UNITED STATES
SECURITIES AND EXCHANGE COMMISSION
Washington, D.C. 20549
FORM N-CSR
CERTIFIED SHAREHOLDER REPORT OF REGISTERED MANAGEMENT
INVESTMENT COMPANIES
Investment Company Act file number 811-08071
Lazard Retirement Series, Inc.
(Exact name of registrant as specified in charter)
30 Rockefeller Plaza
New York, New York 10112
(Address of principal executive offices) (Zip code)
Nathan A. Paul, Esq.
Lazard Asset Management LLC
30 Rockefeller Plaza
New York, New York 10112
(Name and address of agent for service)
Registrant’s telephone number, including area code: (212) 632-6000
Date of fiscal year end: 12/31
Date of reporting period: 6/30/14
ITEM 1. REPORTS TO STOCKHOLDERS.

Lazard Retirement Series
Semi-Annual Report
June 30, 2014
| | US Equity Lazard Retirement US Strategic Equity Portfolio
Lazard Retirement US Small-Mid Cap Equity Portfolio
International Equity Lazard Retirement International Equity Portfolio | | Emerging Markets
Lazard Retirement Emerging Markets Equity Portfolio
Asset Allocation
Lazard Retirement Global Dynamic Multi Asset Portfolio |
| |
| |
| Lazard Retirement Series, Inc. Table of Contents |
| |
Shares of the Portfolios are currently offered only to separate accounts established by insurance companies to fund variable annuity contracts and variable life insurance policies. Portfolio shares may also be offered to certain qualified pension and retirement plans and accounts permitting accumulation of assets on a tax-deferred basis.
Please consider a Portfolio’s investment objective, risks, charges and expenses carefully before investing. For more complete information about Lazard Retirement Series, Inc. (the “Fund”), you may obtain a prospectus or summary prospectus by calling 800-823-6300, or online, at www.LazardNet.com. Read the prospectus or each Portfolio’s summary prospectus carefully before you invest. The prospectus and summary prospectus contain the investment objective, risks, charges, expenses and other information about Portfolios of the Fund, which is not detailed in this report.
Distributed by Lazard Asset Management Securities LLC.
Semi-Annual Report 1
| |
| |
| Lazard Retirement Series, Inc. A Message from Lazard |
| |
Dear Shareholder,
During the first half of 2014, global equity markets rose steadily. Stocks were somewhat volatile at the beginning of the year as investors were concerned that the US Federal Reserve (the “Fed”) may begin to raise interest rates sooner than previously expected. However, Fed Chair Janet Yellen reassured markets on several occasions that the Fed intends to keep interest rates low until the US economy is stronger. Stocks gained in developed markets across North America, Europe, and Asia. Emerging-market equities recovered from a difficult 2013 amid an improving global economic environment and despite growth concerns in China and geopolitical uncertainty from Russia-Ukraine tensions.
Global fixed-income markets extended their rally despite the unwinding of US quantitative easing and as interest rates generally trended lower. Emerging-market debt posted strong returns, supported by the credit-easing measures taken by the European Central Bank and the ongoing accommodative stance by the Fed.
As always, at Lazard Asset Management, we remain focused on active management and are committed to leveraging our strengths to help you, a valued shareholder in Lazard Funds, achieve your financial goals. We appreciate your continued confidence in our investment management capabilities, and feel privileged that you have turned to Lazard for your investment needs.
Sincerely,
Lazard Asset Management LLC
2 Semi-Annual Report
| |
| |
| Lazard Retirement Series, Inc. Investment Overviews |
| |
US Equities
The S&P 500® Index delivered strong results during the six-month period ended June 30, 2014, gaining 7.1%. Stocks were somewhat volatile in the beginning of the year, as many investors were concerned that the Fed might begin to raise interest rates sooner than previously expected. However, Fed Chair Janet Yellen reassured markets on several occasions that the Fed intends to keep interest rates low until the US economy is stronger. Economic reports were mixed in the first quarter, and a final revision of first-quarter GDP growth disappointed as the economy contracted at an annualized rate of -2.9%. However, many analysts attributed the slowdown in activity to the severe winter and encouraging data reassured the market that the economy had bounced back from its first-quarter lull. The economy added more jobs than expected in each month of the second quarter, auto sales continued to be strong, and corporate merger-and-acquisition activity continued at a rapid pace.
International Equities
Despite volatility during the early months, most international equity markets rose during the first half of 2014 driven by positive economic data points, an increase in merger-and-acquisition activity, and accommodative monetary policy. During the second quarter, emerging markets reversed their first quarter decline and ended the period outpacing developed markets. Indian equities were among the best performers on hopes that newly elected Prime Minister Narendra Modi might bring economic and social welfare reform to the country. Turkey also performed well during the period amid multiple interest rate cuts and political stabilization after unrest earlier in the year. Despite a de-escalation of tensions in the second quarter, Russian equities were among the worst performers in the aftermath of events in Crimea and the economic and diplomatic sanctions that followed.
In Europe, data pointed to factory and services output at their highest levels in three years, and euro-zone consumer confidence improved to pre-crisis levels. In an effort to increase bank lending and combat low inflation, the European Central Bank in June introduced another package of stimulative measures that included interest rate reductions. European countries enjoyed lower borrowing costs and improving economic conditions—in particular, bond yields in Greece, Ireland, Italy, Portugal, and Spain have come down significantly. In the United Kingdom, economic data was stronger than expected, unemployment dropped to a five-year low,
salaries outpaced inflation for the first time since 2010, and housing prices continued their ascent.
All global sectors finished the period in positive territory. Utility stocks were among the best performers as investors sought higher dividend-paying investments in contrast to record-low bond-yields. Energy stocks also performed well as oil prices rose due to the turmoil in Iraq.
Emerging Markets Equities
Emerging markets equities suffered through a challenging initial two months, followed by a significant rebound during the first half of 2014. Concerns about the Fed tapering in January and then the trauma of Russia annexing Crimea in February were subsequently more than offset by an improving economic environment, somewhat de-escalating tensions in Ukraine, and an improvement in industrial production data in China. The Morgan Stanley Capital International (MSCI®) Emerging Markets Index (the “EM Index”) increased by 6.1%, as measured in US dollar terms. By region, Latin America performed best, modestly outperforming shares in Asia and eastern Europe. Features of the period included the Crimean (Ukrainian) issue as well as higher crude oil prices caused by increased violence within Iraq.
Asian markets were generally strong over the first half of 2014, apart from China, which suffered from worries about economic growth and a weak renminbi. The period included a military coup which ousted Yingluck Shinawatra as prime minister of Thailand. Somewhat perversely, Thai shares rallied, suggesting less uncertainty. Taiwanese equities, especially technology shares, rose due to upward earnings revisions. Indian stock prices increased sharply following the convincing election win of BJP leader Modi and the announcement of his relatively small, and therefore possibly more efficient, cabinet. Although share prices recovered in Indonesia following a weak period in 2013, polls in June reporting a closer and more complicated presidential election, resulted in marked profit-taking.
European-market returns were somewhat mixed during the period. Because of the Crimean situation, Russian and Hungarian shares fell sharply in February before beginning to recover on the apparent signs of de-escalating tensions. Turkish and South African equities rebounded from the stresses placed on their currencies after the Fed’s tapering in the first quarter, which led both central banks to decisively lift
Semi-Annual Report 3
interest rates. Egyptian shares benefited from General el-Sisi’s election as president. New EM Index constituent countries, Qatar and the United Arab Emirates, rose over the period but suffered considerable declines in June following the effects of a corporate scandal in Qatar and a year of major market increases.
Apart from Chile, Latin American markets rose in the first half. Despite ongoing concerns about economic performance, both Brazil and Colombia benefited from the increase in crude oil prices given their substantial energy weightings. Mexican shares were buoyed by ongoing excitement over reform policy as well as prospects of increased economic growth.
By sector, the information technology, utilities, consumer discretionary, and health care sectors performed relatively well while the materials, telecom services, and consumer staples sectors underperformed the EM Index.
Lazard Retirement US Strategic Equity Portfolio
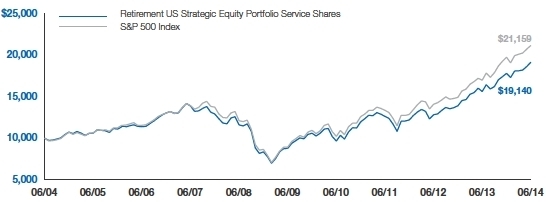
For the six months ended June 30, 2014, the Lazard Retirement US Strategic Equity Portfolio’s Service Shares posted a total return of 7.49%, as compared with the 7.13% return for the S&P 500 Index.
Stock selection in the consumer staples sector contributed to performance. Shares of Molson Coors Brewing rose after the company reported solid quarterly results, driven by strong volumes in its European business and cost savings. Stock selection in the consumer discretionary sector also helped returns. Shares of Advance Auto Parts rose after the company announced its acquisition of General Parts International for $2 billion. The transaction has been completed, making the combined entity the largest aftermarket auto parts provider in North America.
In contrast, stock selection in the health care sector detracted from performance. Shares of pharmaceutical company Pfizer fell after a series of offers made by the company to acquire AstraZeneca were rejected. Stock selection in the financials sector also hurt returns. Shares of exchange operator Intercontinental Exchange fell after management issued expense guidance for the year that was greater than expected.
Lazard Retirement US Small-Mid Cap Equity Portfolio
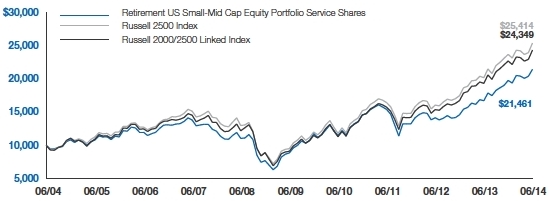
For the six months ended June 30, 2014, the Lazard Retirement US Small-Mid Cap Equity Portfolio’s Service Shares
posted a total return of 8.50%, as compared with the 5.95% return for the Russell 2500® Index.
Stock selection in the information technology sector contributed to performance. Shares of wireless technology company InterDigital rose after management announced that it had renewed its mobile patent agreement with Samsung, its largest customer, after a two year negotiation process. Stock selection in the consumer discretionary sector also helped returns. Shares of Advance Auto Parts rose after the company announced its acquisition of General Parts International for $2 billion. The transaction has been completed, making the combined entity the largest aftermarket auto parts provider in North America.
In contrast, underweight positions in utilities and energy and a lack of exposure to telecom services detracted from performance, as the sectors were the three best performers in the benchmark during the period. In the consumer discretionary sector, shares of women’s retail store operator Francesca’s fell after the company reported quarterly earnings which were below expectations, as severe winter weather and inventory issues hampered results. We sold our position in June as we saw better risk/reward opportunities elsewhere.
Lazard Retirement International Equity Portfolio
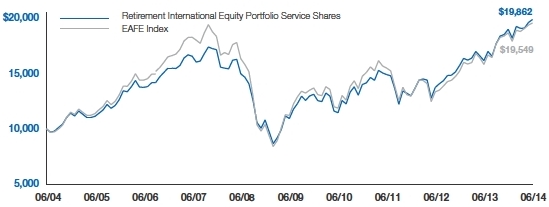
For the six months ended June 30, 2014, the Lazard Retirement International Equity Portfolio’s Service Shares posted a total return of 4.68%, as compared with the 4.78% return for the MSCI EAFE® (Europe, Australasia, Far East) Index (the “EAFE Index”).
The Portfolio outperformed the EAFE Index during the second quarter driven by stock selection in the consumer staples and consumer discretionary sectors. Within consumer staples, shares of Japan Tobacco rose on strong results, an increased dividend, and on the company’s entrance into the high-growth electronic cigarette market via an acquisition. Elsewhere in consumer staples, shares of Belgian brewer Anheuser-Busch InBev rose on sales growth that exceeded expectations, particularly in Brazil ahead of the World Cup. Within the consumer discretionary sector, shares of Brazilian education company Estacio rose on results that exceeded expectations that highlighted increased enrollment. Low exposure to, and stock selection in, the financials sector was also additive to relative returns. Japanese real estate developer Daiwa House performed well on earnings that beat ex-
4 Semi-Annual Report
pectations, driven by orders within the company’s retail and logistics facilities segments.
In contrast, stock selection in the information technology, energy, and industrials sectors detracted from relative returns during the period. Shares of Japanese LCD manufacturer Japan Display declined on weaker-than-expected demand. In the energy sector, oil services provider Petroleum Geo-Services declined on weak results. The turmoil in Iraq and the subsequent rise in oil prices hurt the Portfolio’s holdings in the industrials sector as shares of Irish airline Ryanair and British airline International Consolidated Airlines declined as fuel costs rose. French airplane manufacturer Airbus also declined due to a contract cancellation in addition to rising fuel prices.
Lazard Retirement Emerging Markets Equity Portfolio
For the six months ended June 30, 2014, the Lazard Retirement Emerging Markets Equity Portfolio’s Service Shares posted a total return of 8.88%, while the Investor Shares posted a total return of 9.02%, as compared with the 6.14% return for the EM Index.
Shares of Cielo, a Brazilian credit card processor, continued to perform well amid strong credit card volumes. BB Seguridade Participacoes, a Brazilian insurance company, gained after announcing strong results and providing good guidance. Shares of Taiwan Semiconductor Manufacturing, a Taiwanese manufacturer of integrated circuits, rose amid increased confidence that second half of 2014 earnings would beat expectations. Bank Mandiri, an Indonesian bank, reported good fourth-quarter results.
In contrast, shares of Sberbank of Russia, a Russian bank, declined as the Crimea crisis resulted in increased political concerns and a weakening ruble. KB Financial Group, a South Korean bank, was negatively affected by increased regulatory tightening within the credit card market following a large data leak scandal. Shares of Mobile Telesystems, a Russia-based telecom services company, declined on concerns over increased competition after Rostelecom and Tele2 announced a joint venture, and due to macro-related concerns including the weakening ruble. Shares of Hanwha Life Insurance, a South Korean life insurance company, declined amid weaker-than-expected earnings and growth outlook.
Lazard Retirement Global Dynamic Multi Asset Portfolio
For the six months ended June 30, 2014, the Lazard Retirement Global Dynamic Multi Asset Portfolio’s Service Shares posted a total return of 4.15%, as compared with the 5.61% return of its benchmark, which is a 50/50 blend of the MSCI World® Index and the Barclays Capital Global Aggregate Bond® Index (the “GDMA Index”).
The Portfolio is managed using a combination of Lazard Asset Management LLC’s, the Portfolio’s investment manager (the “Investment Manager”), US and non-US equity and fixed-income strategies. The Investment Manager considers a market forecast based on four categories pertinent to allocation decisions among the strategies: Economy, Valuation, Liquidity, and Sentiment.
Changes made to the market forecast during the period reflected a consideration of many factors. These included monetary policies of central banks around the globe; global macro data readings, particularly of the Purchasing Managers’ Index (which measures economic activity) in China, the United States, the euro zone, and Japan; fiscal policy in developed and emerging markets; geopolitical risks; and equity and fixed income valuations, along with other data.
For the first six months of 2014, the equity allocation in the Portfolio benefited from stock selection in the consumer staples and consumer discretionary sectors, stock selection and an overweight position in health care, and stock selection in Denmark, the Netherlands, and Switzerland. Within fixed income, performance was helped by overweight exposures to Mexico, Israel, and Ireland, underweight exposure to Japan, sector selection, and select currency exposure. In contrast, stock selection in the financials and information technology sectors, an underweight exposure to the energy sector, and stock selection in US and Japanese equities detracted from performance. Within fixed income, performance was hurt by defensive duration in the United States and core Europe, underweight exposures to Spain and Italy, and an underweight exposure to the Japanese yen.
Semi-Annual Report 5
Notes to Investment Overviews:
All returns reflect reinvestment of all dividends and distributions, if any. Certain expenses of the Portfolios may have been waived or reimbursed by the Investment Manager and State Street Bank and Trust Company, the Fund’s Administrator (“State Street”); without such waiver/reimbursement of expenses, the Portfolios’ returns would have been lower. Performance information does not reflect the fees and charges imposed by participating insurance companies at the separate account level, and such charges will have the effect of reducing performance. Past performance is not indicative, or a guarantee, of future results.
The performance data of the indices and other market data have been prepared from sources and data that the Investment Manager believes to be reliable, but no representation is made as to their accuracy. These indices are unmanaged, have no fees or costs and are not available for investment.
The views of the Investment Manager and the securities described in this report are as of June 30, 2014; these views and portfolio holdings may have changed subsequent to this date. Nothing herein should be construed as a recommendation to buy, sell, or hold a particular security. There is no assurance that the securities discussed herein will remain in each Portfolio at the time you receive this report, or that securities sold will not have been repurchased. The specific securities discussed may, in aggregate, represent only a small percentage of each Portfolio’s holdings. It should not be assumed that securities identified and discussed were, or will be, profitable, or that the investment decisions made in the future will be profitable, or equal the investment performance of the securities discussed herein.
The views and opinions expressed are provided for general information only, and do not constitute specific tax, legal, or investment advice to, or recommendations for, any person. There can be no guarantee as to the accuracy of the outlooks for markets, sectors and securities as discussed herein. You should read the Fund’s prospectus or each Portfolio’s summary prospectus for a more detailed discussion of each Portfolio’s investment objective, strategies, risks and fees.
6 Semi-Annual Report
| |
| |
| Lazard Retirement Series, Inc. Performance Overviews (unaudited) |
| |
Lazard Retirement US Strategic Equity Portfolio
Comparison of Changes in Value of $10,000 Investment in the Service Shares of Lazard Retirement US Strategic Equity Portfolio and S&P 500® Index*
Average Annual Total Returns*
Periods Ended June 30, 2014
| | One | Five | Ten | |
| | Year | Years | Years | |
| Service Shares | 22.52% | 16.90% | 6.71% | |
| S&P 500 Index | 24.60% | 18.83% | 7.78% | |
| * | All returns reflect reinvestment of all dividends and distributions, if any. Certain expenses of the Portfolio have been waived or reimbursed by the Portfolio’s Investment Manager or State Street; without such waiver/reimbursement of expenses, the Portfolio’s returns would have been lower. Performance information does not reflect the fees and charges imposed by participating insurance companies at the separate account level, and such charges will have the effect of reducing performance. |
| | |
| | The performance quoted represents past performance. Current performance may be lower or higher than the performance quoted. Past performance is not indicative, or a guarantee, of future results; the investment return and principal value of the Portfolio will fluctuate, so that Portfolio shares, when redeemed, may be worth more or less than their original cost. Within the longer periods illustrated there may have been short-term fluctuations, counter to the overall trend of investment results, and no single period of any length may be taken as typical of what may be expected in future periods. |
| | |
| | The performance data of the index has been prepared from sources and data that the Investment Manager believes to be reliable, but no representation is made as to its accuracy. The S&P 500 Index is a market capitalization-weighted index of 500 common stocks, designed to measure performance of the broad domestic economy through changes in the aggregate market value of these stocks, which represent all major industries. The index is unmanaged, has no fees or costs and is not available for investment. |
| | |
| | Before May 1, 2007, the Portfolio was known as Lazard Retirement Equity Portfolio and had a different investment strategy. |
Semi-Annual Report 7
Lazard Retirement US Small-Mid Cap Equity Portfolio
Comparison of Changes in Value of $10,000 Investment in the Service Shares of Lazard Retirement US Small-Mid Cap Equity Portfolio, Russell 2500® Index and Russell 2000/2500 Linked Index*
Average Annual Total Returns*
Periods Ended June 30, 2014
| | One | Five | Ten | |
| | Year | Years | Years | |
| Service Shares | 28.28% | 19.30% | 7.94% | |
| Russell 2500 Index | 25.58% | 21.63% | 9.78% | |
| Russell 2000/2500 Linked Index | 25.58% | 21.63% | 9.31% | |
| * | All returns reflect reinvestment of all dividends and distributions, if any. Certain expenses of the Portfolio have been waived or reimbursed by the Portfolio’s Investment Manager; without such waiver/reimbursement of expenses, the Portfolio’s returns would have been lower. Performance information does not reflect the fees and charges imposed by participating insurance companies at the separate account level, and such charges will have the effect of reducing performance. |
| | |
| | The performance quoted represents past performance. Current performance may be lower or higher than the performance quoted. Past performance is not indicative, or a guarantee, of future results; the investment return and principal value of the Portfolio will fluctuate, so that Portfolio shares, when redeemed, may be worth more or less than their original cost. Within the longer periods illustrated there may have been short-term fluctuations, counter to the overall trend of investment results, and no single period of any length may be taken as typical of what may be expected in future periods. |
| | |
| | The Portfolio was previously known as Lazard Retirement U.S. Small Cap Equity Portfolio. As of June 1, 2009, the Portfolio changed its name to Lazard U.S. Small-Mid Cap Equity Portfolio and changed its investment strategy to invest in equity securities of small-mid cap US companies. |
| | |
| | The performance data of the indices have been prepared from sources and data that the Investment Manager believes to be reliable, but no representation is made as to their accuracy. The Russell 2500 Index is comprised of the 2,500 smallest US companies included in the Russell 3000® Index (which consists of the 3,000 largest US companies by capitalization). The Russell 2000/2500 Linked Index is an index created by the Portfolio’s Investment Manager, which links the performance of the Russell 2000® Index for all periods through May 31, 2009 and the Russell 2500 Index for all periods thereafter. The Russell 2000 Index is comprised of the 2,000 smallest US companies included in the Russell 3000 Index. The indices are unmanaged, have no fees or costs and are not available for investment. |
8 Semi-Annual Report
Lazard Retirement International Equity Portfolio
Comparison of Changes in Value of $10,000 Investment in the Service Shares of Lazard Retirement International Equity Portfolio and EAFE Index*
Average Annual Total Returns*
Periods Ended June 30, 2014
| | One | Five | Ten | |
| | Year | Years | Years | |
| Service Shares | 22.98% | 12.70% | 7.10% | |
| EAFE Index | 23.57% | 11.77% | 6.93% | |
| * | All returns reflect reinvestment of all dividends and distributions, if any. Certain expenses of the Portfolio have been waived or reimbursed by the Portfolio’s Investment Manager; without such waiver/reimbursement of expenses, the Portfolio’s returns would have been lower. Performance information does not reflect the fees and charges imposed by participating insurance companies at the separate account level, and such charges will have the effect of reducing performance. |
| | |
| | The performance quoted represents past performance. Current performance may be lower or higher than the performance quoted. Past performance is not indicative, or a guarantee, of future results; the investment return and principal value of the Portfolio will fluctuate, so that Portfolio shares, when redeemed, may be worth more or less than their original cost. Within the longer periods illustrated there may have been short-term fluctuations, counter to the overall trend of investment results, and no single period of any length may be taken as typical of what may be expected in future periods. |
| | |
| | The performance data of the index has been prepared from sources and data that the Investment Manager believes to be reliable, but no representation is made as to its accuracy. The EAFE Index is a broadly diversified international index comprised of equity securities of approximately 1,000 companies located in developed countries outside the United States. The index is unmanaged, has no fees or costs and is not available for investment. |
Semi-Annual Report 9
Lazard Retirement Emerging Markets Equity Portfolio
Comparison of Changes in Value of $10,000 Investment in the Service Shares of Lazard Retirement Emerging Markets Equity Portfolio and EM Index*
Average Annual Total Returns*
Periods Ended June 30, 2014
| | Service Shares | Investor Shares | |
| | One | Five | Ten | One | Five | Since | |
| | Year | Years | Years | Year | Years | Inception | † |
| Retirement Emerging Markets Equity Portfolio** | 17.52% | 11.31% | 13.97% | 17.84% | 11.59% | 6.93% | |
| EM Index | 14.31% | 9.24% | 11.94% | 14.31% | 9.24% | 4.99% | |
| * | All returns reflect reinvestment of all dividends and distributions, if any. Certain expenses of the Portfolio have been waived or reimbursed by the Portfolio’s Investment Manager or State Street; without such waiver/reimbursement of expenses, the Portfolio’s returns would have been lower. Performance information does not reflect the fees and charges imposed by participating insurance companies at the separate account level, and such charges will have the effect of reducing performance. |
| | |
| | The performance quoted represents past performance. Current performance may be lower or higher than the performance quoted. Past performance is not indicative, or a guarantee, of future results; the investment return and principal value of the Portfolio will fluctuate, so that Portfolio shares, when redeemed, may be worth more or less than their original cost. Within the longer periods illustrated there may have been short-term fluctuations, counter to the overall trend of investment results, and no single period of any length may be taken as typical of what may be expected in future periods. |
| | |
| | The performance data of the index has been prepared from sources and data that the Investment Manager believes to be reliable, but no representation is made as to its accuracy. The EM Index is comprised of emerging market securities in countries open to non-local investors. The index is unmanaged, has no fees or costs and is not available for investment. |
| | |
| ** | The performance of Service Shares may be greater than or less than the performance of Investor Shares, primarily based on the differences in fees borne by shareholders investing in different classes. |
| | |
| † | The inception date for Investor Shares was May 1, 2006. |
10 Semi-Annual Report
Lazard Retirement Global Dynamic Multi Asset Portfolio
Comparison of Changes in Value of $10,000 Investment in the Service Shares of Lazard Retirement Global Dynamic Multi Asset Portfolio, GDMA Index and MSCI World® Index*
Average Annual Total Returns*
Periods Ended June 30, 2014
| | One | Since | |
| | Year | Inception | † |
| Service Shares | 17.85% | 13.49% | |
| GDMA Index | 15.54% | 9.54% | |
| MSCI World Index | 24.05% | 17.09% | |
| * | All returns reflect reinvestment of all dividends and distributions, if any. Certain expenses of the Portfolio have been waived or reimbursed by the Portfolio’s Investment Manager, State Street or Boston Financial Data Services, Inc., the Fund’s transfer and dividend disbursing agent (“BFDS”); without such waiver/reimbursement of expenses, the Portfolio’s returns would have been lower. Performance information does not reflect the fees and charges imposed by participating insurance companies at the separate account level, and such charges will have the effect of reducing performance. |
| | |
| | The performance quoted represents past performance. Current performance may be lower or higher than the performance quoted. Past performance is not indicative, or a guarantee, of future results; the investment return and principal value of the Portfolio will fluctuate, so that Portfolio shares, when redeemed, may be worth more or less than their original cost. Within the longer periods illustrated there may have been short-term fluctuations, counter to the overall trend of investment results, and no single period of any length may be taken as typical of what may be expected in future periods. |
| | |
| | The performance data of the indices have been prepared from sources and data that the Investment Manager believes to be reliable, but no representation is made as to their accuracy. The GDMA Index is a 50/50 blend of the MSCI World Index and the Barclays Capital Global Aggregate Bond® Index. The MSCI World Index is a free float-adjusted market capitalization weighted index that is designed to measure the equity market performance of developed markets. The Barclays Capital Global Aggregate Bond Index provides a broad-based measure of global investment-grade fixed-income debt markets, including government-related debt, corporate debt, securitized debt and global Treasury. The indices are unmanaged, have no fees or costs and are not available for investment. |
| | |
| | Before April 30, 2014, the Portfolio was known as Lazard Retirement Multi-Asset Targeted Volatility Portfolio. |
| | |
| † | The inception date for the Portfolio was April 30, 2012. |
Semi-Annual Report 11
| |
| |
| Lazard Retirement Series, Inc. Information About Your Portfolio’s Expenses (unaudited) |
| |
Expense Example
As a shareholder in a Portfolio of the Fund, you incur ongoing costs, including management fees, distribution and service (12b-1) fees (Service Shares only), and other expenses. This Example is intended to help you understand your ongoing costs (in dollars) of investing in a Portfolio and to compare these costs with the ongoing costs of investing in other mutual funds. The Example is based on an investment of $1,000 invested at the beginning of the six month period from January 1, 2014 through June 30, 2014 and held for the entire period.
Actual Expenses
For each Share class of the Portfolios, the first line of the table below provides information about actual account values and actual expenses. You may use the information in this line, together with the amount you invested, to estimate the expenses that you paid over the period. Simply divide your account value by $1,000 (for example, an $8,600 account value divided by $1,000=8.6), then multiply the result by the number in the first line under the heading entitled “Expenses Paid During Period” to estimate the expenses you paid on your account during this period.
Hypothetical Example for Comparison Purposes
For each Share class of the Portfolios, the second line of the table below provides information about hypothetical account values and hypothetical expenses based on the class’ actual expense ratio and an assumed rate of return of 5% per year before expenses, which is not the Portfolio’s actual return. The hypothetical account values and expenses may not be used to estimate the actual ending account balance or expenses you paid for the period. You may use this information to compare the ongoing costs of investing in the Portfolio and other mutual funds. To do so, compare this 5% hypothetical example with the 5% hypothetical examples that appear in the shareholders reports of the other funds.
Please note that you also bear fees and charges imposed by participating insurance companies at the separate account level, which are described in the separate prospectuses issued by the insurance companies. Such charges will have the effect of reducing account value.
12 Semi-Annual Report
| Portfolio | | Beginning
Account Value
1/1/14 | | Ending
Account Value
6/30/14 | | Expenses Paid
During Period*
1/1/14 - 6/30/14 | | Annualized Expense
Ratio During Period
1/1/14 - 6/30/14 |
| | | | | | | | | |
| US Strategic Equity | | | | | | | | | | | | | | | | |
| Service Shares | | | | | | | | | | | | | | | | |
| Actual | | $ | 1,000.00 | | | $ | 1,074.90 | | | $ | 5.14 | | | | 1.00 | % |
| Hypothetical (5% Return Before Expenses) | | $ | 1,000.00 | | | $ | 1,019.84 | | | $ | 5.01 | | | | 1.00 | % |
| | | | | | | | | | | | | | | | | |
| US Small-Mid Cap Equity | | | | | | | | | | | | | | | | |
| Service Shares | | | | | | | | | | | | | | | | |
| Actual | | $ | 1,000.00 | | | $ | 1,085.00 | | | $ | 6.46 | | | | 1.25 | % |
| Hypothetical (5% Return Before Expenses) | | $ | 1,000.00 | | | $ | 1,018.60 | | | $ | 6.26 | | | | 1.25 | % |
| | | | | | | | | | | | | | | | | |
| International Equity | | | | | | | | | | | | | | | | |
| Service Shares | | | | | | | | | | | | | | | | |
| Actual | | $ | 1,000.00 | | | $ | 1,046.80 | | | $ | 5.53 | | | | 1.09 | % |
| Hypothetical (5% Return Before Expenses) | | $ | 1,000.00 | | | $ | 1,019.39 | | | $ | 5.46 | | | | 1.09 | % |
| | | | | | | | | | | | | | | | | |
| Emerging Markets Equity | | | | | | | | | | | | | | | | |
| Service Shares | | | | | | | | | | | | | | | | |
| Actual | | $ | 1,000.00 | | | $ | 1,088.80 | | | $ | 7.15 | | | | 1.38 | % |
| Hypothetical (5% Return Before Expenses) | | $ | 1,000.00 | | | $ | 1,017.95 | | | $ | 6.90 | | | | 1.38 | % |
| Investor Shares | | | | | | | | | | | | | | | | |
| Actual | | $ | 1,000.00 | | | $ | 1,090.20 | | | $ | 5.86 | | | | 1.13 | % |
| Hypothetical (5% Return Before Expenses) | | $ | 1,000.00 | | | $ | 1,019.19 | | | $ | 5.66 | | | | 1.13 | % |
| | | | | | | | | | | | | | | | | |
| Global Dynamic Multi Asset | | | | | | | | | | | | | | | | |
| Service Shares | | | | | | | | | | | | | | | | |
| Actual | | $ | 1,000.00 | | | $ | 1,041.50 | | | $ | 5.31 | | | | 1.05 | % |
| Hypothetical (5% Return Before Expenses) | | $ | 1,000.00 | | | $ | 1,019.59 | | | $ | 5.26 | | | | 1.05 | % |
| * | Expenses are equal to the annualized expense ratio of each Share class multiplied by the average account value over the period, multiplied by 181/365 (to reflect one-half year period). |
Semi-Annual Report 13
| |
| |
| Lazard Retirement Series, Inc. Portfolio Holdings Presented by Sector June 30, 2014 (unaudited) |
| |
| Sector* | Lazard
Retirement
US Strategic
Equity Portfolio | | Lazard
Retirement
US Small-Mid Cap
Equity Portfolio | | Lazard
Retirement
International
Equity Portfolio | | Lazard
Retirement
Emerging Markets
Equity Portfolio |
| | | | | | | | |
| Consumer Discretionary | | | 15.8 | % | | | 17.4 | % | | | 18.7 | % | | | 7.0 | % | |
| Consumer Staples | | | 7.2 | | | | — | | | | 12.3 | | | | 9.8 | | |
| Energy | | | 11.0 | | | | 5.3 | | | | 5.2 | | | | 11.7 | | |
| Financials | | | 15.0 | | | | 21.8 | | | | 20.2 | | | | 27.0 | | |
| Health Care | | | 17.6 | | | | 8.8 | | | | 12.4 | | | | — | | |
| Industrials | | | 5.1 | | | | 17.2 | | | | 15.6 | | | | 6.4 | | |
| Information Technology | | | 23.2 | | | | 14.6 | | | | 2.3 | | | | 17.4 | | |
| Materials | | | 4.4 | | | | 8.8 | | | | 5.4 | | | | 5.3 | | |
| Telecommunication Services | | | — | | | | — | | | | 3.4 | | | | 10.3 | | |
| Utilities | | | — | | | | 2.8 | | | | 1.5 | | | | 0.8 | | |
| Short-Term Investments | | | 0.7 | | | | 3.3 | | | | 3.0 | | | | 4.3 | | |
| Total Investments | | | 100.0 | % | | | 100.0 | % | | | 100.0 | % | | | 100.0 | % | |
| | | | | | | | | | | | | | | | | | |
| Sector* | | Lazard
Retirement
Global Dynamic
Multi Asset Portfolio |
| | | | | | |
| Consumer Discretionary | | | 10.8 | % | |
| Consumer Staples | | | 8.2 | | |
| Energy | | | 6.7 | | |
| Financials | | | 16.9 | | |
| Health Care | | | 10.4 | | |
| Industrials | | | 9.6 | | |
| Information Technology | | | 10.3 | | |
| Materials | | | 3.5 | | |
| Telecommunication Services | | | 4.7 | | |
| Utilities | | | 3.8 | | |
| Municipal | | | 0.3 | | |
| Sovereign Debt | | | 11.4 | | |
| Short-Term Investment | | | 3.4 | | |
| Total Investments | | | 100.0 | % | |
* Represents percentage of total investments.
14 Semi-Annual Report
| |
| |
| Lazard Retirement Series, Inc. Portfolios of Investments June 30, 2014 (unaudited) |
| |
| Description | | Shares | | | Value | |
| | | | | | | | | |
| Lazard Retirement US Strategic Equity Portfolio | | | | | | | | |
| | | | | | | | | |
| Common Stocks | 98.6% | | | | | | | | |
| | | | | | | | | |
| Alcohol & Tobacco | 3.9% | | | | | | | | |
| Molson Coors Brewing Co., Class B | | | 5,230 | | | $ | 387,857 | |
| | | | | | | | | |
| Banking | 1.7% | | | | | | | | |
| Regions Financial Corp. | | | 15,305 | | | | 162,539 | |
| | | | | | | | | |
| Cable Television | 1.7% | | | | | | | | |
| Comcast Corp., Class A | | | 3,150 | | | | 167,990 | |
| | | | | | | | | |
| Chemicals | 1.7% | | | | | | | | |
| Eastman Chemical Co. | | | 1,960 | | | | 171,206 | |
| | | | | | | | | |
| Commercial Services | 4.6% | | | | | | | | |
| Corrections Corp. of America | | | 4,988 | | | | 163,856 | |
| Republic Services, Inc. | | | 2,470 | | | | 93,786 | |
| ServiceMaster Global Holdings, Inc. | | | 2,750 | | | | 50,132 | |
| Tyco International, Ltd. | | | 3,005 | | | | 137,028 | |
| | | | | | | | 444,802 | |
| Computer Software | 2.1% | | | | | | | | |
| Check Point Software Technologies, Ltd. (a) | | | 1,550 | | | | 103,897 | |
| Microsoft Corp. | | | 2,550 | | | | 106,335 | |
| | | | | | | | 210,232 | |
| Energy Exploration & Production | 4.0% | | | | | | | | |
| Apache Corp. | | | 1,975 | | | | 198,724 | |
| Devon Energy Corp. | | | 2,485 | | | | 197,309 | |
| | | | | | | | 396,033 | |
| Energy Integrated | 4.9% | | | | | | | | |
| Chevron Corp. | | | 1,585 | | | | 206,922 | |
| Consol Energy, Inc. | | | 3,790 | | | | 174,605 | |
| HollyFrontier Corp. | | | 2,320 | | | | 101,361 | |
| | | | | | | | 482,888 | |
| Energy Services | 2.0% | | | | | | | | |
| Transocean, Ltd. | | | 4,410 | | | | 198,582 | |
| | | | | | | | | |
| Financial Services | 11.1% | | | | | | | | |
| Ally Financial, Inc. | | | 5,350 | | | | 127,918 | |
| American Express Co. | | | 2,310 | | | | 219,150 | |
| Citigroup, Inc. | | | 4,180 | | | | 196,878 | |
| Intercontinental Exchange, Inc. | | | 980 | | | | 185,122 | |
| Morgan Stanley | | | 5,485 | | | | 177,330 | |
| Visa, Inc., Class A | | | 890 | | | | 187,532 | |
| | | | | | | | 1,093,930 | |
| Description | | | Shares | | | | Value | |
| | | | | | | | | |
| Food & Beverages | 3.2% | | | | | | | | |
| Kellogg Co. | | | 975 | | | $ | 64,058 | |
| Sysco Corp. | | | 6,705 | | | | 251,102 | |
| | | | | | | | 315,160 | |
| Forest & Paper Products | 1.3% | | | | | | | | |
| International Paper Co. | | | 2,645 | | | | 133,493 | |
| | | | | | | | | |
| Health Services | 1.1% | | | | | | | | |
| UnitedHealth Group, Inc. | | | 1,310 | | | | 107,093 | |
| | | | | | | | | |
| Insurance | 2.4% | | | | | | | | |
| The Hartford Financial Services Group, Inc. | | | 4,320 | | | | 154,699 | |
| Voya Financial, Inc. | | | 2,150 | | | | 78,131 | |
| | | | | | | | 232,830 | |
| Leisure & Entertainment | 5.3% | | | | | | | | |
| Bloomin’ Brands, Inc. (a) | | | 2,225 | | | | 49,907 | |
| Norwegian Cruise Line Holdings, Ltd. (a) | | | 3,550 | | | | 112,535 | |
| The Madison Square Garden Co., Class A (a) | | | 1,100 | | | | 68,695 | |
| Viacom, Inc., Class B | | | 3,390 | | | | 294,014 | |
| | | | | | | | 525,151 | |
| Manufacturing | 2.7% | | | | | | | | |
| Carpenter Technology Corp. | | | 740 | | | | 46,805 | |
| Caterpillar, Inc. | | | 505 | | | | 54,878 | |
| Honeywell International, Inc. | | | 1,240 | | | | 115,258 | |
| Joy Global, Inc. | | | 760 | | | | 46,801 | |
| | | | | | | | 263,742 | |
| Medical Products | 6.3% | | | | | | | | |
| Baxter International, Inc. | | | 3,925 | | | | 283,778 | |
| CareFusion Corp. (a) | | | 4,420 | | | | 196,027 | |
| McKesson Corp. | | | 720 | | | | 134,071 | |
| | | | | | | | 613,876 | |
| | | | | | | | | |
| Metal & Glass Containers | 0.8% | | | | | | | | |
| Owens-Illinois, Inc. (a) | | | 2,225 | | | | 77,074 | |
| | | | | | | | | |
| Pharmaceutical & Biotechnology | 10.1% | | | | | | | | |
| Eli Lilly & Co. | | | 2,515 | | | | 156,358 | |
| Pfizer, Inc. | | | 14,480 | | | | 429,766 | |
| Zoetis, Inc. | | | 12,593 | | | | 406,376 | |
| | | | | | | | 992,500 | |
| Retail | 8.1% | | | | | | | | |
| Advance Auto Parts, Inc. | | | 3,679 | | | | 496,371 | |
| Dick’s Sporting Goods, Inc. | | | 1,230 | | | | 57,269 | |
| J.C. Penney Co., Inc. (a) | | | 6,720 | | | | 60,816 | |
| Kohl’s Corp. | | | 975 | | | | 51,363 | |
| Macy’s, Inc. | | | 2,275 | | | | 131,995 | |
| | | | | | | | 797,814 | |
The accompanying notes are an integral part of these financial statements.
Semi-Annual Report 15
| Description | | | Shares | | | Value | |
| | | | | | | | | |
| Lazard Retirement US Strategic Equity Portfolio (concluded) | | | |
| | | | | | | | | |
| Semiconductors & Components | 2.8% | | | | | | | | |
| Intel Corp. | | | 1,775 | | | $ | 54,847 | |
| Maxim Integrated Products, Inc. | | | 1,500 | | | | 50,715 | |
| Xerox Corp. | | | 13,250 | | | | 164,830 | |
| | | | | | | | 270,392 | |
| Technology | 2.8% | | | | | | | | |
| Citrix Systems, Inc. (a) | | | 1,225 | | | | 76,624 | |
| eBay, Inc. (a) | | | 1,000 | | | | 50,060 | |
| Google, Inc., Class A (a) | | | 123 | | | | 71,914 | |
| Google, Inc., Class C (a) | | | 128 | | | | 73,636 | |
| | | | | | | | 272,234 | |
| Technology Hardware | 13.5% | | | | | | | | |
| Apple, Inc. | | | 3,913 | | | | 363,635 | |
| Brocade Communications Systems, Inc. | | | 7,600 | | | | 69,920 | |
| Cisco Systems, Inc. | | | 14,900 | | | | 370,265 | |
| EMC Corp. | | | 6,790 | | | | 178,849 | |
| Hewlett-Packard Co. | | | 2,000 | | | | 67,360 | |
| NCR Corp. (a) | | | 800 | | | | 28,072 | |
| Qualcomm, Inc. | | | 1,790 | | | | 141,768 | |
| Teradyne, Inc. | | | 5,225 | | | | 102,410 | |
| | | | | | | | 1,322,279 | |
| Description | | | Shares | | | Value | |
| | | | | | | | | |
| Transportation | 0.5% | | | | | | | | |
| American Airlines Group, Inc. (a) | | | 1,125 | | | $ | 48,330 | |
| | | | | | | | | |
Total Common Stocks
(Identified cost $8,051,608) | | | | | | | 9,688,027 | |
| | | | | | | | | |
| Preferred Stock | 0.0% | | | | | | | | |
| | | | | | | | | |
| Automotive | 0.0% | | | | | | | | |
Better Place, Inc., Series B
(Identified cost $31,701) (a), (b) | | | 12,681 | | | | 0 | |
| | | | | | | | | |
| Short-Term Investment | 0.7% | | | | | | | | |
State Street Institutional Treasury
Money Market Fund
(Identified cost $66,014) | | | 66,014 | | | | 66,014 | |
| | | | | | | | | |
Total Investments | 99.3%
(Identified cost $8,149,323) (c) | | | | | | $ | 9,754,041 | |
| | | | | | | | | |
Cash and Other Assets in Excess
of Liabilities | 0.7% | | | | | | | 63,876 | |
| | | | | | | | | |
| Net Assets | 100.0% | | | | | | $ | 9,817,917 | |
The accompanying notes are an integral part of these financial statements.
16 Semi-Annual Report
| Description | | Shares | | | Value | |
| | | | | | | |
| Lazard Retirement US Small-Mid Cap Equity Portfolio | | |
| | | | | | | | | |
| Common Stocks | 97.4% | | | | | | | | |
| | | | | | | | | |
| Aerospace & Defense | 0.9% | | | | | | | | |
| B/E Aerospace, Inc. (a) | | | 6,055 | | | $ | 560,027 | |
| | | | | | | | | |
| Automotive | 1.9% | | | | | | | | |
| Modine Manufacturing Co. (a) | | | 45,580 | | | | 717,429 | |
| Tenneco, Inc. (a) | | | 7,240 | | | | 475,668 | |
| | | | | | | | 1,193,097 | |
| Banking | 7.2% | | | | | | | | |
| East West Bancorp, Inc. | | | 17,415 | | | | 609,351 | |
| PacWest Bancorp | | | 27,630 | | | | 1,192,787 | |
| Signature Bank (a) | | | 6,920 | | | | 873,166 | |
| United Bankshares, Inc. | | | 30,450 | | | | 984,448 | |
| Wintrust Financial Corp. | | | 20,305 | | | | 934,030 | |
| | | | | | | | 4,593,782 | |
| Chemicals | 4.9% | | | | | | | | |
| Koppers Holdings, Inc. | | | 13,500 | | | | 516,375 | |
| Polypore International, Inc. (a) | | | 9,700 | | | | 462,981 | |
| Rockwood Holdings, Inc. | | | 5,970 | | | | 453,660 | |
| Taminco Corp. (a) | | | 42,595 | | | | 990,760 | |
| Tronox, Ltd., Class A | | | 26,000 | | | | 699,400 | |
| | | | | | | | 3,123,176 | |
| Commercial Services | 6.7% | | | | | | | | |
| Applied Industrial Technologies, Inc. | | | 12,800 | | | | 649,344 | |
| Blackhawk Network Holdings, Inc. (a) | | | 32,760 | | | | 924,487 | |
| Convergys Corp. | | | 26,300 | | | | 563,872 | |
| LifeLock, Inc. (a) | | | 26,795 | | | | 374,058 | |
| Markit, Ltd. | | | 26,300 | | | | 709,574 | |
| MDC Partners, Inc., Class A | | | 27,700 | | | | 595,273 | |
| ServiceMaster Global Holdings, Inc. | | | 24,800 | | | | 452,104 | |
| | | | | | | | 4,268,712 | |
| Computer Software | 6.2% | | | | | | | | |
| Informatica Corp. (a) | | | 17,785 | | | | 634,035 | |
| j2 Global, Inc. | | | 18,810 | | | | 956,677 | |
| Red Hat, Inc. (a) | | | 12,295 | | | | 679,545 | |
| Rovi Corp. (a) | | | 19,000 | | | | 455,240 | |
| TIBCO Software, Inc. (a) | | | 39,320 | | | | 793,084 | |
| Web.com Group, Inc. (a) | | | 16,890 | | | | 487,614 | |
| | | | | | | | 4,006,195 | |
| Construction & Engineering | 2.0% | | | | | | | | |
| EMCOR Group, Inc. | | | 13,975 | | | | 622,307 | |
| Quanta Services, Inc. (a) | | | 18,835 | | | | 651,314 | |
| | | | | | | | 1,273,621 | |
| Description | | Shares | | | Value | |
| | | | | | | |
| Consumer Products | 1.1% | | | | | | | | |
| Matthews International Corp., Class A | | | 16,235 | | | $ | 674,889 | |
| | | | | | | | | |
| Electric | 1.4% | | | | | | | | |
| CMS Energy Corp. | | | 29,675 | | | | 924,376 | |
| | | | | | | | | |
| Energy | 1.4% | | | | | | | | |
| Pattern Energy Group, Inc. | | | 27,595 | | | | 913,670 | |
| | | | | | | | | |
| Energy Exploration & Production | 3.3% | | | | | | | | |
| Athlon Energy, Inc. | | | 9,445 | | | | 450,526 | |
| EP Energy Corp., Class A | | | 44,000 | | | | 1,014,200 | |
| Memorial Resource Development Corp. | | | 27,800 | | | | 677,208 | |
| | | | | | | | 2,141,934 | |
| Energy Services | 2.0% | | | | | | | | |
| Diamond Offshore Drilling, Inc. | | | 12,125 | | | | 601,764 | |
| Oceaneering International, Inc. | | | 8,300 | | | | 648,479 | |
| | | | | | | | 1,250,243 | |
| Financial Services | 5.1% | | | | | | | | |
| Air Lease Corp. | | | 24,165 | | | | 932,286 | |
| Cohen & Steers, Inc. | | | 10,700 | | | | 464,166 | |
| Springleaf Holdings, Inc. | | | 36,945 | | | | 958,723 | |
| Waddell & Reed Financial, Inc., Class A | | | 14,380 | | | | 900,044 | |
| | | | | | | | 3,255,219 | |
| Forest & Paper Products | 2.6% | | | | | | | | |
| KapStone Paper and Packaging Corp. (a) | | | 25,520 | | | | 845,478 | |
| Schweitzer-Mauduit International, Inc. | | | 19,375 | | | | 845,912 | |
| | | | | | | | 1,691,390 | |
| Health Services | 5.7% | | | | | | | | |
| Brookdale Senior Living, Inc. (a) | | | 25,815 | | | | 860,672 | |
| Magellan Health Services, Inc. (a) | | | 13,555 | | | | 843,663 | |
| Phibro Animal Health Corp., Class A | | | 41,020 | | | | 900,389 | |
| Quintiles Transnational Holdings, Inc. (a) | | | 19,685 | | | | 1,049,014 | |
| | | | | | | | 3,653,738 | |
| Housing | 1.0% | | | | | | | | |
| Taylor Morrison Home Corp., Class A (a) | | | 29,395 | | | | 659,036 | |
| | | | | | | | | |
| Insurance | 2.6% | | | | | | | | |
| American Equity Investment Life Holding Co. | | | 31,035 | | | | 763,461 | |
| Arch Capital Group, Ltd. (a) | | | 15,980 | | | | 917,891 | |
| | | | | | | | 1,681,352 | |
The accompanying notes are an integral part of these financial statements.
Semi-Annual Report 17
| Description | | Shares | | | Value | |
| | | | | | | |
| Lazard Retirement US Small-Mid Cap Equity Portfolio (concluded) | |
| | | | | | | |
| Leisure & Entertainment | 4.2% | | | | | | | | |
| Bally Technologies, Inc. (a) | | | 9,195 | | | $ | 604,295 | |
| Bloomin’ Brands, Inc. (a) | | | 19,800 | | | | 444,114 | |
| Diamond Resorts International, Inc. | | | 31,600 | | | | 735,332 | |
| Hyatt Hotels Corp., Class A (a) | | | 14,580 | | | | 889,089 | |
| | | | | | | | 2,672,830 | |
| Manufacturing | 12.1% | | | | | | | | |
| ACCO Brands Corp. (a) | | | 101,785 | | | | 652,442 | |
| Actuant Corp., Class A | | | 28,915 | | | | 999,591 | |
| Altra Industrial Motion Corp. | | | 17,740 | | | | 645,559 | |
| Carpenter Technology Corp. | | | 10,050 | | | | 635,662 | |
| FLIR Systems, Inc. | | | 19,685 | | | | 683,660 | |
| Joy Global, Inc. | | | 6,900 | | | | 424,902 | |
| Kennametal, Inc. | | | 13,035 | | | | 603,260 | |
| Littelfuse, Inc. | | | 7,745 | | | | 719,898 | |
| The Toro Co. | | | 10,165 | | | | 646,494 | |
| TriMas Corp. (a) | | | 23,015 | | | | 877,562 | |
| Woodward, Inc. | | | 17,540 | | | | 880,157 | |
| | | | | | | | 7,769,187 | |
| Medical Products | 2.2% | | | | | | | | |
| CareFusion Corp. (a) | | | 20,555 | | | | 911,614 | |
| Sirona Dental Systems, Inc. (a) | | | 6,265 | | | | 516,612 | |
| | | | | | | | 1,428,226 | |
| Metal & Glass Containers | 1.1% | | | | | | | | |
| Owens-Illinois, Inc. (a) | | | 19,880 | | | | 688,643 | |
| | | | | | | | | |
| Pharmaceutical & Biotechnology | 1.0% | | | | | | | | |
| Aratana Therapeutics, Inc. (a) | | | 21,800 | | | | 340,298 | |
| Intrexon Corp. | | | 11,220 | | | | 281,959 | |
| | | | | �� | | | 622,257 | |
| Real Estate | 8.5% | | | | | | | | |
| DCT Industrial Trust, Inc. | | | 93,600 | | | | 768,456 | |
| Extra Space Storage, Inc. REIT | | | 19,900 | | | | 1,059,675 | |
| Highwoods Properties, Inc. | | | 18,100 | | | | 759,295 | |
| Jones Lang LaSalle, Inc. | | | 6,220 | | | | 786,146 | |
| Kilroy Realty Corp. REIT | | | 18,500 | | | | 1,152,180 | |
| LaSalle Hotel Properties REIT | | | 27,000 | | | | 952,830 | |
| | | | | | | | 5,478,582 | |
| | | | | | | |
| Description | | Shares | | | Value | |
| | | | | | | |
| Retail | 6.1% | | | | | | | | |
| Advance Auto Parts, Inc. | | | 8,115 | | | $ | 1,094,876 | |
| Carter’s, Inc. | | | 8,900 | | | | 613,477 | |
| Chico’s FAS, Inc. | | | 40,775 | | | | 691,544 | |
| Iconix Brand Group, Inc. (a) | | | 14,420 | | | | 619,195 | |
| Steven Madden, Ltd. (a) | | | 25,780 | | | | 884,254 | |
| | | | | | | | 3,903,346 | |
| Semiconductors & Components | 1.9% | | | | | | | | |
| Microsemi Corp. (a) | | | 18,300 | | | | 489,708 | |
| Xilinx, Inc. | | | 15,425 | | | | 729,757 | |
| | | | | | | | 1,219,465 | |
| Technology | 1.1% | | | | | | | | |
| BroadSoft, Inc. (a) | | | 27,675 | | | | 730,343 | |
| | | | | | | | | |
| Technology Hardware | 0.9% | | | | | | | | |
| InterDigital, Inc. | | | 11,530 | | | | 551,134 | |
| | | | | | | | | |
| Transportation | 2.3% | | | | | | | | |
| Alaska Air Group, Inc. | | | 7,405 | | | | 703,845 | |
| Echo Global Logistics, Inc. (a) | | | 41,125 | | | | 788,367 | |
| | | | | | | | 1,492,212 | |
| Total Common Stocks | | | | | | | | |
| (Identified cost $50,478,894) | | | | | | | 62,420,682 | |
| | | | | | | | | |
| Preferred Stock | 0.0% | | | | | | | | |
| | | | | | | | | |
| Automotive | 0.0% | | | | | | | | |
Better Place, Inc., Series B
(Identified cost $864,900) (a), (b) | | | 345,960 | | | | 0 | |
| | | | | | | | | |
| Short-Term Investment | 3.3% | | | | | | | | |
State Street Institutional Treasury
Money Market Fund
(Identified cost $2,148,568) | | | 2,148,568 | | | | 2,148,568 | |
| | | | | | | | | |
| Total Investments | 100.7% | | | | | | | | |
| (Identified cost $53,492,362) (c) | | | | | | $ | 64,569,250 | |
| | | | | | | | | |
Liabilities in Excess of Cash and
Other Assets | (0.7)% | | | | | | | (428,269 | ) |
| | | | | | | | | |
| Net Assets | 100.0% | | | | | | $ | 64,140,981 | |
The accompanying notes are an integral part of these financial statements.
18 Semi-Annual Report
| Description | | Shares | | | Value | |
| | | | | | | | | |
| Lazard Retirement International Equity Portfolio | | | |
| | | | | | | | | |
| Common Stocks | 94.9% | | | | | | | | |
| | | | | | | | | |
| Australia | 1.8% | | | | | | | | |
| Ansell, Ltd. | | | 321,369 | | | $ | 6,009,180 | |
| James Hardie Industries PLC | | | 509,324 | | | | 6,646,894 | |
| | | | | | | | 12,656,074 | |
| Austria | 0.9% | | | | | | | | |
| UNIQA Insurance Group AG | | | 480,901 | | | | 6,181,978 | |
| | | | | | | | | |
| Belgium | 2.6% | | | | | | | | |
| Anheuser-Busch InBev NV | | | 163,442 | | | | 18,776,919 | |
| | | | | | | | | |
| Bermuda | 1.2% | | | | | | | | |
| Signet Jewelers, Ltd. | | | 78,365 | | | | 8,651,684 | |
| | | | | | | | | |
| Brazil | 1.5% | | | | | | | | |
| Estacio Participacoes SA | | | 825,000 | | | | 10,921,588 | |
| | | | | | | | | |
| Canada | 2.5% | | | | | | | | |
| MacDonald Dettwiler & Associates, Ltd. | | | 103,900 | | | | 8,483,958 | |
| Rogers Communications, Inc., Class B | | | 240,500 | | | | 9,678,150 | |
| | | | | | | | 18,162,108 | |
| China | 0.9% | | | | | | | | |
| Anhui Conch Cement Co., Ltd., Class H | | | 1,888,500 | | | | 6,518,034 | |
| | | | | | | | | |
| Denmark | 0.9% | | | | | | | | |
| Carlsberg A/S, Class B | | | 62,351 | | | | 6,716,229 | |
| | | | | | | | | |
| Finland | 1.8% | | | | | | | | |
| Sampo Oyj, A Shares | | | 259,904 | | | | 13,150,011 | |
| | | | | | | | | |
| France | 8.4% | | | | | | | | |
| Airbus Group NV | | | 152,575 | | | | 10,224,593 | |
| BNP Paribas SA | | | 172,835 | | | | 11,725,469 | |
| Cap Gemini SA | | | 124,213 | | | | 8,861,423 | |
| Sanofi SA | | | 178,753 | | | | 18,988,988 | |
| Valeo SA | | | 80,062 | | | | 10,753,501 | |
| | | | | | | | 60,553,974 | |
| Germany | 4.3% | | | | | | | | |
| Bayer AG | | | 139,656 | | | | 19,725,478 | |
| Bayerische Motoren Werke AG | | | 53,326 | | | | 6,763,048 | |
| RTL Group SA | | | 42,433 | | | | 4,720,330 | |
| | | | | | | | 31,208,856 | |
| Description | | Shares | | | Value | |
| | | | | | | | | |
| Greece | 1.0% | | | | | | | | |
| Piraeus Bank SA (a) | | | 3,300,737 | | | $ | 7,321,914 | |
| | | | | | | | | |
| Ireland | 1.0% | | | | | | | | |
| Ryanair Holdings PLC Sponsored ADR (a) | | | 132,272 | | | | 7,380,778 | |
| | | | | | | | | |
| Israel | 2.1% | | | | | | | | |
| Teva Pharmaceutical Industries, Ltd., Sponsored ADR | | | 284,300 | | | | 14,903,006 | |
| | | | | | | | | |
| Italy | 3.1% | | | | | | | | |
| Atlantia SpA | | | 407,534 | | | | 11,618,318 | |
| Eni SpA | | | 391,625 | | | | 10,714,320 | |
| | | | | | | | 22,332,638 | |
| Japan | 18.5% | | | | | | | | |
| AEON Financial Service Co., Ltd. | | | 186,200 | | | | 4,868,899 | |
| Asahi Group Holdings, Ltd. | | | 290,200 | | | | 9,109,481 | |
| Asics Corp. | | | 370,560 | | | | 8,643,535 | |
| Daikin Industries, Ltd. | | | 178,600 | | | | 11,269,051 | |
| Daiwa House Industry Co., Ltd. | | | 609,000 | | | | 12,624,254 | |
| Don Quijote Holdings Co., Ltd. | | | 209,400 | | | | 11,678,693 | |
| Japan Tobacco, Inc. | | | 391,700 | | | | 14,279,138 | |
| KDDI Corp. | | | 244,400 | | | | 14,906,940 | |
| LIXIL Group Corp. | | | 265,600 | | | | 7,167,962 | |
| Makita Corp. | | | 104,200 | | | | 6,438,893 | |
| Seven & I Holdings Co., Ltd. | | | 266,000 | | | | 11,206,633 | |
| Sumitomo Mitsui Financial Group, Inc. | | | 378,800 | | | | 15,869,179 | |
| United Arrows, Ltd. | | | 123,900 | | | | 4,996,116 | |
| | | | | | | | 133,058,774 | |
| Norway | 0.6% | | | | | | | | |
| Petroleum Geo-Services ASA | | | 400,418 | | | | 4,243,203 | |
| | | | | | | | | |
| Philippines | 1.8% | | | | | | | | |
| Alliance Global Group, Inc. | | | 18,972,300 | | | | 12,648,200 | |
| | | | | | | | | |
| South Korea | 1.1% | | | | | | | | |
| Samsung Electronics Co., Ltd. GDR | | | 11,997 | | | | 7,750,062 | |
| | | | | | | | | |
| Spain | 2.5% | | | | | | | | |
| Mediaset Espana Comunicacion SA (a) | | | 582,618 | | | | 6,795,482 | |
| Red Electrica Corporacion SA | | | 120,122 | | | | 10,987,470 | |
| | | | | | | | 17,782,952 | |
| Sweden | 3.3% | | | | | | | | |
| Assa Abloy AB, Class B | | | 181,383 | | | | 9,229,927 | |
| Swedbank AB, A Shares | | | 541,360 | | | | 14,357,296 | |
| | | | | | | | 23,587,223 | |
The accompanying notes are an integral part of these financial statements.
Semi-Annual Report 19
| Description | | Shares | | | Value | |
| | | | | | | | | |
| Lazard Retirement International Equity Portfolio (concluded) | |
| | | | | | | | | |
| Switzerland | 7.8% | | | | | | | | |
| GAM Holding AG | | | 346,051 | | | $ | 6,594,792 | |
| Glencore PLC | | | 2,119,233 | | | | 11,807,226 | |
| Novartis AG | | | 322,694 | | | | 29,220,036 | |
| Swatch Group AG | | | 14,449 | | | | 8,725,124 | |
| | | | | | | | 56,347,178 | |
| Thailand | 0.7% | | | | | | | | |
| Krung Thai Bank Public Co. Ltd. (d) | | | 7,691,800 | | | | 4,953,277 | |
| | | | | | | | | |
| Turkey | 0.5% | | | | | | | | |
| Koc Holding AS | | | 698,758 | | | | 3,430,135 | |
| | | | | | | | | |
| United Kingdom | 24.1% | | | | | | | | |
| British American Tobacco PLC | | | 267,622 | | | | 15,929,526 | |
| Direct Line Insurance Group PLC | | | 2,331,801 | | | | 10,766,757 | |
| Informa PLC | | | 1,279,279 | | | | 10,487,024 | |
| International Consolidated Airlines Group SA (a) | | | 1,673,652 | | | | 10,612,186 | |
| Ladbrokes PLC | | | 1,759,802 | | | | 4,225,450 | |
| Lloyds Banking Group PLC (a) | | | 14,011,738 | | | | 17,804,917 | |
| Prudential PLC | | | 810,938 | | | | 18,610,923 | |
| Reed Elsevier PLC | | | 752,806 | | | | 12,110,509 | |
| Rexam PLC | | | 1,534,789 | | | | 14,052,511 | |
| Rolls-Royce Holdings PLC | | | 745,536 | | | | 13,639,480 | |
| Royal Dutch Shell PLC, A Shares | | | 538,607 | | | | 22,293,054 | |
| Taylor Wimpey PLC | | | 5,327,520 | | | | 10,393,969 | |
| Unilever PLC | | | 272,486 | | | | 12,362,474 | |
| | | | | | | | 173,288,780 | |
| Total Common Stocks | | | | | | | | |
| (Identified cost $506,462,466) | | | | | | | 682,525,575 | |
| Description | | Shares | | | Value | |
| | | | | | | | | |
| Preferred Stock | 2.0% | | | | | | | | |
| | | | | | | | | |
| Germany | 2.0% | | | | | | | | |
Volkswagen AG
(Identified cost $14,689,454) | | | 55,091 | | | $ | 14,468,649 | |
| | | | | | | | | |
| Short-Term Investment | 3.0% | | | | | | | | |
State Street Institutional Treasury
Money Market Fund
(Identified cost $21,365,606) | | | 21,365,606 | | | | 21,365,606 | |
| | | | | | | | | |
| Total Investments | 99.9% | | | | | | | | |
| (Identified cost $542,517,526) (c) | | | | | | $ | 718,359,830 | |
| | | | | | | | | |
Cash and Other Assets in Excess
of Liabilities | 0.1% | | | | | | | 954,704 | |
| | | | | | | | | |
| Net Assets | 100.0% | | | | | | $ | 719,314,534 | |
The accompanying notes are an integral part of these financial statements.
20 Semi-Annual Report
| Description | | Shares | | | Value | |
| | | | | | | |
| Lazard Retirement Emerging Markets Equity Portfolio | |
| | | | | | | | | |
| Common Stocks | 95.9% | | | | | | | | |
| | | | | | | | | |
| Argentina | 1.2% | | | | | | | | |
| YPF Sociedad Anonima Sponsored ADR | | | 443,434 | | | $ | 14,491,423 | |
| | | | | | | | | |
| Brazil | 15.9% | | | | | | | | |
| Ambev SA ADR | | | 1,918,800 | | | | 13,508,352 | |
| Banco do Brasil SA | | | 3,699,966 | | | | 41,613,105 | |
| BB Seguridade Participacoes SA | | | 1,830,200 | | | | 26,871,096 | |
| CCR SA | | | 1,568,400 | | | | 12,777,189 | |
| CEMIG SA Sponsored ADR | | | 1,222,800 | | | | 9,770,172 | |
| Cielo SA | | | 1,723,160 | | | | 35,484,852 | |
| Localiza Rent a Car SA | | | 500,100 | | | | 8,247,859 | |
| Natura Cosmeticos SA | | | 566,900 | | | | 9,557,377 | |
| Souza Cruz SA | | | 1,131,627 | | | | 11,661,981 | |
| Vale SA Sponsored ADR | | | 820,800 | | | | 10,859,184 | |
| Via Varejo SA | | | 834,600 | | | | 9,348,880 | |
| | | | | | | | 189,700,047 | |
| China | 8.7% | | | | | | | | |
| Baidu, Inc. Sponsored ADR (a) | | | 105,700 | | | | 19,745,817 | |
| China Construction Bank Corp., Class H (a) | | | 45,741,390 | | | | 34,584,608 | |
| China Shenhua Energy Co., Ltd., Class H (a) | | | 2,767,500 | | | | 7,998,555 | |
| CNOOC, Ltd. | | | 8,470,000 | | | | 15,256,141 | |
| NetEase, Inc. Sponsored ADR | | | 251,200 | | | | 19,684,032 | |
| Weichai Power Co., Ltd., Class H | | | 1,851,400 | | | | 7,142,452 | |
| | | | | | | | 104,411,605 | |
| Colombia | 2.8% | | | | | | | | |
| Pacific Rubiales Energy Corp. | | | 1,662,200 | | | | 33,772,078 | |
| | | | | | | | | |
| Egypt | 0.8% | | | | | | | | |
| Commercial International Bank Egypt SAE GDR | | | 1,927,566 | | | | 9,406,522 | |
| | | | | | | | | |
| Hong Kong | 2.6% | | | | | | | | |
| China Mobile, Ltd. Sponsored ADR | | | 470,649 | | | | 22,878,248 | |
| Huabao International Holdings, Ltd. | | | 13,021,000 | | | | 7,660,993 | |
| | | | | | | | 30,539,241 | |
| Description | | Shares | | | Value | |
| | | | | | | | | |
| Hungary | 0.9% | | | | | | | | |
| OTP Bank PLC | | | 571,688 | | | $ | 10,990,034 | |
| | | | | | | | | |
| India | 6.0% | | | | | | | | |
| Axis Bank, Ltd. | | | 498,996 | | | | 15,906,146 | |
| Bajaj Auto, Ltd. | | | 14,641 | | | | 558,668 | |
| Bank of India | | | 680,164 | | | | 3,410,715 | |
| Bharat Heavy Electricals, Ltd. | | | 2,297,669 | | | | 9,565,821 | |
| Hero MotoCorp, Ltd. | | | 6,392 | | | | 279,449 | |
| Jindal Steel & Power, Ltd. | | | 472,934 | | | | 2,528,815 | |
| Punjab National Bank, Ltd. | | | 1,034,527 | | | | 17,071,545 | |
| Tata Consultancy Services, Ltd. | | | 569,846 | | | | 22,871,057 | |
| | | | | | | | 72,192,216 | |
| Indonesia | 5.8% | | | | | | | | |
| PT Astra International Tbk | | | 14,818,500 | | | | 9,093,596 | |
| PT Bank Mandiri (Persero) Tbk | | | 25,092,229 | | | | 20,583,882 | |
| PT Semen Indonesia (Persero) Tbk | | | 5,555,900 | | | | 7,064,968 | |
PT Telekomunikasi Indonesia (Persero)
Tbk Sponsored ADR | | | 536,000 | | | | 22,329,760 | |
| PT United Tractors Tbk | | | 5,560,040 | | | | 10,833,988 | |
| | | | | | | | 69,906,194 | |
| Macau | 1.2% | | | | | | | | |
| Wynn Macau, Ltd. | | | 3,615,200 | | | | 14,226,827 | |
| | | | | | | | | |
| Malaysia | 0.7% | | | | | | | | |
| British American Tobacco Malaysia Berhad | | | 415,700 | | | | 8,484,889 | |
| | | | | | | | | |
| Mexico | 1.4% | | | | | | | | |
| Grupo Mexico SAB de CV, Series B | | | 2,463,297 | | | | 8,219,534 | |
| Kimberly-Clark de Mexico SAB de CV, Series A | | | 3,085,762 | | | | 8,660,161 | |
| | | | | | | | 16,879,695 | |
| Pakistan | 1.5% | | | | | | | | |
| Oil & Gas Development Co., Ltd. | | | 2,909,500 | | | | 7,681,021 | |
| Pakistan Petroleum, Ltd. | | | 4,564,302 | | | | 10,365,950 | |
| | | | | | | | 18,046,971 | |
| Philippines | 1.6% | | | | | | | | |
Philippine Long Distance Telephone Co.
Sponsored ADR | | | 281,500 | | | | 18,967,470 | |
The accompanying notes are an integral part of these financial statements.
Semi-Annual Report 21
| Description | | Shares | | | Value | |
| | | | | | | | | |
| Lazard Retirement Emerging Markets Equity Portfolio (concluded) | |
| | | | | | | | | |
| Russia | 11.4% | | | | | | | | |
| Alrosa AO (a), (d) | | | 7,820,700 | | | $ | 9,621,932 | |
| Eurasia Drilling Co., Ltd. GDR | | | 205,164 | | | | 6,462,666 | |
| Gazprom OAO Sponsored ADR (a) | | | 3,002,050 | | | | 26,162,866 | |
| Lukoil OAO Sponsored ADR | | | 155,313 | | | | 9,273,739 | |
| Magnit OJSC Sponsored GDR | | | 15,738 | | | | 928,542 | |
| Magnit OJSC Sponsored GDR (d), (e) | | | 132,475 | | | | 7,816,025 | |
| MegaFon OAO GDR (d), (e) | | | 421,946 | | | | 13,291,299 | |
| Mobile TeleSystems OJSC Sponsored ADR | | | 1,214,620 | | | | 23,976,599 | |
| Oriflame Cosmetics SA SDR | | | 172,453 | | | | 4,018,668 | |
| Sberbank of Russia (a), (d) | | | 14,223,089 | | | | 35,374,572 | |
| | | | | | | | 136,926,908 | |
| South Africa | 8.3% | | | | | | | | |
| Bidvest Group, Ltd. | | | 412,750 | | | | 10,967,080 | |
| Imperial Holdings, Ltd. | | | 486,227 | | | | 9,143,902 | |
| Nedbank Group, Ltd. | | | 398,020 | | | | 8,576,798 | |
| PPC, Ltd. | | | 2,528,399 | | | | 7,453,249 | |
| Sanlam, Ltd. | | | 1,526,387 | | | | 8,862,661 | |
| Shoprite Holdings, Ltd. | | | 1,115,509 | | | | 16,153,116 | |
| Standard Bank Group, Ltd. | | | 637,404 | | | | 8,690,511 | |
| Tiger Brands, Ltd. | | | 303,902 | | | | 8,762,436 | |
| Truworths International, Ltd. | | | 612,999 | | | | 4,322,407 | |
| Vodacom Group, Ltd. | | | 698,468 | | | | 8,633,156 | |
| Woolworths Holdings, Ltd. | | | 1,117,345 | | | | 8,210,673 | |
| | | | | | | | 99,775,989 | |
| South Korea | 13.4% | | | | | | | | |
| Coway Co., Ltd. | | | 108,406 | | | | 9,074,904 | |
| Hanwha Life Insurance Co., Ltd. | | | 2,041,722 | | | | 13,035,703 | |
| Hyundai Mobis Co., Ltd. | | | 69,644 | | | | 19,548,227 | |
| KB Financial Group, Inc. | | | 517,880 | | | | 18,016,778 | |
| KT&G Corp. | | | 190,975 | | | | 16,892,926 | |
| Samsung Electronics Co., Ltd. | | | 29,119 | | | | 38,046,371 | |
| Shinhan Financial Group Co., Ltd. | | | 582,001 | | | | 26,948,752 | |
| SK Hynix, Inc. (a) | | | 395,930 | | | | 18,998,222 | |
| | | | | | | | 160,561,883 | |
| Description | | Shares | | | Value | |
| | | | | | | | | |
| Taiwan | 4.6% | | | | | | | | |
| Hon Hai Precision Industry Co., Ltd. | | | 4,719,295 | | | $ | 15,805,798 | |
| Taiwan Semiconductor Manufacturing Co., Ltd. | | | 9,100,642 | | | | 38,556,876 | |
| | | | | | | | 54,362,674 | |
| Thailand | 2.5% | | | | | | | | |
| CP All Public Co. Ltd. (d) | | | 7,369,500 | | | | 10,899,276 | |
| PTT Exploration & Production Public Co. Ltd. (d) | | | 1,781,535 | | | | 9,194,488 | |
| The Siam Cement Public Co. Ltd. | | | 709,400 | | | | 9,967,228 | |
| | | | | | | | 30,060,992 | |
| Turkey | 4.6% | | | | | | | | |
| Akbank TAS | | | 2,721,393 | | | | 10,006,444 | |
| Koc Holding AS | | | 3,575,921 | | | | 17,553,846 | |
| Turkcell Iletisim Hizmetleri AS (a) | | | 2,092,682 | | | | 13,087,906 | |
| Turkiye Is Bankasi AS, C Shares | | | 5,417,917 | | | | 14,653,386 | |
| | | | | | | | 55,301,582 | |
| Total Common Stocks | | | | | | | | |
| (Identified cost $1,018,487,708) | | | | | | | 1,149,005,240 | |
| | | | | | | | | |
| Short-Term Investment | 4.4% | | | | | | | | |
| State Street Institutional Treasury | | | | | | | | |
| Money Market Fund | | | | | | | | |
| (Identified cost $52,254,198) | | | 52,254,198 | | | | 52,254,198 | |
| | | | | | | | | |
| Total Investments | 100.3% | | | | | | | | |
| (Identified cost $1,070,741,906) (c) | | | | | | $ | 1,201,259,438 | |
| | | | | | | | | |
Liabilities in Excess of Cash and
Other Assets | (0.3)% | | | | | | | (3,726,388 | ) |
| | | | | | | | | |
| Net Assets | 100.0% | | | | | | $ | 1,197,533,050 | |
The accompanying notes are an integral part of these financial statements.
22 Semi-Annual Report
| Description | | | Shares | | | | Value | |
| | | | | | | | | |
| Lazard Retirement Global Dynamic Multi Asset Portfolio | |
| | | | | | | | | |
| Common Stocks | 78.5% | | | | | | | | |
| | | | | | | | | |
| Australia | 2.9% | | | | | | | | |
| AGL Energy, Ltd. | | | 80,037 | | | $ | 1,168,289 | |
| Amcor, Ltd. | | | 44,645 | | | | 439,082 | |
| BC Iron, Ltd. | | | 5,722 | | | | 17,266 | |
| BHP Billiton, Ltd. | | | 13,589 | | | | 460,013 | |
| Cardno, Ltd. | | | 5,076 | | | | 30,250 | |
| CSL, Ltd. | | | 10,001 | | | | 627,596 | |
| Dexus Property Group | | | 24,915 | | | | 26,078 | |
| GPT Group REIT | | | 95,371 | | | | 345,331 | |
| Iress, Ltd. | | | 5,596 | | | | 43,216 | |
| Platinum Asset Management, Ltd. | | | 9,129 | | | | 54,232 | |
| Scentre Group (a) | | | 48,455 | | | | 146,209 | |
| Telstra Corp., Ltd. | | | 163,796 | | | | 804,692 | |
| Westfield Corp. | | | 16,087 | | | | 108,460 | |
| | | | | | | | 4,270,714 | |
| Belgium | 0.8% | | | | | | | | |
| Anheuser-Busch InBev NV Sponsored ADR | | | 9,175 | | | | 1,054,574 | |
| bpost SA | | | 4,103 | | | | 103,657 | |
| Telenet Group Holding NV (a) | | | 1,339 | | | | 76,310 | |
| | | | | | | | 1,234,541 | |
| Bermuda | 1.3% | | | | | | | | |
| Everest Re Group, Ltd. | | | 6,414 | | | | 1,029,383 | |
| PartnerRe, Ltd. | | | 7,407 | | | | 808,918 | |
| Validus Holdings, Ltd. | | | 2,552 | | | | 97,589 | |
| | | | | | | | 1,935,890 | |
| Canada | 5.1% | | | | | | | | |
| Agnico-Eagle Mines, Ltd. | | | 1 | | | | 28 | |
| Bell Aliant, Inc. | | | 5,250 | | | | 137,222 | |
| Canadian Apartment Properties REIT | | | 1,039 | | | | 22,259 | |
| Canadian Imperial Bank of Commerce | | | 19,594 | | | | 1,783,026 | |
| Canadian National Railway Co. | | | 1,498 | | | | 97,429 | |
| Canadian Natural Resources, Ltd. | | | 1,439 | | | | 66,121 | |
| Capital Power Corp. | | | 5,223 | | | | 129,076 | |
| CI Financial Corp. | | | 4,844 | | | | 159,114 | |
| Cineplex, Inc. | | | 3,633 | | | | 141,125 | |
| Cogeco Cable, Inc. | | | 2,048 | | | | 113,412 | |
| Constellation Software, Inc. | | | 500 | | | | 127,435 | |
| Encana Corp. | | | 15,356 | | | | 363,806 | |
| Entertainment One, Ltd. (a) | | | 6,303 | | | | 33,440 | |
| Genworth MI Canada, Inc. | | | 1,469 | | | | 52,328 | |
| Description | | | Shares | | | | Value | |
| | | | | | | | | |
| Imperial Oil, Ltd. | | | 2,660 | | | $ | 140,173 | |
| Intact Financial Corp. | | | 2,469 | | | | 170,254 | |
| Magna International, Inc. | | | 1,142 | | | | 122,928 | |
| Metro, Inc. | | | 2,267 | | | | 140,156 | |
| Penn West Petroleum, Ltd. | | | 9,497 | | | | 92,740 | |
| Progressive Waste Solutions, Ltd. | | | 1,465 | | | | 37,605 | |
| Rogers Communications, Inc., Class B | | | 5,229 | | | | 210,424 | |
| Royal Bank of Canada | | | 31,763 | | | | 2,270,636 | |
| Saputo, Inc. | | | 2,874 | | | | 172,189 | |
| Shaw Communications, Inc., Class B | | | 12,947 | | | | 331,971 | |
| ShawCor, Ltd. | | | 769 | | | | 42,765 | |
| The Jean Coutu Group PJC, Inc., Class A | | | 4,825 | | | | 102,464 | |
| Tim Hortons, Inc. | | | 5,505 | | | | 301,136 | |
| Yamana Gold, Inc. | | | 1 | | | | 4 | |
| | | | | | | | 7,361,266 | |
| Colombia | 0.1% | | | | | | | | |
| Pacific Rubiales Energy Corp. | | | 3,554 | | | | 72,209 | |
| | | | | | | | | |
| Denmark | 1.6% | | | | | | | | |
| AP Moeller-Maersk A/S, Class B | | | 98 | | | | 243,522 | |
| Coloplast A/S, Class B | | | 2,428 | | | | 219,574 | |
| Novo Nordisk A/S, Class B | | | 6,867 | | | | 316,055 | |
| Novo Nordisk A/S Sponsored ADR | | | 23,985 | | | | 1,107,867 | |
| Topdanmark A/S ADR (a) | | | 129,690 | | | | 395,554 | |
| | | | | | | | 2,282,572 | |
| Finland | 0.8% | | | | | | | | |
| Kone Oyj, Class B | | | 16,358 | | | | 682,722 | |
| Sampo Oyj, A Shares ADR | | | 19,850 | | | | 501,212 | |
| | | | | | | | 1,183,934 | |
| France | 1.1% | | | | | | | | |
| Airbus Group NV | | | 7,177 | | | | 480,956 | |
| Bureau Veritas SA | | | 3,415 | | | | 94,786 | |
| Orpea | | | 1,142 | | | | 80,111 | |
| Safran SA | | | 766 | | | | 50,152 | |
| Total SA | | | 12,674 | | | | 915,971 | |
| | | | | | | | 1,621,976 | |
| Germany | 1.7% | | | | | | | | |
| BASF SE | | | 1,606 | | | | 186,989 | |
| Bayer AG | | | 2,139 | | | | 302,120 | |
| Continental AG | | | 154 | | | | 35,669 | |
| Continental AG Sponsored ADR | | | 26,831 | | | | 1,249,251 | |
| Hugo Boss AG | | | 3,369 | | | | 503,528 | |
| Symrise AG ADR | | | 14,635 | | | | 199,182 | |
| | | | | | | | 2,476,739 | |
The accompanying notes are an integral part of these financial statements.
Semi-Annual Report 23
| Description | | | Shares | | | | Value | |
| | | | | | | |
| Lazard Retirement Global Dynamic Multi Asset Portfolio (continued) |
| |
| Hong Kong | 0.8% | | | | | | | | |
| Cheung Kong Holdings, Ltd. | | | 31,000 | | | $ | 549,572 | |
| Galaxy Entertainment Group, Ltd. | | | 16,000 | | | | 127,580 | |
| Hopewell Holdings, Ltd. | | | 10,000 | | | | 34,772 | |
| Michael Kors Holdings, Ltd. (a) | | | 1,927 | | | | 170,829 | |
| Swire Pacific, Ltd., Class A | | | 7,000 | | | | 86,118 | |
| The Link REIT | | | 30,000 | | | | 161,411 | |
| | | | | | | | 1,130,282 | |
| Ireland | 0.2% | | | | | | | | |
| Accenture PLC Class A | | | 472 | | | | 38,449 | |
| ICON PLC (a) | | | 758 | | | | 35,709 | |
| Ryanair Holdings PLC Sponsored ADR (a) | | | 3,577 | | | | 199,597 | |
| | | | | | | | 273,755 | |
| Israel | 0.2% | | | | | | | | |
| Bank Hapoalim BM | | | 7,331 | | | | 42,386 | |
| Bank Leumi Le-Israel BM (a) | | | 34,874 | | | | 136,081 | |
| Israel Discount Bank, Ltd., Class A (a) | | | 72,455 | | | | 122,803 | |
| | | | | | | | 301,270 | |
| Italy | 0.3% | | | | | | | | |
| Eni SpA | | | 17,802 | | | | 487,038 | |
| | | | | | | | | |
| Japan | 6.2% | | | | | | | | |
| Alfresa Holdings Corp. | | | 1,100 | | | | 70,905 | |
| ANA Holdings, Inc. | | | 42,000 | | | | 99,087 | |
| AOKI Holdings, Inc. | | | 2,600 | | | | 36,778 | |
| Asahi Glass Co., Ltd. | | | 51,000 | | | | 300,548 | |
| Asahi Kasei Corp. | | | 52,000 | | | | 397,809 | |
| Astellas Pharma, Inc. | | | 2,900 | | | | 38,102 | |
| Bridgestone Corp. | | | 34,300 | | | | 1,200,271 | |
| Coca-Cola East Japan Co., Ltd. | | | 2,200 | | | | 55,942 | |
| Daito Trust Construction Co., Ltd. | | | 500 | | | | 58,783 | |
| Daiwa House Industry Co., Ltd. ADR | | | 10,260 | | | | 2,130,002 | |
| East Japan Railway Co. | | | 700 | | | | 55,133 | |
| Fuji Heavy Industries, Ltd. | | | 5,000 | | | | 138,443 | |
| Heiwa Corp. | | | 2,400 | | | | 53,281 | |
| Hino Motors, Ltd. | | | 30,000 | | | | 413,109 | |
| Hogy Medical Co., Ltd. | | | 700 | | | | 37,935 | |
| Japan Airlines Co., Ltd. | | | 700 | | | | 38,695 | |
| Kaken Pharmaceutical Co., Ltd. | | | 4,000 | | | | 84,655 | |
| KDDI Corp. | | | 2,900 | | | | 176,883 | |
| Kubota Corp. | | | 6,000 | | | | 85,050 | |
| Description | | | Shares | | | | Value | |
| | | | | | | | | |
| Maeda Road Construction Co., Ltd. | | | 19,000 | | | $ | 328,779 | |
| Mitsubishi Estate Co., Ltd. ADR | | | 31,460 | | | | 778,320 | |
| Mitsubishi Materials Corp. | | | 28,000 | | | | 98,120 | |
| Mitsubishi UFJ Lease & Finance Co., Ltd. | | | 17,830 | | | | 102,434 | |
| Mitsui & Co., Ltd. | | | 6,100 | | | | 97,788 | |
| Mitsui Mining & Smelting Co., Ltd. | | | 36,000 | | | | 102,700 | |
| Nippon Suisan Kaisha, Ltd. (a) | | | 19,600 | | | | 60,558 | |
| Ryosan Co., Ltd. | | | 5,300 | | | | 110,442 | |
| Secom Co., Ltd. | | | 700 | | | | 42,772 | |
| Senshu Ikeda Holdings, Inc. | | | 28,100 | | | | 143,128 | |
| Sumitomo Mitsui Trust Holdings, Inc. Sponsored ADR | | | 102,220 | | | | 461,012 | |
| The Bank of Yokohama, Ltd. | | | 126,000 | | | | 725,117 | |
| Tokyo Seimitsu Co., Ltd. | | | 12,800 | | | | 230,085 | |
| Wacoal Holdings Corp. | | | 5,000 | | | | 54,291 | |
| West Japan Railway Co. | | | 3,900 | | | | 171,699 | |
| Yoshinoya D&C Co., Ltd. | | | 5,300 | | | | 74,657 | |
| | | | | | | | 9,053,313 | |
| Macau | 0.4% | | | | | | | | |
| Sands China, Ltd. | | | 6,400 | | | | 48,514 | |
| Sands China, Ltd. Sponsored ADR | | | 6,855 | | | | 520,089 | |
| | | | | | | | 568,603 | |
| Malta | 0.0% | | | | | | | | |
| Unibet Group PLC SDR | | | 650 | | | | 32,298 | |
| | | | | | | | | |
| Netherlands | 1.2% | | | | | | | | |
| CNH Industrial NV | | | 29,295 | | | | 300,852 | |
| Gemalto NV | | | 400 | | | | 41,462 | |
| Koninklijke Ahold NV | | | 29,176 | | | | 547,724 | |
| NXP Semiconductor NV (a) | | | 12,870 | | | | 851,737 | |
| | | | | | | | 1,741,775 | |
| New Zealand | 0.4% | | | | | | | | |
| Air New Zealand, Ltd. | | | 36,830 | | | | 67,073 | |
Fisher & Paykel Healthcare Corp.,
Ltd., Class C | | | 22,640 | | | | 94,157 | |
| Meridian Energy, Ltd. | | | 40,219 | | | | 43,665 | |
| Sky Network Television, Ltd. | | | 50,571 | | | | 304,186 | |
| Telecom Corp. of New Zealand, Ltd. | | | 21,127 | | | | 49,574 | |
| | | | | | | | 558,655 | |
| Norway | 1.1% | | | | | | | | |
| Opera Software ASA | | | 5,316 | | | | 70,894 | |
| Statoil ASA | | | 26,651 | | | | 818,580 | |
| Telenor ASA | | | 31,426 | | | | 715,735 | |
| | | | | | | | 1,605,209 | |
The accompanying notes are an integral part of these financial statements.
24 Semi-Annual Report
| Description | | Shares | | | Value | |
| | | | | | | | | |
| Lazard Retirement Global Dynamic Multi Asset Portfolio (continued) | |
| | | | | | | | | |
| Portugal | 0.1% | | | | | | | | |
| Sonae SGPS SA | | | 42,922 | | | $ | 70,469 | |
| | | | | | | | | |
| Singapore | 0.5% | | | | | | | | |
| Avago Technologies, Ltd. | | | 484 | | | | 34,882 | |
| ComfortDelGro Corp., Ltd. | | | 289,000 | | | | 579,437 | |
| DBS Group Holdings, Ltd. | | | 8,000 | | | | 107,467 | |
| M1, Ltd. | | | 26,000 | | | | 73,189 | |
| | | | | | | | 794,975 | |
| Spain | 0.0% | | | | | | | | |
| Amadeus IT Holding SA, A Shares | | | 780 | | | | 32,170 | |
| Corporacion Financiera Alba SA | | | 150 | | | | 9,754 | |
| | | | | | | | 41,924 | |
| Sweden | 0.7% | | | | | | | | |
| Alfa Laval AB | | | 3,949 | | | | 101,775 | |
| Assa Abloy AB ADR | | | 29,085 | | | | 738,759 | |
| Betsson AB | | | 736 | | | | 25,446 | |
| Hennes & Mauritz AB, B Shares | | | 2,893 | | | | 126,431 | |
| Meda AB | | | 2,719 | | | | 47,246 | |
| | | | | | | | 1,039,657 | |
| Switzerland | 2.6% | | | | | | | | |
| Novartis AG | | | 1,485 | | | | 134,420 | |
| Novartis AG ADR | | | 28,275 | | | | 2,559,736 | |
| Panalpina Welttransport Holding AG ADR | | | 11,420 | | | | 364,298 | |
| Roche Holding AG | | | 464 | | | | 138,394 | |
| Swisscom AG | | | 385 | | | | 223,802 | |
| Tyco International, Ltd. | | | 8,995 | | | | 410,172 | |
| | | | | | | | 3,830,822 | |
| United Kingdom | 8.5% | | | | | | | | |
| Admiral Group PLC | | | 845 | | | | 22,401 | |
| Aggreko PLC | | | 3,704 | | | | 104,594 | |
| Anglo American PLC | | | 24,626 | | | | 602,672 | |
| Bellway PLC | | | 19,630 | | | | 526,094 | |
| Berendsen PLC | | | 4,658 | | | | 78,043 | |
| BP PLC | | | 118,294 | | | | 1,042,406 | |
| British American Tobacco PLC | | | 10,810 | | | | 643,438 | |
| British Sky Broadcasting Group PLC | | | 46,247 | | | | 715,490 | |
| Britvic PLC | | | 3,224 | | | | 40,140 | |
| BT Group PLC | | | 14,566 | | | | 95,949 | |
| Centrica PLC | | | 205,212 | | | | 1,097,850 | |
| Delphi Automotive PLC | | | 1,385 | | | | 95,205 | |
| Halma PLC | | | 5,466 | | | | 55,145 | |
| Hays PLC | | | 38,102 | | | | 95,268 | |
| Description | | Shares | | | Value | |
| | | | | | | | | |
| HSBC Holdings PLC | | | 19,020 | | | $ | 192,994 | |
International Consolidated Airlines
Group SA Sponsored ADR (a) | | | 30,987 | | | | 980,739 | |
| ITV PLC | | | 48,419 | | | | 147,664 | |
| Lloyds Banking Group PLC ADR (a) | | | 123,222 | | | | 633,361 | |
| Next PLC | | | 1,570 | | | | 173,977 | |
| Premier Oil PLC | | | 24,781 | | | | 141,608 | |
| Provident Financial PLC | | | 13,982 | | | | 546,534 | |
| Rexam PLC Sponsored ADR | | | 8,408 | | | | 392,654 | |
| Rolls-Royce Holdings PLC | | | 4,617 | | | | 84,467 | |
| Royal Dutch Shell PLC, A Shares | | | 23,297 | | | | 964,674 | |
| Shire PLC | | | 2,603 | | | | 203,583 | |
| SSE PLC | | | 6,664 | | | | 178,713 | |
| TalkTalk Telecom Group PLC | | | 7,601 | | | | 42,342 | |
| Unilever PLC | | | 2,352 | | | | 106,708 | |
| Unilever PLC Sponsored ADR | | | 47,890 | | | | 2,169,896 | |
| WH Smith PLC | | | 4,971 | | | | 91,029 | |
| | | | | | | | 12,265,638 | |
| United States | 39.9% | | | | | | | | |
| 3M Co. | | | 2,824 | | | | 404,510 | |
| Abbott Laboratories | | | 4,408 | | | | 180,287 | |
| Aflac, Inc. | | | 3,819 | | | | 237,733 | |
| Air Lease Corp. | | | 13,722 | | | | 529,395 | |
| Allergan, Inc. | | | 584 | | | | 98,824 | |
| Ally Financial, Inc. | | | 13,205 | | | | 315,732 | |
| Amdocs, Ltd. | | | 2,310 | | | | 107,005 | |
| Ameren Corp. | | | 16,881 | | | | 690,095 | |
| American Express Co. | | | 13,875 | | | | 1,316,321 | |
| AmTrust Financial Services, Inc. | | | 929 | | | | 38,966 | |
| Apache Corp. | | | 1,740 | | | | 175,079 | |
| Apple, Inc. | | | 30,078 | | | | 2,795,149 | |
| AT&T, Inc. | | | 32,072 | | | | 1,134,066 | |
| AutoZone, Inc. (a) | | | 2,012 | | | | 1,078,915 | |
| Ball Corp. | | | 4,384 | | | | 274,789 | |
| Baxter International, Inc. | | | 1,342 | | | | 97,027 | |
| Biogen Idec, Inc. (a) | | | 1,695 | | | | 534,450 | |
| Bristol-Myers Squibb Co. | | | 6,915 | | | | 335,447 | |
| Brocade Communications Systems, Inc. | | | 5,915 | | | | 54,418 | |
| Cabot Oil & Gas Corp. | | | 1,495 | | | | 51,039 | |
| CBOE Holdings, Inc. | | | 1,537 | | | | 75,636 | |
| Celgene Corp. (a) | | | 1,172 | | | | 100,651 | |
| Chesapeake Energy Corp. | | | 3,067 | | | | 95,322 | |
| Citigroup, Inc. | | | 22,965 | | | | 1,081,651 | |
| CMS Energy Corp. | | | 2,145 | | | | 66,817 | |
| Comcast Corp., Class A | | | 6,765 | | | | 363,145 | |
The accompanying notes are an integral part of these financial statements.
Semi-Annual Report 25
| Description | | Shares | | | Value | |
| | | | | | | | | |
| Lazard Retirement Global Dynamic Multi Asset Portfolio (continued) | |
| | | | | | | | | |
| Consol Energy, Inc. | | | 15,295 | | | $ | 704,641 | |
| Corning, Inc. | | | 8,805 | | | | 193,270 | |
| CR Bard, Inc. | | | 9,590 | | | | 1,371,466 | |
| Credit Acceptance Corp. (a) | | | 274 | | | | 33,729 | |
| CVS Caremark Corp. | | | 8,932 | | | | 673,205 | |
| CYS Investments, Inc. | | | 9,784 | | | | 87,891 | |
| Dollar Tree, Inc. (a) | | | 1,520 | | | | 82,779 | |
| Dr Pepper Snapple Group, Inc. | | | 912 | | | | 53,425 | |
| Eastman Chemical Co. | | | 8,354 | | | | 729,722 | |
| Eaton Corp. PLC | | | 6,565 | | | | 506,687 | |
| Eaton Vance Corp. | | | 13,272 | | | | 501,549 | |
| Edison International | | | 1,715 | | | | 99,659 | |
| Eli Lilly & Co. | | | 1,315 | | | | 81,754 | |
| EMC Corp. | | | 43,331 | | | | 1,141,339 | |
| Emerson Electric Co. | | | 1,394 | | | | 92,506 | |
| Entergy Corp. | | | 1,206 | | | | 99,001 | |
| EOG Resources, Inc. | | | 4,504 | | | | 526,337 | |
| Exelon Corp. | | | 9,039 | | | | 329,743 | |
| Exxon Mobil Corp. | | | 415 | | | | 41,782 | |
| Facebook, Inc. (a) | | | 5,425 | | | | 365,048 | |
| FMC Technologies, Inc. (a) | | | 3,803 | | | | 232,249 | |
| GameStop Corp. Class A | | | 4,004 | | | | 162,042 | |
| General Mills, Inc. | | | 1,657 | | | | 87,059 | |
| Google, Inc., Class A (a) | | | 1,855 | | | | 1,084,563 | |
| Google, Inc., Class C (a) | | | 720 | | | | 414,202 | |
| HCA Holdings, Inc. (a) | | | 2,224 | | | | 125,389 | |
| HealthSouth Corp. | | | 5,474 | | | | 196,352 | |
| Honeywell International, Inc. | | | 10,680 | | | | 992,706 | |
| Huntington Bancshares, Inc. | | | 9,882 | | | | 94,274 | |
| Intel Corp. | | | 42,489 | | | | 1,312,910 | |
| Intercontinental Exchange, Inc. | | | 2,459 | | | | 464,505 | |
| Intuit, Inc. | | | 2,849 | | | | 229,430 | |
| Jack in the Box, Inc. | | | 701 | | | | 41,948 | |
| Johnson & Johnson | | | 25,875 | | | | 2,707,042 | |
| Joy Global, Inc. | | | 6,615 | | | | 407,352 | |
| Kellogg Co. | | | 20,863 | | | | 1,370,699 | |
| Kimberly-Clark Corp. | | | 11,611 | | | | 1,291,375 | |
| Las Vegas Sands Corp. | | | 2,110 | | | | 160,824 | |
| Lockheed Martin Corp. | | | 1,926 | | | | 309,566 | |
| LyondellBasell Industries NV Class A | | | 3,964 | | | | 387,085 | |
| Macy’s, Inc. | | | 7,222 | | | | 419,020 | |
| MasterCard, Inc., Class A | | | 9,580 | | | | 703,843 | |
| McDonald’s Corp. | | | 2,886 | | | | 290,736 | |
| Description | | Shares | | | Value | |
| | | | | | | | | |
| McKesson Corp. | | | 1,985 | | | $ | 369,627 | |
| Merck & Co., Inc. | | | 1,295 | | | | 74,916 | |
| MFA Financial, Inc. REIT | | | 10,100 | | | | 82,921 | |
| Microsoft Corp. | | | 45,349 | | | | 1,891,053 | |
| Molson Coors Brewing Co., Class B | | | 5,931 | | | | 439,843 | |
| Monsanto Co. | | | 3,310 | | | | 412,889 | |
| Mylan, Inc. (a) | | | 1,323 | | | | 68,214 | |
| NetApp, Inc. | | | 3,061 | | | | 111,788 | |
| NeuStar, Inc., Class A (a) | | | 6,928 | | | | 180,267 | |
| Newmont Mining Corp. | | | 1,623 | | | | 41,289 | |
| Northrop Grumman Corp. | | | 569 | | | | 68,069 | |
| O’Reilly Automotive, Inc. (a) | | | 339 | | | | 51,053 | |
| Occidental Petroleum Corp. | | | 3,382 | | | | 347,095 | |
| Oracle Corp. | | | 11,835 | | | | 479,673 | |
| Outerwall, Inc. (a) | | | 492 | | | | 29,200 | |
| Pfizer, Inc. | | | 34,458 | | | | 1,022,713 | |
| PG&E Corp. | | | 5,378 | | | | 258,252 | |
| Portland General Electric Co. | | | 2,500 | | | | 86,675 | |
| Praxair, Inc. | | | 260 | | | | 34,538 | |
| Public Service Enterprise Group, Inc. | | | 2,497 | | | | 101,853 | |
| Qualcomm, Inc. | | | 4,487 | | | | 355,370 | |
| Quintiles Transnational Holdings, Inc. (a) | | | 6,915 | | | | 368,500 | |
| Raytheon Co. | | | 1,490 | | | | 137,452 | |
| Realogy Holdings Corp. (a) | | | 7,820 | | | | 294,892 | |
| Red Hat, Inc. (a) | | | 6,340 | | | | 350,412 | |
| Regions Financial Corp. | | | 45,325 | | | | 481,351 | |
| Reynolds American, Inc. | | | 2,336 | | | | 140,978 | |
| Ross Stores, Inc. | | | 17,203 | | | | 1,137,634 | |
| Sanderson Farms, Inc. | | | 1,104 | | | | 106,965 | |
| Schlumberger, Ltd. | | | 13,804 | | | | 1,628,182 | |
| Skyworks Solutions, Inc. | | | 1,300 | | | | 61,048 | |
| SM Energy Co. | | | 1,703 | | | | 143,222 | |
| Spectrum Brands Holdings, Inc. | | | 800 | | | | 68,824 | |
| Starwood Property Trust, Inc. | | | 3,500 | | | | 83,195 | |
| Team Health Holdings, Inc. (a) | | | 3,820 | | | | 190,771 | |
| The Hartford Financial Services Group, Inc. | | | 15,060 | | | | 539,299 | |
| The Hershey Co. | | | 3,065 | | | | 298,439 | |
| The Home Depot, Inc. | | | 429 | | | | 34,732 | |
| The Kroger Co. | | | 10,861 | | | | 536,859 | |
| The Sherwin-Williams Co. | | | 213 | | | | 44,072 | |
| The Southern Co. | | | 1,684 | | | | 76,420 | |
| The TJX Cos., Inc. | | | 5,603 | | | | 297,799 | |
| The Walt Disney Co. | | | 20,266 | | | | 1,737,607 | |
| Time Warner Cable, Inc. | | | 406 | | | | 59,804 | |
| Two Harbors Investment Corp. REIT | | | 6,800 | | | | 71,264 | |
The accompanying notes are an integral part of these financial statements.
26 Semi-Annual Report
| Description | | Shares | | | Value | |
| | | | | | | | | |
| Lazard Retirement Global Dynamic Multi Asset Portfolio (continued) |
| | | | | | | | | |
| Tyson Foods, Inc., Class A | | | 2,884 | | | $ | 108,265 | |
| Union Pacific Corp. | | | 9,357 | | | | 933,361 | |
| United Technologies Corp. | | | 7,215 | | | | 832,972 | |
| UnitedHealth Group, Inc. | | | 7,350 | | | | 600,862 | |
| Vantiv, Inc., Class A (a) | | | 1,156 | | | | 38,735 | |
| Verisk Analytics, Inc., Class A (a) | | | 1,148 | | | | 68,610 | |
| Verizon Communications, Inc. | | | 43,909 | | | | 2,148,467 | |
| Vertex Pharmaceuticals, Inc. (a) | | | 2,380 | | | | 225,338 | |
| Viacom, Inc., Class B | | | 10,764 | | | | 933,562 | |
| Visa, Inc., Class A | | | 5,319 | | | | 1,120,766 | |
| Wal-Mart Stores, Inc. | | | 7,299 | | | | 547,936 | |
| Waste Connections, Inc. | | | 2,937 | | | | 142,591 | |
| Wells Fargo & Co. | | | 12,249 | | | | 643,807 | |
| Wisconsin Energy Corp. | | | 3,567 | | | | 167,364 | |
| Xcel Energy, Inc. | | | 4,807 | | | | 154,930 | |
| Xerox Corp. | | | 25,435 | | | | 316,411 | |
| Zoetis, Inc. | | | 11,100 | | | | 358,197 | |
| | | | | | | | 58,172,366 | |
Total Common Stocks
(Identified cost $108,876,090) | | | | | | | 114,407,890 | |
| | | | | | | | | |
| Preferred Stock | 0.3% | | | | | | | | |
| | | | | | | | | |
| Germany | 0.3% | | | | | | | | |
Volkswagen AG Sponsored ADR
(Identified cost $457,693) | | | 8,695 | | | | 456,053 | |
| Description | | Security
Currency | | Principal
Amount
(000) | | Value | |
| | | | | | | | | | | |
| Corporate Bonds | 4.9% | | | | | | | | | | |
| | | | | | | | | | | |
| Australia | 0.3% | | | | | | | | | | |
| Mercedes-Benz Australia/Pacific Property, Ltd., | | | | | | | | | | |
| 4.500%, 05/18/15 | | AUD | | | 236 | | | $ | 225,022 | |
| Telstra Corp., Ltd., | | | | | | | | | | |
| 6.250%, 04/15/15 | | AUD | | | 225 | | | | 217,584 | |
| | | | | | | | | | 442,606 | |
| Description | | Security
Currency | | Principal
Amount
(000) | | Value | |
| | | | | | | | | | | |
| Canada | 0.6% | | | | | | | | | | |
| Shaw Communications, Inc., | | | | | | | | | | |
| 5.650%, 10/01/19 | | CAD | | | 150 | | | $ | 159,991 | |
| Suncor Energy, Inc., | | | | | | | | | | |
| 6.100%, 06/01/18 | | USD | | | 185 | | | | 214,704 | |
| The Toronto-Dominion Bank, | | | | | | | | | | |
| 1.824%, 04/03/17 | | CAD | | | 290 | | | | 272,076 | |
| Wells Fargo Financial Canada Corp., | | | | | | | | | | |
| 2.774%, 02/09/17 | | CAD | | | 220 | | | | 210,976 | |
| | | | | | | | | | 857,747 | |
| Chile | 0.2% | | | | | | | | | | |
| Corp. Nacional del Cobre de Chile, | | | | | | | | | | |
| 4.500%, 08/13/23 | | USD | | | 250 | | | | 265,625 | |
| | | | | | | | | | | |
| France | 0.5% | | | | | | | | | | |
| Electricite de France SA, | | | | | | | | | | |
| 5.000%, 02/05/18 | | EUR | | | 150 | | | | 236,596 | |
| Orange SA: | | | | | | | | | | |
| 4.750%, 02/21/17 | | EUR | | | 165 | | | | 249,863 | |
| 5.375%, 07/08/19 | | USD | | | 195 | | | | 222,169 | |
| | | | | | | | | | 708,628 | |
| Italy | 0.2% | | | | | | | | | | |
| Atlantia SpA, | | | | | | | | | | |
| 4.375%, 09/16/25 | | EUR | | | 160 | | | | 260,493 | |
| | | | | | | | | | | |
| Mexico | 0.2% | | | | | | | | | | |
| America Movil SAB de CV, | | | | | | | | | | |
| 6.450%, 12/05/22 | | MXN | | | 3,500 | | | | 267,522 | |
| | | | | | | | | | | |
| Netherlands | 0.3% | | | | | | | | | | |
| BMW Finance NV, | | | | | | | | | | |
| 3.375%, 12/14/18 | | GBP | | | 185 | | | | 329,812 | |
| Deutsche Bahn Finance BV, | | | | | | | | | | |
| 3.375%, 09/01/16 | | NOK | | | 1,200 | | | | 201,797 | |
| | | | | | | | | | 531,609 | |
| New Zealand | 0.1% | | | | | | | | | | |
| Fonterra Cooperative Group, Ltd., | | | | | | | | | | |
| 5.500%, 02/26/24 | | AUD | | | 100 | | | | 99,245 | |
| | | | | | | | | | | |
| Singapore | 0.2% | | | | | | | | | | |
| Temasek Financial I, Ltd., | | | | | | | | | | |
| 4.300%, 10/25/19 | | USD | | | 250 | | | | 276,662 | |
The accompanying notes are an integral part of these financial statements.
Semi-Annual Report 27
| Description | | Security
Currency | | Principal
Amount
(000) | | Value | |
| | | | | | | | | | | |
| Lazard Retirement Global Dynamic Multi Asset Portfolio (continued) |
| | | | | | | | | | | |
| United Kingdom | 0.8% | | | | | | | | | | |
| Abbey National Treasury Services PLC, | | | | | | | | | | |
| 5.125%, 04/14/21 | | GBP | | | 130 | | | $ | 252,933 | |
| Barclays Bank PLC, | | | | | | | | | | |
| 5.125%, 01/08/20 | | USD | | | 115 | | | | 129,984 | |
| BG Energy Capital PLC, | | | | | | | | | | |
| 5.125%, 12/01/25 | | GBP | | | 100 | | | | 189,625 | |
| Network Rail Infrastructure Finance PLC, | | | | | | | | | | |
| 4.400%, 03/06/16 | | CAD | | | 300 | | | | 294,617 | |
| Rolls-Royce PLC, | | | | | | | | | | |
| 6.750%, 04/30/19 | | GBP | | | 100 | | | | 203,200 | |
| Tesco PLC, | | | | | | | | | | |
| 6.125%, 02/24/22 | | GBP | | | 100 | | | | 196,545 | |
| | | | | | | | | | 1,266,904 | |
| United States | 1.5% | | | | | | | | | | |
| American Express Credit Corp., | | | | | | | | | | |
| 2.375%, 03/24/17 | | USD | | | 180 | | | | 186,086 | |
| BMW US Capital LLC, | | | | | | | | | | |
| 2.375%, 12/04/15 | | NOK | | | 310 | | | | 50,984 | |
| Coca-Cola Enterprises, Inc., | | | | | | | | | | |
| 2.000%, 12/05/19 | | EUR | | | 200 | | | | 283,816 | |
| General Electric Capital Corp.: | | | | | | | | | | |
| 6.500%, 09/28/15 | | NZD | | | 20 | | | | 17,970 | |
| 5.500%, 02/01/17 | | NZD | | | 245 | | | | 217,900 | |
| JPMorgan Chase & Co.: | | | | | | | | | | |
| 1.625%, 05/15/18 | | USD | | | 195 | | | | 194,238 | |
| 3.875%, 09/23/20 | | EUR | | | 150 | | | | 235,264 | |
| Nestle Holdings, Inc., | | | | | | | | | | |
| 2.500%, 07/10/17 | | NOK | | | 1,180 | | | | 197,088 | |
| Starbucks Corp., | | | | | | | | | | |
| 6.250%, 08/15/17 | | USD | | | 205 | | | | 235,474 | |
| The Goldman Sachs Group, Inc., | | | | | | | | | | |
| 6.250%, 09/01/17 | | USD | | | 215 | | | | 244,768 | |
| Valero Energy Corp., | | | | | | | | | | |
| 6.125%, 02/01/20 | | USD | | | 170 | | | | 200,892 | |
| Yum! Brands, Inc., | | | | | | | | | | |
| 3.750%, 11/01/21 | | USD | | | 90 | | | | 92,704 | |
| | | | | | | | | | 2,157,184 | |
Total Corporate Bonds
(Identified cost $7,050,058) | | | | | | | | | 7,134,225 | |
| Description | | Security
Currency | | Principal
Amount
(000) | | Value | |
| | | | | | | | | | | |
| Foreign Government Obligations | 10.7% | | | | | | | | | | |
| | | | | | | | | | | |
| Australia | 1.2% | | | | | | | | | | |
| Australia Government Bond, | | | | | | | | | | |
| 3.250%, 04/21/29 | | AUD | | | 320 | | | $ | 279,391 | |
| Queensland Treasury Corp., | | | | | | | | | | |
| 5.500%, 06/21/21 | | AUD | | | 540 | | | | 567,487 | |
| Treasury Corp. of Victoria, | | | | | | | | | | |
| 4.750%, 10/15/14 | | AUD | | | 180 | | | | 170,791 | |
| Western Australian Treasury Corp., | | | | | | | | | | |
| 3.000%, 06/08/16 | | AUD | | | 820 | | | | 777,199 | |
| | | | | | | | | | 1,794,868 | |
| Austria | 0.2% | | | | | | | | | | |
| Republic of Austria, | | | | | | | | | | |
| 3.900%, 07/15/20 | | EUR | | | 235 | | | | 381,606 | |
| | | | | | | | | | | |
| Bahamas | 0.3% | | | | | | | | | | |
| Commonwealth of Bahamas, | | | | | | | | | | |
| 6.950%, 11/20/29 | | USD | | | 345 | | | | 383,295 | |
| | | | | | | | | | | |
| Belgium | 0.6% | | | | | | | | | | |
| Belgium Kingdom, | | | | | | | | | | |
| 4.250%, 09/28/22 | | EUR | | | 490 | | | | 824,895 | |
| | | | | | | | | | | |
| Bermuda | 0.3% | | | | | | | | | | |
| Government of Bermuda, | | | | | | | | | | |
| 5.603%, 07/20/20 | | USD | | | 420 | | | | 468,300 | |
| | | | | | | | | | | |
| Brazil | 0.1% | | | | | | | | | | |
| Federal Republic of Brazil, | | | | | | | | | | |
| 2.625%, 01/05/23 | | USD | | | 200 | | | | 184,700 | |
| | | | | | | | | | | |
| Canada | 2.4% | | | | | | | | | | |
| Province of Alberta, | | | | | | | | | | |
| 4.000%, 12/01/19 | | CAD | | | 820 | | | | 847,596 | |
| Province of British Columbia, | | | | | | | | | | |
| 3.700%, 12/18/20 | | CAD | | | 545 | | | | 555,526 | |
| Province of Ontario: | | | | | | | | | | |
| 6.250%, 06/16/15 | | NZD | | | 490 | | | | 437,204 | |
| 2.850%, 06/02/23 | | CAD | | | 555 | | | | 517,208 | |
| Province of Quebec: | | | | | | | | | | |
| 4.500%, 12/01/17 | | CAD | | | 720 | | | | 738,576 | |
| 3.500%, 07/29/20 | | USD | | | 370 | | | | 395,971 | |
| | | | | | | | | | 3,492,081 | |
The accompanying notes are an integral part of these financial statements.
28 Semi-Annual Report
| | | | | Principal | | | |
| | | Security | | Amount | | | |
| Description | | Currency | | (000) | | Value | |
| | | | | | | | | | | |
| Lazard Retirement Global Dynamic Multi Asset Portfolio (continued) | |
| | | | | | | | | | | |
| Colombia | 0.2% | | | | | | | | | | |
| Republic of Colombia, | | | | | | | | | | |
| 7.375%, 01/27/17 | | USD | | | 225 | | | $ | 258,412 | |
| | | | | | | | | | | |
| Czech Republic | 0.6% | | | | | | | | | | |
| Czech Republic: | | | | | | | | | | |
| 5.000%, 06/11/18 | | EUR | | | 200 | | | | 320,444 | |
| 2.500%, 08/25/28 | | CZK | | | 10,450 | | | | 540,909 | |
| | | | | | | | | | 861,353 | |
| Denmark | 0.1% | | | | | | | | | | |
| Kommunekredit, | | | | | | | | | | |
| 2.000%, 01/01/18 | | DKK | | | 680 | | | | 131,437 | |
| | | | | | | | | | | |
| France | 0.5% | | | | | | | | | | |
| Government of France, | | | | | | | | | | |
| 4.250%, 10/25/23 | | EUR | | | 475 | | | | 809,315 | |
| | | | | | | | | | | |
| Israel | 0.6% | | | | | | | | | | |
| Israel Fixed Government Bonds: | | | | | | | | | | |
| 5.500%, 01/31/22 | | ILS | | | 1,530 | | | | 551,228 | |
| 4.250%, 03/31/23 | | ILS | | | 830 | | | | 274,337 | |
| | | | | | | | | | 825,565 | |
| Mexico | 0.5% | | | | | | | | | | |
| Mexican Bonos, | | | | | | | | | | |
| 7.750%, 12/14/17 | | MXN | | | 4,340 | | | | 373,740 | |
| United Mexican States, | | | | | | | | | | |
| 6.750%, 02/06/24 | | GBP | | | 160 | | | | 334,065 | |
| | | | | | | | | | 707,805 | |
| New Zealand | 0.2% | | | | | | | | | | |
| New Zealand Government Bond, | | | | | | | | | | |
| 3.000%, 04/15/20 | | NZD | | | 330 | | | | 271,327 | |
| | | | | | | | | | | |
| Norway | 0.5% | | | | | | | | | | |
| Oslo Kommune, | | | | | | | | | | |
| 3.550%, 02/12/21 | | NOK | | | 4,000 | | | | 687,007 | |
| | | | | | | | | | | |
| Panama | 0.2% | | | | | | | | | | |
| Republic of Panama, | | | | | | | | | | |
| 5.200%, 01/30/20 | | USD | | | 250 | | | | 279,000 | |
| | | | | Principal | | | |
| | | Security | | Amount | | | |
| Description | | Currency | | (000) | | Value | |
| | | | | | | | | | | |
| Poland | 1.4% | | | | | | | | | | |
| Poland Government Bond, | | | | | | | | | | |
| 5.750%, 04/25/29 | | PLN | | | 2,065 | | | $ | 833,779 | |
| Republic of Poland: | | | | | | | | | | |
| 5.625%, 06/20/18 | | EUR | | | 365 | | | | 593,736 | |
| 3.000%, 03/17/23 | | USD | | | 688 | | | | 668,392 | |
| | | | | | | | | | 2,095,907 | |
| Slovakia | 0.1% | | | | | | | | | | |
| Slovak Republic, | | | | | | | | | | |
| 4.375%, 05/21/22 | | USD | | | 200 | | | | 213,400 | |
| | | | | | | | | | | |
| United Kingdom | 0.7% | | | | | | | | | | |
| United Kingdom Treasury: | | | | | | | | | | |
| 2.250%, 09/07/23 | | GBP | | | 245 | | | | 404,978 | |
| 4.250%, 12/07/27 | | GBP | | | 150 | | | | 291,838 | |
| 4.250%, 06/07/32 | | GBP | | | 140 | | | | 272,993 | |
| | | | | | | | | | 969,809 | |
| Total Foreign Government Obligations | | | | | | | | | | |
| (Identified cost $15,110,854) | | | | | | | | | 15,640,082 | |
| | | | | | | | | | | |
| Quasi Government Bonds | 1.0% | | | | | | | | | | |
| | | | | | | | | | | |
| Canada | 0.4% | | | | | | | | | | |
| Hydro-Quebec, | | | | | | | | | | |
| 9.625%, 07/15/22 | | CAD | | | 243 | | | | 339,107 | |
| Ontario Electricity Financial Corp., | | | | | | | | | | |
| 10.125%, 10/15/21 | | CAD | | | 160 | | | | 224,183 | |
| | | | | | | | | | 563,290 | |
| Germany | 0.3% | | | | | | | | | | |
| KfW: | | | | | | | | | | |
| 4.000%, 12/15/14 | | NOK | | | 1,110 | | | | 182,802 | |
| 2.875%, 10/12/16 | | NOK | | | 980 | | | | 163,769 | |
| Landeskreditbank Baden-Wuerttemberg Foerderbank, | | | | | | | | | | |
| 3.000%, 05/22/17 | | NOK | | | 580 | | | | 97,744 | |
| | | | | | | | | | 444,315 | |
| Netherlands | 0.3% | | | | | | | | | | |
| Bank Nederlandse Gemeenten, | | | | | | | | | | |
| 2.500%, 01/23/23 | | USD | | | 420 | | | | 409,854 | |
| | | | | | | | | | | |
Total Quasi Government Bonds
(Identified cost $1,422,192) | | | | | | | | | 1,417,459 | |
The accompanying notes are an integral part of these financial statements.
Semi-Annual Report 29
| | | | | Principal | | | |
| | | Security | | Amount | | | |
| Description | | Currency | | (000) | | Value | |
| | | | | | | | | | | |
| Lazard Retirement Global Dynamic Multi Asset Portfolio (continued) | |
| | | | | | | | | | | |
| Supranationals | 0.7% | | | | | | | | | | |
| Corporacion Andina de Fomento, | | | | | | | | | | |
| 4.375%, 06/15/22 | | USD | | | 370 | | | $ | 392,412 | |
| International Bank for Reconstruction & Development, | | | | | | | | | | |
| 1.375%, 06/23/19 | | SEK | | | 1,880 | | | | 282,337 | |
| Inter-American Development Bank, | | | | | | | | | | |
| 6.000%, 12/15/17 | | NZD | | | 375 | | | | 341,840 | |
| | | | | | | | | | | |
| Total Supranationals | | | | | | | | | | |
| (Identified cost $993,144) | | | | | | | | | 1,016,589 | |
| | | | | | | | | | | |
| US Municipal Bonds | 0.3% | | | | | | | | | | |
| | | | | | | | | | | |
| New Jersey | 0.1% | | | | | | | | | | |
| New Jersey State Transportation Trust Fund Authority Build America Bonds Series C, | | | | | | | | | | |
| 5.754%, 12/15/28 | | USD | | | 100 | | | | 115,719 | |
| | | | | | | | | | | |
| Pennsylvania | 0.0% | | | | | | | | | | |
| Pennsylvania State Build America Bonds Third Series B, | | | | | | | | | | |
| 5.850%, 07/15/30 | | USD | | | 50 | | | | 55,862 | |
| | | | | | | | | | | |
| Texas | 0.1% | | | | | | | | | | |
| Texas State Build America Bonds Series A, | | | | | | | | | | |
| 4.123%, 04/01/25 | | USD | | | 100 | | | | 108,374 | |
| | | | | | | | | | | |
| Utah | 0.1% | | | | | | | | | | |
| Utah State Build America Bonds Series B, | | | | | | | | | | |
| 3.539%, 07/01/25 | | USD | | | 150 | | | | 156,348 | |
| | | | | | | | | | | |
| Total US Municipal Bonds | | | | | | | | | | |
| (Identified cost $426,845) | | | | | | | | | 436,303 | |
| | | | | | | |
| | | | | | | |
| Description | | Shares | | | Value | |
| | | | | | | | | |
| Short-Term Investment | 3.4% | | | | | | | | |
State Street Institutional Treasury
Money Market Fund
(Identified cost $4,978,541) | | | 4,978,541 | | | $ | 4,978,541 | |
| | | | | | | | | |
| Total Investments | 99.8% | | | | | | | | |
| (Identified cost $139,315,417) (c), (f) | | | | | | $ | 145,487,142 | |
| | | | | | | | | |
Cash and Other Assets in Excess
of Liabilities | 0.2% | | | | | | | 355,621 | |
| | | | | | | | | |
| Net Assets | 100.0% | | | | | | $ | 145,842,763 | |
The accompanying notes are an integral part of these financial statements.
30 Semi-Annual Report
Lazard Retirement Global Dynamic Multi Asset Portfolio (continued)
Forward Currency Contracts open at June 30, 2014:
| Currency | | Counterparty | | Expiration
Date | Foreign
Currency Amount | | US $ Cost
on Origination
Date | | | US $
Current
Value | | | Unrealized
Appreciation | | | Unrealized
Depreciation | |
| | | | | | | | | | | | | | | | | | | | | | | | | | | |
| Forward Currency Purchase Contracts | | | | | | | | | | | | | | | | | | | | |
| CHF | | | CIT | | | 08/20/14 | | | 193,035 | | | $ | 217,093 | | | $ | 217,764 | | | $ | 671 | | | $ | — | |
| EUR | | | CIT | | | 08/20/14 | | | 37,373 | | | | 51,210 | | | | 51,184 | | | | — | | | | 26 | |
| EUR | | | CIT | | | 08/20/14 | | | 62,399 | | | | 85,625 | | | | 85,459 | | | | — | | | | 166 | |
| EUR | | | CIT | | | 08/20/14 | | | 110,238 | | | | 150,332 | | | | 150,977 | | | | 645 | | | | — | |
| EUR | | | CIT | | | 08/20/14 | | | 158,523 | | | | 215,987 | | | | 217,105 | | | | 1,118 | | | | — | |
| EUR | | | CIT | | | 08/20/14 | | | 310,739 | | | | 425,629 | | | | 425,574 | | | | — | | | | 55 | |
| EUR | | | CIT | | | 08/20/14 | | | 400,318 | | | | 544,977 | | | | 548,257 | | | | 3,280 | | | | — | |
| EUR | | | CIT | | | 08/20/14 | | | 921,631 | | | | 1,261,759 | | | | 1,262,223 | | | | 464 | | | | — | |
| EUR | | | HSB | | | 07/31/14 | | | 1,872,085 | | | | 2,554,966 | | | | 2,563,727 | | | | 8,761 | | | | — | |
| GBP | | | CIT | | | 08/20/14 | | | 105,203 | | | | 178,000 | | | | 179,975 | | | | 1,975 | | | | — | |
| GBP | | | HSB | | | 07/31/14 | | | 709,992 | | | | 1,206,553 | | | | 1,214,805 | | | | 8,252 | | | | — | |
| GBP | | | HSB | | | 08/20/14 | | | 171,665 | | | | 290,946 | | | | 293,674 | | | | 2,728 | | | | — | |
| JPY | | | CIT | | | 08/20/14 | | | 54,902,502 | | | | 540,000 | | | | 542,145 | | | | 2,145 | | | | — | |
| JPY | | | CIT | | | 08/20/14 | | | 370,494,803 | | | | 3,654,047 | | | | 3,658,520 | | | | 4,473 | | | | — | |
| JPY | | | HSB | | | 07/31/14 | | | 148,510,731 | | | | 1,461,030 | | | | 1,466,293 | | | | 5,263 | | | | — | |
| MXN | | | HSB | | | 08/20/14 | | | 6,744,254 | | | | 514,915 | | | | 518,103 | | | | 3,188 | | | | — | |
| SGD | | | SSB | | | 08/20/14 | | | 9,125 | | | | 7,303 | | | | 7,318 | | | | 15 | | | | — | |
| Total Forward Currency Purchase Contracts | | | | | | $ | 13,360,372 | | | $ | 13,403,103 | | | $ | 42,978 | | | $ | 247 | |
| | | | | | | | | | | | | | | | | | | | | |
| Forward Currency Sale Contracts | | | | | | | | | | | | | | | | | | | | |
| AUD | | | CAN | | | 08/20/14 | | | 1,561,911 | | | $ | 1,452,889 | | | $ | 1,467,677 | | | $ | — | | | $ | 14,788 | |
| AUD | | | CIT | | | 08/20/14 | | | 106,870 | | | | 100,173 | | | | 100,422 | | | | — | | | | 249 | |
| AUD | | | CIT | | | 08/20/14 | | | 175,882 | | | | 161,800 | | | | 165,271 | | | | — | | | | 3,471 | |
| AUD | | | HSB | | | 07/31/14 | | | 873,199 | | | | 817,942 | | | | 821,676 | | | | — | | | | 3,734 | |
| AUD | | | RBC | | | 08/20/14 | | | 147,664 | | | | 135,800 | | | | 138,755 | | | | — | | | | 2,955 | |
| AUD | | | SSB | | | 07/31/14 | | | 403,079 | | | | 377,612 | | | | 379,295 | | | | — | | | | 1,683 | |
| CAD | | | HSB | | | 07/31/14 | | | 1,682,611 | | | | 1,568,298 | | | | 1,575,773 | | | | — | | | | 7,475 | |
| CAD | | | RBC | | | 08/20/14 | | | 291,679 | | | | 268,382 | | | | 273,024 | | | | — | | | | 4,642 | |
| CAD | | | RBC | | | 08/20/14 | | | 3,121,998 | | | | 2,864,153 | | | | 2,922,326 | | | | — | | | | 58,173 | |
| CAD | | | SSB | | | 07/31/14 | | | 455,213 | | | | 424,196 | | | | 426,309 | | | | — | | | | 2,113 | |
| CZK | | | JPM | | | 08/29/14 | | | 4,864,066 | | | | 240,700 | | | | 242,823 | | | | — | | | | 2,123 | |
| DKK | | | CSF | | | 08/20/14 | | | 524,622 | | | | 96,328 | | | | 96,378 | | | | — | | | | 50 | |
| EUR | | | CIT | | | 07/31/14 | | | 520,967 | | | | 711,003 | | | | 713,438 | | | | — | | | | 2,435 | |
| EUR | | | CIT | | | 08/20/14 | | | 61,018 | | | | 83,186 | | | | 83,568 | | | | — | | | | 382 | |
| EUR | | | CIT | | | 08/20/14 | | | 61,129 | | | | 82,782 | | | | 83,720 | | | | — | | | | 938 | |
| EUR | | | CIT | | | 08/20/14 | | | 73,642 | | | | 100,296 | | | | 100,857 | | | | — | | | | 561 | |
| EUR | | | SSB | | | 07/31/14 | | | 192,277 | | | | 262,416 | | | | 263,314 | | | | — | | | | 898 | |
| GBP | | | CIT | | | 08/20/14 | | | 138,638 | | | | 233,200 | | | | 237,174 | | | | — | | | | 3,974 | |
| GBP | | | CIT | | | 08/20/14 | | | 240,357 | | | | 401,502 | | | | 411,188 | | | | — | | | | 9,686 | |
| GBP | | | HSB | | | 08/20/14 | | | 85,639 | | | | 144,045 | | | | 146,506 | | | | — | | | | 2,461 | |
| GBP | | | HSB | | | 08/20/14 | | | 123,172 | | | | 207,040 | | | | 210,714 | | | | — | | | | 3,674 | |
| GBP | | | SSB | | | 07/31/14 | | | 1,142,471 | | | | 1,941,528 | | | | 1,954,784 | | | | — | | | | 13,256 | |
| ILS | | | BNP | | | 08/12/14 | | | 930,596 | | | | 266,826 | | | | 271,107 | | | | — | | | | 4,281 | |
The accompanying notes are an integral part of these financial statements.
Semi-Annual Report 31
Lazard Retirement Global Dynamic Multi Asset Portfolio (concluded)
Forward Currency Contracts open at June 30, 2014 (concluded):
| Currency | | Counterparty | | Expiration
Date | | Foreign
Currency Amount | | US $ Cost
on Origination
Date | | | US $
Current
Value | | | Unrealized
Appreciation | | | Unrealized
Depreciation | |
| | | | | | | | | | | | | | | | | | | | | |
| Forward Currency Sale Contracts (concluded) | | | | | | | | | | | | | | | | | | | | |
| ILS | | | BNP | | | 08/12/14 | | | 1,736,020 | | | $ | 503,300 | | | $ | 505,749 | | | $ | — | | | $ | 2,449 | |
| JPY | | | SSB | | | 07/31/14 | | | 103,550,466 | | | | 1,018,776 | | | | 1,022,386 | | | | — | | | | 3,610 | |
| MXN | | | HSB | | | 08/20/14 | | | 1,544,939 | | | | 118,900 | | | | 118,684 | | | | 216 | | | | — | |
| MXN | | | HSB | | | 08/20/14 | | | 1,664,417 | | | | 127,400 | | | | 127,863 | | | | — | | | | 463 | |
| MXN | | | HSB | | | 08/20/14 | | | 8,162,150 | | | | 628,143 | | | | 627,028 | | | | 1,115 | | | | — | |
| NOK | | | HSB | | | 08/20/14 | | | 9,557,862 | | | | 1,605,382 | | | | 1,555,373 | | | | 50,009 | | | | — | |
| NZD | | | BRC | | | 08/20/14 | | | 321,824 | | | | 273,600 | | | | 280,503 | | | | — | | | | 6,903 | |
| NZD | | | CAN | | | 08/20/14 | | | 991,719 | | | | 849,109 | | | | 864,386 | | | | — | | | | 15,277 | |
| PLN | | | HSB | | | 08/20/14 | | | 1,875,784 | | | | 610,319 | | | | 615,742 | | | | — | | | | 5,423 | |
| Total Forward Currency Sale Contracts | | | | | | $ | 18,677,026 | | | $ | 18,803,813 | | | | 51,340 | | | | 178,127 | |
| Gross unrealized appreciation/depreciation on Forward Currency Purchase and Sale Contracts | | | $ | 94,318 | | | $ | 178,374 | |
The accompanying notes are an integral part of these financial statements.
32 Semi-Annual Report
| |
| |
| Lazard Retirement Series, Inc. Notes to Portfolios of Investments June 30, 2014 (unaudited) |
| |
| (a) | Non-income producing security. |
| | |
| (b) | Private placements. |
| | |
| (c) | For federal income tax purposes, the aggregate cost, aggregate gross unrealized appreciation, aggregate gross unrealized depreciation and the net unrealized appreciation are as follows: |
| Portfolio | | Aggregate
Cost | | Aggregate Gross
Unrealized
Appreciation | | Aggregate Gross
Unrealized
Depreciation | | Net Unrealized
Appreciation | |
| | | | | | | | | | | | | |
| US Strategic Equity | | $ | 8,149,323 | | | $ | 1,694,951 | | | $ | 90,233 | | | $ | 1,604,718 | | |
| US Small-Mid Cap Equity | | | 53,492,362 | | | | 12,195,372 | | | | 1,118,484 | | | | 11,076,888 | | |
| International Equity | | | 542,517,526 | | | | 180,153,993 | | | | 4,311,689 | | | | 175,842,304 | | |
| Emerging Markets Equity | | | 1,070,741,906 | | | | 197,036,507 | | | | 66,518,975 | | | | 130,517,532 | | |
| Global Dynamic Multi Asset | | | 139,315,417 | | | | 6,875,052 | | | | 703,327 | | | | 6,171,725 | | |
| (d) | Security valued using Level 2 inputs, based on reference to a similar security from the same issuer which was trading on an active market, under accounting principles generally accepted in the United States of America (“GAAP”) hierarchy – see Note 8. |
| | |
| (e) | Pursuant to Rule 144A under the Securities Act of 1933, these securities may only be traded among “qualified institutional buyers.” At June 30, 2014, these securities amounted to 1.8% of net assets of Emerging Markets Equity Portfolio, and are considered to be liquid. |
| | |
| (f) | The Portfolio, at all times, maintains portfolio securities in sufficient amount to cover its obligations related to investments in forward currency contracts. |
| Security Abbreviations: | | | | |
| ADR | — | American Depositary Receipt | | | | |
| GDR | — | Global Depositary Receipt | | | | |
| REIT | — | Real Estate Investment Trust | | | | |
| SDR | — | Swedish Depositary Receipt | | | | |
| | | | | | | |
| Currency Abbreviations: | | | | |
| AUD | — | Australian Dollar | | JPY | — | Japanese Yen |
| CAD | — | Canadian Dollar | | MXN | — | Mexican New Peso |
| CHF | — | Swiss Franc | | NOK | — | Norwegian Krone |
| CZK | — | Czech Koruna | | NZD | — | New Zealand Dollar |
| DKK | — | Danish Krone | | PLN | — | Polish Zloty |
| EUR | — | Euro | | SEK | — | Swedish Krona |
| GBP | — | British Pound Sterling | | SGD | — | Singapore Dollar |
| ILS | — | Israeli Shekel | | USD | — | United States Dollar |
| | | | | | | |
| Counterparty Abbreviations: | | | | |
| BNP | — | BNP Paribas SA | | HSB | — | HSBC Bank USA |
| BRC | — | Barclays Bank PLC | | JPM | — | JPMorgan Chase Bank |
| CAN | — | Canadian Imperial Bank of Commerce | | RBC | — | Royal Bank of Canada |
| CIT | — | Citibank NA | | SSB | — | State Street Bank and Trust Co. |
| CSF | — | Credit Suisse Group AG | | | | |
The accompanying notes are an integral part of these financial statements.
Semi-Annual Report 33
Portfolio holdings by industry (as a percentage of net assets), for those Portfolios previously presented by country:
| Industry | | Lazard
Retirement
International
Equity
Portfolio | Lazard
Retirement
Emerging
Markets Equity
Portfolio | Lazard
Retirement
Global Dynamic
Multi Asset
Portfolio |
| | | | | | | | | | | | | | |
| Aerospace & Defense | | | — | % | | | — | % | | | 0.1 | % | |
| Agriculture | | | — | | | | — | | | | 0.3 | | |
| Alcohol & Tobacco | | | 9.0 | | | | 4.2 | | | | 1.6 | | |
| Automotive | | | 4.4 | | | | 0.8 | | | | 2.7 | | |
| Banking | | | 7.6 | | | | 20.8 | | | | 5.9 | | |
| Cable Television | | | — | | | | — | | | | 1.4 | | |
| Chemicals | | | — | | | | 0.8 | | | | 1.6 | | |
| Commercial Services | | | 0.7 | | | | 3.9 | | | | 1.1 | | |
| Computer Software | | | — | | | | 3.3 | | | | 2.1 | | |
| Construction & Engineering | | | — | | | | — | | | | 0.7 | | |
| Consumer Products | | | 2.1 | | | | 0.3 | | | | — | | |
| Diversified | | | 2.2 | | | | 1.5 | | | | — | | |
| Electric | | | 1.5 | | | | 0.8 | | | | 2.3 | | |
| Energy Exploration & Production | | | — | | | | 6.4 | | | | 1.6 | | |
| Energy Integrated | | | 4.6 | | | | 4.8 | | | | 3.6 | | |
| Energy Services | | | 0.6 | | | | 0.5 | | | | 1.5 | | |
| Financial Services | | | 4.1 | | | | 3.0 | | | | 6.4 | | |
| Food & Beverages | | | — | | | | 0.7 | | | | 2.3 | | |
| Forest & Paper Products | | | 2.0 | | | | 0.7 | | | | 1.4 | | |
| Gas Utilities | | | — | | | | — | | | | 1.6 | | |
| Health Services | | | — | | | | — | | | | 1.0 | | |
| Household & Personal Products | | | 1.7 | | | | 2.2 | | | | 1.6 | | |
| Housing | | | 6.0 | | | | 1.2 | | | | 1.9 | | |
| Insurance | | | 6.8 | | | | 3.3 | | | | 2.7 | | |
| Leisure & Entertainment | | | 6.9 | | | | 1.2 | | | | 3.2 | | |
| Manufacturing | | | 7.0 | | | | 4.0 | | | | 4.4 | | |
| Medical Products | | | — | | | | — | | | | 0.4 | | |
| Metals & Glass Containers | | | — | | | | — | | | | 0.2 | | |
| Metals & Mining | | | 1.6 | | | | 2.6 | | | | 1.0 | | |
| Pharmaceutical & Biotechnology | | | 11.5 | | | | — | | | | 9.0 | | |
| Real Estate | | | — | | | | — | | | | 1.7 | | |
| Retail | | | 5.6 | | | | 4.8 | | | | 4.9 | | |
| Semiconductors & Components | | | 1.1 | | | | 8.0 | | | | 1.8 | | |
| Technology | | | 1.2 | | | | 2.0 | | | | 1.5 | | |
| Technology Hardware | | | 1.2 | | | | 1.3 | | | | 3.3 | | |
| Telecommunications | | | 3.4 | | | | 10.3 | | | | 4.7 | | |
| Transportation | | | 4.1 | | | | 2.5 | | | | 3.2 | | |
| Subtotal | | | 96.9 | | | | 95.9 | | | | 84.7 | | |
The accompanying notes are an integral part of these financial statements.
34 Semi-Annual Report
Portfolio holdings by industry (as a percentage of net assets), for those Portfolios previously presented by country (concluded):
| Industry | | Lazard
Retirement
International
Equity
Portfolio | Lazard
Retirement
Emerging
Markets Equity
Portfolio | Lazard
Retirement
Global Dynamic
Multi Asset
Portfolio |
| | | | | | | | | | | | | | |
| Foreign Government Obligations | | | — | % | | | — | % | | | 10.7 | % | |
| Supranationals | | | — | | | | — | | | | 0.7 | | |
| US Municipal Bonds | | | — | | | | — | | | | 0.3 | | |
| Short-Term Investments | | | 3.0 | | | | 4.4 | | | | 3.4 | | |
| Total Investments | | | 99.9 | % | | | 100.3 | % | | | 99.8 | % | |
The accompanying notes are an integral part of these financial statements.
Semi-Annual Report 35
| |
| |
| Lazard Retirement Series, Inc. Statements of Assets and Liabilities (unaudited) |
| |
| June 30, 2014 | | Lazard
Retirement
US Strategic
Equity Portfolio | | Lazard
Retirement
US Small-Mid Cap
Equity Portfolio |
| | | | | | | | | |
| ASSETS | | | | | | | | |
| Investments in securities, at value | | $ | 9,754,041 | | | $ | 64,569,250 | |
| Foreign currency | | | — | | | | — | |
| Receivables for: | | | | | | | | |
| Capital stock sold | | | 3,161 | | | | 71,370 | |
| Dividends and interest | | | 12,378 | | | | 44,529 | |
| Investments sold | | | 176,485 | | | | 274,208 | |
| Amount due from Investment Manager (Note 3) | | | 5,522 | | | | — | |
| Gross unrealized appreciation on forward currency contracts | | | — | | | | — | |
| Total assets | | | 9,951,587 | | | | 64,959,357 | |
| | | | | | | | | |
| LIABILITIES | | | | | | | | |
| Payables for: | | | | | | | | |
| Management fees | | | — | | | | 35,477 | |
| Accrued distribution fees | | | 1,987 | | | | 12,801 | |
| Accrued directors’ fees | | | 57 | | | | 391 | |
| Capital stock redeemed | | | 5,582 | | | | 99,524 | |
| Investments purchased | | | 96,346 | | | | 629,391 | |
| Gross unrealized depreciation on forward currency contracts | | | — | | | | — | |
| Other accrued expenses and payables | | | 29,698 | | | | 40,792 | |
| Total liabilities | | | 133,670 | | | | 818,376 | |
| Net assets | | $ | 9,817,917 | | | $ | 64,140,981 | |
| | | | | | | | | |
| NET ASSETS | | | | | | | | |
| Paid in capital | | $ | 7,497,845 | | | $ | 44,323,410 | |
| Undistributed net investment income (loss) | | | 52,769 | | | | (101,555 | ) |
| Accumulated net realized gain (loss) | | | 662,585 | | | | 8,842,238 | |
| Net unrealized appreciation (depreciation) on: | | | | | | | | |
| Investments | | | 1,604,718 | | | | 11,076,888 | |
| Foreign currency and forward currency contracts | | | — | | | | — | |
| Net assets | | $ | 9,817,917 | | | $ | 64,140,981 | |
| | | | | | | | | |
| Service Shares | | | | | | | | |
| Net assets | | $ | 9,817,917 | | | $ | 64,140,981 | |
| Shares of capital stock outstanding* | | | 759,664 | | | | 6,789,463 | |
| Net asset value, offering and redemption price per share | | $ | 12.92 | | | $ | 9.45 | |
| | | | | | | | | |
| Investor Shares | | | | | | | | |
| Net assets | | | — | | | | — | |
| Shares of capital stock outstanding* | | | — | | | | — | |
| Net asset value, offering and redemption price per share | | | — | | | | — | |
| | | | | | | | | |
| Cost of investments in securities | | $ | 8,149,323 | | | $ | 53,492,362 | |
| Cost of foreign currency | | | — | | | | — | |
* $0.001 par value, 1,950,000,000 shares authorized for the Portfolios in total.
The accompanying notes are an integral part of these financial statements.
36 Semi-Annual Report
| | Lazard
Retirement
International
Equity Portfolio | | Lazard
Retirement
Emerging Markets
Equity Portfolio | | Lazard
Retirement
Global Dynamic
Multi Asset Portfolio |
| | | | | | | | | | | | |
| | $ | 718,359,830 | | | $ | 1,201,259,438 | | | $ | 145,487,142 | |
| | | 1,909,431 | | | | 1,141,105 | | | | 16,569 | |
| | | | | | | | | | | | |
| | | 509,901 | | | | 3,823,458 | | | | 657,267 | |
| | | 1,604,688 | | | | 2,813,775 | | | | 581,800 | |
| | | 155,691 | | | | 1,291,160 | | | | 772,185 | |
| | | — | | | | — | | | | — | |
| | | — | | | | — | | | | 94,318 | |
| | | 722,539,541 | | | | 1,210,328,936 | | | | 147,609,281 | |
| | | | | | | | | | | | |
| | | 442,308 | | | | 980,447 | | | | 66,893 | |
| | | 147,355 | | | | 189,037 | | | | 28,292 | |
| | | 4,939 | | | | 7,887 | | | | 699 | |
| | | 1,269,928 | | | | 10,961,282 | | | | 25,915 | |
| | | 1,261,163 | | | | 272,380 | | | | 1,403,134 | |
| | | — | | | | — | | | | 178,374 | |
| | | 99,314 | | | | 384,853 | | | | 63,211 | |
| | | 3,225,007 | | | | 12,795,886 | | | | 1,766,518 | |
| | $ | 719,314,534 | | | $ | 1,197,533,050 | | | $ | 145,842,763 | |
| | | | | | | | | | | | |
| | $ | 554,196,371 | | | $ | 1,054,493,734 | | | $ | 130,624,813 | |
| | | 11,447,734 | | | | 9,721,245 | | | | 949,157 | |
| | | (22,214,438 | ) | | | 3,009,231 | | | | 8,179,544 | |
| | | | | | | | | | | | |
| | | 175,842,304 | | | | 130,297,662 | | | | 6,171,725 | |
| | | 42,563 | | | | 11,178 | | | | (82,476 | ) |
| | $ | 719,314,534 | | | $ | 1,197,533,050 | | | $ | 145,842,763 | |
| | | | | | | | | | | | |
| | $ | 719,314,534 | | | $ | 925,194,921 | | | $ | 145,842,763 | |
| | | 51,807,815 | | | | 39,505,379 | | | | 11,385,231 | |
| | $ | 13.88 | | | $ | 23.42 | | | $ | 12.81 | |
| | | | | | | | | | | | |
| | | — | | | $ | 272,338,129 | | | | — | |
| | | — | | | | 11,738,960 | | | | — | |
| | | — | | | $ | 23.20 | | | | — | |
| | | | | | | | | | | | |
| | $ | 542,517,526 | | | $ | 1,070,741,906 | | | $ | 139,315,417 | |
| | $ | 1,899,051 | | | $ | 1,144,490 | | | $ | 16,539 | |
Semi-Annual Report 37
| |
| |
| Lazard Retirement Series, Inc. Statements of Operations (unaudited) |
| |
| For the Six Months Ended June 30, 2014 | | Lazard
Retirement
US Strategic Equity
Portfolio | | Lazard
Retirement
US Small-Mid Cap
Equity Portfolio |
| | | | | | | | | |
| Investment Income (Loss) | | | | | | | | |
| | | | | | | | | |
| Income | | | | | | | | |
| Dividends | | $ | 86,263 | | | $ | 272,075 | |
| Interest | | | — | | | | 2 | |
| Total investment income* | | | 86,263 | | | | 272,077 | |
| | | | | | | | | |
| Expenses | | | | | | | | |
| Management fees (Note 3) | | | 32,477 | | | | 224,179 | |
| Distribution fees (Service Shares) | | | 11,599 | | | | 74,726 | |
| Custodian fees | | | 22,042 | | | | 29,318 | |
| Administration fees | | | 22,081 | | | | 27,054 | |
| Professional services | | | 17,193 | | | | 19,573 | |
| Shareholders’ reports | | | 5,257 | | | | 10,217 | |
| Shareholders’ services | | | 6,830 | | | | 7,597 | |
| Directors’ fees and expenses | | | 116 | | | | 775 | |
| Other | | | 1,309 | | | | 1,839 | |
| Total gross expenses | | | 118,904 | | | | 395,278 | |
| Management fees waived and expenses reimbursed | | | (63,133 | ) | | | (21,646 | ) |
| Administration fees waived | | | (9,375 | ) | | | — | |
| Total net expenses | | | 46,396 | | | | 373,632 | |
| Net investment income (loss) | | | 39,867 | | | | (101,555 | ) |
| | | | | | | | | |
| Net Realized and Unrealized Gain (Loss) on Investments, Foreign Currency and Forward Currency Contracts | | | | | | | | |
| Net realized gain (loss) on: | | | | | | | | |
| Investments | | | 609,142 | | | | 4,776,797 | |
| Foreign currency and forward currency contracts | | | — | | | | — | |
| Net change in unrealized appreciation (depreciation) on: | | | | | | | | |
| Investments** | | | 43,593 | | | | 266,749 | |
| Foreign currency and forward currency contracts | | | — | | | | — | |
| Net realized and unrealized gain on investments, foreign currency and forward currency contracts | | | 652,735 | | | | 5,043,546 | |
| Net increase in net assets resulting from operations | | $ | 692,602 | | | $ | 4,941,991 | |
| * Net of foreign withholding taxes of | | $ | — | | | $ | 908 | |
| ** Includes net change in unrealized foreign capital gains taxes of | | $ | — | | | $ | — | |
The accompanying notes are an integral part of these financial statements.
38 Semi-Annual Report
| | Lazard
Retirement
International
Equity Portfolio | | Lazard
Retirement
Emerging Markets
Equity Portfolio | | Lazard
Retirement
Global Dynamic
Multi Asset Portfolio |
| | | | | | | | | | | | |
| | $ | 13,431,208 | | | $ | 16,882,167 | | | $ | 1,175,238 | |
| | | — | | | | — | | | | 334,904 | |
| | | 13,431,208 | | | | 16,882,167 | | | | 1,510,142 | |
| | | | | | | | | | | | |
| | | 2,575,349 | | | | 5,421,189 | | | | 514,679 | |
| | | 858,450 | | | | 1,052,769 | | | | 151,376 | |
| | | 97,047 | | | | 384,949 | | | | 83,521 | |
| | | 89,752 | | | | 124,865 | | | | 33,186 | |
| | | 50,682 | | | | 69,813 | | | | 24,677 | |
| | | 37,959 | | | | 58,819 | | | | 8,334 | |
| | | 8,749 | | | | 17,626 | | | | 6,578 | |
| | | 9,340 | | | | 14,555 | | | | 1,412 | |
| | | 7,386 | | | | 16,807 | | | | 3,367 | |
| | | 3,734,714 | | | | 7,161,392 | | | | 827,130 | |
| | | — | | | | — | | | | (191,350 | ) |
| | | — | | | | — | | | | — | |
| | | 3,734,714 | | | | 7,161,392 | | | | 635,780 | |
| | | 9,696,494 | | | | 9,720,775 | | | | 874,362 | |
| | |
| | | 22,315,864 | | | | 4,036,463 | | | | 7,983,118 | |
| | | 243 | | | | (105,699 | ) | | | (391,728 | ) |
| | |
| | | 544,864 | | | | 84,411,291 | | | | (2,742,605 | ) |
| | | 12,840 | | | | 11,898 | | | | (11,404 | ) |
| | |
| | | 22,873,811 | | | | 88,353,953 | | | | 4,837,381 | |
| | $ | 32,570,305 | | | $ | 98,074,728 | | | $ | 5,711,743 | |
| | $ | 1,434,544 | | | $ | 2,243,268 | | | $ | 81,916 | |
| | $ | — | | | $ | (162,359 | ) | | $ | — | |
Semi-Annual Report 39
| |
| |
| Lazard Retirement Series, Inc. Statements of Changes in Net Assets |
| |
| | Lazard Retirement | | Lazard Retirement | |
| | US Strategic Equity Portfolio | | US Small-Mid Cap Equity Portfolio | |
| | | Six Months Ended | | Year Ended | | Six Months Ended | | Year Ended | |
| | | June 30, 2014 | | December 31, | | June 30, 2014 | | December 31, | |
| | | (unaudited) | | 2013 | | (unaudited) | | 2013 | |
| | | | | | | | | | | | | | | | | | |
| Increase (Decrease) in Net Assets | | | | | | | | | | | | | | | | | |
| Operations | | | | | | | | | | | | | | | | | |
| Net investment income (loss) | | $ | 39,867 | | | $ | 75,648 | | | $ | (101,555 | ) | | $ | (171,941 | ) | |
| Net realized gain on investments, foreign currency and forward currency contracts | | | 609,142 | | | | 1,038,192 | | | | 4,776,797 | | | | 9,224,221 | | |
| Net change in unrealized appreciation (depreciation) on investments, foreign currency and forward currency contracts | | | 43,593 | | | | 806,555 | | | | 266,749 | | | | 6,727,138 | | |
| Net increase (decrease) in net assets resulting from operations | | | 692,602 | | | | 1,920,395 | | | | 4,941,991 | | | | 15,779,418 | | |
| | | | | | | | | | | | | | | | | | |
| Distributions to shareholders | | | | | | | | | | | | | | | | | |
| From net investment income | | | | | | | | | | | | | | | | | |
| Service Shares | | | — | | | | (74,305 | ) | | | — | | | | — | | |
| Investor Shares | | | — | | | | — | | | | — | | | | — | | |
| From net realized gains | | | | | | | | | | | | | | | | | |
| Service Shares | | | — | | | | (822,521 | ) | | | — | | | | (6,742,250 | ) | |
| Investor Shares | | | — | | | | — | | | | — | | | | — | | |
| Net decrease in net assets resulting from distributions | | | — | | | | (896,826 | ) | | | — | | | | (6,742,250 | ) | |
| | | | | | | | | | | | | | | | | | |
| Capital stock transactions | | | | | | | | | | | | | | | | | |
| Net proceeds from sales | | | | | | | | | | | | | | | | | |
| Service Shares | | �� | 1,078,307 | | | | 2,504,958 | | | | 6,402,367 | | | | 6,047,006 | | |
| Investor Shares | | | — | | | | — | | | | — | | | | — | | |
| Net proceeds from reinvestment of distributions | | | | | | | | | | | | | | | | | |
| Service Shares | | | — | | | | 896,825 | | | | — | | | | 6,742,250 | | |
| Investor Shares | | | — | | | | — | | | | — | | | | — | | |
| Cost of shares redeemed | | | | | | | | | | | | | | | | | |
| Service Shares | | | (896,845 | ) | | | (2,183,452 | ) | | | (6,125,943 | ) | | | (9,881,815 | ) | |
| Investor Shares | | | — | | | | — | | | | — | | | | — | | |
| Net increase (decrease) in net assets from capital stock transactions | | | 181,462 | | | | 1,218,331 | | | | 276,424 | | | | 2,907,441 | | |
| Total increase in net assets | | | 874,064 | | | | 2,241,900 | | | | 5,218,415 | | | | 11,944,609 | | |
| Net assets at beginning of period | | | 8,943,853 | | | | 6,701,953 | | | | 58,922,566 | | | | 46,977,957 | | |
| Net assets at end of period* | | $ | 9,817,917 | | | $ | 8,943,853 | | | $ | 64,140,981 | | | $ | 58,922,566 | | |
| * Includes undistributed net investment income (loss) of | | $ | 52,769 | | | $ | 12,902 | | | $ | (101,555 | ) | | $ | — | | |
| | | | | | | | | | | | | | | | | | |
| Shares issued and redeemed | | | | | | | | | | | | | | | | | |
| Service Shares | | | | | | | | | | | | | | | | | |
| Shares outstanding at beginning of period | | | 743,845 | | | | 642,085 | | | | 6,761,491 | | | | 6,431,142 | | |
| Shares sold | | | 88,470 | | | | 206,470 | | | | 716,613 | | | | 714,413 | | |
| Shares issued to shareholders from reinvestment of distributions | | | — | | | | 75,476 | | | | — | | | | 794,734 | | |
| Shares redeemed | | | (72,651 | ) | | | (180,186 | ) | | | (688,641 | ) | | | (1,178,798 | ) | |
| Net increase (decrease) | | | 15,819 | | | | 101,760 | | | | 27,972 | | | | 330,349 | | |
| Shares outstanding at end of period | | | 759,664 | | | | 743,845 | | | | 6,789,463 | | | | 6,761,491 | | |
| | | | | | | | | | | | | | | | | | |
| Investor Shares | | | | | | | | | | | | | | | | | |
| Shares outstanding at beginning of period | | | | | | | | | | | | | | | | | |
| Shares sold | | | | | | | | | | | | | | | | | |
| Shares issued to shareholders from reinvestment of distributions | | | | | | | | | | | | | | | | | |
| Shares redeemed | | | | | | | | | | | | | | | | | |
| Net decrease | | | | | | | | | | | | | | | | | |
| Shares outstanding at end of period | | | | | | | | | | | | | | | | | |
The accompanying notes are an integral part of these financial statements.
40 Semi-Annual Report
| | Lazard Retirement | | Lazard Retirement | | Lazard Retirement | | |
| | International Equity Portfolio | | Emerging Markets Equity Portfolio | | Global Dynamic Multi Asset Portfolio | | |
| | Six Months Ended | | Year Ended | | Six Months Ended | | Year Ended | | Six Months Ended | | Year Ended | | |
| | June 30, 2014 | | December 31, | | June 30, 2014 | | December 31, | | June 30, 2014 | | December 31, | | |
| | (unaudited) | | 2013 | | (unaudited) | | 2013 | | (unaudited) | | 2013 | | |
| | | | | | | | | | | | | | | | | | | | | | | | | | |
| | $ | 9,696,494 | | | $ | 8,972,678 | | | $ | 9,720,775 | | | $ | 15,595,232 | | | $ | 874,362 | | | $ | 583,911 | | | |
| | | | | | | | | | | | | | | | | | | | | | | | | | |
| | | 22,316,107 | | | | 33,220,535 | | | | 3,930,764 | | | | 22,549,847 | | | | 7,591,390 | | | | 2,305,130 | | | |
| | | | | | | | | | | | | | | | | | | | | | | | | | |
| | | 557,704 | | | | 79,561,724 | | | | 84,423,189 | | | | (49,926,249 | ) | | | (2,754,009 | ) | | | 8,080,648 | | | |
| | | | | | | | | | | | | | | | | | | | | | | | | | |
| | | 32,570,305 | | | | 121,754,937 | | | | 98,074,728 | | | | (11,781,170 | ) | | | 5,711,743 | | | | 10,969,689 | | | |
| | | | | | | | | | | | | | | | | | | | | | | | | | |
| | | — | | | | (8,528,761 | ) | | | — | | | | (11,686,440 | ) | | | — | | | | (282,017 | ) | | |
| | | — | | | | — | | | | — | | | | (4,351,540 | ) | | | — | | | | — | | | |
| | | | | | | | | | | | | | | | | | | | | | | | | | |
| | | — | | | | — | | | | — | | | | (4,863,451 | ) | | | — | | | | (1,987,390 | ) | | |
| | | — | | | | — | | | | — | | | | (1,538,429 | ) | | | — | | | | — | | | |
| | | — | | | | (8,528,761 | ) | | | — | | | | (22,439,860 | ) | | | — | | | | (2,269,407 | ) | | |
| | | | | | | | | | | | | | | | | | | | | | | | | | |
| | | 41,403,579 | | | | 79,163,606 | | | | 90,595,148 | | | | 264,286,008 | | | | 49,562,078 | | | | 71,373,222 | | | |
| | | — | | | | — | | | | 29,406,559 | | | | 70,738,953 | | | | — | | | | — | | | |
| | | | | | | | | | | | | | | | | | | | | | | | | | |
| | | — | | | | 8,528,761 | | | | — | | | | 16,549,889 | | | | — | | | | 2,269,406 | | | |
| | | — | | | | — | | | | — | | | | 5,889,970 | | | | — | | | | — | | | |
| | | | | | | | | | | | | | | | | | | | | | | | | | |
| | | (44,171,649 | ) | | | (103,842,938 | ) | | | (88,896,883 | ) | | | (145,304,148 | ) | | | (9,191,014 | ) | | | (12,844,472 | ) | | |
| | | — | | | | — | | | | (38,209,928 | ) | | | (88,670,602 | ) | | | — | | | | — | | | |
| | | | | | | | | | | | | | | | | | | | | | | | | | |
| | | (2,768,070 | ) | | | (16,150,571 | ) | | | (7,105,104 | ) | | | 123,490,070 | | | | 40,371,064 | | | | 60,798,156 | | | |
| | | 29,802,235 | | | | 97,075,605 | | | | 90,969,624 | | | | 89,269,040 | | | | 46,082,807 | | | | 69,498,438 | | | |
| | | 689,512,299 | | | | 592,436,694 | | | | 1,106,563,426 | | | | 1,017,294,386 | | | | 99,759,956 | | | | 30,261,518 | | | |
| | $ | 719,314,534 | | | $ | 689,512,299 | | | $ | 1,197,533,050 | | | $ | 1,106,563,426 | | | $ | 145,842,763 | | | $ | 99,759,956 | | | |
| | $ | 11,447,734 | | | $ | 1,751,240 | | | $ | 9,721,245 | | | $ | 470 | | | $ | 949,157 | | | $ | 74,795 | | | |
| | | | | | | | | | | | | | | | | | | | | | | | | | |
| | | 52,011,272 | | | | 53,294,207 | | | | 39,349,938 | | | | 33,061,628 | | | | 8,108,458 | | | | 2,870,304 | | | |
| | | 3,115,424 | | | | 6,557,150 | | | | 4,256,737 | | | | 12,204,220 | | | | 4,019,848 | | | | 6,175,563 | | | |
| | | | | | | | | | | | | | | | | | | | | | | | | | |
| | | — | | | | 667,953 | | | | — | | | | 771,557 | | | | — | | | | 186,629 | | | |
| | | (3,318,881 | ) | | | (8,508,038 | ) | | | (4,101,296 | ) | | | (6,687,467 | ) | | | (743,075 | ) | | | (1,124,038 | ) | | |
| | | (203,457 | ) | | | (1,282,935 | ) | | | 155,441 | | | | 6,288,310 | | | | 3,276,773 | | | | 5,238,154 | | | |
| | | 51,807,815 | | | | 52,011,272 | | | | 39,505,379 | | | | 39,349,938 | | | | 11,385,231 | | | | 8,108,458 | | | |
| | | | | | | | | | | | | | | | | | | | | | | | | | |
| | | | | | | | | | | 12,235,116 | | | | 12,850,144 | | | | | | | | | | | |
| | | | | | | | | | | 1,350,758 | | | | 3,251,994 | | | | | | | | | | | |
| | | | | | | | | | | | | | | | | | | | | | | | | | |
| | | | | | | | | | | — | | | | 277,567 | | | | | | | | | | | |
| | | | | | | | | | | (1,846,914 | ) | | | (4,144,589 | ) | | | | | | | | | | |
| | | | | | | | | | | (496,156 | ) | | | (615,028 | ) | | | | | | | | | | |
| | | | | | | | | | | 11,738,960 | | | | 12,235,116 | | | | | | | | | | | |
Semi-Annual Report 41
| |
| |
| Lazard Retirement Series, Inc. Financial Highlights |
| |
LAZARD RETIREMENT US STRATEGIC EQUITY PORTFOLIO
| | | Six Months | | | | | | | | | | | | | | | | |
| Selected data for a share of capital | | Ended | | | Year Ended | |
| stock outstanding throughout each period | | 6/30/14† | | | 12/31/13 | | | 12/31/12 | | | 12/31/11 | | | 12/31/10 | | | 12/31/09 | |
| | | | | | | | | | | | | | | | | | | |
| Service Shares | | | | | | | | | | | | | | | | | | |
| Net asset value, beginning of period | | $ | 12.02 | | | $ | 10.44 | | | $ | 9.26 | | | $ | 9.18 | | | $ | 8.19 | | | $ | 6.51 | |
| Income from investment operations: | | | | | | | | | | | | | | | | | | | | | | | | |
| Net investment income | | | 0.05 | | | | 0.11 | | | | 0.12 | | | | 0.10 | | | | 0.06 | | | | 0.06 | |
| Net realized and unrealized gain | | | 0.85 | | | | 2.80 | | | | 1.18 | | | | 0.08 | | | | 0.99 | | | | 1.69 | |
| Total from investment operations | | | 0.90 | | | | 2.91 | | | | 1.30 | | | | 0.18 | | | | 1.05 | | | | 1.75 | |
| Less distributions from: | | | | | | | | | | | | | | | | | | | | | | | | |
| Net investment income | | | — | | | | (0.11 | ) | | | (0.12 | ) | | | (0.10 | ) | | | (0.06 | ) | | | (0.07 | ) |
| Net realized gains | | | — | | | | (1.22 | ) | | | — | | | | — | | | | — | | | | — | |
| Total distributions | | | — | | | | (1.33 | ) | | | (0.12 | ) | | | (0.10 | ) | | | (0.06 | ) | | | (0.07 | ) |
| Net asset value, end of period | | $ | 12.92 | | | $ | 12.02 | | | $ | 10.44 | | | $ | 9.26 | | | $ | 9.18 | | | $ | 8.19 | |
| | | | | | | | | | | | | | | | | | | | | | | | | |
| Total Return (a) | | | 7.49 | % | | | 28.07 | % | | | 14.01 | % | | | 1.96 | % | | | 12.85 | % | | | 26.84 | % |
| | | | | | | | | | | | | | | | | | | | | | | | | |
| Ratios and Supplemental Data: | | | | | | | | | | | | | | | | | | | | | | | | |
| Net assets, end of period (in thousands) | | $ | 9,818 | | | $ | 8,944 | | | $ | 6,702 | | | $ | 6,008 | | | $ | 6,172 | | | $ | 5,365 | |
| Ratios to average net assets (b): | | | | | | | | | | | | | | | | | | | | | | | | |
| Net expenses | | | 1.00 | % | | | 1.00 | % | | | 1.00 | % | | | 1.00 | % | | | 1.22 | % | | | 1.25 | % |
| Gross expenses | | | 2.56 | % | | | 2.88 | % | | | 3.23 | % | | | 3.37 | % | | | 3.84 | % | | | 4.67 | % |
| Net investment income | | | 0.86 | % | | | 0.97 | % | | | 1.16 | % | | | 1.04 | % | | | 0.68 | % | | | 1.03 | % |
| Portfolio turnover rate | | | 29 | % | | | 66 | % | | | 59 | % | | | 50 | % | | | 55 | % | | | 79 | % |
LAZARD RETIREMENT US SMALL-MID CAP EQUITY PORTFOLIO
| | | Six Months | | | | | | | | | | | | | | | | |
| Selected data for a share of capital | | Ended | | | Year Ended | |
| stock outstanding throughout each period | | 6/30/14† | | | 12/31/13 | | | 12/31/12 | | | 12/31/11 | | | 12/31/10 | | | 12/31/09 | |
| | | | | | | | | | | | | | | | | | | |
| Service Shares | | | | | | | | | | | | | | | | | | |
| Net asset value, beginning of period | | $ | 8.71 | | | $ | 7.30 | | | $ | 9.26 | | | $ | 11.04 | | | $ | 9.68 | | | $ | 6.34 | |
| Income (loss) from investment operations: | | | | | | | | | | | �� | | | | | | | | | | | | | |
| Net investment income (loss) | | | (0.02 | ) | | | (0.03 | ) | | | (0.01 | ) | | | (0.01 | ) | | | 0.03 | | | | (0.01 | ) |
| Net realized and unrealized gain (loss) | | | 0.76 | | | | 2.53 | | | | 0.95 | | | | (1.01 | ) | | | 2.27 | | | | 3.35 | |
| Total from investment operations | | | 0.74 | | | | 2.50 | | | | 0.94 | | | | (1.02 | ) | | | 2.30 | | | | 3.34 | |
| Less distributions from: | | | | | | | | | | | | | | | | | | | | | | | | |
| Net investment income | | | — | | | | — | | | | — | | | | — | | | | (0.03 | ) | | | — | |
| Net realized gains | | | — | | | | (1.09 | ) | | | (2.90 | ) | | | (0.76 | ) | | | (0.91 | ) | | | — | |
| Total distributions | | | — | | | | (1.09 | ) | | | (2.90 | ) | | | (0.76 | ) | | | (0.94 | ) | | | — | |
| Net asset value, end of period | | $ | 9.45 | | | $ | 8.71 | | | $ | 7.30 | | | $ | 9.26 | | | $ | 11.04 | | | $ | 9.68 | |
| | | | | | | | | | | | | | | | | | | | | | | | | |
| Total Return (a) | | | 8.50 | % | | | 35.08 | % | | | 10.38 | % | | | –9.07 | % | | | 23.72 | % | | | 52.68 | % |
| | | | | | | | | | | | | | | | | | | | | | | | | |
| Ratios and Supplemental Data: | | | | | | | | | | | | | | | | | | | | | | | | |
| Net assets, end of period (in thousands) | | $ | 64,141 | | | $ | 58,923 | | | $ | 46,978 | | | $ | 180,524 | | | $ | 146,644 | | | $ | 143,821 | |
| Ratios to average net assets (b): | | | | | | | | | | | | | | | | | | | | | | | | |
| Net expenses | | | 1.25 | % | | | 1.25 | % | | | 1.20 | % | | | 1.15 | % | | | 1.18 | % | | | 1.25 | % |
| Gross expenses | | | 1.32 | % | | | 1.35 | % | | | 1.20 | % | | | 1.15 | % | | | 1.18 | % | | | 1.31 | % |
| Net investment income (loss) | | | –0.34 | % | | | –0.33 | % | | | –0.06 | % | | | –0.16 | % | | | 0.29 | % | | | –0.21 | % |
| Portfolio turnover rate | | | 47 | % | | | 101 | % | | | 74 | % | | | 98 | % | | | 122 | % | | | 171 | % |
| † | Unaudited. |
| (a) | Total returns reflect reinvestment of all dividends and distributions, if any. Certain expenses of the Portfolio have been waived or reimbursed by the Portfolio’s Investment Manager or State Street; without such waiver/reimbursement of expenses, the Portfolio’s returns would have been lower. Performance information does not reflect the fees and charges imposed by participating insurance companies at the separate account level, and such charges will have the effect of reducing performance. A period of less than one year is not annualized. |
| (b) | Annualized for a period of less than one year. |
The accompanying notes are an integral part of these financial statements.
42 Semi-Annual Report
LAZARD RETIREMENT INTERNATIONAL EQUITY PORTFOLIO
| | | Six Months | | | | | | | | | | | | | | | | |
| Selected data for a share of capital | | Ended | | | Year Ended | |
| stock outstanding throughout each period | | 6/30/14† | | | 12/31/13 | | | 12/31/12 | | | 12/31/11 | | | 12/31/10 | | | 12/31/09 | |
| | | | | | | | | | | | | | | | | | | |
| Service Shares | | | | | | | | | | | | | | | | | | |
| Net asset value, beginning of period | | $ | 13.26 | | | $ | 11.12 | | | $ | 9.33 | | | $ | 10.28 | | | $ | 9.76 | | | $ | 8.23 | |
| Income (loss) from investment operations: | | | | | | | | | | | | | | | | | | | | | | | | |
| Net investment income | | | 0.19 | | | | 0.17 | | | | 0.19 | | | | 0.18 | | | | 0.12 | | | | 0.16 | |
| Net realized and unrealized gain (loss) | | | 0.43 | | | | 2.13 | | | | 1.78 | | | | (0.93 | ) | | | 0.53 | | | | 1.60 | |
| Total from investment operations | | | 0.62 | | | | 2.30 | | | | 1.97 | | | | (0.75 | ) | | | 0.65 | | | | 1.76 | |
| Less distributions from: | | | | | | | | | | | | | | | | | | | | | | | | |
| Net investment income | | | — | | | | (0.16 | ) | | | (0.18 | ) | | | (0.20 | ) | | | (0.13 | ) | | | (0.23 | ) |
| Total distributions | | | — | | | | (0.16 | ) | | | (0.18 | ) | | | (0.20 | ) | | | (0.13 | ) | | | (0.23 | ) |
| Net asset value, end of period | | $ | 13.88 | | | $ | 13.26 | | | $ | 11.12 | | | $ | 9.33 | | | $ | 10.28 | | | $ | 9.76 | |
| | | | | | | | | | | | | | | | | | | | | | | | | |
| Total Return (a) | | | 4.68 | % | | | 20.76 | % | | | 21.11 | % | | | –7.27 | % | | | 6.72 | % | | | 21.46 | % |
| | | | | | | | | | | | | | | | | | | | | | | | | |
| Ratios and Supplemental Data: | | | | | | | | | | | | | | | | | | | | | | | | |
| Net assets, end of period (in thousands) | | $ | 719,315 | | | $ | 689,512 | | | $ | 592,437 | | | $ | 513,882 | | | $ | 471,030 | | | $ | 343,467 | |
| Ratios to average net assets (b): | | | | | | | | | | | | | | | | | | | | | | | | |
| Net expenses | | | 1.09 | % | | | 1.10 | % | | | 1.10 | % | | | 1.12 | % | | | 1.14 | % | | | 1.17 | % |
| Gross expenses | | | 1.09 | % | | | 1.10 | % | | | 1.10 | % | | | 1.12 | % | | | 1.14 | % | | | 1.17 | % |
| Net investment income | | | 2.82 | % | | | 1.41 | % | | | 1.80 | % | | | 1.89 | % | | | 1.41 | % | | | 1.89 | % |
| Portfolio turnover rate | | | 15 | % | | | 40 | % | | | 43 | % | | | 39 | % | | | 53 | % | | | 104 | % |
| † | Unaudited. |
| (a) | Total returns reflect reinvestment of all dividends and distributions, if any. Performance information does not reflect the fees and charges imposed by participating insurance companies at the separate account level, and such charges will have the effect of reducing performance. A period of less than one year is not annualized. |
| (b) | Annualized for a period of less than one year. |
The accompanying notes are an integral part of these financial statements.
Semi-Annual Report 43
LAZARD RETIREMENT EMERGING MARKETS EQUITY PORTFOLIO
| | | Six Months | | | | | | | | | | | | | | | | |
| Selected data for a share of capital | | Ended | | | Year Ended | |
| stock outstanding throughout each period | | 6/30/14† | | | 12/31/13 | | | 12/31/12 | | | 12/31/11 | | | 12/31/10 | | | 12/31/09 | |
| | | | | | | | | | | | | | | | | | | |
| Service Shares | | | | | | | | | | | | | | | | | | |
| Net asset value, beginning of period | | $ | 21.51 | | | $ | 22.22 | | | $ | 18.71 | | | $ | 23.33 | | | $ | 19.23 | | | $ | 11.59 | |
| Income (loss) from investment operations: | | | | | | | | | | | | | | | | | | | | | | | | |
| Net investment income (a) | | | 0.18 | | | | 0.31 | | | | 0.33 | | | | 0.44 | | | | 0.34 | | | | 0.29 | |
| Net realized and unrealized gain (loss) | | | 1.73 | | | | (0.58 | ) | | | 3.78 | | | | (4.64 | ) | | | 4.02 | | | | 7.80 | |
| Total from investment operations | | | 1.91 | | | | (0.27 | ) | | | 4.11 | | | | (4.20 | ) | | | 4.36 | | | | 8.09 | |
| Less distributions from: | | | | | | | | | | | | | | | | | | | | | | | | |
| Net investment income | | | — | | | | (0.31 | ) | | | (0.35 | ) | | | (0.42 | ) | | | (0.26 | ) | | | (0.45 | ) |
| Net realized gains | | | — | | | | (0.13 | ) | | | (0.25 | ) | | | — | | | | — | | | | — | |
| Total distributions | | | — | | | | (0.44 | ) | | | (0.60 | ) | | | (0.42 | ) | | | (0.26 | ) | | | (0.45 | ) |
| Net asset value, end of period | | $ | 23.42 | | | $ | 21.51 | | | $ | 22.22 | | | $ | 18.71 | | | $ | 23.33 | | | $ | 19.23 | |
| | | | | | | | | | | | | | | | | | | | | | | | | |
| Total Return (b) | | | 8.88 | % | | | –1.24 | % | | | 22.05 | % | | | –18.00 | % | | | 22.69 | % | | | 69.85 | % |
| | | | | | | | | | | | | | | | | | | | | | | | | |
| Ratios and Supplemental Data: | | | | | | | | | | | | | | | | | | | | | | | | |
| Net assets, end of period (in thousands) | | $ | 925,195 | | | $ | 846,233 | | | $ | 734,699 | | | $ | 580,370 | | | $ | 581,859 | | | $ | 367,260 | |
| Ratios to average net assets (c): | | | | | | | | | | | | | | | | | | | | | | | | |
| Net expenses | | | 1.38 | % | | | 1.38 | % | | | 1.39 | % | | | 1.42 | % | | | 1.46 | % | | | 1.56 | % |
| Gross expenses | | | 1.38 | % | | | 1.38 | % | | | 1.39 | % | | | 1.42 | % | | | 1.46 | % | | | 1.56 | % |
| Net investment income | | | 1.74 | % | | | 1.42 | % | | | 1.57 | % | | | 2.04 | % | | | 1.66 | % | | | 1.86 | % |
| Portfolio turnover rate | | | 6 | % | | | 14 | % | | | 23 | % | | | 19 | % | | | 27 | % | | | 51 | % |
| | | Six Months | | | | | | | | | | | | | | | | |
| Selected data for a share of capital | | Ended | | | Year Ended | |
| stock outstanding throughout each period | | 6/30/14† | | | 12/31/13 | | | 12/31/12 | | | 12/31/11 | | | 12/31/10 | | | 12/31/09 | |
| | | | | | | | | | | | | | | | | | | |
| Investor Shares | | | | | | | | | | | | | | | | | | | | | | | | |
| Net asset value, beginning of period | | $ | 21.28 | | | $ | 21.99 | | | $ | 18.52 | | | $ | 23.17 | | | $ | 19.13 | | | $ | 11.55 | |
| Income (loss) from investment operations: | | | | | | | | | | | | | | | | | | | | | | | | |
| Net investment income (a) | | | 0.21 | | | | 0.37 | | | | 0.38 | | | | 0.50 | | | | 0.38 | | | | 0.32 | |
| Net realized and unrealized gain (loss) | | | 1.71 | | | | (0.59 | ) | | | 3.74 | | | | (4.62 | ) | | | 4.01 | | | | 7.79 | |
| Total from investment operations | | | 1.92 | | | | (0.22 | ) | | | 4.12 | | | | (4.12 | ) | | | 4.39 | | | | 8.11 | |
| Less distributions from: | | | | | | | | | | | | | | | | | | | | | | | | |
| Net investment income | | | — | | | | (0.36 | ) | | | (0.40 | ) | | | (0.53 | ) | | | (0.35 | ) | | | (0.53 | ) |
| Net realized gains | | | — | | | | (0.13 | ) | | | (0.25 | ) | | | — | | | | — | | | | — | |
| Total distributions | | | — | | | | (0.49 | ) | | | (0.65 | ) | | | (0.53 | ) | | | (0.35 | ) | | | (0.53 | ) |
| Net asset value, end of period | | $ | 23.20 | | | $ | 21.28 | | | $ | 21.99 | | | $ | 18.52 | | | $ | 23.17 | | | $ | 19.13 | |
| | | | | | | | | | | | | | | | | | | | | | | | | |
| Total Return (b) | | | 9.02 | % | | | –1.01 | % | | | 22.34 | % | | | –17.79 | % | | | 23.05 | % | | | 70.23 | % |
| | | | | | | | | | | | | | | | | | | | | | | | | |
| Ratios and Supplemental Data: | | | | | | | | | | | | | | | | | | | | | | | | |
| Net asset value, end of period | | $ | 272,338 | | | $ | 260,330 | | | $ | 282,596 | | | $ | 244,320 | | | $ | 339,899 | | | $ | 170,217 | |
| Ratios to average net assets (c): | | | | | | | | | | | | | | | | | | | | | | | | |
| Net expenses | | | 1.13 | % | | | 1.14 | % | | | 1.14 | % | | | 1.17 | % | | | 1.21 | % | | | 1.31 | % |
| Gross expenses | | | 1.13 | % | | | 1.14 | % | | | 1.14 | % | | | 1.17 | % | | | 1.21 | % | | | 1.31 | % |
| Net investment income | | | 1.97 | % | | | 1.71 | % | | | 1.85 | % | | | 2.31 | % | | | 1.83 | % | | | 2.03 | % |
| Portfolio turnover rate | | | 6 | % | | | 14 | % | | | 23 | % | | | 19 | % | | | 27 | % | | | 51 | % |
| † | Unaudited. |
| (a) | Net investment income has been computed using the average shares method. |
| (b) | Total returns reflect reinvestment of all dividends and distributions, if any. Performance information does not reflect the fees and charges imposed by participating insurance companies at the separate account level, and such charges will have the effect of reducing performance. A period of less than one year is not annualized. |
| (c) | Annualized for a period of less than one year. |
The accompanying notes are an integral part of these financial statements.
44 Semi-Annual Report
LAZARD RETIREMENT GLOBAL DYNAMIC MULTI ASSET PORTFOLIO
| | | Six Months | | | | | | For the Period | | |
| Selected data for a share of capital | | Ended | | | Year Ended | | | 4/30/12* to | | |
| stock outstanding throughout each period | | 6/30/14† | | | 12/31/13 | | | 12/31/12 | | |
| | | | | | | | | | | |
| Service Shares | | | | | | | | | | |
| Net asset value, beginning of period | | $ | 12.30 | | | $ | 10.54 | | | $ | 10.00 | | |
| Income from investment operations: | | | | | | | | | | | | | |
| Net investment income | | | 0.09 | | | | 0.06 | | | | 0.03 | | |
| Net realized and unrealized gain | | | 0.42 | | | | 1.99 | | | | 0.54 | | |
| Total from investment operations | | | 0.51 | | | | 2.05 | | | | 0.57 | | |
| Less distributions from: | | | | | | | | | | | | | |
| Net Investment Income | | | — | | | | (0.04 | ) | | | — | (c) | |
| Net realized gains | | | — | | | | (0.25 | ) | | | (0.03 | ) | |
| Total distributions | | | — | | | | (0.29 | ) | | | (0.03 | ) | |
| Net asset value, end of period | | $ | 12.81 | | | $ | 12.30 | | | $ | 10.54 | | |
| | | | | | | | | | | | | | |
| Total Return (a) | | | 4.15 | % | | | 19.49 | % | | | 5.74 | % | |
| | | | | | | | | | | | | | |
| Ratios and Supplemental Data: | | | | | | | | | | | | | |
| Net assets, end of period (in thousands) | | $ | 145,843 | | | $ | 99,760 | | | $ | 30,262 | | |
| Ratios to average net assets (b): | | | | | | | | | | | | | |
| Net expenses | | | 1.05 | % | | | 1.05 | % | | | 1.05 | % | |
| Gross expenses | | | 1.37 | % | | | 1.70 | % | | | 3.80 | % | |
| Net investment income | | | 1.44 | % | | | 1.01 | % | | | 1.03 | % | |
| Portfolio turnover rate | | | 67 | % | | | 62 | % | | | 45 | % | |
| † | Unaudited. |
| * | The Portfolio commenced operations on April 30, 2012. |
| (a) | Total returns reflect reinvestment of all dividends and distributions, if any. Certain expenses of the Portfolio have been waived or reimbursed by the Portfolio’s Investment Manager, State Street or BFDS; without such waiver/reimbursement of expenses, the Portfolio’s returns would have been lower. Performance information does not reflect the fees and charges imposed by participating insurance companies at the separate account level, and such charges will have the effect of reducing performance. A period of less than one year is not annualized. |
| (b) | Annualized for a period of less than one year. |
| (c) | Amount is less than $0.01 per share. |
The accompanying notes are an integral part of these financial statements.
Semi-Annual Report 45
| |
| |
| Lazard Retirement Series, Inc. Notes to Financial Statements June 30, 2014 (unaudited) |
| |
1. Organization
Lazard Retirement Series, Inc. (the “Fund”) was incorporated in Maryland on February 13, 1997 and is registered under the Investment Company Act of 1940, as amended (the “Act”), as an open-end management investment company. The Fund, comprised of fifteen no-load portfolios (each referred to as a “Portfolio”), is currently offered only to separate accounts established by insurance companies to fund variable annuity contracts and variable life insurance policies. Portfolio shares may also be offered to certain qualified pension and retirement plans and accounts permitting accumulation of assets on a tax-deferred basis. Effective January 31, 2006, the Fund designated its existing class of shares as Service Shares and commenced offering Investor Shares. Investor Shares and Service Shares are identical, except as to the services offered to and expenses borne by each class of shares. Currently, only the following five Portfolios, each of which is “diversified”, as defined in the Act, are offered: Lazard Retirement US Strategic Equity Portfolio (“US Strategic Equity Portfolio”), Lazard Retirement US Small-Mid Cap Equity Portfolio (“US Small-Mid Cap Equity Portfolio”), Lazard Retirement International Equity Portfolio (“International Equity Portfolio”), Lazard Retirement Emerging Markets Equity Portfolio (“Emerging Markets Equity Portfolio”) and Lazard Retirement Global Dynamic Multi Asset Portfolio (formerly, Multi-Asset Targeted Volatility Portfolio) (“Global Dynamic Multi Asset Portfolio”). Each of the other ten Portfolios had not commenced operations as of June 30, 2014.
2. Significant Accounting Policies
The accompanying financial statements are presented in conformity with GAAP. The Fund is an investment company and therefore applies specialized accounting guidance in Accounting Standards Codification Topic 946. The following is a summary of significant accounting policies consistently followed by the Fund in the preparation of the financial statements:
(a) Valuation of Investments—Net asset value (“NAV”) per share is determined by State Street for the Fund on each day the New York Stock Exchange (“NYSE”) is open for business. Market values for securities listed on the NYSE, NASDAQ national market or other US or foreign exchanges or markets are generally based on the last reported sales price on the exchange or market on which the security is principally traded, generally as of the close of regular trading on
the NYSE (normally 4:00 p.m. Eastern time) on each valuation date; securities not traded on the valuation date are valued at the most recent quoted bid price. The Fund values NASDAQ-traded securities at the NASDAQ Official Closing Price, which may not be the last reported sales price in certain instances. Forward currency contracts are valued using quotations from an independent pricing service. Investments in money market funds are valued at the fund’s NAV.
Bonds and other fixed-income securities that are not exchange-traded are valued on the basis of prices provided by independent pricing services which are based primarily on institutional trading in similar groups of securities, or by using brokers’ quotations or a matrix system which considers such factors as other security prices, yields and maturities. Debt securities maturing in 60 days or less are valued at amortized cost, except where to do so would not accurately reflect their fair value, in which case such securities are valued at fair value as determined by, or in accordance with procedures approved by, the Board of Directors (the “Board”).
The Valuation Committee of the Investment Manager, which meets periodically under the direction of the Board, may evaluate a variety of factors to determine the fair value of securities for which market quotations are determined not to be readily available or reliable. These factors include, but are not limited to, the type of security, the value of comparable securities, observations from financial institutions and relevant news events. Input from the Investment Manager’s portfolio managers/analysts also will be considered.
If a significant event materially affecting the value of securities occurs between the close of the exchange or market on which the security is principally traded and the time when a Portfolio’s NAV is calculated, or when current market quotations otherwise are determined not to be readily available or reliable (including restricted or other illiquid securities such as certain derivative instruments), such securities will be valued at their fair value as determined by, or in accordance with procedures approved by, the Board. The fair value of non-US securities may be determined with the assistance of an independent pricing service using correlations between the movement of prices of such securities and indices of US securities and other appropriate indicators, such as closing market prices of relevant ADRs or futures contracts. Non-US securities may trade on days when a Portfolio is not open for business, thus affecting the value of the Portfolio’s assets
46 Semi-Annual Report
on days when Portfolio shareholders may not be able to buy or sell Portfolio shares.
The effect of using fair value pricing is that the NAV of a Portfolio will reflect the affected securities’ values as determined in the judgment of the Board or its designee instead of being determined by the market. Using a fair value pricing methodology to price securities may result in a value that is different from the most recent closing price of a security and from the prices used by other investment companies to calculate their portfolios’ NAVs.
(b) Portfolio Securities Transactions and Investment Income—Portfolio securities transactions are accounted for on trade date. Realized gain (loss) on sales of investments are recorded on a specific identification basis. Dividend income is recorded on the ex-dividend date and interest income is accrued daily. The Portfolios amortize premiums and accrete discounts on fixed-income securities using the effective yield method. For the period ended June 30, 2014, only Global Dynamic Multi Asset Portfolio traded in fixed-income securities.
The Portfolios may be subject to taxes imposed by foreign countries in which they invest. Such taxes are generally based upon income earned or capital gains (realized or unrealized). The Portfolios accrue and apply such taxes to net investment income, net realized gains and net unrealized gains concurrent with the recognition of income or capital gains (realized and unrealized) from the applicable portfolio securities.
(c) Foreign Currency Translation and Forward Currency Contracts—The accounting records of the Portfolios are maintained in US dollars. Portfolio securities and other assets and liabilities denominated in a foreign currency are translated daily into US dollars at the prevailing rates of exchange. Purchases and sales of securities, income receipts and expense payments are translated into US dollars at the prevailing exchange rates on the respective transaction dates.
The Portfolios do not isolate the portion of operations resulting from changes in foreign exchange rates on investments from the fluctuations arising from changes in their market prices. Such fluctuations are included in net realized and unrealized gain (loss) on investments. Net realized gain
(loss) on foreign currency and forward currency contracts represents net foreign currency gain (loss) from forward currency contracts, disposition of foreign currencies, currency gain (loss) realized between the trade and settlement dates on securities transactions, and the difference between the amount of dividends, interest and foreign withholding taxes recorded on a Portfolio’s accounting records and the US dollar equivalent amounts actually received or paid. Net change in unrealized appreciation (depreciation) on foreign currency reflects the impact of changes in exchange rates on the value of assets and liabilities, other than investments in securities, during the period.
A forward currency contract is an agreement between two parties to buy or sell currency at a set price on a future date. Upon entering into these contracts, risks may arise from the potential inability of counterparties to meet the terms of their contracts and from unanticipated movements in the value of the foreign currency relative to the US dollar.
The US dollar value of forward currency contracts is determined using quotations provided by an independent pricing service. Daily fluctuations in the value of such contracts are recorded as unrealized appreciation (depreciation) on forward currency contracts. When the contract is closed, the Portfolio records a realized gain (loss) equal to the difference between the value at the time it was opened and the value at the time it was closed.
For the period ended June 30, 2014, only Global Dynamic Multi Asset Portfolio traded in forward currency contracts.
(d) Federal Income Taxes—The Fund’s policy is to continue to have each Portfolio qualify as a regulated investment company under Subchapter M of the Internal Revenue Code and to distribute all of its taxable income, including any net realized capital gains, to shareholders. Therefore, no federal income tax provision is required.
At December 31, 2013, the following Portfolio had unused realized capital losses which, for federal income tax purposes, could be used to offset future realized capital gains as follows:
| Portfolio | | Expiring 2017 | | Expiring 2018 |
| | | | | | | | | |
| International Equity | | $35,192,918 | | $7,205,218 |
Semi-Annual Report 47
Under current tax law, certain capital and net foreign currency losses realized after October 31 within the taxable year may be deferred and treated as occurring on the first day of the following tax year. For the tax year ended December 31, 2013, none of the Portfolios elected to defer net capital and foreign currency losses arising between November 1, 2013 and December 31, 2013.
The Regulated Investment Company Modernization Act of 2010 (the “RIC Modernization Act”) includes numerous provisions that generally became effective for taxable years beginning after December 22, 2010. Among the provisions, net capital losses may be carried forward indefinitely, and their character is retained as short-term or long-term. Previously, net capital losses were carried forward for eight years and treated as short-term losses. The RIC Modernization Act also requires that post-enactment net capital losses be used before pre-enactment net capital losses. As a result, pre-enactment capital loss carryforwards may expire unused.
Management has analyzed the Portfolios’ tax positions, and has concluded that no liability for unrecognized tax benefits should be recorded related to uncertain tax positions taken on returns filed for open tax years (2010-2012), or expected to be taken in the Portfolios’ 2013 tax returns.
(e) Dividends and Distributions—Each Portfolio intends to declare and to pay dividends annually from net investment income, if any. During any particular year, net realized gains from investment transactions in excess of available capital loss carryforwards would be taxable to the Portfolios, if not distributed. The Portfolios intend to declare and distribute these amounts, at least annually, to shareholders; however, to avoid taxation, a second distribution may be required.
Income dividends and capital gains distributions are determined in accordance with federal income tax regulations which may differ from GAAP. These book/tax differences, which may result in distribution reclassifications, are primarily due to differing treatments of foreign currency transactions, wash sales, passive foreign investment companies and distributions from real estate investment trusts and partnerships. The book/tax differences relating to shareholders distributions may result in reclassifications among certain capital accounts.
(f) Allocation of Expenses—Expenses not directly chargeable to a specific Portfolio are allocated among the Portfolios primarily on the basis of relative net assets. A Portfolio accrues distribution and service (12b-1) fees to its Service Shares. Each Portfolio’s income, expenses (other than class specific expenses) and realized and unrealized gains and losses are allocated proportionally each day between the classes based upon the relative net assets of each class.
(g) Expense Reductions—The Portfolios’ excess cash in demand deposit accounts, if any, may receive credits that are available to offset custody expenses. The Statements of Operations report gross custody expenses, and report the amount of any credits separately as an expense reduction.
(h) Estimates—The preparation of financial statements in conformity with GAAP requires the Fund to make estimates and assumptions that affect the reported amounts of assets and liabilities and disclosure of contingent assets and liabilities at the date of the financial statements and the reported amounts of increases and decreases in net assets from operations during the reporting period. Actual results could differ from those estimates.
3. Investment Management, Administration, Distribution and Transfer Agency Agreements
The Fund, on behalf of the Portfolios, has entered into an investment management agreement (the “Management Agreement”) with the Investment Manager. Pursuant to the Management Agreement, the Investment Manager regularly provides each Portfolio with investment research, advice and supervision and furnishes continuously an investment program for each Portfolio consistent with its investment objective and policies, including the purchase, retention and disposition of securities. For its services provided to the Fund, the Investment Manager earns a management fee, accrued daily as a percentage of its average daily net assets and payable by each Portfolio monthly, at the annual rate set forth below:
| Portfolio | | Annual Rate | |
| | | | |
| US Strategic Equity | | | 0.70 | % | |
| US Small-Mid Cap Equity | | | 0.75 | | |
| International Equity | | | 0.75 | | |
| Emerging Markets Equity | | | 1.00 | | |
| Global Dynamic Multi Asset | | | 0.85 | | |
48 Semi-Annual Report
The Investment Manager has voluntarily agreed to reduce its fees and, if necessary, reimburse the Portfolios if annualized operating expenses exceed the following percentages of average daily net assets for the respective Shares:
| Portfolio | | Service Shares | | Investor Shares | |
| | |
| US Strategic Equity | | | 1.00 | % | | | N/A | | |
| US Small-Mid Cap Equity | | | 1.25 | | | | N/A | | |
| International Equity | | | 1.25 | | | | N/A | | |
| Emerging Markets Equity | | | 1.55 | | | | 1.30 | % | |
| Global Dynamic Multi Asset | | | 1.05 | | | | N/A | | |
During the period ended June 30, 2014, the Investment Manager waived its management fees and reimbursed the following Portfolios for other expenses as follows:
| | | Service Shares | |
| | | Management | | Expenses | |
| Portfolio | | Fees Waived | | Reimbursed | |
| | | | | | | | | | |
| US Strategic Equity | | $ | 32,477 | | | $ | 30,656 | | |
| US Small-Mid Cap Equity | | | 21,646 | | | | — | | |
| Global Dynamic Multi Asset | | | 191,350 | | | | — | | |
The Fund has entered into an administration agreement with State Street to provide certain administrative services to the Portfolios. Each Portfolio bears the cost of such services at a fixed annual rate of $42,500, plus 0.02% of average daily net assets up to $1 billion and 0.01% of average daily net assets over $1 billion. State Street has agreed to waive $18,750 of the $42,500 annual fee for the US Strategic Equity Portfolio until the Portfolio’s net assets reach $25 million. During the period ended June 30, 2014, State Street waived its fees of $9,375 for the Portfolio.
The Fund has a distribution agreement with Lazard Asset Management Securities LLC (the “Distributor”), a wholly-owned subsidiary of the Investment Manager, to serve as the distributor for shares of each Portfolio. The Distributor bears the cost of printing and mailing prospectuses to potential investors and certain expenses in connection with the offering of Portfolio shares.
Under a Distribution and Servicing Plan, in accordance with Rule 12b-1 under the Act, each Portfolio pays a monthly fee to the Distributor, at an annual rate of 0.25% of the average daily net assets of its Service Shares, for distribution and servicing of accounts. The Distributor may make payments to participating insurance companies, certain financial institutions, securities dealers and other industry professionals for providing these services.
BFDS is the Fund’s transfer and dividend disbursing agent. For its services, BFDS receives a monthly fee computed on the basis of the number of shareholder accounts it maintains for the Fund during the month, subject to a minimum fee amount per share class in each Portfolio, and is reimbursed for certain out-of-pocket expenses. BFDS has agreed to waive the monthly minimum fee for the first six months after a new Portfolio has commenced operations.
4. Directors’ Compensation
Certain Directors of the Fund are officers of the Investment Manager. Each Director who is not an affiliated person of the Investment Manager or any of its affiliates is paid by the Fund, The Lazard Funds, Inc., Lazard Global Total Return and Income Fund, Inc. and Lazard World Dividend & Income Fund, Inc. (collectively with the Fund, the “Lazard Funds”), each a registered management investment company advised by the Investment Manager: (1) an annual retainer of $100,000, (2) a per meeting in person regular or special meeting fee of $5,000 ($1,500 for telephonic participation), including Board, committee, subcommittee or other special meetings specifically authorized by the Board and held in connection with delegated Fund business, and (3) a telephone Audit Committee or special Board meeting fee of $1,500, with an additional annual fee for the Audit Committee Chair of $5,000. Such Directors also are reimbursed for travel and other out-of-pocket expenses for attending Board and committee meetings. No additional compensation is provided in respect of committee meetings held in conjunction with a meeting of the Board. Compensation is, generally, divided among the Lazard Funds based on relative net assets. The Directors do not receive benefits from the Fund pursuant to any pension, retirement or similar arrangement.
5. Securities Transactions and Transactions with Affiliates
Purchases and sales of portfolio securities (excluding short-term investments) for the period ended June 30, 2014 were as follows:
| Portfolio | | Purchases | | Sales | |
| | |
| US Strategic Equity | | $ | 3,080,698 | | | $ | 2,642,550 | | |
| US Small-Mid Cap Equity | | | 28,007,207 | | | | 27,714,810 | | |
| International Equity | | | 103,233,905 | | | | 97,513,940 | | |
| Emerging Markets Equity | | | 64,489,717 | | | | 86,152,340 | | |
| Global Dynamic Multi Asset | | | 117,084,141 | | | | 79,374,199 | | |
Semi-Annual Report 49
For the period ended June 30, 2014, no brokerage commissions were paid to affiliates of the Investment Manager or other affiliates of the Fund for portfolio transactions executed on behalf of the Fund.
6. Non-US Securities Investment Risks
Certain Portfolios invest in securities of foreign entities and in instruments denominated in foreign currencies which involve risks not typically associated with investments in US securities. A Portfolio’s performance will be influenced by political, social and economic factors affecting the non-US countries and companies in which the Portfolio invests. Non-US securities carry special risks, such as less developed or less efficient trading markets, political instability, a lack of company information, differing auditing and legal standards, and, potentially, less liquidity. In addition, investments denominated in currencies other than US dollars may experience a decline in value, in US dollar terms, due solely to fluctuations in currency exchange rates. Emerging market countries can generally have economic structures that are less diverse and mature, and political systems that are less stable, than those of developed countries. The securities markets of emerging market countries have historically been extremely volatile. Capital markets worldwide have experienced unprecedented volatility in recent years, causing significant declines in valuation and liquidity in certain emerging markets. These market conditions may continue or worsen. Investments in these countries may be subject to political, economic, legal, market and currencies risks. The risks may include less protection of property rights and uncertain political and economic policies, the imposition of capital controls and/or foreign investment limitations by a country, nationalization of businesses and the imposition of sanctions by other countries, such as the US. Significant devaluation of emerging market currencies against the US dollar may occur subsequent to acquisition of investments denominated in emerging market currencies. The Portfolios’ investments could be adversely affected by delays in, or a refusal to grant, repatriation of funds or conversion of emerging market currencies.
7. Contractual Obligations
The Fund enters into contracts in the normal course of business that contain a variety of indemnifications. A Portfolio’s
maximum exposure under these arrangements is unknown. Management has reviewed the Fund’s existing contracts and expects the risk of loss to be remote.
8. Fair Value Measurements
Fair value is defined as the price that a Portfolio would receive to sell an asset, or would pay to transfer a liability, in an orderly transaction between market participants at the date of measurement. The Fair Value Measurements and Disclosures provisions of GAAP also establish a framework for measuring fair value, and a three-level hierarchy for fair value measurement that is based upon the transparency of inputs to the valuation of an asset or liability. Inputs may be observable or unobservable and refer, broadly, to the assumptions that market participants would use in pricing the asset or liability. Observable inputs reflect the assumptions that market participants would use in pricing the asset or liability based on market data obtained from sources independent of the Fund. Unobservable inputs reflect the Fund’s own assumptions about the assumptions that market participants would use in pricing the asset or liability, developed based on the best information available in the circumstances. Each investment’s fair value measurement level within the fair value hierarchy is based on the lowest level of any input that is significant to the overall fair value measurement. The three-level hierarchy of inputs is summarized below.
| • | Level 1 – unadjusted quoted prices in active markets for identical investments |
| • | Level 2 – other significant observable inputs (including unadjusted quoted prices for similar investments, interest rates, prepayment speeds, credit risk, etc.) |
| • | Level 3 – significant unobservable inputs (including the Fund’s own assumptions in determining the fair value of investments) |
The inputs or methodology used for valuing securities are not necessarily an indication of the risks associated with investing in these securities.
50 Semi-Annual Report
The following table summarizes the valuation of the Portfolios’ investments by each fair value hierarchy level as of June 30, 2014:
| | | Unadjusted | | | | | | |
| | | Quoted Prices in | | | | | | |
| | | Active Markets | | Significant Other | | Significant | | |
| | | for Identical | | Observable | | Unobservable | | |
| | | Investments | | Inputs | | Inputs | | Balance as of | |
| Description | | (Level 1) | | (Level 2) | | (Level 3) | | June 30, 2014 | |
| | | | | | | | | |
| US Strategic Equity Portfolio | | | | | | | | | | | | | | | | |
| Common Stocks | | $ | 9,688,027 | | | $ | — | | | $ | — | | | $ | 9,688,027 | |
| Preferred Stock* | | | — | | | | — | | | | — | | | | — | |
| Short-Term Investment | | | 66,014 | | | | — | | | | — | | | | 66,014 | |
| Total | | $ | 9,754,041 | | | $ | — | | | $ | — | | | $ | 9,754,041 | |
| | | | | | | | | | | | | | | | | |
| US Small-Mid Cap Equity Portfolio | | | | | | | | | | | | | | | | |
| Common Stocks | | $ | 62,420,682 | | | $ | — | | | $ | — | | | $ | 62,420,682 | |
| Preferred Stock* | | | — | | | | — | | | | — | | | | — | |
| Short-Term Investment | | | 2,148,568 | | | | — | | | | — | | | | 2,148,568 | |
| Total | | $ | 64,569,250 | | | $ | — | | | $ | — | | | $ | 64,569,250 | |
| | | | | | | | | | | | | | | | | |
| International Equity Portfolio | | | | | | | | | | | | | | | | |
| Common Stocks | | | | | | | | | | | | | | | | |
| Thailand | | $ | — | | | $ | 4,953,277 | | | $ | — | | | $ | 4,953,277 | |
| Other | | | 677,572,298 | | | | — | | | | — | | | | 677,572,298 | |
| Preferred Stock | | | 14,468,649 | | | | — | | | | — | | | | 14,468,649 | |
| Short-Term Investment | | | 21,365,606 | | | | — | | | | — | | | | 21,365,606 | |
| Total | | $ | 713,406,553 | | | $ | 4,953,277 | | | $ | — | | | $ | 718,359,830 | |
| | | | | | | | | | | | | | | | | |
| Emerging Markets Equity Portfolio | | | | | | | | | | | | | | | | |
| Common Stocks | | | | | | | | | | | | | | | | |
| Russia | | $ | 70,823,080 | | | $ | 66,103,828 | | | $ | — | | | $ | 136,926,908 | |
| Thailand | | | 9,967,228 | | | | 20,093,764 | | | | — | | | | 30,060,992 | |
| Other | | | 982,017,340 | | | | — | | | | — | | | | 982,017,340 | |
| Short-Term Investment | | | 52,254,198 | | | | — | | | | — | | | | 52,254,198 | |
| Total | | $ | 1,115,061,846 | | | $ | 86,197,592 | | | $ | — | | | $ | 1,201,259,438 | |
| | | | | | | | | | | | | | | | | |
| Global Dynamic Multi Asset Portfolio | | | | | | | | | | | | | | | | |
| Assets: | | | | | | | | | | | | | | | | |
| Common Stocks | | $ | 114,407,890 | | | $ | — | | | $ | — | | | $ | 114,407,890 | |
| Preferred Stock | | | 456,053 | | | | — | | | | — | | | | 456,053 | |
| Corporate Bonds | | | — | | | | 7,134,225 | | | | — | | | | 7,134,225 | |
| Foreign Government Obligations | | | — | | | | 15,640,082 | | | | — | | | | 15,640,082 | |
| Quasi Government Bonds | | | — | | | | 1,417,459 | | | | — | | | | 1,417,459 | |
| Supranationals | | | — | | | | 1,016,589 | | | | — | | | | 1,016,589 | |
| US Municipal Bonds | | | — | | | | 436,303 | | | | — | | | | 436,303 | |
| Short-Term Investment | | | 4,978,541 | | | | — | | | | — | | | | 4,978,541 | |
| Other Financial Instruments** | | | | | | | | | | | | | | | | |
| Forward Currency Contracts | | | — | | | | 94,318 | | | | — | | | | 94,318 | |
| Total | | $ | 119,842,484 | | | $ | 25,738,976 | | | $ | — | | | $ | 145,581,460 | |
| | | | | | | | | | | | | | | | | |
| Liabilities: | | | | | | | | | | | | | | | | |
| Other Financial Instruments** | | | | | | | | | | | | | | | | |
| Forward Currency Contracts | | $ | — | | | $ | (178,374 | ) | | $ | — | | | $ | (178,374 | ) |
| * | | The preferred stock was reported in the Portfolios of Investments at zero market value. |
| ** | | Other financial instruments are derivative instruments which are valued at their respective unrealized appreciation/depreciation. |
Semi-Annual Report 51
Certain common stocks (see footnote (d) in the Notes to Portfolios of Investments) included in Level 2 were valued based on reference to similar securities from the same issuers which were trading on active markets. The fixed-income securities included in Level 2 were valued on the basis of prices provided by independent pricing services. The forward currency contracts included in Level 2 were valued using quotations provided by an independent pricing service.
The fair value measurement process for the Level 3 preferred stock of Better Place, Inc., a company that was working to build the infrastructure to deliver a range of services relating to the use of electric vehicles, including battery charging and swap stations, includes significant unobservable inputs, including the bankruptcy filing of the company, which is reflected in its current valuation of zero.
In connection with the periodic implementation of fair value pricing procedures with respect to non-US securities (see Note 2(a)), certain equity securities (other than those securities described in footnote (d) in the Notes to Portfolios of Investments) in the International Equity, Emerging Markets Equity and Global Dynamic Multi Asset Portfolios can transfer from Level 1 to Level 2 as a result of fair value pricing procedure triggers being met and would revert to Level 1 when the fair value pricing procedure triggers are no longer met. There were no other transfers into or out of Levels 1, 2 or 3 during the period ended June 30, 2014.
For further information regarding security characteristics see Portfolios of Investments.
9. Derivative Instruments
Certain Portfolios may use derivative instruments, including forward currency contracts. Forward currency contracts may be used for hedging purposes or to seek to increase returns.
Global Dynamic Multi Asset Portfolio
During the period ended June 30, 2014, the notional amounts of purchases and sales of forward currency contracts were $90,557,400 and $107,891,264, respectively.
The following table summarizes the fair value of derivative instruments on its Statement of Assets and Liabilities as of June 30, 2014:
| | | Fair Value | |
| |
| Asset Derivatives | | | | |
| Foreign Exchange Risk: | | | | |
| Gross unrealized appreciation on forward currency contracts | | $ | 94,318 | |
| Liability Derivatives | | | | |
| Foreign Exchange Risk: | | | | |
| Gross unrealized depreciation on forward currency contracts | | $ | 178,374 | |
The effect of derivative instruments on its Statement of Operations for the period ended June 30, 2014 was:
| | | Amount | |
| |
| Realized Gain (Loss) on Derivatives Recognized in Income | | | | |
| Foreign Exchange Risk: | | | | |
| Net realized loss on forward currency contracts | | $ | (422,388 | ) |
| Net Change in Unrealized Appreciation (Depreciation) on Derivatives Recognized in Income | | | | |
| Foreign Exchange Risk: | | | | |
| Net change in unrealized depreciation on forward currency contracts | | $ | (9,678 | ) |
See Note 2(c) and the Portfolios of Investments for additional disclosures about derivative instruments.
As of June 30, 2014, the Global Dynamic Multi Asset Portfolio holds derivative instruments that are eligible for offset in its Statement of Assets and Liabilities and are subject to master netting arrangements. A master netting arrangement is an agreement between two counterparties who have multiple contracts with each other that provides for the net settlement of all contracts, as well as any cash collateral, through single payment in the event of default on or termination of any one contract.
52 Semi-Annual Report
The required information for the affected Portfolio is presented in the below table, as of June 30, 2014:
Global Dynamic Multi Asset Portfolio
| | | | | | | Net Amounts of | |
| | | | | Gross Amounts Offset | | Assets Presented | |
| | | Gross Amounts of | | in the Statement of | | in the Statement of | |
| Description | | Recognized Assets | | Assets and Liabilities | | Assets and Liabilities | |
| | | | | | | | | | | | | | |
| Forward Currency Contracts | | $ | 94,318 | | | $ | — | | | $ | 94,318 | | |
| | | | | Gross Amounts Not Offset in the | | | |
| | | | | Statement of Assets and Liabilities | | | |
| | | Net Amounts of | | | | | | | |
| | | Assets Presented | | | | | | | |
| | | in Statement of | | Financial | | Collateral | | | |
| Counterparty | | Assets and Liabilities | | Instruments | | Received | | Net Amount | |
| | |
| Citibank NA | | $ | 14,771 | | | $ | (14,771 | ) | | $ | — | | | $ | — | | |
| HSBC Bank USA | | | 79,532 | | | | (23,230 | ) | | | — | | | | 56,302 | | |
| State Street Bank and Trust Co. | | | 15 | | | | (15 | ) | | | — | | | | — | | |
| Total | | $ | 94,318 | | | $ | (38,016 | ) | | $ | — | | | $ | 56,302 | | |
| | | | | | | Net Amounts of | |
| | | | | Gross Amounts Offset | | Liabilities Presented | |
| | | Gross Amounts of | | in the Statement of | | in the Statement of | |
| Description | | Recognized Liabilities | | Assets and Liabilities | | Assets and Liabilities | |
| | | | | | | | | | | | | | |
| Forward Currency Contracts | | $ | 178,374 | | | $ | — | | | $ | 178,374 | | |
| | | | | Gross Amounts Not Offset in the
Statement of Assets & Liabilities | | | |
| Counterparty | | Net Amounts of
Liabilities Presented
in Statement of
Assets & Liabilities | | Financial
Instruments | | Collateral
Pledged | | Net Amount | |
| | | | | | | | | | | | | | | | | | |
| Barclays Bank PLC | | $ | 6,903 | | | $ | — | | | $ | — | | | $ | 6,903 | | |
| BNP Paribas SA | | | 6,730 | | | | — | | | | — | | | | 6,730 | | |
| Canadian Imperial Bank of Commerce | | | 30,065 | | | | — | | | | — | | | | 30,065 | | |
| Citibank NA | | | 21,943 | | | | (14,771 | ) | | | — | | | | 7,172 | | |
| Credit Suisse Group AG | | | 50 | | | | — | | | | — | | | | 50 | | |
| HSBC Bank USA | | | 23,230 | | | | (23,230 | ) | | | — | | | | — | | |
| JPMorgan Chase Bank | | | 2,123 | | | | — | | | | — | | | | 2,123 | | |
| Royal Bank of Canada | | | 65,770 | | | | — | | | | — | | | | 65,770 | | |
| State Street Bank and Trust Co. | | | 21,560 | | | | (15 | ) | | | — | | | | 21,545 | | |
| Total | | $ | 178,374 | | | $ | (38,016 | ) | | $ | — | | | $ | 140,358 | | |
10. Subsequent Events
Management has evaluated the possibility of subsequent events affecting the Fund’s financial statements and has determined that there are no such subsequent events that require adjustment or disclosure in the financial statements.
Semi-Annual Report 53
| |
| |
| Lazard Retirement Series, Inc. Board of Directors and Officers Information (unaudited) |
| |
| Name (Age) | | Position(s) with the Fund | | Principal Occupation(s) and Other Public Company |
| Address(1) | | (Since) and Term(2) | | Directorships Held During the Past Five Years(2) |
| Independent Directors(3): | | | | |
| Kenneth S. Davidson (69) | | Director
(April 1997) | | Davidson Capital Management Corporation, an investment manager, President (1978 – present) |
| | | | | |
| | | | | Balestra Capital, Ltd., an investment manager and adviser, Senior Advisor (July 2012 – present) |
| | | | | |
| | | | | Aquiline Holdings LLC, an investment manager, Partner (2006 – June 2012) |
| | | | | |
| Nancy A. Eckl (51) | | Director
(May 2007) | | College Retirement Equities Fund (eight accounts), Trustee (2007 – present) |
| | | | | |
| | | | | TIAA-CREF Funds (59 funds) and TIAA-CREF Life Funds (10 funds), Trustee (2007 – present) |
| | | | | |
| | | | | TIAA Separate Account VA-1, Member of the Management Committee (2007 – present) |
| | | | | |
| | | | | American Beacon Advisors, Inc. (“American Beacon”) and certain funds advised by American Beacon, Vice President (1990 – 2006) |
| | | | | |
| Trevor W. Morrison (42) | | Director
(April 2014) | | New York University School of Law, Dean and Eric M. and Laurie B. Roth Professor of Law (2013 – present) |
| | | | | |
| | | | | Columbia Law School, Professor of Law (2008 – 2013) |
| | | | | |
| | | | | Office of Counsel to the President, The White House, Associate Counsel to the President (2009) |
| | | | | |
| Leon M. Pollack (73) | | Director
(August 2006) | | Private Investor |
| | | | | |
| Richard Reiss, Jr. (70) | | Director
(April 1997) | | Georgica Advisors LLC, an investment manager, Chairman (1997 – present) |
| | | | | O’Charley’s, Inc., a restaurant chain, Director (1984 – 2012) |
| | | | | |
| Robert M. Solmson (66) | | Director
(September 2004) | | Fairwood Capital, LLC, a private investment corporation engaged primarily in real estate and hotel investments, President (2008 – present) |
| | | | | |
| Interested Directors(4): | | | | |
| Charles L. Carroll (53) | | Chief Executive Officer,
President and Director
(June 2004) | | Investment Manager, Deputy Chairman and Head of Global Marketing (2004 – present) |
| | | | | |
| Ashish Bhutani (54) | | Director
(July 2005) | | Investment Manager, Chief Executive Officer (2004 – present) |
| | | | | Lazard Ltd, Vice Chairman and Director (2010 – present) |
54 Semi-Annual Report
| (1) | The address of each Director of the Fund is Lazard Asset Management LLC, 30 Rockefeller Plaza, New York, New York 10112-6300. |
| | |
| (2) | Each Director serves as a Director for each of the Lazard Funds (comprised of, as of July 31, 2014, 33 active investment portfolios). Each Director serves an indefinite term, until his or her successor is elected, and each Director serves in the same capacity for the other Lazard Funds. All of the Independent Directors (as defined below) are also board members of Lazard Alternative Strategies 1099 Fund, a closed-end registered management investment company advised by an affiliate of the Investment Manager. |
| | |
| (3) | “Independent Directors” are not “interested persons” (as defined in the Act) of the Fund. |
| | |
| (4) | Messrs. Bhutani and Carroll are “interested persons” (as defined in the Act) of the Fund because of their positions with the Investment Manager. |
The Fund’s Statement of Additional Information contains further information about the Directors and is available without charge by calling 800-823-6300, or online, at www.LazardNet.com.
Semi-Annual Report 55
| Name (Age) | | Position(s) with the Fund | | |
| Address(1) | | (Since) and Term(2) | | Principal Occupation(s) During the Past Five Years |
| Officers(3): | | | | |
| Nathan A. Paul (41) | | Vice President and Secretary
(April 2002) | | Managing Director and General Counsel of the Investment Manager |
| | | | | |
| Stephen St. Clair (55) | | Treasurer
(May 2003) | | Vice President of the Investment Manager |
| | | | | |
| Tamar Goldstein (39) | | Interim Chief Compliance Officer (July 2014) and Assistant Secretary
(February 2009) | | Senior Vice President (since February 2012, previously Vice President) of the Investment Manager |
| | | | | |
| Cesar A. Trelles (39) | | Assistant Treasurer
(December 2004) | | Vice President (since February 2011, previously Fund Administration Manager) of the Investment Manager |
| (1) | The address of each officer of the Fund is Lazard Asset Management LLC, 30 Rockefeller Plaza, New York, New York 10112-6300. |
| (2) | Each officer serves for an indefinite term, until his or her successor is elected and qualifies or until his or her earlier resignation or removal. Each officer serves in the same capacity for the other Lazard Funds. |
| (3) | In addition to Charles L. Carroll, President, whose information is included in the Interested Directors section. |
56 Semi-Annual Report
| |
| |
| Lazard Retirement Series, Inc. Other Information (unaudited) |
| |
Proxy Voting
A description of the policies and procedures used to determine how proxies relating to Fund portfolio securities are voted is available (1) without charge, upon request, by calling (800) 823-6300 or (2) on the Securities and Exchange Commission (the “SEC”) website at http://www.sec.gov.
The Fund’s proxy voting record for the most recent 12-month period ended June 30 is available (1) without charge, upon request, by calling (800) 823-6300 or (2) on the SEC’s website at http://www.sec.gov. Information as of June 30 each year will generally be available by the following August 31.
Form N-Q
The Fund files a complete schedule of each Portfolio’s holdings for the first and third quarters of its fiscal year with the SEC on Form N-Q. The Fund’s Forms N-Q are available on the SEC’s website at http://www.sec.gov and may be reviewed and copied at the SEC’s Public Reference Room in Washington, D.C. Information on the operation of the SEC’s Public Reference Room may be obtained by calling 1-800-SEC-0330.
Board Consideration of Management Agreement
Lazard Retirement Emerging Markets Income Portfolio and Lazard Retirement Fundamental Long/Short Portfolio
At a meeting of the Board held on February 26, 2014 (the “February Meeting”), the Board considered matters in connection with the approval of the Management Agreement between the Fund, on behalf of Lazard Retirement Fundamental Long/Short Portfolio (the “Long/Short Portfolio”) and Lazard Retirement Emerging Markets Income Portfolio (the “Emerging Markets Income Portfolio” and, together with the Long/Short Portfolio, the “April Portfolios”), and the Investment Manager. At a meeting of the Board held on April 10, 2014 (the “April Meeting”), the Board further considered matters in connection with the approval of the Management Agreement between the Fund, on behalf of the Long/Short Portfolio, and the Investment Manager. The Independent Directors were assisted in their review by independent legal counsel and met with counsel in executive session separate from representatives of the Investment Manager.
February Meeting
Services Provided (both April Portfolios)
Representatives of the Investment Manager discussed with the Board the Investment Manager’s written presentation provided in advance of the meeting addressing, among other matters, the nature, extent and quality of services provided to the Fund by the Investment Manager, including a discussion of the Investment Manager and its clients (of which the existing Lazard Funds complex of 34 active funds comprised approximately $24 billion of the approximately $187 billion of total assets under the management of the Investment Manager and its global subsidiaries as of December 31, 2013); the Investment Manager’s global investment management platform, technology, operational and legal and compliance support and significant marketing infrastructure across broad distribution channels; and the Investment Manager��s personnel, resources, financial condition and experience. The Board received a presentation on the April Portfolios from members of the April Portfolios’ proposed portfolio management teams, including the strategies to be employed for the April Portfolios and the April Portfolios’ portfolio management teams, including professional biographies.
The Directors considered the various services to be provided by the Investment Manager including the Investment Manager’s research and portfolio management capabilities and oversight of day-to-day operations, including supervision of fund accounting and administration-related services and assistance in meeting legal and regulatory requirements. The Directors also considered the Investment Manager’s infrastructure and agreed that the April Portfolios were expected to benefit from the services and infrastructure provided by the Investment Manager. The Directors accepted management’s assertion that such services and infrastructure would be greater than those typically provided to a $24 billion fund complex not managed by a large, global firm such as the Investment Manager.
Comparative Management Fee, Expense Ratio and Performance Information
The Directors reviewed comparative management fee and expense ratio information prepared by Lipper, Inc. (“Lipper”) noting the limitations of the comparison group for the Emerging Markets Income Portfolio (the “EMI Group”). For the Long/Short Portfolio, it was determined that the Investment Manager would obtain an additional comparative
Semi-Annual Report 57
analysis from Strategic Insight that was more appropriate to the strategy of the Long/Short Portfolio, as the Investment Manager believed that many of the peer funds selected for the Long/Short Portfolio by Lipper were not appropriate comparisons because Lipper had included funds other than “pure” long/short funds. The Directors determined to consider the Management Agreement with respect to the Long/Short Portfolio at the April Meeting.
Management Fee and Expense Ratios. Representatives of the Investment Manager reviewed the proposed management fee and anticipated expense ratio for the Emerging Markets Income Portfolio and the comparisons provided by Lipper, which compared contractual management fees and expense ratios for the Emerging Markets Income Portfolio to the EMI Group and comparison universe (the “EMI Universe”), and the Directors noted the methodology and assumptions used by Lipper, including that the management fee comparisons and the rankings used therein include administrative fees (which are paid to the Fund’s third party administrator that is not affiliated with the Investment Manager). The proposed management fee for the Emerging Markets Income Portfolio was above the EMI Group median for Service Shares (approximately nine basis points). The net expense ratio for the Emerging Markets Income Portfolio was above the EMI Group and EMI Universe medians for Service Shares but was within the range of the net expense ratios of other funds in the EMI Group and EMI Universe.
The Directors also received information regarding advisory fees charged to the other the Investment Manager client accounts with investment objectives, policies and strategies similar to those of the Emerging Markets Income Portfolio and considered the relevance of this fee information.
Performance (both April Portfolios). The Directors were provided with composite performance information for the Investment Manager’s emerging income and emerging markets currency income strategies and a proprietary account managed in the Investment Manager’s long/short strategy.
Investment Manager Profitability and Economies of Scale (Emerging Markets Income Portfolio only)
Representatives of the Investment Manager referred to previous discussions regarding considerations of profitability and economies of scale in respect of the Fund’s existing
Portfolios and noted that because the Emerging Markets Income Portfolio is newly formed, has not commenced operations and the eventual amount of the Emerging Markets Income Portfolio’s assets is uncertain, specific information concerning the cost of services to be provided to the Emerging Markets Income Portfolio and the expected profits to be realized by the Investment Manager and its affiliates from their relationships with the Emerging Markets Income Portfolio and economies of scale would be subject to a number of assumptions and would be speculative and not meaningful. The Investment Manager’s representatives stated that they did not expect the Investment Manager to realize any current profits on the Emerging Markets Income Portfolio initially, noting the Investment Manager’s agreement to waive its fees and/or reimburse the Emerging Markets Income Portfolio for at least two years following the Emerging Markets Income Portfolio’s commencement of operations to maintain the expense ratios reflected in the Lipper materials. The Board determined to revisit this issue no later than when it next reviewed the investment management fee in connection with renewal of the Management Agreement. The Investment Manager’s representatives noted that neither the Investment Manager nor its affiliates were expected to receive any significant indirect benefits from the Investment Manager acting as investment adviser to the Emerging Markets Income Portfolio. The Investment Manager’s representatives referenced information previously provided on the Investment Manager’s brokerage and soft dollar practices. The representatives of the Investment Manager stated that the Investment Manager intends to support distribution relationships through direct payments from its or its affiliates’ own resources to third parties in connection with distribution and shareholder servicing and/or administrative and recordkeeping services, and noted that the Emerging Markets Income Portfolio would not bear any related costs other than the 0.25% 12b-1 fee pursuant to the Plan adopted for the Emerging Markets Income Portfolio’s Service Shares.
At the conclusion of these discussions, each of the Directors expressed the opinion that he or she had been furnished with sufficient information to make an informed business decision with respect to the approval of the Management Agreement with respect to the Emerging Markets Income Portfolio. Based on its discussions and considerations as described above, the Board made the following conclusions and determinations with regard to the Management Agreement:
58 Semi-Annual Report
| • | The Board concluded that the nature, extent and quality of the services to be provided by the Investment Manager are adequate and appropriate, noting the benefits of advisory and research and other services and infrastructure (as discussed above) associated with an approximately $187 billion global asset management business. |
| | |
| • | The Board was satisfied with the resources the Investment Manager was to devote to management of the April Portfolios. |
| | |
| • | The Board concluded that the Emerging Markets Income Portfolio’s fees to be paid to the Investment Manager were reasonable in light of the considerations discussed above. |
| | |
| • | The Board recognized that economies of scale may be realized as the assets of the Emerging Markets Income Portfolio increases. The Board determined it would seek to have the Investment Manager share any material economies of scale with the Emerging Markets Income Portfolio. |
The Board considered these conclusions and determinations in their totality and, without any one factor being dispositive, determined that approval of the Fund’s Management Agreement for the Emerging Markets Income Portfolio was in the best interests of the Emerging Markets Income Portfolio.
April Meeting
Comparative Management Fee and Expense Ratio Information
Representatives of the Investment Manager reviewed the proposed management fee and anticipated expense ratio for the Long/Short Portfolio and the comparisons provided by Strategic Insight, which compared contractual management fees and expense ratios for the Long/Short Portfolio to its respective expense groups of peer funds (the “Long/Short Group”), and the Directors noted the methodology and assumptions used by Strategic Insight, including that the management fee comparisons and the rankings used therein include administrative fees (which are paid to the Fund’s third party administrator that is not affiliated with the Investment Manager). The proposed management fee for the Long/Short Portfolio was slightly below the Long/Short Group median for Investor Shares and four basis points above the Long/Short Group median for Service Shares.
The net expense ratios for the Long/Short Portfolio were below the respective Long/Short Group median for each share class.
There were no other fee-paying client accounts managed by the Investment Manager with investment objectives, policies and strategies similar to those of the Long/Short Portfolio.
Investment Manager Profitability and Economies of Scale
Representatives of the Investment Manager referred to previous discussions regarding considerations of profitability and economies of scale in respect of the Fund’s existing Portfolios and noted that because the Long/Short Portfolio is newly formed, has not commenced operations and the eventual amount of the Long/Short Portfolio’s assets is uncertain, specific information concerning the cost of services to be provided to the Long/Short Portfolio and the expected profits to be realized by the Investment Manager and its affiliates from their relationships with the Long/Short Portfolio and economies of scale would be subject to a number of assumptions and would be speculative and not meaningful. The Investment Manager’s representatives stated that they did not expect the Investment Manager to realize any current profits on the Long/Short Portfolio initially, noting the Investment Manager’s agreement to waive its fees and/or reimburse Long/Short Portfolio for at least two years following the Long/Short Portfolio’s commencement of operations to maintain the expense ratios reflected in the Strategic Insight materials. The Board determined to revisit this issue no later than when it next reviewed the investment management fee in connection with renewal of the Management Agreement. The Investment Manager’s representatives noted that neither the Investment Manager nor its affiliates were expected to receive any significant indirect benefits from the Investment Manager acting as investment adviser to the Long/Short Portfolio. The Investment Manager’s representatives referenced information previously provided on the Investment Manager’s brokerage and soft dollar practices. The representatives of the Investment Manager stated that the Investment Manager intends to support distribution relationships through direct payments from its or its affiliates’ own resources to third parties in connection with distribution and shareholder servicing and/or administrative and recordkeeping services, and noted that the Long/Short Portfolio would not bear any related costs other than the 0.25% 12b-1 fee pursuant to the Plan adopted for the Long/Short Portfolio’s Service Shares.
Semi-Annual Report 59
At the conclusion of these discussions, each of the Directors expressed the opinion that he or she had been furnished with sufficient information to make an informed business decision with respect to the approval of the Management Agreement with respect to the Long/Short Portfolio. Based on its discussions and considerations as described above and at the February Meeting, the Board made the following conclusions and determinations with regard to the Management Agreement:
| • | The Board concluded that the Long/Short Portfolio’s fees to be paid to the Investment Manager were reasonable in light of the considerations discussed above. |
| | |
| • | The Board recognized that economies of scale may be realized as the assets of the Long/Short Portfolio increase. The Board determined it would seek to have the Investment Manager share any material economies of scale with the Long/Short Portfolio. |
The Board considered these conclusions and determinations in their totality and, without any one factor being dispositive, determined that approval of the Fund’s Management Agreement for the Long/Short Portfolio was in the best interests of the Long/Short Portfolio.
All Portfolios except Lazard Retirement Fundamental Long/Short Portfolio, Lazard Retirement International Equity Concentrated Portfolio, Lazard Retirement Global Strategic Equity Portfolio and Lazard Retirement Emerging Markets Income Portfolio
At a meeting of the Board held on June 24-25, 2014, the Board considered the approval, for an additional annual period, of the Management Agreement between the Fund, on behalf of its Portfolios, and the Investment Manager. The Independent Directors were assisted in their review by independent legal counsel and met with counsel in executive session separate from representatives of the Investment Manager.
Services Provided
Representatives of the Investment Manager discussed with the Board the Investment Manager’s written presentation provided in advance of the meeting addressing, among other matters, the nature, extent and quality of services that the Investment Manager provides the Fund, including a discussion of the Investment Manager and its clients (of which the
Lazard Funds complex of 34 active funds comprised approximately $25 billion (as of April 30, 2014) of the approximately $169.5 billion of total assets under the management of the Investment Manager and its global affiliates as of March 31, 2014). The Investment Manager’s representatives noted that the Investment Manager believes that the Fund continues to benefit significantly from the infrastructure and services provided by the Investment Manager’s global investment management platform, technology, operational and legal and compliance support and significant marketing infrastructure across broad distribution channels. The Directors also considered information provided by the Investment Manager regarding its personnel, resources, financial condition and experience; the Fund’s distribution channels and the relationships with various intermediaries; marketing activities on behalf of the Portfolios; and Portfolio asset flows and the growth or decline in asset levels.
The Directors considered the various services provided by the Investment Manager including the Investment Manager’s research and portfolio management capabilities and oversight of day-to-day operations, including supervision of fund accounting and administration-related services and assistance in meeting legal and regulatory requirements. The Directors also considered the Investment Manager’s infrastructure and agreed that the Fund benefits from the services and infrastructure provided by the Investment Manager. The Directors accepted management’s assertion that such services and infrastructure are greater than those typically provided to a $25 billion fund complex not managed by a large, global firm such as the Investment Manager.
Comparative Management Fee, Expense Ratio and Performance Information
The Directors reviewed comparative management fee, expense ratio and performance (through March 31, 2014) information prepared by Strategic Insight, noting the limitations of certain Strategic Insight comparison groups (each, a “Group”) and broader Morningstar categories (each, a “Category”).
Management Fees and Expense Ratios. The Directors discussed the management fees and expense ratios for each Portfolio. They noted the methodology and assumptions used by Strategic Insight, including that management fee comparisons for the Portfolios and the rankings used therein include administrative fees (which, for the Portfolios, include a fixed dollar fee paid to the Fund’s third party administra-
60 Semi-Annual Report
tor that is not affiliated with the Investment Manager). The Directors acknowledged that, for smaller Portfolios, the fixed dollar administrative fee may have a more significant impact on the contractual management fee.
In reviewing Strategic Insight’s analysis (which was for the Service Shares class of all Portfolios except for the Emerging Markets Equity Portfolio, which has both Service and Investor Shares classes), it was noted that, except for the US Strategic Equity, US Small-Mid Cap Equity, Global Dynamic Multi Asset, International Equity Select and Capital Allocator Opportunistic Strategies Portfolios (of which the International Equity Select and Capital Allocator Opportunistic Strategies Portfolios are not active Portfolios), contractual management fees were lower than each Portfolio’s relevant Group median and that, for the active Portfolios, total expenses were below or only slightly above the median of the relevant Group, except for the US Small-Mid Cap Equity Portfolio, which was significantly smaller than another other fund in its Group. For the US Strategic Equity and US Small-Mid Cap Equity Portfolios, it was noted that the contractual advisory fee was at the medians, and for the Global Dynamic Multi Asset Portfolio it was noted that the contractual advisory fee was more competitive with the median. The Directors considered that the Investment Manager continues to voluntarily enter into fee waiver and expense reimbursement agreements for all of the active Portfolios and that for certain of these Portfolios the Investment Manager was waiving management fees and/or reimbursing expenses.
The Directors also considered management fees paid to the Investment Manager by funds advised or sub-advised by the Investment Manager utilizing the same investment strategies as the Portfolios, as well as the Investment Manager’s separately managed accounts with similar investment objectives, policies and strategies (for each Portfolio, collectively with such funds, “Similar Accounts”). The Directors discussed the fees paid to the Investment Manager by the Fund’s Portfolios compared to the fees paid to the Investment Manager by Similar Accounts. Representatives of the Investment Manager discussed the nature of the Similar Accounts and the extensive differences, from the Investment Manager’s perspective, in services provided to the different types of Similar Accounts as compared to the services provided to the Portfolios. The Directors considered the relevance of the fee information provided for Similar Accounts
managed by the Investment Manager, in light of the significant differences in services provided, to evaluate the appropriateness and reasonableness of the Portfolios’ management fees.
Performance. Strategic Insight’s performance analyses compared each Portfolio’s investment returns to those of the funds in the relevant Group and Category over measurement periods up to ten years through March 31, 2014.
The Directors noted that performance of the Emerging Markets Equity Portfolio was above the Group and Category medians in all periods (first quartile in all periods except one); performance of the International Equity Portfolio was at or near the Group and Category medians in all periods; performance of the Global Dynamic Multi Asset Portfolio was above the Group and Category medians for the one year period (but below year-to-date in 2014); US Small-Mid Cap Equity Portfolio was below the Group and Category medians in most periods but above median in the one-year period and year-to-date in 2014; and the US Strategic Equity Portfolio was below median in all periods except year-to-date in 2014, when it was above the Category median and only slightly below the Group median.
At the meeting, the Directors received and would continue to receive regular updates on the Investment Manager’s efforts in respect of underperforming Portfolios.
Investment Manager Profitability and Economies of Scale
The Directors reviewed information prepared by the Investment Manager for each Portfolio concerning profits realized by the Investment Manager and its affiliates resulting from the Management Agreement, calculated using the actual revenues received for the calendar year ended December 31, 2013 and the Investment Manager’s cost allocation methodology to compute an estimate of each Portfolio’s expenses. The Investment Manager’s representatives stated that neither the Investment Manager nor its affiliates receive any significant indirect benefits from the Investment Manager acting as investment adviser to the Portfolios. The Investment Manager’s representatives stated that the broker-dealer that is treated as an affiliate of the Investment Manager did not effect trades for the Portfolios in the period under review, and the Investment Manager did not benefit from money flow (float) in connection with transactions in the Portfolios’ shares. The Investment Manager’s representatives reviewed
Semi-Annual Report 61
with the Board information provided on the Investment Manager’s brokerage practices and the Portfolios’ brokerage allocation, commission payments and soft dollar commissions and benefits. The representatives of the Investment Manager reminded the Board that the Investment Manager is continuing to support distribution relationships through direct payments from its or its affiliates’ own resources to third parties in connection with distribution and shareholder servicing and/or administrative and recordkeeping services, and noted that the Fund does not bear any related costs other than the 0.25% 12b-1 fee pursuant to the Distribution and Servicing Plan adopted for the Portfolios’ Service Shares.
The profitability percentages were within ranges determined by relevant court cases not to be so disproportionately large that they bore no reasonable relationship to the services rendered. Representatives of the Investment Manager stated that the Investment Manager believed the profits are not unreasonable in light of the services provided and other factors. The Directors considered the Investment Manager’s estimated profitability with respect to each Portfolio as part of their evaluation of whether the Portfolio’s fee under the Management Agreement bears a reasonable relationship to the mix of services provided by the Investment Manager, including the nature, extent and quality of such services, and evaluated profitability in light of the relevant circumstances for each Portfolio, including the size of each Portfolio and the trend in asset growth or decline. Representatives of the Investment Manager and the Directors discussed ways economies of scale could be realized and how they could be shared, including the Investment Manager’s reinvestment of money back into its business, waiving or reimbursing Portfolio expenses, adding discounts to a Portfolio’s management fee schedule as a Portfolio’s assets increase or by instituting relatively low management fees from inception. It was noted that, for Portfolios with declining or stable assets or a low level of assets, the extent to which the Investment Manager may have realized any economies of scale would be reduced.
At the conclusion of these discussions, each of the Directors expressed the opinion that he or she had been furnished with sufficient information to make an informed business decision with respect to the renewal of the Management Agreement. Based on its discussions and considerations as described above, the Board made the following conclusions and determinations.
| • | The Board concluded that the nature, extent and quality of the services provided by the Investment Manager are adequate and appropriate, noting the benefits of advisory and research services and other services and infrastructure (as discussed above) associated with an approximately $169.5 billion global asset management business. |
| • | The Board was generally satisfied with the overall performance of most of the Portfolios, but would continue to monitor performance of the Portfolios that were not generally above or competitive with Group or Category medians. |
| • | The Board concluded that each Portfolio’s fee paid to the Investment Manager was reasonable in light of the considerations discussed above. |
| • | The Board recognized that economies of scale may be realized as the assets of the Portfolios increase and determined that they would continue to consider potential material economies of scale. |
The Board considered these conclusions and determinations in their totality and, without any one factor being dispositive, determined that approval of the Management Agreement for the Fund, on behalf of each Portfolio, was in the best interests of the Portfolio.
Lazard Retirement International Equity Concentrated Portfolio and Lazard Retirement Global Strategic Equity Portfolio
At a meeting of the Fund’s Board held on June 24-25, 2014, the Board considered the approval of the Management Agreement between the Fund, on behalf of Lazard Retirement International Equity Concentrated Portfolio and Lazard Retirement Global Strategic Equity Portfolio (the “June Portfolios”), and the Investment Manager. The Independent Directors were assisted in their review by independent legal counsel and met with counsel in executive session separate from representatives of the Investment Manager.
Services Provided
Representatives of the Investment Manager discussed with the Board the Investment Manager’s written presentation provided in advance of the meeting addressing, among other matters, the nature, extent and quality of services provided to the Fund by the Investment Manager, including a discus-
62 Semi-Annual Report
sion of the Investment Manager and its clients (of which the existing Lazard Funds complex of 34 active funds comprised approximately $25 billion (as of April 30, 2014) of the approximately $169.5 billion of total assets under the management of the Investment Manager and its global affiliates as of March 31, 2014); the Investment Manager’s global investment management platform, technology, operational and legal and compliance support and significant marketing infrastructure across broad distribution channels; and the Investment Manager’s personnel, resources, financial condition and experience. The Board received a presentation on the June Portfolios from members of the June Portfolios’ proposed portfolio management teams, including the strategies to be employed for the June Portfolios and the June Portfolios’ portfolio management teams, including professional biographies.
The Directors considered the various services to be provided by the Investment Manager including the Investment Manager’s research and portfolio management capabilities and oversight of day-to-day operations, including supervision of fund accounting and administration-related services and assistance in meeting legal and regulatory requirements. The Directors also considered the Investment Manager’s infrastructure and agreed that the June Portfolios were expected to benefit from the services and infrastructure provided by the Investment Manager. The Directors accepted management’s assertion that such services and infrastructure would be greater than those typically provided to a $25 billion fund complex not managed by a large, global firm such as the Investment Manager.
Comparative Management Fee, Expense Ratio and Performance Information
The Directors reviewed comparative management fee and expense ratio information prepared by Strategic Insight.
Management Fee and Expense Ratios. Representatives of the Investment Manager reviewed the proposed management fee and anticipated expense ratios for the June Portfolios and the comparisons provided by Strategic Insight, which compared management fees and expense ratios for each June Portfolio to its respective Groups and Category, and the Directors noted the methodology and assumptions used by Strategic Insight, including that the management fee comparisons and the rankings used therein include administrative fees (which are paid to the Fund’s third party admin-
istrator that is not affiliated with the Investment Manager). For the Global Strategic Equity Portfolio, the proposed contractual management fee was below the Group median and above the Category median (third quartile), and the estimated expense ratio was above the Group and Category medians (fourth quartile). For the International Equity Concentrated Portfolio, the proposed contractual management fee was above the Group median (by three basis points) and above the Category median (fourth quartile) and the estimated expense ratio was above the Group and Category medians (fourth quartile). The Directors also reviewed information regarding advisory fees charged to Similar Accounts and considered the relevance of this fee information.
Performance. Since the June Portfolios had not yet commenced operations, there was no performance of the June Portfolios for the Directors to consider. The Directors were provided with performance information for the Investment Manager’s global strategic equity and international equity concentrated strategies, and it was noted that the international equity concentrated performance was for a single account funded by the Investment Manager with approximately $1.5 million in assets.
Investment Manager Profitability and Economies of Scale
Representatives of the Investment Manager referred to recent discussions regarding considerations of profitability and economies of scale in respect of the Fund’s existing Portfolios and noted that because the June Portfolios are newly formed, have not commenced operations and the eventual aggregate amount of the June Portfolios’ assets was uncertain, specific information concerning the cost of services to be provided to the June Portfolios and the expected profits to be realized by the Investment Manager and its affiliates from their relationships with the June Portfolios and economies of scale would be subject to a number of assumptions and would be speculative and not meaningful. The Investment Manager’s representatives stated that they did not expect the Investment Manager to realize any current profits on the June Portfolios initially, noting the Investment Manager’s agreement to waive its fees and/or reimburse each June Portfolio for at least two years following the June Portfolio’s commencement of operations to maintain the expense ratios reflected in the Strategic Insight materials. The Board determined to revisit this issue no later than when it next reviewed the investment management fee in connection with renewal of the Management Agreement. The In-
Semi-Annual Report 63
vestment Manager representatives noted that neither the Investment Manager nor its affiliates were expected to receive any significant indirect benefits from the Investment Manager acting as investment adviser to the June Portfolios. The Investment Manager’s representatives reviewed with the Board information provided on the Investment Manager’s brokerage and soft dollar practices. The representatives of the Investment Manager stated that the Investment Manager intends to support distribution relationships through direct payments from its or its affiliates’ own resources to third parties in connection with distribution and shareholder servicing and/or administrative and recordkeeping services, and noted that the June Portfolios would not bear any related costs other than the 0.25% 12b-1 fee pursuant to the Distribution and Servicing Plan adopted for the June Portfolios’ Service Shares.
At the conclusion of these discussions, each of the Directors expressed the opinion that he or she had been furnished with sufficient information to make an informed business decision with respect to the approval of the Management Agreement with respect to the June Portfolios. Based on its discussions and considerations as described above, the Board made the following conclusions and determinations with regard to the Management Agreement for each June Portfolio:
| • | The Board concluded that the nature, extent and quality of the services to be provided by the Investment Manager are adequate and appropriate, noting the benefits of advisory and research and other services and infrastructure (as discussed above) associated with an approximately $169.5 billion global asset management business. |
| | |
| • | The Board was satisfied with the resources the Investment Manager was to devote to management of the June Portfolios. |
| | |
| • | The Board concluded that the June Portfolio’s fees to be paid to the Investment Manager were reasonable in light of the considerations discussed above. |
| | |
| • | The Board recognized that economies of scale may be realized as the assets of the June Portfolios increase. The Board determined it would seek to have the Investment Manager share any material economies of scale with the June Portfolios. |
The Board considered these conclusions and determinations in their totality and, without any one factor being dispositive, determined that approval of the Fund’s Management Agreement for the June Portfolios was in the best interests of the June Portfolios.
64 Semi-Annual Report
Lazard Retirement Series, Inc.
30 Rockefeller Plaza
New York, New York 10112-6300
Telephone: 800-823-6300
http://www.LazardNet.com
Investment Manager
Lazard Asset Management LLC
30 Rockefeller Plaza
New York, New York 10112-6300
Telephone: 800-823-6300
Distributor
Lazard Asset Management Securities LLC
30 Rockefeller Plaza
New York, New York 10112-6300
Custodian
State Street Bank and Trust Company
One Iron Street
Boston, Massachusetts 02210
Transfer Agent and Dividend Disbursing Agent
Boston Financial Data Services, Inc.
P.O. Box 8514
Boston, Massachusetts 02266-8514
Telephone: 800-986-3455
Independent Registered Public Accounting Firm
Deloitte & Touche LLP
30 Rockefeller Plaza
New York, New York 10112-0015
Legal Counsel
Stroock & Stroock & Lavan LLP
180 Maiden Lane
New York, New York 10038-4982
http://www.stroock.com
Performance information as of the most recent month end is available online at www.LazardNet.com.
| Lazard Asset Management LLC • 30 Rockefeller Plaza • New York NY 10112 • www.lazardnet.com |  |
LZDPS010
ITEM 2. CODE OF ETHICS.
Not applicable.
ITEM 3. AUDIT COMMITTEE FINANCIAL EXPERT.
Not applicable.
ITEM 4. PRINCIPAL ACCOUNTANT FEES AND SERVICES.
Not applicable.
ITEM 5. AUDIT COMMITTEE OF LISTED REGISTRANTS.
Not applicable.
ITEM 6. INVESTMENTS
Not applicable.
ITEM 7. DISCLOSURE OF PROXY VOTING POLICIES AND PROCEDURES FOR CLOSED END MANAGEMENT INVESTMENT COMPANIES.
Not applicable.
ITEM 8. PORTFOLIO MANAGERS OF CLOSED-END MANAGEMENT INVESTMENT COMPANIES.
Not applicable.
ITEM 9. PURCHASES OF EQUITY SECURITIES BY CLOSED-END MANAGEMENT INVESTMENT COMPANY AND AFFILIATED PURCHASERS.
Not applicable.
ITEM 10. SUBMISSION OF MATTERS TO A VOTE OF SECURITY HOLDERS.
There were no material changes to the procedures by which shareholders may recommend nominees to the Registrant’s Board of Directors during the period covered by this report.
ITEM 11. CONTROLS AND PROCEDURES.
(a) The Registrant’s principal executive and principal financial officers have concluded, based on their evaluation of the Registrant’s disclosure controls and procedures as of a date within 90 days of the filing date of this report, that the Registrant’s disclosure controls and procedures are reasonably designed to ensure that information required to be disclosed by the Registrant on Form N-CSR is recorded, processed, summarized and reported within the required time periods and that information required to be disclosed by the Registrant in the reports that it files or submits on Form N-CSR is accumulated and communicated to the Registrant’s management, including its principal executive and principal financial officers, as appropriate to allow timely decisions regarding required disclosure.
(b) There were no changes to the Registrant’s internal control over financial reporting that occurred during the second fiscal quarter of the period covered by this report that have materially affected, or are reasonably likely to materially affect, the Registrant’s internal control over financial reporting.
ITEM 12. EXHIBITS.
(a)(1) Not applicable.
(a)(2) Certifications of principal executive and principal financial officers as required by Rule 30a-2(a) under the Investment Company Act of 1940.
(a)(3) Not applicable.
(b) Certifications of principal executive and principal financial officers as required by Rule 30a-2(b) under the Investment Company Act of 1940.
SIGNATURES
Pursuant to the requirements of the Securities Exchange Act of 1934 and the Investment Company Act of 1940, the registrant has duly caused this report to be signed on its behalf by the undersigned, thereunto duly authorized.
Lazard Retirement Series, Inc.
| By | /s/ Charles L. Carroll |
| | Charles L. Carroll |
| | Chief Executive Officer |
| | |
| Date | September 5, 2014 |
Pursuant to the requirements of the Securities Exchange Act of 1934 and the Investment Company Act of 1940, this report has been signed below by the following persons on behalf of the registrant and in the capacities and on the dates indicated.
| By | /s/ Charles L. Carroll |
| | Charles L. Carroll |
| | Chief Executive Officer |
| | |
| Date | September 5, 2014 |
| | |
| By | /s/ Stephen St. Clair |
| | Stephen St. Clair |
| | Chief Financial Officer |
| | |
| Date | September 5, 2014 |