UNITED STATES
SECURITIES AND EXCHANGE COMMISSION
Washington, D.C. 20549
FORM N-CSR
CERTIFIED SHAREHOLDER REPORT OF REGISTERED
MANAGEMENT INVESTMENT COMPANIES
Investment Company Act file number | 811-8059 |
|
Cohen & Steers Realty Focus Fund, Inc. |
(Exact name of registrant as specified in charter) |
|
280 Park Avenue, New York, NY | | 10017 |
(Address of principal executive offices) | | (Zip code) |
|
Adam M. Derechin
Cohen & Steers Capital Management, Inc.
280 Park Avenue
New York, New York 10017 |
(Name and address of agent for service) |
|
Registrant’s telephone number, including area code: | (212) 832-3232 | |
|
Date of fiscal year end: | December 31 | |
|
Date of reporting period: | December 31, 2005 | |
| | | | | | | | |
Item 1. Reports to Stockholders.
COHEN & STEERS REALTY FOCUS FUND, INC.
February 9, 2006
To Our Shareholders:
We are pleased to submit to you our report for the six months and year ended December 31, 2005. The net asset values per share at that date were $58.90, $58.74, and $58.78 for Class A, Class B, and Class C shares, respectively. Class I shares had a net asset value of $59.09. In addition, semiannual dividends were declared for shareholders of record on December 22, 2005 and paid on December 23, 2005 in the amounts per share for Class A, B, C and I shares of $0.722, $0.557, $0.557, and $0.791, respectively. a
Investment Review
The total return, including income and change in net asset value, for the Cohen & Steers Realty Focus Fund and the comparative benchmarks were:
| | | Six Months Ended
12/31/05 | | Year-Ended
12/31/05 | |
| Cohen & Steers Realty Focus Fund—Class A | | | 5.54 | % | | | 13.87 | % | |
| Cohen & Steers Realty Focus Fund—Class B | | | 5.19 | % | | | 12.99 | % | |
| Cohen & Steers Realty Focus Fund—Class C | | | 5.23 | % | | | 13.07 | % | |
| Cohen & Steers Realty Focus Fund—Class I | | | 5.74 | % | | | 14.41 | % | |
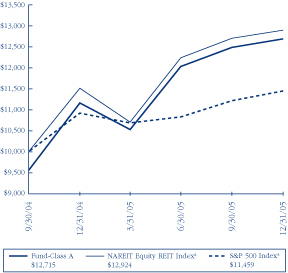
| NAREIT Equity REIT Indexb | | | 5.44 | % | | | 12.16 | % | |
| S&P 500 Indexb | | | 5.77 | % | | | 4.91 | % | |
The performance data quoted represent past performance. Past performance is no guarantee of future results. The investment return and the principal value of an investment will fluctuate and shares, if redeemed, may be worth more or less than their original cost. Current performance may be lower or higher than the performance data quoted. Total returns of the fund current to the most recent month-end can be obtained by visiting our Web site at cohenandsteers.com. Performance does not include the effect of sales charges. If sales charges were included, returns would have been lower.
One year ago, in our 2004 year-end letter to clients, we predicted that GDP growth in the 3.5% range and approximately two million new jobs would provide "a continued positive backdrop for real estate fundamentals, characterized by higher occupancies, rents and cash flows for most property types and in most regions of the
a Please note that distributions paid by the fund to shareholders are subject to recharacterization for tax purposes. The final tax treatment of these distributions is reported to shareholders after the close of each fiscal year.
b The NAREIT Equity REIT Index is an unmanaged, market capitalization weighted index of all publicly traded REITs that invest predominantly in the equity ownership of real estate. The index is designed to reflect the performance of all publicly traded equity REITs as a whole. The S&P 500 Index is an unmanaged index of common stocks that is frequently used as a general measure of stock market performance.
1
COHEN & STEERS REALTY FOCUS FUND, INC.
country." Additionally, we expressed our belief that "REIT cash flows and dividends will continue their re-acceleration," resulting in "a salutary effect on stock prices." We are pleased to report that these predictions have been realized. The fund was positioned throughout the year to benefit from these factors and therefore experienced an excellent year both in terms of absolute and relative performance, once again outperforming the NAREIT Equity REIT benchmark and the broader stock market by a substantial margin.
As the real estate recovery progressed in 2005, landlords re-acquired pricing power, private market valuations for real estate finally caught up with the public market, and the globalization of real estate securities investing and the proliferation of REIT-like structures around the globe continued. In 2005, an even stronger than expected U.S. economy drove demand for commercial and multi-family residential space, which was well in excess of the growth in available supply, resulting in higher occupancy levels and rising rents in most markets throughout the country. What is particularly noteworthy is that the improving real estate market conditions generally accelerated throughout the year. For example, reported rental income from apartment REITs and office rents nationally grew at a faster rate in the fourth quarter of 2005 than in the first three quarters.
The momentum and increasing visibility of the real estate recovery has had the effect of attracting an ever-growing backlog of private capital targeted at direct real estate investments. Not surprisingly, this capital flow had a direct impact on the REIT market in 2005 as seven public REITs were taken private in transactions totaling $19.5 billion in value (these transactions generated an average premium to the current share price of 11.9%), highlighting what we see as the underlying attractiveness of the real estate portfolios owned within the REIT sector. In our view, the premiums paid for these companies reflected not only the real estate owned by these companies, but also the proprietary future growth opportunities and management skill sets that some of these companies possessed.
Finally, no synopsis of the REIT market in 2005 would be complete without noting the explosion of cross-border capital flows within what is becoming a truly worldwide real estate securities market. U.S. companies are investing in global real estate and non-U.S. companies are investing in U.S. real estate. Likewise, many U.S. institutions that currently maintain a U.S. REIT allocation are examining the possibility of adding an international real estate securities allocation. We believe that this process will accelerate. Significant IPO and securitization activity took place as property investors availed themselves of the benefits of the public REIT format. In November, the largest-ever IPO of a REIT took place in Hong Kong when the Hong Kong government sold $3 billion in the stock of the Link REIT, a major owner of urban retail shopping centers. A potentially major catalyst for 2006 will be the likely creation of a REIT-like structure in both Germany and the U.K., two of the world's largest economies. Over time, we expect that this will drive an ever-increasing amount of the world's income producing property into publicly traded REIT-like vehicles, furthering the demand for REITs as a sought after asset class on the investment landscape both domestically and abroad.
Looking at property sector performance in 2005, self storage companies led the way with a total return of 26.6%. Self storage emerged as a mainstream commercial property type in 2005. Fundamentals improved as economic activity drove significantly higher demand for storage units, pressuring rental rates higher across the board. Shurgard was one of the best performers in the fund this year, returning 35.0%, benefiting from all these
2
COHEN & STEERS REALTY FOCUS FUND, INC.
trends as well as a buyout offer from industry leader Public Storage, which returned 25.1% this year. Our stock selection and overweight in the self storage sector contributed to our outperformance during the year.
Regional malls, last year's leading performance sector, came in a distant second this year with a 16.5% total return. Retail conditions remained strong throughout the year although investors have become increasingly worried that consumers burdened with higher interest and fuel costs, and without the benefit of continuously skyrocketing home prices, will curtail their spending. General Growth was another of our best performing investments, returning 35.2%. However, our stock selection in this sector was the single greatest detractor from the fund's performance. This resulted primarily from our position in The Mills Corporation, our worst performer this year, which declined 31.3% as a result of company-specific problems relating to an overly aggressive development pipeline.
The industrial and apartment sectors, both cyclical in nature, benefited from a strong economy and generated total returns of 15.4% and 14.7%, respectively, rounding out the top performing REIT sectors. Apartment companies, particularly those in the more dense coastal areas, benefited from declining owned-home affordability. Stock selection in both sectors contributed to our strong relative performance, although our underweight in the industrial sector detracted.
The coastal theme was very powerful in the office markets as well in 2005. Companies concentrated in these areas dramatically outperformed the average office company's total return of 13.1%. Several of our top performing stocks this year, in particular, Kilroy Realty (50.8%), Boston Properties (32.3%) and Brookfield Properties (20.8%) benefited from a very strong office recovery in their respective coastal markets. As a result, our stock selection in the office sector was the top contributor to our relative performance for the year.
Shopping centers turned a major corner in 2005 as the deterioration in the grocery business worsened. A leading sector for the last several years, shopping centers underperformed in 2005, returning 9.3%. Having anticipated these difficulties, we were concentrated in the few shopping center companies that successfully avoided these negative macro-trends and that continued to outperform the REIT benchmark. As a result, our stock selection and underweight in this sector contributed to our outperformance.
Although REIT share prices generally have demonstrated a low correlation to changes in interest rates over time, there are some property types with flatter, more bond-like income streams that may respond negatively to a rising interest rate environment—for example, health care and net-leased free standing retail properties. Both of these sectors performed poorly this year, returning 1.8% and –0.5%, respectively. Our underweight in these sectors and our investments in Ventas (health care; 22.7%) and Alexanders (free standing; 15.7%) contributed to the fund's relative performance.
Manufactured housing was the worst performing REIT sector in 2005, returning –2.6%. Stock selection was a detractor from our relative performance; specifically, Affordable Residential Communities, which declined 30.9%, and Sun Communities (–16.3%). We liquidated our position in Affordable Residential during the year.
3
COHEN & STEERS REALTY FOCUS FUND, INC.
Investment Outlook
Our view of the REIT sector for 2006 is generally similar to our outlook for 2005. We are anticipating steady forward progression in fundamentals for most major property types, driven by continued solid economic growth and restrained new construction. Occupancies and rents should continue to rise as the economic growth creates jobs and increased disposable income, which should drive continued cash flow and dividend growth for REITs. We believe that real estate cycles play out over several years. Historically, once the dynamic in the market for commercial space shifts from a lessees' market to a lessors' market, it has taken a while to reverse. On the other hand, a severe economic slowdown that interrupts demand, or a building boom that creates too much supply could disrupt the positive environment we predict, although in our view, neither of these is likely to occur over the next 18 months.
What we do expect for 2006 is slightly less economic growth than 2005. Due to the lagged impact of higher interest rates, a stronger dollar, higher energy prices and a presumed slowdown in owned-home price increases, which have enhanced consumer spending recently, we are projecting GDP growth in the 2.5% to 3.0% range for 2006.
In our view, another important theme for 2006 will be the rotation in economic strength from the consumer sector to the corporate sector. We believe the consumer slowdown should be replaced by an accelerating corporate sector that has begun ramping up its capital expenditures and hiring activity in the thirst for additional profit opportunities, which are once again available. In our view, this should result in a shift in relative strength among the major REIT property types.
Retail property types (as well as owner-occupied homes, which are not a part of our investment universe) have led the way over the last several years, driven by the strength of consumer spending and investing. While we do not subscribe to the view that the consumer is "tapped out" or is going to "roll over," the rate of growth in consumer spendings should moderate.
At the same time, we believe that accelerated corporate activity should drive revenue growth for offices, industrial warehouses and hotels (where the business traveler is the provider of the marginal dollar of revenue), enabling these property types to challenge the recent years' leadership of retail REIT returns in 2006. Office property is the largest and most important commercial property type in the United States and has the largest representation in the REIT stock indexes. Offices are where our largely service-based economy transacts business. It is therefore instructive to examine how this bellwether property type should typify the continuing real estate recovery. As illustrated in the chart on the next page, vacancy rates in the United States are projected to continue to decline over the next two years, while effective rents are projected to continue to rise.
4
COHEN & STEERS REALTY FOCUS FUND, INC.
U.S. Metro Office Trends
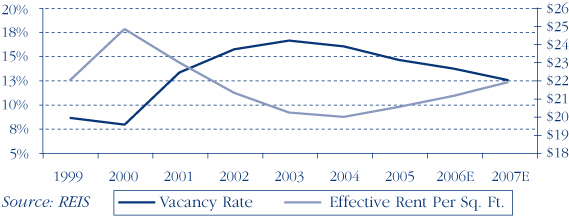
It is important to note that both the downward trend in office vacancies and the upward trend in effective rental rates (the actual economic rent paid, net of concessions) across the United States are well established. Equally importantly, however, the U.S. office market is a long way from the sub-9% vacancy rate and nearly $25 average rents (per square foot) established at the peak of the last cycle in 2000. Rents would have to increase nearly 25% (in nominal dollar terms—that is, ignoring inflation, which has been substantial for all property values as replacement costs for offices and other assets have increased dramatically) from current levels and vacancies would have to decline another six percentage points to achieve the prior peak. We believe this process will take several years, potentially allowing the office sector a longer run in the current cycle.
We believe that rental apartment properties should also benefit from this rotation from the consumer sector to the corporate sector. Higher home prices and interest costs mean that owned housing today is less affordable than at any time in the last 20 years. We believe the percentage of households that rent their homes should continue to rise, driving higher occupancy levels and higher rents for apartments. In addition, continued hiring by corporate America, in our view, will also continue to drive household formation, the other primary driver of apartment demand.
The fund is positioned to benefit from the economic and property-type specific trends we anticipate will unfold during the year. REITs, on average, are trading at very slight premiums to the value of their underlying real estate assets—a historically average level. REIT dividend yields are lower than in years past, partially as a result of lower payout ratios engineered to retain capital for reinvestment. However, REIT dividend growth has accelerated and, in our view, this should continue. Countering the fact that REIT cash flow multiples are above their historical average levels: our belief in above-average anticipated cash flow growth, given the accelerating rental revenue
5
COHEN & STEERS REALTY FOCUS FUND, INC.
growth that we expect. In summary, our forecast for solid economic growth, improving real estate fundamentals and fair valuation levels present what we see as a favorable backdrop for REIT total return prospects for 2006. We also believe that REITs should continue to deliver their well-established diversification benefits to investors.
Sincerely,
 | |  | |
|
| MARTIN COHEN | | ROBERT H. STEERS | |
|
| Co-chairman | | Co-chairman | |
|
 | |  | |
|
| JOSEPH M. HARVEY | | JAMES S. CORL | |
|
| Portfolio Manager | | Portfolio Manager | |
|
The views and opinions in the preceding commentary are as of the date stated and are subject to change. This material represents an assessment of the market environment at a specific point in time, should not be relied upon as investment advice and is not intended to predict or depict performance of any investment.
Visit Cohen & Steers online at cohenandsteers.com
For more information about any of our funds, visit cohenandsteers.com, where you'll find daily net asset values, fund fact sheets and portfolio highlights. You can also access newsletters, education tools and market updates covering REIT, utility and preferred securities sectors.
In addition, our Web site contains comprehensive information about our firm, including our most recent press releases, profiles of our senior investment professionals, and an overview or our investment approach.
6
COHEN & STEERS REALTY FOCUS FUND, INC.
Performance Review
Cohen & Steers Realty Focus Fund—Class A
Growth of a $10,000 Investment
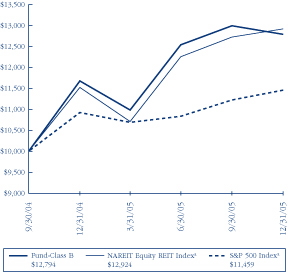
Cohen & Steers Realty Focus Fund—Class B
Growth of a $10,000 Investment
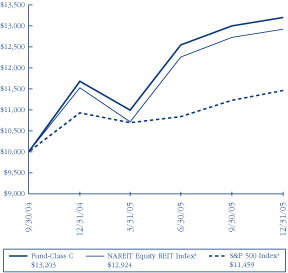
Cohen & Steers Realty Focus Fund—Class C
Growth of a $10,000 Investment
Cohen & Steers Realty Focus Fund—Class I
Growth of a $100,000 Investment
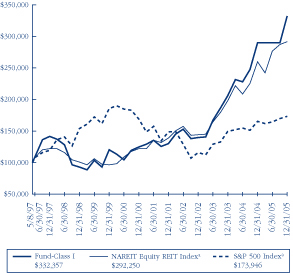
7
COHEN & STEERS REALTY FOCUS FUND, INC.
Performance Review—(Continued)
| | | Class A Shares | | Class B Shares | | Class C Shares | | Class I Shares | |
| 1 Year (with sales charge) | | | 8.74 | %b | | | 7.99 | %c | | | 12.05 | %e | | | — | | |
| 1 Year (without sales charge) | | | 13.87 | % | | | 12.99 | % | | | 13.07 | % | | | 14.41 | % | |
| 5 Years (without sales charge) | | | — | | | | — | | | | — | | | | 21.64 | % | |
Since Inceptionf (with sales
charge) | | | 21.18 | %b | | | 21.79 | %d | | | 24.89 | % | | | — | | |
Since Inceptionf (without sales
charge) | | | 25.73 | % | | | 24.83 | % | | | 24.89 | % | | | 14.90 | % | |
The performance data quoted represent past performance. Past performance is no guarantee of future results. The investment return and principal value of an investment will fluctuate and shares, when redeemed, may be worth more or less than their original cost. Current performance may be lower or higher than the performance data quoted. Performance information current to the most recent month-end can be obtained by visiting our website at cohenandsteers.com. The performance graph and table do not reflect the deduction of taxes that a shareholder would pay on fund distributions or the redemption of fund shares.
Through December 31, 2006, the fund's advisor has contractually agreed to waive certain fees and/or reimburse the fund for expenses. Absent such arrangements, returns would have been lower.
a The comparative indexes are not adjusted to reflect expenses or other fees that the SEC requires to be reflected in the fund's performance. The fund's performance assumes the reinvestment of all dividends and distributions. For more information, including charges and expenses, please read the prospectus carefully before you invest.
b Reflects a 4.50% front-end sales charge.
c Reflects a contingent deferred sales charge of 5%.
d Reflects a contingent deferred sales charge of 4%.
e Reflects a contingent deferred sales charge of 1%.
f Inception dates: September 30, 2004 for Class A, B and C and May 8, 1997 for Class I.
8
COHEN & STEERS REALTY FOCUS FUND, INC.
Expense Example (Unaudited)
As a shareholder of the fund, you incur two types of costs: (1) transaction costs, including sales charges (loads) on purchase payments and redemption fees; and (2) ongoing costs including management fees; distribution and/or service (12b-1) fees; and other fund expenses. This example is intended to help you understand your ongoing costs (in dollars) of investing in the fund and to compare these costs with the ongoing costs of investing in other mutual funds.
The example is based on an investment of $1,000 invested at the beginning of the period and held for the entire period 07/01/05 – 12/31/05.
Actual Expenses
The first line of the table below provides information about actual account values and expenses. You may use the information in this line, together with the amount you invested, to estimate the expenses that you paid over the period. Simply divide your account value by $1,000 (for example, an $8,600 account value divided by $1,000 = 8.6), then multiply the result by the number in the first line under the heading entitled "Expenses Paid During Period" to estimate the expenses you paid on your account during this period.
Hypothetical Example for Comparison Purposes
The second line of the table below provides information about hypothetical account values and hypothetical expenses based on the fund's actual expense ratio and an assumed rate of return of 5% per year before expenses, which is not the fund's actual return. The hypothetical account values and expenses may not be used to estimate the actual ending account balance or expenses you paid for the period. You may use this information to compare the ongoing cost of investing in the fund and other funds. To do so, compare this 5% hypothetical example with the 5% hypothetical examples that appear in the shareholder reports of the other funds.
Please note that the expenses shown in the table are meant to highlight your ongoing costs only and do not reflect any transactional costs, such as sales charges (loads) and redemption fees. Therefore, the second line of the table is useful in comparing ongoing costs only, and will not help you determine the relative total costs of owning different funds. In addition, if these transactional costs were included, your costs would have been higher.
9
COHEN & STEERS REALTY FOCUS FUND, INC.
Expense Example (Unaudited)—(Continued)
| | | Beginning
Account Value
July 01, 2005 | | Ending
Account Value
December 31, 2005 | | Expenses Paid
During Period*
July 01, 2005–
December 31, 2005 | |
| Class A | |
| Actual (5.54% return) | | $ | 1,000.00 | | | $ | 1,055.43 | | | $ | 8.44 | | |
| Hypothetical (5% annual return before expenses) | | $ | 1,000.00 | | | $ | 1,016.99 | | | $ | 8.29 | | |
| Class B | |
| Actual (5.19% return) | | $ | 1,000.00 | | | $ | 1,051.91 | | | $ | 11.84 | | |
| Hypothetical (5% annual return before expenses) | | $ | 1,000.00 | | | $ | 1,013.66 | | | $ | 11.62 | | |
| Class C | |
| Actual (5.23% return) | | $ | 1,000.00 | | | $ | 1,052.25 | | | $ | 11.85 | | |
| Hypothetical (5% annual return before expenses) | | $ | 1,000.00 | | | $ | 1,013.66 | | | $ | 11.62 | | |
| Class I | |
| Actual (5.74% return) | | $ | 1,000.00 | | | $ | 1,057.40 | | | $ | 6.74 | | |
| Hypothetical (5% annual return before expenses) | | $ | 1,000.00 | | | $ | 1,018.65 | | | $ | 6.61 | | |
* Expenses are equal to the fund's Class A, Class B, Class C and Class I annualized expense ratio of 1.63%, 2.29%, 2.29% and 1.30%, respectively, multiplied by the average account value over the period, multiplied by 184/365 (to reflect the one-half year period). If the fund had borne all of its expenses that were assumed by the advisor, the annualized expense ratios would have been 1.75%, 2.44%, 2.42% and 1.46%, respectively.
10
COHEN & STEERS REALTY FOCUS FUND, INC.
DECEMBER 31, 2005
Top Ten Long-Term Holdings
(Unaudited)
| Security | | Market
Value | | % of
Net
Assets | |
| 1. Alexandria Real Estate Equities | | $ | 7,180,600 | | | | 5.4 | % | |
| 2. Apartment Investment & Management Co. | | | 6,816,600 | | | | 5.1 | | |
| 3. BRE Properties | | | 6,494,544 | | | | 4.9 | | |
| 4. Entertainment Properties Trust | | | 5,851,700 | | | | 4.4 | | |
| 5. Mills Corp. | | | 5,758,362 | | | | 4.3 | | |
| 6. AvalonBay Communities | | | 5,399,625 | | | | 4.1 | | |
| 7. Glenborough Realty Trust | | | 5,223,660 | | | | 3.9 | | |
| 8. Extra Space Storage | | | 5,163,620 | | | | 3.9 | | |
| 9. U-Store-It Trust | | | 5,153,040 | | | | 3.9 | | |
| 10. Maguire Properties | | | 5,135,580 | | | | 3.9 | | |
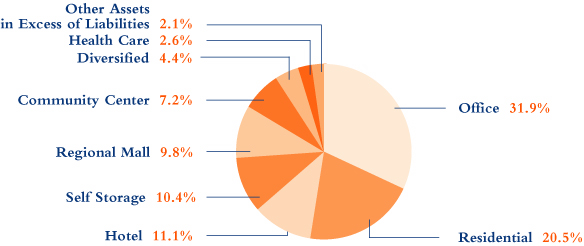
Sector Breakdown
(Based on Net Assets)
(Unaudited)
11
COHEN & STEERS REALTY FOCUS FUND, INC.
SCHEDULE OF INVESTMENTS
December 31, 2005
| | | | | Number
of Shares | | Value | |
| COMMON STOCK | | | 97.9 | % | | | | | | | | | |
| DIVERSIFIED | | | 4.4 | % | | | | | | | | | |
| Entertainment Properties Trust | | | | | | | 143,600 | | | $ | 5,851,700 | | |
| HEALTH CARE | | | 2.6 | % | | | | | | | | | |
| Ventas | | | | | | | 107,700 | | | | 3,448,554 | | |
| HOTEL | | | 11.1 | % | | | | | | | | | |
| Hilton Hotels Corp. | | | | | | | 191,700 | | | | 4,621,887 | | |
| Host Marriott Corp. | | | | | | | 245,400 | | | | 4,650,330 | | |
| Starwood Hotels & Resorts Worldwide | | | | | | | 68,500 | | | | 4,374,410 | | |
| Strategic Hotel Capital | | | | | | | 52,000 | | | | 1,070,160 | | |
| | | | | | | | 14,716,787 | | |
| OFFICE | | | 31.9 | % | | | | | | | | | |
| Alexandria Real Estate Equities | | | | | | | 89,200 | | | | 7,180,600 | | |
| American Financial Realty Trust | | | | | | | 294,700 | | | | 3,536,400 | | |
| Boston Properties | | | | | | | 37,200 | | | | 2,757,636 | | |
| Brookfield Properties Corp. | | | | | | | 135,050 | | | | 3,973,171 | | |
| Forest City Enterprises | | | | | | | 111,300 | | | | 4,221,609 | | |
| Glenborough Realty Trust | | | | | | | 288,600 | | | | 5,223,660 | | |
| HRPT Properties Trust | | | | | | | 259,600 | | | | 2,686,860 | | |
| Mack-Cali Realty Corp. | | | | | | | 108,500 | | | | 4,687,200 | | |
| Maguire Properties | | | | | | | 166,200 | | | | 5,135,580 | | |
| Thomas Properties Group | | | | | | | 225,200 | | | | 2,817,252 | | |
| | | | | | | | 42,219,968 | | |
| RESIDENTIAL | | | 20.5 | % | | | | | | | | | |
| APARTMENT | | | 18.5 | % | | | | | | | | | |
| Apartment Investment & Management Co. | | | | | | | 180,000 | | | | 6,816,600 | | |
| Archstone-Smith Trust | | | | | | | 118,500 | | | | 4,963,965 | | |
| AvalonBay Communities | | | | | | | 60,500 | | | | 5,399,625 | | |
| BRE Properties | | | | | | | 142,800 | | | | 6,494,544 | | |
| Education Realty Trust | | | | | | | 62,400 | | | | 804,336 | | |
| | | | | | | | 24,479,070 | | |
See accompanying notes to financial statements.
12
COHEN & STEERS REALTY FOCUS FUND, INC.
SCHEDULE OF INVESTMENTS—(Continued)
December 31, 2005
| | | | | Number
of Shares | | Value | |
| MANUFACTURED HOME | | | 2.0 | % | | | | | | | | | |
| Sun Communities | | | | | | | 87,000 | | | $ | 2,731,800 | | |
| TOTAL RESIDENTIAL | | | | | | | | | | | 27,210,870 | | |
| SELF STORAGE | | | 10.4 | % | | | | | | | | | |
| Extra Space Storage | | | | | | | 335,300 | | | | 5,163,620 | | |
| Shurgard Storage Centers | | | | | | | 60,800 | | | | 3,447,968 | | |
| U-Store-It Trust | | | | | | | 244,800 | | | | 5,153,040 | | |
| | | | | | | | 13,764,628 | | |
| SHOPPING CENTER | | | 17.0 | % | | | | | | | | | |
| COMMUNITY CENTER | | | 7.2 | % | | | | | | | | | |
| Developers Diversified Realty Corp. | | | | | | | 65,600 | | | | 3,084,512 | | |
| Kite Realty Group Trust | | | | | | | 172,400 | | | | 2,667,028 | | |
| Tanger Factory Outlet Centers | | | | | | | 131,400 | | | | 3,776,436 | | |
| | | | | | | | 9,527,976 | | |
| REGIONAL MALL | | | 9.8 | % | | | | | | | | | |
| Macerich Co. | | | | | | | 35,100 | | | | 2,356,614 | | |
| Mills Corp. | | | | | | | 137,300 | | | | 5,758,362 | | |
| Taubman Centers | | | | | | | 138,500 | | | | 4,812,875 | | |
| | | | | | | | 12,927,851 | | |
| TOTAL SHOPPING CENTER | | | | | | | | | | | 22,455,827 | | |
| TOTAL COMMON STOCK (Identified cost—$119,217,232) | | | | | | | | | | | 129,668,334 | | |
| | | | | Principal
Amount | | | |
| COMMERCIAL PAPER | | | 4.2 | % | | | | | | | | | |
AIG Funding, 3.230%, due 1/3/06
(Identified cost—$5,562,002) | | | | | | $ | 5,563,000 | | | | 5,562,002 | | |
| TOTAL INVESTMENTS (Identified cost—$124,779,234) | | | 102.1 | % | | | | | | | 135,230,336 | | |
| LIABILITIES IN EXCESS OF OTHER ASSETS | | | (2.1 | )% | | | | | | | (2,800,721 | ) | |
| NET ASSETS | | | 100.0 | % | | | | | | $ | 132,429,615 | | |
Note: Percentages indicated are based on the net assets of the fund.
See accompanying notes to financial statements.
13
COHEN & STEERS REALTY FOCUS FUND, INC.
STATEMENT OF ASSETS AND LIABILITIES
December 31, 2005
| ASSETS: | |
| Investments in securities, at value (Identified cost-$124,779,234) | | $ | 135,230,336 | | |
| Receivable for investment securities sold | | | 2,829,901 | | |
| Dividends receivable | | | 831,573 | | |
| Receivable for fund shares sold | | | 698,524 | | |
| Other assets | | | 3,419 | | |
| Total Assets | | | 139,593,753 | | |
| LIABILITIES: | |
| Payable for investment securities purchased | | | 6,781,168 | | |
| Payable for fund shares redeemed | | | 134,846 | | |
| Payable to investment advisor | | | 107,425 | | |
| Payable for distribution fees | | | 15,435 | | |
| Payable for shareholder servicing fees | | | 5,468 | | |
| Payable for directors fees | | | 4,497 | | |
| Payable to administrator | | | 2,176 | | |
| Other liabilities | | | 113,123 | | |
| Total Liabilities | | | 7,164,138 | | |
| NET ASSETS | | $ | 132,429,615 | | |
| NET ASSETS consist of: | |
| Paid-in capital | | $ | 122,280,410 | | |
| Accumulated net realized loss on investments | | | (301,897 | ) | |
| Net unrealized appreciation on investments | | | 10,451,102 | | |
| | | $ | 132,429,615 | | |
See accompanying notes to financial statements.
14
COHEN & STEERS REALTY FOCUS FUND, INC.
STATEMENT OF ASSETS AND LIABILITIES—(Continued)
December 31, 2005
| CLASS A SHARES: | |
| NET ASSETS | | $ | 25,703,399 | | |
| Shares issued and outstanding ($0.001 par value common stock outstanding) | | | 436,393 | | |
| Net asset value and redemption price per share | | $ | 58.90 | | |
| Maximum offering price per share ($58.90 ÷ 0.955)a | | $ | 61.68 | | |
| CLASS B SHARES: | |
| NET ASSETS | | $ | 1,534,241 | | |
| Shares issued and outstanding ($0.001 par value common stock outstanding) | | | 26,119 | | |
| Net asset value and offering price per shareb | | $ | 58.74 | | |
| CLASS C SHARES: | |
| NET ASSETS | | $ | 15,899,626 | | |
| Shares issued and outstanding ($0.001 par value common stock outstanding) | | | 270,511 | | |
| Net asset value and offering price per shareb | | $ | 58.78 | | |
| CLASS I SHARES: | |
| NET ASSETS | | $ | 89,292,349 | | |
| Shares issued and outstanding ($0.001 par value common stock outstanding) | | | 1,511,162 | | |
| Net asset value, offering and redemption price per share | | $ | 59.09 | | |
a On investments of $100,000 or more, the offering price is reduced.
b Redemption price per share is equal to the net asset value per share less any applicable deferred sales charge which varies with the length of time shares are held.
See accompanying notes to financial statements.
15
COHEN & STEERS REALTY FOCUS FUND, INC.
STATEMENT OF OPERATIONS
For the Year Ended December 31, 2005
| Investment Income: | |
| Dividend income (net of $12,282 of foreign withholding tax) | | $ | 1,619,148 | | |
| Interest income | | | 114,305 | | |
| Total Income | | | 1,733,453 | | |
| Expenses: | |
| Investment advisory fees | | | 877,472 | | |
| Reports to shareholders | | | 148,579 | | |
| Professional fees | | | 137,280 | | |
| Administration fees | | | 112,199 | | |
| Distribution fees—Class A | | | 24,941 | | |
| Distribution fees—Class B | | | 7,279 | | |
| Distribution fees—Class C | | | 63,037 | | |
| Transfer agent fees | | | 78,676 | | |
| Registration and filing fees | | | 70,109 | | |
| Directors' fees and expenses | | | 53,488 | | |
| Shareholder servicing fees—Class A | | | 9,976 | | |
| Shareholder servicing fees—Class B | | | 2,426 | | |
| Shareholder servicing fees—Class C | | | 21,013 | | |
| Custodian fees and expenses | | | 25,909 | | |
| Line of credit fees and expenses | | | 3,607 | | |
| Miscellaneous | | | 15,213 | | |
| Total Expenses | | | 1,651,204 | | |
| Reduction of Expenses | | | (255,114 | ) | |
| Net Expenses | | | 1,396,090 | | |
| Net Investment Income | | | 337,363 | | |
| Net Realized and Unrealized Gain (Loss) on Investments: | |
| Net realized gain on investments | | | 14,063,024 | | |
| Net change in unrealized appreciation on investments | | | (1,286,611 | ) | |
| Net realized and unrealized gain on investments | | | 12,776,413 | | |
| Net Increase in Net Assets Resulting from Operations | | $ | 13,113,776 | | |
See accompanying notes to financial statements.
16
COHEN & STEERS REALTY FOCUS FUND, INC.
STATEMENT OF CHANGES IN NET ASSETS
| | | For the
Year Ended
December 31, 2005 | | For the
Year Ended
December 31, 2004 | |
| Change in Net Assets: | |
| From Operations: | |
| Net investment income | | $ | 337,363 | | | $ | 384,327 | | |
| Net realized gain on investments | | | 14,063,024 | | | | 8,559,168 | | |
| Net change in unrealized appreciation on investments | | | (1,286,611 | ) | | | 7,139,307 | | |
| Net increase in net assets resulting from operations | | | 13,113,776 | | | | 16,082,802 | | |
| Dividends to Shareholders from: | |
| Net investment income | |
| Class A | | | (354,529 | ) | | | (33,632 | ) | |
| Class B | | | (19,499 | ) | | | (7,384 | ) | |
| Class C | | | (185,829 | ) | | | (29,646 | ) | |
| Class I | | | (2,016,279 | ) | | | (1,236,072 | ) | |
| Net realized gain on investments | |
| Class A | | | (41,929 | ) | | | — | | |
| Class B | | | (2,507 | ) | | | — | | |
| Class C | | | (26,558 | ) | | | — | | |
| Class I | | | (151,725 | ) | | | — | | |
| Total dividends to shareholders | | | (2,798,855 | ) | | | (1,306,734 | ) | |
| Capital Stock Transactions: | |
| Increase in net assets from fund share transactions | | | 45,018,903 | | | | 33,844,916 | | |
| Total increase in net assets | | | 55,333,824 | | | | 48,620,984 | | |
| Net Assets | |
| Beginning of year | | | 77,095,791 | | | | 28,474,807 | | |
| End of year | | $ | 132,429,615 | | | $ | 77,095,791 | | |
See accompanying notes to financial statements.
17
COHEN & STEERS REALTY FOCUS FUND, INC.
FINANCIAL HIGHLIGHTS
The following table includes selected data for a share outstanding throughout each period and other performance information derived from the financial statements. It should be read in conjunction with the financial statements and notes thereto.
| | | Class A | |
| Per Share Operating Performance: | | For the
Year Ended
December 31, 2005 | | For the Period
September 30, 2004a
through
December 31, 2004 | |
| Net asset value, beginning of period | | $ | 52.96 | | | $ | 45.82 | | |
| Income from investment operations: | |
| Net investment incomeb | | | 0.49 | | | | 0.22 | | |
| Net realized and unrealized gain on investments | | | 6.74 | | | | 7.53 | | |
| Total income from investment operations | | | 7.23 | | | | 7.75 | | |
| Less dividends to shareholders from: | |
| Net investment income | | | (1.26 | ) | | | (0.61 | ) | |
| Net realized gain on investments | | | (0.10 | ) | | | — | | |
| Total dividends and distributions to shareholders | | | (1.36 | ) | | | (0.61 | ) | |
| Redemption fees retained by the fund | | | 0.07 | | | | — | | |
| Net increase in net assets | | | 5.94 | | | | 7.14 | | |
| Net asset value, end of period | | $ | 58.90 | | | $ | 52.96 | | |
| Total investment returnc | | | 13.87 | % | | | 16.93 | %d | |
| Ratios/Supplemental Data: | |
| Net assets, end of period (in millions) | | $ | 25.7 | | | $ | 3.1 | | |
| Ratio of expenses to average daily net assets (before expense reduction) | | | 1.84 | % | | | 3.07 | %e | |
| Ratio of expenses to average daily net assets (net of expense reduction) | | | 1.65 | % | | | 1.65 | %e | |
| Ratio of net investment income to average daily net assets (before expense reduction) | | | 0.67 | % | | | 0.31 | %e | |
| Ratio of net investment income to average daily net assets (net of expense reduction) | | | 0.87 | % | | | 1.73 | %e | |
| Portfolio turnover rate | | | 158 | % | | | 180 | % | |
a Initial offering of shares.
b Calculated based on average shares outstanding during the period.
c Does not reflect sales charges, which would reduce return.
d Not annualized.
e Annualized.
See accompanying notes to financial statements.
18
COHEN & STEERS REALTY FOCUS FUND, INC.
FINANCIAL HIGHLIGHTS—(Continued)
| | | Class B | |
| Per Share Operating Performance: | | For the
Year Ended
December 31, 2005 | | For the Period
September 30, 2004a
through
December 31, 2004 | |
| Net asset value, beginning of period | | $ | 52.92 | | | $ | 45.82 | | |
| Income from investment operations: | |
| Net investment income (loss)b | | | (0.22 | ) | | | 0.20 | | |
| Net realized and unrealized gain on investments | | | 7.03 | | | | 7.47 | | |
| Total income from investment operations | | | 6.81 | | | | 7.67 | | |
| Less dividends to shareholders from: | |
| Net investment income | | | (0.94 | ) | | | (0.57 | ) | |
| Net realized gain on investments | | | (0.10 | ) | | | — | | |
| Total dividends and distributions to shareholders | | | (1.04 | ) | | | (0.57 | ) | |
| Redemption fees retained by the fund | | | 0.05 | | | | — | | |
| Net increase in net assets | | | 5.82 | | | | 7.10 | | |
| Net asset value, end of period | | $ | 58.74 | | | $ | 52.92 | | |
| Total investment returnc | | | 12.99 | % | | | 16.77 | %d | |
| Ratios/Supplemental Data: | |
| Net assets, end of period (in millions) | | $ | 1.5 | | | $ | 0.7 | | |
| Ratio of expenses to average daily net assets (before expense reduction) | | | 2.56 | % | | | 4.07 | %e | |
| Ratio of expenses to average daily net assets (net of expense reduction) | | | 2.30 | % | | | 2.30 | %e | |
| Ratio of net investment income (loss) to average daily net assets (before expense reduction) | | | (0.65 | )% | | | (0.19 | )%e | |
| Ratio of net investment income (loss) to average daily net assets (net of expense reduction) | | | (0.39 | )% | | | 1.58 | %e | |
| Portfolio turnover rate | | | 158 | % | | | 180 | % | |
a Initial offering of shares.
b Calculated based on average shares outstanding during the period.
c Does not reflect sales charges, which would reduce return.
d Not annualized.
e Annualized.
See accompanying notes to financial statements.
19
COHEN & STEERS REALTY FOCUS FUND, INC.
FINANCIAL HIGHLIGHTS—(Continued)
| | | Class C | |
| Per Share Operating Performance: | | For the
Year Ended
December 31, 2005 | | For the Period
September 30, 2004a
through
December 31, 2004 | |
| Net asset value, beginning of period | | $ | 52.93 | | | $ | 45.82 | | |
| Income from investment operations: | |
| Net investment income (loss)b | | | (0.19 | ) | | | 0.15 | | |
| Net realized and unrealized gain on investments | | | 7.03 | | | | 7.53 | | |
| Total income from investment operations | | | 6.84 | | | | 7.68 | | |
| Less dividends to shareholders from: | |
| Net investment income | | | (0.94 | ) | | | (0.57 | ) | |
| Net realized gain on investments | | | (0.10 | ) | | | — | | |
| Total dividends and distributions to shareholders | | | (1.04 | ) | | | (0.57 | ) | |
| Redemption fees retained by the fund | | | 0.05 | | | | — | | |
| Net increase in net assets | | | 5.85 | | | | 7.11 | | |
| Net asset value, end of period | | $ | 58.78 | | | $ | 52.93 | | |
| Total investment returnc | | | 13.07 | % | | | 16.77 | %d | |
| Ratios/Supplemental Data: | |
| Net assets, end of period (in millions) | | $ | 15.9 | | | $ | 3.0 | | |
| Ratio of expenses to average daily net assets (before expense reduction) | | | 2.54 | % | | | 3.78 | %e | |
| Ratio of expenses to average daily net assets (net of expense reduction) | | | 2.30 | % | | | 2.30 | %e | |
| Ratio of net investment income (loss) to average daily net assets (before expense reduction) | | | (0.57 | )% | | | (0.31 | )%e | |
| Ratio of net investment income (loss) to average daily net assets (net of expense reduction) | | | (0.33 | )% | | | 1.17 | %e | |
| Portfolio turnover rate | | | 158 | % | | | 180 | % | |
a Initial offering of shares.
b Calculated based on average shares outstanding during the period.
c Does not reflect sales charges, which would reduce return.
d Not annualized.
e Annualized.
See accompanying notes to financial statements.
20
COHEN & STEERS REALTY FOCUS FUND, INC.
FINANCIAL HIGHLIGHTS—(Continued)
| | | Class I | |
| | | For the Year Ended December 31, | |
| Per Share Operating Performance: | | 2005 | | 2004 | | 2003 | | 2002 | | 2001 | |
| Net asset value, beginning of year | | $ | 53.00 | | | $ | 38.55 | | | $ | 27.50 | | | $ | 26.63 | | | $ | 26.60 | | |
| Income from investment operations: | |
| Net investment income | | | 0.20 | a | | | 0.41 | a | | | 0.64 | | | | 0.73 | | | | 0.69 | | |
| Net realized and unrealized gain on investments | | | 7.24 | | | | 15.16 | | | | 12.06 | | | | 1.29 | | | | 0.49 | | |
| Total income from investment operations | | | 7.44 | | | | 15.57 | | | | 12.70 | | | | 2.02 | | | | 1.18 | | |
| Less dividends to shareholders from: | |
| Net investment income | | | (1.40 | ) | | | (1.18 | ) | | | (1.67 | ) | | | (1.21 | ) | | | (0.52 | ) | |
| Net realized gain on investments | | | (0.10 | ) | | | — | | | | — | | | | — | | | | — | | |
| Tax return of capital | | | — | | | | — | | | | — | | | | — | | | | (0.63 | ) | |
Total dividends and distributions to
shareholders | | | (1.50 | ) | | | (1.18 | ) | | | (1.67 | ) | | | (1.21 | ) | | | (1.15 | ) | |
| Redemption fees retained by the fund | | | 0.15 | | | | 0.06 | | | | 0.02 | | | | 0.06 | | | | — | | |
| Net increase in net assets | | | 6.09 | | | | 14.45 | | | | 11.05 | | | | 0.87 | | | | 0.03 | | |
| Net asset value, end of year | | $ | 59.09 | | | $ | 53.00 | | | $ | 38.55 | | | $ | 27.50 | | | $ | 26.63 | | |
| Total investment return | | | 14.41 | %b | | | 40.98 | % | | | 46.89 | % | | | 7.67 | % | | | 4.39 | % | |
| Ratios/Supplemental Data: | |
| Net assets, end of year (in millions) | | $ | 89.3 | | | $ | 70.2 | | | $ | 28.5 | | | $ | 18.2 | | | $ | 20.2 | | |
Ratio of expenses to average daily net assets
(before expense reduction) | | | 1.57 | % | | | 1.89 | % | | | 1.99 | % | | | 2.09 | % | | | 1.83 | % | |
Ratio of expenses to average daily net assets
(net of expense reduction) | | | 1.30 | % | | | 1.43 | % | | | 1.50 | % | | | 1.50 | % | | | 1.83 | % | |
Ratio of net investment income to average daily net
assets (before expense reduction) | | | 0.09 | % | | | 0.45 | % | | | 1.33 | % | | | 1.96 | % | | | 2.16 | % | |
Ratio of net investment income to average daily net
assets (net of expense reduction) | | | 0.36 | % | | | 0.92 | % | | | 1.82 | % | | | 2.55 | % | | | 2.16 | % | |
| Portfolio turnover rate | | | 158 | % | | | 180 | % | | | 181 | % | | | 179 | % | | | 108 | % | |
a Calculated based on the average shares outstanding during the year.
b Without the benefit of the redemption fees, the total investment return would have been 14.12%.
See accompanying notes to financial statements.
21
COHEN & STEERS REALTY FOCUS FUND, INC.
NOTES TO FINANCIAL STATEMENTS
Note 1. Significant Accounting Policies
Cohen & Steers Realty Focus Fund, Inc. (the fund) was incorporated under the laws of the State of Maryland on February 14, 1997 and is registered under the Investment Company Act of 1940, as amended, as a nondiversified, open-end management investment company. The fund's investment objective is maximum capital appreciation. The authorized shares of the fund are divided into four classes designated Class A, B, C, and I shares. Each of the fund's shares has equal dividend, liquidation and voting rights (except for matters relating to distributions and shareholder servicing of such shares). Class B shares automatically convert to Class A shares at the end of the month which precedes the eighth anniversary of the purchase date.
The following is a summary of significant accounting policies consistently followed by the fund in the preparation of its financial statements. The policies are in conformity with accounting principles generally accepted in the United States of America (GAAP). The preparation of the financial statements in accordance with GAAP requires management to make estimates and assumptions that affect the reported amounts of assets and liabilities at the date of the financial statements and the reported amounts of income and expenses during the reporting period. Actual results could differ from those estimates.
Portfolio Valuation: Investments in securities that are listed on the New York Stock Exchange are valued, except as indicated below, at the last sale price reflected at the close of the New York Stock Exchange on the business day as of which such value is being determined. If there has been no sale on such day, the securities are valued at the mean of the closing bid and asked prices for the day or, if no asked price is available, at the bid price.
Securities not listed on the New York Stock Exchange but listed on other domestic or foreign securities exchanges or admitted to trading on the National Association of Securities Dealers Automated Quotations, Inc. (Nasdaq) national market system are valued in a similar manner. Securities traded on more than one securities exchange are valued at the last sale price on the business day as of which such value is being determined as reflected on the tape at the close of the exchange representing the principal market for such securities.
Readily marketable securities traded in the over-the-counter market, including listed securities whose primary market is believed by Cohen & Steers Capital Management, Inc. to be over-the-counter, but excluding securities admitted to trading on the Nasdaq National List, are valued at the official closing prices as reported by Nasdaq, the National Quotation Bureau, or such other comparable sources as the Board of Directors deems appropriate to reflect their fair market value. If there has been no sale on such day, the securities are valued at the mean of the closing bid and asked prices for the day, or if no asked price is available, at the bid price. Where securities are traded on more than one exchange and also over-the-counter, the securities will generally be valued using the quotations the Board of Directors believes most closely reflect the value of such securities.
Securities for which market prices are unavailable will be valued at fair value pursuant to procedures approved by the fund's Board of Directors. Circumstances in which market prices may be unavailable include, but are not limited to, when trading in a security is suspended, the exchange on which the security is traded is subject
22
COHEN & STEERS REALTY FOCUS FUND, INC.
NOTES TO FINANCIAL STATEMENTS—(Continued)
to an unscheduled close or disruption or material events occur after the close of the exchange on which the security is principally traded. In these circumstances, the fund determines fair value in a manner that fairly reflects the market value of the security on the valuation date based on consideration of any information or factors it deems appropriate. These may include recent transactions in comparable securities, information relating to the specific security and developments in the markets.
The fund's use of fair value pricing may cause the net asset value of fund shares to differ from the net asset value that would be calculated using market quotations. Fair value pricing involves subjective judgments and it is possible that the fair value determined for a security may be materially different than the value that could be realized upon the sale of that security.
To the extent the fund holds securities that are primarily listed on foreign exchanges that trade on weekends or days when the fund does not price its shares, the value of the securities held in the fund may change on days when you will not be able to purchase or redeem fund shares.
Short-term debt securities, which have a maturity date of 60 days or less, are valued at amortized cost, which approximates value.
Security Transactions and Investment Income: Security transactions are recorded on trade date. Realized gains and losses on investments sold are recorded on the basis of identified cost. Interest income is recorded on the accrual basis. Discounts are accreted and premiums are amortized over the life of the respective securities. Dividend income is recorded on the ex-dividend date. The fund records distributions received in excess of income from underlying investments as a reduction of cost of investments and/or realized gain. Such amounts are based on estimates if actual amounts are not available and actual amounts of income, realized gain and return of capital may differ from the estimated amounts. The fund adjusts the estimated amounts of the components of distributions (and consequently its net investment income) as an increase to unrealized appreciation/(depre ciation) and realized gain/(loss) on investments as necessary once the issuers provide information about the actual composition of the distributions. Income, expenses (other than expenses attributable to a specific class), and realized and unrealized gains or losses on investments are allocated to each class of shares based on its relative net assets.
Dividends and Distributions to Shareholders: Dividends from net investment income and capital gain distributions are determined in accordance with U.S. federal income tax regulations, which may differ from GAAP. Dividends from net investment income are declared and paid semi-annually. Net realized capital gains, unless offset by any available capital loss carryforward, are distributed to shareholders annually. Dividends and distributions to shareholders are recorded on the ex-dividend date and are automatically reinvested in full and fractional shares of the fund based on the net asset value per share at the close of business on the ex-dividend date unless the shareholder has elected to have them paid in cash.
Distributions paid by the fund are subject to recharacterization for tax purposes.
23
COHEN & STEERS REALTY FOCUS FUND, INC.
NOTES TO FINANCIAL STATEMENTS—(Continued)
Federal Income Taxes: It is the policy of the fund to continue to qualify as a regulated investment company, if such qualification is in the best interest of the shareholders, by complying with the requirements of Subchapter M of the Internal Revenue Code applicable to regulated investment companies, and by distributing substantially all of its taxable earnings to its shareholders. Accordingly, no provision for federal income or excise tax is necessary.
Note 2. Investment Advisory and Administration Fees and Other Transactions with Affiliates
Investment Advisory Fees: Cohen & Steers Capital Management, Inc. (the advisor) serves as the fund's investment advisor pursuant to an investment advisory agreement (the advisory agreement). Under the terms of the advisory agreement, the advisor provides the fund with the day-to-day investment decisions and generally manages the fund's investments in accordance with the stated policies of the fund, subject to the supervision of the fund's Board of Directors. For the services provided to the fund, the advisor receives a fee, accrued daily and paid monthly at the annual rate of 0.90% of the average daily net assets of the fund.
For the year ended December 31, 2005 and through December 31, 2006, the advisor has contractually agreed to waive its fee and/or reimburse the fund for expenses incurred to the extent necessary to maintain the fund's operating expenses at 1.65% for Class A shares, 2.30% for Class B and Class C shares and 1.30% for Class I shares.
Administration Fees: The fund has entered into an administration agreement with the advisor under which the advisor performs certain administrative functions for the fund and receives a fee, accrued daily and paid monthly at the annual rate of 0.02% of the fund's average daily net assets. For the year ended December 31, 2005, the fund paid the advisor $19,499 in fees under this administration agreement.
Distribution Fees: Shares of the fund are distributed by Cohen & Steers Securities, LLC (the distributor), an affiliated entity of the advisor. The fund has adopted a distribution plan (the plan) pursuant to Rule 12b-1 under the Investment Company Act of 1940. The plan provides that the fund will pay the distributor a fee at an annual rate of up to 0.25% of the average daily net assets attributable to the Class A shares and 0.75% of the average daily net assets attributable to the Class B and Class C shares distributes the shares of the fund.
For the year ended December 31, 2005, the fund has been advised that the distributor received $25,653 in sales commissions from the sale of Class A shares and that the distributor also received $12,505 and $7,663 of contingent deferred sales charges relating to redemptions of Class B and Class C shares, respectively. The distributor has advised the fund that proceeds from the contingent deferred sales charge on the Class B and C shares are paid to the distributor and are used by the distributor to defray its expenses related to providing distribution-related services to the fund in connection with the sale of the Class B and C shares, including payments to dealers and other financial intermediaries for selling Class B and C shares and interest and other financing costs associated with Class B and C shares.
24
COHEN & STEERS REALTY FOCUS FUND, INC.
NOTES TO FINANCIAL STATEMENTS—(Continued)
Shareholder Servicing Fees: The fund has adopted a shareholder services plan which provides that the fund may obtain the services of qualified financial institutions to act as shareholder servicing agents for their customers. For these services, the fund may pay the shareholder servicing agent a fee at an annual rate of up to 0.10% of the average daily net asset value of the fund's Class A shares and up to 0.25% of the average daily net asset value of the fund's Class B and C shares.
Directors' and Officers' Fees: Certain directors and officers of the fund are also directors, officers, and/or employees of the advisor. The fund does not pay compensation to any affiliated directors and officers except for the Chief Compliance Officer, who received $1,655 from the fund for the year ended December 31, 2005, all of which was reimbursed by the advisor.
Note 3. Purchases and Sales of Securities
Purchases and sales of securities, excluding short-term investments, for the year ended December 31, 2005 totaled $193,085,869 and $148,144,832, respectively.
Note 4. Income Tax Information
The tax character of dividends and distributions paid was as follows:
| | | For the Year Ended
December 31, | |
| | | 2005 | | 2004 | |
| Ordinary income | | $ | 2,561,290 | | | $ | 1,306,734 | | |
| Long-term capital gains | | | 237,565 | | | | — | | |
| Total dividends and distributions | | $ | 2,798,855 | | | $ | 1,306,734 | | |
As of December 31, 2005, the tax-basis components of accumulated earnings and the federal tax cost were as follows:
| Gross unrealized appreciation | | $ | 11,629,293 | | |
| Gross unrealized depreciation | | | (1,480,088 | ) | |
| Net unrealized appreciation | | $ | 10,149,205 | | |
| Cost for federal income tax purposes | | $ | 125,081,131 | | |
25
COHEN & STEERS REALTY FOCUS FUND, INC.
NOTES TO FINANCIAL STATEMENTS—(Continued)
During the year ended December 31, 2005, the fund utilized its net capital loss carryover of $13,891,310. As of December 31, 2005, the fund had temporary book/tax differences primarily attributable to wash sales on portfolio securities and permanent book/tax differences primarily attributable to a taxable overdistribution of income in the current year. To reflect reclassifications arising from the permanent differences, paid-in capital was charged $2,205,896, accumulated net realized gain was charged $32,877 and accumulated net investment income was credited $2,238,773. At December 31, 2005, the fund did not have any undistributed ordinary income or long-term capital gains.
Note 5. Capital Stock
The fund is authorized to issue 50 million shares of capital stock, at a par value of $0.001 per share. The Board of Directors of the fund may increase or decrease the aggregate number of shares of common stock that the fund has authority to issue. Transactions in fund shares were as follows:
| | | For the
Year Ended
December 31, 2005 | | For the period
September 30, 2004a
through
December 31, 2004 | |
| | | Shares | | Amount | | Shares | | Amount | |
| Class A: | |
| Sold | | | 425,527 | | | $ | 24,214,195 | | | | 58,596 | | | $ | 2,932,895 | | |
Issued as reinvestment of
dividends | | | 5,036 | | | | 293,591 | | | | 329 | | | | 17,301 | | |
| Redeemed | | | (52,977 | ) | | | (2,882,747 | ) | | | (118 | ) | | | (5,626 | ) | |
Redemption fees retained by
the fundb | | | — | | | | 11,758 | | | | — | | | | — | | |
| Net increase | | | 377,586 | | | $ | 21,636,797 | | | | 58,807 | | | $ | 2,944,570 | | |
| Class B: | |
| Sold | | | 18,141 | | | $ | 1,010,429 | | | | 14,004 | | | $ | 710,245 | | |
Issued as reinvestment of
dividends | | | 246 | | | | 14,214 | | | | 61 | | | | 3,215 | | |
| Redeemed | | | (6,271 | ) | | | (340,218 | ) | | | (62 | ) | | | (3,136 | ) | |
Redemption fees retained by
the fundb | | | — | | | | 838 | | | | — | | | | — | | |
| Net increase | | | 12,116 | | | $ | 685,263 | | | | 14,003 | | | $ | 710,324 | | |
a Initial offering date.
b The fund may charge a 1% redemption fee on shares sold within six months of the time of purchase.
26
COHEN & STEERS REALTY FOCUS FUND, INC.
NOTES TO FINANCIAL STATEMENTS—(Continued)
| | | For the
Year Ended
December 31, 2005 | | For the period
September 30, 2004a
through
December 31, 2004 | |
| | | Shares | | Amount | | Shares | | Amount | |
| Class C: | |
| Sold | | | 241,405 | | | $ | 13,421,544 | | | | 57,767 | | | $ | 2,898,809 | | |
Issued as reinvestment of
dividends | | | 2,412 | | | | 139,677 | | | | 298 | | | | 15,631 | | |
| Redeemed | | | (30,636 | ) | | | (1,675,841 | ) | | | (735 | ) | | | (36,759 | ) | |
Redemption fees retained by
the Fundb | | | — | | | | 7,742 | | | | — | | | | — | | |
| Net increase | | | 213,181 | | | $ | 11,893,122 | | | | 57,330 | | | $ | 2,877,681 | | |
| | | | | For the
Year Ended
December 31, 2004 | |
| Class I: | |
| Sold | | | 726,972 | | | $ | 39,571,623 | | | | 858,501 | | | $ | 39,387,863 | | |
Issued as reinvestment of
dividends | | | 32,167 | | | | 1,855,492 | | | | 22,056 | | | | 1,059,712 | | |
| Redeemed | | | (572,605 | ) | | | (30,829,569 | ) | | | (294,496 | ) | | | (13,210,352 | ) | |
Redemption fees retained by
the fundb | | | — | | | | 206,175 | | | | — | | | | 75,118 | | |
| Net increase | | | 186,534 | | | $ | 10,803,721 | | | | 586,061 | | | $ | 27,312,341 | | |
a Initial offering date.
b The fund may charge a 1% redemption fee on shares sold within six months of the time of purchase.
Note 6. Borrowings
The fund, in conjunction with other Cohen & Steers funds, is a party to a $150,000,000 syndicated credit agreement (the credit agreement) with State Street Bank and Trust Company, as administrative agent and operations agent, and the lenders identified in the credit agreement.
During the year ended December 31, 2005, the fund did not utilize the line of credit.
Note 7. Other
In the normal course of business, the fund enters into contracts that provide general indemnifications. The fund's maximum exposure under these arrangements is dependent on claims that may be made against the fund in the future and, therefore, cannot be estimated; however, based on experience, the risk of material loss from such claims is considered remote.
27
COHEN & STEERS REALTY FOCUS FUND, INC.
REPORT OF INDEPENDENT REGISTERED PUBLIC ACCOUNTING FIRM
To the Board of Directors and Shareholders of
Cohen & Steers Realty Focus Fund, Inc.
In our opinion, the accompanying statement of assets and liabilities, including the schedule of investments, and the related statements of operations and of changes in net assets and the financial highlights present fairly, in all material respects, the financial position of Cohen & Steers Realty Focus Fund, Inc. (the "Fund") at December 31, 2005, the results of its operations for the year then ended, the changes in its net assets for each of the two years in the period then ended and the financial highlights for each of the periods presented, in conformity with accounting principles generally accepted in the United States of America. These financial statements and financial highlights (hereafter referred to as "financial statements") are the responsibility of the Fund's management. Our responsibility is to express an opinion on these financial statements based on our audits. We conducted our audits of these financial statements in accor dance with the standards of the Public Company Accounting Oversight Board (United States). Those standards require that we plan and perform the audit to obtain reasonable assurance about whether the financial statements are free of material misstatement. An audit includes examining, on a test basis, evidence supporting the amounts and disclosures in the financial statements, assessing the accounting principles used and significant estimates made by management, and evaluating the overall financial statement presentation. We believe that our audits, which included confirmation of securities at December 31, 2005 by correspondence with the custodian and brokers, provide a reasonable basis for our opinion.
PricewaterhouseCoopers LLP
New York, New York
February 17, 2006
28
COHEN & STEERS REALTY FOCUS FUND, INC.
TAX INFORMATION—2005 (Unaudited)
Pursuant to the Jobs and Growth Relief Reconciliation Act of 2003, the fund designates qualified dividend income of $110,438. Additionally, 1.45% of the ordinary dividends qualified for the dividends received deduction available to corporations. Also, the fund designates a long-term capital gain distribution of $237,565 at the 15% rate.
OTHER INFORMATION
A description of the policies and procedures that the fund uses to determine how to vote proxies relating to portfolio securities is available (i) without charge, upon request, by calling 1-800-330-7348, (ii) on our Web site at cohenandsteers.com or (iii) on the Securities and Exchange Commission's Web site at http://www.sec.gov. In addition, the fund's proxy voting record for the most recent 12-month period ended June 30 is available (i) without charge, upon request, by calling 1-800-330-7348 or (ii) on the SEC's Web site at http://www.sec.gov.
The fund files its complete schedule of portfolio holdings with the SEC for the first and third quarters of each fiscal year on Form N-Q. The fund's Forms N-Q are available (i) without charge, upon request by calling 1-800-330-7348, or (ii) on the SEC's Web site at http://www.sec.gov. In addition, the Forms N-Q may be reviewed and copied at the SEC's Public Reference Room in Washington, DC. Information on the operation of the Public Reference Room may be obtained by calling 1-800-SEC-0330.
Please note that the distributions paid by the fund to shareholders are subject to recharacterization for tax purposes. The final tax treatment of these distributions is reported to shareholders on their 1099-DIV forms, which are mailed to shareholders after the close of each fiscal year. The fund may pay distributions in excess of the fund's net investment company taxable income and this excess would be a tax-free return of capital distributed from the fund's assets. To the extent this occurs, the fund's shareholders of record will be notified of the estimated amount of capital returned to shareholders for each such distribution and this information will also be available at cohenandsteers.com. Distributions of capital decrease the fund's total assets and, therefore, could have the effect of increasing the fund's expense ratio. In addition, in order to make these distributions, the fund may have to sell portfolio securities at a less than o pportune time.
29
COHEN & STEERS REALTY FOCUS FUND, INC.
MANAGEMENT OF THE FUND
The business and affairs of the fund are managed under the direction of the board of directors. The board of directors approves all significant agreements between the fund and persons or companies furnishing services to it, including the fund's agreements with its advisor, administrator, custodian and transfer agent. The management of the fund's day-to-day operations is delegated to its officers, the advisor and the fund's administrator, subject always to the investment objective and policies of the fund and to the general supervision of the board of directors.
The directors and officers of the fund and their principal occupations during the past five years are set forth below. The statement of additional information (SAI) includes additional information about fund directors and is available, without charge, upon request by calling 1-800-330-7348.
| Name, Address and Age* | | Position(s) Held
with Fund | | Term of
Office | | Principal Occupation
During Past 5 Years
(Including Other
Directorships Held) | | Number of
Funds Within
Fund
Complex
Overseen by
Director
(Including
the Fund) | |
Length
of Time
Served** | |
| Interested Directors1 | |
|
Robert H. Steers
Age: 52 | | Director and Co-Chairman | | Until next election of directors | | Co-Chairman and Co-Chief Executive Officer of Cohen & Steers Capital Management, Inc. (CSCM), the fund's investment manager, and its parent company, Cohen & Steers, Inc. (CNS) since 2004. President and Director, Cohen & Steers Securities, LLC (CSSL), the Cohen & Steers open-end funds' distributor. Prior thereto, Chairman of CSCM and the Cohen & Steers funds. | | | 17 | | | 1991 to present | |
|
Martin Cohen
Age: 56 | | Director and Co-Chairman | | Until next election of directors | | Co-Chairman and Co-Chief Executive Officer of CSCM and CNS. Vice President and Director of CSSL. Prior thereto, President of the CSCM and the Cohen & Steers funds. | | | 17 | | | 1991 to present | |
|
(table continued on next page)
* The address for each director is 280 Park Avenue, New York, NY 10017.
** The length of time served represents the year in which the director was first elected or appointed to any fund in the Cohen & Steers fund complex.
1 "Interested person", as defined in the 1940 Act, of the fund because of affiliation with CSCM.
30
COHEN & STEERS REALTY FOCUS FUND, INC.
(table continued from previous page)
| Name, Address and Age* | | Position(s) Held
with Fund | | Term of
Office | | Principal Occupation
During Past 5 Years
(Including Other
Directorships Held) | | Number of
Funds Within
Fund
Complex
Overseen by
Director
(Including
the Fund) | |
Length
of Time
Served** | |
| Disinterested Directors | |
|
Bonnie Cohen2
Age: 63 | | Director | | Until next election of directors | | Consultant. Prior thereto, Undersecretary of State, United States Department of State. Director of Wellsford Real Properties, Inc. | | | 17 | | | 2001 to present | |
|
George Grossman
Age: 52 | | Director | | Until next election of directors | | Attorney-at-law | | | 17 | | | 1993 to present | |
|
Richard E. Kroon
Age: 63 | | Director | | Until next election of directors | | Board member of Finlay Enterprises, Inc., (operator of department store fine jewelry leased departments) and several private companies; member of Investment Subcommittee, Monmouth University; retired Chairman and Managing Partner of the Sprout Group venture capital funds, then an affiliate of Donaldson, Lufkin & Jenrette Securities Corporation; and former Chairman of the National Venture Capital Association. | | | 17 | | | 2004 to present | |
|
Richard J. Norman
Age: 62 | | Director | | Until next election of directors | | Private Investor. President of the Board of Directors of Maryland Public Television, Board Member of the Salvation Army. Prior thereto, Investment Representative of Morgan Stanley Dean Witter. | | | 17 | | | 2001 to present | |
|
(table continued on next page)
* The address for each director is 280 Park Avenue, New York, NY 10017.
** The length of time served represents the year in which the director was first elected or appointed to any fund in the Cohen & Steers fund complex.
2 Martin Cohen and Bonnie Cohen are not related.
31
COHEN & STEERS REALTY FOCUS FUND, INC.
(table continued from previous page)
| Name, Address and Age* | | Position(s) Held
with Fund | | Term of
Office | | Principal Occupation
During Past 5 Years
(Including Other
Directorships Held) | | Number of
Funds Within
Fund
Complex
Overseen by
Director
(Including
the Fund) | |
Length
of Time
Served** | |
Frank K. Ross
Age: 62 | | Director | | Until next election of directors | | Professor of Accounting, Howard University; Board member of NCRIC Group, Inc. (insurance) and Pepco Holdings, Inc. (electric utility). Formerly, Midatlantic Area Managing Partner for Audit and Risk Advisory Services at KPMG LLP and Managing Partner of its Washington, DC office. | | | 17 | | | 2004 to present | |
|
Willard H. Smith Jr.
Age: 69 | | Director | | Until next election of directors | | Board member of Essex Property Trust Inc., Realty Income Corporation and Crest Net Lease, Inc. Managing Director at Merrill Lynch & Co., Equity Capital Markets Division from 1983 to 1995. | | | 17 | | | 1996 to present | |
|
C. Edward Ward, Jr.
Age: 59 | | Director | | Until next election of directors | | Member of the Board of Trustees of Directors Manhattan College, Riverdale, New York. Formerly head of closed-end fund listings for the New York Stock Exchange. | | | 17 | | | 2004 to present | |
|
* The address for each director is 280 Park Avenue, New York, NY 10017.
** The length of time served represents the year in which the director was first elected or appointed to any fund in the Cohen & Steers fund complex.
32
COHEN & STEERS REALTY FOCUS FUND, INC.
The officers of the fund (other than Messrs. Cohen and Steers, whose biographies are provided above), their address, their ages and their principal occupations for at least the past five years are set forth below.
| Name, Address and Age* | | Position(s) Held
with Fund | | Principal Occupation During Past 5 Years | | Length
of Time
Served** | |
Adam M. Derechin
Age: 41 | | President and Chief Executive Officer | | Chief Operating Officer of CSCM (since 2003) and CNS (since 2004). Prior to that, Senior Vice President of CSCM and Vice President and Assistant Treasurer of the Cohen & Steers funds. | | Since 2005 | |
|
Joseph M. Harvey
Age: 42 | | Vice President | | President of CSCM (since 2003) and CNS (since 2004). Prior to that, Senior Vice President and Director of Investment Research of CSCM. | | Since 2004 | |
|
James S. Corl
Age: 39 | | Vice President | | Executive Vice President of CSCM and CNS since 2004. Prior to that, Senior Vice President of CSCM. | | Since 2004 | |
|
Lawrence B. Stoller
Age: 42 | | Secretary | | Executive Vice President and General Counsel of CSCM and CNS since 2004. Secretary of CSSL since 2006. Prior to that, Senior Vice President and General Counsel of CSCM and Assistant Secretary of the Cohen & Steers funds (since 1999) and Chief Legal Officer of CSSL (since 2002). | | Since 2005 | |
|
Jay J. Chen
Age: 42 | | Treasurer and Chief Financial Officer | | Senior Vice President of CSCM since August 2003 and Assistant Treasurer of CSSL since 2002. Prior to that, Vice President of CSCM. | | Since 2005 | |
|
John E. McLean
Age: 34 | | Chief Compliance Officer and Assistant Secretary | | Vice President and Associate General Counsel of CSCM since September 2003. Prior to that, Vice President, Law and Regulation, J&W Seligman & Co. Incorporated (money manager). | | Since 2004 | |
|
* The address of each officer is 280 Park Avenue, New York, NY 10017
** Officers serve one-year terms. The length of time served represents the year in which the officer was first elected to that position in any fund in the Cohen & Steers fund complex. All of the officers listed above are officers of one or more of the other funds in the complex.
33
COHEN & STEERS REALTY FOCUS FUND, INC.
Meet the Cohen & Steers family of open-end funds:

• Designed for investors seeking maximum total return, investing primarily in REITs
• Symbol: CSRSX

• Designed for institutional investors seeking maximum total return, investing primarily in REITs
• Symbol: CSRIX

• Designed for investors seeking high current income, investing primarily in REITs
• Symbols: CSEIX, CSBIX, CSCIX, CSDIX

• Designed for investors seeking maximum capital appreciation, investing in a limited number of REITs and other real estate securities
• Symbols: CSFAX, CSFBX, CSFCX, CSSPX

• Designed for investors seeking maximum total return, investing primarily in international real estate securities
• Symbols: IRFAX, IRFCX, IRFIX

• Designed for investors seeking maximum total return, investing primarily in utilities
• Symbols: CSUAX, CSUBX, CSUCX, CSUIX

• Designed for investors seeking high current income and long-term growth of income and capital appreciation, investing primarily in dividend paying common stocks and preferred stocks.
• Symbols: DVFAX, DVFCX, DVFIX
Please consider the investment objectives, risks, charges and expenses of the fund carefully before investing. A prospectus containing this and other information can be obtained by calling 800-330-7348 or by visting cohenandsteers.com. Please read the prospectus carefully before investing.
Cohen & Steers Securities, LLC, Distributor
34
COHEN & STEERS REALTY FOCUS FUND, INC.
OFFICERS AND DIRECTORS
Robert H. Steers
Director and co-chairman
Martin Cohen
Director and co-chairman
Bonnie Cohen
Director
George Grossman
Director
Richard E. Kroon
Director
Richard J. Norman
Director
Frank K. Ross
Director
Willard H. Smith Jr.
Director
C. Edward Ward, Jr.
Director
Adam M. Derechin
President and chief executive officer
Joseph M. Harvey
Vice president
James S. Corl
Vice president
Lawrence B. Stoller
Secretary
Jay J. Chen
Treasurer and chief financial officer
John E. McLean
Chief compliance officer and assistant secretary
KEY INFORMATION
Investment Advisor
Cohen & Steers Capital Management, Inc.
280 Park Avenue
New York, NY 10017
(212) 832-3232
Fund Subadministrator and Custodian
State Street Bank and Trust Company
225 Franklin Street
Boston, MA 02110
Transfer Agent
Boston Financial Data Services, Inc.
66 Brooks Drive
Braintree, MA 02184
(800) 437-9912
Legal Counsel
Stroock & Stroock & Lavan LLP
180 Maiden Lane
New York, NY 10038
Distributor
Cohen & Steers Securities, LLC
280 Park Avenue
New York, NY 10017
Nasdaq Symbol: Class A—CSFAX
B—CSFBX
C—CSFCX
I— CSSPX
Web site: cohenandsteers.com
This report is authorized for delivery only to shareholders of Cohen & Steers Realty Focus Fund, Inc. unless accompanied or preceded by the delivery of a currently effective prospectus setting forth details of the fund. Past performance of course, is no guarantee of future results and your investment may be worth more or less at the time you sell.
35
COHEN & STEERS
REALTY FOCUS FUND
280 PARK AVENUE
NEW YORK, NY 10017

ANNUAL REPORT
DECEMBER 31, 2005
Item 2. Code of Ethics.
The registrant has adopted a Code of Ethics that applies to its Principal Executive Officer and Principal Financial Officer. The registrant undertakes to provide to any person without charge, upon request, a copy of the Code of Ethics. Such request can be made by calling 800-330-7348 or writing to the Secretary of the registrant, 280 Park Avenue, New York, NY 10017.
Item 3. Audit Committee Financial Expert.
The registrant’s board has determined that Frank K. Ross, a member of the board’s audit committee, is an “audit committee financial expert”. Mr. Ross is “independent,” as such term is defined in this Item.
Item 4. Principal Accountant Fees and Services.
(a) – (d) Aggregate fees billed to the registrant for the last two fiscal years for professional services rendered by the registrant’s principal accountant were as follows:
| | 2005 | | 2004 | |
Audit Fees | | $ | 49,500 | | $ | 52,500 | |
Audit-Related Fees | | 4,500 | | 6,000 | |
Tax Fees | | 12,975 | | 12,600 | |
All Other Fees | | — | | — | |
| | | | | | | |
Audit-related fees were billed in connection with agreed upon procedures performed by the registrant’s principal accountant relating to after-tax return calculations. Tax fees were billed in connection with the preparation of tax returns, calculation and designation of dividends and other miscellaneous tax services.
Aggregate fees billed by the registrant’s principal accountant for the last two fiscal years for non-audit services provided to the registrant’s investment adviser (not including a sub-adviser whose role is primarily portfolio management and is subcontracted or overseen by another investment adviser) and any entity controlling, controlled by, or under common control with the investment adviser that provides ongoing services to the registered investment company, where the engagement relates directly to the operations and financial reporting of the registrant, were as follows:
| | 2005 | | 2004 | |
Audit-Related Fees | | — | | — | |
Tax Fees | | — | | — | |
All Other Fees | | $ | 85,000 | | $ | 62,500 | |
| | | | | | | |
These other fees were billed in connection with internal control reviews and AIMR performance reviews.
(e)(1) The audit committee is required to pre-approve audit and non-audit services performed for the registrant by the principal accountant. The audit committee also is required to pre-approve non-audit services performed by the registrant’s principal accountant for the registrant’s investment adviser and any sub-adviser (not including any sub-adviser whose role is primarily portfolio management and is subcontracted with or overseen by another investment adviser) and/or to any entity controlling, controlled by or under common control with the registrant’s investment adviser that provides ongoing services to the registrant, if the engagement for services relates directly to the operations and financial reporting of the registrant.
The audit committee may delegate pre-approval authority to one or more of its members who are independent members of the board of directors of the registrant. The member or members to whom such authority is delegated shall report any pre-approval decisions to the audit committee at its next scheduled meeting. The audit committee may not delegate its responsibility to pre-approve services to be performed by the registrant’s principal accountant to the investment adviser.
(e) (2) No services included in (b) – (d) above were approved by the audit committee pursuant to paragraphs (c)(7)(i)(C) of Rule 2-01 of Regulation S-X.
(f) Not applicable.
(g) For the fiscal years ended December 31, 2005 and December 31, 2004, the aggregate fees billed by the registrant’s principal accountant for non-audit services rendered to the registrant and for non-audit services rendered to the registrant’s investment adviser (not including any sub-adviser whose role is primarily portfolio management and is subcontracted with or overseen by another investment adviser) and/or to any entity controlling, controlled by or under common control with the registrant’s investment adviser that provides ongoing services to the registrant were $102,475 and $86,600, respectively.
(h) The registrant’s audit committee considered whether the provision of non-audit services that were rendered to the registrant’s investment adviser (not including any sub-adviser whose role is primarily portfolio management and is subcontracted with or overseen by another investment adviser) and/or to any entity controlling, controlled by or under common control with the registrant’s investment adviser that provides ongoing services to the registrant that were not required to be pre-approved pursuant to paragraph (c)(7)(ii) of Rule 2-01 of Regulation S-X was compatible with maintaining the principal accountant’s independence.
Item 5. Audit Committee of Listed Registrants.
Not applicable.
Item 6. Schedule of Investments.
Included in Item 1 above.
Item 7. Disclosure of Proxy Voting Policies and Procedures for Closed-End Management Investment Companies.
Not applicable.
Item 8. Portfolio Managers of Closed-End Investment Companies.
Not applicable.
Item 9. Purchases of Equity Securities by Closed-End Management Investment Company and Affiliated Purchasers.
Not applicable.
Item 10. Submission of Matters to a Vote of Security Holders.
Not applicable.
Item 11. Controls and Procedures.
(a) The registrant’s principal executive officer and principal financial officer have concluded that the registrant’s disclosure controls and procedures are reasonably designed to ensure that information required to be disclosed by the registrant in this Form N-CSR was recorded, processed, summarized and reported within the time periods specified in the Securities and Exchange Commission’s rules and forms, based upon such officers’ evaluation of these controls and procedures as of a date within 90 days of the filing date of this report.
(b) There were no changes in the registrant’s internal control over financial reporting that occurred during the second fiscal quarter of the period covered by this report that have materially affected, or are reasonably likely to materially affect, the registrant’s internal control over financial reporting.
Item 12. Exhibits.
(a)(1) Not applicable.
(a) (2) Certifications of principal executive officer and principal financial officer as required by Rule 30a-2(a) under the Investment Company Act of 1940.
(b) Certifications of chief executive officer and chief financial officer as required by Rule 30a- 2(b) under the Investment Company Act of 1940.
SIGNATURES
Pursuant to the requirements of the Securities Exchange Act of 1934 and the Investment Company Act of 1940, the registrant has duly caused this report to be signed on its behalf by the undersigned, thereunto duly authorized.
COHEN & STEERS REALTY FOCUS FUND, INC. |
|
|
| By: | /s/ Adam M. Derechin | | |
| | Name: Adam M. Derechin |
| | Title: President and Chief Executive Officer |
| | |
| Date: March 6, 2006 | |
| | | | | |
Pursuant to the requirements of the Securities Exchange Act of 1934 and the Investment Company Act of 1940, this report has been signed below by the following persons on behalf of the registrant and in the capacities and on the dates indicated.
| By: | /s/ Adam M. Derechin | | |
| | Name: | Adam M. Derechin |
| | Title: | President and Chief Executive Officer |
| | | (principal executive officer) |
| | | | | | |
| By: | /s/ Jay J. Chen | | |
| | Name: | Jay J. Chen |
| | Title: | Treasurer |
| | | (principal financial officer) |
| | |
| | |
| Date: March 6, 2006 | |
| | | | | | |