UNITED STATES
SECURITIES AND EXCHANGE COMMISSION
Washington, D.C. 20549
FORM N-CSR
CERTIFIED SHAREHOLDER REPORT OF REGISTERED
MANAGEMENT INVESTMENT COMPANIES
Investment Company Act file number | 811-8059 |
|
Cohen & Steers Realty Focus Fund, Inc. |
(Exact name of registrant as specified in charter) |
|
280 Park Avenue, New York, NY | | 10017 |
(Address of principal executive offices) | | (Zip code) |
|
Adam M. Derechin Cohen & Steers Capital Management, Inc. 280 Park Avenue New York, New York 10017 |
(Name and address of agent for service) |
|
Registrant’s telephone number, including area code: | (212) 832-3232 | |
|
Date of fiscal year end: | December 31 | |
|
Date of reporting period: | December 31, 2006 | |
| | | | | | | | | |
Item 1. Reports to Stockholders.
COHEN & STEERS REALTY FOCUS FUND, INC.
February 9, 2007
To Our Shareholders:
We are pleased to submit to you our report for the year ended December 31, 2006. The net asset values per share at that date were $69.88, $69.65, $69.68 and $70.14 for Class A, Class B, Class C and Class I shares, respectively. In addition, a distribution was declared for shareholders of record on December 21, 2006 and paid on December 22, 2006 to all four classes of shares.a The distribution was as follows:
| | | Total
Distribution | | Ordinary
Income | | Short-Term
Capital Gain | | Long-Term
Capital Gain | |
| Class A | | $ | 6.794 | | | $ | 0.824 | | | $ | 3.51 | | | $ | 2.46 | | |
| Class B | | $ | 6.580 | | | $ | 0.610 | | | $ | 3.51 | | | $ | 2.46 | | |
| Class C | | $ | 6.585 | | | $ | 0.615 | | | $ | 3.51 | | | $ | 2.46 | | |
| Class I | | $ | 6.914 | | | $ | 0.944 | | | $ | 3.51 | | | $ | 2.46 | | |
The total return, including income and change in net asset value, for Cohen and Steers Realty Focus Fund and the comparative benchmarks were:
| | | Six Months Ended
12/31/06 | | Year Ended
12/31/06 | |
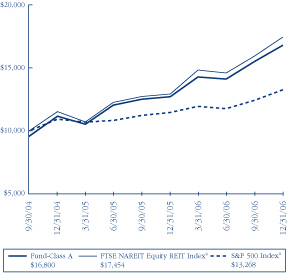
| Cohen and Steers Realty Focus Fund—Class A | | | 19.03 | % | | | 32.14 | % | |
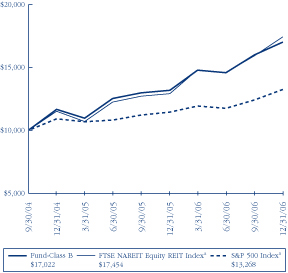
| Cohen and Steers Realty Focus Fund—Class B | | | 18.64 | % | | | 31.29 | % | |
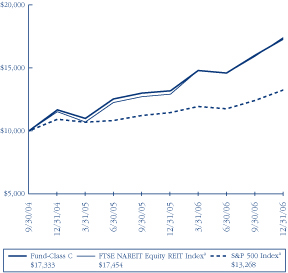
| Cohen and Steers Realty Focus Fund—Class C | | | 18.64 | % | | | 31.28 | % | |
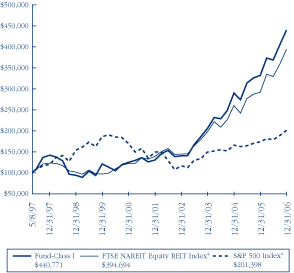
| Cohen and Steers Realty Focus Fund—Class I | | | 19.25 | % | | | 32.62 | % | |
| FTSE NAREIT Equity REIT Indexb | | | 19.61 | % | | | 35.06 | % | |
| S&P 500 Indexb | | | 12.75 | % | | | 15.80 | % | |
The performance data quoted represent past performance. Past performance is no guarantee of future results. The investment return and the principal value of an investment will fluctuate and shares, if redeemed, may be worth more or less than their original cost. Current performance may be lower or higher than the performance data quoted. Total returns of the fund current to the most recent month-end can be obtained by visiting our Web site at cohenandsteers.com. Performance quoted does not reflect the deduction of the maximum 4.5% initial sales charge on Class A shares or the 5% and 1% maximum sales contingent deferred sales charge on Class B and Class C shares, respectively. If such charges were included, returns would have been lower.
a Please note that distributions paid by the fund to shareholders are subject to recharacterization for tax purposes. The final tax treatment of these distributions is reported to shareholders after the close of each fiscal year.
b The FTSE NAREIT Equity REIT Index is an unmanaged, market capitalization weighted index of all publicly traded REITs that invest predominantly in the equity ownership of real estate. The index is designed to reflect the performance of all publicly traded equity REITs as a whole. The S&P 500 Index is an unmanaged index of common stocks that is frequently used as a general measure of stock market performance.
1
COHEN & STEERS REALTY FOCUS FUND, INC.
Investment Review
Real estate securities performed well both in absolute terms and compared with the broader U.S. stock market, reflecting strong underlying real estate fundamentals and earnings that generally met or exceeded expectations. In addition, a global phenomenon of abundant investor demand for the investment characteristics that real estate provides benefited REITs, as investors willingly accepted lower yields for property investments. Finally, and perhaps most profoundly, investors began to recognize that, with the end of the disinflationary period that began in 1981, the implicit inflation-hedging characteristics historically offered by real property have again become valuable.
Public markets, private value
Reflecting the fluidity between public and private markets for real estate to a greater extent than ever, activity on both the M&A and IPO fronts continued. In a notable example of the latter, Douglas Emmett, a company focused on Los Angeles office and apartment properties, went public in late October, raising in excess of $1.6 billion. It was the largest IPO in U.S. REIT history. Investor enthusiasm for sizable income-producing property companies was evident in the successful offering—the deal was boosted to 66 million shares, up from the 55 million shares the firm initially proposed—and the fact that it was the fourth U.S. REIT to raise equity of more than $1 billion in 2006.
In November, Equity Office Properties Trust agreed to be acquired by The Blackstone Group, in a transaction valued at $36 billion—an 8.5% premium to the stock's prior business-day closing price. In the weeks since, into February 2007, a bidding contest with Vornado Realty Trust has driven the price up to $39 billion. This transaction demonstrated that any portfolio of well-located, high-quality properties, regardless of size, is a potential source of value, considering that EOP is the third-largest U.S. REIT (measured by market capitalization) and is set to be the largest-ever LBO of any type. With office values continuing to rise, supported by growth in rental rates and occupancy levels, many private investors have been valuing real estate cash flows more aggressively than the public markets, albeit with the leveraging flexibility available to private buyers.
Performance: Across the board strength
All sectors within the NAREIT benchmark enjoyed double-digit gains in 2006, as rising demand for all types of space continued to outstrip supply, restrained in part by high construction costs in some markets. Job creation, which has been underway for three years as profitable businesses added to payrolls, continued despite a slowing of GDP growth. In the office sector, a top performer, this was reflected in rising demand and rents for office space. Apartments also outperformed as buyer sentiment towards owner-occupied housing turned bearish. As consumers became increasingly leery of the run-up in home prices, they realized that renting was the most affordable, relative to owning, it had been in the U.S. since the early 1980s.
More business-related travel, meanwhile, supported hotel demand, which sustained itself at a higher level than was generally expected. One area where job growth has been lackluster is manufacturing; the warehouse sector
2
COHEN & STEERS REALTY FOCUS FUND, INC.
nonetheless had a good absolute return due to strong absorption of warehouse space, driven by significant manufacturing productivity gains, higher output and international trade. Regional malls underperformed as a group, on stock-specific weakness and fears that dwindling home equity would sap consumer vitality.
Apartments outperform
Factors that detracted from the fund's performance included stock selection in the regional mall sector. The fund's office and hotel stocks had solid performance in absolute terms, but trailed their respective components of the benchmark. Factors that helped the fund's performance included good stock selection in the apartment sector. Stock selection in the health care and diversified sectors was favorable as well.
Investment Outlook
Fundamentals still positive
The strong returns for real estate securities in 2006 were generated amid a slowing economy. The moderate GDP growth slowdown that we had forecast in our last annual report was accompanied by ongoing job growth, as noted above, and we expect the general employment picture to remain healthy. That said, real estate securities have now outperformed the broader U.S. stock market with sizable double-digit gains for the fourth straight year. We do not expect results of similar magnitude in 2007, although based on our view of market sentiment, real estate fundamentals and valuations, we see the potential for attractive total returns, barring an unforeseen and dramatic economic pullback.
We believe sentiment toward real estate securities has moved from overtly bearish to approximately neutral. For example, Wall Street estimates of REIT total returns in 2007 are mostly positive, commensurate with our view, as opposed to the previous two years, when analysts were calling for flat to negative total returns. At the same time, the rapid acceleration of real estate fundamentals will most likely moderate somewhat in the coming year. Therefore, because the P/E multiple expansion stemming from the past three years of accelerating fundamentals has probably run its course—projected 2007 REIT cash flow growth, for example, is in the 9% range, a marginal acceleration from 2006 levels—we do not expect any further widespread multiple expansion.
Finally, from a valuation perspective, our view is commensurately neutral as well. With multiples high—due to higher observable worldwide asset values for real estate—and asset value premiums at historical norms, we believe REITs are fairly valued today. Therefore, in contrast to recent years, we are expecting more normalized returns in 2007 for real estate stocks, based on solid dividend yields and continued attractive growth in cash flow.
3
COHEN & STEERS REALTY FOCUS FUND, INC.
Sincerely,
 | |  | |
|
| MARTIN COHEN | | ROBERT H. STEERS | |
|
| Co-chairman | | Co-chairman | |
|
 | |  | |
|
| JOSEPH M. HARVEY | | JAMES S. CORL | |
|
| Portfolio Manager | | Portfolio Manager | |
|
The views and opinions in the preceding commentary are as of the date stated and are subject to change. This material represents an assessment of the market environment at a specific point in time, should not be relied upon as investment advice and is not intended to predict or depict performance of any investment.
Visit Cohen & Steers online at cohenandsteers.com
For more information about any of our funds, visit cohenandsteers.com, where you'll find daily net asset values, fund fact sheets and portfolio highlights. You can also access newsletters, education tools and market updates covering REIT, utility and preferred securities sectors.
In addition, our Web site contains comprehensive information about our firm, including our most recent press releases, profiles of our senior investment professionals, and an overview or our investment approach.
4
COHEN & STEERS REALTY FOCUS FUND, INC.
Performance Review (Unaudited)
Cohen & Steers Realty Focus Fund—Class A
Growth of a $10,000 Investment
Cohen & Steers Realty Focus Fund—Class B
Growth of a $10,000 Investment
Cohen & Steers Realty Focus Fund—Class C
Growth of a $10,000 Investment
Cohen & Steers Realty Focus Fund—Class I
Growth of a $100,000 Investment
5
COHEN & STEERS REALTY FOCUS FUND, INC.
Performance Review (Unaudited)—(Continued)
| | | Class A Shares | | Class B Shares | | Class C Shares | | Class I Shares | |
| 1 Year (with sales charge) | | | 26.19 | %b | | | 26.29 | %c | | | 30.28 | %e | | | — | | |
| 1 Year (without sales charge) | | | 32.14 | % | | | 31.29 | % | | | 31.28 | % | | | 32.62 | % | |
| 5 Years (without sales charge) | | | — | | | | — | | | | — | | | | 27.61 | % | |
Since Inceptionf (with sales
charge) | | | 25.93 | %b | | | 26.67 | %d | | | 27.69 | % | | | — | | |
Since Inceptionf (without sales
charge) | | | 28.53 | % | | | 27.65 | % | | | 27.69 | % | | | 16.62 | % | |
The performance data quoted represent past performance. Past performance is no guarantee of future results. The investment return and principal value of an investment will fluctuate and shares, when redeemed, may be worth more or less than their original cost. Current performance may be lower or higher than the performance data quoted. Performance information current to the most recent month-end can be obtained by visiting our Web site at cohenandsteers.com. Fund performance during certain periods reflects strong market performance and/or strong performance of stocks held during those periods. This performance may not be repeated. The performance graph and table do not reflect the deduction of taxes that a shareholder would pay on fund distributions or the redemption of fund shares.
Through December 31, 2007, the fund's advisor has contractually agreed to waive certain fees and/or reimburse the fund for expenses. Absent such arrangements, returns would have been lower.
a The comparative indexes are not adjusted to reflect expenses or other fees that the SEC requires to be reflected in the fund's performance. The fund's performance assumes the reinvestment of all dividends and distributions. For more information, including charges and expenses, please read the prospectus carefully before you invest.
b Reflects a 4.50% front-end sales charge.
c Reflects a contingent deferred sales charge of 5%.
d Reflects a contingent deferred sales charge of 3%.
e Reflects a contingent deferred sales charge of 1%.
f Inception dates: September 30, 2004 for Class A, B, and C and May 8, 1997 for Class I.
6
COHEN & STEERS REALTY FOCUS FUND, INC.
Expense Example (Unaudited)
As a shareholder of the fund, you incur two types of costs: (1) transaction costs, including sales charges (loads) on purchase payments and redemption fees and (2) ongoing costs including management fees; distribution and/or service (12b-1) fees; and other fund expenses. This example is intended to help you understand your ongoing costs (in dollars) of investing in the fund and to compare these costs with the ongoing costs of investing in other mutual funds.
The example is based on an investment of $1,000 invested at the beginning of the period and held for the entire period 07/01/06 – 12/31/06.
Actual Expenses
The first line of the table below provides information about actual account values and expenses. You may use the information in this line, together with the amount you invested, to estimate the expenses that you paid over the period. Simply divide your account value by $1,000 (for example, an $8,600 account value divided by $1,000 = 8.6), then multiply the result by the number in the first line under the heading entitled "Expenses Paid During Period" to estimate the expenses you paid on your account during this period.
Hypothetical Example for Comparison Purposes
The second line of the table below provides information about hypothetical account values and hypothetical expenses based on the fund's actual expense ratio and an assumed rate of return of 5% per year before expenses, which is not the fund's actual return. The hypothetical account values and expenses may not be used to estimate the actual ending account balance or expenses you paid for the period. You may use this information to compare the ongoing cost of investing in the fund and other funds. To do so, compare this 5% hypothetical example with the 5% hypothetical examples that appear in the shareholder reports of the other funds.
Please note that the expenses shown in the table are meant to highlight your ongoing costs only and do not reflect any transactional costs, such as sales charges (loads) and redemption fees. Therefore, the second line of the table is useful in comparing ongoing costs only, and will not help you determine the relative total costs of owning different funds. In addition, if these transactional costs were included, your costs would have been higher.
7
COHEN & STEERS REALTY FOCUS FUND, INC.
Expense Example (Unaudited)—(Continued)
| | | Beginning
Account Value
07/01/06 | | Ending
Account Value
12/31/06 | | Expenses Paid
During Period*
07/01/06–
12/31/06 | |
| Class A | |
| Actual (19.03% return) | | $ | 1,000.00 | | | $ | 1,190.30 | | | $ | 9.11 | | |
| Hypothetical (5% annual return before expenses) | | $ | 1,000.00 | | | $ | 1,016.89 | | | $ | 8.39 | | |
| Class B | |
| Actual (18.64% return) | | $ | 1,000.00 | | | $ | 1,186.40 | | | $ | 12.68 | | |
| Hypothetical (5% annual return before expenses) | | $ | 1,000.00 | | | $ | 1,013.61 | | | $ | 11.67 | | |
| Class C | |
| Actual (18.64% return) | | $ | 1,000.00 | | | $ | 1,186.40 | | | $ | 12.68 | | |
| Hypothetical (5% annual return before expenses) | | $ | 1,000.00 | | | $ | 1,013.61 | | | $ | 11.67 | | |
| Class I | |
| Actual (19.25% return) | | $ | 1,000.00 | | | $ | 1,192.50 | | | $ | 7.18 | | |
| Hypothetical (5% annual return before expenses) | | $ | 1,000.00 | | | $ | 1,018.65 | | | $ | 6.61 | | |
* Expenses are equal to the fund's Class A, Class B, Class C and Class I annualized expense ratio of 1.65%, 2.30%, 2.30% and 1.30%, respectively, multiplied by the average account value over the period, multiplied by 184/365 (to reflect the one-half year period).
8
COHEN & STEERS REALTY FOCUS FUND, INC.
DECEMBER 31, 2006
Top Ten Holdings
(Unaudited)
| Security | | Market
Value | | % of
Net
Assets | |
| Equity Office Properties Trust | | $ | 15,630,346 | | | | 6.9 | % | |
| Brookfield Properties Corp. | | | 12,929,738 | | | | 5.7 | | |
| Parkway Properties | | | 12,395,430 | | | | 5.5 | | |
| AvalonBay Communities | | | 11,509,425 | | | | 5.1 | | |
| Federal Realty Investment Trust | | | 11,050,000 | | | | 4.9 | | |
| Equity Residential | | | 11,048,275 | | | | 4.9 | | |
| Host Hotels & Resorts | | | 9,963,691 | | | | 4.4 | | |
| Liberty Property Trust | | | 9,926,280 | | | | 4.4 | | |
| Mid-America Apartment Communities | | | 8,477,244 | | | | 3.8 | | |
| Apartment Investment & Management Co. | | | 8,470,224 | | | | 3.8 | | |
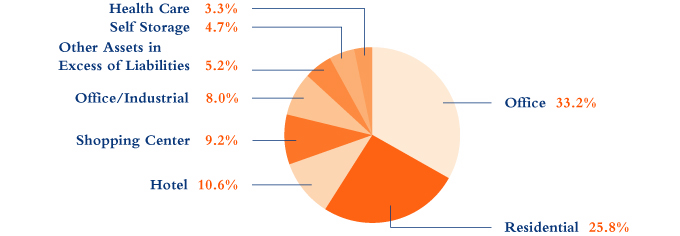
Sector Breakdown
(Based on Net Assets)
(Unaudited)
9
COHEN & STEERS REALTY FOCUS FUND, INC.
SCHEDULE OF INVESTMENTS
December 31, 2006
| | | | | Number
of Shares | | Value | |
| COMMON STOCK | | | 94.8 | % | | | | | | | | | |
| HEALTH CARE | | | 3.3 | % | | | | | | | | | |
| Senior Housing Properties Trust | | | | | | | 306,200 | | | $ | 7,495,776 | | |
| HOTEL | | | 10.6 | % | | | | | | | | | |
| Hilton Hotels Corp. | | | | | | | 45,600 | | | | 1,591,440 | | |
| Host Hotels & Resorts | | | | | | | 405,853 | | | | 9,963,691 | | |
| Starwood Hotels & Resorts Worldwide | | | | | | | 104,300 | | | | 6,518,750 | | |
| Strategic Hotels & Resorts | | | | | | | 266,500 | | | | 5,807,035 | | |
| | | | | | | | 23,880,916 | | |
| OFFICE | | | 33.2 | % | | | | | | | | | |
| Alexandria Real Estate Equities | | | | | | | 65,800 | | | | 6,606,320 | | |
| BioMed Realty Trust | | | | | | | 132,800 | | | | 3,798,080 | | |
| Brookfield Properties Corp. | | | | | | | 328,750 | | | | 12,929,738 | | |
| Equity Office Properties Trust | | | | | | | 324,483 | | | | 15,630,346 | | |
| Forest City Enterprises | | | | | | | 108,800 | | | | 6,353,920 | | |
| Kilroy Realty Corp. | | | | | | | 107,200 | | | | 8,361,600 | | |
| Mack-Cali Realty Corp. | | | | | | | 101,200 | | | | 5,161,200 | | |
| Parkway Properties | | | | | | | 243,000 | | | | 12,395,430 | | |
| Thomas Properties Group | | | | | | | 225,200 | | | | 3,596,444 | | |
| | | | | | | | 74,833,078 | | |
| OFFICE/INDUSTRIAL | | | 8.0 | % | | | | | | | | | |
| EastGroup Properties | | | | | | | 151,500 | | | | 8,114,340 | | |
| Liberty Property Trust | | | | | | | 202,000 | | | | 9,926,280 | | |
| | | | | | | | 18,040,620 | | |
| RESIDENTIAL | | | 25.8 | % | | | | | | | | | |
| APARTMENT | | | 24.6 | % | | | | | | | | | |
| Apartment Investment & Management Co. | | | | | | | 151,200 | | | | 8,470,224 | | |
| AvalonBay Communities | | | | | | | 88,500 | | | | 11,509,425 | | |
| BRE Properties | | | | | | | 126,500 | | | | 8,225,030 | | |
| Equity Residential | | | | | | | 217,700 | | | | 11,048,275 | | |
| Essex Property Trust | | | | | | | 59,200 | | | | 7,651,600 | | |
| Mid-America Apartment Communities | | | | | | | 148,100 | | | | 8,477,244 | | |
| | | | | | | | 55,381,798 | | |
See accompanying notes to financial statements.
10
COHEN & STEERS REALTY FOCUS FUND, INC.
SCHEDULE OF INVESTMENTS—(Continued)
December 31, 2006
| | | | | Number
of Shares | | Value | |
| MANUFACTURED HOME | | | 1.2 | % | | | | | | | | | |
| Sun Communities | | | | | | | 87,000 | | | $ | 2,815,320 | | |
| TOTAL RESIDENTIAL | | | | | | | | | | | 58,197,118 | | |
| SELF STORAGE | | | 4.7 | % | | | | | | | | | |
| Extra Space Storage | | | | | | | 306,600 | | | | 5,598,516 | | |
| U-Store-It Trust | | | | | | | 244,800 | | | | 5,030,640 | | |
| | | | | | | | 10,629,156 | | |
| SHOPPING CENTER | | | 9.2 | % | | | | | | | | | |
| COMMUNITY CENTER | | | 7.8 | % | | | | | | | | | |
| Acadia Realty Trust | | | | | | | 254,500 | | | | 6,367,590 | | |
| Federal Realty Investment Trust | | | | | | | 130,000 | | | | 11,050,000 | | |
| | | | | | | | 17,417,590 | | |
| REGIONAL MALL | | | 1.4 | % | | | | | | | | | |
| Macerich Co. | | | | | | | 36,900 | | | | 3,194,433 | | |
| TOTAL SHOPPING CENTER | | | | | | | | | | | 20,612,023 | | |
| TOTAL COMMON STOCK (Identified cost—$174,575,611) | | | | | | | | | | | 213,688,687 | | |
| | | | | Principal
Amount | | | |
| COMMERCIAL PAPER | | | 0.2 | % | | | | | | | | | |
San Paolo U.S. Finance Co., 4.15%, due 1/2/07
(Identified cost—$341,960) | | | | | | $ | 342,000 | | | | 341,960 | | |
| TOTAL INVESTMENTS (Identified cost—$174,917,571) | | | | | | | 95.0 | % | | | 214,030,647 | | |
| OTHER ASSETS IN EXCESS OF LIABILITIES | | | | | | | 5.0 | % | | | 11,278,329 | | |
| NET ASSETS | | | | | | | 100.0 | % | | $ | 225,308,976 | | |
Note: Percentages indicated are based on the net assets of the fund.
See accompanying notes to financial statements.
11
COHEN & STEERS REALTY FOCUS FUND, INC.
STATEMENT OF ASSETS AND LIABILITIES
December 31, 2006
| ASSETS: | |
| Investments in securities, at value (Identified cost—$174,917,571) | | $ | 214,030,647 | | |
| Receivable for investment securities sold | | | 10,877,784 | | |
| Receivable for fund shares sold | | | 1,780,169 | | |
| Dividends receivable | | | 957,272 | | |
| Other assets | | | 4,570 | | |
| Total Assets | | | 227,650,442 | | |
| LIABILITIES: | |
| Payable for investment securities purchased | | | 1,782,797 | | |
| Payable to investment advisor | | | 225,726 | | |
| Payable for fund shares redeemed | | | 159,408 | | |
| Payable for distribution fees | | | 6,932 | | |
| Payable to administrator | | | 3,781 | | |
| Payable for directors' fees | | | 3,285 | | |
| Payable for shareholder servicing fees | | | 1,777 | | |
| Other liabilities | | | 157,760 | | |
| Total Liabilities | | | 2,341,466 | | |
| NET ASSETS | | $ | 225,308,976 | | |
| NET ASSETS consist of: | |
| Paid-in capital | | | 186,292,077 | | |
| Accumulated net realized loss on investments | | | (96,177 | ) | |
| Net unrealized appreciation on investments | | | 39,113,076 | | |
| | | $ | 225,308,976 | | |
See accompanying notes to financial statements.
12
COHEN & STEERS REALTY FOCUS FUND, INC.
STATEMENT OF ASSETS AND LIABILITIES—(Continued)
December 31, 2006
| CLASS A SHARES: | |
| NET ASSETS | | $ | 60,264,353 | | |
| Shares issued and outstanding ($0.001 par value common stock outstanding) | | | 862,377 | | |
| Net asset value and redemption price per share | | $ | 69.88 | | |
| Maximum offering price per share ($69.88 ÷ 0.955)a | | $ | 73.17 | | |
| CLASS B SHARES: | |
| NET ASSETS | | $ | 3,554,587 | | |
| Shares issued and outstanding ($0.001 par value common stock outstanding) | | | 51,038 | | |
| Net asset value and offering price per shareb | | $ | 69.65 | | |
| CLASS C SHARES: | |
| NET ASSETS | | $ | 38,227,916 | | |
| Shares issued and outstanding ($0.001 par value common stock outstanding) | | | 548,596 | | |
| Net asset value and offering price per shareb | | $ | 69.68 | | |
| CLASS I SHARES: | |
| NET ASSETS | | $ | 123,262,120 | | |
| Shares issued and outstanding ($0.001 par value common stock outstanding) | | | 1,757,362 | | |
| Net asset value, offering and redemption price per share | | $ | 70.14 | | |
a On investments of $100,000 or more, the offering price is reduced.
b Redemption price per share is equal to the net asset value per share less any applicable deferred sales charge which varies with the length of time shares are held.
See accompanying notes to financial statements.
13
COHEN & STEERS REALTY FOCUS FUND, INC.
STATEMENT OF OPERATIONS
For the Year Ended December 31, 2006
| Investment Income: | |
| Dividend income (net of $31,030 of foreign withholding tax) | | $ | 3,494,668 | | |
| Interest income | | | 275,420 | | |
| Total Income | | | 3,770,088 | | |
| Expenses: | |
| Investment advisory fees | | | 1,584,485 | | |
| Distribution fees—Class A | | | 107,806 | | |
| Distribution fees—Class B | | | 18,645 | | |
| Distribution fees—Class C | | | 194,719 | | |
| Transfer agent fees | | | 155,997 | | |
| Administration fees | | | 122,023 | | |
| Shareholder servicing fees—Class A | | | 43,122 | | |
| Shareholder servicing fees—Class B | | | 6,215 | | |
| Shareholder servicing fees—Class C | | | 64,907 | | |
| Professional fees | | | 93,983 | | |
| Reports to shareholders | | | 76,284 | | |
| Registration and filing fees | | | 71,175 | | |
| Directors' fees and expenses | | | 49,151 | | |
| Custodian fees and expenses | | | 35,101 | | |
| Line of credit fees and expenses | | | 5,867 | | |
| Miscellaneous | | | 12,080 | | |
| Total Expenses | | | 2,641,560 | | |
| Reduction of Expenses | | | (6,148 | ) | |
| Net Expenses | | | 2,635,412 | | |
| Net Investment Income | | | 1,134,676 | | |
| Net Realized and Unrealized Gain on Investments: | |
| Net realized gain on investments | | | 19,404,919 | | |
| Net change in unrealized appreciation on investments | | | 28,661,974 | | |
| Net realized and unrealized gain on investments | | | 48,066,893 | | |
| Net Increase in Net Assets Resulting from Operations | | $ | 49,201,569 | | |
See accompanying notes to financial statements.
14
COHEN & STEERS REALTY FOCUS FUND, INC.
STATEMENT OF CHANGES IN NET ASSETS
| | | For the
Year Ended
December 31, 2006 | | For the
Year Ended
December 31, 2005 | |
| Change in Net Assets: | |
| From Operations: | |
| Net investment income | | $ | 1,134,676 | | | $ | 337,363 | | |
| Net realized gain on investments | | | 19,404,919 | | | | 14,063,024 | | |
| Net change in unrealized appreciation on investments | | | 28,661,974 | | | | (1,286,611 | ) | |
| Net increase in net assets resulting from operations | | | 49,201,569 | | | | 13,113,776 | | |
| Dividends and Distributions to Shareholders from: | |
| Net investment income: | |
| Class A | | | (256,441 | ) | | | (354,529 | ) | |
| Class B | | | — | | | | (19,499 | ) | |
| Class C | | | (258 | ) | | | (185,829 | ) | |
| Class I | | | (914,107 | ) | | | (2,016,279 | ) | |
| Net realized gain on investments: | |
| Class A | | | (5,030,435 | ) | | | (41,929 | ) | |
| Class B | | | (299,894 | ) | | | (2,507 | ) | |
| Class C | | | (3,213,032 | ) | | | (26,558 | ) | |
| Class I | | | (10,600,754 | ) | | | (151,725 | ) | |
| Tax return of capital: | |
| Class A | | | (453,053 | ) | | | — | | |
| Class B | | | (26,783 | ) | | | — | | |
| Class C | | | (278,052 | ) | | | — | | |
| Class I | | | (1,003,522 | ) | | | — | | |
| Total dividends and distributions to shareholders | | | (22,076,331 | ) | | | (2,798,855 | ) | |
| Capital Stock Transactions: | |
| Increase in net assets from fund share transactions | | | 65,754,123 | | | | 45,018,903 | | |
| Total increase in net assets | | | 92,879,361 | | | | 55,333,824 | | |
| Net Assets | |
| Beginning of year | | | 132,429,615 | | | | 77,095,791 | | |
| End of year | | $ | 225,308,976 | | | $ | 132,429,615 | | |
See accompanying notes to financial statements.
15
COHEN & STEERS REALTY FOCUS FUND, INC.
FINANCIAL HIGHLIGHTS
The following table includes selected data for a share outstanding throughout each period and other performance information derived from the financial statements. It should be read in conjunction with the financial statements and notes thereto.
| | | Class A | |
| | | For the Year Ended December 31, | | For the Period
September 30, 2004a
through | |
| Per Share Operating Performance: | | 2006 | | 2005 | | December 31, 2004 | |
| Net asset value, beginning of period | | $ | 58.90 | | | $ | 52.96 | | | $ | 45.82 | | |
| Income from investment operations: | |
| Net investment income | | | 0.42 | | | | 0.49 | b | | | 0.22 | b | |
| Net realized and unrealized gain on investments | | | 18.12 | | | | 6.74 | | | | 7.53 | | |
| Total income from investment operations | | | 18.54 | | | | 7.23 | | | | 7.75 | | |
| Less dividends and distributions to shareholders from: | |
| Net investment income | | | (0.42 | ) | | | (1.26 | ) | | | (0.61 | ) | |
| Net realized gain on investments | | | (6.51 | ) | | | (0.10 | ) | | | — | | |
| Tax return of capital | | | (0.64 | ) | | | — | | | | — | | |
| Total dividends and distributions to shareholders | | | (7.57 | ) | | | (1.36 | ) | | | (0.61 | ) | |
| Redemption fees retained by the fund | | | 0.01 | | | | 0.07 | | | | — | | |
| Net increase in net asset value | | | 10.98 | | | | 5.94 | | | | 7.14 | | |
| Net asset value, end of period | | $ | 69.88 | | | $ | 58.90 | | | $ | 52.96 | | |
| Total investment returnc | | | 32.14 | % | | | 13.87 | % | | | 16.93 | %d | |
| Ratios/Supplemental Data: | |
| Net assets, end of period (in millions) | | $ | 60.3 | | | $ | 25.7 | | | $ | 3.1 | | |
Ratio of expenses to average daily net assets
(before expense reduction) | | | 1.61 | % | | | 1.84 | % | | | 3.07 | %e | |
Ratio of expenses to average daily net assets
(net of expense reduction) | | | 1.61 | % | | | 1.65 | % | | | 1.65 | %e | |
Ratio of net investment income to average daily net assets
(before expense reduction) | | | 0.59 | % | | | 0.67 | % | | | 0.31 | %e | |
Ratio of net investment income to average daily net assets
(net of expense reduction) | | | 0.59 | % | | | 0.87 | % | | | 1.73 | %e | |
| Portfolio turnover rate | | | 109 | % | | | 158 | % | | | 180 | %d | |
a Initial offering of shares.
b Calculated based on average shares outstanding during the period.
c Does not reflect sales charges, which would reduce return.
d Not annualized.
e Annualized.
See accompanying notes to financial statements.
16
COHEN & STEERS REALTY FOCUS FUND, INC.
FINANCIAL HIGHLIGHTS—(Continued)
| | | Class B | |
| | | For the Year Ended December 31, | | For the Period
September 30, 2004a
through | |
| Per Share Operating Performance: | | 2006 | | 2005 | | December 31, 2004 | |
| Net asset value, beginning of period | | $ | 58.74 | | | $ | 52.92 | | | $ | 45.82 | | |
| Income from investment operations: | |
| Net investment income (loss) | | | — | | | | (0.22 | )b | | | 0.20 | b | |
| Net realized and unrealized gain on investments | | | 18.04 | | | | 7.03 | | | | 7.47 | | |
| Total income from investment operations | | | 18.04 | | | | 6.81 | | | | 7.67 | | |
| Less dividends and distributions to shareholders from: | |
| Net investment income | | | — | | | | (0.94 | ) | | | (0.57 | ) | |
| Net realized gain on investments | | | (6.51 | ) | | | (0.10 | ) | | | — | | |
| Tax return of capital | | | (0.64 | ) | | | — | | | | — | | |
| Total dividends and distributions to shareholders | | | (7.15 | ) | | | (1.04 | ) | | | (0.57 | ) | |
| Redemption fees retained by the fund | | | 0.02 | | | | 0.05 | | | | — | | |
| Net increase in net asset value | | | 10.91 | | | | 5.82 | | | | 7.10 | | |
| Net asset value, end of period | | $ | 69.65 | | | $ | 58.74 | | | $ | 52.92 | | |
| Total investment returnc | | | 31.29 | % | | | 12.99 | % | | | 16.77 | %d | |
| Ratios/Supplemental Data: | |
| Net assets, end of period (in millions) | | $ | 3.6 | | | $ | 1.5 | | | $ | 0.7 | | |
Ratio of expenses to average daily net assets
(before expense reduction) | | | 2.26 | % | | | 2.56 | % | | | 4.07 | %e | |
Ratio of expenses to average daily net assets
(net of expense reduction) | | | 2.26 | % | | | 2.30 | % | | | 2.30 | %e | |
Ratio of net investment income (loss) to average daily net assets
(before expense reduction) | | | 0.00 | % | | | (0.65 | )% | | | (0.19 | )%e | |
Ratio of net investment income (loss) to average daily net assets
(net of expense reduction) | | | 0.00 | % | | | (0.39 | )% | | | 1.58 | %e | |
| Portfolio turnover rate | | | 109 | % | | | 158 | % | | | 180 | %d | |
a Initial offering of shares.
b Calculated based on average shares outstanding during the period.
c Does not reflect sales charges, which would reduce return.
d Not annualized.
e Annualized.
See accompanying notes to financial statements.
17
COHEN & STEERS REALTY FOCUS FUND, INC.
FINANCIAL HIGHLIGHTS—(Continued)
| | | Class C | |
| | | For the Year Ended December 31, | | For the Period
September 30, 2004a
through | |
| Per Share Operating Performance: | | 2006 | | 2005 | | December 31, 2004 | |
| Net asset value, beginning of period | | $ | 58.78 | | | $ | 52.93 | | | $ | 45.82 | | |
| Income from investment operations: | |
| Net investment income (loss) | | | — | | | | (0.19 | )b | | | 0.15 | b | |
| Net realized and unrealized gain on investments | | | 18.04 | | | | 7.03 | | | | 7.53 | | |
| Total income from investment operations | | | 18.04 | | | | 6.84 | | | | 7.68 | | |
| Less dividends and distributions to shareholders from: | |
| Net investment income | | | (0.01 | ) | | | (0.94 | ) | | | (0.57 | ) | |
| Net realized gain on investments | | | (6.51 | ) | | | (0.10 | ) | | | — | | |
| Tax return of capital | | | (0.64 | ) | | | — | | | | — | | |
| Total dividends and distributions to shareholders | | | (7.16 | ) | | | (1.04 | ) | | | (0.57 | ) | |
| Redemption fees retained by the fund | | | 0.02 | | | | 0.05 | | | | — | | |
| Net increase in net asset value | | | 10.90 | | | | 5.85 | | | | 7.11 | | |
| Net asset value, end of period | | $ | 69.68 | | | $ | 58.78 | | | $ | 52.93 | | |
| Total investment returnc | | | 31.28 | % | | | 13.07 | % | | | 16.77 | %d | |
| Ratios/Supplemental Data: | |
| Net assets, end of period (in millions) | | $ | 38.2 | | | $ | 15.9 | | | $ | 3.0 | | |
Ratio of expenses to average daily net assets
(before expense reduction) | | | 2.26 | % | | | 2.54 | % | | | 3.78 | %e | |
Ratio of expenses to average daily net assets
(net of expense reduction) | | | 2.26 | % | | | 2.30 | % | | | 2.30 | %e | |
Ratio of net investment loss to average daily net assets
(before expense reduction) | | | 0.00 | % | | | (0.57 | )% | | | (0.31 | )%e | |
Ratio of net investment income (loss) to average daily net assets
(net of expense reduction) | | | 0.00 | % | | | (0.33 | )% | | | 1.17 | %e | |
| Portfolio turnover rate | | | 109 | % | | | 158 | % | | | 180 | %d | |
a Initial offering of shares.
b Calculated based on average shares outstanding during the period.
c Does not reflect sales charges, which would reduce return.
d Not annualized.
e Annualized.
See accompanying notes to financial statements.
18
COHEN & STEERS REALTY FOCUS FUND, INC.
FINANCIAL HIGHLIGHTS—(Continued)
| | | Class I | |
| | | For the Year Ended December 31, | |
| Per Share Operating Performance: | | 2006 | | 2005 | | 2004 | | 2003 | | 2002 | |
| Net asset value, beginning of year | | $ | 59.09 | | | $ | 53.00 | | | $ | 38.55 | | | $ | 27.50 | | | $ | 26.63 | | |
| Income from investment operations: | |
| Net investment income | | | 0.65 | | | | 0.20 | a | | | 0.41 | a | | | 0.64 | | | | 0.73 | | |
| Net realized and unrealized gain on investments | | | 18.19 | | | | 7.24 | | | | 15.16 | | | | 12.06 | | | | 1.29 | | |
| Total income from investment operations | | | 18.84 | | | | 7.44 | | | | 15.57 | | | | 12.70 | | | | 2.02 | | |
| Less dividends and distributions to shareholders from: | |
| Net investment income | | | (0.65 | ) | | | (1.40 | ) | | | (1.18 | ) | | | (1.67 | ) | | | (1.21 | ) | |
| Net realized gain on investments | | | (6.51 | ) | | | (0.10 | ) | | | — | | | | — | | | | — | | |
| Tax return of capital | | | (0.64 | ) | | | — | | | | — | | | | — | | | | — | | |
Total dividends and distributions to
shareholders | | | (7.80 | ) | | | (1.50 | ) | | | (1.18 | ) | | | (1.67 | ) | | | (1.21 | ) | |
| Redemption fees retained by the fund | | | 0.01 | | | | 0.15 | | | | 0.06 | | | | 0.02 | | | | 0.06 | | |
| Net increase in net asset value | | | 11.05 | | | | 6.09 | | | | 14.45 | | | | 11.05 | | | | 0.87 | | |
| Net asset value, end of year | | $ | 70.14 | | | $ | 59.09 | | | $ | 53.00 | | | $ | 38.55 | | | $ | 27.50 | | |
| Total investment return | | | 32.62 | % | | | 14.41 | %b | | | 40.98 | % | | | 46.89 | % | | | 7.67 | % | |
| Ratios/Supplemental Data: | |
| Net assets, end of year (in millions) | | $ | 123.3 | | | $ | 89.3 | | | $ | 70.2 | | | $ | 28.5 | | | $ | 18.2 | | |
Ratio of expenses to average daily net assets
(before expense reduction) | | | 1.25 | % | | | 1.57 | % | | | 1.89 | % | | | 1.99 | % | | | 2.09 | % | |
Ratio of expenses to average daily net assets
(net of expense reduction) | | | 1.25 | % | | | 1.30 | % | | | 1.43 | % | | | 1.50 | % | | | 1.50 | % | |
Ratio of net investment income to average daily net assets
(before expense reduction) | | | 0.84 | % | | | 0.09 | % | | | 0.45 | % | | | 1.33 | % | | | 1.96 | % | |
Ratio of net investment income to average daily net assets
(net of expense reduction) | | | 0.85 | % | | | 0.36 | % | | | 0.92 | % | | | 1.82 | % | | | 2.55 | % | |
| Portfolio turnover rate | | | 109 | % | | | 158 | % | | | 180 | % | | | 181 | % | | | 179 | % | |
a Calculated based on average shares outstanding during the year.
b Without the benefit of the redemption fees, the total investment return would have been 14.12%.
See accompanying notes to financial statements.
19
COHEN & STEERS REALTY FOCUS FUND, INC.
NOTES TO FINANCIAL STATEMENTS
Note 1. Significant Accounting Policies
Cohen & Steers Realty Focus Fund, Inc. (the fund) was incorporated under the laws of the State of Maryland on February 14, 1997 and is registered under the Investment Company Act of 1940, as amended, as a nondiversified, open-end management investment company. The fund's investment objective is maximum capital appreciation. The authorized shares of the fund are divided into four classes designated Class A, B, C, and I shares. Each of the fund's shares has equal dividend, liquidation and voting rights (except for matters relating to distributions and shareholder servicing of such shares). Class B shares automatically convert to Class A shares at the end of the month which precedes the eighth anniversary of the purchase date.
The following is a summary of significant accounting policies consistently followed by the fund in the preparation of its financial statements. The policies are in conformity with accounting principles generally accepted in the United States of America (GAAP). The preparation of the financial statements in accordance with GAAP requires management to make estimates and assumptions that affect the reported amounts of assets and liabilities at the date of the financial statements and the reported amounts of income and expenses during the reporting period. Actual results could differ from those estimates.
Portfolio Valuation: Investments in securities that are listed on the New York Stock Exchange are valued, except as indicated below, at the last sale price reflected at the close of the New York Stock Exchange on the business day as of which such value is being determined. If there has been no sale on such day, the securities are valued at the mean of the closing bid and asked prices for the day or, if no asked price is available, at the bid price.
Securities not listed on the New York Stock Exchange but listed on other domestic or foreign securities exchanges or admitted to trading on the National Association of Securities Dealers Automated Quotations, Inc. (Nasdaq) national market system are valued in a similar manner. Securities traded on more than one securities exchange are valued at the last sale price on the business day as of which such value is being determined as reflected on the tape at the close of the exchange representing the principal market for such securities.
Readily marketable securities traded in the over-the-counter market, including listed securities whose primary market is believed by Cohen & Steers Capital Management, Inc. (the advisor) to be over-the-counter, but excluding securities admitted to trading on the Nasdaq National List, are valued at the official closing prices as reported by Nasdaq, the National Quotation Bureau, or such other comparable sources as the Board of Directors deems appropriate to reflect their fair market value. If there has been no sale on such day, the securities are valued at the mean of the closing bid and asked prices for the day, or if no asked price is available, at the bid price. Where securities are traded on more than one exchange and also over-the-counter, the securities will generally be valued using the quotations the Board of Directors believes most closely reflect the value of such securities.
Securities for which market prices are unavailable, or securities for which the advisor determines that bid and/or asked prices price does reflect market value, will be valued at fair value pursuant to procedures approved by the fund's Board of Directors. Circumstances in which market prices may be unavailable include, but are not
20
COHEN & STEERS REALTY FOCUS FUND, INC.
NOTES TO FINANCIAL STATEMENTS—(Continued)
limited to, when trading in a security is suspended, the exchange on which the security is traded is subject to an unscheduled close or disruption or material events occur after the close of the exchange on which the security is principally traded. In these circumstances, the fund determines fair value in a manner that fairly reflects the market value of the security on the valuation date based on consideration of any information or factors it deems appropriate. These may include recent transactions in comparable securities, information relating to the specific security and developments in the markets.
The fund's use of fair value pricing may cause the net asset value of fund shares to differ from the net asset value that would be calculated using market quotations. Fair value pricing involves subjective judgments and it is possible that the fair value determined for a security may be materially different than the value that could be realized upon the sale of that security.
Short-term debt securities, which have a maturity date of 60 days or less, are valued at amortized cost, which approximates value.
Security Transactions and Investment Income: Security transactions are recorded on trade date. Realized gains and losses on investments sold are recorded on the basis of identified cost. Interest income is recorded on the accrual basis. Discounts are accreted and premiums are amortized over the life of the respective securities. Dividend income is recorded on the ex-dividend date. The fund records distributions received in excess of income from underlying investments as a reduction of cost of investments and/or realized gain. Such amounts are based on estimates if actual amounts are not available and actual amounts of income, realized gain and return of capital may differ from the estimated amounts. The fund adjusts the estimated amounts of the components of distributions (and consequently its net investment income) as an increase to unrealized appreciation/(depre ciation) and realized gain/(loss) on investments as necessary once the issuers provide information about the actual composition of the distributions. Income, expenses (other than expenses attributable to a specific class), and realized and unrealized gains or losses on investments are allocated to each class of shares based on its relative net assets.
Dividends and Distributions to Shareholders: Dividends from net investment income and capital gain distributions are determined in accordance with U.S. federal income tax regulations, which may differ from GAAP. Dividends from net investment income are declared and paid semi-annually. Net realized capital gains, unless offset by any available capital loss carryforward, are distributed to shareholders annually. Dividends and distributions to shareholders are recorded on the ex-dividend date and are automatically reinvested in full and fractional shares of the fund based on the net asset value per share at the close of business on the ex-dividend date unless the shareholder has elected to have them paid in cash.
Distributions paid by the fund are subject to recharacterization for tax purposes. Based upon the results of operations for the year ended December 31, 2006, a portion of the dividends paid have been reclassified to return of capital and distributions of net realized capital gains.
21
COHEN & STEERS REALTY FOCUS FUND, INC.
NOTES TO FINANCIAL STATEMENTS—(Continued)
Federal Income Taxes: It is the policy of the fund to continue to qualify as a regulated investment company, if such qualification is in the best interest of the shareholders, by complying with the requirements of Subchapter M of the Internal Revenue Code applicable to regulated investment companies, and by distributing substantially all of its taxable earnings to its shareholders. Accordingly, no provision for federal income or excise tax is necessary.
Note 2. Investment Advisory and Administration Fees and Other Transactions with Affiliates
Investment Advisory Fees: The advisor serves as the fund's investment advisor pursuant to an investment advisory agreement (the advisory agreement). Under the terms of the advisory agreement, the advisor provides the fund with the day-to-day investment decisions and generally manages the fund's investments in accordance with the stated policies of the fund, subject to the supervision of the fund's Board of Directors. For the services provided to the fund, the advisor receives a fee, accrued daily and paid monthly, at the annual rate of 0.90% of the average daily net assets of the fund.
For the year ended December 31, 2006 and through December 31, 2007, the advisor has contractually agreed to waive its fee and/or reimburse the fund for expenses incurred to the extent necessary to maintain the fund's operating expenses at 1.65% for Class A shares, 2.30% for Class B and Class C shares and 1.30% for Class I shares.
Administration Fees: The fund has entered into an administration agreement with the advisor under which the advisor performs certain administrative functions for the fund and receives a fee, accrued daily and paid monthly, at the annual rate of 0.02% of the fund's average daily net assets. For the year ended December 31, 2006, the fund paid the advisor $35,211 in fees under this administration agreement. Additionally, the fund has retained State Street Bank and Trust Company as sub-administrator under a fund accounting and administration agreement.
Distribution Fees: Shares of the fund are distributed by Cohen & Steers Securities, LLC (the distributor), an affiliated entity of the advisor. The fund has adopted a distribution plan (the plan) pursuant to Rule 12b-1 under the Investment Company Act of 1940. The plan provides that the fund will pay the distributor a fee, accrued daily and paid monthly, at an annual rate of up to 0.25% of the average daily net assets attributable to the Class A shares and up to 0.75% of the average daily net assets attributable to the Class B and Class C shares.
For the year ended December 31, 2006, the fund has been advised that the distributor received $37,509 in sales commissions from the sale of Class A shares and that the distributor also received $5,200 and $9,602 of contingent deferred sales charges relating to redemptions of Class B and Class C shares, respectively. The distributor has advised the fund that proceeds from the contingent deferred sales charge on the Class B and C shares are paid to the distributor and are used by the distributor to defray its expenses related to providing distribution-related services to the fund in connection with the sale of the Class B and C shares, including payments to dealers and other financial intermediaries for selling Class B and C shares and interest and other financing costs associated with Class B and C shares.
22
COHEN & STEERS REALTY FOCUS FUND, INC.
NOTES TO FINANCIAL STATEMENTS—(Continued)
Shareholder Servicing Fees: The fund has adopted a shareholder services plan which provides that the fund may obtain the services of qualified financial institutions to act as shareholder servicing agents for their customers. For these services, the fund may pay the shareholder servicing agent a fee, accrued daily and paid monthly, at an annual rate of up to 0.10% of the average daily net asset value of the fund's Class A shares and up to 0.25% of the average daily net asset value of the fund's Class B and C shares.
Directors' and Officers' Fees: Certain directors and officers of the fund are also directors, officers, and/or employees of the advisor. The fund does not pay compensation to any affiliated directors and officers except for the Chief Compliance Officer, who received $2,379 from the fund for the year ended December 31, 2006.
Note 3. Purchases and Sales of Securities
Purchases and sales of securities, excluding short-term investments, for the year ended December 31, 2006 totaled $223,824,709 and $184,335,448, respectively.
Note 4. Income Tax Information
The tax character of dividends and distributions paid was as follows:
| | | For the Year Ended
December 31, | |
| | | 2006 | | 2005 | |
| Ordinary income | | $ | 12,950,864 | | | $ | 2,561,290 | | |
| Long-term capital gains | | | 7,364,057 | | | | 237,565 | | |
| Tax return of capital | | | 1,761,410 | | | | — | | |
| Total dividends and distributions | | $ | 22,076,331 | | | $ | 2,798,855 | | |
As of December 31, 2006, the tax-basis components of accumulated earnings and the federal tax cost were as follows:
| Gross unrealized appreciation | | $ | 39,844,756 | | |
| Gross unrealized depreciation | | | (827,857 | ) | |
| Net unrealized appreciation | | $ | 39,016,899 | | |
| Cost for federal income tax purposes | | $ | 175,013,748 | | |
23
COHEN & STEERS REALTY FOCUS FUND, INC.
NOTES TO FINANCIAL STATEMENTS—(Continued)
As of December 31, 2006, the fund had temporary book/tax differences primarily attributable to wash sales on portfolio securities and permanent book/tax differences primarily attributable to adjustments for prior fiscal year income redesignations. To reflect reclassifications arising from the permanent differences, paid-in capital was
credited $18,954, accumulated net realized loss was charged $55,084 and accumulated net investment income was
credited $36,130.
Note 5. Capital Stock
The fund is authorized to issue 50 million shares of capital stock, at a par value of $0.001 per share. The Board of Directors of the fund may increase or decrease the aggregate number of shares of common stock that the fund has authority to issue. Transactions in fund shares were as follows:
| | | For the
Year Ended
December 31, 2006 | | For the
Year Ended
December 31, 2005 | |
| | | Shares | | Amount | | Shares | | Amount | |
| Class A: | |
| Sold | | | 568,663 | | | $ | 38,229,225 | | | | 425,527 | | | $ | 24,214,195 | | |
Issued as reinvestment of
dividends and distributions | | | 67,465 | | | | 4,561,743 | | | | 5,036 | | | | 293,591 | | |
| Redeemed | | | (210,144 | ) | | | (14,537,094 | ) | | | (52,977 | ) | | | (2,882,747 | ) | |
Redemption fees retained by
the funda | | | — | | | | 6,806 | | | | — | | | | 11,758 | | |
| Net increase | | | 425,984 | | | $ | 28,260,680 | | | | 377,586 | | | $ | 21,636,797 | | |
| Class B: | |
| Sold | | | 26,254 | | | $ | 1,748,080 | | | | 18,141 | | | $ | 1,010,429 | | |
Issued as reinvestment of
dividends and distributions | | | 3,386 | | | | 228,553 | | | | 246 | | | | 14,214 | | |
| Redeemed | | | (4,721 | ) | | | (311,770 | ) | | | (6,271 | ) | | | (340,218 | ) | |
Redemption fees retained by
the funda | | | — | | | | 553 | | | | — | | | | 838 | | |
| Net increase | | | 24,919 | | | $ | 1,665,416 | | | | 12,116 | | | $ | 685,263 | | |
24
COHEN & STEERS REALTY FOCUS FUND, INC.
NOTES TO FINANCIAL STATEMENTS—(Continued)
| | | For the
Year Ended
December 31, 2006 | | For the
Year Ended
December 31, 2005 | |
| | | Shares | | Amount | | Shares | | Amount | |
| Class C: | |
| Sold | | | 307,048 | | | $ | 20,567,536 | | | | 241,405 | | | $ | 13,421,544 | | |
Issued as reinvestment of
dividends and distributions | | | 35,590 | | | | 2,406,049 | | | | 2,412 | | | | 139,677 | | |
| Redeemed | | | (64,553 | ) | | | (4,281,540 | ) | | | (30,636 | ) | | | (1,675,841 | ) | |
Redemption fees retained by
the funda | | | — | | | | 5,799 | | | | — | | | | 7,742 | | |
| Net increase | | | 278,085 | | | $ | 18,697,844 | | | | 213,181 | | | $ | 11,893,122 | | |
| Class I: | |
| Sold | | | 501,779 | | | $ | 33,880,836 | | | | 726,972 | | | $ | 39,571,623 | | |
Issued as reinvestment of
dividends and distributions | | | 159,186 | | | | 10,777,390 | | | | 32,167 | | | | 1,855,492 | | |
| Redeemed | | | (414,765 | ) | | | (27,551,007 | ) | | | (572,605 | ) | | | (30,829,569 | ) | |
Redemption fees retained by
the funda | | | — | | | | 22,964 | | | | — | | | | 206,175 | | |
| Net increase | | | 246,200 | | | $ | 17,130,183 | | | | 186,534 | | | $ | 10,803,721 | | |
a The fund may charge a 1% redemption fee on shares sold within six months of the time of purchase.
Note 6. Borrowings
The fund, in conjunction with other Cohen & Steers funds, is a party to a $150,000,000 syndicated credit agreement (the credit agreement) with State Street Bank and Trust Company, as administrative agent and operations agent, and the lenders identified in the credit agreement, which expires December 2007. The fund pays a commitment fee of 0.10% per annum on its proportionate share of the unused portion of the credit agreement.
During the year ended December 31, 2006, the fund did not utilize the line of credit.
25
COHEN & STEERS REALTY FOCUS FUND, INC.
NOTES TO FINANCIAL STATEMENTS—(Continued)
Note 7. Other
In the normal course of business, the fund enters into contracts that provide general indemnifications. The fund's maximum exposure under these arrangements is dependent on claims that may be made against the fund in the future and, therefore, cannot be estimated; however, based on experience, the risk of material loss from such claims is considered remote.
In July 2006, the Financial Accounting Standards Board (FASB) issued Interpretation 48, Accounting for Uncertainty in Income Taxes—an interpretation of FASB Statement 109 (FIN 48). FIN 48 clarifies the accounting for income taxes by prescribing the minimum recognition threshold a tax position must meet before being recognized in the financial statements. FIN 48 is effective for fiscal years beginning after December 15, 2006. The fund will adopt FIN 48 no later than June 29, 2007 and the impact to the fund's financial statements, if any, is currently being assessed.
In September 2006, Statement of Financial Accounting Standards No. 157, Fair Value Measurements (SFAS 157), was issued and is effective for fiscal years beginning after November 15, 2007. SFAS 157 defines fair value, establishes a framework for measuring fair value and expands disclosures about fair value measurements. Management is currently evaluating the impact the adoption of SFAS 157 will have on the Fund's financial statements.
26
COHEN & STEERS REALTY FOCUS FUND, INC.
REPORT OF INDEPENDENT REGISTERED PUBLIC ACCOUNTING FIRM
To the Board of Directors and Shareholders of
Cohen & Steers Realty Focus Fund, Inc.
In our opinion, the accompanying statement of assets and liabilities, including the schedule of investments, and the related statements of operations and of changes in net assets and the financial highlights present fairly, in all material respects, the financial position of Cohen & Steers Realty Focus Fund, Inc. (the "Fund") at December 31, 2006, the results of its operations for the year then ended, the changes in its net assets for each of the two years in the period then ended and the financial highlights for each of the periods presented, in conformity with accounting principles generally accepted in the United States of America. These financial statements and financial highlights (hereafter referred to as "financial statements") are the responsibility of the Fund's management; our responsibility is to express an opinion on these financial statements based on our audits. We conducted our audits of these financial statements in accor dance with the standards of the Public Company Accounting Oversight Board (United States). Those standards require that we plan and perform the audit to obtain reasonable assurance about whether the financial statements are free of material misstatement. An audit includes examining, on a test basis, evidence supporting the amounts and disclosures in the financial statements, assessing the accounting principles used and significant estimates made by management, and evaluating the overall financial statement presentation. We believe that our audits, which included confirmation of securities at December 31, 2006 by correspondence with the custodian and brokers, provide a reasonable basis for our opinion.
PricewaterhouseCoopers LLP
New York, New York
February 16, 2007
27
COHEN & STEERS REALTY FOCUS FUND, INC.
TAX INFORMATION—2006 (Unaudited)
Pursuant to the Jobs and Growth Relief Reconciliation Act of 2003, the fund designates qualified dividend income of $196,989. Also, the fund designates a long-term capital gain distribution of $6,584,882 at the 15% rate and $779,175 at the 25% rate or maximum allowable.
OTHER INFORMATION
A description of the policies and procedures that the fund uses to determine how to vote proxies relating to portfolio securities is available (i) without charge, upon request, by calling 800-330-7348, (ii) on our Web site at cohenandsteers.com or (iii) on the Securities and Exchange Commission's Web site at http://www.sec.gov. In addition, the fund's proxy voting record for the most recent 12-month period ended June 30 is available (i) without charge, upon request, by calling 800-330-7348 or (ii) on the SEC's Web site at http://www.sec.gov.
The fund files its complete schedule of portfolio holdings with the SEC for the first and third quarters of each fiscal year on Form N-Q. The fund's Forms N-Q are available (i) without charge, upon request by calling 800-330-7348, or (ii) on the SEC's Web site at http://www.sec.gov. In addition, the Forms N-Q may be reviewed and copied at the SEC's Public Reference Room in Washington, DC. Information on the operation of the Public Reference Room may be obtained by calling 800-SEC-0330.
Please note that the distributions paid by the fund to shareholders are subject to recharacterization for tax purposes. The fund may also pay distributions in excess of the fund's net investment company taxable income and this excess would be a tax-free return of capital distributed from the fund's assets. To the extent this occurs, the fund's shareholders of record will be notified of the estimated amount of capital returned to shareholders for each such distribution and this information will also be available at cohenandsteers.com. The final tax treatment of all distributions is reported to shareholders on their 1099-DIV forms, which are mailed after the close of each calendar year. Distributions of capital decrease the fund's total assets and, therefore, could have the effect of increasing the fund's expense ratio. In addition, in order to make these distributions, the fund may have to sell portfolio securities at a less than opportune ti me.
28
COHEN & STEERS REALTY FOCUS FUND, INC.
MANAGEMENT OF THE FUND
The business and affairs of the fund are managed under the direction of the board of directors. The board of directors approves all significant agreements between the fund and persons or companies furnishing services to it, including the fund's agreements with its advisor, administrator, custodian and transfer agent. The management of the fund's day-to-day operations is delegated to its officers, the advisor and the fund's administrator, subject always to the investment objective and policies of the fund and to the general supervision of the board of directors.
The directors and officers of the fund and their principal occupations during the past five years are set forth below. The statement of additional information (SAI) includes additional information about fund directors and is available, without charge, upon request by calling 1-800-330-7348.
| Name, Address and Age* | | Position(s) Held
with Fund | | Term of
Office | | Principal Occupation
During Past 5 Years
(Including Other
Directorships Held) | | Number of
Funds Within
Fund
Complex
Overseen by
Director
(Including
the Fund) | |
Length
of Time
Served** | |
| Interested Directors1 | |
|
Robert H. Steers
Age: 53 | | Director and
Co-Chairman | | Until next election of directors | | Co-Chairman and Co-Chief Executive Officer of Cohen & Steers Capital Management, Inc. (CSCM), the fund's investment manager, and its parent company, Cohen & Steers, Inc. (CNS) since 2004. Vice President and Director, Cohen & Steers Securities, LLC (CSSL), the Cohen & Steers open-end funds' distributor. Prior thereto, Chairman of CSCM and the Cohen & Steers funds. | | | 20 | | | 1991 to
present | |
|
Martin Cohen
Age: 58 | | Director and
Co-Chairman | | Until next election of directors | | Co-Chairman and Co-Chief Executive Officer of CSCM and CNS. Vice President and Director of CSSL. Prior thereto, President of the CSCM and the Cohen & Steers funds. | | | 20 | | | 1991 to
present | |
|
(table continued on next page)
* The address for each director is 280 Park Avenue, New York, NY 10017.
** The length of time served represents the year in which the director was first elected or appointed to any fund in the Cohen & Steers fund complex.
1 "Interested person", as defined in the 1940 Act, of the fund because of affiliation with CSCM.
29
COHEN & STEERS REALTY FOCUS FUND, INC.
(table continued from previous page)
| Name, Address and Age* | | Position(s) Held
with Fund | | Term of
Office | | Principal Occupation
During Past 5 Years
(Including Other
Directorships Held) | | Number of
Funds Within
Fund
Complex
Overseen by
Director
(Including
the Fund) | |
Length
of Time
Served** | |
| Disinterested Directors | |
|
Bonnie Cohen2
Age: 64 | | Director | | Until next election of directors | | Consultant. Prior thereto, Undersecretary of State, United States Department of State. Director of Wellsford Real Properties, Inc. | | | 20 | | | 2001 to
present | |
|
George Grossman
Age: 52 | | Director | | Until next election of directors | | Attorney-at-law | | | 20 | | | 1993 to
present | |
|
Richard E. Kroon
Age: 64 | | Director | | Until next election of directors | | Member of Investment Subcommittee, Monmouth University; retired Chairman and Managing Partner of the Sprout Group venture capital funds, then an affiliate of Donaldson, Lufkin & Jenrette Securities Corporation; and former Chairman of the National Venture Capital Association. | | | 20 | | | 2004 to
present | |
|
Richard J. Norman
Age: 63 | | Director | | Until next election of directors | | Private Investor. President of the Board of Directors of Maryland Public Television, Board Member of the Salvation Army. Prior thereto, Investment Representative of Morgan Stanley Dean Witter. | | | 20 | | | 2001 to
present | |
|
(table continued on next page)
* The address for each director is 280 Park Avenue, New York, NY 10017.
** The length of time served represents the year in which the director was first elected or appointed to any fund in the Cohen & Steers fund complex.
2 Martin Cohen and Bonnie Cohen are not related.
30
COHEN & STEERS REALTY FOCUS FUND, INC.
(table continued from previous page)
| Name, Address and Age* | | Position(s) Held
with Fund | | Term of
Office | | Principal Occupation
During Past 5 Years
(Including Other
Directorships Held) | | Number of
Funds Within
Fund
Complex
Overseen by
Director
(Including
the Fund) | |
Length
of Time
Served** | |
Frank K. Ross
Age: 63 | | Director | | Until next election of directors | | Professor of Accounting, Howard University; Board member of Pepco Holdings, Inc. (electric utility). Formerly, Midatlantic Area Managing Partner for Audit and Risk Advisory Services at KPMG LLP and Managing Partner of its Washington, DC office | | | 20 | | | 2004 to
present | |
|
Willard H. Smith Jr.
Age: 70 | | Director | | Until next election of directors | | Board member of Essex Property Trust Inc., Realty Income Corporation and Crest Net Lease, Inc. Managing Director at Merrill Lynch & Co., Equity Capital Markets Division from 1983 to 1995. | | | 20 | | | 1996 to
present | |
|
C. Edward Ward, Jr.
Age: 60 | | Director | | Until next election of directors | | Member of the Board of Trustees of Directors Manhattan College, Riverdale, New York. Formerly head of closed-end fund listings for the New York Stock Exchange. | | | 20 | | | 2004 to
present | |
|
* The address for each director is 280 Park Avenue, New York, NY 10017.
** The length of time served represents the year in which the director was first elected or appointed to any fund in the Cohen & Steers fund complex.
31
COHEN & STEERS REALTY FOCUS FUND, INC.
The officers of the fund (other than Messrs. Cohen and Steers, whose biographies are provided above), their address, their ages and their principal occupations for at least the past five years are set forth below.
| Name, Address and Age* | | Position(s) Held
with Fund | | Principal Occupation During Past 5 Years | | Length
of Time
Served** | |
| Adam M. Derechin Age: 42 | | President and Chief Executive Officer | | Chief Operating Officer of CSCM (since 2003) and CNS (since 2004). Prior to that, Senior Vice President of CSCM and Vice President and Assistant Treasurer of the Cohen & Steers funds. | | Since 2005 | |
|
| Joseph M. Harvey Age: 43 | | Vice President | | President of CSCM (since 2003) and CNS (since 2004). Prior to that, Senior Vice President and Director of Investment Research of CSCM. | | Since 2004 | |
|
| James S. Corl Age: 39 | | Vice President | | Executive Vice President of CSCM and CNS since 2004. Prior to that, Senior Vice President of CSCM. | | Since 2004 | |
|
| John E. McLean Age: 35 | | Secretary | | Vice President and Associate General Counsel of CSCM since September 2003. Prior to that, Vice President, Law and Regulation, J&W Seligman & Co. Incorporated (money manager). | | Since 2004 | |
|
| James Giallanza Age: 40 | | Treasurer | | Senior Vice President of CSCM since September 2006. Prior thereto, Deputy Head of the US Funds Administration and Treasurer & CFO of various mutual funds within the Legg Mason (formally Citigroup Asset Management) fund complex from August 2004 to September 2006; Director/Controller of the US wholesale business at UBS Global Asset Management (U.S.) from September 2001 to July 2004. | | Since 2006 | |
|
| Lisa D. Phelan Age: 38 | | Chief Compliance Officer | | Vice President & Director of Compliance of CSCM since January 2006. Chief Compliance Officer of CSSL since 2004. Prior to that, Compliance Officer of CSCM since 2004. Chief Compliance Officer, Avatar Associates & Overture Asset Managers, 2003-2004. First VP, Risk Management, Prudential Securities, Inc. 2000-2003. | | Since 2006 | |
|
* The address of each officer is 280 Park Avenue, New York, NY 10017
** Officers serve one-year terms. The length of time served represents the year in which the officer was first elected to that position in any fund in the Cohen & Steers fund complex. All of the officers listed above are officers of one or more of the other funds in the complex.
32
COHEN & STEERS REALTY FOCUS FUND, INC.
Meet the Cohen & Steers family of open-end funds:

• Designed for investors seeking maximum total return, investing primarily in REITs
• Symbol: CSRSX

• Designed for investors seeking high current income, investing primarily in REITs
• Symbols: CSEIX, CSBIX, CSCIX, CSDIX

• Designed for investors seeking maximum total return, investing primarily in international real estate securities
• Symbols: IRFAX, IRFCX, IRFIX

• Designed for investors seeking high current income and long-term growth of income and capital appreciation, investing primarily in dividend paying common stocks and
preferred stocks
• Symbols: DVFAX, DVFCX, DVFIX

• Designed for investors seeking maximum total return, investing primarily in global real estate securities
• Symbol: GRSIX

• Designed for institutional investors seeking maximum total return, investing primarily
in REITs
• Symbol: CSRIX

• Designed for investors seeking maximum capital appreciation, investing in a limited number of REITs and other real estate securities
• Symbols: CSFAX, CSFBX, CSFCX, CSSPX

• Designed for investors seeking maximum total return, investing primarily in utilities
• Symbols: CSUAX, CSUBX, CSUCX, CSUIX

• Designed for investors seeking maximum total return, investing primarily in real estate securities located in the Asia Pacific region
• Symbols: APFAX, APFCX, APFIX
Please consider the investment objectives, risks, charges and expenses of the fund carefully before investing. A prospectus containing this and other information can be obtained by calling 800-330-7348 or by visiting cohenandsteers.com. Please read the prospectus carefully before investing.
Cohen & Steers Securities, LLC, Distributor
33
COHEN & STEERS REALTY FOCUS FUND, INC.
OFFICERS AND DIRECTORS
Robert H. Steers
Director and co-chairman
Martin Cohen
Director and co-chairman
Bonnie Cohen
Director
George Grossman
Director
Richard E. Kroon
Director
Richard J. Norman
Director
Frank K. Ross
Director
Willard H. Smith Jr.
Director
C. Edward Ward, Jr.
Director
Adam M. Derechin
President and chief executive officer
Joseph M. Harvey
Vice president
James S. Corl
Vice president
John E. McLean
Secretary
James Giallanza
Treasurer
Lisa D. Phelan
Chief compliance officer
KEY INFORMATION
Investment Advisor
Cohen & Steers Capital Management, Inc.
280 Park Avenue
New York, NY 10017
(212) 832-3232
Fund Subadministrator and Custodian
State Street Bank and Trust Company
1 Lincoln Street
Boston, MA 02111
Transfer Agent
Boston Financial Data Services, Inc.
2 Heritage Drive
North Quincy, MA 02171
(800) 437-9912
Legal Counsel
Stroock & Stroock & Lavan LLP
180 Maiden Lane
New York, NY 10038
Distributor
Cohen & Steers Securities, LLC
280 Park Avenue
New York, NY 10017
Nasdaq Symbol: Class A—CSFAX
B—CSFBX
C—CSFCX
I— CSSPX
Web site: cohenandsteers.com
This report is authorized for delivery only to shareholders of Cohen & Steers Realty Focus Fund, Inc. unless accompanied or preceded by the delivery of a currently effective prospectus setting forth details of the fund. Past performance of course, is no guarantee of future results and your investment may be worth more or less at the time you sell.
34
COHEN & STEERS
REALTY FOCUS FUND
280 PARK AVENUE
NEW YORK, NY 10017

ANNUAL REPORT
DECEMBER 31, 2006
Item 2. Code of Ethics.
The registrant has adopted a Code of Ethics that applies to its Principal Executive Officer and Principal Financial Officer. The registrant undertakes to provide to any person without charge, upon request, a copy of the Code of Ethics. Such request can be made by calling 800-330-7348 or writing to the Secretary of the registrant, 280 Park Avenue, New York, NY 10017.
Item 3. Audit Committee Financial Expert.
The registrant’s board has determined that Frank K. Ross, a member of the board’s audit committee, is an “audit committee financial expert”. Mr. Ross is “independent,” as such term is defined in this Item.
Item 4. Principal Accountant Fees and Services.
(a) – (d) Aggregate fees billed to the registrant for the last two fiscal years for professional services rendered by the registrant’s principal accountant were as follows:
| | 2006 | | 2005 | |
Audit Fees | | $ | 46,899 | | $ | 49,500 | |
Audit-Related Fees | | — | | 4,500 | |
Tax Fees | | 12,800 | | 12,975 | |
All Other Fees | | — | | — | |
| | | | | | | |
Audit-related fees were billed in connection with agreed upon procedures performed by the registrant’s principal accountant relating to after-tax return calculations. Tax fees were billed in connection with the preparation of tax returns, calculation and designation of dividends and other miscellaneous tax services.
Aggregate fees billed by the registrant’s principal accountant for the last two fiscal years for non-audit services provided to the registrant’s investment adviser (not including a sub-adviser whose role is primarily portfolio management and is subcontracted or overseen by another investment adviser) and any entity controlling, controlled by, or under common control with the investment adviser that provides ongoing services to the registered investment company, where the engagement relates directly to the operations and financial reporting of the registrant, were as follows:
| | 2006 | | 2005 | |
Audit-Related Fees | | — | | — | |
Tax Fees | | — | | — | |
All Other Fees | | $ | 65,000 | | $ | 85,000 | |
| | | | | | | |
These other fees were billed in connection with internal control reviews.
(e)(1) The audit committee is required to pre-approve audit and non-audit services performed for the registrant by the principal accountant. The audit committee also is required to pre-approve non-audit services performed by the registrant’s principal accountant for the registrant’s investment adviser and any sub-adviser (not including any sub-adviser whose role is primarily portfolio management and is subcontracted with or overseen by another investment adviser) and/or to any entity controlling, controlled by or under common control with the registrant’s investment adviser that provides ongoing services to the registrant, if the engagement for services relates directly to the operations and financial reporting of the registrant.
The audit committee may delegate pre-approval authority to one or more of its members who are independent members of the board of directors of the registrant. The member or members to whom such authority is delegated shall report any pre-approval decisions to the audit committee at its next scheduled meeting. The audit committee may not delegate its responsibility to pre-approve services to be performed by the registrant’s principal accountant to the investment adviser.
(e) (2) No services included in (b) – (d) above were approved by the audit committee pursuant to paragraphs (c)(7)(i)(C) of Rule 2-01 of Regulation S-X.
(f) Not applicable.
(g) For the fiscal years ended December 31, 2006 and December 31, 2005, the aggregate fees billed by the registrant’s principal accountant for non-audit services rendered to the registrant and for non-audit services rendered to the registrant’s investment adviser (not including any sub-adviser whose role is primarily portfolio management and is subcontracted with or overseen by another investment adviser) and/or to any entity controlling, controlled by or under common control with the registrant’s investment adviser that provides ongoing services to the registrant were $77,800 and $102,475, respectively.
(h) The registrant’s audit committee considered whether the provision of non-audit services that were rendered to the registrant’s investment adviser (not including any sub-adviser whose role is primarily portfolio management and is subcontracted with or overseen by another investment adviser) and/or to any entity controlling, controlled by or under common control with the registrant’s investment adviser that provides ongoing services to the registrant that were not required to be pre-approved pursuant to paragraph (c)(7)(ii) of Rule 2-01 of Regulation S-X was compatible with maintaining the principal accountant’s independence.
Item 5. Audit Committee of Listed Registrants.
Not applicable.
Item 6. Schedule of Investments.
Included in Item 1 above.
Item 7. Disclosure of Proxy Voting Policies and Procedures for Closed-End Management Investment Companies.
Not applicable.
Item 8. Portfolio Managers of Closed-End Investment Companies.
Not applicable.
Item 9. Purchases of Equity Securities by Closed-End Management Investment Company and Affiliated Purchasers.
Not applicable.
Item 10. Submission of Matters to a Vote of Security Holders.
Not applicable.
Item 11. Controls and Procedures.
(a) The registrant’s principal executive officer and principal financial officer have concluded that the registrant’s disclosure controls and procedures are reasonably designed to ensure that information required to be disclosed by the registrant in this Form N-CSR was recorded, processed, summarized and reported within the time periods specified in the Securities and Exchange Commission’s rules and forms, based upon such officers’ evaluation of these controls and procedures as of a date within 90 days of the filing date of this report.
(b) There were no changes in the registrant’s internal control over financial reporting that occurred during the second fiscal quarter of the period covered by this report that have materially affected, or are reasonably likely to materially affect, the registrant’s internal control over financial reporting.
Item 12. Exhibits.
(a)(1) Not applicable.
(a) (2) Certifications of principal executive officer and principal financial officer as required by Rule 30a-2(a) under the Investment Company Act of 1940.
(b) Certifications of chief executive officer and chief financial officer as required by Rule 30a- 2(b) under the Investment Company Act of 1940.
SIGNATURES
Pursuant to the requirements of the Securities Exchange Act of 1934 and the Investment Company Act of 1940, the registrant has duly caused this report to be signed on its behalf by the undersigned, thereunto duly authorized.
COHEN & STEERS REALTY FOCUS FUND, INC.
| | By: | /s/ Adam M. Derechin | |
| | | | Name: Adam M. Derechin |
| | | | Title: President and Chief Executive Officer |
| | | | |
| | Date: February 27, 2007 |
| | | | | | |
Pursuant to the requirements of the Securities Exchange Act of 1934 and the Investment Company Act of 1940, this report has been signed below by the following persons on behalf of the registrant and in the capacities and on the dates indicated.
| | By: | /s/ Adam M. Derechin | |
| | | | Name: | Adam M. Derechin |
| | | | Title: | President and Chief Executive Officer |
| | | | | (principal executive officer) |
| | | | |
| | By: | /s/ James Giallanza | |
| | | | Name: | James Giallanza |
| | | | Title: | Treasurer |
| | | | | (principal financial officer) |
| | | | |
| | | | |
| | Date: February 27, 2007 |
| | | | | | | |