UNITED STATES
SECURITIES AND EXCHANGE COMMISSION
Washington, D.C. 20549
FORM N-CSR
CERTIFIED SHAREHOLDER REPORT OF REGISTERED
MANAGEMENT INVESTMENT COMPANIES
Investment Company Act file number: | 811-8059 |
|
Cohen & Steers Global Realty Shares, Inc. |
(Exact name of registrant as specified in charter) |
|
280 Park Avenue, New York, NY | | 10017 |
(Address of principal executive offices) | | (Zip code) |
|
Adam M. Derechin Cohen & Steers Capital Management, Inc. 280 Park Avenue New York, New York 10017 |
(Name and address of agent for service) |
|
Registrant’s telephone number, including area code: | (212) 832-3232 | |
|
Date of fiscal year end: | December 31 | |
|
Date of reporting period: | December 31, 2007 | |
| | | | | | | | | |
Item 1. Reports to Stockholders.
COHEN & STEERS GLOBAL REALTY SHARES, INC.
February 8, 2008
To Our Shareholders:
We are pleased to submit to you our report for the year ended December 31, 2007. The net asset values per share at that date were $50.32, $50.12, $50.14 and $50.54 for Class A, Class B, Class C and Class I shares, respectively. In addition, an ordinary income dividend was declared for shareholders of record on December 28, 2007 and paid on December 31, 2007 to all four classes of shares in the amount of $0.205 per share to Class A shares, $0.053 to Class B Shares, $0.089 to Class C Shares, and $0.282 to Class I Shares.a
The total return, including income and change in net asset value, for the fund and the comparative benchmarks were:
| | | Six Months Ended
December 31, 2007 | | Year Ended
December 31, 2007 | |
| Cohen & Steers Global Realty Shares Fund—Class A | | | –13.24 | % | | | –18.85 | % | |
| Cohen & Steers Global Realty Shares Fund—Class B | | | –13.54 | % | | | –19.40 | % | |
| Cohen & Steers Global Realty Shares Fund—Class C | | | –13.51 | % | | | –19.36 | % | |
| Cohen & Steers Global Realty Shares Fund—Class I | | | –13.08 | % | | | –18.58 | % | |
| FTSE EPRA/NAREIT Global Real Estate Indexb | | | –6.96 | % | | | –6.96 | % | |
Custom Index: FTSE NAREIT Equity REIT Index—
FTSE EPRA/NAREIT Global Real Estate Indexb,c | | | –7.92 | % | | | –13.35 | % | |
| FTSE NAREIT Equity REIT Indexb | | | –10.42 | % | | | –15.69 | % | |
| S&P 500 Indexb | | | –1.37 | % | | | 5.49 | % | |
The performance data quoted represent past performance. Past performance is no guarantee of future results. The investment return and the principal value of an investment will fluctuate and shares, if redeemed, may be worth more or less than their original cost. Current performance may be lower or higher than the performance data quoted. Total returns of the fund current to the most recent month-end can be obtained by visiting our Web site at cohenandsteers.com. Performance quoted does not reflect the deduction of the maximum 4.5% initial sales charge on Class A shares or the 5% and 1% maximum contingent deferred sales charge on Class B and Class C shares, respectively. If such charges were included, returns would have been lower.
a Please note that distributions paid by the fund to shareholders are subject to recharacterization for tax purposes. The final tax treatment of these distributions is reported to shareholders after the close of the calendar year.
b The FTSE EPRA/NAREIT Global Real Estate Index is an unmanaged portfolio of approximately 295 constituents from 21 countries. The FTSE NAREIT Equity REIT Index is an unmanaged, market capitalization weighted index of all publicly traded REITs that invest predominantly in the equity ownership of real estate. The index is designed to reflect the performance of all publicly traded equity REITs as a whole. The S&P 500 Index is an unmanaged index of common stocks that is frequently used as a general measure of stock market performance.
c A custom index represented by performance of the FTSE NAREIT Equity REIT Index for periods from the fund's inception to September 28, 2007 and the FTSE EPRA/NAREIT Global Real Estate Index for periods thereafter. The Index was changed to more accurately reflect the fund's amended investable universe.
1
COHEN & STEERS GLOBAL REALTY SHARES, INC.
Effective September 28, 2007, the fund adopted a global investment mandate, where at least 80% of the fund's net assets will be invested in common stocks and other equity securities issued by non-U.S. as well as U.S. real estate companies. The fund's investment objective is total return through capital appreciation and current income.
This represents a change in strategy. Since its inception in 1997, the fund has sought maximum long-term capital appreciation by investing primarily in a limited number of U.S. real estate investment trusts (REITs) and other real estate-oriented companies. We believe that the advent of more REIT and REIT-like structures in major European markets and the significant economic growth we see in the Asia Pacific region present attractive investment opportunities.
Investment Review
U.S. REITs reverse course
U.S. real estate securities suffered a decline (with a total return of –16.4%)1 after four straight years of double-digit gains and seven years of positive total returns. As the year began, the U.S. economy was strong, driving growth in demand for commercial real estate. New supply of competitive commercial real estate product was relatively muted and debt markets were highly liquid and accommodative of real estate M&A activity. This was highlighted in January by a bidding contest for Equity Office Properties, which was acquired by The Blackstone Group in a $41 billion transaction, at a 24% premium to the market price when the offer was first made.
REITs hit by credit woes
However, as credit concerns broadened during the summer, commercial banks became reluctant to lend. Loans to finance M&A stopped abruptly, removing a positive catalyst for the REIT market. In addition, the credit crunch increased the possibility of a U.S. economic recession, fueling worries over underlying fundamentals for real estate.
U.S. real estate securities, which had reached an all-time high in February 2007, declined more than 20% from that peak by August. REITs were volatile over the remainder of the year, as investors reacted to monetary news (the U.S. Federal Reserve reduced interest rates from 5.25% to 4.25% between September and the end of the year) and the latest unsettling credit news.
The crises crossed the Atlantic
The liquidity crisis and credit crunch became visible in Europe in September, when the Bank of England (BOE) stepped in to rescue Northern Rock PLC. A residential lender that borrowed heavily from the capital markets, Northern Rock saw its access to capital essentially cut off. The bank's difficulties contributed to a crisis of confidence that saw financial institutions become reluctant to lend to businesses and to each other.
1 Country returns are in local currencies as measured by the FTSE EPRA/NAREIT Global Real Estate Index.
2
COHEN & STEERS GLOBAL REALTY SHARES, INC.
The U.K. declined
The United Kingdom's decline (–36.3%) began in January amid profit-taking from the late-2006 REIT-conversion rally. Two BOE interest-rate hikes and concerns that office property values would fall in an economic slowdown put additional downward pressure on prices. A 25 basis-point interest-rate cut by the U.K. central bank in December—the first in more than two years—may have signaled the beginning of a more accommodative monetary policy that could help stimulate economic growth and improve credit conditions.
London office rents increased throughout the year due to low vacancies, strong leasing activity and moderate new supply. West End offices performed better than those in the City—the financial district—due to lower vacancies, minimal development activity and less reliance on financial services tenants.
The ECB targeted inflation
Europe's GDP growth in 2007 (3.0%) was accompanied by greater-than-targeted inflation (2.6%). The European Central Bank (ECB) took a hawkish stance against inflation and raised interest rates to 4.0% in the second quarter—its highest level in six years.
The decline in French property stocks (–19.7%) was attributable to the liquidity crunch and a diminished economic outlook. The Paris office sector, however, benefited from continued demand growth and limited supply. France's office market was also in a better position to ride out further erosion in the banking sector because of its modest reliance on financial services tenants.
Residential property shares in Germany (–40.0%) sold off as fundamentals for apartments were not as strong as the market expected. Norway (–1.0%) was the best performer among Europe's developed markets. Rising oil prices stimulated the energy-dependent economy, leading to higher valuations. Commercial property supply has been limited, and high construction costs kept supply tight.
Asia Pacific steered its own course
At times, Asia Pacific appeared largely immune to the credit crisis that paralyzed U.S. and European financial markets. However, evidence that the region was susceptible emerged in December when Centro Properties Group, an Australian LPT, was unable to refinance debt.
Hong Kong led the region, but China was the engine
Hong Kong (+58.9%) was the top performer in the region. Declining interest rates (the Hong Kong dollar is pegged to the U.S. dollar), falling unemployment and rising household income benefited residential developers. The office sector received a boost from China's decision to expand the Qualified Domestic Institutional Investor (QDII) program, which will allow mainland investors to invest in Hong Kong stocks, spurring demand from financial services tenants.
3
COHEN & STEERS GLOBAL REALTY SHARES, INC.
Singapore (+8.1%) sold off over the second half of the year after the government introduced a policy initiative to increase office, residential and hotel property supply in an attempt to keep the country's cost of occupancy competitive with other markets in the region.
Japan's recovery stalled
Japan (–12.3%) had positive returns early in the year on the belief that a sustained economic recovery was underway. Nevertheless, property stocks—and equities in general—sold off as the prospect of global economic slowing created uncertainty about Japan's economy and corporate earnings. Property fundamentals in Japan were healthy nonetheless, particularly in the Tokyo office market.
Australia (–7.7%), a positive performer for most of the year, declined in December when Centro sold off on the announcement that it was unable to refinance A$2.7 billion of maturing debt taken on to finance its aggressive acquisition program. Centro's difficulties reverberated throughout the world, as it was the first major liquidity crisis to hit commercial real estate markets. There do not appear to be many similar refinancing situations, however.
Performance hindered by offices and apartments
The fund underperformed the FTSE NAREIT Equity REIT Index for the first nine months of the period, when it tracked that benchmark. Factors that hindered performance included our overweights and stock selection in the office, apartment and self storage sectors. In addition, while stock selection in the health care and regional mall sectors was relatively favorable, this was more than offset by our underweights in both. Our underweight in health care reflected the fund's (at the time) objective of maximum capital appreciation—health care companies do not typically represent the best capital appreciation opportunities. Within the mall sector, our focus was limited to companies we deemed to have high-quality assets and strong balance sheets.
Stock selection in the hotel sector aided relative performance—we owned Hilton Hotels (not included in the NAREIT index), whose stock rose 40% when The Blackstone Group announced in July that it would purchase Hilton for $26 billion. Stock selection in the shopping center sector helped performance, as did our underweight in certain companies that own both industrial and office properties.
In the year's fourth quarter, operating with the new global investment objective, the fund modestly underperformed the FTSE EPRA/NAREIT Global Real Estate Index. This was due primarily to our overweight in the United Kingdom, which underperformed the global index for the quarter as it did for 2007 as a whole. Stock selection in the U.S. hindered the fund's return in the fourth quarter, while stock selection in Hong Kong and Australia and our underweight in Australia (which struggled late in the year amid the Centro decline) aided the fund's performance.
Investment Outlook
A broad recovery in property share prices is likely to hinge on how quickly and completely the global economy works through the liquidity and credit crises that escalated in 2007.
4
COHEN & STEERS GLOBAL REALTY SHARES, INC.
U.S. real estate securities were trading at an 18% discount to their underlying net asset value as of December 31, 2007, compared with a premium of 13% at the end of 2006, and a historical average premium of 5%. The size of this discount suggests to us that the market is expecting at least a mild U.S. recession and a meaningful decline in property values. Our view is that the economy will slow, with some possibility of it dipping into recession, before reaccelerating in the second half of 2008 as monetary and fiscal stimulus actions take hold.
The United Kingdom and continental Europe will likely experience further declines in real estate asset values, although not to the degree that they saw in 2007. We believe that investor sentiment in the U.K. is bottoming out and that we are seeing the beginnings of constructive drivers for stocks.
In our opinion, European property shares, while inexpensive relative to real estate values, face continued headwinds; fighting inflation, rather than spurring growth, is the ECB's primary focus.
With respect to Asia, rate cuts by the U.S. Federal Reserve in 2008 are likely to stimulate Hong Kong's economy, which will likely lead to asset price inflation. Residential developers should benefit from that economic scenario as lower borrowing costs typically spur home purchases. We nevertheless believe that landlords represent the better value, as they have been largely overlooked and are attractively valued.
We anticipate that the Chinese government's restrictive monetary and regulatory measures to control real estate speculation will succeed in slowing the white-hot economy. Share prices of richly valued mainland-based residential developers may come under pressure. We will selectively take advantage of opportunities, as we believe in China's long-term growth story.
We are less bullish on Singapore than we have been in the past because of the government's intention to increase office, residential and hotel supply with the goal of keeping the country cost-competitive with its neighbors. We are closely monitoring these initiatives and their effect on property fundamentals.
Japanese property stocks and J-REITs are cheap following this year's correction. If the global financial markets stabilize, Japanese real estate securities may regain the momentum they had going into 2007.
Centro Properties will weigh on Australia for a while, even though its complex financing structure is an anomaly. We are cautious about the LPTs because of rising inflation, the likelihood of continued monetary tightening and a preponderance of portfolio assets in Europe and the United States. The domestic market, however, features strong demand growth and limited capacity.
Generally, we believe 2008 is likely to be characterized as a year in which 2007's monetary tightening gives way to easing. Likewise, we believe investors will come to recognize that property stocks may present an attractive investment opportunity in 2008, as economies benefit from lower interest rates and investors have more confidence in net asset values. In this environment, we remain more focused than ever on companies with strong management, solid balance sheets and properties in the most desirable locations.
5
COHEN & STEERS GLOBAL REALTY SHARES, INC.
Sincerely,
 | |  | |
|
| MARTIN COHEN | | ROBERT H. STEERS | |
|
| Co-chairman | | Co-chairman | |
|
 | |  | |
|
| JOSEPH M. HARVEY | | JAMES S. CORL | |
|
| Portfolio Manager | | Portfolio Manager | |
|
 | |  | |
|
| W. JOSEPH HOULIHAN | | GERIOS J. M. ROVERS | |
|
| Portfolio Manager | | Portfolio Manager | |
|
| | |  | |
|
| | | DEREK CHEUNG | |
|
| | | Portfolio Manager | |
|
The views and opinions in the preceding commentary are as of the date stated and are subject to change. This material represents an assessment of the market environment at a specific point in time, should not be relied upon as investment advice and is not intended to predict or depict performance of any investment.
Visit Cohen & Steers online at cohenandsteers.com
For more information about any of our funds, visit cohenandsteers.com, where you'll find daily net asset values, fund fact sheets and portfolio highlights. You can also access newsletters, education tools and market updates covering REIT, utility and preferred securities sectors.
In addition, our Web site contains comprehensive information about our firm, including our most recent press releases, profiles of our senior investment professionals, and an overview of our investment approach.
6
COHEN & STEERS GLOBAL REALTY SHARES, INC.
Performance Review (Unaudited)
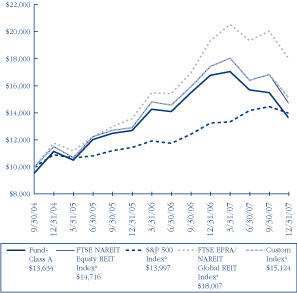
Cohen & Steers Global Realty Shares—Class A
Growth of a $10,000 Investment
Cohen & Steers Global Realty Shares—Class B
Growth of a $10,000 Investment

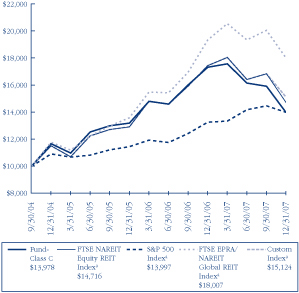
Cohen & Steers Global Realty Shares—Class C
Growth of a $10,000 Investment
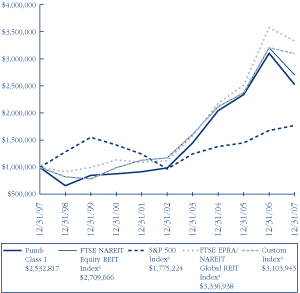
Cohen & Steers Global Realty Shares—Class I
Growth of a $1,000,000 Investment
7
COHEN & STEERS GLOBAL REALTY SHARES, INC.
Performance Review (Unaudited)—(Continued)
Average Annual Total Returns — For the Periods Ended December 31, 2007
| | | Class A Shares | | Class B Shares | | Class C Shares | | Class I Shares | |
| 1 Year (with sales charge) | | | –22.50 | %b | | | –23.43 | %c | | | –20.17 | %e | | | — | | |
| 1 Year (without sales charge) | | | –18.85 | % | | | –19.40 | % | | | –19.36 | % | | | –18.58 | % | |
| 5 Years (without sales charge) | | | — | | | | — | | | | — | | | | 20.67 | % | |
| Since Inceptionf (with sales charge) | | | 10.01 | %b | | | 10.07 | %d | | | 10.85 | % | | | — | | |
| Since Inceptionf (without sales charge) | | | 11.58 | % | | | 10.82 | % | | | 10.85 | % | | | 12.75 | % | |
The performance data quoted represents past performance. Past performance is no guarantee of future results. The investment return and principal value of an investment will fluctuate and shares, when redeemed, may be worth more or less than their original cost. Current performance may be lower or higher than the performance data quoted. Performance information current to the most recent month-end can be obtained by visiting our Web site at cohenandsteers.com. The performance graph and table do not reflect the deduction of taxes that a shareholder would pay on fund distributions or the redemption of fund shares.
The annulized gross and net expense ratios, respectively, for each class of shares as disclosed in the September 28, 2007 prospectuses were as follows: Class A — 1.67% and 1.65%; Class B — 2.32% and 2.30%; Class C — 2.32% and 2.30%; and Class I — 1.31% and 1.30%. Through December 31, 2008, the advisor has contractually agreed to waive its fee and/or reimburse the fund for expenses incurred to the extent necessary to maintain the fund's annual operating expenses at 1.65% for Class A shares, 2.30% for both Class B and Class C shares and 1.30% for Class I shares.
Effective September 28, 2007, the fund changed its investment objective and strategy to invest according to a global real estate strategy. Prior to this date, the fund achieved its investment objective under a domestic real estate strategy. The performance record shown in the table for periods prior to September 28, 2007 was achieved under the fund's previous strategy.
a The comparative indexes are not adjusted to reflect expenses or other fees that the SEC requires to be reflected in the fund's performance. The fund's performance assumes the reinvestment of all dividends and distributions. For more information, including charges and expenses, please read the prospectus carefully before you invest.
b Reflects a 4.50% front-end sales charge.
c Reflects a contingent deferred sales charge of 5%.
d Reflects a contingent deferred sales charge of 3%.
e Reflects a contingent deferred sales charge of 1%.
f Inception dates: September 30, 2004 for Class A, B, and C and May 8, 1997 for Class I.
8
COHEN & STEERS GLOBAL REALTY SHARES, INC.
Expense Example
(Unaudited)
As a shareholder of the fund, you incur two types of costs: (1) transaction costs, including sales charges (loads) on purchase payments and redemption fees; and (2) ongoing costs including management fees; distribution and/or service (12b-1) fees; and other fund expenses. This example is intended to help you understand your ongoing costs (in dollars) of investing in the fund and to compare these costs with the ongoing costs of investing in other mutual funds.
The example is based on an investment of $1,000 invested at the beginning of the period and held for the entire period July 1, 2007—December 31, 2007.
Actual Expenses
The first line of the table below provides information about actual account values and expenses. You may use the information in this line, together with the amount you invested, to estimate the expenses that you paid over the period. Simply divide your account value by $1,000 (for example, an $8,600 account value divided by $1,000 = 8.6), then multiply the result by the number in the first line under the heading entitled "Expenses Paid During Period" to estimate the expenses you paid on your account during this period.
Hypothetical Example for Comparison Purposes
The second line of the table below provides information about hypothetical account values and hypothetical expenses based on the fund's actual expense ratio and an assumed rate of return of 5% per year before expenses, which is not the fund's actual return. The hypothetical account values and expenses may not be used to estimate the actual ending account balance or expenses you paid for the period. You may use this information to compare the ongoing cost of investing in the fund and other funds. To do so, compare this 5% hypothetical example with the 5% hypothetical examples that appear in the shareholder reports of other funds.
Please note that the expenses shown in the table are meant to highlight your ongoing costs only and do not reflect any transactional costs, such as sales charges (loads) and redemption fees. Therefore, the second line of the table is useful in comparing ongoing costs only, and will not help you determine the relative total costs of owning different funds. In addition, if these transactional costs were included, your costs would have been higher.
9
COHEN & STEERS GLOBAL REALTY SHARES, INC.
Expense Example (Unaudited)—(Continued)
| | | Beginning
Account Value
July 1, 2007 | | Ending
Account Value
December 31, 2007 | | Expenses Paid
During Period*
July 1, 2007–
December 31, 2007 | |
| Class A | |
| Actual (–13.24% return) | | $ | 1,000.00 | | | $ | 867.60 | | | $ | 7.72 | | |
| Hypothetical (5% annual return before expenses) | | $ | 1,000.00 | | | $ | 1,016.94 | | | $ | 8.34 | | |
| Class B | |
| Actual (–13.54% return) | | $ | 1,000.00 | | | $ | 864.60 | | | $ | 10.76 | | |
| Hypothetical (5% annual return before expenses) | | $ | 1,000.00 | | | $ | 1,013.66 | | | $ | 11.62 | | |
| Class C | |
| Actual (–13.51% return) | | $ | 1,000.00 | | | $ | 864.90 | | | $ | 10.76 | | |
| Hypothetical (5% annual return before expenses) | | $ | 1,000.00 | | | $ | 1,013.66 | | | $ | 11.62 | | |
| Class I | |
| Actual (–13.08% return) | | $ | 1,000.00 | | | $ | 869.20 | | | $ | 6.08 | | |
| Hypothetical (5% annual return before expenses) | | $ | 1,000.00 | | | $ | 1,018.70 | | | $ | 6.56 | | |
* Expenses are equal to the fund's Class A, Class B, Class C and Class I annualized expense ratio of 1.64%, 2.29%, 2.29% and 1.29%, respectively, multiplied by the average account value over the period, multiplied by 184/365 (to reflect the one-half year period). If the fund had borne all of its expenses that were assumed by the advisor, the annualized expense ratios would have been 1.86%, 2.52%, 2.55% and 1.44%, respectively.
10
COHEN & STEERS GLOBAL REALTY SHARES, INC.
DECEMBER 31, 2007
Top Ten Long-Term Holdings
(Unaudited)
| Security | | Market
Value | | % of
Net
Assets | |
| Land Securities Group PLC | | $ | 7,472,216 | | | | 4.7 | % | |
| Unibail-Rodamco | | | 7,418,066 | | | | 4.7 | | |
| Mitsubishi Estate Co., Ltd. | | | 7,188,918 | | | | 4.5 | | |
| Mitsui Fudosan Co., Ltd. | | | 5,959,988 | | | | 3.8 | | |
| SL Green Realty Corp. | | | 5,210,862 | | | | 3.3 | | |
| Macerich Co. | | | 5,115,965 | | | | 3.2 | | |
| Derwent London PLC | | | 4,743,038 | | | | 3.0 | | |
| Henderson Land Development Company Ltd. | | | 4,690,914 | | | | 3.0 | | |
| Public Storage | | | 4,666,600 | | | | 2.9 | | |
| Sun Hung Kai Properties Ltd. | | | 4,307,646 | | | | 2.7 | | |
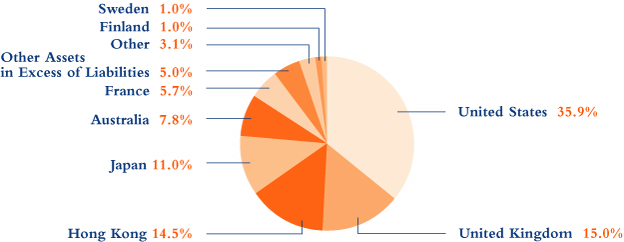
Country Breakdown
(Based on Net Assets)
(Unaudited)
11
COHEN & STEERS GLOBAL REALTY SHARES, INC.
SCHEDULE OF INVESTMENTS
December 31, 2007
| | | | | Number
of Shares | | Value | |
| COMMON STOCK | | | 95.0 | % | | | | | | | | | |
| AUSTRALIA | | | 7.8 | % | | | | | | | | | |
| DIVERSIFIED | | | 3.3 | % | | | | | | | | | |
| DB RREEF Trust | | | | | | | 382,652 | | | $ | 671,975 | | |
| GPT Group | | | | | | | 735,947 | | | | 2,610,642 | | |
| Mirvac Group | | | | | | | 165,202 | | | | 870,334 | | |
| Stockland | | | | | | | 152,602 | | | | 1,128,214 | | |
| | | | | | | | 5,281,165 | | |
| INDUSTRIAL | | | 0.9 | % | | | | | | | | | |
| Macquarie Goodman Group | | | | | | | 340,957 | | | | 1,463,955 | | |
| MALLS | | | 1.4 | % | | | | | | | | | |
| Westfield Group | | | | | | | 120,649 | | | | 2,224,654 | | |
| OFFICE | | | 1.4 | % | | | | | | | | | |
| Commonwealth Property Office Fund | | | | | | | 1,635,289 | | | | 2,218,413 | | |
| SHOPPING CENTER | | | 0.8 | % | | | | | | | | | |
| CFS Gandel Retail Trust | | | | | | | 565,074 | | | | 1,161,022 | | |
| TOTAL AUSTRALIA | | | | | | | | | | | 12,349,209 | | |
| AUSTRIA | | | 0.4 | % | | | | | | | | | |
| DIVERSIFIED | | | | | | | | | | | | | |
| CA Immobilien Anlagen AGa | | | | | | | 29,991 | | | | 670,880 | | |
| FINLAND | | | 1.0 | % | | | | | | | | | |
| DIVERSIFIED | | | 0.5 | % | | | | | | | | | |
| Citycon Oyj | | | | | | | 156,377 | | | | 834,503 | | |
| OFFICE | | | 0.5 | % | | | | | | | | | |
| Sponda Oyj | | | | | | | 67,573 | | | | 807,156 | | |
| TOTAL FINLAND | | | | | | | | | | | 1,641,659 | | |
| FRANCE | | | 5.7 | % | | | | | | | | | |
| DIVERSIFIED | | | 5.5 | % | | | | | | | | | |
| ICADE | | | | | | | 3,623 | | | | 540,348 | | |
Societe Immobiliere de Location pour L'Industrie
et le Commerce (Silic) | | | | | | | 4,677 | | | | 685,784 | | |
| Unibail-Rodamco | | | | | | | 33,843 | | | | 7,418,066 | | |
| | | | | | | | 8,644,198 | | |
See accompanying notes to financial statements.
12
COHEN & STEERS GLOBAL REALTY SHARES, INC.
SCHEDULE OF INVESTMENTS—(Continued)
December 31, 2007
| | | | | Number
of Shares | | Value | |
| SHOPPING CENTER | | | 0.2 | % | | | | | | | | | |
| Mercialys Promesse | | | | | | | 9,872 | | | $ | 377,721 | | |
| TOTAL FRANCE | | | | | | | | | | | 9,021,919 | | |
| GERMANY | | | 0.6 | % | | | | | | | | | |
| APARTMENT | | | 0.2 | % | | | | | | | | | |
| Deutsche Wohnen AG | | | | | | | 10,561 | | | | 325,799 | | |
| DIVERSIFIED | | | 0.3 | % | | | | | | | | | |
| IVG Immobilien AG | | | | | | | 13,088 | | | | 451,211 | | |
| OFFICE | | | 0.1 | % | | | | | | | | | |
| Eurocastle Investment Ltd. | | | | | | | 6,138 | | | | 150,315 | | |
| TOTAL GERMANY | | | | | | | | | | | 927,325 | | |
| HONG KONG | | | 14.5 | % | | | | | | | | | |
| DIVERSIFIED | | | 10.8 | % | | | | | | | | | |
| Cheung Kong Holdings Ltd. | | | | | | | 69,097 | | | | 1,278,721 | | |
| Great Eagle Holdings Ltd. | | | | | | | 592,196 | | | | 2,213,881 | | |
| Henderson Land Development Company Ltd. | | | | | | | 497,307 | | | | 4,690,914 | | |
| Hysan Development Company Ltd. | | | | | | | 524,228 | | | | 1,499,254 | | |
| Kerry Properties Ltd. | | | | | | | 39,000 | | | | 315,105 | | |
| Sino Land Co., Ltd. | | | | | | | 354,309 | | | | 1,254,127 | | |
| Sun Hung Kai Properties Ltd. | | | | | | | 203,074 | | | | 4,307,646 | | |
| Wharf Holdings Ltd. | | | | | | | 323,800 | | | | 1,698,440 | | |
| | | | | | | | 17,258,088 | | |
| HOTEL | | | 0.8 | % | | | | | | | | | |
| Shangri-La Asia Ltd. | | | | | | | 403,681 | | | | 1,281,338 | | |
| OFFICE | | | 2.3 | % | | | | | | | | | |
| Hongkong Land Holdings Ltd. (USD) | | | | | | | 734,000 | | | | 3,625,960 | | |
See accompanying notes to financial statements.
13
COHEN & STEERS GLOBAL REALTY SHARES, INC.
SCHEDULE OF INVESTMENTS—(Continued)
December 31, 2007
| | | | | Number
of Shares | | Value | |
| REAL ESTATE OPERATIONS/DEVELOPMENT | | | 0.6 | % | | | | | | | | | |
| New World China Land Ltd. | | | | | | | 1,001,694 | | | $ | 908,248 | | |
| Sino-Ocean Land Holdings Ltd.a | | | | | | | 983 | | | | 1,218 | | |
| | | | | | | | 909,466 | | |
| TOTAL HONG KONG | | | | | | | | | | | 23,074,852 | | |
| ITALY | | | 0.7 | % | | | | | | | | | |
| OFFICE | | | | | | | | | | | | | |
| Beni Stabili S.p.A. | | | | | | | 952,081 | | | | 1,034,945 | | |
| JAPAN | | | 11.0 | % | | | | | | | | | |
| DIVERSIFIED | | | 1.4 | % | | | | | | | | | |
| Heiwa Real Estate Co., Ltd. | | | | | | | 142,500 | | | | 905,653 | | |
| Kenedix Realty Investment Corp. | | | | | | | 68 | | | | 454,084 | | |
| Sumitomo Realty & Development Co., Ltd. | | | | | | | 31,000 | | | | 767,265 | | |
| Tokyo Tatemono Co., Ltd. | | | | | | | 5,000 | | | | 47,352 | | |
| | | | | | | | 2,174,354 | | |
| OFFICE | | | 8.8 | % | | | | | | | | | |
| DA Office Investment Corp. | | | | | | | 42 | | | | 272,193 | | |
| Mitsubishi Estate Co., Ltd. | | | | | | | 298,000 | | | | 7,188,918 | | |
| Mitsui Fudosan Co., Ltd. | | | | | | | 274,000 | | | | 5,959,988 | | |
| Nomura Real Estate Office Fund | | | | | | | 59 | | | | 559,817 | | |
| | | | | | | | 13,980,916 | | |
| SHOPPING CENTER | | | 0.8 | % | | | | | | | | | |
| AEON Mall Co., Ltd. | | | | | | | 51,000 | | | | 1,346,731 | | |
| TOTAL JAPAN | | | | | | | | | | | 17,502,001 | | |
| NETHERLANDS | | | 0.4 | % | | | | | | | | | |
| SHOPPING CENTER | | | | | | | | | | | | | |
| Corio NV | | | | | | | 8,834 | | | | 715,533 | | |
| NORWAY | | | 0.3 | % | | | | | | | | | |
| DIVERSIFIED | | | | | | | | | | | | | |
| Norwegian Property ASA | | | | | | | 43,282 | | | | 530,080 | | |
See accompanying notes to financial statements.
14
COHEN & STEERS GLOBAL REALTY SHARES, INC.
SCHEDULE OF INVESTMENTS—(Continued)
December 31, 2007
| | | | | Number
of Shares | | Value | |
| SINGAPORE | | | 0.7 | % | | | | | | | | | |
| DIVERSIFIED | | | 0.2 | % | | | | | | | | | |
| CapitaLand Ltd. | | | | | | | 82,000 | | | $ | 357,178 | | |
| OFFICE | | | 0.5 | % | | | | | | | | | |
| CapitaCommercial Trust | | | | | | | 417,000 | | | | 706,853 | | |
| TOTAL SINGAPORE | | | | | | | | | | | 1,064,031 | | |
| SWEDEN | | | 1.0 | % | | | | | | | | | |
| DIVERSIFIED | | | | | | | | | | | | | |
| Castellum AB | | | | | | | 148,816 | | | | 1,548,440 | | |
| UNITED KINGDOM | | | 15.0 | % | | | | | | | | | |
| DIVERSIFIED | | | 8.8 | % | | | | | | | | | |
| British Land Co., PLC | | | | | | | 161,360 | | | | 3,035,371 | | |
| Hammerson PLC | | | | | | | 134,914 | | | | 2,752,739 | | |
| Helical Bar PLC | | | | | | | 114,818 | | | | 731,382 | | |
| Land Securities Group PLC | | | | | | | 249,253 | | | | 7,472,216 | | |
| | | | | | | | 13,991,708 | | |
| INDUSTRIAL | | | 1.5 | % | | | | | | | | | |
| Segro PLC | | | | | | | 243,977 | | | | 2,282,605 | | |
| OFFICE | | | 4.7 | % | | | | | | | | | |
| Derwent London PLC | | | | | | | 168,509 | | | | 4,743,038 | | |
| Great Portland Estates PLC | | | | | | | 291,340 | | | | 2,725,725 | | |
| | | | | | | | 7,468,763 | | |
| TOTAL UNITED KINGDOM | | | | | | | | | | | 23,743,076 | | |
| UNITED STATES | | | 35.9 | % | | | | | | | | | |
| DIVERSIFIED | | | 2.5 | % | | | | | | | | | |
| Vornado Realty Trust | | | | | | | 44,908 | | | | 3,949,659 | | |
See accompanying notes to financial statements.
15
COHEN & STEERS GLOBAL REALTY SHARES, INC.
SCHEDULE OF INVESTMENTS—(Continued)
December 31, 2007
| | | | | Number
of Shares | | Value | |
| HOTEL | | | 4.6 | % | | | | | | | | | |
| Host Hotels & Resorts | | | | | | | 162,353 | | | $ | 2,766,495 | | |
| LaSalle Hotel Properties | | | | | | | 29,176 | | | | 930,714 | | |
| Starwood Hotels & Resorts Worldwide | | | | | | | 62,582 | | | | 2,755,486 | | |
| Sunstone Hotel Investors | | | | | | | 42,777 | | | | 782,391 | | |
| | | | | | | | 7,235,086 | | |
| INDUSTRIAL | | | 0.4 | % | | | | | | | | | |
| ProLogis | | | | | | | 10,577 | | | | 670,370 | | |
| OFFICE | | | 10.9 | % | | | | | | | | | |
| BioMed Realty Trust | | | | | | | 65,584 | | | | 1,519,581 | | |
| Boston Properties | | | | | | | 31,349 | | | | 2,878,152 | | |
| Brookfield Properties Corp. | | | | | | | 91,384 | | | | 1,759,142 | | |
| Douglas Emmett | | | | | | | 40,480 | | | | 915,253 | | |
| DuPont Fabros Technology | | | | | | | 15,000 | | | | 294,000 | | |
| Forest City Enterprises | | | | | | | 22,801 | | | | 1,013,277 | | |
| Kilroy Realty Corp. | | | | | | | 28,826 | | | | 1,584,277 | | |
| Mack-Cali Realty Corp. | | | | | | | 19,893 | | | | 676,362 | | |
| Maguire Properties | | | | | | | 48,120 | | | | 1,418,096 | | |
| SL Green Realty Corp. | | | | | | | 55,755 | | | | 5,210,862 | | |
| | | | | | | | 17,269,002 | | |
| OFFICE/INDUSTRIAL | | | 0.3 | % | | | | | | | | | |
| Liberty Property Trust | | | | | | | 14,866 | | | | 428,290 | | |
| RESIDENTIAL—APARTMENT | | | 4.5 | % | | | | | | | | | |
| Apartment Investment & Management Co. | | | | | | | 26,504 | | | | 920,484 | | |
| AvalonBay Communities | | | | | | | 22,472 | | | | 2,115,514 | | |
| BRE Properties | | | | | | | 38,785 | | | | 1,571,956 | | |
| Equity Residential | | | | | | | 54,223 | | | | 1,977,513 | | |
| UDR | | | | | | | 31,204 | | | | 619,399 | | |
| | | | | | | | 7,204,866 | | |
| SELF STORAGE | | | 2.9 | % | | | | | | | | | |
| Public Storage | | | | | | | 63,569 | | | | 4,666,600 | | |
See accompanying notes to financial statements.
16
COHEN & STEERS GLOBAL REALTY SHARES, INC.
SCHEDULE OF INVESTMENTS—(Continued)
December 31, 2007
| | | | | Number
of Shares | | Value | |
| SHOPPING CENTER | | | 9.8 | % | | | | | | | | | |
| COMMUNITY CENTER | | | 3.4 | % | | | | | | | | | |
| Developers Diversified Realty Corp. | | | | | | | 30,935 | | | $ | 1,184,501 | | |
| Federal Realty Investment Trust | | | | | | | 37,232 | | | | 3,058,609 | | |
| Regency Centers Corp. | | | | | | | 16,772 | | | | 1,081,626 | | |
| | | | | | | | 5,324,736 | | |
| REGIONAL MALL | | | 6.4 | % | | | | | | | | | |
| General Growth Properties | | | | | | | 58,027 | | | | 2,389,552 | | |
| Macerich Co. | | | | | | | 71,995 | | | | 5,115,965 | | |
| Simon Property Group | | | | | | | 31,151 | | | | 2,705,776 | | |
| | | | | | | | 10,211,293 | | |
| TOTAL SHOPPING CENTER | | | | | | | | | | | 15,536,029 | | |
| TOTAL UNITED STATES | | | | | | | | | | | 56,959,902 | | |
TOTAL COMMON STOCK
(Identified cost—$165,304,828) | | | | | | | | | | | 150,783,852 | | |
| | | | | Number
of Rights | | | |
| RIGHTS | | | 0.0 | % | | | | | | | | | |
| HONG KONG | | | | | | | | | | | | | |
| Wharf Holdings Ltd., expires 1/8/08a (Identified cost—$0) | | | | | | | 40,475 | | | | 55,542 | | |
| | | | | Principal
Amount | | | |
| COMMERCIAL PAPER | | | 13.5 | % | | | | | | | | | |
| American Express Credit Corp., 2.00%, due 1/2/08 | | | | | | $ | 7,500,000 | | | | 7,499,583 | | |
| Prudential Funding Corp., 3.15%, due 1/2/08 | | | | | | | 7,500,000 | | | | 7,499,344 | | |
| State Street Boston, 2.00%, due 1/2/08 | | | | | | | 6,478,000 | | | | 6,477,640 | | |
TOTAL COMMERCIAL PAPER
(Identified cost—$21,476,567) | | | | | | | | | | | 21,476,567 | | |
See accompanying notes to financial statements.
17
COHEN & STEERS GLOBAL REALTY SHARES, INC.
SCHEDULE OF INVESTMENTS—(Continued)
December 31, 2007
| | | | | | | Value | |
| TOTAL INVESTMENTS (Identified cost—$186,781,395) | | | 108.5 | % | | | | $ | 172,315,961 | | |
| LIABILITIES IN EXCESS OF OTHER ASSETS | | | (8.5 | )% | | | | | (13,525,340 | ) | |
| NET ASSETS | | | 100.0 | % | | | | $ | 158,790,621 | | |
Glossary of Portfolio Abbreviation
USD United States Dollar
Note: Percentages indicated are based on the net assets of the fund.
a Non-income producing security.
See accompanying notes to financial statements.
18
COHEN & STEERS GLOBAL REALTY SHARES, INC.
STATEMENT OF ASSETS AND LIABILITIES
December 31, 2007
| ASSETS: | |
| Investments in securities, at value (Identified cost—$186,781,395) | | $ | 172,315,961 | | |
| Receivable for fund shares sold | | | 2,397,167 | | |
| Dividends receivable | | | 814,809 | | |
| Receivable for investment securities sold | | | 200,368 | | |
| Receivable due from advisor | | | 18,568 | | |
| Other assets | | | 2,526 | | |
| Total Assets | | | 175,749,399 | | |
| LIABILITIES: | |
| Payable for investment securities purchased | | | 15,130,508 | | |
| Payable for fund shares redeemed | | | 1,481,711 | | |
| Payable for dividends declared | | | 145,241 | | |
| Payable for distribution fees | | | 5,445 | | |
| Payable for directors' fees | | | 3,940 | | |
| Payable for shareholder servicing fees | | | 1,918 | | |
| Other liabilities | | | 190,015 | | |
| Total Liabilities | | | 16,958,778 | | |
| NET ASSETS | | $ | 158,790,621 | | |
| NET ASSETS consist of: | |
| Paid-in-capital | | $ | 175,626,495 | | |
| Dividends in excess of net investment income | | | (38,555 | ) | |
| Accumulated net realized loss | | | (2,314,783 | ) | |
| Net unrealized depreciation | | | (14,482,536 | ) | |
| | | $ | 158,790,621 | | |
See accompanying notes to financial statements.
19
COHEN & STEERS GLOBAL REALTY SHARES, INC.
STATEMENT OF ASSETS AND LIABILITIES—(Continued)
December 31, 2007
| CLASS A SHARES: | |
| NET ASSETS | | $ | 62,217,838 | | |
| Shares issued and outstanding ($0.001 par value common stock outstanding) | | | 1,236,348 | | |
| Net asset value and redemption price per share | | $ | 50.32 | | |
| Maximum offering price per share ($50.32 ÷ 0.955)a | | $ | 52.69 | | |
| CLASS B SHARES: | |
| NET ASSETS | | $ | 3,523,546 | | |
| Shares issued and outstanding ($0.001 par value common stock outstanding) | | | 70,299 | | |
| Net asset value and offering price per shareb | | $ | 50.12 | | |
| CLASS C SHARES: | |
| NET ASSETS | | $ | 45,975,141 | | |
| Shares issued and outstanding ($0.001 par value common stock outstanding) | | | 917,007 | | |
| Net asset value and offering price per shareb | | $ | 50.14 | | |
| CLASS I SHARES: | |
| NET ASSETS | | $ | 47,074,096 | | |
| Shares issued and outstanding ($0.001 par value common stock outstanding) | | | 931,444 | | |
| Net asset value, offering and redemption price per share | | $ | 50.54 | | |
a On investments of $100,000 or more, the offering price is reduced.
b Redemption price per share is equal to the net asset value per share less any applicable deferred sales charge which varies with the length of time shares are held.
See accompanying notes to financial statements.
20
COHEN & STEERS GLOBAL REALTY SHARES, INC.
STATEMENT OF OPERATIONS
For the Year Ended December 31, 2007
| Investment Income: | |
| Dividend income (net of $98,246 of foreign withholding tax) | | $ | 3,713,535 | | |
| Interest income | | | 122,846 | | |
| Total Income | | | 3,836,381 | | |
| Expenses: | |
| Investment advisory fees | | | 1,762,505 | | |
| Distribution fees—Class A | | | 150,926 | | |
| Distribution fees—Class B | | | 26,956 | | |
| Distribution fees—Class C | | | 290,322 | | |
| Professional fees | | | 187,024 | | |
| Shareholder servicing fees—Class A | | | 60,371 | | |
| Shareholder servicing fees—Class B | | | 8,985 | | |
| Shareholder servicing fees—Class C | | | 96,774 | | |
| Administration fees | | | 143,304 | | |
| Shareholder reporting expenses | | | 127,234 | | |
| Transfer agent fees and expenses | | | 122,710 | | |
| Registration and filing fees | | | 64,711 | | |
| Custodian fees and expenses | | | 64,184 | | |
| Directors' fees and expenses | | | 53,365 | | |
| Line of credit fees | | | 3,006 | | |
| Miscellaneous | | | 11,733 | | |
| Total Expenses | | | 3,174,110 | | |
| Reduction of Expenses | | | (162,278 | ) | |
| Net Expenses | | | 3,011,832 | | |
| Net Investment Income | | | 824,549 | | |
| Net Realized and Unrealized Gain (Loss): | |
| Net realized gain on: | |
| Investments | | | 16,611,158 | | |
| Foreign currency transactions | | | 103,602 | | |
| Net realized gain | | | 16,714,760 | | |
| Net change in unrealized appreciation on: | |
| Investments | | | (53,578,510 | ) | |
| Foreign currency translations | | | (17,102 | ) | |
| Net change in unrealized appreciation | | | (53,595,612 | ) | |
| Net realized and unrealized loss | | | (36,880,852 | ) | |
| Net Decrease in Net Assets Resulting from Operations | | $ | (36,056,303 | ) | |
See accompanying notes to financial statements.
21
COHEN & STEERS GLOBAL REALTY SHARES, INC.
STATEMENT OF CHANGES IN NET ASSETS
| | | For the
Year Ended
December 31, 2007 | | For the
Year Ended
December 31, 2006 | |
| Change in Net Assets: | |
| From Operations: | |
| Net investment income | | $ | 824,549 | | | $ | 1,134,676 | | |
| Net realized gain | | | 16,714,760 | | | | 19,404,919 | | |
| Net change in unrealized appreciation | | | (53,595,612 | ) | | | 28,661,974 | | |
Net increase (decrease) in net assets resulting
from operations | | | (36,056,303 | ) | | | 49,201,569 | | |
| Dividends and Distributions to Shareholders from: | |
| Net investment income: | |
| Class A | | | (428,824 | ) | | | (256,441 | ) | |
| Class B | | | (126 | ) | | | — | | |
| Class C | | | (36,988 | ) | | | (258 | ) | |
| Class I | | | (742,497 | ) | | | (914,107 | ) | |
| Net realized gain on investments: | |
| Class A | | | (5,709,786 | ) | | | (5,030,435 | ) | |
| Class B | | | (336,204 | ) | | | (299,894 | ) | |
| Class C | | | (3,750,940 | ) | | | (3,213,032 | ) | |
| Class I | | | (7,447,786 | ) | | | (10,600,754 | ) | |
| Tax return of capital: | |
| Class A | | | — | | | | (453,053 | ) | |
| Class B | | | — | | | | (26,783 | ) | |
| Class C | | | — | | | | (278,052 | ) | |
| Class I | | | — | | | | (1,003,522 | ) | |
| Total dividends and distributions to shareholders | | | (18,453,151 | ) | | | (22,076,331 | ) | |
| Capital Stock Transactions: | |
Increase (decrease) in net assets from fund share
transactions | | | (12,008,901 | ) | | | 65,754,123 | | |
| Total increase (decrease) in net assets | | | (66,518,355 | ) | | | 92,879,361 | | |
| Net Assets: | |
| Beginning of year | | | 225,308,976 | | | | 132,429,615 | | |
| End of yeara | | $ | 158,790,621 | | | $ | 225,308,976 | | |
a Includes dividends in excess of net investment income of $38,555 and $0, respectively.
See accompanying notes to financial statements.
22
COHEN & STEERS GLOBAL REALTY SHARES, INC.
FINANCIAL HIGHLIGHTS
The following table includes selected data for a share outstanding throughout each period and other performance information derived from the financial statements. It should be read in conjunction with the financial statements and notes thereto.
| | | Class A | |
| | | For the Year Ended December 31, | | For the Period
September 30, 2004a
through | |
| Per Share Operating Performance: | | 2007 | | 2006 | | 2005 | | December 31, 2004 | |
| Net asset value, beginning of period | | $ | 69.88 | | | $ | 58.90 | | | $ | 52.96 | | | $ | 45.82 | | |
| Income from investment operations: | |
| Net investment income | | | 0.38 | b | | | 0.42 | | | | 0.49 | c | | | 0.22 | c | |
| Net realized and unrealized gain (loss) on investments | | | (12.68 | ) | | | 18.12 | | | | 6.74 | | | | 7.53 | | |
| Total from investment operations | | | (12.30 | ) | | | 18.54 | | | | 7.23 | | | | 7.75 | | |
| Less dividends and distributions to shareholders from: | |
| Net investment income | | | (0.39 | ) | | | (0.42 | ) | | | (1.26 | ) | | | (0.61 | ) | |
| Net realized gain on investments | | | (6.90 | ) | | | (6.51 | ) | | | (0.10 | ) | | | — | | |
| Tax return of capital | | | — | | | | (0.64 | ) | | | — | | | | — | | |
| Total dividends and distributions to shareholders | | | (7.29 | ) | | | (7.57 | ) | | | (1.36 | ) | | | (0.61 | ) | |
| Redemption fees retained by the fund | | | 0.03 | | | | 0.01 | | | | 0.07 | | | | — | | |
| Net increase (decrease) in net asset value | | | (19.56 | ) | | | 10.98 | | | | 5.94 | | | | 7.14 | | |
| Net asset value, end of period | | $ | 50.32 | | | $ | 69.88 | | | $ | 58.90 | | | $ | 52.96 | | |
| Total investment returnd | | | –18.85 | % | | | 32.14 | % | | | 13.87 | % | | | 16.93 | %e | |
| Ratios/Supplemental Data: | |
| Net assets, end of period (in millions) | | $ | 62.2 | | | $ | 60.3 | | | $ | 25.7 | | | $ | 3.1 | | |
Ratio of expenses to average daily net assets
(before expense reduction) | | | 1.67 | % | | | 1.61 | % | | | 1.84 | % | | | 3.07 | %f | |
Ratio of expenses to average daily net assets
(net of expense reduction) | | | 1.57 | % | | | 1.61 | % | | | 1.65 | % | | | 1.65 | %f | |
Ratio of net investment income to average daily net assets
(before expense reduction) | | | 0.31 | % | | | 0.59 | % | | | 0.67 | % | | | 0.31 | %f | |
Ratio of net investment income to average daily net assets
(net of expense reduction) | | | 0.41 | % | | | 0.59 | % | | | 0.87 | % | | | 1.73 | %f | |
| Portfolio turnover rate | | | 228 | % | | | 109 | % | | | 158 | % | | | 180 | %e | |
a Initial offering of shares.
b 13.8% of the fund's net investment income was attributable to a special dividend paid by Boston Properties, Inc.
c Calculation based on average shares outstanding.
d Does not reflect sales charges, which would reduce return.
e Not annualized.
f Annualized.
See accompanying notes to financial statements.
23
COHEN & STEERS GLOBAL REALTY SHARES, INC.
FINANCIAL HIGHLIGHTS—(Continued)
| | | Class B | |
| | | For the Year Ended December 31, | | For the Period
September 30, 2004a
through | |
| Per Share Operating Performance: | | 2007 | | 2006 | | 2005 | | December 31, 2004 | |
| Net asset value, beginning of period | | $ | 69.65 | | | $ | 58.74 | | | $ | 52.92 | | | $ | 45.82 | | |
| Income from investment operations: | |
| Net investment income (loss) | | | (0.01 | )b | | | — | | | | (0.22 | )c | | | 0.20 | c | |
| Net realized and unrealized gain (loss) on investments | | | (12.65 | ) | | | 18.04 | | | | 7.03 | | | | 7.47 | | |
| Total from investment operations | | | (12.66 | ) | | | 18.04 | | | | 6.81 | | | | 7.67 | | |
| Less dividends and distributions to shareholders from: | |
| Net investment income | | | — | | | | — | | | | (0.94 | ) | | | (0.57 | ) | |
| Net realized gain on investments | | | (6.90 | ) | | | (6.51 | ) | | | (0.10 | ) | | | — | | |
| Tax return of capital | | | — | | | | (0.64 | ) | | | — | | | | — | | |
| Total dividends and distributions to shareholders | | | (6.90 | ) | | | (7.15 | ) | | | (1.04 | ) | | | (0.57 | ) | |
| Redemption fees retained by the fund | | | 0.03 | | | | 0.02 | | | | 0.05 | | | | — | | |
| Net increase (decrease) in net asset value | | | (19.53 | ) | | | 10.91 | | | | 5.82 | | | | 7.10 | | |
| Net asset value, end of period | | $ | 50.12 | | | $ | 69.65 | | | $ | 58.74 | | | $ | 52.92 | | |
| Total investment returnd | | | –19.40 | % | | | 31.29 | % | | | 12.99 | % | | | 16.77 | %e | |
| Ratios/Supplemental Data: | |
| Net assets, end of period (in millions) | | $ | 3.5 | | | $ | 3.6 | | | $ | 1.5 | | | $ | 0.7 | | |
Ratio of expenses to average daily net assets
(before expense reduction) | | | 2.32 | % | | | 2.26 | % | | | 2.56 | % | | | 4.07 | %f | |
Ratio of expenses to average daily net assets
(net of expense reduction) | | | 2.22 | % | | | 2.26 | % | | | 2.30 | % | | | 2.30 | %f | |
Ratio of net investment income (loss) to average daily net assets
(before expense reduction) | | | (0.33 | )% | | | 0.00 | % | | | (0.65 | )% | | | (0.19 | )%f | |
Ratio of net investment income (loss) to average daily net assets
(net of expense reduction) | | | (0.23 | )% | | | 0.00 | % | | | (0.39 | )% | | | 1.58 | %f | |
| Portfolio turnover rate | | | 228 | % | | | 109 | % | | | 158 | % | | | 180 | %e | |
a Initial offering of shares.
b 13.8% of the fund's net investment income was attributable to a special dividend paid by Boston Properties, Inc.
c Calculation based on average shares outstanding.
d Does not reflect sales charges, which would reduce return.
e Not annualized.
f Annualized.
See accompanying notes to financial statements.
24
COHEN & STEERS GLOBAL REALTY SHARES, INC.
FINANCIAL HIGHLIGHTS—(Continued)
| | | Class C | |
| | | For the Year ended December 31, | | For the Period
September 30, 2004a
through | |
| Per Share Operating Performance: | | 2007 | | 2006 | | 2005 | | December 31, 2004 | |
| Net asset value, beginning of period | | $ | 69.68 | | | $ | 58.78 | | | $ | 52.93 | | | $ | 45.82 | | |
| Income from investment operations: | |
| Net investment income (loss) | | | 0.03 | b | | | — | | | | (0.19 | )c | | | 0.15 | c | |
| Net realized and unrealized gain (loss) on investments | | | (12.66 | ) | | | 18.04 | | | | 7.03 | | | | 7.53 | | |
| Total from investment operations | | | (12.63 | ) | | | 18.04 | | | | 6.84 | | | | 7.68 | | |
| Less dividends and distributions to shareholders from: | |
| Net investment income | | | (0.04 | ) | | | (0.01 | ) | | | (0.94 | ) | | | (0.57 | ) | |
| Net realized gain on investments | | | (6.90 | ) | | | (6.51 | ) | | | (0.10 | ) | | | — | | |
| Tax return of capital | | | — | | | | (0.64 | ) | | | — | | | | — | | |
| Total dividends and distributions to shareholders | | | (6.94 | ) | | | (7.16 | ) | | | (1.04 | ) | | | (0.57 | ) | |
| Redemption fees retained by the fund | | | 0.03 | | | | 0.02 | | | | 0.05 | | | | — | | |
| Net increase (decrease) in net asset value | | | (19.54 | ) | | | 10.90 | | | | 5.85 | | | | 7.11 | | |
| Net asset value, end of period | | $ | 50.14 | | | $ | 69.68 | | | $ | 58.78 | | | $ | 52.93 | | |
| Total investment returnd | | | –19.36 | % | | | 31.28 | % | | | 13.07 | % | | | 16.77 | %e | |
| Ratios/Supplemental Data: | |
| Net assets, end of period (in millions) | | $ | 46.0 | | | $ | 38.2 | | | $ | 15.9 | | | $ | 3.0 | | |
Ratio of expenses to average daily net assets
(before expense reduction) | | | 2.34 | % | | | 2.26 | % | | | 2.54 | % | | | 3.78 | %f | |
Ratio of expenses to average daily net assets
(net of expense reduction) | | | 2.22 | % | | | 2.26 | % | | | 2.30 | % | | | 2.30 | %f | |
Ratio of net investment income (loss) to average daily net assets
(before expense reduction) | | | (0.34 | )%g | | | 0.00 | % | | | (0.57 | )% | | | (0.31 | )%f | |
Ratio of net investment income (loss) to average daily net assets
(net of expense reduction) | | | (0.22 | )%g | | | 0.00 | % | | | (0.33 | )% | | | 1.17 | %f | |
| Portfolio turnover rate | | | 228 | % | | | 109 | % | | | 158 | % | | | 180 | %e | |
a Initial offering of shares.
b 13.8% of the fund's net investment income was attributable to a special dividend paid by Boston Properties, Inc.
c Calculation based on average shares outstanding.
d Does not reflect sales charges, which would reduce return.
e Not annualized.
f Annualized.
g Because the ratios are based on average net assets, the result may differ from the per share amount reflected above.
See accompanying notes to financial statements.
25
COHEN & STEERS GLOBAL REALTY SHARES, INC.
FINANCIAL HIGHLIGHTS—(Continued)
| | | Class I | |
| | | Year ended December 31, | |
| Per Share Operating Performance: | | 2007 | | 2006 | | 2005 | | 2004 | | 2003 | |
| Net asset value, beginning of year | | $ | 70.14 | | | $ | 59.09 | | | $ | 53.00 | | | $ | 38.55 | | | $ | 27.50 | | |
| Income from investment operations: | |
| Net investment income | | | 0.57 | a | | | 0.65 | | | | 0.20 | b | | | 0.41 | b | | | 0.64 | | |
Net realized and unrealized gain (loss) on
investments | | | (12.72 | ) | | | 18.19 | | | | 7.24 | | | | 15.16 | | | | 12.06 | | |
| Total from investment operations | | | (12.15 | ) | | | 18.84 | | | | 7.44 | | | | 15.57 | | | | 12.70 | | |
| Less dividends and distributions to shareholders from: | |
| Net investment income | | | (0.59 | ) | | | (0.65 | ) | | | (1.40 | ) | | | (1.18 | ) | | | (1.67 | ) | |
| Net realized gain on investments | | | (6.90 | ) | | | (6.51 | ) | | | (0.10 | ) | | | — | | | | — | | |
| Tax return of capital | | | — | | | | (0.64 | ) | | | — | | | | — | | | | — | | |
Total dividends and distributions to
shareholders | | | (7.49 | ) | | | (7.80 | ) | | | (1.50 | ) | | | (1.18 | ) | | | (1.67 | ) | |
| Redemption fees retained by the fund | | | 0.04 | | | | 0.01 | | | | 0.15 | | | | 0.06 | | | | 0.02 | | |
| Net increase (decrease) in net asset value | | | (19.60 | ) | | | 11.05 | | | | 6.09 | | | | 14.45 | | | | 11.05 | | |
| Net asset value, end of year | | $ | 50.54 | | | $ | 70.14 | | | $ | 59.09 | | | $ | 53.00 | | | $ | 38.55 | | |
| Total investment return | | | –18.58 | % | | | 32.62 | % | | | 14.41 | %c | | | 40.98 | % | | | 46.89 | % | |
| Ratios/Supplemental Data: | |
| Net assets, end of year (in millions) | | $ | 47.1 | | | $ | 123.3 | | | $ | 89.3 | | | $ | 70.2 | | | $ | 28.5 | | |
Ratio of expenses to average daily net assets
(before expense reduction) | | | 1.27 | % | | | 1.25 | % | | | 1.57 | % | | | 1.89 | % | | | 1.99 | % | |
Ratio of expenses to average daily net assets
(net of expense reduction) | | | 1.21 | % | | | 1.25 | % | | | 1.30 | % | | | 1.43 | % | | | 1.50 | % | |
Ratio of net investment income to average daily net
assets (before expense reduction) | | | 0.66 | % | | | 0.84 | % | | | 0.09 | % | | | 0.45 | % | | | 1.33 | % | |
Ratio of net investment income to average daily net
assets (net of expense reduction) | | | 0.72 | % | | | 0.85 | % | | | 0.36 | % | | | 0.92 | % | | | 1.82 | % | |
| Portfolio turnover rate | | | 228 | % | | | 109 | % | | | 158 | % | | | 180 | % | | | 181 | % | |
a 13.8% of the fund's net investment income was attributable to a special dividend paid by Boston Properties, Inc.
b Calculation based on average shares outstanding.
c Without the benefit of the redemption fees, the total investment return would have been 14.12%.
See accompanying notes to financial statements.
26
COHEN & STEERS GLOBAL REALTY SHARES, INC.
NOTES TO FINANCIAL STATEMENTS
Note 1. Significant Accounting Policies
Cohen & Steers Global Realty Shares, Inc. (the fund), formerly Cohen & Steers Realty Focus Fund, Inc., was incorporated under the laws of the State of Maryland on February 14, 1997 and is registered under the Investment Company Act of 1940, as amended, as a nondiversified, open-end management investment company. On September 28, 2007, the fund's name change was effective. Additionally the fund's objective was changed to maximum total return through investing in global real estate equity securities. Prior to September 28, 2007, the fund's investment objective was maximum capital appreciation. The authorized shares of the fund are divided into four classes designated Class A, B, C, and I shares. Effective May 1, 2007, Class B shares are no longer offered except through dividend reinvestment and permitted exchanges by existing Class B shareholders. Each of the fund's shares has equal dividend, liquidation and voting rights (except for m atters relating to distributions and shareholder servicing of such shares). Class B shares automatically convert to Class A shares at the end of the month which precedes the eighth anniversary of the purchase date.
The following is a summary of significant accounting policies consistently followed by the fund in the preparation of its financial statements. The policies are in conformity with accounting principles generally accepted in the United States of America (GAAP). The preparation of the financial statements in accordance with GAAP requires management to make estimates and assumptions that affect the reported amounts of assets and liabilities at the date of the financial statements and the reported amounts of income and expenses during the reporting period. Actual results could differ from those estimates.
Portfolio Valuation: Investments in securities that are listed on the New York Stock Exchange are valued, except as indicated below, at the last sale price reflected at the close of the New York Stock Exchange on the business day as of which such value is being determined. If there has been no sale on such day, the securities are valued at the mean of the closing bid and asked prices for the day or, if no asked price is available, at the bid price.
Securities not listed on the New York Stock Exchange but listed on other domestic or foreign securities exchanges or admitted to trading on the National Association of Securities Dealers Automated Quotations, Inc. (Nasdaq) national market system are valued in a similar manner. Securities traded on more than one securities exchange are valued at the last sale price on the business day as of which such value is being determined as reflected on the tape at the close of the exchange representing the principal market for such securities.
Readily marketable securities traded in the over-the-counter market, including listed securities whose primary market is believed by Cohen & Steers Capital Management, Inc. (the investment manager) to be over-the-counter, but excluding securities admitted to trading on the Nasdaq National List, are valued at the official closing prices as reported by Nasdaq, the National Quotation Bureau, or such other comparable sources as the Board of Directors deem appropriate to reflect their fair market value. If there has been no sale on such day, the securities are valued at the mean of the closing bid and asked prices for the day, or if no asked price is available, at the bid price. However, certain fixed-income securities may be valued on the basis of prices provided by a pricing service when
27
COHEN & STEERS GLOBAL REALTY SHARES, INC.
NOTES TO FINANCIAL STATEMENTS—(Continued)
such prices are believed by the Board of Directors to reflect the fair market value of such securities. Where securities are traded on more than one exchange and also over-the-counter, the securities will generally be valued using the quotations the Board of Directors believes most closely reflect the value of such securities.
Securities for which market prices are unavailable, or securities for which the investment manager determines that bid and/or asked price does not reflect market value, will be valued at fair value pursuant to procedures approved by the fund's Board of Directors. Circumstances in which market prices may be unavailable include, but are not limited to, when trading in a security is suspended, the exchange on which the security is traded is subject to an unscheduled close or disruption or material events occur after the close of the exchange on which the security is principally traded. In these circumstances, the fund determines fair value in a manner that fairly reflects the market value of the security on the valuation date based on consideration of any information or factors it deems appropriate. These may include recent transactions in comparable securities, information relating to the specific security and developments in the markets.
The fund's use of fair value pricing may cause the net asset value of fund shares to differ from the net asset value that would be calculated using market quotations. Fair value pricing involves subjective judgments and it is possible that the fair value determined for a security may be materially different than the value that could be realized upon the sale of that security.
Short-term debt securities, which have a maturity date of 60 days or less, are valued at amortized cost, which approximates value.
Security Transactions, Investment Income and Expense Allocations: Security transactions are recorded on trade date. Realized gains and losses on investments sold are recorded on the basis of identified cost. Interest income is recorded on the accrual basis. Discounts are accreted and premiums are amortized over the life of the respective securities. Dividend income, net of applicable withholding taxes, is recorded on the ex-dividend date except for certain dividends on foreign securities, which are recorded as soon as the fund is informed after the ex-dividend date. The fund records distributions received in excess of income from underlying investments as a reduction of cost of investments and/or realized gain. Such amounts are based on estimates if actual amounts are not available, and actual amounts of income, realized gain and return of capital may differ from the estimated amounts. The fund adjusts the estimated amounts of the components of distributions (and consequently its net investment income) as an increase to unrealized appreciation/depreciation and realized gain/loss on investments as necessary once the issuers provide information about the actual composition of the distributions. Expenses are allocated to each class of shares based on the relative net asset value on the day such expense is accrued except for distribution fees and shareholder service fees which are charged directly to the respective class.
Foreign Currency Translations: The books and records of the fund are maintained in U.S. dollars as follows: (1) the foreign currency market value of investment securities, other assets and liabilities and foreign currency contracts are translated at the exchange rates prevailing at the end of the period; and (2) purchases, sales,
28
COHEN & STEERS GLOBAL REALTY SHARES, INC.
NOTES TO FINANCIAL STATEMENTS—(Continued)
income and expenses are translated at the exchange rates prevailing on the respective dates of such transactions. The resultant exchange gains and losses are recorded as realized and unrealized gain/loss on foreign exchange transactions. Pursuant to U.S. federal income tax regulations, certain foreign exchange gains/losses included in realized and unrealized gain/loss are included in or are a reduction of ordinary income for federal income tax purposes. The fund does not isolate that portion of the results of operations arising as a result of changes in the foreign exchange rates from the changes in the market prices of the securities.
Foreign Securities: The fund may directly purchase securities of foreign issuers. Investing in securities of foreign issuers involves special risks not typically associated with investing in securities of U.S. issuers. The risks include possible revaluation of currencies, the ability to repatriate funds, less complete financial information about companies and possible future adverse political and economic developments. Moreover, securities of many foreign issuers and their markets may be less liquid and their prices more volatile than those of securities of comparable U.S. issuers.
Dividends and Distributions to Shareholders: Dividends from net investment income and capital gain distributions are determined in accordance with U.S. federal income tax regulations, which may differ from GAAP. Dividends from net investment income are declared and paid semi-annually. Net realized capital gains, unless offset by any available capital loss carryforward, are typically distributed to shareholders at least annually. Dividends and distributions to shareholders are recorded on the ex-dividend date and are automatically reinvested in full and fractional shares of the fund based on the net asset value per share at the close of business on the payable date unless the shareholder has elected to have them paid in cash.
Distributions paid by the fund are subject to recharacterization for tax purposes. Based upon the results of operations for the year ended December 31, 2007, a portion of the dividends have been reclassified to distributions of net realized capital gains.
Income Taxes: It is the policy of the fund to continue to qualify as a regulated investment company, if such qualification is in the best interest of the shareholders, by complying with the requirements of Subchapter M of the Internal Revenue Code applicable to regulated investment companies, and by distributing substantially all of its taxable earnings to its shareholders. Accordingly, no provision for federal income or excise tax is necessary.
Note 2. Investment Advisory and Administration Fees and Other Transactions with Affiliates
Investment Advisory Fees: The advisor serves as the fund's investment advisor pursuant to an investment advisory agreement (the advisory agreement). Under the terms of the advisory agreement, the advisor provides the fund with the day-to-day investment decisions and generally manages the fund's investments in accordance with the stated policies of the fund, subject to the supervision of the fund's Board of Directors. For the services provided to the fund, the advisor receives a fee, accrued daily and paid monthly, at the annual rate of 0.90% of the average daily net assets of the fund.
29
COHEN & STEERS GLOBAL REALTY SHARES, INC.
NOTES TO FINANCIAL STATEMENTS—(Continued)
For the year ended December 31, 2007 and through December 31, 2008, the advisor has contractually agreed to waive its fee and/or reimburse the fund for expenses incurred to the extent necessary to maintain the fund's operating expenses at 1.65% for Class A shares, 2.30% for Class B and Class C shares and 1.30% for Class I shares.
Administration Fees: The fund has entered into an administration agreement with the advisor under which the advisor performs certain administrative functions for the fund and receives a fee, accrued daily and paid monthly, at the annual rate of 0.02% of the fund's average daily net assets. For the year ended December 31, 2007, the fund paid the advisor $39,167 in fees under this administration agreement. Additionally, the fund has retained State Street Bank and Trust Company as sub-administrator under a fund accounting and administration agreement.
Distribution Fees: Shares of the fund are distributed by Cohen & Steers Securities, LLC (the distributor), an affiliated entity of the advisor. The fund has adopted a distribution plan (the plan) pursuant to Rule 12b-1 under the Investment Company Act of 1940. The plan provides that the fund will pay the distributor a fee, accrued daily and paid monthly, at an annual rate of up to 0.25% of the average daily net assets attributable to the Class A shares and up to 0.75% of the average daily net assets attributable to the Class B and Class C shares.
For the year ended December 31, 2007, the fund has been advised that the distributor received $38,692 in sales commissions from the sale of Class A shares and that the distributor also received $12,560, $16,082 and $22,053 of contingent deferred sales charges relating to redemptions of Class A, Class B and Class C shares, respectively. The distributor has advised the fund that proceeds from the contingent deferred sales charge on the Class B and C shares are paid to the distributor and are used by the distributor to defray its expenses related to providing distribution-related services to the fund in connection with the sale of the Class B and C shares, including payments to dealers and other financial intermediaries for selling Class B and C shares and interest and other financing costs associated with Class B and C shares.
Shareholder Servicing Fees: The fund has adopted a shareholder services plan which provides that the fund may obtain the services of qualified financial institutions to act as shareholder servicing agents for their customers. For these services, the fund may pay the shareholder servicing agent a fee, accrued daily and paid monthly, at an annual rate of up to 0.10% of the average daily net asset value of the fund's Class A shares and up to 0.25% of the average daily net asset value of the fund's Class B and C shares.
Directors' and Officers' Fees: Certain directors and officers of the fund are also directors, officers, and/or employees of the advisor. The fund does not pay compensation to any affiliated directors and officers except for the Chief Compliance Officer, who received $2,057 from the fund for the year ended December 31, 2007.
Note 3. Purchases and Sales of Securities
Purchases and sales of securities, excluding short-term investments, for the year ended December 31, 2007 totaled $432,546,929 and $455,537,558, respectively.
30
COHEN & STEERS GLOBAL REALTY SHARES, INC.
NOTES TO FINANCIAL STATEMENTS—(Continued)
Note 4. Income Tax Information
The tax character of dividends and distributions paid was as follows:
| | | For the Year Ended
December 31, | |
| | | 2007 | | 2006 | |
| Ordinary income | | $ | 1,208,435 | | | $ | 12,950,864 | | |
| Long-term capital gains | | | 17,244,716 | | | | 7,364,057 | | |
| Tax return of capital | | | — | | | | 1,761,410 | | |
| Total dividends and distributions | | $ | 18,453,151 | | | $ | 22,076,331 | | |
As of December 31, 2007, the tax-basis components of accumulated earnings and the federal tax cost were as follows:
| Gross unrealized appreciation | | $ | 3,912,441 | | |
| Gross unrealized depreciation | | | (20,833,381 | ) | |
| Net unrealized depreciation | | $ | (16,920,940 | ) | |
| Cost for federal income tax purposes | | $ | 189,236,901 | | |
As of December 31, 2007, the fund had temporary book/tax differences primarily attributable to wash sales on portfolio securities and permanent book/tax differences primarily attributable to redemptions used as distributions. To reflect reclassifications arising from the permanent differences, paid-in-capital was credited $1,343,319, accumulated net realized loss was charged $1,688,650 and accumulated net investment income was credited $345,331.
31
COHEN & STEERS GLOBAL REALTY SHARES, INC.
NOTES TO FINANCIAL STATEMENTS—(Continued)
Note 5. Capital Stock
The fund is authorized to issue 50 million shares of capital stock, at a par value of $0.001 per share. The Board of Directors of the fund may increase or decrease the aggregate number of shares of common stock that the fund has authority to issue. Transactions in fund shares were as follows:
| | | For the
Year Ended
December 31, 2007 | | For the
Year Ended
December 31, 2006 | |
| | | Shares | | Amount | | Shares | | Amount | |
| Class A: | |
| Sold | | | 929,036 | | | $ | 54,814,586 | | | | 568,663 | | | $ | 38,229,225 | | |
Issued as reinvestment of
dividends and distributions | | | 82,758 | | | | 4,779,826 | | | | 67,465 | | | | 4,561,743 | | |
| Redeemed | | | (637,823 | ) | | | (39,486,207 | ) | | | (210,144 | ) | | | (14,537,094 | ) | |
Redemption fees retained by
the funda | | | — | | | | 30,678 | | | | — | | | | 6,806 | | |
| Net increase | | | 373,971 | | | $ | 20,138,883 | | | | 425,984 | | | $ | 28,260,680 | | |
| Class B: | |
| Sold | | | 34,545 | | | $ | 2,038,466 | | | | 26,254 | | | $ | 1,748,080 | | |
Issued as reinvestment of
dividends and distributions | | | 4,374 | | | | 251,449 | | | | 3,386 | | | | 228,553 | | |
| Redeemed | | | (19,658 | ) | | | (1,238,270 | ) | | | (4,721 | ) | | | (311,770 | ) | |
Redemption fees retained by
the funda | | | — | | | | 1,801 | | | | — | | | | 553 | | |
| Net increase | | | 19,261 | | | $ | 1,053,446 | | | | 24,919 | | | $ | 1,665,416 | | |
| Class C: | |
| Sold | | | 649,785 | | | $ | 37,411,167 | | | | 307,048 | | | $ | 20,567,536 | | |
Issued as reinvestment of
dividends and distributions | | | 43,535 | | | | 2,503,980 | | | | 35,590 | | | | 2,406,049 | | |
| Redeemed | | | (324,909 | ) | | | (20,194,881 | ) | | | (64,553 | ) | | | (4,281,540 | ) | |
Redemption fees retained by
the funda | | | — | | | | 19,240 | | | | — | | | | 5,799 | | |
| Net increase | | | 368,411 | | | $ | 19,739,506 | | | | 278,085 | | | $ | 18,697,844 | | |
32
COHEN & STEERS GLOBAL REALTY SHARES, INC.
NOTES TO FINANCIAL STATEMENTS—(Continued)
| | | For the
Year Ended
December 31, 2007 | | For the
Year Ended
December 31, 2006 | |
| | | Shares | | Amount | | Shares | | Amount | |
| Class I: | |
| Sold | | | 279,274 | | | $ | 18,954,917 | | | | 501,779 | | | $ | 33,880,836 | | |
Issued as reinvestment of
dividends and distributions | | | 118,139 | | | | 6,901,302 | | | | 159,186 | | | | 10,777,390 | | |
| Redeemed | | | (1,223,331 | ) | | | (78,846,868 | ) | | | (414,765 | ) | | | (27,551,007 | ) | |
Redemption fees retained by
the funda | | | — | | | | 49,913 | | | | — | | | | 22,964 | | |
| Net increase (decrease) | | | (825,918 | ) | | $ | (52,940,736 | ) | | | 246,200 | | | $ | 17,130,183 | | |
a The fund may charge a 2% redemption fee on shares sold within 60 days of the time of purchase. Redemption fees are paid directly to the fund. Prior to September 28, 2007, the redemption fee was charged at a rate of 1% on shares sold within six months of the time of purchase.
Note 6. Borrowings
The fund, in conjunction with other Cohen & Steers funds, is a party to a $200,000,000 syndicated credit agreement (the credit agreement) with State Street Bank and Trust Company, as administrative agent and operations agent, and the lenders identified in the credit agreement, which expires December 2008. The fund pays a commitment fee of 0.10% per annum on its proportionate share of the unused portion of the credit agreement.
During the year ended December 31, 2007, the fund did not utilize the line of credit.
Note 7. Other
In the normal course of business, the fund enters into contracts that provide general indemnifications. The fund's maximum exposure under these arrangements is dependent on claims that may be made against the fund in the future and, therefore, cannot be estimated; however, based on experience, the risk of material loss from such claims is considered remote.
Note 8. New Accounting Pronouncements
In July 2006, the Financial Accounting Standards Board (FASB) issued Interpretation 48, Accounting for Uncertainty in Income Taxes—an interpretation of FASB Statement 109 (FIN 48). FIN 48 clarifies the accounting
33
COHEN & STEERS GLOBAL REALTY SHARES, INC.
NOTES TO FINANCIAL STATEMENTS—(Continued)
for income taxes by prescribing the minimum recognition threshold a tax position must meet before being recognized in the financial statements. FIN 48 is effective for fiscal years beginning after December 15, 2006. An assessment of the fund's tax positions has been made and it has been determined that there is no impact to the fund's financial statements.
In September 2006, Statement of Financial Accounting Standards No. 157, Fair Value Measurements (SFAS 157), was issued and is effective for fiscal years beginning after November 15, 2007. SFAS 157 defines fair value, establishes a framework for measuring fair value and expands disclosures about fair value measurements. Management has evaluated the impact of SFAS 157 and it is not expected to have a material impact on the fund's net assets or results of operations.
34
COHEN & STEERS GLOBAL REALTY SHARES, INC.
REPORT OF INDEPENDENT REGISTERED PUBLIC ACCOUNTING FIRM
To the Board of Directors and Shareholders of
Cohen & Steers Global Realty Shares, Inc.
In our opinion, the accompanying statement of assets and liabilities, including the schedule of investments, and the related statements of operations and of changes in net assets and the financial highlights present fairly, in all material respects, the financial position of Cohen & Steers Global Realty Shares, Inc. (formerly, Cohen & Steers Realty Focus Fund, Inc.) (the "Fund") at December 31, 2007, the results of its operations for the year then ended, the changes in its net assets for each of the two years in the period then ended and the financial highlights for each of the periods presented, in conformity with accounting principles generally accepted in the United States of America. These financial statements and financial highlights (hereafter referred to as "financial statements") are the responsibility of the Fund's management. Our responsibility is to express an opinion on these financial statements based on our audits. We c onducted our audits of these financial statements in accordance with the standards of the Public Company Accounting Oversight Board (United States). Those standards require that we plan and perform the audit to obtain reasonable assurance about whether the financial statements are free of material misstatement. An audit includes examining, on a test basis, evidence supporting the amounts and disclosures in the financial statements, assessing the accounting principles used and significant estimates made by management, and evaluating the overall financial statement presentation. We believe that our audits, which included confirmation of securities at December 31, 2007 by correspondence with the custodian and brokers, provide a reasonable basis for our opinion.
PricewaterhouseCoopers LLP
New York, New York
February 18, 2008
35
COHEN & STEERS GLOBAL REALTY SHARES, INC.
TAX INFORMATION—2007 (Unaudited)
Pursuant to the Jobs and Growth Relief Reconciliation Act of 2003, the fund designates qualified dividend income of $388,454. Additionally, 1.9% of the ordinary dividends qualified for the dividends received deduction available to corporations. Also, the fund designates a long-term capital gain distribution of $18,555,283 at the 15% rate.
The fund has elected, pursuant to section 853 of the Internal Revenue Code, to pass through foreign taxes of $87,120. The fund generated net foreign source income of $691,122 with respect to this election.
OTHER INFORMATION
A description of the policies and procedures that the fund uses to determine how to vote proxies relating to portfolio securities is available (i) without charge, upon request, by calling 800-330-7348, (ii) on our Web site at cohenandsteers.com or (iii) on the Securities and Exchange Commission's Web site at http://www.sec.gov. In addition, the fund's proxy voting record for the most recent 12-month period ended June 30 is available (i) without charge, upon request, by calling 800-330-7348 or (ii) on the SEC's Web site at http://www.sec.gov.
The fund files its complete schedule of portfolio holdings with the SEC for the first and third quarters of each fiscal year on Form N-Q. The fund's Forms N-Q are available (i) without charge, upon request by calling 800-330-7348, or (ii) on the SEC's Web site at http://www.sec.gov. In addition, the Forms N-Q may be reviewed and copied at the SEC's Public Reference Room in Washington, DC. Information on the operation of the Public Reference Room may be obtained by calling 800-SEC-0330.
Please note that the distributions paid by the fund to shareholders are subject to recharacterization for tax purposes. The fund may also pay distributions in excess of the fund's net investment company taxable income and this excess would be a tax-free return of capital distributed from the fund's assets. The final tax treatment of all distributions is reported to shareholders on their 1099-DIV forms, which are mailed after the close of each calendar year.
36
COHEN & STEERS GLOBAL REALTY SHARES, INC.
MANAGEMENT OF THE FUND
The business and affairs of the fund are managed under the direction of the board of directors. The board of directors approves all significant agreements between the fund and persons or companies furnishing services to it, including the fund's agreements with its advisor, administrator, custodian and transfer agent. The management of the fund's day-to-day operations is delegated to its officers, the advisor and the fund's administrator, subject always to the investment objective and policies of the fund and to the general supervision of the board of directors.
The directors and officers of the fund and their principal occupations during the past five years are set forth below. The statement of additional information (SAI) includes additional information about fund directors and is available, without charge, upon request by calling 800-330-7348.
| Name, Address and Age* | | Position(s) Held
With Fund | | Term of
Office | | Principal Occupation
During Past 5 Years
(Including Other
Directorships Held) | | Number of
Funds Within
Fund
Complex
Overseen by
Director
(Including
the Fund) | | Length
of Time
Served** | |
| Interested Directors1 | |
|
Robert H. Steers
Age: 54 | | Director and Co-Chairman | | Until next election of directors | | Co-Chairman and Co-Chief Executive Officer of Cohen & Steers Capital Management, Inc. (CSCM), the fund's investment manager, and its parent company, Cohen & Steers, Inc. (CNS) since 2004. Vice President and Director, Cohen & Steers Securities, LLC (CSSL), the Cohen & Steers open-end funds' distributor. Prior thereto, Chairman of CSCM and the Cohen & Steers funds. | | | 22 | | | 1991 to present | |
|
Martin Cohen
Age: 59 | | Director and Co-Chairman | | Until next election of directors | | Co-Chairman and Co-Chief Executive Officer of CSCM and CNS. Vice President and Director of CSSL. Prior thereto, President of the CSCM and the Cohen & Steers funds. | | | 22 | | | 1991 to present | |
|
(table continued on next page)
* The address for each director is 280 Park Avenue, New York, NY 10017.
** The length of time served represents the year in which the director was first elected or appointed to any fund in the Cohen & Steers fund complex.
1 "Interested person", as defined in the 1940 Act, of the fund because of affiliation with CSCM.
37
COHEN & STEERS GLOBAL REALTY SHARES, INC.
(table continued from previous page)
| Name, Address and Age* | | Position(s) Held
With Fund | | Term of
Office | | Principal Occupation
During Past 5 Years
(Including Other
Directorships Held) | | Number of
Funds Within
Fund
Complex
Overseen by
Director
(Including
the Fund) | | Length
of Time
Served** | |
| Disinterested Directors | |
|
Bonnie Cohen2
Age: 65 | | Director | | Until next election of directors | | Consultant. Director, Reis, Inc.; Chair of the Board of Global Heritage Fund; Program member, The Moriah Fund; Advisory Committee member, The Posse Foundation; Board member, District of Columbia Public Libraries; Visiting Committee, Harvard Business School. Former Under Secretary of State for Management, United States Department of State, 1996-2000. | | | 22 | | | 2001 to present | |
|
George Grossman
Age: 54 | | Director | | Until next election of directors | | Attorney-at-law. | | | 22 | | | 1993 to present | |
|
Richard E. Kroon
Age: 65 | | Director | | Until next election of directors | | Member of Investment Committee, Monmouth University; retired Chairman and Managing Partner of the Sprout Group venture capital funds, then an affiliate of Donaldson, Lufkin & Jenrette Securities Corporation; and former Chairman of the National Venture Capital Association. | | | 22 | | | 2004 to present | |
|
(table continued on next page)
* The address for each director is 280 Park Avenue, New York, NY 10017.
** The length of time served represents the year in which the director was first elected or appointed to any fund in the Cohen & Steers fund complex.
2 Martin Cohen and Bonnie Cohen are not related.
38
COHEN & STEERS GLOBAL REALTY SHARES, INC.
(table continued from previous page)
| Name, Address and Age* | | Position(s) Held
With Fund | | Term of
Office | | Principal Occupation
During Past 5 Years
(Including Other
Directorships Held) | | Number of
Funds Within
Fund
Complex
Overseen by
Director
(Including
the Fund) | | Length
of Time
Served** | |
Richard J. Norman
Age: 64 | | Director | | Until next election of directors | | Private Investor. Board of Directors of Maryland Public Television, Advisory Board Member of the Salvation Army. Prior thereto, Investment Representative of Morgan Stanley Dean Witter. | | | 22 | | | 2001 to present | |
|
Frank K. Ross
Age: 64 | | Director | | Until next election of directors | | Professor of Accounting, Howard University; Board member of Pepco Holdings, Inc. (electric utility). Formerly, Midatlantic Area Managing Partner for Audit and Risk Advisory Services at KPMG LLP and Managing Partner of its Washington, DC office. | | | 22 | | | 2004 to present | |
|
Willard H. Smith Jr.
Age: 71 | | Director | | Until next election of directors | | Board member of Essex Property Trust Inc., Realty Income Corporation and Crest Net Lease, Inc. Managing Director at Merrill Lynch & Co., Equity Capital Markets Division from 1983 to 1995. | | | 22 | | | 1996 to present | |
|
C. Edward Ward Jr.
Age: 61 | | Director | | Until next election of directors | | Member of the Board of Trustees of Directors Manhattan College, Riverdale, New York. Formerly head of closed-end fund listings for the New York Stock Exchange. | | | 22 | | | 2004 to present | |
|
* The address for each director is 280 Park Avenue, New York, NY 10017.
** The length of time served represents the year in which the director was first elected or appointed to any fund in the Cohen & Steers fund complex.
39
COHEN & STEERS GLOBAL REALTY SHARES, INC.
The officers of the fund (other than Messrs. Cohen and Steers, whose biographies are provided above), their address, their ages and their principal occupations for at least the past five years are set forth below.
| Name, Address, and Age* | | Position(s)
with Fund | | Principal Occupation During Past 5 Years | | Length of
Time
Served** | |
Adam M. Derechin
Age: 43 | | President and Chief Executive Officer | | Chief Operating Officer of CSCM (since 2003) and CNS (since 2004). Prior to that, Senior Vice President of CSCM and Vice President and Assistant Treasurer of the Cohen & Steers funds. | | Since 2005 | |
|
Joseph M. Harvey
Age: 44 | | Vice President | | President of CSCM (since 2003) and CNS (since 2004). Prior to that, Senior Vice President and Director of Investment Research of CSCM. | | Since 2004 | |
|
James S. Corl
Age: 41 | | Vice President | | Executive Vice President of CSCM since 2004. Prior to that, Senior Vice President of CSCM. | | Since 2004 | |
|
Francis C. Poli
Age: 45 | | Secretary | | Executive Vice President, Secretary and General Counsel of CSCM and CNS since March 2007. Prior thereto, General Counsel of Allianz Global Investors of America LP. | | Since 2007 | |
|
James Giallanza
Age: 41 | | Treasurer | | Senior Vice President of CSCM since September 2006. Prior thereto, Deputy Head of the US Funds Administration and Treasurer & CFO of various mutual funds within the Legg Mason (formally Citigroup Asset Management) fund complex from August 2004 to September 2006; Director/Controller of the US wholesale business at UBS Global Asset Management (U.S.) from September 2001 to July 2004. | | Since 2006 | |
|
Lisa Phelan
Age: 39 | | Chief Compliance Officer | | Vice President & Director of Compliance of CSCM since January 2006. Chief Compliance Officer of CSSL since 2004. Prior to that, Compliance Officer of CSCM since 2004. Chief Compliance Officer, Avatar Associates & Overture Asset Managers, 2003-2004. First VP, Risk Management, Prudential Securities, Inc. 2000-2003. | | Since 2006 | |
|
* The address of each officer is 280 Park Avenue, New York, NY 10017.
** Officers serve one-year terms. The length of time served represents the year in which the officer was first elected to that position in any fund in the Cohen & Steers fund complex. All of the officers listed above are officers of one or more of the other funds in the complex.
40
COHEN & STEERS GLOBAL REALTY SHARES, INC.
Meet the Cohen & Steers family of open-end funds:
COHEN & STEERS
REALTY SHARES
• Designed for investors seeking maximum total return, investing primarily in REITs
• Symbol: CSRSX
COHEN & STEERS
REALTY INCOME FUND
• Designed for investors seeking maximum total return, investing primarily in real estate securities with an emphasis on both income and capital appreciation
• Symbols: CSEIX, CSBIX, CSCIX, CSDIX
COHEN & STEERS
INTERNATIONAL REALTY FUND
• Designed for investors seeking maximum total return, investing primarily in international real estate securities
• Symbols: IRFAX, IRFCX, IRFIX
COHEN & STEERS
DIVIDEND VALUE FUND
• Designed for investors seeking high current income and long-term growth of income and capital appreciation, investing primarily in dividend paying common stocks and preferred stocks
• Symbols: DVFAX, DVFCX, DVFIX
COHEN & STEERS
INSTITUTIONAL GLOBAL REALTY SHARES
• Designed for investors seeking maximum total return, investing primarily in global real estate securities
• Symbol: GRSIX
COHEN & STEERS
INSTITUTIONAL REALTY SHARES
• Designed for institutional investors seeking maximum total return, investing primarily in REITs
• Symbol: CSRIX
COHEN & STEERS
GLOBAL REALTY SHARES
• Designed for investors seeking maximum total return, investing in global real estate equity securities
• Symbols: CSFAX, CSFBX, CSFCX, CSSPX
COHEN & STEERS
UTILITY FUND
• Designed for investors seeking maximum total return, investing primarily in utilities
• Symbols: CSUAX, CSUBX, CSUCX, CSUIX
COHEN & STEERS
ASIA PACIFIC REALTY SHARES
• Designed for investors seeking maximum total return, investing primarily in real estate securities located in the Asia Pacific region
• Symbols: APFAX, APFCX, APFIX
COHEN & STEERS
EUROPEAN REALTY SHARES
• Designed for investors seeking maximum total return, investing primarily in real estate securities located in Europe
• Symbols: EURAX, EURCX, EURIX
Please consider the investment objectives, risks, charges and expenses of the fund carefully before investing. A prospectus containing this and other information can be obtained by calling 800-330-7348 or by visiting cohenandsteers.com. Please read the prospectus carefully before investing.
Cohen & Steers Securities, LLC, Distributor
41
COHEN & STEERS GLOBAL REALTY SHARES, INC.
OFFICERS AND DIRECTORS
Robert H. Steers
Director and co-chairman
Martin Cohen
Director and co-chairman
Bonnie Cohen
Director
George Grossman
Director
Richard E. Kroon
Director
Richard J. Norman
Director
Frank K. Ross
Director
Willard H. Smith Jr.
Director
C. Edward Ward, Jr.
Director
Adam M. Derechin
President and chief executive officer
Joseph M. Harvey
Vice president
James S. Corl
Vice president
Francis C. Poli
Secretary
James Giallanza
Treasurer and chief financial officer
Lisa D. Phelan
Chief compliance officer
KEY INFORMATION
Investment Advisor
Cohen & Steers Capital Management, Inc.
280 Park Avenue
New York, NY 10017
(212) 832-3232
Fund Subadministrator and Custodian
State Street Bank and Trust Company
One Lincoln Street
Boston, MA 02111
Transfer Agent
Boston Financial Data Services, Inc.
2 Heritage Drive
North Quincy, MA 02171
(800) 437-9912
Legal Counsel
Stroock & Stroock & Lavan LLP
180 Maiden Lane
New York, NY 10038
Distributor
Cohen & Steers Securities, LLC
280 Park Avenue
New York, NY 10017
Nasdaq Symbol: Class A—CSFAX
B—CSFBX
C—CSFCX
I— CSSPX
Web site: cohenandsteers.com
This report is authorized for delivery only to shareholders of Cohen & Steers Global Realty Shares, Inc. unless accompanied or preceded by the delivery of a currently effective prospectus setting forth details of the fund. Past performance of course, is no guarantee of future results and your investment may be worth more or less at the time you sell.
42
COHEN & STEERS
GLOBAL REALTY SHARES
280 PARK AVENUE
NEW YORK, NY 10017

eDelivery NOW AVAILABLE
Stop traditional mail delivery; receive your shareholder reports and prospectus online.
Sign up at cohenandsteers.com
ANNUAL REPORT
DECEMBER 31, 2007
CSFAXAR
Item 2. Code of Ethics.
The registrant has adopted a Code of Ethics that applies to its Principal Executive Officer and Principal Financial Officer. The registrant undertakes to provide to any person without charge, upon request, a copy of the Code of Ethics. Such request can be made by calling 800-330-7348 or writing to the Secretary of the registrant, 280 Park Avenue, New York, NY 10017.
Item 3. Audit Committee Financial Expert.
The registrant’s board has determined that Frank K. Ross, a member of the board’s audit committee, is an “audit committee financial expert”. Mr. Ross is “independent,” as such term is defined in this Item.
Item 4. Principal Accountant Fees and Services.
(a) – (d) Aggregate fees billed to the registrant for the last two fiscal years for professional services rendered by the registrant’s principal accountant were as follows:
| | 2007 | | 2006 | |
Audit Fees | | $ | 45,000 | | $ | 46,899 | |
Audit-Related Fees | | 8,500 | | — | |
Tax Fees | | 13,300 | | 12,800 | |
All Other Fees | | — | | — | |
| | | | | | | |
Audit-related fees were billed in connection with agreed upon procedures performed by the registrant’s principal accountant relating to after-tax return calculations. Tax fees were billed in connection with the preparation of tax returns, calculation and designation of dividends and other miscellaneous tax services.
Aggregate fees billed by the registrant’s principal accountant for the last two fiscal years for non-audit services provided to the registrant’s investment adviser (not including a sub-adviser whose role is primarily portfolio management and is subcontracted or overseen by another investment adviser) and any entity controlling, controlled by, or under common control with the investment adviser that provides ongoing services to the registered investment company, where the engagement relates directly to the operations and financial reporting of the registrant, were as follows:
| | 2007 | | 2006 | |
Audit-Related Fees | | — | | — | |
Tax Fees | | — | | — | |
All Other Fees | | $ | 109,000 | | $ | 65,000 | |
| | | | | | | |
These other fees were billed in connection with internal control reviews.
(e)(1) The audit committee is required to pre-approve audit and non-audit services performed for the registrant by the principal accountant. The audit committee also is required to pre-approve non-audit services performed by the registrant’s principal accountant for the registrant’s investment adviser and any sub-adviser (not including any sub-adviser whose role is primarily
portfolio management and is subcontracted with or overseen by another investment adviser) and/or to any entity controlling, controlled by or under common control with the registrant’s investment adviser that provides ongoing services to the registrant, if the engagement for services relates directly to the operations and financial reporting of the registrant.
The audit committee may delegate pre-approval authority to one or more of its members who are independent members of the board of directors of the registrant. The member or members to whom such authority is delegated shall report any pre-approval decisions to the audit committee at its next scheduled meeting. The audit committee may not delegate its responsibility to pre-approve services to be performed by the registrant’s principal accountant to the investment adviser.
(e) (2) No services included in (b) – (d) above were approved by the audit committee pursuant to paragraphs (c)(7)(i)(C) of Rule
2-01 of Regulation S-X.
(f) Not applicable.
(g) For the fiscal years ended December 31, 2007 and December 31, 2006, the aggregate fees billed by the registrant’s principal accountant for non-audit services rendered to the registrant and for non-audit services rendered to the registrant’s investment adviser (not including any sub-adviser whose role is primarily portfolio management and is subcontracted with or overseen by another investment adviser) and/or to any entity controlling, controlled by or under common control with the registrant’s investment adviser that provides ongoing services to the registrant were $78,300 and $77,800, respectively.
(h) The registrant’s audit committee considered whether the provision of non-audit services that were rendered to the registrant’s investment adviser (not including any sub-adviser whose role is primarily portfolio management and is subcontracted with or overseen by another investment adviser) and/or to any entity controlling, controlled by or under common control with the registrant’s investment adviser that provides ongoing services to the registrant that were not required to be pre-approved pursuant to paragraph (c)(7)(ii) of Rule 2-01 of Regulation S-X was compatible with maintaining the principal accountant’s independence.
Item 5. Audit Committee of Listed Registrants.
Not applicable.
Item 6. Schedule of Investments.
Included in Item 1 above.
Item 7. Disclosure of Proxy Voting Policies and Procedures for Closed-End Management Investment Companies.
Not applicable.
Item 8. Portfolio Managers of Closed-End Investment Companies.
Not applicable.
Item 9. Purchases of Equity Securities by Closed-End Management Investment Company and Affiliated Purchasers.
Not applicable.
Item 10. Submission of Matters to a Vote of Security Holders.
Not applicable.
Item 11. Controls and Procedures.
(a) The registrant’s principal executive officer and principal financial officer have concluded that the registrant’s disclosure controls and procedures are reasonably designed to ensure that information required to be disclosed by the registrant in this Form N-CSR was recorded, processed, summarized and reported within the time periods specified in the Securities and Exchange Commission’s rules and forms, based upon such officers’ evaluation of these controls and procedures as of a date within 90 days of the filing date of this report.
(b) There were no changes in the registrant’s internal control over financial reporting that occurred during the second fiscal quarter of the period covered by this report that have materially affected, or are reasonably likely to materially affect, the registrant’s internal control over financial reporting.
Item 12. Exhibits.
(a)(1) Not applicable.
(a) (2) Certifications of principal executive officer and principal financial officer as required by Rule 30a-2(a) under the Investment Company Act of 1940.
(b) Certifications of chief executive officer and chief financial officer as required by Rule 30a- 2(b) under the Investment Company Act of 1940.
SIGNATURES
Pursuant to the requirements of the Securities Exchange Act of 1934 and the Investment Company Act of 1940, the registrant has duly caused this report to be signed on its behalf by the undersigned, thereunto duly authorized.
COHEN & STEERS GLOBAL REALTY SHARES, INC.
| By: | /s/ Adam M. Derechin | |
| | Name: Adam M. Derechin |
| | Title: President and Chief Executive Officer |
| | |
| Date: March 3, 2008 |
| | | | |
Pursuant to the requirements of the Securities Exchange Act of 1934 and the Investment Company Act of 1940, this report has been signed below by the following persons on behalf of the registrant and in the capacities and on the dates indicated.
| By: | /s/ Adam M. Derechin | |
| | Name: | Adam M. Derechin |
| | Title: | President and Chief Executive Officer |
| | | (principal executive officer) |
| | | |
| By: | /s/ James Giallanza | |
| Name: | James Giallanza |
| Title: | Treasurer |
| | (principal financial officer) |
| | |
| |
| Date: March 3, 2008 |
| | | | | |