UNITED STATES
SECURITIES AND EXCHANGE COMMISSION
Washington, D.C. 20549
FORM N-CSR
CERTIFIED SHAREHOLDER REPORT OF REGISTERED MANAGEMENT
INVESTMENT COMPANIES
| | |
| Investment Company Act file number: | | 811-08085 |
| |
| Exact name of registrant as specified in charter: | | Strategic Partners Mutual Funds, Inc. |
| |
| Address of principal executive offices: | | Gateway Center 3, 100 Mulberry Street, Newark, New Jersey 07102 |
| |
| Name and address of agent for service: | | Deborah A. Docs Gateway Center 3, 100 Mulberry Street, Newark, New Jersey 07102 |
| |
| Registrant’s telephone number, including area code: | | 973-367-7521 |
| |
| Date of fiscal year end: | | 10/31/2005 |
| |
| Date of reporting period: | | 10/31/2005 |
Item 1 – Reports to Stockholders – [ INSERT REPORT ]
ANNUAL REPORT
OCTOBER 31, 2005
STRATEGIC PARTNERS
MUTUAL FUNDS, INC.

This report is not authorized for distribution to prospective investors unless preceded or accompanied by a current prospectus.
The views expressed in this report and information about the Funds’ portfolio holdings are for the period covered by this report and are subject to change thereafter.

Strategic Partners Mutual Funds, Inc.
List of Subadvisers as of October 31, 2005
| | |
| STRATEGIC PARTNERS FUND NAME | | SUBADVISER |
| Strategic Partners International Growth Fund | | William Blair & Company, L.L.C. |
| Strategic Partners Small Cap Growth Fund | | Deutsche Asset Management, Inc.; RS Investment Management, L.P.; and Transamerica Asset Management LLC |
| Strategic Partners Mid Cap Growth Fund | | Goldman Sachs Asset Management, L.P. |
| Strategic Partners Mid Cap Value Fund | | Neuberger Berman Management, Inc. |
| Strategic Partners Technology Fund | | The Dreyfus Corporation |
| Strategic Partners Health Sciences Fund | | A I M Capital Management, Inc. |
| Strategic Partners Managed OTC Fund | | ProFund Advisors LLC |
| Strategic Partners Capital Growth Fund | | Marsico Capital Management, LLC |
| Strategic Partners Concentrated Growth Fund | | Goldman Sachs Asset Management, L.P. |
| Strategic Partners Core Value Fund | | Alliance Capital Management, L.P. |
| Strategic Partners Large Cap Core Fund | | Alliance Capital Management, L.P. |
| Strategic Partners Equity Income Fund | | Alliance Capital Management, L.P. and T. Rowe Price Associates, Inc. |
| Strategic Partners Balanced Fund | | American Century Investment Management, Inc. |
| Strategic Partners High Yield Bond Fund | | Goldman Sachs Asset Management, L.P. |
| Strategic Partners Money Market Fund | | Prudential Investment Management, Inc. |
Subadvisers are subject to change.
For more information about Strategic Partners Mutual Funds, Inc. see the prospectus. You should consider the Funds’ investment objectives, risks, charges, and expenses carefully before investing. The prospectus will contain this and other information about the investment company. Please read the prospectus carefully before investing.
Shares of Strategic Partners Mutual Funds, Inc. are distributed by Prudential Investment Management Services LLC (PIMS), Three Gateway Center, 14th Floor, Newark, NJ 07102-4077; and American Skandia Marketing, Incorporated (ASMI), One Corporate Drive, Shelton, CT 06484. Both are Prudential Financial companies and members Securities Investor Protection Corporation (SIPC).
December 15, 2005
Dear Shareholder:
We hope you find the annual report for Strategic Partners Mutual Funds, Inc. informative and useful. As a Strategic Partners mutual fund shareholder, you may be thinking about where you can find additional growth opportunities. You could invest in last year’s top-performing asset class and hope history repeats itself or you could stay in cash while waiting for the “right moment” to invest.
Instead, we believe it is better to take advantage of developing domestic and global investment opportunities through a diversified portfolio of stock and bond mutual funds. A diversified asset allocation offers two potential advantages. It helps you manage downside risk by not being overly exposed to any particular asset class, plus it gives you a better opportunity to have at least some of your assets in the right place at the right time. Your financial professional can help you create a diversified investment plan that may include mutual funds covering all the basic asset classes and that reflects your personal investment profile and tolerance for risk.
Strategic Partners Mutual Funds gives you a wide range of choices that can help you make progress toward your financial goals. Our funds feature leading asset managers not just from a single company but from the entire investment industry.
Thank you for choosing Strategic Partners Mutual Funds.
Sincerely,

Judy A. Rice President, Strategic Partners Mutual Funds, Inc.
Strategic Partners Mutual Funds
CUSIP Numbers and NASDAQ Symbols
| | | | | | |
| FUND | | CLASS | | CUSIP | | NASDAQ |
| International Growth Fund | | A | | 86277E492 | | N/A |
| | | B | | 86277E476 | | N/A |
| | | C | | 86277E450 | | WBCIX |
| | | L* | | 86277E484 | | WBAIX |
| | | M** | | 86277E468 | | WBBIX |
| | | X*** | | 86277E443 | | WBZIX |
| | | | | | |
| FUND | | CLASS | | CUSIP | | NASDAQ |
| Small Cap Growth Fund | | A | | 86277E831 | | N/A |
| | | B | | 86277E815 | | N/A |
| | | C | | 86277E781 | | PBHCX |
| | | L* | | 86277E823 | | PBSAX |
| | | M** | | 86277E799 | | PBSBX |
| | | X*** | | 86277E773 | | PBSZX |
| | | | | | |
| FUND | | CLASS | | CUSIP | | NASDAQ |
| Mid Cap Growth Fund | | A | | 86277C512 | | N/A |
| | | B | | 86277C488 | | N/A |
| | | C | | 86277C462 | | GCMGX |
| | | L* | | 86277C496 | | GAMGX |
| | | M** | | 86277C470 | | GBMGX |
| | | X*** | | 86277C454 | | N/A |
| | | | | | |
| FUND | | CLASS | | CUSIP | | NASDAQ |
| Mid Cap Value Fund | | A | | 86277E807 | | N/A |
| | | B | | 86277E872 | | N/A |
| | | C | | 86277E856 | | NCBVX |
| | | L* | | 86277E880 | | NABVX |
| | | M** | | 86277E864 | | NBBVX |
| | | X*** | | 86277E849 | | NBVZX |
| | | Z***** | | 86277E435 | | N/A |
| | | | | | |
| FUND | | CLASS | | CUSIP | | NASDAQ |
| Technology Fund | | A | | 86277C314 | | N/A |
| | | B | | 86277C280 | | N/A |
| | | C | | 86277C264 | | ICNVX |
| | | L* | | 86277C298 | | IANVX |
| | | M** | | 86277C272 | | IBNVX |
| | | X*** | | 86277C256 | | IXNZX |
| | | | | | |
| FUND | | CLASS | | CUSIP | | NASDAQ |
| Health Sciences Fund | | A | | 86277C371 | | N/A |
| | | B | | 86277C355 | | N/A |
| | | C | | 86277C330 | | INHCX |
| | | L* | | 86277C363 | | INHAX |
| | | M** | | 86277C348 | | IHSBX |
| | | X*** | | 86277C322 | | N/A |
| | | | | | |
| FUND | | CLASS | | CUSIP | | NASDAQ |
| Managed OTC Fund | | A | | 86277E690 | | N/A |
| | | B | | 86277E674 | | N/A |
| | | C | | 86277E658 | | PCMOX |
| | | L* | | 86277E682 | | PRMAX |
| | | M** | | 86277E666 | | PMOBX |
| | | X*** | | 86277E641 | | N/A |
| | | | | | |
| FUND | | CLASS | | CUSIP | | NASDAQ |
| Capital Growth Fund | | A | | 86277C249 | | N/A |
| | | B | | 86277C223 | | N/A |
| | | C | | 86277C199 | | MARCX |
| | | L* | | 86277C231 | | MARAX |
| | | M** | | 86277C215 | | MARBX |
| | | X*** | | 86277C181 | | MARZX |
| | | | | | |
| FUND | | CLASS | | CUSIP | | NASDAQ |
| Concentrated Growth Fund | | A | | 86277C579 | | N/A |
| | | B | | 86277C553 | | N/A |
| | | C | | 86277C538 | | CCGSX |
| | | L* | | 86277C561 | | CAGSX |
| | | M** | | 86277C546 | | CBGSX |
| | | X*** | | 86277C520 | | CZGSX |
| | | | | | |
| FUND | | CLASS | | CUSIP | | NASDAQ |
| Core Value Fund | | A | | 86277E633 | | N/A |
| | | B | | 86277E617 | | N/A |
| | | C | | 86277E583 | | SBVCX |
| | | L* | | 86277E625 | | SOVAX |
| | | M** | | 86277E591 | | SVCBX |
| | | X*** | | 86277E575 | | N/A |
| | | | | | |
| FUND | | CLASS | | CUSIP | | NASDAQ |
| Large Cap Core Fund | | A | | 86277E567 | | N/A |
| | | B | | 86277E542 | | N/A |
| | | C | | 86277E526 | | MCIFX |
| | | L* | | 86277E559 | | MAIFX |
| | | M** | | 86277E534 | | MBIFX |
| | | X*** | | 86277E518 | | MXIFX |
| | | | | | |
| FUND | | CLASS | | CUSIP | | NASDAQ |
| Equity Income Fund | | A | | 86277C108 | | N/A |
| | | B | | 86277C306 | | N/A |
| | | C | | 86277C504 | | AGOCX |
| | | L* | | 86277C207 | | AGOAX |
| | | M** | | 86277C405 | | AGOBX |
| | | X*** | | 86277C603 | | AXGOX |
| | | | | | |
| FUND | | CLASS | | CUSIP | | NASDAQ |
| Balanced Fund | | A | | 86277C702 | | N/A |
| | | B | | 86277C884 | | N/A |
| | | C | | 86277C868 | | ACBCX |
| | | L* | | 86277C801 | | AACBX |
| | | M** | | 86277C876 | | ACBBX |
| | | X*** | | 86277C850 | | ACBZX |
| | | | | | |
| FUND | | CLASS | | CUSIP | | NASDAQ |
| High Yield Bond Fund | | A | | 86277C710 | | N/A |
| | | B | | 86277C686 | | N/A |
| | | C | | 86277C660 | | FCHYX |
| | | L* | | 86277C694 | | FHYAX |
| | | M** | | 86277C678 | | FBHYX |
| | | X*** | | 86277C652 | | FHYZX |
| | | | | | |
| FUND | | CLASS | | CUSIP | | NASDAQ |
| Money Market Fund**** | | A | | 86277E104 | | N/A |
| | | C | | 86277E609 | | ASCXX |
| | | D | | 86277E302 | | N/A |
| | | L* | | 86277E203 | | AASXX |
| | | M** | | 86277E500 | | ABSXX |
| | | X*** | | 86277E708 | | ASXXX |
*Closed to most new purchases (with the exception of reinvested dividends and purchases by college savings plans) and available for limited exchanges only.
**Closed to new purchases (with the exception of reinvested dividends) and available for limited exchanges only.
***Closed to new purchases and available for limited exchanges only (with the exception of reinvested dividends).
****Available for limited exchanges only.
*****Inception date of 11/28/05.
STRATEGIC PARTNERS MUTUAL FUNDS, INC.
Table of Contents
Summary of Definitions
The following pages present information on the investment performance of each Fund that has been in operation for at least 12 months as of October 31, 2005, including comparisons with relevant market indexes.
Definitions for Broad Market Indexes
Investors cannot invest directly in an index. Returns for the Indexes on the following pages would be lower if they included the effects of sales charges, operating expenses of a mutual fund, or taxes.
Blended Index—The Blended Index is calculated by weighting the S&P 500 Index at 60% and the Lehman Brothers Government/Corporate Bond Index at 40%. The Lehman Brothers Government/Corporate Bond Index is an unmanaged index composed of intermediate- and long-term government and investment-grade corporate debt securities.
Lehman Brothers U.S. Aggregate Bond Index—The Lehman Brothers U.S. Aggregate Bond Index is an unmanaged, market-weighted index that tracks the daily price, coupon pay-downs, and total return performance of fixed-rate, publicly placed, dollar-denominated, and nonconvertible investment-grade debt issues without at least $100 million par amount outstanding and with at least one year to final maturity.
Lehman Brothers U.S. Corporate High Yield Index—The Lehman Brothers U.S. Corporate High Yield Index is an unmanaged index that is generally representative of corporate bonds rated below investment grade. It comprises issues that meet the following criteria: at least $150 million par value outstanding, maximum credit rating of Ba1 or BB+ (including defaulted issues), and at least one year to maturity.
ML High Yield Master II Index—The Merrill Lynch (ML) High Yield Master II Index is an unmanaged index of publicly traded, nonconvertible U.S. bonds rated below investment grade.
MSCI EAFE® Index—The Morgan Stanley Capital International Europe, Australasia, Far East Index (MSCI EAFE® Index) is an unmanaged, weighted index of performance that reflects stock price movements in Europe, Australasia, and the Far East.
NASDAQ-100 Index—The NASDAQ-100 Index is an unmanaged, modified, capitalization-weighted index of the 100 largest and most active nonfinancial domestic and international issues listed on the NASDAQ.
Russell 2000 Index—The Russell 2000 Index is an unmanaged, weighted index that comprises the smallest 2,000 stocks among the largest 3,000 equity-capitalized U.S. corporations and represents approximately 10% of their aggregate market value.
S&P MidCap 400 Index—The Standard & Poor’s MidCap 400 Stock Index (S&P MidCap 400 Index) is an unmanaged index of 400 domestic stocks chosen for market size, liquidity, and industry group representation. It gives a broad look at how U.S. mid-cap stock prices have performed.
S&P 500 Index—The Standard & Poor’s 500 Composite Stock Price Index (S&P 500 Index) is an unmanaged index of 500 stocks of large U.S. public companies. It gives a broad look at how U.S. stock prices have performed.
Definitions for Lipper Averages
Lipper Averages are the average returns of all funds in the specified Lipper comparison group. The Lipper Averages on the following pages reflect the deduction of operating expenses, but not sales charges or taxes.
Lipper Balanced Funds Average—Funds in the Lipper Balanced Funds Average have primary objectives to conserve principal by maintaining at all times a balanced portfolio of both stocks and bonds. Typically, the stock:bond ratio ranges around 60%:40%.
Lipper Corporate Debt Funds A-Rated Average—Funds in the Lipper Corporate Debt Funds A-Rated Average invest primarily in corporate debt issues rated “A” or better, or government issues.
Lipper Equity Income Funds Average—Funds in the Lipper Equity Income Funds Average seek relatively high current income and growth of income through investing 60% or more of its portfolio in equities.
Lipper Health/Biotechnology Funds Average—Funds in the Lipper Health/Biotechnology Funds Average invest primarily in shares of companies engaged in healthcare, medicine, and biotechnology.
Lipper High Current Yield Funds Average—Funds in the Lipper High Current Yield Funds Average aim at high (relative) current yield from fixed income securities, have no quality or maturity restrictions, and tend to invest in lower-grade debt issues.
Lipper International Multi-Cap Growth Funds Average—Funds in the Lipper International Multi-Cap Growth Funds Average invest in a variety of market-capitalization ranges without concentrating 75% of their equity assets in any one market-capitalization range over an extended period of time. Multi-cap funds typically have 25% to 75% of their assets invested in companies strictly outside of the United States with market capitalizations (on a three-year weighted basis) greater than the 250th largest company in the S&P/Citigroup World ex-U.S. Broad Market Index. Multi-cap growth funds typically have an above-average price-to-cash flow ratio, price-to-book ratio, and three-year sales-per-share growth value compared with the S&P/Citigroup World ex-U.S. BMI.
Lipper Large-Cap Core Funds Average—Funds in the Lipper Large-Cap Core Funds Average, by portfolio practice, invest at least 75% of their equity assets in companies with market capitalizations (on a three-year weighted basis) greater than 300% of the dollar-weighted median market capitalization of the middle 1,000 securities of the S&P SuperComposite 1500 Index. Large-cap core funds have more latitude in the companies in which they invest. These funds typically have an average price-to-earnings ratio, price-to-book ratio, and three-year sales-per-share growth value compared with the S&P 500 Index.
Lipper Large-Cap Growth Funds Average—Funds in the Lipper Large-Cap Growth Funds Average, by portfolio practice, invest at least 75% of their equity assets in companies with market capitalizations (on a three-year weighted basis) greater than 300% of the dollar-weighted median market capitalization of the middle 1,000 securities of the S&P SuperComposite 1500 Index. Large-cap growth funds typically have an above-average price-to-earnings ratio, price-to-book ratio, and three-year sales-per-share growth value compared with the S&P 500 Index.
Lipper Large-Cap Value Funds Average—Funds in the Lipper Large-Cap Value Funds Average, by portfolio practice, invest at least 75% of their equity assets in companies with market capitalizations (on a three-year weighted basis) greater than 300% of the dollar-weighted median market capitalization of the middle 1,000 securities of the S&P SuperComposite 1500 Index. Large-cap value funds typically have a below-average price-to-earnings ratio, price-to-book ratio, and three-year sales-per-share growth value compared with the S&P 500 Index.
Lipper Mid-Cap Core Funds Average—Funds in the Lipper Mid-Cap Core Funds Average, by portfolio practice, invest at least 75% of their equity assets in companies with market capitalizations (on a three-year weighted basis) less than 300% of the dollar-weighted median market capitalization of the middle 1,000 securities of the S&P SuperComposite 1500 Index. Mid-cap core funds have more latitude in the companies in which they invest. These funds typically have an average price-to-earnings ratio, price-to-book ratio, and three-year sales-per-share growth value compared with the S&P MidCap 400 Index.
Lipper Mid-Cap Value Funds Average—Funds in the Lipper Mid-Cap Value Funds Average, by portfolio practice, invest at least 75% of their equity assets in companies with market capitalizations (on a three-year weighted basis) less than
300% of the dollar-weighted median market capitalization of the middle 1,000 securities of the S&P SuperComposite 1500 Index. Mid-cap value funds typically have a below-average price-to-earnings ratio, price-to-book ratio, and three-year sales-per-share growth value compared with the S&P MidCap 400 Index.
Lipper Money Market Instrument Funds Average—Funds in the Lipper Money Market Instrument Funds invest in high-quality financial instruments rated in top two grades with dollar-weighted average maturities of less than 90 days. These funds typically intend to keep a constant net asset value.
Lipper Multi-Cap Growth Funds Average—Funds in the Lipper Multi-Cap Growth Funds Average invest in a variety of market-capitalization ranges without concentrating 75% of their equity assets in any one market-capitalization range over an extended period of time. Multi-cap funds typically have between 25% and 75% of their assets invested in companies with market capitalizations (on a three-year weighted basis) above 300% of the dollar-weighted median market capitalization of the middle 1,000 securities of the S&P SuperComposite 1500 Index. Multi-cap growth funds typically have an above-average price-to-earnings ratio, price-to-book ratio, and three-year sales-per-share growth value compared with the S&P SuperComposite 1500 Index.
Lipper Multi-Cap Value Funds Average—Funds in the Lipper Multi-Cap Value Funds Average, by portfolio practice, invest in a variety of market-capitalization ranges without concentrating 75% of their equity assets in any one market-capitalization range over an extended period of time. Multi-cap funds typically have between 25% and 75% of their assets invested in companies with market capitalizations (on a three-year weighted basis) above 300% of the dollar-weighted median market capitalization of the middle 1,000 securities of the S&P SuperComposite 1500 Index. Multi-cap value funds have a below-average price-to-earnings ratio, price-to-book ratio, and three-year sales-per-share growth value compared with the S&P SuperComposite 1500 Index.
Lipper Science & Technology Funds Average—Funds in the Lipper Science & Technology Funds Average invest primarily in science and technology stocks.
Lipper Small-Cap Core Funds Average—Funds in the Lipper Small-Cap Core Funds Average, by portfolio practice, invest at least 75% of their equity assets in companies with market capitalizations (on a three-year weighted basis) less than 250% of the dollar-weighted median of the smallest 500 of the middle 1,000 securities of the S&P SuperComposite 1500 Index. Small-cap core funds have more latitude in the companies in which they invest. These funds typically have an average price-to-earnings ratio, price-to-book ratio, and three-year sales-per-share growth value compared with the S&P SmallCap 600 Index.
Lipper Small-Cap Growth Funds Average—Funds in the Lipper Small-Cap Growth Funds Average, by portfolio practice, invest at least 75% of their equity assets in companies with market capitalizations (on a three-year weighted basis) less than 250% of the dollar-weighted median of the smallest 500 of the middle 1,000 securities of the S&P SuperComposite 1500 Index. Small-cap growth funds typically have an above-average price-to-earnings ratio, price-to-book ratio, and three-year sales-per-share growth value compared with the S&P SmallCap 600 Index.
The Investing Environment
Broad-based stock and bond indexes were positive over the 12 months ended October 31, 2005, and the return for the U.S. stock market overall (as measured by the Russell 3000 Index) was slightly above its 10-year average. However, the performance of individual securities was very uneven. Share prices fell in many industries, particularly in the consumer discretionary and telecommunication services sectors.
World GDP growth moderated from a 3.8% pace to 3.1% as the United States and Asian countries slowed from above-average growth while Europe remained sluggish. Late in the period, the U.S. Gulf coast was hit by hurricanes Katrina and Rita. Investors responded by focusing on the potential long-term impact of higher energy prices, bringing the markets down sharply in September and the first half of October. On the other hand, analysts raised earnings growth estimates for 2006, taking into account the planned $200 billion rebuilding effort.
In our view, the hurricanes exacerbated existing supply concerns in the energy and housing markets. They are likely to raise the cost of doing business for energy-dependent industries and for agricultural industries that use the Mississippi River for transportation. Industries selling to consumers also may be more vulnerable. Nonetheless, we don’t think the impacts are enough to derail the current economic expansion.
Economic and earnings growth remained strong in 2005. However, investors looking ahead were concerned about the slowing of earnings growth from its very rapid rate in 2004, the impact of energy prices on consumer demand for other goods, and rising interest rates. Within the U.S. equity market, mid-cap stocks outpaced large-cap and small-cap stocks. Indeed, the Russell Midcap Index was substantially above its 10-year average, while shares of the very largest corporations lagged both the overall market and their 10-year average return. We think that these are the firms best positioned to benefit from globalization, and their underperformance has generated a buying opportunity.
Value stocks both domestically and internationally performed best through most of the period, but growth outperformed in the third quarter of 2005. After a long period when companies improved their profits primarily by cutting costs, future growth will be more dependent on raising revenues. Currently, investors are paying little or no premium for revenue growth, and we think that is likely to change at some point, driving the prices of growth stocks higher.
The energy sector had extraordinary gains as oil prices rose above $70/barrel in the wake of the hurricanes. Utilities, which are typically value-style investments, also produced strong returns over the period. The industrials, materials, and health care sectors had modest overall returns. Most health care industry groups were among the market’s leaders, but the sector return was pulled down by several very large drug companies’ steep share-price declines. The negative return of the consumer discretionary sector was concentrated in automobile-related and media industries and in the Internet retail stock eBay, while tobacco and housing stocks were strong.
International stock market returns were significantly higher than those in the United States. China took the first step toward an independent monetary policy by loosening the link of its currency to the U.S. dollar. This contributed to global stability by reducing the threat of a rapid economic slowdown triggered by the growing financial imbalances between China and the United States. Japanese voters handed Prime Minister Koizumi a strong mandate to proceed with economic restructuring. This bolsters our confidence that the world’s second largest economy will indeed emerge from 15 years of stagnation—a clear plus for the global economy. Although investment results for U.S. dollar-based investors were reduced somewhat by the steep rise of the dollar in the latter part of the reporting period, international markets generally outperformed U.S. markets even after currency adjustments.
U.S. investment-grade bonds generated very modest returns over the period. Short-term yields rose as the Federal Reserve continued to make incremental rate increases to cool the U.S. economy and keep inflation low. Longer-term yields were more stable, with 30-year yields actually falling to reflect a benign inflation picture. As a result, longer-term bond investors had better returns for the year. Investors reaching for higher yielding alternatives helped high yield corporate (“junk”) and emerging market bonds become the best performing fixed income sectors. Strong U.S. economic growth and solid corporate fundamentals supported junk bonds while high commodity prices and continued fiscal improvement helped the bonds of many key emerging market countries.
This Page Intentionally Left Blank
Your Fund’s Performance
Strategic Partners International Growth Fund
Fund objective
The investment objective of the Strategic Partners International Growth Fund is to seek long-term growth of capital. There can be no assurance that the Fund will achieve its investment objective.
Performance data quoted represent past performance. Past performance does not guarantee future results. The investment return and principal value of an investment will fluctuate, so that an investor’s shares, when redeemed, may be worth more or less than their original cost. Current performance may be lower or higher than the past performance data quoted. An investor may obtain performance data as of the most recent month-end by visiting our website at www.strategicpartners.com or by calling (800) 225-1852. Class A and Class L shares have a maximum initial sales charge of 5.50% and 5.75% respectively. Class L shares are closed to most new purchases (with the exception of reinvested dividends and purchases by certain college savings plans).
| | | | | | | | | |
| Cumulative Total Returns1 as of 10/31/05 | | | | | | | | | |
| | | One Year | | | Five Years | | | Since Inception2 | |
Class A3 | | 16.76 | % | | N/A | | | 14.32 | % |
Class B4 | | 15.87 | | | N/A | | | 12.93 | |
Class C | | 15.93 | | | –19.05 | % | | 38.10 | |
Class L3 | | 16.52 | | | –16.97 | | | 43.38 | |
Class M4 | | 15.87 | | | –19.10 | | | 37.78 | |
Class X | | 15.96 | | | –19.04 | | | 37.88 | |
MSCI EAFE® Index5 | | 18.09 | | | 16.15 | | | * | |
Lipper International Multi-Cap Growth Funds Avg.5 | | 17.54 | | | 2.22 | | | ** | |
| | | | | | | | | | |
| Average Annual Total Returns1 as of 9/30/05 | | | | | | | | | |
| | | One Year | | | Five Years | | | Since Inception2 | |
Class A3 | | 18.39 | % | | N/A | | | 8.13 | % |
Class B4 | | 19.40 | | | N/A | | | 8.89 | |
Class C | | 23.33 | | | –4.63 | % | | 4.64 | |
Class L3 | | 17.68 | | | –5.09 | | | 4.47 | |
Class M4 | | 18.40 | | | –4.83 | | | 4.74 | |
Class X | | 18.29 | | | –5.01 | | | 4.65 | |
MSCI EAFE® Index5 | | 25.79 | | | 3.16 | | | * | |
Lipper International Multi-Cap Growth Funds Avg.5 | | 25.12 | | | –0.46 | | | ** | |
The cumulative total returns do not reflect the deduction of applicable sales charges. If reflected, the applicable sales charges would reduce the cumulative total return performance quoted. Class A and Class L shares are subject to a maximum front-end sales charge of 5.50% and 5.75% respectively. Class L shares are closed to most new purchases (with the exception of reinvested dividends and purchases by certain college savings plans). Class M shares are also closed to most new purchases (with the exception of reinvested dividends). Class L, Class M, and Class X shares are only exchangeable with Class L, Class M, and Class X shares, respectively, offered by the other Strategic Partners Funds. Under certain circumstances, Class A and Class L shares may be subject to a contingent deferred sales charge (CDSC) of 1%. Class B, Class C, Class M, and Class X shares are subject to a maximum CDSC of 5%, 1%, 6%, and 6% respectively.
1Source: Prudential Investments LLC and Lipper Inc. The average annual total returns do take into account applicable sales charges. The returns in the tables do not reflect the deduction of taxes that a shareholder would pay on Fund distributions or following the redemption of Fund shares. During certain periods shown, fee waivers and/or expense reimbursements were in effect. Without such fee waivers and/or expense reimbursements, the returns for the share classes would have been lower. Without a distribution and service (12b-1) fee waiver of 0.05% for Class A shares, the returns would have been lower. Class A shares are subject to a 12b-1 fee of up to 0.30% annually. Class B, Class C, Class M, and Class X shares are subject to a 12b-1 fee of 1.00%. Class L shares are subject to a 12b-1 fee of 0.50%.
2Inception dates: Class A and Class B, 4/12/04; Class C, Class L, Class M, and Class X, 12/31/97.
3Prior to April 12, 2004, Class L shares were known as Class A shares. On April 12, 2004, Class A shares were redesignated as Class L shares and a new Class A was opened.
4Prior to April 12, 2004, Class M shares were known as Class B shares. On April 12, 2004, Class B shares were redesignated as Class M shares and a new Class B was opened.
5See page 1 for a summary of definitions for the Fund’s benchmarks.
*MSCI EAFE® Index Closest Month-End to Inception cumulative total returns as of 10/31/05 are 22.04% for Class A and Class B; and 52.39% for Class C, Class L, Class M, and Class X. MSCI EAFE® Index Closest Month-End to Inception average annual total returns as of 9/30/05 are 16.48% for Class A and Class B; and 5.99% for Class C, Class L, Class M, and Class X.
**Lipper International Equity Funds Average Closest Month-End to Inception cumulative total returns as of 10/31/05 are 17.79% for Class A and Class B; and 50.54% for Class C, Class L, Class M, and Class X. Lipper International Equity Funds Average Closest Month-End to Inception average annual total returns as of 9/30/05 are 13.88% for Class A and Class B; and 5.53% for Class C, Class L, Class M, and Class X.
| | | |
| Five Largest Holdings expressed as a percentage of net assets as of 10/31/05 | | | |
Roche Holding AG, Pharmaceuticals | | 3.3 | % |
Mitsubishi UFG Financial Group, Inc., Financial Bank & Trust | | 3.1 | |
BG Group PLC, Oil & Gas | | 3.0 | |
SAP AG, Computer Services & Software | | 2.8 | |
ORIX Corp., Real Estate | | 2.6 | |
Holdings reflect only long-term investments and are subject to change.
Fund Manager’s Report
For the fiscal year ended October 31, 2005, the Strategic Partners International Growth Fund was subadvised by William Blair & Company, L.L.C. Its Class A shares had a total return of 16.76% compared with the 18.09% return of the MSCI EAFE Index. The Fund trailed the Lipper International Multi-Cap Growth Funds Average (+17.54%).
Strength in the benchmark MSCI EAFE Index was broad, with all sectors posting positive returns and weakness concentrated in the information technology and telecommunication services industries. The strongest sectors were those reflecting broad economic development such as industrials and financials. Sectors where there also were limitations on supply—energy and materials—were the market leaders with substantially higher returns than the others.
The Fund’s bottom-up stock selection process resulted in an overweight in the technology sector and underweight in materials. These emphases hurt its performance. An overweight in the consumer discretionary sector had a somewhat smaller negative impact.
Relative performance was helped by the Fund’s exposure to developing markets, which are not represented in the MSCI EAFE Index, particularly to Brazil, India, Mexico, and South Korea. An emphasis on mid-cap stocks also contributed to relative performance as these stocks outperformed the shares of the largest companies.
The Fund’s stock selection was strong within the energy sector where positions in BG Group (a U.K. natural gas and oil producer) and Statoil ASA (Norway) were among the largest contributors to its return. Holdings in the financials sector also performed well. The Australian firm Macquarie Bank made a particularly large contribution as its share price benefited from rising demand for investment funds it manages. Holdings in the telecommunication services sector also outperformed comparable stocks in the MSCI EAFE Index.
The Fund’s stock selection was relatively weak in the industrials sector, although no single position stood out.
Your Fund’s Performance
Strategic Partners Small Cap Growth Fund
Fund objective
The investment objective of the Strategic Partners Small Cap Growth Fund is to seek capital growth. There can be no assurance that the Fund will achieve its investment objective.
Performance data quoted represent past performance. Past performance does not guarantee future results. The investment return and principal value of an investment will fluctuate, so that an investor’s shares, when redeemed, may be worth more or less than their original cost. Current performance may be lower or higher than the past performance data quoted. An investor may obtain performance data as of the most recent month-end by visiting our website at www.strategicpartners.com or by calling (800) 225-1852. Class A and Class L shares have a maximum initial sales charge of 5.50% and 5.75% respectively. Class L shares are closed to most new purchases (with the exception of reinvested dividends and purchases by certain college savings plans).
| | | | | | | | | |
| Cumulative Total Returns1 as of 10/31/05 | | | | | | | | | |
| | | One Year | | | Five Years | | | Since Inception2 | |
Class A3 | | 3.13 | % | | N/A | | | –5.21 | % |
Class B4 | | 2.43 | | | N/A | | | –7.34 | |
Class C | | 2.41 | | | –36.69 | % | | –49.10 | |
Class L3 | | 2.95 | | | –35.15 | | | –47.60 | |
Class M4 | | 2.41 | | | –36.69 | | | –49.10 | |
Class X | | 2.41 | | | –36.68 | | | –49.03 | |
Russell 2000 Index5 | | 12.08 | | | 38.60 | | | | * |
Lipper Small-Cap Growth Funds Avg.5 | | 11.79 | | | –3.32 | | | ** | |
| | | | | | | | | | |
| Average Annual Total Returns1 as of 9/30/05 | | | | | | | | | |
| | | One Year | | | Five Years | | | Since Inception2 | |
Class A3 | | 2.81 | % | | N/A | | | –4.79 | % |
Class B4 | | 3.03 | | | N/A | | | –5.18 | |
Class C | | 6.96 | | | –9.57 | % | | –10.78 | |
Class L3 | | 2.26 | | | –10.21 | | | –11.28 | |
Class M4 | | 1.98 | | | –9.97 | | | –11.13 | |
Class X | | 1.96 | | | –10.14 | | | –11.10 | |
Russell 2000 Index5 | | 17.95 | | | 6.45 | | | * | |
Lipper Small-Cap Growth Funds Avg.5 | | 18.57 | | | –2.45 | | | ** | |
The cumulative total returns do not reflect the deduction of applicable sales charges. If reflected, the applicable sales charges would reduce the cumulative total return performance quoted. Class A and Class L shares are subject to a maximum front-end sales charge of 5.50% and 5.75% respectively. Class L shares are closed to most new purchases (with the exception of reinvested dividends and purchases by certain college savings plans). Class M shares are also closed to most new purchases (with the exception of reinvested dividends). Class L, Class M, and Class X shares are only exchangeable with Class L, Class M, and Class X shares, respectively, offered by the other Strategic Partners Funds. Under certain circumstances, Class A and Class L shares may be subject to a contingent deferred sales charge (CDSC) of 1%. Class B, Class C, Class M, and Class X shares are subject to a maximum CDSC of 5%, 1%, 6%, and 6% respectively.
1Source: Prudential Investments LLC and Lipper Inc. The average annual total returns do take into account applicable sales charges. The returns in the tables do not reflect the deduction of taxes that a shareholder would pay on Fund distributions or following the redemption of Fund shares. During certain periods shown, fee waivers and/or expense reimbursements were in effect. Without such fee waivers and/or expense reimbursements, the returns for the share classes would have been lower. Without a distribution and service (12b-1) fee waiver of 0.05% for Class A shares, the returns would have been lower. Class A shares are subject to a 12b-1 fee of up to 0.30% annually. Class B, Class C, Class M, and Class X shares are subject to a 12b-1 fee of 1.00%. Class L shares are subject to a 12b-1 fee of 0.50%.
2Inception dates: Class A and Class B, 4/12/04; Class C, Class L, Class M, and Class X, 7/28/97.
3Prior to April 12, 2004, Class L shares were known as Class A shares. On April 12, 2004, Class A shares were redesignated as Class L shares and a new Class A was opened.
4Prior to April 12, 2004, Class M shares were known as Class B shares. On April 12, 2004, Class B shares were redesignated as Class M shares and a new Class B was opened.
5See page 1 for a summary of definitions for the Fund’s benchmarks.
*Russell 2000 Index Closest Month-End to Inception cumulative total returns as of 10/31/05 are 11.55% for Class A and Class B; and 20.32% for Class C, Class L, Class M, and Class X. Russell 2000 Index Closest Month-End to Inception average annual total returns as of 9/30/05 are 9.84% for Class A and Class B; and 3.95% for Class C, Class L, Class M, and Class X.
**Lipper Small-Cap Growth Funds Average Closest Month-End to Inception cumulative total returns as of 10/31/05 are 7.36% for Class A and Class B; and –13.65% for Class C, Class L, Class M, and Class X. Lipper Small-Cap Growth Funds Average Closest Month-End to Inception average annual total returns as of 9/30/05 are 7.15% for Class A and Class B; and –3.86% for Class C, Class L, Class M, and Class X.
| | | |
| Five Largest Holdings expressed as a percentage of net assets as of 10/31/05 | | | |
Cal Dive International, Inc., Oil & Gas | | 1.3 | % |
DRS Technologies, Inc., Aerospace | | 1.2 | |
Valueclick, Inc., Financial Services | | 1.2 | |
St. Mary Land & Exploration Co., Oil & Gas | | 0.9 | |
Chemed Corp., Commercial Services | | 0.9 | |
Holdings reflect only long-term investments and are subject to change.
Fund Manager’s Report
For the fiscal year ended October 31, 2005, the Strategic Partners Small-Cap Growth Fund was subadvised by Deutsche Asset Management, Inc. Its Class A shares had a total return of 3.13% compared with returns of 12.08% for the Russell 2000 Index and 10.91% for the Russell 2000 Growth Index. It trailed the Lipper Small-Cap Growth Funds Average (+11.79%).
During the reporting period, the small-cap market generally favored less risk-averse strategies rather than the Fund’s more conservative growth style. The Fund’s strategy is based upon quantitative stock-selection methods and controlling the size of risk exposures (deviations from the security allocations of the Russell 2000 Growth Index). Risk exposures are generally limited at the sector level, but within the financials, information technology, and healthcare sectors the Fund’s stock selection and industry emphases hurt its relative performance. There were deep losses on holdings in the thrifts & mortgages and consumer finance industry groups in the financials sector, and on biotechnology and pharmaceuticals in the healthcare sector.
An overweight of the pharmaceutical industry compared with the Russell 2000 Growth Index and an underweight of real estate detracted substantially from performance. However, these impacts were more than offset by the advantages of overweights in the oil & gas and machinery industries. Overall, the Fund’s exposures to various industries improved its relative performance. It benefited as well from its style’s inherent underweighting of stocks that are relatively low priced and have high dividend yields, a characteristic that was not rewarded by the market.
Your Fund’s Performance
Strategic Partners Mid Cap Growth Fund
Fund objective
The investment objective of the Strategic Partners Mid Cap Growth Fund is to seek long-term growth of capital. There can be no assurance that the Fund will achieve its investment objective.
Performance data quoted represent past performance. Past performance does not guarantee future results. The investment return and principal value of an investment will fluctuate, so that an investor’s shares, when redeemed, may be worth more or less than their original cost. Current performance may be lower or higher than the past performance data quoted. An investor may obtain performance data as of the most recent month-end by visiting our website at www.strategicpartners.com or by calling (800) 225-1852. Class A and Class L shares have a maximum initial sales charge of 5.50% and 5.75% respectively. Class L shares are closed to most new purchases (with the exception of reinvested dividends and purchases by certain college savings plans).
| | | | | | | | | |
| Cumulative Total Returns1 as of 10/31/05 | | | | | | | | | |
| | | One Year | | | Five Years | | | Since Inception2 | |
Class A3 | | 8.18 | % | | N/A | | | 9.20 | % |
Class B4 | | 7.38 | | | N/A | | | 7.90 | |
Class C | | 7.42 | | | –55.13 | % | | –55.08 | |
Class L3 | | 7.98 | | | –53.96 | | | –53.91 | |
Class M4 | | 7.40 | | | –54.98 | | | –54.98 | |
Class X | | 7.42 | | | –55.08 | | | –55.08 | |
S&P MidCap 400 Index5 | | 17.65 | | | 42.38 | | | * | |
Lipper Mid-Cap Growth Funds Avg.5 | | 14.07 | | | –14.17 | | | ** | |
| | | | | | | | | | |
| Average Annual Total Returns1 as of 9/30/05 | | | | | | | | | |
| | | One Year | | | Five Years | | | Since Inception2 | |
Class A3 | | 8.88 | % | | N/A | | | 4.35 | % |
Class B4 | | 9.22 | | | N/A | | | 5.03 | |
Class C | | 13.57 | | | –14.60 | % | | –14.09 | |
Class L3 | | 8.45 | | | –15.18 | | | –14.67 | |
Class M4 | | 8.53 | | | –14.91 | | | –14.40 | |
Class X | | 8.57 | | | –15.12 | | | –14.44 | |
S&P MidCap 400 Index5 | | 22.16 | | | 7.05 | | | * | |
Lipper Mid-Cap Growth Funds Avg.5 | | 20.63 | | | –4.70 | | | ** | |
The cumulative total returns do not reflect the deduction of applicable sales charges. If reflected, the applicable sales charges would reduce the cumulative total return performance quoted. Class A and Class L shares are subject to a maximum front-end sales charge of 5.50% and 5.75% respectively. Class L shares are closed to most new purchases (with the exception of reinvested dividends and purchases by certain college savings plans). Class M shares are also closed to most new purchases (with the exception of reinvested dividends). Class L, Class M, and Class X shares are only exchangeable with Class L, Class M, and Class X shares, respectively, offered by the other Strategic Partners Funds. Under certain circumstances, Class A and Class L shares may be subject to a contingent deferred sales charge (CDSC) of 1%. Class B, Class C, Class M, and Class X shares are subject to a maximum CDSC of 5%, 1%, 6%, and 6% respectively.
1Source: Prudential Investments LLC and Lipper Inc. The average annual total returns do take into account applicable sales charges. The returns in the tables do not reflect the deduction of taxes that a shareholder would pay on Fund distributions or following the redemption of Fund shares. During certain periods shown, fee waivers and/or expense reimbursements were in effect. Without such fee waivers and/or expense reimbursements, the returns for the share classes would have been lower. Without a distribution and service (12b-1) fee waiver of 0.05% for Class A shares, the returns would have been lower. Class A shares are subject to a 12b-1 fee of up to 0.30% annually. Class B, Class C, Class M, and Class X shares are subject to a 12b-1 fee of 1.00%. Class L shares are subject to a 12b-1 fee of 0.50%.
2Inception dates: Class A and Class B, 4/12/04; Class C, Class L, Class M, and Class X, 9/11/00.
3Prior to April 12, 2004, Class L shares were known as Class A shares. On April 12, 2004, Class A shares were redesignated as Class L shares and a new Class A was opened.
4Prior to April 12, 2004, Class M shares were known as Class B shares. On April 12, 2004, Class B shares were redesignated as Class M shares and a new Class B was opened.
5See page 1 for a summary of definitions for the Fund’s benchmarks.
*S&P MidCap 400 Index Closest Month-End to Inception cumulative total returns as of 10/31/05 are 18.16% for Class A and Class B; and 36.61% for Class C, Class L, Class M, and Class X. S&P MidCap 400 Index Closest Month-End to Inception average annual total returns as of 9/30/05 are 13.40% for Class A and Class B; and 6.78% for Class C, Class L, Class M, and Class X.
**Lipper Mid-Cap Growth Funds Average Closest Month-End to Inception cumulative total returns as of 10/31/05 are 12.39% for Class A and Class B; and –21.12% for Class C, Class L, Class M, and Class X. Lipper Mid-Cap Growth Funds Average Closest Month-End to Inception average annual total returns as of 9/30/05 are 10.11% for Class A and Class B; and –5.12% for Class C, Class L, Class M, and Class X.
| | | |
| Five Largest Holdings expressed as a percentage of net assets as of 10/31/05 | | | |
Grainger, (W.W), Inc., Producer Goods | | 2.3 | % |
Biomet, Inc., Supplies & Equipment | | 2.2 | |
Zebra Technologies Corp., Computer Hardware | | 2.2 | |
Smith International, Inc., Oil Well Services & Equipment | | 2.2 | |
Fortune Brands, Inc., Consumer Products & Services | | 2.1 | |
Holdings reflect only long-term investments and are subject to change.
Fund Manager’s Report
For the fiscal year ended October 31, 2005, the Strategic Partners Mid Cap Growth Fund was subadvised by Goldman Sachs Asset Management, L.P. Its Class A shares had a total return of 8.18% compared with a return of 15.91% for the Russell Midcap Growth Index. It trailed the Lipper Mid-Cap Growth Funds Average (+14.07%).
The Fund’s underperformance was attributable to inopportune sector emphases and poor stock selection within sectors. Its overweight in consumer services, primarily in media stocks, and underweight in energy and basic materials stocks were the main detractors from its relative performance. During this period, energy and basic materials stocks provided much of the market’s strength in this asset class, while consumer services stocks continued to trail well into 2005. The Fund’s manager historically has tended to emphasize the media and leisure industries, which were among the market’s worst performers during this reporting period. Moreover, stock selection in other sectors didn’t help the Fund’s return. Several holdings in the financials, consumer services, and information technology sectors proved unprofitable.
The Fund’s portfolio was more sensitive, overall, to broad market movements than its benchmark, which helped its performance during this strong period for mid-cap growth stocks. This exposure was particularly beneficial in May through July 2005 when the market climbed steeply. Other portfolio risk exposures generally offset one another in impact.
Your Fund’s Performance
Strategic Partners Mid Cap Value Fund***
Fund objective
The investment objective of the Strategic Partners Mid Cap Value Fund is to seek capital growth. There can be no assurance that the Fund will achieve its investment objective.
Performance data quoted represent past performance. Past performance does not guarantee future results. The investment return and principal value of an investment will fluctuate, so that an investor’s shares, when redeemed, may be worth more or less than their original cost. Current performance may be lower or higher than the past performance data quoted. An investor may obtain performance data as of the most recent month-end by visiting our website at www.strategicpartners.com or by calling (800) 225-1852. Class A and Class L shares have a maximum initial sales charge of 5.50% and 5.75% respectively. Class L shares are closed to most new purchases (with the exception of reinvested dividends and purchases by certain college savings plans).
| | | | | | | | | |
| Cumulative Total Returns1 as of 10/31/05 | | | | | | | | | |
| | | One Year | | | Five Years | | | Since Inception2 | |
Class A3 | | 16.74 | % | | N/A | | | 19.78 | % |
Class B4 | | 15.85 | | | N/A | | | 18.24 | |
Class C | | 15.75 | | | 52.45 | % | | 125.74 | |
Class L3 | | 16.29 | | | 56.32 | | | 133.79 | |
Class M4 | | 15.75 | | | 52.45 | | | 125.75 | |
Class X | | 15.67 | | | 52.35 | | | 125.13 | |
S&P MidCap 400 Index5 | | 17.65 | | | 42.38 | | | * | |
Lipper Mid-Cap Value Funds Avg.5 | | 14.51 | | | 67.32 | | | ** | |
| | | | | | | | | | |
| Average Annual Total Returns1 as of 9/30/05 | | | | | | | | | |
| | | One Year | | | Five Years | | | Since Inception2 | |
Class A3 | | 17.51 | % | | N/A | | | 13.11 | % |
Class B4 | | 18.29 | | | N/A | | | 13.98 | |
Class C | | 22.26 | | | 9.99 | % | | 12.88 | |
Class L3 | | 16.74 | | | 9.47 | | | 12.65 | |
Class M4 | | 17.26 | | | 9.95 | | | 13.04 | |
Class X | | 17.20 | | | 9.80 | | | 12.94 | |
S&P MidCap 400 Index5 | | 22.16 | | | 7.05 | | | * | |
Lipper Mid-Cap Value Funds Avg.5 | | 20.19 | | | 11.73 | | | ** | |
The cumulative total returns do not reflect the deduction of applicable sales charges. If reflected, the applicable sales charges would reduce the cumulative total return performance quoted. Class A and Class L shares are subject to a maximum front-end sales charge of 5.50% and 5.75% respectively. Class L shares are closed to most new purchases (with the exception of reinvested dividends and purchases by certain college savings plans). Class M shares are also closed to most new purchases (with the exception of reinvested dividends). Class L, Class M, and Class X shares are only exchangeable with Class L, Class M, and Class X shares, respectively, offered by the other Strategic Partners Funds. Under certain circumstances, Class A and Class L shares may be subject to a contingent deferred sales charge (CDSC) of 1%. Class B, Class C, Class M, and Class X shares are subject to a maximum CDSC of 5%, 1%, 6%, and 6% respectively.
1Source: Prudential Investments LLC and Lipper Inc. The average annual total returns do take into account applicable sales charges. The returns in the tables do not reflect the deduction of taxes that a shareholder would pay on Fund distributions or following the redemption of Fund shares. During certain periods shown, fee waivers and/or expense reimbursements were in effect. Without such fee waivers and/or expense reimbursements, the returns for the share classes would have been lower. Without a distribution and service (12b-1) fee waiver of 0.05% for Class A shares, the returns would have been lower. Class A shares are subject to a 12b-1 fee of up to 0.30% annually. Class B, Class C, Class M, and Class X shares are subject to a 12b-1 fee of 1.00%. Class L shares are subject to a 12b-1 fee of 0.50%.
2Inception dates: Class A and Class B, 4/12/04; Class C, Class L, Class M, Class X, 8/19/98, and Class Z, 11/28/05. Returns for Class Z are not shown since the share class had not existed prior to 10/31/05.
3Prior to April 12, 2004, Class L shares were known as Class A shares. On April 12, 2004, Class A shares were redesignated as Class L shares and a new Class A was opened.
4Prior to April 12, 2004, Class M shares were known as Class B shares. On April 12, 2004, Class B shares were redesignated as Class M shares and a new Class B was opened.
5See page 1 for a summary of definitions for the Fund’s benchmarks.
*S&P MidCap 400 Index Closest Month-End to Inception cumulative total returns as of 10/31/05 are 18.16% for Class A and Class B; and 170.30% for Class C, Class L, Class M, and Class X. S&P MidCap 400 Index Closest Month-End to Inception average annual total returns as of 9/30/05 are 13.40% for Class A and Class B; and 15.42% for Class C, Class L, Class M, and Class X.
**Lipper Mid-Cap Value Funds Average Closest Month-End to Inception cumulative total returns as of 10/31/05 are 17.37% for Class A and Class B; and 150.39% for Class C, Class L, Class M, and Class X. Lipper Mid-Cap Value Funds Average Closest Month-End to Inception average annual total returns as of 9/30/05 are 13.83% for Class A and Class B; and 14.14% for Class C, Class L, Class M, and Class X.
***Prior to November 28, 2005, the Strategic Partners Mid Cap Value Fund was known as the Strategic Partners Relative Value Fund.
| | | |
| Five Largest Holdings expressed as a percentage of net assets as of 10/31/05 | | | |
Arch Coal, Inc., Metals & Mining | | 3.1 | % |
XTO Energy, Inc., Oil & Gas | | 2.8 | |
TXU Corp., Utilities | | 2.6 | |
Canadian Natural Resources Ltd., Oil & Gas | | 2.4 | |
Lennar Corp. (Class A Stock), Construction | | 2.3 | |
Holdings reflect only long-term investments and are subject to change.
Fund Manager’s Report
For the fiscal year ended October 31, 2005, the Strategic Partners Mid Cap Value Fund was subadvised by Neuberger Berman Management, Inc. Its Class A shares had a total return of 16.74% compared with returns of 17.65% for the S&P MidCap 400 Index and 19.50% for the Russell Midcap Value Index. It outperformed the Lipper Mid-Cap Value Funds Average (+14.51%).
During this reporting period, there were significant management changes at the Fund. Its portfolio managers left Neuberger Berman Management in June 2005 and their responsibilities were assumed by another Neuberger Berman portfolio manager. The change didn’t appear to hurt the Fund, whose strongest performance relative to both the S&P MidCap 400 and Russell Midcap Value Indexes came in August.
The Fund trailed the style-appropriate Russell Midcap Value Index primarily because of stock selection, particularly among retailers and insurers. The largest detractors from its relative performance included the automobile parts supplier Lear Corporation (which was sold from the portfolio by period-end), the computer printer company Lexmark International, and the nutritional supplement firm NBTY (whose brand names include Nature’s Bounty and Sundown). The Fund is managed in a bottom-up style, which means that any exposure to various risk factors is the result of decisions made about individual securities. We normally expect stock selection to be the primary driver of the Fund’s relative performance.
The Fund’s holdings performed better than the Russell MidCap Value Index in the healthcare and consumer staples sectors. In addition, it had a greater-than-Index weighting in the healthcare sector, which had an above-average return, and a below-Index weighting in the underperforming basic materials sector. These beneficial sector emphases were partially offset by the Fund’s substantial overweighting in the poor-performing consumer cyclical sector and underweightings in the better-performing utility and financials sectors.
Your Fund’s Performance
Strategic Partners Technology Fund
Fund objective
The investment objective of the Strategic Partners Technology Fund is to seek capital growth by investing primarily in the equity securities of companies engaged in technology-related industries. There can be no assurance that the Fund will achieve its investment objective.
Performance data quoted represent past performance. Past performance does not guarantee future results. The investment return and principal value of an investment will fluctuate, so that an investor’s shares, when redeemed, may be worth more or less than their original cost. Current performance may be lower or higher than the past performance data quoted. An investor may obtain performance data as of the most recent month-end by visiting our website at www.strategicpartners.com or by calling (800) 225-1852. Class A and Class L shares have a maximum initial sales charge of 5.50% and 5.75% respectively. Class L shares are closed to most new purchases (with the exception of reinvested dividends and purchases by certain college savings plans).
| | | | | | | | | |
| Cumulative Total Returns1 as of 10/31/05 | | | | | | | | | |
| | | One Year | | | Five Years | | | Since Inception2 | |
Class A3 | | 4.14 | % | | N/A | | | –4.48 | % |
Class B4 | | 3.10 | | | N/A | | | –5.67 | |
Class C | | 3.48 | | | –71.06 | % | | –73.20 | |
Class L3 | | 3.76 | | | –70.18 | | | –72.36 | |
Class M4 | | 3.49 | | | –71.14 | | | –73.30 | |
Class X | | 3.08 | | | –71.03 | | | –73.20 | |
S&P 500 Index5 | | 8.72 | | | –8.38 | | | * | |
Lipper Science & Technology Funds Avg.5 | | 8.47 | | | –54.26 | | | ** | |
| | | | | | | | | | |
| Average Annual Total Returns1 as of 9/30/05 | | | | | | | | | |
| | | One Year | | | Five Years | | | Since Inception2 | |
Class A3 | | 4.51 | % | | N/A | | | –6.52 | % |
Class B4 | | 4.88 | | | N/A | | | –6.28 | |
Class C | | 8.84 | | | –23.32 | % | | –22.94 | |
Class L3 | | 4.15 | | | –23.77 | | | –23.37 | |
Class M4 | | 3.88 | | | –23.69 | | | –23.31 | |
Class X | | 3.80 | | | –23.73 | | | –23.20 | |
S&P 500 Index5 | | 12.25 | | | –1.49 | | | * | |
Lipper Science & Technology Funds Avg.5 | | 17.40 | | | –17.17 | | | ** | |
The cumulative total returns do not reflect the deduction of applicable sales charges. If reflected, the applicable sales charges would reduce the cumulative total return performance quoted. Class A and Class L shares are subject to a maximum front-end sales charge of 5.50% and 5.75% respectively. Class L shares are closed to most new purchases (with the exception of reinvested dividends and purchases by certain college savings plans). Class M shares are also closed to most new purchases (with the exception of reinvested dividends). Class L, Class M, and Class X shares are only exchangeable with Class L, Class M, and Class X shares, respectively, offered by the other Strategic Partners Funds. Under certain circumstances, Class A and Class L shares may be subject to a contingent deferred sales charge (CDSC) of 1%. Class B, Class C, Class M, and Class X shares are subject to a maximum CDSC of 5%, 1%, 6%, and 6% respectively.
1Source: Prudential Investments LLC and Lipper Inc. The average annual total returns do take into account applicable sales charges. The returns in the tables do not reflect the deduction of taxes that a shareholder would pay on Fund distributions or following the redemption of Fund shares. During certain periods shown, fee waivers and/or expense reimbursements were in effect. Without such fee waivers and/or expense reimbursements, the returns for the share classes would have been lower. Without a distribution and service (12b-1) fee waiver of 0.05% for Class A shares, the returns would have been lower. Class A shares are subject to a 12b-1 fee of up to 0.30% annually. Class B, Class C, Class M, and Class X shares are subject to a 12b-1 fee of 1.00%. Class L shares are subject to a 12b-1 fee of 0.50%.
2Inception dates: Class A and Class B, 4/12/04; Class C, Class L, Class M, and Class X, 9/11/00.
3Prior to April 12, 2004, Class L shares were known as Class A shares. On April 12, 2004, Class A shares were redesignated as Class L shares and a new Class A was opened.
4Prior to April 12, 2004, Class M shares were known as Class B shares. On April 12, 2004, Class B shares were redesignated as Class M shares and a new Class B was opened.
5See page 1 for a summary of definitions for the Fund’s benchmarks.
*S&P 500 Index Closest Month-End to Inception cumulative total returns as of 10/31/05 are 10.17% for Class A and Class B; and –13.58% for Class C, Class L, Class M, and Class X. S&P 500 Index Closest Month-End to Inception average annual total returns as of 9/30/05 are 7.88% for Class A and Class B; and –2.51% for Class C, Class L, Class M, and Class X.
**Lipper Science & Technology Funds Average Closest Month-End to Inception cumulative total returns as of 10/31/05 are 2.21% for Class A and Class B; and –62.75% for Class C, Class L, Class M, and Class X. Lipper Science & Technology Funds Average Closest Month-End to Inception average annual total returns as of 9/30/05 are 2.79% for Class A and Class B; and –18.76% for Class C, Class L, Class M, and Class X.
| | | |
| Five Largest Holdings expressed as a percentage of net assets as of 10/31/05 | | | |
Google, Inc. (Class A Shares), Internet Services | | 4.3 | % |
Apple Computer, Inc., Computer Hardware | | 3.9 | |
Adobe Systems, Inc., Computer Services & Software | | 3.8 | |
Yahoo!, Inc., Internet Services | | 3.4 | |
Motorola, Inc., Telecommunications | | 3.4 | |
Holdings reflect only long-term investments and are subject to change.
Fund Manager’s Report
For the fiscal year ended October 31, 2005, the Strategic Partners Technology Fund was subadvised by The Dreyfus Corporation. Its Class A shares had a total return of 4.14% compared with the 8.72% return of the S&P 500 Index and 6.1% for the S&P SuperComposite Information Technology Index. It trailed the Lipper Science & Technology funds Average (+8.47%).
The Fund’s underperformance of the sector-appropriate S&P SuperComposite Information Technology Index during this period was primarily attributable to poor stock selection within the information technology sector, where its relative performance was hurt by a decision not to hold Hewlett-Packard or Apple Computer. These stocks performed extremely well. Overweights compared to the S&P Supercomposite Information Technology Index in Anaya and Xilinx also detracted significantly. On the positive side, overweights in Corning and Marvell Technology Group were among the Fund’s strongest performers, and the Fund also benefited from not having a position in International Business Machines, whose stock declined.
The Fund typically invests a significant amount in technology-oriented firms that are classified in other sectors, such as the consumer discretionary stocks eBay (Internet retail) and Apollo Group (education, including on-line and technical training). The consumer discretionary positions significantly detracted from the Fund’s performance. Overall, however, the Fund’s holdings outside the information technology sector, particularly in healthcare technology, helped its performance. Positions in Amgen, Genentech, and Teva Pharmaceutical Industries performed strongly.
Your Fund’s Performance
Strategic Partners Health Sciences Fund
Fund objective
The investment objective of the Strategic Partners Health Sciences Fund is to seek growth. There can be no assurance that the Fund will achieve its investment objective.
Performance data quoted represent past performance. Past performance does not guarantee future results. The investment return and principal value of an investment will fluctuate, so that an investor’s shares, when redeemed, may be worth more or less than their original cost. Current performance may be lower or higher than the past performance data quoted. An investor may obtain performance data as of the most recent month-end by visiting our website at www.strategicpartners.com or by calling (800) 225-1852. Class A and Class L shares have a maximum initial sales charge of 5.50% and 5.75% respectively. Class L shares are closed to most new purchases (with the exception of reinvested dividends and purchases by certain college savings plans).
| | | | | | |
| Cumulative Total Returns1 as of 10/31/05 | | | | | | |
| | | One Year | | | Since Inception2 | |
Class A3 | | 13.04 | % | | 4.92 | % |
Class B4 | | 12.23 | | | 3.56 | |
Class C | | 12.10 | | | 22.30 | |
Class L3 | | 12.62 | | | 24.90 | |
Class M4 | | 12.12 | | | 22.10 | |
Class X | | 12.09 | | | 22.40 | |
S&P 500 Index5 | | 8.72 | | | * | |
Lipper Health/Biotechnology Funds Avg.5 | | 15.03 | | | ** | |
| | | | | | |
| | | | | | | |
| Average Annual Total Returns1 as of 9/30/05 | | | | | | |
| | | One Year | | | Since Inception2 | |
Class A3 | | 8.07 | % | | 0.96 | % |
Class B4 | | 8.43 | | | 1.37 | |
Class C | | 12.39 | | | 4.82 | |
Class L3 | | 7.30 | | | 4.16 | |
Class M4 | | 7.33 | | | 4.62 | |
Class X | | 7.29 | | | 4.49 | |
S&P 500 Index5 | | 12.25 | | | * | |
Lipper Health/Biotechnology Funds Avg.5 | | 15.79 | | | ** | |
The cumulative total returns do not reflect the deduction of applicable sales charges. If reflected, the applicable sales charges would reduce the cumulative total return performance quoted. Class A and Class L shares are subject to a maximum front-end sales charge of 5.50% and 5.75% respectively. Class L shares are closed to most new purchases (with the exception of reinvested dividends and purchases by certain college savings plans). Class M shares are also closed to most new purchases (with the exception of reinvested dividends). Class L, Class M, and Class X shares are only exchangeable with Class L, Class M, and Class X shares, respectively, offered by the other Strategic Partners Funds. Under certain circumstances, Class A and Class L shares may be subject to a contingent deferred sales charge (CDSC) of 1%. Class B, Class C, Class M, and Class X shares are subject to a maximum CDSC of 5%, 1%, 6%, and 6% respectively.
1Source: Prudential Investments LLC and Lipper Inc. The average annual total returns do take into account applicable sales charges. The returns in the tables do not reflect the deduction of taxes that a shareholder would pay on Fund distributions or following the redemption of Fund shares. During certain periods shown, fee waivers and/or expense reimbursements were in effect. Without such fee waivers and/or expense reimbursements, the returns for the share classes would have been lower. Without a distribution and service (12b-1) fee waiver of 0.05% for Class A shares, the returns would have been lower. Class A shares are subject to a 12b-1 fee of up to 0.30% annually. Class B, Class C, Class M, and Class X shares are subject to a 12b-1 fee of 1.00%. Class L shares are subject to a 12b-1 fee of 0.50%.
2Inception dates: Class A and Class B, 4/12/04; Class C, Class L, Class M, and Class X, 3/1/01.
3Prior to April 12, 2004, Class L shares were known as Class A shares. On April 12, 2004, Class A shares were redesignated as Class L shares and a new Class A was opened.
4Prior to April 12, 2004, Class M shares were known as Class B shares. On April 12, 2004, Class B shares were redesignated as Class M shares and a new Class B was opened.
5See page 1 for a summary of definitions for the Fund’s benchmarks.
*S&P 500 Index Closest Month-End to Inception cumulative total returns as of 10/31/05 are 10.17% for Class A and Class B; and 5.17% for Class C, Class L, Class M, and Class X. S&P 500 Index Closest Month-End to Inception average annual total returns as of 9/30/05 are 12.04% for Class A and Class B; and 6.95% for Class C, Class L, Class M, and Class X.
**Lipper Health/Biotechnology Funds Average Closest Month-End to Inception cumulative total returns as of 10/31/05 are 9.58% for Class A and Class B; and 10.68% for Class C, Class L, Class M, and Class X. Lipper Health/Biotechnology Funds Average Closest Month-End to Inception average annual total returns as of 9/30/05 are 7.97% for Class A and Class B; and 2.16% for Class C, Class L, Class M, and Class X.
| | | |
| Five Largest Holdings expressed as a percentage of net assets as of 10/31/05 | | | |
Roche Holding AG, Pharmaceuticals | | 8.0 | % |
Protein Design Labs, Inc., Biotechnology Healthcare | | 4.3 | |
St. Jude Medical, Inc., Medical Equipment & Devices | | 3.7 | |
Amgen, Inc., Biotechnology Healthcare | | 3.7 | |
Eisai Co. Ltd., Medical Supplies & Equipment | | 3.3 | |
Holdings reflect only long-term investments and are subject to change.
Fund Manager’s Report
For the fiscal year ended October 31, 2005, the Strategic Partners Health Sciences Fund was subadvised by INVESCO Institutional (N.A.), Inc. Its Class A shares had a total return of 13.04% compared with the 8.72% return of the S&P 500 Index and 12.23% return of the S&P SuperComposite Health Care Index. The Fund trailed the Lipper Health/Biotechnology Funds Average (+15.03%).
The Fund outperformed the sector-appropriate S&P SuperComposite Health Care Index primarily because of good stock selection. In particular, in the pharmaceutical industry, the Fund had substantial underexposure to the large drug companies Merck (–5.16%) and Pfizer (–24.51%), which were hurt by drug recalls, product liability problems, and other negative factors. Its largest holding at period-end was Roche (+45.81%). The Fund also had significant positions in Eisai (+35.14%) and Amgen (+35.84%).
However, it was a position in health services company PacifiCare Health Systems (+131.09%) that made the largest contribution to the Fund’s total return. In fact, the health services industry generally performed very strongly over this reporting period. Although the Fund’s holdings in the sector also did well, the fact that it did not emphasize the sector limited the benefit of the rally.
The Fund’s mix of established and less-established but more rapidly growing firms generally worked well. Some of the top contributors to its performance were biotechnology and medical device companies, but positions in more established firms also helped results.
Your Fund’s Performance
Strategic Partners Managed OTC Fund
Fund objective
The investment objective of the Strategic Partners Managed OTC Fund is to provide investment results that correlate to the performance of a benchmark for securities that are traded in the over-the-counter market. The Fund’s current benchmark is a multiple of the NASDAQ-100 Index. There can be no assurance that the Fund will achieve its investment objective.
Performance data quoted represent past performance. Past performance does not guarantee future results. The investment return and principal value of an investment will fluctuate, so that an investor’s shares, when redeemed, may be worth more or less than their original cost. Current performance may be lower or higher than the past performance data quoted. An investor may obtain performance data as of the most recent month-end by visiting our website at www.strategicpartners.com or by calling (800) 225-1852. Class A and Class L shares have a maximum initial sales charge of 5.50% and 5.75% respectively. Class L shares are closed to most new purchases (with the exception of reinvested dividends and purchases by certain college savings plans).
| | | | | | | | | |
| Cumulative Total Returns1 as of 10/31/05 | | | | | | | | | |
| | | One Year | | | Five Years | | | Since Inception2 | |
Class A3 | | 5.47 | % | | N/A | | | 4.65 | % |
Class B4 | | 4.80 | | | N/A | | | 2.75 | |
Class C | | 4.80 | | | –68.09 | % | | –73.80 | |
Class L3 | | 5.10 | | | –67.40 | | | –73.20 | |
Class M4 | | 4.78 | | | –68.01 | | | –73.70 | |
Class X | | 4.78 | | | –67.97 | | | –73.70 | |
NASDAQ-100 Index5 | | 6.22 | | | –51.89 | | | * | |
Lipper Multi-Cap Growth Funds Avg.5 | | 12.95 | | | –26.01 | | | ** | |
| | | | | | | | | | |
| Average Annual Total Returns1 as of 9/30/05 | | | | | | | | | |
| | | One Year | | | Five Years | | | Since Inception2 | |
Class A3 | | 8.66 | % | | N/A | | | 0.75 | % |
Class B4 | | 8.56 | | | N/A | | | 0.75 | |
Class C | | 12.56 | | | –22.52 | % | | –22.94 | |
Class L3 | | 7.87 | | | –23.10 | | | –23.51 | |
Class M4 | | 7.98 | | | –22.79 | | | –23.20 | |
Class X | | 7.98 | | | –22.94 | | | –23.20 | |
NASDAQ-100 Index5 | | 13.37 | | | –14.81 | | | * | |
Lipper Multi-Cap Growth Funds Avg.5 | | 17.74 | | | –7.89 | | | ** | |
The cumulative total returns do not reflect the deduction of applicable sales charges. If reflected, the applicable sales charges would reduce the cumulative total return performance quoted. Class A and Class L shares are subject to a maximum front-end sales charge of 5.50% and 5.75% respectively. Class L shares are closed to most new purchases (with the exception of reinvested dividends and purchases by certain college savings plans). Class M shares are also closed to most new purchases (with the exception of reinvested dividends). Class L, Class M, and Class X shares are only exchangeable with Class L, Class M, and Class X shares, respectively, offered by the other Strategic Partners Funds. Under certain circumstances, Class A and Class L shares may be subject to a contingent deferred sales charge (CDSC) of 1%. Class B, Class C, Class M, and Class X shares are subject to a maximum CDSC of 5%, 1%, 6%, and 6% respectively.
1Source: Prudential Investments LLC and Lipper Inc. The average annual total returns do take into account applicable sales charges. The returns in the tables do not reflect the deduction of taxes that a shareholder would pay on Fund distributions or following the redemption of Fund shares. During certain periods shown, fee waivers and/or expense reimbursements were in effect. Without such fee waivers and/or expense reimbursements, the returns for the share classes would have been lower. Without a distribution and service (12b-1) fee waiver of 0.05% for Class A shares, the returns would have been lower. Class A shares are subject to a 12b-1 fee of up to 0.30% annually. Class B, Class C, Class M, and Class X shares are subject to a 12b-1 fee of 1.00%. Class L shares are subject to a 12b-1 fee of 0.50%.
2Inception dates: Class A and Class B, 4/12/04; Class C, Class L, Class M, and Class X, 9/11/00.
3Prior to April 12, 2004, Class L shares were known as Class A shares. On April 12, 2004, Class A shares were redesignated as Class L shares and a new Class A was opened.
4Prior to April 12, 2004, Class M shares were known as Class B shares. On April 12, 2004, Class B shares were redesignated as Class M shares and a new Class B was opened.
5See page 1 for a summary of definitions for the Fund’s benchmarks.
*NASDAQ-100 Index Closest Month-End to Inception cumulative total returns as of 10/31/05 are 9.79% for Class A and Class B; and –61.27% for Class C, Class L, Class M, and Class X. NASDAQ–100 Index Closest Month-End to Inception average annual total returns as of 9/30/05 are 7.43% for Class A and Class B; and –16.79% for Class C, Class L, Class M, and Class X.
**Lipper Multi-Cap Growth Funds Average Closest Month-End to Inception cumulative total returns as of 10/31/05 are 11.38% for Class A and Class B; and –33.51% for Class C, Class L, Class M, and Class X. Lipper Multi-Cap Growth Funds Average Closest Month-End to Inception average annual total returns as of 9/30/05 are 8.61% for Class A and Class B; and –8.59% for Class C, Class L, Class M, and Class X.
| | | |
| Five Largest Holdings expressed as a percentage of net assets as of 10/31/05 | | | |
Microsoft Corp., Software | | 6.9 | % |
QUALCOMM Inc., Telecommunications | | 5.7 | |
Apple Computer, Inc., Computer | | 4.8 | |
Intel Corp., Semiconductors | | 3.6 | |
Cisco Systems, Inc., Telecommunications | | 2.9 | |
Holdings reflect only long-term investments and are subject to change.
Fund Manager’s Report
For the fiscal year ended October 31, 2005, the Strategic Partners Managed OTC Fund was subadvised by ProFund Advisors LLC. Its Class A shares had a total return of 5.47% compared with a return of 6.22% for the NASDAQ-100 Index. It trailed the Lipper Multi-Cap Growth Funds Average (+12.95%).
The NASDAQ-100 Index is an unmanaged index that includes 100 of the largest (based on market capitalization) and most active non-financial domestic and international companies listed on the NASDAQ Stock Market. It includes major industry groups such as computer hardware and software, telecommunications, retail/wholesale trade, and biotechnology. It does not contain financial companies, including investment companies. The Fund is managed with a passive approach, not speculating on the future direction of the overall NASDAQ-100 Index or of any of the companies included in it. Leveraged investment techniques (investing borrowed money) give the Fund approximately 125% exposure to the Index every day.
The Fund benefited from a favorable market environment in November and December 2004, helped by its inherent leveraged exposure. During these months gains were led by the diversified consumer services, hotels, and Internet services industries. However, when the NASDAQ-100 Index performed poorly, primarily in January through April 2005, the Fund trailed the Index. The decline was concentrated in the same industries that had led during the rally. The Fund underperformed the NASDAQ-100 because the Index rose rapidly for only a short period compared with a longer period of decline.
Your Fund’s Performance
Strategic Partners Capital Growth Fund
Fund objective
The investment objective of the Strategic Partners Capital Growth Fund is to seek capital growth. There can be no assurance that the Fund will achieve its investment objective.
Performance data quoted represent past performance. Past performance does not guarantee future results. The investment return and principal value of an investment will fluctuate, so that an investor’s shares, when redeemed, may be worth more or less than their original cost. Current performance may be lower or higher than the past performance data quoted. An investor may obtain performance data as of the most recent month-end by visiting our website at www.strategicpartners.com or by calling (800) 225-1852. Class A and Class L shares have a maximum initial sales charge of 5.50% and 5.75% respectively. Class L shares are closed to most new purchases (with the exception of reinvested dividends and purchases by certain college savings plans).
| | | | | | | | | |
| Cumulative Total Returns1 as of 10/31/05 | | | | | | | | | |
| | | One Year | | | Five Years | | | Since Inception2 | |
Class A3 | | 13.69 | % | | N/A | | | 12.02 | % |
Class B4 | | 12.84 | | | N/A | | | 10.71 | |
Class C | | 12.87 | | | –7.10 | % | | 46.50 | |
Class L3 | | 13.36 | | | –4.77 | | | 52.02 | |
Class M4 | | 12.77 | | | –7.22 | | | 46.60 | |
Class X | | 12.88 | | | –7.11 | | | 46.40 | |
S&P 500 Index5 | | 8.72 | | | –8.38 | | | * | |
Lipper Large-Cap Growth Funds Avg.5 | | 10.06 | | | –29.90 | | | ** | |
| | | | | | | | | | |
| Average Annual Total Returns1 as of 9/30/05 | | | | | | | | | |
| | | One Year | | | Five Years | | | Since Inception2 | |
Class A3 | | 8.26 | % | | N/A | | | 4.84 | % |
Class B4 | | 8.69 | | | N/A | | | 5.46 | |
Class C | | 12.72 | | | –2.81 | % | | 5.56 | |
Class L3 | | 7.70 | | | –3.26 | | | 5.38 | |
Class M4 | | 7.70 | | | –3.00 | | | 5.72 | |
Class X | | 7.73 | | | –3.21 | | | 5.59 | |
S&P 500 Index5 | | 12.25 | | | –1.49 | | | * | |
Lipper Large-Cap Growth Funds Avg.5 | | 12.55 | | | –7.83 | | | ** | |
The cumulative total returns do not reflect the deduction of applicable sales charges. If reflected, the applicable sales charges would reduce the cumulative total return performance quoted. Class A and Class L shares are subject to a maximum front-end sales charge of 5.50% and 5.75% respectively. Class L shares are closed to most new purchases (with the exception of reinvested dividends and purchases by certain college savings plans). Class M shares are also closed to most new purchases (with the exception of reinvested dividends). Class L, Class M, and Class X shares are only exchangeable with Class L, Class M, and Class X shares, respectively, offered by the other Strategic Partners Funds. Under certain circumstances, Class A and Class L shares may be subject to a contingent deferred sales charge (CDSC) of 1%. Class B, Class C, Class M, and Class X shares are subject to a maximum CDSC of 5%, 1%, 6%, and 6% respectively.
1Source: Prudential Investments LLC and Lipper Inc. The average annual total returns do take into account applicable sales charges. The returns in the tables do not reflect the deduction of taxes that a shareholder would pay on Fund distributions or following the redemption of Fund shares. During certain periods shown, fee waivers and/or expense reimbursements were in effect. Without such fee waivers and/or expense reimbursements, the returns for the share classes would have been lower. Without a distribution and service (12b-1) fee waiver of 0.05% for Class A shares, the returns would have been lower. Class A shares are subject to a 12b-1 fee of up to 0.30% annually. Class B, Class C, Class M, and Class X shares are subject to a 12b-1 fee of 1.00%. Class L shares are subject to a 12b-1 fee of 0.50%.
2Inception dates: Class A and Class B, 4/12/04; Class C, Class L, Class M, and Class X, 8/19/98.
3Prior to April 12, 2004, Class L shares were known as Class A shares. On April 12, 2004, Class A shares were redesignated as Class L shares and a new Class A was opened.
4Prior to April 12, 2004, Class M shares were known as Class B shares. On April 12, 2004, Class B shares were redesignated as Class M shares and a new Class B was opened.
5See page 1 for a summary of definitions for the Fund’s benchmarks.
*S&P 500 Index Closest Month-End to Inception cumulative total returns as of 10/31/05 are 10.17% for Class A and Class B; and 40.52% for Class C, Class L, Class M, and Class X. S&P 500 Index Closest Month-End to Inception average annual total returns as of 9/30/05 are 7.88% for Class A and Class B; and 5.17% for Class C, Class L, Class M, and Class X.
**Lipper Large-Cap Growth Funds Average Closest Month-End to Inception cumulative total returns as of 10/31/05 are 7.84% for Class A and Class B; and 27.23% for Class C, Class L, Class M, and Class X. Lipper Large-Cap Growth Funds Average Closest Month-End to Inception average annual total returns as of 9/30/05 are 5.70% for Class A and Class B; and 3.29% for Class C, Class L, Class M, and Class X.
| | | |
| Five Largest Holdings expressed as a percentage of net assets as of 10/31/05 | | | |
UnitedHealth Group, Inc., Healthcare Services | | 8.7 | % |
Genentech, Inc., Pharmaceuticals | | 7.9 | |
Procter & Gamble Co., Consumer Products & Services | | 4.6 | |
FedEx Corp., Transportation | | 4.2 | |
Lowe’s Cos., Inc., Retail & Merchandising | | 4.1 | |
Holdings reflect only long-term investments and are subject to change.
Fund Manager’s Report
For the fiscal year ended October 31, 2005, the Strategic Partners Capital Growth Fund was subadvised by Marsico Capital Management, LLC. Its Class A shares had a total return of 13.69%, significantly above the returns of 8.72% for the S&P 500 Index and 8.81% for the Russell 1000 Growth Index. It also outperformed the Lipper Large-Cap Growth Fund Average (+10.06%).
The Fund’s strong performance relative to the style-appropriate Russell 1000 Growth Index was primarily attributable to its selection of stocks within sectors and to its relative weightings of sectors as compared with the Index. It benefited somewhat less from certain momentum characteristics, which paid off during the current reporting period. In particular, the Fund’s holdings had, on average, greater strength in underlying business fundamentals than average for the Russell 1000 Growth Index. Their share prices also had more upward momentum. Such stocks had better-than-average returns.
Two of the Fund’s largest positions, Genentech and UnitedHealth Group, both in the health care sector, were among the largest contributors to its relative return. Genentech, a biotechnology firm, benefited from several unexpected positive developments with regard to its cancer treatments, which drove its share price up.
The Fund benefited from emphases on the medical services, construction & real property, and biotechnology industries, as well as from de-emphases on the semiconductors, computer hardware, and media industries. These advantages were partially offset by its underprepresentation in the very strong energy sector. Its subadviser, Marsico Capital Management, places a heavy emphasis on its individual stock selection and felt that it could add more value in sectors that were currently less popular and less expensive. This turned out to be the case.
Your Fund’s Performance
Strategic Partners Concentrated Growth Fund
Fund objective
The investment objective of the Strategic Partners Concentrated Growth Fund is to seek growth of capital. There can be no assurance that the Fund will achieve its investment objective.
Performance data quoted represent past performance. Past performance does not guarantee future results. The investment return and principal value of an investment will fluctuate, so that an investor’s shares, when redeemed, may be worth more or less than their original cost. Current performance may be lower or higher than the past performance data quoted. An investor may obtain performance data as of the most recent month-end by visiting our website at www.strategicpartners.com or by calling (800) 225-1852. Class A and Class L shares have a maximum initial sales charge of 5.50% and 5.75% respectively. Class L shares are closed to most new purchases (with the exception of reinvested dividends and purchases by certain college savings plans).
| | | | | | | | | |
| Cumulative Total Returns1 as of 10/31/05 | | | | | | | | | |
| | | One Year | | | Five Years | | | Since Inception2 | |
Class A3 | | 4.91 | % | | N/A | | | 1.03 | % |
Class B4 | | 4.14 | | | N/A | | | –0.40 | |
Class C | | 4.15 | | | –50.05 | % | | 0.48 | |
Class L3 | | 4.66 | | | –48.73 | | | 4.86 | |
Class M4 | | 4.14 | | | –50.00 | | | 0.78 | |
Class X | | 4.13 | | | –50.02 | | | 0.88 | |
S&P 500 Index5 | | 8.72 | | | –8.38 | | | * | |
Lipper Large-Cap Growth Funds Avg.5 | | 10.06 | | | –29.90 | | | ** | |
| | | | | | | | | | |
| Average Annual Total Returns1 as of 9/30/05 | | | | | | | | | |
| | | One Year | | | Five Years | | | Since Inception2 | |
Class A3 | | 3.31 | % | | N/A | | | –2.39 | % |
Class B4 | | 3.53 | | | N/A | | | –2.19 | |
Class C | | 7.55 | | | –13.57 | % | | 0.20 | |
Class L3 | | 2.78 | | | –14.15 | | | 0.09 | |
Class M4 | | 2.52 | | | –13.90 | | | 0.24 | |
Class X | | 2.51 | | | –14.09 | | | 0.25 | |
S&P 500 Index5 | | 12.25 | | | –1.49 | | | * | |
Lipper Large-Cap Growth Funds Avg.5 | | 12.55 | | | –7.83 | | | ** | |
The cumulative total returns do not reflect the deduction of applicable sales charges. If reflected, the applicable sales charges would reduce the cumulative total return performance quoted. Class A and Class L shares are subject to a maximum front-end sales charge of 5.50% and 5.75% respectively. Class L shares are closed to most new purchases (with the exception of reinvested dividends and purchases by certain college savings plans). Class M shares are also closed to most new purchases (with the exception of reinvested dividends). Class L, Class M, and Class X shares are only exchangeable with Class L, Class M, and Class X shares, respectively, offered by the other Strategic Partners Funds. Under certain circumstances, Class A and Class L shares may be subject to a contingent deferred sales charge (CDSC) of 1%. Class B, Class C, Class M, and Class X shares are subject to a maximum CDSC of 5%, 1%, 6%, and 6% respectively.
1Source: Prudential Investments LLC and Lipper Inc. The average annual total returns do take into account applicable sales charges. The returns in the tables do not reflect the deduction of taxes that a shareholder would pay on Fund distributions or following the redemption of Fund shares. During certain periods shown, fee waivers and/or expense reimbursements were in effect. Without such fee waivers and/or expense reimbursements, the returns for the share classes would have been lower. Without a distribution and service (12b-1) fee waiver of 0.05% for Class A shares, the returns would have been lower. Class A shares are subject to a 12b-1 fee of up to 0.30% annually. Class B, Class C, Class M, and Class X shares are subject to a 12b-1 fee of 1.00%. Class L shares are subject to a 12b-1 fee of 0.50%.
2Inception dates: Class A and Class B, 4/12/04; Class C, Class L, Class M, and Class X, 7/28/97.
3Prior to April 12, 2004, Class L shares were known as Class A shares. On April 12, 2004, Class A shares were redesignated as Class L shares and a new Class A was opened.
4Prior to April 12, 2004, Class M shares were known as Class B shares. On April 12, 2004, Class B shares were redesignated as Class M shares and a new Class B was opened.
5See page 1 for a summary of definitions for the Fund’s benchmarks.
*S&P 500 Index Closest Month-End to inception cumulative total returns as of 10/31/05 are 10.17% for Class A and Class B; and 43.43% for Class C, Class L, Class M, and Class X. S&P 500 Index Closest Month-End to Inception average annual total returns as of 9/30/05 are 7.88% for Class A and Class B; and 4.73% for Class C, Class L, Class M, and Class X.
**Lipper Large-Cap Growth Funds Average Closest Month-End to Inception cumulative total returns as of 10/31/05 are 7.84% for Class A and Class B; and 25.36% for Class C, Class L, Class M, and Class X. Lipper Large-Cap Growth Funds Average Closest Month-End to Inception average annual total returns as of 9/30/05 are 5.70% for Class A and Class B; and 2.71% for Class C, Class L, Class M, and Class X.
| | | |
| Five Largest Holdings expressed as a percentage of net assets as of 10/31/05 | | | |
Freddie Mac, Financials | | 7.2 | % |
McGraw-Hill Cos., Inc., Commercial Services | | 6.1 | |
Schlumberger Ltd., Networking/Telecom Equipment | | 5.5 | |
First Data Corp., Computer Services & Software | | 5.4 | |
Microsoft Corp., Computer Services & Software | | 5.2 | |
Holdings reflect only long-term investments and are subject to change.
Fund Manager’s Report
For the fiscal year ended October 31, 2005, the Strategic Partners Concentrated Growth Fund was subadvised by Goldman Sachs Asset Management, L.P. Its Class A shares had a total return of 4.91% compared with returns of 8.72% for the S&P 500 Index and 8.81% for the Russell 1000 Growth Index. It trailed the Lipper Large-Cap Growth Funds Average (+10.06%).
The Fund’s underperformance of the Russell 1000 Growth Index was largely due to its significant overweight in the consumer services sector, primarily in media stocks. The Fund’s concentrated style (approximately 30 to 45 stocks) leads to heavy commitments, and its investment style has tended in recent years to favor media and leisure stocks because of their attractive growth, free cash flow, and valuation trends. During this reporting period, however, these industries were among the market’s poorest performers.
Independent of industry focuses, stock selection did not add significant value as the contributions of overperformers were almost offset by underperformers. The Fund had attractive gains on positions in companies such as Pepsico and McGrawHill Publishing, but losses on positions in Cendant and Viacom.
However, several of the portfolio’s aggregate risk characteristics helped improve the Fund’s performance. For example, the manager added technology stocks throughout 2005. The technology sector tends to move with the overall market, but with a larger swing. By the time of the sharp market upswing in May through August, the additional technology exposure had made the overall Fund more sensitive to broad market movements than its benchmark. This benefited its return. Likewise, less overall exposure to stocks with higher-than-average dividend yields and greater exposure to stocks with conservative valuations (share prices in comparison to measures of enterprise value such as earnings and net assets) proved beneficial. These latter characteristics are typical of the manager’s long-term investment style.
Your Fund’s Performance
Strategic Partners Core Value Fund
Fund objective
The investment objective of the Strategic Partners Core Value Fund is to seek long-term capital growth. There can be no assurance that the Fund will achieve its investment objective.
Performance data quoted represent past performance. Past performance does not guarantee future results. The investment return and principal value of an investment will fluctuate, so that an investor’s shares, when redeemed, may be worth more or less than their original cost. Current performance may be lower or higher than the past performance data quoted. An investor may obtain performance data as of the most recent month-end by visiting our website at www.strategicpartners.com or by calling (800) 225-1852. Class A and Class L shares have a maximum initial sales charge of 5.50% and 5.75% respectively. Class L shares are closed to most new purchases (with the exception of reinvested dividends and purchases by certain college savings plans).
| | | | | | |
| Cumulative Total Returns1 as of 10/31/05 | | | | | | |
| | | One Year | | | Since Inception2 | |
Class A3 | | 9.09 | % | | 10.44 | % |
Class B4 | | 8.28 | | | 9.18 | |
Class C | | 8.25 | | | 33.03 | |
Class L3 | | 8.74 | | | 36.10 | |
Class M4 | | 8.31 | | | 33.12 | |
Class X | | 8.33 | | | 33.13 | |
S&P 500 Index5 | | 8.72 | | | * | |
Lipper Multi-Cap Value Funds Avg.5 | | 11.02 | | | ** | |
| | | | | | | |
| Average Annual Total Returns1 as of 9/30/05 | | | | | | |
| | | One Year | | | Since Inception2 | |
Class A3 | | 7.49 | % | | 4.81 | % |
Class B4 | | 7.88 | | | 5.52 | |
Class C | | 11.76 | | | 6.82 | |
Class L3 | | 6.72 | | | 6.20 | |
Class M4 | | 6.74 | | | 6.72 | |
Class X | | 6.84 | | | 6.55 | |
S&P 500 Index5 | | 12.25 | | | * | |
Lipper Multi-Cap Value Funds Avg.5 | | 15.12 | | | ** | |
The cumulative total returns do not reflect the deduction of applicable sales charges. If reflected, the applicable sales charges would reduce the cumulative total return performance quoted. Class A and Class L shares are subject to a maximum front-end sales charge of 5.50% and 5.75% respectively. Class L shares are closed to most new purchases (with the exception of reinvested dividends and purchases by certain college savings plans). Class M shares are also closed to most new purchases (with the exception of reinvested dividends). Class L, Class M, and Class X shares are only exchangeable with Class L, Class M, and Class X shares, respectively, offered by the other Strategic Partners Funds. Under certain circumstances, Class A and Class L shares may be subject to a contingent deferred sales charge (CDSC) of 1%. Class B, Class C, Class M, and Class X shares are subject to a maximum CDSC of 5%, 1%, 6%, and 6% respectively.
1Source: Prudential Investments LLC and Lipper Inc. The average annual total returns do take into account applicable sales charges. The returns in the tables do not reflect the deduction of taxes that a shareholder would pay on Fund distributions or following the redemption of Fund shares. During certain periods shown, fee waivers and/or expense reimbursements were in effect. Without such fee waivers and/or expense reimbursements, the returns for the share classes would have been lower. Without a distribution and service (12b-1) fee waiver of 0.05% for Class A shares, the returns would have been lower. Class A shares are subject to a 12b-1 fee of up to 0.30% annually. Class B, Class C, Class M, and Class X shares are subject to a 12b-1 fee of 1.00%. Class L shares are subject to a 12b-1 fee of 0.50%.
2Inception dates: Class A and Class B, 4/12/04; Class C, Class L, Class M, and Class X, 3/1/01.
3Prior to April 12, 2004, Class L shares were known as Class A shares. On April 12, 2004, Class A shares were redesignated as Class L shares and a new Class A was opened.
4Prior to April 12, 2004, Class M shares were known as Class B shares. On April 12, 2004, Class B shares were redesignated as Class M shares and a new Class B was opened.
5See page 1 for a summary of definitions for the Fund’s benchmarks.
*S&P 500 Index Closest Month-End to Inception cumulative total returns as of 10/31/05 are 10.17% for Class A and Class B; and 5.17% for Class C, Class L, Class M, and Class X. S&P 500 Index Closest Month-End to Inception average annual total returns as of 9/30/05 are 7.88% for Class A and Class B; and 1.48% for Class C, Class L, Class M, and Class X.
**Lipper Multi-Cap Value Funds Average Closest Month-End to Inception cumulative total returns as of 10/31/05 are 13.27% for Class A and Class B; and 26.02% for Class C, Class L, Class M, and Class X. Lipper Multi-Cap Value Funds Average Closest Month-End to Inception average annual total returns as of 9/30/05 are 10.41% for Class A and Class B; and 5.58% for Class C, Class L, Class M, and Class X.
| | | |
| Five Largest Holdings expressed as a percentage of net assets as of 10/31/05 | | | |
Exxon Mobil Corp., Oil & Gas | | 6.0 | % |
Citigroup, Inc., Financial Services | | 4.7 | |
Bank of America Corp., Financial Bank & Trust | | 3.6 | |
ConocoPhillips, Oil & Gas | | 2.5 | |
Pfizer, Inc., Pharmaceuticals | | 2.4 | |
Holdings reflect only long-term investments and are subject to change.
Fund Manager’s Report
For the fiscal year ended October 31, 2005, the Strategic Partners Core Value Fund was subadvised by AllianceBernstein. Its Class A shares had a total return of 9.09% compared with 8.72% for the S&P 500 Index and 11.86% for the Russell 1000 Value Index. It trailed the Lipper Multi-Cap Value Fund Average (+11.02%).
This Fund’s investment style avoids large deviations (active positions) from the Russell 1000 Value Index weightings in individual stocks, so its performance is expected to be fairly close to the Index. The intent is that exposures to any risk factor other than the Fund’s value-investing orientation will be small. The active positions are based upon valuations (share prices related to measures of intrinsic value) that use AllianceBernstein’s proprietary forecasts of each company’s future cash flow. Over this reporting period, the Fund’s underperformance was the result of slightly weak stock and sector emphases, particularly in consumer cyclicals, information technology, and financials. The Fund was also hurt by slight overweights compared to the Russell 1000 Value Index in the consumer cyclical and information technology sectors. Stocks in these sectors generally underperformed other sectors.
The Fund’s portfolio was slightly more sensitive, overall, to broad market movements than the Russell 1000 Value Index. When the market climbed steeply in May through July 2005, this risk exposure was particularly beneficial to its return. Several other broad portfolio characteristics also helped its performance, including above-average exposure to stocks with lower price-to-earnings multiples. Such “deep value” stocks continued to perform better than most through much of the reporting period.
Your Fund’s Performance
Strategic Partners Large Cap Core Fund
Fund objective
The investment objective of the Strategic Partners Large Cap Core Fund is to outperform the Standard & Poor’s 500 Composite Stock Price Index (S&P 500 Index) through stock selection, resulting in different weightings of common stocks relative to the Index. There can be no assurance that the Fund will achieve its investment objective.
Performance data quoted represent past performance. Past performance does not guarantee future results. The investment return and principal value of an investment will fluctuate, so that an investor’s shares, when redeemed, may be worth more or less than their original cost. Current performance may be lower or higher than the past performance data quoted. An investor may obtain performance data as of the most recent month-end by visiting our website at www.strategicpartners.com or by calling (800) 225-1852. Class A and Class L shares have a maximum initial sales charge of 5.50% and 5.75% respectively. Class L shares are closed to most new purchases (with the exception of reinvested dividends and purchases by certain college savings plans).
| | | | | | | | | |
| Cumulative Total Returns1 as of 10/31/05 | | | | | | | | | |
| | | One Year | | | Five Years | | | Since Inception2 | |
Class A3 | | 7.20 | % | | N/A | | | 5.79 | % |
Class B4 | | 6.34 | | | N/A | | | 4.54 | |
Class C | | 6.47 | | | –9.56 | % | | –7.75 | |
Class L3 | | 6.88 | | | –7.34 | | | –5.12 | |
Class M4 | | 6.35 | | | –9.66 | | | –7.85 | |
Class X | | 6.24 | | | –9.85 | | | –8.05 | |
S&P 500 Index5 | | 8.72 | | | –8.38 | | | * | |
Lipper Large-Cap Core Funds Avg.5 | | 8.35 | | | –13.44 | | | ** | |
| | | | | | | | | | |
| Average Annual Total Returns1 as of 9/30/05 | | | | | | | | | |
| | | One Year | | | Five Years | | | Since Inception2 | |
Class A3 | | 4.19 | % | | N/A | | | –1.22 | % |
Class B4 | | 4.31 | | | N/A | | | –1.67 | |
Class C | | 8.57 | | | –1.73 | % | | –1.05 | |
Class L3 | | 3.65 | | | –2.41 | | | –1.45 | |
Class M4 | | 3.57 | | | –2.12 | | | –1.39 | |
Class X | | 3.35 | | | –2.37 | | | –1.44 | |
S&P 500 Index5 | | 12.25 | | | –1.49 | | | * | |
Lipper Large-Cap Core Funds Avg.5 | | 11.54 | | | –2.87 | | | ** | |
The cumulative total returns do not reflect the deduction of applicable sales charges. If reflected, the applicable sales charges would reduce the cumulative total return performance quoted. Class A and Class L shares are subject to a maximum front-end sales charge of 5.50% and 5.75% respectively. Class L shares are closed to most new purchases (with the exception of reinvested dividends and purchases by certain college savings plans). Class M shares are also closed to most new purchases (with the exception of reinvested dividends). Class L, Class M, and Class X shares are only exchangeable with Class L, Class M, and Class X shares, respectively, offered by the other Strategic Partners Funds. Under certain circumstances, Class A and Class L shares may be subject to a contingent deferred sales charge (CDSC) of 1%. Class B, Class C, Class M, and Class X shares are subject to a maximum CDSC of 5%, 1%, 6%, and 6% respectively.
1Source: Prudential Investments LLC and Lipper Inc. The average annual total returns do take into account applicable sales charges. The returns in the tables do not reflect the deduction of taxes that a shareholder would pay on Fund distributions or following the redemption of Fund shares. During certain periods shown, fee waivers and/or expense reimbursements were in effect. Without such fee waivers and/or expense reimbursements, the returns for the share classes would have been lower. Without a distribution and service (12b-1) fee waiver of 0.05% for Class A shares, the returns would have been lower. Class A shares are subject to a 12b-1 fee of up to 0.30% annually. Class B, Class C, Class M, and Class X shares are subject to a 12b-1 fee of 1.00%. Class L shares are subject to a 12b-1 fee of 0.50%.
2Inception dates: Class A and Class B, 4/12/04; Class C, Class L, Class M, and Class X, 11/1/99.
3Prior to April 12, 2004, Class L shares were known as Class A shares. On April 12, 2004, Class A shares were redesignated as Class L shares and a new Class A was opened.
4Prior to April 12, 2004, Class M shares were known as Class B shares. On April 12, 2004, Class B shares were redesignated as Class M shares and a new Class B was opened.
5See page 1 for a summary of definitions for the Fund’s benchmarks.
*S&P 500 Index Closest Month-End to Inception cumulative total returns as of 10/31/05 are 10.17% for Class A and Class B; and –2.81% for Class C, Class L, Class M, and Class X. S&P 500 Index Closest Month-End to Inception average annual total returns as of 9/30/05 are 7.88% for Class A and Class B; and –0.20% for Class C, Class L, Class M, and Class X.
**Lipper Large-Cap Core Funds Average Closest Month-End to Inception cumulative total returns as of 10/31/05 are 7.67% for Class A and Class B; and –4.75% for Class C, Class L, Class M, and Class X. Lipper Large-Cap Core Funds Average Closest Month-End to Inception average annual total returns as of 9/30/05 are 6.14% for Class A and Class B; and –0.75% for Class C, Class L, Class M, and Class X.
| | | |
| Five Largest Holdings expressed as a percentage of net assets as of 10/31/05 | | | |
General Electric Co., Conglomerates | | 4.2 | % |
Citigroup, Inc., Financial Services | | 3.1 | |
Exxon Mobil Corp., Oil & Gas | | 3.0 | |
Microsoft Corp., Computer Services & Software | | 2.6 | |
American International Group, Inc., Insurance | | 2.5 | |
Holdings reflect only long-term investments and are subject to change.
Fund Manager’s Report
For the fiscal year ended October 31, 2005, the Strategic Partners Large-Cap Core Fund was subadvised by AllianceBernstein. Its Class A shares had a total return of 7.20%, compared with 8.72% for the S&P 500 Index. It trailed the Lipper Large-Cap Core Funds Average (+8.35%).
This Fund’s enhanced-index investment style avoids large deviations in stock and sector positions from the S&P 500 Index weightings. Its performance is expected to be fairly close to the S&P 500 and not be driven by any single risk factor. Its small deviations from the S&P 500 weights (active positions) are determined by a quantitative investment model. These active positions reduced the Fund’s relative performance. Several positions in individual stocks and modest overweights in the technology, consumer cyclical, and health-care sectors had negative impacts. These detractions were partially offset by the positive impacts of a slight overweight in financials and underexposures in the consumer services and healthcare sectors.
Characteristics of the overall portfolio had slight impact. Gains from emphases that were rewarded by the market, such as stocks that had greater earnings and price momentum or lower dividend yields than the S&P 500 Index average, were mostly offset by emphases that were out of favor for much of the reporting period. These included relatively high valuations (share prices as related to measures of inherent value), including higher ratios of share price-to-book value and to sales. Such relatively high valuations tend to characterize growth stocks.
Your Fund’s Performance
Strategic Partners Equity Income Fund
Fund objective
The investment objective of the Strategic Partners Equity Income Fund is long-term growth of capital and income while attempting to avoid excessive fluctuations in market value. There can be no assurance that the Fund will achieve its investment objective.
Performance data quoted represent past performance. Past performance does not guarantee future results. The investment return and principal value of an investment will fluctuate, so that an investor’s shares, when redeemed, may be worth more or less than their original cost. Current performance may be lower or higher than the past performance data quoted. An investor may obtain performance data as of the most recent month-end by visiting our website at www.strategicpartners.com or by calling (800) 225-1852. Class A and Class L shares have a maximum initial sales charge of 5.50% and 5.75% respectively. Class L shares are closed to most new purchases (with the exception of reinvested dividends and purchases by certain college savings plans).
| | | | | | | | | |
| Cumulative Total Returns1 as of 10/31/05 | | | | | | | | | |
| | | One Year | | | Five Years | | | Since Inception2 | |
Class A3 | | 8.72 | % | | N/A | | | 7.07 | % |
Class B4 | | 7.77 | | | N/A | | | 5.59 | |
Class C | | 7.70 | | | 6.29 | % | | 45.39 | |
Class L3 | | 8.19 | | | 8.95 | | | 50.98 | |
Class M4 | | 7.77 | | | 6.36 | | | 45.71 | |
Class X | | 7.70 | | | 6.36 | | | 45.39 | |
S&P 500 Index5 | | 8.72 | | | –8.38 | | | * | |
Lipper Large-Cap Core Funds Avg.5 | | 8.35 | | | –13.44 | | | ** | |
| | | | | | | | | | |
| Average Annual Total Returns1 as of 9/30/05 | | | | | | | | | |
| | | One Year | | | Five Years | | | Since Inception2 | |
Class A3 | | 4.58 | % | | N/A | | | 1.33 | % |
Class B4 | | 4.92 | | | N/A | | | 1.81 | |
Class C | | 8.85 | | | 1.76 | % | | 4.96 | |
Class L3 | | 4.13 | | | 1.26 | | | 4.80 | |
Class M4 | | 3.92 | | | 1.60 | | | 5.12 | |
Class X | | 3.86 | | | 1.40 | | | 5.00 | |
S&P 500 Index5 | | 12.25 | | | –1.49 | | | * | |
Lipper Large-Cap Core Funds Avg.5 | | 11.54 | | | –2.87 | | | ** | |
The cumulative total returns do not reflect the deduction of applicable sales charges. If reflected, the applicable sales charges would reduce the cumulative total return performance quoted. Class A and Class L shares are subject to a maximum front-end sales charge of 5.50% and 5.75% respectively. Class L shares are closed to most new purchases (with the exception of reinvested dividends and purchases by certain college savings plans). Class M shares are also closed to most new purchases (with the exception of reinvested dividends). Class L, Class M, and Class X shares are only exchangeable with Class L, Class M, and Class X shares, respectively, offered by the other Strategic Partners Funds. Under certain circumstances, Class A and Class L shares may be subject to a contingent deferred sales charge (CDSC) of 1%. Class B, Class C, Class M, and Class X shares are subject to a maximum CDSC of 5%, 1%, 6%, and 6% respectively.
1Source: Prudential Investments LLC and Lipper Inc. The average annual total returns do take into account applicable sales charges. The returns in the tables do not reflect the deduction of taxes that a shareholder would pay on Fund distributions or following the redemption of Fund shares. During certain periods shown, fee waivers and/or expense reimbursements were in effect. Without such fee waivers and/or expense reimbursements, the returns for the share classes would have been lower. Without a distribution and service (12b-1) fee waiver of 0.05% for Class A shares, the returns would have been lower. Class A shares are subject to a 12b-1 fee of up to 0.30% annually. Class B, Class C, Class M, and Class X shares are subject to a 12b-1 fee of 1.00%. Class L shares are subject to a 12b-1 fee of 0.50%.
2Inception dates: Class A and Class B, 4/12/04; Class C, Class L, Class M, and Class X, 12/31/97.
3Prior to April 12, 2004, Class L shares were known as Class A shares. On April 12, 2004, Class A shares were redesignated as Class L shares and a new Class A was opened.
4Prior to April 12, 2004, Class M shares were known as Class B shares. On April 12, 2004, Class B shares were redesignated as Class M shares and a new Class B was opened.
5See page 1 for a summary of definitions for the Fund’s benchmarks.
*S&P 500 Index Closest Month-End to Inception cumulative total returns as of 10/31/05 are 10.17% for Class A and Class B; and 40.03% for Class C, Class L, Class M, and Class X. S&P 500 Index Closest Month-End to Inception average annual total returns as of 9/30/05 are 7.88% for Class A and Class B; and 4.67% for Class C, Class L, Class M, and Class X.
**Lipper Large-Cap Core Funds Average Closest Month-End to Inception cumulative total returns as of 10/31/05 are 7.67% for Class A and Class B; and 29.61% for Class C, Class L, Class M, and Class X. Lipper Large-Cap Core Funds Average Closest Month-End to Inception average annual total returns as of 9/30/05 are 6.14% for Class A and Class B; and 3.44% for Class C, Class L, Class M, and Class X.
| | | |
| Five Largest Holdings expressed as a percentage of net assets as of 10/31/05 | | | |
General Electric Co., Utilities | | 3.5 | % |
JP Morgan Chase & Co., Financial Services | | 3.4 | |
American International Group, Inc., Insurance | | 3.2 | |
Microsoft Corp., Computer Services & Software | | 2.8 | |
Exxon Mobile Corp., Oil & Gas | | 2.6 | |
Holdings reflect only long-term investments and are subject to change.
Fund Manager’s Report
For the fiscal year ended October 31, 2005, the Strategic Partners Equity Income Fund was managed by AllianceBernstein. Its Class A shares had a total return of 8.72% compared with 8.72% for the S&P 500 Index and 11.86% for the Russell 1000 Value Index. It was basically in line with the Lipper Large-Cap Core Funds Average (+8.35%).
The Fund’s underperformance of the style-appropriate Russell 1000 Value Index was driven by a number of portfolio deviations from the Index in style, risk exposures, and sectors, in addition to the selection of individual stocks. The relative value style of its manager typically results in a portfolio that is less extreme than the Index on measures of value such as price-to-cash flow and price-to-book value. These value factors generally were associated with higher returns during this reporting period, so the Fund’s performance relative to the Index was weak. In addition, AllianceBernstein’s investment process focuses on stocks of companies with very large market capitalizations (“megacaps”). Somewhat unexpectedly, megacaps substantially underperformed the rest of the market. AllianceBernstein also consistently focuses on high-quality stocks—those with relatively low debt/capital ratios. This style characteristic was not favored. Together, these portfolio characteristics explain much of the year’s underperformance.
The Fund’s sector positioning detracted from its relative performance. AllianceBernstein typically is overweight in the healthcare, consumer staples, and information technology sectors, and underweight in more traditional value sectors such as utilities, energy, and materials compared with the Russell 1000 Value Index. Over this reporting period, however, the latter sectors drove the market return.
In addition, a number of individual positions in the financials, information technology, and consumer services sectors pulled down the Fund’s relative performance.
Your Fund’s Performance
Strategic Partners Balanced Fund
Fund objective
The investment objective of the Strategic Partners Balanced Fund is to seek capital growth and current income. There can be no assurance that the Fund will achieve its investment objective.
Performance data quoted represent past performance. Past performance does not guarantee future results. The investment return and principal value of an investment will fluctuate, so that an investor’s shares, when redeemed, may be worth more or less than their original cost. Current performance may be lower or higher than the past performance data quoted. An investor may obtain performance data as of the most recent month-end by visiting our website at www.strategicpartners.com or by calling (800) 225-1852. Class A and Class L shares have a maximum initial sales charge of 5.50% and 5.75% respectively. Class L shares are closed to most new purchases (with the exception of reinvested dividends and purchases by certain college savings plans).
| | | | | | | | | |
| Cumulative Total Returns1 as of 10/31/05 | | | | | | | | | |
| | | One Year | | | Five Years | | | Since Inception2 | |
Class A3 | | 6.32 | % | | N/A | | | 47.95 | % |
Class B4 | | 5.53 | | | N/A | | | 41.33 | |
Class C | | 5.45 | | | 4.88 | % | | 41.22 | |
Class L3 | | 5.95 | | | 7.53 | | | 47.36 | |
Class M4 | | 5.53 | | | 4.96 | | | 41.33 | |
Class X | | 5.53 | | | 4.96 | | | 41.21 | |
Blended Index5 | | 5.61 | | | 9.82 | | | * | |
Lipper Balanced Funds Avg.5 | | 6.81 | | | 10.11 | | | ** | |
| | | | | | | | | | |
| Average Annual Total Returns1 as of 9/30/05 | | | | | | | | | |
| | | One Year | | | Five Years | | | Since Inception2 | |
Class A3 | | 3.71 | % | | N/A | | | 4.49 | % |
Class B4 | | 3.95 | | | N/A | | | 4.64 | |
Class C | | 7.96 | | | 1.15 | % | | 4.63 | |
Class L3 | | 3.19 | | | 0.47 | | | 4.51 | |
Class M4 | | 2.87 | | | 0.77 | | | 4.63 | |
Class X | | 2.88 | | | 0.57 | | | 4.62 | |
Blended Index5 | | 8.41 | | | 2.17 | | | * | |
Lipper Balanced Funds Avg.5 | | 9.78 | | | 2.05 | | | ** | |
The cumulative total returns do not reflect the deduction of applicable sales charges. If reflected, the applicable sales charges would reduce the cumulative total return performance quoted. Class A and Class L shares are subject to a maximum front-end sales charge of 5.50% and 5.75% respectively. Class L shares are closed to most new purchases (with the exception of reinvested dividends and purchases by certain college savings plans). Class M shares are also closed to most new purchases (with the exception of reinvested dividends). Class L, Class M, and Class X shares are only exchangeable with Class L, Class M, and Class X shares, respectively, offered by the other Strategic Partners Funds. Under certain circumstances, Class A and Class L shares may be subject to a contingent deferred sales charge (CDSC) of 1%. Class B, Class C, Class M, and Class X shares are subject to a maximum CDSC of 5%, 1%, 6%, and 6% respectively.
1Source: Prudential Investments LLC and Lipper Inc. The average annual total returns do take into account applicable sales charges. The returns in the tables do not reflect the deduction of taxes that a shareholder would pay on Fund distributions or following the redemption of Fund shares. During certain periods shown, fee waivers and/or expense reimbursements were in effect. Without such fee waivers and/or expense reimbursements, the returns for the share classes would have been lower. Without a distribution and service (12b-1) fee waiver of 0.05% for Class A shares, the returns would have been lower. Class A shares are subject to a 12b-1 fee of up to 0.30% annually. Class B, Class C, Class M, and Class X shares are subject to a 12b-1 fee of 1.00%. Class L shares are subject to a 12b-1 fee of 0.50%.
2Inception dates: Class A and Class B, 4/12/04; Class C, Class L, Class M, and Class X, 7/28/97.
3Prior to April 12, 2004, Class L shares were known as Class A shares. On April 12, 2004, Class A shares were redesignated as Class L shares and a new Class A was opened.
4Prior to April 12, 2004, Class M shares were known as Class B shares. On April 12, 2004, Class B shares were redesignated as Class M shares and a new Class B was opened.
5See page 1 for a summary of definitions for the Fund’s benchmarks.
*Blended Index Closest Month-End to Inception cumulative total returns as of 10/31/05 are 6.99% for Class A and Class B; and 56.23% for Class C, Class L, Class M, and Class X. Blended Index Closest Month-End to Inception average annual total returns as of 9/30/05 are 5.56% for Class A and Class B; and 5.79% for Class C, Class L, Class M, and Class X.
**Lipper Balanced Funds Average Closest Month-End to Inception cumulative total returns as of 10/31/05 are 7.34% for Class A and Class B; and 47.09% for Class C, Class L, Class M, and Class X. Lipper Balanced Funds Average Closest Month-End to Inception average annual total returns as of 9/30/05 are 5.93% for Class A and Class B; and 4.91% for Class C, Class L, Class M, and Class X.
| | | |
| Five Largest Holdings expressed as a percentage of net assets as of 10/31/05 | | | |
Exxon Mobil Corp, Oil & Gas | | 2.5 | % |
Federal National Mortgage Assoc. 6.00%, TBA, U.S. Government Agency | | 1.9 | |
Johnson & Johnson, Consumer Products & Services | | 1.6 | |
Intel Corp., Semiconductors | | 1.6 | |
Ford Credit Floorplan Master Owner Trust, 4.01%, 7/15/09, Asset-Backed Securities | | 1.5 | |
Holdings reflect only long-term investments and are subject to change.
Fund Manager’s Report
For the fiscal year ended October 31, 2005, the Strategic Partners Balanced Fund was managed by American Century Investment Management, Inc. Its Class A shares had a total return of 6.32% compared with the 5.61% return of the Fund’s blended benchmark, made up of 60% stocks (S&P 500 Index, which gained 8.72%) and 40% bonds (Lehman Brothers Government Credit Index, which advanced 0.83%). The Fund slightly trailed the Lipper Balanced Funds Average (+6.81%). Both the Fund’s stock and bond holdings outperformed their respective asset class benchmarks.
The Fund’s stock portfolio is managed with a valuation-sensitive quantitative stock selection strategy. Deviations from the sector weightings of the S&P 500 Index are controlled, but individual stock positions may vary from the Index weightings. Not only did the value-style bias help during this reporting period, but it characteristically tends to produce an emphasis on smaller companies relative to the S&P 500 Index, which also aided the Fund’s return. It had less exposure than the Index to stocks of companies with higher dividend yields, which proved to be beneficial. The Fund’s holdings outperformed corresponding Index sectors in the healthcare, industrials, and utilities sectors. The good performance in the industrials sector was primarily due to positions in the aerospace and defense and building products industries. These advantages more than offset the negative impact of overweights compared with the Index in the poorer performing consumer discretionary and materials sectors.
The Fund’s bond holdings benefited from sector deviations from the Lehman Brothers Government Credit Index weightings—it favored asset-backed securities, collateralized mortgage obligations, and commercial mortgage-backed securities and underrepresented corporate and Treasury bonds. Overall, the portfolio had a slightly lower duration than the Index and an emphasis on lower credit quality securities. These exposures also contributed to its performance
Your Fund’s Performance
Strategic Partners High Yield Bond Fund
Fund objective
The investment objective of the Strategic Partners High Yield Bond Fund is to seek a high level of current income and may also consider the potential for capital appreciation. There can be no assurance that the Fund will achieve its investment objective.
Performance data quoted represent past performance. Past performance does not guarantee future results. The investment return and principal value of an investment will fluctuate, so that an investor’s shares, when redeemed, may be worth more or less than their original cost. Current performance may be lower or higher than the past performance data quoted. An investor may obtain performance data as of the most recent month-end by visiting our website at www.strategicpartners.com or by calling (800) 225-1852. Class A and Class L shares have a maximum initial sales charge of 4.50% and 4.25% respectively. Class L shares are closed to most new purchases (with the exception of reinvested dividends and purchases by certain college savings plans).
| | | | | | | | | |
| Cumulative Total Returns1 as of 10/31/05 | | | | | | | | | |
| | | One Year | | | Five Years | | | Since Inception2 | |
Class A3 | | 1.48 | % | | N/A | | | 7.81 | % |
Class B4 | | 0.86 | | | N/A | | | 6.73 | |
Class C | | 0.72 | | | 29.63 | % | | 32.36 | |
Class L3 | | 1.37 | | | 33.07 | | | 38.12 | |
Class M4 | | 0.85 | | | 29.62 | | | 32.41 | |
Class X | | 0.85 | | | 29.79 | | | 32.49 | |
ML High Yield Master II Index5 | | 3.92 | | | 45.12 | | | * | |
Lehman Brothers U.S. Corporate High Yield Index | | 4.08 | | | 47.57 | | | ** | |
Lipper High Current Yield Funds Avg.5 | | 3.25 | | | 36.23 | | | *** | |
| | | | | | | | | | |
| Average Annual Total Returns1 as of 9/30/05 | | | | | | | | | |
| | | One Year | | | Five Years | | | Since Inception2 | |
Class A3 | | –0.13 | % | | N/A | | | 2.80 | % |
Class B4 | | –1.06 | | | N/A | | | 2.79 | |
Class C | | 2.69 | | | 4.59 | % | | 3.52 | |
Class L3 | | –0.12 | | | 4.44 | | | 3.64 | |
Class M4 | | –2.03 | | | 4.50 | | | 3.65 | |
Class X | | –2.03 | | | 4.39 | | | 3.66 | |
ML High Yield Master II Index5 | | 6.70 | | | 7.19 | | | * | |
Lehman Brothers U.S. Corporate High Yield Index | | 6.71 | | | 7.54 | | | ** | |
Lipper High Current Yield Funds Avg.5 | | 6.06 | | | 5.80 | | | *** | |
The cumulative total returns do not reflect the deduction of applicable sales charges. If reflected, the applicable sales charges would reduce the cumulative total return performance quoted. Class A and Class L shares are subject to a maximum front-end sales charge of 4.50% and 4.25% respectively. Class L shares are closed to most new purchases (with the exception of reinvested dividends and purchases by certain college savings plans). Class M shares are also closed to most new purchases (with the exception of reinvested dividends). Class L, Class M, and Class X shares are only exchangeable with Class L, Class M, and Class X shares, respectively, offered by the other Strategic Partners Funds. Under certain circumstances, Class A and Class L shares may be subject to a contingent deferred sales charge (CDSC) of 1%. Class B, Class C, Class M, and Class X shares are subject to a maximum CDSC of 5%, 1%, 6%, and 6% respectively.
1Source: Prudential Investments LLC and Lipper Inc. The average annual total returns do take into account applicable sales charges. The returns in the tables do not reflect the deduction of taxes that a shareholder would pay on Fund distributions or following the redemption of Fund shares. During certain periods shown, fee waivers and/or expense reimbursements were in effect. Without such fee waivers and expense reimbursements, the returns for the share classes would have been lower. Without a distribution and service (12b-1) fee waiver of 0.05% for Class A shares, the returns would have been lower. Class A shares are subject to a 12b-1 fee of up to 0.30% annually. Class B, Class C, Class M, and Class X shares are subject to a 12b-1 fee of 1.00%. Class L shares are subject to a 12b-1 fee of 0.50%.
2Inception dates: Class A and Class B, 4/12/04; Class C, Class L, Class M, and Class X, 7/28/97.
3Prior to April 12, 2004, Class L shares were known as Class A shares. On April 12, 2004, Class A shares were redesignated as Class L shares and a new Class A was opened.
4Prior to April 12, 2004, Class M shares were known as Class B shares. On April 12, 2004, Class B shares were redesignated as Class M shares and a new Class B was opened.
5See page 1 for a summary of definitions for the Fund’s benchmarks.
*ML High Yield Master II Index Closest Month-End to Inception cumulative total returns as of 10/31/05 are 9.93% for Class A and Class B; and 53.87% for Class C, Class L, Class M, and Class X. ML High Yield Master II Index Closest Month-End to Inception average annual total returns as of 9/30/05 are 7.04% for Class A and Class B; and 5.51% for Class C, Class L, Class M, and Class X.
**Lehman Brothers U.S. Corporate High Yield Index Closest Month-End to Inception cumulative total returns as of 10/31/05 are 10.03% for Class A and Class B; and 53.52% for Class C, Class L, Class M, and Class X. Lehman Brothers U.S. Corporate High Yield Index Closest Month-End to Inception average annual total returns as of 9/30/05 are 7.08% for Class A and Class B; and 5.48% for Class C, Class L, Class M, and Class X.
***Lipper High Current Yield Funds Average Closest Month-End to Inception cumulative total returns as of 10/31/05 are 8.70% for Class A and Class B; and 36.46% for Class C, Class L, Class M, and Class X. Lipper High Current Yield Funds Average Closest Month-End to Inception average annual total returns as of 9/30/05 are 6.37% for Class A and Class B; and 3.83% for Class C, Class L, Class M, and Class X.
| | | |
| Five Largest Issues expressed as a percentage of net assets as of 10/31/05 | | | |
Mandalay Resort Group 10.25% 08/01/07, Gaming | | 0.5 | % |
MGM Grand, Inc. 8.375% 02/01/11, Gaming | | 0.5 | |
Ray Acquisition SCA 9.375% 03/16/15, Services Cyclical—Distribution Logistics | | 0.4 | |
Graham Packaging Co. 9.875% 10/15/14, Packaging | | 0.4 | |
Grohe Holding GMBH 8.625% 10/01/14, Building Materials | | 0.4 | |
Issues are subject to change.
Fund Manager’s Report
For the fiscal year ended October 31, 2005, the Strategic Partners High Yield Bond Fund was subadvised by Goldman Sachs Asset Management, LP. Its Class A shares had a total return of 1.48 % compared with 3.92% for the Merrill Lynch High Yield Master II Index (the Index) and 4.08% for the Lehman Brothers U.S. Corporate High Yield Index. It trailed the Lipper High Current Yield Funds Average (+3.25%).
The 12-month reporting period was characterized by volatile conditions in the high yield market. At times the market rallied impressively, reflecting its low default rate and the generally favorable credit fundamentals of many high yield issuers due to solid earnings and healthy balance sheets awash in liquidity. At other times the market sold off sharply, reflecting ongoing problems in the U.S. automotive and airline industries and concern about the negative impact of higher energy prices on the economy. In the auto industry, General Motors (GM) and Ford Motor faced heavy competition from overseas rivals, as well as the high costs of their respective healthcare and pension obligations. Bonds of both were downgraded to high yield status by some major credit-rating agencies. Troubles at GM and Ford hurt auto parts manufacturers, some of which sought bankruptcy protection. There were also credit blowups in the airline industry as rising jet fuel prices contributed to the bankruptcies of Delta and Northwest Airlines in September. Prices of oil, gasoline, natural gas, electricity, and chemicals, which were already high, climbed further amid supply disruptions caused by hurricanes that hit the Gulf Coast in late August and September.
In this challenging investment environment, the Fund trailed the Index for its fiscal year due to individual security and industry selection across a variety of sectors. For example, gains from favorable debt security selection in the automotive, media, and technology industries were largely offset by negative debt security selection in the packaging, conglomerates, finance, and cellular telecommunications industries. Similarly, gains from relative sector positioning versus the Index, such as the Fund’s overweight exposure to the food/beverage, consumer products, and building materials sectors were offset by losses from allocations to the transportation, non-cellular telecommunications, and environmental industries.
Your Fund’s Performance
Strategic Partners Money Market Fund
Fund objective
The investment objectives of the Strategic Partners Money Market Fund are to seek high current income and maintain high levels of liquidity. There can be no assurance that the Fund will achieve its investment objectives.
Yields will fluctuate from time to time, and past performance does not guarantee future results. Current performance may be lower or higher than the performance data quoted. An investment in the Fund is not insured or guaranteed by the Federal Deposit Insurance Corporation or any other government agency. Although the Fund seeks to preserve the value of your investment at $1 per share, it is possible to lose money by investing in the Fund.
| | | | | | | | | | | | | | | |
| Fund Facts as of 10/31/05* | | | | | | | | | | | | | | |
| | | One-Year
Total Return | | | 7-Day
Current Yield | | | Net Asset
Value
(NAV) | | Weighted
Avg. Maturity
(WAM) | | | Net
Assets
(Millions) | |
Class A | | N/A | | | 2.53 | % | | $ | 1.00 | | 52 | Days | | $33 | *** |
Class C | | 0.92 | % | | 1.78 | | | | 1.00 | | 52 | | | 12 | |
Class D | | 1.42 | | | 2.28 | | | | 1.00 | | 52 | | | 13 | |
Class L | | 1.42 | | | 2.28 | | | | 1.00 | | 52 | | | 21 | |
Class M | | 0.92 | | | 1.78 | | | | 1.00 | | 52 | | | 61 | |
Class X | | 0.92 | | | 1.78 | | | | 1.00 | | 52 | | | 14 | |
Lipper Money Market Instrument Funds Avg.1 | | 2.02 | | | N/A | | | | N/A | | N/A | | | N/A | |
Source: Prudential Investments LLC and Lipper Inc. The one-year total return in the table does not reflect the deduction of taxes that a shareholder would pay on Fund distributions or following the redemption of Fund shares.
1See page 1 for a summary of definitions for the Fund’s benchmark.
*Class D and Class L shares are subject to a distribution and service (12b-1) fee of 0.50%. Class C, Class M, and Class X shares are subject to a 12b-1 fee of 1%.
***(Thousands)
Fund Manager’s Report
For the fiscal year ended October 31, 2005, the Strategic Partners Money Market Fund Class L shares returned 1.42% compared with a return of 2.02% for the Lipper Money Market Instrument Funds Average. From November 1, 2004, through August 5, 2005, the Fund was managed by Wells Capital Management, Inc., which was replaced by Prudential Fixed Income.
For the first nine months of the Fund’s fiscal year, yields on money market securities rose progressively higher. This trend reflected decisions by the Federal Reserve (the Fed), which repeatedly increased short-term interest rates in quarter-percentage-point increments. It worked to gradually remove the excess monetary stimulus from the U.S. economy. One type of investment that performed well was short-term adjustable-rate debt securities because their interest rates reset periodically based on formulas tied to the federal funds rate on overnight loans between banks or some other benchmark rate. The Fund had a meaningful exposure to these securities. The Fund’s limited exposure to asset-backed commercial paper and its large amount of net redemptions hindered its relative performance during the first nine months of the reporting period. The need to satisfy shareholder redemptions sometimes hindered the investment adviser’s ability to reinvest proceeds from maturing securities into higher yielding securities.
For the last three months of the Fund’s fiscal year, the trend toward higher money market yields persisted as Fed policymakers continued to raise short-term rates. (Since the Fed’s latest rate hike campaign began in June 2004, the target for the federal funds rate has been increased a total of 12 times, from 1.00% to 4.00% as of November 1, 2005.) Generally, the Fund invested in money market securities that matured around the time of the next regularly scheduled Fed meeting, which allowed the investment adviser to reinvest their proceeds in higher-yielding short-term securities. During the time that Prudential Fixed Income managed the Fund, its holdings of variable-rate securities increased, specifically those with coupons that readjusted to either the one- or three-month London interbank offered rate.
Fees and Expenses (Unaudited)
As a shareholder of the Funds, you incur two types of costs: (1) transaction costs, including sales charges (loads) on purchase payments and redemptions, as applicable, and (2) ongoing costs, including management fees, distribution and/or service (12b-1) fees, and other Fund expenses, as applicable. This example is intended to help you understand your ongoing costs (in dollars) of investing in the Funds and to compare these costs with the ongoing costs of investing in other mutual funds.
The example is based on an investment of $1,000 invested on May 1, 2005, at the beginning of the period, and held through the six-month period ended October 31, 2005.
The Fund’s transfer agent may charge additional fees to holders of certain accounts that are not included in the expenses shown in the table on the following page. These fees apply to Individual Retirement Accounts (IRAs) and Section 403(b) accounts. As of the close of the six-month period covered by the table, IRA fees included an annual maintenance fee of $15 per account (subject to a maximum annual maintenance fee of $25 for all accounts held by the same shareholder). Section 403(b) accounts are charged an annual $25 fiduciary maintenance fee. Some of the fees may vary in amount, or may be waived, based on your total account balance or the number of JennisonDryden or Strategic Partners Funds, including the Fund, that you own. You should consider the additional fees that were charged to your Fund account over the six-month period when you estimate the total ongoing expenses paid over the period and the impact of these fees on your ending account value, as these additional expenses are not reflected in the information provided in the expense table. Additional fees have the effect of reducing investment returns.
Actual Expenses
The first line for each share class in the table on the following page provides information about actual account values and actual expenses. You may use the information on this line, together with the amount you invested, to estimate the expenses that you paid over the period. Simply divide your account value by $1,000 (for example, an $8,600 account value ÷ $1,000 = 8.6), then multiply the result by the number on the first line under the heading “Expenses Paid During the Six-Month Period” to estimate the expenses you paid on your account during this period.
Hypothetical Example for Comparison Purposes
The second line for each share class in the table on the following page provides information about hypothetical account values and hypothetical expenses based on the Fund’s actual expense ratio and an assumed rate of return of 5% per year before expenses, which is not the Fund’s actual return. The hypothetical account values and expenses may not be used to estimate the actual ending account balance or expenses you paid for the period. You may use this information to compare the ongoing costs of investing in the Fund and other funds. To do so, compare this 5% hypothetical example with the 5% hypothetical examples that appear in the shareholder reports of the other funds.
Fees and Expenses (continued)
Please note that the expenses shown in the table are meant to highlight your ongoing costs only, and do not reflect any transactional costs such as sales charges (loads). Therefore the second line for each share class in the table is useful in comparing ongoing costs only, and will not help you determine the relative total costs of owning different funds. In addition, if these transactional costs were included, your costs would have been higher.
| | | | | | | | | | | | | | |
Strategic Partners
International Growth Fund | | Beginning Account
Value
May 1, 2005 | | Ending Account
Value
October 31, 2005 | | Annualized
Expense Ratio
Based on the
Six-Month Period | | | Expenses Paid
During the
Six-Month Period* |
| | | | | | | | | | | | | | | |
| Class A | | Actual | | $ | 1,000.00 | | $ | 1,100.62 | | 1.85 | % | | $ | 9.80 |
| | | Hypothetical | | $ | 1,000.00 | | $ | 1,015.88 | | 1.85 | % | | $ | 9.40 |
| | | | | | | | | | | | | | | |
| Class B | | Actual | | $ | 1,000.00 | | $ | 1,096.49 | | 2.60 | % | | $ | 13.74 |
| | | Hypothetical | | $ | 1,000.00 | | $ | 1,012.10 | | 2.60 | % | | $ | 13.19 |
| | | | | | | | | | | | | | | |
| Class C | | Actual | | $ | 1,000.00 | | $ | 1,096.28 | | 2.60 | % | | $ | 13.74 |
| | | Hypothetical | | $ | 1,000.00 | | $ | 1,012.10 | | 2.60 | % | | $ | 13.19 |
| | | | | | | | | | | | | | | |
| Class L | | Actual | | $ | 1,000.00 | | $ | 1,099.91 | | 2.10 | % | | $ | 11.12 |
| | | Hypothetical | | $ | 1,000.00 | | $ | 1,014.62 | | 2.10 | % | | $ | 10.66 |
| | | | | | | | | | | | | | | |
| Class M | | Actual | | $ | 1,000.00 | | $ | 1,096.49 | | 2.60 | % | | $ | 13.74 |
| | | Hypothetical | | $ | 1,000.00 | | $ | 1,012.10 | | 2.60 | % | | $ | 13.19 |
| | | | | | | | | | | | | | | |
| Class X | | Actual | | $ | 1,000.00 | | $ | 1,097.39 | | 2.60 | % | | $ | 13.75 |
| | | Hypothetical | | $ | 1,000.00 | | $ | 1,012.10 | | 2.60 | % | | $ | 13.19 |
| | | | | | | | | | | | | | |
Strategic Partners
Small Cap
Growth Fund | | Beginning Account
Value
May 1, 2005 | | Ending Account
Value
October 31, 2005 | | Annualized
Expense Ratio
Based on the
Six-Month Period | | | Expenses Paid
During the
Six-Month Period* |
| | | | | | | | | | | | | | | |
| Class A | | Actual | | $ | 1,000.00 | | $ | 1,068.81 | | 1.61 | % | | $ | 8.40 |
| | | Hypothetical | | $ | 1,000.00 | | $ | 1,017.09 | | 1.61 | % | | $ | 8.19 |
| | | | | | | | | | | | | | | |
| Class B | | Actual | | $ | 1,000.00 | | $ | 1,063.22 | | 2.36 | % | | $ | 12.27 |
| | | Hypothetical | | $ | 1,000.00 | | $ | 1,013.31 | | 2.36 | % | | $ | 11.98 |
| | | | | | | | | | | | | | | |
| Class C | | Actual | | $ | 1,000.00 | | $ | 1,064.88 | | 2.36 | % | | $ | 12.28 |
| | | Hypothetical | | $ | 1,000.00 | | $ | 1,013.31 | | 2.36 | % | | $ | 11.98 |
| | | | | | | | | | | | | | | |
| Class L | | Actual | | $ | 1,000.00 | | $ | 1,067.20 | | 1.86 | % | | $ | 9.69 |
| | | Hypothetical | | $ | 1,000.00 | | $ | 1,015.83 | | 1.86 | % | | $ | 9.45 |
| | | | | | | | | | | | | | | |
| Class M | | Actual | | $ | 1,000.00 | | $ | 1,064.88 | | 2.36 | % | | $ | 12.28 |
| | | Hypothetical | | $ | 1,000.00 | | $ | 1,013.31 | | 2.36 | % | | $ | 11.98 |
| | | | | | | | | | | | | | | |
| Class X | | Actual | | $ | 1,000.00 | | $ | 1,064.12 | | 2.36 | % | | $ | 12.28 |
| | | Hypothetical | | $ | 1,000.00 | | $ | 1,013.31 | | 2.36 | % | | $ | 11.98 |
| | | | | | | | | | | | | | |
Strategic Partners
Mid Cap Growth Fund | | Beginning Account
Value
May 1, 2005 | | Ending Account
Value
October 31, 2005 | | Annualized
Expense Ratio
Based on the
Six-Month Period | | | Expenses Paid
During the
Six-Month Period* |
| | | | | | | | | | | | | | | |
| Class A | | Actual | | $ | 1,000.00 | | $ | 1,079.30 | | 1.65 | % | | $ | 8.65 |
| | | Hypothetical | | $ | 1,000.00 | | $ | 1,016.89 | | 1.65 | % | | $ | 8.39 |
| | | | | | | | | | | | | | | |
| Class B | | Actual | | $ | 1,000.00 | | $ | 1,076.42 | | 2.40 | % | | $ | 12.56 |
| | | Hypothetical | | $ | 1,000.00 | | $ | 1,013.11 | | 2.40 | % | | $ | 12.18 |
| | | | | | | | | | | | | | | |
| Class C | | Actual | | $ | 1,000.00 | | $ | 1,076.68 | | 2.40 | % | | $ | 12.56 |
| | | Hypothetical | | $ | 1,000.00 | | $ | 1,013.11 | | 2.40 | % | | $ | 12.18 |
| | | | | | | | | | | | | | | |
| Class L | | Actual | | $ | 1,000.00 | | $ | 1,079.80 | | 1.90 | % | | $ | 9.96 |
| | | Hypothetical | | $ | 1,000.00 | | $ | 1,015.63 | | 1.90 | % | | $ | 9.65 |
| | | | | | | | | | | | | | | |
| Class M | | Actual | | $ | 1,000.00 | | $ | 1,076.62 | | 2.40 | % | | $ | 12.56 |
| | | Hypothetical | | $ | 1,000.00 | | $ | 1,013.11 | | 2.40 | % | | $ | 12.18 |
| | | | | | | | | | | | | | | |
| Class X | | Actual | | $ | 1,000.00 | | $ | 1,076.68 | | 2.40 | % | | $ | 12.56 |
| | | Hypothetical | | $ | 1,000.00 | | $ | 1,013.11 | | 2.40 | % | | $ | 12.18 |
| | | | | | | | | | | | | | |
Strategic Partners
Mid Cap Value Fund | | Beginning Account
Value
May 1, 2005 | | Ending Account
Value
October 31, 2005 | | Annualized
Expense Ratio
Based on the
Six-Month Period | | | Expenses Paid
During the
Six-Month Period* |
| | | | | | | | | | | | | | | |
| Class A | | Actual | | $ | 1,000.00 | | $ | 1,101.28 | | 1.61 | % | | $ | 8.53 |
| | | Hypothetical | | $ | 1,000.00 | | $ | 1,017.09 | | 1.61 | % | | $ | 8.19 |
| | | | | | | | | | | | | | | |
| Class B | | Actual | | $ | 1,000.00 | | $ | 1,097.29 | | 2.36 | % | | $ | 12.48 |
| | | Hypothetical | | $ | 1,000.00 | | $ | 1,013.31 | | 2.36 | % | | $ | 11.98 |
| | | | | | | | | | | | | | | |
| Class C | | Actual | | $ | 1,000.00 | | $ | 1,096.89 | | 2.36 | % | | $ | 12.47 |
| | | Hypothetical | | $ | 1,000.00 | | $ | 1,013.31 | | 2.36 | % | | $ | 11.98 |
| | | | | | | | | | | | | | | |
| Class L | | Actual | | $ | 1,000.00 | | $ | 1,100.22 | | 1.86 | % | | $ | 9.85 |
| | | Hypothetical | | $ | 1,000.00 | | $ | 1,015.83 | | 1.86 | % | | $ | 9.45 |
| | | | | | | | | | | | | | | |
| Class M | | Actual | | $ | 1,000.00 | | $ | 1,096.89 | | 2.36 | % | | $ | 12.47 |
| | | Hypothetical | | $ | 1,000.00 | | $ | 1,013.31 | | 2.36 | % | | $ | 11.98 |
| | | | | | | | | | | | | | | |
| Class X | | Actual | | $ | 1,000.00 | | $ | 1,096.59 | | 2.36 | % | | $ | 12.47 |
| | | Hypothetical | | $ | 1,000.00 | | $ | 1,013.31 | | 2.36 | % | | $ | 11.98 |
Fees and Expenses (continued)
| | | | | | | | | | | | | | |
Strategic Partners
Technology Fund | | Beginning Account
Value
May 1, 2005 | | Ending Account
Value
October 31, 2005 | | Annualized
Expense Ratio
Based on the
Six-Month Period | | | Expenses Paid
During the
Six-Month Period* |
| | | | | | | | | | | | | | | |
| Class A | | Actual | | $ | 1,000.00 | | $ | 1,086.30 | | 1.65 | % | | $ | 8.68 |
| | | Hypothetical | | $ | 1,000.00 | | $ | 1,016.89 | | 1.65 | % | | $ | 8.39 |
| | | | | | | | | | | | | | | |
| Class B | | Actual | | $ | 1,000.00 | | $ | 1,081.31 | | 2.40 | % | | $ | 12.59 |
| | | Hypothetical | | $ | 1,000.00 | | $ | 1,013.11 | | 2.40 | % | | $ | 12.18 |
| | | | | | | | | | | | | | | |
| Class C | | Actual | | $ | 1,000.00 | | $ | 1,084.99 | | 2.40 | % | | $ | 12.61 |
| | | Hypothetical | | $ | 1,000.00 | | $ | 1,013.11 | | 2.40 | % | | $ | 12.18 |
| | | | | | | | | | | | | | | |
| Class L | | Actual | | $ | 1,000.00 | | $ | 1,086.61 | | 1.90 | % | | $ | 9.99 |
| | | Hypothetical | | $ | 1,000.00 | | $ | 1,015.63 | | 1.90 | % | | $ | 9.65 |
| | | | | | | | | | | | | | | |
| Class M | | Actual | | $ | 1,000.00 | | $ | 1,085.40 | | 2.40 | % | | $ | 12.62 |
| | | Hypothetical | | $ | 1,000.00 | | $ | 1,013.11 | | 2.40 | % | | $ | 12.18 |
| | | | | | | | | | | | | | | |
| Class X | | Actual | | $ | 1,000.00 | | $ | 1,080.71 | | 2.40 | % | | $ | 12.59 |
| | | Hypothetical | | $ | 1,000.00 | | $ | 1,013.11 | | 2.40 | % | | $ | 12.18 |
| | | | | | | | | | | | | | |
Strategic Partners
Health Sciences Fund | | Beginning Account
Value
May 1, 2005 | | Ending Account
Value
October 31, 2005 | | Annualized
Expense Ratio
Based on the
Six-Month Period | | | Expenses Paid
During the
Six-Month Period* |
| | | | | | | | | | | | | | | |
| Class A | | Actual | | $ | 1,000.00 | | $ | 1,088.32 | | 1.65 | % | | $ | 8.69 |
| | | Hypothetical | | $ | 1,000.00 | | $ | 1,016.89 | | 1.65 | % | | $ | 8.39 |
| | | | | | | | | | | | | | | |
| Class B | | Actual | | $ | 1,000.00 | | $ | 1,083.38 | | 2.40 | % | | $ | 12.60 |
| | | Hypothetical | | $ | 1,000.00 | | $ | 1,013.11 | | 2.40 | % | | $ | 12.18 |
| | | | | | | | | | | | | | | |
| Class C | | Actual | | $ | 1,000.00 | | $ | 1,083.28 | | 2.40 | % | | $ | 12.60 |
| | | Hypothetical | | $ | 1,000.00 | | $ | 1,013.11 | | 2.40 | % | | $ | 12.18 |
| | | | | | | | | | | | | | | |
| Class L | | Actual | | $ | 1,000.00 | | $ | 1,086.10 | | 1.90 | % | | $ | 9.99 |
| | | Hypothetical | | $ | 1,000.00 | | $ | 1,015.63 | | 1.90 | % | | $ | 9.65 |
| | | | | | | | | | | | | | | |
| Class M | | Actual | | $ | 1,000.00 | | $ | 1,084.39 | | 2.40 | % | | $ | 12.61 |
| | | Hypothetical | | $ | 1,000.00 | | $ | 1,013.11 | | 2.40 | % | | $ | 12.18 |
| | | | | | | | | | | | | | | |
| Class X | | Actual | | $ | 1,000.00 | | $ | 1,084.19 | | 2.40 | % | | $ | 12.61 |
| | | Hypothetical | | $ | 1,000.00 | | $ | 1,013.11 | | 2.40 | % | | $ | 12.18 |
| | | | | | | | | | | | | | |
Strategic Partners
Managed OTC Fund | | Beginning Account
Value
May 1, 2005 | | Ending Account
Value
October 31, 2005 | | Annualized
Expense Ratio
Based on the
Six-Month Period | | | Expenses Paid
During the
Six-Month Period* |
| | | | | | | | | | | | | | | |
| Class A | | Actual | | $ | 1,000.00 | | $ | 1,129.71 | | 1.50 | % | | $ | 8.05 |
| | | Hypothetical | | $ | 1,000.00 | | $ | 1,017.64 | | 1.50 | % | | $ | 7.63 |
| | | | | | | | | | | | | | | |
| Class B | | Actual | | $ | 1,000.00 | | $ | 1,124.52 | | 2.25 | % | | $ | 12.05 |
| | | Hypothetical | | $ | 1,000.00 | | $ | 1,013.86 | | 2.25 | % | | $ | 11.42 |
| | | | | | | | | | | | | | | |
| Class C | | Actual | | $ | 1,000.00 | | $ | 1,124.52 | | 2.25 | % | | $ | 12.05 |
| | | Hypothetical | | $ | 1,000.00 | | $ | 1,013.86 | | 2.25 | % | | $ | 11.42 |
| | | | | | | | | | | | | | | |
| Class L | | Actual | | $ | 1,000.00 | | $ | 1,126.08 | | 1.75 | % | | $ | 9.38 |
| | | Hypothetical | | $ | 1,000.00 | | $ | 1,016.38 | | 1.75 | % | | $ | 8.89 |
| | | | | | | | | | | | | | | |
| Class M | | Actual | | $ | 1,000.00 | | $ | 1,123.91 | | 2.25 | % | | $ | 12.05 |
| | | Hypothetical | | $ | 1,000.00 | | $ | 1,013.86 | | 2.25 | % | | $ | 11.42 |
| | | | | | | | | | | | | | | |
| Class X | | Actual | | $ | 1,000.00 | | $ | 1,123.91 | | 2.25 | % | | $ | 12.05 |
| | | Hypothetical | | $ | 1,000.00 | | $ | 1,013.86 | | 2.25 | % | | $ | 11.42 |
| | | | | | | | | | | | | | |
Strategic Partners
Capital Growth Fund | | Beginning Account
Value
May 1, 2005 | | Ending Account
Value
October 31, 2005 | | Annualized
Expense Ratio
Based on the
Six-Month Period | | | Expenses Paid
During the
Six-Month Period* |
| | | | | | | | | | | | | | | |
| Class A | | Actual | | $ | 1,000.00 | | $ | 1,074.51 | | 1.55 | % | | $ | 8.10 |
| | | Hypothetical | | $ | 1,000.00 | | $ | 1,017.39 | | 1.55 | % | | $ | 7.88 |
| | | | | | | | | | | | | | | |
| Class B | | Actual | | $ | 1,000.00 | | $ | 1,070.68 | | 2.30 | % | | $ | 12.00 |
| | | Hypothetical | | $ | 1,000.00 | | $ | 1,013.61 | | 2.30 | % | | $ | 11.67 |
| | | | | | | | | | | | | | | |
| Class C | | Actual | | $ | 1,000.00 | | $ | 1,070.88 | | 2.30 | % | | $ | 12.01 |
| | | Hypothetical | | $ | 1,000.00 | | $ | 1,013.61 | | 2.30 | % | | $ | 11.67 |
| | | | | | | | | | | | | | | |
| Class L | | Actual | | $ | 1,000.00 | | $ | 1,072.69 | | 1.80 | % | | $ | 9.40 |
| | | Hypothetical | | $ | 1,000.00 | | $ | 1,016.13 | | 1.80 | % | | $ | 9.15 |
| | | | | | | | | | | | | | | |
| Class M | | Actual | | $ | 1,000.00 | | $ | 1,070.12 | | 2.30 | % | | $ | 12.00 |
| | | Hypothetical | | $ | 1,000.00 | | $ | 1,013.61 | | 2.30 | % | | $ | 11.67 |
| | | | | | | | | | | | | | | |
| Class X | | Actual | | $ | 1,000.00 | | $ | 1,070.98 | | 2.30 | % | | $ | 12.01 |
| | | Hypothetical | | $ | 1,000.00 | | $ | 1,013.61 | | 2.30 | % | | $ | 11.67 |
Fees and Expenses (continued)
| | | | | | | | | | | | | | |
Strategic Partners
Concentrated Growth Fund | | Beginning Account
Value
May 1, 2005 | | Ending Account
Value
October 31, 2005 | | Annualized
Expense Ratio
Based on the
Six-Month Period | | | Expenses Paid
During the
Six-Month Period* |
| | | | | | | | | | | | | | | |
| Class A | | Actual | | $ | 1,000.00 | | $ | 1,076.02 | | 1.50 | % | | $ | 7.85 |
| | | Hypothetical | | $ | 1,000.00 | | $ | 1,017.64 | | 1.50 | % | | $ | 7.63 |
| | | | | | | | | | | | | | | |
| Class B | | Actual | | $ | 1,000.00 | | $ | 1,072.49 | | 2.25 | % | | $ | 11.75 |
| | | Hypothetical | | $ | 1,000.00 | | $ | 1,013.86 | | 2.25 | % | | $ | 11.42 |
| | | | | | | | | | | | | | | |
| Class C | | Actual | | $ | 1,000.00 | | $ | 1,072.69 | | 2.25 | % | | $ | 11.75 |
| | | Hypothetical | | $ | 1,000.00 | | $ | 1,013.86 | | 2.25 | % | | $ | 11.42 |
| | | | | | | | | | | | | | | |
| Class L | | Actual | | $ | 1,000.00 | | $ | 1,074.51 | | 1.75 | % | | $ | 9.15 |
| | | Hypothetical | | $ | 1,000.00 | | $ | 1,016.38 | | 1.75 | % | | $ | 8.89 |
| | | | | | | | | | | | | | | |
| Class M | | Actual | | $ | 1,000.00 | | $ | 1,072.39 | | 2.25 | % | | $ | 11.75 |
| | | Hypothetical | | $ | 1,000.00 | | $ | 1,013.86 | | 2.25 | % | | $ | 11.42 |
| | | | | | | | | | | | | | | |
| Class X | | Actual | | $ | 1,000.00 | | $ | 1,072.29 | | 2.25 | % | | $ | 11.75 |
| | | Hypothetical | | $ | 1,000.00 | | $ | 1,013.86 | | 2.25 | % | | $ | 11.42 |
| | | | | | | | | | | | | | |
Strategic Partners
Core Value Fund | | Beginning Account
Value
May 1, 2005 | | Ending Account
Value
October 31, 2005 | | Annualized
Expense Ratio
Based on the
Six-Month Period | | | Expenses Paid
During the
Six-Month Period* |
| | | | | | | | | | | | | | | |
| Class A | | Actual | | $ | 1,000.00 | | $ | 1,044.31 | | 1.45 | % | | $ | 7.47 |
| | | Hypothetical | | $ | 1,000.00 | | $ | 1,017.90 | | 1.45 | % | | $ | 7.38 |
| | | | | | | | | | | | | | | |
| Class B | | Actual | | $ | 1,000.00 | | $ | 1,040.38 | | 2.20 | % | | $ | 11.31 |
| | | Hypothetical | | $ | 1,000.00 | | $ | 1,014.12 | | 2.20 | % | | $ | 11.17 |
| | | | | | | | | | | | | | | |
| Class C | | Actual | | $ | 1,000.00 | | $ | 1,040.38 | | 2.20 | % | | $ | 11.31 |
| | | Hypothetical | | $ | 1,000.00 | | $ | 1,014.12 | | 2.20 | % | | $ | 11.17 |
| | | | | | | | | | | | | | | |
| Class L | | Actual | | $ | 1,000.00 | | $ | 1,042.70 | | 1.70 | % | | $ | 8.75 |
| | | Hypothetical | | $ | 1,000.00 | | $ | 1,016.64 | | 1.70 | % | | $ | 8.64 |
| | | | | | | | | | | | | | | |
| Class M | | Actual | | $ | 1,000.00 | | $ | 1,040.38 | | 2.20 | % | | $ | 11.31 |
| | | Hypothetical | | $ | 1,000.00 | | $ | 1,014.12 | | 2.20 | % | | $ | 11.17 |
| | | | | | | | | | | | | | | |
| Class X | | Actual | | $ | 1,000.00 | | $ | 1,040.38 | | 2.20 | % | | $ | 11.31 |
| | | Hypothetical | | $ | 1,000.00 | | $ | 1,014.12 | | 2.20 | % | | $ | 11.17 |
| | | | | | | | | | | | | | |
Strategic Partners
Large Cap Core Fund | | Beginning Account
Value
May 1, 2005 | | Ending Account
Value
October 31, 2005 | | Annualized
Expense Ratio
Based on the
Six-Month Period | | | Expenses Paid
During the
Six-Month Period* |
| | | | | | | | | | | | | | | |
| Class A | | Actual | | $ | 1,000.00 | | $ | 1,057.72 | | 1.25 | % | | $ | 6.48 |
| | | Hypothetical | | $ | 1,000.00 | | $ | 1,018.90 | | 1.25 | % | | $ | 6.36 |
| | | | | | | | | | | | | | | |
| Class B | | Actual | | $ | 1,000.00 | | $ | 1,053.69 | | 2.00 | % | | $ | 10.35 |
| | | Hypothetical | | $ | 1,000.00 | | $ | 1,015.12 | | 2.00 | % | | $ | 10.16 |
| | | | | | | | | | | | | | | |
| Class C | | Actual | | $ | 1,000.00 | | $ | 1,054.90 | | 2.00 | % | | $ | 10.36 |
| | | Hypothetical | | $ | 1,000.00 | | $ | 1,015.12 | | 2.00 | % | | $ | 10.16 |
| | | | | | | | | | | | | | | |
| Class L | | Actual | | $ | 1,000.00 | | $ | 1,056.91 | | 1.50 | % | | $ | 7.78 |
| | | Hypothetical | | $ | 1,000.00 | | $ | 1,017.64 | | 1.50 | % | | $ | 7.63 |
| | | | | | | | | | | | | | | |
| Class M | | Actual | | $ | 1,000.00 | | $ | 1,053.79 | | 2.00 | % | | $ | 10.35 |
| | | Hypothetical | | $ | 1,000.00 | | $ | 1,015.12 | | 2.00 | % | | $ | 10.16 |
| | | | | | | | | | | | | | | |
| Class X | | Actual | | $ | 1,000.00 | | $ | 1,052.68 | | 2.00 | % | | $ | 10.35 |
| | | Hypothetical | | $ | 1,000.00 | | $ | 1,015.12 | | 2.00 | % | | $ | 10.16 |
| | | | | | | | | | | | | | |
Strategic Partners
Equity Income Fund | | Beginning Account
Value
May 1, 2005 | | Ending Account
Value
October 31, 2005 | | Annualized
Expense Ratio
Based on the
Six-Month Period | | | Expenses Paid
During the
Six-Month Period* |
| | | | | | | | | | | | | | | |
| Class A | | Actual | | $ | 1,000.00 | | $ | 1,037.10 | | 1.41 | % | | $ | 7.24 |
| | | Hypothetical | | $ | 1,000.00 | | $ | 1,018.10 | | 1.41 | % | | $ | 7.17 |
| | | | | | | | | | | | | | | |
| Class B | | Actual | | $ | 1,000.00 | | $ | 1,031.91 | | 2.16 | % | | $ | 11.06 |
| | | Hypothetical | | $ | 1,000.00 | | $ | 1,014.32 | | 2.16 | % | | $ | 10.97 |
| | | | | | | | | | | | | | | |
| Class C | | Actual | | $ | 1,000.00 | | $ | 1,031.20 | | 2.16 | % | | $ | 11.06 |
| | | Hypothetical | | $ | 1,000.00 | | $ | 1,014.32 | | 2.16 | % | | $ | 10.97 |
| | | | | | | | | | | | | | | |
| Class L | | Actual | | $ | 1,000.00 | | $ | 1,033.42 | | 1.66 | % | | $ | 8.51 |
| | | Hypothetical | | $ | 1,000.00 | | $ | 1,016.84 | | 1.66 | % | | $ | 8.44 |
| | | | | | | | | | | | | | | |
| Class M | | Actual | | $ | 1,000.00 | | $ | 1,031.91 | | 2.16 | % | | $ | 11.06 |
| | | Hypothetical | | $ | 1,000.00 | | $ | 1,014.32 | | 2.16 | % | | $ | 10.97 |
| | | | | | | | | | | | | | | |
| Class X | | Actual | | $ | 1,000.00 | | $ | 1,031.10 | | 2.16 | % | | $ | 11.06 |
| | | Hypothetical | | $ | 1,000.00 | | $ | 1,014.32 | | 2.16 | % | | $ | 10.97 |
Fees and Expenses (continued)
| | | | | | | | | | | | | | |
Strategic Partners
Balanced Fund | | Beginning Account
Value
May 1, 2005 | | Ending Account
Value
October 31, 2005 | | Annualized
Expense Ratio
Based on the
Six-Month Period | | | Expenses Paid
During the
Six-Month Period* |
| | | | | | | | | | | | | | | |
| Class A | | Actual | | $ | 1,000.00 | | $ | 1,032.01 | | 1.40 | % | | $ | 7.17 |
| | | Hypothetical | | $ | 1,000.00 | | $ | 1,018.15 | | 1.40 | % | | $ | 7.12 |
| | | | | | | | | | | | | | | |
| Class B | | Actual | | $ | 1,000.00 | | $ | 1,028.18 | | 2.15 | % | | $ | 10.99 |
| | | Hypothetical | | $ | 1,000.00 | | $ | 1,014.37 | | 2.15 | % | | $ | 10.92 |
| | | | | | | | | | | | | | | |
| Class C | | Actual | | $ | 1,000.00 | | $ | 1,028.18 | | 2.15 | % | | $ | 10.99 |
| | | Hypothetical | | $ | 1,000.00 | | $ | 1,014.37 | | 2.15 | % | | $ | 10.92 |
| | | | | | | | | | | | | | | |
| Class L | | Actual | | $ | 1,000.00 | | $ | 1,029.89 | | 1.65 | % | | $ | 8.44 |
| | | Hypothetical | | $ | 1,000.00 | | $ | 1,016.89 | | 1.65 | % | | $ | 8.39 |
| | | | | | | | | | | | | | | |
| Class M | | Actual | | $ | 1,000.00 | | $ | 1,028.18 | | 2.15 | % | | $ | 10.99 |
| | | Hypothetical | | $ | 1,000.00 | | $ | 1,014.37 | | 2.15 | % | | $ | 10.92 |
| | | | | | | | | | | | | | | |
| Class X | | Actual | | $ | 1,000.00 | | $ | 1,028.18 | | 2.15 | % | | $ | 10.99 |
| | | Hypothetical | | $ | 1,000.00 | | $ | 1,014.37 | | 2.15 | % | | $ | 10.92 |
| | | | | | | | | | | | | | |
Strategic Partners
High Yield Bond Fund | | Beginning Account
Value
May 1, 2005 | | Ending Account
Value
October 31, 2005 | | Annualized
Expense Ratio
Based on the
Six-Month Period | | | Expenses Paid
During the
Six-Month Period* |
| | | | | | | | | | | �� | | | | |
| Class A | | Actual | | $ | 1,000.00 | | $ | 1,024.20 | | 1.25 | % | | $ | 6.38 |
| | | Hypothetical | | $ | 1,000.00 | | $ | 1,018.90 | | 1.25 | % | | $ | 6.36 |
| | | | | | | | | | | | | | | |
| Class B | | Actual | | $ | 1,000.00 | | $ | 1,021.68 | | 2.00 | % | | $ | 10.19 |
| | | Hypothetical | | $ | 1,000.00 | | $ | 1,015.12 | | 2.00 | % | | $ | 10.16 |
| | | | | | | | | | | | | | | |
| Class C | | Actual | | $ | 1,000.00 | | $ | 1,020.32 | | 2.00 | % | | $ | 10.18 |
| | | Hypothetical | | $ | 1,000.00 | | $ | 1,015.12 | | 2.00 | % | | $ | 10.16 |
| | | | | | | | | | | | | | | |
| Class L | | Actual | | $ | 1,000.00 | | $ | 1,024.30 | | 1.50 | % | | $ | 7.65 |
| | | Hypothetical | | $ | 1,000.00 | | $ | 1,017.64 | | 1.50 | % | | $ | 7.63 |
| | | | | | | | | | | | | | | |
| Class M | | Actual | | $ | 1,000.00 | | $ | 1,020.32 | | 2.00 | % | | $ | 10.18 |
| | | Hypothetical | | $ | 1,000.00 | | $ | 1,015.12 | | 2.00 | % | | $ | 10.16 |
| | | | | | | | | | | | | | | |
| Class X | | Actual | | $ | 1,000.00 | | $ | 1,021.78 | | 2.00 | % | | $ | 10.19 |
| | | Hypothetical | | $ | 1,000.00 | | $ | 1,015.12 | | 2.00 | % | | $ | 10.16 |
| | | | | | | | | | | | | | |
Strategic Partners
Money Market Fund | | Beginning Account
Value
May 1, 2005 | | Ending Account
Value
October 31, 2005 | | Annualized
Expense Ratio
Based on the
Six-Month Period | | | Expenses Paid
During the
Six-Month Period* |
| | | | | | | | | | | | | | | |
| Class A | | Actual** | | $ | 1,000.00 | | $ | 1,005.30 | | 1.25 | % | | $ | 2.78 |
| | | Hypothetical | | $ | 1,000.00 | | $ | 1,018.90 | | 1.25 | % | | $ | 6.36 |
| | | | | | | | | | | | | | | |
| Class C | | Actual | | $ | 1,000.00 | | $ | 1,007.11 | | 2.00 | % | | $ | 10.12 |
| | | Hypothetical | | $ | 1,000.00 | | $ | 1,015.12 | | 2.00 | % | | $ | 10.16 |
| | | | | | | | | | | | | | | |
| Class D | | Actual | | $ | 1,000.00 | | $ | 1,009.58 | | 1.50 | % | | $ | 7.60 |
| | | Hypothetical | | $ | 1,000.00 | | $ | 1,017.64 | | 1.50 | % | | $ | 7.63 |
| | | | | | | | | | | | | | | |
| Class L | | Actual | | $ | 1,000.00 | | $ | 1,009.58 | | 1.50 | % | | $ | 7.60 |
| | | Hypothetical | | $ | 1,000.00 | | $ | 1,017.64 | | 1.50 | % | | $ | 7.63 |
| | | | | | | | | | | | | | | |
| Class M | | Actual | | $ | 1,000.00 | | $ | 1,007.11 | | 2.00 | % | | $ | 10.12 |
| | | Hypothetical | | $ | 1,000.00 | | $ | 1,015.12 | | 2.00 | % | | $ | 10.16 |
| | | | | | | | | | | | | | | |
| Class X | | Actual | | $ | 1,000.00 | | $ | 1,007.11 | | 2.00 | % | | $ | 10.12 |
| | | Hypothetical | | $ | 1,000.00 | | $ | 1,015.12 | | 2.00 | % | | $ | 10.16 |
* Fund expenses (net of fee waivers or subsidies, if any) for each share class are equal to the annualized expense ratio for each share class (provided in the table), multiplied by the average account value over the period, multiplied by the 184 days in the six-month period ended October 31, 2005, and divided by the 365 days in the Fund’s fiscal year ended October 31, 2005 (to reflect the six-month period) with the exception of the Strategic Partners Money Market Class A “Actual” information which reflects the 81 day period ended October 31, 2005 due to its inception date of August 12, 2005.
** Class A shares commenced operations on August 12, 2005.
This Page Intentionally Left Blank
Strategic Partners International Growth Fund
SCHEDULE OF INVESTMENTS
October 31, 2005
| | | | | |
| | | Shares
| | Value (Note 2)
|
Long-Term Investments — 98.3% | | | | | |
Common Stocks — 97.1% | | | | | |
Australia — 3.4% | | | | | |
BHP Billiton Ltd. | | 176,300 | | $ | 2,734,510 |
Macquarie Bank Ltd. | | 74,549 | | | 3,619,873 |
Sigma Co. Ltd. | | 28,613 | | | 257,327 |
Toll Holdings Ltd. | | 180,588 | | | 1,692,728 |
| | | | |
|
|
| | | | | | 8,304,438 |
| | | | |
|
|
Austria — 1.9% | | | | | |
Erste Bank der Oesterreichischen Sparkassen AG | | 47,356 | | | 2,463,118 |
Raiffeisen International Bank Holding AG * | | 34,700 | | | 2,183,279 |
| | | | |
|
|
| | | | | | 4,646,397 |
| | | | |
|
|
Brazil — 0.8% | | | | | |
Petroleo Brasileiro SA | | 135,100 | | | 1,932,486 |
| | | | |
|
|
Canada — 5.4% | | | | | |
Canadian National Railway Co. | | 78,300 | | | 5,668,148 |
Manulife Financial Corp. | | 72,100 | | | 3,752,423 |
Research In Motion Ltd. * | | 44,100 | | | 2,711,491 |
Shoppers Drug Mart Corp. | | 33,900 | | | 1,127,704 |
| | | | |
|
|
| | | | | | 13,259,766 |
| | | | |
|
|
France — 9.6% | | | | | |
Axalto Holding NV * | | 14,900 | | | 405,531 |
BNP Paribas | | 78,300 | | | 5,935,302 |
Essilor International SA | | 27,000 | | | 2,223,008 |
Eurazeo | | 3,600 | | | 349,900 |
Hermes International | | 11,630 | | | 2,609,192 |
Iliad SA | | 10,000 | | | 533,311 |
JC Decaux SA * | | 26,500 | | | 541,808 |
Sanofi-Aventis | | 74,627 | | | 5,974,381 |
Technip SA | | 37,400 | | | 2,015,649 |
Vinci SA | | 37,900 | | | 2,961,470 |
| | | | |
|
|
| | | | | | 23,549,552 |
| | | | |
|
|
Germany — 9.8% | | | | | |
Bijou Brigitte AG | | 2,900 | | | 603,001 |
Celesio AG | | 49,600 | | | 4,286,449 |
Continental AG | | 56,810 | | | 4,343,762 |
E.ON AG * | | 38,800 | | | 3,515,394 |
Porsche AG | | 4,650 | | | 3,352,039 |
Qiagen NV * | | 93,200 | | | 1,103,553 |
SAP AG | | 40,000 | | | 6,840,762 |
| | | | |
|
|
| | | | | | 24,044,960 |
| | | | |
|
|
Greece — 1.8% | | | | | |
Coca-Cola Hellenic Bottling Co. SA | | 64,800 | | | 1,765,981 |
EFG Eurobank Ergasias SA | | 40,640 | | $ | 1,222,497 |
National Bank of Greece SA * | | 34,400 | | | 1,340,693 |
| | | | |
|
|
| | | | | | 4,329,171 |
| | | | |
|
|
Hong Kong — 2.7% | | | | | |
Esprit Holdings Ltd. | | 349,700 | | | 2,477,405 |
Li & Fung Ltd. | | 381,000 | | | 817,578 |
Techtronic Industries Co. | | 1,378,900 | | | 3,393,869 |
| | | | |
|
|
| | | | | | 6,688,852 |
| | | | |
|
|
Hungary — 0.8% | | | | | |
OTP Bank Rt | | 51,900 | | | 1,854,961 |
| | | | |
|
|
India — 1.7% | | | | | |
Bharti Televentures * | | 203,700 | | | 1,460,706 |
HDFC Bank Ltd. | | 105,200 | | | 1,427,379 |
Infosys Technologies Ltd. | | 23,532 | | | 1,319,827 |
| | | | |
|
|
| | | | | | 4,207,912 |
| | | | |
|
|
Ireland — 2.0% | | | | | |
Anglo Irish Bank Corp. PLC | | 179,684 | | | 2,441,945 |
Ryanair Holdings PLC, ADR * | | 49,900 | | | 2,473,543 |
| | | | |
|
|
| | | | | | 4,915,488 |
| | | | |
|
|
Italy — 1.9% | | | | | |
Luxottica Group SpA | | 131,400 | | | 3,179,451 |
Saipem SpA | | 105,800 | | | 1,513,947 |
| | | | |
|
|
| | | | | | 4,693,398 |
| | | | |
|
|
Japan — 24.5% | | | | | |
Aeon Credit Service Co. Ltd. | | 13,700 | | | 1,076,120 |
Aeon Mall Co. Ltd. | | 37,200 | | | 1,579,683 |
ASKUL Corp. | | 11,000 | | | 665,797 |
Chiyoda Corp. | | 74,000 | | | 1,277,845 |
Chugai Pharmaceutical Co. Ltd. | | 194,900 | | | 4,267,601 |
Denso Corp. | | 190,800 | | | 5,431,846 |
Hoya Corp. * | | 108,700 | | | 3,772,249 |
Kenedix, Inc. | | 128 | | | 525,433 |
Keyence Corp. | | 17,700 | | | 4,072,800 |
KK DaVinci Advisors * | | 101 | | | 476,281 |
Komeri Co. Ltd. | | 29,000 | | | 1,027,241 |
Misumi Corp. | | 1,000 | | | 39,086 |
Mitsubishi UFG Financial Group, Inc. | | 605 | | | 7,603,913 |
NEOMAX Co. Ltd. | | 24,000 | | | 726,233 |
Nidec Corp. | | 17,400 | | | 1,020,862 |
Nidec Corp. W/I * | | 20,000 | | | 1,108,152 |
Nitto Denko Corp. | | 29,200 | | | 1,767,982 |
ORIX Corp. | | 34,300 | | | 6,431,520 |
Point, Inc. | | 12,700 | | | 788,728 |
Ryohin Keikaku Co. Ltd. | | 16,900 | | | 1,126,851 |
45
Strategic Partners International Growth Fund
SCHEDULE OF INVESTMENTS
October 31, 2005
| | | | | |
| | | Shares
| | Value (Note 2)
|
Sharp Corp. | | 448,400 | | $ | 6,157,146 |
Shimamura Co. Ltd. | | 9,400 | | | 1,205,801 |
Shinsei Bank Ltd. | | 851,000 | | | 4,951,630 |
Sundrug Co. Ltd. | | 9,700 | | | 547,502 |
Yamada Denki Co. Ltd. | | 29,900 | | | 2,640,974 |
| | | | |
|
|
| | | | | | 60,289,276 |
| | | | |
|
|
Mexico — 1.8% | | | | | |
America Movil SA de CV | | 1,140,000 | | | 1,488,221 |
Wal-Mart de Mexico SA de CV | | 625,300 | | | 3,043,739 |
| | | | |
|
|
| | | | | | 4,531,960 |
| | | | |
|
|
Netherlands — 0.5% | | | | | |
TomTom NV * | | 34,200 | | | 1,316,914 |
| | | | |
|
|
Norway — 1.6% | | | | | |
Statoil ASA * | | 170,700 | | | 3,816,738 |
| | | | |
|
|
Singapore — 0.8% | | | | | |
CapitaLand Ltd. | | 1,072,000 | | | 2,017,590 |
| | | | |
|
|
South Africa — 1.2% | | | | | |
Sasol Ltd. * | | 93,700 | | | 2,961,079 |
| | | | |
|
|
South Korea — 1.9% | | | | | |
Kookmin Bank * | | 29,700 | | | 1,689,762 |
Samsung Electronics Co. Ltd. | | 5,450 | | | 2,901,723 |
| | | | |
|
|
| | | | | | 4,591,485 |
| | | | |
|
|
Spain — 1.9% | | | | | |
Grupo Ferrovial SA | | 19,600 | | | 1,446,963 |
Industria de Diseno Textil SA | | 111,500 | | | 3,299,259 |
| | | | |
|
|
| | | | | | 4,746,222 |
| | | | |
|
|
Sweden — 0.5% | | | | | |
Capio AB * | | 32,000 | | | 552,569 |
Modern Times Group AB (Class “B” Stock) | | 17,800 | | | 680,678 |
| | | | |
|
|
| | | | | | 1,233,247 |
| | | | |
|
|
Switzerland — 9.5% | | | | | |
Actelion Ltd. * | | 7,600 | | | 854,694 |
EFG International * | | 15,500 | | | 445,399 |
Nobel Biocare Holding AG * | | 5,800 | | | 1,337,146 |
Roche Holding AG | | 54,800 | | | 8,185,892 |
SGS SA * | | 2,250 | | | 1,657,812 |
Synthes, Inc. | | 44,100 | | | 4,668,748 |
UBS AG | | 71,500 | | | 6,072,246 |
| | | | |
|
|
| | | | | | 23,221,937 |
| | | | |
|
|
Taiwan — 3.1% | | | | | |
HON HAI Precision Industry Co. Ltd. | | 869,165 | | $ | 3,765,296 |
MediaTek, Inc. * | | 447,800 | | | 3,874,218 |
| | | | |
|
|
| | | | | | 7,639,514 |
| | | | |
|
|
United Kingdom — 8.0% | | | | | |
BG Group PLC | | 841,170 | | | 7,384,822 |
Cairn Energy PLC * | | 37,100 | | | 1,134,073 |
Capita Group PLC | | 401,500 | | | 2,771,563 |
Reckitt Benckiser PLC | | 106,310 | | | 3,212,050 |
Tesco PLC | | 967,170 | | | 5,148,528 |
| | | | |
|
|
| | | | | | 19,651,036 |
| | | | |
|
|
Total Common Stocks
(Cost $183,808,249) | | | | | 238,444,379 |
| | | | |
|
|
Preferred Stock — 1.2% | | | | | |
Brazil — 1.2% | | | | | |
Banco Itau Holding Financeira SA 2.10% | | | | | |
(Cost $1,229,502) | | 122,200 | | | 2,925,572 |
| | | | |
|
|
Total Long-Term Investments
(Cost $185,037,751) | | | | | 241,369,951 |
| | | | |
|
|
Total Investments(o) — 98.3%
(Cost $185,037,751; Note 5) | | | | | 241,369,951 |
Other Assets In Excess of Liabilities — 1.7% | | | | | 4,180,903 |
| | | | |
|
|
Net Assets — 100.0% | | | | $ | 245,550,854 |
| | | | |
|
|
The following abbreviations and annotations are used in portfolio descriptions:
| ADR | American Depositary Receipt |
| * | Non-income producing security. |
| (o) | As of October 31, 2005, 41 securities representing $93,739,068 and 38.8% of the total market value were fair valued in accordance with the policies adopted by the Board of Directors. |
46
The industry classification of portfolio holdings and other assets in excess of liabilities shown as a percentage of net assets as of October 31, 2005 was as follows:
| | | |
Financial-Bank & Trust | | 13.7 | % |
Pharmaceuticals | | 12.2 | |
Oil & Gas | | 8.4 | |
Electronic Components & Equipment | | 8.1 | |
Retail & Merchandising | | 7.9 | |
Computer Services & Software | | 6.7 | |
Financial Services | | 6.1 | |
Medical Supplies & Equipment | | 5.0 | |
Automotive Parts | | 4.0 | |
Transportation | | 3.0 | |
Machinery & Equipment | | 2.2 | |
Food | | 2.1 | |
Commercial Services | | 1.8 | |
Construction | | 1.8 | |
Consumer Products & Services | | 1.5 | |
Insurance | | 1.5 | |
Real Estate | | 1.5 | |
Automobile Manufacturers | | 1.4 | |
Utilities | | 1.4 | |
Telecommunications | | 1.2 | |
Building Materials | | 1.1 | |
Clothing & Apparel | | 1.1 | |
Airlines | | 1.0 | |
Beverages | | 0.8 | |
Chemicals | | 0.7 | |
Business Services | | 0.5 | |
Advertising | | 0.3 | |
Cable Television | | 0.3 | |
Financial-Brokerage | | 0.3 | |
Metals & Mining | | 0.3 | |
Healthcare Services | | 0.2 | |
Internet Services | | 0.2 | |
| | |
|
|
| | | 98.3 | |
Other Assets in Excess of Liabilities | | 1.7 | |
| | |
|
|
Total | | 100.0 | % |
| | |
|
|
See Notes to Financial Statements.
47
Strategic Partners Small Cap Growth Fund
SCHEDULE OF INVESTMENTS
October 31, 2005
| | | | | |
| | | Shares
| | Value (Note 2)
|
Long-Term Investments — 98.6% | | | | | |
Common Stocks | | | | | |
Advertising — 0.7% | | | | | |
Marchex, Inc., (Class “B” Stock) | | 29,670 | | $ | 499,939 |
Valuevision Media, Inc., (Class “A” Stock) | | 14,234 | | | 139,778 |
Ventiv Health, Inc. * | | 3,970 | | | 100,203 |
| | | | |
|
|
| | | | | | 739,920 |
| | | | |
|
|
Aerospace — 2.1% | | | | | |
AAR Corp. * | | 28,462 | | | 453,399 |
DRS Technologies, Inc. * | | 26,550 | | | 1,307,853 |
Innovative Solutions and Support, Inc. * | | 7,068 | | | 101,002 |
Teledyne Technologies, Inc. * | | 12,750 | | | 449,565 |
| | | | |
|
|
| | | | | | 2,311,819 |
| | | | |
|
|
Airlines — 0.1% | | | | | |
SkyWest, Inc. | | 2,400 | | | 70,344 |
| | | | |
|
|
Automobile Manufacturers | | | | | |
A.S.V., Inc. | | 649 | | | 15,148 |
| | | | |
|
|
Automotive Parts — 0.5% | | | | | |
CSK Auto Corp. * | | 40,033 | | | 605,699 |
| | | | |
|
|
Biotechnology — 0.9% | | | | | |
Alexion Pharmaceuticals, Inc. * | | 8,990 | | | 246,236 |
Cambrex Corp. | | 8,176 | | | 155,998 |
Illumina, Inc. * | | 16,647 | | | 259,194 |
SuperGen, Inc. * | | 61,052 | | | 344,944 |
| | | | |
|
|
| | | | | | 1,006,372 |
| | | | |
|
|
Broadcasting | | | | | |
Sinclair Broadcast Group, Inc., (Class “A” Stock) | | 250 | | | 2,072 |
| | | | |
|
|
Building Materials — 1.0% | | | | | |
Building Material Holding Corp. | | 2,830 | | | 240,578 |
Ceradyne, Inc. * | | 1,790 | | | 70,168 |
Genlyte Group, Inc. | | 8,545 | | | 435,539 |
Hexel Corp. * | | 21,000 | | | 332,220 |
Oxford Industries, Inc. | | 1,100 | | | 54,175 |
| | | | |
|
|
| | | | | | 1,132,680 |
| | | | |
|
|
Business Services — 3.2% | | | | | |
Aviall, Inc. * | | 1,500 | | | 47,325 |
Brady Corp. (Class “A” Stock) | | 13,050 | | | 375,449 |
Clean Harbors, Inc. * | | 6,000 | | | 203,400 |
Filenet, Corp. * | | 24,154 | | | 679,935 |
Guess?, Inc. * | | 18,737 | | | 508,147 |
Harbor Florida Bancshares, Inc. | | 9,900 | | | 349,866 |
Harland, (John H.) Co. | | 8,800 | | | 365,992 |
infoUSA, Inc. | | 5,300 | | | 56,816 |
PRA International | | 3,700 | | $ | 98,272 |
SPSS, Inc. * | | 6,700 | | | 152,760 |
WESCO International, Inc. * | | 15,776 | | | 627,096 |
| | | | |
|
|
| | | | | | 3,465,058 |
| | | | |
|
|
Chemicals — 0.3% | | | | | |
Minerals Technologies, Inc. | | 513 | | | 27,425 |
Symyx Technologies, Inc. * | | 11,420 | | | 305,371 |
| | | | |
|
|
| | | | | | 332,796 |
| | | | |
|
|
Clothing & Apparel — 0.3% | | | | | |
K-Swiss, Inc. (Class “A” Stock) | | 9,780 | | | 297,801 |
| | | | |
|
|
Commercial Services — 7.4% | | | | | |
AMN Healthcare Services, Inc. | | 31,070 | | | 512,655 |
Arbitron, Inc. | | 12,154 | | | 454,681 |
Barrett Business Services | | 13,700 | | | 365,790 |
Chemed Corp. | | 20,548 | | | 987,948 |
CRA International, Inc. * | | 4,225 | | | 186,999 |
Digitas, Inc. | | 48,320 | | | 521,856 |
Euronet Worldwide, Inc. * | | 15,004 | | | 421,612 |
FirstService Corp. | | 25,750 | | | 601,777 |
ICT Group, Inc. * | | 4,639 | | | 65,967 |
Korn/Ferry International * | | 27,730 | | | 477,511 |
Laureate Education, Inc. | | 10,610 | | | 524,134 |
LECG Corp. * | | 5,928 | | | 130,950 |
Mcgrath Rentcorp | | 19,970 | | | 570,143 |
Providence Service Corp. | | 4,090 | | | 126,258 |
Rollins, Inc. | | 26,570 | | | 505,361 |
Steiner Leisure Ltd. | | 14,550 | | | 496,010 |
TeleTech Holdings, Inc. * | | 26,500 | | | 276,395 |
TNS, Inc. * | | 36,260 | | | 637,451 |
Universal Technical Institute, Inc. * | | 9,270 | | | 290,429 |
| | | | |
|
|
| | | | | | 8,153,927 |
| | | | |
|
|
Commercial Services & Supplies — 0.5% | | | | | |
Concur Technologies, Inc. * | | 17,300 | | | 233,723 |
Design Within Reach, Inc. * | | 27,280 | | | 220,150 |
Mercury Computer Systems, Inc. * | | 3,880 | | | 73,681 |
| | | | |
|
|
| | | | | | 527,554 |
| | | | |
|
|
Computer Hardware — 0.3% | | | | | |
Ansys, Inc. * | | 9,150 | | | 340,929 |
| | | | |
|
|
Computer Networking — 0.9% | | | | | |
Infospace, Inc. * | | 27,770 | | | 697,582 |
Ixia * | | 17,800 | | | 224,636 |
United Online, Inc. * | | 2,100 | | | 28,161 |
| | | | |
|
|
| | | | | | 950,379 |
| | | | |
|
|
Computer Services & Software — 8.2% | | | | | |
Advent Software, Inc. | | 17,700 | | | 543,744 |
Altiris, Inc. * | | 33,350 | | | 563,615 |
48
| | | | | |
| | | Shares
| | Value (Note 2)
|
Anteon International Corp. | | 9,916 | | $ | 448,203 |
Bottomline Technologies, Inc. | | 52,880 | | | 668,932 |
Catapult Communications, Corp. * | | 5,535 | | | 101,235 |
Computer Programs & Systems, Inc. | | 12,210 | | | 450,549 |
CSG Systems International, Inc. | | 4,800 | | | 112,848 |
Dendrite International, Inc. * | | 6,460 | | | 113,373 |
Earthlink, Inc. * | | 25,750 | | | 283,508 |
Equinix, Inc. | | 12,350 | | | 455,592 |
Factset Research Systems, Inc. | | 5,980 | | | 209,719 |
Hyperion Solutions Corp. * | | 3,320 | | | 160,555 |
Informatica Corp. | | 4,764 | | | 56,692 |
M-Systems Flash Disk Pioneers * | | 15,450 | | | 489,611 |
Mantech International Corp. (Class “A” Stock) * | | 12,925 | | | 358,023 |
Microsemi Corp. * | | 17,320 | | | 401,304 |
MTS Systems Corp. | | 12,050 | | | 481,518 |
Optimal Group, Inc. (Class “A” Stock) | | 31,220 | | | 582,877 |
Parametric Technology Corp. * | | 93,293 | | | 607,337 |
Progress Software Corp. * | | 5,150 | | | 160,371 |
Synplicity, Inc. | | 44,620 | | | 319,479 |
Take-Two Interactive Software, Inc. * | | 3,037 | | | 62,714 |
THQ, Inc. | | 3,529 | | | 81,802 |
Trident Microsystems, Inc. * | | 10,574 | | | 319,969 |
Ultimate Software Group, Inc. * | | 13,760 | | | 233,782 |
Wind River Systems, Inc. * | | 28,150 | | | 368,765 |
Witness Systems, Inc. * | | 18,590 | | | 364,364 |
| | | | |
|
|
| | | | | | 9,000,481 |
| | | | |
|
|
Computer Software — 1.3% | | | | | |
Packeteer, Inc. * | | 34,234 | | | 270,106 |
Per-Se Technologies, Inc. * | | 41,852 | | | 930,370 |
Quest Software, Inc. * | | 16,350 | | | 227,429 |
| | | | |
|
|
| | | | | | 1,427,905 |
| | | | |
|
|
Construction — 0.7% | | | | | |
Eagle Materials, Inc. | | 3,995 | | | 425,428 |
Monaco Coach Corp. | | 7,701 | | | 94,491 |
Shaw Group, Inc. | | 8,161 | | | 218,715 |
| | | | |
|
|
| | | | | | 738,634 |
| | | | |
|
|
Consumer Products & Services — 1.2% | | | | | |
Central Garden & Pet Co. | | 10,280 | | | 440,704 |
Chattem, Inc. * | | 6,444 | | | 212,652 |
Jarden Corp. * | | 18,750 | | | 633,562 |
| | | | |
|
|
| | | | | | 1,286,918 |
| | | | |
|
|
Distribution/Wholesale — 0.5% | | | | | |
Navarre Corp. | | 19,711 | | | 87,320 |
Nuco2, Inc. * | | 21,096 | | $ | 483,098 |
| | | | |
|
|
| | | | | | 570,418 |
| | | | |
|
|
Diversified — 0.5% | | | | | |
Blount International, Inc. * | | 31,609 | | | 501,319 |
| | | | |
|
|
Education — 0.3% | | | | | |
Blackboard, Inc. * | | 12,247 | | | 344,141 |
| | | | |
|
|
Electronic Components & Equipment — 1.1% | | | | | |
ESCO Technologies, Inc. * | | 4,450 | | | 192,507 |
Intermagnetics General Corp. | | 11,980 | | | 343,227 |
IXYS Corp. * | | 36,631 | | | 375,102 |
Plexus Corp. * | | 5,900 | | | 104,253 |
Portalplayer, Inc. * | | 2,700 | | | 54,513 |
Trimble Navigation Ltd. * | | 951 | | | 27,455 |
Watts Water Technologies, Inc. (Class “B” Stock) | | 2,509 | | | 69,650 |
| | | | |
|
|
| | | | | | 1,166,707 |
| | | | |
|
|
Electronics — 1.6% | | | | | |
Axsys Technologies, Inc. | | 17,370 | | | 329,509 |
Benchmark Electronics, Inc. * | | 6,834 | | | 191,967 |
Coherent, Inc. * | | 4,902 | | | 145,148 |
Itron, Inc. * | | 11,320 | | | 491,967 |
Rogers Corp. | | 3,554 | | | 132,742 |
Sonic Solutions, Inc. * | | 20,050 | | | 383,757 |
SRS Labs, Inc. | | 19,890 | | | 117,351 |
| | | | |
|
|
| | | | | | 1,792,441 |
| | | | |
|
|
Entertainment & Leisure — 1.7% | | | | | |
Century Casinos, Inc. | | 42,890 | | | 322,533 |
Isle of Capri Casinos, Inc. * | | 3,250 | | | 69,160 |
Life Time Fitness, Inc. * | | 2,200 | | | 81,708 |
Mikohn Gaming Corp. | | 22,390 | | | 234,871 |
Multimedia Games, Inc. * | | 44,829 | | | 444,704 |
Scientific Games Corp. (Class “A” Stock) | | 25,070 | | | 751,097 |
| | | | |
|
|
| | | | | | 1,904,073 |
| | | | |
|
|
Farming & Agriculture — 0.1% | | | | | |
Tejon Ranch Co. * | | 2,850 | | | 126,540 |
| | | | |
|
|
Financial — Bank & Trust — 2.0% | | | | | |
Bank of the Ozarks, Inc. | | 3,550 | | | 124,498 |
Boston Private Financial Holdings, Inc. | | 12,520 | | | 362,454 |
Cascade Bancorp | | 2,050 | | | 46,740 |
Center Financial Corp. | | 21,519 | | | 545,291 |
CoBiz, Inc. | | 3,950 | | | 70,034 |
CVB Financial Corp. | | 1,800 | | | 35,478 |
Glacier Bancorp, Inc. | | 10,500 | | | 309,540 |
Hudson United Bancorp | | 3,906 | | | 161,982 |
49
Strategic Partners Small Cap Growth Fund
SCHEDULE OF INVESTMENTS
October 31, 2005
| | | | | |
| | | Shares
| | Value (Note 2)
|
PrivateBancorp, Inc. | | 14,400 | | $ | 489,168 |
| | | | |
|
|
| | | | | | 2,145,185 |
| | | | |
|
|
Financial Services — 5.3% | | | | | |
Accredited Home Lenders Holding Co. * | | 10,110 | | | 365,375 |
Advanced Analogic Technologies, Inc. | | 22,910 | | | 249,719 |
AQuantive, Inc. * | | 8,600 | | | 186,190 |
Asset Acceptance Capital Corp. | | 600 | | | 15,894 |
Asta Funding, Inc. | | 4,250 | | | 115,303 |
BKF Capital Group, Inc. | | 950 | | | 16,321 |
CompuCredit Corp. * | | 11,192 | | | 490,433 |
Corus Bankshares, Inc. | | 3,250 | | | 178,425 |
Digital Insight, Corp. * | | 12,334 | | | 367,923 |
Digital River, Inc. * | | 5,072 | | | 142,067 |
Financial Federal Corp. | | 4,066 | | | 155,240 |
Frontier Financial Corp. | | 700 | | | 22,568 |
GAMCO Investment, Inc., (Class “A” Stock) | | 2,367 | | | 110,444 |
Jefferies Group, Inc. | | 5,753 | | | 244,272 |
Macatawa Bank Corp. | | 450 | | | 16,340 |
Pacific Capital Bancorp | | 5,300 | | | 191,171 |
Portfolio Recovery Associates, Inc. * | | 10,580 | | | 411,562 |
Stamps.com, Inc. * | | 7,750 | | | 156,240 |
SVB Financial Group * | | 8,569 | | | 425,965 |
Univest Corp. of Pennsylvania | | 3,850 | | | 100,100 |
Valueclick, Inc. * | | 74,175 | | | 1,298,063 |
Websense, Inc. * | | 8,427 | | | 497,867 |
| | | | |
|
|
| | | | | | 5,757,482 |
| | | | |
|
|
Furniture — 0.1% | | | | | |
American Woodmark Corp. | | 4,000 | | | 123,880 |
| | | | |
|
|
Healthcare Services — 5.8% | | | | | |
Amedisys, Inc. * | | 7,920 | | | 302,623 |
American Healthways, Inc. * | | 10,340 | | | 419,390 |
Amsurg Corp. * | | 5,327 | | | 126,516 |
Apria Healthcare Group, Inc. * | | 4,200 | | | 96,894 |
Beverly Enterprises, Inc. * | | 30,485 | | | 357,894 |
Centene Corp. * | | 20,151 | | | 406,043 |
Connectics Corp * | | 27,653 | | | 360,595 |
Five Star Quality Care, Inc. | | 54,500 | | | 367,330 |
Geron Corp. | | 48,700 | | | 439,761 |
LabOne, Inc. * | | 21,155 | | | 928,070 |
Matria Healthcare, Inc. | | 10,360 | | | 347,371 |
Molina Healthcare, Inc. * | | 14,790 | | | 303,934 |
Odyssey HealthCare, Inc. | | 25,428 | | | 439,396 |
United Surgical Partners International, Inc. * | | 17,547 | | | 629,060 |
United Therapeutics, Corp. * | | 8,614 | | | 636,230 |
USANA Health Sciences, Inc. * | | 2,500 | | | 110,050 |
WellCare Health Plans, Inc. * | | 1,614 | | $ | 50,841 |
| | | | |
|
|
| | | | | | 6,321,998 |
| | | | |
|
|
Healthcare-Products — 3.5% | | | | | |
Animas Corp. | | 2,052 | | | 33,755 |
Haemonetics Corp. * | | 2,550 | | | 123,547 |
Hologic, Inc. * | | 4,600 | | | 255,116 |
Inverness Medical Innovations, Inc. * | | 4,334 | | | 103,063 |
IRIS International, Inc. | | 5,050 | | | 118,422 |
Kensey Nash Corp. * | | 5,101 | | | 116,966 |
Merge Technologies, Inc. * | | 19,090 | | | 440,406 |
NuVasive Inc. * | | 8,100 | | | 141,183 |
Orthovita, Inc. | | 69,370 | | | 263,606 |
PolyMedica Corp. | | 16,680 | | | 550,607 |
PSS World Medical, Inc. * | | 9,318 | | | 129,800 |
SonoSite, Inc. | | 9,870 | | | 290,079 |
Spectranetics Corp. | | 40,190 | | | 399,489 |
Symmetry Medical, Inc. | | 13,670 | | | 302,654 |
Syneron Medical Ltd. | | 14,750 | | | 530,115 |
| | | | |
|
|
| | | | | | 3,798,808 |
| | | | |
|
|
Hotels & Motels — 0.1% | | | | | |
Ameristar Casinos, Inc. | | 5,800 | | | 123,714 |
| | | | |
|
|
Insurance — 0.2% | | | | | |
Tower Group, Inc. | | 12,910 | | | 248,776 |
| | | | |
|
|
Internet Services — 3.9% | | | | | |
1-800-Flowers.com, Inc. * | | 9,350 | | | 63,487 |
CNET Networks, Inc. * | | 21,300 | | | 289,467 |
Cybersource Corp. * | | 58,100 | | | 389,270 |
Dobson Communications, Corp. * | | 48,290 | | | 352,034 |
Internet Security Systems * | | 3,450 | | | 84,973 |
IVillage, Inc. * | | 6,650 | | | 48,878 |
J2 Global Communications, Inc. * | | 13,270 | | | 586,667 |
Jupitermedia Corp. * | | 18,288 | | | 310,896 |
Keynote Systems, Inc. | | 42,730 | | | 556,772 |
Online Resources Corp. * | | 37,690 | | | 452,280 |
Priceline.com, Inc. * | | 8,986 | | | 170,464 |
ProQuest Co. * | | 5,850 | | | 173,452 |
RealNetworks, Inc. * | | 2,800 | | | 21,840 |
RSA Security, Inc. * | | 1,000 | | | 11,400 |
Secure Computing Corp. * | | 2,700 | | | 32,346 |
TIBCO Software, Inc. * | | 18,350 | | | 139,276 |
WebEx Communications, Inc. * | | 11,500 | | | 263,465 |
WebSideStory, Inc. * | | 20,030 | | | 348,322 |
| | | | |
|
|
| | | | | | 4,295,289 |
| | | | |
|
|
Internet Software & Services — 0.5% | | | | | |
Openwave Systems, Inc. * | | 30,036 | | | 536,743 |
| | | | |
|
|
50
| | | | | |
| | | Shares
| | Value
(Note 2)
|
Lodging — 0.1% | | | | | |
La Quinta Corp. * | | 14,694 | | $ | 122,695 |
| | | | |
|
|
Machinery & Equipment — 2.1% | | | | | |
Applied Industrial Technologies, Inc. | | 13,256 | | | 436,785 |
Avocent Corp. * | | 8,374 | | | 256,747 |
Franklin Electric Co., Inc. | | 6,800 | | | 295,188 |
IDEX Corp. | | 1,811 | | | 72,476 |
InterDigital Communications Corp. * | | 14,300 | | | 274,417 |
JLG Industries, Inc. | | 16,093 | | | 617,327 |
Presstek, Inc. | | 16,250 | | | 166,563 |
UNOVA, Inc. * | | 5,957 | | | 184,667 |
| | | | |
|
|
| | | | | | 2,304,170 |
| | | | |
|
|
Medical Supplies & Equipment — 2.2% | | | | | |
Advanced Energy Industries, Inc. * | | 35,450 | | | 381,087 |
Align Technology, Inc. * | | 10,400 | | | 76,752 |
Arthrocare Corp. * | | 3,450 | | | 126,719 |
Biosite, Inc. | | 800 | | | 44,184 |
Kyphon, Inc. * | | 2,900 | | | 116,261 |
LCA-Vision, Inc. | | 6,210 | | | 260,882 |
Lifeline Systems, Inc. * | | 26,930 | | | 888,690 |
Mentor Corp. | | 6,949 | | | 312,705 |
Oakley, Inc. | | 7,700 | | | 113,960 |
Pharmion Corp. * | | 4,300 | | | 81,227 |
| | | | |
|
|
| | | | | | 2,402,467 |
| | | | |
|
|
Metals & Mining — 2.0% | | | | | |
Cleveland-Cliffs, Inc. | | 1,600 | | | 130,464 |
Mueller Industries, Inc. | | 14,739 | | | 405,912 |
NS Group, Inc. * | | 3,100 | | | 107,291 |
Quanex Corp. | | 16,750 | | | 969,992 |
Silgan Holdings, Inc. | | 18,204 | | | 585,623 |
| | | | |
|
|
| | | | | | 2,199,282 |
| | | | |
|
|
Office Equipment — 0.7% | | | | | |
Cymer, Inc. * | | 14,448 | | | 503,513 |
Global Imaging Systems, Inc. * | | 7,636 | | | 271,918 |
| | | | |
|
|
| | | | | | 775,431 |
| | | | |
|
|
Oil & Gas — 8.4% | | | | | |
Berry Petroleum Co. (Class “A” Stock) | | 7,410 | | | 443,563 |
Cabot Oil & Gas Corp. | | 13,647 | | | 624,896 |
Cal Dive International, Inc. * | | 23,758 | | | 1,462,067 |
Comstock Resources, Inc. * | | 16,273 | | | 489,980 |
Encore Medical Corp. | | 77,430 | | | 387,924 |
Frontier Oil Corp. | | 17,473 | | | 644,404 |
Grey Wolf, Inc. * | | 43,730 | | | 335,846 |
GSI Commerce, Inc. * | | 2,950 | | | 47,141 |
Hydril * | | 6,759 | | $ | 448,392 |
KCS Energy, Inc. * | | 24,402 | | | 588,576 |
Maverick Tube Corp. * | | 16,080 | | | 497,837 |
Oil States International, Inc. * | | 14,429 | | | 477,600 |
Parker Drilling Co. | | 10,300 | | | 91,052 |
Patterson-UTI Energy, Inc. | | 12,060 | | | 411,608 |
Remington Oil & Gas Corp. * | | 6,650 | | | 232,750 |
St Mary Land & Exploration Co. | | 29,850 | | | 1,015,199 |
Superior Energy Services, Inc. | | 27,545 | | | 561,367 |
Unit Corp. * | | 7,540 | | | 395,096 |
| | | | |
|
|
| | | | | | 9,155,298 |
| | | | |
|
|
Personal Services — 1.3% | | | | | |
Administaff, Inc. | | 11,606 | | | 491,166 |
Labor Ready, Inc. * | | 41,000 | | | 957,350 |
| | | | |
|
|
| | | | | | 1,448,516 |
| | | | |
|
|
Pharmaceuticals — 7.3% | | | | | |
Alpharma, Inc. (Class “A” Stock) | | 15,738 | | | 391,719 |
American Medical Systems Holdings, Inc. * | | 44,060 | | | 720,381 |
Andrx Corp. * | | 20,205 | | | 312,571 |
Atherogenics, Inc. | | 16,310 | | | 244,650 |
Bioenvision, Inc. * | | 48,576 | | | 297,771 |
Durect Corp. | | 24,950 | | | 158,183 |
Enzon Pharmaceuticals, Inc. * | | 26,882 | | | 188,443 |
Eyetech Pharmaceuticals, Inc. * | | 26,450 | | | 466,578 |
First Horizon Pharmaceutical Corp. * | | 47,700 | | | 688,311 |
HealthExtras, Inc. | | 3,801 | | | 80,011 |
I-Flow Corp. * | | 15,970 | | | 192,758 |
Immunogen, Inc. * | | 59,650 | | | 334,040 |
Integra LifeSciences Holdings Corp. * | | 14,900 | | | 514,050 |
KV Pharmaceutical Co. (Class “A” Stock) * | | 7,400 | | | 126,762 |
Longs Drug Stores Corp. | | 13,484 | | | 562,418 |
Mannatech Inc. | | 30,374 | | | 279,441 |
Medarex, Inc. * | | 43,200 | | | 377,568 |
Medicines Co. * | | 7,644 | | | 131,018 |
Medicis Pharmaceutical Corp. (Class “A” Stock) | | 5,100 | | | 150,450 |
Nastech Pharmaceutical Co., Inc. | | 9,350 | | | 124,729 |
Nektar Therapeutics * | | 9,300 | | | 140,058 |
NitroMed, Inc. | | 250 | | | 4,068 |
Rigel Pharmaceuticals, Inc. | | 12,690 | | | 284,890 |
Salix Pharmaceuticals Ltd. * | | 34,570 | | | 620,186 |
Serologicals Corp. * | | 23,382 | | | 455,481 |
West Pharmaceutical Services, Inc. | | 4,350 | | | 104,313 |
| | | | |
|
|
| | | | | | 7,950,848 |
| | | | |
|
|
51
Strategic Partners Small Cap Growth Fund
SCHEDULE OF INVESTMENTS
October 31, 2005
| | | | | |
| | | Shares
| | Value
(Note 2)
|
Printing & Publishing — 0.8% | | | | | |
Consolidated Graphics, Inc. * | | 12,110 | | $ | 472,169 |
Playboy Enterprises, Inc. (Class “B” Stock) * | | 22,600 | | | 342,164 |
Reader’s Digest Association, Inc. (The) | | 5,750 | | | 88,090 |
| | | | |
|
|
| | | | | | 902,423 |
| | | | |
|
|
Real Estate Investment Trust — 2.8% | | | | | |
Alexander’s, Inc. * | | 100 | | | 24,000 |
Alexandria Real Estate Equities, Inc. | | 3,200 | | | 258,720 |
Capital Automotive | | 7,592 | | | 293,203 |
Entertainment Properties Trust | | 700 | | | 28,070 |
Epicor Software Corp. * | | 32,890 | | | 403,889 |
Equity Lifestyle Properties, Inc. | | 1,200 | | | 50,796 |
Glimcher Realty Trust | | 11,700 | | | 268,749 |
Kilroy Realty Corp. | | 3,950 | | | 221,792 |
KKR Financial Corp. * | | 23,390 | | | 522,065 |
RADvision Ltd. * | | 25,070 | | | 325,910 |
RAIT Investment Trust | | 2,600 | | | 69,056 |
Tanger Factory Outlet Centers | | 9,800 | | | 263,522 |
Taubman Centers, Inc. | | 6,150 | | | 202,765 |
Washington Real Estate Investment Trust | | 3,750 | | | 111,938 |
| | | | |
|
|
| | | | | | 3,044,475 |
| | | | |
|
|
Retail & Merchandising — 4.7% | | | | | |
Aeropostale, Inc. * | | 20,035 | | | 391,484 |
Cato Corp. (Class “A” Stock) | | 7,750 | | | 154,845 |
CEC Entertainment, Inc. * | | 8,603 | | | 290,867 |
Cosi, Inc. | | 18,590 | | | 162,663 |
DiamondCluster International, Inc. * | | 17,900 | | | 115,097 |
GameStop Corp. (Class “B” Stock) * | | 12,910 | | | 417,509 |
Genesco, Inc. * | | 9,300 | | | 342,240 |
Hibbett Sporting Goods, Inc. * | | 21,150 | | | 554,764 |
JOS. A. Bank Clothiers, Inc. * | | 9,697 | | | 395,735 |
Movie Gallery, Inc. | | 52,850 | | | 367,836 |
Pantry, Inc. (The) * | | 12,909 | | | 499,449 |
Rare Hospitality International, Inc. | | 4,350 | | | 132,936 |
Red Robin Gourmet Burgers, Inc. | | 5,788 | | | 279,155 |
Select Comfort Corp. * | | 20,815 | | | 455,848 |
Stein Mart, Inc. | | 6,350 | | | 116,523 |
Tractor Supply Co. | | 3,057 | | | 148,265 |
Yankee Candle Co., Inc. | | 13,700 | | | 309,757 |
| | | | |
|
|
| | | | | | 5,134,973 |
| | | | |
|
|
Semiconductors — 4.1% | | | | | |
Aeroflex, Inc. * | | 11,320 | | | 102,559 |
Brooks Automation, Inc. * | | 18,154 | | $ | 212,583 |
Cypress Semiconductor Corp. * | | 32,352 | | | 439,987 |
Diodes, Inc. | | 6,350 | | | 230,251 |
Emulex Corp. * | | 26,361 | | | 487,942 |
Fairchild Semiconductor International, Inc. * | | 5,900 | | | 90,860 |
Genesis Microchip, Inc. | | 4,000 | | | 76,960 |
Intergrated Device Technology, Inc. | | 972 | | | 9,604 |
Kulicke & Soffa Industries, Inc. | | 65,850 | | | 412,880 |
Micrel, Inc. * | | 36,327 | | | 363,270 |
O2Micro International Ltd. | | 19,270 | | | 252,437 |
Omnivision Technologies, Inc. * | | 23,580 | | | 303,946 |
ON Semiconductor Corp. * | | 87,664 | | | 406,761 |
Photronics, Inc. * | | 28,550 | | | 513,900 |
Ultratech, Inc. * | | 24,320 | | | 335,130 |
Volterra Semiconductor Corp. | | 19,370 | | | 238,832 |
| | | | |
|
|
| | | | | | 4,477,902 |
| | | | |
|
|
Telecommunications — 3.2% | | | | | |
Affiliated Managers Group * | | 2,851 | | | 218,814 |
Comtech Telecommunications Corp. * | | 13,022 | | | 499,524 |
Dril-Quip, Inc. * | | 1,965 | | | 80,369 |
ExpressJet Holdings, Inc. * | | 31,100 | | | 279,589 |
Golden Telecom, Inc. | | 9,100 | | | 264,355 |
North Pittsburgh Systems, Inc. | | 13,950 | | | 280,395 |
Premiere Global Services, Inc. * | | 51,669 | | | 438,153 |
SafeNet, Inc. * | | 19,091 | | | 633,248 |
Symmetricon, Inc. * | | 43,315 | | | 345,221 |
Ubiquitel, Inc. * | | 54,650 | | | 472,176 |
| | | | |
|
|
| | | | | | 3,511,844 |
| | | | |
|
|
Transportation — 2.1% | | | | | |
American Commerical Lines, Inc. * | | 8,820 | | | 248,018 |
Forward Air Corp. | | 2,368 | | | 83,946 |
HUB Group, Inc. (Class “A” Stock) | | 2,000 | | | 72,740 |
Kirby Corp. * | | 9,690 | | | 500,682 |
Knight Transportation, Inc. | | 21,590 | | | 587,464 |
Old Dominion Freight Line * | | 9,240 | | | 327,004 |
Vitran Corp., Inc. | | 25,070 | | | 433,962 |
Werner Enterprises, Inc. * | | 3,699 | | | 66,286 |
| | | | |
|
|
| | | | | | 2,320,102 |
| | | | |
|
|
Total Long-Term Investments
(Cost $ 104,619,374) | | | | | 107,914,376 |
| | | | |
|
|
Short-Term Investments — 2.1% | | | | | |
Money Market Mutual Fund — 2.0% | | | | | |
Dryden Core Investment Fund -Taxable Money Market Series (w) | | 2,187,335 | | | 2,187,335 |
| | | | |
|
|
52
| | | | | | |
| | | Shares
| | Value (Note 2)
| |
U.S. Treasury Obligations — 0.1% | | | | | | |
U.S. Treasury Bill 3.75%, 01/19/06 (k) (n) | | 110 | | $ | 109,098 | |
| | | | |
|
|
|
Total Short-Term Investments
(Cost $ 2,296,430) | | | | | 2,296,433 | |
| | | | |
|
|
|
Total Investments — 100.7%
(Cost $106,915,804; Note 5) | | | | | 110,210,809 | |
Liabilities In Excess of Other Assets(u) — (0.7%) | | | | | (736,935 | ) |
| | | | |
|
|
|
Net Assets — 100.0% | | | | $ | 109,473,874 | |
| | | | |
|
|
|
The following annotations are used in portfolio descriptions:
| * | Non-income producing security. |
| (k) | Securities or a portion thereof with an aggregate market value of $109,098 have been segregated with the custodian to cover margin requirements for futures contracts open at October 31, 2005. |
| (n) | Rates shown are the effective yields at purchase date. |
| (u) | Liabilities in excess of other assets includes net unrealized appreciation on futures contracts as follows: |
| | | | | | | | | | | | | |
Number
of
Contracts
| | Type
| | Expiration
Month
| | Value at
Trade
Date
| | Value at
October 31,
2005
| | Unrealized
Appreciation
|
Long Position: | | | | | | | | | | | | | |
7 | | Russell 2000 | | Dec 05 | | $ | 444,692 | | $ | 454,428 | | $ | 9,736 |
| | | | | | | | | | | | |
|
|
| (w) | Prudential Investments LLC, the manager of the Fund, also serves as manager of the Dryden Core Investment Fund -Taxable Money Market Series. |
The industry classification of long-term portfolio holdings, short-term investments and liabilities in excess of other assets shown as a percentage of net assets as of October 31, 2005 were as follows:
| | | |
Oil & Gas | | 8.4 | % |
Computer Services & Software | | 8.2 | |
Commercial Services | | 7.4 | |
Pharmaceuticals | | 7.3 | |
Healthcare Services | | 5.8 | |
Financial Services | | 5.3 | |
Retail & Merchandising | | 4.7 | |
Semiconductors | | 4.1 | |
Internet Services | | 3.9 | |
Healthcare-Products | | 3.5 | |
Business Services | | 3.2 | |
Telecommunications | | 3.2 | |
Real Estate Investment Trust | | 2.8 | |
Medical Supplies & Equipment | | 2.2 | |
Aerospace | | 2.1 | |
Machinery & Equipment | | 2.1 | |
Transportation | | 2.1 | |
Financial - Bank & Trust | | 2.0 | |
Metals & Mining | | 2.0 | |
Entertainment & Leisure | | 1.7 | |
Electronics | | 1.6 | |
Computer Software | | 1.3 | |
Personal Services | | 1.3 | |
Consumer Products & Services | | 1.2 | |
Electronic Components & Equipment | | 1.1 | |
Building Materials | | 1.0 | |
Biotechnology | | 0.9 | |
Computer Networking | | 0.9 | |
Printing & Publishing | | 0.8 | |
Advertising | | 0.7 | |
Construction | | 0.7 | |
Office Equipment | | 0.7 | |
Automotive Parts | | 0.5 | |
Commercial Services & Supplies | | 0.5 | |
Distribution/Wholesale | | 0.5 | |
Diversified | | 0.5 | |
Internet Software & Services | | 0.5 | |
Chemicals | | 0.3 | |
Clothing & Apparel | | 0.3 | |
Computer Hardware | | 0.3 | |
Education | | 0.3 | |
Insurance | | 0.2 | |
Airlines | | 0.1 | |
Farming & Agriculture | | 0.1 | |
Furniture | | 0.1 | |
Hotels & Motels | | 0.1 | |
Lodging | | 0.1 | |
Short-Term Investments | | 2.1 | |
| | |
|
|
| | | 100.7 | |
Liabilities In Excess of Other Assets | | –0.7 | |
| | |
|
|
Total | | 100.0 | % |
| | |
|
|
See Notes to Financial Statements.
53
Strategic Partners Mid-Cap Growth Fund
SCHEDULE OF INVESTMENTS
October 31, 2005
| | | | | |
| | | Shares
| | Value (Note 2)
|
Long-Term Investments — 100.6% | | | | | |
Common Stocks | | | | | |
Aerospace & Defense — 1.7% | | | | | |
Alliant Techsystems, Inc. * | | 31,484 | | $ | 2,210,806 |
| | | | |
|
|
Apparel/Shoes — 2.8% | | | | | |
Chico’s FAS, Inc. * | | 59,550 | | | 2,354,607 |
Urban Outfitters, Inc. * | | 48,600 | | | 1,376,838 |
| | | | |
|
|
| | | | | | 3,731,445 |
| | | | |
|
|
Audio & Visual Equipment — 2.1% | | | | | |
Harman International Industries, Inc. | | 27,800 | | | 2,776,108 |
| | | | |
|
|
Audio Technology — 0.8% | | | | | |
Dolby Laboratories, Inc. (Class “A” Stock) * | | 64,200 | | | 1,033,620 |
| | | | |
|
|
Auto Parts & Related — 2.2% | | | | | |
Gentex Corp. | | 151,300 | | | 2,847,466 |
| | | | |
|
|
Banks — 0.6% | | | | | |
Commerce Bancorp, Inc. (a) | | 25,000 | | | 761,750 |
| | | | |
|
|
Broadcasting & Cable/Satellite TV — 4.1% | | | | | |
Entravision Communications Corp. (Class “A” Stock) * | | 269,825 | | | 2,212,565 |
Univision Communications, Inc. (Class “A” Stock) * | | 98,075 | | | 2,563,681 |
XM Satellite Radio Holdings, Inc. (Class “A” Stock) | | 22,500 | | | 648,675 |
| | | | |
|
|
| | | | | | 5,424,921 |
| | | | |
|
|
Commercial Services — 11.7% | | | | | |
Alliance Data Systems Corp. * | | 71,000 | | | 2,524,760 |
ARAMARK Corp. (Class “B” Stock) | | 100,250 | | | 2,548,355 |
Ceridian Corp. * | | 44,700 | | | 979,377 |
ChoicePoint, Inc. * | | 42,800 | | | 1,808,728 |
Cogent, Inc. * | | 93,244 | | | 2,475,628 |
Cognizant Technology Solutions Corp. * | | 39,200 | | | 1,724,016 |
Iron Mountain, Inc. * | | 54,237 | | | 2,115,243 |
Moody’s Corp. | | 23,200 | | | 1,235,632 |
| | | | |
|
|
| | | | | | 15,411,739 |
| | | | |
|
|
Computer Hardware — 3.9% | | | | | |
Avocent Corp. * | | 72,800 | | | 2,232,048 |
Zebra Technologies Corp. (Class “A” Stock) * | | 68,200 | | | 2,940,102 |
| | | | |
|
|
| | | | | | 5,172,150 |
| | | | |
|
|
Computer Software — 6.2% | | | | | |
Activision, Inc. * | | 94,533 | | | 1,490,791 |
Cognos, Inc. * (Canada) | | 69,400 | | | 2,604,582 |
Mercury Interactive Corp. * | | 34,100 | | | 1,186,339 |
NAVTEQ Corp. * | | 39,400 | | $ | 1,541,328 |
Salesforce.com, Inc. * | | 53,200 | | | 1,329,468 |
| | | | |
|
|
| | | | | | 8,152,508 |
| | | | |
|
|
Consumer Products & Services — 2.1% | | | | | |
Fortune Brands, Inc. | | 37,200 | | | 2,826,084 |
| | | | |
|
|
Drugs & Medicine — 1.0% | | | | | |
OSI Pharmaceuticals, Inc. *(a) | | 55,200 | | | 1,286,160 |
| | | | |
|
|
Financial Technology — 3.4% | | | | | |
Fiserv, Inc. * | | 55,300 | | | 2,415,504 |
MoneyGram International, Inc. | | 86,200 | | | 2,094,660 |
| | | | |
|
|
| | | | | | 4,510,164 |
| | | | |
|
|
Food — 0.7% | | | | | |
McCormick & Co., Inc. | | 29,800 | | | 902,642 |
| | | | |
|
|
Gaming/Lodging — 2.1% | | | | | |
Harrah’s Entertainment, Inc. | | 26,375 | | | 1,595,160 |
Marriott International, Inc. (Class “A” Stock) | | 19,950 | | | 1,189,419 |
| | | | |
|
|
| | | | | | 2,784,579 |
| | | | |
|
|
Healthcare Services — 0.6% | | | | | |
VCA Antech, Inc. * | | 30,100 | | | 776,580 |
| | | | |
|
|
Insurance — 0.7% | | | | | |
Willis Group Holdings Ltd. (United Kingdom) | | 24,675 | | | 916,430 |
| | | | |
|
|
Internet & Online — 1.5% | | | | | |
CNET Networks, Inc. * | | 148,500 | | | 2,018,115 |
| | | | |
|
|
Manufacturing — 3.4% | | | | | |
American Standard Cos., Inc. | | 55,570 | | | 2,113,883 |
Rockwell Automation, Inc. | | 45,200 | | | 2,402,380 |
| | | | |
|
|
| | | | | | 4,516,263 |
| | | | |
|
|
Medical Products — 7.4% | | | | | |
Advanced Medical Optics, Inc. * | | 23,300 | | | 831,344 |
Bard (C.R.), Inc. | | 42,600 | | | 2,657,388 |
Cooper Cos., Inc. (The) | | 9,400 | | | 647,096 |
Fisher Scientific International, Inc. * | | 45,976 | | | 2,597,644 |
Gen-Probe, Inc. | | 40,300 | | | 1,645,852 |
Kinetic Concepts, Inc. * | | 38,500 | | | 1,382,150 |
| | | | |
|
|
| | | | | | 9,761,474 |
| | | | |
|
|
Medical Supplies & Equipment — 4.3% | | | | | |
Biomet, Inc. | | 84,700 | | | 2,950,101 |
Charles River Laboratories International, Inc. * | | 63,025 | | | 2,757,974 |
| | | | |
|
|
| | | | | | 5,708,075 |
| | | | |
|
|
54
| | | | | | |
| | | Shares
| | Value (Note 2)
| |
Movies & Entertainment — 0.4% | | | | | | |
Lodgenet Entertainment Corp. * | | 36,550 | | $ | 475,150 | |
| | | | |
|
|
|
Networking/Telecom Equipment — 4.9% | | | | | | |
Amphenol Corp. | | 50,100 | | | 2,002,497 | |
FLIR Systems, Inc. * | | 123,246 | | | 2,583,236 | |
Juniper Networks, Inc. * | | 82,500 | | | 1,924,725 | |
| | | | |
|
|
|
| | | | | | 6,510,458 | |
| | | | |
|
|
|
Oil & Gas — 3.0% | | | | | | |
Weatherford International, Inc. Ltd. | | 33,000 | | | 2,065,800 | |
XTO Energy, Inc. | | 43,233 | | | 1,878,906 | |
| | | | |
|
|
|
| | | | | | 3,944,706 | |
| | | | |
|
|
|
Oil Well Services & Equipment — 4.1% | | | | | | |
Cooper Cameron Corp. * | | 34,500 | | | 2,543,685 | |
Smith International, Inc. (a) | | 89,450 | | | 2,898,180 | |
| | | | |
|
|
|
| | | | | | 5,441,865 | |
| | | | |
|
|
|
Pharmacy Benefit Manager — 2.3% | | | | | | |
Caremark Rx, Inc. * | | 30,000 | | | 1,572,000 | |
Medco Health Solutions, Inc. * | | 24,800 | | | 1,401,200 | |
| | | | |
|
|
|
| | | | | | 2,973,200 | |
| | | | |
|
|
|
Producer Goods — 2.3% | | | | | | |
Grainger, (W.W), Inc. | | 46,340 | | | 3,103,853 | |
| | | | |
|
|
|
Publishing — 3.9% | | | | | | |
Lamar Advertising Co. * | | 60,250 | | | 2,688,355 | |
Scripps, (E.W.) Co. (Class “A” Stock) (a) | | 54,100 | | | 2,477,780 | |
| | | | |
|
|
|
| | | | | | 5,166,135 | |
| | | | |
|
|
|
Restaurants — 1.5% | | | | | | |
Chang’s China Bistro, (P.F.), Inc. * | | 42,500 | | | 1,943,950 | |
| | | | |
|
|
|
Retailing — 4.6% | | | | | | |
PETCO Animal Supplies, Inc. * | | 123,350 | | | 2,344,884 | |
Select Comfort Corp. *(a) | | 48,179 | | | 1,055,120 | |
Williams-Sonoma, Inc. * | | 67,185 | | | 2,627,605 | |
| | | | |
|
|
|
| | | | | | 6,027,609 | |
| | | | |
|
|
|
Semi Capital — 2.3% | | | | | | |
KLA-Tencor Corp. | | 15,075 | | | 697,822 | |
Tessera Technologies, Inc. * | | 83,057 | | | 2,317,290 | |
| | | | |
|
|
|
| | | | | | 3,015,112 | |
| | | | |
|
|
|
Semiconductors — 5.6% | | | | | | |
Linear Technology Corp. | | 81,300 | | | 2,699,973 | |
Marvell Technology Group Ltd. * (Bermuda) | | 30,600 | | | 1,420,146 | |
Microchip Technology, Inc. | | 60,800 | | $ | 1,834,336 | |
Xilinx, Inc. | | 57,400 | | | 1,374,730 | |
| | | | |
|
|
|
| | | | | | 7,329,185 | |
| | | | |
|
|
|
Telecommunications — 2.4% | | | | | | |
Crown Castle International Corp. * | | 96,650 | | | 2,369,858 | |
Neustar, Inc. (Class “A” Stock) * | | 26,800 | | | 820,080 | |
| | | | |
|
|
|
| | | | | | 3,189,938 | |
| | | | |
|
|
|
Total Long-Term Investments
(Cost $118,143,229) | | | | | 132,650,240 | |
| | | | |
|
|
|
Short-Term Investments — 4.4% | | | | | | |
Money Market Mutual Fund | | | | | | |
Dryden Core Investment Fund - Taxable Money Market Series (b)(w) (Cost $5,792,414) | | 5,792,414 | | | 5,792,414 | |
| | | | |
|
|
|
Total Investments — 105.0% | | | | | | |
(Cost $123,935,643; Note 5) | | | | | 138,442,654 | |
Liabilities In Excess of Other Assets (includes cash collateral for securities on loan of $5,792,414) — (5.0%) | | | | | (6,590,989 | ) |
| | | | |
|
|
|
Net Assets — 100.0% | | | | $ | 131,851,665 | |
| | | | |
|
|
|
The following annotations are used in portfolio descriptions:
| * | Non-income producing security. |
| (a) | All or a portion of security is on loan. The aggregate market value of such securities is $5,615,570; cash collateral of $5,792,414 (included with liabilities) was received with which the portfolio purchased highly liquid short-term investments. |
| (b) | Represents security purchased with cash collateral for securities on loan. |
| (w) | Prudential Investments LLC, the manager of the Fund also serves as manager of the Dryden Core Investment Fund-Taxable Money Market Series. |
55
Strategic Partners Mid-Cap Growth Fund
SCHEDULE OF INVESTMENTS
October 31, 2005
The industry classification of long-term portfolio holdings, short-term investments and liablilities in excess of other assets shown as a percentage of net assets as of October 31, 2005 were as follows:
| | | |
Commercial Services | | 11.7 | % |
Medical Products | | 7.4 | |
Computer Software | | 6.2 | |
Semiconductors | | 5.6 | |
Networking/Telecom Equipment | | 4.9 | |
Retailing | | 4.6 | |
Medical Supplies & Equipment | | 4.3 | |
Broadcasting & Cable/Satellite TV | | 4.1 | |
Oil Well Services & Equipment | | 4.1 | |
Computer Hardware | | 3.9 | |
Publishing | | 3.9 | |
Financial Technology | | 3.4 | |
Manufacturing | | 3.4 | |
Oil & Gas | | 3.0 | |
Apparel/Shoes | | 2.8 | |
Telecommunications | | 2.4 | |
Pharmacy Benefit Manager | | 2.3 | |
Producer Goods | | 2.3 | |
Semi Capital | | 2.3 | |
Auto Parts & Related | | 2.2 | |
Audio & Visual Equipment | | 2.1 | |
Consumer Products & Services | | 2.1 | |
Gaming/Lodging | | 2.1 | |
Aerospace & Defense | | 1.7 | |
Internet & Online | | 1.5 | |
Restaurants | | 1.5 | |
Drugs & Medicine | | 1.0 | |
Audio Technology | | 0.8 | |
Food | | 0.7 | |
Insurance | | 0.7 | |
Banks | | 0.6 | |
Healthcare Services | | 0.6 | |
Movies & Entertainment | | 0.4 | |
Short-Term Investments (Entire portion represents investments purchased with collateral received from securities on loan) | | 4.4 | |
| | |
|
|
| | | 105.0 | |
Liabilities In Excess of Other Assets | | –5.0 | |
| | |
|
|
Total | | 100.0 | % |
| | |
|
|
See Notes to Financial Statements.
56
Strategic Partners Mid Cap Value Fund
SCHEDULE OF INVESTMENTS
October 31, 2005
| | | | | |
| | | Shares
| | Value
(Note 2)
|
Long-Term Investments — 99.4% | | | | | |
Common Stocks | | | | | |
Automotive Parts — 4.9% | | | | | |
Advance Auto Parts, Inc. * | | 135,450 | | $ | 5,079,375 |
BorgWarner, Inc. | | 66,700 | | | 3,867,933 |
Johnson Controls, Inc. (a) | | 78,500 | | | 5,341,925 |
| | | | |
|
|
| | | | | | 14,289,233 |
| | | | |
|
|
Beverages — 1.0% | | | | | |
Constellation Brands, Inc. (Class “A” Stock) | | 127,000 | | | 2,989,580 |
| | | | |
|
|
Business Services — 1.2% | | | | | |
Manpower, Inc. | | 77,100 | | | 3,491,088 |
| | | | |
|
|
Clothing & Apparel — 0.9% | | | | | |
Jones Apparel Group, Inc. | | 55,500 | | | 1,514,040 |
VF Corp. | | 22,900 | | | 1,196,525 |
| | | | |
|
|
| | | | | | 2,710,565 |
| | | | |
|
|
Computer Hardware — 1.6% | | | | | |
Lexmark International, Inc., (Class “A” Stock) * | | 113,300 | | | 4,704,216 |
| | | | |
|
|
Construction — 14.0% | | | | | |
Beazer Homes USA, Inc. (a) | | 94,300 | | | 5,464,685 |
Centex Corp. | | 105,600 | | | 6,795,360 |
Chicago Bridge & Iron Co. NV (Netherlands) | | 97,200 | | | 2,167,560 |
Hovnanian Enterprises, Inc. (Class “A” Stock) * | | 116,200 | | | 5,227,838 |
KB Home | | 57,400 | | | 3,751,090 |
Lennar Corp. (Class “A” Stock) (a) | | 123,200 | | | 6,847,456 |
Pulte Homes, Inc. | | 169,400 | | | 6,401,626 |
WCI Communities, Inc. *(a) | | 172,400 | | | 4,313,448 |
| | | | |
|
|
| | | | | | 40,969,063 |
| | | | |
|
|
Consumer Products & Services — 3.0% | | | | | |
Black & Decker Corp. | | 7,700 | | | 632,401 |
Spectrum Brands, Inc. * | | 170,200 | | | 3,523,140 |
Whirlpool Corp. | | 58,800 | | | 4,615,800 |
| | | | |
|
|
| | | | | | 8,771,341 |
| | | | |
|
|
Education — 2.0% | | | | | |
Career Education Corp. (a) | | 167,200 | | | 5,950,648 |
| | | | |
|
|
Entertainment & Leisure — 1.6% | | | | | |
Harley-Davidson, Inc. (a) | | 95,800 | | | 4,744,974 |
| | | | |
|
|
Finance Services — 4.8% | | | | | |
AMBAC Financial Group, Inc. | | 31,350 | | | 2,222,401 |
Bear Stearns Cos., Inc. | | 40,100 | | | 4,242,580 |
CIT Group, Inc. | | 54,400 | | | 2,487,712 |
IndyMac Bancorp, Inc. (a) | | 132,000 | | $ | 4,927,560 |
| | | | |
|
|
| | | | | | 13,880,253 |
| | | | |
|
|
Financial — Bank & Trust — 5.1% | | | | | |
Astoria Financial Corp. | | 135,750 | | | 3,794,212 |
First Horizon National Corp. (a) | | 53,400 | | | 2,065,512 |
Hudson City Bancorp, Inc. | | 529,600 | | | 6,270,464 |
North Fork Bancorp, Inc. | | 107,502 | | | 2,724,101 |
| | | | |
|
|
| | | | | | 14,854,289 |
| | | | |
|
|
Healthcare Services — 2.4% | | | | | |
Coventry Health Care, Inc. * | | 75,850 | | | 4,095,142 |
Wellpoint, Inc. * | | 37,800 | | | 2,822,904 |
| | | | |
|
|
| | | | | | 6,918,046 |
| | | | |
|
|
Industrial Products — 0.8% | | | | | |
Ingersoll-Rand Co. Ltd. (Class “A” Stock) | | 63,700 | | | 2,407,223 |
| | | | |
|
|
Insurance — 4.3% | | | | | |
Arch Capital Group Ltd. * | | 41,000 | | | 2,029,500 |
Endurance Specialty Holdings Ltd. | | 107,500 | | | 3,564,700 |
PMI Group, Inc. (The) | | 131,300 | | | 5,236,244 |
Radian Group, Inc. | | 33,200 | | | 1,729,720 |
| | | | |
|
|
| | | | | | 12,560,164 |
| | | | |
|
|
Internet Services — 1.8% | | | | | |
Check Point Software Technologies Ltd. * | | 228,800 | | | 5,115,968 |
| | | | |
|
|
Machinery & Equipment — 4.7% | | | | | |
Briggs & Stratton Corp. | | 85,300 | | | 2,727,894 |
Joy Global, Inc. | | 128,500 | | | 5,894,295 |
Terex Corp. * | | 92,600 | | | 5,090,222 |
| | | | |
|
|
| | | | | | 13,712,411 |
| | | | |
|
|
Metals & Mining — 9.1% | | | | | |
Alpha Natural Resources, Inc. * | | 199,400 | | | 4,735,750 |
Arch Coal, Inc. (a) | | 116,600 | | | 8,986,362 |
Peabody Energy Corp. | | 84,800 | | | 6,627,968 |
Phelps Dodge Corp. | | 50,400 | | | 6,071,688 |
| | | | |
|
|
| | | | | | 26,421,768 |
| | | | |
|
|
Oil & Gas — 13.5% | | | | | |
Canadian Natural Resources Ltd. | | 167,100 | | | 6,886,191 |
Denbury Resources, Inc. | | 142,800 | | | 6,230,364 |
Quicksilver Resources, Inc. *(a) | | 148,450 | | | 5,749,469 |
Southwestern Energy Co. * | | 50,000 | | | 3,627,000 |
Sunoco, Inc. | | 38,300 | | | 2,853,350 |
Talisman Energy, Inc. (Canada) | | 136,500 | | | 6,045,585 |
XTO Energy, Inc. | | 184,866 | | | 8,034,276 |
| | | | |
|
|
| | | | | | 39,426,235 |
| | | | |
|
|
57
Strategic Partners Mid Cap Value Fund
SCHEDULE OF INVESTMENTS
October 31, 2005
| | | | | | |
| | | Shares
| | Value
(Note 2)
| |
Pharmaceuticals — 4.1% | | | | | | |
NBTY, Inc. * | | 209,300 | | $ | 4,188,093 | |
Omnicare, Inc. | | 78,300 | | | 4,236,030 | |
Shire Pharmaceuticals Group PLC, ADR (a) (United Kingdom) | | 98,800 | | | 3,540,992 | |
| | | | |
|
|
|
| | | | | | 11,965,115 | |
| | | | |
|
|
|
Real Estate Investment Trust — 3.7% | | | | | | |
Colonial Properties Trust | | 81,400 | | | 3,557,994 | |
Developers Diversified Realty Corp. | | 110,500 | | | 4,826,640 | |
Trizec Properties, Inc. | | 110,600 | | | 2,460,850 | |
| | | | |
|
|
|
| | | | | | 10,845,484 | |
| | | | |
|
|
|
Retail & Merchandising — 2.6% | | | | | | |
Dollar Tree Stores, Inc. * | | 28,600 | | | 616,616 | |
Hot Topic, Inc. * | | 48,600 | | | 723,654 | |
Ross Stores, Inc. | | 113,100 | | | 3,058,224 | |
TJX Cos., Inc. | | 148,400 | | | 3,195,052 | |
| | | | |
|
|
|
| | | | | | 7,593,546 | |
| | | | |
|
|
|
Telecommunications — 2.5% | | | | | | |
Avaya, Inc. * | | 169,800 | | | 1,956,096 | |
Scientific-Atlanta, Inc. | | 146,900 | | | 5,206,136 | |
| | | | |
|
|
|
| | | | | | 7,162,232 | |
| | | | |
|
|
|
Transportation — 4.8% | | | | | | |
Frontline Ltd. (a) | | 111,000 | | | 4,407,810 | |
General Maritime Corp. (a) | | 107,900 | | | 4,017,117 | |
Overseas Shipholding Group, Inc. | | 59,400 | | | 2,827,440 | |
Teekay Shipping Corp. (a) | | 73,700 | | | 2,906,728 | |
| | | | |
|
|
|
| | | | | | 14,159,095 | |
| | | | |
|
|
|
Utilities — 5.0% | | | | | | |
DPL, Inc. | | 177,500 | | | 4,574,175 | |
Edison International * | | 54,300 | | | 2,376,168 | |
TXU Corp. | | 76,100 | | | 7,667,075 | |
| | | | |
|
|
|
| | | | | | 14,617,418 | |
| | | | |
|
|
|
Total Long-Term Investments
(Cost $ 259,775,485) | | | | | 290,259,955 | |
| | | | |
|
|
|
Short-Term Investments — 20.4% | | | | | | |
Money Market Mutual Fund — 18.8% | | | | | | |
Dryden Core Investment Fund - Taxable Money Market Series (b)(w) | | 54,913,704 | | | 54,913,704 | |
| | | | |
|
|
|
Registered Investment Company — 1.6% | | | | | | |
BlackRock Provident | | | | | | |
Institutional Funds | | | | | | |
TempCash Portfolio | | 4,590,989 | | $ | 4,590,989 | |
| | | | |
|
|
|
Total Short-Term Investments
(Cost $ 59,504,693) | | | | | 59,504,693 | |
| | | | |
|
|
|
Total Investments — 119.8%
(Cost $319,280,178; Note 5) | | | | | 349,764,648 | |
Liabilities In Excess of Other Assets
(includes cash collateral for securities on loan of $54,913,704) — (19.8%) | | | | | (57,827,752 | ) |
| | | | |
|
|
|
Net Assets — 100.0% | | | | $ | 291,936,896 | |
| | | | |
|
|
|
The following abbreviations and annotations are used in portfolio descriptions:
| ADR | American Depositary Receipt |
| * | Non-income producing security. |
| (a) | All or a portion of security is on loan. The aggregate market value of such securities is $53,710,418; cash collateral of $54,913,704 (included with liabilities) was received with which the portfolio purchased highly liquid short-term investments. |
| (b) | Represents security purchased with cash collateral for securities on loan. |
| (w) | Prudential Investments LLC, the manager of the Fund also serves as manager of the Dryden Core Investment Fund -Taxable Money Market Series. |
58
The industry classification of long-term portfolio holdings, short-term investments and liabilities in excess of other assets shown as a percentage of net assets as of October 31, 2005 were as follows:
| | | |
Construction | | 14.0 | % |
Oil & Gas | | 13.5 | |
Metals & Mining | | 9.1 | |
Financial - Bank & Trust | | 5.1 | |
Utilities | | 5.0 | |
Automotive Parts | | 4.9 | |
Finance Services | | 4.8 | |
Transportation | | 4.8 | |
Machinery & Equipment | | 4.7 | |
Insurance | | 4.3 | |
Pharmaceuticals | | 4.1 | |
Real Estate Investment Trust | | 3.7 | |
Consumer Products & Services | | 3.0 | |
Retail & Merchandising | | 2.6 | |
Telecommunications | | 2.5 | |
Healthcare Services | | 2.4 | |
Education | | 2.0 | |
Internet Services | | 1.8 | |
Computer Hardware | | 1.6 | |
Entertainment & Leisure | | 1.6 | |
Business Services | | 1.2 | |
Beverages | | 1.0 | |
Clothing & Apparel | | 0.9 | |
Industrial Products | | 0.8 | |
Short-Term Investments (18.8% represents investment purchased with collateral received from securities on loan) | | 20.4 | |
| | |
|
|
| | | 119.8 | |
Liabilities In Excess of Other Assets | | –19.8 | |
| | |
|
|
Total | | 100.0 | % |
| | |
|
|
See Notes to Financial Statements.
59
Strategic Partners Technology Fund
SCHEDULE OF INVESTMENTS
October 31, 2005
| | | | | | |
| | | Shares
| | Value (Note 2)
| |
Long-Term Investments — 98.3% | | | | | | |
Common Stocks | | | | | | |
Business Services — 5.7% | | | | | | |
Accenture Ltd. (Class “A” Stock) * | | 13,500 | | $ | 355,185 | |
Automatic Data Processing, Inc. | | 10,300 | | | 480,598 | |
| | | | |
|
|
|
| | | | | | 835,783 | |
| | | | |
|
|
|
Computer Hardware — 6.4% | | | | | | |
Apple Computer, Inc. * | | 10,000 | | | 575,900 | |
Dell, Inc. * | | 11,300 | | | 360,244 | |
| | | | |
|
|
|
| | | | | | 936,144 | |
| | | | |
|
|
|
Computer Services & Software — 24.5% | | | | | | |
Adobe Systems, Inc. | | 17,300 | | | 557,925 | |
Check Point Software Technologies Ltd. * | | 12,700 | | | 283,972 | |
Cognizant Technology Solutions Corp. * | | 9,500 | | | 417,810 | |
Cognos, Inc. * (Canada) | | 9,800 | | | 367,794 | |
Electronic Arts, Inc. * | | 7,500 | | | 426,600 | |
EMC Corp. * | | 28,500 | | | 397,860 | |
Infosys Technologies Ltd., ADR (India) | | 4,500 | | | 306,000 | |
Microsoft Corp. | | 14,700 | | | 377,790 | |
Oracle Corp. * | | 12,200 | | | 154,696 | |
SAP AG, ADR (Germany) | | 7,400 | | | 317,756 | |
| | | | |
|
|
|
| | | | | | 3,608,203 | |
| | | | |
|
|
|
Computers — Networking — 8.2% | | | | | | |
Cisco Systems, Inc. * | | 26,000 | | | 453,700 | |
Juniper Networks, Inc. * | | 17,500 | | | 408,275 | |
Network Appliance, Inc. * | | 12,500 | | | 342,000 | |
| | | | |
|
|
|
| | | | | | 1,203,975 | |
| | | | |
|
|
|
Electronic Components & Equipment — 1.9% | | | | | | |
Linear Technology Corp. | | 8,500 | | | 282,285 | |
| | | | |
|
|
|
Internet Services — 11.0% | | | | | | |
Checkfree Corp. * | | 8,000 | | | 340,000 | |
eBay, Inc. * | | 3,800 | | | 150,480 | |
Google, Inc. (Class “A” Stock) * | | 1,700 | | | 632,638 | |
Yahoo!, Inc. * | | 13,500 | | | 499,095 | |
| | | | |
|
|
|
| | | | | | 1,622,213 | |
| | | | |
|
|
|
Pharmaceuticals — 7.8% | | | | | | |
Amgen, Inc. * | | 4,700 | | | 356,072 | |
Genentech, Inc. * | | 4,000 | | | 362,400 | |
Teva Pharmaceutical Industries Ltd., ADR (Israel) | | 11,500 | | | 438,380 | |
| | | | |
|
|
|
| | | | | | 1,156,852 | |
| | | | |
|
|
|
Semiconductors — 18.6% | | | | | | |
Applied Materials, Inc. | | 17,500 | | $ | 286,650 | |
Broadcom Corp. (Class “A” Stock) * | | 10,300 | | | 437,338 | |
Intel Corp. | | 7,700 | | | 180,950 | |
KLA-Tencor Corp. | | 7,200 | | | 333,288 | |
Marvell Technology Group Ltd. * (Bermuda) | | 10,500 | | | 487,305 | |
National Semiconductor Corp. | | 13,000 | | | 294,190 | |
Taiwan Semiconductor Manufacturing Co. Ltd., ADR (Taiwan) | | 55,000 | | | 444,400 | |
Xilinx, Inc. | | 11,300 | | | 270,635 | |
| | | | |
|
|
|
| | | | | | 2,734,756 | |
| | | | |
|
|
|
Telecommunications — 14.2% | | | | | | |
Amdocs Ltd. * | | 13,500 | | | 357,345 | |
Comverse Technology, Inc. * | | 17,000 | | | 426,700 | |
Corning, Inc. * | | 18,600 | | | 373,674 | |
Motorola, Inc. | | 22,500 | | | 498,600 | |
QUALCOMM, Inc. | | 11,000 | | | 437,360 | |
| | | | |
|
|
|
| | | | | | 2,093,679 | |
| | | | |
|
|
|
Total Long-Term Investments
(Cost $ 11,471,770) | | | | | 14,473,890 | |
| | | | |
|
|
|
Short-Term Investment — 2.6% | | | | | | |
Registered Investment Company | | | | | | |
BlackRock Provident
Institutional Funds
TempCash Portfolio
(Cost $ 377,195) | | 377,195 | | | 377,195 | |
| | | | |
|
|
|
Total Investments — 100.9%
(Cost $11,848,965; Note 5) | | | | | 14,851,085 | |
Liabilities In Excess of Other Assets — (0.9%) | | | | | (131,761 | ) |
| | | | |
|
|
|
Net Assets — 100.0% | | | | $ | 14,719,324 | |
| | | | |
|
|
|
The following abbreviations and annotations are used in portfolio descriptions:
| ADR | American Depositary Receipt |
| * | Non-income producing security. |
60
The industry classification of long-term portfolio holdings, short-term investments and liabilities in excess of other assets shown as a percentage of net assets as of October 31, 2005 were as follows:
| | | |
Computer Services & Software | | 24.5 | % |
Semiconductors | | 18.6 | |
Telecommunications | | 14.2 | |
Internet Services | | 11.0 | |
Computers - Networking | | 8.2 | |
Pharmaceuticals | | 7.8 | |
Computer Hardware | | 6.4 | |
Business Services | | 5.7 | |
Electronic Components & Equipment | | 1.9 | |
Short-Term Investments | | 2.6 | |
| | |
|
|
| | | 100.9 | |
Liabilities In Excess of Other Assets | | –0.9 | |
| | |
|
|
Total | | 100.0 | % |
| | |
|
|
See Notes to Financial Statements.
61
Strategic Partners Health Sciences Fund
SCHEDULE OF INVESTMENTS
October 31, 2005
| | | | | |
| | | Shares
| | Value
(Note 2)
|
Long-Term Investments — 91.5% | | | | | |
Common Stocks | | | | | |
Biotechnology Healthcare — 8.4% | | | | | |
Amgen, Inc. * | | 10,900 | | $ | 825,784 |
Human Genome Sciences, Inc. * | | 9,700 | | | 80,995 |
Protein Design Labs, Inc. * | | 34,400 | | | 963,888 |
Tercica, Inc. * | | 2,400 | | | 23,976 |
| | | | |
|
|
| | | | | | 1,894,643 |
| | | | |
|
|
Business Services — 0.8% | | | | | |
Dionex Corp. * | | 3,700 | | | 179,191 |
| | | | |
|
|
Chemicals — 0.2% | | | | | |
Akzo Nobel NV, ADR (Netherlands) | | 900 | | | 38,997 |
| | | | |
|
|
Commercial Services — 0.8% | | | | | |
HMS Holdings Corp. * | | 24,600 | | | 175,152 |
| | | | |
|
|
Drugs & Medicine — 0.1% | | | | | |
Idenix Pharmaceuticals, Inc. * | | 1,120 | | | 23,307 |
| | | | |
|
|
Electronic Components & Equipment — 1.6% | | | | | |
Varian, Inc. * | | 5,800 | | | 213,266 |
Waters Corp. * | | 3,800 | | | 137,560 |
| | | | |
|
|
| | | | | | 350,826 |
| | | | |
|
|
Health Care — 0.4% | | | | | |
DaVita, Inc. * | | 1,800 | | | 88,524 |
| | | | |
|
|
Health Care — Medical Products — 0.3% | | | | | |
PSS World Medical, Inc. * | | 5,497 | | | 76,573 |
| | | | |
|
|
Healthcare Facilities — 2.0% | | | | | |
Community Health Systems, Inc. * | | 11,900 | | | 441,609 |
| | | | |
|
|
Healthcare Services — 6.6% | | | | | |
Coventry Health Care, Inc. * | | 5,044 | | | 272,325 |
HCA, Inc. | | 2,000 | | | 96,380 |
Humana Inc. * | | 1,700 | | | 75,463 |
Kindred Healthcare, Inc. * | | 6,860 | | | 192,080 |
LifePoint Hospitals, Inc. * | | 5,829 | | | 227,914 |
Pacificare Health Systems, Inc. * | | 7,500 | | | 617,700 |
| | | | |
|
|
| | | | | | 1,481,862 |
| | | | |
|
|
Healthcare Supplies — 4.9% | | | | | |
Johnson & Johnson | | 400 | | | 25,048 |
SonoSight, Inc. * | | 9,769 | | | 287,111 |
Wyeth | | 17,800 | | | 793,168 |
| | | | |
|
|
| | | | | | 1,105,327 |
| | | | |
|
|
Insurance — 2.6% | | | | | |
WellPoint, Inc. * | | 7,800 | | | 582,504 |
| | | | |
|
|
Machinery & Equipment — 1.1% | | | | | |
Thermo Electron Corp. * | | 8,176 | | | 246,833 |
| | | | |
|
|
Managed Healthcare — 2.2% | | | | | |
Aetna, Inc. * | | 2,850 | | $ | 252,396 |
Health Net, Inc. * | | 5,200 | | | 243,568 |
| | | | |
|
|
| | | | | | 495,964 |
| | | | |
|
|
Medical Equipment — 0.7% | | | | | |
Stryker Corp. | | 4,000 | | | 164,280 |
| | | | |
|
|
Medical Equipment & Devices — 4.6% | | | | | |
Baxter International, Inc. | | 2,700 | | | 103,221 |
Becton Dickinson & Co. | | 1,100 | | | 55,825 |
Gen-Probe, Inc. * | | 688 | | | 28,098 |
St. Jude Medical, Inc. * | | 17,394 | | | 836,130 |
| | | | |
|
|
| | | | | | 1,023,274 |
| | | | |
|
|
Medical Supplies — 0.3% | | | | | |
Charles River Laboratories International, Inc. * | | 1,510 | | | 66,078 |
| | | | |
|
|
Medical Supplies & Equipment — 17.2% | | | | | |
Advanced Medical Optics * | | 4,774 | | | 170,336 |
Astellas Pharma Inc. (Japan) | | 14,100 | | | 503,645 |
Atherogenics, Inc. * | | 3,700 | | | 55,500 |
ATS Medical, Inc. * | | 11,100 | | | 33,183 |
Bard (C.R.), Inc. | | 800 | | | 49,904 |
Beckman Coulter, Inc. | | 3,900 | | | 192,114 |
Biomet, Inc. | | 6,003 | | | 209,084 |
Coley Pharmaceutical Group, Inc. | | 2,700 | | | 39,987 |
Cytyc Corp. * | | 6,000 | | | 152,100 |
Eisai Co. Ltd. (Japan) | | 20,500 | | | 802,845 |
Fisher Scientific International, Inc. * | | 2,600 | | | 146,900 |
Immucor, Inc. * | | 4,115 | | | 106,661 |
Inamed Corp. * | | 1,010 | | | 71,993 |
Intralase Corp. * | | 600 | | | 9,276 |
Medicines Co. * | | 2,800 | | | 47,992 |
Medtronic, Inc. | | 11,000 | | | 623,260 |
Mentor Corp. | | 4,962 | | | 223,290 |
Serologicals Corp. * | | 7,600 | | | 148,048 |
Varian Medical Systems, Inc. * | | 3,200 | | | 145,792 |
Vnus Medical Technologies * | | 3,800 | | | 38,874 |
Wright Medical Group, Inc. * | | 4,600 | | | 85,606 |
| | | | |
|
|
| | | | | | 3,856,390 |
| | | | |
|
|
Pharmaceuticals — 28.2% | | | | | |
Abgenix, Inc. * | | 3,000 | | | 31,200 |
Ariad Pharmaceuticals Inc * | | 7,200 | | | 50,112 |
Biogen Idec, Inc. * | | 10,200 | | | 414,426 |
Caremark Rx, Inc. * | | 2,500 | | | 131,000 |
Cubist Pharmaceuticals, Inc. * | | 6,200 | | | 125,302 |
Dov Pharmaceutical, Inc. * | | 900 | | | 13,977 |
62
| | | | | |
| | | Shares
| | Value (Note 2)
|
Endo Pharmaceutical, Inc * | | 5,085 | | $ | 136,888 |
Epix Pharmaceuticals, Inc. * | | 2,900 | | | 20,300 |
Impax Laboratories, Inc. * | | 4,500 | | | 47,621 |
IVAX Corp. * | | 2,100 | | | 59,955 |
Keryx Biopharmaceuticals, Inc. * | | 700 | | | 10,115 |
Medicis Pharmaceutical (Class “A” Stock) | | 8,110 | | | 239,245 |
Merck KGAA * (Germany) | | 1,332 | | | 110,147 |
MGI Pharma, Inc. | | 4,800 | | | 90,048 |
Nabi Biopharmaceuticals, Inc. * | | 8,335 | | | 107,105 |
Novo-Nordisk A/S, ADR (Denmark) | | 7,000 | | | 360,920 |
Panacos Pharmcueticals, Inc. * | | 5,510 | | | 43,529 |
Pharmaceutical Product Development, Inc. * | | 9,100 | | | 522,977 |
QLT PhotoTherapeutics, Inc. (Canada) * | | 34,092 | | | 241,031 |
Rigel Pharmaceuticals, Inc. * | | 2,029 | | | 45,551 |
Roche Holding AG (Switzerland) | | 12,100 | | | 1,807,469 |
Salix Pharmaceuticals Ltd. * | | 1,200 | | | 21,528 |
Sanofi-Aventis, ADR (France) | | 18,200 | | | 730,184 |
Sepracor, Inc. * | | 2,704 | | | 152,100 |
Shionogi & Co. Ltd (Japan) | | 9,000 | | | 109,443 |
Shire Pharmaceuticals Group PLC, ADR (United Kingdom) * | | 14,000 | | | 501,760 |
Taro Pharmaceuticals Industries * | | 4,237 | | | 93,214 |
Theravance, Inc. * | | 2,392 | | | 51,835 |
Xenoport, Inc. * | | 2,542 | | | 34,876 |
Zymogenetics, Inc. * | | 1,700 | | | 29,784 |
| | | | |
|
|
| | | | | | 6,333,642 |
| | | | |
|
|
Pharmaceuticals — Manufacturing — 4.4% | | | | | |
Forest Laboratories, Inc. * | | 5,100 | | | 193,341 |
Kyorin Pharmaceutical Co. (Japan) | | 6,000 | | | 76,376 |
Novartis AG, ADR (Switzerland) | | 11,800 | | | 635,076 |
Santen Pharmaceutical Co. Ltd. (Japan) | | 1,000 | | | 25,529 |
Teva Pharmaceutical Industries Ltd., ADR (Israel) | | 1,600 | | | 60,992 |
| | | | |
|
|
| | | | | | 991,314 |
| | | | |
|
|
Pharmaceuticals — Research & Manufacturing — 3.4% | | | | | |
Lilly, (Eli) & Co. | | 6,540 | | | 325,627 |
Pfizer, Inc. | | 20,400 | | | 443,496 |
| | | | |
|
|
| | | | | | 769,123 |
| | | | |
|
|
Retail & Merchandising — 0.7% | | | | | |
CVS Corp. | | 6,554 | | $ | 159,983 |
| | | | |
|
|
Total Long-Term Investments
(Cost $17,927,350) | | | | | 20,545,396 |
| | | | |
|
|
Short-Term Investments — 5.0% | | | | | |
Registered Investment Companies | | | | | |
BlackRock Provident Institutional Funds TempCash Portfolio (Cost $1,128,892) | | 1,128,892 | | | 1,128,892 |
| | | | |
|
|
Total Investments(o) — 96.5%
(Cost $19,056,242; Note 5) | | | | | 21,674,288 |
Other Assets In Excess of Liabilities — 3.5% | | | | | 786,777 |
| | | | |
|
|
Net Assets — 100.0% | | | | $ | 22,461,065 |
| | | | |
|
|
The following abbreviations and annotations are used in portfolio descriptions:
| ADR | American Depositary Receipt |
| * | Non-income producing security. |
| (o) | As of October 31, 2005, 5 securities representing $1,517,837 and 7.0% of the total market value were fair valued in accordance with the policies adopted by the Board of Directors. |
63
Strategic Partners Health Sciences Fund
SCHEDULE OF INVESTMENTS
October 31, 2005
The industry classification of long-term portfolio holdings, short-term investments and other assets in excess of liabilities shown as a percentage of net assets as of October 31, 2005 were as follows:
| | | |
Pharmaceuticals | | 28.2 | % |
Medical Supplies & Equipment | | 17.2 | |
Biotechnology Healthcare | | 8.4 | |
Healthcare Services | | 6.6 | |
Healthcare Supplies | | 4.9 | |
Medical Equipment & Devices | | 4.6 | |
Pharmaceuticals - Manufacturing | | 4.4 | |
Pharmaceuticals - Research & Manufacturing | | 3.4 | |
Insurance | | 2.6 | |
Managed Healthcare | | 2.2 | |
Healthcare Facilities | | 2.0 | |
Electronic Components & Equipment | | 1.6 | |
Machinery & Equipment | | 1.1 | |
Business Services | | 0.8 | |
Commercial Services | | 0.8 | |
Medical Equipment | | 0.7 | |
Retail & Merchandising | | 0.7 | |
Health Care | | 0.4 | |
Health Care - Medical Products | | 0.3 | |
Medical Supplies | | 0.3 | |
Chemicals | | 0.2 | |
Drugs & Medicine | | 0.1 | |
Short-Term Investments | | 5.0 | |
| | |
|
|
| | | 96.5 | |
Other Assets In Excess of Liabilities | | 3.5 | |
| | |
|
|
Total | | 100.0 | % |
| | |
|
|
See Notes to Financial Statements.
64
Strategic Partners Managed OTC Fund
SCHEDULE OF INVESTMENTS
October 31, 2005
| | | | | |
| | | Shares
| | Value (Note 2)
|
Long-Term Investments — 92.6% | | | | | |
Common Stocks | | | | | |
Advertising — 0.3% | | | | | |
Lamar Advertising Co. * | | 1,587 | | $ | 70,812 |
| | | | |
|
|
Automobile Manufacturers — 1.0% | | | | | |
PACCAR, Inc. | | 3,588 | | | 251,232 |
| | | | |
|
|
Biotechnology — 7.9% | | | | | |
Amgen, Inc. * | | 10,764 | | | 815,480 |
Biogen Idec, Inc. * | | 6,900 | | | 280,347 |
Chiron Corp. * | | 4,899 | | | 216,242 |
Genzyme Corp. * | | 6,072 | | | 439,005 |
Invitrogen Corp. * | | 966 | | | 61,428 |
Medimmune, Inc. * | | 4,968 | | | 173,781 |
Millennium Pharmaceuticals, Inc. | | 6,348 | | | 57,894 |
| | | | |
|
|
| | | | | | 2,044,177 |
| | | | |
|
|
Broadcasting — 1.1% | | | | | |
Sirius Satellite Radio, Inc. | | 26,979 | | | 168,349 |
XM Satellite Radio Holdings, Inc. (Class “A” Stock) | | 4,278 | | | 123,335 |
| | | | |
|
|
| | | | | | 291,684 |
| | | | |
|
|
Cable Television — 0.4% | | | | | |
Liberty Global, Inc. (Class “A” Stock) * | | 4,554 | | | 112,803 |
| | | | |
|
|
Chemicals — 0.3% | | | | | |
Sigma-Aldrich Corp. * | | 1,242 | | | 79,115 |
| | | | |
|
|
Commercial Services — 2.1% | | | | | |
Apollo Group, Inc. (Class “A” Stock) * | | 3,450 | | | 217,419 |
Career Education Corp. | | 1,932 | | | 68,760 |
Paychex, Inc. | | 6,762 | | | 262,095 |
| | | | |
|
|
| | | | | | 548,274 |
| | | | |
|
|
Computer Services & Software — 1.2% | | | | | |
Autodesk, Inc. | | 4,485 | | | 202,408 |
Cognizant Technology Solutions Corp. * | | 2,484 | | | 109,246 |
| | | | |
|
|
| | | | | | 311,654 |
| | | | |
|
|
Computers — 9.8% | | | | | |
Apple Computer, Inc. * | | 21,735 | | | 1,251,719 |
Dell, Inc. * | | 16,560 | | | 527,933 |
Network Appliance, Inc. * | | 7,245 | | | 198,223 |
Research in Motion Ltd. * | | 3,588 | | | 220,626 |
SanDisk Corp. | | 3,105 | | | 182,853 |
Sun Microsystems Inc. | | 27,807 | | | 111,228 |
Synopsys, Inc. | | 2,484 | | | 47,072 |
| | | | |
|
|
| | | | | | 2,539,654 |
| | | | |
|
|
Containers & Packaging — 0.2% | | | | | |
Smurfit-Stone Container Corp. * | | 4,692 | | $ | 49,547 |
| | | | |
|
|
Distribution/Wholesale — 0.7% | | | | | |
CDW Corp. | | 1,587 | | | 89,428 |
Fastenal Co. | | 1,380 | | | 96,779 |
| | | | |
|
|
| | | | | | 186,207 |
| | | | |
|
|
Electronic Components & Equipment — 0.5% | | | | | |
American Power Conversion Corp. | | 3,657 | | | 78,223 |
Molex, Inc. | | 1,863 | | | 47,153 |
| | | | |
|
|
| | | | | | 125,376 |
| | | | |
|
|
Electronics — 1.0% | | | | | |
Flextronics International Ltd. * | | 11,661 | | | 108,331 |
Garmin Ltd. | | 1,863 | | | 106,992 |
Sanmina-SCI Corp. * | | 10,557 | | | 38,533 |
| | | | |
|
|
| | | | | | 253,856 |
| | | | |
|
|
Entertainment & Leisure — 0.4% | | | | | |
Wynn Resorts Ltd. * | | 2,001 | | | 93,407 |
| | | | |
|
|
Food — 0.7% | | | | | |
Whole Foods Market, Inc. | | 1,242 | | | 179,009 |
| | | | |
|
|
Healthcare Services — 0.3% | | | | | |
Lincare Holdings, Inc. | | 1,794 | | | 73,285 |
| | | | |
|
|
Healthcare-Products — 0.8% | | | | | |
Biomet, Inc. | | 6,279 | | | 218,697 |
| | | | |
|
|
Internet Services — 9.1% | | | | | |
Amazon.Com, Inc. * | | 5,106 | | | 203,627 |
Check Point Software Technologies Ltd. * | | 4,554 | | | 101,828 |
eBay, Inc. * | | 18,975 | | | 751,410 |
IAC/InterActiveCorp | | 6,624 | | | 169,574 |
Symantec Corp. * | | 23,511 | | | 560,737 |
VeriSign, Inc. * | | 4,692 | | | 110,872 |
Yahoo!, Inc. * | | 12,696 | | | 469,371 |
| | | | |
|
|
| | | | | | 2,367,419 |
| | | | |
|
|
Media — 2.4% | | | | | |
Comcast Corp. (Class “A” Stock) | | 17,871 | | | 497,350 |
EchoStar Communications Corp. (Class “A” Stock) | | 4,140 | | | 111,242 |
| | | | |
|
|
| | | | | | 608,592 |
| | | | |
|
|
Medical Supplies & Equipment — 0.4% | | | | | |
Patterson Cos, Inc. * | | 2,484 | | | 102,788 |
| | | | |
|
|
Pharmaceuticals — 4.7% | | | | | |
Celgene Corp. * | | 3,105 | | | 174,191 |
Express Scripts, Inc. | | 2,484 | | | 187,318 |
Gilead Sciences, Inc. * | | 8,418 | | | 397,751 |
65
Strategic Partners Managed OTC Fund
SCHEDULE OF INVESTMENTS
October 31, 2005
| | | | | |
| | | Shares
| | Value (Note 2)
|
Sepracor, Inc. * | | 1,932 | | $ | 108,675 |
Teva Pharmaceutical Industries Ltd., ADR (Israel) | | 8,970 | | | 341,936 |
| | | | |
|
|
| | | | | | 1,209,871 |
| | | | |
|
|
Precious Metals — 0.3% | | | | | |
Dentsply International, Inc. | | 1,449 | | | 79,898 |
| | | | |
|
|
Retail — 7.2% | | | | | |
Bed Bath & Beyond, Inc. * | | 7,452 | | | 301,955 |
Costco Wholesale, Inc. | | 4,761 | | | 230,242 |
Dollar Tree Stores, Inc. * | | 1,932 | | | 41,654 |
PetSmart, Inc. | | 2,691 | | | 63,238 |
Ross Stores, Inc. | | 2,691 | | | 72,765 |
Sears Holdings Corp. * | | 3,243 | | | 389,971 |
Staples, Inc. | | 9,246 | | | 210,161 |
Starbucks Corp. * | | 20,010 | | | 565,883 |
| | | | |
|
|
| | | | | | 1,875,869 |
| | | | |
|
|
Semiconductors — 12.4% | | | | | |
Altera Corp. | | 9,798 | | | 163,137 |
Applied Materials, Inc. | | 15,732 | | | 257,690 |
ATI Technologies, Inc. * | | 4,692 | | | 67,799 |
Broadcom Corp. (Class “A” Stock) * | | 4,830 | | | 205,082 |
Intel Corp. | | 40,020 | | | 940,470 |
Intersil Holding Corp. (Class “A” Stock) | | 2,898 | | | 65,959 |
KLA-Tencor Corp. | | 4,485 | | | 207,611 |
Lam Research Corp. | | 2,622 | | | 88,466 |
Linear Technology Corp. | | 7,728 | | | 256,647 |
Marvell Technology Group Ltd. * | | 5,037 | | | 233,767 |
Maxim Integrated Products, Inc. | | 8,625 | | | 299,115 |
Microchip Technology, Inc. | | 3,243 | | | 97,841 |
Novellus Systems, Inc. * | | 2,622 | | | 57,317 |
QLogic Corp. | | 1,725 | | | 52,026 |
Xilinx, Inc. | | 8,694 | | | 208,221 |
| | | | |
|
|
| | | | | | 3,201,148 |
| | | | |
|
|
Software — 14.5% | | | | | |
Adobe Systems, Inc. | | 9,039 | | | 291,508 |
BEA Systems, Inc. | | 6,831 | | | 60,249 |
Citrix Systems, Inc. | | 3,795 | | | 104,628 |
Electronic Arts, Inc. * | | 5,727 | | | 325,752 |
Fiserv, Inc. * | | 4,416 | | | 192,891 |
Intuit, Inc. * | | 4,278 | | | 196,488 |
Mercury Interactive Corp. * | | 1,725 | | | 60,013 |
Microsoft Corp. | | 69,207 | | | 1,778,620 |
Oracle Corp. * | | 40,434 | | | 512,703 |
Pixar, Inc. * | | 2,208 | | $ | 112,012 |
Siebel Systems Inc. | | 11,454 | | | 118,549 |
| | | | |
|
|
| | | | | | 3,753,413 |
| | | | |
|
|
Telecommunications — 11.4% | | | | | |
Cisco Systems, Inc. * | | 42,849 | | | 747,715 |
Comverse Technology, Inc. * | | 3,933 | | | 98,718 |
JDS Uniphase Corp. | | 35,397 | | | 74,334 |
Juniper Networks, Inc. * | | 6,900 | | | 160,977 |
Level 3 Communications Inc. | | 12,972 | | | 37,619 |
MCI, Inc. | | 6,693 | | | 133,191 |
NTL, Inc. | | 1,725 | | | 105,777 |
QUALCOMM, Inc. | | 36,984 | | | 1,470,484 |
Telefonaktiebolaget LM Ericsson (ADR) (Sweden) | | 2,415 | | | 79,236 |
Tellabs, Inc. * | | 4,761 | | | 45,515 |
| | | | |
|
|
| | | | | | 2,953,566 |
| | | | |
|
|
Textiles — 0.6% | | | | | |
Cintas Corp. | | 3,795 | | | 153,963 |
| | | | |
|
|
Transportation — 0.9% | | | | | |
C.H. Robinson Worldwide, Inc. | | 3,174 | | | 111,915 |
Expeditors International of Washington, Inc. | | 1,932 | | | 117,215 |
| | | | |
|
|
| | | | | | 229,130 |
| | | | |
|
|
Total Long-Term Investments
(Cost $ 17,119,856) | | | | | 23,964,446 |
| | | | |
|
|
Short-Term Investments — 5.1% | | | | | |
Registered Investment Companies | | | | | |
BlackRock Provident Institutional Funds TempCash Portfolio | | 661,377 | | | 661,377 |
BlackRock Provident Institutional Funds TempFund Portfolio | | 661,377 | | | 661,377 |
| | | | |
|
|
Total Short-Term Investments
(Cost $ 1,322,754) | | | | | 1,322,754 |
| | | | |
|
|
Total Investments — 97.7%
(Cost $18,442,610; Note 5) | | | | | 25,287,200 |
Other Assets In Excess of Liabilities(u) — 2.3% | | | | | 600,362 |
| | | | |
|
|
Net Assets — 100.0% | | | | $ | 25,887,562 |
| | | | |
|
|
66
The following abbreviations and annotations are used in portfolio descriptions:
| ADR | American Depositary Receipt |
| * | Non-income producing security. |
| (u) | Other assets in excess of liabilities includes unrealized depreciation on futures contracts as follows: |
| | | | | | | | | | | | | | |
Number of Contracts
| | Type
| | Expiration Month
| | Value at
Trade Date
| | Value at
October 31,
2005
| | Unrealized
Depreciation
| |
Long Position: | | | | | | | | | | | | | | |
41 | | NASDAQ 100 | | Dec 05 | | $ | 6,608,320 | | $ | 6,504,650 | | $ | (103,670 | )(1) |
61 | | E-mini NASDAQ 100 | | Dec 05 | | | 1,908,080 | | | 1,935,530 | | | 27,450 | |
| | | | | | | | | | | | |
|
|
|
| | | | | | | | | | | | | $ | (76,220 | ) |
| | | | | | | | | | | | |
|
|
|
| (1) | Cash of $798,000 has been segregated with the custodian to cover requirements for open futures contracts at October 31, 2005. |
The industry classification of long-term portfolio holdings, short-term investments and other assets in excess of liabilities shown as a percentage of net assets as of October 31, 2005 were as follows:
| | | |
Software | | 14.5 | % |
Semiconductors | | 12.4 | |
Telecommunications | | 11.4 | |
Computers | | 9.8 | |
Internet Services | | 9.1 | |
Biotechnology | | 7.9 | |
Retail | | 7.2 | |
Pharmaceuticals | | 4.7 | |
Media | | 2.4 | |
Commercial Services | | 2.1 | |
Computer Services & Software | | 1.2 | |
Broadcasting | | 1.1 | |
Automobile Manufacturers | | 1.0 | |
Electronics | | 1.0 | |
Transportation | | 0.9 | |
Healthcare-Products | | 0.8 | |
Distribution/Wholesale | | 0.7 | |
Food | | 0.7 | |
Textiles | | 0.6 | |
Electronic Components & Equipment | | 0.5 | |
Cable Television | | 0.4 | |
Entertainment & Leisure | | 0.4 | |
Medical Supplies & Equipment | | 0.4 | |
Advertising | | 0.3 | |
Chemicals | | 0.3 | |
Healthcare Services | | 0.3 | |
Precious Metals | | 0.3 | |
Containers & Packaging | | 0.2 | |
Short-Term Investments | | 5.1 | |
| | |
|
|
| | | 97.7 | |
Other Assets In Excess of Liabilities | | 2.3 | |
| | |
|
|
Total | | 100.0 | % |
| | |
|
|
See Notes to Financial Statements.
67
Strategic Partners Capital Growth Fund
SCHEDULE OF INVESTMENTS
October 31, 2005
| | | | | |
| | | Shares
| | Value (Note 2)
|
Long-Term Investments — 98.7% | | | | | |
Common Stocks | | | | | |
Aerospace — 3.4% | | | | | |
General Dynamics Corp. | | 124,742 | | $ | 14,507,494 |
Lockheed Martin Corp. | | 111,794 | | | 6,770,245 |
| | | | |
|
|
| | | | | | 21,277,739 |
| | | | |
|
|
Computer Hardware — 2.2% | | | | | |
Apple Computer, Inc. * | | 242,392 | | | 13,959,355 |
| | | | |
|
|
Construction — 4.2% | | | | | |
KB Home | | 102,916 | | | 6,725,560 |
Lennar Corp. (Class “A” Stock) (a) | | 181,346 | | | 10,079,211 |
MDC Holdings, Inc. | | 94,161 | | | 6,459,445 |
Toll Brothers, Inc. * | | 98,922 | | | 3,651,211 |
| | | | |
|
|
| | | | | | 26,915,427 |
| | | | |
|
|
Consumer Products & Services — 6.1% | | | | | |
Johnson & Johnson | | 154,227 | | | 9,657,695 |
Procter & Gamble Co. | | 523,439 | | | 29,307,349 |
| | | | |
|
|
| | | | | | 38,965,044 |
| | | | |
|
|
Electronic Components & Equipment — 3.3% | | | | | |
General Electric Co. | | 586,859 | | | 19,900,389 |
Harman International Industries, Inc. | | 7,911 | | | 789,992 |
| | | | |
|
|
| | | | | | 20,690,381 |
| | | | |
|
|
Entertainment & Leisure — 1.3% | | | | | |
Wynn Resorts Ltd. *(a) | | 175,000 | | | 8,169,000 |
| | | | |
|
|
Finance Services — 10.8% | | | | | |
Chicago Mercantile Exchange Holding, Inc. (a) | | 48,339 | | | 17,650,986 |
Countrywide Financial Corp. | | 476,722 | | | 15,145,458 |
Lehman Brothers Holdings, Inc. (a) | | 120,018 | | | 14,362,554 |
SLM Corp. | | 388,255 | | | 21,559,800 |
| | | | |
|
|
| | | | | | 68,718,798 |
| | | | |
|
|
Financial — Bank & Trust — 3.2% | | | | | |
UBS AG, ADR (Switzerland) | | 203,148 | | | 17,403,689 |
UCBH Holdings, Inc. | | 161,502 | | | 2,810,135 |
| | | | |
|
|
| | | | | | 20,213,824 |
| | | | |
|
|
Healthcare Services — 10.5% | | | | | |
Quest Diagnostics, Inc. | | 236,172 | | | 11,031,594 |
UnitedHealth Group, Inc. | | 955,794 | | | 55,330,915 |
| | | | |
|
|
| | | | | | 66,362,509 |
| | | | |
|
|
Hotels & Motels — 4.3% | | | | | |
Four Seasons Hotels, Inc. (Canada) | | 281,463 | | | 15,094,860 |
MGM Mirage, Inc. * | | 319,475 | | $ | 11,938,781 |
| | | | |
|
|
| | | | | | 27,033,641 |
| | | | |
|
|
Insurance — 1.2% | | | | | |
Progressive Corp. | | 63,153 | | | 7,313,749 |
| | | | |
|
|
Internet Services — 3.4% | | | | | |
Google, Inc. (Class “A” Stock) *(a) | | 57,584 | | | 21,429,310 |
| | | | |
|
|
Machinery & Equipment — 3.0% | | | | | |
Caterpillar, Inc. * | | 364,581 | | | 19,173,315 |
| | | | |
|
|
Medical Supplies & Equipment — 8.0% | | | | | |
Amgen, Inc. *(a) | | 206,420 | | | 15,638,379 |
Genzyme Corp. *(a) | | 91,170 | | | 6,591,591 |
Medtronic, Inc. (a) | | 243,880 | | | 13,818,241 |
Zimmer Holdings, Inc. * | | 230,050 | | | 14,670,289 |
| | | | |
|
|
| | | | | | 50,718,500 |
| | | | |
|
|
Oil & Gas — 0.8% | | | | | |
Halliburton Co. | | 90,710 | | | 5,360,961 |
| | | | |
|
|
Pharmaceuticals — 8.5% | | | | | |
Amylin Pharmaceuticals, Inc. *(a) | | 110,992 | | | 3,729,331 |
Genentech, Inc. *(a) | | 553,548 | | | 50,151,449 |
| | | | |
|
|
| | | | | | 53,880,780 |
| | | | |
|
|
Railroads — 2.0% | | | | | |
Burlington Northern Santa Fe Corp. | | 159,371 | | | 9,890,564 |
Union Pacific Corp. (a) | | 43,494 | | | 3,008,915 |
| | | | |
|
|
| | | | | | 12,899,479 |
| | | | |
|
|
Real Estate — 0.9% | | | | | |
St. Joe Co. (The) | | 83,440 | | | 5,502,868 |
| | | | |
|
|
Restaurants — 4.0% | | | | | |
Starbucks Corp. * | | 359,204 | | | 10,158,289 |
Yum! Brands, Inc. | | 295,448 | | | 15,029,440 |
| | | | |
|
|
| | | | | | 25,187,729 |
| | | | |
|
|
Retail & Merchandising — 8.8% | | | | | |
CVS Corp. | | 302,871 | | | 7,393,081 |
Home Depot, Inc. | | 183,729 | | | 7,540,238 |
Lowe’s Cos., Inc. (a) | | 432,915 | | | 26,308,245 |
Target Corp. | | 232,205 | | | 12,931,497 |
Walgreen Co. | | 39,354 | | | 1,787,852 |
| | | | |
|
|
| | | | | | 55,960,913 |
| | | | |
|
|
Telecommunications — 4.6% | | | | | |
Motorola, Inc. | | 518,983 | | | 11,500,663 |
QUALCOMM, Inc. | | 442,081 | | | 17,577,141 |
| | | | |
|
|
| | | | | | 29,077,804 |
| | | | |
|
|
68
| | | | | | |
| | | Shares
| | Value
(Note 2)
| |
Transportation — 4.2% | | | | | | |
FedEx Corp. (a) | | 291,784 | | $ | 26,823,703 | |
| | | | |
|
|
|
Total Long-Term Investments
(Cost $431,394,956) | | | | | 625,634,829 | |
| | | | |
|
|
|
Short-Term Investments — 23.5% | | | | | | |
Money Market Mutual Fund — 22.1% | | | | | | |
Dryden Core Investment Fund - Taxable Money Market Series (b)(w) | | 140,479,036 | | | 140,479,036 | |
| | | | |
|
|
|
Registered Investment Companies — 1.4% | | | | | | |
BlackRock Provident Institutional Funds TempCash Portfolio | | 4,451,101 | | | 4,451,101 | |
BlackRock Provident Institutional Funds TempFund Portfolio | | 4,451,100 | | | 4,451,100 | |
| | | | |
|
|
|
| | | | | | 8,902,201 | |
| | | | |
|
|
|
Total Short-Term Investments
(Cost $149,381,237) | | | | | 149,381,237 | |
| | | | |
|
|
|
Total Investments — 122.2%
(Cost $580,776,193; Note 5) | | | | | 775,016,066 | |
Liabilities In Excess of Other Assets
(includes cash collateral for securities on loan of $140,479,036) — (22.2%) | | | | | (140,916,310 | ) |
| | | | |
|
|
|
Net Assets — 100.0% | | | | $ | 634,099,756 | |
| | | | |
|
|
|
The following abbreviations and annotations are used in portfolio descriptions:
| ADR | American Depositary Receipt |
| * | Non-income producing security. |
| (a) | All or a portion of security is on loan. The aggregate market value of such securities is $138,269,599; cash collateral of $ 140,479,036 (included with liabilities) was received with which the portfolio purchased highly liquid short-term investments. |
| (b) | Represents security purchased with cash collateral for securities on loan. |
| (w) | Prudential Investments LLC, the manager of the Fund also serves as manager of the Dryden Core Investment Fund- Taxable Money Market Series. |
The industry classification of long-term portfolio holdings, short-term investments and liabilities in excess of other assets shown as a percentage of net assets as of October 31, 2005 were as follows:
| | | |
Finance Services | | 10.8 | % |
Healthcare Services | | 10.5 | |
Retail & Merchandising | | 8.8 | |
Pharmaceuticals | | 8.5 | |
Medical Supplies & Equipment | | 8.0 | |
Consumer Products & Services | | 6.1 | |
Telecommunications | | 4.6 | |
Hotels & Motels | | 4.3 | |
Construction | | 4.2 | |
Transportation | | 4.2 | |
Restaurants | | 4.0 | |
Aerospace | | 3.4 | |
Internet Services | | 3.4 | |
Electronic Components & Equipment | | 3.3 | |
Financial - Bank & Trust | | 3.2 | |
Machinery & Equipment | | 3.0 | |
Computer Hardware | | 2.2 | |
Railroads | | 2.0 | |
Entertainment & Leisure | | 1.3 | |
Insurance | | 1.2 | |
Real Estate Investment Trust | | 0.9 | |
Oil & Gas | | 0.8 | |
Short-Term Investments (22.1% represents investment purchased with collateral received from securities on loan) | | 23.5 | |
| | |
|
|
| | | 122.2 | |
Liabilities In Excess of Other Assets | | –22.2 | |
| | |
|
|
Total | | 100.0 | % |
| | |
|
|
See Notes to Financial Statements.
69
Strategic Partners Concentrated Growth Fund
SCHEDULE OF INVESTMENTS
October 31, 2005
| | | | | | |
| | | Shares
| | Value
(Note 2)
| |
Long-Term Investments — 100.4% | | | | | | |
Common Stocks | | | | | | |
Beverages — 4.4% | | | | | | |
PepsiCo, Inc. | | 219,800 | | $ | 12,985,784 | |
| | | | |
|
|
|
Broadcast & Cable/Satellite TV — 6.9% | | | | | | |
Clear Channel Communications, Inc. | | 155,720 | | | 4,737,003 | |
Univision Communications, Inc. (Class “A” Stock) *(a) | | 482,017 | | | 12,599,924 | |
Westwood One, Inc. * | | 161,900 | | | 2,995,150 | |
| | | | |
|
|
|
| | | | | | 20,332,077 | |
| | | | |
|
|
|
Commercial Services — 10.9% | | | | | | |
Cendant Corp. | | 568,210 | | | 9,898,218 | |
McGraw-Hill Cos., Inc. | | 366,380 | | | 17,930,637 | |
Moody’s Corp. | | 82,000 | | | 4,367,320 | |
| | | | |
|
|
|
| | | | | | 32,196,175 | |
| | | | |
|
|
|
Computer Hardware — 2.3% | | | | | | |
Dell, Inc. * | | 214,500 | | | 6,838,260 | |
| | | | |
|
|
|
Computer Services & Software — 12.9% | | | | | | |
Electronic Arts, Inc. *(a) | | 118,620 | | | 6,747,106 | |
First Data Corp. | | 397,900 | | | 16,095,055 | |
Microsoft Corp. | | 598,626 | | | 15,384,688 | |
| | | | |
|
|
|
| | | | | | 38,226,849 | |
| | | | |
|
|
|
Financials — 10.9% | | | | | | |
Freddie Mac | | 345,500 | | | 21,196,425 | |
Schwab, (Charles) Corp. | | 720,340 | | | 10,949,168 | |
| | | | |
|
|
|
| | | | | | 32,145,593 | |
| | | | |
|
|
|
Food — 1.7% | | | | | | |
Wrigley, (Wm., Jr.) Co. * | | 73,100 | | | 5,080,450 | |
| | | | |
|
|
|
Gaming/Lodging — 6.7% | | | | | | |
Carnival Corp. | | 122,510 | | | 6,085,072 | |
Harrah’s Entertainment, Inc. | | 177,920 | | | 10,760,602 | |
Starwood Hotels & Resorts Worldwide, Inc. | | 49,485 | | | 2,891,408 | |
| | | | |
|
|
|
| | | | | | 19,737,082 | |
| | | | |
|
|
|
Internet & Online — 2.6% | | | | | | |
Google, Inc. (Class “A” Stock) * | | 20,720 | | | 7,710,741 | |
| | | | |
|
|
|
Medical Supplies & Equipment — 5.8% | | | | | | |
Medtronic, Inc. (a) | | 129,850 | | | 7,357,301 | |
Stryker Corp. | | 145,750 | | | 5,985,953 | |
Zimmer Holdings, Inc. * | | 60,420 | | | 3,852,983 | |
| | | | |
|
|
|
| | | | | | 17,196,237 | |
| | | | |
|
|
|
Movies & Entertainment — 7.0% | | | | | | |
Time Warner, Inc. * | | 355,126 | | $ | 6,331,897 | |
Viacom, Inc. (Class “B” Stock) | | 463,190 | | | 14,344,994 | |
| | | | |
|
|
|
| | | | | | 20,676,891 | |
| | | | |
|
|
|
Networking/Telecom Equipment — 2.3% | | | | | | |
Cisco Systems, Inc. * | | 384,100 | | | 6,702,545 | |
| | | | |
|
|
|
Oil & Gas — 6.6% | | | | | | |
Schlumberger Ltd. | | 179,920 | | | 16,331,338 | |
Suncor Energy, Inc. | | 61,760 | | | 3,312,189 | |
| | | | |
|
|
|
| | | | | | 19,643,527 | |
| | | | |
|
|
|
Pharmacy Benefit Manager — 6.1% | | | | | | |
Caremark Rx, Inc. * | | 222,760 | | | 11,672,624 | |
Medco Health Solutions, Inc. * | | 112,200 | | | 6,339,300 | |
| | | | |
|
|
|
| | | | | | 18,011,924 | |
| | | | |
|
|
|
Retailing — 2.9% | | | | | | |
Lowe’s Cos., Inc. | | 141,200 | | | 8,580,724 | |
| | | | |
|
|
|
Semiconductors — 6.7% | | | | | | |
Linear Technology Corp. | | 158,690 | | | 5,270,095 | |
Qualcomm, Inc. | | 365,000 | | | 14,512,400 | |
| | | | |
|
|
|
| | | | | | 19,782,495 | |
| | | | |
|
|
|
Telecommunications — 3.7% | | | | | | |
American Tower Corp. (Class “A” Stock) | | 202,970 | | | 4,840,834 | |
Crown Castle International Corp. * | | 254,450 | | | 6,239,114 | |
| | | | |
|
|
|
| | | | | | 11,079,948 | |
| | | | |
|
|
|
Total Long-Term Investments
(Cost $262,149,819) | | | | | 296,927,302 | |
| | | | |
|
|
|
Short-Term Investment — 7.7% | | | | | | |
Money Market Mutual Fund | | | | | | |
Dryden Core Investment Fund - Taxable Money Market Series (b)(w) (Cost $22,634,620) | | 22,634,620 | | | 22,634,620 | |
| | | | |
|
|
|
Total Investments — 108.1%
(Cost $284,784,439; Note 5) | | | | | 319,561,922 | |
Liabilities In Excess of Other Assets (includes cash collateral for securities on loan of $22,634,620) — (8.1%) | | | | | (23,843,994 | ) |
| | | | |
|
|
|
Net Assets — 100.0% | | | | $ | 295,717,928 | |
| | | | |
|
|
|
70
The following annotations are used in portfolio descriptions:
| * | Non-income producing security. |
| (a) | All or a portion of security is on loan. The aggregate market value of such securities is $22,049,818; cash collateral of $22,634,620 (included with liabilities) was received with which the portfolio purchased highly liquid short-term investments. |
| (b) | Represents security purchased with cash collateral for securities on loan. |
| (w) | Prudential Investments LLC, the manager of the Fund also serves as manager of the Dryden Core Investment Fund-Taxable Money Market Series. |
The industry classification of long-term portfolio holdings, short-term investments and liabilities in excess of other assets shown as a percentage of net assets as of October 31, 2005 were as follows:
| | | |
Computer Services & Software | | 12.9 | % |
Commercial Services | | 10.9 | |
Financials | | 10.9 | |
Movies & Entertainment | | 7.0 | |
Broadcast & Cable/Satellite TV | | 6.9 | |
Gaming/Lodging | | 6.7 | |
Semiconductors | | 6.7 | |
Oil & Gas | | 6.6 | |
Pharmacy Benefit Manager | | 6.1 | |
Medical Supplies & Equipment | | 5.8 | |
Beverages | | 4.4 | |
Telecommunications | | 3.7 | |
Retailing | | 2.9 | |
Internet & Online | | 2.6 | |
Computer Hardware | | 2.3 | |
Networking/Telecom Equipment | | 2.3 | |
Food | | 1.7 | |
Short-Term Investments (Entire portion represents investment purchased with collateral received from securities on loan) | | 7.7 | |
| | |
|
|
| | | 108.1 | |
Liabilities In Excess of Other Assets | | –8.1 | |
| | |
|
|
Total | | 100.0 | % |
| | |
|
|
See Notes to Financial Statements.
71
Strategic Partners Core Value Fund
SCHEDULE OF INVESTMENTS
October 31, 2005
| | | | | |
| | | Shares
| | Value (Note 2)
|
Long-Term Investments — 99.6% | | | | | |
Common Stocks | | | | | |
Advertising — 0.5% | | | | | |
Interpublic Group of Cos., Inc. (The) * | | 20,700 | | $ | 213,831 |
| | | | |
|
|
Aerospace — 1.5% | | | | | |
Boeing Co. * | | 6,100 | | | 394,304 |
Goodrich Corp. | | 8,975 | | | 323,728 |
| | | | |
|
|
| | | | | | 718,032 |
| | | | |
|
|
Automotive Parts — 1.7% | | | | | |
American Axle & Manufacturing Holdings, Inc. | | 3,700 | | | 80,660 |
Autoliv, Inc. | | 3,500 | | | 150,360 |
BorgWarner, Inc. | | 4,000 | | | 231,960 |
Cooper Tire & Rubber Co. | | 5,600 | | | 76,496 |
Dana Corp. | | 7,275 | | | 54,635 |
Lear Corp. | | 3,225 | | | 98,234 |
Magna International, Inc. (Class “A” Stock) | | 1,700 | | | 118,524 |
| | | | |
|
|
| | | | | | 810,869 |
| | | | |
|
|
Beverages — 0.7% | | | | | |
Molson Coors Brewing Co. (Class “B” Stock) | | 1,000 | | | 61,700 |
PepsiCo, Inc. | | 4,700 | | | 277,676 |
| | | | |
|
|
| | | | | | 339,376 |
| | | | |
|
|
Building Materials — 1.1% | | | | | |
Martin Marietta Materials, Inc. | | 3,500 | | | 276,185 |
Vulcan Materials Co. | | 3,400 | | | 221,000 |
| | | | |
|
|
| | | | | | 497,185 |
| | | | |
|
|
Cable Television — 0.8% | | | | | |
Comcast Corp. (Class “A” Stock) * | | 13,500 | | | 375,705 |
| | | | |
|
|
Chemicals — 0.5% | | | | | |
DuPont, (E.I.) de Nemours & Co. | | 1,100 | | | 45,859 |
PPG Industries, Inc. | | 3,200 | | | 191,904 |
| | | | |
|
|
| | | | | | 237,763 |
| | | | |
|
|
Clothing & Apparel — 0.6% | | | | | |
Jones Apparel Group, Inc. | | 7,000 | | | 190,960 |
VF Corp. | | 1,900 | | | 99,275 |
| | | | |
|
|
| | | | | | 290,235 |
| | | | |
|
|
Computer Hardware — 2.5% | | | | | |
Hewlett-Packard Co. | | 36,500 | | | 1,023,460 |
International Business Machines Corp. | | 2,000 | | $ | 163,760 |
| | | | |
|
|
| | | | | | 1,187,220 |
| | | | |
|
|
Computer Services & Software — 1.3% | | | | | |
Electronic Data Systems Corp. | | 15,400 | | | 358,974 |
Microsoft Corp. | | 10,300 | | | 264,710 |
| | | | |
|
|
| | | | | | 623,684 |
| | | | |
|
|
Conglomerates — 4.9% | | | | | |
Altria Group, Inc. | | 14,100 | | | 1,058,205 |
General Electric Co. | | 28,400 | | | 963,044 |
Textron, Inc. | | 3,500 | | | 252,140 |
| | | | |
|
|
| | | | | | 2,273,389 |
| | | | |
|
|
Consumer Products & Services — 1.9% | | | | | |
Clorox Co. | | 5,600 | | | 303,072 |
Newell Rubbermaid, Inc. | | 12,800 | | | 294,272 |
UST, Inc. | | 7,100 | | | 293,869 |
| | | | |
|
|
| | | | | | 891,213 |
| | | | |
|
|
Containers & Packaging — 0.7% | | | | | |
Owens-Illinois, Inc. * | | 10,450 | | | 198,968 |
Smurfit-Stone Container Corp. * | | 12,550 | | | 132,528 |
| | | | |
|
|
| | | | | | 331,496 |
| | | �� | |
|
|
Electronic Components & Equipment — 2.0% | | | | | |
Agere Systems, Inc. * | | 11,900 | | | 123,760 |
Arrow Electronics, Inc. * | | 3,900 | | | 115,089 |
Celestica, Inc. * | | 13,000 | | | 124,280 |
Flextronics International Ltd. * (Singapore) | | 13,800 | | | 128,202 |
Hubbell, Inc. (Class “B” Stock) * | | 3,875 | | | 186,620 |
Sanmina-SCI Corp. * | | 35,100 | | | 128,115 |
Solectron Corp. * | | 36,500 | | | 128,845 |
| | | | |
|
|
| | | | | | 934,911 |
| | | | |
|
|
Entertainment & Leisure — 1.9% | | | | | |
Disney, (Walt) Co. | | 1,900 | | | 46,303 |
Time Warner, Inc. * | | 42,300 | | | 754,209 |
Viacom, Inc. (Class “B” Stock) * | | 2,200 | | | 68,134 |
| | | | |
|
|
| | | | | | 868,646 |
| | | | |
|
|
Farming & Agriculture — 0.5% | | | | | |
Bunge Ltd. (Bermuda) | | 4,500 | | | 233,730 |
| | | | |
|
|
Financial — Bank & Trust — 10.6% | | | | | |
Bank of America Corp. | | 38,000 | | | 1,662,120 |
BB&T Corp. | | 4,600 | | | 194,764 |
Comerica, Inc. | | 5,675 | | | 327,901 |
72
| | | | | |
| | | Shares
| | Value (Note 2)
|
Huntington Bancshares, Inc. | | 13,300 | | $ | 309,358 |
National City Corp. | | 10,925 | | | 352,113 |
SunTrust Banks, Inc. | | 6,025 | | | 436,692 |
U.S. Bancorp | | 10,300 | | | 304,674 |
Wachovia Corp. | | 17,861 | | | 902,338 |
Wells Fargo & Co. | | 7,800 | | | 469,560 |
| | | | |
|
|
| | | | | | 4,959,520 |
| | | | |
|
|
Financial Services — 15.6% | | | | | |
Citigroup, Inc. | | 47,900 | | | 2,192,862 |
Countrywide Financial Corp. | | 3,700 | | | 117,549 |
Fannie Mae | | 12,225 | | | 580,932 |
Freddie Mac | | 5,900 | | | 361,965 |
Goldman Sachs Group, Inc. | | 5,000 | | | 631,850 |
J.P. Morgan Chase & Co. | | 23,000 | | | 842,260 |
KeyCorp | | 10,450 | | | 336,908 |
Lehman Brothers Holdings, Inc. | | 3,300 | | | 394,911 |
Mellon Financial Co. | | 10,800 | | | 342,252 |
Merrill Lynch & Co., Inc. | | 7,400 | | | 479,076 |
Morgan Stanley Dean Witter & Co. | | 6,800 | | | 369,988 |
PNC Financial Services Group | | 2,500 | | | 151,775 |
Washington Mutual, Inc. | | 13,012 | | | 515,275 |
| | | | |
|
|
| | | | | | 7,317,603 |
| | | | |
|
|
Food — 1.4% | | | | | |
Archer-Daniels-Midland Co. | | 2,200 | | | 53,614 |
Safeway, Inc. | | 9,000 | | | 209,340 |
Sara Lee Corp. | | 8,800 | | | 157,080 |
Unilever NV, (Netherlands) | | 3,600 | | | 253,116 |
| | | | |
|
|
| | | | | | 673,150 |
| | | | |
|
|
Healthcare Providers & Services — 0.2% | | | | | |
Tenet Healthcare Corp. * | | 13,200 | | | 111,144 |
| | | | |
|
|
Healthcare Services — 1.3% | | | | | |
HCA, Inc. | | 2,200 | | | 106,018 |
Medco Health Solutions, Inc. * | | 8,700 | | | 491,550 |
| | | | |
|
|
| | | | | | 597,568 |
| | | | |
|
|
Industrial Products — 1.5% | | | | | |
Cooper Industries Ltd. (Class “A” Stock) (Bermuda) | | 3,200 | | | 226,848 |
Crane Co. | | 4,400 | | | 136,224 |
Ingersoll-Rand Co. Ltd. (Class “A” Stock) | | 2,200 | | | 83,138 |
SPX Corp. | | 5,400 | | | 232,308 |
| | | | |
|
|
| | | | | | 678,518 |
| | | | |
|
|
Insurance — 8.0% | | | | | |
ACE Ltd. (Cayman Island) | | 2,500 | | | 130,250 |
Allstate Corp. | | 5,700 | | | 300,903 |
American International Group, Inc. | | 8,800 | | $ | 570,240 |
Chubb Corp. | | 4,300 | | | 399,771 |
Genworth Financial, Inc. (Class “A” Stock) | | 10,800 | | | 342,252 |
Hartford Financial Services Group, Inc. (The) | | 6,600 | | | 526,350 |
MetLife, Inc. | | 7,400 | | | 365,634 |
MGIC Investment Corp. | | 1,700 | | | 100,708 |
PartnerRe Ltd. (Bermuda) | | 400 | | | 25,488 |
RenaissanceRe Holdings Ltd. (Bermuda) | | 4,800 | | | 181,680 |
St. Paul Travelers Cos., Inc. (The) | | 12,317 | | | 554,635 |
Torchmark Corp. | | 850 | | | 44,905 |
XL Capital Ltd. (Class “A” Stock) (Cayman Islands) | | 3,100 | | | 198,586 |
| | | | |
|
|
| | | | | | 3,741,402 |
| | | | |
|
|
Machinery & Equipment — 0.7% | | | | | |
Eaton Corp. | | 5,500 | | | 323,565 |
| | | | |
|
|
Medical Supplies & Equipment — 0.5% | | | | | |
AmerisourceBergen Corp. | | 2,800 | | | 213,556 |
| | | | |
|
|
Oil & Gas — 15.2% | | | | | |
BP PLC, ADR (United Kingdom) | | 4,300 | | | 285,520 |
ChevronTexaco Corp. | | 17,000 | | | 970,190 |
ConocoPhillips | | 17,800 | | | 1,163,764 |
Diamond Offshore Drilling, Inc. | | 6,400 | | | 361,344 |
Exxon Mobil Corp. | | 49,650 | | | 2,787,351 |
GlobalSantaFe Corp. | | 7,400 | | | 329,670 |
Marathon Oil Corp. | | 7,400 | | | 445,184 |
Occidental Petroleum Corp. | | 6,350 | | | 500,888 |
Rowan Cos., Inc. * | | 7,800 | | | 257,322 |
| | | | |
|
|
| | | | | | 7,101,233 |
| | | | |
|
|
Paper & Forest Products — 0.6% | | | | | |
Temple-Inland, Inc. | | 7,600 | | | 279,908 |
| | | | |
|
|
Pharmaceuticals — 4.5% | | | | | |
Bristol-Meyers Squibb Co. | | 3,800 | | | 80,446 |
Lilly, (Eli) & Co. | | 5,000 | | | 248,950 |
Merck & Co., Inc. | | 22,500 | | | 634,950 |
Pfizer, Inc. | | 52,500 | | | 1,141,350 |
| | | | |
|
|
| | | | | | 2,105,696 |
| | | | |
|
|
Railroads — 2.2% | | | | | |
Burlington Northern Santa Fe Corp. | | 8,225 | | | 510,443 |
CSX Corp. | | 8,300 | | | 380,223 |
Norfolk Southern Corp. | | 4,000 | | | 160,800 |
| | | | |
|
|
| | | | | | 1,051,466 |
| | | | |
|
|
73
Strategic Partners Core Value Fund
SCHEDULE OF INVESTMENTS
October 31, 2005
| | | | | |
| | | Shares
| | Value (Note 2)
|
Restaurants — 1.0% | | | | | |
McDonald’s Corp. | | 15,000 | | $ | 474,000 |
| | | | |
|
|
Retail & Merchandising — 3.7% | | | | | |
Kroger Co. (The) * | | 20,200 | | | 401,980 |
Limited Brands, Inc. | | 14,600 | | | 292,146 |
Nordstrom, Inc. | | 4,000 | | | 138,600 |
Office Depot, Inc. * | | 14,600 | | | 401,938 |
SUPERVALU, Inc. | | 6,600 | | | 207,438 |
Target Corp. | | 4,900 | | | 272,881 |
| | | | |
|
|
| | | | | | 1,714,983 |
| | | | |
|
|
Semiconductors — 0.5% | | | | | |
Intel Corp. | | 10,000 | | | 235,000 |
| | | | |
|
|
Telecommunications — 6.7% | | | | | |
ADC Telecommunications, Inc. * | | 8,628 | | | 150,559 |
BellSouth Corp. | | 4,900 | | | 127,498 |
Corning, Inc. * | | 13,400 | | | 269,206 |
Crown Castle International Corp. * | | 10,200 | | | 250,104 |
Nokia Corp. (Class “A” Stock), ADR (Finland) | | 14,800 | | | 248,936 |
Nortel Networks Corp. * (Canada) | | 8,500 | | | 27,625 |
SBC Communications, Inc. | | 15,100 | | | 360,135 |
Sprint Corp. | | 28,450 | | | 663,170 |
Tellabs, Inc. * | | 11,700 | | | 111,852 |
Verizon Communications, Inc. | | 29,350 | | | 924,818 |
| | | | |
|
|
| | | | | | 3,133,903 |
| | | | |
|
|
Utilities — 2.3% | | | | | |
American Electric Power Co., Inc. | | 9,775 | | | 371,060 |
Constellation Energy Group, Inc. | | 3,100 | | | 169,880 |
Edison International | | 2,400 | | | 105,024 |
Entergy Corp. | | 5,100 | | | 360,672 |
Wisconsin Energy Corp. | | 400 | | | 15,132 |
Xcel Energy, Inc. | | 2,600 | | | 47,658 |
| | | | |
|
|
| | | | | | 1,069,426 |
| | | | |
|
|
Total Long-Term Investments
(Cost $39,048,165) | | | | | 46,608,926 |
| | | | |
|
|
Short-Term Investments — 0.3% | | | | | |
Registered Investment Companies | | | | | |
BlackRock Provident Institutional Funds TempCash Portfolio | | 62,174 | | $ | 62,174 |
BlackRock Provident Institutional Funds TempFund Portfolio | | 62,174 | | | 62,174 |
| | | | |
|
|
Total Short-Term Investments
(Cost $124,348) | | | | | 124,348 |
| | | | |
|
|
Total Investments — 99.9%
(Cost $39,172,513; Note 5) | | | | | 46,733,274 |
Other Assets In Excess of Liabilities — 0.1% | | | | | 37,310 |
| | | | |
|
|
Net Assets — 100.0% | | | | $ | 46,770,584 |
| | | | |
|
|
The following abbreviations and annotations are used in portfolio descriptions:
ADR American Depositary Receipt
| * | Non-income producing security. |
74
The industry classification of long-term portfolio holdings, short-term investments and other assets in excess of liabilities shown as a percentage of net assets as of October 31, 2005 were as follows:
| | | |
Financial Services | | 15.6 | % |
Oil & Gas | | 15.2 | |
Financial - Bank & Trust | | 10.6 | |
Insurance | | 8.0 | |
Telecommunications | | 6.7 | |
Conglomerates | | 4.9 | |
Pharmaceuticals | | 4.5 | |
Retail & Merchandising | | 3.7 | |
Computer Hardware | | 2.5 | |
Utilities | | 2.3 | |
Railroads | | 2.2 | |
Electronic Components & Equipment | | 2.0 | |
Consumer Products & Services | | 1.9 | |
Entertainment & Leisure | | 1.9 | |
Automotive Parts | | 1.7 | |
Aerospace | | 1.5 | |
Industrial Products | | 1.5 | |
Food | | 1.4 | |
Computer Services & Software | | 1.3 | |
Healthcare Services | | 1.3 | |
Building Materials | | 1.1 | |
Restaurants | | 1.0 | |
Cable Television | | 0.8 | |
Beverages | | 0.7 | |
Containers & Packaging | | 0.7 | |
Machinery & Equipment | | 0.7 | |
Clothing & Apparel | | 0.6 | |
Paper & Forest Products | | 0.6 | |
Advertising | | 0.5 | |
Chemicals | | 0.5 | |
Farming & Agriculture | | 0.5 | |
Medical Supplies & Equipment | | 0.5 | |
Semiconductors | | 0.5 | |
Healthcare Providers & Services | | 0.2 | |
Short-Term Investments | | 0.3 | |
| | |
|
|
| | | 99.9 | |
Other Assets In Excess of Liabilities | | 0.1 | |
| | |
|
|
Total | | 100.0 | % |
| | |
|
|
See Notes to Financial Statements.
75
Strategic Partners Large Cap Core Fund
SCHEDULE OF INVESTMENTS
October 31, 2005
| | | | | |
| | | Shares
| | Value
(Note 2)
|
Long-Term Investments — 99.8% | | | | | |
Common Stocks | | | | | |
Advertising — 0.1% | | | | | |
Interpublic Group of Cos., Inc. (The) * | | 13,110 | | $ | 135,426 |
| | | | |
|
|
Aerospace — 2.2% | | | | | |
Boeing Co. * | | 14,500 | | | 937,280 |
Goodrich Corp. | | 7,500 | | | 270,525 |
Lockheed Martin Corp. | | 10,200 | | | 617,712 |
Northrop Grumman Corp. | | 10,600 | | | 568,690 |
United Technologies Corp. | | 15,910 | | | 815,865 |
| | | | |
|
|
| | | | | | 3,210,072 |
| | | | |
|
|
Automobile Manufacturers — 0.9% | | | | | |
Ford Motor Co. | | 70,400 | | | 585,728 |
General Motors Corp. (a) | | 26,300 | | | 720,620 |
| | | | |
|
|
| | | | | | 1,306,348 |
| | | | |
|
|
Automotive Parts — 0.4% | | | | | |
BorgWarner, Inc. | | 6,950 | | | 403,031 |
Dana Corp. | | 25,900 | | | 194,509 |
| | | | |
|
|
| | | | | | 597,540 |
| | | | |
|
|
Beverages — 1.3% | | | | | |
Coca-Cola Co. | | 19,500 | | | 834,210 |
PepsiCo, Inc. | | 18,234 | | | 1,077,265 |
| | | | |
|
|
| | | | | | 1,911,475 |
| | | | |
|
|
Broadcasting — 0.3% | | | | | |
Univision Communications, Inc. (Class “A” Stock) * | | 16,990 | | | 444,119 |
| | | | |
|
|
Building Materials — 0.6% | | | | | |
American Standard Cos., Inc. | | 15,000 | | | 570,600 |
Masco Corp. | | 12,310 | | | 350,835 |
| | | | |
|
|
| | | | | | 921,435 |
| | | | |
|
|
Cable Television — 0.4% | | | | | |
Comcast Corp. (Class “A” Stock) | | 22,200 | | | 617,826 |
| | | | |
|
|
Chemicals — 1.3% | | | | | |
Ashland, Inc. | | 7,900 | | | 422,729 |
Dow Chemical Co. | | 6,800 | | | 311,848 |
DuPont, (E.I.) de Nemours & Co. | | 6,000 | | | 250,140 |
Lubrizol Corp. | | 11,450 | | | 476,206 |
PPG Industries, Inc. | | 6,300 | | | 377,811 |
| | | | |
|
|
| | | | | | 1,838,734 |
| | | | |
|
|
Clothing & Apparel — 0.4% | | | | | |
VF Corp. | | 10,912 | | | 570,152 |
| | | | |
|
|
Computer Hardware — 3.9% | | | | | |
Apple Computer, Inc. * | | 6,090 | | | 350,723 |
Dell, Inc. * | | 71,900 | | $ | 2,292,172 |
Hewlett-Packard Co. | | 58,625 | | | 1,643,845 |
Ingram Micro, Inc. (Class “A” Stock) * | | 11,200 | | | 202,720 |
International Business Machines Corp. | | 14,070 | | | 1,152,052 |
| | | | |
|
|
| | | | | | 5,641,512 |
| | | | |
|
|
Computer Services & Software — 4.4% | | | | | |
Electronic Data Systems Corp. | | 10,600 | | | 247,086 |
EMC Corp. * | | 58,470 | | | 816,241 |
Microsoft Corp. | | 147,500 | | | 3,790,750 |
Oracle Corp. * | | 72,100 | | | 914,228 |
Tech Data Corp. * | | 11,200 | | | 387,968 |
Unisys Corp. * | | 49,150 | | | 251,157 |
| | | | |
|
|
| | | | | | 6,407,430 |
| | | | |
|
|
Conglomerates — 5.4% | | | | | |
General Electric Co. | | 180,200 | | | 6,110,582 |
Honeywell International, Inc. | | 6,000 | | | 205,200 |
Textron, Inc. | | 6,900 | | | 497,076 |
Tyco International Ltd. | | 42,490 | | | 1,121,311 |
| | | | |
|
|
| | | | | | 7,934,169 |
| | | | |
|
|
Construction — 0.5% | | | | | |
Centex Corp. | | 6,600 | | | 424,710 |
Pulte Homes, Inc. | | 8,000 | | | 302,320 |
| | | | |
|
|
| | | | | | 727,030 |
| | | | |
|
|
Consumer Products & Services — 5.7% | | | | | |
Colgate-Palmolive Co. | | 27,670 | | | 1,465,403 |
Fortune Brands, Inc. | | 7,100 | | | 539,387 |
Johnson & Johnson | | 28,895 | | | 1,809,405 |
Procter & Gamble Co. | | 54,460 | | | 3,049,216 |
Reckitt Benckiser PLC (United Kingdom) | | 19,390 | | | 585,849 |
Reynolds, (R.J.) Tobacco Holdings, Inc. (a) | | 8,500 | | | 722,500 |
Whirlpool Corp. | | 2,600 | | | 204,100 |
| | | | |
|
|
| | | | | | 8,375,860 |
| | | | |
|
|
Containers & Packaging — 0.2% | | | | | |
Sonoco Products Co. | | 9,900 | | | 280,170 |
| | | | |
|
|
Education — 0.2% | | | | | |
Strayer Education, Inc. | | 3,900 | | | 349,089 |
| | | | |
|
|
Electronic Components & Equipment — 1.2% | | | | | |
Agere Systems, Inc. * | | 6,700 | | | 69,680 |
Arrow Electronics, Inc. * | | 6,500 | | | 191,815 |
Eastman Kodak Co. | | 17,500 | | | 383,250 |
Emerson Electric Co. | | 3,000 | | | 208,650 |
76
| | | | | |
| | | Shares
| | Value
(Note 2)
|
Flextronics International Ltd. * | | 9,700 | | $ | 90,113 |
Hubbell, Inc. (Class “B” Stock) | | 6,000 | | | 288,960 |
Solectron Corp. * | | 95,600 | | | 337,468 |
Vishay Intertechnology, Inc. * | | 9,500 | | | 107,730 |
| | | | |
|
|
| | | | | | 1,677,666 |
| | | | |
|
|
Energy — Energy Resources — 0.2% | | | | | |
Noble Energy, Inc. | | 8,600 | | | 344,430 |
| | | | |
|
|
Entertainment & Leisure — 2.3% | | | | | |
Carnival Corp. | | 8,600 | | | 427,162 |
Disney, (Walt) Co. | | 25,360 | | | 618,023 |
Time Warner, Inc. * | | 99,500 | | | 1,774,085 |
Viacom, Inc. (Class “B” Stock) | | 15,933 | | | 493,445 |
| | | | |
|
|
| | | | | | 3,312,715 |
| | | | |
|
|
Farming & Agriculture — 0.3% | | | | | |
Bunge Ltd. (Bermuda) | | 8,400 | | | 436,296 |
| | | | |
|
|
Financial — Bank & Trust — 6.0% | | | | | |
Bank of America Corp. (a) | | 79,704 | | | 3,486,253 |
Comerica, Inc. | | 9,500 | | | 548,910 |
Commerce Bancorp, Inc. (a) | | 15,600 | | | 475,332 |
Huntington Bancshares, Inc. | | 5,000 | | | 116,300 |
National City Corp. (a) | | 29,300 | | | 944,339 |
SunTrust Banks, Inc. | | 9,200 | | | 666,816 |
U.S. Bancorp | | 11,406 | | | 337,390 |
Wachovia Corp. | | 28,900 | | | 1,460,028 |
Wells Fargo & Co. | | 12,260 | | | 738,052 |
| | | | |
|
|
| | | | | | 8,773,420 |
| | | | |
|
|
Financial Services — 10.5% | | | | | |
American Express Co. | | 22,080 | | | 1,098,922 |
Bank of New York Co., Inc. (The) | | 5,800 | | | 181,482 |
Citigroup, Inc. | | 97,673 | | | 4,471,470 |
Fannie Mae | | 3,825 | | | 181,764 |
Goldman Sachs Group, Inc. | | 13,380 | | | 1,690,830 |
JP Morgan Chase & Co. | | 59,742 | | | 2,187,752 |
KeyCorp | | 15,900 | | | 512,616 |
Legg Mason, Inc. | | 6,200 | | | 665,322 |
Lehman Brothers Holdings, Inc. | | 8,070 | | | 965,737 |
Merrill Lynch & Co., Inc. | | 32,900 | | | 2,129,946 |
Morgan Stanley Dean Witter & Co. | | 15,600 | | | 848,796 |
PNC Financial Services Group | | 7,700 | | | 467,467 |
| | | | |
|
|
| | | | | | 15,402,104 |
| | | | |
|
|
Food — 0.7% | | | | | |
Albertson’s, Inc. | | 2,500 | | | 62,775 |
Archer-Daniels-Midland Co. | | 11,438 | | | 278,744 |
Wrigley, (Wm., Jr.) Co. | | 8,800 | | | 611,600 |
| | | | |
|
|
| | | | | | 953,119 |
| | | | |
|
|
Healthcare Services — 3.1% | | | | | |
Caremark Rx, Inc. * | | 24,800 | | $ | 1,299,520 |
HCA, Inc. | | 8,100 | | | 390,339 |
Health Management Associates, Inc. (Class “A” Stock) | | 29,700 | | | 635,877 |
UnitedHealth Group, Inc. | | 39,200 | | | 2,269,288 |
| | | | |
|
|
| | | | | | 4,595,024 |
| | | | |
|
|
Industrial Products — 0.6% | | | | | |
Cooper Industries Ltd. (Class “A” Stock) (Bermuda) | | 5,800 | | | 411,162 |
Ingersoll-Rand Co. Ltd. (Class “A” Stock) | | 12,000 | | | 453,480 |
| | | | |
|
|
| | | | | | 864,642 |
| | | | |
|
|
Insurance — 6.5% | | | | | |
ACE Ltd. (Cayman Islands) (a) | | 12,600 | | | 656,460 |
AFLAC, Inc. | | 6,200 | | | 296,236 |
American International Group, Inc. | | 56,799 | | | 3,680,575 |
Axis Capital Holdings Ltd. (Bermuda) | | 16,150 | | | 418,769 |
Chubb Corp. | | 4,475 | | | 416,041 |
Hartford Financial Services Group, Inc. (The) | | 3,200 | | | 255,200 |
Lincoln National Corp. | | 13,000 | | | 657,930 |
Loews Corp. * | | 4,100 | | | 381,218 |
St. Paul Travelers Cos., Inc. (The) | | 20,697 | | | 931,986 |
UnumProvident Corp. | | 25,100 | | | 509,279 |
Wellpoint, Inc. * | | 11,000 | | | 821,480 |
XL Capital Ltd. (Class “A” Stock) (a) | | 7,500 | | | 480,450 |
| | | | |
|
|
| | | | | | 9,505,624 |
| | | | |
|
|
Internet Services — 2.7% | | | | | |
eBay, Inc. * | | 38,430 | | | 1,521,828 |
McAfee, Inc. * | | 15,200 | | | 456,456 |
Yahoo!, Inc. * | | 53,630 | | | 1,982,701 |
| | | | |
|
|
| | | | | | 3,960,985 |
| | | | |
|
|
Machinery & Equipment — 0.6% | | | | | |
Caterpillar, Inc. * | | 8,160 | | | 429,134 |
Eaton Corp. | | 8,000 | | | 470,640 |
| | | | |
|
|
| | | | | | 899,774 |
| | | | |
|
|
Medical Supplies — 0.2% | | | | | |
Dade Behring Holdings, Inc. | | 9,400 | | | 338,494 |
| | | | |
|
|
Medical Supplies & Equipment — 3.2% | | | | | |
Abbott Laboratories | | 18,000 | | | 774,900 |
Alcon, Inc. (Switzerland) | | 4,800 | | | 637,920 |
Amgen, Inc. * | | 22,980 | | | 1,740,965 |
77
Strategic Partners Large Cap Core Fund
SCHEDULE OF INVESTMENTS
October 31, 2005
| | | | | |
| | | Shares
| | Value (Note 2)
|
Guidant Corp. | | 2,870 | | $ | 180,810 |
Medtronic, Inc. (a) | | 5,030 | | | 285,000 |
St. Jude Medical, Inc. * | | 20,000 | | | 961,400 |
Synthes, Inc. (Switzerland) | | 970 | | | 102,691 |
| | | | |
|
|
| | | | | | 4,683,686 |
| | | | |
|
|
Metals & Mining — 0.4% | | | | | |
Alcan, Inc. (Canada) | | 3,700 | | | 117,253 |
Novelis, Inc. (Canada) | | 740 | | | 14,585 |
United States Steel Corp. | | 12,800 | | | 467,584 |
| | | | |
|
|
| | | | | | 599,422 |
| | | | |
|
|
Oil & Gas — 9.3% | | | | | |
Baker Hughes, Inc. | | 6,100 | | | 335,256 |
BP PLC, ADR (United Kingdom) | | 5,495 | | | 364,868 |
ChevronTexaco Corp. (a) | | 37,494 | | | 2,139,782 |
ConocoPhillips | | 18,640 | | | 1,218,683 |
Diamond Offshore Drilling, Inc. | | 5,000 | | | 282,300 |
El Paso Corp. | | 14,900 | | | 176,714 |
EOG Resources, Inc. | | 5,790 | | | 392,446 |
Exxon Mobil Corp. | | 79,400 | | | 4,457,516 |
FMC Technologies, Inc. * | | 6,000 | | | 218,760 |
Halliburton Co. | | 3,000 | | | 177,300 |
Marathon Oil Corp. | | 6,500 | | | 391,040 |
Nabors Industries Ltd. (Bermuda) * | | 10,100 | | | 693,163 |
Noble Corp. (Cayman Islands) (a) | | 8,620 | | | 554,956 |
Occidental Petroleum Corp. | | 3,900 | | | 307,632 |
Total Fina SA, ADR (France) | | 3,960 | | | 499,039 |
Transocean, Inc. (Cayman Islands) * | | 6,340 | | | 364,487 |
Valero Energy Corp. | | 2,800 | | | 294,672 |
XTO Energy, Inc. | | 17,600 | | | 764,896 |
| | | | |
|
|
| | | | | | 13,633,510 |
| | | | |
|
|
Personal Services — 0.3% | | | | | |
Apollo Group, Inc. (Class “A” Stock) * | | 7,300 | | | 460,046 |
| | | | |
|
|
Pharmaceuticals — 3.8% | | | | | |
Bristol-Meyers Squibb Co. | | 18,400 | | | 389,528 |
Genentech, Inc. * | | 4,500 | | | 407,700 |
Gilead Sciences, Inc. * | | 21,440 | | | 1,013,040 |
Lilly, (Eli) & Co. (a) | | 32,660 | | | 1,626,141 |
Merck & Co., Inc. | | 4,700 | | | 132,634 |
Pfizer, Inc. | | 53,580 | | | 1,164,829 |
Roche Holding AG (Switzerland) | | 2,770 | | | 413,776 |
Wyeth | | 10,080 | | | 449,165 |
| | | | |
|
|
| | | | | | 5,596,813 |
| | | | |
|
|
Printing & Publishing — 0.2% | | | | | |
Donnelley, (R.R.) & Sons Co. | | 7,300 | | | 255,646 |
| | | | |
|
|
Railroads — 0.6% | | | | | |
Burlington Northern Santa Fe Corp. | | 4,100 | | $ | 254,446 |
CSX Corp. | | 12,300 | | | 563,463 |
| | | | |
|
|
| | | | | | 817,909 |
| | | | |
|
|
Restaurants — 0.5% | | | | | |
McDonald’s Corp. | | 10,000 | | | 316,000 |
Outback Steakhouse, Inc. * | | 9,200 | | | 346,472 |
| | | | |
|
|
| | | | | | 662,472 |
| | | | |
|
|
Retail & Merchandising — 5.4% | | | | | |
Home Depot, Inc. | | 51,700 | | | 2,121,768 |
Kohl’s Corp. * | | 4,900 | | | 235,837 |
Limited Brands, Inc. | | 18,500 | | | 370,185 |
Lowe’s Cos., Inc. | | 27,300 | | | 1,659,021 |
SUPERVALU, Inc. | | 7,400 | | | 232,582 |
Target Corp. | | 34,770 | | | 1,936,341 |
TJX Cos., Inc. | | 28,990 | | | 624,155 |
Wal-Mart Stores, Inc. | | 8,370 | | | 395,985 |
Williams-Sonoma, Inc. * | | 9,900 | | | 387,189 |
| | | | |
|
|
| | | | | | 7,963,063 |
| | | | |
|
|
Semiconductors — 2.4% | | | | | |
Broadcom Corp. (Class “A” Stock) * | | 11,000 | | | 467,060 |
Intel Corp. | | 68,500 | | | 1,609,750 |
Marvell Technology Group Ltd. * | | 14,410 | | | 668,768 |
Texas Instruments, Inc. | | 24,720 | | | 705,756 |
| | | | |
|
|
| | | | | | 3,451,334 |
| | | | |
|
|
Software — 1.0% | | | | | |
Electronic Arts, Inc. * | | 20,380 | | | 1,159,214 |
Fiserv, Inc. * | | 8,300 | | | 362,544 |
| | | | |
|
|
| | | | | | 1,521,758 |
| | | | |
|
|
Telecommunications — 5.5% | | | | | |
BellSouth Corp. | | 26,400 | | | 686,928 |
Cisco Systems, Inc. * | | 54,850 | | | 957,133 |
Corning, Inc. * | | 21,500 | | | 431,935 |
Motorola, Inc. | | 30,700 | | | 680,312 |
QUALCOMM, Inc. | | 27,950 | | | 1,111,292 |
SBC Communications, Inc. | | 47,200 | | | 1,125,720 |
Sprint Corp. | | 58,895 | | | 1,372,842 |
Tellabs, Inc. * | | 20,300 | | | 194,068 |
Verizon Communications, Inc. | | 37,672 | | | 1,187,045 |
Vodafone Group PLC, ADR (United Kingdom) | | 13,032 | | | 342,220 |
| | | | |
|
|
| | | | | | 8,089,495 |
| | | | |
|
|
Tobacco — 2.1% | | | | | |
Altria Group, Inc. | | 41,860 | | | 3,141,593 |
| | | | |
|
|
78
| | | | | | |
| | | Shares
| | Value (Note 2)
| |
Transportation — 1.1% | | | | | | |
FedEx Corp. | | 2,900 | | $ | 266,597 | |
United Parcel Service, Inc. (Class “B” Stock) | | 18,300 | | | 1,334,802 | |
| | | | |
|
|
|
| | | | | | 1,601,399 | |
| | | | |
|
|
|
Utilities — 0.9% | | | | | | |
DTE Energy Co. | | 9,500 | | | 410,400 | |
Entergy Corp. | | 1,210 | | | 85,571 | |
Exelon Corp. | | 6,360 | | | 330,910 | |
Progress Energy, Inc. | | 6,200 | | | 270,258 | |
Sempra Energy * | | 6,100 | | | 270,230 | |
| | | | |
|
|
|
| | | | | | 1,367,369 | |
| | | | |
|
|
|
Total Long-Term Investments
(Cost $121,981,945) | | | | | 146,178,195 | |
| | | | |
|
|
|
Short-Term Investments — 8.2% | | | | | | |
Money Market Mutual Fund — 8.0% | | | | | | |
Dryden Core Investment Fund - Taxable Money Market Series (b)(w) | | 11,774,635 | | | 11,774,635 | |
| | | | |
|
|
|
Registered Investment Companies — 0.2% | | | | | | |
BlackRock Provident Institutional Funds TempCash Portfolio | | 104,355 | | | 104,355 | |
BlackRock Provident Institutional Funds TempFund Portfolio | | 104,355 | | | 104,355 | |
| | | | |
|
|
|
| | | | | | 208,710 | |
| | | | |
|
|
|
Total Short-Term Investments
(Cost $11,983,345) | | | | | 11,983,345 | |
| | | | |
|
|
|
Total Investments — 108.0%
(Cost $133,965,290; Note 5) | | | | | 158,161,540 | |
Liabilities In Excess of Other Assets (includes cash collateral for securities on loan of $11,774,635) — (8.0%) | | | | | (11,688,316 | ) |
| | | | |
|
|
|
Net Assets — 100.0% | | | | $ | 146,473,224 | |
| | | | |
|
|
|
The following abbreviations and annotations are used in portfolio descriptions:
| ADR | American Depositary Receipt |
| * | Non-income producing security. |
| (a) | All or a portion of security is on loan. The aggregate market value of such securities is $11,506,805; cash collateral of $11,774,635 (included with liabilities) was received with which the portfolio purchased highly liquid short-term investments. |
| (b) | Represents security purchased with cash collateral for securities on loan. |
| (w) | Prudential Investments LLC, the manager of the Fund also serves as manager of the Dryden Core Investment Fund-Taxable Money Market Series. |
79
Strategic Partners Large Cap Core Fund
SCHEDULE OF INVESTMENTS
October 31, 2005
The industry classification of long-term portfolio holdings, short-term investments and liabilities in excess of other assets shown as a percentage of net assets as of October 31, 2005 were as follows:
| | | |
Financial Services | | 10.5 | % |
Oil & Gas | | 9.3 | |
Insurance | | 6.5 | |
Financial - Bank & Trust | | 6.0 | |
Consumer Products & Services | | 5.7 | |
Telecommunications | | 5.5 | |
Conglomerates | | 5.4 | |
Retail & Merchandising | | 5.4 | |
Computer Services & Software | | 4.4 | |
Computer Hardware | | 3.9 | |
Pharmaceuticals | | 3.8 | |
Medical Supplies & Equipment | | 3.2 | |
Healthcare Services | | 3.1 | |
Internet Services | | 2.7 | |
Semiconductors | | 2.4 | |
Entertainment & Leisure | | 2.3 | |
Aerospace | | 2.2 | |
Tobacco | | 2.1 | |
Beverages | | 1.3 | |
Chemicals | | 1.3 | |
Electronic Components & Equipment | | 1.2 | |
Transportation | | 1.1 | |
Software | | 1.0 | |
Automobile Manufacturers | | 0.9 | |
Utilities | | 0.9 | |
Food | | 0.7 | |
Building Materials | | 0.6 | |
Industrial Products | | 0.6 | |
Machinery & Equipment | | 0.6 | |
Railroads | | 0.6 | |
Construction | | 0.5 | |
Restaurants | | 0.5 | |
Automotive Parts | | 0.4 | |
Cable Television | | 0.4 | |
Clothing & Apparel | | 0.4 | |
Metals & Mining | | 0.4 | |
Broadcasting | | 0.3 | |
Farming & Agriculture | | 0.3 | |
Personal Services | | 0.3 | |
Containers & Packaging | | 0.2 | |
Education | | 0.2 | |
Energy - Energy Resources | | 0.2 | |
Medical Supplies | | 0.2 | |
Printing & Publishing | | 0.2 | |
Advertising | | 0.1 | |
Short-Term Investments (8.0% represents investment purchased with collateral received from securities on loan) | | 8.2 | |
| | |
|
|
| | | 108.0 | |
Liabilities In Excess of Other Assets | | –8.0 | |
| | |
|
|
Total | | 100.0 | % |
| | |
|
|
See Notes to Financial Statements.
80
Strategic Partners Equity Income Fund
SCHEDULE OF INVESTMENTS
October 31, 2005
| | | | | |
| | | Shares
| | Value (Note 2)
|
Long-Term Investments — 99.4% | | | | | |
Common Stocks | | | | | |
Aerospace & Defense — 3.0% | | | | | |
Honeywell International, Inc. | | 74,000 | | $ | 2,530,800 |
Lockheed Martin Corp. | | 22,200 | | | 1,344,432 |
Raytheon Co. | | 41,600 | | | 1,537,120 |
United Technologies Corp. | | 70,470 | | | 3,613,702 |
| | | | |
|
|
| | | | | | 9,026,054 |
| | | | |
|
|
Automobile Manufacturers — 0.3% | | | | | |
General Motors Corp. | | 34,700 | | | 950,780 |
| | | | |
|
|
Beverages — 1.3% | | | | | |
Anheuser-Busch Cos., Inc. | | 39,200 | | | 1,617,392 |
Coca-Cola Co. | | 50,400 | | | 2,156,112 |
| | | | |
|
|
| | | | | | 3,773,504 |
| | | | |
|
|
Building Materials — 0.4% | | | | | |
American Standard Cos., Inc. | | 30,911 | | | 1,175,854 |
| | | | |
|
|
Chemicals — 1.3% | | | | | |
Dow Chemical Co. | | 24,500 | | | 1,123,570 |
E.I. Du Pont de Nemours & Co. | | 44,675 | | | 1,862,501 |
Hercules, Inc. * | | 94,400 | | | 1,051,616 |
| | | | |
|
|
| | | | | | 4,037,687 |
| | | | |
|
|
Commercial Services — 0.7% | | | | | |
Waste Management, Inc. | | 70,100 | | | 2,068,651 |
| | | | |
|
|
Computer Services & Software — 5.4% | | | | | |
Fiserv, Inc. * | | 27,525 | | | 1,202,292 |
Hewlett-Packard Co. | | 68,600 | | | 1,923,544 |
International Business Machines Corp. | | 31,900 | | | 2,611,972 |
Microsoft Corp. | | 326,500 | | | 8,391,050 |
Oracle Corp. * | | 178,200 | | | 2,259,576 |
| | | | |
|
|
| | | | | | 16,388,434 |
| | | | |
|
|
Conglomerates — 0.5% | | | | | |
Tyco International Ltd. | | 55,200 | | | 1,456,728 |
| | | | |
|
|
Construction | | | | | |
Pulte Homes, Inc. | | 3,483 | | | 131,623 |
| | | | |
|
|
Consumer Products & Services — 3.0% | | | | | |
Avon Products, Inc. | | 94,400 | | | 2,547,856 |
Colgate-Palmolive Co. | | 24,300 | | | 1,286,928 |
Fortune Brands, Inc. | | 17,050 | | | 1,295,288 |
Newell Rubbermaid, Inc. | | 73,400 | | | 1,687,466 |
Procter & Gamble Co. | | 41,715 | | | 2,335,623 |
| | | | |
|
|
| | | | | | 9,153,161 |
| | | | |
|
|
Entertainment & Leisure — 0.6% | | | | | |
Carnival Corp. | | 36,450 | | | 1,810,471 |
Royal Caribbean Cruises Ltd. | | 2,570 | | $ | 106,501 |
| | | | |
|
|
| | | | | | 1,916,972 |
| | | | |
|
|
Financial — Bank & Trust — 6.4% | | | | | |
Bank of America Corp. | | 176,900 | | | 7,737,606 |
Fifth Third Bancorp | | 53,100 | | | 2,133,027 |
Goldman Sachs Group, Inc. | | 9,778 | | | 1,235,646 |
Mellon Financial Corp. | | 63,000 | | | 1,996,470 |
North Fork Bancorporation, Inc. | | 24,793 | | | 628,254 |
State Street Corp. | | 40,600 | | | 2,242,338 |
U.S. Bancorp | | 93,600 | | | 2,768,688 |
Wachovia Corp. | | 12,150 | | | 613,818 |
| | | | |
|
|
| | | | | | 19,355,847 |
| | | | |
|
|
Financial Services — 13.0% | | | | | |
American Express Co. | | 42,200 | | | 2,100,294 |
Ameriprise Financial, Inc. | | 33,940 | | | 1,263,247 |
Citigroup, Inc. | | 207,800 | | | 9,513,084 |
Fannie Mae | | 156,800 | | | 7,451,136 |
Franklin Resources, Inc. | | 8,600 | | | 759,982 |
JPMorgan Chase & Co. | | 282,300 | | | 10,337,826 |
Merrill Lynch & Co., Inc. | | 50,600 | | | 3,275,844 |
Morgan Stanley Dean Witter & Co. | | 58,300 | | | 3,172,103 |
Schwab, (Charles) Corp. | | 93,300 | | | 1,418,160 |
| | | | |
|
|
| | | | | | 39,291,676 |
| | | | |
|
|
Food — 1.0% | | | | | |
Campbell Soup Co. | | 48,500 | | | 1,411,350 |
General Mills, Inc. | | 26,600 | | | 1,283,716 |
Unilever NV | | 4,200 | | | 295,302 |
| | | | |
|
|
| | | | | | 2,990,368 |
| | | | |
|
|
Healthcare Services — 2.1% | | | | | |
Health Management Associates, Inc. (Class “A” Stock) | | 92,565 | | | 1,981,817 |
WellPoint, Inc. * | | 60,264 | | | 4,500,515 |
| | | | |
|
|
| | | | | | 6,482,332 |
| | | | |
|
|
Hotels & Motels — 0.3% | | | | | |
Hilton Hotels Corp. | | 46,575 | | | 905,884 |
| | | | |
|
|
Insurance — 8.1% | | | | | |
ACE Ltd. | | 74,925 | | | 3,903,593 |
American International Group, Inc. | | 151,500 | | | 9,817,200 |
Axis Capital Holdings Ltd. (Bermuda) | | 69,579 | | | 1,804,183 |
Genworth Financial, Inc. (Class “A” Stock) | | 19,500 | | | 617,955 |
Hartford Financial Service Group, Inc. | | 20,800 | | | 1,658,800 |
Marsh & McLennan Cos., Inc. | | 115,000 | | | 3,352,250 |
81
Strategic Partners Equity Income Fund
SCHEDULE OF INVESTMENTS
October 31, 2005
| | | | | |
| | | Shares
| | Value (Note 2)
|
Metlife, Inc. | | 19,845 | | $ | 980,541 |
St. Paul Travelers Cos., Inc. (The) | | 49,700 | | | 2,237,991 |
| | | | |
|
|
| | | | | | 24,372,513 |
| | | | |
|
|
Media — 9.1% | | | | | |
Comcast Corp. (Class “A” Stock) | | 15,000 | | | 417,450 |
Comcast Corp. (Special Class “A” Stock) * | | 105,700 | | | 2,897,237 |
Dow Jones & Co., Inc. | | 33,300 | | | 1,129,203 |
Liberty Media Corp. (Class “A” Stock) * | | 247,100 | | | 1,969,387 |
New Corp. | | 255,150 | | | 3,635,888 |
New York Times Co. (Class “A” Stock) | | 51,000 | | | 1,389,240 |
Time Warner, Inc. * | | 433,800 | | | 7,734,654 |
Viacom, Inc. (Class “B” Stock) | | 174,700 | | | 5,410,459 |
Walt Disney Co. (The) | | 78,500 | | | 1,913,045 |
Westwood One, Inc. * | | 60,750 | | | 1,123,875 |
| | | | |
|
|
| | | | | | 27,620,438 |
| | | | |
|
|
Medical Supplies & Equipment — 1.5% | | | | | |
Boston Scientific Corp. * | | 121,500 | | | 3,052,080 |
Forest Laboratories, Inc. * | | 21,345 | | | 809,189 |
Zimmer Holdings, Inc. * | | 10,530 | | | 671,498 |
| | | | |
|
|
| | | | | | 4,532,767 |
| | | | |
|
|
Metals & Mining — 0.5% | | | | | |
Nucor Corp. | | 22,600 | | | 1,352,610 |
| | | | |
|
|
Oil & Gas — 15.0% | | | | | |
Air Products & Chemicals, Inc. | | 93,313 | | | 5,341,236 |
Amerada Hess Corp. | | 15,700 | | | 1,964,070 |
Apache Corp. | | 2,916 | | | 186,128 |
Baker Hughes, Inc. | | 78,900 | | | 4,336,344 |
BP PLC, ADR (United Kingdom) | | 22,032 | | | 1,462,925 |
Chevron Corp. | | 116,100 | | | 6,625,827 |
ConocoPhillips | | 42,201 | | | 2,759,101 |
Exxon Mobil Corp. | | 139,200 | | | 7,814,688 |
Marathon Oil Corp. | | 21,627 | | | 1,301,080 |
Nabors Industries Ltd. * | | 32,562 | | | 2,234,730 |
NiSource, Inc. * | | 102,600 | | | 2,426,490 |
Noble Energy, Inc. | | 46,251 | | | 1,852,353 |
Royal Dutch Shell PLC, ADR (United Kingdom) | | 25,100 | | | 1,557,204 |
Schlumberger Ltd. | | 4,050 | | | 367,619 |
Sempra Energy * | | 18,792 | | | 832,486 |
Total SA, ADR (France) | | 33,400 | | | 4,209,068 |
| | | | |
|
|
| | | | | | 45,271,349 |
| | | | |
|
|
Paper & Forest Products — 0.9% | | | | | |
Bowater, Inc. | | 27,400 | | | 726,100 |
International Paper Co. | | 71,500 | | $ | 2,086,370 |
| | | | |
|
|
| | | | | | 2,812,470 |
| | | | |
|
|
Pharmaceuticals — 4.4% | | | | | |
Bristol-Meyers Squibb Co. | | 66,700 | | | 1,412,039 |
Eli Lilly & Co. | | 24,600 | | | 1,224,834 |
Johnson & Johnson | | 29,400 | | | 1,841,028 |
Merck & Co., Inc. | | 86,600 | | | 2,443,852 |
Pfizer, Inc. | | 145,800 | | | 3,169,692 |
Schering-Plough Corp. | | 77,700 | | | 1,580,418 |
Wyeth | | 39,800 | | | 1,773,488 |
| | | | |
|
|
| | | | | | 13,445,351 |
| | | | |
|
|
Restaurants — 0.4% | | | | | |
McDonald’s Corp. | | 36,450 | | | 1,151,820 |
| | | | |
|
|
Retail & Merchandising — 3.4% | | | | | |
Home Depot, Inc. | | 162,600 | | | 6,673,104 |
Lowe’s Cos., Inc. | | 12,960 | | | 787,579 |
RadioShack Corp. | | 56,300 | | | 1,244,230 |
Wal-Mart Stores, Inc. | | 35,500 | | | 1,679,505 |
| | | | |
|
|
| | | | | | 10,384,418 |
| | | | |
|
|
Semiconductors — 0.6% | | | | | |
Texas Instruments, Inc. | | 61,800 | | | 1,764,390 |
| | | | |
|
|
Telecommunications — 5.1% | | | | | |
Alltel Corp. | | 24,100 | | | 1,490,826 |
BellSouth Corp. | | 46,765 | | | 1,216,825 |
Juniper Networks, Inc. * | | 35,721 | | | 833,371 |
Motorola, Inc. | | 64,000 | | | 1,418,240 |
Qualcomm, Inc. | | 10,473 | | | 416,407 |
Qwest Communications | | | | | |
International, Inc. * | | 313,700 | | | 1,367,732 |
SBC Communications, Inc. | | 145,300 | | | 3,465,405 |
Sprint Nextel Corp. | | 96,000 | | | 2,237,760 |
Verizon Communications, Inc. | | 94,900 | | | 2,990,299 |
| | | | |
|
|
| | | | | | 15,436,865 |
| | | | |
|
|
Tobacco — 1.8% | | | | | |
Altria Group, Inc. * | | 56,300 | | | 4,225,315 |
Loews Corp. - Carolina Group | | 30,375 | | | 1,249,931 |
Reynolds, (R.J.) Tobacco Holdings, Inc. | | 900 | | | 76,500 |
| | | | |
|
|
| | | | | | 5,551,746 |
| | | | |
|
|
Transportation — 2.6% | | | | | |
Union Pacific Corp. | | 77,300 | | | 5,347,614 |
United Parcel Service, Inc. (Class “B” Stock) | | 35,154 | | | 2,564,133 |
| | | | |
|
|
| | | | | | 7,911,747 |
| | | | |
|
|
82
| | | | | | |
| | | Shares
| | Value
(Note 2)
| |
Utilities — 6.7% | | | | | | |
Duke Energy Corp. | | 91,900 | | $ | 2,433,512 | |
Emerson Electric Co. | | 36,612 | | | 2,546,365 | |
FirstEnergy Corp. | | 67,400 | | | 3,201,500 | |
General Electric Co. | | 313,600 | | | 10,634,176 | |
Illinois Tool Works, Inc. | | 13,465 | | | 1,141,293 | |
Ingersoll-Rand Co. Ltd. (Class “A” Stock) | | 5,751 | | | 217,330 | |
| | | | |
|
|
|
| | | | | | 20,174,176 | |
| | | | |
|
|
|
Total Long-Term Investments
(Cost $267,341,808) | | | | | 300,888,215 | |
| | | | |
|
|
|
Short-Term Investment — 0.7% | | | | | | |
Money Market Mutual Fund | | | | | | |
Dryden Core Investment Fund - Taxable Money Market Series (w) (Cost $2,279,573) | | 2,279,573 | | | 2,279,573 | |
| | | | |
|
|
|
Total Investments — 100.1%
(Cost $269,621,381; Note 5) | | | | | 303,167,788 | |
Liabilities In Excess of Other Assets — (0.1%) | | | | | (364,602 | ) |
| | | | |
|
|
|
Net Assets — 100.0% | | | | $ | 302,803,186 | |
| | | | |
|
|
|
The following abbreviations and annotations are used in portfolio descriptions:
| ADR | American Depositary Receipt |
| * | Non-income producing security. |
| (w) | Prudential Investments LLC, the manager of the Fund serves as manager of the Dryden Core Investment Fund-Taxable Money Market Series. |
The industry classification of long-term portfolio holdings, short-term investments and liablilities in excess of other assets shown as a percentage of net assets as of October 31, 2005 were as follows:
| | | |
Oil & Gas | | 15.0 | % |
Financial Services | | 13.0 | |
Media | | 9.1 | |
Insurance | | 8.1 | |
Utilities | | 6.7 | |
Financial - Bank & Trust | | 6.4 | |
Computer Services & Software | | 5.4 | |
Telecommunications | | 5.1 | |
Pharmaceuticals | | 4.4 | |
Retail & Merchandising | | 3.4 | |
Aerospace & Defense | | 3.0 | |
Consumer Products & Services | | 3.0 | |
Transportation | | 2.6 | |
Healthcare Services | | 2.1 | |
Tobacco | | 1.8 | |
Medical Supplies & Equipment | | 1.5 | |
Beverages | | 1.3 | |
Chemicals | | 1.3 | |
Food | | 1.0 | |
Paper & Forest Products | | 0.9 | |
Commercial Services | | 0.7 | |
Entertainment & Leisure | | 0.6 | |
Semiconductors | | 0.6 | |
Conglomerates | | 0.5 | |
Metals & Mining | | 0.5 | |
Building Materials | | 0.4 | |
Restaurants | | 0.4 | |
Automobile Manufacturers | | 0.3 | |
Hotels & Motels | | 0.3 | |
Short-Term Investments | | 0.7 | |
| | |
|
|
| | | 100.1 | |
Liabilities In Excess of Other Assets | | –0.1 | |
| | |
|
|
Total | | 100.0 | % |
| | |
|
|
See Notes to Financial Statements.
83
Strategic Partners Balanced Fund
SCHEDULE OF INVESTMENTS
October 31, 2005
| | | | | |
| | | Shares
| | Value
(Note 2)
|
Long-Term Investments — 104.3% | | | | | |
Common Stocks — 60.1% | | | | | |
Aerospace — 0.4% | | | | | |
Boeing Co. * | | 410 | | $ | 26,503 |
Lockheed Martin Corp. | | 6,820 | | | 413,019 |
| | | | |
|
|
| | | | | | 439,522 |
| | | | |
|
|
Airlines — 0.1% | | | | | |
Southwest Airlines Co. | | 4,121 | | | 65,977 |
| | | | |
|
|
Automobile Manufacturers — 0.5% | | | | | |
Ford Motor Co. | | 42,537 | | | 353,908 |
Navistar International Corp. * | | 5,317 | | | 146,324 |
| | | | |
|
|
| | | | | | 500,232 |
| | | | |
|
|
Automotive Parts — 0.9% | | | | | |
Goodyear Tire & Rubber Co. (The) * | | 34,913 | | | 546,039 |
TRW Automotive Holdings Corp. * | | 18,165 | | | 491,363 |
| | | | |
|
|
| | | | | | 1,037,402 |
| | | | |
|
|
Beverages — 1.9% | | | | | |
Brown-Forman Corp. | | 4,669 | | | 295,734 |
Coca-Cola Co. | | 5,391 | | | 230,627 |
Coca-Cola Enterprises, Inc. | | 11,008 | | | 208,051 |
Constellation Brands, Inc. | | 7,251 | | | 170,689 |
Molson Coors Brewing Co. (Class “B” Stock) | | 163 | | | 10,057 |
Pepsi Bottling Group, Inc. | | 22,936 | | | 652,071 |
PepsiAmericas, Inc. | | 19,177 | | | 447,208 |
PepsiCo, Inc. | | 506 | | | 29,894 |
| | | | |
|
|
| | | | | | 2,044,331 |
| | | | |
|
|
Building Materials — 0.1% | | | | | |
USG Corp. * | | 1,467 | | | 86,729 |
| | | | |
|
|
Business Services — 0.7% | | | | | |
Accenture Ltd. (Class “A” Stock) * | | 10,381 | | | 273,124 |
Alliance Data Systems Corp. * | | 359 | | | 12,766 |
Harland, (John H.) Co. | | 11,606 | | | 482,694 |
| | | | |
|
|
| | | | | | 768,584 |
| | | | |
|
|
Chemicals — 0.5% | | | | | |
FMC Corp. | | 10,445 | | | 568,626 |
| | | | |
|
|
Commercial Services — 0.2% | | | | | |
PHH Corp. * | | 6,768 | | | 190,384 |
| | | | |
|
|
Computer Hardware — 2.6% | | | | | |
Apple Computer, Inc. * | | 15,507 | | | 893,048 |
Dell, Inc. * | | 28,243 | | | 900,387 |
Hewlett-Packard Co. | | 22,822 | | | 639,929 |
International Business Machines Corp. | | 4,634 | | $ | 379,432 |
Western Digital Corp. * | | 1,528 | | | 18,488 |
| | | | |
|
|
| | | | | | 2,831,284 |
| | | | |
|
|
Computer Services & Software — 1.8% | | | | | |
Autodesk, Inc. | | 4,086 | | | 184,401 |
Cadence Design Systems, Inc. * | | 2,998 | | | 47,908 |
Computer Sciences Corp. * | | 7,815 | | | 400,519 |
Global Payments, Inc. | | 4,532 | | | 194,196 |
Intergraph Corp. | | 5,143 | | | 248,818 |
Intuit, Inc. * | | 2,829 | | | 129,936 |
Microsoft Corp. | | 11,057 | | | 284,165 |
Oracle Corp. * | | 21,416 | | | 271,555 |
Parametric Technology Corp. * | | 25,990 | | | 169,195 |
Symantec Corp. * | | 1,598 | | | 38,112 |
| | | | |
|
|
| | | | | | 1,968,805 |
| | | | |
|
|
Conglomerates — 0.2% | | | | | |
Danaher Corp. | | 979 | | | 51,006 |
Teleflex, Inc. | | 2,441 | | | 161,570 |
| | | | |
|
|
| | | | | | 212,576 |
| | | | |
|
|
Consumer Products & Services — 2.9% | | | | | |
Black & Decker Corp. | | 11,418 | | | 937,760 |
Clorox Co. | | 2,385 | | | 129,076 |
Colgate-Palmolive Co. | | 509 | | | 26,957 |
Energizer Holdings, Inc. * | | 3,967 | | | 200,294 |
Johnson & Johnson | | 27,610 | | | 1,728,938 |
Kimberly-Clark Corp. | | 895 | | | 50,872 |
Weight Watchers | | 864 | | | 45,421 |
| | | | |
|
|
| | | | | | 3,119,318 |
| | | | |
|
|
Containers & Packaging — 0.4% | | | | | |
Greif, Inc. (Class “A” Stock) | | 3,082 | | | 188,002 |
Silgan Holdings, Inc. | | 8,440 | | | 271,515 |
| | | | |
|
|
| | | | | | 459,517 |
| | | | |
|
|
Electronic Components & Equipment — 0.2% | | | | | |
Arrow Electronics, Inc. * | | 8,521 | | | 251,455 |
| | | | |
|
|
Entertainment & Leisure — 3.3% | | | | | |
Disney, (Walt) Co. | | 39,432 | | | 960,958 |
DreamWorks Animation SKG, Inc. (Class “A” Stock) * | | 6,431 | | | 164,891 |
Harley-Davidson, Inc. | | 1,111 | | | 55,028 |
Regal Entertainment Group (Class “A” Stock) | | 2,475 | | | 45,614 |
Royal Caribbean Cruises Ltd. | | 5,197 | | | 215,364 |
Time Warner, Inc. * | | 53,030 | | | 945,525 |
84
| | | | | |
| | | Shares
| | Value (Note 2)
|
Viacom, Inc. (Class “B” Stock) | | 38,857 | | $ | 1,203,401 |
| | | | |
|
|
| | | | | | 3,590,781 |
| | | | |
|
|
Environmental Services — 0.1% | | | | | |
Republic Services, Inc. | | 2,191 | | | 77,452 |
| | | | |
|
|
Financial — Bank & Trust — 5.6% | | | | | |
Bank of America Corp. | | 35,232 | | | 1,541,048 |
Comerica, Inc. | | 7,340 | | | 424,105 |
Corus Bankshares, Inc. | | 926 | | | 50,837 |
Downey Financial Corp. | | 7,261 | | | 442,558 |
Fremont General Corp. | | 2,776 | | | 60,211 |
Golden West Financial Corp. | | 7,867 | | | 462,029 |
National City Corp. | | 32,854 | | | 1,058,884 |
Northern Trust Corp. | | 8,251 | | | 442,254 |
Wachovia Corp. | | 6,849 | | | 346,012 |
Wells Fargo & Co. | | 19,950 | | | 1,200,990 |
| | | | |
|
|
| | | | | | 6,028,928 |
| | | | |
|
|
Financial Services — 4.2% | | | | | |
American Express Co. | | 28,262 | | | 1,406,600 |
Asset Acceptance Capital Corp. | | 238 | | | 6,305 |
Capital One Financial Corp. | | 14,212 | | | 1,085,086 |
Compucredit Corp. * | | 2,767 | | | 121,250 |
Federated Investors, Inc. | | 756 | | | 26,467 |
Franklin Resources, Inc. | | 3,062 | | | 270,589 |
Investment Technology Group, Inc. * | | 1,282 | | | 41,678 |
Moody’s Corp. | | 5,837 | | | 310,879 |
Morgan Stanley Dean Witter & Co. | | 10,215 | | | 555,798 |
Washington Mutual, Inc. | | 11,256 | | | 445,738 |
WFS Financial, Inc. * | | 3,708 | | | 266,716 |
| | | | |
|
|
| | | | | | 4,537,106 |
| | | | |
|
|
Food — 2.1% | | | | | |
Archer-Daniels-Midland Co. | | 16,313 | | | 397,548 |
Chiquita Brands International, Inc. * | | 5,076 | | | 140,148 |
Kroger Co. (The) * | | 18,980 | | | 377,702 |
Performance Food Group Co. * | | 12,001 | | | 331,108 |
Pilgrim’s Pride Corp. | | 28,461 | | | 895,952 |
Seaboard Corp. | | 77 | | | 109,417 |
| | | | |
|
|
| | | | | | 2,251,875 |
| | | | |
|
|
Healthcare Services — 1.6% | | | | | |
McKesson Corp. | | 23,564 | | | 1,070,513 |
Sierra Health Services, Inc. * | | 190 | | | 14,250 |
UnitedHealth Group, Inc. | | 12,108 | | | 700,932 |
| | | | |
|
|
| | | | | | 1,785,695 |
| | | | |
|
|
Insurance — 4.0% | | | | | |
Arch Capital Group Ltd. * | | 2,824 | | | 139,788 |
Axis Capital Holdings Ltd. (Bermuda) | | 17,004 | | $ | 440,914 |
Berkley, (W.R.) Corp. | | 20,424 | | | 892,529 |
Chubb Corp. | | 5,777 | | | 537,087 |
Endurance Specialty Holdings Ltd. | | 26,337 | | | 873,335 |
First American Corp. | | 13,098 | | | 573,954 |
Loews Corp. * | | 5,600 | | | 520,688 |
MetLife, Inc. | | 1,803 | | | 89,086 |
Nationwide Financial Services, Inc. (Class “A” Stock) | | 207 | | | 8,361 |
Zenith National Insurance Corp. | | 5,590 | | | 251,662 |
| | | | |
|
|
| | | | | | 4,327,404 |
| | | | |
|
|
Machinery & Equipment — 0.8% | | | | | |
Cummins, Inc. | | 10,026 | | | 855,920 |
| | | | |
|
|
Medical Supplies & Equipment — 2.2% | | | | | |
Amgen, Inc. * | | 17,382 | | | 1,316,860 |
Applera Corp. - Applied Biosystems Group | | 4,919 | | | 119,384 |
Baxter International, Inc. | | 186 | | | 7,111 |
Becton Dickinson & Co. | | 16,459 | | | 835,294 |
Kinetic Concepts, Inc. * | | 3,284 | | | 117,896 |
| | | | |
|
|
| | | | | | 2,396,545 |
| | | | |
|
|
Metals & Mining — 1.9% | | | | | |
Freeport-McMoRan Copper & Gold, Inc. (Class “B” Stock) | | 14,374 | | | 710,363 |
Nucor Corp. | | 3,480 | | | 208,278 |
Phelps Dodge Corp. | | 9,245 | | | 1,113,745 |
Quanex Corp. | | 1,069 | | | 61,906 |
| | | | |
|
|
| | | | | | 2,094,292 |
| | | | |
|
|
Office Equipment | | | | | |
Herman Miller, Inc. | | 835 | | | 22,887 |
| | | | |
|
|
Oil & Gas — 5.9% | | | | | |
ChevronTexaco Corp. | | 11,963 | | | 682,728 |
ConocoPhillips | | 3,948 | | | 258,120 |
Energen Corp. | | 1,126 | | | 42,338 |
Exxon Mobil Corp. | | 48,244 | | | 2,708,418 |
Helmerich & Payne, Inc. | | 431 | | | 23,877 |
Kerr-McGee Corp. | | 3,529 | | | 300,106 |
Marathon Oil Corp. | | 18,367 | | | 1,104,959 |
Sunoco, Inc. | | 14,654 | | | 1,091,723 |
Valero Energy Corp. | | 1,607 | | | 169,121 |
Veritas DGC, Inc. | | 1,210 | | | 38,974 |
| | | | |
|
|
| | | | | | 6,420,364 |
| | | | |
|
|
Paper & Forest Products — 0.1% | | | | | |
Potlatch Corp. | | 3,182 | | | 142,331 |
| | | | |
|
|
85
Strategic Partners Balanced Fund
SCHEDULE OF INVESTMENTS
October 31, 2005
| | | | | | |
| | | Shares
| | Value
(Note 2)
|
Pharmaceuticals — 3.9% | | | | | | |
Allergan, Inc. | | | 3,215 | | $ | 287,099 |
Alpharma, Inc. (Class “A” Stock) | | | 2,300 | | | 57,247 |
AmerisourceBergen Corp. | | | 9,474 | | | 722,582 |
Cardinal Health, Inc. | | | 16,819 | | | 1,051,356 |
Express Scripts, Inc. | | | 881 | | | 66,436 |
Gilead Sciences, Inc. * | | | 5,040 | | | 238,140 |
Hospira, Inc. | | | 24,929 | | | 993,421 |
King Pharmaceuticals, Inc. * | | | 33,317 | | | 514,081 |
Pfizer, Inc. | | | 12,081 | | | 262,641 |
| | | | | |
|
|
| | | | | | | 4,193,003 |
| | | | | |
|
|
Printing & Publishing — 0.3% | | | | | | |
Dex Media, Inc. | | | 5,961 | | | 160,768 |
Scholastic Corp. * | | | 1,358 | | | 44,203 |
Wiley, (John) & Sons, Inc. | | | 2,688 | | | 105,370 |
| | | | | |
|
|
| | | | | | | 310,341 |
| | | | | |
|
|
Railroads — 0.1% | | | | | | |
Burlington Northern Santa Fe Corp. | | | 317 | | | 19,673 |
Union Pacific Corp. | | | 1,134 | | | 78,450 |
| | | | | |
|
|
| | | | | | | 98,123 |
| | | | | |
|
|
Real Estate Investment Trust — 0.3% | | | | | | |
CBL & Associates Properties, Inc. | | | 382 | | | 14,267 |
Trizec Properties, Inc. | | | 12,327 | | | 274,276 |
| | | | | |
|
|
| | | | | | | 288,543 |
| | | | | |
|
|
Restaurants — 0.5% | | | | | | |
Darden Restaurants, Inc. | | | 16,145 | | | 523,421 |
| | | | | |
|
|
Retail & Merchandising — 1.9% | | | | | | |
American Eagle Outfitters, Inc. | | | 54 | | | 1,272 |
Barnes & Noble, Inc. * | | | 2,757 | | | 99,693 |
Charming Shoppes, Inc. * | | | 8,683 | | | 97,250 |
Children’s Place Retail Stores, Inc. (The) * | | | 4,677 | | | 200,784 |
Federated Department Stores, Inc. | | | 9,296 | | | 570,495 |
Home Depot, Inc. | | | 15,404 | | | 632,180 |
Longs Drug Stores Corp. | | | 7,708 | | | 321,501 |
Payless Shoesource, Inc. * | | | 7,563 | | | 138,932 |
SUPERVALU, Inc. | | | 1,399 | | | 43,970 |
| | | | | |
|
|
| | | | | | | 2,106,077 |
| | | | | |
|
|
Semi-Conductor & Semi-Conductor Instruments — 1.0% | | | | | | |
Texas Instruments, Inc. | | | 36,645 | | | 1,046,215 |
| | | | | |
|
|
Semiconductors — 1.6% | | | | | | |
Emulex Corp. * | | | 3,764 | | | 69,672 |
Intel Corp. | | | 71,901 | | | 1,689,673 |
| | | | | |
|
|
| | | | | | | 1,759,345 |
| | | | | |
|
|
Software | | | | | | |
BMC Software, Inc. * | | | 1,058 | | $ | 20,726 |
| | | | | |
|
|
Telecommunications — 2.4% | | | | | | |
ALLTEL Corp. | | | 1,569 | | | 97,058 |
AT&T Corp. | | | 5,655 | | | 111,856 |
BellSouth Corp. | | | 8,539 | | | 222,185 |
CenturyTel, Inc. | | | 470 | | | 15,383 |
Cisco Systems, Inc. * | | | 13,210 | | | 230,515 |
Harris Corp. | | | 1,311 | | | 53,882 |
Motorola, Inc. | | | 7,257 | | | 160,815 |
SBC Communications, Inc. | | | 8,063 | | | 192,303 |
Sprint Corp. | | | 44,708 | | | 1,042,143 |
Verizon Communications, Inc. | | | 13,802 | | | 434,901 |
West Corp. * | | | 663 | | | 26,155 |
| | | | | |
|
|
| | | | | | | 2,587,196 |
| | | | | |
|
|
Transportation — 0.4% | | | | | | |
FedEx Corp. | | | 616 | | | 56,629 |
United Parcel Service, Inc. (Class “B” Stock) | | | 4,697 | | | 342,599 |
| | | | | |
|
|
| | | | | | | 399,228 |
| | | | | |
|
|
Utilities — 2.5% | | | | | | |
AES Corp. * | | | 25,685 | | | 408,135 |
Allegheny Energy, Inc. * | | | 5,929 | | | 167,554 |
Constellation Energy Group, Inc. | | | 1,493 | | | 81,816 |
Entergy Corp. | | | 3,324 | | | 235,073 |
TXU Corp. | | | 11,509 | | | 1,159,532 |
UGI Corp. | | | 28,560 | | | 674,016 |
| | | | | |
|
|
| | | | | | | 2,726,126 |
| | | | | |
|
|
Total Common Stocks
(Cost $57,492,496) | | | | | | 65,134,665 |
| | | | | |
|
|
| | |
| | | Principal
Amount
(000)
| | |
U.S. Government Agency Mortgage-Backed Securities — 19.7% | | | | | | |
Federal Home Loan Bank | | | | | | |
4.60%, 04/11/08 | | $ | 940 | | | 932,025 |
Federal Home Loan Mortgage Corp. | | | | | | |
4.25%, 02/28/07 | | | 910 | | | 906,016 |
4.50%, 03/15/14 - 01/01/19 | | | 2,024 | | | 1,994,497 |
4.75%, 10/17/08 | | | 500 | | | 496,914 |
5.50%, 12/01/33 | | | 532 | | | 525,864 |
6.50%, 06/01/16 - 06/01/31 | | | 345 | | | 353,708 |
7.00%, 03/15/10 - 08/01/29 | | | 1,240 | | | 1,341,708 |
86
| | | | | | |
| | | Principal
Amount
(000)
| | Value
(Note 2)
|
Federal National Mortgage Assoc. | | | | | | |
4.50%, 05/01/19 | | $ | 244 | | $ | 235,997 |
5.00%, 11/01/33 - 08/01/34 | | | 2,033 | | | 1,956,882 |
5.00%, TBA | | | 1,480 | | | 1,459,650 |
5.25%, 04/15/07 | | | 1,063 | | | 1,072,352 |
5.50%, 12/01/16 - 01/01/34 | | | 3,059 | | | 3,025,001 |
5.50%, TBA | | | 700 | | | 704,593 |
5.75%, 02/15/08 | | | 450 | | | 460,464 |
6.00%, 12/01/13 - 07/01/35 | | | 846 | | | 856,575 |
6.00%, TBA | | | 2,079 | | | 2,096,946 |
6.50%, 07/01/29 - 01/01/32 | | | 365 | | | 374,417 |
6.50%, TBA | | | 1,375 | | | 1,411,094 |
7.00%, 05/01/11 - 06/01/32 | | | 460 | | | 480,248 |
7.50%, 07/01/29 - 09/01/30 | | | 71 | | | 75,762 |
Government National Mortgage Assoc. | | | | | | |
7.50%, 05/15/30 | | | 38 | | | 40,494 |
7.00%, 08/15/29 - 05/15/31 | | | 140 | | | 147,940 |
6.50%, 05/15/28 - 03/15/29 | | | 342 | | | 355,261 |
6.00%, 08/15/28 | | | 40 | | | 40,881 |
| | | | | |
|
|
Total U.S. Government Agency Mortgage-Backed Securities
(Cost $21,472,200) | | | | | | 21,345,289 |
| | | | | |
|
|
| | | | | | | | |
| | | Moody’s
Ratings
(Unaudited)
| | | | |
Corporate Obligations — 9.8% | | | | | | | | |
Beverages — 0.2% | | | | | | | | |
Miller Brewing Co., Notes 144A (g) | | | | | | | | |
4.25%, 08/15/08 | | Baa1 | | | 200 | | | 196,006 |
| | | | | | | |
|
|
Broadcasting — 0.3% | | | | | | | | |
Cox Communications, Inc., Notes | | | | | | | | |
4.625%, 01/15/10 | | Baa3 | | | 225 | | | 217,117 |
News America Holdings Co., Gtd. Notes | | | | | | | | |
7.75%, 01/20/24 | | Baa3 | | | 100 | | | 111,400 |
| | | | | | | |
|
|
| | | | | | | | | 328,517 |
| | | | | | | |
|
|
Cable Television — 0.3% | | | | | | | | |
Comcast Corp., Gtd. Notes | | | | | | | | |
5.50%, 03/15/11 | | Baa3 | | | 350 | | | 350,345 |
| | | | | | | |
|
|
Commercial Services — 0.1% | | | | | | | | |
D.R. Horton, Inc., Sr. Notes | | | | | | | | |
7.875%, 08/15/11 | | Ba1 | | | 120 | | | 129,416 |
| | | | | | | |
|
|
Computer Services & Software — 0.1% | | | | | | | | |
Computer Associates International, Inc. Sr. Notes 144A (g) | | | | | | | | |
4.75%, 12/01/09 | | Ba1 | | $ | 160 | | $ | 155,379 |
| | | | | | | |
|
|
Construction — 0.1% | | | | | | | | |
KB Home & Broad Home Corp., Notes | | | | | | | | |
6.375%, 08/15/11 | | Ba1 | | | 110 | | | 108,310 |
| | | | | | | |
|
|
Consumer Products & Services — 0.4% | | | | | | | | |
General Electric Co., Notes | | | | | | | | |
5.00%, 02/01/13 | | Aaa | | | 390 | | | 386,716 |
| | | | | | | |
|
|
Containers & Packaging — 0.1% | | | | | | | | |
Ball Corp., Gtd. Notes | | | | | | | | |
7.75%, 08/01/06 | | Ba2 | | | 150 | | | 152,250 |
| | | | | | | |
|
|
Entertainment & Leisure — 0.2% | | | | | | | | |
Park Place Entertainment, Inc., Sr. Sub. Notes | | | | | | | | |
7.875%, 12/15/05 | | Ba2 | | | 200 | | | 200,500 |
| | | | | | | |
|
|
Environmental Services — 0.1% | | | | | | | | |
Waste Management, Inc., Sr. Notes | | | | | | | | |
7.00%, 07/15/28 | | Baa3 | | | 130 | | | 143,238 |
| | | | | | | |
|
|
Financial — Bank & Trust — 0.6% | | | | | | | | |
Citigroup, Inc., Sub. Notes | | | | | | | | |
5.00%, 09/15/14 | | Aa2 | | | 272 | | | 266,367 |
HSBC Finance Corp., Sr. Notes | | | | | | | | |
4.625%, 09/15/10 | | A1 | | | 90 | | | 87,839 |
PNC Bank NA, Sub. Notes | | | | | | | | |
4.875%, 09/21/17 | | A2 | | | 110 | | | 104,329 |
Wells Fargo & Co., Sr. Notes | | | | | | | | |
4.625%, 08/09/10 | | Aa1 | | | 140 | | | 137,984 |
| | | | | | | |
|
|
| | | | | | | | | 596,519 |
| | | | | | | |
|
|
Financial — Brokerage — 0.6% | | | | | | | | |
Goldman Sachs Group, Inc., Notes | | | | | | | | |
5.25%, 10/15/13 | | Aa3 | | | 150 | | | 148,345 |
Merrill Lynch & Co., Inc., Notes | | | | | | | | |
2.07%, 06/12/06 | | Aa3 | | | 250 | | | 245,944 |
4.25%, 02/08/10 | | Aa3 | | | 100 | | | 96,789 |
87
Strategic Partners Balanced Fund
SCHEDULE OF INVESTMENTS
October 31, 2005
| | | | | | | | |
| | | Moody’s
Ratings
(Unaudited)
| | Principal
Amount
(000)
| | Value
(Note 2)
|
Morgan Stanley, Notes | | | | | | | | |
4.00%, 01/15/10 | | Aa3 | | $ | 50 | | $ | 47,815 |
Sr. Sub. Notes | | | | | | | | |
4.75%, 04/01/14 | | A1 | | | 70 | | | 66,034 |
| | | | | | | |
|
|
| | | | | | | | | 604,927 |
| | | | | | | |
|
|
Financial Services — 1.4% | | | | | | | | |
American General Finance, Notes | | | | | | | | |
4.50%, 11/15/07 | | A1 | | | 200 | | | 198,545 |
Bank of America Corp., Sr. Notes | | | | | | | | |
4.375%, 12/01/10 | | Aa2 | | | 250 | | | 242,677 |
Capital One Financial, Notes | | | | | | | | |
4.80%, 02/21/12 | | Baa3 | | | 150 | | | 143,484 |
Ford Motor Credit Co., Notes | | | | | | | | |
6.50%, 01/25/07 | | A3 | | | 80 | | | 79,051 |
7.375%, 10/28/09 | | A3 | | | 260 | | | 248,085 |
General Electric Capital Corp., Notes | | | | | | | | |
6.125%, 02/22/11 | | Aaa | | | 90 | | | 94,314 |
General Motors Acceptance Corp., Notes | | | | | | | | |
6.125%, 08/28/07 | | Aaa | | | 150 | | | 147,691 |
6.75%, 12/01/14 | | Baa1 | | | 50 | | | 47,812 |
John Deere Capital Corp., Sr. Notes | | | | | | | | |
4.50%, 08/25/08 | | A3 | | | 140 | | | 138,504 |
Morgan Stanley, Notes | | | | | | | | |
4.25%, 05/15/10 | | Aa3 | | | 150 | | | 144,278 |
| | | | | | | |
|
|
| | | | | | | | | 1,484,441 |
| | | | | | | |
|
|
Food — 0.1% | | | | | | | | |
Cadbury Schweppes US Finance LLC, Notes 144A (g) | | | | | | | | |
3.875%, 10/01/08 | | Baa2 | | | 90 | | | 87,285 |
Kroger Co., Gtd. Notes | | | | | | | | |
6.80%, 04/01/11 | | Baa2 | | | 70 | | | 73,152 |
| | | | | | | |
|
|
| | | | | | | | | 160,437 |
| | | | | | | |
|
|
Insurance — 0.4% | | | | | | | | |
Genworth Financial, Inc., Notes | | | | | | | | |
4.95%, 10/01/15 | | A2 | | $ | 70 | | $ | 67,753 |
5.75%, 06/15/14 | | A2 | | | 150 | | | 154,798 |
Monumental Global Funding II, Notes 144A (g) | | | | | | | | |
3.85%, 03/03/08 | | Aa3 | | | 250 | | | 244,419 |
| | | | | | | |
|
|
| | | | | | | | | 466,970 |
| | | | | | | |
|
|
Internet Services | | | | | | | | |
IAC Interactive Corp., Notes | | | | | | | | |
7.00%, 01/15/13 | | Baa3 | | | 50 | | | 51,244 |
| | | | | | | |
|
|
Medical Supplies & Equipment — 0.4% | | | | | | | | |
Beckman Coulter, Inc., Gtd. Notes | | | | | | | | |
7.45%, 03/04/08 | | Baa3 | | | 300 | | | 315,579 |
Schering-Plough Corp., Notes | | | | | | | | |
5.30%, 12/01/13 | | Baa1 | | | 100 | | | 101,234 |
| | | | | | | |
|
|
| | | | | | | | | 416,813 |
| | | | | | | |
|
|
Metals & Mining — 0.1% | | | | | | | | |
Alcan, Inc., Notes | | | | | | | | |
4.50%, 05/15/13 | | Baa1 | | | 100 | | | 94,361 |
| | | | | | | |
|
|
Miscellaneous — 0.7% | | | | | | | | |
Morgan Stanley Traded Custody Receipts Series 2002-2, Sub. Notes 144A (c)(f)(g) | | | | | | | | |
7.705%, 03/01/32 | | Baa1 | | | 684 | | | 787,701 |
| | | | | | | |
|
|
Oil & Gas — 0.7% | | | | | | | | |
Anadarko Petroleum Corp., Debs. | | | | | | | | |
7.95%, 04/15/29 | | Baa1 | | | 200 | | | 246,983 |
Devon Energy Corp., Sr. Notes | | | | | | | | |
2.75%, 08/01/06 | | Baa2 | | | 200 | | | 196,671 |
Enterprise Products Operating LP, Sr. Notes | | | | | | | | |
4.95%, 06/01/10 | | Baa3 | | | 190 | | | 185,065 |
Nexen, Inc., Notes | | | | | | | | |
5.875%, 03/10/35 | | Baa2 | | | 65 | | | 61,860 |
88
| | | | | | | | | |
| | | Moody’s
Ratings
(Unaudited)
| | Principal
Amount
(000)
| | | Value
(Note 2)
|
XTO Energy, Inc., Notes | | | | | | | | | |
5.30%, 06/30/15 | | Baa | | $ | 50 | | | $ | 49,397 |
| | | | | | | | |
|
|
| | | | | | | | | | 739,976 |
| | | | | | | | |
|
|
Railroads — 0.3% | | | | | | | | | |
Canandian National Railways Co., Bonds | | | | | | | | | |
6.25%, 08/01/34 | | Baa1 | | | 200 | | | | 216,486 |
Norfolk Southern Corp., Sr. Notes | | | | | | | | | |
7.80%, 05/15/27 | | Baa1 | | | 6 | | | | 7,460 |
Sr. Unsec’d. Notes | | | | | | | | | |
5.64%, 05/17/29 | | Baa1 | | | 144 | | | | 140,959 |
| | | | | | | | |
|
|
| | | | | | | | | | 364,905 |
| | | | | | | | |
|
|
Restaurants — 0.2% | | | | | | | | | |
Yum! Brands, Inc., Sr. Notes | | | | | | | | | |
8.875%, 04/15/11 | | Baa3 | | | 170 | | | | 198,015 |
| | | | | | | | |
|
|
Retail & Merchandising — 0.5% | | | | | | | | | |
CVS Corp., Notes | | | | | | | | | |
4.00%, 09/15/09 | | A3 | | | 100 | | | | 96,179 |
May Department Stores Co., Notes | | | | | | | | | |
4.80%, 07/15/09 | | Baa2 | | | 300 | | | | 295,788 |
Safeway, Inc., Notes | | | | | | | | | |
6.50%, 03/01/11 | | Baa2 | | | 100 | | | | 102,729 |
| | | | | | | | |
|
|
| | | | | | | | | | 494,696 |
| | | | | | | | |
|
|
Telecommunications — 1.1% | | | | | | | | | |
AT&T Broadband Corp., Gtd. Notes | | | | | | | | | |
8.375%, 03/15/13 | | Baa3 | | | 38 | | | | 43,772 |
AT&T Corp., Notes | | | | | | | | | |
6.00%, 03/15/09 | | Baa2 | | | — | (r) | | | 204 |
Sr. Notes | | | | | | | | | |
9.05%, 11/15/11 | | Ba1 | | | 115 | | | | 127,075 |
British Telecom PLC, Unsub. Notes (United Kingdom) (l) | | | | | | | | | |
7.00%, 05/23/07 | | Baa1 | | | 175 | | | | 179,989 |
Deutsche Telekom International Finance BV, Gtd. Notes (Germany) (l) | | | | | | | | | |
5.25%, 07/22/13 | | Baa1 | | | 50 | | | | 49,437 |
Deutsche Telekom International Finance BV, Gtd. Notes (Netherlands) (l) | | | | | | | | | |
8.50%, 06/15/10 | | Baa1 | | $ | 110 | | | $ | 122,753 |
France Telecom SA, Notes (France) (l) | | | | | | | | | |
8.00%, 03/01/11 | | Baa1 | | | 100 | | | | 111,384 |
Nextel Communications, Sr. Notes | | | | | | | | | |
5.95%, 03/15/14 | | Ba3 | | | 180 | | | | 180,561 |
Sprint Capital Corp., Notes | | | | | | | | | |
8.375%, 03/15/12 | | Baa3 | | | 150 | | | | 173,069 |
Gtd. Notes | | | | | | | | | |
8.75%, 03/15/32 | | Baa3 | | | 60 | | | | 77,606 |
Telecom Italia Capital SA, Co., Gtd. Notes | | | | | | | | | |
4.00%, 01/15/10 | | Baa2 | | | 70 | | | | 66,541 |
Vodafone Group PLC., Unsec’d. Notes (United Kingdom) (l) | | | | | | | | | |
5.00%, 09/15/15 | | A2 | | | 110 | | | | 106,833 |
| | | | | | | | |
|
|
| | | | | | | | | | 1,239,224 |
| | | | | | | | |
|
|
Utilities — 0.8% | | | | | | | | | |
Carolina Power & Light, First Mortgage | | | | | | | | | |
5.15%, 04/01/15 | | A3 | | | 30 | | | | 29,453 |
CenterPoint Energy Resources Corp., Debs. | | | | | | | | | |
6.50%, 02/01/08 | | Ba1 | | | 225 | | | | 231,055 |
Dominion Resources, Inc., Notes | | | | | | | | | |
4.125%, 02/15/08 | | Baa1 | | | 250 | | | | 245,535 |
4.75%, 12/15/10 | | Baa1 | | | 70 | | | | 68,299 |
Nisource Finance Corp., Gtd. Notes | | | | | | | | | |
5.25%, 09/15/17 | | Baa3 | | | 70 | | | | 66,957 |
Pacific Gas & Electric Corp., First Mortgage | | | | | | | | | |
6.05%, 03/01/34 | | Baa1 | | | 80 | | | | 80,371 |
89
Strategic Partners Balanced Fund
SCHEDULE OF INVESTMENTS
October 31, 2005
| | | | | | | | | |
| | | Moody’s
Ratings
(Unaudited)
| | | Principal
Amount
(000)
| | Value (Note 2)
|
Tampa Electric Co., Notes | | | | | | | | | |
6.375%, 08/15/12 | | Baa2 | | | $ | 100 | | $ | 106,171 |
| | | | | | | | |
|
|
| | | | | | | | | | 827,841 |
| | | | | | | | |
|
|
Total Corporate Obligations
(Cost $10,757,092) | | | | | | | | | 10,678,747 |
| | | | | | | | |
|
|
Collateralized Mortgage Obligations — 5.1% | | | | | | | | | |
Banc of America Commercial Mortgage, Inc., Series 2004-1, Class XP, IO | | | | | | | | | |
0.80%, 11/10/39 | | AAA | (d) | | | 2,712 | | | 65,992 |
Banc of America Mortgage Securities, Series 2004-F, Class 2A5 (c) | | | | | | | | | |
4.163%, 07/25/34 | | Aaa | | | | 1,000 | | | 969,762 |
Bear Stearns Adjustable Rate Mortgage Trust, Series 2005-4 Class-4A2 (c) | | | | | | | | | |
4.567%, 08/25/35 | | Aaa | | | | 500 | | | 486,552 |
Bear Stearns Commercial Mortgage Securities, Series 2004-BA5A, Class A1 144A (g) | | | | | | | | | |
3.898%, 09/15/19 | | Aaa | | | | 157 | | | 157,446 |
Bear Stearns Commercial Mortgage Securities, Series 2004-T16, Class-X2, IO | | | | | | | | | |
0.81%, 08/13/46 | | AAA | (d) | | | 4,500 | | | 163,858 |
Commercial Mortgage Acceptance Corp., Series 1998-C2, Class X, IO | | | | | | | | | |
1.02%, 09/15/30 | | AAA | (d) | | | 5,746 | | | 187,278 |
Federal National Mortgage Assoc., Series 2003-52, Class KF (c) | | | | | | | | | |
4.438%, 07/25/17 | | Aaa | | | | 287 | | | 288,103 |
GMAC Commercial Mortgage Securities, Inc., Series 2002-C2, Class A1 | | | | | | | | | |
4.321%, 10/15/38 | | Aaa | | | $ | 318 | | $ | 316,810 |
LB-UBS Commercial Mortgage Trust, Series 2005-C3 Class A3 | | | | | | | | | |
4.647%, 07/15/30 | | Aaa | | | | 500 | | | 485,427 |
LB-UBS Commerical Mortgage Trust, Series 2003-C5, Class A2 | | | | | | | | | |
3.478%, 07/15/27 | | AAA | (d) | | | 700 | | | 674,263 |
Lehman Brothers Mortgage Trust, Series 2005-LLFA, Class A1 144A (c) | | | | | | | | | |
4.07%, 07/15/18 | | Aaa | | | | 325 | | | 324,943 |
Master Alternative Loans Trust, Series 2003-8, Class 4A1 | | | | | | | | | |
7.00%, 12/25/33 | | AAA | (d) | | | 74 | | | 74,042 |
Washington Mutual, Series 2004-AR4, Class A6 (c) | | | | | | | | | |
3.806%, 06/25/34 | | Aaa | | | | 500 | | | 478,972 |
Washington Mutual, Series 2004-AR9, Class A7 (c) | | | | | | | | | |
4.196%, 08/25/34 | | Aaa | | | | 640 | | | 625,729 |
Washington Mutual, Series 2005-AR11, Class A1C1 (c) | | | | | | | | | |
4.03%, 07/25/45 | | Aaa | | | | 239 | | | 239,178 |
| | | | | | | | |
|
|
Total Collateralized Mortgage Obligations
(Cost $5,661,400) | | | | | | | | | 5,538,355 |
| | | | | | | | |
|
|
U.S. Treasury Obligations — 4.8% | | | | | | | | | |
U.S. Treasury Bonds | | | | | | | | | |
8.00%, 11/15/21 | | | | | | 460 | | | 622,186 |
6.25%, 08/15/23 | | | | | | 1,000 | | | 1,167,070 |
5.375%, 02/15/31 | | | | | | 415 | | | 452,609 |
U.S. Treasury Inflationary Bonds TIPS | | | | | | | | | |
1.875%, 07/15/15 | | | | | | 206 | | | 205,855 |
3.00%, 07/15/12 | | | | | | 200 | | | 233,558 |
90
| | | | | | | | |
| | | Moody’s
Ratings
(Unaudited)
| | Principal
Amount
(000)
| | Value (Note 2)
|
U.S. Treasury Notes | | | | | | | | |
4.25%, 10/15/10 - 08/15/15 | | | | $ | 2,545 | | $ | 2,492,668 |
| | | | | | | |
|
|
Total U.S. Treasury Obligations
(Cost $5,226,196) | | | | | | | | 5,173,946 |
| | | | | | | |
|
|
Asset-Backed Securities — 4.1% | | | | | | | | |
ABSC NIMS Trust, Series 2004-HE5, Class A1 144A (g) | | | | | | | | |
5.00%, 08/27/34 | | BBB+(d) | | | 12 | | | 11,987 |
Accredited Mortgage Loan Trust, Series 2004-4, Class A2A(c) | | | | | | | | |
4.188%, 01/25/35 | | Aaa | | | 127 | | | 127,449 |
Ameriquest Finance NIM Trust, Series 2004-RN4, Class A 144A (g) | | | | | | | | |
4.60%, 07/25/34 | | BBB(d) | | | 5 | | | 5,404 |
Ameriquest Finance NIM Trust, Series 2004-RN5, Class A 144A (g) | | | | | | | | |
5.193%, 06/25/34 | | BBB+(d) | | | 9 | | | 9,075 |
Argent NIM Notes, Series 2004-WN9, Class A 144A (g) | | | | | | | | |
5.19%, 10/25/34 | | BBB(d) | | | 14 | | | 13,731 |
Argent NIM Trust, Series 2004-WN10, Class A 144A (g) | | | | | | | | |
4.212%, 11/26/34 | | A-(d) | | | 12 | | | 11,476 |
Argent NIM Trust, Series 2004-WN8, Class A 144A (g) | | | | | | | | |
4.70%, 07/25/34 | | BBB+(d) | | | 3 | | | 3,488 |
Asset Backed Funding Corp. NIM Trust, Series 2004-OPT4, Class N1 | | | | | | | | |
4.45%, 05/26/34 | | A-(d) | | | 23 | | | 22,601 |
Capital One Prime Auto Receivables Trust, Series 2004-2, Class A4 (c) | | | | | | | | |
4.03%, 04/15/10 | | Aaa | | | 550 | | | 550,432 |
Centex Home Equity, Series 2004-C, Class AF1 | | | | | | | | |
2.82%, 01/25/19 | | Aaa | | $ | 43 | | $ | 43,118 |
CNH Equipment Trust, Series 2004-A, Class A3A (c) | | | | | | | | |
4.04%, 10/15/08 | | Aaa | | | 110 | | | 110,037 |
Commercial Mortgage Pass-Through, Series 2004-HTL1, Class A1 | | | | | | | | |
4.008%, 07/15/16 | | Aaa | | | 161 | | | 161,076 |
Countrywide Asset-Backed Certificates Series 2004-11N, Class-N 144A (g) | | | | | | | | |
5.25%, 04/25/36 | | BBB(d) | | | 13 | | | 12,429 |
Countrywide Asset-Backed Certificates, Series 2004-5N, Class N1 | | | | | | | | |
5.50%, 10/25/35 | | BBB(d) | | | 12 | | | 11,463 |
Equifirst Mortgage Loan Trust Series 2004-3 Class A1 (c) | | | | | | | | |
4.198%, 12/25/34 | | Aaa | | | 87 | | | 87,163 |
Finance America NIM Trust, Series 2004-1, Class A | | | | | | | | |
5.25%, 06/27/34 | | BBB+(d) | | | 12 | | | 11,482 |
First Franklin Mortgage Loan Asset Backed, Series 2004-FF11, Class 2A1 | | | | | | | | |
4.188%, 01/25/35 | | Aaa | | | 137 | | | 136,617 |
First Franklin Mortgage Loan Asset Backed, Series 2005-FF4, Class 2A1 (c)(g) | | | | | | | | |
4.118%, 05/25/35 | | Aaa | | | 1,090 | | | 1,090,212 |
91
Strategic Partners Balanced Fund
SCHEDULE OF INVESTMENTS
October 31, 2005
| | | | | | | | | | |
| | | Moody’s
Ratings
(Unaudited)
| | Principal Amount (000)
| | | Value (Note 2)
| |
Ford Credit Floorplan Master Owner Trust, Series 2004-1, Class A (c) | | | | | | | | | | |
4.01%, 07/15/09 | | Aaa | | $ | 1,613 | | | $ | 1,613,458 | |
Fremont NIM Trust, Series 2004-B, Class Notes 144A (g) | | | | | | | | | | |
4.703%, 05/25/34 | | BBB+(d) | | | — | (r) | | | 273 | |
GSAMP Trust, Series 2004-NIM1, Class N1 144A | | | | | | | | | | |
5.50%, 09/25/34 | | BBB(d) | | | 15 | | | | 15,481 | |
Long Beach Asset Holdings Corp., Series 2004-5, Class Notes 144A (g) | | | | | | | | | | |
5.00%, 09/25/34 | | A-(d) | | | 13 | | | | 13,333 | |
Long Beach Asset Holdings Corp., Series 2005-1, Class N1 144A (g) | | | | | | | | | | |
4.115%, 02/25/35 | | NR | | | 49 | | | | 48,331 | |
Park Place Securities, Inc., Series 2004-WHQ2, Class A3B (c) | | | | | | | | | | |
4.198%, 12/27/34 | | Aaa | | | 186 | | | | 186,331 | |
Residential Asset Securities Corp., Series 2004-KS2, Class MI1 | | | | | | | | | | |
4.71%, 03/25/34 | | Aa2 | | | 75 | | | | 72,585 | |
Sail Net Interest Margin Notes, Series 2004-8A, Class A 144A (g) | | | | | | | | | | |
5.00%, 09/27/34 | | A-(d) | | | 24 | | | | 24,165 | |
Sail Net Interest Margin Notes, Series 2004-BNCA, Class A 144A (g) | | | | | | | | | | |
5.00%, 09/27/34 | | A-(d) | | | 10 | | | | 9,798 | |
Sharps SP I LLC Net Interest Margin Trust, Series 2004-OP1N, Class NA 144A (g) | | | | | | | | | | |
5.19%, 04/25/34 | | BBB(d) | | $ | 10 | | | $ | 9,529 | |
| | | | | | | | |
|
|
|
Total Asset-Backed Securities
(Cost $4,414,355) | | | | | | | | | 4,412,524 | |
| | | | | | | | |
|
|
|
Municipal Bonds — 0.7% | | | | | | | | | | |
Illinois — 0.2% | | | | | | | | | | |
Illinois State Taxable Pension | | | | | | | | | | |
5.10%, 06/01/33 | | Aa3 | | | 200 | | | | 192,454 | |
| | | | | | | | |
|
|
|
Massachusetts — 0.5% | | | | | | | | | | |
Massachusetts State Spl. Obligation Tax Revenue | | | | | | | | | | |
5.50%, 01/01/34 | | Aaa | | | 500 | | | | 571,485 | |
| | | | | | | | |
|
|
|
Total Municipal Bonds
(Cost $809,031) | | | | | | | | | 763,939 | |
| | | | | | | | |
|
|
|
| | | | | Units
| | | | |
Warrant | | | | | | | | | | |
Telecommunications | | | | | | | | | | |
Lucent Technologies, Inc., expiring on 12/10/07 *
(Cost $541) | | | | | 398 | | | | 275 | |
| | | | | | | | |
|
|
|
Total Long-Term Investments (Cost $105,833,311) | | | | | | | | | 113,047,741 | |
| | | | | | | | |
|
|
|
| | | | | Principal
Amount (000)
| | | | |
Short-Term Investments — 1.3% | | | | | | | | | | |
U.S. Government Agency Obligations | | | | | | | | | | |
FNMA Discount Note | | | | | | | | | | |
3.72%, 11/01/05 (Cost $1,425,000) | | | | $ | 1,425 | | | | 1,425,000 | |
| | | | | | | | |
|
|
|
Total Investments — 105.6%
(Cost $107,258,311; Note 5) | | | | | | | | | 114,472,741 | |
Liabilities In Excess of Other Assets(u) — (5.6%) | | | | | | | | | (6,118,786 | ) |
| | | | | | | | |
|
|
|
Net Assets — 100.0% | | | | | | | | $ | 108,353,955 | |
| | | | | | | | |
|
|
|
92
The following abbreviations and annotations are used in portfolio descriptions:
| 144A | Security was purchased pursuant to Rule 144A under the securities Act of 1933 and may not be resold subject to that rule except to qualified institutional buyers. Unless otherwise noted 144A securities are deemed to be liquid. |
| TBA | Securities Purchased on a Forward Commitment Basis |
| TIPS | Treasury Inflation Protected Securities |
| * | Non-income producing security. |
| (c) | Indicates a variable rate security. The maturity date presented for these instruments is the next date on which the rate of interest is adjusted. |
| (d) | Standard & Poor’s rating. |
| (f) | A TRACER (Traded Custody Receipts). Rate shown reflects the weighted average rate of the underlying securities as October 31, 2005. |
| (g) | Indicates a security that has been deemed illiquid. |
| (l) | US$ Denominated Foreign Bonds. |
| (u) | Liabilities in excess of other assets includes net unrealized depreciation on futures contracts as follows: |
| | | | | | | | | | | | | | |
Number of Contracts
| | Type
| | Expiration Month
| | Value at Trade Date
| | Value at October 31,
2005
| | Unrealized
Depreciation
| |
Long Position: | | | | | | | | | | | | | | |
2 | | S&P 500 | | Dec 05 | | $ | 613,975 | | $ | 604,900 | | $ | (9,075 | )(1) |
| | | | | | | | | | | | |
|
|
|
| (1) | Cash of $32,000 has been segregated with the custodian to cover requirements for open futures contracts at October 31, 2005. |
The industry classification of long-term portfolio holdings, short-term investments and liablilities in excess of other assets shown as a percentage of net assets as of October 31, 2005 were as follows:
| | | |
U.S. Government Agency Mortgage-Backed Securities | | 17.3 | % |
Oil & Gas | | 6.6 | |
Collateralized Mortgage Obligations | | 6.4 | |
Financial - Bank & Trust | | 6.2 | |
Financial Services | | 5.6 | |
U.S. Treasury Obligations | | 4.8 | |
Insurance | | 4.4 | |
Asset-Backed Securities | | 4.1 | |
Pharmaceuticals | | 3.9 | |
Entertainment & Leisure | | 3.5 | |
Telecommunications | | 3.5 | |
Consumer Products & Services | | 3.3 | |
Utilities | | 3.3 | |
Computer Hardware | | 2.6 | |
Medical Supplies & Equipment | | 2.6 | |
Retail & Merchandising | | 2.4 | |
Food | | 2.2 | |
Beverages | | 2.1 | |
Metals & Mining | | 2.0 | |
Computer Services & Software | | 1.9 | |
Healthcare Services | | 1.6 | |
Semiconductors | | 1.6 | |
Federal Home Loan Mortgage Corp. | | 1.1 | |
Semi-Conductor & Semi-Conductor Instruments | | 1.0 | |
Automotive Parts | | 0.9 | |
Machinery & Equipment | | 0.8 | |
Business Services | | 0.7 | |
Miscellaneous | | 0.7 | |
Municipal Bonds | | 0.7 | |
Restaurants | | 0.7 | |
Financial - Brokerage | | 0.6 | |
Automobile Manufacturers | | 0.5 | |
Chemicals | | 0.5 | |
Containers & Packaging | | 0.5 | |
Aerospace | | 0.4 | |
Railroads | | 0.4 | |
Transportation | | 0.4 | |
Broadcasting | | 0.3 | |
Cable Television | | 0.3 | |
Commercial Services | | 0.3 | |
Printing & Publishing | | 0.3 | |
Real Estate Investment Trust | | 0.3 | |
Conglomerates | | 0.2 | |
Electronic Components & Equipment | | 0.2 | |
Environmental Services | | 0.2 | |
Airlines | | 0.1 | |
Building Materials | | 0.1 | |
Construction | | 0.1 | |
Paper & Forest Products | | 0.1 | |
Short-Term Investments | | 1.3 | |
| | |
|
|
| | | 105.6 | |
Liabilities In Excess of Other Assets | | –5.6 | |
| | |
|
|
Total | | 100.0 | % |
| | |
|
|
93
Strategic Partners High Yield Bond Fund
SCHEDULE OF INVESTMENTS
October 31, 2005
| | | | | | | | |
| | | Moody’s
Ratings
(Unaudited)
| | Principal
Amount
(000)#
| | Value
(Note 2)
|
Long-Term Investments — 95.4% | | | | | | | | |
Corporate Obligations — 95.1% | | | | | | | | |
Aerospace — 2.0% | | | | | | | | |
Argo-Tech Corp., Sr. Notes | | | | | | | | |
9.25%, 06/01/11 | | B3 | | $ | 500 | | $ | 515,000 |
K & F Acquisition, Inc., Gtd. Notes | | | | | | | | |
7.75%, 11/15/14 | | Caa1 | | | 500 | | | 500,000 |
Sequa Corp., Sr. Notes | | | | | | | | |
9.00%, 08/01/09 | | B1 | | | 500 | | | 518,750 |
Standard Aero Holdings Inc., Gtd. Notes | | | | | | | | |
8.25%, 09/01/14 | | Caa1 | | | 250 | | | 237,500 |
TransDigm, Inc., Gtd. Notes | | | | | | | | |
8.375%, 07/15/11 | | B3 | | | 500 | | | 520,000 |
| | | | | | | |
|
|
| | | | | | | | | 2,291,250 |
| | | | | | | |
|
|
Agriculture — 2.4% | | | | | | | | |
Land O’ Lakes, Inc., Sec’d. Notes | | | | | | | | |
9.00%, 12/15/10 | | B2 | | | 250 | | | 272,500 |
Land O’ Lakes, Inc., Sr. Notes | | | | | | | | |
8.75%, 11/15/11 | | B3 | | | 250 | | | 261,875 |
National Beef Packaging Co., LLC, Sr. Notes | | | | | | | | |
10.50%, 08/01/11 | | B3 | | | 275 | | | 283,937 |
Smithfield Foods, Inc., Sr. Notes | | | | | | | | |
8.00%, 10/15/09 | | Ba2 | | | 500 | | | 528,125 |
Swift & Co., Gtd. Notes | | | | | | | | |
10.125%, 10/01/09 | | B2 | | | 250 | | | 263,750 |
Swift & Co., Sr. Sub. Notes | | | | | | | | |
12.50%, 01/01/10 | | B3 | | | 225 | | | 239,063 |
United Agricultural Products Holding Corp., Sr. Disc. Notes, Zero Coupon (until 01/15/08) | | | | | | | | |
10.75%, 07/15/12 | | B3 | | | 800 | | | 696,000 |
United Agricultural Products Holding Corp., Sr. Notes | | | | | | | | |
8.25%, 12/15/11 | | B1 | | | 158 | | | 165,900 |
| | | | | | | |
|
|
| | | | | | | | | 2,711,150 |
| | | | | | | |
|
|
Airlines | | | | | | | | |
Northwest Airlines, Corp., Gtd. Notes (a) (g) | | | | | | | | |
10.00%, 02/01/09 | | C | | $ | 114 | | $ | 32,490 |
| | | | | | | |
|
|
Automotive — 0.9% | | | | | | | | |
General Motors Acceptance Corp., Bonds (a) | | | | | | | | |
8.00%, 11/01/31 | | Ba1 | | | 250 | | | 258,085 |
General Motors Acceptance Corp., Notes | | | | | | | | |
6.875%, 09/15/11 | | Ba1 | | | 500 | | | 484,810 |
7.25%, 03/02/11 | | Ba1 | | | 250 | | | 245,900 |
| | | | | | | |
|
|
| | | | | | | | | 988,795 |
| | | | | | | |
|
|
Automotive Parts — 2.9% | | | | | | | | |
Accuride Corp., Gtd. Notes | | | | | | | | |
8.50%, 02/01/15 | | B3 | | | 250 | | | 236,250 |
Advanced Accessory System, Sr. Notes (a) | | | | | | | | |
10.75%, 06/15/11 | | B3 | | | 125 | | | 106,250 |
Affinia Group, Inc., Gtd. Notes 144A (g) | | | | | | | | |
9.00%, 11/30/14 | | Caa1 | | | 250 | | | 193,750 |
Dana Corp., Notes | | | | | | | | |
9.00%, 08/15/11 | | Ba2 | | | 150 | | | 130,500 |
Delco Remy International, Inc., Sr. Sub. Notes | | | | | | | | |
9.375%, 04/15/12 | | Caa1 | | | 500 | | | 215,000 |
Goodyear Tire & Rubber Co., Notes (a) | | | | | | | | |
7.857%, 08/15/11 | | B3 | | | 500 | | | 477,500 |
Goodyear Tire & Rubber Co., Sr. Notes 144A (g) | | | | | | | | |
9.00%, 07/01/15 | | B3 | | | 250 | | | 241,250 |
Navistar International Corp., Gtd. Notes | | | | | | | | |
6.25%, 03/01/12 | | Ba3 | | | 250 | | | 224,375 |
Schefenaccker AG, Sr. Sub. Notes (Germany) | | | | | | | | |
9.50%, 02/11/14 | | Caa1 | | EUR | 125 | | | 101,868 |
Tenneco Automotive, Inc., Gtd. Notes (a) | | | | | | | | |
8.625%, 11/15/14 | | B3 | | | 125 | | | 119,375 |
94
| | | | | | | | |
| | | Moody’s
Ratings
(Unaudited)
| | Principal
Amount
(000)#
| | Value
(Note 2)
|
TRW Automotive, Inc., Sr. Sub. Notes | | | | | | | | |
11.00%, 02/15/13 | | B1 | | $ | 829 | | $ | 926,408 |
United Components, Inc., Sr. Sub. Notes | | | | | | | | |
9.375%, 06/15/13 | | B3 | | | 250 | | | 250,000 |
| | | | | | | |
|
|
| | | | | | | | | 3,222,526 |
| | | | | | | |
|
|
Building Materials — 3.9% | | | | | | | | |
ACIH, Inc., Sr. Disc. Notes, Zero Coupon (until 12/15/07) 144A (g) | | | | | | | | |
11.50%, 12/15/12 | | Caa1 | | | 125 | | | 85,000 |
Associated Materials, Inc., Gtd. Notes | | | | | | | | |
9.75%, 04/15/12 | | Caa1 | | | 325 | | | 302,250 |
Associated Materials, Inc., Sr. Disc. Notes, Zero Coupon (until 03/01/09) | | | | | | | | |
11.25%, 03/01/14 | | Caa2 | | | 500 | | | 235,000 |
FIMEP SA, Sr. Unsub. Notes | | | | | | | | |
10.50%, 02/15/13 | | B1 | | | 750 | | | 849,375 |
Goodman Global Holding Co. Inc., Sr. Sub. Notes 144A (a) (g) | | | | | | | | |
7.875%, 12/15/12 | | Caa1 | | | 375 | | | 352,500 |
Grohe Holding GMBH, Sr. Notes (Germany) | | | | | | | | |
8.625%, 10/01/14 | | B3 | | EUR | 1,000 | | | 1,060,630 |
Norcraft Cos. LLC, Sr. Sub. Notes | | | | | | | | |
9.00%, 11/01/11 | | B3 | | | 300 | | | 306,000 |
Norcraft Holdings Capital, Sr. Disc. Notes, Zero Coupon (until 09/01/08) | | | | | | | | |
9.75%, 09/01/12 | | Caa1 | | | 250 | | | 175,000 |
Nortek, Inc., Sr. Sub. Notes | | | | | | | | |
8.50%, 09/01/14 | | Caa1 | | | 875 | | | 835,625 |
NTK Holdings Inc., Sr. Disc. Notes (a) | | | | | | | | |
10.75%, 03/01/14 | | Caa2 | | | 250 | | | 150,000 |
| | | | | | | |
|
|
| | | | | | | | | 4,351,380 |
| | | | | | | |
|
|
Capital Goods — Others — 1.4% | | | | | | | | |
Altra Industrial Motion, Inc., Sec’d. Notes 144A (g) | | | | | | | | |
9.50%, 12/01/11 | | B3 | | $ | 125 | | $ | 121,250 |
Briggs & Stratton Corp., Gtd. Notes | | | | | | | | |
8.875%, 03/15/11 | | Ba1 | | | 400 | | | 447,000 |
Mueller Group, Inc., Sr. Sub. Notes | | | | | | | | |
10.00%, 05/01/12 | | Caa1 | | | 425 | | | 446,250 |
Rexnord Corp., Gtd. Notes | | | | | | | | |
10.125%, 12/15/12 | | B3 | | | 500 | | | 547,500 |
| | | | | | | |
|
|
| | | | | | | | | 1,562,000 |
| | | | | | | |
|
|
Chemicals — 8.2% | | | | | | | | |
BCP Crystal Holdings Corp., Sr. Sub. Notes (Luxembourg) (l) | | | | | | | | |
9.625%, 06/15/14 | | B3 | | | 362 | | | 398,200 |
Borden US Finance Corp., Sec’d. Notes 144A (g) | | | | | | | | |
9.00%, 07/15/14 | | B3 | | | 250 | | | 245,938 |
Compass Minerals Group, Inc., Gtd. Notes | | | | | | | | |
10.00%, 08/15/11 | | B3 | | | 250 | | | 269,375 |
Compass Minerals International, Inc., Sr. Disc. Notes, Zero Coupon (until 06/01/08) | | | | | | | | |
12.00%, 06/01/13 | | B-(d) | | | 500 | | | 425,000 |
Compass Minerals International, Inc., Sr. Notes, Zero Coupon (until 12/15/07) | | | | | | | | |
12.75%, 12/15/12 | | B-(d) | | | 500 | | | 440,000 |
Crompton Corp., Sr. Notes | | | | | | | | |
9.875%, 08/01/12 | | Ba1 | | | 250 | | | 280,000 |
Crystal US Holdings, Sr. Disc. Notes Zero Coupon (until 10/01/09) | | | | | | | | |
10.50%, 10/01/14 | | Caa2 | | | 650 | | | 450,125 |
Equistar Chemicals LP, Gtd. Notes | | | | | | | | |
10.125%, 09/01/08 | | B2 | | | 725 | | | 781,187 |
95
Strategic Partners High Yield Bond Fund
SCHEDULE OF INVESTMENTS
October 31, 2005
| | | | | | | | |
| | | Moody’s Ratings (Unaudited)
| | Principal Amount (000)#
| | Value (Note 2)
|
Huntsman Advanced Materials LLC, Sec’d. Notes | | | | | | | | |
11.00%, 07/15/10 | | Ba3 | | $ | 250 | | $ | 277,500 |
Huntsman International, LLC | | | | | | | | |
10.125%, 07/01/09 | | B3 | | | 610 | | | 627,538 |
INVISTA, Notes 144A (g) | | | | | | | | |
9.25%, 05/01/12 | | B1 | | | 625 | | | 671,094 |
KRATON Polymers LLC, Sr. Sub. Notes 144A | | | | | | | | |
8.125%, 01/15/14 | | Caa1 | | | 500 | | | 465,000 |
LBC Luxembourg Holdings SCA, Gtd. Notes (Luxembourg) | | | | | | | | |
11.00%, 05/15/14 | | Caa1 | | EUR | 250 | | | 334,817 |
Nell AF SARL, Sr. Notes (a) (l) (g) | | | | | | | | |
8.375%, 08/15/15 | | B2 | | | 500 | | | 480,000 |
PQ Corp., Gtd. Notes 144A (g) | | | | | | | | |
7.50%, 02/15/13 | | B3 | | | 250 | | | 230,000 |
Resolution Performance Products LLC, Sec’d. Notes | | | | | | | | |
9.50%, 04/15/10 | | B3 | | | 250 | | | 252,500 |
Rhodia SA, Sr. Notes (France) (a) (l) | | | | | | | | |
10.25%, 06/01/10 | | B3 | | | 750 | | | 798,750 |
Rhodia SA, Sr. Sub. Notes 8.875%, 06/01/11 (France) (a) (l) | | Caa1 | | | 500 | | | 472,500 |
9.25%, 06/01/11 | | Caa1 | | EUR | 250 | | | 304,107 |
Rockwood Specialties Group, Inc., Gtd. Notes 144A (g) | | | | | | | | |
7.625%, 11/15/14 | | B3 | | EUR | 500 | | | 605,218 |
Rockwood Specialties Group, Inc., Sr. Sub. Notes | | | | | | | | |
10.625%, 05/15/11 | | B3 | | | 456 | | | 487,920 |
| | | | | | | |
|
|
| | | | | | | | | 9,296,769 |
| | | | | | | |
|
|
Clothing & Apparel — 0.2% | | | | | | | | |
Propex Fabrics, Inc. Gtd. Notes | | | | | | | | |
10.00%, 12/01/12 | | Caa1 | | | 250 | | | 217,188 |
| | | | | | | |
|
|
Computer Services — 0.8% | | | | | | | | |
Sungard Data Systems, Inc., Sr. Sub. Notes 144A (g) | | | | | | | | |
10.25%, 08/15/15 | | Caa1 | | $ | 250 | | $ | 247,812 |
Sungard Data Systems, Inc., Sr. Unsec’d. Notes 144A (g) | | | | | | | | |
9.125%, 08/15/13 | | B3 | | | 625 | | | 634,375 |
| | | | | | | |
|
|
| | | | | | | | | 882,187 |
| | | | | | | |
|
|
Conglomerates — 2.3% | | | | | | | | |
Blount, Inc., Sr. Sub. Notes | | | | | | | | |
8.875%, 08/01/12 | | B3 | | | 375 | | | 394,687 |
Bombardier, Inc., Notes (Canada) 144A (a) (l) (g) | | | | | | | | |
6.75%, 05/01/12 | | Ba2 | | | 250 | | | 226,250 |
Invensys PLC, Sr. Notes (United Kingdom) 144A (l) (g) | | | | | | | | |
9.875%, 03/15/11 | | B3 | | | 250 | | | 240,000 |
Mark IV Industries, Inc., Sr. Sub. Notes | | | | | | | | |
7.50%, 09/01/07 | | Caa1 | | | 750 | | | 712,500 |
NOMA Luxembourg SA, Sr. Notes (Luxembourg) | | | | | | | | |
9.75%, 07/15/11 | | B3 | | EUR | 250 | | | 345,304 |
Park-Ohio Industries, Inc., Gtd. Notes | | | | | | | | |
8.375%, 11/15/14 | | Caa1 | | | 375 | | | 328,125 |
Polypore International, Inc., Sr. Disc. Notes Zero Coupon (until 10/01/08) | | | | | | | | |
10.50%, 10/01/12 | | Caa2 | | | 250 | | | 128,750 |
Polypore, Inc., Notes 144A | | | | | | | | |
8.75%, 05/15/12 | | Caa1 | | EUR | 250 | | | 273,397 |
| | | | | | | |
|
|
| | | | | | | | | 2,649,013 |
| | | | | | | |
|
|
Consumer Cyclical — Services — 1.4% | | | | | | | | |
Brickman Group Ltd., Gtd. Notes, Series B | | | | | | | | |
11.75%, 12/15/09 | | B2 | | | 500 | | | 556,250 |
Interline Brands, Inc., Sr. Sub. Notes | | | | | | | | |
11.50%, 05/15/11 | | B3 | | | 325 | | | 360,750 |
96
| | | | | | | | |
| | | Moody’s Ratings (Unaudited)
| | Principal Amount (000)#
| | Value (Note 2)
|
United Rentals North America, Inc., Sr. Sub. Notes (a) | | | | | | | | |
7.75%, 11/15/13 | | Caa1 | | $ | 750 | | $ | 712,500 |
| | | | | | | |
|
|
| | | | | | | | | 1,629,500 |
| | | | | | | |
|
|
Consumer Products — 6.7% | | | | | | | | |
Aearo Co., Sr. Sub. Notes | | | | | | | | |
8.25%, 04/15/12 | | B3 | | | 225 | | | 223,875 |
Ames True Temper, Sr. Sub. Notes | | | | | | | | |
10.00%, 07/15/12 | | Caa2 | | | 250 | | | 187,500 |
Bear Creek Corp., Sr. Notes 144A (g) | | | | | | | | |
9.00%, 03/01/13 | | B3 | | | 250 | | | 256,250 |
Chattem, Inc., Sr. Sub. Notes | | | | | | | | |
7.00%, 03/01/14 | | B2 | | | 500 | | | 505,000 |
DEL Laboratories, Inc., Gtd. Notes | | | | | | | | |
8.00%, 02/01/12 | | Caa2 | | | 250 | | | 187,500 |
FTD, Inc., Gtd. Notes | | | | | | | | |
7.75%, 02/15/14 | | B3 | | | 365 | | | 361,350 |
Johnsondiversey Holdings, Inc., Disc. Notes, Zero Coupon (until 05/15/07) | | | | | | | | |
10.67%, 05/15/13 | | Caa1 | | | 500 | | | 360,000 |
Jostens Holding Corp., Sr. Disc. Notes, Zero Coupon (until 12/01/08) | | | | | | | | |
10.25%, 12/01/13 | | Caa2 | | | 1,025 | | | 740,563 |
Jostens IH Corp. Gtd. Notes | | | | | | | | |
7.625%, 10/01/12 | | B3 | | | 500 | | | 492,500 |
Leiner Health Products, Inc., Sr. Sub. Notes (a) | | | | | | | | |
11.00%, 06/01/12 | | Caa1 | | | 250 | | | 207,500 |
Norcross Safety Products, LLC, Sr. Sub. Notes | | | | | | | | |
9.875%, 08/15/11 | | B3 | | | 375 | | | 399,375 |
NSP Holdings Capital Corp., Sr. Unsec’d. Notes | | | | | | | | |
11.75%, 01/01/12 | | B-(d) | | | 132 | | | 136,722 |
Playtex Products, Inc., Gtd. Notes | | | | | | | | |
9.375%, 06/01/11 | | Caa2 | | $ | 375 | | $ | 388,125 |
Prestige Brands, Inc., Sr. Sub. Notes (a) | | | | | | | | |
9.25%, 04/15/12 | | B3 | | | 225 | | | 227,250 |
Rayovac Corp., Sr. Sub. Notes | | | | | | | | |
8.50%, 10/01/13 | | B3 | | | 500 | | | 452,500 |
Safilo Capital International SA, Sr. Notes (Luxembourg) | | | | | | | | |
9.625%, 05/15/13 | | Caa2 | | EUR | 750 | | | 1,008,946 |
Sealy Mattress Co., Sr. Sub. Notes (a) | | | | | | | | |
8.25%, 06/15/14 | | B3 | | | 500 | | | 507,500 |
Simmons Bedding, Co., Sr. Disc. Notes (a) (g) | | | | | | | | |
10.00%, 12/15/14 | | Caa2 | | | 375 | | | 183,750 |
Spectrum Brands, Inc., Gtd. Notes | | | | | | | | |
7.375%, 02/01/15 | | B3 | | | 250 | | | 215,938 |
True Temper Sports, Inc., Gtd. Notes | | | | | | | | |
8.375%, 09/15/11 | | Caa1 | | | 100 | | | 90,000 |
WH Holdings Ltd., Sr. Notes | | | | | | | | |
9.50%, 04/01/11 | | B1 | | | 375 | | | 406,875 |
| | | | | | | |
|
|
| | | | | | | | | 7,539,019 |
| | | | | | | |
|
|
Containers & Packaging — 0.4% | | | | | | | | |
Portola Packaging, Inc., Sr. Notes (a) | | | | | | | | |
8.25%, 02/01/12 | | Caa1 | | | 125 | | | 81,250 |
Solo Cup Co., Sr. Sub. Notes (a) | | | | | | | | |
8.50%, 02/15/14 | | Caa1 | | | 375 | | | 307,500 |
| | | | | | | |
|
|
| | | | | | | | | 388,750 |
| | | | | | | |
|
|
Defense — 1.1% | | | | | | | | |
Communications & Power Industries Inc., Sr. Sub. Notes | | | | | | | | |
8.00%, 08/01/12 | | B3 | | | 500 | | | 508,750 |
L-3 Communications Corp., Sr. Sub. Notes 144A (g) | | | | | | | | |
6.375%, 10/15/15 | | Ba3 | | | 750 | | | 740,625 |
| | | | | | | |
|
|
| | | | | | | | | 1,249,375 |
| | | | | | | |
|
|
97
Strategic Partners High Yield Bond Fund
SCHEDULE OF INVESTMENTS
October 31, 2005
| | | | | | | | |
| | | Moody’s Ratings (Unaudited)
| | Principal Amount (000)#
| | Value (Note 2)
|
Electric — 2.3% | | | | | | | | |
Calpine Canada Energy Finance Corp., Gtd. Notes (a) | | | | | | | | |
8.50%, 05/01/08 | | Caa3 | | $ | 250 | | $ | 135,000 |
Calpine Corp., Sec’d. Notes 144A (g) | | | | | | | | |
8.50%, 07/15/10 | | B-(d) | | | 500 | | | 350,000 |
Calpine Corp., Sr. Notes (a) | | | | | | | | |
8.50%, 02/15/11 | | Caa3 | | | 375 | | | 176,250 |
Dynegy Holdings, Inc., Sec’d. Notes 144A (g) | | | | | | | | |
10.125%, 07/15/13 | | B3 | | | 500 | | | 550,000 |
Midwest Generation LLC, Sec’d. Notes | | | | | | | | |
8.75%, 05/01/34 | | B1 | | | 750 | | | 821,250 |
Reliant Energy, Inc., Sec’d. Notes | | | | | | | | |
9.25%, 07/15/10 | | B1 | | | 250 | | | 262,500 |
Texas Genco LLC Financing Corp., Sr. Notes 144A (g) | | | | | | | | |
6.875%, 12/15/14 | | B1 | | | 250 | | | 267,500 |
| | | | | | | |
|
|
| | | | | | | | | 2,562,500 |
| | | | | | | |
|
|
Electric — Generation — 0.4% | | | | | | | | |
Mission Energy Holding Co., Sec’d. Notes | | | | | | | | |
13.50%, 07/15/08 | | B2 | | | 375 | | | 434,063 |
| | | | | | | |
|
|
Energy — 1.5% | | | | | | | | |
Foundation PA Coal Co., Sr. Notes | | | | | | | | |
7.25%, 08/01/14 | | B1 | | | 500 | | | 511,250 |
Magnum Hunter Resources, Inc., Gtd. Notes | | | | | | | | |
9.60%, 03/15/12 | | Ba3 | | | 195 | | | 210,600 |
Pride International, Inc., Sr. Notes | | | | | | | | |
7.375%, 07/15/14 | | Ba2 | | | 375 | | | 404,062 |
Swift Energy Co., Sr. Sub. Notes | | | | | | | | |
9.375%, 05/01/12 | | B2 | | | 425 | | | 454,750 |
Tesoro Petroleum Corp., Sec’d. Notes | | | | | | | | |
8.00%, 04/15/08 | | Ba2 | | | 125 | | | 130,000 |
| | | | | | | |
|
|
| | | | | | | | | 1,710,662 |
| | | | | | | |
|
|
Energy — Exploration & Production — 0.9% | | | | | | | | |
Chesapeake Energy Corp., Sr. Notes 144A | | | | | | | | |
6.375%, 06/15/15 | | Ba2 | | $ | 500 | | $ | 491,250 |
El Paso Production Holding Co., Gtd. Notes | | | | | | | | |
7.75%, 06/01/13 | | B3 | | | 500 | | | 515,000 |
| | | | | | | |
|
|
| | | | | | | | | 1,006,250 |
| | | | | | | |
|
|
Entertainment — 1.3% | | | | | | | | |
Six Flags, Inc., Sr. Notes | | | | | | | | |
9.75%, 04/15/13 | | Caa1 | | | 250 | | | 248,750 |
Universal City Development Partners Ltd., Sr. Notes | | | | | | | | |
11.75%, 04/01/10 | | B2 | | | 500 | | | 560,625 |
Warner Music Group, Sr. Sub. Notes | | | | | | | | |
7.375%, 04/15/14 | | B3 | | | 500 | | | 487,500 |
WMG Holdings Corp., Sr. Discount Notes Zero Coupon (until 12/15/09) | | | | | | | | |
9.50%, 12/15/14 | | Caa2 | | | 325 | | | 223,437 |
| | | | | | | |
|
|
| | | | | | | | | 1,520,312 |
| | | | | | | |
|
|
Environmental — 1.3% | | | | | | | | |
Allied Waste North America, Gtd. Notes, Series B | | | | | | | | |
8.875%, 04/01/08 | | B2 | | | 500 | | | 521,250 |
9.25%, 09/01/12 | | B2 | | | 167 | | | 180,001 |
Allied Waste North America, Sr. Notes | | | | | | | | |
8.50%, 12/01/08 | | B2 | | | 225 | | | 234,000 |
Allied Waste North America, Sr. Notes 144A (g) | | | | | | | | |
7.25%, 03/15/15 | | B2 | | | 250 | | | 247,500 |
Waste Services Inc., Sr. Sub. Notes | | | | | | | | |
9.50%, 04/15/14 | | Caa2 | | | 250 | | | 247,500 |
| | | | | | | |
|
|
| | | | | | | | | 1,430,251 |
| | | | | | | |
|
|
98
| | | | | | | | |
| | | Moody’s
Ratings
(Unaudited)
| | Principal
Amount
(000)#
| | Value
(Note 2)
|
Finance — 0.1% | | | | | | | | |
Refco Finance Holdings LLC, Gtd. Notes (g) | | | | | | | | |
9.00%, 08/01/12 | | Ca | | $ | 136 | | $ | 95,540 |
| | | | | | | |
|
|
Food — 2.3% | | | | | | | | |
Dole Foods Co., Inc., Sr. Notes | | | | | | | | |
8.625%, 05/01/09 | | B2 | | | 375 | | | 387,656 |
Eagle Family Foods, Gtd. Notes, Series B | | | | | | | | |
8.75%, 01/15/08 | | Caa2 | | | 500 | | | 390,000 |
Michael Foods, Inc., Sr. Sub. Notes | | | | | | | | |
8.00%, 11/15/13 | | B3 | | | 250 | | | 253,750 |
Pilgrim’s Pride Corp., Gtd. Notes | | | | | | | | |
9.625%, 09/15/11 | | Ba2 | | | 325 | | | 347,750 |
Pilgrim’s Pride Corp., Sr. Sub. Notes | | | | | | | | |
9.25%, 11/15/13 | | Ba3 | | | 525 | | | 576,188 |
Pinnacle Foods Holding Corp., Sr. Sub. Notes | | | | | | | | |
8.25%, 12/01/13 | | B3 | | | 375 | | | 346,875 |
United Biscuits Finance, Gtd. Notes (United Kingdom) | | | | | | | | |
10.625%, 04/15/11 | | B3 | | EUR | 250 | | | 320,586 |
| | | | | | | |
|
|
| | | | | | | | | 2,622,805 |
| | | | | | | |
|
|
Gaming — 7.1% | | | | | | | | |
Boyd Gaming Corp., Sr. Sub. Notes | | | | | | | | |
8.75%, 04/15/12 | | B1 | | | 250 | | | 267,188 |
Codere Finance SA, Sr. Notes (Luxembourg) 144A (g) | | | | | | | | |
8.25%, 06/15/15 | | B2 | | EUR | 125 | | | 156,173 |
Global Cash Finance Corp., Sr. Sub. Notes | | | | | | | | |
8.75%, 03/15/12 | | Caa1 | | | 195 | | | 207,431 |
Isle of Capri Casinos, Inc., Gtd. Notes | | | | | | | | |
9.00%, 03/15/12 | | B2 | | | 250 | | | 260,000 |
Las Vegas Sands Corp., Gtd. Notes | | | | | | | | |
6.375%, 02/15/15 | | B2 | | | 250 | | | 236,875 |
Mandalay Resort Group, Sr. Notes | | | | | | | | |
9.50%, 08/01/08 | | Ba2 | | $ | 50 | | $ | 53,625 |
Mandalay Resort Group, Sr. Sub. Notes | | | | | | | | |
10.25%, 08/01/07 | | Ba3 | | | 1,325 | | | 1,411,125 |
MGM Grand, Gtd. Notes | | | | | | | | |
8.375%, 02/01/11 | | Ba3 | | | 1,250 | | | 1,321,875 |
Mohegan Tribal Gaming Authority, Sr. Sub. Notes | | | | | | | | |
8.00%, 04/01/12 | | Ba3 | | | 450 | | | 468,562 |
MTR Gaming Group, Inc., Gtd. Notes, Series B | | | | | | | | |
9.75%, 04/01/10 | | B2 | | | 250 | | | 263,125 |
Park Place Entertainment Corp., Sr. Sub. Notes | | | | | | | | |
7.875%, 03/15/10 | | Ba1 | | | 375 | | | 399,844 |
8.125%, 05/15/11 | | Ba1 | | | 700 | | | 764,750 |
Penn National Gaming, Inc., Sr. Sub. Notes | | | | | | | | |
6.75%, 03/01/15 | | B3 | | | 250 | | | 240,000 |
Pinnacle Entertainment, Inc., Sr. Sub. Notes | | | | | | | | |
8.25%, 03/15/12 | | Caa1 | | | 250 | | | 248,125 |
River Rock Entertainment Authority, Sr. Notes | | | | | | | | |
9.75%, 11/01/11 | | B2 | | | 225 | | | 245,250 |
Seneca Gaming Corp., Sr. Notes | | | | | | | | |
7.25%, 05/01/12 | | B1 | | | 250 | | | 255,313 |
Station Casinos, Inc., Sr. Sub. Notes | | | | | | | | |
6.50%, 02/01/14 | | Ba3 | | | 500 | | | 498,750 |
6.875%, 03/01/16 | | Ba3 | | | 250 | | | 251,875 |
Wynn Las Vegas LLC, First Mortgage Notes | | | | | | | | |
6.625%, 12/01/14 | | B2 | | | 500 | | | 476,250 |
| | | | | | | |
|
|
| | | | | | | | | 8,026,136 |
| | | | | | | |
|
|
Health Care — Medical Providers — 0.4% | | | | | | | | |
CDRV Investors, Inc., Sr. Disc. Notes Zero Coupon (until 1/01/10) Zero, 01/01/15 | | Caa2 | | | 750 | | | 416,250 |
| | | | | | | |
|
|
99
Strategic Partners High Yield Bond Fund
SCHEDULE OF INVESTMENTS
October 31, 2005
| | | | | | | | |
| | | Moody’s
Ratings
(Unaudited)
| | Principal
Amount
(000)#
| | Value
(Note 2)
|
Healthcare — 3.9% | | | | | | | | |
Alliance Imaging, Inc., Sr. Sub. Notes | | | | | | | | |
7.25%, 12/15/12 | | B3 | | $ | 250 | | $ | 218,750 |
AmeriPath, Inc., Gtd. Notes | | | | | | | | |
10.50%, 04/01/13 | | Caa1 | | | 625 | | | 650,000 |
Kinetic Concepts, Sr. Sub. Notes | | | | | | | | |
7.375%, 05/15/13 | | B2 | | | 114 | | | 115,140 |
Medical Device Manufacturing, Inc., Gtd. Notes | | | | | | | | |
10.00%, 07/15/12 | | Caa1 | | | 250 | | | 292,500 |
Nyco Holdings, Sr. Notes (Denmark) | | | | | | | | |
11.50%, 03/31/13 | | B3 | | EUR | 250 | | | 348,300 |
Quintiles Transnational Corp., Sr. Sub. Notes | | | | | | | | |
10.00%, 10/01/13 | | B3 | | | 500 | | | 551,875 |
Select Medical Corp., Gtd. Notes | | | | | | | | |
7.625%, 02/01/15 | | B3 | | | 125 | | | 115,938 |
Sybron Dental Specialties, Inc., Gtd. Notes | | | | | | | | |
8.125%, 06/15/12 | | B1 | | | 375 | | | 394,687 |
Tenet Healthcare Corp., Sr. Notes | | | | | | | | |
9.875%, 07/01/14 | | B3 | | | 250 | | | 241,875 |
Tenet Healthcare Corp., Sr. Unsec’d Notes | | | | | | | | |
7.375%, 02/01/13 | | B3 | | | 250 | | | 221,875 |
US Oncology, Inc., Gtd. Notes | | | | | | | | |
9.00%, 08/15/12 | | B2 | | | 500 | | | 527,500 |
Vanguard Health Holdings, Co. II LLC, Sr. Sub. Notes | | | | | | | | |
9.00%, 10/01/14 | | Caa1 | | | 500 | | | 521,250 |
VWR International, Inc., Sr. Sub. Notes | | | | | | | | |
8.00%, 04/15/14 | | Caa1 | | | 250 | | | 242,500 |
| | | | | | | |
|
|
| | | | | | | | | 4,442,190 |
| | | | | | | |
|
|
Healthcare Services — 0.2% | | | | | | | | |
DaVita, Inc., Gtd. Notes | | | | | | | | |
7.25%, 03/15/15 | | B3 | | | 250 | | | 252,500 |
| | | | | | | |
|
|
Hotels & Motels — 0.2% | | | | | | | | |
Gaylord Entertainment Co., Gtd. Notes | | | | | | | | |
6.75%, 11/15/14 | | B3 | | $ | 250 | | $ | 241,250 |
| | | | | | | |
|
|
Lodging — 0.6% | | | | | | | | |
HMH Properties, Inc., Gtd. Notes, Series B | | | | | | | | |
7.875%, 08/01/08 | | Ba2 | | | 43 | | | 43,484 |
Host Marriott LP, Sr. Notes | | | | | | | | |
7.00%, 08/15/12 | | Ba2 | | | 500 | | | 503,750 |
Starwood Hotel & Resorts Worldwide, Inc., Notes | | | | | | | | |
6.75%, 11/15/05 | | Ba1 | | | 175 | | | 175,000 |
| | | | | | | |
|
|
| | | | | | | | | 722,234 |
| | | | | | | |
|
|
Machinery — 0.1% | | | | | | | | |
Columbus McKinnon Corp., Sec’d. Notes | | | | | | | | |
10.00%, 08/01/10 | | B2 | | | 125 | | | 137,500 |
| | | | | | | |
|
|
Media — Broadcasting & Radio — 0.7% | | | | | | | | |
Emmis Operating Co., Sr. Sub. Notes | | | | | | | | |
6.875%, 05/15/12 | | B2 | | | 250 | | | 246,875 |
Radio One, Inc., Sr. Sub. Notes 144A (g) | | | | | | | | |
6.375%, 02/15/13 | | B2 | | | 250 | | | 244,063 |
Sinclair Broadcast Group, Inc., Gtd. Notes | | | | | | | | |
8.75%, 12/15/11 | | B2 | | | 250 | | | 262,500 |
XM Satellite Radio, Inc., Sec’d. Notes, Zero Coupon (until 12/31/05) (g) | | | | | | | | |
14.00%, 12/31/09 | | Caa1 | | | 65 | | | 68,141 |
| | | | | | | |
|
|
| | | | | | | | | 821,579 |
| | | | | | | |
|
|
Media — Cable — 3.5% | | | | | | | | |
Adelphia Communications Corp., Sr. Notes (a) (g) | | | | | | | | |
10.25%, 06/15/11 | | D | | | 250 | | | 171,875 |
Cablevision Systems Corp. Holdings, Inc., Series B, Sr. Notes | | | | | | | | |
8.125%, 07/15/09 | | B1 | | | 150 | | | 153,375 |
100
| | | | | | | | |
| | | Moody’s
Ratings
(Unaudited)
| | Principal
Amount
(000)#
| | Value (Note 2)
|
Cablevision Systems Corp., Sr. Notes, 144A (a) | | | | | | | | |
8.00%, 04/15/12 | | B3 | | $ | 500 | | $ | 477,500 |
CCH I Holdings LLC, Gtd. Notes | | | | | | | | |
9.92%, 04/01/14 | | Ca | | | 500 | | | 322,500 |
10.00%, 05/15/14 | | Ca | | | 250 | | | 161,250 |
Charter Communications Holdings II LLC, Sr. Notes 144A (g) | | | | | | | | |
10.25%, 09/15/10 | | Caa1 | | | 500 | | | 501,250 |
Ono Finance, Gtd. Notes (United Kingdom) | | | | | | | | |
10.50%, 05/15/14 | | Caa2 | | EUR | 375 | | | 473,014 |
Tele Columbus AG & Co., Sr. Sub. Notes (Germany) | | | | | | | | |
9.375%, 04/15/12 | | B3 | | EUR | 250 | | | 311,598 |
Telenet Communication NV, Sr. Notes (Belgium) | | | | | | | | |
9.00%, 12/15/13 | | B3 | | EUR | 250 | | | 334,068 |
Telenet Group Holdings NV, Disc. Notes, Zero Coupon (until 12/15/08) (Belgium) 144A (g) (l) | | | | | | | | |
11.50%, 06/15/14 | | Caa2 | | | 1,000 | | | 795,000 |
UPC Holding BV, Sr. Notes 144A (Netherlands) (g) | | | | | | | | |
7.75%, 01/15/14 | | B3 | | EUR | 250 | | | 276,393 |
| | | | | | | |
|
|
| | | | | | | | | 3,977,823 |
| | | | | | | |
|
|
Media — Non Cable — 0.6% | | | | | | | | |
DirecTV Holdings LLC, Sr. Notes | | | | | | | | |
8.375%, 03/15/13 | | Ba2 | | | 325 | | | 351,813 |
Echostar DBS Corp., Sr. Notes | | | | | | | | |
5.75%, 10/01/08 | | Ba3 | | | 375 | | | 366,562 |
| | | | | | | |
|
|
| | | | | | | | | 718,375 |
| | | | | | | |
|
|
Metals — 2.1% | | | | | | | | |
AK Steel Corp., Gtd. Notes | | | | | | | | |
7.75%, 06/15/12 | | B1 | | | 500 | | | 450,000 |
Neenah Corp., Sec’d. Notes 144A (g) | | | | | | | | |
11.00%, 09/30/10 | | B2 | | $ | 500 | | $ | 552,500 |
Ryerson Tull, Inc., Notes | | | | | | | | |
9.125%, 07/15/06 | | B2 | | | 550 | | | 556,187 |
UCAR Finance, Inc., Gtd. Notes | | | | | | | | |
10.25%, 02/15/12 | | B2 | | | 250 | | | 263,750 |
United States Steel Corp., Sr. Notes | | | | | | | | |
9.75%, 05/15/10 | | Ba2 | | | 484 | | | 527,560 |
| | | | | | | |
|
|
| | | | | | | | | 2,349,997 |
| | | | | | | |
|
|
Metals & Mining — 0.6% | | | | | | | | |
Novelis, Inc., Sr. Notes (Canada) 144A (g)(l) | | | | | | | | |
7.25%, 02/15/15 | | B1 | | | 250 | | | 228,125 |
OM Group, Inc., Gtd. Notes | | | | | | | | |
9.25%, 12/15/11 | | Caa1 | | | 500 | | | 481,250 |
| | | | | | | |
|
|
| | | | | | | | | 709,375 |
| | | | | | | |
|
|
Packaging — 3.8% | | | | | | | | |
Consolidated Container Co., Gtd. Notes (a) | | | | | | | | |
10.125%, 07/15/09 | | Caa2 | | | 250 | | | 145,000 |
Consolidated Container Co., LLC, Sr. Dis. Notes | | | | | | | | |
10.75%, 06/15/09 | | B3 | | | 250 | | | 197,500 |
Crown Euro Holdings SA, Sec’d (France) | | | | | | | | |
10.875%, 03/01/13 | | B2 | | EUR | 250 | | | 294,375 |
Crown European Holdings SA, Gtd. Notes (France) | | | | | | | | |
10.25%, 03/01/11 | | B+ | | EUR | 250 | | | 341,558 |
Crown European Holdings SA, Sec’d. Notes (France) (l) | | | | | | | | |
9.50%, 03/01/11 | | B1 | | | 250 | | | 275,000 |
Gerresheimer Holdings GMBH, Gtd. Notes (Germany) 144A (g) | | | | | | | | |
7.875%, 03/01/15 | | Caa1 | | EUR | 250 | | | 295,868 |
Graham Packaging Co., Inc., Sub. Notes 144A (a) | | | | | | | | |
9.875%, 10/15/14 | | Caa2 | | | 1,250 | | | 1,168,750 |
101
Strategic Partners High Yield Bond Fund
SCHEDULE OF INVESTMENTS
October 31, 2005
| | | | | | | | |
| | | Moody’s
Ratings
(Unaudited)
| | Principal
Amount
(000)#
| | Value
(Note 2)
|
Graham Packaging International Corp., Sr. Sub. Notes | | | | | | | | |
9.50%, 08/15/13 | | B3 | | $ | 500 | | $ | 448,750 |
Huntsman Packaging Corp., Gtd. Notes | | | | | | | | |
13.00%, 06/01/10 | | Ca | | | 250 | | | 36,250 |
Owens-Brockway Glass Container, Inc., Gtd. Notes | | | | | | | | |
8.25%, 05/15/13 | | B2 | | | 375 | | | 382,500 |
8.875%, 02/15/09 | | B1 | | | 500 | | | 522,500 |
Pliant Corp., Sec’d. Notes (a) (g) | | | | | | | | |
11.125%, 09/01/09 | | Caa3 | | | 125 | | | 101,875 |
Russell Stanley Holdings, Inc., Sr. Sub. Notes 144A PIK (g)(z) | | | | | | | | |
9.00%, 11/30/08 | | NR | | | 55 | | | 0 |
Tekni-Plex, Inc., Gtd. Notes | | | | | | | | |
12.75%, 06/15/10 | | Ca | | | 62 | | | 27,590 |
Tekni-Plex, Inc., Sec’d. Notes 144A (a) (g) | | | | | | | | |
8.75%, 11/15/13 | | Caa2 | | | 125 | | | 106,250 |
| | | | | | | |
|
|
| | | | | | | | | 4,343,766 |
| | | | | | | |
|
|
Paper — 2.4% | | | | | | | | |
Ainsworth Lumber Co. Ltd., Gtd. Notes (Canada) (l) | | | | | | | | |
7.25%, 10/01/12 | | B2 | | | 250 | | | 225,625 |
Boise Cascade LLC, Gtd. Notes | | | | | | | | |
7.125%, 10/15/14 | | B2 | | | 250 | | | 222,500 |
Georgia-Pacific Corp., Gtd. Notes | | | | | | | | |
9.375%, 02/01/13 | | Ba1 | | | 500 | | | 551,250 |
Georgia-Pacific Corp., Notes | | | | | | | | |
8.125%, 05/15/11 | | Ba2 | | | 500 | | | 542,500 |
Jefferson Smurfit Corp., Gtd. Notes | | | | | | | | |
7.50%, 06/01/13 | | B2 | | | 250 | | | 225,000 |
Jefferson Smurfit Corp., Sr. Notes | | | | | | | | |
9.625%, 10/01/12 | | B3 | | | 500 | | | 480,000 |
JSG Holding PLC, Sr. Notes (Ireland) 144A | | | | | | | | |
11.50%, 10/01/15 | | Caa2 | | EUR | 137 | | $ | 141,550 |
Stone Container Corp., Sr. Notes | | | | | | | | |
9.75%, 02/01/11 | | B2 | | $ | 250 | | | 250,000 |
Tembec Industries, Inc., Gtd. Notes | | | | | | | | |
8.50%, 02/01/11 | | B3 | | | 125 | | | 79,375 |
| | | | | | | |
|
|
| | | | | | | | | 2,717,800 |
| | | | | | | |
|
|
Pharmaceuticals — 0.1% | | | | | | | | |
Mylan Laboratories, Inc., Sr. Notes 144A (g) | | | | | | | | |
6.375%, 08/15/15 | | Ba1 | | | 125 | | | 123,438 |
| | | | | | | |
|
|
Pipelines — 4.8% | | | | | | | | |
El Paso Corp., Notes (a) | | | | | | | | |
7.875%, 06/15/12 | | Caa1 | | | 750 | | | 765,000 |
El Paso Corp., Sr. Notes | | | | | | | | |
6.75%, 05/15/09 | | Caa1 | | | 500 | | | 491,250 |
7.80%, 08/01/31 | | Caa1 | | | 750 | | | 744,375 |
Southern Natural Gas Co., Notes | | | | | | | | |
8.00%, 03/01/32 | | B1 | | | 250 | | | 268,610 |
Tennessee Gas Pipeline Co., Bonds | | | | | | | | |
8.375%, 06/15/32 | | B1 | | | 350 | | | 391,393 |
Tennessee Gas Pipeline Co., Debs. | | | | | | | | |
7.50%, 04/01/17 | | B1 | | | 500 | | | 526,250 |
Transcontinental Gas Pipe Corp., Sr. Notes, Series B | | | | | | | | |
8.875%, 07/15/12 | | Ba2 | | | 475 | | | 543,875 |
Williams Cos., Inc., Notes | | | | | | | | |
7.875%, 09/01/21 | | B1 | | | 500 | | | 539,375 |
Williams Cos., Inc., Sr. Notes | | | | | | | | |
7.625%, 07/15/19 | | B1 | | | 750 | | | 795,000 |
Williams Cos., Inc., Sr. Unsec’d. Notes | | | | | | | | |
8.125%, 03/15/12 | | B1 | | | 375 | | | 405,000 |
| | | | | | | |
|
|
| | | | | | | | | 5,470,128 |
| | | | | | | |
|
|
102
| | | | | | | | | |
| | | Moody’s
Ratings
(Unaudited)
| | | Principal
Amount
(000)#
| | Value
(Note 2)
|
Printing — 0.2% | | | | | | | | | |
Vertis, Inc., Gtd. Notes, Series B (a) | | | | | | | | | |
10.875%, 06/15/09 | | Caa1 | | | $ | 250 | | $ | 232,500 |
| | | | | | | | |
|
|
Publishing — 3.8% | | | | | | | | | |
Advanstar Communications, Inc., Gtd. Notes (g) | | | | | | | | | |
12.00%, 02/15/11 | | Caa2 | | | | 250 | | | 265,313 |
Advanstar Communications, Inc., Sec’d. Notes | | | | | | | | | |
10.75%, 08/15/10 | | B3 | | | | 125 | | | 138,438 |
American Media Operations, Inc., Gtd. Notes | | | | | | | | | |
8.875%, 01/15/11 | | Caa1 | | | | 75 | | | 64,125 |
Dex Media East LLC, Gtd. Notes | | | | | | | | | |
12.125%, 11/15/12 | | B2 | | | | 487 | | | 568,572 |
Dex Media West LLC, Sr. Sub. Notes | | | | | | | | | |
9.875%, 08/15/13 | | B2 | | | | 303 | | | 334,057 |
Dex Media, Inc., Disc. Notes, Zero Coupon (until 11/15/08) (a) | | | | | | | | | |
9.00%, 11/15/13 | | B3 | | | | 750 | | | 581,250 |
Houghton Mifflin Co., Sr. Disc. Notes, Zero Coupon (until 10/15/08) | | | | | | | | | |
11.50%, 10/15/13 | | Caa2 | | | | 250 | | | 181,250 |
Houghton Mifflin Co., Sr. Sub. Notes (a) | | | | | | | | | |
9.875%, 02/01/13 | | Caa1 | | | | 250 | | | 258,125 |
Primedia, Inc., Sr. Notes | | | | | | | | | |
8.00%, 05/15/13 | | B2 | | | | 125 | | | 114,063 |
WDAC Subsidiary Corp., Sr. Notes | | | | | | | | | |
8.375%, 12/01/14 | | Caa1 | | | | 250 | | | 235,625 |
8.50%, 12/01/14 | | Caa1 | | | EUR | 750 | | | 860,638 |
Yell Finance BV, Gtd. Notes, Zero Coupon (until 08/01/06) | | | | | | | | | |
13.50%, 08/01/11 | | B1 | | | | 592 | | | 603,840 |
Ziff Davis Media, Inc., Gtd. Notes, Series B, PIK (g) | | | | | | | | | |
12.00%, 08/12/09 | | CCC- | (d) | | $ | 92 | | $ | 94,424 |
| | | | | | | | |
|
|
| | | | | | | | | | 4,299,720 |
| | | | | | | | |
|
|
Publishing — 0.8% | | | | | | | | | |
Lighthouse International Co. SA, Gtd. Notes (Luxembourg) | | | | | | | | | |
8.00%, 04/30/14 | | B3 | | | EUR | 750 | | | 943,781 |
| | | | | | | | |
|
|
Real Estate — 0.1% | | | | | | | | | |
CB Richard Ellis Services, Inc., Sr. Notes | | | | | | | | | |
9.75%, 05/15/10 | | Ba3 | | | | 114 | | | 124,830 |
| | | | | | | | |
|
|
Restaurants — 0.5% | | | | | | | | | |
Dominos, Inc., Sr. Sub. Notes | | | | | | | | | |
8.25%, 07/01/11 | | B2 | | | | 164 | | | 169,740 |
Landry’s Restaurants, Inc., Gtd. Notes | | | | | | | | | |
7.50%, 12/15/14 | | B2 | | | | 375 | | | 345,000 |
| | | | | | | | |
|
|
| | | | | | | | | | 514,740 |
| | | | | | | | |
|
|
Retailers — 0.4% | | | | | | | | | |
General Nutrition Centers, Inc., Sr. Sub. Notes | | | | | | | | | |
12.00%, 12/01/11 | | Caa1 | | | | 200 | | | 167,500 |
Victoria Acquisition III BV, Sr. Notes (Netherlands) | | | | | | | | | |
7.875%, 10/01/14 | | B3 | | | EUR | 250 | | | 283,883 |
| | | | | | | | |
|
|
| | | | | | | | | | 451,383 |
| | | | | | | | |
|
|
Retailers — Food & Drug — 1.1% | | | | | | | | | |
Brake Brothers Finance PLC, Sr. Notes (United Kingdom) | | | | | | | | | |
12.00%, 12/15/11 | | B3 | | | GBP | 250 | | | 486,751 |
Couche-Tard US LP, Sr. Sub. Notes | | | | | | | | | |
7.50%, 12/15/13 | | Ba3 | | | | 250 | | | 253,750 |
Jean Coutu Group, Inc., Sr. Sub. Notes (Canada) (a) (l) | | | | | | | | | |
8.50%, 08/01/14 | | B3 | | | | 250 | | | 231,875 |
103
Strategic Partners High Yield Bond Fund
SCHEDULE OF INVESTMENTS
October 31, 2005
| | | | | | | | |
| | | Moody’s
Ratings
(Unaudited)
| | Principal
Amount
(000)#
| | Value
(Note 2)
|
Rite Aid Corp., Sec’d. Notes | | | | | | | | |
8.125%, 05/01/10 | | B2 | | $ | 250 | | $ | 250,000 |
| | | | | | | |
|
|
| | | | | | | | | 1,222,376 |
| | | | | | | |
|
|
Services — 0.2% | | | | | | | | |
Cornell Cos., Inc., Sr. Notes | | | | | | | | |
10.75%, 07/01/12 | | B3 | | | 250 | | | 254,375 |
| | | | | | | |
|
|
Services Cyclical — Distribution Logistics — 1.1% | | | | | | | | |
Ray Acquisition SCA, Sec’d. Notes (France) 144A (g) | | | | | | | | |
9.375%, 03/16/15 | | Caa1 | | EUR | 1,000 | | | 1,228,413 |
| | | | | | | |
|
|
Technology — 1.3% | | | | | | | | |
Activant Solutions, Sr. Notes | | | | | | | | |
10.50%, 06/15/11 | | B2 | | | 250 | | | 266,250 |
Lucent Technologies, Inc., Debs. | | | | | | | | |
6.45%, 03/15/29 | | B1 | | | 500 | | | 427,500 |
Xerox Corp., Gtd. Notes | | | | | | | | |
9.75%, 01/15/09 | | Ba2 | | | 500 | | | 552,500 |
Xerox Corp., Sr. Notes | | | | | | | | |
7.625%, 06/15/13 | | Ba2 | | | 250 | | | 262,500 |
| | | | | | | |
|
|
| | | | | | | | | 1,508,750 |
| | | | | | | |
|
|
Technology — Hardware — 0.1% | | | | | | | | |
Amkor Technology, Inc., Sr. Notes | | | | | | | | |
5.00%, 03/15/07 | | Caa3 | | | 125 | | | 109,375 |
| | | | | | | |
|
|
Telecom — Integrated/Services — 0.7% | | | | | | | | |
Qwest Corp., Notes | | | | | | | | |
8.875%, 03/15/12 | | Ba3 | | | 750 | | | 823,125 |
| | | | | | | |
|
|
Telecommunications — 2.7% | | | | | | | | |
Cincinnati Bell, Inc., Sr. Sub. Notes | | | | | | | | |
8.375%, 01/15/14 | | B3 | | | 250 | | | 243,125 |
Citizens Communications, Co., Sr. Notes | | | | | | | | |
6.25%, 01/15/13 | | Ba3 | | | 250 | | | 236,875 |
Eircom Funding, Gtd. Notes (Ireland) (l) | | | | | | | | |
8.25%, 08/15/13 | | B1 | | | 250 | | | 269,375 |
Inmarsat Finance PLC, Gtd. Notes Zero Coupon (until 11/15/08) | | | | | | | | |
10.375%, 11/15/12 | | B2 | | | 500 | | | 408,750 |
Nextel Communications, Sr. Notes | | | | | | | | |
5.95%, 03/15/14 | | Baa2 | | $ | 500 | | $ | 501,558 |
PanAmSat Holding Corp., Sr. Disc. Notes, Zero Coupon (until 11/01/09) | | | | | | | | |
10.375%, 11/01/14 | | B3 | | | 250 | | | 170,625 |
Qwest Capital Funding Co., Gtd. Notes (a) | | | | | | | | |
7.90%, 08/15/10 | | Caa2 | | | 250 | | | 248,750 |
Qwest Services Corp., Sec’d. Notes | | | | | | | | |
13.50%, 12/15/10 | | Caa1 | | | 500 | | | 571,250 |
Rogers Wireless, Inc., Sec’d. Notes (Canada) (l) | | | | | | | | |
7.50%, 03/15/15 | | Ba3 | | | 250 | | | 268,125 |
Rogers Wireless, Inc., Sr. Sub. Notes (Canada) (a) (l) | | | | | | | | |
8.00%, 12/15/12 | | B2 | | | 125 | | | 132,187 |
| | | | | | | |
|
|
| | | | | | | | | 3,050,620 |
| | | | | | | |
|
|
Telecommunications — Cellular — 4.0% | | | | | | | | |
Alamosa Delaware, Inc., Gtd. Notes | | | | | | | | |
12.00%, 07/31/09 | | Caa1 | | | 250 | | | 273,750 |
Alamosa Delaware, Inc., Sr. Notes | | | | | | | | |
8.50%, 01/31/12 | | Caa1 | | | 500 | | | 518,750 |
American Cellular Corp., Sr. Notes, Series B | | | | | | | | |
10.00%, 08/01/11 | | B3 | | | 250 | | | 270,000 |
American Tower Corp., Sr. Notes | | | | | | | | |
7.50%, 05/01/12 | | B1 | | | 500 | | | 521,250 |
Citizens Communications Co., Notes | | | | | | | | |
9.25%, 05/15/11 | | Ba3 | | | 250 | | | 270,625 |
Digicel Ltd., Sr. Notes 144A (g) | | | | | | | | |
9.25%, 09/01/12 | | B3 | | | 125 | | | 128,750 |
Dobson Cellular Systems, Inc., Sec’d. Notes | | | | | | | | |
9.875%, 11/01/12 | | B2 | | | 250 | | | 270,000 |
Hellas Telecommunications Sec’d. Notes (Luxembourg) (g) | | | | | | | | |
8.50%, 10/15/13 | | B3 | | EUR | 125 | | | 147,746 |
104
| | | | | | | | |
| | | Moody’s
Ratings
(Unaudited)
| | Principal
Amount
(000)#
| | Value (Note 2)
|
Horizon PCS, Inc., Gtd. Notes | | | | | | | | |
11.375%, 07/15/12 | | B3e | | $ | 125 | | $ | 140,625 |
Nextel Communications, Inc., Sr. Notes | | | | | | | | |
7.375%, 08/01/15 | | Baa2 | | | 625 | | | 661,536 |
Nextel Partners, Inc., Sr. Notes | | | | | | | | |
8.125%, 07/01/11 | | Ba3 | | | 200 | | | 213,500 |
Rogers Wireless, Inc., Sec’d. Notes (Canada) (l) | | | | | | | | |
6.375%, 03/01/14 | | Ba3 | | | 500 | | | 498,750 |
US Unwired, Inc., Sec’d. Notes | | | | | | | | |
10.00%, 06/15/12 | | Caa1 | | | 500 | | | 568,750 |
| | | | | | | |
|
|
| | | | | | | | | 4,484,032 |
| | | | | | | |
|
|
Telecommunications — Satellites — 0.4% | | | | | | | | |
Intelsat, Ltd. Notes (Bermuda) (l) | | | | | | | | |
7.625%, 04/15/12 | | Caa1 | | | 125 | | | 100,625 |
PanAmSat Corp., Gtd. Notes | | | | | | | | |
9.00%, 08/15/14 | | B1 | | | 325 | | | 342,063 |
| | | | | | | |
|
|
| | | | | | | | | 442,688 |
| | | | | | | |
|
|
Textile — 0.7% | | | | | | | | |
Russell Corp., Gtd. Notes | | | | | | | | |
9.25%, 05/01/10 | | B2 | | | 275 | | | 277,062 |
Warnaco, Inc., Sr. Notes | | | | | | | | |
8.875%, 06/15/13 | | B1 | | | 500 | | | 538,750 |
| | | | | | | |
|
|
| | | | | | | | | 815,812 |
| | | | | | | |
|
|
Tobacco — 0.2% | | | | | | | | |
Alliance One International, Inc., Notes 144A (g) | | | | | | | | |
11.00%, 05/15/12 | | B2 | | | 250 | | | 210,000 |
| | | | | | | |
|
|
Transportation — 0.6% | | | | | | | | |
Petroleum Helicopters, Inc., Gtd. Notes, Series B | | | | | | | | |
9.375%, 05/01/09 | | B1 | | | 375 | | | 392,812 |
Stena AB, Sr. Notes | | | | | | | | |
9.625%, 12/01/12 | | Ba3 | | | 250 | | | 270,000 |
| | | | | | | |
|
|
| | | | | | | | | 662,812 |
| | | | | | | |
|
|
Utilities — Electrical Utilities — 0.4% | | | | | | | | |
Dynegy Holdings, Inc., Sr. Notes | | | | | | | | |
8.75%, 02/15/12 | | Caa2 | | $ | 125 | | $ | 132,187 |
NRG Energy, Inc., Gtd. Notes 144A | | | | | | | | |
8.00%, 12/15/13 | | B1 | | | 319 | | | 347,710 |
| | | | | | | |
|
|
| | | | | | | | | 479,897 |
| | | | | | | |
|
|
Total Corporate Obligations
(Cost $107,228,300) | | | | | | | | 107,723,345 |
| | | | | | | |
|
|
| | | | | Shares
| | |
Preferred Stock — 0.2% | | | | | | | | |
Publishing | | | | | | | | |
Ziff Davis Media, Inc., | | | | | | | | |
Series E-1, 10.00% | | | | | 2 | | | 1,440 |
| | | | | | | |
|
|
Retailers — 0.2% | | | | | | | | |
General Nutrition Centers, Inc., | | | | | | | | |
Series A, 12.00% | | | | | 250 | | | 179,375 |
| | | | | | | |
|
|
Total Preferred Stock
(Cost $251,501) | | | | | | | | 180,815 |
| | | | | | | |
|
|
| | | | | Units
| | |
Warrants* — 0.1% | | | | | | | | |
Chemicals | | | | | | | | |
General Chemical Industry Product, Inc., Series A, expiring 04/30/11 | | | | | 103 | | | 0 |
General Chemical Industry Product, Inc., Series B, expiring 04/30/11 | | | | | 77 | | | 0 |
| | | | | | | |
|
|
| | | | | | | | | 0 |
| | | | | | | |
|
|
Media — Broadcasting & Radio | | | | | | | | |
XM Satellite Radio, Inc., expiring 03/15/10 | | | | | 450 | | | 20,250 |
| | | | | | | |
|
|
Metals — 0.1% | | | | | | | | |
ACP Holding Co., expiring 10/07/13 | | | | | 39,024 | | | 77,072 |
| | | | | | | |
|
|
Packaging | | | | | | | | |
Pliant Corp., 144A, expiring 06/01/10 | | | | | 475 | | | 5 |
| | | | | | | |
|
|
105
Strategic Partners High Yield Bond Fund
SCHEDULE OF INVESTMENTS
October 31, 2005
| | | | | | |
| | | Units
| | Value (Note 2)
| |
Paper | | | | | | |
MDP Acquisitions PLC, expiring 10/01/13 (Ireland) 144A (g) | | 275 | | $ | 5,638 | |
| | | | |
|
|
|
Publishing | | | | | | |
Advanstar Holdings Corp., expiring 10/15/11 144A (g) | | 225 | | | 2 | |
Ziff Davis Media, Inc., expiring 08/12/12 | | 4,400 | | | 440 | |
| | | | |
|
|
|
| | | | | | 442 | |
| | | | |
|
|
|
Total Warrants
(Cost $79,747) | | | | | 103,407 | |
| | | | |
|
|
|
| | | Shares
| | | |
Common Stocks | | | | | | |
Chemicals | | | | | | |
General Chemicals Industry Products * | | 179 | | | 49,907 | |
| | | | |
|
|
|
Packaging | | | | | | |
Russell Stanley Holdings, Inc.(z)* | | 6,000 | | | 0 | |
| | | | |
|
|
|
Total Common Stocks
(Cost $577,332) | | | | | 49,907 | |
| | | | |
|
|
|
Total Long-Term Investments
(Cost $108,136,880) | | | | | 108,057,474 | |
| | | | |
|
|
|
Short-Term Investments — 9.2% | | | | | | |
Money Market Mutual Fund | | | | | | |
Dryden Core Investment Fund - Taxable Money Market Series (b)(w) (Cost $ 10,426,363) | | 10,426,363 | | | 10,426,363 | |
| | | | |
|
|
|
Total Investments(o) — 104.6%
(Cost $118,563,243; Note 5) | | | | | 118,483,837 | |
Liabilities In Excess of Other Assets
(Includes cash collateral for securities on loan of $10,426,363)(u) — (4.6%) | | | | | (5,240,743 | ) |
| | | | |
|
|
|
Net Assets — 100.0% | | | | $ | 113,243,094 | |
| | | | |
|
|
|
The following abbreviations and annotations are used in portfolio descriptions:
| 144A | Security was purchased pursuant to Rule 144A under the securities Act of 1933 and may not be resold subject to that rule except to qualified institutional buyers. Unless otherwise noted 144A securities are deemed to be liquid. |
| * | Non-income producing security. |
| # | Principal amount is shown in U.S. dollars unless otherwise stated. |
| (a) | All or a portion of security is on loan. The aggregate market value of such securities is $10,295,907; cash collateral of $10,426,363 (included with liabilities) was received with which the portfolio purchased highly liquid short-term investments. |
| (b) | Represents security purchased with cash collateral for securities on loan. |
| (d) | Standard & Poor’s rating. |
| (g) | Indicates a security that has been deemed illiquid. |
| (l) | US$ Denominated Foreign Bonds. |
| (o) | As of October 31, 2005, 6 securities representing $49,912 and 0.04% of the total market value were fair valued in accordance with the policies adopted by the Board of Directors. |
| (u) | Liabilities in excess of other assets includes net unrealized appreciation on forward foreign currency contracts as follows: |
Forward foreign currency exchange contracts outstanding at October 31, 2005:
Purchase Contracts
| | | | | | | | | | | | | | |
Settlement
Month
| | Type
| | Contracts
to Receive
| | In Exchange
For
| | Contracts
at Value
| | Unrealized
Depreciation
| |
Nov 05 | | Buy EUR | | 2,451,650 | | $ | 2,963,305 | | $ | 2,938,762 | | $ | (24,543 | ) |
| | | | | | |
|
| |
|
| |
|
|
|
Sale Contracts | | | | | | | | | | | | | | |
| | | | | |
Settlement
Month
| | Type
| | Contracts
to Receive
| | In Exchange
For
| | Contracts
at Value
| | Unrealized
Appreciation
| |
Nov 05 | | Sell EUR | | 11,312,459 | | $ | 14,065,303 | | $ | 13,569,015 | | $ | 496,288 | |
Nov 05 | | Sell GBP | | 286,438 | | | 512,724 | | | 506,903 | | | 5,821 | |
| | | | | | |
|
| |
|
| |
|
|
|
| | | | | | | $ | 14,578,027 | | $ | 14,075,918 | | $ | 502,109 | |
| | | | | | |
|
| |
|
| |
|
|
|
| (w) | Prudential Investments LLC, the manager of the Fund also serves as manager of the Dryden Core Investment Fund-Taxable Money Market Series. |
106
The industry classification of long-term portfolio holdings, short-term investments and liabilities in excess of other assets shown as a percentage of net assets as of October 31, 2005 were as follows:
| | | |
Chemicals | | 8.2 | % |
Gaming | | 7.1 | |
Consumer Products | | 6.7 | |
Pipelines | | 4.8 | |
Publishing | | 4.6 | |
Telecommunications - Cellular | | 4.0 | |
Building Materials | | 3.9 | |
Healthcare | | 3.9 | |
Packaging | | 3.8 | |
Media - Cable | | 3.5 | |
Automotive Parts | | 2.9 | |
Telecommunications | | 2.7 | |
Agriculture | | 2.4 | |
Paper | | 2.4 | |
Conglomerates | | 2.3 | |
Electric | | 2.3 | |
Food | | 2.3 | |
Metals | | 2.2 | |
Aerospace | | 2.0 | |
Energy | | 1.5 | |
Capital Goods - Others | | 1.4 | |
Consumer Cyclical - Services | | 1.4 | |
Entertainment | | 1.3 | |
Environmental | | 1.3 | |
Technology | | 1.3 | |
Defense | | 1.1 | |
Retailers - Food & Drug | | 1.1 | |
Services Cyclical - Distribution Logistics | | 1.1 | |
Automotive | | 0.9 | |
Energy - Exploration & Production | | 0.9 | |
Computer Services | | 0.8 | |
Media - Broadcasting & Radio | | 0.7 | |
Telecom - Integrated/Services | | 0.7 | |
Textile | | 0.7 | |
Lodging | | 0.6 | |
Media - Non Cable | | 0.6 | |
Metals & Mining | | 0.6 | |
Retailers | | 0.6 | |
Transportation | | 0.6 | |
Restaurants | | 0.5 | |
Containers & Packaging | | 0.4 | |
Electric - Generation | | 0.4 | |
Health Care - Medical Providers | | 0.4 | |
Telecommunications - Satellites | | 0.4 | |
Utilities - Electrical Utilities | | 0.4 | |
Clothing & Apparel | | 0.2 | |
Healthcare Services | | 0.2 | |
Hotels & Motels | | 0.2 | |
Preferred Stock | | 0.2 | |
Printing | | 0.2 | |
Services | | 0.2 | |
Tobacco | | 0.2 | |
Finance | | 0.1 | |
Machinery | | 0.1 | |
Pharmaceuticals | | 0.1 | |
Real Estate Investment Trust | | 0.1 | |
Technology - Hardware | | 0.1 | |
Warrants | | 0.1 | |
Short-Term Investments (Entire portion represents investment purchased with collateral received from securities on loan) | | 9.2 | |
| | |
|
|
| | | 104.6 | |
Liabilities In Excess of Other Assets | | –4.6 | |
| | |
|
|
Total | | 100.0 | % |
| | |
|
|
See Notes to Finanacial Statements.
107
Strategic Partners Money Market Fund
SCHEDULE OF INVESTMENTS
October 31, 2005
| | | | | | |
| | | Principal
Amount
(000)
| | Value (Note 2)
|
Commercial Paper — 75.9% | | | | | | |
Allianz Finance Corp. 144(n) | | | | | | |
3.94%, 12/06/05 | | | | | | |
(cost $2,988,508; purchased 10/06/05) | | $ | 3,000 | | $ | 2,988,508 |
Alltel Corp. 144A(n) | | | | | | |
4.01%, 11/22/05 | | | | | | |
(cost $5,287,602; purchased 10/27/05) | | | 5,300 | | | 5,287,602 |
Amsterdam Funding Corp. 144A(n) | | | | | | |
3.78%, 11/01/05 | | | | | | |
(cost $1,000,000; purchased 10/04/05) | | | 1,000 | | | 1,000,000 |
4.00%, 11/21/05 | | | | | | |
(cost $1,995,556; purchased 10/21/05) | | | 2,000 | | | 1,995,556 |
Bank of America Corp.(n) | | | | | | |
4.01%, 11/29/05 | | | 3,000 | | | 2,990,643 |
Bank of Ireland 144A(n) | | | | | | |
3.715%, 01/18/06 | | | | | | |
(cost $2,975,852; purchased 07/18/05) | | | 3,000 | | | 2,975,852 |
Banque Et Caisse Epargne(n) | | | | | | |
3.80%, 11/01/05 | | | 6,140 | | | 6,140,000 |
Barton Capital Corp. 144A(n) | | | | | | |
3.90%, 11/14/05 | | | | | | |
(cost $2,995,775; purchased 10/17/05) | | | 3,000 | | | 2,995,775 |
Cafco LLC 144A(n) | | | | | | |
3.90%, 02/28/06 | | | | | | |
(cost $5,922,650; purchased 08/31/05) | | | 6,000 | | | 5,922,650 |
Ciesco LLC 144A(n) | | | | | | |
3.64%, 11/01/05 | | | | | | |
(cost $5,000,000; purchased 08/05/05) | | | 5,000 | | | 5,000,000 |
Countrywide Financial Corp.(n) | | | | | | |
3.86%, 11/03/05 | | | 5,700 | | | 5,698,778 |
Credit Suisse First Boston USA, Inc. 144A(n) | | | | | | |
3.65%, 12/19/05 | | | | | | |
(cost $3,482,967; purchased 07/19/05) | | | 3,500 | | | 3,482,967 |
Depfa Bank PLC 144A(n) | | | | | | |
3.78%, 11/01/05 | | | | | | |
(cost $3,500,000; purchased 10/04/05) | | | 3,500 | | | 3,500,000 |
Edison Asset Securities LLC 144A(n) | | | | | | |
3.91%, 11/14/05 | | $ | 330 | | $ | 329,534 |
Falcon Asset Securities Corp. 144A(n) | | | | | | |
4.00%, 11/23/05 | | | | | | |
(cost $997,556; purchased 10/20/05) | | | 1,000 | | | 997,556 |
Greenwich Capital Holdings(c)(n) | | | | | | |
3.90%, 05/11/06 | | | 4,500 | | | 4,500,000 |
HBOS Corp. 144A(n) | | | | | | |
4.04%, 11/15/05 | | | 4,000 | | | 3,993,716 |
HSBC Finance Corp.(n) | | | | | | |
3.85%, 11/03/05 | | | 5,000 | | | 4,998,930 |
Market Street Funding 144A | | | | | | |
3.93%, 11/15/05 | | | | | | |
(cost $5,990,830; purchased 10/18/05) | | | 6,000 | | | 5,990,830 |
Morgan Stanley(n) | | | | | | |
3.83%, 11/01/05 | | | 3,500 | | | 3,500,000 |
Park Granada LLC 144A(n) | | | | | | |
4.03%, 11/04/05 | | | | | | |
(cost $2,175,269; purchased 10/28/05) | | | 2,176 | | | 2,175,269 |
Preferred Receivable Funding 144A(n) | | | | | | |
3.78%, 11/01/05 | | | | | | |
(cost $3,238,000; purchased 10/04/05) | | | 3,238 | | | 3,238,000 |
4.02%, 12/01/05 | | | | | | |
(cost $1,079,372; purchased 10/25/05) | | | 1,083 | | | 1,079,372 |
Prudential PLC 144A(n) | | | | | | |
3.69%, 11/07/05 | | | | | | |
(cost $4,996,925; purchased 08/05/05) | | | 5,000 | | | 4,996,925 |
UBS Finance Delaware LLC(n) | | | | | | |
3.765%, 11/01/05 | | | 4,881 | | | 4,881,000 |
Windmill Funding Corp. 144A(n) | | | | | | |
3.97%, 12/01/05 | | | | | | |
(cost $1,345,534; purchased 10/20/05) | | | 1,350 | | | 1,345,534 |
| | | | | |
|
|
Total Commercial Paper
(Cost $92,004,997) | | | | | | 92,004,997 |
| | | | | |
|
|
Certificates of Deposit — 6.6% | | | | | | |
BNP Paribas NY Branch(c) | | | | | | |
3.908%, 06/19/06 | | | 2,000 | | | 1,999,718 |
Branch Banking & Trust | | | | | | |
3.71%, 08/10/06 | | | 5,000 | | | 4,999,592 |
108
| | | | | | | |
| | | Principal
Amount (000)
| | Value (Note 2)
| |
Royal Bank of Scotland | | | | | | | |
4.30%, 09/28/06 | | $ | 1,000 | | $ | 1,000,000 | |
Total Certificates of Deposit
(Cost $7,999,310) | | | | | | 7,999,310 | |
Corporate Obligations — 21.2% | | | | | | | |
3M Co. 144A | | | | | | | |
5.674%, 12/12/05 | | | 1,000 | | | 1,003,092 | |
Bank of America Corp. | | | | | | | |
7.50%, 09/15/06 | | | 3,000 | | | 3,081,828 | |
Bank One Corp.(c) | | | | | | | |
3.98%, 09/15/06 | | | 1,210 | | | 1,211,298 | |
General Electric Capital Corp. | | | | | | | |
6.80%, 11/01/05 | | | 2,446 | | | 2,446,000 | |
Goldman Sachs Group, Inc.(c) | | | | | | | |
4.12%, 03/21/06 | | | 2,250 | | | 2,251,993 | |
HBOS Treasury Services PLC(c) | | | | | | | |
4.153%, 01/12/06 | | | 2,000 | | | 2,000,196 | |
JPMorgan Chase & Co. | | | | | | | |
5.625%, 08/15/06 | | | 3,000 | | | 3,031,496 | |
Merrill Lynch & Co.(c) | | | | | | | |
3.95%, 11/15/06 | | | 5,000 | | | 5,000,000 | |
Morgan Stanley Group, Inc. | | | | | | | |
4.25%, 03/27/06 | | | 2,000 | | | 2,002,344 | |
National City Bank | | | | | | | |
4.051%, 07/26/06 | | | 1,650 | | | 1,650,313 | |
Paccar Financial Corp.(c) | | | | | | | |
3.921%, 11/13/06 | | | 2,000 | | | 2,000,000 | |
| | | | | |
|
|
|
Total Corporate Obligations
(Cost $25,678,560) | | | | | | 25,678,560 | |
| | | | | |
|
|
|
Total Investments — 103.7%
(Cost $125,682,867)† | | | | | | 125,682,867 | |
Liabilities In Excess of Other Assets — (3.7%) | | | | | | (4,467,512 | ) |
| | | | | |
|
|
|
Net Assets — 100.0% | | | | | $ | 121,215,355 | |
| | | | | |
|
|
|
The following abbreviations and annotations are used in portfolio descriptions:
| 144A | Security was purchased pursuant to Rule 144A under the securities Act of 1933 and may not be resold subject to that rule except to qualified institutional buyers. At the end of the current reporting period, the aggregate amortized cost of such securities was $54,972,396. The aggregate market value of $54,972,396 is approximately 45.4% of net assets. |
| | These securities have been deemed to be liquid under procedures established by the Board of Directors. |
| † | The cost of securities for federal income tax purposes is substantially the same as for financial reporting purposes. |
| (c) | Indicates a variable rate security. The maturity date presented for these instruments is the next date on which the rate of interest is adjusted. |
| (n) | Rates shown are the effective yields at purchase date. |
The following is a breakdown of the money market portfolio by industry classification, as of October 31, 2005. Percentages are based on net assets.
| | | |
Financial | | 54.8 | % |
Bank | | 30.5 | |
Certificates of Deposit | | 6.6 | |
Insurance | | 6.6 | |
Telecommunications | | 4.4 | |
Industrial | | 0.8 | |
| | |
|
|
| | | 103.7 | |
Liabilities In Excess of Other Assets | | –3.7 | |
| | |
|
|
Total | | 100.0 | % |
| | |
|
|
See Notes to Financial Statements.
109
Statements of Assets and Liabilities
OCTOBER 31, 2005
| | | | | | | | | | | | | | | | | | | | |
| | | STRATEGIC
PARTNERS
INTERNATIONAL
GROWTH
FUND
| | | STRATEGIC
PARTNERS
SMALL CAP
GROWTH
FUND
| | | STRATEGIC
PARTNERS
MID-CAP
GROWTH
FUND
| | | STRATEGIC
PARTNERS
MID CAP
VALUE
FUND
| | | STRATEGIC
PARTNERS
TECHNOLOGY
FUND
| |
ASSETS: | | | | | | | | | | | | | | | | | | | | |
Investments at Value: Unaffiliated investments (A) including Securities on Loan (D) | | $ | 241,369,951 | | | $ | 108,023,474 | | | $ | 132,650,240 | | | $ | 294,850,944 | | | $ | 14,851,085 | |
Affiliated investments (B) | | | — | | | | 2,187,335 | | | | 5,792,414 | | | | 54,913,704 | | | | — | |
Cash (F) | | | — | | | | 323,657 | | | | 390,991 | | | | — | | | | — | |
Foreign currency at value (C) | | | 3,582,749 | | | | — | | | | — | | | | — | | | | — | |
Receivable for: | | | | | | | | | | | | | | | | | | | | |
Securities Sold | | | 7,277,055 | | | | 15,909,775 | | | | 1,243,356 | | | | 5,340,108 | | | | — | |
Dividends and Interest | | | 732,143 | | | | 41,302 | | | | 14,668 | | | | 87,450 | | | | 7,350 | |
Fund Shares Sold | | | 62,539 | | | | 87,704 | | | | 60,033 | | | | 113,688 | | | | 5,689 | |
Receivable from Investment Manager | | | — | | | | — | | | | — | | | | — | | | | 17,708 | |
Prepaid Expenses | | | 26,979 | | | | 23,802 | | | | 21,681 | | | | 31,050 | | | | 7,290 | |
| | |
|
|
| |
|
|
| |
|
|
| |
|
|
| |
|
|
|
Total Assets | | | 253,051,416 | | | | 126,597,049 | | | | 140,173,383 | | | | 355,336,944 | | | | 14,889,122 | |
| | |
|
|
| |
|
|
| |
|
|
| |
|
|
| |
|
|
|
LIABILITIES: | | | | | | | | | | | | | | | | | | | | |
Payable to Custodian | | | 2,580,765 | | | | — | | | | — | | | | 104,057 | | | | 7,408 | |
Payable to Investment Manager | | | 88,988 | | | | 83,388 | | | | 140,460 | | | | 108,688 | | | | — | |
Payable to Broker for Collateral for Securities on Loan | | | — | | | | — | | | | 5,792,414 | | | | 54,913,704 | | | | — | |
Payable for: | | | | | | | | | | | | | | | | | | | | |
Securities Purchased | | | 3,592,873 | | | | 16,389,968 | | | | 1,402,445 | | | | 7,017,232 | | | | — | |
Fund Shares Redeemed | | | 411,279 | | | | 205,426 | | | | 299,576 | | | | 658,403 | | | | 38,611 | |
Distribution Fees | | | 171,045 | | | | 74,304 | | | | 89,356 | | | | 199,535 | | | | 9,294 | |
Deferred Directors’ Fees | | | 17,637 | | | | 8,374 | | | | 7,774 | | | | 8,671 | | | | 824 | |
Transfer Agents’ Fees (E) | | | 484,963 | | | | 320,046 | | | | 394,294 | | | | 329,128 | | | | 65,639 | |
Accrued Expenses and Other Liabilities | | | 55,800 | | | | 41,669 | | | | 195,399 | | | | 60,630 | | | | 48,022 | |
Withholding Tax | | | 97,212 | | | | — | | | | — | | | | — | | | | — | |
| | |
|
|
| |
|
|
| |
|
|
| |
|
|
| |
|
|
|
Total Liabilities | | | 7,500,562 | | | | 17,123,175 | | | | 8,321,718 | | | | 63,400,048 | | | | 169,798 | |
| | |
|
|
| |
|
|
| |
|
|
| |
|
|
| |
|
|
|
Net Assets | | $ | 245,550,854 | | | $ | 109,473,874 | | | $ | 131,851,665 | | | $ | 291,936,896 | | | $ | 14,719,324 | |
| | |
|
|
| |
|
|
| |
|
|
| |
|
|
| |
|
|
|
Components of Net Assets | | | | | | | | | | | | | | | | | | | | |
Common Stock, at $.001 Par Value | | $ | 18,354 | | | $ | 21,354 | | | $ | 29,152 | | | $ | 15,031 | | | $ | 5,453 | |
Paid-In-Capital in Excess of Par | | | 353,535,645 | | | | 232,637,313 | | | | 271,542,737 | | | | 204,594,183 | | | | 53,130,578 | |
| | |
|
|
| |
|
|
| |
|
|
| |
|
|
| |
|
|
|
| | | | 353,553,999 | | | | 232,658,667 | | | | 271,571,889 | | | | 204,609,214 | | | | 53,136,031 | |
Undistributed Net Investment Income (Loss) | | | (4,295,446 | ) | | | (10,920 | ) | | | (7,774 | ) | | | (8,671 | ) | | | (824 | ) |
Accumulated Net Realized Gain (Loss) on Investments | | | (159,855,799 | ) | | | (126,478,614 | ) | | | (154,219,461 | ) | | | 56,851,883 | | | | (41,418,003 | ) |
Net Unrealized Appreciation (Depreciation) on Investments | | | 56,148,100 | | | | 3,304,741 | | | | 14,507,011 | | | | 30,484,470 | | | | 3,002,120 | |
| | |
|
|
| |
|
|
| |
|
|
| |
|
|
| |
|
|
|
Net Assets | | $ | 245,550,854 | | | $ | 109,473,874 | | | $ | 131,851,665 | | | $ | 291,936,896 | | | $ | 14,719,324 | |
| | |
|
|
| |
|
|
| |
|
|
| |
|
|
| |
|
|
|
(A) Unaffiliated Investments at Cost | | $ | 185,037,751 | | | $ | 104,728,469 | | | $ | 118,143,229 | | | $ | 264,366,474 | | | $ | 11,848,965 | |
| | |
|
|
| |
|
|
| |
|
|
| |
|
|
| |
|
|
|
(B) Affiliated Investments at Cost | | $ | — | | | $ | 2,187,335 | | | $ | 5,792,414 | | | $ | 54,913,704 | | | $ | — | |
| | |
|
|
| |
|
|
| |
|
|
| |
|
|
| |
|
|
|
(C) Foreign Currency at Cost | | $ | 3,631,119 | | | $ | — | | | $ | — | | | $ | — | | | $ | — | |
| | |
|
|
| |
|
|
| |
|
|
| |
|
|
| |
|
|
|
(D) Securities on Loan at Value | | $ | — | | | $ | — | | | $ | 5,615,570 | | | $ | 53,710,418 | | | $ | — | |
| | |
|
|
| |
|
|
| |
|
|
| |
|
|
| |
|
|
|
(E) Affiliated Transfer Agent Fees | | $ | 62,145 | | | $ | 111,785 | | | $ | 158,115 | | | $ | 169,641 | | | $ | 25,257 | |
| | |
|
|
| |
|
|
| |
|
|
| |
|
|
| |
|
|
|
(F) Amount Segregated to Cover Open Futures Contracts | | $ | — | | | $ | — | | | $ | — | | | $ | — | | | $ | — | |
| | |
|
|
| |
|
|
| |
|
|
| |
|
|
| |
|
|
|
See Notes to Financial Statements.
110
| | | | | | | | | | | | | | | | | | | | | | |
| | | | | STRATEGIC PARTNERS INTERNATIONAL GROWTH FUND
| | | STRATEGIC PARTNERS SMALL CAP GROWTH FUND
| | | STRATEGIC PARTNERS MID-CAP GROWTH FUND
| | | STRATEGIC PARTNERS MID CAP VALUE FUND
| | | STRATEGIC PARTNERS TECHNOLOGY FUND
| |
NET ASSET VALUE: | | | | | | | | | | | | | | | | | | | | |
Class A: | | Net Assets | | $ | 15,784,604 | | | $ | 11,807,004 | | | $ | 10,692,453 | | | $ | 20,191,221 | | | $ | 2,319,549 | |
| | | | |
|
|
| |
|
|
| |
|
|
| |
|
|
| |
|
|
|
| | | Shares Outstanding | | | 1,153,575 | | | | 2,236,043 | | | | 2,308,372 | | | | 1,003,565 | | | | 837,448 | |
| | | | |
|
|
| |
|
|
| |
|
|
| |
|
|
| |
|
|
|
| | | Net Asset Value and Redemption Price Per Share | | $ | 13.68 | | | $ | 5.28 | | | $ | 4.63 | | | $ | 20.12 | | | $ | 2.77 | |
| | | | |
|
|
| |
|
|
| |
|
|
| |
|
|
| |
|
|
|
| | | Maximum Sales Charge | | | 5.50 | % | | | 5.50 | % | | | 5.50 | % | | | 5.50 | % | | | 5.50 | % |
| | | | |
|
|
| |
|
|
| |
|
|
| |
|
|
| |
|
|
|
| | | Offering Price Per Share* | | $ | 14.48 | | | $ | 5.59 | | | $ | 4.90 | | | $ | 21.29 | | | $ | 2.93 | |
| | | | |
|
|
| |
|
|
| |
|
|
| |
|
|
| |
|
|
|
Class B: | | Net Assets | | $ | 2,624,939 | | | $ | 7,818,636 | | | $ | 2,110,012 | | | $ | 3,450,440 | | | $ | 311,314 | |
| | | | |
|
|
| |
|
|
| |
|
|
| |
|
|
| |
|
|
|
| | | Shares Outstanding | | | 197,466 | | | | 1,549,522 | | | | 467,661 | | | | 178,957 | | | | 116,990 | |
| | | | |
|
|
| |
|
|
| |
|
|
| |
|
|
| |
|
|
|
| | | Net Asset Value, Offering and Redemption Price Per Share | | $ | 13.29 | | | $ | 5.05 | | | $ | 4.51 | | | $ | 19.28 | | | $ | 2.66 | |
| | | | |
|
|
| |
|
|
| |
|
|
| |
|
|
| |
|
|
|
Class C: | | Net Assets | | $ | 48,316,362 | | | $ | 22,024,141 | | | $ | 22,098,491 | | | $ | 56,013,412 | | | $ | 3,226,616 | |
| | | | |
|
|
| |
|
|
| |
|
|
| |
|
|
| |
|
|
|
| | | Shares Outstanding | | | 3,627,271 | | | | 4,329,591 | | | | 4,925,911 | | | | 2,909,891 | | | | 1,205,170 | |
| | | | |
|
|
| |
|
|
| |
|
|
| |
|
|
| |
|
|
|
| | | Net Asset Value, Offering and Redemption Price Per Share | | $ | 13.32 | | | $ | 5.09 | | | $ | 4.49 | | | $ | 19.25 | | | $ | 2.68 | |
| | | | |
|
|
| |
|
|
| |
|
|
| |
|
|
| |
|
|
|
Class D: | | Net Assets | | $ | — | | | $ | — | | | $ | — | | | $ | — | | | $ | — | |
Class L: | | Net Assets | | $ | 40,802,989 | | | $ | 16,580,337 | | | $ | 24,097,572 | | | $ | 49,081,224 | | | $ | 2,288,111 | |
| | | | |
|
|
| |
|
|
| |
|
|
| |
|
|
| |
|
|
|
| | | Shares Outstanding | | | 2,990,146 | | | | 3,165,659 | | | | 5,240,662 | | | | 2,456,816 | | | | 830,076 | |
| | | | |
|
|
| |
|
|
| |
|
|
| |
|
|
| |
|
|
|
| | | Net Asset Value and Redemption Price Per Share | | $ | 13.65 | | | $ | 5.24 | | | $ | 4.60 | | | $ | 19.98 | | | $ | 2.76 | |
| | | | |
|
|
| |
|
|
| |
|
|
| |
|
|
| |
|
|
|
Class M: | | Net Assets | | $ | 106,492,292 | | | $ | 41,127,514 | | | $ | 60,542,488 | | | $ | 138,363,313 | | | $ | 5,568,571 | |
| | | | |
|
|
| |
|
|
| |
|
|
| |
|
|
| |
|
|
|
| | | Shares Outstanding | | | 8,013,959 | | | | 8,087,623 | | | | 13,465,154 | | | | 7,187,369 | | | | 2,088,472 | |
| | | | |
|
|
| |
|
|
| |
|
|
| |
|
|
| |
|
|
|
| | | Net Asset Value and Redemption Price Per Share | | $ | 13.29 | | | $ | 5.09 | | | $ | 4.50 | | | $ | 19.25 | | | $ | 2.67 | |
| | | | |
|
|
| |
|
|
| |
|
|
| |
|
|
| |
|
|
|
Class X: | | Net Assets | | $ | 31,529,668 | | | $ | 10,116,242 | | | $ | 12,310,649 | | | $ | 24,837,286 | | | $ | 1,005,163 | |
| | | | |
|
|
| |
|
|
| |
|
|
| |
|
|
| |
|
|
|
| | | Shares Outstanding | | | 2,371,403 | | | | 1,985,245 | | | | 2,744,647 | | | | 1,294,047 | | | | 374,571 | |
| | | | |
|
|
| |
|
|
| |
|
|
| |
|
|
| |
|
|
|
| | | Net Asset Value, Offering and Redemption Price Per Share | | $ | 13.30 | | | $ | 5.10 | | | $ | 4.49 | | | $ | 19.19 | | | $ | 2.68 | |
| | | | |
|
|
| |
|
|
| |
|
|
| |
|
|
| |
|
|
|
| * | On sales of $50,000 or more, the offering price of Class A shares is reduced for High Yield Bond Fund. For all other funds with the exception of Money Market Fund the offering price is reduced for $25,000 or more. |
See Notes to Financial Statements.
111
Statements of Assets and Liabilities
OCTOBER 31, 2005
| | | | | | | | | | | | | | | | | | | |
| | | STRATEGIC PARTNERS HEALTH SCIENCES FUND
| | | STRATEGIC PARTNERS MANAGED OTC FUND
| | | STRATEGIC PARTNERS CAPITAL GROWTH FUND
| | | STRATEGIC PARTNERS CONCENTRATED GROWTH FUND
| | | STRATEGIC PARTNERS CORE VALUE FUND
|
ASSETS: | | | | | | | | | | | | | | | | | | | |
Investments at Value: Unaffiliated investments (A) including Securities on Loan (D) | | $ | 21,674,288 | | | $ | 25,287,200 | | | $ | 634,537,030 | | | $ | 296,927,302 | | | $ | 46,733,274 |
Affiliated investments (B) | | | — | | | | — | | | | 140,479,036 | | | | 22,634,620 | | | | — |
Cash (F) | | | 725,583 | | | | 774,541 | | | | — | | | | 571,846 | | | | — |
Receivable for: | | | | | | | | | | | | | | | | | | | |
Securities Sold | | | 150,021 | | | | — | | | | 3,740,005 | | | | 1,461,756 | | | | 334,016 |
Dividends and Interest | | | 28,262 | | | | 4,777 | | | | 382,273 | | | | 37,376 | | | | 47,707 |
Fund Shares Sold | | | 240,252 | | | | 2,408 | | | | 105,032 | | | | 64,000 | | | | 6,463 |
Futures Variation Margin | | | — | | | | 138,320 | | | | — | | | | — | | | | — |
Receivable from Investment Manager | | | 117,861 | | | | — | | | | — | | | | — | | | | 27,257 |
Prepaid Expenses | | | 29,183 | | | | 8,728 | | | | 33,763 | | | | 8,144 | | | | 25,429 |
| | |
|
|
| |
|
|
| |
|
|
| |
|
|
| |
|
|
Total Assets | | | 22,965,450 | | | | 26,215,974 | | | | 779,277,139 | | | | 321,705,044 | | | | 47,174,146 |
| | |
|
|
| |
|
|
| |
|
|
| |
|
|
| |
|
|
LIABILITIES: | | | | | | | | | | | | | | | | | | | |
Payable to Custodian | | | — | | | | — | | | | 215,127 | | | | — | | | | 10,740 |
Payable to Investment Manager | | | — | | | | 138,068 | | | | 556,746 | | | | 107,413 | | | | — |
Payable to Broker for Collateral for Securities on Loan | | | — | | | | — | | | | 140,479,036 | | | | 22,634,620 | | | | — |
Payable for: | | | | | | | | | | | | | | | | | | | |
Securities Purchased | | | 247,469 | | | | — | | | | — | | | | 1,162,578 | | | | 172,869 |
Fund Shares Redeemed | | | 95,535 | | | | 54,593 | | | | 2,269,042 | | | | 848,149 | | | | 59,094 |
Distribution Fees | | | 13,712 | | | | 17,426 | | | | 442,049 | | | | 206,583 | | | | 31,941 |
Deferred Directors’ Fees | | | 562 | | | | 889 | | | | 27,468 | | | | 57,971 | | | | 660 |
Transfer Agents’ Fees (E) | | | 58,640 | | | | 70,034 | | | | 935,068 | | | | 869,184 | | | | 61,436 |
Accrued Expenses and Other Liabilities | | | 88,467 | | | | 47,402 | | | | 252,847 | | | | 100,618 | | | | 66,822 |
| | |
|
|
| |
|
|
| |
|
|
| |
|
|
| |
|
|
Total Liabilities | | | 504,385 | | | | 328,412 | | | | 145,177,383 | | | | 25,987,116 | | | | 403,562 |
| | |
|
|
| |
|
|
| |
|
|
| |
|
|
| |
|
|
Net Assets | | $ | 22,461,065 | | | $ | 25,887,562 | | | $ | 634,099,756 | | | $ | 295,717,928 | | | $ | 46,770,584 |
| | |
|
|
| |
|
|
| |
|
|
| |
|
|
| |
|
|
Components of Net Assets | | | | | | | | | | | | | | | | | | | |
Common Stock, at $.001 Par Value | | $ | 1,822 | | | $ | 9,790 | | | $ | 42,927 | | | $ | 28,495 | | | $ | 3,627 |
Paid-In-Capital in Excess of Par | | | 19,699,858 | | | | 60,535,485 | | | | 622,349,954 | | | | 1,255,166,771 | | | | 36,406,004 |
| | |
|
|
| |
|
|
| |
|
|
| |
|
|
| |
|
|
| | | | 19,701,680 | | | | 60,545,275 | | | | 622,392,881 | | | | 1,255,195,266 | | | | 36,409,631 |
Undistributed Net Investment Income (Loss) | | | (562 | ) | | | (889 | ) | | | (27,468 | ) | | | (57,971 | ) | | | 86,767 |
Accumulated Net Realized Gain (Loss) on Investments | | | 142,260 | | | | (41,425,194 | ) | | | (182,508,600 | ) | | | (994,196,850 | ) | | | 2,713,425 |
Net Unrealized Appreciation (Depreciation) on Investments | | | 2,617,687 | | | | 6,768,370 | | | | 194,242,943 | | | | 34,777,483 | | | | 7,560,761 |
| | |
|
|
| |
|
|
| |
|
|
| |
|
|
| |
|
|
Net Assets | | $ | 22,461,065 | | | $ | 25,887,562 | | | $ | 634,099,756 | | | $ | 295,717,928 | | | $ | 46,770,584 |
| | |
|
|
| |
|
|
| |
|
|
| |
|
|
| |
|
|
(A) Unaffiliated Investments at Cost | | $ | 19,056,242 | | | $ | 18,442,610 | | | $ | 440,297,157 | | | $ | 262,149,819 | | | $ | 39,172,513 |
| | |
|
|
| |
|
|
| |
|
|
| |
|
|
| |
|
|
(B) Affiliated Investments at Cost | | $ | — | | | $ | — | | | $ | 140,479,036 | | | $ | 22,634,620 | | | $ | — |
| | |
|
|
| |
|
|
| |
|
|
| |
|
|
| |
|
|
(C) Foreign Currency at Cost | | $ | — | | | $ | — | | | $ | — | | | $ | — | | | $ | — |
| | |
|
|
| |
|
|
| |
|
|
| |
|
|
| |
|
|
(D) Securities on Loan at Value | | $ | — | | | $ | — | | | $ | 138,269,599 | | | $ | 22,049,818 | | | $ | — |
| | |
|
|
| |
|
|
| |
|
|
| |
|
|
| |
|
|
(E) Affiliated Transfer Agent Fees | | $ | 19,874 | | | $ | 28,376 | | | $ | 412,233 | | | $ | 415,736 | | | $ | 30,852 |
| | |
|
|
| |
|
|
| |
|
|
| |
|
|
| |
|
|
(F) Amount Segregated to Cover Open Futures Contracts | | $ | — | | | $ | — | | | $ | — | | | $ | — | | | $ | — |
| | |
|
|
| |
|
|
| |
|
|
| |
|
|
| |
|
|
See Notes to Financial Statements.
112
| | | | | | | | | | | | | | | | | | | | | | |
| | | | | STRATEGIC PARTNERS HEALTH SCIENCES FUND
| | | STRATEGIC PARTNERS MANAGED OTC FUND
| | | STRATEGIC PARTNERS CAPITAL GROWTH FUND
| | | STRATEGIC
PARTNERS
CONCENTRATED
GROWTH FUND
| | | STRATEGIC
PARTNERS
CORE
VALUE
FUND
| |
NET ASSET VALUE: | | | | | | | | | | | | | | | | | | | | |
Class A: | | Net Assets | | $ | 4,600,967 | | | $ | 1,857,089 | | | $ | 31,084,892 | | | $ | 14,473,881 | | | $ | 3,607,490 | |
| | | | |
|
|
| |
|
|
| |
|
|
| |
|
|
| |
|
|
|
| | | Shares Outstanding | | | 366,168 | | | | 687,358 | | | | 2,034,236 | | | | 1,231,800 | | | | 278,132 | |
| | | | |
|
|
| |
|
|
| |
|
|
| |
|
|
| |
|
|
|
| | | Net Asset Value and Redemption Price Per Share | | $ | 12.57 | | | $ | 2.70 | | | $ | 15.28 | | | $ | 11.75 | | | $ | 12.97 | |
| | | | |
|
|
| |
|
|
| |
|
|
| |
|
|
| |
|
|
|
| | | Maximum Sales Charge | | | 5.50 | % | | | 5.50 | % | | | 5.50 | % | | | 5.50 | % | | | 5.50 | % |
| | | | |
|
|
| |
|
|
| |
|
|
| |
|
|
| |
|
|
|
| | | Offering Price Per Share* | | $ | 13.30 | | | $ | 2.86 | | | $ | 16.17 | | | $ | 12.43 | | | $ | 13.72 | |
| | | | |
|
|
| |
|
|
| |
|
|
| |
|
|
| |
|
|
|
Class B: | | Net Assets | | $ | 835,774 | | | $ | 539,426 | | | $ | 8,075,227 | | | $ | 3,653,985 | | | $ | 982,837 | |
| | | | |
|
|
| |
|
|
| |
|
|
| |
|
|
| |
|
|
|
| | | Shares Outstanding | | | 68,463 | | | | 205,588 | | | | 549,994 | | | | 363,149 | | | | 76,301 | |
| | | | |
|
|
| |
|
|
| |
|
|
| |
|
|
| |
|
|
|
| | | Net Asset Value, Offering and Redemption Price Per Share | | $ | 12.21 | | | $ | 2.62 | | | $ | 14.68 | | | $ | 10.06 | | | $ | 12.88 | |
| | | | |
|
|
| |
|
|
| |
|
|
| |
|
|
| |
|
|
|
Class C: | | Net Assets | | $ | 3,738,224 | | | $ | 7,634,188 | | | $ | 145,904,462 | | | $ | 43,945,815 | | | $ | 10,508,241 | |
| | | | |
|
|
| |
|
|
| |
|
|
| |
|
|
| |
|
|
|
| | | Shares Outstanding | | | 305,627 | | | | 2,908,375 | | | | 9,961,232 | | | | 4,377,844 | | | | 815,874 | |
| | | | |
|
|
| |
|
|
| |
|
|
| |
|
|
| |
|
|
|
| | | Net Asset Value, Offering and Redemption Price Per Share | | $ | 12.23 | | | $ | 2.62 | | | $ | 14.65 | | | $ | 10.04 | | | $ | 12.88 | |
| | | | |
|
|
| |
|
|
| |
|
|
| |
|
|
| |
|
|
|
Class D: | | Net Assets | | $ | — | | | $ | — | | | $ | — | | | $ | — | | | $ | — | |
Class L: | | Net Assets | | $ | 3,016,463 | | | $ | 5,014,460 | | | $ | 104,412,465 | | | $ | 49,291,396 | | | $ | 7,129,772 | |
| | | | |
|
|
| |
|
|
| |
|
|
| |
|
|
| |
|
|
|
| | | Shares Outstanding | | | 241,446 | | | | 1,870,073 | | | | 6,872,957 | | | | 4,215,682 | | | | 551,367 | |
| | | | |
|
|
| |
|
|
| |
|
|
| |
|
|
| |
|
|
|
| | | Net Asset Value and Redemption Price Per Share | | $ | 12.49 | | | $ | 2.68 | | | $ | 15.19 | | | $ | 11.69 | | | $ | 12.93 | |
| | | | |
|
|
| |
|
|
| |
|
|
| |
|
|
| |
|
|
|
Class M: | | Net Assets | | $ | 8,784,998 | | | $ | 9,885,709 | | | $ | 291,460,765 | | | $ | 155,489,671 | | | $ | 20,401,769 | |
| | | | |
|
|
| |
|
|
| |
|
|
| |
|
|
| |
|
|
|
| | | Shares Outstanding | | | 719,592 | | | | 3,754,875 | | | | 19,877,222 | | | | 15,443,957 | | | | 1,584,190 | |
| | | | |
|
|
| |
|
|
| |
|
|
| |
|
|
| |
|
|
|
| | | Net Asset Value and Redemption Price Per Share | | $ | 12.21 | | | $ | 2.63 | | | $ | 14.66 | | | $ | 10.07 | | | $ | 12.88 | |
| | | | |
|
|
| |
|
|
| |
|
|
| |
|
|
| |
|
|
|
Class X: | | Net Assets | | $ | 1,484,639 | | | $ | 956,690 | | | $ | 53,161,945 | | | $ | 28,863,180 | | | $ | 4,140,475 | |
| | | | |
|
|
| |
|
|
| |
|
|
| |
|
|
| |
|
|
|
| | | Shares Outstanding | | | 121,336 | | | | 363,411 | | | | 3,632,049 | | | | 2,863,039 | | | | 321,311 | |
| | | | |
|
|
| |
|
|
| |
|
|
| |
|
|
| |
|
|
|
| | | Net Asset Value, Offering and Redemption Price Per Share | | $ | 12.24 | | | $ | 2.63 | | | $ | 14.64 | | | $ | 10.08 | | | $ | 12.89 | |
| | | | |
|
|
| |
|
|
| |
|
|
| |
|
|
| |
|
|
|
| * | On sales of $50,000 or more, the offering price of Class A shares is reduced for High Yield Bond Fund. For all other funds with the exception of Money Market Fund the offering price is reduced for $25,000 or more. |
See Notes to Financial Statements.
113
Statements of Assets and Liabilities
OCTOBER 31, 2005
| | | | | | | | | | | | | | | | | | | | |
| | | STRATEGIC
PARTNERS
LARGE CAP
CORE FUND
| | | STRATEGIC
PARTNERS
EQUITY INCOME FUND
| | | STRATEGIC
PARTNERS BALANCED FUND
| | | STRATEGIC
PARTNERS
HIGH YIELD
BOND FUND
| | | STRATEGIC
PARTNERS
MONEY MARKET FUND
| |
ASSETS: | | | | | | | | | | | | | | | | | | | | |
Investments at Value: Unaffiliated investments (A) including Securities on Loan (D) | | $ | 146,386,905 | | | $ | 300,888,215 | | | $ | 114,472,741 | | | $ | 108,057,474 | | | $ | 125,682,867 | |
Affiliated investments (B) | | | 11,774,635 | | | | 2,279,573 | | | | — | | | | 10,426,363 | | | | — | |
Cash (F) | | | — | | | | 124,920 | | | | 43,845 | | | | 2,718,427 | | | | 22,879 | |
Foreign currency at value (C) | | | — | | | | — | | | | — | | | | 159,120 | | | | — | |
Receivable for: | | | | | | | | | | | | | | | | | | | | |
Securities Sold | | | 1,166,908 | | | | 1,351,395 | | | | 3,631,870 | | | | 1,079,530 | | | | — | |
Dividends and Interest | | | 145,916 | | | | 346,260 | | | | 373,103 | | | | 2,386,409 | | | | 303,750 | |
Fund Shares Sold | | | 124,954 | | | | 30,273 | | | | 47,022 | | | | 35,278 | | | | 126,620 | |
Futures Variation Margin | | | — | | | | — | | | | 5,050 | | | | — | | | | — | |
Unrealized Appreciation on Foreign Currency Forward Contracts | | | — | | | | — | | | | — | | | | 502,109 | | | | — | |
Receivable from Investment Manager | | | — | | | | — | | | | 40,967 | | | | — | | | | 101,220 | |
Prepaid Expenses | | | 24,632 | | | | 6,004 | | | | 4,735 | | | | 14,637 | | | | 25,667 | |
| | |
|
|
| |
|
|
| |
|
|
| |
|
|
| |
|
|
|
Total Assets | | | 159,623,950 | | | | 305,026,640 | | | | 118,619,333 | | | | 125,379,347 | | | | 126,263,003 | |
| | |
|
|
| |
|
|
| |
|
|
| |
|
|
| |
|
|
|
LIABILITIES: | | | | | | | | | | | | | | | | | | | | |
Payable to Custodian | | | 17,447 | | | | — | | | | — | | | | — | | | | — | |
Payable to Investment Manager | | | 321,779 | | | | 309,757 | | | | — | | | | 137,026 | | | | — | |
Unrealized depreciation on foreign currency forward contracts | | | — | | | | — | | | | — | | | | 24,543 | | | | — | |
Payable to Broker for Collateral for Securities on Loan | | | 11,774,635 | | | | — | | | | — | | | | 10,426,363 | | | | — | |
Payable for: | | | | | | | | | | | | | | | | | | | | |
Securities Purchased | | | — | | | | 240,903 | | | | 9,724,996 | | | | 401,215 | | | | 3,993,716 | |
Fund Shares Redeemed | | | 497,301 | | | | 667,927 | | | | 178,506 | | | | 532,425 | | | | 528,257 | |
Distribution Fees | | | 100,968 | | | | 212,604 | | | | 75,060 | | | | 86,809 | | | | 83,752 | |
Deferred Directors’ Fees | | | 5,743 | | | | 21,110 | | | | 5,358 | | | | 4,577 | | | | 28,110 | |
Transfer Agents’ Fees (E) | | | 169,229 | | | | 516,305 | | | | 149,902 | | | | 213,777 | | | | 254,228 | |
Accrued Expenses and Other Liabilities | | | 263,624 | | | | 254,848 | | | | 131,556 | | | | 84,848 | | | | 127,422 | |
Dividends and Distributions | | | — | | | | — | | | | — | | | | 224,670 | | | | 32,163 | |
| | |
|
|
| |
|
|
| |
|
|
| |
|
|
| |
|
|
|
Total Liabilities | | | 13,150,726 | | | | 2,223,454 | | | | 10,265,378 | | | | 12,136,253 | | | | 5,047,648 | |
| | |
|
|
| |
|
|
| |
|
|
| |
|
|
| |
|
|
|
Net Assets | | $ | 146,473,224 | | | $ | 302,803,186 | | | $ | 108,353,955 | | | $ | 113,243,094 | | | $ | 121,215,355 | |
| | |
|
|
| |
|
|
| |
|
|
| |
|
|
| |
|
|
|
Components of Net Assets | | | | | | | | | | | | | | | | | | | | |
Common Stock, at $.001 Par Value | | $ | 15,792 | | | $ | 22,174 | | | $ | 8,226 | | | $ | 16,008 | | | $ | 121,263 | |
Paid-In-Capital in Excess of Par | | | 155,594,585 | | | | 315,895,533 | | | | 106,704,420 | | | | 146,665,534 | | | | 121,136,508 | |
| | |
|
|
| |
|
|
| |
|
|
| |
|
|
| |
|
|
|
| | | | 155,610,377 | | | | 315,917,707 | | | | 106,712,646 | | | | 146,681,542 | | | | 121,257,771 | |
Undistributed Net Investment Income (Loss) | | | 327,379 | | | | 16,721 | | | | 230,192 | | | | 244,493 | | | | (26,953 | ) |
Accumulated Net Realized Gain (Loss) on Investments | | | (33,660,556 | ) | | | (46,677,649 | ) | | | (5,794,254 | ) | | | (34,078,773 | ) | | | (15,463 | ) |
Net Unrealized Appreciation (Depreciation) on Investments | | | 24,196,024 | | | | 33,546,407 | | | | 7,205,371 | | | | 395,832 | | | | — | |
| | |
|
|
| |
|
|
| |
|
|
| |
|
|
| |
|
|
|
Net Assets | | $ | 146,473,224 | | | $ | 302,803,186 | | | $ | 108,353,955 | | | $ | 113,243,094 | | | $ | 121,215,355 | |
| | |
|
|
| |
|
|
| |
|
|
| |
|
|
| |
|
|
|
(A) Unaffiliated Investments at Cost | | $ | 122,190,655 | | | $ | 267,341,808 | | | $ | 107,258,311 | | | $ | 108,136,880 | | | $ | 125,682,867 | |
| | |
|
|
| |
|
|
| |
|
|
| |
|
|
| |
|
|
|
(B) Affiliated Investments at Cost | | $ | 11,774,635 | | | $ | 2,279,573 | | | $ | — | | | $ | 10,426,363 | | | $ | — | |
| | |
|
|
| |
|
|
| |
|
|
| |
|
|
| |
|
|
|
(C) Foreign Currency at Cost | | $ | — | | | $ | — | | | $ | — | | | $ | 159,351 | | | $ | — | |
| | |
|
|
| |
|
|
| |
|
|
| |
|
|
| |
|
|
|
(D) Securities on Loan at Value | | $ | 11,506,805 | | | $ | — | | | $ | — | | | $ | 10,295,907 | | | $ | — | |
| | |
|
|
| |
|
|
| |
|
|
| |
|
|
| |
|
|
|
(E) Affiliated Transfer Agent Fees | | $ | 94,230 | | | $ | 165,861 | | | $ | 62,145 | | | $ | 71,418 | | | $ | 82,977 | |
| | |
|
|
| |
|
|
| |
|
|
| |
|
|
| |
|
|
|
(F) Amount Segregated to Cover Open Futures Contracts | | $ | — | | | $ | — | | | $ | 32,000 | | | $ | — | | | $ | — | |
| | |
|
|
| |
|
|
| |
|
|
| |
|
|
| |
|
|
|
See Notes to Financial Statements.
114
| | | | | | | | | | | | | | | | | | | | | |
| | | | | STRATEGIC
PARTNERS
LARGE CAP
CORE FUND
| | | STRATEGIC
PARTNERS
EQUITY
INCOME
FUND
| | | STRATEGIC
PARTNERS
BALANCED
FUND
| | | STRATEGIC
PARTNERS
HIGH YIELD
BOND FUND
| | | STRATEGIC
PARTNERS
MONEY
MARKET
FUND
|
NET ASSET VALUE: | | | | | | | | | | | | | | | | | | | |
Class A: | | Net Assets | | $ | 12,526,834 | | | $ | 14,835,103 | | | $ | 9,099,203 | | | $ | 6,638,896 | | | $ | 32,721 |
| | | | |
|
|
| |
|
|
| |
|
|
| |
|
|
| |
|
|
| | | Shares Outstanding | | | 1,314,093 | | | | 1,060,569 | | | | 688,886 | | | | 937,117 | | | | 32,722 |
| | | | |
|
|
| |
|
|
| |
|
|
| |
|
|
| |
|
|
| | | Net Asset Value and Redemption Price Per Share | | $ | 9.53 | | | $ | 13.99 | | | $ | 13.21 | | | $ | 7.08 | | | $ | 1.00 |
| | | | |
|
|
| |
|
|
| |
|
|
| |
|
|
| |
|
|
| | | Maximum Sales Charge | | | 5.50 | % | | | 5.50 | % | | | 5.50 | % | | | 4.50 | % | | | — |
| | | | |
|
|
| |
|
|
| |
|
|
| |
|
|
| |
|
|
| | | Offering Price Per Share* | | $ | 10.08 | | | $ | 14.80 | | | $ | 13.98 | | | $ | 7.41 | | | $ | — |
| | | | |
|
|
| |
|
|
| |
|
|
| |
|
|
| |
|
|
Class B: | | Net Assets | | $ | 3,143,827 | | | $ | 3,063,302 | | | $ | 2,145,222 | | | $ | 1,700,906 | | | $ | — |
| | | | |
|
|
| |
|
|
| |
|
|
| |
|
|
| |
|
|
| | | Shares Outstanding | | | 340,785 | | | | 225,305 | | | | 162,886 | | | | 240,233 | | | | — |
| | | | |
|
|
| |
|
|
| |
|
|
| |
|
|
| |
|
|
| | | Net Asset Value, Offering and Redemption Price Per Share | | $ | 9.23 | | | $ | 13.60 | | | $ | 13.17 | | | $ | 7.08 | | | $ | — |
| | | | |
|
|
| |
|
|
| |
|
|
| |
|
|
| |
|
|
Class C: | | Net Assets | | $ | 26,905,040 | | | $ | 54,187,311 | | | $ | 13,850,206 | | | $ | 14,195,879 | | | $ | 12,339,203 |
| | | | |
|
|
| |
|
|
| |
|
|
| |
|
|
| |
|
|
| | | Shares Outstanding | | | 2,920,659 | | | | 3,993,150 | | | | 1,052,452 | | | | 2,006,438 | | | | 12,346,013 |
| | | | |
|
|
| |
|
|
| |
|
|
| |
|
|
| |
|
|
| | | Net Asset Value, Offering and Redemption Price Per Share | | $ | 9.21 | | | $ | 13.57 | | | $ | 13.16 | | | $ | 7.08 | | | $ | 1.00 |
| | | | |
|
|
| |
|
|
| |
|
|
| |
|
|
| |
|
|
Class D: | | Net Assets | | $ | — | | | $ | — | | | $ | — | | | $ | — | | | $ | 13,015,074 |
| | | | |
|
|
| |
|
|
| |
|
|
| |
|
|
| |
|
|
| | | Shares Outstanding | | | — | | | | — | | | | — | | | | — | | | | 13,019,798 |
| | | | |
|
|
| |
|
|
| |
|
|
| |
|
|
| |
|
|
| | | Net Asset Value, Offering and Redemption Price Per Share | | $ | — | | | $ | — | | | $ | — | | | $ | — | | | $ | 1.00 |
| | | | |
|
|
| |
|
|
| |
|
|
| |
|
|
| |
|
|
Class L: | | Net Assets | | $ | 20,527,974 | | | $ | 46,285,263 | | | $ | 15,293,492 | | | $ | 12,139,061 | | | $ | 21,170,358 |
| | | | |
|
|
| |
|
|
| |
|
|
| |
|
|
| |
|
|
| | | Shares Outstanding | | | 2,165,040 | | | | 3,323,617 | | | | 1,159,043 | | | | 1,714,616 | | | | 21,180,311 |
| | | | |
|
|
| |
|
|
| |
|
|
| |
|
|
| |
|
|
| | | Net Asset Value and Redemption Price Per Share | | $ | 9.48 | | | $ | 13.93 | | | $ | 13.19 | | | $ | 7.08 | | | $ | 1.00 |
| | | | |
|
|
| |
|
|
| |
|
|
| |
|
|
| |
|
|
Class M: | | Net Assets | | $ | 74,648,705 | | | $ | 143,413,711 | | | $ | 55,083,927 | | | $ | 67,863,020 | | | $ | 60,896,438 |
| | | | |
|
|
| |
|
|
| |
|
|
| |
|
|
| |
|
|
| | | Shares Outstanding | | | 8,103,194 | | | | 10,548,267 | | | | 4,183,935 | | | | 9,595,355 | | | | 60,916,498 |
| | | | |
|
|
| |
|
|
| |
|
|
| |
|
|
| |
|
|
| | | Net Asset Value and Redemption Price Per Share | | $ | 9.21 | | | $ | 13.60 | | | $ | 13.17 | | | $ | 7.07 | | | $ | 1.00 |
| | | | |
|
|
| |
|
|
| |
|
|
| |
|
|
| |
|
|
Class X: | | Net Assets | | $ | 8,720,844 | | | $ | 41,018,496 | | | $ | 12,881,905 | | | $ | 10,705,332 | | | $ | 13,761,561 |
| | | | |
|
|
| |
|
|
| |
|
|
| |
|
|
| |
|
|
| | | Shares Outstanding | | | 948,228 | | | | 3,022,869 | | | | 979,124 | | | | 1,514,505 | | | | 13,765,837 |
| | | | |
|
|
| |
|
|
| |
|
|
| |
|
|
| |
|
|
| | | Net Asset Value, Offering and Redemption Price Per Share | | $ | 9.20 | | | $ | 13.57 | | | $ | 13.16 | | | $ | 7.07 | | | $ | 1.00 |
| | | | |
|
|
| |
|
|
| |
|
|
| |
|
|
| |
|
|
| * | On sales of $50,000 or more, the offering price of Class A shares is reduced for High Yield Bond Fund. For all other funds with the exception of Money Market Fund the offering price is reduced for $25,000 or more. |
See Notes to Financial Statements.
115
Statement of Operations
YEAR ENDED OCTOBER 31, 2005
| | | | | | | | | | | | | | | | | | | | |
| | | STRATEGIC
PARTNERS
INTERNATIONAL
GROWTH FUND
| | | STRATEGIC
PARTNERS
SMALL CAP
GROWTH FUND
| | | STRATEGIC
PARTNERS
MID-CAP
GROWTH FUND
| | | STRATEGIC
PARTNERS
MID CAP
VALUE FUND
| | | STRATEGIC
PARTNERS
TECHNOLOGY FUND
| |
INVESTMENT INCOME | | | | | | | | | | | | | | | | | | | | |
Interest | | $ | 58,845 | | | $ | 4,809 | | | $ | 13,181 | | | $ | — | | | $ | 765 | |
Unaffiliated dividend income | | | 4,915,826 | | | | 172,826 | | | | 699,301 | | | | 4,196,914 | | | | 167,801 | |
Affiliated dividend income | | | — | | | | 148 | | | | — | | | | — | | | | — | |
Unaffiliated Income from Securities Loaned, Net | | | — | | | | 14,395 | | | | 30,905 | | | | 54,495 | | | | 3,572 | |
Affiliated Income from Securities Loaned, Net | | | — | | | | 1,317 | | | | 1,015 | | | | 17,117 | | | | — | |
Foreign Taxes Withheld | | | (569,625 | ) | | | (516 | ) | | | — | | | | (1,093 | ) | | | (6,928 | ) |
| | |
|
|
| |
|
|
| |
|
|
| |
|
|
| |
|
|
|
Total Income | | | 4,405,046 | | | | 192,979 | | | | 744,402 | | | | 4,267,433 | | | | 165,210 | |
| | |
|
|
| |
|
|
| |
|
|
| |
|
|
| |
|
|
|
EXPENSES | | | | | | | | | | | | | | | | | | | | |
Advisory Fees | | | 2,694,795 | | | | 402,568 | | | | 1,504,224 | | | | 2,890,236 | | | | 181,946 | |
Distribution Fees — Class A | | | 36,807 | | | | 7,938 | | | | 27,081 | | | | 47,317 | | | | 5,627 | |
Distribution Fees — Class B | | | 20,364 | | | | 5,914 | | | | 16,862 | | | | 26,926 | | | | 2,621 | |
Distribution Fees — Class C | | | 525,145 | | | | 76,531 | | | | 253,893 | | | | 596,506 | | | | 42,614 | |
Distribution Fees — Class L | | | 255,324 | | | | 46,874 | | | | 160,746 | | | | 310,912 | | | | 17,161 | |
Distribution Fees — Class M | | | 1,154,431 | | | | 181,169 | | | | 699,007 | | | | 1,503,063 | | | | 67,257 | |
Distribution Fees — Class X | | | 336,976 | | | | 34,639 | | | | 139,954 | | | | 273,787 | | | | 12,623 | |
Transfer Agent’s Fees and Expenses (A) | | | 1,550,000 | | | | 375,000 | | | | 1,118,000 | | | | 1,234,000 | | | | 194,000 | |
Accounting Fees | | | 133,000 | | | | 49,000 | | | | 103,000 | | | | 145,000 | | | | 51,000 | |
Custodian Fees and Expenses | | | 193,000 | | | | 22,000 | | | | 12,000 | | | | 9,000 | | | | 10,000 | |
Audit and Legal Fees | | | 38,000 | | | | 29,000 | | | | 50,000 | | | | 47,000 | | | | 27,000 | |
Directors’ Fees | | | 16,000 | | | | 16,000 | | | | 10,000 | | | | 16,000 | | | | 12,000 | |
Registration Fees | | | 142,000 | | | | 47,000 | | | | 56,000 | | | | 66,000 | | | | 48,000 | |
Interest Expense | | | 2,132 | | | | 167 | | | | 10,102 | | | | 492 | | | | 1,550 | |
Reports to Shareholders | | | 71,000 | | | | 44,000 | | | | 150,000 | | | | 70,000 | | | | 8,000 | |
Miscellaneous | | | 59,737 | | | | 54,010 | | | | 25,030 | | | | 25,747 | | | | 16,744 | |
| | |
|
|
| |
|
|
| |
|
|
| |
|
|
| |
|
|
|
Total Expenses | | | 7,228,711 | | | | 1,391,810 | | | | 4,335,899 | | | | 7,261,986 | | | | 698,143 | |
Less: Advisory Fee Waivers and Expense Reimbursements | | | (585,225 | ) | | | (445,161 | ) | | | (879,343 | ) | | | (155,625 | ) | | | (294,607 | ) |
| | |
|
|
| |
|
|
| |
|
|
| |
|
|
| |
|
|
|
Net Expenses | | | 6,643,486 | | | | 946,649 | | | | 3,456,556 | | | | 7,106,361 | | | | 403,536 | |
| | |
|
|
| |
|
|
| |
|
|
| |
|
|
| |
|
|
|
Net Investment Income (Loss) | | | (2,238,440 | ) | | | (753,670 | ) | | | (2,712,154 | ) | | | (2,838,928 | ) | | | (238,326 | ) |
| | |
|
|
| |
|
|
| �� |
|
|
| |
|
|
| |
|
|
|
REALIZED AND UNREALIZED GAIN (LOSS) ON INVESTMENTS | | | | | | | | | | | | | | | | | | | | |
Net Realized Gain (Loss) on: | | | | | | | | | | | | | | | | | | | | |
Investments | | | 48,332,898 | | | | 3,055,991 | | | | 30,683,083 | | | | 68,941,489 | | | | 1,240,656 | |
Foreign currencies | | | (869,641 | ) | | | — | | | | — | | | | — | | | | 1 | |
Futures | | | — | | | | 59,793 | | | | — | | | | — | | | | — | |
| | |
|
|
| |
|
|
| |
|
|
| |
|
|
| |
|
|
|
| | | | 47,463,257 | | | | 3,115,784 | | | | 30,683,083 | | | | 68,941,489 | | | | 1,240,657 | |
| | |
|
|
| |
|
|
| |
|
|
| |
|
|
| |
|
|
|
Net Change in Unrealized Appreciation (Depreciation) on: | | | | | | | | | | | | | | | | | | | | |
Investments | | | (4,497,227 | ) | | | 322,190 | | | | (16,087,988 | ) | | | (17,963,024 | ) | | | (347,908 | ) |
Foreign currencies | | | (217,216 | ) | | | — | | | | — | | | | — | | | | — | |
Futures | | | — | | | | 3,948 | | | | — | | | | — | | | | — | |
| | |
|
|
| |
|
|
| |
|
|
| |
|
|
| |
|
|
|
| | | | (4,714,443 | ) | | | 326,138 | | | | (16,087,988 | ) | | | (17,963,024 | ) | | | (347,908 | ) |
| | |
|
|
| |
|
|
| |
|
|
| |
|
|
| |
|
|
|
Net Gain on Investments and Foreign Currencies | | | 42,748,814 | | | | 3,441,922 | | | | 14,595,095 | | | | 50,978,465 | | | | 892,749 | |
| | |
|
|
| |
|
|
| |
|
|
| |
|
|
| |
|
|
|
Net Increase in Net Assets Resulting from Operations | | $ | 40,510,374 | | | $ | 2,688,252 | | | $ | 11,882,941 | | | $ | 48,139,537 | | | $ | 654,423 | |
| | |
|
|
| |
|
|
| |
|
|
| |
|
|
| |
|
|
|
(A) Affiliated Transfer Agent’s Fees and Expenses | | $ | 200,000 | | | $ | 221,000 | | | $ | 511,000 | | | $ | 565,000 | | | $ | 83,000 | |
| | |
|
|
| |
|
|
| |
|
|
| |
|
|
| |
|
|
|
See Notes to Financial Statements.
116
| | | | | | | | | | | | | | | | | | | | |
| | | STRATEGIC
PARTNERS
HEALTH
SCIENCES
FUND
| | | STRATEGIC
PARTNERS
MANAGED
OTC FUND
| | | STRATEGIC
PARTNERS
CAPITAL
GROWTH
FUND
| | | STRATEGIC
PARTNERS
CONCENTRATED
GROWTH FUND
| | | STRATEGIC
PARTNERS
CORE
VALUE
FUND
| |
INVESTMENT INCOME | | | | | | | | | | | | | | | | | | | | |
Interest | | $ | 7,124 | | | $ | 550 | | | $ | — | | | $ | 22,305 | | | $ | — | |
Unaffiliated dividend income | | | 192,030 | | | | 496,680 | | | | 6,742,756 | | | | 5,470,932 | | | | 1,192,563 | |
Unaffiliated Income from Securities Loaned, Net | | | 2,423 | | | | 8,031 | | | | 49,910 | | | | 33,725 | | | | 5,145 | |
Affiliated Income from Securities Loaned, Net | | | — | | | | — | | | | 17,828 | | | | 1,060 | | | | — | |
Foreign Taxes Withheld | | | (6,493 | ) | | | (738 | ) | | | (209,482 | ) | | | (385 | ) | | | (2,911 | ) |
| | |
|
|
| |
|
|
| |
|
|
| |
|
|
| |
|
|
|
Total Income | | | 195,084 | | | | 504,523 | | | | 6,601,012 | | | | 5,527,637 | | | | 1,194,797 | |
| | |
|
|
| |
|
|
| |
|
|
| |
|
|
| |
|
|
|
EXPENSES | | | | | | | | | | | | | | | | | | | | |
Advisory Fees | | | 208,851 | | | | 274,382 | | | | 6,641,656 | | | | 3,390,830 | | | | 423,511 | |
Distribution Fees — Class A | | | 6,960 | | | | 4,403 | | | | 68,968 | | | | 32,417 | | | | 7,156 | |
Distribution Fees — Class B | | | 4,468 | | | | 6,251 | | | | 60,518 | | | | 27,919 | | | | 7,025 | |
Distribution Fees — Class C | | | 39,758 | | | | 96,122 | | | | 1,620,082 | | | | 519,108 | | | | 113,192 | |
Distribution Fees — Class L | | | 17,985 | | | | 31,121 | | | | 628,992 | | | | 298,598 | | | | 40,135 | |
Distribution Fees — Class M | | | 85,503 | | | | 127,030 | | | | 3,218,507 | | | | 1,863,909 | | | | 222,138 | |
Distribution Fees — Class X | | | 15,313 | | | | 13,544 | | | | 576,608 | | | | 331,237 | | | | 47,000 | |
Transfer Agent’s Fees and Expenses (A) | | | 164,000 | | | | 128,000 | | | | 2,610,000 | | | | 2,662,000 | | | | 198,000 | |
Accounting Fees | | | 51,000 | | | | 48,000 | | | | 137,000 | | | | 149,000 | | | | 52,000 | |
Custodian Fees and Expenses | | | 30,000 | | | | 18,000 | | | | 10,000 | | | | 20,000 | | | | 5,000 | |
Audit and Legal Fees | | | 49,000 | | | | 27,000 | | | | 51,000 | | | | 38,000 | | | | 25,000 | |
Directors’ Fees | | | 9,000 | | | | 14,000 | | | | 21,000 | | | | 9,000 | | | | 13,000 | |
Registration Fees | | | 46,000 | | | | 49,000 | | | | 154,000 | | | | 52,000 | | | | 56,000 | |
Interest Expense | | | — | | | | 202 | | | | 3,836 | | | | 7,768 | | | | — | |
Reports to Shareholders | | | 11,000 | | | | 28,000 | | | | 310,000 | | | | 200,000 | | | | 30,000 | |
Miscellaneous | | | 36,435 | | | | 10,614 | | | | 47,516 | | | | 37,342 | | | | 20,572 | |
| | |
|
|
| |
|
|
| |
|
|
| |
|
|
| |
|
|
|
Total Expenses | | | 775,273 | | | | 875,669 | | | | 16,159,683 | | | | 9,639,128 | | | | 1,259,729 | |
Less: Advisory Fee Waivers and Expense Reimbursements | | | (312,894 | ) | | | (193,613 | ) | | | (870,368 | ) | | | (2,221,134 | ) | | | (225,035 | ) |
| | |
|
|
| |
|
|
| |
|
|
| |
|
|
| |
|
|
|
Net Expenses | | | 462,379 | | | | 682,056 | | | | 15,289,315 | | | | 7,417,994 | | | | 1,034,694 | |
| | |
|
|
| |
|
|
| |
|
|
| |
|
|
| |
|
|
|
Net Investment Income (Loss) | | | (267,295 | ) | | | (177,533 | ) | | | (8,688,303 | ) | | | (1,890,357 | ) | | | 160,103 | |
| | |
|
|
| |
|
|
| |
|
|
| |
|
|
| |
|
|
|
REALIZED AND UNREALIZED GAIN (LOSS) ON INVESTMENTS | | | | | | | | | | | | | | | | | | | | |
Net Realized Gain (Loss) on: | | | | | | | | | | | | | | | | | | | | |
Investments | | | 1,103,808 | | | | 1,092,460 | | | | 81,586,136 | | | | 20,098,023 | | | | 2,714,388 | |
Futures | | | — | | | | 1,163,310 | | | | — | | | | — | | | | — | |
Options written | | | 2,934 | | | | — | | | | — | | | | — | | | | — | |
Foreign currencies | | | (44,423 | ) | | | — | | | | (3,112 | ) | | | — | | | | — | |
| | |
|
|
| |
|
|
| |
|
|
| |
|
|
| |
|
|
|
| | | | 1,062,319 | | | | 2,255,770 | | | | 81,583,024 | | | | 20,098,023 | | | | 2,714,388 | |
| | |
|
|
| |
|
|
| |
|
|
| |
|
|
| |
|
|
|
Net Change in Unrealized Appreciation (Depreciation) on: | | | | | | | | | | | | | | | | | | | | |
Investments | | | 1,576,905 | | | | 366,141 | | | | 14,544,064 | | | | (2,730,609 | ) | | | 1,139,409 | |
Futures | | | — | | | | (801,412 | ) | | | — | | | | — | | | | — | |
Foreign currencies | | | (359 | ) | | | — | | | | (716 | ) | | | — | | | | — | |
| | |
|
|
| |
|
|
| |
|
|
| |
|
|
| |
|
|
|
| | | | 1,576,546 | | | | (435,271 | ) | | | 14,543,348 | | | | (2,730,609 | ) | | | 1,139,409 | |
| | |
|
|
| |
|
|
| |
|
|
| |
|
|
| |
|
|
|
Net Gain on Investments and Foreign Currencies | | | 2,638,865 | | | | 1,820,499 | | | | 96,126,372 | | | | 17,367,414 | | | | 3,853,797 | |
| | |
|
|
| |
|
|
| |
|
|
| |
|
|
| |
|
|
|
Net Increase in Net Assets Resulting from Operations | | $ | 2,371,570 | | | $ | 1,642,966 | | | $ | 87,438,069 | | | $ | 15,477,057 | | | $ | 4,013,900 | |
| | |
|
|
| |
|
|
| |
|
|
| |
|
|
| |
|
|
|
(A) Affiliated Transfer Agent’s Fees and Expenses | | $ | 61,000 | | | $ | 95,000 | | | $ | 1,362,000 | | | $ | 1,378,000 | | | $ | 97,000 | |
| | |
|
|
| |
|
|
| |
|
|
| |
|
|
| |
|
|
|
See Notes to Financial Statements.
117
Statement of Operations
YEAR ENDED OCTOBER 31, 2005
| | | | | | | | | | | | | | | | | | | | |
| | | STRATEGIC
PARTNERS
LARGE CAP
CORE
FUND
| | | STRATEGIC
PARTNERS
EQUITY
INCOME
FUND
| | | STRATEGIC
PARTNERS
BALANCED
FUND
| | | STRATEGIC
PARTNERS
HIGH YIELD
BOND FUND
| | | STRATEGIC
PARTNERS
MONEY
MARKET
FUND
| |
INVESTMENT INCOME | | | | | | | | | | | | | | | | | | | | |
Interest | | $ | 109 | | | $ | 5,664 | | | $ | 2,051,016 | | | $ | 12,559,635 | | | $ | 3,984,991 | |
Unaffiliated dividend income | | | 3,086,590 | | | | 5,066,991 | | | | 1,307,803 | | | | 136,999 | | | | 931 | |
Affiliated dividend income | | | — | | | | 174 | | | | — | | | | — | | | | — | |
Unaffiliated Income from Securities Loaned, Net | | | 13,667 | | | | 1,984 | | | | 9,519 | | | | — | | | | — | |
Affiliated Income from Securities Loaned, Net | | | 1,139 | | | | 60 | | | | — | | | | 9,469 | | | | — | |
Foreign Taxes Withheld | | | (2,174 | ) | | | (1,136 | ) | | | (862 | ) | | | — | | | | — | |
| | |
|
|
| |
|
|
| |
|
|
| |
|
|
| |
|
|
|
Total Income | | | 3,099,331 | | | | 5,073,737 | | | | 3,367,476 | | | | 12,706,103 | | | | 3,985,922 | |
| | |
|
|
| |
|
|
| |
|
|
| |
|
|
| |
|
|
|
EXPENSES | | | | | | | | | | | | | | | | | | | | |
Advisory Fees | | | 1,158,654 | | | | 2,137,122 | | | | 1,056,712 | | | | 1,036,279 | | | | 706,913 | |
Distribution Fees — Class A | | | 25,914 | | | | 29,706 | | | | 17,670 | | | | 21,590 | | | | 15 | |
Distribution Fees — Class B | | | 22,962 | | | | 18,794 | | | | 16,479 | | | | 11,679 | | | | — | |
Distribution Fees — Class C | | | 276,794 | | | | 404,192 | | | | 163,872 | | | | 204,787 | | | | 160,982 | |
Distribution Fees — Class D | | | — | | | | — | | | | — | | | | — | | | | 74,098 | |
Distribution Fees — Class L | | | 105,443 | | | | 183,557 | | | | 96,953 | | | | 86,164 | | | | 152,692 | |
Distribution Fees — Class M | | | 758,257 | | | | 1,035,037 | | | | 630,655 | | | | 878,120 | | | | 656,803 | |
Distribution Fees — Class X | | | 75,761 | | | | 271,760 | | | | 145,956 | | | | 127,125 | | | | 141,003 | |
Transfer Agent’s Fees and Expenses (A) | | | 508,000 | | | | 951,000 | | | | 446,000 | | | | 482,000 | | | | 752,000 | |
Accounting Fees | | | 58,000 | | | | 125,000 | | | | 89,000 | | | | 102,000 | | | | 47,000 | |
Custodian Fees and Expenses | | | 1,000 | | | | 9,000 | | | | 60,000 | | | | 7,000 | | | | 26,000 | |
Audit and Legal Fees | | | 34,000 | | | | 46,000 | | | | 68,000 | | | | 49,000 | | | | 40,000 | |
Directors’ Fees | | | 12,000 | | | | 17,000 | | | | 12,000 | | | | 13,000 | | | | 13,000 | |
Registration Fees | | | 74,000 | | | | 57,000 | | | | 52,000 | | | | 61,000 | | | | 89,000 | |
Interest Expense | | | 13,778 | | | | 24,074 | | | | 823 | | | | 10,767 | | | | — | |
Reports to Shareholders | | | 107,000 | | | | 120,000 | | | | 30,000 | | | | 68,000 | | | | 85,000 | |
Merger Expense | | | 235,339 | | | | — | | | | — | | | | — | | | | — | |
Miscellaneous | | | 44,239 | | | | 26,934 | | | | 45,244 | | | | 38,076 | | | | 18,468 | |
| | |
|
|
| |
|
|
| |
|
|
| |
|
|
| |
|
|
|
Total Expenses | | | 3,511,141 | | | | 5,456,176 | | | | 2,931,364 | | | | 3,196,587 | | | | 2,962,974 | |
Less: Advisory Fee Waivers and Expense Reimbursements | | | (792,728 | ) | | | (947,647 | ) | | | (452,570 | ) | | | (383,881 | ) | | | (369,810 | ) |
| | |
|
|
| |
|
|
| |
|
|
| |
|
|
| |
|
|
|
Net Expenses | | | 2,718,413 | | | | 4,508,529 | | | | 2,478,794 | | | | 2,812,706 | | | | 2,593,164 | |
| | |
|
|
| |
|
|
| |
|
|
| |
|
|
| |
|
|
|
Net Investment Income | | | 380,918 | | | | 565,208 | | | | 888,682 | | | | 9,893,397 | | | | 1,392,758 | |
| | |
|
|
| |
|
|
| |
|
|
| |
|
|
| |
|
|
|
REALIZED AND UNREALIZED GAIN (LOSS) ON INVESTMENTS | | | | | | | | | | | | | | | | | | | | |
Net Realized Gain (Loss) on: | | | | | | | | | | | | | | | | | | | | |
Investments | | | 5,807,707 | | | | 31,382,759 | | | | 9,643,899 | | | | 3,056,176 | | | | (15,463 | ) |
Futures | | | — | | | | — | | | | 29,669 | | | | — | | | | — | |
Foreign currencies | | | 690 | | | | — | | | | 47,864 | | | | 158,149 | | | | — | |
| | |
|
|
| |
|
|
| |
|
|
| |
|
|
| |
|
|
|
| | | | 5,808,397 | | | | 31,382,759 | | | | 9,721,432 | | | | 3,214,325 | | | | (15,463 | ) |
| | |
|
|
| |
|
|
| |
|
|
| |
|
|
| |
|
|
|
Net Change in Unrealized Appreciation (Depreciation) on: | | | | | | | | | | | | | | | | | | | | |
Investments | | | 2,995,650 | | | | (10,895,123 | ) | | | (3,410,854 | ) | | | (11,890,189 | ) | | | — | |
Futures | | | — | | | | — | | | | (11,763 | ) | | | — | | | | — | |
Foreign currencies | | | (226 | ) | | | — | | | | 16 | | | | 1,045,053 | | | | — | |
| | |
|
|
| |
|
|
| |
|
|
| |
|
|
| |
|
|
|
| | | | 2,995,424 | | | | (10,895,123 | ) | | | (3,422,601 | ) | | | (10,845,136 | ) | | | — | |
| | |
|
|
| |
|
|
| |
|
|
| |
|
|
| |
|
|
|
Net Gain (Loss) on Investments and Foreign Currencies | | | 8,803,821 | | | | 20,487,636 | | | | 6,298,831 | | | | (7,630,811 | ) | | | (15,463 | ) |
| | |
|
|
| |
|
|
| |
|
|
| |
|
|
| |
|
|
|
Net Increase in Net Assets Resulting from Operations | | $ | 9,184,739 | | | $ | 21,052,844 | | | $ | 7,187,513 | | | $ | 2,262,586 | | | $ | 1,377,295 | |
| | |
|
|
| |
|
|
| |
|
|
| |
|
|
| |
|
|
|
(A) Affiliated Transfer Agent’s Fees and Expenses | | $ | 255,000 | | | $ | 468,000 | | | $ | 201,000 | | | $ | 235,000 | | | $ | 277,000 | |
| | |
|
|
| |
|
|
| |
|
|
| |
|
|
| |
|
|
|
See Notes to Financial Statements.
118
This Page Intentionally Left Blank
119
Statements of Changes in Net Assets
| | | | | | | | | | | | | | | | |
| | | STRATEGIC PARTNERS
INTERNATIONAL GROWTH
FUND
| | | STRATEGIC PARTNERS
SMALL CAP GROWTH FUND
| |
| | | Year Ended
October 31,
2005
| | | Year Ended
October 31,
2004
| | | Year Ended
October 31,
2005
| | | Year Ended
October 31,
2004
| |
OPERATIONS: | | | | | | | | | | | | | | | | |
Net Investment Income (Loss) | | $ | (2,238,440 | ) | | $ | (2,713,279 | ) | | $ | (753,670 | ) | | $ | (973,411 | ) |
Net Realized Gain (Loss) on Investments and Foreign Currencies | | | 47,463,257 | | | | 28,047,074 | | | | 3,115,784 | | | | 7,949,886 | |
Net Change in Unrealized Appreciation (Depreciation) on Investments and Foreign Currencies | | | (4,714,443 | ) | | | (420,169 | ) | | | 326,138 | | | | (6,757,437 | ) |
| | |
|
|
| |
|
|
| |
|
|
| |
|
|
|
Net Increase (Decrease) in Net Assets Resulting from Operations | | | 40,510,374 | | | | 24,913,626 | | | | 2,688,252 | | | | 219,038 | |
| | |
|
|
| |
|
|
| |
|
|
| |
|
|
|
DIVIDENDS AND DISTRIBUTIONS: | | | | | | | | | | | | | | | | |
Dividends from Net Investment Income: | | | | | | | | | | | | | | | | |
Class A | | | (159,915 | ) | | | (7,675 | ) | | | — | | | | — | |
Class B | | | (6,278 | ) | | | — | | | | — | | | | — | |
Class C | | | (248,656 | ) | | | — | | | | — | | | | — | |
Class D | | | — | | | | — | | | | — | | | | — | |
Class L | | | (588,340 | ) | | | (91,348 | ) | | | — | | | | — | |
Class M | | | (538,340 | ) | | | — | | | | — | | | | — | |
Class X | | | (156,884 | ) | | | — | | | | — | | | | — | |
| | |
|
|
| |
|
|
| |
|
|
| |
|
|
|
Total Dividends | | | (1,698,413 | ) | | | (99,023 | ) | | | — | | | | — | |
| | |
|
|
| |
|
|
| |
|
|
| |
|
|
|
Distributions from Net Realized Gains: | | | | | | | | | | | | | | | | |
Class A | | | — | | | | — | | | | — | | | | — | |
Class B | | | — | | | | — | | | | — | | | | — | |
Class C | | | — | | | | — | | | | — | | | | — | |
Class D | | | — | | | | — | | | | — | | | | — | |
Class L | | | — | | | | — | | | | — | | | | — | |
Class M | | | — | | | | — | | | | — | | | | — | |
Class X | | | — | | | | — | | | | — | | | | — | |
| | |
|
|
| |
|
|
| |
|
|
| |
|
|
|
Total Distributions | | | — | | | | — | | | | — | | | | — | |
| | |
|
|
| |
|
|
| |
|
|
| |
|
|
|
FUND SHARE TRANSACTIONS (Note 4) | | | | | | | | | | | | | | | | |
Net Proceeds from Shares Sold(b) | | | 27,324,745 | | | | 196,070,018 | | | | 80,392,640 | | | | 13,723,679 | |
Net Asset Value of Shares Issued in Reinvestment of Dividends and Distributions | | | 1,567,606 | | | | 87,863 | | | | — | | | | — | |
Cost of Shares Redeemed | | | (101,317,370 | ) | | | (96,567,861 | ) | | | (18,197,839 | ) | | | (22,325,892 | ) |
| | |
|
|
| |
|
|
| |
|
|
| |
|
|
|
Increase (Decrease) in Net Assets from Fund Share Transactions | | | (72,425,019 | ) | | | 99,590,020 | | | | 62,194,801 | | | | (8,602,213 | ) |
| | |
|
|
| |
|
|
| |
|
|
| |
|
|
|
Net Increase (Decrease) in Net Assets | | | (33,613,058 | ) | | | 124,404,623 | | | | 64,883,053 | | | | (8,383,175 | ) |
NET ASSETS: | | | | | | | | | | | | | | | | |
Beginning of Year | | | 279,163,912 | | | | 154,759,289 | | | | 44,590,821 | | | | 52,973,996 | |
| | |
|
|
| |
|
|
| |
|
|
| |
|
|
|
End of Year(a) | | $ | 245,550,854 | | | $ | 279,163,912 | | | $ | 109,473,874 | | | $ | 44,590,821 | |
| | |
|
|
| |
|
|
| |
|
|
| |
|
|
|
(a) Includes Undistributed Net Investment Income of: | | $ | — | | | $ | — | | | $ | — | | | $ | — | |
| | |
|
|
| |
|
|
| |
|
|
| |
|
|
|
(b) Includes Value of Shares Issued in Merger: | | $ | — | | | $ | 149,666,303 | | | $ | 75,279,784 | | | $ | — | |
| | |
|
|
| |
|
|
| |
|
|
| |
|
|
|
See Notes to Financial Statements.
120
| | | | | | | | | | | | | | | | | | | | | | | | | | | | | | |
STRATEGIC PARTNERS
MID-CAP GROWTH FUND
| | | STRATEGIC PARTNERS MID
CAP VALUE FUND
| | | STRATEGIC PARTNERS
TECHNOLOGY FUND
| | | STRATEGIC PARTNERS
HEALTH SCIENCES FUND
| |
Year Ended
October 31,
2005
| | | Year Ended
October 31,
2004
| | | Year Ended
October 31,
2005
| | | Year Ended
October 31,
2004
| | | Year Ended
October 31,
2005
| | | Year Ended
October 31,
2004
| | | Year Ended
October 31,
2005
| | | Year Ended
October 31,
2004
| |
| $ | (2,712,154 | ) | | $ | (2,570,924 | ) | | $ | (2,838,928 | ) | | $ | (2,743,552 | ) | | $ | (238,326 | ) | | $ | (469,765 | ) | | $ | (267,295 | ) | | $ | (300,411 | ) |
| | 30,683,083 | | | | 21,152,208 | | | | 68,941,489 | | | | 42,917,689 | | | | 1,240,657 | | | | 1,379,026 | | | | 1,062,319 | | | | 2,818,413 | |
| | (16,087,988 | ) | | | (6,027,667 | ) | | | (17,963,024 | ) | | | 877,486 | | | | (347,908 | ) | | | (2,254,995 | ) | | | 1,576,546 | | | | (1,632,781 | ) |
|
|
| |
|
|
| |
|
|
| |
|
|
| |
|
|
| |
|
|
| |
|
|
| |
|
|
|
| | 11,882,941 | | | | 12,553,617 | | | | 48,139,537 | | | | 41,051,623 | | | | 654,423 | | | | (1,345,734 | ) | | | 2,371,570 | | | | 885,221 | |
|
|
| |
|
|
| |
|
|
| |
|
|
| |
|
|
| |
|
|
| |
|
|
| |
|
|
|
| | — | | | | — | | | | — | | | | — | | | | — | | | | — | | | | — | | | | — | |
| | — | | | | — | | | | — | | | | — | | | | — | | | | — | | | | — | | | | — | |
| | — | | | | — | | | | — | | | | — | | | | — | | | | — | | | | — | | | | — | |
| | — | | | | — | | | | — | | | | — | | | | — | | | | — | | | | — | | | | — | |
| | — | | | | — | | | | — | | | | — | | | | — | | | | — | | | | — | | | | — | |
| | — | | | | — | | | | — | | | | — | | | | — | | | | — | | | | — | | | | — | |
| | — | | | | — | | | | — | | | | — | | | | — | | | | — | | | | — | | | | — | |
|
|
| |
|
|
| |
|
|
| |
|
|
| |
|
|
| |
|
|
| |
|
|
| |
|
|
|
| | — | | | | — | | | | — | | | | — | | | | — | | | | — | | | | — | | | | — | |
|
|
| |
|
|
| |
|
|
| |
|
|
| |
|
|
| |
|
|
| |
|
|
| |
|
|
|
| | | | | | | | | | | | | | | | | | | | | | | | | | | | | | | |
| | — | | | | — | | | | (1,706,973 | ) | | | — | | | | — | | | | — | | | | — | | | | — | |
| | — | | | | — | | | | (152,535 | ) | | | — | | | | — | | | | — | | | | — | | | | — | |
| | — | | | | — | | | | (7,000,236 | ) | | | (551,438 | ) | | | — | | | | — | | | | — | | | | — | |
| | — | | | | — | | | | — | | | | — | | | | — | | | | — | | | | — | | | | — | |
| | — | | | | — | | | | (7,910,219 | ) | | | (693,820 | ) | | | — | | | | — | | | | — | | | | — | |
| | — | | | | — | | | | (17,653,222 | ) | | | (1,287,867 | ) | | | — | | | | — | | | | — | | | | — | |
| | — | | | | — | | | | (3,193,460 | ) | | | (231,903 | ) | | | — | | | | — | | | | — | | | | — | |
|
|
| |
|
|
| |
|
|
| |
|
|
| |
|
|
| |
|
|
| |
|
|
| |
|
|
|
| | — | | | | — | | | | (37,616,645 | ) | | | (2,765,028 | ) | | | — | | | | — | | | | — | | | | — | |
|
|
| |
|
|
| |
|
|
| |
|
|
| |
|
|
| |
|
|
| |
|
|
| |
|
|
|
| | | | | | | | | | | | | | | | | | | | | | | | | | | | | | | |
| | 16,221,389 | | | | 182,608,812 | | | | 43,259,968 | | | | 156,486,555 | | | | 3,353,896 | | | | 8,330,726 | | | | 7,897,254 | | | | 7,429,268 | |
| | | | | | | | | | | | | | | | | | | | | | | | | | | | | | | |
| | — | | | | — | | | | 34,307,054 | | | | 2,545,232 | | | | — | | | | — | | | | — | | | | — | |
| | (62,055,106 | ) | | | (57,108,333 | ) | | | (111,069,994 | ) | | | (99,404,076 | ) | | | (10,414,208 | ) | | | (11,281,479 | ) | | | (8,168,618 | ) | | | (6,316,689 | ) |
|
|
| |
|
|
| |
|
|
| |
|
|
| |
|
|
| |
|
|
| |
|
|
| |
|
|
|
| | (45,833,717 | ) | | | 125,500,479 | | | | (33,502,972 | ) | | | 59,627,711 | | | | (7,060,312 | ) | | | (2,950,753 | ) | | | (271,364 | ) | | | 1,112,579 | |
|
|
| |
|
|
| |
|
|
| |
|
|
| |
|
|
| |
|
|
| |
|
|
| |
|
|
|
| | (33,950,776 | ) | | | 138,054,096 | | | | (22,980,080 | ) | | | 97,914,306 | | | | (6,405,889 | ) | | | (4,296,487 | ) | | | 2,100,206 | | | | 1,997,800 | |
| | 165,802,441 | | | | 27,748,345 | | | | 314,916,976 | | | | 217,002,670 | | | | 21,125,213 | | | | 25,421,700 | | | | 20,360,859 | | | | 18,363,059 | |
|
|
| |
|
|
| |
|
|
| |
|
|
| |
|
|
| |
|
|
| |
|
|
| |
|
|
|
| $ | 131,851,665 | | | $ | 165,802,441 | | | $ | 291,936,896 | | | $ | 314,916,976 | | | $ | 14,719,324 | | | $ | 21,125,213 | | | $ | 22,461,065 | | | $ | 20,360,859 | |
|
|
| |
|
|
| |
|
|
| |
|
|
| |
|
|
| |
|
|
| |
|
|
| |
|
|
|
| $ | — | | | $ | — | | | $ | — | | | $ | — | | | $ | — | | | $ | — | | | $ | — | | | $ | — | |
|
|
| |
|
|
| |
|
|
| |
|
|
| |
|
|
| |
|
|
| |
|
|
| |
|
|
|
| $ | — | | | $ | 158,906,224 | | | $ | — | | | $ | 87,404,927 | | | $ | — | | | $ | — | | | $ | — | | | $ | — | |
|
|
| |
|
|
| |
|
|
| |
|
|
| |
|
|
| |
|
|
| |
|
|
| |
|
|
|
See Notes to Financial Statements.
121
Statements of Changes in Net Assets
| | | | | | | | | | | | | | | | |
| | | STRATEGIC PARTNERS
MANAGED OTC FUND
| | | STRATEGIC PARTNERS
CAPITAL GROWTH FUND
| |
| | | Year Ended
October 31,
2005
| | | Year Ended
October 31,
2004
| | | Year Ended
October 31,
2005
| | | Year Ended
October 31,
2004
| |
OPERATIONS: | | | | | | | �� | | | | | | | | | |
Net Investment Income (Loss) | | $ | (177,533 | ) | | $ | (755,848 | ) | | $ | (8,688,303 | ) | | $ | (9,586,084 | ) |
Net Realized Gain (Loss) on Investments and Foreign Currencies . | | | 2,255,770 | | | | (2,537,981 | ) | | | 81,583,024 | | | | 41,641,863 | |
Net Change in Unrealized Appreciation (Depreciation) on Investments and Foreign Currencies | | | (435,271 | ) | | | 4,070,516 | | | | 14,543,348 | | | | (15,119,836 | ) |
| | |
|
|
| |
|
|
| |
|
|
| |
|
|
|
Net Increase (Decrease) in Net Assets Resulting from Operations | | | 1,642,966 | | | | 776,687 | | | | 87,438,069 | | | | 16,935,943 | |
| | |
|
|
| |
|
|
| |
|
|
| |
|
|
|
DIVIDENDS AND DISTRIBUTIONS: | | | | | | | | | | | | | | | | |
Dividends from Net Investment Income: | | | | | | | | | | | | | | | | |
Class A | | | — | | | | — | | | | — | | | | — | |
Class B | | | — | | | | — | | | | — | | | | — | |
Class C | | | — | | | | — | | | | — | | | | — | |
Class D | | | — | | | | — | | | | — | | | | — | |
Class L | | | — | | | | — | | | | — | | | | — | |
Class M | | | — | | | | — | | | | — | | | | — | |
Class X | | | — | | | | — | | | | — | | | | — | |
| | |
|
|
| |
|
|
| |
|
|
| |
|
|
|
Total Dividends | | | — | | | | — | | | | — | | | | — | |
| | |
|
|
| |
|
|
| |
|
|
| |
|
|
|
Distributions from Net Realized Gains: | | | | | | | | | | | | | | | | |
Class A | | | — | | | | — | | | | — | | | | — | |
Class B | | | — | | | | — | | | | — | | | | — | |
Class C | | | — | | | | — | | | | — | | | | — | |
Class D | | | — | | | | — | | | | — | | | | — | |
Class L | | | — | | | | — | | | | — | | | | — | |
Class M | | | — | | | | — | | | | — | | | | — | |
Class X | | | — | | | | — | | | | — | | | | — | |
| | |
|
|
| |
|
|
| |
|
|
| |
|
|
|
Total Distributions | | | — | | | | — | | | | — | | | | — | |
| | |
|
|
| |
|
|
| |
|
|
| |
|
|
|
FUND SHARE TRANSACTIONS (Note 4) | | | | | | | | | | | | | | | | |
Net Proceeds from Shares Sold(b) | | | 4,553,733 | | | | 15,930,602 | | | | 52,828,650 | | | | 229,363,952 | |
Net Asset Value of Shares Issued in Reinvestment of Dividends and Distributions | | | — | | | | — | | | | — | | | | — | |
Cost of Shares Redeemed | | | (16,834,008 | ) | | | (21,745,124 | ) | | | (222,081,521 | ) | | | (230,466,365 | ) |
| | |
|
|
| |
|
|
| |
|
|
| |
|
|
|
Increase (Decrease) in Net Assets from Fund Share Transactions | | | (12,280,275 | ) | | | (5,814,522 | ) | | | (169,252,871 | ) | | | (1,102,413 | ) |
| | |
|
|
| |
|
|
| |
|
|
| |
|
|
|
Net Increase (Decrease) in Net Assets | | | (10,637,309 | ) | | | (5,037,835 | ) | | | (81,814,802 | ) | | | 15,833,530 | |
NET ASSETS: | | | | | | | | | | | | | | | | |
Beginning of Year | | | 36,524,871 | | | | 41,562,706 | | | | 715,914,558 | | | | 700,081,028 | |
| | |
|
|
| |
|
|
| |
|
|
| |
|
|
|
End of Year(a) | | $ | 25,887,562 | | | $ | 36,524,871 | | | $ | 634,099,756 | | | $ | 715,914,558 | |
| | |
|
|
| |
|
|
| |
|
|
| |
|
|
|
(a) Includes Undistributed Net Investment Income of: | | $ | — | | | $ | — | | | $ | — | | | $ | — | |
| | |
|
|
| |
|
|
| |
|
|
| |
|
|
|
(b) Includes Value of Shares Issued in Merger: | | $ | — | | | $ | — | | | $ | — | | | $ | 116,120,633 | |
| | |
|
|
| |
|
|
| |
|
|
| |
|
|
|
See Notes to Financial Statements.
122
| | | | | | | | | | | | | | | | | | | | | | | | | | | | | |
STRATEGIC PARTNERS CONCENTRATED GROWTH FUND
| | | STRATEGIC PARTNERS CORE VALUE FUND
| | | STRATEGIC PARTNERS LARGE CAP CORE FUND
| | | STRATEGIC PARTNERS EQUITY INCOME FUND
| |
Year Ended October 31, 2005
| | Year Ended October 31, 2004
| | | Year Ended October 31, 2005
| | | Year Ended October 31, 2004
| | | Year Ended October 31, 2005
| | | Year Ended October 31, 2004
| | | Year Ended October 31, 2005
| | | Year Ended October 31, 2004
| |
| $ | (1,890,357) | | $ | (5,999,641 | ) | | $ | 160,103 | | | $ | 112,707 | | | $ | 380,918 | | | $ | (310,493 | ) | | $ | 565,208 | | | $ | (431,521 | ) |
| | 20,098,023 | | | 16,028,481 | | | | 2,714,388 | | | | 1,777,105 | | | | 5,808,397 | | | | 205,398 | | | | 31,382,759 | | | | 13,495,142 | |
| | (2,730,609) | | | (2,970,123 | ) | | | 1,139,409 | | | | 2,788,786 | | | | 2,995,424 | | | | 9,710,452 | | | | (10,895,123 | ) | | | 9,259,414 | |
|
| |
|
|
| |
|
|
| |
|
|
| |
|
|
| |
|
|
| |
|
|
| |
|
|
|
| | 15,477,057 | | | 7,058,717 | | | | 4,013,900 | | | | 4,678,598 | | | | 9,184,739 | | | | 9,605,357 | | | | 21,052,844 | | | | 22,323,035 | |
|
| |
|
|
| |
|
|
| |
|
|
| |
|
|
| |
|
|
| |
|
|
| |
|
|
|
| | — | | | — | | | | (27,263 | ) | | | — | | | | — | | | | (833 | ) | | | (96,725 | ) | | | — | |
| | — | | | — | | | | (854 | ) | | | — | | | | — | | | | — | | | | (1,065 | ) | | | — | |
| | — | | | — | | | | (9,707 | ) | | | (40,685 | ) | | | — | | | | — | | | | (36,016 | ) | | | — | |
| | — | | | — | | | | — | | | | — | | | | — | | | | — | | | | — | | | | — | |
| | — | | | — | | | | (70,548 | ) | | | (55,771 | ) | | | — | | | | (4,243 | ) | | | (276,305 | ) | | | — | |
| | — | | | — | | | | (32,335 | ) | | | (62,711 | ) | | | — | | | | — | | | | (93,218 | ) | | | — | |
| | — | | | — | | | | (3,884 | ) | | | (11,514 | ) | | | — | | | | — | | | | (24,048 | ) | | | — | |
|
| |
|
|
| |
|
|
| |
|
|
| |
|
|
| |
|
|
| |
|
|
| |
|
|
|
| | — | | | — | | | | (144,591 | ) | | | (170,681 | ) | | | — | | | | (5,076 | ) | | | (527,377 | ) | | | — | |
|
| |
|
|
| |
|
|
| |
|
|
| |
|
|
| |
|
|
| |
|
|
| |
|
|
|
| | — | | | — | | | | (56,822 | ) | | | — | | | | — | | | | — | | | | — | | | | — | |
| | — | | | — | | | | (6,723 | ) | | | — | | | | — | | | | — | | | | — | | | | — | |
| | — | | | — | | | | (263,393 | ) | | | — | | | | — | | | | — | | | | — | | | | — | |
| | — | | | — | | | | — | | | | — | | | | — | | | | — | | | | — | | | | — | |
| | — | | | — | | | | (194,959 | ) | | | — | | | | — | | | | — | | | | — | | | | — | |
| | — | | | — | | | | (497,987 | ) | | | — | | | | — | | | | — | | | | — | | | | — | |
| | — | | | — | | | | (105,395 | ) | | | — | | | | — | | | | — | | | | — | | | | — | |
|
| |
|
|
| |
|
|
| |
|
|
| |
|
|
| |
|
|
| |
|
|
| |
|
|
|
| | — | | | — | | | | (1,125,279 | ) | | | — | | | | — | | | | — | | | | — | | | | — | |
|
| |
|
|
| |
|
|
| |
|
|
| |
|
|
| |
|
|
| |
|
|
| |
|
|
|
| | 14,305,326 | | | 32,643,631 | | | | 14,483,213 | | | | 22,857,818 | | | | 50,979,313 | | | | 56,405,756 | | | | 128,360,865 | | | | 45,603,649 | |
| | — | | | — | | | | 1,209,484 | | | | 161,002 | | | | — | | | | 5,076 | | | | 510,840 | | | | — | |
| | (133,947,015) | | | (160,216,520 | ) | | | (18,500,181 | ) | | | (21,612,296 | ) | | | (62,627,777 | ) | | | (69,681,893 | ) | | | (79,614,309 | ) | | | (88,799,884 | ) |
|
| |
|
|
| |
|
|
| |
|
|
| |
|
|
| |
|
|
| |
|
|
| |
|
|
|
| | (119,641,689) | | | (127,572,889 | ) | | | (2,807,484 | ) | | | 1,406,524 | | | | (11,648,464 | ) | | | (13,271,061 | ) | | | 49,257,396 | | | | (43,196,235 | ) |
|
| |
|
|
| |
|
|
| |
|
|
| |
|
|
| |
|
|
| |
|
|
| |
|
|
|
| | (104,164,632) | | | (120,514,172 | ) | | | (63,454 | ) | | | 5,914,441 | | | | (2,463,725 | ) | | | (3,670,780 | ) | | | 69,782,863 | | | | (20,873,200 | ) |
| | 399,882,560 | | | 520,396,732 | | | | 46,834,038 | | | | 40,919,597 | | | | 148,936,949 | | | | 152,607,729 | | | | 233,020,323 | | | | 253,893,523 | |
|
| |
|
|
| |
|
|
| |
|
|
| |
|
|
| |
|
|
| |
|
|
| |
|
|
|
| $ | 295,717,928 | | $ | 399,882,560 | | | $ | 46,770,584 | | | $ | 46,834,038 | | | $ | 146,473,224 | | | $ | 148,936,949 | | | $ | 302,803,186 | | | $ | 233,020,323 | |
|
| |
|
|
| |
|
|
| |
|
|
| |
|
|
| |
|
|
| |
|
|
| |
|
|
|
| $ | — | | $ | — | | | $ | 86,767 | | | $ | 71,255 | | | $ | 327,379 | | | $ | — | | | $ | 16,721 | | | $ | — | |
|
| |
|
|
| |
|
|
| |
|
|
| |
|
|
| |
|
|
| |
|
|
| |
|
|
|
| $ | — | | $ | — | | | $ | — | | | $ | — | | | $ | 32,727,939 | | | $ | 14,341,252 | | | $ | 112,897,042 | | | $ | 1,775,446 | |
|
| |
|
|
| |
|
|
| |
|
|
| |
|
|
| |
|
|
| |
|
|
| |
|
|
|
See Notes to Financial Statements.
123
Statements of Changes in Net Assets
| | | | | | | | | | | | | | | | | | | | | | | | |
| | | STRATEGIC PARTNERS BALANCED FUND
| | | STRATEGIC PARTNERS HIGH YIELD BOND FUND
| | | STRATEGIC PARTNERS MONEY MARKET FUND
| |
| | | Year Ended October 31, 2005
| | | Year Ended October 31, 2004
| | | Year Ended October 31, 2005
| | | Year Ended October 31, 2004
| | | Year Ended October 31, 2005
| | | Year Ended October 31, 2004
| |
OPERATIONS: | | | | | | | | | | | | | | | | | | | | | | | | |
Net Investment Income (Loss) | | $ | 888,682 | | | $ | 776,128 | | | $ | 9,893,397 | | | $ | 12,534,299 | | | $ | 1,392,758 | | | $ | 448,697 | |
Net Realized Gain (Loss) on Investments and Foreign Currencies | | | 9,721,432 | | | | 11,986,747 | | | | 3,214,325 | | | | 3,079,394 | | | | (15,463 | ) | | | 388 | |
Net Change in Unrealized Appreciation (Depreciation) on Investments and Foreign Currencies | | | (3,422,601 | ) | | | (3,360,363 | ) | | | (10,845,136 | ) | | | 4,600,404 | | | | — | | | | — | |
| | |
|
|
| |
|
|
| |
|
|
| |
|
|
| |
|
|
| |
|
|
|
Net Increase (Decrease) in Net Assets Resulting from Operations | | | 7,187,513 | | | | 9,402,512 | | | | 2,262,586 | | | | 20,214,097 | | | | 1,377,295 | | | | 449,085 | |
| | |
|
|
| |
|
|
| |
|
|
| |
|
|
| |
|
|
| |
|
|
|
DIVIDENDS AND DISTRIBUTIONS: | | | | | | | | | | | | | | | | | | | | | | | | |
Dividends from Net Investment Income: | | | | | | | | | | | | | | | | | | | | | | | | |
Class A | | | (88,000 | ) | | | (21,201 | ) | | | (644,460 | ) | | | (177,921 | ) | | | (154 | ) | | | — | |
Class B | | | (9,094 | ) | | | (948 | ) | | | (78,721 | ) | | | (12,153 | ) | | | — | | | | — | |
Class C | | | (110,844 | ) | | | (129,517 | ) | | | (1,377,592 | ) | | | (1,947,832 | ) | | | (129,807 | ) | | | (680 | ) |
Class D | | | — | | | | — | | | | — | | | | — | | | | (206,044 | ) | | | (65,074 | ) |
Class L | | | (247,236 | ) | | | (322,476 | ) | | | (1,246,113 | ) | | | (2,092,523 | ) | | | (387,698 | ) | | | (378,932 | ) |
Class M | | | (422,177 | ) | | | (421,170 | ) | | | (5,924,059 | ) | | | (7,812,965 | ) | | | (571,379 | ) | | | (3,506 | ) |
Class X | | | (97,824 | ) | | | (95,177 | ) | | | (856,681 | ) | | | (997,409 | ) | | | (126,220 | ) | | | (505 | ) |
| | |
|
|
| |
|
|
| |
|
|
| |
|
|
| |
|
|
| |
|
|
|
Total Dividends | | | (975,175 | ) | | | (990,489 | ) | | | (10,127,626 | ) | | | (13,040,803 | ) | | | (1,421,302 | ) | | | (448,697 | ) |
| | |
|
|
| |
|
|
| |
|
|
| |
|
|
| |
|
|
| |
|
|
|
Distributions from Net Realized Gains: | | | | | | | | | | | | | | | | | | | | | | | | |
Class A | | | — | | | | — | | | | — | | | | — | | | | — | | | | — | |
Class B | | | — | | | | — | | | | — | | | | — | | | | — | | | | — | |
Class C | | | — | | | | — | | | | — | | | | — | | | | — | | | | — | |
Class D | | | — | | | | — | | | | — | | | | — | | | | — | | | | — | |
Class L | | | — | | | | — | | | | — | | | | — | | | | — | | | | — | |
Class M | | | — | | | | — | | | | — | | | | — | | | | — | | | | — | |
Class X | | | — | | | | — | | | | — | | | | — | | | | — | | | | — | |
| | |
|
|
| |
|
|
| |
|
|
| |
|
|
| |
|
|
| |
|
|
|
Total Distributions | | | — | | | | — | | | | — | | | | — | | | | — | | | | — | |
| | |
|
|
| |
|
|
| |
|
|
| |
|
|
| |
|
|
| |
|
|
|
FUND SHARE TRANSACTIONS (Note 4) | | | | | | | | | | | | | | | | | | | | | | | | |
Net Proceeds from Shares Sold(b) | | | 14,631,391 | | | | 29,951,874 | | | | 35,599,904 | | | | 68,286,315 | | | | 74,781,556 | | | | 239,455,706 | |
Net Asset Value of Shares Issued in Reinvestment of Dividends and Distributions | | | 875,416 | | | | 927,821 | | | | 6,591,573 | | | | 8,586,844 | | | | 1,188,165 | | | | 409,993 | |
Cost of Shares Redeemed | | | (44,015,387 | ) | | | (49,402,492 | ) | | | (99,250,414 | ) | | | (122,627,026 | ) | | | (134,342,101 | ) | | | (354,289,517 | ) |
| | |
|
|
| |
|
|
| |
|
|
| |
|
|
| |
|
|
| |
|
|
|
Increase (Decrease) in Net Assets from Fund Share Transactions | | | (28,508,580 | ) | | | (18,522,797 | ) | | | (57,058,937 | ) | | | (45,753,867 | ) | | | (58,372,380 | ) | | | (114,423,818 | ) |
| | |
|
|
| |
|
|
| |
|
|
| |
|
|
| |
|
|
| |
|
|
|
Net Increase (Decrease) in Net Assets | | | (22,296,242 | ) | | | (10,110,774 | ) | | | (64,923,977 | ) | | | (38,580,573 | ) | | | (58,416,387 | ) | | | (114,423,430 | ) |
NET ASSETS: | | | | | | | | | | | | | | | | | | | | | | | | |
Beginning of Year . | | | 130,650,197 | | | | 140,760,971 | | | | 178,167,071 | | | | 216,747,644 | | | | 179,631,742 | | | | 294,055,172 | |
| | |
|
|
| |
|
|
| |
|
|
| |
|
|
| |
|
|
| |
|
|
|
End of Year(a) | | $ | 108,353,955 | | | $ | 130,650,197 | | | $ | 113,243,094 | | | $ | 178,167,071 | | | $ | 121,215,355 | | | $ | 179,631,742 | |
| | |
|
|
| |
|
|
| |
|
|
| |
|
|
| |
|
|
| |
|
|
|
(a) Includes Undistributed Net Investment Income of: | | $ | 230,192 | | | $ | 246,459$ | | | | 244,493 | | | $ | 270,181 | | | $ | — | | | $ | — | |
| | |
|
|
| |
|
|
| |
|
|
| |
|
|
| |
|
|
| |
|
|
|
(b) Includes Value of Shares Issued in Merger: | | $ | — | | | $ | — | | | $ | — | | | $ | — | | | $ | — | | | $ | — | |
| | |
|
|
| |
|
|
| |
|
|
| |
|
|
| |
|
|
| |
|
|
|
See Notes to Financial Statements.
124
OCTOBER 31, 2005
Notes to Financial Statements
1. Organization
Strategic Partners Mutual Funds, Inc., formerly known as American Skandia Advisor Funds, Inc., (the “Company”) is an open-end management investment company, registered under the Investment Company Act of 1940, as amended. The Company was organized on March 5, 1997, as a Maryland Corporation. The Company operates as a series company and effective April 12, 2004, the name of the Company was changed to Strategic Partners Mutual Funds, Inc. At October 31, 2005, the Company consisted of 13 diversified and 2 non-diversified investment portfolios (Strategic Partners Mid-Cap Growth Fund and Strategic Partners Managed OTC Fund) (each a “Fund” and collectively the “Funds”).
The Funds of the Company have the following as investment objectives:
Strategic Partners International Growth Fund (“International Growth”): Capital growth by investing in equity securities of foreign companies.
Strategic Partners Small Cap Growth Fund (“Small Cap Growth”), formerly known as Strategic Partners Managed Small-Cap Fund: Maximum capital growth by investing in equity securities of small capitalization companies included in the Russell 2000 Growth Index.
Strategic Partners Mid-Cap Growth Fund (“Mid-Cap Growth”): Long-term capital growth by investing primarily in equity securities of medium-sized companies.
Strategic Partners Mid Cap Value Fund (“Mid Cap Value”), formerly known as Strategic Partners Relative Value Fund: Capital growth by investing primarily in common stocks of medium capitalization companies.
Strategic Partners Technology Fund (“Technology”): Capital growth by investing primarily in equity securities of companies engaged in technology-related industries.
Strategic Partners Health Sciences Fund (“Health Science”): Growth by investing primarily in the equity securities of companies that develop, produce or distribute products or services related to health care.
Strategic Partners Managed OTC Fund (“Managed OTC”): Provide investment results that correlate to a multiple of the daily performance of the NASDAQ 100 Index by investing primarily in securities of companies included in the NASDAQ 100 and leveraged instruments, such as futures contracts and options, relating to the NASDAQ 100.
Strategic Partners Capital Growth Fund (“Capital Growth”): Capital growth by investing primarily in common stocks, with the majority of the Fund’s assets in large-cap stocks.
Strategic Partners Concentrated Growth Fund (“Concentrated Growth”): Capital growth by investing in equity securities of approximately 30-45 large-cap companies.
Strategic Partners Core Value Fund (“Core Value”): Long-term capital growth by investing primarily in common stocks of large capitalization companies that appear to be undervalued.
Strategic Partners Large Cap Core Fund (“Large Cap Core”), formerly known as Strategic Partners Managed Index 500 Fund: To outperform the S&P 500 Stock Index by investing primarily in common stocks included in the S&P 500.
Strategic Partners Equity Income Fund (“Equity Income”): Long term capital growth and income by investing primarily in common stocks that are believed to be selling at reasonable valuation in relation to their fundamental business prospects.
Strategic Partners Balanced Fund (“Balanced”): Capital growth and current income by investing in approximately 60% of its assets in equity securities and the remainder in bonds and other fixed income securities.
Strategic Partners High Yield Bond Fund (“High Yield Bond”): High current income by investing primarily in lower-quality fixed income securities.
Strategic Partners Money Market Fund (“Money Market”): Maximize current income and maintain high levels of liquidity by investing in high-quality, short-term, U.S. dollar-denominated instruments.
125
2. Significant Accounting Policies
The following accounting policies are in conformity with accounting principles generally accepted in the United States of America. Such policies are consistently followed by the Company and the Funds in the preparation of their financial statements.
Securities Valuation
Securities listed on a securities exchange (other than options on securities and indices) are valued at the last sale price on such exchange on the day of valuation or, if there was no sale on such day, at the mean between the last reported bid and asked prices, or at the last bid price on such day in the absence of an asked price. Securities that are actively traded via Nasdaq are valued at the official closing price as provided by Nasdaq. Securities that are actively traded in the over-the-counter market, including listed securities for which primary market is believed by Prudential Investments LLC (“PI” or “Manager”) in consultation with the subadviser, to be over-the-counter, are valued at market value using prices provided by an independent pricing agent or principal market maker. Futures contracts and options thereon traded on a commodities exchange or board of trade are valued at the last sale price at the close of trading on such exchange or board of trade or, if there was no sale on the applicable commodities exchange or board of trade on such day, at the mean between the most recently quoted prices on such exchange or board of trade or at the last bid price in the absence of an asked price. Prices may be obtained from independent pricing services which use information provided by market makers or estimates of market values obtained from yield data relating to investments or securities with similar characteristics. Securities for which reliable market quotations are not readily available, or whose values have been affected by events occurring after the close of the security’s foreign market and before the Fund’s normal pricing time, are valued at fair value in accordance with the Board of Directors’ approved fair valuation procedures. When determining the fair valuation of securities some of the factors influencing the valuation include, the nature of any restrictions on disposition of the securities; assessment of the general liquidity of the securities; the issuer’s financial condition and the markets in which it does business; the cost of the investment; the size of the holding and the capitalization of issuer; the prices of any recent transactions or bids/offers for such securities or any comparable securities; any available analyst media or other reports or information deemed reliable by the investment adviser regarding the issuer or the markets or industry in which it operates. Using fair value to price securities may result in a value that is different from a security’s most recent closing price and from the price used by other mutual funds to calculate their net asset value.
Investments in mutual funds are valued at the net asset value as of the close of the New York Stock Exchange on the date of valuation.
Short-term securities, which mature in sixty days or less, are valued at amortized cost, which approximates market value. The amortized cost method involves valuing a security at its cost on the date of purchase or market value on the 61st day, and thereafter assuming a constant amortization to maturity of the difference between the principal amount due at maturity and cost. Short-term securities, which mature in more than sixty days, are valued at current market quotations.
Foreign Currency Translation
Fund securities and other assets and liabilities denominated in foreign currencies are translated each business day into U.S. dollars based on the current rates of exchange. Purchases and sales of Fund securities and income and expenses are translated into U.S. dollars on the respective dates of such transactions. Gains and losses resulting from changes in exchange rates applicable to long-term foreign securities are not reported separately from gains and losses arising from movements in securities prices. Net realized foreign exchange gains and losses include gains and losses from sales and maturities of foreign currency exchange contracts, gains and losses realized between the trade and settlement dates of foreign securities transactions, and the difference between the amount of net investment income accrued on foreign securities and the U.S. dollar amount actually received. Net unrealized foreign exchange gains and losses include gains and losses from changes in the value of assets and liabilities other than Fund securities, resulting from changes in exchange rates.
126
Forward Currency Contracts
A forward currency contract is a commitment to purchase or sell a foreign currency at a future date at a negotiated forward rate. Certain Funds, as defined in the prospectus, enter into forward currency contracts in order to hedge their exposure to changes in foreign currency exchange rates on their foreign portfolio holdings or on specific receivables and payables denominated in a foreign currency. The contracts are valued daily at forward exchange rates and any unrealized gain or loss is included in net unrealized appreciation or depreciation on investments. Gain or loss is realized on the settlement date of the contract equal to the difference between the settlement value of the original and renegotiated forward contracts. This gain or loss, if any, is included in net realized gain or loss on foreign currency transactions. Risks may arise upon entering into these contracts from the potential inability of the counter parties to meet the terms of their contracts.
Options
The Funds may either purchase or write options in order to hedge against adverse market movements or fluctuations in value caused by changes in prevailing interest rates with respect to securities or financial instruments which the Fund currently owns or intends to purchase. The Fund’s principal reason for writing options is to realize, through receipt of premiums, a greater current return than would be realized on the underlying security alone. When the Fund purchases an option, it pays a premium and an amount equal to that premium is recorded as an asset. When the Fund writes an option, it receives a premium and an amount equal to that premium is recorded as a liability. The asset or liability is adjusted daily to reflect the current market value of the option. If an option expires unexercised, the Fund realizes a gain or loss to the extent of the premium received or paid, respectively.
If an option is exercised, the premium received or paid is recorded as an adjustment to the proceeds from the sale or the cost of the purchase. The difference between the premium and the amount received or paid on effecting a closing purchase or sale transaction is also treated as a realized gain or loss. Gain or loss on purchased options is included in net realized gain or loss on investment transactions. Gain or loss on written options is presented separately as net realized gain or loss on written option transactions.
The Fund, as writer of an option, may have no control over whether the underlying securities or financial instruments may be sold (called) or purchased (put). As a result, the Fund bears the market risk of an unfavorable change in the price of the security or financial instrument underlying the written option.
When a Fund writes an option on a swap, an amount equal to any premium received by the Fund is recorded as a liability and is subsequently adjusted to the current market value of the written option on the swap. If a call option on a swap is exercised, the Fund becomes obligated to pay (receive) a fixed interest rate (noted as the strike price) and receive (pay) a variable interest rate on a notional amount. If a put option on a swap is exercised, the Fund becomes obligated to pay a variable interest rate and receive a fixed interest rate (noted as the strike price) on a notional amount. Premiums received from writing options on swaps that expire or are exercised are treated as realized gains upon the expiration or exercise of such options on swaps. The risk associated with writing put and call options on swaps is that the Fund will be obligated to be party to a swap agreement if an option on a swap is exercised.
Financial Futures Contracts
A financial futures contract is an agreement to purchase (long) or sell (short) an agreed amount of securities at a set price for delivery on a future date. Upon entering into a financial futures contract, the Fund is required to pledge to the broker an amount of cash and/or other assets equal to a certain percentage of the contract amount. This amount is known as the “initial margin.” Subsequent payments known as “variation margin,” are made or received by the Fund each day, depending on the daily fluctuations in the value of the underlying security. Such variation margin is recorded for financial statement purposes on a daily basis as unrealized gain or loss. When the contract expires or is closed, the gain or loss is realized and is presented in the Statement of Operations as net realized gain or loss on financial futures contracts. The use of futures transactions involves the risk of imperfect correlation in movements in the price of futures contracts, interest rates and underlying hedged assets.
127
Repurchase Agreements
A repurchase agreement is a commitment to purchase securities from a seller who agrees to repurchase the securities at an agreed-upon price and date. The excess of the resale price over the purchase price determines the yield on the transaction. Under the terms of the agreement, the market value, including accrued interest, of the securities will be at least equal to their repurchase price.
Repurchase agreements are recorded at cost, which, combined with accrued interest, approximates market value.
Repurchase agreements bear a risk of loss in the event that the seller defaults on its obligation to repurchase the securities. In such case, the Fund may be delayed or prevented from exercising its right to dispose of the securities.
Swap Agreements
The Funds may enter into swap agreements. A swap is an agreement to exchange the return generated by one instrument for the return generated by another instrument. The Funds may enter into interest rate, forward swap spread lock and credit default swap agreements to manage its exposure to interest rates and credit risk. Interest rate swap agreements involve the exchange by the Fund with another party of their respective commitments to pay or receive interest.
Forward spread lock swap agreements involve commitments to pay or receive a settlement amount calculated as the difference between the swap spread and a fixed spread, multiplied by the notional amount times the duration of the swap. The swap spread is the difference between the benchmark swap rate (market rate) and the specific Treasury rate. In a credit default swap, one party makes a stream of payments to another party in exchange for the right to receive a specified return in the event of a default by a third party, typically corporate issues or sovereign issues of an emerging country, on its obligation. Dividends and interest on the securities in the swap are included in the value of the exchange. The swaps are valued daily at current market value and any unrealized gain or loss is included in the net unrealized appreciation or depreciation on investments. Gain or loss is realized on the termination date of the swap and is equal to the difference between the Fund’s basis in the swap and the proceeds or costs of the closing transaction, including fees. During the period that the swap agreement is open, the Fund may be subject to risk from the potential inability of the counter party to meet the terms of the agreement.
Forward currency contracts, written options, financial futures contracts, and swap agreements involve elements of both market and credit risk in excess of the amounts reflected on the Statement of Assets and Liabilities.
Delayed Delivery Transactions
Certain Funds may purchase or sell securities on a when-issued or delayed delivery basis. These transactions involve a commitment by the Fund to purchase or sell securities for a predetermined price or yield, with payment and delivery taking place beyond the customary settlement period. When delayed delivery purchases are outstanding, the Fund will set aside and maintain until the settlement date in a segregated account, liquid assets in an amount sufficient to meet the purchase price. When purchasing a security on a delayed delivery basis, the Fund assumes the rights and risks of ownership of the security, including the risk of price and yield fluctuations, and takes such fluctuations into account when determining its net asset value. The Fund may dispose of or renegotiate a delayed delivery transaction after it is entered into, and may sell when-issued securities before they are delivered, which may result in a capital gain or loss. When the Fund has sold a security on a delayed delivery basis, the Fund does not participate in future gains and losses with respect to the security.
Securities Loans
The Funds may lend their portfolio securities to broker-dealers. The loans are secured by collateral at least equal at all times to the market value of the securities loaned. Loans are subject to termination at the option of the borrower or the Funds. Upon termination of the loan, the borrower will return to the lender securities identical to the loaned securities. Should the borrower of the securities fail financially, the Funds
128
have the right to repurchase the securities using the collateral in the open market. The Funds recognize income, net of any rebate and securities lending agent fees, for lending its securities in the form of fees or interest on the investment of any cash received as collateral. The Funds also continue to receive interest and dividends or amounts equivalent thereto, on the securities loaned and recognize any unrealized gain or loss in the market price of the securities loaned that may occur during the term of the loan.
Cash collateral received in connection with securities lending is invested in short-term investments by the lending agent. These may include the Prudential Core Money Market Series or Institutional Money Market Trust, advised by BlackRock Capital Management, Inc., or directly in high-quality, short-term instruments with a maturity date not to exceed 60 days.
Investment Transactions and Investment Income
Securities transactions are recorded on the trade date. Realized gains or losses on sales of investments and currency transactions are calculated on the identified cost basis. Dividend income is recorded on the ex-dividend date and interest income is recorded on the accrual basis. The Fund amortizes premiums and discounts on portfolio securities as adjustments to interest income. Expenses are recorded on the accrual basis which may require the use of certain estimates by management.
Net investment income or loss (other than distribution fees, which are charged directly to the respective class) and unrealized and realized gains or losses are allocated daily to each class of shares based upon the relative proportion of net assets of each class at the beginning of the day.
Traded Custody Receipts
The Trust invests in securities that represent an interest in a diversified portfolio (the “basket”) of debt instruments (the underlying securities). Under the term of the baskets, the Trust has direct ownership in each underlying security equal to its pro rata interest in the basket. In the event of default of any underlying security, the notional amount on which interest is earned is reduced by the par amount of the defaulted security, and the pro rata interest of such security is distributed to the Trust. Traded custody receipts (‘‘TRACERS’’) are custody receipts representing direct ownership in a static, unlevered portfolio of 28 investment-grade corporate bonds with an approximate 10-year final legal maturity. Purchasers of TRACERS will generally have all the rights and privileges of owners of the underlying bonds. Purchasers must withdraw any underlying bond that has defaulted or been downgraded below investment grade by Fitch, Ratings Ltd., either in the form of cash proceeds from liquidation or the transfer of their pro rata share of the underlying bond. As TRACERS approaches its final maturity date, it is expected that its market risk exposures will be reduced. Therefore, the volatility rating assigned to TRACERS is expected to improve (be lowered) over time.
Distributions to Shareholders
Distributions to shareholders are recorded on the ex-divided date. Dividends, if any, from net investment income are declared and paid at least annually by the International Growth, Small Cap Growth, Mid-Cap Growth, Mid Cap Value, Technology, Health Sciences, Managed OTC, Capital Growth, Concentrated Growth, Core Value, Large Cap Core, Equity Income; semiannually by the Balanced, and declared daily and paid monthly by the High Yield Bond and Money Market.
These dividends and distributions are determined in accordance with federal income tax regulations and may differ from accounting principles generally accepted in the United States of America.
Net realized gains from investment transactions, if any are distributed at least annually. Permanent book/tax differences relating to income and gains are reclassified to paid-in capital when they arise.
129
Taxes
For federal income tax purposes, each Fund in the Company is treated as a separate tax paying entity. It is the Funds’ policy to continue to meet the requirements of the Internal Revenue Code applicable to regulated investment companies and to distribute all of its taxable net income and capital gains, if any, to shareholders. Therefore, no federal tax provision is required. Withholding taxes on foreign dividends are recorded net of reclaimable amounts, at the time the related income is earned.
Estimates
The preparation of the financial statements requires management to make estimates and assumptions that affect the reported amounts and disclosures in the financial statements. Actual results could differ from those estimates.
3. Agreements and Other Transactions with Affiliates
The Funds have entered into investment management agreements with Prudential Investments LLC (‘‘Investment Manager’’) which provide that the Investment Manager will furnish each Fund with investment advice and investment management and administrative services. The Investment Manager has presently engaged the following firms as Sub-advisors for their respective Funds:
AIM Capital Management, Inc. for Health Sciences; Alliance Capital Management L.P. for Core Value, a portion of Equity Income, and Large Cap Core; American Century Investment Management, Inc. for Balanced; Deutsche Asset Management, Inc. for a portion of Small Cap Growth; The Dreyfus Corporation for Technology; Goldman Sachs Asset Management, L.P. for Mid-Cap Growth, Concentrated Growth and High Yield Bond; Marsico Capital Management, LLC for Capital Growth; Neuberger Berman Management, Inc. for Mid Cap Value; ProFund Advisors LLC for Managed OTC; Prudential Investment Management, Inc. for Money Market; RS Investments L.P. for a portion of Small Cap Growth; T. Rowe Price Associates, Inc. for a portion of Equity Income; Transamerica Investment Management LLC for a portion of Small Cap Growth; and William Blair & Company, LLC for International Growth.
130
Advisory Fees and Expense Limitations
The Investment Manager receives a fee, computed daily and paid monthly, based on an annual rate of the average net assets. The Investment Manager pays each Sub-advisor a fee as compensation for advisory services provided to the Funds. The Investment Manager has voluntarily agreed to waive expenses in accordance with limitation expense policies as noted in the table below. The Investment Manager will reimburse each Fund for its respective operating expenses, exclusive of taxes, interest, brokerage commissions, distribution fees and extraordinary expenses, but inclusive of the advisory fee, which in the aggregate exceed specified percentages of the Funds’ average net assets while retaining their ability to be reimbursed for such fee waivers prior to the end of the fiscal year. The advisory fees and expense limitations are summarized as follows:
| | | | | | | | | | |
| | | Advisory Expense
| | | | | | |
| | | November 1 through
July 31, 2005
| | Effective August 1, 2005
| | Effective Advisory Fees
Net of Waiver
| | | Fees
Limitations
| |
International Growth Fund | | 1.00% to $500 million; | | 1.00% to $500 million; | | 0.95 | % | | 1.60 | % |
| | | 0.95% next $500 million; | | 0.95% next $500 million; | | | | | | |
| | | 0.90% $1 billion and over | | 0.90% $1 billion and over | | | | | | |
Small Cap Growth Fund | | 0.95% | | 0.95% | | 0.85 | % | | 1.40 | % |
Mid-Cap Growth Fund | | 1.00% to $500 million; | | 0.90% to $500 million; | | 0.8769 | % | | 1.40 | % |
| | | 0.90% next $500 million; | | 0.85% next $500 million; | | | | | | |
| | | 0.85% $1 billion and over | | 0.80% $1 billion and over | | | | | | |
Mid Cap Value Fund | | 0.90% to $500 million; | | 0.90% to $500 million; | | 0.90 | % | | 1.35 | % |
| | | 0.85% next $500 million; | | 0.85% next $500 million; | | | | | | |
| | | 0.80% $1 billion and over | | 0.80% $1 billion and over | | | | | | |
Technology Fund | | 1.00% | | 1.00% | | 1.00 | % | | 1.40 | % |
Health Sciences Fund | | 1.00% | | 1.00% | | 1.00 | % | | 1.40 | % |
Managed OTC Fund | | 0.85% | | 0.85% | | 0.85 | % | | 1.25 | % |
Capital Growth Fund | | 1.00% to $500 million; | | 0.90% to $500 million; | | 0.9489 | % | | 1.30 | % |
| | | 0.90% next $500 million; | | 0.85% next $500 million; | | | | | | |
| | | 0.85% $1 billion and over | | 0.80% $1 billion and over | | | | | | |
Concentrated Growth Fund | | 1.00% to $500 million; | | 0.90% to $500 million; | | 0.9075 | % | | 1.25 | % |
| | | 0.90% next $500 million; | | 0.85% next $500 million; | | | | | | |
| | | 0.85% $1 billion and over | | 0.80% $1 billion and over | | | | | | |
Core Value Fund | | 0.85% | | 0.85% | | 0.85 | % | | 1.20 | % |
Large Cap Core Fund | | 0.80% to $500 million; | | 0.80% to $500 million; | | 0.80 | % | | 1.00 | % |
| | | 0.75% next $500 million; | | 0.75% next $500 million; | | | | | | |
| | | 0.70% $1 billion and over | | 0.70% $1 billion and over | | | | | | |
Equity Income Fund | | 1.00% to $500 million; | | 0.85% to $500 million; | | 0.7645 | % | | 1.15 | % |
| | | 0.80% next $500 million; | | 0.80% next $500 million; | | | | | | |
| | | 0.75% $1 billion and over | | 0.75% $1 billion and over | | | | | | |
Balanced Fund | | 0.90% to $500 million; | | 0.75% to $500 million; | | 0.8649 | % | | 1.15 | % |
| | | 0.80% next $500 million; | | 0.70% next $500 million; | | | | | | |
| | | 0.75% $1 billion and over | | 0.65% $1 billion and over | | | | | | |
High Yield Bond Fund | | 0.70% to $500 million; | | 0.70% to $500 million; | | 0.70 | % | | 1.00 | % |
| | | 0.65% next $500 million; | | 0.65% next $500 million; | | | | | | |
| | | 0.60% $1 billion and over | | 0.60% $1 billion and over | | | | | | |
Money Market Fund | | 0.50% | | 0.50% | | 0.4967 | % | | 1.00 | % |
The Investment Manager has voluntarily agreed to waive portions of its advisory fees equal to 0.05% of average daily net assets of International Growth, and 0.10% of average daily net assets of Small Cap Growth for the year ended October 31, 2005. The Investment Manager will waive a portion of its advisory fee for the Money Market Fund to the extent necessary to keep net operating expenses from exceeding total investment income. Such voluntary fee waivers or reductions have been calculated prior to any fee reimbursements with
131
respect to the expense limitations, and may be rescinded at any time and without notice to investors. All reimbursements by the Investment Manager are reflected in the Statements of Operations.
Management of the Company
Certain officers and directors of the Funds are officers or directors of the Investment Manager. The Funds pay no compensation directly to their officers or interested directors.
Distributor
Prudential Investment Management Services LLC (“PIMS”) and American Skandia Marketing, Incorporated (“ASMI”), both affiliates of Prudential Investments LLC and an indirect, wholly-owned subsidiary of Prudential serves as the distributor for the Funds. The Company has adopted a separate Distribution and Service plan (each a “Plan” and collectively the “Plans”) for Class A, B, C, D, L, M and X shares of each Fund in accordance with the requirements of Rule 12b-1 of the Investment Company Act of 1940.
During the year ended October 31, 2005, PIMS has advised the Funds, front-end sales charges (“FESC”) and gross contingent deferred sales charges (“CDSC”) were approximately as follows:
| | | | | | | | | | | | | | | | | | |
| | | Class A
FESC
| | Class A
CDSC
| | Class B
CDSC
| | Class C
CDSC
| | Class M
CDSC
| | Class X
CDSC
|
International Growth | | $ | 50,900 | | $ | 200 | | $ | 6,400 | | $ | 1,900 | | $ | 555,000 | | $ | 126,800 |
Small Cap Growth | | | 14,200 | | | 300 | | | 2,100 | | | 300 | | | 103,000 | | | 20,700 |
Mid-Cap Growth | | | 57,100 | | | — | | | 9,800 | | | 1,600 | | | 400,300 | | | 79,100 |
Mid Cap Value | | | 107,000 | | | 600 | | | 7,700 | | | 5,900 | | | 544,300 | | | 90,700 |
Technology | | | 5,500 | | | — | | | 1,800 | | | 200 | | | 68,000 | | | 3,800 |
Health Sciences | | | 28,100 | | | — | | | 900 | | | 300 | | | 48,300 | | | 6,800 |
Managed OTC | | | 26,900 | | | — | | | 25,400 | | | 400 | | | 116,200 | | | 7,100 |
Capital Growth | | | 231,600 | | | — | | | 23,600 | | | 8,700 | | | 1,434,400 | | | 225,100 |
Concentrated Growth | | | 85,100 | | | 300 | | | 17,900 | | | 1,500 | | | 1,150,000 | | | 152,800 |
Core Value | | | 22,100 | | | — | | | 1,300 | | | 700 | | | 102,300 | | | 26,400 |
Large Cap Core | | | 41,500 | | | — | | | 7,400 | | | 2,500 | | | 480,300 | | | 31,800 |
Equity Income | | | 49,900 | | | 400 | | | 9,800 | | | 1,600 | | | 526,200 | | | 85,700 |
Balanced | | | 65,100 | | | 400 | | | 3,900 | | | 600 | | | 285,000 | | | 57,300 |
High Yield Bond | | | 67,600 | | | — | | | 8,600 | | | 1,800 | | | 556,000 | | | 45,100 |
Money Market | | | — | | | — | | | — | | | — | | | 601,700 | | | 154,800 |
Under the Plans, the Funds compensate PIMS and ASMI a distribution and service fee at an annual rate up to 0.30%, 1.00%, 1.00%, 0.50%, 0.50%, 1.00% and 1.00% of the average daily net assets of the Class A, B, C, D, L, M and X shares, respectively. For the year ended October 31, 2005, PIMS has contractually agreed to limit such fees to .25 of 1% of the average daily net assets of the Class A shares.
Transfer Agent
Prudential Mutual Fund Services LLC (“PMFS”), an affiliate of Prudential Investments LLC and an indirect, wholly-owned subsidiary of Prudential, serves as the Funds’ transfer agent. Transfer agent fees and expenses are shown in the Statements of Operations.
Cash Sweep
The Funds invest in the Taxable Money Market Series (the “Series”), a portfolio of Dryden Core Investment Fund, pursuant to an exemptive order received from the Securities and Exchange Commission. The Series is a money market mutual fund registered under the Investment Company Act of 1940, as amended, and managed by PI.
Securities Lending Agent
Effective October 1, 2005, Prudential Investment Management, Inc. (“PIM”), an indirect, wholly-owned subsidiary of Prudential, took over as the Funds’ securities lending agent. For the period through October 31, 2005, PIM has been compensated approximately $21,000 for these services.
132
Broker
For the year ended October 31, 2005, Wachovia Securities LLC (“Wachovia”), an affiliate of PI, earned the following amount of brokerage commissions from portfolio transactions executed on behalf of the Funds:
| | | |
Mid-Cap Growth | | $ | 1,605 |
Mid Cap Value | | | 2,865 |
Technology | | | 95 |
4. Shares of Capital Stock
Class A shares (except for Money Market) are sold with a front-end sales charge of up to 5.50%. Purchases of $1 million or more are subject to a contingent deferred sales charge (“CDSC”) if shares are redeemed within 12 months of their purchase. Class B shares (except for Money Market) are sold with a CDSC which declines from 5% to zero depending upon the period of time the shares are held. Class B shares will automatically convert to Class A shares approximately seven years after purchase. Class C shares are sold with a CDSC of 1% during the first 12 months. Class X shares are closed to new purchases. In addition, for Money Market only, Class D shares are offered with no sales charge. The authorized capital stock of the Funds is 5.5 billion shares, with a par value of $.001 per share.
Transactions in shares of capital stock, during the year ended October 31, 2005, were as follows:
| | | | | | | | | | | | | | | | | | | | | | | | | | | | | | | | | | | | | | | | | | |
| | | CLASS A
| | | CLASS B
| | | CLASS C
| | | CLASS L
| | | CLASS M
| | | CLASS X
| |
| | | SHARES
| | | AMOUNT
| | | SHARES
| | | AMOUNT
| | | SHARES
| | | AMOUNT
| | | SHARES
| | | AMOUNT
| | | SHARES
| | | AMOUNT
| | | SHARES
| | | AMOUNT
| |
INTERNATIONAL GROWTH: | | | | | | | | | | | | | | | | | | | | | | | | | | | | | | | | | | | | | | | | | | |
Sold | | 846,268 | | | $ | 10,858,026 | | | 343,850 | | | $ | 4,324,095 | | | 228,000 | | | $ | 2,870,635 | | | 133,959 | | | $ | 1,720,179 | | | 505,054 | | | $ | 6,314,146 | | | 98,448 | | | $ | 1,237,664 | |
Reinvested | | 12,713 | | | | 159,672 | | | 477 | | | | 5,859 | | | 19,575 | | | | 240,965 | | | 40,035 | | | | 502,843 | | | 41,086 | | | | 504,535 | | | 12,519 | | | | 153,732 | |
Redeemed | | (607,760 | ) | | | (7,898,438 | ) | | (234,803 | ) | | | (2,980,127 | ) | | (1,415,305 | ) | | | (17,833,016 | ) | | (2,155,985 | ) | | | (27,702,830 | ) | | (2,834,329 | ) | | | (35,731,777 | ) | | (728,015 | ) | | | (9,171,182 | ) |
| | |
|
| |
|
|
| |
|
| |
|
|
| |
|
| |
|
|
| |
|
| |
|
|
| |
|
| |
|
|
| |
|
| |
|
|
|
Net Increase/(Decrease) before Conversion | | 251,221 | | | | 3,119,260 | | | 109,524 | | | | 1,349,827 | | | (1,167,730 | ) | | | (14,721,416 | ) | | (1,981,991 | ) | | | (25,479,808 | ) | | (2,288,189 | ) | | | (28,913,096 | ) | | (617,048 | ) | | | (7,779,786 | ) |
Conversion from Class B into Class A | | 330 | | | | 4,392 | | | (339 | ) | | | (4,392 | ) | | — | | | | — | | | — | | | | — | | | — | | | | — | | | — | | | | — | |
| | |
|
| |
|
|
| |
|
| |
|
|
| |
|
| |
|
|
| |
|
| |
|
|
| |
|
| |
|
|
| |
|
| |
|
|
|
Net Increase/(Decrease) | | 251,551 | | | $ | 3,123,652 | | | 109,185 | | | $ | 1,345,435 | | | (1,167,730 | ) | | $ | (14,721,416 | ) | | (1,981,991 | ) | | $ | (25,479,808 | ) | | (2,288,189 | ) | | $ | (28,913,096 | ) | | (617,048 | ) | | $ | (7,779,786 | ) |
| | |
|
| |
|
|
| |
|
| |
|
|
| |
|
| |
|
|
| |
|
| |
|
|
| |
|
| |
|
|
| |
|
| |
|
|
|
SMALL CAP GROWTH | | | | | | | | | | | | | | | | | | | | | | | | | | | | | | | | | | | | | | | | | | |
Sold | | 2,195,380 | | | $ | 11,499,809 | | | 1,521,113 | | | $ | 7,042,374 | | | 3,301,876 | | | $ | 19,190,865 | | | 1,928,392 | | | $ | 6,691,923 | | | 5,443,416 | | | $ | 31,767,775 | | | 1,503,989 | | | $ | 4,199,894 | |
Redeemed | | (368,336 | ) | | | (1,971,305 | ) | | (21,892 | ) | | | (145,944 | ) | | (684,627 | ) | | | (3,578,979 | ) | | (834,159 | ) | | | (4,471,436 | ) | | (1,270,203 | ) | | | (6,627,717 | ) | | (269,171 | ) | | | (1,402,458 | ) |
| | |
|
| |
|
|
| |
|
| |
|
|
| |
|
| |
|
|
| |
|
| |
|
|
| |
|
| |
|
|
| |
|
| |
|
|
|
Net Increase/(Decrease) before Conversion | | 1,827,044 | | | | 9,528,504 | | | 1,499,221 | | | | 6,896,430 | | | 2,617,249 | | | | 15,611,886 | | | 1,094,233 | | | | 2,220,487 | | | 4,173,213 | | | | 25,140,058 | | | 1,234,818 | | | | 2,797,436 | |
Conversion from Class B into Class A | | 6,116 | | | | 34,188 | | | (6,390 | ) | | | (34,188 | ) | | — | | | | — | | | — | | | | — | | | — | | | | — | | | — | | | | — | |
| | |
|
| |
|
|
| |
|
| |
|
|
| |
|
| |
|
|
| |
|
| |
|
|
| |
|
| |
|
|
| |
|
| |
|
|
|
Net Increase/(Decrease) | | 1,833,160 | | | $ | 9,562,692 | | | 1,492,831 | | | $ | 6,862,242 | | | 2,617,249 | | | $ | 15,611,886 | | | 1,094,233 | | | $ | 2,220,487 | | | 4,173,213 | | | $ | 25,140,058 | | | 1,234,818 | | | $ | 2,797,436 | |
| | |
|
| |
|
|
| |
|
| |
|
|
| |
|
| |
|
|
| |
|
| |
|
|
| |
|
| |
|
|
| |
|
| |
|
|
|
MID-CAP GROWTH: | | | | | | | | | | | | | | | | | | | | | | | | | | | | | | | | | | | | | | | | | | |
Sold | | 1,840,530 | | | $ | 8,367,475 | | | 311,247 | | | $ | 1,382,274 | | | 484,092 | | | $ | 2,154,365 | | | 181,141 | | | $ | 819,980 | | | 660,618 | | | $ | 2,940,137 | | | 124,542 | | | $ | 557,158 | |
Redeemed | | (1,392,069 | ) | | | (6,406,848 | ) | | (75,553 | ) | | | (339,019 | ) | | (2,203,787 | ) | | | (9,764,295 | ) | | (3,946,048 | ) | | | (17,740,470 | ) | | (5,205,983 | ) | | | (23,160,141 | ) | | (1,054,621 | ) | | | (4,644,333 | ) |
| | |
|
| |
|
|
| |
|
| |
|
|
| |
|
| |
|
|
| |
|
| |
|
|
| |
|
| |
|
|
| |
|
| |
|
|
|
Net Increase/(Decrease) before Conversion | | 448,461 | | | | 1,960,627 | | | 235,694 | | | | 1,043,255 | | | (1,719,695 | ) | | | (7,609,930 | ) | | (3,764,907 | ) | | | (16,920,490 | ) | | (4,545,365 | ) | | | (20,220,004 | ) | | (930,079 | ) | | | (4,087,175 | ) |
Conversion from Class B into Class A | | 2,133 | | | | 9,660 | | | (2,182 | ) | | | (9,660 | ) | | — | | | | — | | | — | | | | — | | | — | | | | — | | | — | | | | — | |
| | |
|
| |
|
|
| |
|
| |
|
|
| |
|
| |
|
|
| |
|
| |
|
|
| |
|
| |
|
|
| |
|
| |
|
|
|
Net Increase/(Decrease) | | 450,594 | | | $ | 1,970,287 | | | 233,512 | | | $ | 1,033,595 | | | (1,719,695 | ) | | $ | (7,609,930 | ) | | (3,764,907 | ) | | $ | (16,920,490 | ) | | (4,545,365 | ) | | $ | (20,220,004 | ) | | (930,079 | ) | | $ | (4,087,175 | ) |
| | |
|
| |
|
|
| |
|
| |
|
|
| |
|
| |
|
|
| |
|
| |
|
|
| |
|
| |
|
|
| |
|
| |
|
|
|
MID CAP VALUE: | | | | | | | | | | | | | | | | | | | | | | | | | | | | | | | | | | | | | | | | | | |
Sold | | 788,399 | | | $ | 15,452,692 | | | 136,307 | | | $ | 2,529,641 | | | 387,615 | | | $ | 7,269,131 | | | 183,538 | | | $ | 3,547,575 | | | 638,701 | | | $ | 12,027,462 | | | 129,564 | | | $ | 2,433,467 | |
Reinvested | | 92,981 | | | | 1,722,930 | | | 7,986 | | | | 142,787 | | | 356,992 | | | | 6,372,310 | | | 367,808 | | | | 6,782,379 | | | 904,962 | | | | 16,153,566 | | | 176,016 | | | | 3,133,082 | |
Redeemed | | (588,135 | ) | | | (11,621,748 | ) | | (23,758 | ) | | | (461,129 | ) | | (962,832 | ) | | | (18,095,709 | ) | | (1,620,680 | ) | | | (31,232,708 | ) | | (2,211,536 | ) | | | (41,715,526 | ) | | (423,011 | ) | | | (7,943,174 | ) |
| | |
|
| |
|
|
| |
|
| |
|
|
| |
|
| |
|
|
| |
|
| |
|
|
| |
|
| |
|
|
| |
|
| |
|
|
|
Net Increase/(Decrease) before Conversion | | 293,245 | | | | 5,553,874 | | | 120,535 | | | | 2,211,299 | | | (218,225 | ) | | | (4,454,268 | ) | | (1,069,334 | ) | | | (20,902,754 | ) | | (667,873 | ) | | | (13,534,498 | ) | | (117,431 | ) | | | (2,376,625 | ) |
Conversion from Class B into Class A | | 1,910 | | | | 38,681 | | | (1,989 | ) | | | (38,681 | ) | | — | | | | — | | | — | | | | — | | | — | | | | — | | | — | | | | — | |
| | |
|
| |
|
|
| |
|
| |
|
|
| |
|
| |
|
|
| |
|
| |
|
|
| |
|
| |
|
|
| |
|
| |
|
|
|
Net Increase/(Decrease) | | 295,155 | | | $ | 5,592,555 | | | 118,546 | | | $ | 2,172,618 | | | (218,225 | ) | | $ | (4,454,268 | ) | | (1,069,334 | ) | | $ | (20,902,754 | ) | | (667,873 | ) | | $ | (13,534,498 | ) | | (117,431 | ) | | $ | (2,376,625 | ) |
| | |
|
| |
|
|
| |
|
| |
|
|
| |
|
| |
|
|
| |
|
| |
|
|
| |
|
| |
|
|
| |
|
| |
|
|
|
TECHNOLOGY: | | | | | | | | | | | | | | | | | | | | | | | | | | | | | | | | | | | | | | | | | | |
Sold | | 956,800 | | | $ | 2,594,595 | | | 90,803 | | | $ | 237,008 | | | 117,694 | | | $ | 310,732 | | | 18,339 | | | $ | 49,314 | | | 50,060 | | | $ | 134,140 | | | 10,669 | | | $ | 28,107 | |
Redeemed | | (669,195 | ) | | | (1,829,720 | ) | | (32,982 | ) | | | (86,948 | ) | | (983,621 | ) | | | (2,583,134 | ) | | (835,217 | ) | | | (2,285,139 | ) | | (1,133,160 | ) | | | (2,980,437 | ) | | (246,301 | ) | | | (648,830 | ) |
| | |
|
| |
|
|
| |
|
| |
|
|
| |
|
| |
|
|
| |
|
| |
|
|
| |
|
| |
|
|
| |
|
| |
|
|
|
Net Increase/(Decrease) before Conversion | | 287,605 | | | | 764,875 | | | 57,821 | | | | 150,061 | | | (865,927 | ) | | | (2,272,402 | ) | | (816,878 | ) | | | (2,235,825 | ) | | (1,083,100 | ) | | | (2,846,297 | ) | | (235,632 | ) | | | (620,723 | ) |
Conversion from Class B into Class A | | 4,525 | | | | 12,308 | | | (4,698 | ) | | | (12,308 | ) | | — | | | | — | | | — | | | | — | | | — | | | | — | | | — | | | | — | |
| | |
|
| |
|
|
| |
|
| |
|
|
| |
|
| |
|
|
| |
|
| |
|
|
| |
|
| |
|
|
| |
|
| |
|
|
|
Net Increase/(Decrease) | | 292,130 | | | $ | 777,183 | | | 53,123 | | | $ | 137,752 | | | (865,927 | ) | | $ | (2,272,402 | ) | | (816,878 | ) | | $ | (2,235,825 | ) | | (1,083,100 | ) | | $ | (2,846,297 | ) | | (235,632 | ) | | $ | (620,723 | ) |
| | |
|
| |
|
|
| |
|
| |
|
|
| |
|
| |
|
|
| |
|
| |
|
|
| |
|
| |
|
|
| |
|
| |
|
|
|
133
| | | | | | | | | | | | | | | | | | | | | | | | | | | | | | | | | | | | | | | | | | |
| | | CLASS A
| | | CLASS B
| | | CLASS C
| | | CLASS L
| | | CLASS M
| | | CLASS X
| |
| | | SHARES
| | | AMOUNT
| | | SHARES
| | | AMOUNT
| | | SHARES
| | | AMOUNT
| | | SHARES
| | | AMOUNT
| | | SHARES
| | | AMOUNT
| | | SHARES
| | | AMOUNT
| |
HEALTH SCIENCES: | | | | | | | | | | | | | | | | | | | | | | | | | | | | | | | | | | | | | | | | | | |
Sold | | 359,276 | | | $ | 4,400,105 | | | 66,035 | | | $ | 781,531 | | | 49,241 | | | $ | 575,281 | | | 19,634 | | | $ | 235,039 | | | 151,722 | | | $ | 1,770,145 | | | 11,682 | | | $ | 135,153 | |
Redeemed | | (99,140 | ) | | | (1,174,632 | ) | | (17,282 | ) | | | (242,729 | ) | | (139,229 | ) | | | (1,609,572 | ) | | (171,677 | ) | | | (2,032,233 | ) | | (224,751 | ) | | | (2,629,328 | ) | | (41,737 | ) | | | (480,124 | ) |
| | |
|
| |
|
|
| |
|
| |
|
|
| |
|
| |
|
|
| |
|
| |
|
|
| |
|
| |
|
|
| |
|
| |
|
|
|
Net Increase/(Decrease) before Conversion | | 260,136 | | | | 3,225,473 | | | 48,753 | | | | 538,802 | | | (89,988 | ) | | | (1,034,291 | ) | | (152,043 | ) | | | (1,797,194 | ) | | (73,029 | ) | | | (859,183 | ) | | (30,055 | ) | | | (344,971 | ) |
Conversion from Class B into Class A | | 4,649 | | | | 13,778 | | | (4,825 | ) | | | (13,778 | ) | | — | | | | — | | | — | | | | — | | | — | | | | — | | | — | | | | — | |
| | |
|
| |
|
|
| |
|
| |
|
|
| |
|
| |
|
|
| |
|
| |
|
|
| |
|
| |
|
|
| |
|
| |
|
|
|
Net Increase/(Decrease) | | 264,785 | | | $ | 3,239,251 | | | 43,928 | | | $ | 525,024 | | | (89,988 | ) | | $ | (1,034,291 | ) | | (152,043 | ) | | $ | (1,797,194 | ) | | (73,029 | ) | | $ | (859,183 | ) | | (30,055 | ) | | $ | (344,971 | ) |
| | |
|
| |
|
|
| |
|
| |
|
|
| |
|
| |
|
|
| |
|
| |
|
|
| |
|
| |
|
|
| |
|
| |
|
|
|
MANAGED OTC: | | | | | | | | | | | | | | | | | | | | | | | | | | | | | | | | | | | | | | | | | | |
Sold | | 527,279 | | | $ | 1,394,087 | | | 231,562 | | | $ | 575,257 | | | 218,421 | | | $ | 559,968 | | | 122,482 | | | $ | 319,814 | | | 505,086 | | | $ | 1,326,578 | | | 141,295 | | | $ | 378,029 | |
Redeemed | | (403,749 | ) | | | (1,068,351 | ) | | (241,588 | ) | | | (629,223 | ) | | (1,785,136 | ) | | | (4,592,306 | ) | | (1,112,597 | ) | | | (2,935,571 | ) | | (2,507,688 | ) | | | (6,532,170 | ) | | (410,122 | ) | | | (1,076,389 | ) |
| | |
|
| |
|
|
| |
|
| |
|
|
| |
|
| |
|
|
| |
|
| |
|
|
| |
|
| |
|
|
| |
|
| |
|
|
|
Net Increase/(Decrease) before Conversion | | 123,530 | | | | 325,736 | | | (10,026 | ) | | | (53,966 | ) | | (1,566,715 | ) | | | (4,032,338 | ) | | (990,115 | ) | | | (2,615,757 | ) | | (2,002,602 | ) | | | (5,205,592 | ) | | (268,827 | ) | | | (698,360 | ) |
Conversion from Class B into Class A | | 207 | | | | 573 | | | (212 | ) | | | (573 | ) | | — | | | | — | | | — | | | | — | | | — | | | | — | | | — | | | | — | |
| | |
|
| |
|
|
| |
|
| |
|
|
| |
|
| |
|
|
| |
|
| |
|
|
| |
|
| |
|
|
| |
|
| |
|
|
|
Net Increase/(Decrease) | | 123,737 | | | $ | 326,309 | | | (10,238 | ) | | $ | (54,539 | ) | | (1,566,715 | ) | | $ | (4,032,338 | ) | | (990,115 | ) | | $ | (2,615,757 | ) | | (2,002,602 | ) | | $ | (5,205,592 | ) | | (268,827 | ) | | $ | (698,360 | ) |
| | |
|
| |
|
|
| |
|
| |
|
|
| |
|
| |
|
|
| |
|
| |
|
|
| |
|
| |
|
|
| |
|
| |
|
|
|
CAPITAL GROWTH: | | | | | | | | | | | | | | | | | | | | | | | | | | | | | | | | | | | | | | | | | | |
Sold | | 1,434,973 | | | $ | 21,140,891 | | | 373,816 | | | $ | 5,290,603 | | | 679,704 | | | $ | 9,660,684 | | | 230,109 | | | $ | 3,351,268 | | | 745,504 | | | $ | 10,547,200 | | | 199,653 | | | $ | 2,838,004 | |
Redeemed | | (756,958 | ) | | | (11,275,079 | ) | | (51,741 | ) | | | (742,509 | ) | | (3,591,941 | ) | | | (51,104,127 | ) | | (3,769,556 | ) | | | (55,064,330 | ) | | (6,207,302 | ) | | | (88,339,227 | ) | | (1,098,975 | ) | | | (15,556,249 | ) |
| | |
|
| |
|
|
| |
|
| |
|
|
| |
|
| |
|
|
| |
|
| |
|
|
| |
|
| |
|
|
| |
|
| |
|
|
|
Net Increase/(Decrease) before Conversion | | 678,015 | | | | 9,865,812 | | | 322,075 | | | | 4,548,094 | | | (2,912,237 | ) | | | (41,443,443 | ) | | (3,539,447 | ) | | | (51,713,062 | ) | | (5,461,798 | ) | | | (77,792,027 | ) | | (899,322 | ) | | | (12,718,245 | ) |
Conversion from Class B into Class A | | 5,051 | | | | 78,298 | | | (5,247 | ) | | | (78,298 | ) | | — | | | | — | | | — | | | | — | | | — | | | | — | | | — | | | | — | |
| | |
|
| |
|
|
| |
|
| |
|
|
| |
|
| |
|
|
| |
|
| |
|
|
| |
|
| |
|
|
| |
|
| |
|
|
|
Net Increase/(Decrease) | | 683,066 | | | $ | 9,944,110 | | | 316,828 | | | $ | 4,469,796 | | | (2,912,237 | ) | | $ | (41,443,443 | ) | | (3,539,447 | ) | | $ | (51,713,062 | ) | | (5,461,798 | ) | | $ | (77,792,027 | ) | | (899,322 | ) | | $ | (12,718,245 | ) |
| | |
|
| |
|
|
| |
|
| |
|
|
| |
|
| |
|
|
| |
|
| |
|
|
| |
|
| |
|
|
| |
|
| |
|
|
|
CONCENTRATED GROWTH: | | | | | | | | | | | | | | | | | | | | | | | | | | | | | | | | | | | | | | | | | | |
Sold | | 807,929 | | | $ | 9,328,743 | | | 252,796 | | | $ | 2,502,215 | | | 168,808 | | | $ | 1,669,985 | | | 9,880 | | | $ | 115,110 | | | 51,692 | | | $ | 518,050 | | | 17,043 | | | $ | 171,223 | |
Redeemed | | (477,314 | ) | | | (5,516,812 | ) | | (56,229 | ) | | | (556,838 | ) | | (2,177,036 | ) | | | (21,573,820 | ) | | (2,210,745 | ) | | | (25,486,536 | ) | | (7,062,665 | ) | | | (70,121,999 | ) | | (1,075,766 | ) | | | (10,691,010 | ) |
| | |
|
| |
|
|
| |
|
| |
|
|
| |
|
| |
|
|
| |
|
| |
|
|
| |
|
| |
|
|
| |
|
| |
|
|
|
Net Increase/(Decrease) before Conversion | | 330,615 | | | | 3,811,931 | | | 196,567 | | | | 1,945,377 | | | (2,008,228 | ) | | | (19,903,835 | ) | | (2,200,865 | ) | | | (25,371,426 | ) | | (7,010,973 | ) | | | (69,603,949 | ) | | (1,058,723 | ) | | | (10,519,787 | ) |
Conversion from Class B into Class A | | 65 | | | | 750 | | | (76 | ) | | | (750 | ) | | — | | | | — | | | — | | | | — | | | — | | | | — | | | — | | | | — | |
| | |
|
| |
|
|
| |
|
| |
|
|
| |
|
| |
|
|
| |
|
| |
|
|
| |
|
| |
|
|
| |
|
| |
|
|
|
Net Increase/(Decrease) | | 330,680 | | | $ | 3,812,681 | | | 196,491 | | | $ | 1,944,627 | | | (2,008,228 | ) | | $ | (19,903,835 | ) | | (2,200,865 | ) | | $ | (25,371,426 | ) | | (7,010,973 | ) | | $ | (69,603,949 | ) | | (1,058,723 | ) | | $ | (10,519,787 | ) |
| | |
|
| |
|
|
| |
|
| |
|
|
| |
|
| |
|
|
| |
|
| |
|
|
| |
|
| |
|
|
| |
|
| |
|
|
|
CORE VALUE: | | | | | | | | | | | | | | | | | | | | | | | | | | | | | | | | | | | | | | | | | | |
Sold | | 242,808 | | | $ | 3,098,274 | | | 61,632 | | | $ | 781,681 | | | 204,051 | | | $ | 2,605,169 | | | 91,147 | | | $ | 1,153,356 | | | 403,499 | | | $ | 5,136,882 | | | 134,409 | | | $ | 1,707,851 | |
Reinvested | | 6,748 | | | | 84,419 | | | 604 | | | | 7,563 | | | 20,523 | | | | 256,748 | | | 20,365 | | | | 254,769 | | | 39,678 | | | | 496,372 | | | 8,755 | | | | 109,613 | |
Redeemed | | (113,046 | ) | | | (1,443,891 | ) | | (3,666 | ) | | | (46,975 | ) | | (337,631 | ) | | | (4,307,320 | ) | | (261,230 | ) | | | (3,329,327 | ) | | (572,328 | ) | | | (7,341,694 | ) | | (158,358 | ) | | | (2,030,974 | ) |
| | |
|
| |
|
|
| |
|
| |
|
|
| |
|
| |
|
|
| |
|
| |
|
|
| |
|
| |
|
|
| |
|
| |
|
|
|
Net Increase/(Decrease) before Conversion | | 136,510 | | | | 1,738,802 | | | 58,570 | | | | 742,269 | | | (113,057 | ) | | | (1,445,403 | ) | | (149,718 | ) | | | (1,921,202 | ) | | (129,151 | ) | | | (1,708,440 | ) | | (15,194 | ) | | | (213,510 | ) |
Conversion from Class B into Class A | | 1,514 | | | | 19,748 | | | (1,521 | ) | | | (19,748 | ) | | — | | | | — | | | — | | | | — | | | — | | | | — | | | — | | | | — | |
| | |
|
| |
|
|
| |
|
| |
|
|
| |
|
| |
|
|
| |
|
| |
|
|
| |
|
| |
|
|
| |
|
| |
|
|
|
Net Increase/(Decrease) | | 138,024 | | | $ | 1,758,550 | | | 57,049 | | | $ | 722,521 | | | (113,057 | ) | | $ | (1,445,403 | ) | | (149,718 | ) | | $ | (1,921,202 | ) | | (129,151 | ) | | $ | (1,708,440 | ) | | (15,194 | ) | | $ | (213,510 | ) |
| | |
|
| |
|
|
| |
|
| |
|
|
| |
|
| |
|
|
| |
|
| |
|
|
| |
|
| |
|
|
| |
|
| |
|
|
|
LARGE CAP CORE: | | | | | | | | | | | | | | | | | | | | | | | | | | | | | | | | | | | | | | | | | | |
Sold | | 1,164,500 | | | $ | 11,376,095 | | | 247,968 | | | $ | 2,368,400 | | | 824,549 | | | $ | 7,496,115 | | | 696,238 | | | $ | 5,985,019 | | | 2,142,153 | | | $ | 20,155,199 | | | 396,300 | | | $ | 3,598,485 | |
Redeemed | | (700,255 | ) | | | (6,610,683 | ) | | (55,640 | ) | | | (510,242 | ) | | (1,324,912 | ) | | | (12,098,955 | ) | | (1,253,136 | ) | | | (11,789,245 | ) | | (3,169,245 | ) | | | (29,003,478 | ) | | (286,674 | ) | | | (2,615,174 | ) |
| | |
|
| |
|
|
| |
|
| |
|
|
| |
|
| |
|
|
| |
|
| |
|
|
| |
|
| |
|
|
| |
|
| |
|
|
|
Net Increase/(Decrease) | | 464,245 | | | $ | 4,765,412 | | | 192,328 | | | $ | 1,858,158 | | | (500,363 | ) | | $ | (4,602,839 | ) | | (556,898 | ) | | $ | (5,804,226 | ) | | (1,027,092 | ) | | $ | (8,848,279 | ) | | 109,626 | | | $ | 983,311 | |
| | |
|
| |
|
|
| |
|
| |
|
|
| |
|
| |
|
|
| |
|
| |
|
|
| |
|
| |
|
|
| |
|
| |
|
|
|
EQUITY INCOME: | | | | | | | | | | | | | | | | | | | | | | | | | | | | | | | | | | | | | | | | | | |
Sold | | 1,016,385 | | | $ | 13,996,550 | | | 163,312 | | | $ | 2,188,574 | | | 1,546,648 | | | $ | 20,439,887 | | | 1,350,811 | | | $ | 18,283,904 | | | 4,255,327 | | | $ | 56,360,024 | | | 1,293,533 | | | $ | 17,091,926 | |
Reinvested | | 6,975 | | | | 96,464 | | | 71 | | | | 961 | | | 2,525 | | | | 34,168 | | | 19,535 | | | | 270,174 | | | 6,297 | | | | 85,324 | | | 1,755 | | | | 23,749 | |
Redeemed | | (658,544 | ) | | | (9,122,736 | ) | | (21,577 | ) | | | (292,954 | ) | | (921,495 | ) | | | (12,438,135 | ) | | (1,272,716 | ) | | | (17,625,621 | ) | | (2,444,257 | ) | | | (33,014,820 | ) | | (529,193 | ) | | | (7,120,043 | ) |
| | |
|
| |
|
|
| |
|
| |
|
|
| |
|
| |
|
|
| |
|
| |
|
|
| |
|
| |
|
|
| |
|
| |
|
|
|
Net Increase/(Decrease) before Conversion | | 364,816 | | | | 4,970,278 | | | 141,806 | | | | 1,896,581 | | | 627,678 | | | | 8,035,920 | | | 97,630 | | | | 928,457 | | | 1,817,367 | | | | 23,430,528 | | | 766,095 | | | | 9,995,632 | |
Conversion from Class B into Class A | | 479 | | | | 6,768 | | | (490 | ) | | | (6,768 | ) | | — | | | | — | | | — | | | | — | | | — | | | | — | | | — | | | | — | |
| | |
|
| |
|
|
| |
|
| |
|
|
| |
|
| |
|
|
| |
|
| |
|
|
| |
|
| |
|
|
| |
|
| |
|
|
|
Net Increase/(Decrease) | | 365,295 | | | $ | 4,977,046 | | | 141,316 | | | $ | 1,889,813 | | | 627,678 | | | $ | 8,035,920 | | | 97,630 | | | $ | 928,457 | | | 1,817,367 | | | $ | 23,430,528 | | | 766,095 | | | $ | 9,995,632 | |
| | |
|
| |
|
|
| |
|
| |
|
|
| |
|
| |
|
|
| |
|
| |
|
|
| |
|
| |
|
|
| |
|
| |
|
|
|
BALANCED: | | | | | | | | | | | | | | | | | | | | | | | | | | | | | | | | | | | | | | | | | | |
Sold | | 502,705 | | | $ | 6,627,496 | | | 116,105 | | | $ | 1,518,703 | | | 100,606 | | | $ | 1,323,750 | | | 54,676 | | | $ | 713,289 | | | 282,142 | | | $ | 3,682,163 | | | 58,296 | | | $ | 765,990 | |
Reinvested | | 5,387 | | | | 71,113 | | | 669 | | | | 8,840 | | | 7,617 | | | | 100,359 | | | 17,328 | | | | 228,515 | | | 28,379 | | | | 374,163 | | | 7,017 | | | | 92,426 | |
Redeemed | | (174,296 | ) | | | (2,296,824 | ) | | (20,610 | ) | | | (271,437 | ) | | (519,177 | ) | | | (6,822,925 | ) | | (716,146 | ) | | | (9,434,322 | ) | | (1,570,329 | ) | | | (20,608,129 | ) | | (349,449 | ) | | | (4,581,750 | ) |
| | |
|
| |
|
|
| |
|
| |
|
|
| |
|
| |
|
|
| |
|
| |
|
|
| |
|
| |
|
|
| |
|
| |
|
|
|
Net Increase/(Decrease) before Conversion | | 333,796 | | | | 4,401,785 | | | 96,164 | | | | 1,256,106 | | | (410,954 | ) | | | (5,398,816 | ) | | (644,142 | ) | | | (8,492,518 | ) | | (1,259,808 | ) | | | (16,551,803 | ) | | (284,136 | ) | | | (3,723,334 | ) |
Conversion from Class B into Class A | | 1,902 | | | | 25,069 | | | (1,906 | ) | | | (25,069 | ) | | — | | | | — | | | — | | | | — | | | — | | | | — | | | — | | | | — | |
| | |
|
| |
|
|
| |
|
| |
|
|
| |
|
| |
|
|
| |
|
| |
|
|
| |
|
| |
|
|
| |
|
| |
|
|
|
Net Increase/(Decrease) | | 335,698 | | | $ | 4,426,854 | | | 94,258 | | | $ | 1,231,037 | | | (410,954 | ) | | $ | (5,398,816 | ) | | (644,142 | ) | | $ | (8,492,518 | ) | | (1,259,808 | ) | | $ | (16,551,803 | ) | | (284,136 | ) | | $ | (3,723,334 | ) |
| | |
|
| |
|
|
| |
|
| |
|
|
| |
|
| |
|
|
| |
|
| |
|
|
| |
|
| |
|
|
| |
|
| |
|
|
|
134
| | | | | | | | | | | | | | | | | | | | | | | | | | | | | | | | | | | | | | | | | | |
| | | CLASS A
| | | CLASS B
| | | CLASS C
| | | CLASS L
| | | CLASS M
| | | CLASS X
| |
| | | SHARES
| | | AMOUNT
| | | SHARES
| | | AMOUNT
| | | SHARES
| | | AMOUNT
| | | SHARES
| | | AMOUNT
| | | SHARES
| | | AMOUNT
| | | SHARES
| | | AMOUNT
| |
HIGH YIELD BOND: | | | | | | | | | | | | | | | | | | | | | | | | | | | | | | | | | | | | | | | | | | |
Sold | | 1,266,984 | | | $ | 9,351,988 | | | 214,501 | | | $ | 1,589,584 | | | 747,611 | | | $ | 5,485,186 | | | 287,108 | | | $ | 2,135,648 | | | 1,944,542 | | | $ | 14,420,806 | | | 353,039 | | | $ | 2,616,692 | |
Reinvested | | 67,114 | | | | 496,867 | | | 7,613 | | | | 55,768 | | | 144,217 | | | | 1,065,632 | | | 117,688 | | | | 869,354 | | | 456,651 | | | | 3,366,446 | | | 100,084 | | | | 737,506 | |
Redeemed | | (1,409,600 | ) | | | (10,329,212 | ) | | (45,319 | ) | | | (332,955 | ) | | (2,386,334 | ) | | | (17,631,255 | ) | | (1,787,750 | ) | | | (13,215,810 | ) | | (6,914,498 | ) | | | (51,090,595 | ) | | (896,567 | ) | | | (6,650,587 | ) |
| | |
|
| |
|
|
| |
|
| |
|
|
| |
|
| |
|
|
| |
|
| |
|
|
| |
|
| |
|
|
| |
|
| |
|
|
|
Net Increase/(Decrease) before Conversion | | (75,502 | ) | | | (480,357 | ) | | 176,795 | | | | 1,312,397 | | | (1,494,506 | ) | | | (11,080,437 | ) | | (1,382,954 | ) | | | (10,210,808 | ) | | (4,513,305 | ) | | | (33,303,343 | ) | | (443,444 | ) | | | (3,296,389 | ) |
Conversion from Class B into Class A | | 3,378 | | | | 24,908 | | | (3,382 | ) | | | (24,908 | ) | | — | | | | — | | | — | | | | — | | | — | | | | — | | | — | | | | — | |
| | |
|
| |
|
|
| |
|
| |
|
|
| |
|
| |
|
|
| |
|
| |
|
|
| |
|
| |
|
|
| |
|
| |
|
|
|
Net Increase/(Decrease) | | (72,124 | ) | | $ | (455,449 | ) | | 173,413 | | | $ | 1,287,489 | | | (1,494,506 | ) | | $ | (11,080,437 | ) | | (1,382,954 | ) | | $ | (10,210,808 | ) | | (4,513,305 | ) | | $ | (33,303,343 | ) | | (443,444 | ) | | $ | (3,296,389 | ) |
| | |
|
| |
|
|
| |
|
| |
|
|
| |
|
| |
|
|
| |
|
| |
|
|
| |
|
| |
|
|
| |
|
| |
|
|
|
| | | | | | |
| | | CLASS A
| | | CLASS C
| | | CLASS D
| | | CLASS L
| | | CLASS M
| | | CLASS X
| |
| | | SHARES
| | | AMOUNT
| | | SHARES
| | | AMOUNT
| | | SHARES
| | | AMOUNT
| | | SHARES
| | | AMOUNT
| | | SHARES
| | | AMOUNT
| | | SHARES
| | | AMOUNT
| |
MONEY MARKET: | | | | | | | | | | | | | | | | | | | | | | | | | | | | | | | | | | | | | | | | | | |
Sold | | 55,097 | | | $ | 55,097 | | | 1,230,128 | | | $ | 1,230,128 | | | 5,389,855 | | | $ | 5,389,855 | | | 11,887,327 | | | $ | 11,887,327 | | | 43,018,513 | | | $ | 43,018,513 | | | 13,200,636 | | | $ | 13,200,636 | |
Reinvested | | 140 | | | | 140 | | | 92,464 | | | | 92,464 | | | 143,713 | | | | 143,713 | | | 352,300 | | | | 352,300 | | | 489,858 | | | | 489,859 | | | 109,688 | | | | 109,689 | |
Redeemed | | (22,515 | ) | | | (22,515 | ) | | (11,061,205 | ) | | | (11,061,217 | ) | | (8,493,037 | ) | | | (8,493,575 | ) | | (35,857,788 | ) | | | (35,857,789 | ) | | (62,533,193 | ) | | | (62,533,195 | ) | | (16,373,810 | ) | | | (16,373,810 | ) |
| | |
|
| |
|
|
| |
|
| |
|
|
| |
|
| |
|
|
| |
|
| |
|
|
| |
|
| |
|
|
| |
|
| |
|
|
|
Net Increase/(Decrease) | | 32,722 | | | $ | 32,722 | | | (9,738,613 | ) | | $ | (9,738,625 | ) | | (2,959,469 | ) | | $ | (2,960,007 | ) | | (23,618,161 | ) | | $ | (23,618,162 | ) | | (19,024,822 | ) | | $ | (19,024,823 | ) | | (3,063,486 | ) | | $ | (3,063,485 | ) |
| | |
|
| |
|
|
| |
|
| |
|
|
| |
|
| |
|
|
| |
|
| |
|
|
| |
|
| |
|
|
| |
|
| |
|
|
|
Transactions in shares of capital stock, during the year ended October 31, 2004, were as follows:
| | | | | | | | | | | | | | | | | | | | | | | | | | | | | | | | | | | | | | | | | | |
| | | CLASS A
| | | CLASS B
| | | CLASS C
| | | CLASS L
| | | CLASS M
| | | CLASS X
| |
| | | SHARES
| | | AMOUNT
| | | SHARES
| | | AMOUNT
| | | SHARES
| | | AMOUNT
| | | SHARES
| | | AMOUNT
| | | SHARES
| | | AMOUNT
| | | SHARES
| | | AMOUNT
| |
INTERNATIONAL GROWTH: | | | | | | | | | | | | | | | | | | | | | | | | | | | | | | | | | | | | | | | | | | |
Sold | | 1,050,355 | | | $ | 11,824,806 | | | 188,688 | | | $ | 2,100,234 | | | 3,699,119 | | | $ | 41,670,891 | | | 4,727,029 | | | $ | 39,461,552 | | | 6,530,937 | | | $ | 81,545,776 | | | 1,817,957 | | | $ | 19,466,759 | |
Reinvested | | 694 | | | | 7,905 | | | — | | | | — | | | — | | | | — | | | 7,021 | | | | 79,958 | | | — | | | | — | | | — | | | | — | |
Redeemed | | (149,025 | ) | | | (1,701,488 | ) | | (100,407 | ) | | | (1,124,237 | ) | | (2,166,332 | ) | | | (23,920,067 | ) | | (2,723,239 | ) | | | (30,808,943 | ) | | (2,744,440 | ) | | | (30,321,434 | ) | | (786,828 | ) | | | (8,691,692 | ) |
| | |
|
| |
|
|
| |
|
| |
|
|
| |
|
| |
|
|
| |
|
| |
|
|
| |
|
| |
|
|
| |
|
| |
|
|
|
Net Increase/(Decrease) | | 902,024 | | | $ | 10,131,223 | | | 88,281 | | | $ | 975,997 | | | 1,532,787 | | | $ | 17,750,824 | | | 2,010,811 | | | $ | 8,732,567 | | | 3,786,497 | | | $ | 51,224,342 | | | 1,031,129 | | | $ | 10,775,067 | |
| | |
|
| |
|
|
| |
|
| |
|
|
| |
|
| |
|
|
| |
|
| |
|
|
| |
|
| |
|
|
| |
|
| |
|
|
|
SMALL CAP GROWTH: | | | | | | | | | | | | | | | | | | | | | | | | | | | | | | | | | | | | | | | | | | |
Sold | | 446,197 | | | $ | 2,245,087 | | | 58,410 | | | $ | 289,730 | | | 423,589 | | | $ | 2,198,938 | | | 561,440 | | | $ | 2,954,835 | | | 930,395 | | | $ | 4,776,242 | | | 244,525 | | | $ | 1,258,847 | |
Redeemed | | (43,314 | ) | | | (220,990 | ) | | (1,719 | ) | | | (8,490 | ) | | (1,043,593 | ) | | | (5,300,660 | ) | | (1,515,219 | ) | | | (7,850,666 | ) | | (1,452,458 | ) | | | (7,341,222 | ) | | (316,050 | ) | | | (1,603,864 | ) |
| | |
|
| |
|
|
| |
|
| |
|
|
| |
|
| |
|
|
| |
|
| |
|
|
| |
|
| |
|
|
| |
|
| |
|
|
|
Net Increase/(Decrease) | | 402,883 | | | $ | 2,024,097 | | | 56,691 | | | $ | 281,240 | | | (620,004 | ) | | $ | (3,101,722 | ) | | (953,779 | ) | | $ | (4,895,831 | ) | | (522,063 | ) | | $ | (2,564,980 | ) | | (71,525 | ) | | $ | (345,017 | ) |
| | |
|
| |
|
|
| |
|
| |
|
|
| |
|
| |
|
|
| |
|
| |
|
|
| |
|
| |
|
|
| |
|
| |
|
|
|
MID-CAP GROWTH: | | | | | | | | | | | | | | | | | | | | | | | | | | | | | | | | | | | | | | | | | | |
Sold | | 2,198,686 | | | $ | 8,974,407 | | | 240,589 | | | $ | 968,602 | | | 7,930,760 | | | $ | 30,584,964 | | | 11,443,714 | | | $ | 43,552,947 | | | 20,422,916 | | | $ | 83,977,889 | | | 4,136,736 | | | $ | 14,550,003 | |
Redeemed | | (340,908 | ) | | | (1,408,824 | ) | | (6,440 | ) | | | (26,016 | ) | | (3,132,850 | ) | | | (12,530,737 | ) | | (4,709,947 | ) | | | (19,205,290 | ) | | (4,959,720 | ) | | | (19,953,592 | ) | | (997,158 | ) | | | (3,983,874 | ) |
| | |
|
| |
|
|
| |
|
| |
|
|
| |
|
| |
|
|
| |
|
| |
|
|
| |
|
| |
|
|
| |
|
| |
|
|
|
Net Increase/(Decrease) | | 1,857,778 | | | $ | 7,565,583 | | | 234,149 | | | $ | 942,586 | | | 4,797,910 | | | $ | 18,054,227 | | | 6,733,767 | | | $ | 24,347,657 | | | 15,463,196 | | | $ | 64,024,297 | | | 3,139,578 | | | $ | 10,566,129 | |
| | |
|
| |
|
|
| |
|
| |
|
|
| |
|
| |
|
|
| |
|
| |
|
|
| |
|
| |
|
|
| |
|
| |
|
|
|
MID CAP VALUE: | | | | | | | | | | | | | | | | | | | | | | | | | | | | | | | | | | | | | | | | | | |
Sold | | 814,751 | | | $ | 15,004,809 | | | 62,842 | | | $ | 1,132,501 | | | 1,858,076 | | | $ | 32,663,323 | | | 2,280,313 | | | $ | 39,633,245 | | | 3,311,025 | | | $ | 58,002,928 | | | 574,529 | | | $ | 10,049,749 | |
Reinvested | | — | | | | — | | | — | | | | — | | | 29,255 | | | | 507,275 | | | 34,773 | | | | 617,578 | | | 68,677 | | | | 1,190,179 | | | 13,306 | | | | 230,200 | |
Redeemed | | (106,341 | ) | | | (2,009,393 | ) | | (2,431 | ) | | | (44,076 | ) | | (1,362,157 | ) | | | (24,233,920 | ) | | (1,873,827 | ) | | | (34,268,419 | ) | | (1,786,953 | ) | | | (31,970,475 | ) | | (385,604 | ) | | | (6,877,793 | ) |
| | |
|
| |
|
|
| |
|
| |
|
|
| |
|
| |
|
|
| |
|
| |
|
|
| |
|
| |
|
|
| |
|
| |
|
|
|
Net Increase/(Decrease) | | 708,410 | | | $ | 12,995,416 | | | 60,411 | | | $ | 1,088,425 | | | 525,174 | | | $ | 8,936,678 | | | 441,259 | | | $ | 5,982,404 | | | 1,592,749 | | | $ | 27,222,632 | | | 202,231 | | | $ | 3,402,156 | |
| | |
|
| |
|
|
| |
|
| |
|
|
| |
|
| |
|
|
| |
|
| |
|
|
| |
|
| |
|
|
| |
|
| |
|
|
|
TECHNOLOGY: | | | | | | | | | | | | | | | | | | | | | | | | | | | | | | | | | | | | | | | | | | |
Sold | | 831,174 | | | $ | 2,170,892 | | | 68,352 | | | $ | 170,815 | | | 599,973 | | | $ | 1,629,845 | | | 818,815 | | | $ | 2,347,991 | | | 539,800 | | | $ | 1,493,256 | | | 190,743 | | | $ | 517,927 | |
Redeemed | | (285,856 | ) | | | (740,490 | ) | | (4,485 | ) | | | (11,900 | ) | | (962,622 | ) | | | (2,557,152 | ) | | (1,846,596 | ) | | | (5,042,630 | ) | | (933,246 | ) | | | (2,472,895 | ) | | (173,770 | ) | | | (456,412 | ) |
| | |
|
| |
|
|
| |
|
| |
|
|
| |
|
| |
|
|
| |
|
| |
|
|
| |
|
| |
|
|
| |
|
| |
|
|
|
Net Increase/(Decrease) | | 545,318 | | | $ | 1,430,402 | | | 63,867 | | | $ | 158,915 | | | (362,649 | ) | | $ | (927,307 | ) | | (1,027,781 | ) | | $ | (2,694,639 | ) | | (393,446 | ) | | $ | (979,639 | ) | | 16,973 | | | $ | 61,515 | |
| | |
|
| |
|
|
| |
|
| |
|
|
| |
|
| |
|
|
| |
|
| |
|
|
| |
|
| |
|
|
| |
|
| |
|
|
|
HEALTH SCIENCES: | | | | | | | | | | | | | | | | | | | | | | | | | | | | | | | | | | | | | | | | | | |
Sold | | 123,754 | | | $ | 1,409,259 | | | 24,718 | | | $ | 276,983 | | | 88,006 | | | $ | 995,705 | | | 83,016 | | | $ | 960,476 | | | 277,559 | | | $ | 3,082,196 | | | 62,537 | | | $ | 704,649 | |
Redeemed | | (22,371 | ) | | | (249,152 | ) | | (183 | ) | | | (2,000 | ) | | (118,004 | ) | | | (1,326,014 | ) | | (168,257 | ) | | | (1,908,272 | ) | | (195,606 | ) | | | (2,177,595 | ) | | (57,805 | ) | | | (653,656 | ) |
| | |
|
| |
|
|
| |
|
| |
|
|
| |
|
| |
|
|
| |
|
| |
|
|
| |
|
| |
|
|
| |
|
| |
|
|
|
Net Increase/(Decrease) | | 101,383 | | | $ | 1,160,107 | | | 24,535 | | | $ | 274,983 | | | (29,998 | ) | | $ | (330,309 | ) | | (85,241 | ) | | $ | (947,796 | ) | | 81,953 | | | $ | 904,601 | | | 4,732 | | | $ | 50,993 | |
| | |
|
| |
|
|
| |
|
| |
|
|
| |
|
| |
|
|
| |
|
| |
|
|
| |
|
| |
|
|
| |
|
| |
|
|
|
MANAGED OTC: | | | | | | | | | | | | | | | | | | | | | | | | | | | | | | | | | | | | | | | | | | |
Sold | | 620,579 | | | $ | 1,505,535 | | | 233,749 | | | $ | 549,446 | | | 1,558,590 | | | $ | 3,909,246 | | | 979,473 | | | $ | 2,477,134 | | | 2,421,007 | | | $ | 6,012,763 | | | 597,006 | | | $ | 1,476,478 | |
Redeemed | | (56,958 | ) | | | (139,590 | ) | | (17,923 | ) | | | (41,938 | ) | | (2,662,267 | ) | | | (6,452,018 | ) | | (1,851,437 | ) | | | (4,555,263 | ) | | (3,701,639 | ) | | | (8,921,315 | ) | | (686,645 | ) | | | (1,635,000 | ) |
| | |
|
| |
|
|
| |
|
| |
|
|
| |
|
| |
|
|
| |
|
| |
|
|
| |
|
| |
|
|
| |
|
| |
|
|
|
Net Increase/(Decrease) | | 563,621 | | | $ | 1,365,945 | | | 215,826 | | | $ | 507,508 | | | (1,103,677 | ) | | $ | (2,542,772 | ) | | (871,964 | ) | | $ | (2,078,129 | ) | | (1,280,632 | ) | | $ | (2,908,552 | ) | | (89,639 | ) | | $ | (158,522 | ) |
| | |
|
| |
|
|
| |
|
| |
|
|
| |
|
| |
|
|
| |
|
| |
|
|
| |
|
| |
|
|
| |
|
| |
|
|
|
CAPITAL GROWTH: | | | | | | | | | | | | | | | | | | | | | | | | | | | | | | | | | | | | | | | | | | |
Sold | | 1,773,464 | | | $ | 23,367,858 | | | 375,113 | | | $ | 4,861,604 | | | 4,123,618 | | | $ | 52,261,363 | | | 3,782,039 | | | $ | 49,150,192 | | | 6,314,729 | | | $ | 82,371,716 | | | 1,485,238 | | | $ | 17,351,219 | |
Redeemed | | (422,294 | ) | | | (5,723,929 | ) | | (141,947 | ) | | | (1,875,810 | ) | | (5,283,822 | ) | | | (67,329,854 | ) | | (4,720,356 | ) | | | (61,975,957 | ) | | (6,199,324 | ) | | | (79,108,282 | ) | | (1,132,153 | ) | | | (14,452,533 | ) |
| | |
|
| |
|
|
| |
|
| |
|
|
| |
|
| |
|
|
| |
|
| |
|
|
| |
|
| |
|
|
| |
|
| |
|
|
|
Net Increase/(Decrease) | | 1,351,170 | | | $ | 17,643,929 | | | 233,166 | | | $ | 2,985,794 | | | (1,160,204 | ) | | $ | (15,068,491 | ) | | (938,317 | ) | | $ | (12,825,765 | ) | | 115,405 | | | $ | 3,263,434 | | | 353,085 | | | $ | 2,898,686 | |
| | |
|
| |
|
|
| |
|
| |
|
|
| |
|
| |
|
|
| |
|
| |
|
|
| |
|
| |
|
|
| |
|
| |
|
|
|
CONCENTRATED GROWTH: | | | | | | | | | | | | | | | | | | | | | | | | | | | | | | | | | | | | | | | | | | |
Sold | | 1,000,937 | | | $ | 11,195,953 | | | 174,680 | | | $ | 1,677,359 | | | 437,077 | | | $ | 4,283,826 | | | 618,792 | | | $ | 6,961,708 | | | 688,521 | | | $ | 6,769,965 | | | 177,706 | | | $ | 1,754,820 | |
Redeemed | | (99,817 | ) | | | (1,096,070 | ) | | (8,022 | ) | | | (76,114 | ) | | (3,208,117 | ) | | | (31,208,619 | ) | | (3,561,377 | ) | | | (39,960,420 | ) | | (7,839,505 | ) | | | (76,221,543 | ) | | (1,193,524 | ) | | | (11,653,754 | ) |
| | |
|
| |
|
|
| |
|
| |
|
|
| |
|
| |
|
|
| |
|
| |
|
|
| |
|
| |
|
|
| |
|
| |
|
|
|
Net Increase/(Decrease) | | 901,120 | | | $ | 10,099,883 | | | 166,658 | | | $ | 1,601,245 | | | (2,771,040 | ) | | $ | (26,924,793 | ) | | (2,942,585 | ) | | $ | (32,998,712 | ) | | (7,150,984 | ) | | $ | (69,451,578 | ) | | (1,015,818 | ) | | $ | (9,898,934 | ) |
| | |
|
| |
|
|
| |
|
| |
|
|
| |
|
| |
|
|
| |
|
| |
|
|
| |
|
| |
|
|
| |
|
| |
|
|
|
CORE VALUE: | | | | | | | | | | | | | | | | | | | | | | | | | | | | | | | | | | | | | | | | | | |
Sold | | 207,659 | | | $ | 2,463,700 | | | 66,078 | | | $ | 796,050 | | | 418,035 | | | $ | 4,924,500 | | | 297,635 | | | $ | 3,502,915 | | | 809,557 | | | $ | 9,557,506 | | | 136,242 | | | $ | 1,613,147 | |
Reinvested | | — | | | | — | | | — | | | | — | | | 3,311 | | | | 38,441 | | | 4,573 | | | | 53,232 | | | 4,997 | | | | 58,009 | | | 975 | | | | 11,320 | |
Redeemed | | (67,551 | ) | | | (824,773 | ) | | (46,826 | ) | | | (567,331 | ) | | (802,257 | ) | | | (9,247,274 | ) | | (369,748 | ) | | | (4,359,597 | ) | | (498,660 | ) | | | (5,912,898 | ) | | (59,140 | ) | | | (700,423 | ) |
| | |
|
| |
|
|
| |
|
| |
|
|
| |
|
| |
|
|
| |
|
| |
|
|
| |
|
| |
|
|
| |
|
| |
|
|
|
Net Increase/(Decrease) | | 140,108 | | | $ | 1,638,927 | | | 19,252 | | | $ | 228,719 | | | (380,911 | ) | | $ | (4,284,333 | ) | | (67,540 | ) | | $ | (803,450 | ) | | 315,894 | | | $ | 3,702,617 | | | 78,077 | | | $ | 924,044 | |
| | |
|
| |
|
|
| |
|
| |
|
|
| |
|
| |
|
|
| |
|
| |
|
|
| |
|
| |
|
|
| |
|
| |
|
|
|
135
| | | | | | | | | | | | | | | | | | | | | | | | | | | | | | | | | | | | | | | | | | |
| | | CLASS A
| | | CLASS B
| | | CLASS C
| | | CLASS L
| | | CLASS M
| | | CLASS X
| |
| | | SHARES
| | | AMOUNT
| | | SHARES
| | | AMOUNT
| | | SHARES
| | | AMOUNT
| | | SHARES
| | | AMOUNT
| | | SHARES
| | | AMOUNT
| | | SHARES
| | | AMOUNT
| |
LARGE CAP CORE: | | | | | | | | | | | | | | | | | | | | | | | | | | | | | | | | | | | | | | | | | | |
Sold | | 1,030,207 | | | $ | 9,017,200 | | | 218,066 | | | $ | 1,874,286 | | | 1,150,668 | | | $ | 10,238,986 | | | 965,258 | | | $ | 8,799,541 | | | 2,518,904 | | | $ | 22,687,406 | | | 423,428 | | | $ | 3,788,337 | |
Reinvested | | 71 | | | | 834 | | | — | | | | — | | | — | | | | — | | | 473 | | | | 4,242 | | | — | | | | — | | | — | | | | — | |
Redeemed | | (180,430 | ) | | | (1,590,317 | ) | | (69,609 | ) | | | (612,031 | ) | | (2,152,041 | ) | | | (18,852,465 | ) | | (2,041,515 | ) | | | (18,385,214 | ) | | (2,891,704 | ) | | | (25,802,174 | ) | | (500,518 | ) | | | (4,439,692 | ) |
| | |
|
| |
|
|
| |
|
| |
|
|
| |
|
| |
|
|
| |
|
| |
|
|
| |
|
| |
|
|
| |
|
| |
|
|
|
Net Increase/(Decrease) | | 849,848 | | | $ | 7,427,717 | | | 148,457 | | | $ | 1,262,255 | | | (1,001,373 | ) | | $ | (8,613,479 | ) | | (1,075,784 | ) | | $ | (9,581,431 | ) | | (372,800 | ) | | $ | (3,114,768 | ) | | (77,090 | ) | | $ | (651,355 | ) |
| | |
|
| |
|
|
| |
|
| |
|
|
| |
|
| |
|
|
| |
|
| |
|
|
| |
|
| |
|
|
| |
|
| |
|
|
|
EQUITY INCOME: | | | | | | | | | | | | | | | | | | | | | | | | | | | | | | | | | | | | | | | | | | |
Sold | | 801,495 | | | $ | 10,234,325 | | | 87,515 | | | $ | 1,094,404 | | | 692,580 | | | $ | 8,577,841 | | | 594,467 | | | $ | 7,560,275 | | | 1,142,481 | | | $ | 14,178,033 | | | 317,020 | | | $ | 3,958,771 | |
Redeemed | | (106,221 | ) | | | (1,359,208 | ) | | (3,526 | ) | | | (43,930 | ) | | (1,975,106 | ) | | | (24,368,958 | ) | | (2,024,920 | ) | | | (25,781,858 | ) | | (2,446,067 | ) | | | (30,359,317 | ) | | (554,396 | ) | | | (6,886,613 | ) |
| | |
|
| |
|
|
| |
|
| |
|
|
| |
|
| |
|
|
| |
|
| |
|
|
| |
|
| |
|
|
| |
|
| |
|
|
|
Net Increase/(Decrease) | | 695,274 | | | $ | 8,875,117 | | | 83,989 | | | $ | 1,050,474 | | | (1,282,526 | ) | | $ | (15,791,117 | ) | | (1,430,453 | ) | | $ | (18,221,583 | ) | | (1,303,586 | ) | | $ | (16,181,284 | ) | | (237,376 | ) | | $ | (2,927,842 | ) |
| | |
|
| |
|
|
| |
|
| |
|
|
| |
|
| |
|
|
| |
|
| |
|
|
| |
|
| |
|
|
| |
|
| |
|
|
|
BALANCED: | | | | | | | | | | | | | | | | | | | | | | | | | | | | | | | | | | | | | | | | | | |
Sold | | 515,537 | | | $ | 6,373,095 | | | 89,595 | | | $ | 1,113,492 | | | 284,203 | | | $ | 3,501,320 | | | 389,816 | | | $ | 4,739,159 | | | 943,605 | | | $ | 11,602,493 | | | 212,017 | | | $ | 2,622,315 | |
Reinvested | | 1,720 | | | | 21,151 | | | 72 | | | | 891 | | | 10,116 | | | | 124,086 | | | 24,907 | | | | 306,046 | | | 31,174 | | | | 382,433 | | | 7,604 | | | | 93,214 | |
Redeemed | | (164,069 | ) | | | (2,047,942 | ) | | (21,039 | ) | | | (266,926 | ) | | (805,539 | ) | | | (9,961,380 | ) | | (1,264,768 | ) | | | (15,618,323 | ) | | (1,416,597 | ) | | | (17,441,505 | ) | | (330,708 | ) | | | (4,066,416 | ) |
| | |
|
| |
|
|
| |
|
| |
|
|
| |
|
| |
|
|
| |
|
| |
|
|
| |
|
| |
|
|
| |
|
| |
|
|
|
Net Increase/(Decrease) | | 353,188 | | | $ | 4,346,304 | | | 68,628 | | | $ | 847,457 | | | (511,220 | ) | | $ | (6,335,974 | ) | | (850,045 | ) | | $ | (10,573,118 | ) | | (441,818 | ) | | $ | (5,456,579 | ) | | (111,087 | ) | | $ | (1,350,887 | ) |
| | |
|
| |
|
|
| |
|
| |
|
|
| |
|
| |
|
|
| |
|
| |
|
|
| |
|
| |
|
|
| |
|
| |
|
|
|
HIGH YIELD BOND: | | | | | | | | | | | | | | | | | | | | | | | | | | | | | | | | | | | | | | | | | | |
Sold | | 1,119,275 | | | $ | 8,176,650 | | | 71,606 | | | $ | 522,070 | | | 2,258,489 | | | $ | 16,579,094 | | | 1,869,507 | | | $ | 13,689,059 | | | 3,479,459 | | | $ | 25,485,800 | | | 523,331 | | | $ | 3,833,642 | |
Reinvested | | 23,308 | | | | 172,462 | | | 1,219 | | | | 8,988 | | | 212,929 | | | | 1,565,516 | | | 213,386 | | | | 1,568,568 | | | 594,289 | | | | 4,364,359 | | | 123,562 | | | | 906,951 | |
Redeemed | | (133,342 | ) | | | (964,509 | ) | | (6,005 | ) | | | (43,238 | ) | | (4,103,255 | ) | | | (30,076,602 | ) | | (4,019,383 | ) | | | (29,475,957 | ) | | (7,696,468 | ) | | | (56,145,099 | ) | | (810,322 | ) | | | (5,921,621 | ) |
| | |
|
| |
|
|
| |
|
| |
|
|
| |
|
| |
|
|
| |
|
| |
|
|
| |
|
| |
|
|
| |
|
| |
|
|
|
Net Increase/(Decrease) | | 1,009,241 | | | $ | 7,384,603 | | | 66,820 | | | $ | 487,820 | | | (1,631,837 | ) | | $ | (11,931,992 | ) | | (1,936,490 | ) | | $ | (14,218,330 | ) | | (3,622,720 | ) | | $ | (26,294,940 | ) | | (163,429 | ) | | $ | (1,181,028 | ) |
| | |
|
| |
|
|
| |
|
| |
|
|
| |
|
| |
|
|
| |
|
| |
|
|
| |
|
| |
|
|
| |
|
| |
|
|
|
| | | | | | | | | | | | | | | | | | | | | | | | | | | | | | | | | | | |
| | | CLASS C
| | | CLASS D
| | | CLASS L
| | | CLASS M
| | | CLASS X
| |
| | | SHARES
| | | AMOUNT
| | | SHARES
| | | AMOUNT
| | | SHARES
| | | AMOUNT
| | | SHARES
| | | AMOUNT
| | | SHARES
| | | AMOUNT
| |
MONEY MARKET: | | | | | | | | | | | | | | | | | | | | | | | | | | | | | | | | | | | |
Sold | | 29,661,908 | | | $ | 29,661,723 | | | 43,430,435 | | | $ | 43,430,436 | | | 83,800,458 | | | $ | 83,800,458 | | | 63,806,252 | | | $ | 63,806,252 | | | 18,756,839 | | | $ | 18,756,837 | |
Reinvested | | 175 | | | | 175 | | | 50,024 | | | | 50,024 | | | 357,676 | | | | 357,676 | | | 2,028 | | | | 2,028 | | | 90 | | | | 90 | |
Redeemed | | (53,299,719 | ) | | | (53,299,740 | ) | | (27,501,191 | ) | | | (27,501,191 | ) | | (142,585,681 | ) | | | (142,585,681 | ) | | (104,042,545 | ) | | | (104,042,548 | ) | | (26,860,356 | ) | | | (26,860,357 | ) |
| | |
|
| |
|
|
| |
|
| |
|
|
| |
|
| |
|
|
| |
|
| |
|
|
| |
|
| |
|
|
|
Net Increase/(Decrease) | | (23,637,636 | ) | | $ | (23,637,842 | ) | | 15,979,268 | | | $ | 15,979,269 | | | (58,427,547 | ) | | $ | (58,427,547 | ) | | (40,234,265 | ) | | $ | (40,234,268 | ) | | (8,103,427 | ) | | $ | (8,103,430 | ) |
| | |
|
| |
|
|
| |
|
| |
|
|
| |
|
| |
|
|
| |
|
| |
|
|
| |
|
| |
|
|
|
5. Taxation
Each Fund intends to qualify as a regulated investment company under the Internal Revenue Code and to distribute all of its taxable income, including any net realized gains on investments, to shareholders. Accordingly, no provision for federal income or excise tax has been made.
For the year ended October 31, 2005, the tax character of the dividends paid, as reflected in the Statements of Changes in Net Assets were:
| | | | | | | | | |
| | | ORDINARY
INCOME
| | LONG-TERM
CAPITAL GAIN
| | TOTAL
DISTRIBUTIONS
|
International Growth | | $ | 1,698,413 | | $ | — | | $ | 1,698,413 |
Mid Cap Value | | | 9,429,006 | | | 28,187,639 | | | 37,616,645 |
Core Value | | | 144,591 | | | 1,125,279 | | | 1,269,870 |
Large Cap Core | | | 31,655 | | | — | | | 31,655 |
Equity Income | | | 527,377 | | | — | | | 527,377 |
Balanced | | | 975,175 | | | — | | | 975,175 |
High Yield Bond | | | 10,127,626 | | | — | | | 10,127,626 |
Money Market | | | 1,421,302 | | | — | | | 1,421,302 |
For the year ended October 31, 2004, the tax character of the dividends paid, as reflected in the Statements of Changes in Net Assets were:
| | | | | | | | | |
| | | ORDINARY
INCOME
| | LONG-TERM
CAPITAL GAIN
| | TOTAL
DISTRIBUTIONS
|
International Growth | | $ | 99,023 | | | — | | $ | 99,023 |
Mid Cap Value | | | — | | $ | 2,765,028 | | | 2,765,028 |
Core Value | | | 170,681 | | | — | | | 170,681 |
Large Cap Core | | | 5,076 | | | — | | | 5,076 |
Balanced | | | 990,489 | | | — | | | 990,489 |
High Yield Bond | | | 13,040,803 | | | — | | | 13,040,803 |
Money Market | | | 448,697 | | | — | | | 448,697 |
136
For federal income tax purposes, ordinary income dividends and short-term capital gain distributions are taxable as ordinary income. Long-term capital gains distributions are taxable as capital gains income.
The tax character of distributable earnings/(accumulated losses) at October 31, 2005 was:
| | | | | | | | | |
| | | UNDISTRIBUTED ORDINARY INCOME
| | UNDISTRIBUTED LONG-TERM CAPITAL GAIN
| | CAPITAL LOSS CARRYFORWARDS
|
International Growth | | | — | | | — | | $ | 158,826,890 |
Small Cap Growth | | $ | 632,970 | | $ | 1,613,657 | | | 128,277,213 |
Mid-Cap Growth | | | — | | | — | | | 153,730,402 |
Mid Cap Value | | | — | | | 59,130,489 | | | 2,115,059 |
Technology | | | — | | | — | | | 40,844,138 |
Health Sciences | | | — | | | 287,654 | | | — |
Managed OTC | | | — | | | — | | | 35,558,033 |
Capital Growth | | | — | | | — | | | 179,816,863 |
Concentrated Growth | | | — | | | — | | | 990,941,119 |
Core Value | | | 200,288 | | | 2,601,527 | | | — |
Large Cap Core | | | 333,122 | | | — | | | 32,611,029 |
Equity Income | | | 37,831 | | | — | | | 44,813,682 |
Balanced | | | 235,550 | | | — | | | 5,205,812 |
High Yield Bond | | | 987,326 | | | — | | | 34,066,828 |
Money Market | | | 33,321 | | | — | | | 15,463 |
At October 31, 2005, the following funds had, for federal income tax purposes, capital loss carryforwards available to offset future net realized capital gains. However, it is uncertain whether the Fund will be able to realize the full benefit prior to the expiration date.
| | | | | | | | | | | | | | | | | | | | | |
| | | EXPIRING OCTOBER 31,
|
| | | 2007
| | 2008
| | 2009
| | 2010
| | 2011
| | 2012
| | 2013
|
International Growth | | $ | 4,869,179 | | $ | 15,642,599 | | $ | 72,355,840 | | $ | 50,162,120 | | $ | 15,797,152 | | | — | | | — |
Small Cap Growth | | | 6,234,691 | | | 86,335,732 | | | 31,576,598 | | | 4,130,192 | | | — | | | — | | | — |
Mid-Cap Growth | | | — | | | 88,196,520 | | | 61,020,585 | | | 3,486,677 | | | 1,026,620 | | | — | | | — |
Mid Cap Value | | | — | | | — | | | — | | | 2,115,059 | | | — | | | — | | | — |
Technology | | | — | | | — | | | 16,299,417 | | | 17,782,577 | | | 6,709,869 | | $ | 52,275 | | | — |
Managed OTC | | | — | | | 1,097,897 | | | 13,155,667 | | | 12,453,037 | | | 4,038,335 | | | 4,246,151 | | $ | 566,946 |
Capital Growth | | | — | | | 15,284,085 | | | 83,527,795 | | | 81,004,983 | | | — | | | — | | | — |
Concentrated Growth | | | 19,361,142 | | | 304,073,150 | | | 384,441,491 | | | 201,055,611 | | | 82,009,725 | | | — | | | — |
Large Cap Core | | | — | | | 3,166,091 | | | 8,111,926 | | | 12,032,779 | | | 8,971,027 | | | 329,206 | | | — |
Equity Income | | | — | | | — | | | 19,147,340 | | | 15,133,362 | | | 10,532,980 | | | — | | | — |
Balanced | | | — | | | — | | | — | | | 1,737,156 | | | 3,468,656 | | | — | | | — |
High Yield Bond | | | — | | | — | | | 8,901,916 | | | 18,610,007 | | | 6,554,905 | | | — | | | — |
Money Market | | | — | | | — | | | — | | | — | | | — | | | — | | | 15,463 |
The following funds utilized losses deferred in prior years against current year capital gains as follows:
| | | |
International Growth | | $ | 45,866,998 |
Small Cap Growth | | | 144,473 |
Mid-Cap Growth | | | 30,601,668 |
Mid Cap Value | | | 4,142,994 |
Technology | | | 1,074,580 |
Health Sciences | | | 787,661 |
Capital Growth | | | 81,360,807 |
Concentrated Growth | | | 21,038,458 |
Large Cap Core | | | 5,787,410 |
Equity Income | | | 31,228,357 |
Balanced | | | 8,894,380 |
High Yield | | | 2,995,303 |
137
At October 31, 2005, the cost and unrealized appreciation or depreciation in value of the investments for federal income tax purposes, were as follows:
| | | | | | | | | | | | | | | | | | |
| | | TAX BASIS
| | GROSS UNREALIZED APPRECIATION
| | GROSS UNREALIZED (DEPRECIATION)
| | | NET UNREALIZED APPRECIATION (DEPRECIATION)
| | | OTHER TEMPORARY DIFFERENCES
| |
International Growth | | $ | 190,344,469 | | $ | 53,352,257 | | $ | (2,326,775 | ) | | $ | 51,025,482 | | | $ | (17,637 | ) |
Small Cap Growth | | | 107,354,096 | | | 8,849,376 | | | (5,992,663 | ) | | | 2,856,713 | | | | (20,656 | ) |
Mid-Cap Growth | | | 124,424,701 | | | 21,541,310 | | | (7,523,357 | ) | | | 14,017,953 | | | | (7,774 | ) |
Mid Cap Value | | | 319,443,724 | | | 45,207,397 | | | (14,886,473 | ) | | | 30,320,924 | | | | (8,671 | ) |
Technology | | | 12,422,830 | | | 2,979,216 | | | (550,961 | ) | | | 2,428,255 | | | | (824 | ) |
Health Sciences | | | 19,201,637 | | | 3,207,291 | | | (734,640 | ) | | | 2,472,651 | | | | (562 | ) |
Managed OTC | | | 24,385,990 | | | 5,855,364 | | | (4,954,154 | ) | | | 901,210 | | | | 75,331 | |
Capital Growth | | | 583,467,931 | | | 195,635,136 | | | (4,087,001 | ) | | | 191,548,135 | | | | (27,468 | ) |
Concentrated Growth | | | 288,040,171 | | | 57,370,350 | | | (25,848,599 | ) | | | 31,521,751 | | | | (57,971 | ) |
Core Value | | | 39,173,474 | | | 9,873,897 | | | (2,314,097 | ) | | | 7,559,800 | | | | (660 | ) |
Large Cap Core | | | 135,014,817 | | | 30,487,034 | | | (7,340,311 | ) | | | 23,146,723 | | | | (5,743 | ) |
Equity Income | | | 271,485,349 | | | 42,626,300 | | | (10,943,861 | ) | | | 31,682,439 | | | | (21,110 | ) |
Balanced | | | 107,855,828 | | | 8,887,544 | | | (2,270,631 | ) | | | 6,616,913 | | | | 3,717 | |
High Yield Bond | | | 118,611,208 | | | 5,030,628 | | | (5,157,999 | ) | | | (127,371 | ) | | | (482,143 | ) |
Money Market | | | 125,682,867 | | | — | | | — | | | | — | | | | (28,110 | ) |
The differences between book and tax basis of investments are primarily attributable to deferred losses on wash sales and straddles, as well as tax adjustment on investments in Passive Foreign Investment Companies, Real Estate Investments Trusts, foreign exchange contracts, and other temporary differences.
Distributions to shareholders, which are determined in accordance with federal income tax regulations, which may differ from generally accepted accounting principles, are recorded on the ex-dividend date. In order to present undistributed net investment income and accumulated net realized capital gains or losses on the Statements of Assets and Liabilities that more closely represent their tax character, certain adjustments have been made to undistributed net investment income and accumulated net realized gain or loss in investments. For the year ended October 31, 2005 the adjustments were as follows:
| | | | | | | | | | | | |
| | | UNDISTRIBUTED NET INVESTMENT INCOME
| | | ACCUMULATED NET REALIZED GAIN (LOSS)
| | | PAID-IN CAPITAL
| |
International Growth(c)(e)(f)(j) | | $ | 2,484,588 | | | $ | (1,512,739 | ) | | $ | (971,849 | ) |
Small Cap Growth(a)(b)(d)(h)(i)(k) | | | 744,637 | | | | (95,076,485 | ) | | | 94,331,848 | |
Mid-Cap Growth(c) | | | 2,712,154 | | | | — | | | | (2,712,154 | ) |
Mid Cap Value(c)(h) | | | 2,838,928 | | | | (2,784,265 | ) | | | (54,663 | ) |
Technology(c)(f) | | | 238,326 | | | | (1 | ) | | | (238,325 | ) |
Health Sciences(c)(f) | | | 267,295 | | | | 44,423 | | | | (311,718 | ) |
Managed OTC(c) | | | 177,533 | | | | — | | | | (177,533 | ) |
Capital Growth(c)(f) | | | 8,688,303 | | | | 3,112 | | | | (8,691,415 | ) |
Concentrated Growth(c) | | | 1,890,357 | | | | — | | | | (1,890,357 | ) |
Large Cap Core(a)(b)(d)(f)(i)(l) | | | (49,275 | ) | | | (7,226,697 | ) | | | 7,275,972 | |
Equity Income(a)(b)(d) | | | (12,674 | ) | | | (22,308,239 | ) | | | 22,320,913 | |
Balanced(f)(g) | | | 70,226 | | | | (70,226 | ) | | | — | |
High Yield Bond(f) | | | 208,541 | | | | (208,541 | ) | | | — | |
Money Market(m) | | | 1,591 | | | | — | | | | (1,591 | ) |
| (a) | Reclassification of capital loss carryover from merger. |
| (b) | Reclassification of deferred compensation from merger. |
| (c) | Reclassification of tax net operating loss. |
| (d) | Reclassification of disallowed wash sales from merger. |
| (e) | Reclassification of over distribution of ordinary income. |
| (f) | Reclassification of foreign currency exchange gain or loss. |
| (g) | Reclassification of paydown gains. |
| (h) | Reclassification of tax net operating loss to short-term capital gains. |
138
| (i) | Reclassification of Real Estate Investment Trust tax adjustments. |
| (j) | Reclassification of capital gain/loss on PFIC sold to ordinary income. |
| (k) | Outstanding REIT adjustments from merger. |
| (l) | Dividends as a result of redemptions from the fund. |
| (m) | Other book to tax adjustments. |
6. Portfolio Securities
Purchases and sales of securities, other than U.S. government securities and short-term obligations, during the year ended October 31, 2005, were as follows:
| | | | | | |
| | | PURCHASES
| | SALES
|
International Growth | | $ | 232,714,458 | | $ | 313,976,125 |
Small Cap Growth | | | 132,225,769 | | | 146,664,899 |
Mid-Cap Growth | | | 125,671,604 | | | 174,276,864 |
Mid Cap Value | | | 310,809,872 | | | 381,504,002 |
Technology | | | 7,065,965 | | | 14,526,038 |
Health Sciences | | | 18,276,201 | | | 18,590,055 |
Managed OTC | | | 3,143,723 | | | 14,720,188 |
Capital Growth | | | 414,157,133 | | | 583,743,287 |
Concentrated Growth | | | 115,068,144 | | | 235,458,223 |
Core Value | | | 13,082,056 | | | 16,558,472 |
Large Cap Core Fund | | | 52,460,749 | | | 68,634,076 |
Equity Income | | | 149,913,564 | | | 212,322,573 |
Balanced | | | 93,580,036 | | | 114,203,176 |
High Yield Bond | | | 30,746,847 | | | 81,893,908 |
Purchases and sales of U.S. government securities, during the year ended October 31, 2005, were as follows:
| | | | | | |
| | | PURCHASES
| | SALES
|
Balanced | | $ | 161,495,651 | | $ | 166,798,485 |
7. Written Options Transactions
Written options transactions, during the year ended October 31, 2005, were as follows:
| | | | | | | |
| | | HEALTH SCIENCES
| |
| | | NUMBER OF CONTRACTS
| | | PREMIUM RECEIVED
| |
Balance at beginning of period | | — | | | | — | |
Written options | | 16 | | | $ | 1,724 | |
Expired options | | (5 | ) | | | (409 | ) |
Closed options | | (11 | ) | | | (1,315 | ) |
| | |
|
| |
|
|
|
Balance at end of year | | — | | | $ | — | |
| | |
|
| |
|
|
|
139
8. Line of Credit
The Funds and other affiliated funds participated in a $500 million unsecured, committed line of credit, provided by PNC Bank and The Bank of New York, under a line of credit agreement. Under the terms, borrowings may be made for temporary or emergency purposes, including the meeting of redemption requests that otherwise might require the untimely disposition of securities. Any borrowings must be repaid within 30 days of their receipt. Interest is charged to each Fund, based on its borrowings, at a premium above the Federal Funds Rate. In addition, a commitment fee, equal to an annual rate of 0.075% of the average daily unused portion of the line of credit, is allocated among the participants at the end of each quarter. The expiration date of the line of credit was October 28, 2005. Effective October 29, 2005, the Funds renewed the SCA with the banks. The commitment under the renewed SCA continues to be $500 million. The Funds pay a commitment fee of .0725 of 1% of the unused portion of the renewed SCA. The expiration date of the renewed SCA will be October 27, 2006.
The following table summarizes the borrowing that occurred during the year ended October 31, 2005:
| | | | | | | | |
| | | Average Loan
Outstanding During
the Borrowing Period
| | Average
Interest
Rate
| | | Number of
Days
Outstanding
|
International Growth | | $ | 1,928,571 | | 2.832 | % | | 14 |
Small-Cap Growth | | | 850,000 | | 3.704 | % | | 2 |
Mid-Cap Growth | | | 1,862,500 | | 3.612 | % | | 56 |
Mid Cap Value | | | 1,433,333 | | 4.090 | % | | 3 |
Technology | | | 656,000 | | 3.388 | % | | 25 |
Managed OTC | | | 1,000,000 | | 3.650 | % | | 2 |
Capital Growth | | | 2,958,333 | | 3.886 | % | | 12 |
Concentrated Growth | | | 1,274,453 | | 3.419 | % | | 64 |
Large Cap Core | | | 1,466,209 | | 3.679 | % | | 91 |
Equity Income | | | 2,090,400 | | 3.524 | % | | 125 |
Balanced | | | 912,500 | | 4.009 | % | | 8 |
High Yield Bond | | | 2,497,436 | | 3.849 | % | | 39 |
9. Reorganization
On May 26, 2004, September 1, 2004, November 16, 2004, and March 3, 2005 the Board of Directors of the Company approved an Agreement and Plan of Reorganization (the “Plan”) which provides for the transfer of all the assets of the Class A, B, C, L, M, and X shares of the following funds for like shares of the acquiring funds and the assumption of liabilities of the funds.
Shareholders approved the Plan at a meeting on September 12, 2005 and September 21, 2005, respectively, and the reorganization took place on September 19, 2005 and October 21, 2005.
The acquisition was accomplished by a tax-free exchange of the following shares:
MERGED FUND
Strategic Partners
| | | | |
| Growth with Income Fund | | Shares
|
Class | | A | | 274,249 |
| | | B | | 58,513 |
| | | C | | 564,873 |
| | | L | | 642,595 |
| | | M | | 1,760,097 |
| | | X | | 271,891 |
ACQUIRING FUND
Strategic Partners
| | | | | | | |
| Large Cap Core Fund | | Shares
| | Value
|
| Class | | A | | 267,683 | | $ | 2,575,009 |
| | | B | | 57,067 | | | 531,862 |
| | | C | | 551,481 | | | 5,134,285 |
| | | L | | 628,081 | | | 6,010,738 |
| | | M | | 1,719,203 | | | 16,005,784 |
| | | X | | 265,905 | | | 2,470,261 |
140
MERGED FUND
Strategic Partners
| | | | |
| Capital Income Fund | | Shares
|
Class | | A | | 370,023 |
| | | B | | 58,578 |
| | | C | | 1,490,034 |
| | | L | | 1,428,527 |
| | | M | | 4,262,977 |
| | | X | | 1,310,026 |
| |
| Strategic Partners | | |
| |
| Small Cap Growth Opportunity Fund | | Shares
|
Class | | A | | 412,547 |
| | | B | | 72,565 |
| | | C | | 1,023,758 |
| | | L | | 920,866 |
| | | M | | 2,709,038 |
| | | X | | 746,657 |
| |
| Strategic Partners Style Specific | | |
| |
| Small Cap Growth Fund | | Shares
|
Class | | A | | 516,485 |
| | | B | | 824,390 |
| | | C | | 772,936 |
| | | | | | | |
| | |
| ACQUIRING FUND | | | | |
| | |
| Strategic Partners | | | | | |
| | |
| Equity Income Fund | | Shares
| | Value
|
| Class | | A | | 346,123 | | $ | 4,700,355 |
| | | B | | 56,058 | | | 741,088 |
| | | C | | 1,427,946 | | | 18,848,884 |
| | | L | | 1,336,240 | | | 18,106,047 |
| | | M | | 4,080,250 | | | 53,940,907 |
| | | X | | 1,254,527 | | | 16,559,761 |
| | |
| Strategic Partners | | | | | |
| | |
| Small Cap Growth Fund | | Shares
| | Value
|
| Class | | A | | 818,947 | | $ | 4,250,337 |
| | | B | | 143,885 | | | 713,669 |
| | | C | | 2,013,152 | | | 10,065,759 |
| | | L | | 1,829,864 | | | 9,423,800 |
| | | M | | 5,324,326 | | | 26,621,628 |
| | | X | | 1,464,618 | | | 7,337,737 |
| | |
| Strategic Partners | | | | | |
| | |
| Small Cap Growth Fund | | Shares
| | Value
|
| Class | | A | | 819,615 | | $ | 4,253,800 |
| | | B | | 1,312,947 | | | 6,512,216 |
| | | C | | 1,220,168 | | | 6,100,838 |
The aggregate net assets and unrealized appreciation of the Merged Funds immediately before the acquisitions and the acquired capital loss carryforwards from the merged funds were as follows:
| | | | | | | | | | |
| | | TOTAL NET ASSETS
| | UNREALIZED
APPRECIATION/
(DEPRECIATION)
| | | CAPITAL LOSS CARRYFORWARDS*
|
Merged Funds | | | | | | | | | | |
Strategic Partners Growth with Income Fund | | $ | 32,727,939 | | $ | 5,803,180 | | | $ | 11,844,388 |
Strategic Partners Capital Income Fund | | | 112,897,042 | | | 5,399,053 | | | | 32,333,071 |
Strategic Partners Small Cap Growth Opportunity Fund | | | 58,412,930 | | | (658,303 | ) | | | 117,767,066 |
Strategic Partners Style Specific Small Cap Growth Fund | | | 16,868,950 | | | 1,585,911 | | | | 6,165,904 |
Acquiring Funds | | | | | | | | | | |
Strategic Partners Large Cap Core Fund | | $ | 129,332,669 | | | | | | | |
Strategic Partners Equity Income Fund | | | 183,397,101 | | | | | | | |
Strategic Partners Small Cap Growth Fund | | | 33,145,223 | | | | | | | |
| * | The future utilization of the acquired capital loss carry forwards may be limited under certain conditions defined in the Internal Revenue Code of 1986, as amended. |
10. Subsequent Events
On March 3, 2005, the Board of Directors of the Company had approved an Agreement and Plan of Reorganization (the ‘‘Plan’’) which provides for the transfer of all the assets of the Class A, B, C, L, M and X shares of Health Sciences and the Class A, B, C and Z shares of Strategic Partners Opportunity Funds – Mid Cap Value Fund (“Mid Cap Value Fund”) for like shares of the acquiring funds and the assumption of the liabilities of the funds.
| | |
Fund
| | Acquiring Fund
|
Strategic Partners Health Sciences | | Jennison Health Sciences Fund |
Strategic Partners Mid Cap Value Fund | | Strategic Partners Mid Cap Value (formerly known as the Strategic Partners Relative Value Fund) |
In accordance with the Plan, the mergers were completed at the close of business on November 25, 2005.
In addition, at its meeting on November 30, 2005, the Board of Directors of the Company approved the merger of the Managed OTC Fund and the Technology Fund into the Jennison U.S. Emerging Growth Fund pursuant to an Agreement and Plan of Reorganization (the “Plan”) which provides for the transfer of all the assets of the Class A, B, C, L, M and X shares for like shares of the acquiring fund and the assumption of the liabilities of each fund.
141
This Page Intentionally Left Blank
142
Financial Highlights
Per Share Data
(for a Share Outstanding Throughout Each Period)
| | | | | | | | | | | | | | | | | | | | | | | | | | | | | | | | |
| | | | | | | | Increase (Decrease) from
Investment Operations
| | | Less Distributions
| | | | | |
| | | Period Ended
| | | Net Asset Value Beginning of Period
| | Net Investment
Income
(Loss)
| | | Net Realized & Unrealized Gain (Loss)
| | | Total from Investment Operations
| | | From Net Investment Income
| | | From Net Realized Gains
| | Total Distributions
| | | Net Asset Value End of Period
|
STRATEGIC PARTNERS INTERNATIONAL GROWTH FUND: | | | | | | | | | | | | | | | | | | | | | | | | | | | | | | | | |
Class A | | 10/31/05 | | | $ | 11.87 | | $ | (0.01 | ) | | $ | 1.97 | | | $ | 1.96 | | | $ | (0.15 | ) | | $ | — | | $ | (0.15 | ) | | $ | 13.68 |
| | | 10/31/04 | (10)(12) | | | 12.13 | | | (0.03 | ) | | | (0.21 | ) | | | (0.24 | ) | | | (0.02 | ) | | | — | | | (0.02 | ) | | | 11.87 |
| | | | | | | | | |
Class B | | 10/31/05 | | | | 11.53 | | | (0.07 | ) | | | 1.88 | | | | 1.81 | | | | (0.05 | ) | | | — | | | (0.05 | ) | | | 13.29 |
| | | 10/31/04 | (10)(12) | | | 11.82 | | | (0.08 | ) | | | (0.21 | ) | | | (0.29 | ) | | | — | | | | — | | | — | | | | 11.53 |
| | | | | | | | | |
Class C | | 10/31/05 | | | | 11.55 | | | (0.20 | ) | | | 2.02 | | | | 1.82 | | | | (0.05 | ) | | | — | | | (0.05 | ) | | | 13.32 |
| | | 10/31/04 | (12) | | | 10.50 | | | (0.13 | ) | | | 1.18 | | | | 1.05 | | | | — | | | | — | | | — | | | | 11.55 |
| | | 10/31/03 | (12) | | | 8.08 | | | (0.08 | ) | | | 2.50 | | | | 2.42 | | | | — | | | | — | | | — | | | | 10.50 |
| | | 10/31/02 | (12) | | | 9.79 | | | (0.05 | ) | | | (1.66 | ) | | | (1.71 | ) | | | — | | | | — | | | — | | | | 8.08 |
| | | 10/31/01 | (12) | | | 17.06 | | | (0.18 | ) | | | (6.62 | ) | | | (6.80 | ) | | | (0.47 | ) | | | — | | | (0.47 | ) | | | 9.79 |
| | | | | | | | | |
Class L (11) | | 10/31/05 | | | | 11.84 | | | (0.19 | ) | | | 2.12 | | | | 1.93 | | | | (0.12 | ) | | | — | | | (0.12 | ) | | | 13.65 |
| | | 10/31/04 | (12) | | | 10.72 | | | (0.08 | ) | | | 1.22 | | | | 1.14 | | | | (0.02 | ) | | | — | | | (0.02 | ) | | | 11.84 |
| | | 10/31/03 | (12) | | | 8.21 | | | (0.04 | ) | | | 2.55 | | | | 2.51 | | | | — | | | | — | | | — | | | | 10.72 |
| | | 10/31/02 | (12) | | | 9.90 | | | — | † | | | (1.69 | ) | | | (1.69 | ) | | | — | | | | — | | | — | | | | 8.21 |
| | | 10/31/01 | (12) | | | 17.27 | | | (0.13 | ) | | | (6.67 | ) | | | (6.80 | ) | | | (0.57 | ) | | | — | | | (0.57 | ) | | | 9.90 |
| | | | | | | | | |
Class M (11) | | 10/31/05 | | | | 11.52 | | | (0.19 | ) | | | 2.01 | | | | 1.82 | | | | (0.05 | ) | | | — | | | (0.05 | ) | | | 13.29 |
| | | 10/31/04 | (12) | | | 10.48 | | | (0.13 | ) | | | 1.17 | | | | 1.04 | | | | — | | | | — | | | — | | | | 11.52 |
| | | 10/31/03 | (12) | | | 8.06 | | | (0.08 | ) | | | 2.50 | | | | 2.42 | | | | — | | | | — | | | — | | | | 10.48 |
| | | 10/31/02 | (12) | | | 9.77 | | | (0.05 | ) | | | (1.66 | ) | | | (1.71 | ) | | | — | | | | — | | | — | | | | 8.06 |
| | | 10/31/01 | (12) | | | 17.03 | | | (0.17 | ) | | | (6.62 | ) | | | (6.79 | ) | | | (0.47 | ) | | | — | | | (0.47 | ) | | | 9.77 |
| | | | | | | | | |
Class X | | 10/31/05 | | | | 11.53 | | | (0.19 | ) | | | 2.01 | | | | 1.82 | | | | (0.05 | ) | | | — | | | (0.05 | ) | | | 13.30 |
| | | 10/31/04 | (12) | | | 10.48 | | | (0.13 | ) | | | 1.18 | | | | 1.05 | | | | — | | | | — | | | — | | | | 11.53 |
| | | 10/31/03 | (12) | | | 8.06 | | | (0.08 | ) | | | 2.50 | | | | 2.42 | | | | — | | | | — | | | — | | | | 10.48 |
| | | 10/31/02 | (12) | | | 9.77 | | | (0.05 | ) | | | (1.66 | ) | | | (1.71 | ) | | | — | | | | — | | | — | | | | 8.06 |
| | | 10/31/01 | (12) | | | 17.03 | | | (0.15 | ) | | | (6.64 | ) | | | (6.79 | ) | | | (0.47 | ) | | | — | | | (0.47 | ) | | | 9.77 |
STRATEGIC PARTNERS SMALL CAP GROWTH FUND: | | | | | | | | | | | | | | | | | | | | | | | | | | | | | | | | |
Class A | | 10/31/05 | | | $ | 5.12 | | $ | (0.04 | ) | | $ | 0.20 | | | $ | 0.16 | | | $ | — | | | $ | — | | $ | — | | | $ | 5.28 |
| | | 10/31/04 | (10) | | | 5.61 | | | (0.02 | ) | | | (0.47 | ) | | | (0.49 | ) | | | — | | | | — | | | — | | | | 5.12 |
| | | | | | | | | |
Class B | | 10/31/05 | | | | 4.93 | | | (0.03 | ) | | | 0.15 | | | | 0.12 | | | | — | | | | — | | | — | | | | 5.05 |
| | | 10/31/04 | (10) | | | 5.49 | | | (0.03 | ) | | | (0.53 | ) | | | (0.56 | ) | | | — | | | | — | | | — | | | | 4.93 |
| | | | | | | | | |
Class C | | 10/31/05 | | | | 4.97 | | | (0.03 | ) | | | 0.15 | | | | 0.12 | | | | — | | | | — | | | — | | | | 5.09 |
| | | 10/31/04 | | | | 4.97 | | | (0.13 | ) | | | 0.13 | | | | .— | | | | — | | | | — | | | — | | | | 4.97 |
| | | 10/31/03 | (12) | | | 3.46 | | | (0.06 | ) | | | 1.57 | | | | 1.51 | | | | — | | | | — | | | — | | | | 4.97 |
| | | 10/31/02 | (12) | | | 4.55 | | | (0.08 | ) | | | (1.01 | ) | | | (1.09 | ) | | | — | | | | — | | | — | | | | 3.46 |
| | | 10/31/01 | (12) | | | 8.04 | | | (0.10 | ) | | | (3.39 | ) | | | (3.49 | ) | | | — | | | | — | | | — | | | | 4.55 |
| | | | | | | | | |
Class L (11) | | 10/31/05 | | | | 5.09 | | | (0.05 | ) | | | 0.20 | | | | 0.15 | | | | — | | | | — | | | — | | | | 5.24 |
| | | 10/31/04 | | | | 5.06 | | | (0.10 | ) | | | 0.13 | | | | 0.03 | | | | — | | | | — | | | — | | | | 5.09 |
| | | 10/31/03 | (12) | | | 3.51 | | | (0.04 | ) | | | 1.59 | | | | 1.55 | | | | — | | | | — | | | — | | | | 5.06 |
| | | 10/31/02 | (12) | | | 4.59 | | | (0.06 | ) | | | (1.02 | ) | | | (1.08 | ) | | | — | | | | — | | | — | | | | 3.51 |
| | | 10/31/01 | (12) | | | 8.08 | | | (0.07 | ) | | | (3.42 | ) | | | (3.49 | ) | | | — | | | | — | | | — | | | | 4.59 |
| | | | | | | | | |
Class M (11) | | 10/31/05 | | | | 4.97 | | | (0.04 | ) | | | 0.16 | | | | 0.12 | | | | — | | | | — | | | — | | | | 5.09 |
| | | 10/31/04 | | | | 4.96 | | | (0.12 | ) | | | 0.13 | | | | 0.01 | | | | — | | | | — | | | — | | | | 4.97 |
| | | 10/31/03 | (12) | | | 3.46 | | | (0.06 | ) | | | 1.56 | | | | 1.50 | | | | — | | | | — | | | — | | | | 4.96 |
| | | 10/31/02 | (12) | | | 4.54 | | | (0.08 | ) | | | (1.00 | ) | | | (1.08 | ) | | | — | | | | — | | | — | | | | 3.46 |
| | | 10/31/01 | (12) | | | 8.04 | | | (0.10 | ) | | | (3.40 | ) | | | (3.50 | ) | | | — | | | | — | | | — | | | | 4.54 |
| | | | | | | | | |
Class X | | 10/31/05 | | | | 4.98 | | | (0.03 | ) | | | 0.15 | | | | 0.12 | | | | — | | | | — | | | — | | | | 5.10 |
| | | 10/31/04 | | | | 4.97 | | | (0.12 | ) | | | 0.13 | | | | 0.01 | | | | — | | | | — | | | — | | | | 4.98 |
| | | 10/31/03 | (12) | | | 3.47 | | | (0.06 | ) | | | 1.56 | | | | 1.50 | | | | — | | | | — | | | — | | | | 4.97 |
| | | 10/31/02 | (12) | | | 4.55 | | | (0.08 | ) | | | (1.00 | ) | | | (1.08 | ) | | | — | | | | — | | | — | | | | 3.47 |
| | | 10/31/01 | (12) | | | 8.05 | | | (0.10 | ) | | | (3.40 | ) | | | (3.50 | ) | | | — | | | | — | | | — | | | | 4.55 |
143
| | | | | | | | | | | | | | | | |
Supplemental Data
| | | Ratios of Expenses to Average Net Assets(2)
| | | | |
Total Return
| | | Net Assets at
End of Period
(in 000’s)
| | Portfolio
Turnover
Rate
| | | Net Operating Expenses
(after Expense
Reimbursement
and Waiver)(3)
| | | Net Operating Expenses
(before Expense
Reimbursement
and Waiver)(3)
| | | Ratio of Net Investment
Income (Loss) to
Average Net Assets(2)
| |
| 16.76 | % | | $ | 15,785 | | 89 | % | | 1.85 | % | | 2.10 | % | | (0.18 | %) |
| (2.09 | %) | | | 10,704 | | 87 | % | | 1.85 | % | | 2.12 | % | | (0.55 | %) |
| | | | | |
| 15.87 | % | | | 2,625 | | 89 | % | | 2.60 | % | | 2.85 | % | | (0.96 | %) |
| (2.54 | )% | | | 1,018 | | 87 | % | | 2.60 | % | | 2.87 | % | | (1.34 | %) |
| | | | | |
| 15.93 | % | | | 48,316 | | 89 | % | | 2.60 | % | | 2.85 | % | | (0.97 | %) |
| 9.91 | % | | | 55,388 | | 87 | % | | 2.60 | % | | 2.87 | % | | (1.16 | %) |
| 29.95 | % | | | 34,265 | | 126 | % | | 2.60 | % | | 2.86 | % | | (0.94 | %) |
| (17.47 | %) | | | 32,443 | | 56 | % | | 2.60 | % | | 2.88 | % | | (0.48 | %) |
| (40.76 | %) | | | 56,063 | | 69 | % | | 2.56 | % | | 2.66 | % | | (1.13 | %) |
| | | | | |
| 16.52 | % | | | 40,803 | | 89 | % | | 2.10 | % | | 2.35 | % | | (0.47 | %) |
| 10.00 | % | | | 58,880 | | 87 | % | | 2.10 | % | | 2.37 | % | | (0.66 | %) |
| 30.57 | % | | | 31,759 | | 126 | % | | 2.10 | % | | 2.36 | % | | (0.41 | %) |
| (17.07 | %) | | | 31,546 | | 56 | % | | 2.10 | % | | 2.37 | % | | 0.03 | % |
| (40.46 | %) | | | 57,798 | | 69 | % | | 2.06 | % | | 2.16 | % | | (0.64 | %) |
| | | | | |
| 15.87 | % | | | 106,492 | | 89 | % | | 2.60 | % | | 2.85 | % | | (0.97 | %) |
| 9.92 | % | | | 118,719 | | 87 | % | | 2.60 | % | | 2.87 | % | | (1.16 | %) |
| 30.02 | % | | | 68,304 | | 126 | % | | 2.60 | % | | 2.86 | % | | (0.95 | %) |
| (17.50 | %) | | | 65,261 | | 56 | % | | 2.60 | % | | 2.88 | % | | (0.47 | %) |
| (40.78 | %) | | | 106,979 | | 69 | % | | 2.56 | % | | 2.66 | % | | (1.13 | %) |
| | | | | |
| 15.96 | % | | | 31,530 | | 89 | % | | 2.60 | % | | 2.85 | % | | (0.97 | %) |
| 10.02 | %(1) | | | 34,454 | | 87 | % | | 2.60 | % | | 2.87 | % | | (1.16 | %) |
| 30.02 | %(1) | | | 20,520 | | 126 | % | | 2.60 | % | | 2.86 | % | | (0.95 | %) |
| (17.50 | %)(1) | | | 17,976 | | 56 | % | | 2.60 | % | | 2.88 | % | | (0.48 | %) |
| (40.79 | %)(1) | | | 27,923 | | 69 | % | | 2.56 | % | | 2.66 | % | | (1.13 | %) |
| | | | | |
| 3.13 | % | | $ | 11,807 | | 288 | % | | 1.65 | % | | 2.70 | % | | (1.19 | %) |
| (8.73 | %) | | | 2,063 | | 242 | % | | 1.65 | % | | 2.36 | % | | (1.23 | %) |
| | | | | |
| 2.43 | % | | | 7,819 | | 288 | % | | 2.40 | % | | 3.45 | % | | (1.97 | %) |
| (10.20 | %) | | | 280 | | 242 | % | | 2.40 | % | | 3.11 | % | | (2.01 | %) |
| | | | | |
| 2.41 | % | | | 22,024 | | 288 | % | | 2.40 | % | | 3.45 | % | | (1.95 | %) |
| 0.00 | % | | | 8,516 | | 242 | % | | 2.40 | % | | 3.11 | % | | (2.04 | %) |
| 43.64 | % | | | 11,580 | | 203 | % | | 2.40 | % | | 3.11 | % | | (1.55 | %) |
| (23.96 | %) | | | 8,054 | | 309 | % | | 2.36 | % | | 3.15 | % | | (1.78 | %) |
| (43.41 | %) | | | 10,968 | | 110 | % | | 2.30 | % | | 3.13 | % | | (1.76 | %) |
| | | | | |
| 2.95 | % | | | 16,580 | | 288 | % | | 1.90 | % | | 2.95 | % | | (1.44 | %) |
| 0.59 | % | | | 10,549 | | 242 | % | | 1.90 | % | | 2.61 | % | | (1.53 | %) |
| 44.16 | % | | | 15,297 | | 203 | % | | 1.90 | % | | 2.60 | % | | (1.05 | %) |
| (23.53 | %) | | | 10,499 | | 309 | % | | 1.86 | % | | 2.64 | % | | (1.29 | %) |
| (43.19 | %) | | | 17,736 | | 110 | % | | 1.80 | % | | 2.65 | % | | (1.24 | %) |
| | | | | |
| 2.41 | % | | | 41,128 | | 288 | % | | 2.40 | % | | 3.45 | % | | (1.94 | %) |
| 0.20 | % | | | 19,448 | | 242 | % | | 2.40 | % | | 3.11 | % | | (2.03 | %) |
| 43.35 | % | | | 22,010 | | 203 | % | | 2.40 | % | | 3.11 | % | | (1.56 | %) |
| (23.79 | %) | | | 16,513 | | 309 | % | | 2.36 | % | | 3.15 | % | | (1.78 | %) |
| (43.53 | %) | | | 22,969 | | 110 | % | | 2.30 | % | | 3.13 | % | | (1.75 | %) |
| | | | | |
| 2.41 | % | | | 10,116 | | 288 | % | | 2.40 | % | | 3.45 | % | | (1.95 | %) |
| 0.20 | %(1) | | | 3,736 | | 242 | % | | 2.40 | % | | 3.11 | % | | (2.03 | %) |
| 43.23 | %(1) | | | 4,087 | | 203 | % | | 2.40 | % | | 3.11 | % | | (1.55 | %) |
| (23.74 | %)(1) | | | 2,995 | | 309 | % | | 2.36 | % | | 3.15 | % | | (1.78 | %) |
| (43.48 | %)(1) | | | 3,875 | | 110 | % | | 2.30 | % | | 3.13 | % | | (1.76 | %) |
See Notes to Financial Statements.
144
Financial Highlights
Per Share Data
(for a Share Outstanding Throughout Each Period)
| | | | | | | | | | | | | | | | | | | | | | | | | | | | | | | | | |
| | | | | | | | Increase (Decrease) from Investment Operations
| | | Less Distributions
| | | | | | |
| | | Period Ended
| | | Net Asset Value Beginning of Period
| | Net Investment Income (Loss)
| | | Net Realized & Unrealized Gain (Loss)
| | | Total from Investment Operations
| | | From Net Investment Income
| | | From Net Realized Gains
| | | Total Distributions
| | | Net Asset Value End of Period
|
STRATEGIC PARTNERS MID-CAP GROWTH FUND: | | | | | | | | | | | | | | | | | | | | | | | | | | | | | | | | | |
Class A | | 10/31/05 | | | $ | 4.28 | | $ | (0.06 | ) | | $ | 0.41 | | | $ | 0.35 | | | $ | — | | | $ | — | | | $ | — | | | $ | 4.63 |
| | | 10/31/04 | (10)(12) | | | 4.27 | | | (0.02 | ) | | | 0.03 | | | | 0.01 | | | | — | | | | — | | | | — | | | | 4.28 |
| | | | | | | | | |
Class B | | 10/31/05 | | | | 4.20 | | | (0.08 | ) | | | 0.39 | | | | 0.31 | | | | — | | | | — | | | | — | | | | 4.51 |
| | | 10/31/04 | (10)(12) | | | 4.21 | | | (0.04 | ) | | | 0.03 | | | | (0.01 | ) | | | — | | | | — | | | | — | | | | 4.20 |
| | | | | | | | | |
Class C | | 10/31/05 | | | | 4.18 | | | (0.10 | ) | | | 0.41 | | | | 0.31 | | | | — | | | | — | | | | — | | | | 4.49 |
| | | 10/31/04 | (12) | | | 3.83 | | | (0.07 | ) | | | 0.42 | | | | 0.35 | | | | — | | | | — | | | | — | | | | 4.18 |
| | | 10/31/03 | (12) | | | 3.06 | | | (0.06 | ) | | | 0.83 | | | | 0.77 | | | | — | | | | — | | | | — | | | | 3.83 |
| | | 10/31/02 | (12) | | | 4.03 | | | (0.07 | ) | | | (0.90 | ) | | | (0.97 | ) | | | — | | | | — | | | | — | | | | 3.06 |
| | | 10/31/01 | (12) | | | 10.01 | | | (0.09 | ) | | | (5.89 | ) | | | (5.98 | ) | | | — | † | | | — | | | | — | | | | 4.03 |
| | | | | | | | | |
Class L (11) | | 10/31/05 | | | | 4.26 | | | (0.08 | ) | | | 0.42 | | | | 0.34 | | | | — | | | | — | | | | — | | | | 4.60 |
| | | 10/31/04 | (12) | | | 3.89 | | | (0.05 | ) | | | 0.42 | | | | 0.37 | | | | — | | | | — | | | | — | | | | 4.26 |
| | | 10/31/03 | (12) | | | 3.09 | | | (0.04 | ) | | | 0.84 | | | | 0.80 | | | | — | | | | — | | | | — | | | | 3.89 |
| | | 10/31/02 | (12) | | | 4.04 | | | (0.05 | ) | | | (0.90 | ) | | | (0.95 | ) | | | — | | | | — | | | | — | | | | 3.09 |
| | | 10/31/01 | (12) | | | 10.01 | | | (0.06 | ) | | | (5.90 | ) | | | (5.96 | ) | | | (0.01 | ) | | | — | | | | (0.01 | ) | | | 4.04 |
| | | | | | | | | |
Class M (11) | | 10/31/05 | | | | 4.19 | | | (0.10 | ) | | | 0.41 | | | | 0.31 | | | | — | | | | — | | | | — | | | | 4.50 |
| | | 10/31/04 | (12) | | | 3.84 | | | (0.07 | ) | | | 0.42 | | | | 0.35 | | | | — | | | | — | | | | — | | | | 4.19 |
| | | 10/31/03 | (12) | | | 3.06 | | | (0.06 | ) | | | 0.84 | | | | 0.78 | | | | — | | | | — | | | | — | | | | 3.84 |
| | | 10/31/02 | (12) | | | 4.03 | | | (0.07 | ) | | | (0.90 | ) | | | (0.97 | ) | | | — | | | | — | | | | — | | | | 3.06 |
| | | 10/31/01 | (12) | | | 10.00 | | | (0.09 | ) | | | (5.88 | ) | | | (5.97 | ) | | | — | † | | | — | | | | — | | | | 4.03 |
| | | | | | | | | |
Class X | | 10/31/05 | | | | 4.18 | | | (0.10 | ) | | | 0.41 | | | | 0.31 | | | | — | | | | — | | | | — | | | | 4.49 |
| | | 10/31/04 | (12) | | | 3.83 | | | (0.07 | ) | | | 0.42 | | | | 0.35 | | | | — | | | | — | | | | — | | | | 4.18 |
| | | 10/31/03 | (12) | | | 3.06 | | | (0.06 | ) | | | 0.83 | | | | 0.77 | | | | — | | | | — | | | | — | | | | 3.83 |
| | | 10/31/02 | (12) | | | 4.02 | | | (0.07 | ) | | | (0.89 | ) | | | (0.96 | ) | | | — | | | | — | | | | — | | | | 3.06 |
| | | 10/31/01 | (12) | | | 10.00 | | | (0.09 | ) | | | (5.89 | ) | | | (5.98 | ) | | | — | † | | | — | | | | — | | | | 4.02 |
STRATEGIC PARTNERS MID-CAP VALUE FUND: | | | | | | | | | | | | | | | | | | | | | | | | | | | | | | | | | |
Class A | | 10/31/05 | | | $ | 19.33 | | $ | (0.07 | ) | | $ | 3.11 | | | $ | 3.04 | | | $ | — | | | $ | (2.25 | ) | | $ | (2.25 | ) | | $ | 20.12 |
| | | 10/31/04 | (10)(12) | | | 18.92 | | | (0.03 | ) | | | 0.44 | | | | 0.41 | | | | — | | | | — | | | | — | | | | 19.33 |
| | | | | | | | | |
Class B | | 10/31/05 | | | | 18.74 | | | (0.17 | ) | | | 2.96 | | | | 2.79 | | | | — | | | | (2.25 | ) | | | (2.25 | ) | | | 19.28 |
| | | 10/31/04 | (10)(12) | | | 18.43 | | | (0.11 | ) | | | 0.42 | | | | 0.31 | | | | — | | | | — | | | | — | | | | 18.74 |
| | | | | | | | | |
Class C | | 10/31/05 | | | | 18.73 | | | (0.21 | ) | | | 2.98 | | | | 2.77 | | | | — | | | | (2.25 | ) | | | (2.25 | ) | | | 19.25 |
| | | 10/31/04 | (12) | | | 16.40 | | | (0.18 | ) | | | 2.66 | | | | 2.48 | | | | — | | | | (0.15 | ) | | | (0.15 | ) | | | 18.73 |
| | | 10/31/03 | (12) | | | 12.84 | | | (0.16 | ) | | | 3.72 | | | | 3.56 | | | | — | | | | — | | | | — | | | | 16.40 |
| | | 10/31/02 | (12) | | | 13.17 | | | (0.14 | ) | | | (0.08 | ) | | | (0.22 | ) | | | — | | | | (0.11 | ) | | | (0.11 | ) | | | 12.84 |
| | | 10/31/01 | (12) | | | 14.53 | | | (0.11 | ) | | | (1.17 | ) | | | (1.28 | ) | | | — | | | | (0.08 | ) | | | (0.08 | ) | | | 13.17 |
| | | | | | | | | |
Class L (11) | | 10/31/05 | | | | 19.28 | | | (0.10 | ) | | | 3.05 | | | | 2.95 | | | | — | | | | (2.25 | ) | | | (2.25 | ) | | | 19.98 |
| | | 10/31/04 | (12) | | | 16.79 | | | (0.10 | ) | | | 2.74 | | | | 2.64 | | | | — | | | | (0.15 | ) | | | (0.15 | ) | | | 19.28 |
| | | 10/31/03 | (12) | | | 13.08 | | | (0.09 | ) | | | 3.80 | | | | 3.71 | | | | — | | | | — | | | | — | | | | 16.79 |
| | | 10/31/02 | (12) | | | 13.35 | | | (0.07 | ) | | | (0.09 | ) | | | (0.16 | ) | | | — | | | | (0.11 | ) | | | (0.11 | ) | | | 13.08 |
| | | 10/31/01 | (12) | | | 14.65 | | | (0.03 | ) | | | (1.19 | ) | | | (1.22 | ) | | | — | | | | (0.08 | ) | | | (0.08 | ) | | | 13.35 |
| | | | | | | | | |
Class M (11) | | 10/31/05 | | | | 18.73 | | | (0.22 | ) | | | 2.99 | | | | 2.77 | | | | — | | | | (2.25 | ) | | | (2.25 | ) | | | 19.25 |
| | | 10/31/04 | (12) | | | 16.40 | | | (0.18 | ) | | | 2.66 | | | | 2.48 | | | | — | | | | (0.15 | ) | | | (0.15 | ) | | | 18.73 |
| | | 10/31/03 | (12) | | | 12.83 | | | (0.16 | ) | | | 3.73 | | | | 3.57 | | | | — | | | | — | | | | — | | | | 16.40 |
| | | 10/31/02 | (12) | | | 13.17 | | | (0.14 | ) | | | (0.09 | ) | | | (0.23 | ) | | | — | | | | (0.11 | ) | | | (0.11 | ) | | | 12.83 |
| | | 10/31/01 | (12) | | | 14.53 | | | (0.11 | ) | | | (1.17 | ) | | | (1.28 | ) | | | — | | | | (0.08 | ) | | | (0.08 | ) | | | 13.17 |
| | | | | | | | | |
Class X | | 10/31/05 | | | | 18.69 | | | (0.22 | ) | | | 2.97 | | | | 2.75 | | | | — | | | | (2.25 | ) | | | (2.25 | ) | | | 19.19 |
| | | 10/31/04 | (12) | | | 16.37 | | | (0.18 | ) | | | 2.65 | | | | 2.47 | | | | — | | | | (0.15 | ) | | | (0.15 | ) | | | 18.69 |
| | | 10/31/03 | (12) | | | 12.81 | | | (0.16 | ) | | | 3.72 | | | | 3.56 | | | | — | | | | — | | | | — | | | | 16.37 |
| | | 10/31/02 | (12) | | | 13.14 | | | (0.14 | ) | | | (0.08 | ) | | | (0.22 | ) | | | — | | | | (0.11 | ) | | | (0.11 | ) | | | 12.81 |
| | | 10/31/01 | (12) | | | 14.50 | | | (0.11 | ) | | | (1.17 | ) | | | (1.28 | ) | | | — | | | | (0.08 | ) | | | (0.08 | ) | | | 13.14 |
145
| | | | | | | | | | | | | | | | |
Supplemental Data
| | | Ratios of Expenses to Average Net Assets(2)
| | | Ratio of Net Investment Income (Loss) to Average Net Assets(2)
| |
Total Return
| | | Net Assets at End of Period (in 000’s)
| | Portfolio Turnover Rate
| | | Net Operating Expenses (after Expense Reimbursement and Waiver)(3)
| | | Net Operating Expenses (before Expense Reimbursement and Waiver)(3)
| | |
| 8.18 | % | | $ | 10,692 | | 82 | % | | 1.65 | % | | 2.22 | % | | (1.18 | %) |
| 0.23 | % | | | 7,956 | | 98 | % | | 1.65 | % | | 2.18 | % | | (1.12 | %) |
| | | | | |
| 7.38 | % | | | 2,110 | | 82 | % | | 2.40 | % | | 2.97 | % | | (1.93 | %) |
| (0.24 | %) | | | 984 | | 98 | % | | 2.40 | % | | 2.93 | % | | (1.85 | %) |
| | | | | |
| 7.42 | % | | | 22,098 | | 82 | % | | 2.40 | % | | 2.97 | % | | (1.92 | %) |
| 9.14 | % | | | 27,756 | | 98 | % | | 2.40 | % | | 2.93 | % | | (1.79 | %) |
| 25.16 | % | | | 7,083 | | 132 | % | | 2.40 | % | | 3.54 | % | | (1.85 | %) |
| (24.07 | %) | | | 3,566 | | 89 | % | | 2.40 | % | | 3.65 | % | | (1.88 | %) |
| (59.72 | %) | | | 4,687 | | 188 | % | | 2.40 | % | | 3.40 | % | | (1.61 | %) |
| | | | | |
| 7.98 | % | | | 24,098 | | 82 | % | | 1.90 | % | | 2.47 | % | | (1.42 | %) |
| 9.51 | % | | | 38,359 | | 98 | % | | 1.90 | % | | 2.43 | % | | (1.29 | %) |
| 25.89 | % | | | 8,839 | | 132 | % | | 1.90 | % | | 3.05 | % | | (1.34 | %) |
| (23.51 | %) | | | 5,765 | | 89 | % | | 1.90 | % | | 3.17 | % | | (1.38 | %) |
| (59.56 | %) | | | 6,012 | | 188 | % | | 1.90 | % | | 2.95 | % | | (1.13 | %) |
| | | | | |
| 7.40 | % | | | 60,542 | | 82 | % | | 2.40 | % | | 2.97 | % | | (1.92 | %) |
| 9.12 | % | | | 75,401 | | 98 | % | | 2.40 | % | | 2.93 | % | | (1.79 | %) |
| 25.49 | % | | | 9,777 | | 132 | % | | 2.40 | % | | 3.56 | % | | (1.83 | %) |
| (24.07 | %) | | | 7,310 | | 89 | % | | 2.40 | % | | 3.65 | % | | (1.88 | %) |
| (59.68 | %) | | | 9,098 | | 188 | % | | 2.40 | % | | 3.37 | % | | (1.60 | %) |
| | | | | |
| 7.42 | % | | | 12,311 | | 82 | % | | 2.40 | % | | 2.97 | % | | (1.92 | %) |
| 9.14 | %(1) | | | 15,346 | | 98 | % | | 2.40 | % | | 2.93 | % | | (1.79 | %) |
| 25.16 | %(1) | | | 2,049 | | 132 | % | | 2.40 | % | | 3.54 | % | | (1.85 | %) |
| (23.88 | %)(1) | | | 916 | | 89 | % | | 2.40 | % | | 3.65 | % | | (1.88 | %) |
| (59.78 | %)(1) | | | 1,174 | | 188 | % | | 2.40 | % | | 3.47 | % | | (1.65 | %) |
| | | | | |
| 16.74 | % | | $ | 20,191 | | 98 | % | | 1.60 | % | | 1.65 | % | | (0.26 | %) |
| 2.17 | % | | | 13,692 | | 80 | % | | 1.60 | % | | 1.64 | % | | (0.29 | %) |
| | | | | |
| 15.85 | % | | | 3,450 | | 98 | % | | 2.35 | % | | 2.40 | % | | (1.02 | %) |
| 1.68 | % | | | 1,132 | | 80 | % | | 2.35 | % | | 2.39 | % | | (1.07 | %) |
| | | | | |
| 15.75 | % | | | 56,013 | | 98 | % | | 2.35 | % | | 2.40 | % | | (1.03 | %) |
| 15.21 | % | | | 58,598 | | 80 | % | | 2.35 | % | | 2.39 | % | | (1.02 | %) |
| 27.73 | % | | | 42,700 | | 61 | % | | 2.35 | % | | 2.52 | % | | (1.16 | %) |
| (1.78 | %) | | | 36,403 | | 109 | % | | 2.35 | % | | 2.49 | % | | (0.99 | %) |
| (8.87 | %) | | | 34,719 | | 219 | % | | 2.35 | % | | 2.41 | % | | (0.73 | %) |
| | | | | |
| 16.29 | % | | | 49,081 | | 98 | % | | 1.85 | % | | 1.90 | % | | (0.53 | %) |
| 15.81 | % | | | 67,968 | | 80 | % | | 1.85 | % | | 1.89 | % | | (0.53 | %) |
| 28.37 | % | | | 51,801 | | 61 | % | | 1.85 | % | | 2.01 | % | | (0.66 | %) |
| (1.31 | %) | | | 43,346 | | 109 | % | | 1.85 | % | | 1.99 | % | | (0.49 | %) |
| (8.39 | %) | | | 43,595 | | 219 | % | | 1.85 | % | | 1.91 | % | | (0.24 | %) |
| | | | | |
| 15.75 | % | | | 138,363 | | 98 | % | | 2.35 | % | | 2.40 | % | | (1.03 | %) |
| 15.21 | % | | | 147,143 | | 80 | % | | 2.35 | % | | 2.39 | % | | (1.02 | %) |
| 27.83 | % | | | 102,711 | | 61 | % | | 2.35 | % | | 2.52 | % | | (1.16 | %) |
| (1.86 | %) | | | 94,735 | | 109 | % | | 2.35 | % | | 2.49 | % | | (0.99 | %) |
| (8.87 | %) | | | 96,608 | | 219 | % | | 2.35 | % | | 2.41 | % | | (0.73 | %) |
| | | | | |
| 15.67 | % | | | 24,837 | | 98 | % | | 2.35 | % | | 2.40 | % | | (1.03 | %) |
| 15.18 | %(1) | | | 26,383 | | 80 | % | | 2.35 | % | | 2.39 | % | | (1.02 | %) |
| 27.79 | %(1) | | | 19,791 | | 61 | % | | 2.35 | % | | 2.52 | % | | (1.16 | %) |
| (1.79 | %)(1) | | | 17,141 | | 109 | % | | 2.35 | % | | 2.49 | % | | (0.99 | %) |
| (8.89 | %)(1) | | | 15,781 | | 219 | % | | 2.35 | % | | 2.41 | % | | (0.73 | %) |
See Notes to Financial Statements.
146
Financial Highlights
Per Share Data
(for a Share Outstanding Throughout Each Period)
| | | | | | | | | | | | | | | | | | | | | | | | | | | | | | | | | |
| | | | | | | | Increase (Decrease) from Investment Operations
| | | Less Distributions
| | | | | | |
| | | Period
Ended
| | | Net Asset
Value
Beginning
of Period
| | Net Investment Income (Loss)
| | | Net Realized & Unrealized Gain (Loss)
| | | Total from Investment Operations
| | | From Net Investment Income
| | | From Net Realized Gains
| | | Total Distributions
| | | Net Asset
Value End
of Period
|
| STRATEGIC PARTNERS TECHNOLOGY FUND: | | | | | | | | | | | | | | | | | | | | | | | | | | | | | | | | | |
Class A | | 10/31/05 | | | $ | 2.66 | | $ | (0.03 | ) | | $ | 0.14 | | | $ | 0.11 | | | $ | — | | | $ | — | | | $ | — | | | $ | 2.77 |
| | | 10/31/04 | (10)(12) | | | 2.92 | | | (0.02 | ) | | | (0.24 | ) | | | (0.26 | ) | | | — | | | | — | | | | — | | | | 2.66 |
| | | | | | | | | |
Class B | | 10/31/05 | | | | 2.58 | | | (0.04 | ) | | | 0.12 | | | | 0.08 | | | | — | | | | — | | | | — | | | | 2.66 |
| | | 10/31/04 | (10)(12) | | | 2.84 | | | (0.03 | ) | | | (0.23 | ) | | | (0.26 | ) | | | — | | | | — | | | | — | | | | 2.58 |
| | | | | | | | | |
Class C | | 10/31/05 | | | | 2.59 | | | (0.06 | ) | | | 0.15 | | | | 0.09 | | | | — | | | | — | | | | — | | | | 2.68 |
| | | 10/31/04 | (12) | | | 2.73 | | | (0.06 | ) | | | (0.08 | ) | | | (0.14 | ) | | | — | | | | — | | | | — | | | | 2.59 |
| | | 10/31/03 | (12) | | | 1.94 | | | (0.05 | ) | | | 0.84 | | | | 0.79 | | | | — | | | | — | | | | — | | | | 2.73 |
| | | 10/31/02 | (12) | | | 3.14 | | | (0.06 | ) | | | (1.14 | ) | | | (1.20 | ) | | | — | | | | — | | | | — | | | | 1.94 |
| | | 10/31/01 | (12) | | | 9.26 | | | (0.08 | ) | | | (6.04 | ) | | | (6.12 | ) | | | — | | | | — | † | | | — | | | | 3.14 |
| | | | | | | | | |
Class L (11) | | 10/31/05 | | | | 2.66 | | | (0.03 | ) | | | 0.13 | | | | 0.10 | | | | — | | | | — | | | | — | | | | 2.76 |
| | | 10/31/04 | (12) | | | 2.79 | | | (0.04 | ) | | | (0.09 | ) | | | (0.13 | ) | | | — | | | | — | | | | — | | | | 2.66 |
| | | 10/31/03 | (12) | | | 1.97 | | | (0.04 | ) | | | 0.86 | | | | 0.82 | | | | — | | | | — | | | | — | | | | 2.79 |
| | | 10/31/02 | (12) | | | 3.18 | | | (0.05 | ) | | | (1.16 | ) | | | (1.21 | ) | | | — | | | | — | | | | — | | | | 1.97 |
| | | 10/31/01 | (12) | | | 9.27 | | | (0.05 | ) | | | (6.03 | ) | | | (6.08 | ) | | | (0.01 | ) | | | — | † | | | (0.01 | ) | | | 3.18 |
| | | | | | | | | |
Class M (11) | | 10/31/05 | | | | 2.58 | | | (0.05 | ) | | | 0.14 | | | | 0.09 | | | | — | | | | — | | | | — | | | | 2.67 |
| | | 10/31/04 | (12) | | | 2.72 | | | (0.06 | ) | | | (0.08 | ) | | | (0.14 | ) | | | — | | | | — | | | | — | | | | 2.58 |
| | | 10/31/03 | (12) | | | 1.93 | | | (0.05 | ) | | | 0.84 | | | | 0.79 | | | | — | | | | — | | | | — | | | | 2.72 |
| | | 10/31/02 | (12) | | | 3.13 | | | (0.07 | ) | | | (1.13 | ) | | | (1.20 | ) | | | — | | | | — | | | | — | | | | 1.93 |
| | | 10/31/01 | (12) | | | 9.25 | | | (0.08 | ) | | | (6.04 | ) | | | (6.12 | ) | | | — | | | | — | † | | | — | | | | 3.13 |
| | | | | | | | | |
Class X | | 10/31/05 | | | | 2.60 | | | (0.05 | ) | | | 0.13 | | | | 0.08 | | | | — | | | | — | | | | — | | | | 2.68 |
| | | 10/31/04 | (12) | | | 2.74 | | | (0.06 | ) | | | (0.08 | ) | | | (0.14 | ) | | | — | | | | — | | | | — | | | | 2.60 |
| | | 10/31/03 | (12) | | | 1.94 | | | (0.05 | ) | | | 0.85 | | | | 0.80 | | | | — | | | | — | | | | — | | | | 2.74 |
| | | 10/31/02 | (12) | | | 3.14 | | | (0.07 | ) | | | (1.13 | ) | | | (1.20 | ) | | | — | | | | — | | | | — | | | | 1.94 |
| | | 10/31/01 | (12) | | | 9.25 | | | (0.08 | ) | | | (6.03 | ) | | | (6.11 | ) | | | — | | | | — | † | | | — | | | | 3.14 |
| | | | | | | | | |
| STRATEGIC PARTNERS HEALTH SCIENCES FUND: | | | | | | | | | | | | | | | | | | | | | | | | | | | | | | | | | |
Class A | | 10/31/05 | | | $ | 11.12 | | $ | (0.10 | ) | | $ | 1.55 | | | $ | 1.45 | | | $ | — | | | $ | — | | | $ | — | | | $ | 12.57 |
| | | 10/31/04 | (10) | | | 12.06 | | | (0.03 | ) | | | (0.91 | ) | | | (0.94 | ) | | | — | | | | — | | | | — | | | | 11.12 |
| | | | | | | | | |
Class B | | 10/31/05 | | | | 10.88 | | | (0.12 | ) | | | 1.45 | | | | 1.33 | | | | — | | | | — | | | | — | | | | 12.21 |
| | | 10/31/04 | (10) | | | 11.87 | | | (0.05 | ) | | | (0.94 | ) | | | (0.99 | ) | | | — | | | | — | | | | — | | | | 10.88 |
| | | | | | | | | |
Class C | | 10/31/05 | | | | 10.91 | | | (0.20 | ) | | | 1.52 | | | | 1.32 | | | | — | | | | — | | | | — | | | | 12.23 |
| | | 10/31/04 | | | | 10.40 | | | (0.18 | ) | | | 0.69 | | | | 0.51 | | | | — | | | | — | | | | — | | | | 10.91 |
| | | 10/31/03 | (12) | | | 9.34 | | | (0.14 | ) | | | 1.20 | | | | 1.06 | | | | — | | | | — | | | | — | | | | 10.40 |
| | | 10/31/02 | (12) | | | 11.33 | | | (0.18 | ) | | | (1.81 | ) | | | (1.99 | ) | | | — | | | | — | | | | — | | | | 9.34 |
| | | 10/31/01 | (7)(12) | | | 10.00 | | | (0.12 | ) | | | 1.45 | | | | 1.33 | | | | — | | | | — | | | | — | | | | 11.33 |
| | | | | | | | | |
Class L (11) | | 10/31/05 | | | | 11.09 | | | (0.11 | ) | | | 1.51 | | | | 1.40 | | | | — | | | | — | | | | — | | | | 12.49 |
| | | 10/31/04 | | | | 10.52 | | | (0.14 | ) | | | 0.71 | | | | 0.57 | | | | — | | | | — | | | | — | | | | 11.09 |
| | | 10/31/03 | (12) | | | 9.40 | | | (0.09 | ) | | | 1.21 | | | | 1.12 | | | | — | | | | — | | | | — | | | | 10.52 |
| | | 10/31/02 | (12) | | | 11.35 | | | (0.12 | ) | | | (1.83 | ) | | | (1.95 | ) | | | — | | | | — | | | | — | | | | 9.40 |
| | | 10/31/01 | (7)(12) | | | 10.00 | | | (0.08 | ) | | | 1.43 | | | | 1.35 | | | | — | | | | — | | | | — | | | | 11.35 |
| | | | | | | | | |
Class M (11) | | 10/31/05 | | | | 10.89 | | | (0.18 | ) | | | 1.50 | | | | 1.32 | | | | — | | | | — | | | | — | | | | 12.21 |
| | | 10/31/04 | | | | 10.38 | | | (0.18 | ) | | | 0.69 | | | | 0.51 | | | | — | | | | — | | | | — | | | | 10.89 |
| | | 10/31/03 | (12) | | | 9.31 | | | (0.14 | ) | | | 1.21 | | | | 1.07 | | | | — | | | | — | | | | — | | | | 10.38 |
| | | 10/31/02 | (12) | | | 11.31 | | | (0.18 | ) | | | (1.82 | ) | | | (2.00 | ) | | | — | | | | — | | | | — | | | | 9.31 |
| | | 10/31/01 | (7)(12) | | | 10.00 | | | (0.11 | ) | | | 1.42 | | | | 1.31 | | | | — | | | | — | | | | — | | | | 11.31 |
| | | | | | | | | |
Class X | | 10/31/05 | | | | 10.92 | | | (0.19 | ) | | | 1.51 | | | | 1.32 | | | | — | | | | — | | | | — | | | | 12.24 |
| | | 10/31/04 | | | | 10.40 | | | (0.18 | ) | | | 0.70 | | | | 0.52 | | | | — | | | | — | | | | — | | | | 10.92 |
| | | 10/31/03 | (12) | | | 9.34 | | | (0.14 | ) | | | 1.20 | | | | 1.06 | | | | — | | | | — | | | | — | | | | 10.40 |
| | | 10/31/02 | (12) | | | 11.33 | | | (0.18 | ) | | | (1.81 | ) | | | (1.99 | ) | | | — | | | | — | | | | — | | | | 9.34 |
| | | 10/31/01 | (7)(12) | | | 10.00 | | | (0.11 | ) | | | 1.44 | | | | 1.33 | | | | — | | | | — | | | | — | | | | 11.33 |
147
| | | | | | | | | | | | | | | | |
Supplemental Data
| | | Ratios of Expenses to Average Net Assets(2)
| | | Ratio of Net Investment
Income (Loss) to
Average Net Assets(2)
| |
Total
Return
| | | Net Assets at
End of Period
(in 000’s)
| | Portfolio
Turnover
Rate
| | | Net Operating Expenses
(after Expense
Reimbursement
and Waiver)(3)
| | | Net Operating Expenses
(before Expense
Reimbursement and Waiver)(3)
| | |
| 4.14 | % | | $ | 2,320 | | 39 | % | | 1.65 | % | | 3.26 | % | | (0.85 | %) |
| (8.90 | %) | | | 1,453 | | 136 | % | | 1.65 | % | | 3.05 | % | | (1.31 | %) |
| | | | | |
| 3.10 | % | | | 311 | | 39 | % | | 2.40 | % | | 4.01 | % | | (1.69 | %) |
| (9.16 | %) | | | 165 | | 136 | % | | 2.40 | % | | 3.80 | % | | (2.05 | %) |
| | | | | |
| 3.48 | % | | | 3,227 | | 39 | % | | 2.40 | % | | 4.01 | % | | (1.47 | %) |
| (5.13 | %) | | | 5,366 | | 136 | % | | 2.40 | % | | 3.80 | % | | (2.13 | %) |
| 40.72 | % | | | 6,651 | | 89 | % | | 2.40 | % | | 3.77 | % | | (2.09 | %) |
| (38.22 | %) | | | 4,559 | | 91 | % | | 2.40 | % | | 3.54 | % | | (2.25 | %) |
| (66.09 | %) | | | 6,939 | | 74 | % | | 2.40 | % | | 3.31 | % | | (1.68 | %) |
| | | | | |
| 3.76 | % | | | 2,288 | | 39 | % | | 1.90 | % | | 3.51 | % | | (0.96 | %) |
| (4.66 | %) | | | 4,374 | | 136 | % | | 1.90 | % | | 3.30 | % | | (1.64 | %) |
| 41.62 | % | | | 7,452 | | 89 | % | | 1.90 | % | | 3.27 | % | | (1.59 | %) |
| (38.05 | %) | | | 4,773 | | 91 | % | | 1.90 | % | | 3.03 | % | | (1.74 | %) |
| (65.64 | %) | | | 7,989 | | 74 | % | | 1.90 | % | | 2.90 | % | | (1.21 | %) |
| | | | | |
| 3.49 | % | | | 5,569 | | 39 | % | | 2.40 | % | | 4.01 | % | | (1.49 | %) |
| (5.15 | %) | | | 8,182 | | 136 | % | | 2.40 | % | | 3.80 | % | | (2.13 | %) |
| 40.93 | % | | | 9,694 | | 89 | % | | 2.40 | % | | 3.77 | % | | (2.10 | %) |
| (38.34 | %) | | | 6,036 | | 91 | % | | 2.40 | % | | 3.52 | % | | (2.25 | %) |
| (66.16 | %) | | | 10,259 | | 74 | % | | 2.40 | % | | 3.30 | % | | (1.67 | %) |
| | | | | |
| 3.08 | % | | | 1,005 | | 39 | % | | 2.40 | % | | 4.01 | % | | (1.47 | %) |
| (5.11 | %)(1) | | | 1,585 | | 136 | % | | 2.40 | % | | 3.80 | % | | (2.13 | %) |
| 41.24 | %(1) | | | 1,624 | | 89 | % | | 2.40 | % | | 3.78 | % | | (2.10 | %) |
| (38.22 | %)(1) | | | 1,013 | | 91 | % | | 2.40 | % | | 3.51 | % | | (2.26 | %) |
| (66.05 | %)(1) | | | 1,830 | | 74 | % | | 2.40 | % | | 3.44 | % | | (1.71 | %) |
| | | | | |
| 13.04 | % | | $ | 4,601 | | 93 | % | | 1.65 | % | | 3.45 | % | | (0.73 | %) |
| (7.79 | %) | | | 1,127 | | 178 | % | | 1.65 | % | | 2.75 | % | | (0.83 | %) |
| | | | | |
| 12.23 | % | | | 836 | | 93 | % | | 2.40 | % | | 4.20 | % | | (1.50 | %) |
| (8.34 | %) | | | 267 | | 178 | % | | 2.40 | % | | 3.50 | % | | (1.60 | %) |
| | | | | |
| 12.10 | % | | | 3,738 | | 93 | % | | 2.40 | % | | 4.20 | % | | (1.46 | %) |
| 4.90 | % | | | 4,317 | | 178 | % | | 2.40 | % | | 3.50 | % | | (1.53 | %) |
| 11.35 | % | | | 4,427 | | 144 | % | | 2.40 | % | | 3.62 | % | | (1.47 | %) |
| (17.64 | %) | | | 3,870 | | 122 | % | | 2.40 | % | | 3.68 | % | | (1.70 | %) |
| 13.40 | % | | | 2,659 | | 35 | % | | 2.40 | % | | 4.70 | % | | (1.56 | %) |
| | | | | |
| 12.62 | % | | | 3,016 | | 93 | % | | 1.90 | % | | 3.70 | % | | (0.95 | %) |
| 5.42 | % | | | 4,365 | | 178 | % | | 1.90 | % | | 3.00 | % | | (1.02 | %) |
| 11.92 | % | | | 5,036 | | 144 | % | | 1.90 | % | | 3.12 | % | | (0.97 | %) |
| (17.25 | %) | | | 4,210 | | 122 | % | | 1.90 | % | | 3.18 | % | | (1.19 | %) |
| 13.60 | % | | | 3,971 | | 35 | % | | 1.90 | % | | 3.96 | % | | (1.10 | %) |
| | | | | |
| 12.12 | % | | | 8,785 | | 93 | % | | 2.40 | % | | 4.20 | % | | (1.47 | %) |
| 4.91 | % | | | 8,632 | | 178 | % | | 2.40 | % | | 3.50 | % | | (1.52 | %) |
| 11.37 | % | | | 7,375 | | 144 | % | | 2.40 | % | | 3.62 | % | | (1.48 | %) |
| (17.60 | %) | | | 7,256 | | 122 | % | | 2.40 | % | | 3.66 | % | | (1.69 | %) |
| 13.10 | % | | | 6,427 | | 35 | % | | 2.40 | % | | 4.75 | % | | (1.54 | %) |
| | | | | |
| 12.09 | % | | | 1,485 | | 93 | % | | 2.40 | % | | 4.20 | % | | (1.46 | %) |
| 5.00 | %(1) | | | 1,653 | | 178 | % | | 2.40 | % | | 3.50 | % | | (1.52 | %) |
| 11.35 | %(1) | | | 1,526 | | 144 | % | | 2.40 | % | | 3.62 | % | | (1.47 | %) |
| (17.64 | %)(1) | | | 1,956 | | 122 | % | | 2.40 | % | | 3.69 | % | | (1.70 | %) |
| 13.40 | %(1) | | | 1,702 | | 35 | % | | 2.40 | % | | 5.49 | % | | (1.48 | %) |
See Notes to Financial Statements.
148
Financial Highlights
Per Share Data
(for a Share Outstanding Throughout Each Period)
| | | | | | | | | | | | | | | | | | | | | | | | | | | | | | |
| | | | | | | | Increase (Decrease) from Investment Operations
| | | Less Distributions
| | | | |
| | | Period Ended
| | | Net Asset Value Beginning of Period
| | Net Investment Income (Loss)
| | | Net Realized & Unrealized Gain (Loss)
| | | Total from Investment Operations
| | | From Net Investment Income
| | From Net Realized Gains
| | Total Distributions
| | Net Asset Value End of Period
|
STRATEGIC PARTNERS MANAGED OTC FUND: | | | | | | | | | | | | | | | | | | | | | | | | | | | | | | |
| | | | | | | | | |
Class A | | 10/31/05 | | | $ | 2.56 | | $ | (0.01 | ) | | $ | 0.15 | | | $ | 0.14 | | | $ | — | | $ | — | | $ | — | | $ | 2.70 |
| | | 10/31/04 | (10)(12) | | | 2.60 | | | (0.02 | ) | | | (0.02 | ) | | | (0.04 | ) | | | — | | | — | | | — | | | 2.56 |
| | | | | | | | | |
Class B | | 10/31/05 | | | | 2.50 | | | (0.03 | ) | | | 0.15 | | | | 0.12 | | | | — | | | — | | | — | | | 2.62 |
| | | 10/31/04 | (10)(12) | | | 2.57 | | | (0.03 | ) | | | (0.04 | ) | | | (0.07 | ) | | | — | | | — | | | — | | | 2.50 |
| | | | | | | | | |
Class C | | 10/31/05 | | | | 2.50 | | | (0.02 | ) | | | 0.14 | | | | 0.12 | | | | — | | | — | | | — | | | 2.62 |
| | | 10/31/04 | (12) | | | 2.42 | | | (0.05 | ) | | | 0.13 | | | | 0.08 | | | | — | | | — | | | — | | | 2.50 |
| | | 10/31/03 | (12) | | | 1.60 | | | (0.04 | ) | | | 0.86 | | | | 0.82 | | | | — | | | — | | | — | | | 2.42 |
| | | 10/31/02 | (12) | | | 2.51 | | | (0.05 | ) | | | (0.86 | ) | | | (0.91 | ) | | | — | | | — | | | — | | | 1.60 |
| | | 10/31/01 | (12) | | | 8.21 | | | (0.07 | ) | | | (5.63 | ) | | | (5.70 | ) | | | — | | | — | | | — | | | 2.51 |
| | | | | | | | | |
Class L (11) | | 10/31/05 | | | | 2.55 | | | — | | | | 0.13 | | | | 0.13 | | | | — | | | — | | | — | | | 2.68 |
| | | 10/31/04 | (12) | | | 2.45 | | | (0.04 | ) | | | 0.14 | | | | 0.10 | | | | — | | | — | | | — | | | 2.55 |
| | | 10/31/03 | (12) | | | 1.61 | | | (0.03 | ) | | | 0.87 | | | | 0.84 | | | | — | | | — | | | — | | | 2.45 |
| | | 10/31/02 | (12) | | | 2.53 | | | (0.04 | ) | | | (0.88 | ) | | | (0.92 | ) | | | — | | | — | | | — | | | 1.61 |
| | | 10/31/01 | (12) | | | 8.22 | | | (0.05 | ) | | | (5.64 | ) | | | (5.69 | ) | | | — | | | — | | | — | | | 2.53 |
| | | | | | | | | |
Class M (11) | | 10/31/05 | | | | 2.51 | | | (0.02 | ) | | | 0.14 | | | | 0.12 | | | | — | | | — | | | — | | | 2.63 |
| | | 10/31/04 | (12) | | | 2.43 | | | (0.05 | ) | | | 0.13 | | | | 0.08 | | | | — | | | — | | | — | | | 2.51 |
| | | 10/31/03 | (12) | | | 1.60 | | | (0.04 | ) | | | 0.87 | | | | 0.83 | | | | — | | | — | | | — | | | 2.43 |
| | | 10/31/02 | (12) | | | 2.52 | | | (0.05 | ) | | | (0.87 | ) | | | (0.92 | ) | | | — | | | — | | | — | | | 1.60 |
| | | 10/31/01 | (12) | | | 8.22 | | | (0.07 | ) | | | (5.63 | ) | | | (5.70 | ) | | | — | | | — | | | — | | | 2.52 |
| | | | | | | | | |
Class X | | 10/31/05 | | | | 2.51 | | | (0.02 | ) | | | 0.14 | | | | 0.12 | | | | — | | | — | | | — | | | 2.63 |
| | | 10/31/04 | (12) | | | 2.43 | | | (0.05 | ) | | | 0.13 | | | | 0.08 | | | | — | | | — | | | — | | | 2.51 |
| | | 10/31/03 | (12) | | | 1.60 | | | (0.04 | ) | | | 0.87 | | | | 0.83 | | | | — | | | — | | | — | | | 2.43 |
| | | 10/31/02 | (12) | | | 2.52 | | | (0.05 | ) | | | (0.87 | ) | | | (0.92 | ) | | | — | | | — | | | — | | | 1.60 |
| | | 10/31/01 | (12) | | | 8.21 | | | (0.07 | ) | | | (5.62 | ) | | | (5.69 | ) | | | — | | | — | | | — | | | 2.52 |
STRATEGIC PARTNERS CAPITAL GROWTH FUND: | | | | | | | | | | | | | | | | | | | | | | | | | | | | | | |
| | | | | | | | | |
Class A | | 10/31/05 | | | $ | 13.44 | | $ | (0.11 | ) | | $ | 1.95 | | | $ | 1.84 | | | $ | — | | $ | — | | $ | — | | $ | 15.28 |
| | | 10/31/04 | (10) | | | 13.73 | | | (0.02 | ) | | | (0.27 | ) | | | (0.29 | ) | | | — | | | — | | | — | | | 13.44 |
| | | | | | | | | |
Class B | | 10/31/05 | | | | 13.01 | | | (0.17 | ) | | | 1.84 | | | | 1.67 | | | | — | | | — | | | — | | | 14.68 |
| | | 10/31/04 | (10) | | | 13.35 | | | (0.05 | ) | | | (0.29 | ) | | | (0.34 | ) | | | — | | | — | | | — | | | 13.01 |
| | | | | | | | | |
Class C | | 10/31/05 | | | | 12.98 | | | (0.23 | ) | | | 1.90 | | | | 1.67 | | | | — | | | — | | | — | | | 14.65 |
| | | 10/31/04 | | | | 12.70 | | | (0.20 | ) | | | 0.48 | | | | 0.28 | | | | — | | | — | | | — | | | 12.98 |
| | | 10/31/03 | (12) | | | 10.45 | | | (0.16 | ) | | | 2.41 | | | | 2.25 | | | | — | | | — | | | — | | | 12.70 |
| | | 10/31/02 | (12) | | | 10.98 | | | (0.17 | ) | | | (0.36 | ) | | | (0.53 | ) | | | — | | | — | | | — | | | 10.45 |
| | | 10/31/01 | (12) | | | 15.78 | | | (0.17 | ) | | | (4.63 | ) | | | (4.80 | ) | | | — | | | — | | | — | | | 10.98 |
| | | | | | | | | |
Class L (11) | | 10/31/05 | | | | 13.40 | | | (0.13 | ) | | | 1.92 | | | | 1.79 | | | | — | | | — | | | — | | | 15.19 |
| | | 10/31/04 | | | | 13.04 | | | (0.13 | ) | | | 0.49 | | | | 0.36 | | | | — | | | — | | | — | | | 13.40 |
| | | 10/31/03 | (12) | | | 10.68 | | | (0.11 | ) | | | 2.47 | | | | 2.36 | | | | — | | | — | | | — | | | 13.04 |
| | | 10/31/02 | (12) | | | 11.16 | | | (0.12 | ) | | | (0.36 | ) | | | (0.48 | ) | | | — | | | — | | | — | | | 10.68 |
| | | 10/31/01 | (12) | | | 15.96 | | | (0.10 | ) | | | (4.70 | ) | | | (4.80 | ) | | | — | | | — | | | — | | | 11.16 |
| | | | | | | | | |
Class M (11) | | 10/31/05 | | | | 13.00 | | | (0.22 | ) | | | 1.88 | | | | 1.66 | | | | — | | | — | | | — | | | 14.66 |
| | | 10/31/04 | | | | 12.72 | | | (0.19 | ) | | | 0.47 | | | | 0.28 | | | | — | | | — | | | — | | | 13.00 |
| | | 10/31/03 | (12) | | | 10.46 | | | (0.16 | ) | | | 2.42 | | | | 2.26 | | | | — | | | — | | | — | | | 12.72 |
| | | 10/31/02 | (12) | | | 10.99 | | | (0.17 | ) | | | (0.36 | ) | | | (0.53 | ) | | | — | | | — | | | — | | | 10.46 |
| | | 10/31/01 | (12) | | | 15.80 | | | (0.17 | ) | | | (4.64 | ) | | | (4.81 | ) | | | — | | | — | | | — | | | 10.99 |
| | | | | | | | | |
Class X | | 10/31/05 | | | | 12.97 | | | (0.22 | ) | | | 1.89 | | | | 1.67 | | | | — | | | — | | | — | | | 14.64 |
| | | 10/31/04 | | | | 12.69 | | | (0.18 | ) | | | 0.46 | | | | 0.28 | | | | — | | | — | | | — | | | 12.97 |
| | | 10/31/03 | (12) | | | 10.44 | | | (0.16 | ) | | | 2.41 | | | | 2.25 | | | | — | | | — | | | — | | | 12.69 |
| | | 10/31/02 | (12) | | | 10.97 | | | (0.17 | ) | | | (0.36 | ) | | | (0.53 | ) | | | — | | | — | | | — | | | 10.44 |
| | | 10/31/01 | (12) | | | 15.77 | | | (0.17 | ) | | | (4.63 | ) | | | (4.80 | ) | | | — | | | — | | | — | | | 10.97 |
149
| | | | | | | | | | | | | | | | |
Supplemental Data
| | | Ratios of Expenses to Average Net Assets(2)
| | | | |
Total Return
| | | Net Assets at End of Period (in 000’s)
| | Portfolio Turnover Rate
| | | Net Operating Expenses (after Expense Reimbursement and Waiver)(3)
| | | Net Operating Expenses (before Expense Reimbursement and Waiver)(3)
| | | Ratio of Net Investment Income (Loss) to Average Net Assets(2)
| |
| 5.47 | % | | $ | 1,857 | | 10 | % | | 1.50 | % | | 2.10 | % | | (0.19 | %) |
| (1.54 | %) | | | 1,442 | | 17 | % | | 1.50 | % | | 2.25 | % | | (1.17 | %) |
| | | | | |
| 4.80 | % | | | 539 | | 10 | % | | 2.25 | % | | 2.85 | % | | (0.94 | %) |
| (2.72 | %) | | | 541 | | 17 | % | | 2.25 | % | | 3.00 | % | | (1.94 | %) |
| | | | | |
| 4.80 | % | | | 7,634 | | 10 | % | | 2.25 | % | | 2.85 | % | | (0.69 | %) |
| 3.31 | % | | | 11,209 | | 17 | % | | 2.25 | % | | 3.00 | % | | (1.98 | %) |
| 51.25 | % | | | 13,526 | | 17 | % | | 2.25 | % | | 2.93 | % | | (1.96 | %) |
| (36.26 | %) | | | 7,688 | | 30 | % | | 2.25 | % | | 3.10 | % | | (2.06 | %) |
| (69.43 | %) | | | 7,760 | | 54 | % | | 2.25 | % | | 3.14 | % | | (1.93 | %) |
| | | | | |
| 5.10 | % | | | 5,014 | | 10 | % | | 1.75 | % | | 2.35 | % | | (0.16 | %) |
| 4.08 | % | | | 7,284 | | 17 | % | | 1.75 | % | | 2.50 | % | | (1.48 | %) |
| 52.17 | % | | | 9,161 | | 17 | % | | 1.75 | % | | 2.42 | % | | (1.46 | %) |
| (36.36 | %) | | | 5,076 | | 30 | % | | 1.75 | % | | 2.58 | % | | (1.56 | %) |
| (69.22 | %) | | | 6,805 | | 54 | % | | 1.75 | % | | 2.59 | % | | (1.42 | %) |
| | | | | |
| 4.78 | % | | | 9,886 | | 10 | % | | 2.25 | % | | 2.85 | % | | (0.67 | %) |
| 3.29 | % | | | 14,462 | | 17 | % | | 2.25 | % | | 3.00 | % | | (1.98 | %) |
| 51.88 | % | | | 17,120 | | 17 | % | | 2.25 | % | | 2.93 | % | | (1.96 | %) |
| (36.51 | %) | | | 10,978 | | 30 | % | | 2.25 | % | | 3.09 | % | | (2.06 | %) |
| (69.34 | %) | | | 13,664 | | 54 | % | | 2.25 | % | | 3.13 | % | | (1.92 | %) |
| | | | | |
| 4.78 | % | | | 957 | | 10 | % | | 2.25 | % | | 2.85 | % | | (0.56 | %) |
| 3.29 | %(1) | | | 1,588 | | 17 | % | | 2.25 | % | | 3.00 | % | | (1.98 | %) |
| 51.88 | %(1) | | | 1,756 | | 17 | % | | 2.25 | % | | 2.92 | % | | (1.96 | %) |
| (36.51 | %)(1) | | | 739 | | 30 | % | | 2.25 | % | | 3.07 | % | | (2.06 | %) |
| (69.31 | %)(1) | | | 1,106 | | 54 | % | | 2.25 | % | | 3.23 | % | | (1.94 | %) |
| | | | | |
| 13.69 | % | | $ | 31,085 | | 60 | % | | 1.55 | % | | 1.67 | % | | (0.62 | %) |
| (2.11 | %) | | | 18,159 | | 78 | % | | 1.55 | % | | 1.69 | % | | (0.47 | %) |
| | | | | |
| 12.84 | % | | | 8,075 | | 60 | % | | 2.30 | % | | 2.42 | % | | (1.37 | %) |
| (2.55 | %) | | | 3,034 | | 78 | % | | 2.30 | % | | 2.44 | % | | (1.21 | %) |
| | | | | |
| 12.87 | % | | | 145,904 | | 60 | % | | 2.30 | % | | 2.42 | % | | (1.36 | %) |
| 2.20 | % | | | 167,119 | | 78 | % | | 2.30 | % | | 2.44 | % | | (1.37 | %) |
| 21.88 | % | | | 178,255 | | 81 | % | | 2.30 | % | | 2.51 | % | | (1.52 | %) |
| (5.10 | %) | | | 144,397 | | 103 | % | | 2.30 | % | | 2.50 | % | | (1.51 | %) |
| (30.37 | %) | | | 156,021 | | 133 | % | | 2.30 | % | | 2.44 | % | | (1.26 | %) |
| | | | | |
| 13.36 | % | | | 104,412 | | 60 | % | | 1.80 | % | | 1.92 | % | | (0.85 | %) |
| 2.76 | % | | | 139,498 | | 78 | % | | 1.80 | % | | 1.94 | % | | (0.87 | %) |
| 22.44 | % | | | 148,052 | | 81 | % | | 1.80 | % | | 2.01 | % | | (1.02 | %) |
| 4.57 | %) | | | 124,022 | | 103 | % | | 1.80 | % | | 2.00 | % | | (1.01 | %) |
| (30.03 | %) | | | 149,093 | | 133 | % | | 1.80 | % | | 1.94 | % | | (0.76 | %) |
| | | | | |
| 12.77 | % | | | 291,461 | | 60 | % | | 2.30 | % | | 2.42 | % | | (1.36 | %) |
| 2.20 | % | | | 329,320 | | 78 | % | | 2.30 | % | | 2.44 | % | | (1.36 | %) |
| 21.96 | % | | | 320,738 | | 81 | % | | 2.30 | % | | 2.51 | % | | (1.53 | %) |
| (5.10 | %) | | | 282,066 | | 103 | % | | 2.30 | % | | 2.50 | % | | (1.51 | %) |
| (30.44 | %) | | | 331,904 | | 133 | % | | 2.30 | % | | 2.44 | % | | (1.26 | %) |
| | | | | |
| 12.88 | % | | | 53,162 | | 60 | % | | 2.30 | % | | 2.42 | % | | (1.36 | %) |
| 2.21 | %(1) | | | 58,784 | | 78 | % | | 2.30 | % | | 2.44 | % | | (1.36 | %) |
| 21.90 | %(1) | | | 53,036 | | 81 | % | | 2.30 | % | | 2.51 | % | | (1.52 | %) |
| (5.10 | %)(1) | | | 45,557 | | 103 | % | | 2.30 | % | | 2.50 | % | | (1.51 | %) |
| (30.39 | %)(1) | | | 51,745 | | 133 | % | | 2.30 | % | | 2.44 | % | | (1.26 | %) |
See Notes to Financial Statements.
150
Financial Highlights
Per Share Data
(for a Share Outstanding Throughout Each Period)
| | | | | | | | | | | | | | | | | | | | | | | | | | | | | | | | | |
| | | | | | | | Increase (Decrease) from Investment Operations
| | | Less Distributions
| | | | | | |
| | | Period Ended
| | | Net Asset Value Beginning of Period
| | Net Investment Income (Loss)
| | | Net Realized & Unrealized Gain (Loss)
| | | Total from Investment Operations
| | | From Net Investment Income
| | | From Net Realized Gains
| | | Total Distributions
| | | Net Asset Value End of Period
|
STRATEGIC PARTNERS CONCENTRATED GROWTH FUND(9): | | | | | | | | | | | | | | | | | | | | | | | | | | | | | | | | | |
| | | | | | | | | |
Class A | | 10/31/05 | (12) | | $ | 11.20 | | $ | (0.01 | ) | | $ | 0.56 | | | $ | 0.55 | | | $ | — | | | $ | — | | | $ | — | | | $ | 11.75 |
| | | 10/31/04 | (10)(12) | | | 11.70 | | | (0.04 | ) | | | (0.46 | ) | | | (0.50 | ) | | | — | | | | — | | | | — | | | | 11.20 |
| | | | | | | | | |
Class B | | 10/31/05 | (12) | | | 9.66 | | | (0.07 | ) | | | 0.47 | | | | 0.40 | | | | — | | | | — | | | | — | | | | 10.06 |
| | | 10/31/04 | (10)(12) | | | 10.16 | | | (0.07 | ) | | | (0.43 | ) | | | (0.50 | ) | | | — | | | | — | | | | — | | | | 9.66 |
| | | | | | | | | |
Class C | | 10/31/05 | (12) | | | 9.64 | | | (0.08 | ) | | | 0.48 | | | | 0.40 | | | | — | | | | — | | | | — | | | | 10.04 |
| | | 10/31/04 | (12) | | | 9.53 | | | (0.13 | ) | | | 0.24 | | | | 0.11 | | | | — | | | | — | | | | — | | | | 9.64 |
| | | 10/31/03 | (12) | | | 8.51 | | | (0.13 | ) | | | 1.15 | | | | 1.02 | | | | — | | | | — | | | | — | | | | 9.53 |
| | | 10/31/02 | (12) | | | 10.91 | | | (0.12 | ) | | | (2.28 | ) | | | (2.40 | ) | | | — | | | | — | | | | — | | | | 8.51 |
| | | 10/31/01 | (12) | | | 20.10 | | | (0.07 | ) | | | (9.12 | ) | | | (9.19 | ) | | | — | | | | — | | | | — | | | | 10.91 |
| | | | | | | | | |
Class L (11) | | 10/31/05 | (12) | | | 11.17 | | | (0.02 | ) | | | 0.54 | | | | 0.52 | | | | — | | | | — | | | | — | | | | 11.69 |
| | | 10/31/04 | (12) | | | 10.99 | | | (0.10 | ) | | | 0.28 | | | | 0.18 | | | | — | | | | — | | | | — | | | | 11.17 |
| | | 10/31/03 | (12) | | | 9.76 | | | (0.10 | ) | | | 1.33 | | | | 1.23 | | | | — | | | | — | | | | — | | | | 10.99 |
| | | 10/31/02 | (12) | | | 12.44 | | | (0.12 | ) | | | (2.56 | ) | | | (2.68 | ) | | | — | | | | — | | | | — | | | | 9.76 |
| | | 10/31/01 | (12) | | | 22.80 | | | 0.01 | | | | (10.37 | ) | | | (10.36 | ) | | | — | | | | — | | | | — | | | | 12.44 |
| | | | | | | | | |
Class M (11) | | 10/31/05 | (12) | | | 9.67 | | | (0.08 | ) | | | 0.48 | | | | 0.40 | | | | — | | | | — | | | | — | | | | 10.07 |
| | | 10/31/04 | (12) | | | 9.56 | | | (0.14 | ) | | | 0.25 | | | | 0.11 | | | | — | | | | — | | | | — | | | | 9.67 |
| | | 10/31/03 | (12) | | | 8.54 | | | (0.13 | ) | | | 1.15 | | | | 1.02 | | | | — | | | | — | | | | — | | | | 9.56 |
| | | 10/31/02 | (12) | | | 10.94 | | | (0.12 | ) | | | (2.28 | ) | | | (2.40 | ) | | | — | | | | — | | | | — | | | | 8.54 |
| | | 10/31/01 | (12) | | | 20.14 | | | (0.07 | ) | | | (9.13 | ) | | | (9.20 | ) | | | — | | | | — | | | | — | | | | 10.94 |
| | | | | | | | | |
Class X | | 10/31/05 | (12) | | | 9.68 | | | (0.08 | ) | | | 0.48 | | | | 0.40 | | | | — | | | | — | | | | — | | | | 10.08 |
| | | 10/31/04 | (12) | | | 9.57 | | | (0.14 | ) | | | 0.25 | | | | 0.11 | | | | — | | | | — | | | | — | | | | 9.68 |
| | | 10/31/03 | (12) | | | 8.55 | | | (0.13 | ) | | | 1.15 | | | | 1.02 | | | | — | | | | — | | | | — | | | | 9.57 |
| | | 10/31/02 | (12) | | | 10.95 | | | (0.11 | ) | | | (2.29 | ) | | | (2.40 | ) | | | — | | | | — | | | | — | | | | 8.55 |
| | | 10/31/01 | (12) | | | 20.17 | | | (0.07 | ) | | | (9.15 | ) | | | (9.22 | ) | | | — | | | | — | | | | — | | | | 10.95 |
STRATEGIC PARTNERS CORE VALUE FUND: | | | | | | | | | | | | | | | | | | | | | | | | | | | | | | | | | |
| | | | | | | | | |
Class A | | 10/31/05 | | | $ | 12.29 | | $ | 0.11 | | | $ | 0.99 | | | $ | 1.10 | | | $ | (0.14 | ) | | $ | (0.28 | ) | | $ | (0.42 | ) | | $ | 12.97 |
| | | 10/31/04 | (10)(12) | | | 12.21 | | | 0.06 | | | | 0.02 | | | | 0.08 | | | | — | | | | — | | | | — | | | | 12.29 |
| | | | | | | | | |
Class B | | 10/31/05 | | | | 12.20 | | | 0.03 | | | | 0.97 | | | | 1.00 | | | | (0.04 | ) | | | (0.28 | ) | | | (0.32 | ) | | | 12.88 |
| | | 10/31/04 | (10)(12) | | | 12.17 | | | 0.01 | | | | 0.02 | | | | 0.03 | | | | — | | | | — | | | | — | | | | 12.20 |
| | | | | | | | | |
Class C | | 10/31/05 | | | | 12.18 | | | 0.03 | | | | 0.96 | | | | 0.99 | | | | (0.01 | ) | | | (0.28 | ) | | | (0.29 | ) | | | 12.88 |
| | | 10/31/04 | (12) | | | 10.95 | | | 0.02 | | | | 1.25 | | | | 1.27 | | | | (0.04 | ) | | | — | | | | (0.04 | ) | | | 12.18 |
| | | 10/31/03 | (12) | | | 8.88 | | | 0.04 | | | | 2.05 | | | | 2.09 | | | | (0.02 | ) | | | — | | | | (0.02 | ) | | | 10.95 |
| | | 10/31/02 | (12) | | | 9.73 | | | 0.03 | | | | (0.85 | ) | | | (0.82 | ) | | | (0.01 | ) | | | (0.02 | ) | | | (0.03 | ) | | | 8.88 |
| | | 10/31/01 | (7)(12) | | | 10.00 | | | 0.01 | | | | (0.28 | ) | | | (0.27 | ) | | | — | | | | — | | | | — | | | | 9.73 |
| | | | | | | | | |
Class L (11) | | 10/31/05 | | | | 12.26 | | | 0.09 | | | | 0.96 | | | | 1.05 | | | | (0.10 | ) | | | (0.28 | ) | | | (0.38 | ) | | | 12.93 |
| | | 10/31/04 | (12) | | | 10.99 | | | 0.07 | | | | 1.27 | | | | 1.34 | | | | (0.07 | ) | | | — | | | | (0.07 | ) | | | 12.26 |
| | | 10/31/03 | (12) | | | 8.92 | | | 0.10 | | | | 2.04 | | | | 2.14 | | | | (0.07 | ) | | | — | | | | (0.07 | ) | | | 10.99 |
| | | 10/31/02 | (12) | | | 9.77 | | | 0.08 | | | | (0.86 | ) | | | (0.78 | ) | | | (0.05 | ) | | | (0.02 | ) | | | (0.07 | ) | | | 8.92 |
| | | 10/31/01 | (7)(12) | | | 10.00 | | | 0.05 | | | | (0.28 | ) | | | (0.23 | ) | | | — | | | | — | | | | — | | | | 9.77 |
| | | | | | | | | |
Class M (11) | | 10/31/05 | | | | 12.18 | | | 0.03 | | | | 0.97 | | | | 1.00 | | | | (0.02 | ) | | | (0.28 | ) | | | (0.30 | ) | | | 12.88 |
| | | 10/31/04 | (12) | | | 10.95 | | | 0.02 | | | | 1.25 | | | | 1.27 | | | | (0.04 | ) | | | — | | | | (0.04 | ) | | | 12.18 |
| | | 10/31/03 | (12) | | | 8.88 | | | 0.04 | | | | 2.05 | | | | 2.09 | | | | (0.02 | ) | | | — | | | | (0.02 | ) | | | 10.95 |
| | | 10/31/02 | (12) | | | 9.74 | | | 0.03 | | | | (0.86 | ) | | | (0.83 | ) | | | (0.01 | ) | | | (0.02 | ) | | | (0.03 | ) | | | 8.88 |
| | | 10/31/01 | (7)(12) | | | 10.00 | | | 0.01 | | | | (0.27 | ) | | | (0.26 | ) | | | — | | | | — | | | | — | | | | 9.74 |
| | | | | | | | | |
Class X | | 10/31/05 | | | | 12.18 | | | 0.03 | | | | 0.97 | | | | 1.00 | | | | (0.01 | ) | | | (0.28 | ) | | | (0.29 | ) | | | 12.89 |
| | | 10/31/04 | (12) | | | 10.95 | | | 0.02 | | | | 1.25 | | | | 1.27 | | | | (0.04 | ) | | | — | | | | (0.04 | ) | | | 12.18 |
| | | 10/31/03 | (12) | | | 8.88 | | | 0.04 | | | | 2.05 | | | | 2.09 | | | | (0.02 | ) | | | — | | | | (0.02 | ) | | | 10.95 |
| | | 10/31/02 | (12) | | | 9.73 | | | 0.03 | | | | (0.85 | ) | | | (0.82 | ) | | | (0.01 | ) | | | (0.02 | ) | | | (0.03 | ) | | | 8.88 |
| | | 10/31/01 | (7)(12) | | | 10.00 | | | 0.02 | | | | (0.29 | ) | | | (0.27 | ) | | | — | | | | — | | | | — | | | | 9.73 |
151
| | | | | | | | | | | | | | | | |
Supplemental Data
| | | Ratios of Expenses to Average Net Assets(2)
| | | | |
Total Return
| | | Net Assets at End of Period (in 000’s)
| | Portfolio Turnover Rate
| | | Net Operating Expenses (after Expense Reimbursement and Waiver)(3)
| | | Net Operating Expenses (before Expense Reimbursement and Waiver)(3)
| | | Ratio of Net Investment Income (Loss) to Average Net Assets(2)
| |
| 4.91 | % | | $ | 14,474 | | 33 | % | | 1.50 | % | | 2.15 | % | | (0.13 | %) |
| (4.27 | %) | | | 10,089 | | 16 | % | | 1.50 | % | | 1.92 | % | | (0.66 | %) |
| | | | | |
| 4.14 | % | | | 3,654 | | 33 | % | | 2.25 | % | | 2.90 | % | | (0.97 | %) |
| (4.92 | %) | | | 1,609 | | 16 | % | | 2.25 | % | | 2.67 | % | | (1.39 | %) |
| | | | | |
| 4.15 | % | | | 43,946 | | 33 | % | | 2.25 | % | | 2.90 | % | | (0.64 | %) |
| 1.15 | % | | | 61,542 | | 16 | % | | 2.25 | % | | 2.67 | % | | (1.39 | %) |
| 11.99 | % | | | 87,291 | | 107 | % | | 2.25 | % | | 2.76 | % | | (1.48 | %) |
| (22.00 | %) | | | 99,201 | | 76 | % | | 2.25 | % | | 2.67 | % | | (1.19 | %) |
| (45.72 | %) | | | 185,968 | | 54 | % | | 2.25 | % | | 2.47 | % | | (0.45 | %) |
| | | | | |
| 4.66 | % | | | 49,291 | | 33 | % | | 1.75 | % | | 2.40 | % | | (0.13 | %) |
| 1.64 | % | | | 71,664 | | 16 | % | | 1.75 | % | | 2.17 | % | | (0.89 | %) |
| 12.60 | % | | | 102,837 | | 107 | % | | 1.75 | % | | 2.26 | % | | (0.98 | %) |
| (21.54 | %) | | | 112,352 | | 76 | % | | 1.75 | % | | 2.16 | % | | (1.05 | %) |
| (45.44 | %) | | | 210,590 | | 54 | % | | 1.75 | % | | 1.98 | % | | 0.05 | % |
| | | | | |
| 4.14 | % | | | 155,490 | | 33 | % | | 2.25 | % | | 2.90 | % | | (0.65 | %) |
| 1.15 | % | | | 217,028 | | 16 | % | | 2.25 | % | | 2.67 | % | | (1.39 | %) |
| 11.94 | % | | | 283,005 | | 107 | % | | 2.25 | % | | 2.76 | % | | (1.48 | %) |
| (21.94 | %) | | | 309,908 | | 76 | % | | 2.25 | % | | 2.67 | % | | (1.21 | %) |
| (45.68 | %) | | | 556,811 | | 54 | % | | 2.25 | % | | 2.47 | % | | (0.45 | %) |
| 4.13 | % | | | 28,863 | | 33 | % | | 2.25 | % | | 2.90 | % | | (0.67 | %) |
| 1.15 | %(1) | | | 37,951 | | 16 | % | | 2.25 | % | | 2.67 | % | | (1.39 | %) |
| 11.93 | %(1) | | | 47,264 | | 107 | % | | 2.25 | % | | 2.76 | % | | (1.48 | %) |
| (21.92 | %)(1) | | | 49,108 | | 76 | % | | 2.25 | % | | 2.67 | % | | (1.11 | %) |
| (45.71 | %)(1) | | | 82,210 | | 54 | % | | 2.25 | % | | 2.47 | % | | (0.45 | %) |
| | | | | |
| 9.09 | % | | $ | 3,607 | | 27 | % | | 1.45 | % | | 1.90 | % | | 0.91 | % |
| 0.66 | % | | | 1,722 | | 35 | % | | 1.45 | % | | 1.93 | % | | 0.93 | % |
| | | | | |
| 8.28 | % | | | 983 | | 27 | % | | 2.20 | % | | 2.65 | % | | 0.11 | % |
| 0.25 | % | | | 235 | | 35 | % | | 2.20 | % | | 2.68 | % | | 0.15 | % |
| 8.25 | % | | | 10,508 | | 27 | % | | 2.20 | % | | 2.65 | % | | 0.20 | % |
| 11.64 | % | | | 11,311 | | 35 | % | | 2.20 | % | | 2.68 | % | | 0.15 | % |
| 23.64 | % | | | 14,337 | | 21 | % | | 2.20 | % | | 2.72 | % | | 0.41 | % |
| (8.49 | %) | | | 7,212 | | 14 | % | | 2.20 | % | | 3.25 | % | | 0.30 | % |
| (2.70 | %) | | | 3,040 | | 9 | % | | 2.20 | % | | 4.73 | % | | 0.22 | % |
| | | | | |
| 8.74 | % | | | 7,130 | | 27 | % | | 1.70 | % | | 2.15 | % | | 0.71 | % |
| 12.24 | % | | | 8,595 | | 35 | % | | 1.70 | % | | 2.18 | % | | 0.63 | % |
| 24.15 | % | | | 8,450 | | 21 | % | | 1.70 | % | | 2.21 | % | | 0.91 | % |
| (8.16 | %) | | | 4,537 | | 14 | % | | 1.70 | % | | 2.76 | % | | 0.75 | % |
| (2.20 | %) | | | 1,677 | | 9 | % | | 1.70 | % | | 3.95 | % | | 0.70 | % |
| | | | | |
| 8.31 | % | | | 20,402 | | 27 | % | | 2.20 | % | | 2.65 | % | | 0.20 | % |
| 11.64 | % | | | 20,874 | | 35 | % | | 2.20 | % | | 2.68 | % | | 0.13 | % |
| 23.64 | % | | | 15,304 | | 21 | % | | 2.20 | % | | 2.72 | % | | 0.42 | % |
| (8.58 | %) | | | 9,378 | | 14 | % | | 2.20 | % | | 3.26 | % | | 0.29 | % |
| (2.60 | %) | | | 3,867 | | 9 | % | | 2.20 | % | | 5.57 | % | | 0.22 | % |
| | | | | |
| 8.33 | % | | | 4,140 | | 27 | % | | 2.20 | % | | 2.65 | % | | 0.19 | % |
| 11.64 | %(1) | | | 4,098 | | 35 | % | | 2.20 | % | | 2.68 | % | | 0.14 | % |
| 23.64 | %(1) | | | 2,829 | | 21 | % | | 2.20 | % | | 2.72 | % | | 0.43 | % |
| (8.49 | %)(1) | | | 2,217 | | 14 | % | | 2.20 | % | | 3.28 | % | | 0.30 | % |
| | | | | |
| (2.70 | %)(1) | | | 514 | | 9 | % | | 2.20 | % | | 4.75 | % | | 0.23 | % |
See Notes to Financial Statements.
152
Financial Highlights
Per Share Data
(for a Share Outstanding Throughout Each Period)
| | | | | | | | | | | | | | | | | | | | | | | | | | | | | | | | | |
| | | | | | | | Increase (Decrease) from Investment Operations
| | | Less Distributions
| | | | | | |
| | | Period Ended
| | | Net Asset Value Beginning of Period
| | Net Investment Income (Loss)
| | | Net Realized & Unrealized Gain (Loss)
| | | Total from Investment Operations
| | | From Net Investment Income
| | | From Net Realized Gains
| | | Total Distributions
| | | Net Asset Value End of Period
|
STRATEGIC PARTNERS LARGE CAP CORE FUND: | | | | | | | | | | | | | | | | | | | | | | | | | | | | | | | | | |
| | | | | | | | | |
Class A | | 10/31/05 | (12) | | $ | 8.89 | | $ | 0.06 | | | $ | 0.58 | | | $ | 0.64 | | | $ | — | | | $ | — | | | $ | — | | | $ | 9.53 |
| | | 10/31/04 | (10)(12) | | | 9.06 | | | 0.03 | | | | (0.20 | ) | | | (0.17 | ) | | | — | † | | | — | | | | — | † | | | 8.89 |
| | | | | | | | | |
Class B | | 10/31/05 | (12) | | | 8.67 | | | — | † | | | 0.56 | | | | 0.56 | | | | — | | | | — | | | | — | | | | 9.23 |
| | | 10/31/04 | (10)(12) | | | 8.87 | | | (0.01 | ) | | | (0.19 | ) | | | (0.20 | ) | | | — | | | | — | | | | — | | | | 8.67 |
| | | | | | | | | |
Class C | | 10/31/05 | (12) | | | 8.66 | | | 0.01 | | | | 0.54 | | | | 0.55 | | | | — | | | | — | | | | — | | | | 9.21 |
| | | 10/31/04 | (12) | | | 8.16 | | | (0.03 | ) | | | 0.53 | | | | 0.50 | | | | — | | | | — | | | | — | | | | 8.66 |
| | | 10/31/03 | (12) | | | 6.85 | | | (0.01 | ) | | | 1.32 | | | | 1.31 | | | | — | | | | — | | | | — | | | | 8.16 |
| | | 10/31/02 | (12) | | | 8.08 | | | (0.02 | ) | | | (1.21 | ) | | | (1.23 | ) | | | — | | | | — | | | | — | | | | 6.85 |
| | | 10/31/01 | (12) | | | 10.20 | | | (0.02 | ) | | | (2.09 | ) | | | (2.11 | ) | | | — | | | | (0.01 | ) | | | (0.01 | ) | | | 8.08 |
| | | | | | | | | |
Class L (11) | | 10/31/05 | (12) | | | 8.87 | | | 0.07 | | | | 0.54 | | | | 0.61 | | | | — | † | | | — | | | | — | † | | | 9.48 |
| | | 10/31/04 | (12) | | | 8.32 | | | 0.02 | | | | 0.53 | | | | 0.55 | | | | — | † | | | — | | | | — | † | | | 8.87 |
| | | 10/31/03 | (12) | | | 6.95 | | | 0.03 | | | | 1.34 | | | | 1.37 | | | | — | | | | — | | | | — | | | | 8.32 |
| | | 10/31/02 | (12) | | | 8.15 | | | 0.02 | | | | (1.22 | ) | | | (1.20 | ) | | | — | | | | — | | | | — | | | | 6.95 |
| | | 10/31/01 | (12) | | | 10.24 | | | 0.02 | | | | (2.10 | ) | | | (2.08 | ) | | | — | † | | | (0.01 | ) | | | (0.01 | ) | | | 8.15 |
| | | | | | | | | |
Class M (11) | | 10/31/05 | (12) | | | 8.66 | | | 0.01 | | | | 0.54 | | | | 0.55 | | | | — | | | | — | | | | — | | | | 9.21 |
| | | 10/31/04 | (12) | | | 8.16 | | | (0.03 | ) | | | 0.53 | | | | 0.50 | | | | — | | | | — | | | | — | | | | 8.66 |
| | | 10/31/03 | (12) | | | 6.85 | | | (0.01 | ) | | | 1.32 | | | | 1.31 | | | | — | | | | — | | | | — | | | | 8.16 |
| | | 10/31/02 | (12) | | | 8.08 | | | (0.02 | ) | | | (1.21 | ) | | | (1.23 | ) | | | — | | | | — | | | | — | | | | 6.85 |
| | | 10/31/01 | (12) | | | 10.20 | | | (0.02 | ) | | | (2.09 | ) | | | (2.11 | ) | | | — | | | | (0.01 | ) | | | (0.01 | ) | | | 8.08 |
| | | | | | | | | |
Class X | | 10/31/05 | (12) | | | 8.65 | | | 0.01 | | | | 0.54 | | | | 0.55 | | | | — | | | | — | | | | — | | | | 9.20 |
| | | 10/31/04 | (12) | | | 8.15 | | | (0.03 | ) | | | 0.53 | | | | 0.50 | | | | — | | | | — | | | | — | | | | 8.65 |
| | | 10/31/03 | (12) | | | 6.84 | | | (0.01 | ) | | | 1.32 | | | | 1.31 | | | | — | | | | — | | | | — | | | | 8.15 |
| | | 10/31/02 | (12) | | | 8.06 | | | (0.02 | ) | | | (1.20 | ) | | | (1.22 | ) | | | — | | | | — | | | | — | | | | 6.84 |
| | | 10/31/01 | (12) | | | 10.20 | | | (0.02 | ) | | | (2.11 | ) | | | (2.13 | ) | | | — | | | | (0.01 | ) | | | (0.01 | ) | | | 8.06 |
STRATEGIC PARTNERS EQUITY INCOME FUND: | | | | | | | | | | | | | | | | | | | | | | | | | | | | | | | | | |
| | | | | | | | | |
Class A | | 10/31/05 | | | $ | 12.99 | | $ | 0.13 | | | $ | 1.00 | | | $ | 1.13 | | | $ | (0.13 | ) | | $ | — | | | $ | (0.13 | ) | | $ | 13.99 |
| | | 10/31/04 | (10)(12) | | | 13.28 | | | 0.04 | | | | (0.33 | ) | | | (0.29 | ) | | | — | | | | — | | | | — | | | | 12.99 |
| | | | | | | | | |
Class B | | 10/31/05 | | | | 12.63 | | | — | † | | | 0.98 | | | | 0.98 | | | | (0.01 | ) | | | — | | | | (0.01 | ) | | | 13.60 |
| | | 10/31/04 | (10)(12) | | | 12.98 | | | (0.01 | ) | | | (0.34 | ) | | | (0.35 | ) | | | — | | | | — | | | | — | | | | 12.63 |
| | | | | | | | | |
Class C | | 10/31/05 | | | | 12.61 | | | 0.02 | | | | 0.96 | | | | 0.97 | | | | (0.01 | ) | | | — | | | | (0.01 | ) | | | 13.57 |
| | | 10/31/04 | (12) | | | 11.57 | | | (0.03 | ) | | | 1.07 | | | | 1.04 | | | | — | | | | — | | | | — | | | | 12.61 |
| | | 10/31/03 | (12) | | | 9.40 | | | (0.02 | ) | | | 2.19 | | | | 2.17 | | | | — | | | | — | | | | — | | | | 11.57 |
| | | 10/31/02 | (12) | | | 12.09 | | | (0.03 | ) | | | (2.36 | ) | | | (2.39 | ) | | | — | | | | (0.30 | ) | | | (0.30 | ) | | | 9.40 |
| | | 10/31/01 | (12) | | | 13.67 | | | (0.07 | ) | | | (0.92 | ) | | | (0.99 | ) | | | — | | | | (0.59 | ) | | | (0.59 | ) | | | 12.09 |
| | | | | | | | | |
Class L (11) | | 10/31/05 | | | | 12.96 | | | 0.08 | | | | 0.98 | | | | 1.06 | | | | (0.09 | ) | | | — | | | | (0.09 | ) | | | 13.93 |
| | | 10/31/04 | (12) | | | 11.83 | | | 0.03 | | | | 1.10 | | | | 1.13 | | | | — | | | | — | | | | — | | | | 12.96 |
| | | 10/31/03 | (12) | | | 9.56 | | | 0.03 | | | | 2.24 | | | | 2.27 | | | | — | | | | — | | | | — | | | | 11.83 |
| | | 10/31/02 | (12) | | | 12.23 | | | 0.03 | | | | (2.40 | ) | | | (2.37 | ) | | | — | | | | (0.30 | ) | | | (0.30 | ) | | | 9.56 |
| | | 10/31/01 | (12) | | | 13.76 | | | — | | | | (0.94 | ) | | | (0.94 | ) | | | — | | | | (0.59 | ) | | | (0.59 | ) | | | 12.23 |
| | | | | | | | | |
Class M (11) | | 10/31/05 | | | | 12.63 | | | 0.01 | | | | 0.97 | | | | 0.98 | | | | (0.01 | ) | | | — | | | | (0.01 | ) | | | 13.60 |
| | | 10/31/04 | (12) | | | 11.58 | | | (0.03 | ) | | | 1.08 | | | | 1.05 | | | | — | | | | — | | | | — | | | | 12.63 |
| | | 10/31/03 | (12) | | | 9.41 | | | (0.02 | ) | | | 2.19 | | | | 2.17 | | | | — | | | | — | | | | — | | | | 11.58 |
| | | 10/31/02 | (12) | | | 12.10 | | | (0.03 | ) | | | (2.36 | ) | | | (2.39 | ) | | | — | | | | (0.30 | ) | | | (0.30 | ) | | | 9.41 |
| | | 10/31/01 | (12) | | | 13.69 | | | (0.07 | ) | | | (0.93 | ) | | | (1.00 | ) | | | — | | | | (0.59 | ) | | | (0.59 | ) | | | 12.10 |
| | | | | | | | | |
Class X | | 10/31/05 | | | | 12.61 | | | 0.01 | | | | 0.96 | | | | 0.97 | | | | (0.01 | ) | | | — | | | | (0.01 | ) | | | 13.57 |
| | | 10/31/04 | (12) | | | 11.56 | | | (0.03 | ) | | | 1.08 | | | | 1.05 | | | | — | | | | — | | | | — | | | | 12.61 |
| | | 10/31/03 | (12) | | | 9.39 | | | (0.02 | ) | | | 2.19 | | | | 2.17 | | | | — | | | | — | | | | — | | | | 11.56 |
| | | 10/31/02 | (12) | | | 12.08 | | | (0.03 | ) | | | (2.36 | ) | | | (2.39 | ) | | | — | | | | (0.30 | ) | | | (0.30 | ) | | | 9.39 |
| | | 10/31/01 | (12) | | | 13.66 | | | (0.06 | ) | | | (0.93 | ) | | | (0.99 | ) | | | — | | | | (0.59 | ) | | | (0.59 | ) | | | 12.08 |
153
| | | | | | | | | | |
Supplemental Data
| | Ratios of Expenses to Average Net Assets(2)
| | |
Total Return
| | Net Assets at End of Period (in 000’s)
| | Portfolio Turnover Rate
| | Net Operating Expenses (after Expense Reimbursement and Waiver)(3)
| | Net Operating Expenses (before Expense Reimbursement and Waiver)(3)
| | Ratio of Net Investment Income (Loss) to Average Net Assets(2)
|
| 7.20% | | $12,527 | | 36% | | 1.25% | | 1.80% | | 0.81% |
| (1.86%) | | 7,558 | | 29% | | 1.25% | | 1.56% | | 0.60% |
| | | | | |
| 6.46% | | 3,144 | | 36% | | 2.00% | | 2.55% | | (0.03%) |
| (2.25%) | | 1,288 | | 29% | | 2.00% | | 2.31% | | (0.13%) |
| | | | | |
| 6.35% | | 26,905 | | 36% | | 2.00% | | 2.55% | | 0.15% |
| 6.13% | | 29,631 | | 29% | | 2.00% | | 2.31% | | (0.30%) |
| 19.12% | | 36,069 | | 39% | | 2.00% | | 2.35% | | (0.09%) |
| (15.22%) | | 31,253 | | 19% | | 2.00% | | 2.33% | | (0.20%) |
| (20.74%) | | 30,585 | | 30% | | 2.00% | | 2.35% | | (0.26%) |
| | | | | |
| 6.88% | | 20,528 | | 36% | | 1.50% | | 2.05% | | 0.68% |
| 6.63% | | 24,137 | | 29% | | 1.50% | | 1.81% | | 0.19% |
| 19.71% | | 31,579 | | 39% | | 1.50% | | 1.84% | | 0.40% |
| (14.72%) | | 26,122 | | 19% | | 1.50% | | 1.83% | | (0.30%) |
| (20.36%) | | 24,163 | | 30% | | 1.50% | | 1.86% | | 0.24% |
| | | | | |
| 6.35% | | 74,649 | | 36% | | 2.00% | | 2.55% | | 0.14% |
| 6.13% | | 79,069 | | 29% | | 2.00% | | 2.31% | | (0.30%) |
| 19.12% | | 77,502 | | 39% | | 2.00% | | 2.34% | | (0.10%) |
| (15.22%) | | 64,146 | | 19% | | 2.00% | | 2.33% | | (0.20%) |
| (20.74%) | | 53,206 | | 30% | | 2.00% | | 2.36% | | (0.27%) |
| | | | | |
| 6.36% | | 8,721 | | 36% | | 2.00% | | 2.55% | | 0.11% |
| 6.14%(1) | | 7,253 | | 29% | | 2.00% | | 2.31% | | (0.30%) |
| 19.15%(1) | | 7,459 | | 39% | | 2.00% | | 2.35% | | (0.09%) |
| (15.14%)(1) | | 6,964 | | 19% | | 2.00% | | 2.33% | | (0.21%) |
| (20.94%)(1) | | 5,918 | | 30% | | 2.00% | | 2.36% | | (0.26%) |
| | | | | |
| 8.72% | | $14,835 | | 66% | | 1.41% | | 1.84% | | 0.78% |
| (2.18%) | | 9,032 | | 54% | | 1.40% | | 1.78% | | 0.59% |
| | | | | |
| 7.77% | | 3,063 | | 66% | | 2.16% | | 2.59% | | (0.04%) |
| (2.70%) | | 1,061 | | 54% | | 2.15% | | 2.53% | | (0.21%) |
| | | | | |
| 7.70% | | 54,187 | | 66% | | 2.16% | | 2.59% | | 0.14% |
| 8.99% | | 42,450 | | 54% | | 2.15% | | 2.53% | | (0.28%) |
| 23.09% | | 53,779 | | 60% | | 2.15% | | 2.59% | | (0.17%) |
| (20.39%) | | 50,779 | | 88% | | 2.15% | | 2.54% | | (0.25%) |
| (7.59%) | | 64,103 | | 128% | | 2.15% | | 2.44% | | (0.51%) |
| | | | | |
| 8.19% | | 46,285 | | 66% | | 1.66% | | 2.09% | | 0.67% |
| 9.55% | | 41,796 | | 54% | | 1.65% | | 2.03% | | 0.21% |
| 23.74% | | 55,064 | | 60% | | 1.65% | | 2.09% | | 0.32% |
| (19.99%) | | 47,611 | | 88% | | 1.65% | | 2.04% | | 0.25% |
| (7.16%) | | 66,446 | | 128% | | 1.65% | | 1.94% | | (0.01%) |
| | | | | |
| 7.77% | | 143,414 | | 66% | | 2.16% | | 2.59% | | 0.13% |
| 9.07% | | 110,231 | | 54% | | 2.15% | | 2.53% | | (0.28%) |
| 23.06% | | 116,211 | | 60% | | 2.15% | | 2.59% | | (0.17%) |
| (20.37%) | | 106,401 | | 88% | | 2.15% | | 2.54% | | (0.25%) |
| (7.65%) | | 152,314 | | 128% | | 2.15% | | 2.44% | | (0.51%) |
| | | | | |
| 7.70% | | 41,019 | | 66% | | 2.16% | | 2.59% | | 0.13% |
| 9.08%(1) | | 28,451 | | 54% | | 2.15% | | 2.53% | | (0.28%) |
| 23.11%(1) | | 28,840 | | 60% | | 2.15% | | 2.59% | | (0.17%) |
| (20.41%)(1) | | 25,972 | | 88% | | 2.15% | | 2.54% | | (0.24%) |
| (7.60%)(1) | | 36,297 | | 128% | | 2.15% | | 2.44% | | (0.51%) |
See Notes to Financial Statements.
154
Financial Highlights
Per Share Data
(for a Share Outstanding Throughout Each Period)
| | | | | | | | | | | | | | | | | | | | | | | | | | | | | | | | |
| | | | | | | | Increase (Decrease) from Investment
Operations
| | | Less Distributions
| | | | | |
| | | Period
Ended
| | | Net Asset
Value
Beginning
of Period
| | Net
Investment
Income
(Loss)
| | | Net
Realized &
Unrealized
Gain
(Loss)
| | | Total from
Investment
Operations
| | | From Net
Investment
Income
| | | From Net
Realized
Gains
| | Total
Distributions
| | | Net Asset
Value End
of Period
|
STRATEGIC PARTNERS BALANCED FUND: | | | | | | | | | | | | | | | | | | | | | | | | | | | | | | | | |
| | | | | | | | | |
Class A | | 10/31/05 | | | $ | 12.60 | | $ | 0.19 | | | $ | 0.61 | | | $ | 0.80 | | | $ | (0.19 | ) | | $ | — | | $ | (0.19 | ) | | $ | 13.21 |
| | | 10/31/04 | (10) | | | 12.58 | | | 0.08 | | | | — | | | | 0.08 | | | | (0.06 | ) | | | — | | | (0.06 | ) | | | 12.60 |
| | | | | | | | | |
Class B | | 10/31/05 | | | | 12.57 | | | 0.08 | | | | 0.60 | | | | 0.68 | | | | (0.08 | ) | | | — | | | (0.08 | ) | | | 13.17 |
| | | 10/31/04 | (10) | | | 12.54 | | | 0.03 | | | | 0.03 | | | | 0.06 | | | | (0.03 | ) | | | — | | | (0.03 | ) | | | 12.57 |
| | | | | | | | | |
Class C | | 10/31/05 | | | | 12.56 | | | 0.08 | | | | 0.60 | | | | 0.68 | | | | (0.08 | ) | | | — | | | (0.08 | ) | | | 13.16 |
| | | 10/31/04 | | | | 11.83 | | | 0.06 | | | | 0.74 | | | | 0.80 | | | | (0.07 | ) | | | — | | | (0.07 | ) | | | 12.56 |
| | | 10/31/03 | (12) | | | 10.47 | | | 0.08 | | | | 1.39 | | | | 1.47 | | | | (0.11 | ) | | | — | | | (0.11 | ) | | | 11.83 |
| | | 10/31/02 | (12) | | | 11.50 | | | 0.14 | (a) | | | (1.03 | )(a) | | | (0.89 | ) | | | (0.14 | ) | | | — | | | (0.14 | ) | | | 10.47 |
| | | 10/31/01 | (12) | | | 13.10 | | | 0.15 | | | | (1.64 | ) | | | (1.49 | ) | | | (0.11 | ) | | | — | | | (0.11 | ) | | | 11.50 |
| | | | | | | | | |
Class L (11) | | 10/31/05 | | | | 12.60 | | | 0.14 | | | | 0.61 | | | | 0.75 | | | | (0.16 | ) | | | — | | | (0.16 | ) | | | 13.19 |
| | | 10/31/04 | | | | 11.87 | | | 0.11 | | | | 0.75 | | | | 0.86 | | | | (0.13 | ) | | | — | | | (0.13 | ) | | | 12.60 |
| | | 10/31/03 | (12) | | | 10.50 | | | 0.13 | | | | 1.41 | | | | 1.54 | | | | (0.17 | ) | | | — | | | (0.17 | ) | | | 11.87 |
| | | 10/31/02 | (12) | | | 11.54 | | | 0.19 | (a) | | | (1.04 | )(a) | | | (0.85 | ) | | | (0.19 | ) | | | — | | | (0.19 | ) | | | 10.50 |
| | | 10/31/01 | (12) | | | 13.14 | | | 0.21 | | | | (1.64 | ) | | | (1.43 | ) | | | (0.17 | ) | | | — | | | (0.17 | ) | | | 11.54 |
| | | | | | | | | |
Class M (11) | | 10/31/05 | | | | 12.56 | | | 0.08 | | | | 0.61 | | | | 0.69 | | | | (0.08 | ) | | | — | | | (0.08 | ) | | | 13.17 |
| | | 10/31/04 | | | | 11.84 | | | 0.06 | | | | 0.73 | | | | 0.79 | | | | (0.07 | ) | | | — | | | (0.07 | ) | | | 12.56 |
| | | 10/31/03 | (12) | | | 10.47 | | | 0.08 | | | | 1.40 | | | | 1.48 | | | | (0.11 | ) | | | — | | | (0.11 | ) | | | 11.84 |
| | | 10/31/02 | (12) | | | 11.50 | | | 0.14 | (a) | | | (1.03 | )(a) | | | (0.89 | ) | | | (0.14 | ) | | | — | | | (0.14 | ) | | | 10.47 |
| | | 10/31/01 | (12) | | | 13.10 | | | 0.15 | | | | (1.64 | ) | | | (1.49 | ) | | | (0.11 | ) | | | — | | | (0.11 | ) | | | 11.50 |
| | | | | | | | | |
Class X | | 10/31/05 | | | | 12.55 | | | 0.08 | | | | 0.61 | | | | 0.69 | | | | (0.08 | ) | | | — | | | (0.08 | ) | | | 13.16 |
| | | 10/31/04 | | | | 11.83 | | | 0.06 | | | | 0.73 | | | | 0.79 | | | | (0.07 | ) | | | — | | | (0.07 | ) | | | 12.55 |
| | | 10/31/03 | (12) | | | 10.47 | | | 0.08 | | | | 1.39 | | | | 1.47 | | | | (0.11 | ) | | | — | | | (0.11 | ) | | | 11.83 |
| | | 10/31/02 | (12) | | | 11.50 | | | 0.14 | (a) | | | (1.03 | )(a) | | | (0.89 | ) | | | (0.14 | ) | | | — | | | (0.14 | ) | | | 10.47 |
| | | 10/31/01 | (12) | | | 13.09 | | | 0.15 | | | | (1.63 | ) | | | (1.48 | ) | | | (0.11 | ) | | | — | | | (0.11 | ) | | | 11.50 |
STRATEGIC PARTNERS HIGH YIELD BOND FUND: | | | | | | | | | | | | | | | | | | | | | | | | | | | | | | | | |
| | | | | | | | | |
Class A | | 10/31/05 | | | $ | 7.52 | | $ | 0.54 | | | $ | (0.43 | ) | | $ | 0.11 | | | $ | (0.55 | ) | | $ | — | | $ | (0.55 | ) | | $ | 7.08 |
| | | 10/31/04 | (10) | | | 7.37 | | | 0.29 | | | | 0.16 | | | | 0.45 | | | | (0.30 | ) | | | — | | | (0.30 | ) | | | 7.52 |
| | | | | | | | | |
Class B | | 10/31/05 | | | | 7.51 | | | 0.49 | | | | (0.42 | ) | | | 0.07 | | | | (0.50 | ) | | | — | | | (0.50 | ) | | | 7.08 |
| | | 10/31/04 | (10) | | | 7.36 | | | 0.26 | | | | 0.16 | | | | 0.42 | | | | (0.27 | ) | | | — | | | (0.27 | ) | | | 7.51 |
| | | | | | | | | |
Class C | | 10/31/05 | | | | 7.51 | | | 0.49 | | | | (0.42 | ) | | | 0.07 | | | | (0.50 | ) | | | — | | | (0.50 | ) | | | 7.08 |
| | | 10/31/04 | | | | 7.23 | | | 0.46 | | | | 0.31 | | | | 0.77 | | | | (0.49 | ) | | | — | | | (0.49 | ) | | | 7.51 |
| | | 10/31/03 | (12) | | | 6.26 | | | 0.50 | | | | 0.98 | | | | 1.48 | | | | (0.51 | ) | | | — | | | (0.51 | ) | | | 7.23 |
| | | 10/31/02 | (12) | | | 6.96 | | | 0.55 | (b) | | | (0.68 | )(b) | | | (0.13 | ) | | | (0.57 | ) | | | — | | | (0.57 | ) | | | 6.26 |
| | | 10/31/01 | (12) | | | 8.02 | | | 0.71 | | | | (1.06 | ) | | | (0.35 | ) | | | (0.71 | ) | | | — | | | (0.71 | ) | | | 6.96 |
| | | | | | | | | |
Class L (11) | | 10/31/05 | | | | 7.51 | | | 0.53 | | | | (0.42 | ) | | | 0.11 | | | | (0.54 | ) | | | — | | | (0.54 | ) | | | 7.08 |
| | | 10/31/04 | | | | 7.23 | | | 0.49 | | | | 0.31 | | | | 0.80 | | | | (0.52 | ) | | | — | | | (0.52 | ) | | | 7.51 |
| | | 10/31/03 | (12) | | | 6.26 | | | 0.53 | | | | 0.98 | | | | 1.51 | | | | (0.54 | ) | | | — | | | (0.54 | ) | | | 7.23 |
| | | 10/31/02 | (12) | | | 6.96 | | | 0.59 | (b) | | | (0.69 | )(b) | | | (0.10 | ) | | | (0.60 | ) | | | — | | | (0.60 | ) | | | 6.26 |
| | | 10/31/01 | (12) | | | 8.02 | | | 0.75 | | | | (1.06 | ) | | | (0.31 | ) | | | (0.75 | ) | | | — | | | (0.75 | ) | | | 6.96 |
| | | | | | | | | |
Class M (11) | | 10/31/05 | | | | 7.50 | | | 0.49 | | | | (0.42 | ) | | | 0.07 | | | | (0.50 | ) | | | — | | | (0.50 | ) | | | 7.07 |
| | | 10/31/04 | | | | 7.22 | | | 0.46 | | | | 0.31 | | | | 0.77 | | | | (0.49 | ) | | | — | | | (0.49 | ) | | | 7.50 |
| | | 10/31/03 | (12) | | | 6.25 | | | 0.49 | | | | 0.98 | | | | 1.48 | | | | (0.51 | ) | | | — | | | (0.51 | ) | | | 7.22 |
| | | 10/31/02 | (12) | | | 6.96 | | | 0.55 | (b) | | | (0.69 | )(b) | | | (0.14 | ) | | | (0.57 | ) | | | — | | | (0.57 | ) | | | 6.25 |
| | | 10/31/01 | (12) | | | 8.02 | | | 0.71 | | | | (1.06 | ) | | | (0.35 | ) | | | (0.71 | ) | | | — | | | (0.71 | ) | | | 6.96 |
| | | | | | | | | |
Class X | | 10/31/05 | | | | 7.50 | | | 0.49 | | | | (0.42 | ) | | | 0.07 | | | | (0.50 | ) | | | — | | | (0.50 | ) | | | 7.07 |
| | | 10/31/04 | | | | 7.22 | | | 0.46 | | | | 0.31 | | | | 0.77 | | | | (0.49 | ) | | | — | | | (0.49 | ) | | | 7.50 |
| | | 10/31/03 | (12) | | | 6.25 | | | 0.49 | | | | 0.98 | | | | 1.48 | | | | (0.51 | ) | | | — | | | (0.51 | ) | | | 7.22 |
| | | 10/31/02 | (12) | | | 6.95 | | | 0.55 | (b) | | | (0.68 | )(b) | | | (0.13 | ) | | | (0.57 | ) | | | — | | | (0.57 | ) | | | 6.25 |
| | | 10/31/01 | (12) | | | 8.01 | | | 0.71 | | | | (1.06 | ) | | | (0.35 | ) | | | (0.71 | ) | | | — | | | (0.71 | ) | | | 6.95 |
155
| | | | | | | | | | | | | | | |
Supplemental Data
| | | Ratios of Expenses to Average Net Assets(2)
| | | | |
Total Return
| | Net Assets at
End of Period
(in 000’s)
| | Portfolio
Turnover
Rate
| | | Net Operating Expenses
(after Expense
Reimbursement
and Waiver)(3)
| | | Net Operating Expenses
(before Expense
Reimbursement
and Waiver)(3)
| | | Ratio of Net Investment
Income (Loss) to
Average Net Assets(2)
| |
| | | | | |
6.32% | | $ | 9,099 | | 196 | % | | 1.40 | % | | 1.77 | % | | 1.31 | % |
0.68% | | | 4,451 | | 216 | % | | 1.40 | % | | 1.71 | % | | 1.24 | % |
| | | | | |
5.53% | | | 2,145 | | 196 | % | | 2.15 | % | | 2.52 | % | | 0.54 | % |
0.39% | | | 862 | | 216 | % | | 2.15 | % | | 2.46 | % | | 0.49 | % |
| | | | | |
5.45% | | | 13,850 | | 196 | % | | 2.15 | % | | 2.55 | % | | 0.61 | % |
6.80% | | | 18,375 | | 216 | % | | 2.15 | % | | 2.46 | % | | 0.44 | % |
14.16% | | | 23,359 | | 129 | % | | 2.15 | % | | 2.51 | % | | 0.75 | % |
(7.87%) | | | 22,188 | | 119 | % | | 2.15 | % | | 2.45 | % | | 1.21 | %(a) |
(11.44%) | | | 32,294 | | 122 | % | | 2.15 | % | | 2.41 | % | | 1.22 | % |
| | | | | |
5.95% | | | 15,293 | | 196 | % | | 1.65 | % | | 2.05 | % | | 1.12 | % |
7.30% | | | 22,716 | | 216 | % | | 1.65 | % | | 1.96 | % | | 0.93 | % |
14.79% | | | 31,493 | | 129 | % | | 1.65 | % | | 2.01 | % | | 1.25 | % |
(7.46%) | | | 29,785 | | 119 | % | | 1.65 | % | | 1.96 | % | | 1.71 | %(a) |
(10.96%) | | | 37,523 | | 122 | % | | 1.65 | % | | 1.91 | % | | 1.71 | % |
| | | | | |
5.53% | | | 55,084 | | 196 | % | | 2.15 | % | | 2.55 | % | | 0.61 | % |
6.71% | | | 68,387 | | 216 | % | | 2.15 | % | | 2.46 | % | | 0.44 | % |
14.25% | | | 69,656 | | 129 | % | | 2.15 | % | | 2.51 | % | | 0.75 | % |
(7.87%) | | | 67,109 | | 119 | % | | 2.15 | % | | 2.46 | % | | 1.21 | %(a) |
(11.44%) | | | 86,075 | | 122 | % | | 2.15 | % | | 2.41 | % | | 1.22 | % |
| | | | | |
5.53% | | | 12,882 | | 196 | % | | 2.15 | % | | 2.55 | % | | 0.60 | % |
6.71%(1) | | | 15,859 | | 216 | % | | 2.15 | % | | 2.46 | % | | 0.44 | % |
14.26%(1) | | | 16,254 | | 129 | % | | 2.15 | % | | 2.51 | % | | 0.75 | % |
(7.96%)(1) | | | 16,048 | | 119 | % | | 2.15 | % | | 2.46 | % | | 1.21 | %(a) |
(11.38%)(1) | | | 21,106 | | 122 | % | | 2.15 | % | | 2.41 | % | | 1.22 | % |
| | | | | |
1.48% | | $ | 6,639 | | 22 | % | | 1.25 | % | | 1.56 | % | | 7.30 | % |
6.47% | | | 7,587 | | 49 | % | | 1.25 | % | | 1.46 | % | | 7.05 | % |
0.86% | | | 1,701 | | 22 | % | | 2.00 | % | | 2.31 | % | | 6.59 | % |
6.04% | | | 502 | | 49 | % | | 2.00 | % | | 2.21 | % | | 6.30 | % |
| | | | | |
0.72% | | | 14,196 | | 22 | % | | 2.00 | % | | 2.31 | % | | 6.57 | % |
10.96% | | | 26,291 | | 49 | % | | 2.00 | % | | 2.21 | % | | 6.37 | % |
24.34% | | | 37,091 | | 48 | % | | 2.00 | % | | 2.18 | % | | 7.19 | % |
(2.24%) | | | 22,882 | | 35 | % | | 2.00 | % | | 2.23 | % | | 8.08 | %(b) |
(4.58%) | | | 16,599 | | 31 | % | | 2.00 | % | | 2.33 | % | | 9.33 | % |
| | | | | |
1.37% | | | 12,139 | | 22 | % | | 1.50 | % | | 1.81 | % | | 7.07 | % |
11.50% | | | 23,262 | | 49 | % | | 1.50 | % | | 1.71 | % | | 6.86 | % |
24.96% | | | 36,377 | | 48 | % | | 1.50 | % | | 1.68 | % | | 7.63 | % |
(1.75%) | | | 23,613 | | 35 | % | | 1.50 | % | | 1.74 | % | | 8.58 | %(b) |
(4.10%) | | | 26,426 | | 31 | % | | 1.50 | % | | 1.82 | % | | 9.77 | % |
| | | | | |
0.85% | | | 67,863 | | 22 | % | | 2.00 | % | | 2.31 | % | | 6.59 | % |
10.96% | | | 105,842 | | 49 | % | | 2.00 | % | | 2.21 | % | | 6.38 | % |
24.37% | | | 127,974 | | 48 | % | | 2.00 | % | | 2.18 | % | | 7.19 | % |
(2.39%) | | | 83,293 | | 35 | % | | 2.00 | % | | 2.23 | % | | 8.10 | %(b) |
(4.58%) | | | 80,038 | | 31 | % | | 2.00 | % | | 2.33 | % | | 9.40 | % |
| | | | | |
0.85% | | | 10,705 | | 22 | % | | 2.00 | % | | 2.31 | % | | 6.58 | % |
11.11%(1) | | | 14,682 | | 49 | % | | 2.00 | % | | 2.21 | % | | 6.37 | % |
24.20%(1) | | | 15,306 | | 48 | % | | 2.00 | % | | 2.18 | % | | 7.24 | % |
(2.25%)(1) | | | 12,882 | | 35 | % | | 2.00 | % | | 2.24 | % | | 8.12 | %(b) |
(4.59%)(1) | | | 14,777 | | 31 | % | | 2.00 | % | | 2.34 | % | | 9.46 | % |
See Notes to Financial Statements.
156
Financial Highlights
Per Share Data
(for a Share Outstanding Throughout Each Period)
| | | | | | | | | | | | | | | | | | | | | | | | | | | | | | | | | |
| | | | | | | | Increase (Decrease) from Investment
Operations
| | | Less Distributions
| | | | | | |
| | | Period
Ended
| | | Net Asset
Value
Beginning
of Period
| | Net
Investment
Income
(Loss)
| | | Net
Realized &
Unrealized
Gain (Loss)
| | | Total from
Investment
Operations
| | | From Net
Investment
Income
| | | From Net
Realized
Gains
| | | Total
Distributions
| | | Net Asset
Value End
of Period
|
STRATEGIC PARTNERS MONEY MARKET FUND(9): | | | | | | | | | | | | | | | | | | | | | | | | | | | | | | | | | |
| | | | | | | | | |
Class A(13) | | 10/31/05 | | | $ | 1.00 | | $ | 0.005 | | | $ | — | † | | $ | 0.005 | | | $ | (0.005 | ) | | $ | — | † | | $ | (0.005 | ) | | $ | 1.00 |
| | | | | | | | | |
Class C | | 10/31/05 | | | | 1.00 | | | 0.009 | | | | — | † | | | 0.009 | | | | (0.009 | ) | | | — | † | | | (0.009 | ) | | | 1.00 |
| | | 10/31/04 | | | | 1.00 | | | — | † | | | — | † | | | — | † | | | — | † | | | — | | | | — | † | | | 1.00 |
| | | 10/31/03 | (12) | | | 1.00 | | | — | † | | | — | † | | | — | † | | | — | † | | | — | † | | | — | † | | | 1.00 |
| | | 10/31/02 | (12) | | | 1.00 | | | 0.001 | | | | — | † | | | 0.001 | | | | (0.001 | ) | | | — | † | | | (0.001 | ) | | | 1.00 |
| | | 10/31/01 | (12) | | | 1.00 | | | 0.030 | | | | — | † | | | 0.030 | | | | (0.030 | ) | | | — | † | | | (0.030 | ) | | | 1.00 |
| | | | | | | | | |
Class D | | 10/31/05 | | | | 1.00 | | | 0.014 | | | | — | † | | | 0.014 | | | | (0.014 | ) | | | — | † | | | (0.014 | ) | | | 1.00 |
| | | 10/31/04 | (10) | | | 1.00 | | | — | † | | | — | † | | | — | | | | — | † | | | — | | | | (0.003 | ) | | | 1.00 |
| | | | | | | | | |
Class L (11) | | 10/31/05 | | | | 1.00 | | | 0.014 | | | | — | † | | | 0.014 | | | | (0.014 | ) | | | — | † | | | (0.014 | ) | | | 1.00 |
| | | 10/31/04 | | | | 1.00 | | | 0.010 | | | | — | † | | | 0.010 | | | | (0.010 | ) | | | — | | | | (0.010 | ) | | | 1.00 |
| | | 10/31/03 | (12) | | | 1.00 | | | 0.005 | | | | — | † | | | 0.005 | | | | (0.005 | ) | | | — | † | | | (0.005 | ) | | | 1.00 |
| | | 10/31/02 | (12) | | | 1.00 | | | 0.006 | | | | — | † | | | 0.006 | | | | (0.006 | ) | | | — | † | | | (0.006 | ) | | | 1.00 |
| | | 10/31/01 | (12) | | | 1.00 | | | 0.040 | | | | — | † | | | 0.040 | | | | (0.040 | ) | | | — | † | | | (0.040 | ) | | | 1.00 |
| | | | | | | | | |
Class M (11) | | 10/31/05 | | | | 1.00 | | | 0.009 | | | | — | † | | | 0.009 | | | | (0.009 | ) | | | — | † | | | (0.009 | ) | | | 1.00 |
| | | 10/31/04 | | | | 1.00 | | | — | † | | | — | † | | | — | † | | | — | † | | | — | | | | — | † | | | 1.00 |
| | | 10/31/03 | (12) | | | 1.00 | | | — | † | | | — | † | | | — | † | | | — | † | | | — | † | | | — | † | | | 1.00 |
| | | 10/31/02 | (12) | | | 1.00 | | | 0.001 | | | | — | † | | | 0.001 | | | | (0.001 | ) | | | — | † | | | (0.001 | ) | | | 1.00 |
| | | 10/31/01 | (12) | | | 1.00 | | | 0.030 | | | | — | † | | | 0.030 | | | | (0.030 | ) | | | — | † | | | (0.030 | ) | | | 1.00 |
| | | | | | | | | |
Class X | | 10/31/05 | | | | 1.00 | | | 0.009 | | | | — | † | | | 0.009 | | | | (0.009 | ) | | | — | † | | | (0.009 | ) | | | 1.00 |
| | | 10/31/04 | | | | 1.00 | | | — | † | | | — | † | | | — | † | | | — | † | | | — | | | | — | † | | | 1.00 |
| | | 10/31/03 | (12) | | | 1.00 | | | — | † | | | — | † | | | — | † | | | — | † | | | — | † | | | — | † | | | 1.00 |
| | | 10/31/02 | (12) | | | 1.00 | | | 0.001 | | | | — | † | | | 0.001 | | | | (0.001 | ) | | | — | † | | | (0.001 | ) | | | 1.00 |
| | | 10/31/01 | (12) | | | 1.00 | | | 0.030 | | | | — | † | | | 0.030 | | | | (0.030 | ) | | | — | † | | | (0.030 | ) | | | 1.00 |
| (1) | Total return for Class X shares does not reflect the payment of bonus shares. |
| (2) | Annualized for periods less than one year. |
| (3) | Includes commissions received by American Skandia Marketing, Incorporated under the Funds’ Supplemental Distribution Plan. The Supplemental Distribution Plan was terminated by the Board of Directors of the Fund effective June 27, 2001. |
| (4) | Commenced operations on November 1, 1999. |
| (5) | Commenced operations on March 1, 2000. |
| (6) | Commenced operations on September 11, 2000. |
| (7) | Commenced operations on March 1, 2001. |
| (8) | Commenced operations on May 1, 2002. |
| (9) | For the Periods ended 10/31/00, 10/31/01, 10/31/02, and 10/31/03 the Portfolio Turnover Rate, Ratios of Expenses and Ratios of Net Investment Income (Loss) represent the combined ratios for the respective Fund and its respective pro rata share of its Master Portfolio. On 9/27/02 these Funds withdrew their net assets-in-kind from its corresponding ASMT Portfolio. (See Note 1 in Notes to Financial Statements). |
| (10) | Opened on April 12, 2004. |
| (11) | Converted from classes A and B to classes L and M, respectively on April 12, 2004. |
| (12) | Calculations are based on the average daily number of shares outstanding. |
| (13) | Opened on August 12, 2005. |
| (a) | The reclassification of paydown gains and losses as discussed in Note 2 of the Notes to Financial Statements had a (0.01) per share effect for American Century Strategic Balanced and no per share effect for PIMCO Total Return Bond. For American Century Strategic Balanced and PIMCO Total Return Bond the Ratio of Net Investment Income (Loss) would have been 1.64%, 1.14%, 1.14%, and 1.14%, and 3.19%, 2.70%, 2.69%, and 2.71% for Class A, Class B, Class C, and Class X, respectively, without the reclassification of paydown gains and losses for the year ended 10/31/02. Ratios for prior periods have not been restated to reflect this change. |
| (b) | The adoption of the change in amortization method as discussed in Note 2 of the Notes to Financial Statements had a 0.01 per share effect for Federated High Yield Bond. Without the change in amortization method the Net Investment Income Ratio would have been 8.71%, 8.23%, 8.21%, and 8.25% for Class A, Class B, Class C, and Class X, respectively. Ratios for prior periods have not been restated to reflect this change. |
| † | Amount is less than $0.005. |
157
| | | | | | | | | | | | | | |
Supplemental Data
| | Ratios of Expenses to Average Net Assets(2)
| | | | |
Total Return
| | Net Assets at End of Period (in 000’s)
| | Portfolio Turnover Rate
| | Net Operating Expenses (after Expense Reimbursement and Waiver)(3)
| | | Net Operating Expenses (before Expense Reimbursement and Waiver)(3)
| | | Ratio of Net Investment Income (Loss) to Average Net Assets(2)
| |
0.53% | | $ | 33 | | N/A | | 1.25 | % | | 1.44 | % | | 0.59 | % |
0.92% | | | 12,339 | | N/A | | 2.00 | % | | 2.26 | % | | 0.84 | % |
0.00% | | | 22,084 | | N/A | | 1.23 | % | | 1.90 | % | | 0.01 | % |
0.00% | | | 45,723 | | N/A | | 1.32 | % | | 1.92 | % | | — | † |
0.15% | | | 73,787 | | N/A | | 1.89 | % | | 1.96 | % | | 0.13 | % |
3.09% | | | 73,282 | | N/A | | 1.91 | % | | 1.91 | % | | 2.95 | % |
1.42% | | | 13,015 | | N/A | | 1.50 | % | | 1.77 | % | | 1.39 | % |
0.29% | | | 15,973 | | N/A | | 0.83 | % | | 1.38 | % | | 0.51 | % |
1.42% | | | 21,170 | | N/A | | 1.50 | % | | 1.77 | % | | 1.25 | % |
0.50% | | | 44,800 | | N/A | | 0.72 | % | | 1.40 | % | | 0.50 | % |
0.50% | | | 103,228 | | N/A | | 0.80 | % | | 1.42 | % | | 0.50 | % |
0.65% | | | 135,044 | | N/A | | 1.39 | % | | 1.46 | % | | 0.66 | % |
3.61% | | | 176,679 | | N/A | | 1.41 | % | | 1.41 | % | | 3.55 | % |
0.92% | | | 60,896 | | N/A | | 2.00 | % | | 2.27 | % | | 0.85 | % |
0.00% | | | 79,944 | | N/A | | 1.25 | % | | 1.91 | % | | 0.01 | % |
0.00% | | | 120,172 | | N/A | | 1.31 | % | | 1.92 | % | | — | † |
0.15% | | | 157,867 | | N/A | | 1.89 | % | | 1.96 | % | | 0.14 | % |
3.09% | | | 147,983 | | N/A | | 1.91 | % | | 1.91 | % | | 2.78 | % |
0.92% | | | 13,762 | | N/A | | 2.00 | % | | 2.27 | % | | 0.88 | % |
0.00%(1) | | | 16,830 | | N/A | | 1.25 | % | | 1.91 | % | | 0.01 | % |
0.00%(1) | | | 24,933 | | N/A | | 1.30 | % | | 1.92 | % | | — | † |
0.15%(1) | | | 32,558 | | N/A | | 1.89 | % | | 1.96 | % | | 0.14 | % |
3.09%(1) | | | 30,941 | | N/A | | 1.91 | % | | 1.91 | % | | 2.95 | % |
See Notes to Financial Statements.
158
Report of Independent Registered Public Accounting Firm
To the Board of Directors and Shareholders of
Strategic Partners Mutual Funds:
We have audited the accompanying statements of assets and liabilities of Strategic Partners Mutual Funds, (comprised of the funds listed in the attachment to the Report of Independent Registered Public Accounting Firm, hereafter referred to as the “Funds”), as of October 31, 2005, and the related statements of operations for the year then ended, and changes in net assets and financial highlights for each of the years in the two-year period then ended. These financial statements and financial highlights are the responsibility of the Funds’ management. Our responsibility is to express an opinion on these financial statements and the financial highlights based on our audits. The financial highlights for the periods presented prior to November 1, 2003, were audited by other auditors, whose report dated December 19, 2003, expressed an unqualified opinion thereon.
We conducted our audits in accordance with the Public Company Accounting Oversight Board (United States). Those standards require that we plan and perform the audit to obtain reasonable assurance about whether the financial statements and financial highlights are free of material misstatement. An audit includes examining, on a test basis, evidence supporting the amounts and disclosures in the financial statements and financial highlights. Our procedures included confirmation of securities owned as of October 31, 2005, by correspondence with the custodian and brokers or by other appropriate audit procedures when replies from brokers were not received. An audit also includes assessing the accounting principles used and significant estimates made by management, as well as evaluating the overall financial statement presentation. We believe that our audits provide a reasonable basis for our opinion.
In our opinion, the financial statements and financial highlights referred to above present fairly, in all material respects, the financial position of the Funds as of October 31, 2005, and the results of their operations for the year then ended, and the changes in net assets and financial highlights for each of the years in the two-year period then ended, in conformity with accounting principles generally accepted in the United States of America.

New York, New York
December 22, 2005
159
Attachment to the Report of Independent Registered Public Accounting Firm
Strategic Partners International Growth Fund
Strategic Partners Small Cap Growth Fund
Strategic Partners Mid-Cap Growth Fund
Strategic Partners Mid Cap Value Fund
Strategic Partners Technology Fund
Strategic Partners Health Sciences Fund
Strategic Partners Managed OTC Fund
Strategic Partners Capital Growth Fund
Strategic Partners Concentrated Growth Fund
Strategic Partners Core Value Fund
Strategic Partners Large Cap Core Fund
Strategic Partners Equity Income Fund
Strategic Partners Balanced Fund
Strategic Partners High Yield Bond Fund
Strategic Partners Money Market Fund
160
Tax Information
Unaudited
For the year ended October 31, 2005, the tax character of the dividends paid, as reflected in the Statements of Changes in Net Assets were:
| | | | | | | | | |
| | | ORDINARY
INCOME
| | LONG-TERM
CAPITAL GAIN
| | TOTAL
DISTRIBUTIONS
|
International Growth | | $ | 1,698,413 | | | — | | $ | 1,698,413 |
Mid Cap Value | | | 9,429,006 | | $ | 28,187,639 | | | 37,616,645 |
Core Value | | | 144,591 | | | 1,125,279 | | | 1,269,870 |
Large Cap Core | | | 31,655 | | | — | | | 31,655 |
Equity Income | | | 527,377 | | | — | | | 527,377 |
Balanced | | | 975,175 | | | — | | | 975,175 |
High Yield Bond | | | 10,127,626 | | | — | | | 10,127,626 |
Money Market | | | 1,421,302 | | | — | | | 1,421,302 |
|
For the period ended November 25, 2005, the tax character of the dividend paid was: |
| | | |
Health Sciences | | $ | — | | $ | 288,513 | | | $288,513 |
For federal income tax purposes, ordinary income dividends and short-term capital gain distributions are taxable as ordinary income. Long-term capital gains distributions are taxable as capital gains income.
As required by the Internal Revenue Code, the following percentages of investment company taxable income for the year ended October 31, 2005 have been designated as 1) Qualified for the reduced tax rate under The Job and Growth Tax Relief Reconciliation Act of 2003 and 2) dividends received deduction eligible for corporate shareholders:
| | | | | | |
| | | QDI
| | | DRD
| |
International Growth | | 100.00 | % | | 3.89 | % |
Mid Cap Value | | 38.18 | % | | 41.73 | % |
Core Value | | 100.00 | % | | 100.00 | % |
Large Cap Core | | 100.00 | % | | 100.00 | % |
Equity Income | | 100.00 | % | | 100.00 | % |
Balanced | | 100.00 | % | | 100.00 | % |
High Yield Bond | | 0.45 | % | | 0.45 | % |
International Growth paid foreign taxes of $472,413 and recognized foreign source income of $4,915,826. Pursuant to Section 853 of the Internal Revenue Code, the Fund designates such amounts as having been paid in connection with dividends distributed from investment taxable income during the fiscal year ended October 31, 2005.
In January 2006, you will be advised on IRS Form 1099DIV or substitute 1099DIV as to the federal tax status of the distributions received by you in calendar year 2005.
161
Supplemental Proxy Information (Unaudited)
| 1. | To approve a new subadvisory agreement between Prudential Investments LLC (PI) and American Skandia Investment Services, Inc. (ASISI) and Prudential Investment Management, Inc. (PIM). |
Shareholder Meeting Date: July 1, 2005
Voting Results:
| | |
For: | | 55,293,503 |
Against: | | 2,185,875 |
Abstain: | | 4,685,829 |
| 2. | To approve a Plan of Reorganization whereby all of the assets and liabilities of Strategic Partners Growth with Income Fund will be transferred to, and assumed by, Strategic Partners Large Cap Core Fund (formerly, Strategic Partners Managed Index 500 Fund), in exchange for shares of Strategic Partners Large Cap Core Fund and the cancellation of all of the shares of Strategic Partners Growth with Income Fund. |
Shareholder Meeting Date: July 29, 2005
Voting Results:
| | |
For: | | 1,903,420 |
Against: | | 56,565 |
Abstain: | | 180,494 |
| 3. | To approve a Plan of Reorganization whereby all of the assets and liabilities of Strategic Partners Bond Fund will be transferred to, and assumed by, Strategic Partners Total Return Bond Fund, in exchange for shares of Strategic Partners Total Return Bond Fund and the cancellation of all of the shares of Strategic Partners Bond Fund. |
Shareholder Meeting Date: July 29, 2005
Voting Results:
| | |
For: | | 13,288,754 |
Against: | | 254,815 |
Abstain: | | 1,265,219 |
| 4. | To approve a Plan of Reorganization whereby all of the assets and liabilities of Strategic Partners Small Company Fund will be transferred to, and assumed by, Strategic Partners Small Cap Value Fund, in exchange for shares of Strategic Partners Small Cap Value Fund and the cancellation of all of the shares of Strategic Partners Small Company Fund. |
Shareholder Meeting Date: July 29, 2005
Voting Results:
| | |
For: | | 6,238,551 |
Against: | | 138,666 |
Abstain: | | 388,552 |
162
| 5. | To approve a Plan of Reorganization whereby all of the assets and liabilities of Strategic Partners Small Cap Growth Opportunity Fund will be transferred to, and assumed by, Strategic Partners Small Cap Growth Fund (formerly, Strategic Partners Managed Small Cap Growth Fund), in exchange for shares of Strategic Partners Small Cap Growth Fund and the cancellation of all of the shares of Strategic Partners Small Cap Growth Opportunity Fund. |
Shareholder Meeting Date: October 5, 2005
Voting Results:
| | |
For: | | 3,080,972 |
Against: | | 89,495 |
Abstain: | | 190,945 |
| 6. | To approve a Plan of Reorganization whereby all of the assets and liabilities of Strategic Partners Capital Income Fund will be transferred to, and assumed by, Strategic Partners Equity Income Fund, in exchange for shares of Strategic Partners Equity Income Fund and the cancellation of all of the shares of Strategic Partners Capital Income Fund. |
Shareholder Meeting Date: October 10, 2005
Voting Results:
| | |
For: | | 4,768,739 |
Against: | | 104,580 |
Abstain: | | 340,205 |
| 7. | To approve a Plan of Reorganization whereby all of the assets and liabilities of Strategic Partners Health Sciences Fund will be transferred to, and assumed by, Jennison Health Sciences Fund, in exchange for shares of Jennison Health Sciences Fund and the cancellation of all of the shares of Strategic Partners Health Sciences Fund. |
Shareholder Meeting Date: October 10, 2005
Voting Results:
| | |
For: | | 816,196 |
Against: | | 33,989 |
Abstain: | | 37,243 |
163
Management of the Fund (Unaudited)
Information pertaining to the Directors of the Fund is set forth below. Directors who are not deemed to be “interested persons” of the Fund, as defined in the Investment Company Act of 1940 as amended, (the 1940 Act) are referred to as “Independent Directors.” Directors who are deemed to be “interested persons” of the Fund are referred to as “Interested Directors.” “Fund Complex”† consists of the Fund and any other investment companies managed by PI.
Independent Directors(2)
Linda W. Bynoe (53), Director since 2005(3) Oversees 88 portfolios in Fund complex
Principal occupations (last 5 years): President and Chief Executive Officer (since March 1995) of Telemat Ltd. (management consulting); formerly Vice President at Morgan Stanley & Co.
Other Directorships held:(4) Director of Dynegy Inc. (energy services) (since September 2002) and Simon Property Group, Inc. (real estate investment trust) (since May 2003); Director (since August 2005) of The High Yield Plus Fund, Inc.
David E.A. Carson (71), Director since 2003(3) Oversees 92 portfolios in Fund complex
Principal occupations (last 5 years): Formerly Director (January 2000-May 2000), Chairman (January 1999-December 1999), Chairman and Chief Executive Officer (January 1998-December 1998) and President, Chairman and Chief Executive Officer (1983-1997) of People’s Bank.
Other Directorships held:(4) Director (since 2004) of The High Yield Plus Fund, Inc.
Robert E. La Blanc (71), Director since 2003(3) Oversees 89 portfolios in Fund complex
Principal occupations (last 5 years): President (since 1981) of Robert E. La Blanc Associates, Inc. (telecommunications).
Other Directorships held:(4) Director of Chartered Semiconductor Manufacturing, Ltd. (since 1998); Computer Associates International, Inc. (since 2002) (software company); FiberNet Telecom Group, Inc. (since 2003) (telecom company); Director (since April 1999) of The High Yield Plus Fund, Inc.
Douglas H. McCorkindale (66), Director since 1998(3) Oversees 89 portfolios in Fund complex
Principal occupations (last 5 years): Chairman (since February 2001) of Gannett Co. Inc. (publishing and media); formerly Chief Executive Officer (June 2000-July 2005), President (September 1997-July 2005) and Vice Chairman (March 1984-May 2000) of Gannett Co. Inc.
Other Directorships held:(4) Director of Gannett Co. Inc., Director of Continental Airlines, Inc. (since May 1993); Director of Lockheed Martin Corp. (aerospace and defense) (since May 2001); Director of The High Yield Plus Fund, Inc. (since 1996).
Richard A. Redeker (62), Director since 1998(3) Oversees 89 portfolios in Fund complex
Principal occupations (last 5 years): Management Consultant; Director of Invesmart, Inc. (since 2001) and Director of Penn Tank Lines, Inc. (since 1999).
Other Directorships held:(4) Director (since January 2005) of The High Yield Plus Fund, Inc.
Robin B. Smith (66), Director since 1998(3) Oversees 90 portfolios in Fund complex
Principal occupations (last 5 years): Chairman of the Board (since January 2003) of Publishers Clearing House (direct marketing); formerly Chairman and Chief Executive Officer (August 1996-January 2003) of Publishers Clearing House.
Other Directorships held:(4) Director of BellSouth Corporation (since 1992); Director (since January 2005) of The High Yield Plus Fund, Inc.
164
Stephen G. Stoneburn (62), Director since 2003(3) Oversees 89 portfolios in Fund complex
Principal occupations (last 5 years): President and Chief Executive Officer (since June 1996) of Quadrant Media Corp. (a publishing company); formerly President (June 1995-June 1996) of Argus Integrated Media, Inc.; Senior Vice President and Managing Director (January 1993-1995) of Cowles Business Media and Senior Vice President of Fairchild Publications, Inc. (1975-1989).
Other Directorships held:(4) Director (since January 2005) of The High Yield Plus Fund, Inc.
Clay T. Whitehead (67), Director since 1998(3) Oversees 90 portfolios in Fund complex
Principal occupations (last 5 years): President (since 1983) of National Exchange Inc. (new business development firm).
Other Directorships held:(4) Director (since 2000) of The High Yield Plus Fund, Inc.
Interested Directors(1)
Judy A. Rice (57), President since 2003 and Director since 2000(3) Oversees 89 portfolios in Fund complex
Principal occupations (last 5 years): President, Chief Executive Officer, Chief Operating Officer and Officer-in-Charge (since February 2003) of PI; Vice President (since February 1999) of Prudential Investment Management Services LLC; President, Chief Executive Officer and Officer-in-Charge (since April 2003) of Prudential Mutual Fund Services LLC; formerly Executive Vice President (September 1999-February 2003) of PI; Member of Board of Governors of the Money Management Institute.
Other Directorships held:(4) Director (since August 2005) of The High Yield Plus Fund, Inc.
Robert F. Gunia (59), Vice President and Director since 1998(3) Oversees 157 portfolios in Fund complex
Principal occupations (last 5 years): Chief Administrative Officer (since September 1999) and Executive Vice President (since December 1996) of PI; President (since April 1999) of Prudential Investment Management Services LLC; Executive Vice President (since March 1999) and Treasurer (since May 2000) of Prudential Mutual Fund Services LLC.
Other Directorships held:(4) Vice President and Director (since May 1989) and Treasurer (since 1999) of The Asia Pacific Fund, Inc.; Vice President (since 2004) and Director (since August 2005) of The High Yield Plus Fund, Inc.
Information pertaining to the Officers of the Fund who are not also Directors is set forth below.
Officers(2)
Kathryn L. Quirk (52), Chief Legal Officer since 2005(3)
Principal occupations (last 5 years): Vice President and Corporate Counsel (since September 2004) of Prudential; Executive Vice President, Chief Legal Officer and Secretary (since July 2005) of PI and Prudential Mutual Fund Services LLC; formerly Managing Director, General Counsel, Chief Compliance Officer, Chief Risk Officer and Corporate Secretary (1997-2002) of Zurich Scudder Investments, Inc.
Grace C. Torres (46), Treasurer and Principal Financial and Accounting Officer since 1998(3)
Principal occupations (last 5 years): Assistant Treasurer (since March 1999) and Senior Vice President (since September 1999) of PI; Assistant Treasurer (since May 2003) and Vice President (since June 2005) of American Skandia Investment Services, Inc.; Senior Vice President and Assistant Treasurer (since May 2003) of American Skandia Advisory Services, Inc.; formerly Senior Vice President (May 2003-June 2005) of American Skandia Investment Services, Inc.
165
Jack Benintende (41), Acting Treasurer since 2005(3)
Principal occupations (last 5 years): Vice President (since June 2000) within Prudential Mutual Fund Administration; Assistant Treasurer (since September 2004) of The High Yield Plus Fund, Inc.; formerly Assistant Treasurer (2000-October 2004) of Aberdeen Asia-Pacific Income Fund, Inc. and Aberdeen Australia Equity Fund, Inc.; Senior manager within the investment management practice of PricewaterhouseCoopers LLP (May 1994 through June 2000).
Deborah A. Docs (47), Secretary since 2004(3)
Principal occupations (last 5 years): Vice President and Corporate Counsel (since January 2001) of Prudential; Vice President (since December 1996) and Assistant Secretary (since March 1999) of PI; formerly Vice President and Assistant Secretary (May 2003-June 2005) of American Skandia Investment Services, Inc.
Jonathan D. Shain (47), Assistant Secretary since 2005(3)
Principal occupations (last 5 years): Vice President and Corporate Counsel (since August 1998) of Prudential; Vice President and Assistant Secretary (since May 2001) of PI; Vice President and Assistant Secretary (since February 2001) of PMFS; formerly Vice President and Assistant Secretary (May 2003-June 2005) of American Skandia Investment Services, Inc.
Marina Belaya (38), Assistant Secretary since 2005(3)
Principal occupations (last 5 years): Vice President and Corporate Counsel (since April 2005) of Prudential; formerly Associate (September 2002-March 2005) at Schutle, Roth & Zabel LLP.
Claudia DiGiacomo (31), Assistant Secretary since 2005(3)
Principal occupations (last 5 years): Vice President and Corporate Counsel (since January 2005) of Prudential; Associate at Sidley Austin Brown & Wood LLP (1999-2004).
Lee D. Augsburger (46), Chief Compliance Officer since 2004(3)
Principal occupations (last 5 years): Senior Vice President and Chief Compliance Officer (since April 2003) of PI; Vice President (since November 2000) and Chief Compliance Officer (since October 2000) of Prudential Investment Management, Inc.; Chief Compliance Officer and Senior Vice President (since May 2003) of American Skandia Investment Services, Inc.; Chief Compliance Officer (since October 2004) of Quantitative Management Associates LLC.
Maryanne Ryan (41), Anti-Money Laundering Compliance Officer since 2002(3)
Principal occupations (last 5 years): Anti-Money Laundering Officer and Vice President (since April 2002) of Pruco Securities, LLC; Vice President and Bank Secrecy Act Officer (since July 2004) of Prudential Trust Company; Anti-Money Laundering Officer (since April 2003) of PI.
| † | The Fund Complex consists of all investment companies managed by PI. The Funds for which PI serves as manager include JennisonDryden Mutual Funds, Strategic Partners Funds, The Prudential Variable Contract Accounts 2, 10, 11, The Target Portfolio Trust, The Prudential Series Fund, Inc., American Skandia Trust and Prudential’s Gibraltar Fund. |
| (1) | “Interested” Director, as defined in the 1940 Act, by reason of employment with the Manager, the Subadviser(s) or the Distributor. |
| (2) | Unless otherwise noted, the address of the Directors and Officers is c/o: Prudential Investments LLC, Gateway Center Three, 100 Mulberry Street, Newark, NJ 07102. |
| (3) | There is no set term of office for Directors and Officers. The Independent Directors have adopted a retirement policy, which calls for the retirement of Directors on December 31 of the year in which they reach the age of 75. The table shows the individuals length of service as Director and/or Officer. |
| (4) | This column includes only directorships of companies required to register, or file reports with the SEC under the Securities and Exchange Act of 1934 (that is, “public companies”) or other investment companies registered under the 1940 Act. |
166
Approval of Advisory Agreements
The Board of Directors (the “Board”) of Strategic Partners Mutual Funds, Inc. (the “Company”) oversees the management of each of the Company’s funds (each, a “Fund”), and, as required by law, determines annually whether to renew the Company’s management agreement with Prudential Investments LLC and American Skandia Investment Services, Inc. (collectively, “PI”) and each Fund’s subadvisory agreement. In addition to determining whether to renew each Fund’s existing agreements, the Board is also responsible for determining whether to approve new subadvisory agreements for the Funds.
The Board, including a majority of the Independent Directors, met on May 24, 2005 and June 23, 2005, and approved the renewal of the existing management and subadvisory agreements through July 31, 2006, after concluding that renewal of the agreements was in the best interests of each of the Company’s Funds and their shareholders. In addition, the Board approved several new subadvisory agreements for certain of the Funds at its June 23, 2005 meeting.
In advance of the meetings, the Directors received materials relating to the agreements, and had the opportunity to ask questions and request further information in connection with their consideration. Among other things, the Board considered performance and expense comparisons with other mutual funds in relevant Peer Universes and Peer Groups. The mutual funds included in each Peer Universe or Peer Group was objectively determined solely by Lipper Inc. (“Lipper”), an independent provider of mutual fund data. Peer Universes and Peer Groups are mutual funds grouped according to investment style. If the quartile refers to performance, then a fund in the first quartile is among the best performers. If the quartile refers to expenses, then a fund in the first quartile has among the lowest expenses.
In approving the agreements, the Directors, including the Independent Directors advised by independent legal counsel, considered the factors they deemed relevant, including the nature, quality and extent of services provided, the performance of each Fund, the profitability of PI and its affiliates, expenses and fees, and the potential for economies of scale that may be shared with each Fund and its shareholders. In their deliberations, the Directors did not identify any single factor that was dispositive and each Director attributed different weights to the various factors. In connection with their deliberations, the Board considered information provided by PI throughout the year at regular Board meetings, presentations from portfolio managers and other information, as well as information furnished at or in advance of the meetings on May 24, 2005 and June 23, 2005.
The Directors determined that the overall arrangements between the Company and PI, which serves as the Company’s investment manager pursuant to a management agreement, and between PI and each subadviser, each of which serves pursuant to the terms of subadvisory agreements with PI, are fair and reasonable in light of the services performed, fees charged and such other matters as the Directors considered relevant in the exercise of their business judgment.
The material factors and conclusions that formed the basis for the Directors’ determinations to approve the renewal of the agreements are discussed separately below.
Nature, quality and extent of services
The Board received and considered information regarding the nature and extent of services provided to the Company by PI and each subadviser. The Board considered the services provided by PI, including but not limited to the oversight of the subadvisers, as well as the provision of recordkeeping and compliance services to the Company and each Fund. With respect to PI’s oversight of the subadvisers, the Board noted that PI’s Strategic Investment Research Group (“SIRG”), a business unit of PI, is responsible for screening and recommending new subadvisers when appropriate, as well as monitoring and reporting to the Board on the performance and operations of the subadvisers. The Board also considered that PI pays the salaries of all of the officers and non-independent Directors of
Approval of Advisory Agreements (continued)
the Company. The Board also considered the investment subadvisory services provided by each subadviser, as well as compliance with each Fund’s investment restrictions, policies and procedures. The Board considered PI’s evaluation of the subadvisers; as well as PI’s recommendation, based on its review of the subadvisers, to renew the subadvisory agreements or to replace certain subadvisers, as applicable.
The Board reviewed the qualifications, backgrounds and responsibilities of PI’s senior management responsible for the oversight of the Company, each Fund, and each subadviser, and also reviewed the qualifications, backgrounds and responsibilities of the subadvisers’ portfolio managers who are responsible for the day-to-day management of each Fund. The Board was provided with information pertaining to PI’s and each subadviser’s organizational structure, senior management, investment operations, and other relevant information pertaining to both PI and each subadviser. The Board also noted that it received favorable compliance reports from the Company’s Chief Compliance Officer (CCO) as to both PI and each subadviser.
The Board concluded that it was satisfied with the nature, extent and quality of the investment management services provided by PI and the subadvisory services provided to the Funds by each subadviser, and that there was a reasonable basis on which to conclude that the Company and its Funds benefit from the services provided by PI and each subadviser under the management and subadvisory agreements.
Costs of Services and Profits Realized by PI
The Board was provided with information on the profitability of PI and its affiliates in serving as the Company’s investment manager. The Board discussed with PI the methodology utilized in assembling the information regarding profitability and considered its reasonableness. The Board recognized that it is difficult to make comparisons of profitability from fund management contracts because comparative information is not generally publicly available and is affected by numerous factors, including the structure of the particular adviser, the types of funds it manages, its business mix, numerous assumptions regarding allocations and the adviser’s capital structure and cost of capital. Taking these factors into account, the Board concluded that the profitability of PI and its affiliates in relation to the services rendered was not unreasonable.
The Board noted that none of the Company’s subadvisers was affiliated with PI, and concluded that the level of profitability of a subadviser not affiliated with PI may not be as significant as PI’s profitability given the arm’s length nature of the process by which the subadvisory fee rates were negotiated by PI and the unaffiliated subadvisers, as well as the fact that PI compensates the subadvisers out of its management fee.
Economies of Scale
The Board noted that the management fee schedule for the following Funds does not contain breakpoints that reduce the fee rate on assets above specified levels: Strategic Partners Money Market Fund, Strategic Partners Managed OTC Fund, Strategic Partners Small Cap Growth Fund, Strategic Partners Core Value Fund, Strategic Partners Health Sciences Fund, and Strategic Partners Technology Fund.
The Board received and discussed information concerning whether PI realizes economies of scale as each Fund’s assets grow beyond current levels. However, because of the nature of PI’s business, the Board could not reach definitive conclusions as to whether PI might realize economies of scale on a particular Fund or how great they may be. In light of each Fund’s current size and fee rate, the Board concluded that the absence of breakpoints in the fee schedule of the identified Funds is acceptable at this time.
The Board also noted that the management fee schedule for the following Funds include breakpoints, which have the effect of decreasing the fee rate as assets increase, but at the current level of assets the Funds do not realize the effect of those rate reductions: Strategic Partners Balanced Fund, Strategic Partners Concentrated Growth Fund, Strategic Partners Equity Income Fund, Strategic Partners High Yield Bond Fund, Strategic Partners International Growth Fund, Strategic Partners Large Cap Core Fund, Strategic Partners Mid Cap Growth Fund, and Strategic Partners Mid-Cap Value Fund. The Board further noted that the management fee schedule for Strategic Partners Capital Growth Fund includes breakpoints, which have the effect of decreasing the fee rate as assets increase, and that at its current level of assets the Fund’s effective fee rate reflected some of those rate reductions.
The Board took note that the fee structure of the Funds with breakpoints would result in benefits to Fund shareholders when (and if) assets reach the levels at which the fee rate is reduced. These benefits will accrue whether or not PI is then realizing any economies of scale.
Other Benefits to PI and The Subadvisers
The Board considered potential ancillary benefits that might be received by PI, the subadvisers, and their affiliates as a result of their relationship with a Fund. The Board concluded that potential benefits to be derived by PI included brokerage commissions received by affiliates of PI, transfer agency fees received by the Company’s transfer agent (which is affiliated with PI), as well as reputational or other intangible benefits resulting from PI’s association with a Fund. The Board concluded that the potential benefits to be derived by the subadvisers included the ability to use soft dollar credits, brokerage commissions received by affiliates of the subadvisers, as well as the potential benefits consistent with those generally resulting from an increase in assets under management, specifically, potential access to additional research resources and reputational benefits. The Board concluded that the benefits derived by PI and the subadvisers were consistent with the types of benefits generally derived by investment managers and subadvisers to mutual funds.
Performance of the Funds / Fees and Expenses / Other Factors
With respect to each Fund, the Board also considered certain additional specific factors and related conclusions relating to the performance and fees and expenses of the Funds, as detailed below. Unless otherwise noted, the time periods referenced are for periods ended December 31.
Strategic Partners Balanced Fund. The Board received and considered information about the Fund’s historical performance, noting that the Fund had achieved performance that was in the second quartile over one-year and three-year time periods and was in the third quartile over a five-year time period, in relation to the group of comparable funds in a Peer Universe. The Board noted that the Fund had outperformed over one-year, three-year and five-year periods when compared against the Fund’s benchmark index.
The Board determined that the Fund’s performance was satisfactory.
The Board considered the management fee for the Fund as compared to the management fee charged by PI to other funds and accounts and the fee charged by other advisers to comparable mutual funds as provided by Lipper.
The Fund’s management fee of 0.595% ranked in the first quartile in its Peer Group, due to a voluntary reimbursement/waiver of fees by PI. The Board accepted PI’s recommendation to reduce the management fee contractually to the following schedule: 0.75% on Fund assets to $500 million; 0.70% on the next $500 million of Fund assets, and 0.65% on Fund assets over $1 billion. The Board also accepted PI’s recommendation to continue the existing voluntary cap on Fund expenses of 1.40%. The Board concluded that the management and subadvisory fees are reasonable.
Approval of Advisory Agreements (continued)
Strategic Partners Capital Growth Fund. The Board received and considered information about the Fund’s historical performance, noting that the Fund had achieved performance that was in the first quartile over one-year, three-year and five-year time periods in relation to the group of comparable funds in a Peer Universe. The Board noted that the Fund had outperformed over the same time periods when compared against the Fund’s benchmark index, the Russell 1000 Growth Index.
The Board determined that the Fund’s performance was satisfactory.
The Board considered the management fee for the Fund as compared to the management fee charged by PI to other funds and accounts and the fee charged by other advisers to comparable mutual funds provided by Lipper.
The Fund’s management fee of 0.862% ranked in the third quartile in its Peer Group (reflecting a voluntary reimbursement/waiver of fees by PI). The Board accepted PI’s recommendation to reduce the management fee to the following schedule: 0.90% on Fund assets to $500 million; 0.85% on the next $500 million of Fund assets, and 0.80% on Fund assets over $1 billion. The Board also accepted PI’s recommendation to continue the Fund’s existing voluntary cap on net total expenses of 1.550%. The Board concluded that the management and subadvisory fees are reasonable.
Strategic Partners Concentrated Growth Fund. The Board received and considered information about the Fund’s historical performance, noting that the Fund had achieved performance that was in the fourth quartile over one-year, three-year and five-year time periods in relation to the group of comparable funds in a Peer Universe. While expressing the view that the Fund’s performance had been disappointing, the Board noted that PI had taken steps to address the performance issues by replacing the previous subadviser in November 2002 and that the performance of the Fund had improved during the most recent calendar quarter. The Board took into account the style factors that had contributed to the Fund’s poor performance. The Board concluded that it was reasonable to approve the continuance of the management and subadvisory agreements and to continue to monitor the situation.
The Board considered the management fee for the Fund as compared to the management fee charged by PI to other funds and accounts and the fee charged by other advisers to comparable mutual funds as provided by Lipper.
The Fund’s management fee of 0.587% ranked in the first quartile in its Peer Group (reflecting a voluntary reimbursement/waiver of fees by PI). The Board accepted PI’s recommendation to contractually reduce the management fee according to the following schedule: 0.90% on Fund assets to $500 million; 0.85% on the next $500 million of Fund assets, and 0.80% on Fund assets over $1 billion. The Board concluded that the management and subadvisory fees are reasonable.
Strategic Partners Core Value Fund. The Board received and considered information about the Fund’s historical performance, noting that the Fund had achieved performance that was in the second quartile over a one-year period and performance that was in the first quartile over a three-year period in relation to the group of comparable funds in a Peer Universe.
The Board determined that the Fund’s performance was satisfactory.
The Board considered the management fee for the Fund as compared to the management fee charged by PI to other funds and accounts and the fee charged by other advisers to comparable mutual funds provided by Lipper.
The Fund’s management fee of 0.396% ranked in the second quartile in its Peer Group (reflecting a voluntary reimbursement/waiver of fees by PI). The Board accepted PI’s recommendation to maintain the Fund’s existing voluntary cap on expenses of 1.450%. The Board concluded that the management and subadvisory fees are reasonable.
Strategic Partners Equity Income Fund. Pursuant to a recommendation submitted by PI, the Board approved an additional new subadvisory agreement with T. Rowe Price Associates, Inc., to serve as an additional subadviser to the Fund along with Alliance Capital Management, L.P., the Fund’s current subadviser.
The Board received and considered information about the Fund’s historical performance, noting that the Fund had achieved performance that was in the first quartile over one-year, three-year and five-year time periods in relation to the group of comparable funds in a Peer Universe. The Board determined that the Fund’s performance was satisfactory.
The Board considered the management fee for the Fund as compared to the management fee charged by PI to other funds and accounts and the fee charged by other advisers to comparable mutual funds as provided by Lipper.
The Fund’s management fee of 0.636% ranked in the second quartile in its Peer Group, due to a waiver/reimbursement of fees by PI. The Board accepted PI’s recommendation to contractually reduce the management fee earned by PI on Fund assets up to $500 million from 1.00% to 0.85%. The Board also accepted PI’s recommendation to continue the existing voluntary cap of 1.40% on Fund expenses. The Board concluded that the management and subadvisory fees are reasonable.
Strategic Partners Health Sciences Fund. The Board received and considered information about the Fund’s historical performance, noting that the Fund had achieved performance that was in the third quartile over a one-year period and performance that was in the second quartile over a three-year period in relation to the group of comparable funds in a Peer Universe. The Board noted that the Fund’s performance over the three-year period was higher than the median performance of mutual funds included in the Peer Universe, and that the Fund had also outperformed its benchmark index over the same time periods. The Board further noted that, pending shareholder approval, the Fund was expected to reorganize with Jennison Health Sciences Fund later in the year.
The Board determined that the performance of the Fund was satisfactory, but noted that the Fund was scheduled to reorganize with Jennison Health Sciences Fund.
The Board considered the management fee for the Fund as compared to the management fee charged by PI to other funds and accounts and the fee charged by other advisers to comparable mutual funds as provided by Lipper.
The Fund’s management fee of 0.00% ranked in the first quartile in its Peer Group (reflecting the fact that the Fund receives a waiver of fees, expense subsidy or cap on expenses that exceeds the Fund’s contractual management fee). The Fund’s contractual management fee of 1.025%, which does not reflect the impact of any fee waiver or expense subsidy, ranked in the second quartile in its Peer Group. The Board accepted PI’s recommendation to maintain the existing voluntary cap on Fund expenses of 1.650%. The Board concluded that the management and subadvisory fees are reasonable.
Strategic Partners High Yield Bond Fund. The Board received and considered information about the Fund’s historical performance, noting that the Fund had achieved performance that was in the second quartile over one-year and three-year periods, and performance that was in the third quartile over a five-year period in relation to the group of comparable funds in a Peer Universe. The Board noted that the Fund’s current subadviser, Goldman Sachs, had assumed management of the Fund in May 2004 and that the Fund had outperformed its benchmark index and achieved performance that was above the median performance of the other mutual funds included in the Peer Universe since Goldman Sachs assumed responsibility for the Fund.
The Board determined that the performance of the Fund was satisfactory.
Approval of Advisory Agreements (continued)
The Board considered the management fee for the Fund as compared to the management fee charged by PI to other funds and accounts and the fee charged by other advisers to comparable mutual funds as provided by Lipper.
The Fund’s management fee of 0.514% ranked in the second quartile in its Peer Group (reflecting a voluntary reimbursement/waiver of fees by PI). The Board accepted PI’s recommendation to maintain the existing voluntary cap on Fund expenses of 1.250%. The Board concluded that the management and subadvisory fees are reasonable.
Strategic Partners International Growth Fund. The Board received and considered information about the Fund’s historical performance, noting that the Fund had achieved performance that was in the fourth quartile over one-year, three-year and five-year time periods in relation to the group of comparable funds in a Peer Universe. In addition, the Board noted that the Fund had underperformed when compared against the appropriate benchmark index, the MSCI EAFE Index, over the same time periods. The Board indicated that it was disappointed in the Fund’s historical performance, but noted that William Blair had served as the Fund’s subadviser since November 11, 2002, and that the growth investment style utilized by William Blair had been out of favor during the past several years. The Board further noted that the Fund had consistently outperformed the MSCI International Growth Index, which indicated that the Fund’s underperformance was attributable to style and not stock selection.
The Board considered the management fee for the Fund as compared to the management fee charged by PI to other funds and accounts and the fee charged by other advisers to comparable mutual funds as provided by Lipper.
The Fund’s management fee of 0.748% ranked in the first quartile in its Peer Group. The Board accepted PI’s recommendation to continue the existing voluntary cap of 1.85% on Fund expenses. The Board concluded that the management and subadvisory fees are reasonable.
Strategic Partners Large Cap Core Fund (formerly, Strategic Partners Managed Index 500 Fund). The Board received and considered information about the Fund’s historical performance, noting that the Fund had achieved gross performance (which does not reflect the impact of Fund expenses) that was in the second quartile over a one-year period, first quartile over a three-year period, and performance that was in the second quartile over a five-year period in relation to the group of comparable funds in a Peer Universe. The Board further noted that the Fund had achieved net performance (which reflects the impact of Fund expenses) that was in the second quartile over the same time periods.
The Board determined that the performance of the Fund was satisfactory.
The Board considered the management fee for the Fund as compared to the management fee charged by PI to other funds and accounts and the fee charged by other advisers to comparable mutual funds as provided by Lipper.
The Fund’s management fee of 0.497% ranked in the first quartile in its Peer Group (reflecting a voluntary reimbursement/waiver of fees by PI). The Board accepted PI’s recommendation to maintain the existing voluntary cap on Fund expenses of 1.250%. The Board concluded that the management and subadvisory fees are reasonable.
Strategic Partners Managed OTC Fund. The Board received and considered information about the Fund’s historical performance, noting that the Fund had achieved performance that was in the first quartile over a one-year period and performance that was in the third quartile over a three-year period in relation to the group of comparable funds in a Peer Universe.
The Board determined that the performance of the Fund was satisfactory.
The Board considered the management fee for the Fund as compared to the management fee charged by PI to other funds and accounts and the fee charged by other advisers to comparable mutual funds as provided by Lipper.
The Fund’s management fee of 0.126% ranked in the first quartile in its Peer Group (reflecting a voluntary reimbursement/waiver of fees by PI). The Board accepted PI’s recommendation to maintain the existing voluntary cap on Fund expenses of 1.50%. The Board concluded that the management and subadvisory fees are reasonable.
Strategic Partners Small Cap Growth Fund (formerly, Strategic Partners Managed Small Cap Growth Fund). Pursuant to recommendations submitted by PI, the Board approved additional new subadvisory agreements with Westcap Investors LLC and RS Investment Management, L.P., to serve as additional subadvisers to the Fund along with Deutsche Asset Management, Inc., the Fund’s current subadviser.
The Board received and considered information about the Fund’s historical performance, noting that the Fund had achieved performance that was in the third quartile over a one-year period and performance that was in the second quartile over a three-year period in relation to the group of comparable funds in a Peer Universe. The Board further noted that, over a three-year period, the Fund’s performance approximated the performance of its benchmark index.
The Board determined that the performance of the Fund was satisfactory.
The Board considered the management fee for the Fund as compared to the management fee charged by PI to other funds and accounts and the fee charged by other advisers to comparable mutual funds as provided by Lipper.
The Fund’s management fee of 0.263% ranked in the first quartile in its Peer Group (reflecting a voluntary reimbursement/waiver of fees by PI). The Board accepted PI’s recommendation to maintain the existing voluntary cap on Fund expenses of 1.650%. The Board took into account that PI had agreed, upon the consummation of the pending reorganizations of Strategic Partners Small Capitalization Growth Fund and Strategic Partners Small Cap Growth Opportunity Fund into the Fund, to voluntarily subsidize and/or cap the annual operating expenses of the Fund so that annual operating expenses (exclusive of distribution and service fees) does not exceed 1.55% of average net assets until at least March 31, 2006. The Board concluded that the management and subadvisory fees are reasonable.
Strategic Partners Mid Cap Growth Fund. The Board received and considered information about the Fund’s historical performance, noting that the Fund had achieved performance that was in the second quartile over a one-year period and performance that was in the third quartile over a three-year time period in relation to the group of comparable funds in a Peer Universe. However, the Board further noted that the Fund’s performance over the same one-year period was higher than the median of the group of mutual funds in the Peer Universe, and that over the same one-year time period the Fund outperformed when compared against the appropriate benchmark index, the Standard and Poor’s MidCap 400 Index. The Board noted that Goldman Sachs had served as subadviser to the Fund since November 11, 2002, and that the Fund’s performance over the one-year time period was satisfactory.
The Board considered the management fee for the Fund as compared to the management fee charged by PI to other funds and accounts and the fee charged by other advisers to comparable mutual funds as provided by Lipper.
The Fund’s management fee of 0.489% (which reflects any subsidies, expense caps or waivers) ranked in the first quartile in its Peer Group, due to a waiver/reimbursement of fees by PI. The Board accepted PI’s recommendation to contractually reduce the management fee earned on Fund assets up
Approval of Advisory Agreements (continued)
to $500 million from 1.00% to 0.90%, and to reduce the management fee earned on Fund assets above $500 million by 0.05% at each fee breakpoint. The Board also accepted PI’s recommendation to continue the existing voluntary cap of 1.650% on Fund expenses. The Board concluded that the management and subadvisory fees was reasonable.
Strategic Partners Money Market Fund. The Board received and considered information about the Fund’s historical performance, noting that the Fund had achieved gross performance (which does not reflect the impact of fee waivers or expense subsidies) that was in the fourth quartile over one-year, three-year and five-year periods in relation to the group of comparable funds in a Peer Universe. Over the same time periods, the Fund achieved net performance (which does reflect the impact of fee waivers of expense subsidies) that was in the third quartile over one-year and three-year periods, and performance that was in the fourth quartile over a five-year period.
While expressing the view that the Fund’s performance had been disappointing, the Board concluded that it was reasonable to approve the continuance of the management and subadvisory agreements and to continue to monitor the situation, noting that it had previously approved submitting to shareholders a proposal to appoint Prudential Investment Management, Inc. (“PIM”) as the Fund’s new subadviser, and that a shareholder meeting to consider the proposal was scheduled for later in 2006.
The Board considered the management fee for the Fund as compared to the management fee charged by PI to other funds and accounts and the fee charged by other advisers to comparable mutual funds as provided by Lipper.
The Fund’s contractual management fee of 0.525% ranked in the fourth quartile in its Peer Group. The Board accepted PI’s recommendation to voluntarily waive 10 basis points of its management fee. The Board also accepted PI’s recommendation to maintain the Fund’s current expense cap of 1.50%. The Board concluded that the management and subadvisory fees are reasonable.
Strategic Partners Mid-Cap Value Fund (formerly, Strategic Partners Relative Value Fund). The Board received and considered information about the Fund’s historical performance, noting that the Fund had achieved gross performance (which does not reflect the impact of Fund expenses) that was in the second quartile over one-year, three-year and five-year time periods in relation to the group of comparable funds in a Peer Universe. The Board further noted that the Fund had achieved net performance (which reflects the impact of Fund expenses) that was identical to the gross performance, except that net performance was in the third quartile over a five-year period. In addition, the Board noted that the Fund outperformed when compared against the appropriate benchmark index, the Standard & Poor’s MidCap 400 Index. The Board determined that the Fund’s performance was satisfactory.
The Board considered the management fee for the Fund as compared to the management fee charged by PI to other funds and accounts and the fee charged by other advisers to comparable mutual funds as provided by Lipper.
The Fund’s management fee of 0.876% (which reflects subsidies, expense caps or waivers) ranked in third quartile in its Peer Group, but was only slightly higher than the median actual management fee of 0.858% for all mutual funds in the Peer Group. The Board accepted PI’s recommendation to continue the current voluntary expense cap of 1.60%. The Board concluded that the management and subadvisory fees are reasonable.
Strategic Partners Technology Fund. The Board received and considered information about the Fund’s historical performance, noting that the Fund had achieved performance that was in the third quartile over a one-year period and performance that was in the fourth quartile over a three-year period
in relation to the group of comparable funds in a Peer Universe. The Board noted that subject to shareholder approval, the Fund was scheduled to reorganize with the Jennison Technology Fund. In light of this, the Board concluded that it was reasonable to approve the continuance of the management and subadvisory agreements and to continue to monitor the situation, pending shareholder approval of the reorganization.
The Board considered the management fee for the Fund as compared to the management fee charged by PI to other funds and accounts and the fee charged by other advisers to comparable mutual funds provided by Lipper Inc.
The Fund’s management fee of 0.00% (reflecting a voluntary reimbursement/waiver of fees by PI), ranked in the first quartile of its Peer Group, reflecting the fact that the Fund receives a waiver of fees, expense subsidy or cap on expenses that exceeds the Fund’s contractual management fee. The Fund’s contractual management fee of 1.025%, which does not reflect the impact of any fee waiver or expense subsidy, ranked in the second quartile of its Peer Group. The Board accepted PI’s recommendation to maintain the Fund’s current expense cap of 1.650%, which ranked it in the first quartile for net total expenses among the mutual funds included in the Peer Group. The Board concluded that the management and subadvisory fees are reasonable.
Strategic Partners International Growth Fund
Growth of a $10,000 Investment
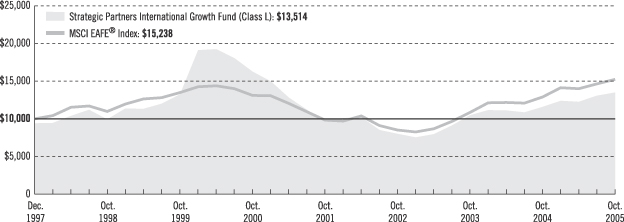
| | | | | | | | | |
| Average Annual Total Returns (With Sales Charges) as of 10/31/05 | |
| | | One Year | | | Five Years | | | Since Inception | |
Class A | | 10.34 | % | | N/A | | | 5.07 | % |
Class B | | 10.87 | | | N/A | | | 5.65 | |
Class C | | 14.93 | | | –4.33 | % | | 4.07 | |
Class L | | 9.84 | | | –4.78 | | | 3.92 | |
Class M | | 9.87 | | | –4.52 | | | 4.18 | |
Class X | | 9.96 | | | –4.70 | | | 4.09 | |
| | | | | | | | | | |
| Average Annual Total Returns (Without Sales Charges) as of 10/31/05 | |
| | | One Year | | | Five Years | | | Since Inception | |
Class A | | 16.76 | % | | N/A | | | 8.98 | % |
Class B | | 15.87 | | | N/A | | | 8.13 | |
Class C | | 15.93 | | | –4.14 | % | | 4.21 | |
Class L | | 16.52 | | | –3.65 | | | 4.71 | |
Class M | | 15.87 | | | –4.15 | | | 4.18 | |
Class X | | 15.96 | | | –4.14 | | | 4.19 | |
Performance data quoted represent past performance. Past performance does not guarantee future results. The investment return and principal value of an investment will fluctuate so that an investor’s shares, when redeemed, may be worth more or less than their original cost. Current performance may be lower or higher than the past performance data quoted. An investor may obtain performance data as of the most recent month-end by visiting our website at www.strategicpartners.com or by calling (800) 225-1852. Class A and Class L shares have a maximum initial sales charge of 5.50% and 5.75% respectively. Class L shares are closed to most new purchases (with the exception of reinvested dividends and purchases by certain college savings plans).
Source: Prudential Investments LLC and Lipper Inc.
Inception dates: Class A and Class B, 4/12/04; Class C, Class L, Class M, and Class X, 12/31/97.
The graph compares a $10,000 investment in the Strategic Partners International Growth Fund (Class L shares) with a similar investment in the MSCI EAFE® Index by portraying the initial account values at the commencement of operations of Class A shares (December 31, 1997) and the account values at the end of the current fiscal year (October 31, 2005) as measured on a quarterly basis. For purposes of the graph, and unless otherwise indicated, it has been assumed that (a) the maximum applicable front-end sales charge was deducted from the initial $10,000 investment in Class L shares; (b) all recurring fees (including management fees) were deducted; and (c) all dividends and distributions were reinvested. The line graph provides information for Class L shares only. As indicated in the tables above, performance for Class A, B, C, M, and X shares will vary due to the differing charges and expenses applicable to each share class (as indicated in the following paragraphs).
| | |
| | | Visit our website at www.strategicpartners.com |
The MSCI EAFE® Index is an unmanaged, weighted index of performance that reflects stock price movements of developed-country markets in Europe, Australasia, and the Far East. MSCI EAFE® Index’s total returns include the reinvestment of all dividends, but do not include the effects of sales charges, operating expenses of a mutual fund, or taxes. These returns would be lower if they included the effects of sales charges, operating expenses, or taxes. The securities that comprise the MSCI EAFE® Index may differ substantially from the securities in the Fund. The MSCI EAFE® Index is not the only index that may be used to characterize performance of global/international stock funds. Other indexes may portray different comparative performance. Investors cannot invest directly in an index.
Class A and Class L shares are subject to a maximum front-end sales charge of 5.50% and 5.75% respectively. Class L shares are closed to most new purchases (with the exception of reinvested dividends and purchases by certain college savings plans). Under certain circumstances, Class A and Class L shares may be subject to a contingent deferred sales charge (CDSC) of 1%, in certain circumstances. Class B, Class C, Class M, and Class X shares are subject to a maximum CDSC of 5%, 1%, 6%, and 6% respectively. Class A shares are subject to a 12b-1 fee of up to 0.30% annually. Class B, Class C, Class M, and Class X shares are subject to a 12b-1 fee of 1%. Class L shares are subject to a 12b-1 fee of 0.50%. The returns in the graph and the tables do not reflect the deduction of taxes that a shareholder would pay on Fund distributions or following the redemption of Fund shares.
| | |
| Strategic Partners Mutual Funds, Inc. | | |
Strategic Partners Small Cap Growth Fund
Growth of a $10,000 Investment
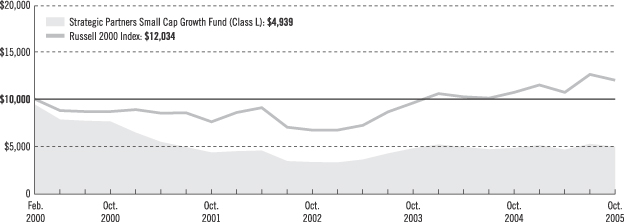
| | | | | | | | | |
| Average Annual Total Returns (With Sales Charges) as of 10/31/05 | |
| | | One Year | | | Five Years | | | Since Inception | |
Class A | | –2.58 | % | | N/A | | | –6.78 | % |
Class B | | –2.57 | | | N/A | | | –7.25 | |
Class C | | 1.41 | | | –8.74 | % | | –11.23 | |
Class L | | –2.96 | | | –9.37 | | | –11.70 | |
Class M | | –3.59 | | | –9.11 | | | –11.55 | |
Class X | | –3.65 | | | –9.29 | | | –11.53 | |
| | | | | | | | | | |
| Average Annual Total Returns (Without Sales Charges) as of 10/31/05 | |
| | | One Year | | | Five Years | | | Since Inception | |
Class A | | 3.13 | % | | N/A | | | –3.38 | % |
Class B | | 2.43 | | | N/A | | | –4.78 | |
Class C | | 2.41 | | | –8.74 | % | | –11.23 | |
Class L | | 2.95 | | | –8.30 | | | –10.78 | |
Class M | | 2.41 | | | –8.74 | | | –11.23 | |
Class X | | 2.41 | | | –8.74 | | | –11.21 | |
Performance data quoted represent past performance. Past performance does not guarantee future results. The investment return and principal value of an investment will fluctuate so that an investor’s shares, when redeemed, may be worth more or less than their original cost. Current performance may be lower or higher than the past performance data quoted. An investor may obtain performance data as of the most recent month-end by visiting our website at www.strategicpartners.com or by calling (800) 225-1852. Class A and Class L shares have a maximum initial sales charge of 5.50% and 5.75% respectively. Class L shares are closed to most new purchases (with the exception of reinvested dividends and purchases by certain college savings plans).
Source: Prudential Investments LLC and Lipper Inc.
Inception dates: Class A and Class B, 4/12/04; Class C, Class L, Class M, and Class X, 7/28/97.
The graph compares a $10,000 investment in the Strategic Partners Small Cap Growth Fund (Class L shares) with a similar investment in the Russell 2000 Index by portraying the initial account values at the commencement of operations for Class L shares (July 28, 1997) and the account values at the end of the current fiscal year (October 31, 2005) as measured on a quarterly basis. The Russell 2000 Index data are measured from the closest month-end to inception date, and not from the Fund’s actual inception date. For purposes of the graph, and unless otherwise indicated, it has been assumed that (a) the maximum applicable front-end sales charge was deducted from the initial $10,000 investment in Class L shares; (b) all recurring fees (including management fees) were deducted; and (c) all dividends and distributions were reinvested. The line graph provides information for Class L shares only. As indicated in the tables above, performance for Class A, B, C, M, and X shares will vary due to the differing charges and expenses applicable to each share class (as indicated in the following paragraphs).
| | |
| | | Visit our website at www.strategicpartners.com |
The Russell 2000 Index is an unmanaged index of the 2,000 smallest U.S. companies included in the Russell 3000 Index. It gives a broad look at how stock prices of smaller companies have performed. The Index’s total returns include the reinvestment of all dividends, but do not include the effects of sales charges, operating expenses of a mutual fund, or taxes. The returns for the Index would be lower if they included the effects of sales charges, operating expenses, or taxes. The securities that comprise the Index may differ substantially from the securities in the Fund. This is not the only index that may be used to characterize performance of small-capitalization stock funds. Other indexes may portray different comparative performance. Investors cannot invest directly in an index.
Class A and Class L shares are subject to a maximum front-end sales charge of 5.50% and 5.75% respectively. Class L shares are closed to most new purchases (with the exception of reinvested dividends and purchases by certain college savings plans). Under certain circumstances, Class A and Class L shares may be subject to a contingent deferred sales charge (CDSC) of 1%, in certain circumstances. Class B, Class C, Class M, and Class X shares are subject to a maximum CDSC of 5%, 1%, 6%, and 6% respectively. Class A shares are subject to a 12b-1 fee of up to 0.30% annually. Class B, Class C, Class M, and Class X shares are subject to a 12b-1 fee of 1%. Class L shares are subject to a 12b-1 fee of 0.50%. The returns in the graph and the tables do not reflect the deduction of taxes that a shareholder would pay on Fund distributions or following the redemption of Fund shares.
| | |
| Strategic Partners Mutual Funds, Inc. | | |
Strategic Partners Mid Cap Growth Fund
Growth of a $10,000 Investment
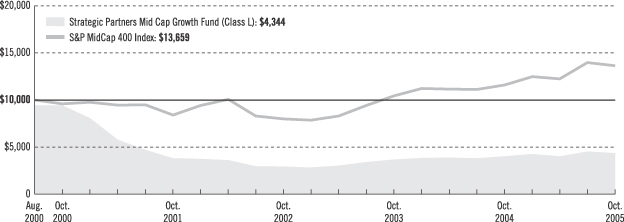
| | | | | | | | | |
| Average Annual Total Returns (With Sales Charges) as of 10/31/05 | | | | |
| | | One Year | | | Five Years | | | Since Inception | |
Class A | | 2.21 | % | | N/A | | | 1.99 | % |
Class B | | 2.38 | | | N/A | | | 2.49 | |
Class C | | 6.42 | | | –14.81 | % | | –14.43 | |
Class L | | 1.77 | | | –15.38 | | | –14.98 | |
Class M | | 1.40 | | | –15.10 | | | –14.73 | |
Class X | | 1.42 | | | –15.31 | | | –14.76 | |
| | | | | | | | | | |
| Average Annual Total Returns (Without Sales Charges) as of 10/31/05 | | | | |
| | | One Year | | | Five Years | | | Since Inception | |
Class A | | 8.18 | % | | N/A | | | 5.82 | % |
Class B | | 7.38 | | | N/A | | | 5.00 | |
Class C | | 7.42 | | | –14.81 | % | | –14.43 | |
Class L | | 7.98 | | | –14.37 | | | –14.00 | |
Class M | | 7.40 | | | –14.75 | | | –14.39 | |
Class X | | 7.42 | | | –14.79 | | | –14.43 | |
Performance data quoted represent past performance. Past performance does not guarantee future results. The investment return and principal value of an investment will fluctuate so that an investor’s shares, when redeemed, may be worth more or less than their original cost. Current performance may be lower or higher than the past performance data quoted. An investor may obtain performance data as of the most recent month-end by visiting our website at www.strategicpartners.com or by calling (800) 225-1852. Class A and Class L shares have a maximum initial sales charge of 5.50% and 5.75% respectively. Class L shares are closed to most new purchases (with the exception of reinvested dividends and purchases by certain college savings plans).
Source: Prudential Investments LLC and Lipper Inc.
Inception dates: Class A and Class B, 4/12/04; Class C, Class L, Class M, and Class X, 9/11/00.
The graph compares a $10,000 investment in the Strategic Partners Mid Cap Growth Fund (Class L shares) with a similar investment in the S&P MidCap 400 Index by portraying the initial account values at the commencement of operations of Class L shares (September 11, 2000) and the account values at the end of the current fiscal year (October 31, 2005) as measured on a quarterly basis. For purposes of the graph, and unless otherwise indicated, it has been assumed that (a) the maximum applicable front-end sales charge was deducted from the initial $10,000 investment in Class L shares; (b) all recurring fees (including management fees) were deducted; and (c) all dividends and distributions were reinvested. The line graph provides information for Class L shares only. As indicated in the tables above, performance for Class A, B, C, M, and X shares will vary due to the differing charges and expenses applicable to each share class (as indicated in the following paragraphs).
| | |
| | | Visit our website at www.strategicpartners.com |
The S&P MidCap 400 Index is an unmanaged index of 400 domestic stocks chosen for market size, liquidity, and industry group representation. It gives a broad look at how U.S. mid-cap stock prices have performed. The Index’s total returns include the reinvestment of all dividends, but do not include the effects of sales charges, operating expenses of a mutual fund, or taxes. The returns for the Index would be lower if they included the effects of sales charges, operating expenses, or taxes. The securities that comprise the index may differ substantially from the securities in the Fund. This is not the only index that may be used to characterize performance of mid-capitalization stock funds. Other indexes may portray different comparative performance. Investors cannot invest directly in an index.
Class A and Class L shares are subject to a maximum front-end sales charge of 5.50% and 5.75% respectively. Class L shares are closed to most new purchases (with the exception of reinvested dividends and purchases by certain college savings plans). Under certain circumstances, Class A and Class L shares may be subject to a contingent deferred sales charge (CDSC) of 1%, in certain circumstances. Class B, Class C, Class M, and Class X shares are subject to a maximum CDSC of 5%, 1%, 6%, and 6% respectively. Class A shares are subject to a 12b-1 fee of up to 0.30% annually. Class B, Class C, Class M, and Class X shares are subject to a 12b-1 fee of 1%. Class L shares are subject to a 12b-1 fee of 0.50%. The returns in the graph and the tables do not reflect the deduction of taxes that a shareholder would pay on Fund distributions or following the redemption of Fund shares.
| | |
| Strategic Partners Mutual Funds, Inc. | | |
Strategic Partners Mid Cap Value Fund
Growth of a $10,000 Investment
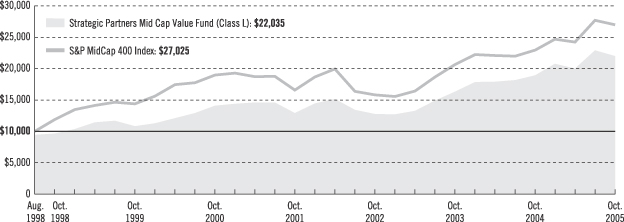
| | | | | | | | | |
| Average Annual Total Returns (With Sales Charges) as of 10/31/05 | |
| | | One Year | | | Five Years | | | Since Inception | |
Class A | | 10.30 | % | | N/A | | | 8.28 | % |
Class B | | 10.85 | | | N/A | | | 8.93 | |
Class C | | 14.75 | | | 8.58 | % | | 11.82 | |
Class L | | 9.59 | | | 8.06 | | | 11.60 | |
Class M | | 9.75 | | | 8.51 | | | 11.97 | |
Class X | | 9.67 | | | 8.35 | | | 11.86 | |
| | | | | | | | | | |
| Average Annual Total Returns (Without Sales Charges) as of 10/31/05 | |
| | | One Year | | | Five Years | | | Since Inception | |
Class A | | 16.74 | % | | N/A | | | 12.30 | % |
Class B | | 15.85 | | | N/A | | | 11.37 | |
Class C | | 15.75 | | | 8.80 | % | | 11.97 | |
Class L | | 16.29 | | | 9.35 | | | 12.52 | |
Class M | | 15.75 | | | 8.80 | | | 11.97 | |
Class X | | 15.67 | | | 8.78 | | | 11.93 | |
Performance data quoted represent past performance. Past performance does not guarantee future results. The investment return and principal value of an investment will fluctuate so that an investor’s shares, when redeemed, may be worth more or less than their original cost. Current performance may be lower or higher than the past performance data quoted. An investor may obtain performance data as of the most recent month-end by visiting our website at www.strategicpartners.com or by calling (800) 225-1852. Class A and Class L shares have a maximum initial sales charge of 5.50% and 5.75% respectively. Class L shares are closed to most new purchases (with the exception of reinvested dividends and purchases by certain college savings plans).
Source: Prudential Investments LLC and Lipper Inc.
Inception dates: Class A and Class B, 4/12/04; Class C, Class L, Class M; Class X, 8/19/98; and Class Z, 11/28/05. Returns for Class Z are not shown since the share class has not existed prior to 10/31/05.
The graph compares a $10,000 investment in the Strategic Partners Mid Cap Value Fund (Class L shares) with a similar investment in the S&P MidCap 400 Index by portraying the initial account values at the commencement of operations of Class L shares (August 19, 1998) and the account values at the end of the current fiscal year (October 31, 2005) as measured on a quarterly basis. For purposes of the graph, and unless otherwise indicated, it has been assumed that (a) the maximum applicable front-end sales charge was deducted from the initial $10,000 investment in Class L shares; (b) all recurring fees (including management fees) were deducted; and (c) all dividends and distributions were reinvested. The line graph provides information for Class L shares only. As indicated in the tables above, performance for Class A, B, C, M, and X shares will vary due to the differing charges and expenses applicable to each share class (as indicated in the following paragraphs).
| | |
| | | Visit our website at www.strategicpartners.com |
The S&P MidCap 400 Index is an unmanaged index of 400 domestic stocks chosen for market size, liquidity, and industry group representation. It gives a broad look at how U.S. mid-cap stock prices have performed. The Index’s total returns include the reinvestment of all dividends, but do not include the effects of sales charges, operating expenses of a mutual fund, or taxes. The returns for the index would be lower if they included the effects of sales charges, operating expenses, or taxes. The securities that comprise the index may differ substantially from the securities in the Fund. This is not the only index that may be used to characterize performance of small- to mid-capitalization stock funds. Other indexes may portray different comparative performance. Investors cannot invest directly in an index.
Class A and Class L shares are subject to a maximum front-end sales charge of 5.50% and 5.75% respectively. Class L shares are closed to most new purchases (with the exception of reinvested dividends and purchases by certain college savings plans). Under certain circumstances, Class A and Class L shares may be subject to a contingent deferred sales charge (CDSC) of 1%, in certain circumstances. Class B, Class C, Class M, and Class X shares are subject to a maximum CDSC of 5%, 1%, 6%, and 6% respectively. Class A shares are subject to a 12b-1 fee of up to 0.30% annually. Class B, Class C, Class M, and Class X shares are subject to a 12b-1 fee of 1%. Class L shares are subject to a 12b-1 fee of 0.50%. The returns in the graph and the tables do not reflect the deduction of taxes that a shareholder would pay on Fund distributions or following the redemption of Fund shares.
| | |
| Strategic Partners Mutual Funds, Inc. | | |
Strategic Partners Technology Fund
Growth of a $10,000 Investment
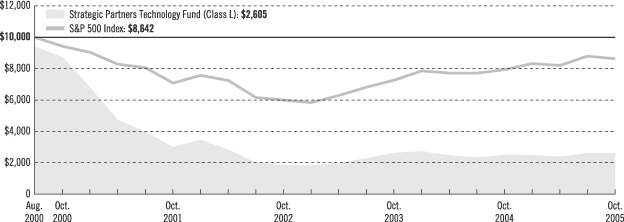
| | | | | | | | | |
| Average Annual Total Returns (With Sales Charges) as of 10/31/05 | | | | |
| | | One Year | | | Five Years | | | Since Inception | |
Class A | | –1.42 | % | | N/A | | | –6.39 | % |
Class B | | –1.90 | | | N/A | | | –6.18 | |
Class C | | 2.48 | | | –21.96 | % | | –22.61 | |
Class L | | –2.13 | | | –22.43 | | | –23.04 | |
Class M | | –2.51 | | | –22.32 | | | –22.97 | |
Class X | | –2.92 | | | –22.42 | | | –22.92 | |
| | | | | | | | | | |
| Average Annual Total Returns (Without Sales Charges) as of 10/31/05 | | | | |
| | | One Year | | | Five Years | | | Since Inception | |
Class A | | 4.14 | % | | N/A | | | –2.09 | % |
Class B | | 3.10 | | | N/A | | | –3.68 | |
Class C | | 3.48 | | | –21.96 | % | | –22.61 | |
Class L | | 3.76 | | | –21.49 | | | –22.14 | |
Class M | | 3.49 | | | –22.00 | | | –22.67 | |
Class X | | 3.08 | | | –21.95 | | | –22.61 | |
Performance data quoted represent past performance. Past performance does not guarantee future results. The investment return and principal value of an investment will fluctuate so that an investor’s shares, when redeemed, may be worth more or less than their original cost. Current performance may be lower or higher than the past performance data quoted. An investor may obtain performance data as of the most recent month-end by visiting our website at www.strategicpartners.com or by calling (800) 225-1852. Class A and Class L shares have a maximum initial sales charge of 5.50% and 5.75% respectively. Class L shares are closed to most new purchases (with the exception of reinvested dividends and purchases by certain college savings plans).
Source: Prudential Investments LLC and Lipper Inc.
Inception dates: Class A and Class B, 4/12/04; Class C, Class L, Class M, and Class X, 9/11/00.
The graph compares a $10,000 investment in the Strategic Partners Technology Fund (Class L shares) with a similar investment in the Standard & Poor’s 500 Composite Stock Price Index (S&P 500 Index) by portraying the initial account values at the commencement of operations for Class L shares (September 11, 2000) and the account values at the end of the current fiscal year (October 31, 2005) as measured on a quarterly basis. The S&P 500 Index data are measured from the closest month-end to inception date, and not from the Fund’s actual inception date. For purposes of the graph, and unless otherwise indicated, it has been assumed that (a) the maximum applicable front-end sales charge was deducted from the initial $10,000 investment in Class L shares; (b) all recurring fees (including management fees) were deducted; and (c) all dividends and distributions were reinvested. The line graph provides information for Class L shares only. As indicated in the tables above, performance for Class A, B, C, M, and X shares will vary due to the differing charges and expenses applicable to each share class (as indicated in the following paragraphs).
| | |
| | | Visit our website at www.strategicpartners.com |
The S&P 500 Index is an unmanaged index of 500 stocks of large U.S. public companies. It gives a broad look at how stock prices have performed in the United States. The Index’s total returns include the reinvestment of all dividends, but do not include the effects of sales charges, operating expenses of a mutual fund, or taxes. The returns for the Index would be lower if they included the effects of sales charges, operating expenses, or taxes. The securities that comprise the Index may differ substantially from the securities in the Fund. This is not the only index that may be used to characterize performance of sector stock funds. Other indexes may portray different comparative performance. Investors cannot invest directly in an index.
Class A and Class L shares are subject to a maximum front-end sales charge of 5.50% and 5.75% respectively. Class L shares are closed to most new purchases (with the exception of reinvested dividends and purchases by certain college savings plans). Under certain circumstances, Class A and Class L shares may be subject to a contingent deferred sales charge (CDSC) of 1%, in certain circumstances. Class B, Class C, Class M, and Class X shares are subject to a maximum CDSC of 5%, 1%, 6%, and 6% respectively. Class A shares are subject to a 12b-1 fee of up to 0.30% annually. Class B, Class C, Class M, and Class X shares are subject to a 12b-1 fee of 1%. Class L shares are subject to a 12b-1 fee of 0.50%. The returns in the graph and the tables reflect the share class expense structure in effect at the close of the fiscal period, but do not reflect the deduction of taxes that a shareholder would pay on Fund distributions or following the redemption of Fund shares.
| | |
| Strategic Partners Mutual Funds, Inc. | | |
Strategic Partners Health Sciences Fund
Growth of a $10,000 Investment
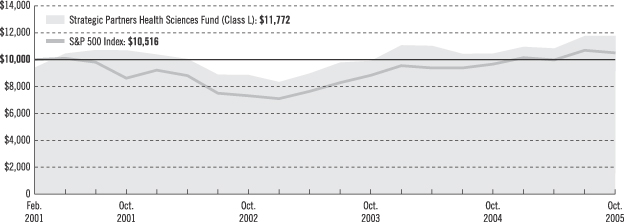
| | | | | | |
| Average Annual Total Returns (With Sales Charges) as of 10/31/05 | |
| | | One Year | | | Since Inception | |
Class A | | 6.80 | % | | –0.56 | % |
Class B | | 7.23 | | | –0.28 | |
Class C | | 11.10 | | | 4.18 | |
Class L | | 6.12 | | | 3.56 | |
Class M | | 6.12 | | | 4.00 | |
Class X | | 6.09 | | | 3.87 | |
| | | | | | | |
| Average Annual Total Returns (Without Sales Charges) as of 10/31/05 | |
| | | One Year | | | Since Inception | |
Class A | | 13.04 | % | | 3.14 | % |
Class B | | 12.23 | | | 2.28 | |
Class C | | 12.10 | | | 4.41 | |
Class L | | 12.62 | | | 4.88 | |
Class M | | 12.12 | | | 4.37 | |
Class X | | 12.09 | | | 4.42 | |
Performance data quoted represent past performance. Past performance does not guarantee future results. The investment return and principal value of an investment will fluctuate so that an investor’s shares, when redeemed, may be worth more or less than their original cost. Current performance may be lower or higher than the past performance data quoted. An investor may obtain performance data as of the most recent month-end by visiting our website at www.strategicpartners.com or by calling (800) 225-1852. Class A and Class L shares have a maximum initial sales charge of 5.50% and 5.75% respectively. Class L shares are closed to most new purchases (with the exception of reinvested dividends and purchases by certain college savings plans).
Source: Prudential Investments LLC and Lipper Inc.
Inception dates: Class A and Class B, 4/12/04; Class C, Class L, Class M, and Class X, 3/1/01.
The graph compares a $10,000 investment in the Strategic Partners Health Sciences Fund (Class L shares) with a similar investment in the Standard & Poor’s 500 Composite Stock Price Index (S&P 500 Index) by portraying the initial account values at the commencement of operations for Class L shares (March 1, 2001) and the account values at the end of the current fiscal year (October 31, 2005) as measured on a quarterly basis. The S&P 500 Index data are measured from the closest month-end to inception date, and not from the Fund’s actual inception date. For purposes of the graph, and unless otherwise indicated, it has been assumed that (a) the maximum applicable front-end sales charge was deducted from the initial $10,000 investment in Class L shares; (b) all recurring fees (including management fees) were deducted; and (c) all dividends and distributions were reinvested. The line graph provides information for Class L shares only. As indicated in the tables above, performance for Class A, B, C, M, and X shares will vary due to the differing charges and expenses applicable to each share class (as indicated in the following paragraphs).
| | |
| | | Visit our website at www.strategicpartners.com |
The S&P 500 Index is an unmanaged index of 500 stocks of large U.S. public companies. It gives a broad look at how stock prices have performed in the United States. The Index’s total returns include the reinvestment of all dividends, but do not include the effects of sales charges, operating expenses of a mutual fund, or taxes. The returns for the Index would be lower if they included the effects of sales charges, operating expenses, or taxes. The securities that comprise the Index may differ substantially from the securities in the Fund. This is not the only index that may be used to characterize performance of sector stock funds. Other indexes may portray different comparative performance. Investors cannot invest directly in an index.
Class A and Class L shares are subject to a maximum front-end sales charge of 5.50% and 5.75% respectively. Class L shares are closed to most new purchases (with the exception of reinvested dividends and purchases by certain college savings plans). Under certain circumstances, Class A and Class L shares may be subject to a contingent deferred sales charge (CDSC) of 1%, in certain circumstances. Class B, Class C, Class M, and Class X shares are subject to a maximum CDSC of 5%, 1%, 6% and, 6% respectively. Class A shares are subject to a 12b-1 fee of up to 0.30% annually. Class B, Class C, Class M, and Class X shares are subject to a 12b-1 fee of 1%. Class L shares are subject to a 12b-1 fee of 0.50%. The returns in the graph and the tables do not reflect the deduction of taxes that a shareholder would pay on Fund distributions or following the redemption of Fund shares.
| | |
| Strategic Partners Mutual Funds, Inc. | | |
Strategic Partners Managed OTC Fund
Growth of a $10,000 Investment
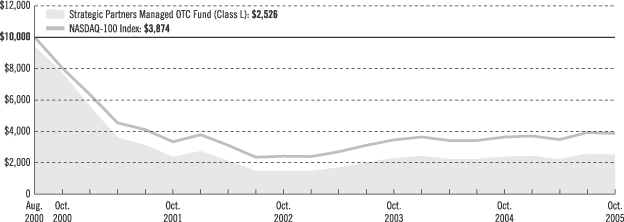
| | | | | | | | | |
| Average Annual Total Returns (With Sales Charges) as of 10/31/05 | | | | |
| | | One Year | | | Five Years | | | Since Inception | |
Class A | | –0.37 | % | | N/A | | | –0.71 | % |
Class B | | –0.20 | | | N/A | | | –0.81 | |
Class C | | 3.80 | | | –20.42 | % | | –22.95 | |
Class L | | –1.11 | | | –21.02 | | | –23.50 | |
Class M | | –1.22 | | | –20.70 | | | –23.20 | |
Class X | | –1.22 | | | –20.85 | | | –23.20 | |
| | | | | | | | | | |
| Average Annual Total Returns (Without Sales Charges) as of 10/31/05 | | | | |
| | | One Year | | | Five Years | | | Since Inception | |
Class A | | 5.47 | % | | N/A | | | 2.96 | % |
Class B | | 4.80 | | | N/A | | | 1.76 | |
Class C | | 4.80 | | | –20.42 | % | | –22.95 | |
Class L | | 5.10 | | | –20.08 | | | –22.61 | |
Class M | | 4.78 | | | –20.38 | | | –22.89 | |
Class X | | 4.78 | | | –20.36 | | | –22.89 | |
Performance data quoted represent past performance. Past performance does not guarantee future results. The investment return and principal value of an investment will fluctuate so that an investor’s shares, when redeemed, may be worth more or less than their original cost. Current performance may be lower or higher than the past performance data quoted. An investor may obtain performance data as of the most recent month-end by visiting our website at www.strategicpartners.com or by calling (800) 225-1852. Class A and Class L shares have a maximum initial sales charge of 5.50% and 5.75% respectively. Class L shares are closed to most new purchases (with the exception of reinvested dividends and purchases by certain college savings plans).
Source: Prudential Investments LLC and Lipper Inc.
Inception dates: Class A and Class B, 4/12/04; Class C, Class L, Class M, and Class X, 9/11/00.
The graph compares a $10,000 investment in the Strategic Partners Managed OTC Fund (Class L shares) with a similar investment in the NASDAQ-100 Index by portraying the initial account values at the commencement of operations for Class L shares (September 11, 2000) and the account values at the end of the current fiscal year (October 31, 2005) as measured on a quarterly basis. The NASDAQ-100 Index data are measured from the closest month-end to inception date, and not from the Fund’s actual inception date. For purposes of the graph, and unless otherwise indicated, it has been assumed that (a) the maximum applicable front-end sales charge was deducted from the initial $10,000 investment in Class L shares; (b) all recurring fees (including management fees) were deducted; and (c) all dividends and distributions were reinvested. The line graph provides information for Class L shares only. As indicated in the tables above, performance for Class A, B, C, M, and X shares will vary due to the differing charges and expenses applicable to each share class (as indicated in the following paragraphs).
| | |
| | | Visit our website at www.strategicpartners.com |
The NASDAQ-100 Index is an unmanaged, modified, capitalization-weighted index of the 100 largest and most active nonfinancial domestic and international issues listed on the NASDAQ. The Index’s total returns include the reinvestment of all dividends, but do not include the effects of sales charges, operating expenses of a mutual fund, or taxes. The returns for the Index would be lower if they included the effects of sales charges, operating expenses, or taxes. The securities that comprise the Index may differ substantially from the securities in the Fund. This is not the only index that may be used to characterize performance of sector stock funds. Other indexes may portray different comparative performance. Investors cannot invest directly in an index.
Class A and Class L shares are subject to a maximum front-end sales charge of 5.50% and 5.75% respectively. Class L shares are closed to most new purchases (with the exception of reinvested dividends and purchases by certain college savings plans). Under certain circumstances, Class A and Class L shares may be subject to a contingent deferred sales charge (CDSC) of 1%, in certain circumstances. Class B, Class C, Class M, and Class X shares are subject to a maximum CDSC of 5%, 1%, 6% and, 6% respectively. Class A shares are subject to a 12b-1 fee of up to 0.30% annually. Class B, Class C, Class M, and Class X shares are subject to a 12b-1 fee of 1%. Class L shares are subject to a 12b-1 fee of 0.50%. The returns in the graph and the tables do not reflect the deduction of taxes that a shareholder would pay on Fund distributions or following the redemption of Fund shares.
| | |
| Strategic Partners Mutual Funds, Inc. | | |
Strategic Partners Capital Growth Fund
Growth of a $10,000 Investment
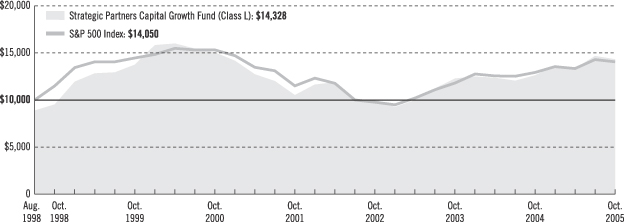
| | | | | | | | | |
| Average Annual Total Returns (With Sales Charges) as of 10/31/05 | |
| | | One Year | | | Five Years | | | Since Inception | |
Class A | | 7.45 | % | | N/A | | | 3.75 | % |
Class B | | 7.84 | | | N/A | | | 4.26 | |
Class C | | 11.87 | | | –1.66 | % | | 5.30 | |
Class L | | 6.82 | | | –2.13 | | | 5.12 | |
Class M | | 6.77 | | | –1.88 | | | 5.46 | |
Class X | | 6.88 | | | –2.06 | | | 5.34 | |
| | | | | | | | | | |
| Average Annual Total Returns (Without Sales Charges) as of 10/31/05 | |
| | | One Year | | | Five Years | | | Since Inception | |
Class A | | 13.69 | % | | N/A | | | 7.57 | % |
Class B | | 12.84 | | | N/A | | | 6.76 | |
Class C | | 12.87 | | | –1.46 | % | | 5.45 | |
Class L | | 13.36 | | | –0.97 | | | 5.99 | |
Class M | | 12.77 | | | –1.49 | | | 5.46 | |
Class X | | 12.88 | | | –1.46 | | | 5.44 | |
Performance data quoted represent past performance. Past performance does not guarantee future results. The investment return and principal value of an investment will fluctuate so that an investor’s shares, when redeemed, may be worth more or less than their original cost. Current performance may be lower or higher than the past performance data quoted. An investor may obtain performance data as of the most recent month-end by visiting our website at www.strategicpartners.com or by calling (800) 225-1852. Class A and Class L shares have a maximum initial sales charge of 5.50% and 5.75% respectively. Class L shares are closed to most new purchases (with the exception of reinvested dividends and purchases by certain college savings plans).
Source: Prudential Investments LLC and Lipper Inc.
Inception dates: Class A and Class B, 4/12/04; Class C, Class L, Class M, and Class X, 8/19/98.
The graph compares a $10,000 investment in the Strategic Partners Capital Growth Fund (Class L shares) with a similar investment in the Standard & Poor’s 500 Composite Stock Price Index (S&P 500 Index) by portraying the initial account values at the commencement of operations for Class L shares (8/19/98) and the account values at the end of the current fiscal year (October 31, 2005) as measured on a quarterly basis. The S&P 500 Index data are measured from the closest month-end to inception date, and not from the Fund’s actual inception date. For purposes of the graph, and unless otherwise indicated, it has been assumed that (a) the maximum applicable front-end sales charge was deducted from the initial $10,000 investment in Class L shares; (b) all recurring fees (including management fees) were deducted; and (c) all dividends and distributions were reinvested. The line graph provides information for Class L shares only. As indicated in the tables above, performance for Class A, B, C, M and X shares will vary due to the differing charges and expenses applicable to each share class (as indicated in the following paragraphs).
| | |
| | | Visit our website at www.strategicpartners.com |
The S&P 500 Index is an unmanaged index of 500 stocks of large U.S. public companies. It gives a broad look at how stock prices have performed in the United States. The Index’s total returns include the reinvestment of all dividends, but do not include the effects of sales charges, operating expenses of a mutual fund, or taxes. The returns for the Index would be lower if they included the effects of sales charges, operating expenses, or taxes. The securities that comprise the Index may differ substantially from the securities in the Fund. This is not the only index that may be used to characterize performance of sector stock funds. Other indexes may portray different comparative performance. Investors cannot invest directly in an index.
Class A and Class L shares are subject to a maximum front-end sales charge of 5.50% and 5.75% respectively. Class L shares are closed to most new purchases (with the exception of reinvested dividends and purchases by certain college savings plans). Under certain circumstances, Class A and Class L shares may be subject to a contingent deferred sales charge (CDSC) of 1%, in certain circumstances. Class B, Class C, Class M, and Class X shares are subject to a maximum CDSC of 5%, 1%, 6%, and 6% respectively. Class A shares are subject to a 12b-1 fee of up to 0.30% annually. Class B, Class C, Class M, and Class X shares are subject to a 12b-1 fee of 1%. Class L shares are subject to a 12b-1 fee of 0.50%. The returns in the graph and the tables do not reflect the deduction of taxes that a shareholder would pay on Fund distributions or following the redemption of Fund shares.
| | |
| Strategic Partners Mutual Funds, Inc. | | |
Strategic Partners Concentrated Growth Fund
Growth of a $10,000 Investment
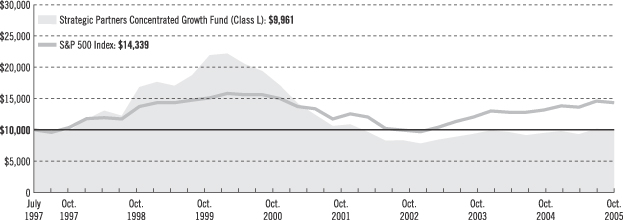
| | | | | | | | | |
| Average Annual Total Returns (With Sales Charges) as of 10/31/05 | |
| | | One Year | | | Five Years | | | Since Inception | |
Class A | | –0.84 | % | | N/A | | | –2.95 | % |
Class B | | –0.86 | | | N/A | | | –2.84 | |
Class C | | 3.15 | | | –12.96 | % | | 0.06 | |
Class L | | –1.35 | | | –13.54 | | | –0.05 | |
Class M | | –1.86 | | | –13.30 | | | 0.09 | |
Class X | | –1.87 | | | –13.48 | | | 0.11 | |
| | | | | | | | | | |
| Average Annual Total Returns (Without Sales Charges) as of 10/31/05 | |
| | | One Year | | | Five Years | | | Since Inception | |
Class A | | 4.91 | % | | N/A | | | –0.25 | % |
Class B | | 4.14 | | | N/A | | | 0.66 | |
Class C | | 4.15 | | | –12.96 | % | | 0.06 | |
Class L | | 4.66 | | | –12.51 | | | 0.58 | |
Class M | | 4.14 | | | –12.94 | | | 0.09 | |
Class X | | 4.13 | | | –12.95 | | | 0.11 | |
Performance data quoted represent past performance. Past performance does not guarantee future results. The investment return and principal value of an investment will fluctuate so that an investor’s shares, when redeemed, may be worth more or less than their original cost. Current performance may be lower or higher than the past performance data quoted. An investor may obtain performance data as of the most recent month-end by visiting our website at www.strategicpartners.com or by calling (800) 225-1852. Class A and Class L shares have a maximum initial sales charge of 5.50% and 5.75% respectively. Class L shares are closed to most new purchases (with the exception of reinvested dividends and purchases by certain college savings plans).
Source: Prudential Investments LLC and Lipper Inc.
Inception dates: Class A and Class B, 4/12/04; Class C, Class L, Class M, and Class X, 7/28/97.
The graph compares a $10,000 investment in the Strategic Partners Concentrated Growth Fund (Class L shares) with a similar investment in the Standard & Poor’s 500 Composite Stock Price Index (S&P 500 Index) by portraying the initial account values at the commencement of operations for Class L shares (July 28, 1997) and the account values at the end of the current fiscal year (October 31, 2005) as measured on a quarterly basis. The S&P 500 Index data are measured from the closest month-end to inception date, and not from the Fund’s actual inception date. For purposes of the graph, and unless otherwise indicated, it has been assumed that (a) the maximum applicable front-end sales charge was deducted from the initial $10,000 investment in Class L shares; (b) all recurring fees (including management fees) were deducted; and (c) all dividends and distributions were reinvested. The line graph provides information for Class L shares only. As indicated in the tables above, performance for Class A, B, C, M, and X shares will vary due to the differing charges and expenses applicable to each share class (as indicated in the following paragraphs).
| | |
| | | Visit our website at www.strategicpartners.com |
The S&P 500 Index is an unmanaged index of 500 stocks of large U.S. public companies. It gives a broad look at how stock prices have performed in the United States. The Index’s total returns include the reinvestment of all dividends, but do not include the effects of sales charges, operating expenses of a mutual fund, or taxes. The returns for the Index would be lower if they included the effects of sales charges, operating expenses, or taxes. The securities that comprise the Index may differ substantially from the securities in the Fund. This is not the only index that may be used to characterize performance of sector stock funds. Other indexes may portray different comparative performance. Investors cannot invest directly in an index.
Class A and Class L shares are subject to a maximum front-end sales charge of 5.50% and 5.75% respectively. Class L shares are closed to most new purchases (with the exception of reinvested dividends and purchases by certain college savings plans). Under certain circumstances, Class A and Class L shares may be subject to a contingent deferred sales charge (CDSC) of 1%, in certain circumstances. Class B, Class C, Class M, and Class X shares are subject to a maximum CDSC of 5%, 1%, 6%, and 6% respectively. Class A shares are subject to a 12b-1 fee of up to 0.30% annually. Class B, Class C, Class M, and Class X shares are subject to a 12b-1 fee of 1%. Class L shares are subject to a 12b-1 fee of 0.50%. The returns in the graph and the tables do not reflect the deduction of taxes that a shareholder would pay on Fund distributions or following the redemption of Fund shares.
| | |
| Strategic Partners Mutual Funds, Inc. | | |
Strategic Partners Core Value Fund
Growth of a $10,000 Investment
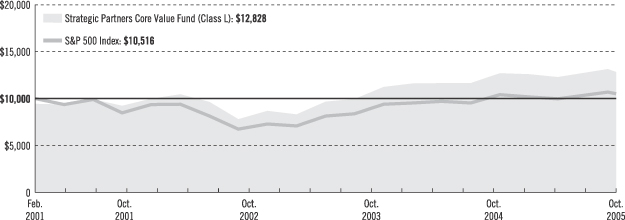
| | | | | | |
| Average Annual Total Returns (With Sales Charges) as of 10/31/05 | | | | | | |
| | | One Year | | | Since Inception | |
Class A | | 3.05 | % | | 2.77 | % |
Class B | | 3.28 | | | 3.30 | |
Class C | | 7.25 | | | 6.08 | |
Class L | | 2.47 | | | 5.48 | |
Class M | | 2.31 | | | 5.97 | |
Class X | | 2.33 | | | 5.80 | |
| | | | | | | |
| Average Annual Total Returns (Without Sales Charges) as of 10/31/05 | | | | | | |
| | | One Year | | | Since Inception | |
Class A | | 9.09 | % | | 6.59 | % |
Class B | | 8.28 | | | 5.81 | |
Class C | | 8.25 | | | 6.30 | |
Class L | | 8.74 | | | 6.82 | |
Class M | | 8.31 | | | 6.32 | |
Class X | | 8.33 | | | 6.32 | |
Performance data quoted represent past performance. Past performance does not guarantee future results. The investment return and principal value of an investment will fluctuate so that an investor’s shares, when redeemed, may be worth more or less than their original cost. Current performance may be lower or higher than the past performance data quoted. An investor may obtain performance data as of the most recent month-end by visiting our website at www.strategicpartners.com or by calling (800) 225-1852. Class A and Class L shares have a maximum initial sales charge of 5.50% and 5.75% respectively. Class L shares are closed to most new purchases (with the exception of reinvested dividends and purchases by certain college savings plans).
Source: Prudential Investments LLC and Lipper Inc.
Inception dates: Class A and Class B, 4/12/04; Class C, Class L, Class M, and Class X, 3/1/01.
The graph compares a $10,000 investment in the Strategic Partners Core Value Fund (Class L shares) with a similar investment in the Standard & Poor’s 500 Composite Stock Price Index (S&P 500 Index) by portraying the initial account values at the commencement of operations for Class L shares (March 1, 2001) and the account values at the end of the current fiscal year (October 31, 2005) as measured on a quarterly basis. The S&P 500 Index data are measured from the closest month-end to inception date, and not from the Fund’s actual inception date. For purposes of the graph, and unless otherwise indicated, it has been assumed that (a) the maximum applicable front-end sales charge was deducted from the initial $10,000 investment in Class L shares; (b) all recurring fees (including management fees) were deducted; and (c) all dividends and distributions were reinvested. The line graph provides information for Class L shares only. As indicated in the tables above, performance for Class A, B, C, M, and X shares will vary due to the differing charges and expenses applicable to each share class (as indicated in the following paragraphs).
| | |
| | | Visit our website at www.strategicpartners.com |
The S&P 500 Index is an unmanaged index of 500 stocks of large U.S. public companies. It gives a broad look at how stock prices have performed in the United States. The Index’s total returns include the reinvestment of all dividends, but do not include the effects of sales charges, operating expenses of a mutual fund, or taxes. The returns for the Index would be lower if they included the effects of sales charges, operating expenses, or taxes. The securities that comprise the Index may differ substantially from the securities in the Fund. This is not the only index that may be used to characterize performance of sector stock funds. Other indexes may portray different comparative performance. Investors cannot invest directly in an index.
Class A and Class L shares are subject to a maximum front-end sales charge of 5.50% and 5.75%, respectively. Class L shares are closed to most new purchases (with the exception of reinvested dividends and purchases by certain college savings plans). Under certain circumstances, Class A and Class L shares may be subject to a contingent deferred sales charge (CDSC) of 1%, in certain circumstances. Class B, Class C, Class M, and Class X shares are subject to a maximum CDSC of 5%, 1%, 6%, and 6%, respectively. Class A shares are subject to a 12b-1 fee of up to 0.30% annually. Class B, Class C, Class M, and Class X shares are subject to a 12b-1 fee of 1%. Class L shares are subject to a 12b-1 fee of 0.50%. The returns in the graph and the tables do not reflect the deduction of taxes that a shareholder would pay on Fund distributions or following the redemption of Fund shares.
| | |
| Strategic Partners Mutual Funds, Inc. | | |
Strategic Partners Large Cap Core Fund
Growth of a $10,000 Investment
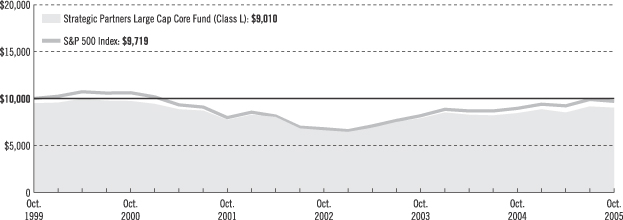
| | | | | | | | | |
| Average Annual Total Returns (With Sales Charges) as of 10/31/05 | | | | |
| | | One Year | | | Five Years | | | Since Inception | |
Class A | | 1.28 | % | | N/A | | | 0.01 | % |
Class B | | 1.34 | | | N/A | | | 0.34 | |
Class C | | 5.47 | | | –1.99 | % | | –1.34 | |
Class L | | 0.74 | | | –2.67 | | | –1.72 | |
Class M | | 0.35 | | | –2.41 | | | –1.68 | |
Class X | | 0.24 | | | –2.65 | | | –1.72 | |
| | | | | | | | | | |
| Average Annual Total Returns (Without Sales Charges) as of 10/31/05 | | | | |
| | | One Year | | | Five Years | | | Since Inception | |
Class A | | 7.20 | % | | N/A | | | 3.68 | % |
Class B | | 6.46 | | | N/A | | | 2.89 | |
Class C | | 6.35 | | | –1.99 | % | | –1.34 | |
Class L | | 6.88 | | | –1.51 | | | –0.87 | |
Class M | | 6.35 | | | –2.01 | | | –1.35 | |
Class X | | 6.36 | | | –2.05 | | | –1.39 | |
Performance data quoted represent past performance. Past performance does not guarantee future results. The investment return and principal value of an investment will fluctuate so that an investor’s shares, when redeemed, may be worth more or less than their original cost. Current performance may be lower or higher than the past performance data quoted. An investor may obtain performance data as of the most recent month-end by visiting our website at www.strategicpartners.com or by calling (800) 225-1852. Class A and Class L shares have a maximum initial sales charge of 5.50% and 5.75% respectively. Class L shares are closed to most new purchases (with the exception of reinvested dividends and purchases by certain college savings plans).
Source: Prudential Investments LLC and Lipper Inc.
Inception dates: Class A and Class B, 4/12/04; Class C, Class L, Class M, and Class X, 11/1/99.
The graph compares a $10,000 investment in the Strategic Partners Large Cap Core Fund (Class L shares) with a similar investment in the Standard & Poor’s 500 Composite Stock Price Index (S&P 500 Index) by portraying the initial account values at the commencement of operations for Class L shares (November 1, 1999) and the account values at the end of the current fiscal year (October 31, 2005) as measured on a quarterly basis. The S&P 500 Index data are measured from the closest month-end to inception date, and not from the Fund’s actual inception date. For purposes of the graph, and unless otherwise indicated, it has been assumed that (a) the maximum applicable front-end sales charge was deducted from the initial $10,000 investment in Class L shares; (b) all recurring fees (including management fees) were deducted; and (c) all dividends and distributions were reinvested. The line graph provides information for Class L shares only. As indicated in the tables above, performance for Class A, B, C, M, and X shares will vary due to the differing charges and expenses applicable to each share class (as indicated in the following paragraphs).
| | |
| | | Visit our website at www.strategicpartners.com |
The S&P 500 Index is an unmanaged index of 500 stocks of large U.S. public companies. It gives a broad look at how stock prices have performed in the United States. The Index’s total returns include the reinvestment of all dividends, but do not include the effects of sales charges, operating expenses of a mutual fund, or taxes. The returns for the Index would be lower if they included the effects of sales charges, operating expenses, or taxes. The securities that comprise the Index may differ substantially from the securities in the Fund. This is not the only index that may be used to characterize performance of sector stock funds. Other indexes may portray different comparative performance. Investors cannot invest directly in an index.
Class A and Class L shares are subject to a maximum front-end sales charge of 5.50% and 5.75% respectively. Class L shares are closed to most new purchases (with the exception of reinvested dividends and purchases by certain college savings plans). Under certain circumstances, Class A and Class L shares may be subject to a contingent deferred sales charge (CDSC) of 1%, in certain circumstances. Class B, Class C, Class M, and Class X shares are subject to a maximum CDSC of 5%, 1%, 6%, and 6% respectively. Class A shares are subject to a 12b-1 fee of up to 0.30% annually. Class B, Class C, Class M, and Class X shares are subject to a 12b-1 fee of 1%. Class L shares are subject to a 12b-1 fee of 0.50%. The returns in the graph and the tables do not reflect the deduction of taxes that a shareholder would pay on Fund distributions or following the redemption of Fund shares.
| | |
| Strategic Partners Mutual Funds, Inc. | | |
Strategic Partners Equity Income Fund
Growth of a $10,000 Investment
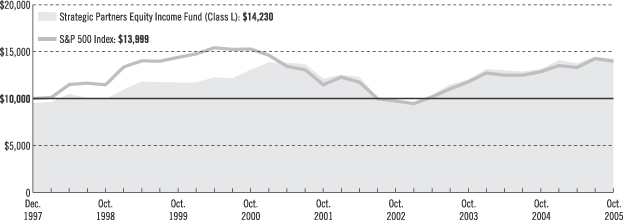
| | | | | | | | | |
| Average Annual Total Returns (With Sales Charges) as of 10/31/05 | |
| | | One Year | | | Five Years | | | Since Inception | |
Class A | | 2.71 | % | | N/A | | | 4.74 | % |
Class B | | 2.77 | | | N/A | | | 4.92 | |
Class C | | 6.70 | | | 1.02 | % | | 4.76 | |
Class L | | 1.98 | | | 0.53 | | | 4.61 | |
Class M | | 1.77 | | | 0.86 | | | 4.92 | |
Class X | | 1.70 | | | 0.67 | | | 4.80 | |
| | | | | | | | | | |
| Average Annual Total Returns (Without Sales Charges) as of 10/31/05 | |
| | | One Year | | | Five Years | | | Since Inception | |
Class A | | 8.72 | % | | N/A | | | 5.50 | % |
Class B | | 7.77 | | | N/A | | | 4.92 | |
Class C | | 7.70 | | | 1.23 | % | | 4.89 | |
Class L | | 8.19 | | | 1.73 | | | 5.40 | |
Class M | | 7.77 | | | 1.24 | | | 4.92 | |
Class X | | 7.70 | | | 1.24 | | | 4.89 | |
Performance data quoted represent past performance. Past performance does not guarantee future results. The investment return and principal value of an investment will fluctuate so that an investor’s shares, when redeemed, may be worth more or less than their original cost. Current performance may be lower or higher than the past performance data quoted. An investor may obtain performance data as of the most recent month-end by visiting our website at www.strategicpartners.com or by calling (800) 225-1852. Class A and Class L shares have a maximum initial sales charge of 5.50% and 5.75% respectively. Class L shares are closed to most new purchases (with the exception of reinvested dividends and purchases by certain college savings plans).
Source: Prudential Investments LLC and Lipper Inc.
Inception dates: Class A and Class B, 4/12/04; Class C, Class L, Class M, and Class X, 12/31/97.
The graph compares a $10,000 investment in the Strategic Partners Equity Income Fund (Class L shares) with a similar investment in the Standard & Poor’s 500 Composite Stock Price Index (S&P 500 Index) by portraying the initial account values at the commencement of operations for Class L shares (December 31, 1997) and the account values at the end of the current fiscal year (October 31, 2005) as measured on a quarterly basis. The S&P 500 Index data are measured from the closest month-end to inception date, and not from the Fund’s actual inception date. For purposes of the graph, and unless otherwise indicated, it has been assumed that (a) the maximum applicable front-end sales charge was deducted from the initial $10,000 investment in Class L shares; (b) all recurring fees (including management fees) were deducted; and (c) all dividends and distributions were reinvested. The line graph provides information for Class L shares only. As indicated in the tables above, performance for Class A, B, C, M, and X shares will vary due to the differing charges and expenses applicable to each share class (as indicated in the following paragraphs).
| | |
| | | Visit our website at www.strategicpartners.com |
The S&P 500 Index is an unmanaged index of 500 stocks of large U.S. public companies. It gives a broad look at how stock prices have performed in the United States. The Index’s total returns include the reinvestment of all dividends, but do not include the effects of sales charges, operating expenses of a mutual fund, or taxes. The returns for the Index would be lower if they included the effects of sales charges, operating expenses, or taxes. The securities that comprise the Index may differ substantially from the securities in the Fund. This is not the only index that may be used to characterize performance of sector stock funds. Other indexes may portray different comparative performance. Investors cannot invest directly in an index.
Class A and Class L shares are subject to a maximum front-end sales charge of 5.50% and 5.75%, respectively. Class L shares are closed to most new purchases (with the exception of reinvested dividends and purchases by certain college savings plans). Under certain circumstances, Class A and Class L shares may be subject to a contingent deferred sales charge (CDSC) of 1%, in certain circumstances. Class B, Class C, Class M, and Class X shares are subject to a maximum CDSC of 5%, 1%, 6%, and 6%, respectively. Class A shares are subject to a 12b-1 fee of up to 0.30% annually. Class B, Class C, Class M, and Class X shares are subject to a 12b-1 fee of 1%. Class L shares are subject to a 12b-1 fee of 0.50%. The returns in the graph and the tables do not reflect the deduction of taxes that a shareholder would pay on Fund distributions or following the redemption of Fund shares.
| | |
| Strategic Partners Mutual Funds, Inc. | | |
Strategic Partners Balanced Fund
Growth of a $10,000 Investment
| | | | | | | | | |
| Average Annual Total Returns (With Sales Charges) as of 10/31/05 | |
| | | One Year | | | Five Years | | | Since Inception | |
Class A | | 0.50 | % | | N/A | | | 4.14 | % |
Class B | | 0.53 | | | N/A | | | 4.28 | |
Class C | | 4.45 | | | 0.96 | % | | 4.27 | |
Class L | | –0.16 | | | 0.27 | | | 4.15 | |
Class M | | –0.47 | | | 0.59 | | | 4.28 | |
Class X | | –0.47 | | | 0.39 | | | 4.27 | |
| | | | | | | | | | |
| Average Annual Total Returns (Without Sales Charges) as of 10/31/05 | |
| | | One Year | | | Five Years | | | Since Inception | |
Class A | | 6.32 | % | | N/A | | | 4.86 | % |
Class B | | 5.53 | | | N/A | | | 4.28 | |
Class C | | 5.45 | | | 0.96 | % | | 4.27 | |
Class L | | 5.95 | | | 1.46 | | | 4.81 | |
Class M | | 5.53 | | | 0.97 | | | 4.28 | |
Class X | | 5.53 | | | 0.97 | | | 4.27 | |
Performance data quoted represent past performance. Past performance does not guarantee future results. The investment return and principal value of an investment will fluctuate so that an investor’s shares, when redeemed, may be worth more or less than their original cost. Current performance may be lower or higher than the past performance data quoted. An investor may obtain performance data as of the most recent month-end by visiting our website at www.jennisondryden.com or by calling (800) 225-1852. Class A and Class L shares have a maximum initial sales charge of 5.50% and 5.75% respectively. Class L shares are closed to most new purchases (with the exception of reinvested dividends and purchases by certain college savings plans).
Source: Prudential Investments LLC and Lipper Inc.
Inception dates: Class A and Class B, 4/12/04; Class C, Class L, Class M, and Class X, 7/28/97.
The graph compares a $10,000 investment in the Strategic Partners Balanced Fund (Class L shares) with a similar investment in the Blended Index by portraying the initial account values at the commencement of operations for Class L shares (July 28, 1997) and the account values at the end of the current fiscal year (October 31, 2005) as measured on a quarterly basis. The Blended Index data are measured from the closest month-end to inception date, and not from the Fund’s actual inception date. For purposes of the graph, and unless otherwise indicated, it has been assumed that (a) the maximum applicable front-end sales charge was deducted from the initial $10,000 investment in Class L shares; (b) all recurring fees (including management fees) were deducted; and (c) all dividends and distributions were reinvested. The line graph provides information for Class L shares only. As indicated in the tables above, performance for Class A, B, C, M, and X shares will vary due to the differing charges and expenses applicable to each share class (as indicated in the following paragraphs).
| | |
| | | Visit our website at www.strategicpartners.com |
The Blended Index is an unmanaged index that is calculated by weighting the S&P 500 Index at 60% and the Lehman Brothers Government/Corporate Bond Index at 40%. The Lehman Brothers Government/Corporate Bond Index is an unmanaged index comprised of intermediate- and long-term government and investment-grade corporate debt securities. The Index’s total returns include the reinvestment of all dividends, but do not include the effects of sales charges, operating expenses of a mutual fund, or taxes. The returns for the Index would be lower if they included the effects of sales charges, operating expenses, or taxes. The securities that comprise the Index may differ substantially from the securities in the Fund. This is not the only index that may be used to characterize performance of balanced stock funds. Other indexes may portray different comparative performance. Investors cannot invest directly in an index.
Class A and Class L shares are subject to a maximum front-end sales charge of 5.50% and 5.75% respectively. Class L shares are closed to most new purchases (with the exception of reinvested dividends and purchases by certain college savings plans). Under certain circumstances, Class A and Class L shares may be subject to a contingent deferred sales charge (CDSC) of 1%, in certain circumstances. Class B, Class C, Class M, and Class X shares are subject to a maximum CDSC of 5%, 1%, 6%, and 6% respectively. Class A shares are subject to a 12b-1 fee of up to 0.30% annually. Class B, Class C, Class M, and Class X shares are subject to a 12b-1 fee of 1%. Class L shares are subject to a 12b-1 fee of 0.50%. The returns in the graph and the tables do not reflect the deduction of taxes that a shareholder would pay on Fund distributions or following the redemption of Fund shares.
| | |
| Strategic Partners Mutual Funds, Inc. | | |
Strategic Partners High Yield Bond Fund
Growth of a $10,000 Investment
| | | | | | | | | |
| Average Annual Total Returns (With Sales Charges) as of 10/31/05 | |
| | | One Year | | | Five Years | | | Since Inception | |
Class A | | –3.03 | % | | N/A | | | 1.87 | % |
Class B | | –3.86 | | | N/A | | | 1.84 | |
Class C | | –0.22 | | | 5.12 | % | | 3.33 | |
Class L | | –2.91 | | | 4.95 | | | 3.45 | |
Class M | | –4.80 | | | 5.04 | | | 3.46 | |
Class X | | –4.81 | | | 4.92 | | | 3.47 | |
| | | | | | | | | | |
| Average Annual Total Returns (Without Sales Charges) as of 10/31/05 | |
| | | One Year | | | Five Years | | | Since Inception | |
Class A | | 1.48 | % | | N/A | | | 4.95 | % |
Class B | | 0.86 | | | N/A | | | 4.27 | |
Class C | | 0.72 | | | 5.33 | % | | 3.45 | |
Class L | | 1.37 | | | 5.88 | | | 3.99 | |
Class M | | 0.85 | | | 5.33 | | | 3.46 | |
Class X | | 0.85 | | | 5.35 | | | 3.47 | |
Performance data quoted represent past performance. Past performance does not guarantee future results. The investment return and principal value of an investment will fluctuate so that an investor’s shares, when redeemed, may be worth more or less than their original cost. Current performance may be lower or higher than the past performance data quoted. An investor may obtain performance data as of the most recent month-end by visiting our website at www.strategicpartners.com or by calling (800) 225-1852. Class A and Class L shares have a maximum initial sales charge of 4.50% and 4.25% respectively. Class L shares are closed to most new purchases (with the exception of reinvested dividends and purchases by certain college savings plans).
Source: Prudential Investments LLC and Lipper Inc.
Inception dates: Class A and Class B, 4/12/04; Class C, Class L, Class M, and Class X, 7/28/97.
The graph compares a $10,000 investment in the Strategic Partners High Yield Bond Fund (Class L shares) with a similar investment in the Merrill Lynch (ML) High Yield Master II Index and the Lehman Brothers U.S. Corporate High Yield Index by portraying the initial account values at the commencement of operations for Class L shares (July 28, 1997) and the account values at the end of the current fiscal year (October 31, 2005) as measured on a quarterly basis. The Merrill Lynch (ML) High Yield Master II Index and the Lehman Brothers U.S. Corporate High Yield Index data are measured from the closest month-end to inception date, and not from the Fund’s actual inception date. For purposes of the graph, and unless otherwise indicated, it has been assumed that (a) the maximum applicable front-end sales charge was deducted from the initial $10,000 investment in Class L shares; (b) all recurring fees (including management fees) were deducted; and (c) all dividends and distributions were reinvested. The line graph provides information for Class L shares only. As indicated in the tables above, performance for Class A, B, C, M, and X shares will vary due to the differing charges and expenses applicable to each share class (as indicated in the following paragraphs).
| | |
| | | Visit our website at www.strategicpartners.com |
The ML High Yield Master II Index is an unmanaged index of publicly traded, nonconvertible U.S. bonds rated below investment grade. The Lehman Brothers U.S. Corporate High Yield Index is an unmanaged index that is generally representative of corporate bonds rated below investment grade. It comprises issues that meet the following criteria: at least $150 million par value outstanding, maximum credit rating of Ba1 or BB+ (including defaulted issues), and at least one year to maturity. It gives a broad look at how bond prices have performed. The Indexes’ total returns include the reinvestment of all dividends, but do not include the effects of sales charges, operating expenses of a mutual fund, or taxes. The returns for the Indexes would be lower if they included the effects of sales charges, operating expenses, or taxes. The securities that comprise the Indexes may differ substantially from the securities in the Fund. These are not the only indexes that may be used to characterize performance of high yield bond funds. Other indexes may portray different comparative performance. Investors cannot invest directly in an index.
Class A and Class L shares are subject to a maximum front-end sales charge of 4.50% and 4.25% respectively. Class L shares are closed to most new purchases (with the exception of reinvested dividends and purchases by certain college savings plans). Under certain circumstances, Class A and Class L shares may be subject to a contingent deferred sales charge (CDSC) of 1%, in certain circumstances. Class B, Class C, Class M, and Class X shares are subject to a maximum CDSC of 5%, 1%, 6%, and 6% respectively. Class A shares are subject to a 12b-1 fee of up to 0.30% annually. Class B, Class C, Class M, and Class X shares are subject to a 12b-1 fee of 1%. Class L shares are subject to a 12b-1 fee of 0.50%. The returns in the graph and the tables do not reflect the deduction of taxes that a shareholder would pay on Fund distributions or following the redemption of Fund shares.
| | |
| Strategic Partners Mutual Funds, Inc. | | |
| | | | |
| n MAIL | | n TELEPHONE | | n WEBSITE |
Gateway Center Three 100 Mulberry Street Newark, NJ 07102 | | (800) 225-1852 | | www.strategicpartners.com |
|
| PROXY VOTING |
The Board of Directors of the Funds has delegated to the Funds’ investment subadvisers the responsibility for voting any proxies and maintaining proxy recordkeeping with respect to the Funds. A description of these proxy voting policies and procedures is available without charge, upon request, by calling (800) 225-1852 or by visiting the Securities and Exchange Commission’s (the Commission) website at www.sec.gov. Information regarding how the Funds voted proxies relating to portfolio securities during the most recent 12-month period ended June 30, 2005, is available on the Funds’ website at www.strategicpartners.com and on the Commission’s website at www.sec.gov. |
|
| DIRECTORS |
Linda W. Bynoe • David E.A. Carson • Robert F. Gunia • Robert E. La Blanc • Douglas H. McCorkindale • Richard A. Redeker • Judy A. Rice • Robin B. Smith • Stephen G. Stoneburn • Clay T. Whitehead |
|
| OFFICERS |
Judy A. Rice, President • Robert F. Gunia, Vice President • Grace C. Torres, Treasurer and Principal Financial and Accounting Officer • Jack Benintende, Acting Treasurer• Deborah A. Docs, Secretary • Jonathan D. Shain, Assistant Secretary •
Claudia DiGiacomo, Assistant Secretary • Marina Belaya, Assistant Secretary • Maryanne Ryan, Anti-Money Laundering Compliance Officer • Lee D. Augsburger, Chief Compliance Officer |
| | | | |
| MANAGER | | Prudential Investments LLC | | Gateway Center Three
100 Mulberry Street
Newark, NJ 07102 |
|
| INVESTMENT SUBADVISERS | | A I M Capital Management, Inc. | | 11 Greenway Plaza
Houston, TX 77046 |
|
| | | Alliance Capital Management, L.P. | | 1345 Avenue of the Americas
New York, NY 10105 |
|
| | | American Century Investment
Management, Inc. | | 4500 Main Street
Kansas City, MO 64111 |
|
| | | Deutsche Asset Management, Inc. | | 345 Park Avenue
New York, NY 10154 |
|
| | | The Dreyfus Corporation | | 200 Park Avenue
New York, NY 10166 |
|
| | | Goldman Sachs Asset Management, L.P. | | 32 Old Slip
New York, NY 10005 |
|
| | | Marsico Capital Management, LLC | | 1200 Seventeenth Street
Suite 1300
Denver, CO 80202 |
|
| | | Neuberger Berman Management Inc. | | 605 Third Avenue
New York, NY 10158 |
|
| | | ProFund Advisors LLC | | 7501 Wisconsin Avenue
Bethesda, MD 20814 |
|
| | | Prudential Investment Management, Inc. | | Gateway Center Two
100 Mulberry Street
Newark, NJ 07102 |
|
| | | RS Investment Management, L.P. | | 388 Market Street
Suite 1700
San Francisco, CA 94111 |
|
| | | Transamerica Asset Management LLC | | 11111 Santa Monica Boulevard
Suite 820
Los Angeles, CA 90025 |
|
| | | T. Rowe Price Associates, Inc. | | 100 East Pratt Street
Baltimore, MD 21202 |
|
| | | Wells Capital Management, Inc. | | 525 Market Street
San Francisco, CA 94105 |
|
| | | William Blair & Company, L.L.C. | | 222 West Adams Street
Chicago, IL 60606 |
| | | | |
| DISTRIBUTORS | | American Skandia Marketing,
Incorporated Prudential Investment Management
Services LLC | | One Corporate Drive
Shelton, CT 06484 Gateway Center Three
100 Mulberry Street
Newark, NJ 07102 |
|
| CUSTODIANS | | PFPC Trust Company | | 400 Bellevue Parkway
Wilmington, DE 19809 |
|
| TRANSFER AGENT | | Prudential Mutual Fund Services LLC | | PO Box 8098
Philadelphia, PA 19176 |
|
| SUB ACCOUNTING AGENT | | PFPC Inc. | | 103 Bellevue Parkway
Wilmington, DE 19809 |
|
| INDEPENDENT REGISTERED PUBLIC ACCOUNTING FIRM | | KPMG LLP | | 345 Park Avenue
New York, NY 10154 |
|
| FUND COUNSEL | | Shearman & Sterling LLP | | 599 Lexington Avenue
New York, NY 10022 |
|
An investor should consider the investment objectives, risks, charges, and expenses of the Funds carefully before investing. The prospectus for the Funds contains this and other information about the Funds. An investor may obtain a prospectus by visiting our website at www.strategicpartners.com or by calling (800) 225-1852. The prospectus should be read carefully before investing. |
|
| E-DELIVERY |
To receive your mutual fund documents on-line, go to www.icsdelivery.com/prudential/funds and enroll. Instead of receiving printed documents by mail, you will receive notification via e-mail when new materials are available. You can cancel your enrollment or change your e-mail address at any time by clicking on the change/cancel enrollment option at the icsdelivery website address. |
|
| SHAREHOLDER COMMUNICATIONS WITH DIRECTORS |
Shareholders can communicate directly with the Board of Directors by writing to the Chair of the Board, Strategic Partners Mutual Funds, Inc., PO Box 13964, Philadelphia, PA 19176. Shareholders can communicate directly with an individual Director by writing to the same address. Communications are not screened before being delivered to the addressee. |
|
| AVAILABILITY OF PORTFOLIO SCHEDULE |
Each Fund files its complete schedule of portfolio holdings with the Securities and Exchange Commission (the Commission) for the first and third quarters of each fiscal year on Form N-Q. The Funds’ Forms N-Q are available on the Commission’s website at www.sec.gov. The Funds’ Forms N-Q may also be reviewed and copied at the Commission’s Public Reference Room in Washington, D.C. Information on the operation and location of the Public Reference Room may be obtained by calling (800) SEC-0330 (732-0330). The Funds will provide a full list of their portfolio holdings on their website (www.strategicpartners.com) as of the end of each month within approximately 30 days after the end of the month. |
|
The Funds’ Statement of Additional Information contains additional information about the Funds’ Directors and is available without charge upon request by calling (800) 225-1852. |
Mutual Funds:
| | | | |
ARE NOT INSURED BY THE FDIC OR ANY
FEDERAL GOVERNMENT AGENCY | | MAY LOSE VALUE | | ARE NOT A DEPOSIT OF OR GUARANTEED BY ANY BANK OR ANY BANK AFFILIATE |

Strategic Partners Mutual Funds, Inc.
MFSP601E IFS-A112586 Ed. 12/2005
Item 2 – Code of Ethics — See Exhibit (a)
As of the end of the period covered by this report, the registrant has adopted a code of ethics (the “Section 406 Standards for Investment Companies – Ethical Standards for Principal Executive and Financial Officers”) that applies to the registrant’s Principal Executive Officer and Principal Financial Officer; the registrant’s Principal Financial Officer also serves as the Principal Accounting Officer.
The registrant hereby undertakes to provide any person, without charge, upon request, a copy of the code of ethics. To request a copy of the code of ethics, contact the registrant 973-367-7521, and ask for a copy of the Section 406 Standards for Investment Companies - Ethical Standards for Principal Executive and Financial Officers.
Item 3 – Audit Committee Financial Expert –
The registrant’s Board has determined that Mr. David Carson, member of the Board’s Audit Committee is an “audit committee financial expert,” and that he is “independent,” for purposes of this Item.
Item 4 – Principal Accountant Fees and Services –
For the fiscal years ended October 31, 2005 and October 31, 2004, KPMG LLP (“KPMG”), the Registrant’s principal accountant, billed the Registrant $333,960 and $354,200, respectively, for professional services rendered for the audit of the Registrant’s annual financial statements or services that are normally provided in connection with statutory and regulatory filings.
None.
None.
None.
| (e) (1) | Audit Committee Pre-Approval Policies and Procedures |
THE PRUDENTIAL MUTUAL FUNDS
AUDIT COMMITTEE POLICY
on
Pre-Approval of Services Provided by the Independent Accountants
The Audit Committee of each Prudential Mutual Fund is charged with the responsibility to monitor the independence of the Fund’s independent accountants. As part of this responsibility, the Audit Committee must pre-approve any independent accounting firm’s engagement to render audit and/or permissible non-audit services, as required by law. In evaluating a proposed engagement of the independent accountants, the Audit Committee will assess the effect that the engagement might reasonably be expected to have on the accountant’s independence. The Committee’s evaluation will be based on:
| | • | | a review of the nature of the professional services expected to be provided, |
| | • | | a review of the safeguards put into place by the accounting firm to safeguard independence, and |
| | • | | periodic meetings with the accounting firm. |
Policy for Audit and Non-Audit Services Provided to the Funds
On an annual basis, the scope of audits for each Fund, audit fees and expenses, and audit-related and non-audit services (and fees proposed in respect thereof) proposed to be performed by the Fund’s independent accountants will be presented by the Treasurer and the independent accountants to the Audit Committee for review and, as appropriate, approval prior to the initiation of such services. Such presentation shall be accompanied by confirmation by both the Treasurer and the independent accountants that the proposed services will not adversely affect the independence of the independent accountants. Proposed services shall be described in sufficient detail to enable the Audit Committee to assess the appropriateness of such services and fees, and the compatibility of the provision of such services with the auditor’s independence. The Committee shall receive periodic reports on the progress of the audit and other services which are approved by the Committee or by the Committee Chair pursuant to authority delegated in this Policy.
The categories of services enumerated under “Audit Services”, “Audit-related Services”, and “Tax Services” are intended to provide guidance to the Treasurer and the independent accountants as to those categories of services which the Committee believes are generally consistent with the independence of the independent accountants and which the Committee (or the Committee Chair) would expect upon the presentation of specific proposals to pre-approve. The enumerated categories are not intended as an exclusive list of audit, audit-related or tax services which the Committee (or the Committee Chair) would consider for pre-approval.
Audit Services
The following categories of audit services are considered to be consistent with the role of the Fund’s independent accountants:
| | • | | Annual Fund financial statement audits |
| | • | | Seed audits (related to new product filings, as required) |
| | • | | SEC and regulatory filings and consents |
Audit-related Services
The following categories of audit-related services are considered to be consistent with the role of the Fund’s independent accountants:
| | • | | Accounting consultations |
| | • | | Fund merger support services |
| | • | | Agreed Upon Procedure Reports |
| | • | | Other Internal Control Reports |
Individual audit-related services that fall within one of these categories and are not presented to the Audit Committee as part of the annual pre-approval process will be subject to pre-approval by the Committee Chair (or any other Committee member on whom this responsibility has been delegated) so long as the estimated fee for those services does not exceed $50,000.
Tax Services
The following categories of tax services are considered to be consistent with the role of the Fund’s independent accountants:
| | • | | Tax compliance services related to the filing or amendment of the following: |
| | • | | Federal, state and local income tax compliance; and, |
| | • | | Sales and use tax compliance |
| | • | | Timely RIC qualification reviews |
| | • | | Tax distribution analysis and planning |
| | • | | Tax authority examination services |
| | • | | Tax appeals support services |
| | • | | Accounting methods studies |
| | • | | Fund merger support services |
| | • | | Tax consulting services and related projects |
Individual tax services that fall within one of these categories and are not presented to the Audit Committee as part of the annual pre-approval process will be subject to pre-approval by the Committee Chair (or any other Committee member on whom this responsibility has been delegated) so long as the estimated fee for those services does not exceed $50,000.
Other Non-audit Services
Certain non-audit services that the independent accountants are legally permitted to render will be subject to pre-approval by the Committee or by one or more Committee members to whom the Committee has delegated this authority and who will report to the full Committee any pre-approval decisions made pursuant to this Policy. Non-audit services presented for pre-approval pursuant to this paragraph will be accompanied by a confirmation from both the Treasurer and the independent accountants that the proposed services will not adversely affect the independence of the independent accountants.
Proscribed Services
The Fund’s independent accountants will not render services in the following categories of non-audit services:
| | • | | Bookkeeping or other services related to the accounting records or financial statements of the Fund |
| | • | | Financial information systems design and implementation |
| | • | | Appraisal or valuation services, fairness opinions, or contribution-in-kind reports |
| | • | | Internal audit outsourcing services |
| | • | | Management functions or human resources |
| | • | | Broker or dealer, investment adviser, or investment banking services |
| | • | | Legal services and expert services unrelated to the audit |
| | • | | Any other service that the Public Company Accounting Oversight Board determines, by regulation, is impermissible. |
Pre-approval of Non-Audit Services Provided to Other Entities Within the Prudential Fund Complex
Certain non-audit services provided to Prudential Investments LLC or any of its affiliates that also provide ongoing services to the Prudential Mutual Funds will be subject to pre-approval by the Audit Committee. The only non-audit services provided to these entities that will require pre-approval are those related directly to the operations and financial reporting of the Funds. Individual projects that are not presented to the Audit Committee as part of the annual pre-approval process, will be subject to pre-approval by the Committee Chair (or any other Committee member on whom this responsibility has been delegated) so long as the estimated fee for those services does not exceed $50,000. Services presented for pre-approval pursuant to this paragraph will be accompanied by a confirmation from both the Treasurer and the independent accountants that the proposed services will not adversely affect the independence of the independent accountants.
Although the Audit Committee will not pre-approve all services provided to Prudential Investments LLC and its affiliates, the Committee will receive an annual report from the Fund’s independent accounting firm showing the aggregate fees for all services provided to Prudential Investments and its affiliates.
| (e) | (2) Percentage of services referred to in 4(b)- (4)(d) that were approved by the audit committee – |
Not applicable.
| (f) | Percentage of hours expended attributable to work performed by other than full time employees of principal accountant if greater than 50%. |
Not applicable.
Not applicable to Registrant for the fiscal years 2005 and 2004. The aggregate non-audit fees billed by KPMG for services rendered to the registrant’s investment adviser and any entity controlling, controlled by, or under common control with the investment adviser that provides ongoing services to the registrant for the fiscal year 2005 was $51,000. The aggregate non-audit fees billed by KPMG for services rendered to the registrant’s investment adviser and any entity controlling, controlled by, or under common control with the investment adviser that provides ongoing services to the registrant for the fiscal year 2004 was $33,500.
| (h) | Principal Accountants Independence |
Not applicable as KPMG has not provided non-audit services to the registrant’s investment adviser and any entity controlling, controlled by, or under common control with the investment adviser that provides ongoing services to the registrant that were not pre-approved pursuant to Rule 2-01(c)(7)(ii) of Regulation S-X.
Item 5 – Audit Committee of Listed Registrants – Not applicable.
Item 6 – Schedule of Investments – The schedule is included as part of the report to shareholders filed under Item 1 of this Form.
Item 7 – Disclosure of Proxy Voting Policies and Procedures for Closed-End Management Investment Companies – Not applicable.
Item 8 – Portfolio Managers of Closed-End Management Investment Companies – Not applicable.
Item 9 – Purchases of Equity Securities by Closed-End Management Investment Company and Affiliated Purchasers – Not applicable.
Item 10 – Submission of Matters to a Vote of Security Holders – Not applicable.
Item 11 – Controls and Procedures
| | (a) | It is the conclusion of the registrant’s principal executive officer and principal financial officer that the effectiveness of the registrant’s current disclosure controls and procedures (such disclosure controls and procedures having been evaluated within 90 days of the date of this filing) provide reasonable assurance that the information required to be disclosed by the registrant has been recorded, processed, summarized and reported within the time period specified in the Commission’s rules and forms and that the information required to be disclosed by the registrant has been accumulated and communicated to the |
| | registrant’s principal executive officer and principal financial officer in order to allow timely decisions regarding required disclosure. |
| | (b) | There has been no significant change in the registrant’s internal control over financial reporting that occurred during the registrant’s most recent fiscal half-year of the period covered by this report that has materially affected, or is likely to materially affect, the registrant’s internal control over financial reporting. |
Item 12 – Exhibits
| | (a) | (1) Code of Ethics – Attached hereto as Exhibit EX-99.CODE-ETH |
| | (2) | Certifications pursuant to Section 302 of the Sarbanes-Oxley Act – Attached hereto as Exhibit EX-99.CERT. |
| | (3) | Any written solicitation to purchase securities under Rule 23c-1. – Not applicable. |
| | (b) | Certifications pursuant to Section 906 of the Sarbanes-Oxley Act – Attached hereto as Exhibit EX-99.906CERT. |
SIGNATURES
Pursuant to the requirements of the Securities Exchange Act of 1934 and the Investment Company Act of 1940, the registrant has duly caused this report to be signed on its behalf by the undersigned, thereunto duly authorized.
| | |
(Registrant) | | Strategic Partners Mutual Funds, Inc. |
| |
| By (Signature and Title)* | | /s/ DEBORAH A. DOCS |
| | | Deborah A. Docs |
| | | Secretary |
Pursuant to the requirements of the Securities Exchange Act of 1934 and the Investment Company Act of 1940, this report has been signed below by the following persons on behalf of the registrant and in the capacities and on the dates indicated.
| | |
| |
| By (Signature and Title)* | | /s/ JUDY A. RICE |
| | | Judy A. Rice |
| | | President and Principal Executive Officer |
| | |
| |
| By (Signature and Title)* | | /s/ JACK BENINTENDE |
| | | Jack Benintende |
| | | Acting Treasurer and Principal Financial Officer |
| * | Print the name and title of each signing officer under his or her signature. |