UNITED STATES
SECURITIES AND EXCHANGE COMMISSION
Washington, D.C. 20549
FORM N-CSR/A
CERTIFIED SHAREHOLDER REPORT OF REGISTERED MANAGEMENT
INVESTMENT COMPANIES
| | |
| Investment Company Act file number: | | 811-08085 |
| |
| Exact name of registrant as specified in charter: | | Strategic Partners Mutual Funds, Inc. |
| |
| Address of principal executive offices: | | Gateway Center 3, 100 Mulberry Street, Newark, New Jersey 07102 |
| |
| Name and address of agent for service: | | Deborah A. Docs Gateway Center 3, 100 Mulberry Street, Newark, New Jersey 07102 |
| |
| Registrant’s telephone number, including area code: | | 973-367-7521 |
| |
| Date of fiscal year end: | | 10/31/2005 |
| |
| Date of reporting period: | | 10/31/2005 |
Item 1 – Reports to Stockholders – [ CORRECTED PAGES FOR REPORT TO STOCKHOLDERS FILED ON FORM
N-CSR ON JANUARY 6, 2006 ARE ATTACHED. CORRECTED PAGES REPLACE THE INDICATED PAGES FROM FORM N-CSR FILED ON JANUARY 6, 2006. ]
Your Fund’s Performance
Strategic Partners International Growth Fund
Fund objective
The investment objective of the Strategic Partners International Growth Fund is to seek long-term growth of capital. There can be no assurance that the Fund will achieve its investment objective.
Performance data quoted represent past performance. Past performance does not guarantee future results. The investment return and principal value of an investment will fluctuate, so that an investor’s shares, when redeemed, may be worth more or less than their original cost. Current performance may be lower or higher than the past performance data quoted. An investor may obtain performance data as of the most recent month-end by visiting our website at www.strategicpartners.com or by calling (800) 225-1852. Class A and Class L shares have a maximum initial sales charge of 5.50% and 5.75% respectively. Class L shares are closed to most new purchases (with the exception of reinvested dividends and purchases by certain college savings plans).
| | | | | | | | | |
| Cumulative Total Returns1 as of 10/31/05 | | | | | | | | | |
| | | One Year | | | Five Years | | | Since Inception2 | |
Class A3 | | 16.76 | % | | N/A | | | 14.32 | % |
Class B4 | | 15.87 | | | N/A | | | 12.93 | |
Class C | | 15.93 | | | –19.05 | % | | 38.10 | |
Class L3 | | 16.52 | | | –16.97 | | | 43.38 | |
Class M4 | | 15.87 | | | –19.10 | | | 37.78 | |
Class X | | 15.96 | | | –19.04 | | | 37.88 | |
MSCI EAFE® Index5 | | 18.09 | | | 16.15 | | | * | |
Lipper International Multi-Cap Growth Funds Avg.5 | | 17.54 | | | 2.22 | | | ** | |
| | | | | | | | | | |
| Average Annual Total Returns1 as of 9/30/05 | | | | | | | | | |
| | | One Year | | | Five Years | | | Since Inception2 | |
Class A3 | | 18.39 | % | | N/A | | | 8.13 | % |
Class B4 | | 19.40 | | | N/A | | | 8.89 | |
Class C | | 23.33 | | | –4.44 | % | | 4.77 | |
Class L3 | | 17.68 | | | –5.09 | | | 4.47 | |
Class M4 | | 18.40 | | | –4.83 | | | 4.74 | |
Class X | | 18.29 | | | –5.01 | | | 4.65 | |
MSCI EAFE® Index5 | | 25.79 | | | 3.16 | | | * | |
Lipper International Multi-Cap Growth Funds Avg.5 | | 25.12 | | | –0.46 | | | ** | |
The cumulative total returns do not reflect the deduction of applicable sales charges. If reflected, the applicable sales charges would reduce the cumulative total return performance quoted. Class A and Class L shares are subject to a maximum front-end sales charge of 5.50% and 5.75% respectively. Class L shares are closed to most new purchases (with the exception of reinvested dividends and purchases by certain college savings plans). Class M shares are also closed to most new purchases (with the exception of reinvested dividends). Class L, Class M, and Class X shares are only exchangeable with Class L, Class M, and Class X shares, respectively, offered by the other Strategic Partners Funds. Under certain circumstances, Class A and Class L shares may be subject to a contingent deferred sales charge (CDSC) of 1%. Class B, Class C, Class M, and Class X shares are subject to a maximum CDSC of 5%, 1%, 6%, and 6% respectively.
1Source: Prudential Investments LLC and Lipper Inc. The average annual total returns do take into account applicable sales charges. The returns in the tables do not reflect the deduction of taxes that a shareholder would pay on Fund distributions or following the redemption of Fund shares. During certain periods shown, fee waivers and/or expense reimbursements were in effect. Without such fee waivers and/or expense reimbursements, the returns for the share classes would have been lower. Without a distribution and service (12b-1) fee waiver of 0.05% for Class A shares, the returns would have been lower. Class A shares are subject to a 12b-1 fee of up to 0.30% annually. Class B, Class C, Class M, and Class X shares are subject to a 12b-1 fee of 1.00%. Class L shares are subject to a 12b-1 fee of 0.50%.
2Inception dates: Class A and Class B, 4/12/04; Class C, Class L, Class M, and Class X, 12/31/97.
3Prior to April 12, 2004, Class L shares were known as Class A shares. On April 12, 2004, Class A shares were redesignated as Class L shares and a new Class A was opened.
4Prior to April 12, 2004, Class M shares were known as Class B shares. On April 12, 2004, Class B shares were redesignated as Class M shares and a new Class B was opened.
Your Fund’s Performance
Strategic Partners Mid Cap Value Fund***
Fund objective
The investment objective of the Strategic Partners Mid Cap Value Fund is to seek capital growth. There can be no assurance that the Fund will achieve its investment objective.
Performance data quoted represent past performance. Past performance does not guarantee future results. The investment return and principal value of an investment will fluctuate, so that an investor’s shares, when redeemed, may be worth more or less than their original cost. Current performance may be lower or higher than the past performance data quoted. An investor may obtain performance data as of the most recent month-end by visiting our website at www.strategicpartners.com or by calling (800) 225-1852. Class A and Class L shares have a maximum initial sales charge of 5.50% and 5.75% respectively. Class L shares are closed to most new purchases (with the exception of reinvested dividends and purchases by certain college savings plans).
| | | | | | | | | |
| Cumulative Total Returns1 as of 10/31/05 | | | | | | | | | |
| | | One Year | | | Five Years | | | Since Inception2 | |
Class A3 | | 16.74 | % | | N/A | | | 19.78 | % |
Class B4 | | 15.85 | | | N/A | | | 18.24 | |
Class C | | 15.75 | | | 52.45 | % | | 125.74 | |
Class L3 | | 16.29 | | | 56.32 | | | 133.79 | |
Class M4 | | 15.75 | | | 52.45 | | | 125.75 | |
Class X | | 15.67 | | | 52.35 | | | 125.13 | |
S&P MidCap 400 Index5 | | 17.65 | | | 42.38 | | | * | |
Lipper Mid-Cap Value Funds Avg.5 | | 14.51 | | | 67.32 | | | ** | |
| | | | | | | | | | |
| Average Annual Total Returns1 as of 9/30/05 | | | | | | | | | |
| | | One Year | | | Five Years | | | Since Inception2 | |
Class A3 | | 17.51 | % | | N/A | | | 13.11 | % |
Class B4 | | 18.29 | | | N/A | | | 13.98 | |
Class C | | 22.26 | | | 10.22 | % | | 13.04 | |
Class L3 | | 16.74 | | | 9.47 | | | 12.65 | |
Class M4 | | 17.26 | | | 9.95 | | | 13.04 | |
Class X | | 17.20 | | | 9.80 | | | 12.94 | |
S&P MidCap 400 Index5 | | 22.16 | | | 7.05 | | | * | |
Lipper Mid-Cap Value Funds Avg.5 | | 20.19 | | | 11.73 | | | ** | |
The cumulative total returns do not reflect the deduction of applicable sales charges. If reflected, the applicable sales charges would reduce the cumulative total return performance quoted. Class A and Class L shares are subject to a maximum front-end sales charge of 5.50% and 5.75% respectively. Class L shares are closed to most new purchases (with the exception of reinvested dividends and purchases by certain college savings plans). Class M shares are also closed to most new purchases (with the exception of reinvested dividends). Class L, Class M, and Class X shares are only exchangeable with Class L, Class M, and Class X shares, respectively, offered by the other Strategic Partners Funds. Under certain circumstances, Class A and Class L shares may be subject to a contingent deferred sales charge (CDSC) of 1%. Class B, Class C, Class M, and Class X shares are subject to a maximum CDSC of 5%, 1%, 6%, and 6% respectively.
1Source: Prudential Investments LLC and Lipper Inc. The average annual total returns do take into account applicable sales charges. The returns in the tables do not reflect the deduction of taxes that a shareholder would pay on Fund distributions or following the redemption of Fund shares. During certain periods shown, fee waivers and/or expense reimbursements were in effect. Without such fee waivers and/or expense reimbursements, the returns for the share classes would have been lower. Without a distribution and service (12b-1) fee waiver of 0.05% for Class A shares, the returns would have been lower. Class A shares are subject to a 12b-1 fee of up to 0.30% annually. Class B, Class C, Class M, and Class X shares are subject to a 12b-1 fee of 1.00%. Class L shares are subject to a 12b-1 fee of 0.50%.
2Inception dates: Class A and Class B, 4/12/04; Class C, Class L, Class M, Class X, 8/19/98, and Class Z, 11/28/05. Returns for Class Z are not shown since the share class had not existed prior to 10/31/05.
3Prior to April 12, 2004, Class L shares were known as Class A shares. On April 12, 2004, Class A shares were redesignated as Class L shares and a new Class A was opened.
4Prior to April 12, 2004, Class M shares were known as Class B shares. On April 12, 2004, Class B shares were redesignated as Class M shares and a new Class B was opened.
Your Fund’s Performance
Strategic Partners Health Sciences Fund
Fund objective
The investment objective of the Strategic Partners Health Sciences Fund is to seek growth. There can be no assurance that the Fund will achieve its investment objective.
Performance data quoted represent past performance. Past performance does not guarantee future results. The investment return and principal value of an investment will fluctuate, so that an investor’s shares, when redeemed, may be worth more or less than their original cost. Current performance may be lower or higher than the past performance data quoted. An investor may obtain performance data as of the most recent month-end by visiting our website at www.strategicpartners.com or by calling (800) 225-1852. Class A and Class L shares have a maximum initial sales charge of 5.50% and 5.75% respectively. Class L shares are closed to most new purchases (with the exception of reinvested dividends and purchases by certain college savings plans).
| | | | | | |
| Cumulative Total Returns1 as of 10/31/05 | | | | | | |
| | | One Year | | | Since Inception2 | |
Class A3 | | 13.04 | % | | 4.92 | % |
Class B4 | | 12.23 | | | 3.56 | |
Class C | | 12.10 | | | 22.30 | |
Class L3 | | 12.62 | | | 24.90 | |
Class M4 | | 12.12 | | | 22.10 | |
Class X | | 12.09 | | | 22.40 | |
S&P 500 Index5 | | 8.72 | | | * | |
Lipper Health/Biotechnology Funds Avg.5 | | 15.03 | | | ** | |
| | | | | | |
| | | | | | | |
| Average Annual Total Returns1 as of 9/30/05 | | | | | | |
| | | One Year | | | Since Inception2 | |
Class A3 | | 8.07 | % | | 0.96 | % |
Class B4 | | 8.43 | | | 1.37 | |
Class C | | 12.39 | | | 5.04 | |
Class L3 | | 7.30 | | | 4.16 | |
Class M4 | | 7.33 | | | 4.62 | |
Class X | | 7.29 | | | 4.49 | |
S&P 500 Index5 | | 12.25 | | | * | |
Lipper Health/Biotechnology Funds Avg.5 | | 15.79 | | | ** | |
The cumulative total returns do not reflect the deduction of applicable sales charges. If reflected, the applicable sales charges would reduce the cumulative total return performance quoted. Class A and Class L shares are subject to a maximum front-end sales charge of 5.50% and 5.75% respectively. Class L shares are closed to most new purchases (with the exception of reinvested dividends and purchases by certain college savings plans). Class M shares are also closed to most new purchases (with the exception of reinvested dividends). Class L, Class M, and Class X shares are only exchangeable with Class L, Class M, and Class X shares, respectively, offered by the other Strategic Partners Funds. Under certain circumstances, Class A and Class L shares may be subject to a contingent deferred sales charge (CDSC) of 1%. Class B, Class C, Class M, and Class X shares are subject to a maximum CDSC of 5%, 1%, 6%, and 6% respectively.
1Source: Prudential Investments LLC and Lipper Inc. The average annual total returns do take into account applicable sales charges. The returns in the tables do not reflect the deduction of taxes that a shareholder would pay on Fund distributions or following the redemption of Fund shares. During certain periods shown, fee waivers and/or expense reimbursements were in effect. Without such fee waivers and/or expense reimbursements, the returns for the share classes would have been lower. Without a distribution and service (12b-1) fee waiver of 0.05% for Class A shares, the returns would have been lower. Class A shares are subject to a 12b-1 fee of up to 0.30% annually. Class B, Class C, Class M, and Class X shares are subject to a 12b-1 fee of 1.00%. Class L shares are subject to a 12b-1 fee of 0.50%.
2Inception dates: Class A and Class B, 4/12/04; Class C, Class L, Class M, and Class X, 3/1/01.
3Prior to April 12, 2004, Class L shares were known as Class A shares. On April 12, 2004, Class A shares were redesignated as Class L shares and a new Class A was opened.
4Prior to April 12, 2004, Class M shares were known as Class B shares. On April 12, 2004, Class B shares were redesignated as Class M shares and a new Class B was opened.
Your Fund’s Performance
Strategic Partners Capital Growth Fund
Fund objective
The investment objective of the Strategic Partners Capital Growth Fund is to seek capital growth. There can be no assurance that the Fund will achieve its investment objective.
Performance data quoted represent past performance. Past performance does not guarantee future results. The investment return and principal value of an investment will fluctuate, so that an investor’s shares, when redeemed, may be worth more or less than their original cost. Current performance may be lower or higher than the past performance data quoted. An investor may obtain performance data as of the most recent month-end by visiting our website at www.strategicpartners.com or by calling (800) 225-1852. Class A and Class L shares have a maximum initial sales charge of 5.50% and 5.75% respectively. Class L shares are closed to most new purchases (with the exception of reinvested dividends and purchases by certain college savings plans).
| | | | | | | | | |
| Cumulative Total Returns1 as of 10/31/05 | | | | | | | | | |
| | | One Year | | | Five Years | | | Since Inception2 | |
Class A3 | | 13.69 | % | | N/A | | | 12.02 | % |
Class B4 | | 12.84 | | | N/A | | | 10.71 | |
Class C | | 12.87 | | | –7.10 | % | | 46.50 | |
Class L3 | | 13.36 | | | –4.77 | | | 52.02 | |
Class M4 | | 12.77 | | | –7.22 | | | 46.60 | |
Class X | | 12.88 | | | –7.11 | | | 46.40 | |
S&P 500 Index5 | | 8.72 | | | –8.38 | | | * | |
Lipper Large-Cap Growth Funds Avg.5 | | 10.06 | | | –29.90 | | | ** | |
| | | | | | | | | | |
| Average Annual Total Returns1 as of 9/30/05 | | | | | | | | | |
| | | One Year | | | Five Years | | | Since Inception2 | |
Class A3 | | 8.26 | % | | N/A | | | 4.84 | % |
Class B4 | | 8.69 | | | N/A | | | 5.46 | |
Class C | | 12.72 | | | –2.61 | % | | 5.70 | |
Class L3 | | 7.70 | | | –3.26 | | | 5.38 | |
Class M4 | | 7.70 | | | –3.00 | | | 5.72 | |
Class X | | 7.73 | | | –3.21 | | | 5.59 | |
S&P 500 Index5 | | 12.25 | | | –1.49 | | | * | |
Lipper Large-Cap Growth Funds Avg.5 | | 12.55 | | | –7.83 | | | ** | |
The cumulative total returns do not reflect the deduction of applicable sales charges. If reflected, the applicable sales charges would reduce the cumulative total return performance quoted. Class A and Class L shares are subject to a maximum front-end sales charge of 5.50% and 5.75% respectively. Class L shares are closed to most new purchases (with the exception of reinvested dividends and purchases by certain college savings plans). Class M shares are also closed to most new purchases (with the exception of reinvested dividends). Class L, Class M, and Class X shares are only exchangeable with Class L, Class M, and Class X shares, respectively, offered by the other Strategic Partners Funds. Under certain circumstances, Class A and Class L shares may be subject to a contingent deferred sales charge (CDSC) of 1%. Class B, Class C, Class M, and Class X shares are subject to a maximum CDSC of 5%, 1%, 6%, and 6% respectively.
1Source: Prudential Investments LLC and Lipper Inc. The average annual total returns do take into account applicable sales charges. The returns in the tables do not reflect the deduction of taxes that a shareholder would pay on Fund distributions or following the redemption of Fund shares. During certain periods shown, fee waivers and/or expense reimbursements were in effect. Without such fee waivers and/or expense reimbursements, the returns for the share classes would have been lower. Without a distribution and service (12b-1) fee waiver of 0.05% for Class A shares, the returns would have been lower. Class A shares are subject to a 12b-1 fee of up to 0.30% annually. Class B, Class C, Class M, and Class X shares are subject to a 12b-1 fee of 1.00%. Class L shares are subject to a 12b-1 fee of 0.50%.
2Inception dates: Class A and Class B, 4/12/04; Class C, Class L, Class M, and Class X, 8/19/98.
3Prior to April 12, 2004, Class L shares were known as Class A shares. On April 12, 2004, Class A shares were redesignated as Class L shares and a new Class A was opened.
4Prior to April 12, 2004, Class M shares were known as Class B shares. On April 12, 2004, Class B shares were redesignated as Class M shares and a new Class B was opened.
Your Fund’s Performance
Strategic Partners Concentrated Growth Fund
Fund objective
The investment objective of the Strategic Partners Concentrated Growth Fund is to seek growth of capital. There can be no assurance that the Fund will achieve its investment objective.
Performance data quoted represent past performance. Past performance does not guarantee future results. The investment return and principal value of an investment will fluctuate, so that an investor’s shares, when redeemed, may be worth more or less than their original cost. Current performance may be lower or higher than the past performance data quoted. An investor may obtain performance data as of the most recent month-end by visiting our website at www.strategicpartners.com or by calling (800) 225-1852. Class A and Class L shares have a maximum initial sales charge of 5.50% and 5.75% respectively. Class L shares are closed to most new purchases (with the exception of reinvested dividends and purchases by certain college savings plans).
| | | | | | | | | |
| Cumulative Total Returns1 as of 10/31/05 | | | | | | | | | |
| | | One Year | | | Five Years | | | Since Inception2 | |
Class A3 | | 4.91 | % | | N/A | | | 1.03 | % |
Class B4 | | 4.14 | | | N/A | | | –0.40 | |
Class C | | 4.15 | | | –50.05 | % | | 0.48 | |
Class L3 | | 4.66 | | | –48.73 | | | 4.86 | |
Class M4 | | 4.14 | | | –50.00 | | | 0.78 | |
Class X | | 4.13 | | | –50.02 | | | 0.88 | |
S&P 500 Index5 | | 8.72 | | | –8.38 | | | * | |
Lipper Large-Cap Growth Funds Avg.5 | | 10.06 | | | –29.90 | | | ** | |
| | | | | | | | | | |
| Average Annual Total Returns1 as of 9/30/05 | | | | | | | | | |
| | | One Year | | | Five Years | | | Since Inception2 | |
Class A3 | | 3.31 | % | | N/A | | | –2.39 | % |
Class B4 | | 3.53 | | | N/A | | | –2.19 | |
Class C | | 7.55 | | | –13.57 | % | | 0.20 | |
Class L3 | | 2.78 | | | –14.15 | | | –0.01 | |
Class M4 | | 2.52 | | | –13.90 | | | 0.24 | |
Class X | | 2.51 | | | –14.09 | | | 0.25 | |
S&P 500 Index5 | | 12.25 | | | –1.49 | | | * | |
Lipper Large-Cap Growth Funds Avg.5 | | 12.55 | | | –7.83 | | | ** | |
The cumulative total returns do not reflect the deduction of applicable sales charges. If reflected, the applicable sales charges would reduce the cumulative total return performance quoted. Class A and Class L shares are subject to a maximum front-end sales charge of 5.50% and 5.75% respectively. Class L shares are closed to most new purchases (with the exception of reinvested dividends and purchases by certain college savings plans). Class M shares are also closed to most new purchases (with the exception of reinvested dividends). Class L, Class M, and Class X shares are only exchangeable with Class L, Class M, and Class X shares, respectively, offered by the other Strategic Partners Funds. Under certain circumstances, Class A and Class L shares may be subject to a contingent deferred sales charge (CDSC) of 1%. Class B, Class C, Class M, and Class X shares are subject to a maximum CDSC of 5%, 1%, 6%, and 6% respectively.
1Source: Prudential Investments LLC and Lipper Inc. The average annual total returns do take into account applicable sales charges. The returns in the tables do not reflect the deduction of taxes that a shareholder would pay on Fund distributions or following the redemption of Fund shares. During certain periods shown, fee waivers and/or expense reimbursements were in effect. Without such fee waivers and/or expense reimbursements, the returns for the share classes would have been lower. Without a distribution and service (12b-1) fee waiver of 0.05% for Class A shares, the returns would have been lower. Class A shares are subject to a 12b-1 fee of up to 0.30% annually. Class B, Class C, Class M, and Class X shares are subject to a 12b-1 fee of 1.00%. Class L shares are subject to a 12b-1 fee of 0.50%.
2Inception dates: Class A and Class B, 4/12/04; Class C, Class L, Class M, and Class X, 7/28/97.
3Prior to April 12, 2004, Class L shares were known as Class A shares. On April 12, 2004, Class A shares were redesignated as Class L shares and a new Class A was opened.
4Prior to April 12, 2004, Class M shares were known as Class B shares. On April 12, 2004, Class B shares were redesignated as Class M shares and a new Class B was opened.
Your Fund’s Performance
Strategic Partners Core Value Fund
Fund objective
The investment objective of the Strategic Partners Core Value Fund is to seek long-term capital growth. There can be no assurance that the Fund will achieve its investment objective.
Performance data quoted represent past performance. Past performance does not guarantee future results. The investment return and principal value of an investment will fluctuate, so that an investor’s shares, when redeemed, may be worth more or less than their original cost. Current performance may be lower or higher than the past performance data quoted. An investor may obtain performance data as of the most recent month-end by visiting our website at www.strategicpartners.com or by calling (800) 225-1852. Class A and Class L shares have a maximum initial sales charge of 5.50% and 5.75% respectively. Class L shares are closed to most new purchases (with the exception of reinvested dividends and purchases by certain college savings plans).
| | | | | | |
| Cumulative Total Returns1 as of 10/31/05 | | | | | | |
| | | One Year | | | Since Inception2 | |
Class A3 | | 9.09 | % | | 10.44 | % |
Class B4 | | 8.28 | | | 9.18 | |
Class C | | 8.25 | | | 33.03 | |
Class L3 | | 8.74 | | | 36.10 | |
Class M4 | | 8.31 | | | 33.12 | |
Class X | | 8.33 | | | 33.13 | |
S&P 500 Index5 | | 8.72 | | | * | |
Lipper Multi-Cap Value Funds Avg.5 | | 11.02 | | | ** | |
| | | | | | | |
| Average Annual Total Returns1 as of 9/30/05 | | | | | | |
| | | One Year | | | Since Inception2 | |
Class A3 | | 7.49 | % | | 4.81 | % |
Class B4 | | 7.88 | | | 5.52 | |
Class C | | 11.76 | | | 7.05 | |
Class L3 | | 6.72 | | | 6.20 | |
Class M4 | | 6.74 | | | 6.72 | |
Class X | | 6.84 | | | 6.55 | |
S&P 500 Index5 | | 12.25 | | | * | |
Lipper Multi-Cap Value Funds Avg.5 | | 15.12 | | | ** | |
The cumulative total returns do not reflect the deduction of applicable sales charges. If reflected, the applicable sales charges would reduce the cumulative total return performance quoted. Class A and Class L shares are subject to a maximum front-end sales charge of 5.50% and 5.75% respectively. Class L shares are closed to most new purchases (with the exception of reinvested dividends and purchases by certain college savings plans). Class M shares are also closed to most new purchases (with the exception of reinvested dividends). Class L, Class M, and Class X shares are only exchangeable with Class L, Class M, and Class X shares, respectively, offered by the other Strategic Partners Funds. Under certain circumstances, Class A and Class L shares may be subject to a contingent deferred sales charge (CDSC) of 1%. Class B, Class C, Class M, and Class X shares are subject to a maximum CDSC of 5%, 1%, 6%, and 6% respectively.
1Source: Prudential Investments LLC and Lipper Inc. The average annual total returns do take into account applicable sales charges. The returns in the tables do not reflect the deduction of taxes that a shareholder would pay on Fund distributions or following the redemption of Fund shares. During certain periods shown, fee waivers and/or expense reimbursements were in effect. Without such fee waivers and/or expense reimbursements, the returns for the share classes would have been lower. Without a distribution and service (12b-1) fee waiver of 0.05% for Class A shares, the returns would have been lower. Class A shares are subject to a 12b-1 fee of up to 0.30% annually. Class B, Class C, Class M, and Class X shares are subject to a 12b-1 fee of 1.00%. Class L shares are subject to a 12b-1 fee of 0.50%.
2Inception dates: Class A and Class B, 4/12/04; Class C, Class L, Class M, and Class X, 3/1/01.
3Prior to April 12, 2004, Class L shares were known as Class A shares. On April 12, 2004, Class A shares were redesignated as Class L shares and a new Class A was opened.
4Prior to April 12, 2004, Class M shares were known as Class B shares. On April 12, 2004, Class B shares were redesignated as Class M shares and a new Class B was opened.
Your Fund’s Performance
Strategic Partners Large Cap Core Fund
Fund objective
The investment objective of the Strategic Partners Large Cap Core Fund is to outperform the Standard & Poor’s 500 Composite Stock Price Index (S&P 500 Index) through stock selection, resulting in different weightings of common stocks relative to the Index. There can be no assurance that the Fund will achieve its investment objective.
Performance data quoted represent past performance. Past performance does not guarantee future results. The investment return and principal value of an investment will fluctuate, so that an investor’s shares, when redeemed, may be worth more or less than their original cost. Current performance may be lower or higher than the past performance data quoted. An investor may obtain performance data as of the most recent month-end by visiting our website at www.strategicpartners.com or by calling (800) 225-1852. Class A and Class L shares have a maximum initial sales charge of 5.50% and 5.75% respectively. Class L shares are closed to most new purchases (with the exception of reinvested dividends and purchases by certain college savings plans).
| | | | | | | | | |
| Cumulative Total Returns1 as of 10/31/05 | | | | | | | | | |
| | | One Year | | | Five Years | | | Since Inception2 | |
Class A3 | | 7.20 | % | | N/A | | | 5.79 | % |
Class B4 | | 6.34 | | | N/A | | | 4.54 | |
Class C | | 6.47 | | | –9.56 | % | | –7.75 | |
Class L3 | | 6.88 | | | –7.34 | | | –5.12 | |
Class M4 | | 6.35 | | | –9.66 | | | –7.85 | |
Class X | | 6.24 | | | –9.85 | | | –8.05 | |
S&P 500 Index5 | | 8.72 | | | –8.38 | | | * | |
Lipper Large-Cap Core Funds Avg.5 | | 8.35 | | | –13.44 | | | ** | |
| | | | | | | | | | |
| Average Annual Total Returns1 as of 9/30/05 | | | | | | | | | |
| | | One Year | | | Five Years | | | Since Inception2 | |
Class A3 | | 4.19 | % | | N/A | | | 1.22 | % |
Class B4 | | 4.31 | | | N/A | | | 1.67 | |
Class C | | 8.57 | | | –1.73 | % | | –1.05 | |
Class L3 | | 3.65 | | | –2.41 | | | –1.57 | |
Class M4 | | 3.57 | | | –2.12 | | | –1.39 | |
Class X | | 3.35 | | | –2.37 | | | –1.44 | |
S&P 500 Index5 | | 12.25 | | | –1.49 | | | * | |
Lipper Large-Cap Core Funds Avg.5 | | 11.54 | | | –2.87 | | | ** | |
The cumulative total returns do not reflect the deduction of applicable sales charges. If reflected, the applicable sales charges would reduce the cumulative total return performance quoted. Class A and Class L shares are subject to a maximum front-end sales charge of 5.50% and 5.75% respectively. Class L shares are closed to most new purchases (with the exception of reinvested dividends and purchases by certain college savings plans). Class M shares are also closed to most new purchases (with the exception of reinvested dividends). Class L, Class M, and Class X shares are only exchangeable with Class L, Class M, and Class X shares, respectively, offered by the other Strategic Partners Funds. Under certain circumstances, Class A and Class L shares may be subject to a contingent deferred sales charge (CDSC) of 1%. Class B, Class C, Class M, and Class X shares are subject to a maximum CDSC of 5%, 1%, 6%, and 6% respectively.
1Source: Prudential Investments LLC and Lipper Inc. The average annual total returns do take into account applicable sales charges. The returns in the tables do not reflect the deduction of taxes that a shareholder would pay on Fund distributions or following the redemption of Fund shares. During certain periods shown, fee waivers and/or expense reimbursements were in effect. Without such fee waivers and/or expense reimbursements, the returns for the share classes would have been lower. Without a distribution and service (12b-1) fee waiver of 0.05% for Class A shares, the returns would have been lower. Class A shares are subject to a 12b-1 fee of up to 0.30% annually. Class B, Class C, Class M, and Class X shares are subject to a 12b-1 fee of 1.00%. Class L shares are subject to a 12b-1 fee of 0.50%.
2Inception dates: Class A and Class B, 4/12/04; Class C, Class L, Class M, and Class X, 11/1/99.
3Prior to April 12, 2004, Class L shares were known as Class A shares. On April 12, 2004, Class A shares were redesignated as Class L shares and a new Class A was opened.
4Prior to April 12, 2004, Class M shares were known as Class B shares. On April 12, 2004, Class B shares were redesignated as Class M shares and a new Class B was opened.
Your Fund’s Performance
Strategic Partners Equity Income Fund
Fund objective
The investment objective of the Strategic Partners Equity Income Fund is long-term growth of capital and income while attempting to avoid excessive fluctuations in market value. There can be no assurance that the Fund will achieve its investment objective.
Performance data quoted represent past performance. Past performance does not guarantee future results. The investment return and principal value of an investment will fluctuate, so that an investor’s shares, when redeemed, may be worth more or less than their original cost. Current performance may be lower or higher than the past performance data quoted. An investor may obtain performance data as of the most recent month-end by visiting our website at www.strategicpartners.com or by calling (800) 225-1852. Class A and Class L shares have a maximum initial sales charge of 5.50% and 5.75% respectively. Class L shares are closed to most new purchases (with the exception of reinvested dividends and purchases by certain college savings plans).
| | | | | | | | | |
| Cumulative Total Returns1 as of 10/31/05 | | | | | | | | | |
| | | One Year | | | Five Years | | | Since Inception2 | |
Class A3 | | 8.72 | % | | N/A | | | 7.07 | % |
Class B4 | | 7.77 | | | N/A | | | 5.59 | |
Class C | | 7.70 | | | 6.29 | % | | 45.39 | |
Class L3 | | 8.19 | | | 8.95 | | | 50.98 | |
Class M4 | | 7.77 | | | 6.36 | | | 45.71 | |
Class X | | 7.70 | | | 6.36 | | | 45.39 | |
S&P 500 Index5 | | 8.72 | | | –8.38 | | | * | |
Lipper Large-Cap Core Funds Avg.5 | | 8.35 | | | –13.44 | | | ** | |
| | | | | | | | | | |
| Average Annual Total Returns1 as of 9/30/05 | | | | | | | | | |
| | | One Year | | | Five Years | | | Since Inception2 | |
Class A3 | | 4.58 | % | | N/A | | | 1.33 | % |
Class B4 | | 4.92 | | | N/A | | | 1.81 | |
Class C | | 8.85 | | | 1.96 | % | | 5.10 | |
Class L3 | | 4.13 | | | 1.26 | | | 4.80 | |
Class M4 | | 3.92 | | | 1.60 | | | 5.12 | |
Class X | | 3.86 | | | 1.40 | | | 5.00 | |
S&P 500 Index5 | | 12.25 | | | –1.49 | | | * | |
Lipper Large-Cap Core Funds Avg.5 | | 11.54 | | | –2.87 | | | ** | |
The cumulative total returns do not reflect the deduction of applicable sales charges. If reflected, the applicable sales charges would reduce the cumulative total return performance quoted. Class A and Class L shares are subject to a maximum front-end sales charge of 5.50% and 5.75% respectively. Class L shares are closed to most new purchases (with the exception of reinvested dividends and purchases by certain college savings plans). Class M shares are also closed to most new purchases (with the exception of reinvested dividends). Class L, Class M, and Class X shares are only exchangeable with Class L, Class M, and Class X shares, respectively, offered by the other Strategic Partners Funds. Under certain circumstances, Class A and Class L shares may be subject to a contingent deferred sales charge (CDSC) of 1%. Class B, Class C, Class M, and Class X shares are subject to a maximum CDSC of 5%, 1%, 6%, and 6% respectively.
1Source: Prudential Investments LLC and Lipper Inc. The average annual total returns do take into account applicable sales charges. The returns in the tables do not reflect the deduction of taxes that a shareholder would pay on Fund distributions or following the redemption of Fund shares. During certain periods shown, fee waivers and/or expense reimbursements were in effect. Without such fee waivers and/or expense reimbursements, the returns for the share classes would have been lower. Without a distribution and service (12b-1) fee waiver of 0.05% for Class A shares, the returns would have been lower. Class A shares are subject to a 12b-1 fee of up to 0.30% annually. Class B, Class C, Class M, and Class X shares are subject to a 12b-1 fee of 1.00%. Class L shares are subject to a 12b-1 fee of 0.50%.
2Inception dates: Class A and Class B, 4/12/04; Class C, Class L, Class M, and Class X, 12/31/97.
3Prior to April 12, 2004, Class L shares were known as Class A shares. On April 12, 2004, Class A shares were redesignated as Class L shares and a new Class A was opened.
4Prior to April 12, 2004, Class M shares were known as Class B shares. On April 12, 2004, Class B shares were redesignated as Class M shares and a new Class B was opened.
Your Fund’s Performance
Strategic Partners Balanced Fund
Fund objective
The investment objective of the Strategic Partners Balanced Fund is to seek capital growth and current income. There can be no assurance that the Fund will achieve its investment objective.
Performance data quoted represent past performance. Past performance does not guarantee future results. The investment return and principal value of an investment will fluctuate, so that an investor’s shares, when redeemed, may be worth more or less than their original cost. Current performance may be lower or higher than the past performance data quoted. An investor may obtain performance data as of the most recent month-end by visiting our website at www.strategicpartners.com or by calling (800) 225-1852. Class A and Class L shares have a maximum initial sales charge of 5.50% and 5.75% respectively. Class L shares are closed to most new purchases (with the exception of reinvested dividends and purchases by certain college savings plans).
| | | | | | | | | |
| Cumulative Total Returns1 as of 10/31/05 | | | | | | | | | |
| | | One Year | | | Five Years | | | Since Inception2 | |
Class A3 | | 6.32 | % | | N/A | | | 7.21 | % |
Class B4 | | 5.53 | | | N/A | | | 6.10 | |
Class C | | 5.45 | | | 4.88 | % | | 41.22 | |
Class L3 | | 5.95 | | | 7.53 | | | 47.36 | |
Class M4 | | 5.53 | | | 4.96 | | | 41.33 | |
Class X | | 5.53 | | | 4.96 | | | 41.21 | |
Blended Index5 | | 5.61 | | | 9.82 | | | * | |
Lipper Balanced Funds Avg.5 | | 6.81 | | | 10.11 | | | ** | |
| | | | | | | | | | |
| Average Annual Total Returns1 as of 9/30/05 | | | | | | | | | |
| | | One Year | | | Five Years | | | Since Inception2 | |
Class A3 | | 3.71 | % | | N/A | | | 2.55 | % |
Class B4 | | 3.95 | | | N/A | | | 3.21 | |
Class C | | 7.96 | | | 1.15 | % | | 4.63 | |
Class L3 | | 3.19 | | | 0.47 | | | 4.41 | |
Class M4 | | 2.87 | | | 0.77 | | | 4.63 | |
Class X | | 2.88 | | | 0.57 | | | 4.62 | |
Blended Index5 | | 8.41 | | | 2.17 | | | * | |
Lipper Balanced Funds Avg.5 | | 9.78 | | | 2.05 | | | ** | |
The cumulative total returns do not reflect the deduction of applicable sales charges. If reflected, the applicable sales charges would reduce the cumulative total return performance quoted. Class A and Class L shares are subject to a maximum front-end sales charge of 5.50% and 5.75% respectively. Class L shares are closed to most new purchases (with the exception of reinvested dividends and purchases by certain college savings plans). Class M shares are also closed to most new purchases (with the exception of reinvested dividends). Class L, Class M, and Class X shares are only exchangeable with Class L, Class M, and Class X shares, respectively, offered by the other Strategic Partners Funds. Under certain circumstances, Class A and Class L shares may be subject to a contingent deferred sales charge (CDSC) of 1%. Class B, Class C, Class M, and Class X shares are subject to a maximum CDSC of 5%, 1%, 6%, and 6% respectively.
1Source: Prudential Investments LLC and Lipper Inc. The average annual total returns do take into account applicable sales charges. The returns in the tables do not reflect the deduction of taxes that a shareholder would pay on Fund distributions or following the redemption of Fund shares. During certain periods shown, fee waivers and/or expense reimbursements were in effect. Without such fee waivers and/or expense reimbursements, the returns for the share classes would have been lower. Without a distribution and service (12b-1) fee waiver of 0.05% for Class A shares, the returns would have been lower. Class A shares are subject to a 12b-1 fee of up to 0.30% annually. Class B, Class C, Class M, and Class X shares are subject to a 12b-1 fee of 1.00%. Class L shares are subject to a 12b-1 fee of 0.50%.
2Inception dates: Class A and Class B, 4/12/04; Class C, Class L, Class M, and Class X, 7/28/97.
3Prior to April 12, 2004, Class L shares were known as Class A shares. On April 12, 2004, Class A shares were redesignated as Class L shares and a new Class A was opened.
4Prior to April 12, 2004, Class M shares were known as Class B shares. On April 12, 2004, Class B shares were redesignated as Class M shares and a new Class B was opened.
Your Fund’s Performance
Strategic Partners High Yield Bond Fund
Fund objective
The investment objective of the Strategic Partners High Yield Bond Fund is to seek a high level of current income and may also consider the potential for capital appreciation. There can be no assurance that the Fund will achieve its investment objective.
Performance data quoted represent past performance. Past performance does not guarantee future results. The investment return and principal value of an investment will fluctuate, so that an investor’s shares, when redeemed, may be worth more or less than their original cost. Current performance may be lower or higher than the past performance data quoted. An investor may obtain performance data as of the most recent month-end by visiting our website at www.strategicpartners.com or by calling (800) 225-1852. Class A and Class L shares have a maximum initial sales charge of 4.50% and 4.25% respectively. Class L shares are closed to most new purchases (with the exception of reinvested dividends and purchases by certain college savings plans).
| | | | | | | | | |
| Cumulative Total Returns1 as of 10/31/05 | | | | | | | | | |
| | | One Year | | | Five Years | | | Since Inception2 | |
Class A3 | | 1.48 | % | | N/A | | | 7.81 | % |
Class B4 | | 0.86 | | | N/A | | | 6.73 | |
Class C | | 0.72 | | | 29.63 | % | | 32.36 | |
Class L3 | | 1.37 | | | 33.07 | | | 38.12 | |
Class M4 | | 0.85 | | | 29.62 | | | 32.41 | |
Class X | | 0.85 | | | 29.79 | | | 32.49 | |
ML High Yield Master II Index5 | | 3.92 | | | 45.12 | | | * | |
Lehman Brothers U.S. Corporate High Yield Index | | 4.08 | | | 47.57 | | | ** | |
Lipper High Current Yield Funds Avg.5 | | 3.25 | | | 36.23 | | | *** | |
| | | | | | | | | | |
| Average Annual Total Returns1 as of 9/30/05 | | | | | | | | | |
| | | One Year | | | Five Years | | | Since Inception2 | |
Class A3 | | –0.13 | % | | N/A | | | 2.80 | % |
Class B4 | | –1.06 | | | N/A | | | 2.79 | |
Class C | | 2.69 | | | 4.79 | % | | 3.65 | |
Class L3 | | –0.12 | | | 4.44 | | | 3.64 | |
Class M4 | | –2.03 | | | 4.50 | | | 3.65 | |
Class X | | –2.03 | | | 4.39 | | | 3.66 | |
ML High Yield Master II Index5 | | 6.70 | | | 7.19 | | | * | |
Lehman Brothers U.S. Corporate High Yield Index | | 6.71 | | | 7.54 | | | ** | |
Lipper High Current Yield Funds Avg.5 | | 6.06 | | | 5.80 | | | *** | |
The cumulative total returns do not reflect the deduction of applicable sales charges. If reflected, the applicable sales charges would reduce the cumulative total return performance quoted. Class A and Class L shares are subject to a maximum front-end sales charge of 4.50% and 4.25% respectively. Class L shares are closed to most new purchases (with the exception of reinvested dividends and purchases by certain college savings plans). Class M shares are also closed to most new purchases (with the exception of reinvested dividends). Class L, Class M, and Class X shares are only exchangeable with Class L, Class M, and Class X shares, respectively, offered by the other Strategic Partners Funds. Under certain circumstances, Class A and Class L shares may be subject to a contingent deferred sales charge (CDSC) of 1%. Class B, Class C, Class M, and Class X shares are subject to a maximum CDSC of 5%, 1%, 6%, and 6% respectively.
1Source: Prudential Investments LLC and Lipper Inc. The average annual total returns do take into account applicable sales charges. The returns in the tables do not reflect the deduction of taxes that a shareholder would pay on Fund distributions or following the redemption of Fund shares. During certain periods shown, fee waivers and/or expense reimbursements were in effect. Without such fee waivers and expense reimbursements, the returns for the share classes would have been lower. Without a distribution and service (12b-1) fee waiver of 0.05% for Class A shares, the returns would have been lower. Class A shares are subject to a 12b-1 fee of up to 0.30% annually. Class B, Class C, Class M, and Class X shares are subject to a 12b-1 fee of 1.00%. Class L shares are subject to a 12b-1 fee of 0.50%.
2Inception dates: Class A and Class B, 4/12/04; Class C, Class L, Class M, and Class X, 7/28/97.
3Prior to April 12, 2004, Class L shares were known as Class A shares. On April 12, 2004, Class A shares were redesignated as Class L shares and a new Class A was opened.
4Prior to April 12, 2004, Class M shares were known as Class B shares. On April 12, 2004, Class B shares were redesignated as Class M shares and a new Class B was opened.
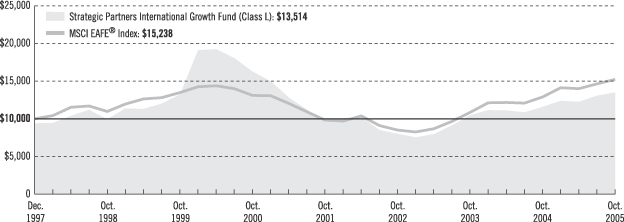
Strategic Partners International Growth Fund
Growth of a $10,000 Investment
| | | | | | | | | |
| Average Annual Total Returns (With Sales Charges) as of 10/31/05 | |
| | | One Year | | | Five Years | | | Since Inception | |
Class A | | 10.34 | % | | N/A | | | 5.07 | % |
Class B | | 10.87 | | | N/A | | | 5.65 | |
Class C | | 14.93 | | | –4.14 | % | | 4.21 | |
Class L | | 9.84 | | | –4.78 | | | 3.92 | |
Class M | | 9.87 | | | –4.52 | | | 4.18 | |
Class X | | 9.96 | | | –4.70 | | | 4.09 | |
| | | | | | | | | | |
| Average Annual Total Returns (Without Sales Charges) as of 10/31/05 | |
| | | One Year | | | Five Years | | | Since Inception | |
Class A | | 16.76 | % | | N/A | | | 8.98 | % |
Class B | | 15.87 | | | N/A | | | 8.13 | |
Class C | | 15.93 | | | –4.14 | % | | 4.21 | |
Class L | | 16.52 | | | –3.65 | | | 4.71 | |
Class M | | 15.87 | | | –4.15 | | | 4.18 | |
Class X | | 15.96 | | | –4.14 | | | 4.19 | |
Performance data quoted represent past performance. Past performance does not guarantee future results. The investment return and principal value of an investment will fluctuate so that an investor’s shares, when redeemed, may be worth more or less than their original cost. Current performance may be lower or higher than the past performance data quoted. An investor may obtain performance data as of the most recent month-end by visiting our website at www.strategicpartners.com or by calling (800) 225-1852. Class A and Class L shares have a maximum initial sales charge of 5.50% and 5.75% respectively. Class L shares are closed to most new purchases (with the exception of reinvested dividends and purchases by certain college savings plans).
Source: Prudential Investments LLC and Lipper Inc.
Inception dates: Class A and Class B, 4/12/04; Class C, Class L, Class M, and Class X, 12/31/97.
The graph compares a $10,000 investment in the Strategic Partners International Growth Fund (Class L shares) with a similar investment in the MSCI EAFE® Index by portraying the initial account values at the commencement of operations of Class A shares (December 31, 1997) and the account values at the end of the current fiscal year (October 31, 2005) as measured on a quarterly basis. For purposes of the graph, and unless otherwise indicated, it has been assumed that (a) the maximum applicable front-end sales charge was deducted from the initial $10,000 investment in Class L shares; (b) all recurring fees (including management fees) were deducted; and (c) all dividends and distributions were reinvested. The line graph provides information for Class L shares only. As indicated in the tables above, performance for Class A, B, C, M, and X shares will vary due to the differing charges and expenses applicable to each share class (as indicated in the following paragraphs).
| | |
| | | Visit our website at www.strategicpartners.com |
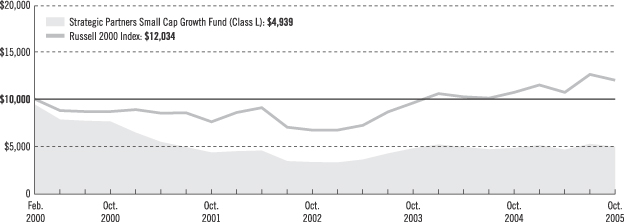
Strategic Partners Small Cap Growth Fund
Growth of a $10,000 Investment
| | | | | | | | | |
| Average Annual Total Returns (With Sales Charges) as of 10/31/05 | |
| | | One Year | | | Five Years | | | Since Inception | |
Class A | | –2.58 | % | | N/A | | | –6.78 | % |
Class B | | –2.57 | | | N/A | | | –7.25 | |
Class C | | 1.41 | | | –8.74 | % | | –11.23 | |
Class L | | –2.96 | | | –9.37 | | | –11.70 | |
Class M | | –3.59 | | | –9.11 | | | –11.55 | |
Class X | | –3.59 | | | –9.29 | | | –11.53 | |
| | | | | | | | | | |
| Average Annual Total Returns (Without Sales Charges) as of 10/31/05 | |
| | | One Year | | | Five Years | | | Since Inception | |
Class A | | 3.13 | % | | N/A | | | –3.38 | % |
Class B | | 2.43 | | | N/A | | | –4.78 | |
Class C | | 2.41 | | | –8.74 | % | | –11.23 | |
Class L | | 2.95 | | | –8.30 | | | –10.78 | |
Class M | | 2.41 | | | –8.74 | | | –11.23 | |
Class X | | 2.41 | | | –8.74 | | | –11.21 | |
Performance data quoted represent past performance. Past performance does not guarantee future results. The investment return and principal value of an investment will fluctuate so that an investor’s shares, when redeemed, may be worth more or less than their original cost. Current performance may be lower or higher than the past performance data quoted. An investor may obtain performance data as of the most recent month-end by visiting our website at www.strategicpartners.com or by calling (800) 225-1852. Class A and Class L shares have a maximum initial sales charge of 5.50% and 5.75% respectively. Class L shares are closed to most new purchases (with the exception of reinvested dividends and purchases by certain college savings plans).
Source: Prudential Investments LLC and Lipper Inc.
Inception dates: Class A and Class B, 4/12/04; Class C, Class L, Class M, and Class X, 7/28/97.
The graph compares a $10,000 investment in the Strategic Partners Small Cap Growth Fund (Class L shares) with a similar investment in the Russell 2000 Index by portraying the initial account values at the commencement of operations for Class L shares (July 28, 1997) and the account values at the end of the current fiscal year (October 31, 2005) as measured on a quarterly basis. The Russell 2000 Index data are measured from the closest month-end to inception date, and not from the Fund’s actual inception date. For purposes of the graph, and unless otherwise indicated, it has been assumed that (a) the maximum applicable front-end sales charge was deducted from the initial $10,000 investment in Class L shares; (b) all recurring fees (including management fees) were deducted; and (c) all dividends and distributions were reinvested. The line graph provides information for Class L shares only. As indicated in the tables above, performance for Class A, B, C, M, and X shares will vary due to the differing charges and expenses applicable to each share class (as indicated in the following paragraphs).
| | |
| | | Visit our website at www.strategicpartners.com |
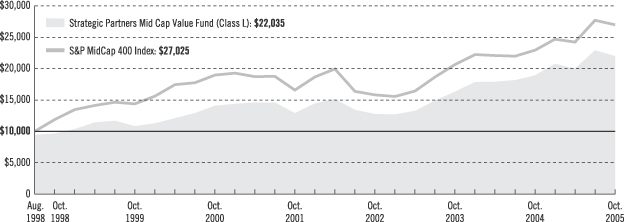
Strategic Partners Mid Cap Value Fund
Growth of a $10,000 Investment
| | | | | | | | | |
| Average Annual Total Returns (With Sales Charges) as of 10/31/05 | |
| | | One Year | | | Five Years | | | Since Inception | |
Class A | | 10.30 | % | | N/A | | | 8.28 | % |
Class B | | 10.85 | | | N/A | | | 8.93 | |
Class C | | 14.75 | | | 8.80 | % | | 11.97 | |
Class L | | 9.59 | | | 8.06 | | | 11.60 | |
Class M | | 9.75 | | | 8.51 | | | 11.97 | |
Class X | | 9.67 | | | 8.35 | | | 11.86 | |
| | | | | | | | | | |
| Average Annual Total Returns (Without Sales Charges) as of 10/31/05 | |
| | | One Year | | | Five Years | | | Since Inception | |
Class A | | 16.74 | % | | N/A | | | 12.30 | % |
Class B | | 15.85 | | | N/A | | | 11.37 | |
Class C | | 15.75 | | | 8.80 | % | | 11.97 | |
Class L | | 16.29 | | | 9.35 | | | 12.52 | |
Class M | | 15.75 | | | 8.80 | | | 11.97 | |
Class X | | 15.67 | | | 8.78 | | | 11.93 | |
Performance data quoted represent past performance. Past performance does not guarantee future results. The investment return and principal value of an investment will fluctuate so that an investor’s shares, when redeemed, may be worth more or less than their original cost. Current performance may be lower or higher than the past performance data quoted. An investor may obtain performance data as of the most recent month-end by visiting our website at www.strategicpartners.com or by calling (800) 225-1852. Class A and Class L shares have a maximum initial sales charge of 5.50% and 5.75% respectively. Class L shares are closed to most new purchases (with the exception of reinvested dividends and purchases by certain college savings plans).
Source: Prudential Investments LLC and Lipper Inc.
Inception dates: Class A and Class B, 4/12/04; Class C, Class L, Class M; Class X, 8/19/98; and Class Z, 11/28/05. Returns for Class Z are not shown since the share class has not existed prior to 10/31/05.
The graph compares a $10,000 investment in the Strategic Partners Mid Cap Value Fund (Class L shares) with a similar investment in the S&P MidCap 400 Index by portraying the initial account values at the commencement of operations of Class L shares (August 19, 1998) and the account values at the end of the current fiscal year (October 31, 2005) as measured on a quarterly basis. For purposes of the graph, and unless otherwise indicated, it has been assumed that (a) the maximum applicable front-end sales charge was deducted from the initial $10,000 investment in Class L shares; (b) all recurring fees (including management fees) were deducted; and (c) all dividends and distributions were reinvested. The line graph provides information for Class L shares only. As indicated in the tables above, performance for Class A, B, C, M, and X shares will vary due to the differing charges and expenses applicable to each share class (as indicated in the following paragraphs).
| | |
| | | Visit our website at www.strategicpartners.com |
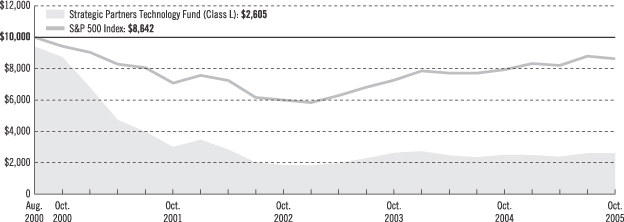
Strategic Partners Technology Fund
Growth of a $10,000 Investment
| | | | | | | | | |
| Average Annual Total Returns (With Sales Charges) as of 10/31/05 | | | | |
| | | One Year | | | Five Years | | | Since Inception | |
Class A | | –1.42 | % | | N/A | | | –6.39 | % |
Class B | | –1.90 | | | N/A | | | –6.18 | |
Class C | | 2.48 | | | –21.96 | % | | –22.61 | |
Class L | | –2.13 | | | –22.43 | | | –23.04 | |
Class M | | –2.51 | | | –22.32 | | | –22.97 | |
Class X | | –2.92 | | | –22.42 | | | –22.92 | |
| | | | | | | | | | |
| Average Annual Total Returns (Without Sales Charges) as of 10/31/05 | | | | |
| | | One Year | | | Five Years | | | Since Inception | |
Class A | | 4.14 | % | | N/A | | | –2.90 | % |
Class B | | 3.10 | | | N/A | | | –3.68 | |
Class C | | 3.48 | | | –21.96 | % | | –22.61 | |
Class L | | 3.76 | | | –21.49 | | | –22.14 | |
Class M | | 3.49 | | | –22.00 | | | –22.67 | |
Class X | | 3.08 | | | –21.95 | | | –22.61 | |
Performance data quoted represent past performance. Past performance does not guarantee future results. The investment return and principal value of an investment will fluctuate so that an investor’s shares, when redeemed, may be worth more or less than their original cost. Current performance may be lower or higher than the past performance data quoted. An investor may obtain performance data as of the most recent month-end by visiting our website at www.strategicpartners.com or by calling (800) 225-1852. Class A and Class L shares have a maximum initial sales charge of 5.50% and 5.75% respectively. Class L shares are closed to most new purchases (with the exception of reinvested dividends and purchases by certain college savings plans).
Source: Prudential Investments LLC and Lipper Inc.
Inception dates: Class A and Class B, 4/12/04; Class C, Class L, Class M, and Class X, 9/11/00.
The graph compares a $10,000 investment in the Strategic Partners Technology Fund (Class L shares) with a similar investment in the Standard & Poor’s 500 Composite Stock Price Index (S&P 500 Index) by portraying the initial account values at the commencement of operations for Class L shares (September 11, 2000) and the account values at the end of the current fiscal year (October 31, 2005) as measured on a quarterly basis. The S&P 500 Index data are measured from the closest month-end to inception date, and not from the Fund’s actual inception date. For purposes of the graph, and unless otherwise indicated, it has been assumed that (a) the maximum applicable front-end sales charge was deducted from the initial $10,000 investment in Class L shares; (b) all recurring fees (including management fees) were deducted; and (c) all dividends and distributions were reinvested. The line graph provides information for Class L shares only. As indicated in the tables above, performance for Class A, B, C, M, and X shares will vary due to the differing charges and expenses applicable to each share class (as indicated in the following paragraphs).
| | |
| | | Visit our website at www.strategicpartners.com |
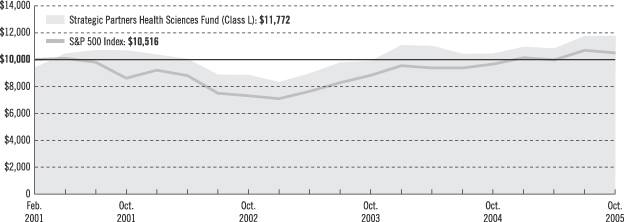
Strategic Partners Health Sciences Fund
Growth of a $10,000 Investment
| | | | | | |
| Average Annual Total Returns (With Sales Charges) as of 10/31/05 | |
| | | One Year | | | Since Inception | |
Class A | | 6.80 | % | | –0.56 | % |
Class B | | 7.23 | | | –0.28 | |
Class C | | 11.10 | | | 4.41 | |
Class L | | 6.12 | | | 3.56 | |
Class M | | 6.12 | | | 4.00 | |
Class X | | 6.09 | | | 3.87 | |
| | | | | | | |
| Average Annual Total Returns (Without Sales Charges) as of 10/31/05 | |
| | | One Year | | | Since Inception | |
Class A | | 13.04 | % | | 3.14 | % |
Class B | | 12.23 | | | 2.28 | |
Class C | | 12.10 | | | 4.41 | |
Class L | | 12.62 | | | 4.88 | |
Class M | | 12.12 | | | 4.37 | |
Class X | | 12.09 | | | 4.42 | |
Performance data quoted represent past performance. Past performance does not guarantee future results. The investment return and principal value of an investment will fluctuate so that an investor’s shares, when redeemed, may be worth more or less than their original cost. Current performance may be lower or higher than the past performance data quoted. An investor may obtain performance data as of the most recent month-end by visiting our website at www.strategicpartners.com or by calling (800) 225-1852. Class A and Class L shares have a maximum initial sales charge of 5.50% and 5.75% respectively. Class L shares are closed to most new purchases (with the exception of reinvested dividends and purchases by certain college savings plans).
Source: Prudential Investments LLC and Lipper Inc.
Inception dates: Class A and Class B, 4/12/04; Class C, Class L, Class M, and Class X, 3/1/01.
The graph compares a $10,000 investment in the Strategic Partners Health Sciences Fund (Class L shares) with a similar investment in the Standard & Poor’s 500 Composite Stock Price Index (S&P 500 Index) by portraying the initial account values at the commencement of operations for Class L shares (March 1, 2001) and the account values at the end of the current fiscal year (October 31, 2005) as measured on a quarterly basis. The S&P 500 Index data are measured from the closest month-end to inception date, and not from the Fund’s actual inception date. For purposes of the graph, and unless otherwise indicated, it has been assumed that (a) the maximum applicable front-end sales charge was deducted from the initial $10,000 investment in Class L shares; (b) all recurring fees (including management fees) were deducted; and (c) all dividends and distributions were reinvested. The line graph provides information for Class L shares only. As indicated in the tables above, performance for Class A, B, C, M, and X shares will vary due to the differing charges and expenses applicable to each share class (as indicated in the following paragraphs).
| | |
| | | Visit our website at www.strategicpartners.com |
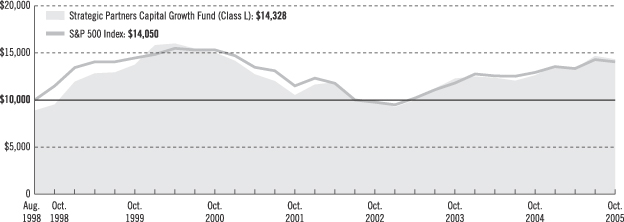
Strategic Partners Capital Growth Fund
Growth of a $10,000 Investment
| | | | | | | | | |
| Average Annual Total Returns (With Sales Charges) as of 10/31/05 | |
| | | One Year | | | Five Years | | | Since Inception | |
Class A | | 7.45 | % | | N/A | | | 3.75 | % |
Class B | | 7.84 | | | N/A | | | 4.26 | |
Class C | | 11.87 | | | –1.46 | % | | 5.45 | |
Class L | | 6.82 | | | –2.13 | | | 5.12 | |
Class M | | 6.77 | | | –1.88 | | | 5.46 | |
Class X | | 6.88 | | | –2.06 | | | 5.34 | |
| | | | | | | | | | |
| Average Annual Total Returns (Without Sales Charges) as of 10/31/05 | |
| | | One Year | | | Five Years | | | Since Inception | |
Class A | | 13.69 | % | | N/A | | | 7.57 | % |
Class B | | 12.84 | | | N/A | | | 6.76 | |
Class C | | 12.87 | | | –1.46 | % | | 5.45 | |
Class L | | 13.36 | | | –0.97 | | | 5.99 | |
Class M | | 12.77 | | | –1.49 | | | 5.46 | |
Class X | | 12.88 | | | –1.46 | | | 5.44 | |
Performance data quoted represent past performance. Past performance does not guarantee future results. The investment return and principal value of an investment will fluctuate so that an investor’s shares, when redeemed, may be worth more or less than their original cost. Current performance may be lower or higher than the past performance data quoted. An investor may obtain performance data as of the most recent month-end by visiting our website at www.strategicpartners.com or by calling (800) 225-1852. Class A and Class L shares have a maximum initial sales charge of 5.50% and 5.75% respectively. Class L shares are closed to most new purchases (with the exception of reinvested dividends and purchases by certain college savings plans).
Source: Prudential Investments LLC and Lipper Inc.
Inception dates: Class A and Class B, 4/12/04; Class C, Class L, Class M, and Class X, 8/19/98.
The graph compares a $10,000 investment in the Strategic Partners Capital Growth Fund (Class L shares) with a similar investment in the Standard & Poor’s 500 Composite Stock Price Index (S&P 500 Index) by portraying the initial account values at the commencement of operations for Class L shares (8/19/98) and the account values at the end of the current fiscal year (October 31, 2005) as measured on a quarterly basis. The S&P 500 Index data are measured from the closest month-end to inception date, and not from the Fund’s actual inception date. For purposes of the graph, and unless otherwise indicated, it has been assumed that (a) the maximum applicable front-end sales charge was deducted from the initial $10,000 investment in Class L shares; (b) all recurring fees (including management fees) were deducted; and (c) all dividends and distributions were reinvested. The line graph provides information for Class L shares only. As indicated in the tables above, performance for Class A, B, C, M and X shares will vary due to the differing charges and expenses applicable to each share class (as indicated in the following paragraphs).
| | |
| | | Visit our website at www.strategicpartners.com |
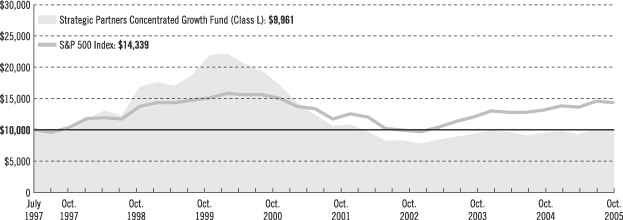
Strategic Partners Concentrated Growth Fund
Growth of a $10,000 Investment
| | | | | | | | | |
| Average Annual Total Returns (With Sales Charges) as of 10/31/05 | |
| | | One Year | | | Five Years | | | Since Inception | |
Class A | | –0.84 | % | | N/A | | | –2.95 | % |
Class B | | –0.86 | | | N/A | | | –2.84 | |
Class C | | 3.15 | | | –12.96 | % | | 0.06 | |
Class L | | –1.35 | | | –13.54 | | | –0.14 | |
Class M | | –1.86 | | | –13.30 | | | 0.09 | |
Class X | | –1.87 | | | –13.48 | | | 0.11 | |
| | | | | | | | | | |
| Average Annual Total Returns (Without Sales Charges) as of 10/31/05 | |
| | | One Year | | | Five Years | | | Since Inception | |
Class A | | 4.91 | % | | N/A | | | 0.66 | % |
Class B | | 4.14 | | | N/A | | | –0.25 | |
Class C | | 4.15 | | | –12.96 | % | | 0.06 | |
Class L | | 4.66 | | | –12.51 | | | 0.58 | |
Class M | | 4.14 | | | –12.94 | | | 0.09 | |
Class X | | 4.13 | | | –12.95 | | | 0.11 | |
Performance data quoted represent past performance. Past performance does not guarantee future results. The investment return and principal value of an investment will fluctuate so that an investor’s shares, when redeemed, may be worth more or less than their original cost. Current performance may be lower or higher than the past performance data quoted. An investor may obtain performance data as of the most recent month-end by visiting our website at www.strategicpartners.com or by calling (800) 225-1852. Class A and Class L shares have a maximum initial sales charge of 5.50% and 5.75% respectively. Class L shares are closed to most new purchases (with the exception of reinvested dividends and purchases by certain college savings plans).
Source: Prudential Investments LLC and Lipper Inc.
Inception dates: Class A and Class B, 4/12/04; Class C, Class L, Class M, and Class X, 7/28/97.
The graph compares a $10,000 investment in the Strategic Partners Concentrated Growth Fund (Class L shares) with a similar investment in the Standard & Poor’s 500 Composite Stock Price Index (S&P 500 Index) by portraying the initial account values at the commencement of operations for Class L shares (July 28, 1997) and the account values at the end of the current fiscal year (October 31, 2005) as measured on a quarterly basis. The S&P 500 Index data are measured from the closest month-end to inception date, and not from the Fund’s actual inception date. For purposes of the graph, and unless otherwise indicated, it has been assumed that (a) the maximum applicable front-end sales charge was deducted from the initial $10,000 investment in Class L shares; (b) all recurring fees (including management fees) were deducted; and (c) all dividends and distributions were reinvested. The line graph provides information for Class L shares only. As indicated in the tables above, performance for Class A, B, C, M, and X shares will vary due to the differing charges and expenses applicable to each share class (as indicated in the following paragraphs).
| | |
| | | Visit our website at www.strategicpartners.com |
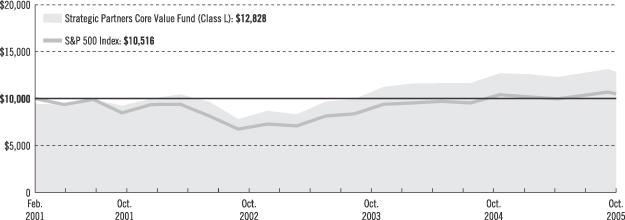
Strategic Partners Core Value Fund
Growth of a $10,000 Investment
| | | | | | |
| Average Annual Total Returns (With Sales Charges) as of 10/31/05 | | | | | | |
| | | One Year | | | Since Inception | |
Class A | | 3.05 | % | | 2.77 | % |
Class B | | 3.28 | | | 3.30 | |
Class C | | 7.25 | | | 6.30 | |
Class L | | 2.47 | | | 5.48 | |
Class M | | 2.31 | | | 5.97 | |
Class X | | 2.33 | | | 5.80 | |
| | | | | | | |
| Average Annual Total Returns (Without Sales Charges) as of 10/31/05 | | | | | | |
| | | One Year | | | Since Inception | |
Class A | | 9.09 | % | | 6.59 | % |
Class B | | 8.28 | | | 5.81 | |
Class C | | 8.25 | | | 6.30 | |
Class L | | 8.74 | | | 6.82 | |
Class M | | 8.31 | | | 6.32 | |
Class X | | 8.33 | | | 6.32 | |
Performance data quoted represent past performance. Past performance does not guarantee future results. The investment return and principal value of an investment will fluctuate so that an investor’s shares, when redeemed, may be worth more or less than their original cost. Current performance may be lower or higher than the past performance data quoted. An investor may obtain performance data as of the most recent month-end by visiting our website at www.strategicpartners.com or by calling (800) 225-1852. Class A and Class L shares have a maximum initial sales charge of 5.50% and 5.75% respectively. Class L shares are closed to most new purchases (with the exception of reinvested dividends and purchases by certain college savings plans).
Source: Prudential Investments LLC and Lipper Inc.
Inception dates: Class A and Class B, 4/12/04; Class C, Class L, Class M, and Class X, 3/1/01.
The graph compares a $10,000 investment in the Strategic Partners Core Value Fund (Class L shares) with a similar investment in the Standard & Poor’s 500 Composite Stock Price Index (S&P 500 Index) by portraying the initial account values at the commencement of operations for Class L shares (March 1, 2001) and the account values at the end of the current fiscal year (October 31, 2005) as measured on a quarterly basis. The S&P 500 Index data are measured from the closest month-end to inception date, and not from the Fund’s actual inception date. For purposes of the graph, and unless otherwise indicated, it has been assumed that (a) the maximum applicable front-end sales charge was deducted from the initial $10,000 investment in Class L shares; (b) all recurring fees (including management fees) were deducted; and (c) all dividends and distributions were reinvested. The line graph provides information for Class L shares only. As indicated in the tables above, performance for Class A, B, C, M, and X shares will vary due to the differing charges and expenses applicable to each share class (as indicated in the following paragraphs).
| | |
| | | Visit our website at www.strategicpartners.com |
Strategic Partners Large Cap Core Fund
Growth of a $10,000 Investment
| | | | | | | | | |
| Average Annual Total Returns (With Sales Charges) as of 10/31/05 | | | | |
| | | One Year | | | Five Years | | | Since Inception | |
Class A | | 1.28 | % | | N/A | | | 0.01 | % |
Class B | | 1.34 | | | N/A | | | 0.34 | |
Class C | | 5.47 | | | –1.99 | % | | –1.34 | |
Class L | | 0.74 | | | –2.67 | | | –1.84 | |
Class M | | 0.35 | | | –2.41 | | | –1.68 | |
Class X | | 0.24 | | | –2.65 | | | –1.72 | |
| | | | | | | | | | |
| Average Annual Total Returns (Without Sales Charges) as of 10/31/05 | | | | |
| | | One Year | | | Five Years | | | Since Inception | |
Class A | | 7.20 | % | | N/A | | | 3.68 | % |
Class B | | 6.46 | | | N/A | | | 2.89 | |
Class C | | 6.35 | | | –1.99 | % | | –1.34 | |
Class L | | 6.88 | | | –1.51 | | | –0.87 | |
Class M | | 6.35 | | | –2.01 | | | –1.35 | |
Class X | | 6.36 | | | –2.05 | | | –1.39 | |
Performance data quoted represent past performance. Past performance does not guarantee future results. The investment return and principal value of an investment will fluctuate so that an investor’s shares, when redeemed, may be worth more or less than their original cost. Current performance may be lower or higher than the past performance data quoted. An investor may obtain performance data as of the most recent month-end by visiting our website at www.strategicpartners.com or by calling (800) 225-1852. Class A and Class L shares have a maximum initial sales charge of 5.50% and 5.75% respectively. Class L shares are closed to most new purchases (with the exception of reinvested dividends and purchases by certain college savings plans).
Source: Prudential Investments LLC and Lipper Inc.
Inception dates: Class A and Class B, 4/12/04; Class C, Class L, Class M, and Class X, 11/1/99.
The graph compares a $10,000 investment in the Strategic Partners Large Cap Core Fund (Class L shares) with a similar investment in the Standard & Poor’s 500 Composite Stock Price Index (S&P 500 Index) by portraying the initial account values at the commencement of operations for Class L shares (November 1, 1999) and the account values at the end of the current fiscal year (October 31, 2005) as measured on a quarterly basis. The S&P 500 Index data are measured from the closest month-end to inception date, and not from the Fund’s actual inception date. For purposes of the graph, and unless otherwise indicated, it has been assumed that (a) the maximum applicable front-end sales charge was deducted from the initial $10,000 investment in Class L shares; (b) all recurring fees (including management fees) were deducted; and (c) all dividends and distributions were reinvested. The line graph provides information for Class L shares only. As indicated in the tables above, performance for Class A, B, C, M, and X shares will vary due to the differing charges and expenses applicable to each share class (as indicated in the following paragraphs).
| | |
| | | Visit our website at www.strategicpartners.com |
Strategic Partners Equity Income Fund
Growth of a $10,000 Investment
| | | | | | | | | |
| Average Annual Total Returns (With Sales Charges) as of 10/31/05 | |
| | | One Year | | | Five Years | | | Since Inception | |
Class A | | 2.71 | % | | N/A | | | 0.75 | % |
Class B | | 2.77 | | | N/A | | | 1.02 | |
Class C | | 6.70 | | | 1.23 | % | | 4.89 | |
Class L | | 1.98 | | | 0.53 | | | 4.61 | |
Class M | | 1.77 | | | 0.86 | | | 4.92 | |
Class X | | 1.70 | | | 0.67 | | | 4.80 | |
| | | | | | | | | | |
| Average Annual Total Returns (Without Sales Charges) as of 10/31/05 | |
| | | One Year | | | Five Years | | | Since Inception | |
Class A | | 8.72 | % | | N/A | | | 4.49 | % |
Class B | | 7.77 | | | N/A | | | 3.56 | |
Class C | | 7.70 | | | 1.23 | % | | 4.89 | |
Class L | | 8.19 | | | 1.73 | | | 5.40 | |
Class M | | 7.77 | | | 1.24 | | | 4.92 | |
Class X | | 7.70 | | | 1.24 | | | 4.89 | |
Performance data quoted represent past performance. Past performance does not guarantee future results. The investment return and principal value of an investment will fluctuate so that an investor’s shares, when redeemed, may be worth more or less than their original cost. Current performance may be lower or higher than the past performance data quoted. An investor may obtain performance data as of the most recent month-end by visiting our website at www.strategicpartners.com or by calling (800) 225-1852. Class A and Class L shares have a maximum initial sales charge of 5.50% and 5.75% respectively. Class L shares are closed to most new purchases (with the exception of reinvested dividends and purchases by certain college savings plans).
Source: Prudential Investments LLC and Lipper Inc.
Inception dates: Class A and Class B, 4/12/04; Class C, Class L, Class M, and Class X, 12/31/97.
The graph compares a $10,000 investment in the Strategic Partners Equity Income Fund (Class L shares) with a similar investment in the Standard & Poor’s 500 Composite Stock Price Index (S&P 500 Index) by portraying the initial account values at the commencement of operations for Class L shares (December 31, 1997) and the account values at the end of the current fiscal year (October 31, 2005) as measured on a quarterly basis. The S&P 500 Index data are measured from the closest month-end to inception date, and not from the Fund’s actual inception date. For purposes of the graph, and unless otherwise indicated, it has been assumed that (a) the maximum applicable front-end sales charge was deducted from the initial $10,000 investment in Class L shares; (b) all recurring fees (including management fees) were deducted; and (c) all dividends and distributions were reinvested. The line graph provides information for Class L shares only. As indicated in the tables above, performance for Class A, B, C, M, and X shares will vary due to the differing charges and expenses applicable to each share class (as indicated in the following paragraphs).
| | |
| | | Visit our website at www.strategicpartners.com |
Strategic Partners Balanced Fund
Growth of a $10,000 Investment
| | | | | | | | | |
| Average Annual Total Returns (With Sales Charges) as of 10/31/05 | |
| | | One Year | | | Five Years | | | Since Inception | |
Class A | | 0.50 | % | | N/A | | | 0.84 | % |
Class B | | 0.53 | | | N/A | | | 1.35 | |
Class C | | 4.45 | | | 0.96 | % | | 4.27 | |
Class L | | –0.16 | | | 0.27 | | | 4.06 | |
Class M | | –0.47 | | | 0.59 | | | 4.28 | |
Class X | | –0.47 | | | 0.39 | | | 4.27 | |
| | | | | | | | | | |
| Average Annual Total Returns (Without Sales Charges) as of 10/31/05 | |
| | | One Year | | | Five Years | | | Since Inception | |
Class A | | 6.32 | % | | N/A | | | 4.58 | % |
Class B | | 5.53 | | | N/A | | | 3.88 | |
Class C | | 5.45 | | | 0.96 | % | | 4.27 | |
Class L | | 5.95 | | | 1.46 | | | 4.81 | |
Class M | | 5.53 | | | 0.97 | | | 4.28 | |
Class X | | 5.53 | | | 0.97 | | | 4.27 | |
Performance data quoted represent past performance. Past performance does not guarantee future results. The investment return and principal value of an investment will fluctuate so that an investor’s shares, when redeemed, may be worth more or less than their original cost. Current performance may be lower or higher than the past performance data quoted. An investor may obtain performance data as of the most recent month-end by visiting our website at www.jennisondryden.com or by calling (800) 225-1852. Class A and Class L shares have a maximum initial sales charge of 5.50% and 5.75% respectively. Class L shares are closed to most new purchases (with the exception of reinvested dividends and purchases by certain college savings plans).
Source: Prudential Investments LLC and Lipper Inc.
Inception dates: Class A and Class B, 4/12/04; Class C, Class L, Class M, and Class X, 7/28/97.
The graph compares a $10,000 investment in the Strategic Partners Balanced Fund (Class L shares) with a similar investment in the Blended Index by portraying the initial account values at the commencement of operations for Class L shares (July 28, 1997) and the account values at the end of the current fiscal year (October 31, 2005) as measured on a quarterly basis. The Blended Index data are measured from the closest month-end to inception date, and not from the Fund’s actual inception date. For purposes of the graph, and unless otherwise indicated, it has been assumed that (a) the maximum applicable front-end sales charge was deducted from the initial $10,000 investment in Class L shares; (b) all recurring fees (including management fees) were deducted; and (c) all dividends and distributions were reinvested. The line graph provides information for Class L shares only. As indicated in the tables above, performance for Class A, B, C, M, and X shares will vary due to the differing charges and expenses applicable to each share class (as indicated in the following paragraphs).
| | |
| | | Visit our website at www.strategicpartners.com |
Strategic Partners High Yield Bond Fund
Growth of a $10,000 Investment
| | | | | | | | | |
| Average Annual Total Returns (With Sales Charges) as of 10/31/05 | |
| | | One Year | | | Five Years | | | Since Inception | |
Class A | | –3.03 | % | | N/A | | | 1.87 | % |
Class B | | –3.86 | | | N/A | | | 1.84 | |
Class C | | –0.22 | | | 5.33 | % | | 3.45 | |
Class L | | –2.91 | | | 4.95 | | | 3.45 | |
Class M | | –4.80 | | | 5.04 | | | 3.46 | |
Class X | | –4.81 | | | 4.92 | | | 3.47 | |
| | | | | | | | | | |
| Average Annual Total Returns (Without Sales Charges) as of 10/31/05 | |
| | | One Year | | | Five Years | | | Since Inception | |
Class A | | 1.48 | % | | N/A | | | 4.95 | % |
Class B | | 0.86 | | | N/A | | | 4.27 | |
Class C | | 0.72 | | | 5.33 | % | | 3.45 | |
Class L | | 1.37 | | | 5.88 | | | 3.99 | |
Class M | | 0.85 | | | 5.33 | | | 3.46 | |
Class X | | 0.85 | | | 5.35 | | | 3.47 | |
Performance data quoted represent past performance. Past performance does not guarantee future results. The investment return and principal value of an investment will fluctuate so that an investor’s shares, when redeemed, may be worth more or less than their original cost. Current performance may be lower or higher than the past performance data quoted. An investor may obtain performance data as of the most recent month-end by visiting our website at www.strategicpartners.com or by calling (800) 225-1852. Class A and Class L shares have a maximum initial sales charge of 4.50% and 4.25% respectively. Class L shares are closed to most new purchases (with the exception of reinvested dividends and purchases by certain college savings plans).
Source: Prudential Investments LLC and Lipper Inc.
Inception dates: Class A and Class B, 4/12/04; Class C, Class L, Class M, and Class X, 7/28/97.
The graph compares a $10,000 investment in the Strategic Partners High Yield Bond Fund (Class L shares) with a similar investment in the Merrill Lynch (ML) High Yield Master II Index and the Lehman Brothers U.S. Corporate High Yield Index by portraying the initial account values at the commencement of operations for Class L shares (July 28, 1997) and the account values at the end of the current fiscal year (October 31, 2005) as measured on a quarterly basis. The Merrill Lynch (ML) High Yield Master II Index and the Lehman Brothers U.S. Corporate High Yield Index data are measured from the closest month-end to inception date, and not from the Fund’s actual inception date. For purposes of the graph, and unless otherwise indicated, it has been assumed that (a) the maximum applicable front-end sales charge was deducted from the initial $10,000 investment in Class L shares; (b) all recurring fees (including management fees) were deducted; and (c) all dividends and distributions were reinvested. The line graph provides information for Class L shares only. As indicated in the tables above, performance for Class A, B, C, M, and X shares will vary due to the differing charges and expenses applicable to each share class (as indicated in the following paragraphs).
| | |
| | | Visit our website at www.strategicpartners.com |
Item 11—Controls and Procedures
(a) The accounting agent has implemented appropriate enhancements to its controls and procedures with respect to data prepared by them.
SIGNATURES
Pursuant to the requirements of the Securities Exchange Act of 1934 and the Investment Company Act of 1940, the registrant has duly caused this report to be signed on its behalf by the undersigned, thereunto duly authorized.
(Registrant) Strategic Partners Mutual Funds, Inc.
| | |
| By (Signature and Title)* | | /s/ Deborah A. Docs |
| | Deborah A. Docs |
| | Secretary |
Date March 30, 2006
Pursuant to the requirements of the Securities Exchange Act of 1934 and the Investment Company Act of 1940, this report has been signed below by the following persons on behalf of the registrant and in the capacities and on the dates indicated.
| | |
| By (Signature and Title)* | | /s/ Judy A. Rice |
| | Judy A. Rice |
| | President and Principal Executive Officer |
Date March 30, 2006
| | |
| By (Signature and Title)* | | /s/ Grace C. Torres |
| | Grace C. Torres |
| | Treasurer and Principal Financial Officer |
Date March 30, 2006
| * | Print the name and title of each signing officer under his or her signature. |