UNITED STATES
SECURITIES AND EXCHANGE COMMISSION
Washington, D.C. 20549
FORM N-CSR
CERTIFIED SHAREHOLDER REPORT OF REGISTERED MANAGEMENT
INVESTMENT COMPANIES
| | |
| Investment Company Act file number: | | 811-08085 |
| |
| Exact name of registrant as specified in charter: | | Strategic Partners Mutual |
| | Funds, Inc. |
| |
| Address of principal executive offices: | | Gateway Center 3, |
| | 100 Mulberry Street, |
| | Newark, New Jersey 07102 |
| |
| Name and address of agent for service: | | Deborah A. Docs |
| | Gateway Center 3, |
| | 100 Mulberry Street, |
| | Newark, New Jersey 07102 |
| |
| Registrant’s telephone number, including area code: | | 800-225-1852 |
| |
| Date of fiscal year end: | | 10/31/2007 |
| |
| Date of reporting period: | | 10/31/2007 |
Item 1 – Reports to Stockholders


(Formerly known as Strategic Partners Mid Cap Value Fund)
| | |
| OCTOBER 31, 2007 | | ANNUAL REPORT |
Dryden Mid Cap Value Fund
FUND TYPE
Small/Mid-Cap stock
OBJECTIVE
Capital growth
This report is not authorized for distribution to prospective investors unless preceded or accompanied by a current prospectus.
The views expressed in this report and information about the Fund’s portfolio holdings are for the period covered by this report and are subject to change thereafter.
JennisonDryden, Dryden, Prudential Financial and the Rock Prudential logo are registered service marks of The Prudential Insurance Company of America, Newark, NJ, and its affiliates.

December 14, 2007
Dear Shareholder:
We hope you find the annual report for the Dryden Mid Cap Value Fund informative and useful. As a JennisonDryden mutual fund shareholder, you may be thinking about where you can find additional growth opportunities. You could invest in last year’s top-performing asset class and hope history repeats itself or you could stay in cash while waiting for the “right moment” to invest.
Instead, we believe it is better to take advantage of developing domestic and global investment opportunities through a diversified portfolio of stock and bond mutual funds. A diversified asset allocation offers two potential advantages. It helps you manage downside risk by not being overly exposed to any particular asset class, plus it gives you a better opportunity to have at least some of your assets in the right place at the right time. Your financial professional can help you create a diversified investment plan that may include mutual funds covering all the basic asset classes and that reflects your personal investor profile and tolerance for risk.
JennisonDryden Mutual Funds gives you a wide range of choices that can help you make progress toward your financial goals. Our funds offer the experience, resources, and professional discipline of four leading asset managers. They are recognized and respected in the institutional market and by discerning investors for excellence in their respective strategies. JennisonDryden equity funds are advised by Jennison Associates LLC, Quantitative Management Associates LLC (QMA), or Prudential Real Estate Investors (PREI). Prudential Investment Management, Inc. (PIM) advises the JennisonDryden fixed income and money market funds. Jennison Associates, QMA, and PIM are registered investment advisers and Prudential Financial companies. PREI is a registered investment adviser and a unit of PIM.
Thank you for choosing JennisonDryden Mutual Funds.
Sincerely,

Judy A. Rice, President
Dryden Mid Cap Value Fund
| | |
| Dryden Mid Cap Value Fund | | 1 |
Your Fund’s Performance
Fund objective
The investment objective of the Dryden Mid Cap Value Fund is to seek capital growth. There can be no assurance that the Fund will achieve its investment objective.
Performance data quoted represent past performance. Past performance does not guarantee future results. The investment return and principal value of an investment will fluctuate, so that an investor’s shares, when redeemed, may be worth more or less than their original cost. Current performance may be lower or higher than the past performance data quoted. An investor may obtain performance data as of the most recent month-end by visiting our website at www.jennisondryden.com or by calling (800) 225-1852. Class A and Class L shares have a maximum initial sales charge of 5.50% and 5.75%, respectively. Gross operating expenses: Class A, 1.53%; Class B, 2.23%; Class C, 2.23%; Class L, 1.73%; Class M, 2.23%; Class X, 1.23%; Class Z, 1.23%. Net operating expenses apply to: Class A, 1.48%; Class B, 2.23%; Class C, 2.23%; Class L, 1.73%; Class M, 2.23%; Class X, 1.23%; Class Z, 1.23%, after contractual reduction through 2/28/2008.
| | | | | | | | | |
Cumulative Total Returns as of 10/31/07 | | | | | | | | | |
| | | One Year | | | Five Years | | | Since Inception1 | |
Class A2 | | 9.78 | % | | N/A | | | 46.96 | % |
Class B3 | | 8.99 | | | N/A | | | 42.97 | |
Class C | | 9.00 | | | 106.92 | % | | 174.24 | |
Class L2 | | 9.54 | | | 112.08 | | | 186.80 | |
Class M3 | | 8.95 | | | 106.85 | | | 173.94 | |
Class X | | 10.04 | | | 110.46 | | | 178.30 | |
Class Z | | 10.24 | | | N/A | | | 18.18 | |
S&P MidCap 400 Index4 | | 17.02 | | | 126.69 | | | * | |
Russell Midcap Index5 | | 15.24 | | | 149.85 | | | ** | |
Russell Midcap Value Index6 | | 9.73 | | | 152.56 | | | *** | |
Lipper Mid-Cap Value Funds Avg.7 | | 12.87 | | | 141.01 | | | **** | |
| | | | | | | | | |
Average Annual Total Returns8 as of 9/30/07 | | | | | | | |
| | | One Year | | | Five Years | | | Since Inception1 | |
Class A2 | | 8.85 | % | | N/A | | | 9.72 | % |
Class B3 | | 9.41 | | | N/A | | | 10.25 | |
Class C | | 13.43 | | | 16.16 | % | | 11.63 | |
Class L2 | | 8.31 | | | 15.36 | | | 11.44 | |
Class M3 | | 8.37 | | | 15.93 | | | 11.62 | |
Class X | | 9.72 | | | 16.22 | | | 11.80 | |
Class Z | | 15.72 | | | N/A | | | 9.10 | |
S&P MidCap 400 Index4 | | 18.76 | | | 18.17 | | | * | |
Russell Midcap Index5 | | 17.87 | | | 20.90 | | | ** | |
Russell Midcap Value Index6 | | 13.75 | | | 21.02 | | | *** | |
Lipper Mid-Cap Value Funds Avg.7 | | 16.04 | | | 19.40 | | | **** | |
| | |
| 2 | | Visit our website at www.jennisondryden.com |
The cumulative total returns do not reflect the deduction of applicable sales charges. If reflected, the applicable sales charges would reduce the cumulative total return performance quoted. Class A and Class L shares are subject to a maximum front-end sales charge of 5.50% and 5.75%, respectively. Class L shares are closed to most new purchases (with the exception of reinvested dividends and purchases by certain college savings plans). Class M and Class X shares are also closed to most new purchases (with the exception of reinvested dividends). Class L, Class M, and Class X shares are exchangeable only with Class L, Class M, and Class X shares, respectively, offered by the other JennisonDryden Funds. Under certain circumstances, Class A and Class L shares may be subject to a contingent deferred sales charge (CDSC) of 1%. Class B, Class C, Class M, and Class X shares are subject to a maximum CDSC of 5%, 1%, 6%, and 6%, respectively.
Source: Prudential Investments LLC and Lipper Inc. Performance figures may reflect fee waivers and/or expense reimbursements. In the absence of such fee waivers and/or expense reimbursements, total returns would be lower.
1Inception dates: Class A and Class B, 4/12/04; Class C, Class L, Class M, Class X, 8/19/98, and Class Z, 11/28/05.
2Prior to April 12, 2004, Class L shares were known as Class A shares. On April 12, 2004, Class A shares were redesignated as Class L shares and a new Class A was opened.
3Prior to April 12, 2004, Class M shares were known as Class B shares. On April 12, 2004, Class B shares were redesignated as Class M shares and a new Class B was opened.
4The Standard & Poor’s MidCap 400 Stock Index (S&P MidCap 400 Index) is an unmanaged index of 400 domestic stocks chosen for market size, liquidity, and industry group representation. It gives a broad look at how U.S. mid-cap stock prices have performed.
5The Russell MidCap Index measures the performance of the 800 smallest companies in the Russell 1000 Index, which represent approximately 25% of the total market capitalization of the Russell 1000 Index.
6The Russell MidCap Value Index measures the performance of those Russell MidCap companies with lower price-to-book ratios and lower forecasted growth values. The stocks are also members of the Russell 1000 Value Index.
7Funds in the Lipper Mid-Cap Value Funds Average, by portfolio practice, invest at least 75% of their equity assets in companies with market capitalizations (on a three-year weighted basis) less than 300% of the dollar-weighted median market capitalization of the middle 1,000 securities of the S&P SuperComposite 1500 Index. Mid-cap value funds typically have a below-average price-to-earnings ratio, price-to-book ratio, and three-year sales-per-share growth value compared with the companies in the S&P MidCap 400 Index.
8The average annual total returns take into account applicable sales charges. The returns in the tables do not reflect the deduction of taxes that a shareholder would pay on Fund distributions or following the redemption of Fund shares. Without a distribution and service (12b-1) fee waiver of 0.05% for Class A shares, the returns would have been lower. Class A shares are subject to a 12b-1 fee of up to 0.30% annually. Class B, Class C, Class M, and Class X shares are subject to a 12b-1 fee of 1.00%. Class L shares are subject to a 12b-1 fee of 0.50%.
*S&P MidCap 400 Index Closest Month-End to Inception cumulative total returns as of 10/31/07 are 56.84% for Class A and Class B; and 258.77% for Class C, Class L, Class M, and Class X; and 26.55% for Class Z. S&P MidCap 400 Index Closest Month-End to Inception average annual total returns as of 9/30/07 are 12.88% for Class A and Class B; and 14.77% for Class C, Class L, Class M, and Class X; and 12.11% for Class Z.
| | |
| Dryden Mid Cap Value Fund | | 3 |
Your Fund’s Performance (continued)
**Russell Midcap Index Closest Month-End to Inception cumulative total returns as of 10/31/07 are 65.16% for Class A and Class B; and 210.50% for Class C, Class L, Class M, and Class X; and 29.55% for Class Z. Russell Midcap Index Closest Month-End to Inception average annual total returns as of 9/30/07 are 14.89% for Class A and Class B; and 13.09% for Class C, Class L, Class M, and Class X; and 14.17% for Class Z.
***Russell Midcap Value Index Closest Month-End to Inception cumulative total returns as of 10/31/07 are 67.33% for Class A and Class B; and 221.98% for Class C, Class L, Class M, and Class X; and 27.73% for Class Z. Russell Midcap Value Index Closest Month-End to Inception average annual total returns as of 9/30/07 are 15.72% for Class A and Class B; and 13.69% for Class C, Class L, Class M, and Class X; and 14.05% for Class Z.
****Lipper Mid-Cap Value Funds Average Closest Month-End to Inception cumulative total returns as of 10/31/07 are 58.28% for Class A and Class B; and 229.38% for Class C, Class L, Class M, and Class X; and 26.99% for Class Z. Lipper Mid-Cap Value Funds Average Closest Month-End to Inception average annual total returns as of 9/30/07 are 13.51% for Class A and Class B; and 13.62% for Class C, Class L, Class M, and Class X; and 13.17% for Class Z.
Investors cannot invest directly in an index. The returns for the Russell 2500 Index and the S&P SmallCap 600 Index would be lower if they included the effects of sales charges, operating expenses of a mutual fund, or taxes.
Returns for the Lipper Average reflect the deduction of operating expenses, but sales charges or taxes.
| | | |
| Five Largest Holdings expressed as a percentage of net assets as of 10/31/07 | | | |
iShares Russell Midcap Value Index Fund, Exchange Traded Fund | | 1.8 | % |
Edison International, Electric Utilities | | 1.4 | |
American Electric Power Co., Inc., Electric Utilities | | 1.3 | |
Hess Corp., Oil, Gas, & Consumable Fuels | | 1.3 | |
PG&E Corp., Multi-Utilities | | 1.2 | |
Holdings reflect only long-term investments and are subject to change.
| | |
| 4 | | Visit our website at www.jennisondryden.com |
Strategy and Performance Overview
How did the Fund perform?
The Dryden Mid Cap Value Fund’s Class A shares returned 9.78% for the 12 months ended October 31, 2007, in line with the 9.73% return of the Russell Midcap Value Index (the Index) but trailing the 12.87% return of the Lipper Mid-Cap Value Funds Average (the Lipper Average).
Were there changes in investment personnel relevant to the Fund’s performance?
On January 29, 2007, the name of the Fund was changed to the Dryden Mid Cap Value Fund and shareholders approved the appointment of Quantitative Management Associates LLC (QMA) as the Fund’s manager responsible for its day-to-day management.
Were there changes to the Fund’s investment objectives and the way it is managed?
Although the Fund’s investment objective remained capital appreciation, the way the Fund is managed changed. In the first three months of its fiscal year, Neuberger Berman Management Inc. managed the Fund after which QMA, which employs its quantitative value equity strategy, became the Fund’s manager. QMA invests in a diversified portfolio of stocks that are out of favor and inexpensive based on price-to-earnings ratios and other value measures. Historically, value stocks have outperformed broad stock market averages. Sector, industry, and individual security weighting constraints are placed on the portfolio to reduce risk relative to its benchmark.
What were stock market conditions like during the first three months of the period?
The period from November 1, 2006 through January 31, 2007 recorded attractive stock market returns. Robust corporate earnings growth and relatively low interest rates and inflation helped boost merger-and-acquisition activity which benefited stocks as investors were willing to pay more for shares of companies that were potential takeover targets. Stock prices also benefited as some corporations increased dividends or bought back shares at attractive prices. Stocks of medium-sized companies outperformed both large and small companies as measured by market capitalization.
How did the Fund perform before the change in asset managers?
For the three months, the Fund’s Class A shares returned 6.92%, lagging the 7.49% return of the Index and the 7.0% return of the Lipper Average. The Fund’s holdings in the specialty retail, medical services, defense and aerospace, and financial services industries were the primary detractors from its performance relative to the Index. However, this was partially offset by the positive impact of its holdings in the metals and mining and drug industries.
| | |
| Dryden Mid Cap Value Fund | | 5 |
Strategy and Performance Overview (continued)
The Neuberger Berman strategy involves investing in stocks with low price-to-earnings ratios and other characteristics typical of the value style of investing, but it also incorporated some factors associated with growth stocks. For example, compared with the Index, the Fund had an overweight exposure to some stocks with high price volatility, which detracted from its relative performance. To a lesser extent, the Fund was also hurt by its overweight exposure to stocks with above-market rates of earnings growth as these types of stocks were largely out of favor. However, this was partially offset by the positive impact of the Fund’s underweight exposure to companies that pay out most of their earnings in the form of dividends to shareholders.
What were stock market conditions like during the last nine months of the period?
Stock prices advanced at a much slower pace from February 1, 2007, through October 31, 2007. Corporate earnings growth slowed but the impact on the equity market was mitigated by strength in consumer spending and the job market. Growth in U.S. exports, which were made more competitive by the nation’s weak currency, also helped.
Slower economic growth and market turbulence early on led to style, capitalization, and sector rotations. After a large decline in the Shanghai Composite Index in China at the end of February prompted a global stock sell-off, investors began to reevaluate their appetite for risk and searched for companies with more resilient growth prospects. During the summer, stocks experienced another setback after a crisis in debt securities backed by subprime mortgages (home loans made to borrowers with poor credit histories) spread abroad from the United States. Citing risks to the U.S. economy from increasing financial market turbulence, the Federal Reserve aggressively lowered its target for the rate banks charge each other on overnight loans by a half point in late September and by a quarter point in October, helping stocks recover most of their summer losses.
Unlike recent years when the value-style of investing dominated growth investing, growth stocks outperformed value stocks across every U.S. market capitalization by period end. A decreasing appetite for risk affected small-cap stocks as investors moved to the relative safety of larger companies, which are often viewed as better able to weather an economic slowdown. Small-cap stocks, which had outperformed their larger brethren in 2006 across all styles, gave way to larger issues.
| | |
| 6 | | Visit our website at www.jennisondryden.com |
How did the Fund perform after the change in asset managers?
For the nine months, the Fund’s Class A shares returned 2.68%, outperforming the 2.08% return of the Index but underperforming the 5.64% return of the Lipper Average. Primary contributors to the Fund’s performance were its overweight exposure to the energy sector versus the Index and good stock selection in the materials and industrials sectors.
Strong global demand for petroleum products supported the Fund’s holdings in the energy sector. Notable performers include Frontline, an oil tanker operator whose stock increased 76%, and Denbury Resources (+104%) and Canadian Natural Resources (+67%), two oil exploration and production companies. Among the energy equipment companies, Oil States International (+50%) and Noble Corp. (+42%) were two solid performers. In the materials sector, the Fund benefited from having a larger exposure to mining stocks than the Index, which included Cleveland Cliffs (+76%), a producer of iron ore, and copper companies Freeport-McMoRan (+107%) and Southern Copper Corp. (+137%). In the industrials sector, the Fund benefited from its overweight position in Cummins (+80%) whose expertise in manufacturing diesel engines is enabling it to gain market share as global regulations for diesel emissions become more stringent. The Fund’s overweighting positions in Terex (+30%) and AGCO Corp. (+76%) also contributed to its performance.
Partially offsetting these positives were adverse stock selection in the consumer discretionary and information technology sectors. In consumer discretionary, the key detractor from the Fund’s return was its larger exposure than the Index to household durables, primarily homebuilders. The weak housing market, combined with tightened lending standards and disruptions in the credit markets, penalized homebuilders and other housing-related stocks. In information technology, the Fund’s overweight position in Lexmark International (–33%) detracted from its return. Higher spending on research and development and marketing has depressed profitability as Lexmark tries to improve its competitive position in inkjet and laser printers. Finally, the Fund’s performance relative to the Index was hurt since it did not hold Juniper Networks (+99%), a top-performing provider of secure networking solutions.
| | |
| Dryden Mid Cap Value Fund | | 7 |
Fees and Expenses (Unaudited)
As a shareholder of the Fund, you incur two types of costs: (1) transaction costs, including sales charges (loads) on purchase payments and redemptions, as applicable, and (2) ongoing costs, including management fees, distribution and/or service (12b-1) fees, and other Fund expenses, as applicable. This example is intended to help you understand your ongoing costs (in dollars) of investing in the Funds and to compare these costs with the ongoing costs of investing in other mutual funds.
The example is based on an investment of $1,000 invested on May 1, 2007, at the beginning of the period, and held through the six-month period ended October 31, 2007. The example is for illustrative purposes only; you should consult the Prospectus for information on initial and subsequent minimum investment requirements.
The Fund’s transfer agent may charge additional fees to holders of certain accounts that are not included in the expenses shown in the table on the following page. These fees apply to Individual Retirement Accounts (IRAs) and Section 403(b) accounts. As of the close of the six-month period covered by the table, IRA fees included an annual maintenance fee of $15 per account (subject to a maximum annual maintenance fee of $25 for all accounts held by the same shareholder). Section 403(b) accounts are charged an annual $25 fiduciary maintenance fee. Some of the fees may vary in amount, or may be waived, based on your total account balance or the number of JennisonDryden Funds, including the Fund, that you own. You should consider the additional fees that were charged to your Fund account over the six-month period when you estimate the total ongoing expenses paid over the period and the impact of these fees on your ending account value, as these additional expenses are not reflected in the information provided in the expense table. Additional fees have the effect of reducing investment returns.
Actual Expenses
The first line for each share class in the table on the following page provides information about actual account values and actual expenses. You may use the information on this line, together with the amount you invested, to estimate the expenses that you paid over the period. Simply divide your account value by $1,000 (for example, an $8,600 account value ÷ $1,000 = 8.6), then multiply the result by the number on the first line under the heading “Expenses Paid During the Six-Month Period” to estimate the expenses you paid on your account during this period.
Hypothetical Example for Comparison Purposes
The second line for each share class in the table on the following page provides information about hypothetical account values and hypothetical expenses based on the Fund’s actual expense ratio and an assumed rate of return of 5% per year before
| | |
| 8 | | Visit our website at www.jennisondryden.com |
expenses, which is not the Fund’s actual return. The hypothetical account values and expenses may not be used to estimate the actual ending account balance or expenses you paid for the period. You may use this information to compare the ongoing costs of investing in the Fund and other funds. To do so, compare this 5% hypothetical example with the 5% hypothetical examples that appear in the shareholder reports of the other funds.
Please note that the expenses shown in the table are meant to highlight your ongoing costs only, and do not reflect any transactional costs such as sales charges (loads). Therefore the second line for each share class in the table is useful in comparing ongoing costs only, and will not help you determine the relative total costs of owning different funds. In addition, if these transactional costs were included, your costs would have been higher.
| | | | | | | | | | | | | | |
Dryden Mid-Cap
Value Fund | | Beginning Account
Value
May 1, 2007 | | Ending Account
Value
October 31, 2007 | | Annualized
Expense Ratio
Based on the Six-
Month Period | | | Expenses Paid
During the Six-
Month Period* |
| | | | | | | | | | | | | | |
| Class A | | Actual | | $ | 1,000.00 | | $ | 968.40 | | 1.49 | % | | $ | 7.39 |
| | | Hypothetical | | $ | 1,000.00 | | $ | 1,017.69 | | 1.49 | % | | $ | 7.58 |
| | | | | | | | | | | | | | |
| Class B | | Actual | | $ | 1,000.00 | | $ | 965.00 | | 2.24 | % | | $ | 11.09 |
| | | Hypothetical | | $ | 1,000.00 | | $ | 1,013.91 | | 2.24 | % | | $ | 11.37 |
| | | | | | | | | | | | | | |
| Class C | | Actual | | $ | 1,000.00 | | $ | 964.90 | | 2.24 | % | | $ | 11.09 |
| | | Hypothetical | | $ | 1,000.00 | | $ | 1,013.91 | | 2.24 | % | | $ | 11.37 |
| | | | | | | | | | | | | | |
| Class L | | Actual | | $ | 1,000.00 | | $ | 967.40 | | 1.74 | % | | $ | 8.63 |
| | | Hypothetical | | $ | 1,000.00 | | $ | 1,016.43 | | 1.74 | % | | $ | 8.84 |
| | | | | | | | | | | | | | |
| Class M | | Actual | | $ | 1,000.00 | | $ | 964.90 | | 2.24 | % | | $ | 11.09 |
| | | Hypothetical | | $ | 1,000.00 | | $ | 1,013.91 | | 2.24 | % | | $ | 11.37 |
| | | | | | | | | | | | | | |
| Class X | | Actual | | $ | 1,000.00 | | $ | 969.70 | | 1.24 | % | | $ | 6.16 |
| | | Hypothetical | | $ | 1,000.00 | | $ | 1,018.95 | | 1.24 | % | | $ | 6.31 |
| | | | | | | | | | | | | | |
| Class Z | | Actual | | $ | 1,000.00 | | $ | 971.60 | | 1.24 | % | | $ | 6.16 |
| | | Hypothetical | | $ | 1,000.00 | | $ | 1,018.95 | | 1.24 | % | | $ | 6.31 |
* Fund expenses (net of fee waivers or subsidies, if any) for each share class are equal to the annualized expense ratio for each share class (provided in the table), multiplied by the average account value over the period, multiplied by the 184 days in the six-month period ended October 31, 2007, and divided by the 365 days in the Fund’s fiscal year ended October 31, 2007 (to reflect the six-month period). Expenses presented in the table include the expenses of any underlying portfolios in which the Fund may invest.
| | |
| Dryden Mid Cap Value Fund | | 9 |
Portfolio of Investments
October 31, 2007
| | | | | |
| | | Shares | | Value (Note 2) |
| | | | | |
LONG-TERM INVESTMENTS 99.7% | | | |
COMMON STOCKS | | | | | |
| | |
Aerospace & Defense 1.0% | | | | | |
L-3 Communications Holdings, Inc. | | 26,700 | | $ | 2,927,388 |
| | |
Auto Components 1.8% | | | | | |
Advance Auto Parts, Inc. | | 32,900 | | | 1,122,548 |
Autoliv, Inc. (Sweden) | | 23,600 | | | 1,491,048 |
BorgWarner, Inc. | | 17,400 | | | 1,839,354 |
TRW Automotive Holdings Corp.* | | 28,800 | | | 855,072 |
| | | | | |
| | | | | 5,308,022 |
| | |
Automobiles 1.3% | | | | | |
Ford Motor Co.* | | 198,900 | | | 1,764,243 |
Harley-Davidson, Inc. | | 28,300 | | | 1,457,450 |
Penske Auto Group, Inc.(a) | | 28,626 | | | 637,787 |
| | | �� | | |
| | | | | 3,859,480 |
| | |
Beverages 2.5% | | | | | |
Coca-Cola Enterprises, Inc. | | 80,300 | | | 2,072,543 |
Constellation Brands, Inc. (Class A Stock)*(a) | | 81,700 | | | 2,052,304 |
Pepsi Bottling Group, Inc. | | 38,100 | | | 1,641,348 |
PepsiAmericas, Inc. | | 43,400 | | | 1,550,248 |
| | | | | |
| | | | | 7,316,443 |
| | |
Building Products 0.4% | | | | | |
Masco Corp. | | 45,500 | | | 1,095,640 |
| | |
Capital Markets 0.1% | | | | | |
Bear Stearns Cos., Inc. (The) | | 2,300 | | | 261,280 |
| | |
Chemicals 4.0% | | | | | |
Ashland, Inc. | | 18,300 | | | 1,074,576 |
Celanese Corp. | | 27,300 | | | 1,145,508 |
Eastman Chemical Co. | | 24,400 | | | 1,624,796 |
FMC Corp. | | 28,200 | | | 1,621,500 |
Huntsman Corp. | | 30,200 | | | 795,770 |
Lyondell Chemical Co. | | 53,000 | | | 2,514,850 |
PPG Industries, Inc.(a) | | 34,200 | | | 2,556,108 |
Westlake Chemical Corp.(a) | | 14,700 | | | 360,738 |
| | | | | |
| | | | | 11,693,846 |
See Notes to Financial Statements.
| | |
| Dryden Mid Cap Value Fund | | 11 |
Portfolio of Investments
October 31, 2007 continued
| | | | | |
| | | Shares | | Value (Note 2) |
| | | | | |
COMMON STOCKS (continued) | | | | | |
| | |
Commercial Banks 6.8% | | | | | |
Associated Banc-Corp | | 39,600 | | $ | 1,142,856 |
BancorpSouth, Inc.(a) | | 36,300 | | | 880,638 |
Bank of Hawaii Corp. | | 9,700 | | | 515,652 |
City National Corp. | | 15,600 | | | 1,054,560 |
Colonial BancGroup, Inc. (The) | | 50,100 | | | 960,918 |
Comerica, Inc.(a) | | 36,200 | | | 1,689,816 |
Commerce Bancshares, Inc.(a) | | 14,600 | | | 688,682 |
First Horizon National Corp.(a) | | 35,100 | | | 915,408 |
Huntington Bancshares, Inc. | | 66,500 | | | 1,191,015 |
KeyCorp | | 85,000 | | | 2,418,250 |
M&T Bank Corp.(a) | | 11,100 | | | 1,104,228 |
Marshall & Ilsley Corp. | | 55,900 | | | 2,386,930 |
Popular, Inc. (Puerto Rico)(a) | | 79,600 | | | 839,780 |
Synovus Financial Corp. | | 31,700 | | | 835,612 |
TCF Financial Corp. | | 36,300 | | | 826,551 |
UnionBanCal Corp. | | 17,900 | | | 966,779 |
Wilmington Trust Corp. | | 11,900 | | | 432,803 |
Zions Bancorp | | 17,000 | | | 1,004,870 |
| | | | | |
| | | | | 19,855,348 |
| | |
Commercial Services & Supplies 0.7% | | | | | |
R.R. Donnelley & Sons Co. | | 52,400 | | | 2,111,196 |
| | |
Communication Equipment 0.3% | | | | | |
Arris Group, Inc.*(a) | | 78,700 | | | 905,050 |
| | |
Computer Services & Software 0.4% | | | | | |
Tech Data Corp.* | | 28,500 | | | 1,120,905 |
| | |
Computers & Peripherals 1.1% | | | | | |
Lexmark International, Inc. (Class A Stock)* | | 44,000 | | | 1,847,560 |
Western Digital Corp.* | | 47,100 | | | 1,220,832 |
| | | | | |
| | | | | 3,068,392 |
| | |
Construction 0.6% | | | | | |
Centex Corp. | | 17,400 | | | 436,044 |
Lennar Corp. (Class A Stock) | | 30,900 | | | 706,065 |
NVR, Inc.*(a) | | 800 | | | 380,600 |
Ryland Group, Inc.(a) | | 8,700 | | | 247,341 |
| | | | | |
| | | | | 1,770,050 |
See Notes to Financial Statements.
| | |
| 12 | | Visit our website at www.jennisondryden.com |
| | | | | |
| | | Shares | | Value (Note 2) |
| | | | | |
COMMON STOCKS (continued) | | | | | |
| | |
Construction & Engineering 0.4% | | | | | |
Chicago Bridge & Iron Co. N.V. (Netherlands) | | 22,400 | | $ | 1,120,000 |
| | |
Consumer Finance 0.2% | | | | | |
AmeriCredit Corp.* | | 31,300 | | | 441,643 |
| | |
Containers & Packaging 0.2% | | | | | |
Sonoco Products Co. | | 22,900 | | | 708,068 |
| | |
Diversified Consumer Services 0.2% | | | | | |
Career Education Corp.* | | 19,900 | | | 711,226 |
| | |
Diversified Financial Services 0.6% | | | | | |
CIT Group, Inc. | | 42,800 | | | 1,508,272 |
Thornburg Mortgage, Inc.(a) | | 18,900 | | | 198,450 |
| | | | | |
| | | | | 1,706,722 |
| | |
Diversified Telecommunication Services 0.5% | | | | | |
CenturyTel, Inc. | | 32,600 | | | 1,436,030 |
| | |
Electric Utilities 6.3% | | | | | |
American Electric Power Co., Inc. | | 80,800 | | | 3,895,368 |
DPL, Inc. | | 55,700 | | | 1,617,528 |
Edison International | | 68,600 | | | 3,989,090 |
Great Plains Energy, Inc.(a) | | 31,600 | | | 942,944 |
Pepco Holdings, Inc. | | 54,700 | | | 1,558,403 |
Pinnacle West Capital Corp. | | 28,500 | | | 1,151,400 |
PPL Corp. | | 45,500 | | | 2,352,350 |
Progress Energy, Inc. | | 56,000 | | | 2,688,000 |
| | | | | |
| | | | | 18,195,083 |
| | |
Electronic Components 0.6% | | | | | |
Integrys Energy Group, Inc.(a) | | 24,300 | | | 1,307,583 |
Vishay Intertechnology, Inc.* | | 38,200 | | | 480,938 |
| | | | | |
| | | | | 1,788,521 |
| | |
Electronic Equipment & Instruments 1.0% | | | | | |
Avnet, Inc.* | | 44,100 | | | 1,839,852 |
Ingram Micro, Inc. (Class A Stock)* | | 47,000 | | | 998,280 |
| | | | | |
| | | | | 2,838,132 |
See Notes to Financial Statements.
| | |
| Dryden Mid Cap Value Fund | | 13 |
Portfolio of Investments
October 31, 2007 continued
| | | | | |
| | | Shares | | Value (Note 2) |
| | | | | |
COMMON STOCKS (continued) | | | | | |
| | |
Energy Equipment & Services 2.2% | | | | | |
BJ Services Co. | | 40,600 | | $ | 1,022,714 |
Noble Corp. (Cayman Islands) | | 20,600 | | | 1,090,770 |
Oil States International, Inc.*(a) | | 25,000 | | | 1,079,750 |
Patterson-UTI Energy, Inc.(a) | | 37,100 | | | 739,774 |
SEACOR Holdings, Inc.*(a) | | 9,500 | | | 870,675 |
Tidewater, Inc.(a) | | 16,100 | | | 880,187 |
Unit Corp.* | | 11,700 | | | 558,909 |
| | | | | |
| | | | | 6,242,779 |
| | |
Exchange Traded Fund 1.8% | | | | | |
iShares Russell Midcap Value Index Fund | | 34,100 | | | 5,175,357 |
| | |
Financial Services 0.2% | | | | | |
Fulton Financial Corp.(a) | | 45,500 | | | 596,505 |
| | |
Food & Staples Retailing 1.2% | | | | | |
Kroger Co. (The) | | 67,500 | | | 1,983,825 |
Safeway, Inc. | | 45,000 | | | 1,530,000 |
| | | | | |
| | | | | 3,513,825 |
| | |
Food Products 1.6% | | | | | |
ConAgra Foods, Inc. | | 41,900 | | | 994,287 |
Dean Foods Co.(a) | | 48,300 | | | 1,341,291 |
Del Monte Foods Co. | | 113,400 | | | 1,172,556 |
Smithfield Foods, Inc.* | | 44,600 | | | 1,278,682 |
| | | | | |
| | | | | 4,786,816 |
| | |
Gas Utilities 2.0% | | | | | |
AGL Resources, Inc.(a) | | 27,900 | | | 1,102,887 |
Atmos Energy Corp. | | 33,300 | | | 934,065 |
National Fuel Gas Co. | | 43,400 | | | 2,104,466 |
ONEOK, Inc. | | 32,000 | | | 1,598,080 |
| | | | | |
| | | | | 5,739,498 |
| | |
Healthcare Equipment & Supplies 0.1% | | | | | |
Cooper Cos., Inc. (The)(a) | | 6,000 | | | 252,000 |
| | |
Healthcare Providers & Services 2.4% | | | | | |
Aetna, Inc. | | 22,200 | | | 1,246,974 |
CIGNA Corp. | | 20,000 | | | 1,049,800 |
See Notes to Financial Statements.
| | |
| 14 | | Visit our website at www.jennisondryden.com |
| | | | | |
| | | Shares | | Value (Note 2) |
| | | | | |
COMMON STOCKS (continued) | | | | | |
| | |
Healthcare Providers & Services (cont’d.) | | | | | |
Coventry Health Care, Inc.* | | 26,200 | | $ | 1,580,122 |
LifePoint Hospitals, Inc.* | | 57,200 | | | 1,745,744 |
Omnicare, Inc. | | 42,900 | | | 1,265,550 |
| | | | | |
| | | | | 6,888,190 |
| | |
Hotels, Restaurants & Leisure 1.0% | | | | | |
Brinker International, Inc.(a) | | 17,600 | | | 446,864 |
Carnival Corp. (Panama)(a) | | 25,600 | | | 1,228,288 |
International Speedway Corp. (Class A Stock) | | 16,600 | | | 737,538 |
Yum! Brands, Inc. | | 11,600 | | | 467,132 |
| | | | | |
| | | | | 2,879,822 |
| | |
Household Durables 2.0% | | | | | |
Black & Decker Corp. (The)(a) | | 7,700 | | | 692,307 |
Fortune Brands, Inc. | | 12,300 | | | 1,030,371 |
Leggett & Platt, Inc.(a) | | 37,700 | | | 732,511 |
Mohawk Industries, Inc.*(a) | | 15,200 | | | 1,297,168 |
Stanley Works (The)(a) | | 13,900 | | | 799,945 |
Whirlpool Corp. | | 17,200 | | | 1,361,896 |
| | | | | |
| | | | | 5,914,198 |
| | |
Independent Power Producers & Energy Traders 1.4% | | | | | |
Mirant Corp.* | | 40,600 | | | 1,719,816 |
NRG Energy, Inc.*(a) | | 49,400 | | | 2,255,604 |
| | | | | |
| | | | | 3,975,420 |
| | |
Industrial Conglomerates 1.0% | | | | | |
Teleflex, Inc. | | 15,600 | | | 1,142,076 |
Walter Industries, Inc. | | 61,100 | | | 1,872,104 |
| | | | | |
| | | | | 3,014,180 |
| | |
Insurance 9.1% | | | | | |
Ambac Financial Group, Inc.(a) | | 18,900 | | | 696,087 |
American Financial Group, Inc. | | 30,000 | | | 897,000 |
Cincinnati Financial Corp. | | 39,500 | | | 1,571,310 |
CNA Financial Corp. | | 6,200 | | | 245,706 |
Conseco, Inc.* | | 17,200 | | | 271,588 |
Endurance Specialty Holdings Ltd. (Bermuda)(a) | | 40,800 | | | 1,599,768 |
Fidelity National Financial, Inc. | | 61,300 | | | 943,407 |
First American Corp. | | 27,700 | | | 833,770 |
Genworth Financial, Inc. | | 34,700 | | | 947,310 |
See Notes to Financial Statements.
| | |
| Dryden Mid Cap Value Fund | | 15 |
Portfolio of Investments
October 31, 2007 continued
| | | | | |
| | | Shares | | Value (Note 2) |
| | | | | |
COMMON STOCKS (continued) | | | | | |
| | |
Insurance (cont’d.) | | | | | |
HCC Insurance Holdings, Inc. | | 27,200 | | $ | 813,008 |
MBIA, Inc.(a) | | 31,200 | | | 1,342,848 |
Mercury General Corp. | | 15,300 | | | 785,043 |
Nationwide Financial Services, Inc. (Class A Stock) | | 19,100 | | | 1,024,715 |
Old Republic International Corp. | | 65,200 | | | 999,516 |
Philadelphia Consolidated Holding Co.* | | 13,700 | | | 558,960 |
Principal Financial Group, Inc. | | 22,400 | | | 1,515,808 |
Protective Life Corp. | | 23,800 | | | 1,020,306 |
Reinsurance Group of America, Inc. | | 15,000 | | | 856,950 |
RenaissanceRe Holdings Ltd. | | 12,000 | | | 700,080 |
Safeco Corp.(a) | | 29,800 | | | 1,725,420 |
StanCorp Financial Group, Inc. | | 21,700 | | | 1,196,321 |
Torchmark Corp.(a) | | 23,800 | | | 1,550,808 |
Transatlantic Holdings, Inc. | | 9,700 | | | 722,941 |
Unitrin, Inc. | | 19,100 | | | 884,521 |
Unum Group | | 76,200 | | | 1,778,508 |
W.R. Berkely Corp. | | 34,100 | | | 1,026,069 |
| | | | | |
| | | | | 26,507,768 |
| | |
Internet Services 0.8% | | | | | |
Computer Sciences Corp.* | | 39,600 | | | 2,312,244 |
| | |
Leisure Equipment & Products 0.9% | | | | | |
Brunswick Corp.(a) | | 28,800 | | | 642,528 |
Eastman Kodak Co. | | 69,700 | | | 1,997,602 |
| | | | | |
| | | | | 2,640,130 |
| | |
Machinery 5.0% | | | | | |
AGCO Corp.*(a) | | 20,300 | | | 1,211,504 |
Cummins, Inc.(a) | | 9,300 | | | 1,115,628 |
Eaton Corp. | | 34,800 | | | 3,221,784 |
Ingersoll-Rand Co. Ltd. (Class A Stock)(a) | | 40,000 | | | 2,014,000 |
Paccar, Inc. | | 26,250 | | | 1,458,450 |
Parker Hannifin Corp. | | 33,600 | | | 2,700,432 |
Terex Corp.* | | 11,600 | | | 860,952 |
Timken Co. | | 58,600 | | | 1,949,036 |
| | | | | |
| | | | | 14,531,786 |
| | |
Media 1.9% | | | | | |
Cablevision Systems Corp. (Class A Stock)* | | 48,500 | | | 1,422,505 |
EchoStar Communications Corp. (Class A Stock)* | | 13,800 | | | 675,648 |
Gannett Co., Inc. | | 52,600 | | | 2,230,766 |
See Notes to Financial Statements.
| | |
| 16 | | Visit our website at www.jennisondryden.com |
| | | | | |
| | | Shares | | Value (Note 2) |
| | | | | |
COMMON STOCKS (continued) | | | | | |
| | |
Media (cont’d) | | | | | |
McClatchy Co. (Class A Stock)(a) | | 7,800 | | $ | 129,402 |
New York Times Co. (The) (Class A Stock)(a) | | 48,300 | | | 944,748 |
| | | | | |
| | | | | 5,403,069 |
| | |
Metals & Mining 3.5% | | | | | |
Cleveland-Cliffs, Inc. | | 21,000 | | | 2,008,650 |
Freeport-McMoRan Copper & Gold, Inc. (Class B Stock) | | 17,433 | | | 2,051,516 |
Southern Copper Corp. | | 7,800 | | | 1,089,660 |
Steel Dynamics, Inc. | | 29,800 | | | 1,585,956 |
United States Steel Corp. | | 33,000 | | | 3,560,700 |
| | | | | |
| | | | | 10,296,482 |
| | |
Multi-Line Retail 0.5% | | | | | |
Dollar Tree Stores, Inc.* | | 34,800 | | | 1,332,840 |
| | |
Multi-Utilities 8.9% | | | | | |
CenterPoint Energy, Inc. | | 84,900 | | | 1,422,924 |
Consolidated Edison, Inc.(a) | | 54,600 | | | 2,571,114 |
DTE Energy Co. | | 42,900 | | | 2,127,840 |
Duke Energy Corp. | | 28,900 | | | 554,013 |
Energy East Corp. | | 48,800 | | | 1,360,544 |
NiSource, Inc. | | 68,700 | | | 1,404,915 |
NSTAR | | 35,200 | | | 1,237,632 |
PG&E Corp. | | 73,000 | | | 3,571,890 |
Puget Energy, Inc. | | 42,200 | | | 1,192,150 |
SCANA Corp. | | 33,600 | | | 1,363,824 |
Sempra Energy | | 54,800 | | | 3,370,748 |
TECO Energy, Inc.(a) | | 69,600 | | | 1,171,368 |
Vectren Corp. | | 33,400 | | | 936,536 |
Wisconsin Energy Corp. | | 32,300 | | | 1,546,524 |
Xcel Energy, Inc.(a) | | 93,900 | | | 2,117,445 |
| | | | | |
| | | | | 25,949,467 |
| | |
Office Electronics 1.2% | | | | | |
Xerox Corp.*(a) | | 196,000 | | | 3,418,240 |
| | |
Oil, Gas & Consumable Fuels 10.4% | | | | �� | |
Cabot Oil & Gas Corp. | | 26,642 | | | 1,057,421 |
Canadian Natural Resources Ltd. | | 12,300 | | | 1,023,360 |
Chesapeake Energy Corp.(a) | | 66,400 | | | 2,621,472 |
Cimarex Energy Co.(a) | | 29,500 | | | 1,195,045 |
See Notes to Financial Statements.
| | |
| Dryden Mid Cap Value Fund | | 17 |
Portfolio of Investments
October 31, 2007 continued
| | | | | |
| | | Shares | | Value (Note 2) |
COMMON STOCKS (continued) | | | | | |
| | |
Oil, Gas, Consumable Fuels (cont’d.) | | | | | |
| | | | | |
Denbury Resources, Inc.* | | 14,900 | | $ | 843,340 |
Forest Oil Corp.*(a) | | 27,300 | | | 1,326,507 |
Frontline Ltd. (Bermuda)(a) | | 28,900 | | | 1,312,060 |
Hess Corp. | | 52,600 | | | 3,766,686 |
Murphy Oil Corp. | | 39,700 | | | 2,923,111 |
Newfield Exploration Co.* | | 35,600 | | | 1,916,704 |
Noble Energy, Inc. | | 42,400 | | | 3,245,296 |
Overseas Shipholding Group | | 14,400 | | | 1,071,360 |
Pogo Producing Co. | | 21,700 | | | 1,292,452 |
Ship Finance International Ltd.(a) | | 43,257 | | | 1,184,377 |
Sunoco, Inc. | | 16,800 | | | 1,236,480 |
Talisman Energy, Inc. (Canada) | | 56,000 | | | 1,217,440 |
Tesoro Corp.(a) | | 29,900 | | | 1,809,847 |
XTO Energy, Inc. | | 18,800 | | | 1,247,944 |
| | | | | |
| | | | | 30,290,902 |
| | |
Paper & Forest Products 0.2% | | | | | |
Louisiana-Pacific Corp. | | 43,000 | | | 707,780 |
| | |
Personal Products 0.4% | | | | | |
NBTY, Inc.* | | 32,700 | | | 1,164,120 |
| | |
Pharmaceuticals 1.0% | | | | | |
Endo Pharmaceuticals Holdings, Inc.*(a) | | 37,100 | | | 1,087,030 |
King Pharmaceuticals, Inc.* | | 72,400 | | | 767,440 |
Watson Pharmaceuticals, Inc.* | | 38,200 | | | 1,167,392 |
| | | | | |
| | | | | 3,021,862 |
| | |
Real Estate Investment Trusts 1.3% | | | | | |
Annaly Capital Management, Inc.(a) | | 105,500 | | | 1,802,995 |
Colonial Properties Trust(a) | | 8,700 | | | 272,571 |
iStar Financial, Inc.(a) | | 51,600 | | | 1,574,316 |
| | | | | |
| | | | | 3,649,882 |
| | |
Road & Rail 1.0% | | | | | |
Avis Budget Group, Inc.* | | 22,500 | | | 469,575 |
Con-Way, Inc. | | 18,800 | | | 801,068 |
Ryder System, Inc. | | 21,300 | | | 1,019,205 |
YRC Worldwide, Inc.*(a) | | 23,600 | | | 580,088 |
| | | | | |
| | | | | 2,869,936 |
See Notes to Financial Statements.
| | |
| 18 | | Visit our website at www.jennisondryden.com |
| | | | | |
| | | Shares | | Value (Note 2) |
| | | | | |
COMMON STOCKS (continued) | | | | | |
| | |
Semiconductors & Semiconductor Equipment 0.5% | | | | | |
International Rectifier Corp.* | | 28,700 | | $ | 958,006 |
Teradyne, Inc.*(a) | | 43,200 | | | 533,088 |
| | | | | |
| | | | | 1,491,094 |
| | |
Software 1.1% | | | | | |
BEA Systems, Inc.* | | 31,200 | | | 527,280 |
Check Point Software Technologies Ltd. (Israel)* | | 66,500 | | | 1,679,790 |
McAfee, Inc.* | | 26,500 | | | 1,095,775 |
| | | | | |
| | | | | 3,302,845 |
| | |
Specialty Retail 2.0% | | | | | |
Aeropostale, Inc.*(a) | | 41,450 | | | 949,205 |
AutoNation, Inc.*(a) | | 26,800 | | | 474,092 |
AutoZone, Inc.* | | 4,400 | | | 547,404 |
Circuit City Stores, Inc. | | 46,100 | | | 365,573 |
Foot Locker, Inc. | | 28,500 | | | 424,365 |
Hot Topic, Inc.*(a) | | 55,300 | | | 423,598 |
RadioShack Corp.(a) | | 32,700 | | | 674,274 |
Ross Stores, Inc. | | 37,400 | | | 1,010,548 |
TJX Cos., Inc. | | 35,400 | | | 1,024,122 |
| | | | | |
| | | | | 5,893,181 |
| | |
Textiles, Apparel & Luxury Goods 0.6% | | | | | |
Jones Apparel Group, Inc.(a) | | 35,000 | | | 732,900 |
Liz Claiborne, Inc.(a) | | 31,200 | | | 888,264 |
| | | | | |
| | | | | 1,621,164 |
| | |
Thrifts & Mortgage Finance 0.8% | | | | | |
Astoria Financial Corp.(a) | | 13,100 | | | 340,469 |
MGIC Investment Corp. | | 9,600 | | | 185,856 |
PMI Group, Inc. (The) | | 25,200 | | | 403,956 |
Washington Federal, Inc. | | 20,900 | | | 504,944 |
Washington Mutual, Inc. | | 18,200 | | | 507,416 |
Webster Financial Corp. | | 11,700 | | | 424,008 |
| | | | | |
| | | | | 2,366,649 |
| | |
Trading Companies & Distributors 0.5% | | | | | |
United Rentals, Inc.* | | 46,300 | | | 1,582,997 |
See Notes to Financial Statements.
| | |
| Dryden Mid Cap Value Fund | | 19 |
Portfolio of Investments
October 31, 2007 continued
| | | | | | |
| | | Shares | | Value (Note 2) | |
| | | | | | |
COMMON STOCKS (continued) | | | | | | |
| | |
Wireless Telecommunication Services 0.2% | | | | | | |
Telephone & Data Systems, Inc. | | 8,400 | | $ | 586,320 | |
| | | | | | |
TOTAL LONG-TERM INVESTMENTS
(cost $261,844,350) | | | | | 290,157,813 | |
| | | | | | |
SHORT-TERM INVESTMENT 21.3% | | | | | | |
| | |
AFFILIATED MONEY MARKET MUTUAL FUND | | | | | | |
Dryden Core Investment Fund - Taxable Money Market Series
(cost $61,876,127; includes $59,132,515 of cash collateral for securities on loan)(b)(c) | | 61,876,127 | | | 61,876,127 | |
| | | | | | |
TOTAL INVESTMENTS 121.0%
(cost $323,720,477; Note 5) | | | | | 352,033,940 | |
Liabilities in excess of other assets (21.0%) | | | (61,090,449 | ) |
| | | | | | |
NET ASSETS 100.0% | | | | $ | 290,943,491 | |
| | | | | | |
| * | Non-income producing security. |
| (a) | All or a portion of security is on loan. The aggregate market value of such securities is $57,417,954; cash collateral of $59,132,515 (included with liabilities) was received with which the portfolio purchased highly liquid short-term investments. |
| (b) | Represents security, or a portion thereof, purchased with cash collateral received for securities on loan. |
| (c) | Prudential Investments LLC, the manager of the Fund also serves as manager of the Dryden Core Investment Fund-Taxable Money Market Series. |
The industry classification of investments and liabilities in excess of other assets shown as a percentage of net assets as of October 31, 2007 were as follows:
| | | |
Affiliated Money Market Mutual Fund (20.3% represents investments purchased with collateral from securities on loan) | | 21.3 | % |
Oil, Gas & Consumable Fuels | | 10.4 | |
Insurance | | 9.1 | |
Multi-utilities | | 8.9 | |
Commercial Banks | | 6.8 | |
Electric Utilities | | 6.3 | |
Machinery | | 5.0 | |
Chemicals | | 4.0 | |
Metals & Mining | | 3.5 | |
Beverages | | 2.5 | |
Healthcare Providers & Services | | 2.4 | |
Energy Equipment & Services | | 2.2 | |
Household Durables | | 2.0 | |
Specialty Retail | | 2.0 | |
Gas Utilities | | 2.0 | |
Media | | 1.9 | |
See Notes to Financial Statements.
| | |
| 20 | | Visit our website at www.jennisondryden.com |
| | | |
Industry (cont’d) | | | |
Auto Components | | 1.8 | % |
Exchange Traded Fund | | 1.8 | |
Food Products | | 1.6 | |
Independent Power Producers & Energy Traders | | 1.4 | |
Automobiles | | 1.3 | |
Real Estate Investment Trusts | | 1.3 | |
Food & Staples Retailing | | 1.2 | |
Office Electronics | | 1.2 | |
Software | | 1.1 | |
Computers & Peripherals | | 1.1 | |
Pharmaceuticals | | 1.0 | |
Industrial Conglomerates | | 1.0 | |
Aerospace & Defense | | 1.0 | |
Hotels, Restaurants & Leisure | | 1.0 | |
Road & Rail | | 1.0 | |
Electronic Equipment & Instruments | | 1.0 | |
Leisure Equipment & Products | | 0.9 | |
Thrifts & Mortgage Finance | | 0.8 | |
Internet Services | | 0.8 | |
Commercial Services & Supplies | | 0.7 | |
Electronic Components | | 0.6 | |
Construction | | 0.6 | |
Diversified Financial Services | | 0.6 | |
Textiles, Apparel & Luxury Goods | | 0.6 | |
Trading Companies & Distributors | | 0.5 | |
Semiconductors & Semiconductor Equipment | | 0.5 | |
Diversified Telecommunication Services | | 0.5 | |
Multi-line Retail | | 0.5 | |
Personal Products | | 0.4 | |
Computer Services & Software | | 0.4 | |
Construction & Engineering | | 0.4 | |
Building Products | | 0.4 | |
Communication Equipment | | 0.3 | |
Diversified Consumer Services | | 0.2 | |
Containers & Packaging | | 0.2 | |
Paper & Forest Products | | 0.2 | |
Financial Services | | 0.2 | |
Wireless Telecommunication Services | | 0.2 | |
Consumer Finance | | 0.2 | |
Capital Markets | | 0.1 | |
Healthcare Equipment & Supplies | | 0.1 | |
| | | |
| | 121.0 | |
Liabilities in excess of other assets | | (21.0 | ) |
| | | |
| | 100.0 | % |
| | | |
See Notes to Financial Statements.
| | |
| Dryden Mid Cap Value Fund | | 21 |
Statement of Assets and Liabilities
as of October 31, 2007
| | | | |
ASSETS | | | | |
Investments at value: Unaffiliated investments(a) including securities on loan(c) | | $ | 290,157,813 | |
Affiliated investments(b) | | | 61,876,127 | |
Fund shares sold | | | 279,972 | |
Dividends and interest receivable | | | 250,168 | |
Prepaid expenses | | | 5,348 | |
| | | | |
Total assets | | | 352,569,428 | |
| | | | |
| |
LIABILITIES | | | | |
Payable to broker for collateral for securities on loan | | | 59,132,515 | |
Payable for fund shares redeemed | | | 1,279,889 | |
Payable to investment manager | | | 396,697 | |
Payable to custodian | | | 359,249 | |
Distribution fees | | | 259,931 | |
Transfer agents’ fees(d) | | | 108,525 | |
Accrued expenses | | | 83,337 | |
Deferred directors’ fees | | | 4,833 | |
Withholding tax payable | | | 961 | |
| | | | |
Total liabilities | | | 61,625,937 | |
| | | | |
| |
NET ASSETS | | $ | 290,943,491 | |
| | | | |
| | | | | |
Net assets were comprised of: | | | | |
Common stock, at $.001 par value | | $ | 16,657 | |
Paid-in capital in excess of par | | | 202,006,296 | |
| | | | |
| | | 202,022,953 | |
Accumulated net investment loss | | | (4,834 | ) |
Accumulated net realized gain on investments transactions | | | 60,611,909 | |
Net unrealized appreciation (depreciation) on investments | | | 28,313,463 | |
| | | | |
Net assets, October 31, 2007 | | $ | 290,943,491 | |
| | | | |
(a) Unaffiliated investments at cost | | $ | 261,844,350 | |
| | | | |
(b) Affiliated investments at cost | | $ | 61,876,127 | |
| | | | |
(c) Securities on loan at value | | $ | 57,417,954 | |
| | | | |
(d) Affiliated transfer agent fees | | $ | 30,000 | |
| | | | |
See Notes to Financial Statements.
| | |
| 22 | | Visit our website at www.jennisondryden.com |
| | | |
Class A: | | | |
Net asset value and redemption price per share | | | |
($54,832,649 ÷ 2,983,307 shares of common stock issued and outstanding) | | $ | 18.38 |
Maximum sales charge (5.5% of offering price) | | | 1.07 |
| | | |
Offering price per share | | $ | 19.45 |
| | | |
| |
Class B: | | | |
Net asset value, offering and redemption price per share | | | |
($40,564,684 ÷ 2,376,666 shares of common stock issued and outstanding) | | $ | 17.07 |
| | | |
| |
Class C: | | | |
Net asset value, offering and redemption price per share | | | |
($67,296,709 ÷ 3,947,958 shares of common stock issued and outstanding) | | $ | 17.05 |
| | | |
| |
Class L: | | | |
Net asset value, offering and redemption price per share | | | |
($29,119,247 ÷ 1,607,232 shares of common stock issued and outstanding) | | $ | 18.12 |
| | | |
| |
Class M: | | | |
Net asset value, offering and redemption price per share | | | |
($69,620,534 ÷ 4,087,060 shares of common stock issued and outstanding) | | $ | 17.03 |
| | | |
| |
Class X: | | | |
Net asset value, offering and redemption price per share | | | |
($15,661,434 ÷ 905,692 shares of common stock issued and outstanding) | | $ | 17.29 |
| | | |
| |
Class Z: | | | |
Net asset value, offering and redemption price per share | | | |
($13,848,234 ÷ 748,590 shares of common stock issued and outstanding) | | $ | 18.50 |
| | | |
See Notes to Financial Statements.
| | |
| Dryden Mid Cap Value Fund | | 23 |
Statement of Operations
Year Ended October 31, 2007
| | | | |
NET INVESTMENT LOSS | | | | |
Investment income | | | | |
Unaffiliated dividend income | | $ | 5,642,618 | |
Affiliated income from securities loaned, net | | | 211,770 | |
Affiliated dividend income | | | 139,056 | |
Foreign taxes withheld | | | (13,588 | ) |
| | | | |
Total income | | | 5,979,856 | |
| | | | |
| |
Expenses | | | | |
Advisory fees | | | 2,977,475 | |
Distribution fees—Class A | | | 130,965 | |
Distribution fees—Class B | | | 460,945 | |
Distribution fees—Class C | | | 760,459 | |
Distribution fees—Class L | | | 171,669 | |
Distribution fees—Class M | | | 910,665 | |
Transfer agent’s fees and expenses (including affiliated expenses of $509,000) | | | 786,000 | |
Custodian’s fees and expenses | | | 96,000 | |
Registration fees | | | 64,000 | |
Reports to shareholders | | | 50,000 | |
Audit and legal fees | | | 40,000 | |
Directors’ fees | | | 17,000 | |
Insurance fees | | | 5,000 | |
Commitment fees | | | 1,000 | |
Miscellaneous | | | 16,489 | |
| | | | |
Total expenses | | | 6,487,667 | |
| | | | |
Net investment loss | | | (507,811 | ) |
| | | | |
| |
REALIZED AND UNREALIZED GAIN (LOSS) ON INVESTMENTS | | | | |
Net realized gain on investments | | | 62,242,943 | |
Net change in unrealized appreciation (depreciation) on investments | | | (30,270,234 | ) |
| | | | |
Net gain on investments | | | 31,972,709 | |
| | | | |
NET INCREASE IN NET ASSETS RESULTING FROM OPERATIONS | | $ | 31,464,898 | |
| | | | |
See Notes to Financial Statements.
| | |
| 24 | | Visit our website at www.jennisondryden.com |
Statement of Changes in Net Assets
| | | | | | | | |
| | | Dryden Mid Cap Value Fund | |
| | | Year
Ended
October 31, 2007 | | | Year
Ended
October 31, 2006 | |
INCREASE (DECREASE) IN NET ASSETS | | | | | | | | |
Operations | | | | | | | | |
Net investment loss | | $ | (507,811 | ) | | $ | (1,326,650 | ) |
Net realized gain on investments transactions | | | 62,242,943 | | | | 34,996,112 | |
Net change in unrealized appreciation (depreciation) on investments | | | (30,270,234 | ) | | | 2,312,993 | |
| | | | | | | | |
Net increase in net assets resulting from operations | | | 31,464,898 | | | | 35,982,455 | |
| | | | | | | | |
Distributions (Note 1) | | | | | | | | |
Distributions from net realized gains | | | | | | | | |
Class A | | | (4,018,906 | ) | | | (4,078,457 | ) |
Class B | | | (4,412,263 | ) | | | (711,922 | ) |
Class C | | | (7,318,251 | ) | | | (11,460,673 | ) |
Class L | | | (3,312,131 | ) | | | (9,783,292 | ) |
Class M | | | (9,716,121 | ) | | | (28,302,102 | ) |
Class X | | | (1,780,127 | ) | | | (5,113,048 | ) |
Class Z | | | (1,066,903 | ) | | | — | |
| | | | | | | | |
Total distributions | | | (31,624,702 | ) | | | (59,449,494 | ) |
| | | | | | | | |
| | |
Fund share transactions (Note 4) | | | | | | | | |
Net proceeds from shares sold | | | 17,548,970 | | | | 30,469,415 | |
Net asset value of shares issued in connection with merger (Note 8) | | | — | | | | 129,015,263 | |
Net asset value of shares issued in reinvestment of dividends and distributions | | | 27,210,201 | | | | 49,920,779 | |
Cost of shares redeemed | | | (104,920,347 | ) | | | (126,610,843 | ) |
| | | | | | | | |
Increase (decrease) in net assets from Fund share transactions | | | (60,161,176 | ) | | | 82,794,614 | |
| | | | | | | | |
Net increase (decrease) in net assets | | | (60,320,980 | ) | | | 59,327,575 | |
| | |
NET ASSETS | | | | | | | | |
Beginning of year | | | 351,264,471 | | | | 291,936,896 | |
| | | | | | | | |
End of year | | $ | 290,943,491 | | | $ | 351,264,471 | |
| | | | | | | | |
See Notes to Financial Statements.
| | |
| Dryden Mid Cap Value Fund | | 25 |
Notes to Financial Statements
1. Organization
Strategic Partners Mutual Funds, Inc., formerly known as American Skandia Advisor Funds, Inc., (the “Company”) is an open-end management investment company, registered under the Investment Company Act of 1940, as amended. The Company was organized on March 5, 1997, as a Maryland Corporation. The Company operates as a series company and effective April 12, 2004, the name of the Company was changed to Strategic Partners Mutual Funds, Inc. At October 31, 2007, the Company consisted of four diversified investment portfolios (each a “Fund” and collectively the “Funds”). The information presented in these financial statements pertains to Dryden Mid Cap Value (formerly known as Strategic Partners Mid Cap Value Fund) (“Mid Cap Value”). The investment objective of the Fund is capital growth by investing primarily in common stocks of medium capitalization companies.
2. Significant Accounting Policies
The following accounting policies are in conformity with accounting principles generally accepted in the United States of America. Such policies are consistently followed by the Company and the Fund in the preparation of their financial statements.
Securities Valuation
Securities listed on a securities exchange (other than options on securities and indices) are valued at the last sale price on such exchange on the day of valuation or, if there was no sale on such day, at the mean between the last reported bid and asked prices, or at the last bid price on such day in the absence of an asked price. Securities that are actively traded via Nasdaq are valued at the official closing price as provided by Nasdaq. Securities that are actively traded in the over-the-counter market, including listed securities for which primary market is believed by Prudential Investments LLC (“PI” or “Manager”) in consultation with the subadviser, to be over-the-counter, are valued at market value using prices provided by an independent pricing agent or principal market maker. Futures contracts and options thereon traded on a commodities exchange or board of trade are valued at the last sale price at the close of trading on such exchange or board of trade or, if there was no sale on the applicable commodities exchange or board of trade on such day, at the mean between the most recently quoted prices on such exchange or board of trade or at the last bid price in the absence of an asked price. Prices may be obtained from independent pricing services which use information provided by market makers or
| | |
| 26 | | Visit our website at www.jennisondryden.com |
estimates of market values obtained from yield data relating to investments or securities with similar characteristics. Securities for which reliable market quotations are not readily available, or whose values have been affected by events occurring after the close of the security’s foreign market and before the Fund’s normal pricing time, are valued at fair value in accordance with the Board of Directors’ approved fair valuation procedures. When determining the fair valuation of securities some of the factors influencing the valuation include, the nature of any restrictions on disposition of the securities; assessment of the general liquidity of the securities; the issuer’s financial condition and the markets in which it does business; the cost of the investment; the size of the holding and the capitalization of issuer; the prices of any recent transactions or bids/offers for such securities or any comparable securities; any available analyst media or other reports or information deemed reliable by the investment adviser regarding the issuer or the markets or industry in which it operates. Using fair value to price securities may result in a value that is different from a security’s most recent closing price and from the price used by other mutual funds to calculate their net asset value. As of October 31, 2007, there were no securities valued in accordance with such procedure.
Investments in mutual funds are valued at the net asset value as of the close of the New York Stock Exchange on the date of valuation.
Foreign Currency Translation
Fund securities and other assets and liabilities denominated in foreign currencies are translated each business day into U.S. dollars based on the current rates of exchange. Purchases and sales of Fund securities and income and expenses are translated into U.S. dollars on the respective dates of such transactions. Gains and losses resulting from changes in exchange rates applicable to long-term foreign securities are not reported separately from gains and losses arising from movements in securities prices. Net realized foreign exchange gains and losses include gains and losses from sales and maturities of foreign currency exchange contracts, gains and losses realized between the trade and settlement dates of foreign securities transactions, and the difference between the amount of net investment income accrued on foreign securities and the U.S. dollar amount actually received. Net unrealized foreign exchange gains and losses include gains and losses from changes in the value of assets and liabilities other than Fund securities, resulting from changes in exchange rates.
Securities Lending
The Fund may lend its portfolio securities to broker-dealers. The loans are secured by collateral at least equal at all times to the market value of the securities loaned.
| | |
| Dryden Mid Cap Value Fund | | 27 |
Notes to Financial Statements
continued
Loans are subject to termination at the option of the borrower or the Funds. Upon termination of the loan, the borrower will return to the lender securities identical to the loaned securities. Should the borrower of the securities fail financially, the Funds have the right to repurchase the securities using the collateral in the open market. The Funds recognize income, net of any rebate and securities lending agent fees, for lending its securities in the form of fees or interest on the investment of any cash received as collateral. The Fund also continues to receive interest and dividends or amounts equivalent thereto, on the securities loaned and recognize any unrealized gain or loss in the market price of the securities loaned that may occur during the term of the loan.
Cash collateral received in connection with securities lending is invested in short-term investments by the lending agent. These may include the Prudential Core Money Market Series or Institutional Money Market Trust, advised by BlackRock Capital Management, Inc., or directly in high-quality, short-term instruments with a maturity date not to exceed 60 days.
Investment Transactions and Investment Income
Securities transactions are recorded on the trade date. Realized gains or losses on sales of investments and currency transactions are calculated on the identified cost basis. Dividend income is recorded on the ex-dividend date and interest income is recorded on the accrual basis. The Fund amortizes premiums and discounts on portfolio securities as adjustments to interest income. Expenses are recorded on the accrual basis which may require the use of certain estimates by management.
Net investment income or loss (other than distribution fees, which are charged directly to the respective class) and unrealized and realized gains or losses are allocated daily to each class of shares based upon the relative proportion of net assets of each class at the beginning of the day.
Distributions to Shareholders
Distributions to shareholders are recorded on the ex-divided date. Dividends, if any, from net investment income are declared and paid at least annually by the Mid Cap Value Fund. These dividends and distributions are determined in accordance with federal income tax regulations and may differ from accounting principles generally accepted in the United States of America.
| | |
| 28 | | Visit our website at www.jennisondryden.com |
Net realized gains from investment transactions, if any, are distributed at least annually. Permanent book/tax differences relating to income and gains are reclassified to paid-in capital when they arise.
Taxes
For federal income tax purposes, each Fund in the Company is treated as a separate tax paying entity. It is the Fund’s policy to continue to meet the requirements of the Internal Revenue Code applicable to regulated investment companies and to distribute all of its taxable net income and capital gains, if any, to shareholders. Therefore, no federal tax provision is required. Withholding taxes on foreign dividends are recorded net of reclaimable amounts, at the time the related income is earned.
Estimates
The preparation of the financial statements requires management to make estimates and assumptions that affect the reported amounts and disclosures in the financial statements. Actual results could differ from those estimates.
3. Agreements and Other Transactions with Affiliates
The Funds have entered into investment management agreements with Prudential Investments LLC (“Investment Manager”) which provide that the Investment Manager will furnish each Fund with investment advice and investment management and administrative services. The Investment Manager has engaged Quantitative Management Associates LLC as Sub-Advisor of the Fund, as of October 31, 2007.
Advisory Fees and Expense Limitations
The Investment Manager receives a fee, computed daily and paid monthly, based on an annual rate of the average net assets. The Investment Manager pays each Sub-advisor a fee as compensation for advisory services provided to the Funds. The Investment Manager has voluntarily agreed to waive expenses in accordance with limitation expense policies as noted in the table below. The Investment Manager will reimburse each Fund for its respective operating expenses, exclusive of taxes, interest, brokerage commissions, distribution fees and extraordinary expenses, but inclusive of the advisory fee, which in the aggregate exceed specified percentages of the Funds’ average net assets while retaining their ability to be reimbursed for such fee waivers
| | |
| Dryden Mid Cap Value Fund | | 29 |
Notes to Financial Statements
continued
prior to the end of the fiscal year. The advisory fees and expense limitations are summarized as follows:
| | | | | | | | |
| | | Advisory Expense | | Effective Advisory Fees
Net of Waiver | | | Fees
Limitations | |
Mid Cap Value Fund | | 0.90% to $500 million; | | 0.90 | % | | 1.35 | % |
| | 0.85% next $500 million; | | | | | | |
| | 0.80% in excess of $1 billion | | | | | | |
Such voluntary fee waivers or reductions have been calculated prior to any fee reimbursements with respect to the expense limitations, and may be rescinded at any time and without notice to investors. All reimbursements by the Investment Manager are reflected in the Statements of Operations.
Management of the Company
Certain officers and directors of the Funds are officers or directors of the Investment Manager. The Funds pay no compensation directly to their officers or interested directors.
Distributor
Prudential Investment Management Services LLC (“PIMS”) and American Skandia Marketing, Incorporated (“ASMI”), both affiliates of Prudential Investments LLC and an indirect, wholly-owned subsidiary of Prudential serves as the distributor for the Funds. The Company has adopted a separate Distribution and Service plan (each a “Plan” and collectively the “Plans”) for Class A, B, C, L, M, X and Z shares of each Fund in accordance with the requirements of Rule 12b-1 of the Investment Company Act of 1940. No distribution or service fees are paid to PIMS as distributor for Class Z shares.
Under the Plans, the Fund compensate PIMS and ASMI a distribution and service fee at an annual rate up to 0.30%, 1.00%, 1.00%, 0.50%, 1.00% and 1.00% of the average daily net assets of the Class A, B, C, L, M and X shares, respectively. For the year ended October 31, 2007, PIMS has contractually agreed to limit such fees to 0.25 of 1% of the average daily net assets of the Class A shares. The effective distribution fee rate for Class X shares was 0.00% for the year ended October 31, 2007.
| | |
| 30 | | Visit our website at www.jennisondryden.com |
During the year ended October 31, 2007, PIMS has advised the Fund, front-end sales charges (“FESC”) and gross contingent deferred sales charges (“CDSC”) were approximately as follows:
| | | | | | | | | | | | | | | |
| | | Class A
FESC | | Class B
CDSC | | Class C
CDSC | | Class M
CDSC | | Class X
CDSC |
Mid Cap Value | | $ | 50,700 | | $ | 69,000 | | $ | 2,100 | | $ | 153,600 | | $ | 30,300 |
Transfer Agent
Prudential Mutual Fund Services LLC (“PMFS”), an affiliate of Prudential Investments LLC and an indirect, wholly-owned subsidiary of Prudential, serves as the Funds’ transfer agent. Transfer agent fees and expenses in the Statements of Operations include certain out-of-pocket expenses paid to non-affiliates, where applicable.
The Fund pays networking fees to affiliated and unaffiliated broker/dealers including fees relating to the services of Wachovia Securities, LLC (“Wachovia”) and First Clearing LLC (“First Clearing”) affiliates of PI. These networking fees are payments made to broker/dealers that clear mutual fund transactions through a national clearing system. For the years ended October 31, 2007 and October 31, 2006, the Fund incurred approximately $97,000 and $160,000, respectively, in total networking fees of which approximately $37,000 and $46,000, respectively, was paid to First Clearing. These amounts are included in transfer agents’ fees and expenses in the Statement of Operations.
Cash Sweep
The Fund invests in the Taxable Money Market Series (the “Series”), a portfolio of Dryden Core Investment Fund, pursuant to an exemptive order received from the Securities and Exchange Commission. The Series is a money market mutual fund registered under the Investment Company Act of 1940, as amended, and managed by PI.
Securities Lending Agent
Prudential Investment Management, Inc. (“PIM”), an indirect, wholly-owned subsidiary of Prudential, served as the Fund’s securities lending agent. For the year ended October 31, 2007, PIM was compensated $90,767 for these services by the Fund.
| | |
| Dryden Mid Cap Value Fund | | 31 |
Notes to Financial Statements
continued
Broker
For the year ended October 31, 2007, Prudential Equity Group, LLC earned $200 in brokerage commissions from transactions executed on behalf of the Fund.
4. Shares of Capital Stock
Class A shares are sold with a front-end sales charge of up to 5.50%. Purchases of $1 million or more are subject to a contingent deferred sales charge (“CDSC”) if shares are redeemed within 12 months of their purchase. Class B shares are sold with a CDSC which declines from 5% to zero depending upon the period of time the shares are held. Class B shares will automatically convert to Class A shares approximately seven years after purchase. Class M shares will automatically convert to Class A shares approximately eight years after purchase. Class C shares are sold with a CDSC of 1% during the first 12 months. Class L shares are closed to most new purchases (with the exception of reinvested dividends and purchases by certain college savings
plans). Class M shares are also closed to most new purchases (with the exception of reinvested dividends). Class L shares and Class M shares are only exchangeable with Class L shares and Class M shares, respectively, offered by the other Strategic Partners Funds. Class X shares are closed to new purchases. The authorized capital stock of the Funds is 5.5 billion shares, with a par value of $.001 per share. Class Z shares are not subject to any sales or redemption charge and are offered exclusively for sale to a limited group of investors.
| | |
| 32 | | Visit our website at www.jennisondryden.com |
Transactions in shares of capital stock were as follows:
| | | | | | | |
Class A | | Shares | | | Amount | |
Year ended October 31, 2007: | | | | | | | |
Shares sold | | 360,615 | | | $ | 6,583,935 | |
Shares issued in reinvestment of dividends and distributions | | 172,072 | | | | 3,052,550 | |
Shares reacquired | | (911,833 | ) | | | (16,746,058 | ) |
| | | | | | | |
Net increase (decrease) in shares outstanding before conversion | | (379,146 | ) | | | (7,109,573 | ) |
Shares issued upon conversion from Class B, Class M and Class X | | 887,793 | | | | 16,434,741 | |
| | | | | | | |
Net increase (decrease) in shares outstanding | | 508,647 | | | $ | 9,325,168 | |
| | | | | | | |
Year ended October 31, 2006: | | | | | | | |
Shares sold | | 1,807,136 | | | $ | 31,681,312 | |
Shares issued in reinvestment of dividends and distributions | | 149,137 | | | | 2,514,438 | |
Shares reacquired | | (700,787 | ) | | | (12,404,100 | ) |
| | | | | | | |
Net increase (decrease) in shares outstanding before conversion | | 1,255,486 | | | | 21,791,650 | |
Shares issued upon conversion from Class B, Class M and Class X into Class A | | 215,609 | | | | 3,785,068 | |
| | | | | | | |
Net increase (decrease) in shares outstanding | | 1,471,095 | | | $ | 25,576,718 | |
| | | | | | | |
Class B | | | | | | |
Year ended October 31, 2007: | | | | | | | |
Shares sold | | 68,383 | | | $ | 1,173,907 | |
Shares issued in reinvestment of dividends and distributions | | 230,121 | | | | 3,817,707 | |
Shares reacquired | | (653,000 | ) | | | (11,197,496 | ) |
| | | | | | | |
Net increase (decrease) in shares outstanding before conversion | | (354,496 | ) | | | (6,205,882 | ) |
Shares reacquired upon conversion into Class A | | (45,391 | ) | | | (775,070 | ) |
| | | | | | | |
Net increase (decrease) in shares outstanding | | (399,887 | ) | | $ | (6,980,952 | ) |
| | | | | | | |
Year ended October 31, 2006: | | | | | | | |
Shares sold | | 3,328,648 | | | $ | 55,040,516 | |
Shares issued in reinvestment of dividends and distributions | | 42,509 | | | | 679,292 | |
Shares reacquired | | (744,053 | ) | | | (12,456,689 | ) |
| | | | | | | |
Net increase (decrease) in shares outstanding before conversion | | 2,627,104 | | | | 43,263,119 | |
Shares reacquired upon conversion into Class A | | (29,508 | ) | | | (482,512 | ) |
| | | | | | | |
Net increase (decrease) in shares outstanding | | 2,597,596 | | | $ | 42,780,607 | |
| | | | | | | |
| | |
| Dryden Mid Cap Value Fund | | 33 |
Notes to Financial Statements
continued
| | | | | | | |
Class C | | Shares | | | Amount | |
Year ended October 31, 2007: | | | | | | | |
Shares sold | | 150,475 | | | $ | 2,576,572 | |
Shares issued in reinvestment of dividends and distributions | | 383,382 | | | | 6,352,634 | |
Shares reacquired | | (1,255,578 | ) | | | (21,482,279 | ) |
| | | | | | | |
Net increase (decrease) in shares outstanding | | (721,721 | ) | | $ | (12,553,073 | ) |
| | | | | | | |
Year ended October 31, 2006: | | | | | | | |
Shares sold | | 2,756,378 | | | $ | 45,607,381 | |
Shares issued in reinvestment of dividends and distributions | | 593,277 | | | | 9,462,775 | |
Shares reacquired | | (1,589,867 | ) | | | (26,655,615 | ) |
| | | | | | | |
Net increase (decrease) in shares outstanding | | 1,759,788 | | | $ | 28,414,541 | |
| | | | | | | |
Class L | | | | | | |
Year ended October 31, 2007: | | | | | | | |
Shares sold | | 29,758 | | | $ | 530,301 | |
Shares issued in reinvestment of dividends and distributions | | 159,446 | | | | 2,795,092 | |
Shares reacquired | | (702,441 | ) | | | (12,692,169 | ) |
| | | | | | | |
Net increase (decrease) in shares outstanding | | (513,237 | ) | | $ | (9,366,776 | ) |
| | | | | | | |
Year ended October 31, 2006: | | | | | | | |
Shares sold | | 112,111 | | | $ | 2,022,806 | |
Shares issued in reinvestment of dividends and distributions | | 480,517 | | | | 8,024,632 | |
Shares reacquired | | (928,975 | ) | | | (16,431,846 | ) |
| | | | | | | |
Net increase (decrease) in shares outstanding | | (336,347 | ) | | $ | (6,384,408 | ) |
| | | | | | | |
Class M | | | | | | |
Year ended October 31, 2007: | | | | | | | |
Shares sold | | 78,946 | | | $ | 1,333,121 | |
Shares issued in reinvestment of dividends and distributions | | 520,264 | | | | 8,615,580 | |
Shares reacquired | | (1,888,168 | ) | | | (32,248,443 | ) |
| | | | | | | |
Net increase (decrease) in shares outstanding before conversion | | (1,288,958 | ) | | | (22,299,742 | ) |
Shares reacquired upon conversion into Class A | | (904,501 | ) | | | (15,582,223 | ) |
| | | | | | | |
Net increase (decrease) in shares outstanding | | (2,193,459 | ) | | $ | (37,881,965 | ) |
| | | | | | | |
Year ended October 31, 2006: | | | | | | | |
Shares sold | | 450,507 | | | $ | 7,536,531 | |
Shares issued in reinvestment of dividends and distributions | | 1,552,098 | | | | 24,755,971 | |
Shares reacquired | | (2,780,839 | ) | | | (46,726,666 | ) |
| | | | | | | |
Net increase (decrease) in shares outstanding before conversion | | (778,234 | ) | | | (14,434,164 | ) |
Shares reacquired upon conversion into Class A | | (128,616 | ) | | | (2,117,075 | ) |
| | | | | | | |
Net increase (decrease) in shares outstanding | | (906,850 | ) | | | $(16,551,239) | |
| | | | | | | |
| | |
| 34 | | Visit our website at www.jennisondryden.com |
| | | | | | | |
Class X | | Shares | | | Amount | |
Year ended October 31, 2007: | | | | | | | |
Shares sold | | 48,538 | | | $ | 832,479 | |
Shares issued in reinvestment of dividends and distributions | | 92,812 | | | | 1,545,327 | |
Shares reacquired | | (375,243 | ) | | | (6,485,746 | ) |
| | | | | | | |
Net increase (decrease) in shares outstanding before conversion | | (233,893 | ) | | | (4,107,940 | ) |
Shares reacquired upon conversion into Class A | | (4,276 | ) | | | (77,449 | ) |
| | | | | | | |
Net increase (decrease) in shares outstanding | | (238,169 | ) | | $ | (4,185,389 | ) |
| | | | | | | |
Year ended October 31, 2006: | | | | | | | |
Shares sold | | 103,884 | | | $ | 1,776,262 | |
Shares issued in reinvestment of dividends and distributions | | 282,169 | | | | 4,483,671 | |
Shares reacquired | | (465,539 | ) | | | (7,850,896 | ) |
| | | | | | | |
Net increase (decrease) in shares outstanding before conversion | | (79,486 | ) | | | (1,590,963 | ) |
Shares reacquired upon conversion into Class A | | (70,700 | ) | | | (1,185,481 | ) |
| | | | | | | |
Net increase (decrease) in shares outstanding | | (150,186 | ) | | $ | (2,776,444 | ) |
| | | | | | | |
Class Z | | | | | | |
Year ended October 31, 2007: | | | | | | | |
Shares sold | | 233,078 | | | $ | 4,518,655 | |
Shares issued in reinvestment of dividends and distributions | | 58,004 | | | | 1,031,311 | |
Shares reacquired | | (220,443 | ) | | | (4,068,156 | ) |
| | | | | | | |
Net increase (decrease) in shares outstanding | | 70,639 | | | $ | 1,481,810 | |
| | | | | | | |
Year ended October 31, 2006: | | | | | | | |
Shares sold | | 907,046 | | | $ | 15,819,870 | |
Shares issued in reinvestment of dividends and distributions | | — | | | | — | |
Shares reacquired | | (229,095 | ) | | | (4,085,031 | ) |
| | | | | | | |
Net increase (decrease) in shares outstanding | | 677,951 | | | $ | 11,734,839 | |
| | | | | | | |
5. Distributions and Tax Information
Distributions to shareholders, which are determined in accordance with federal income tax regulations, which may differ from generally accepted accounting principles, are recorded on the ex-dividend date. In order to present accumulated net investment loss, accumulated net realized gain on investment transactions on the Statement of Assets and Liabilities that more closely represent their tax character, certain adjustments have been made to paid-in-capital in excess of par, accumulated net investment loss and accumulated net realized gain on investment transactions. For the tax year ended October 31, 2007 the adjustments were to decrease accumulated net investment loss by $502,977, decrease accumulated net realized gain on investments by $624,862 and increase paid-in capital in excess of par by $121,885 due to the treatment for book and tax purposes of net operating losses, investments in real estate investment trusts and deemed distributions due to shareholder redemptions. Net investment loss, net realized gains and net assets were not affected by this change.
| | |
| Dryden Mid Cap Value Fund | | 35 |
Notes to Financial Statements
continued
For the year ended October 31, 2007, the tax character of dividends paid as reflected in the Statement of Changes in Net Assets was $115,876 from ordinary income and $31,630,711 from long-term capital gains. For the year ended October 31, 2006, the tax character of dividends paid as reflected in the Statement of Changes in Net Assets was $319,005 from ordinary income and $59,130,489 from long-term capital gains. For federal income tax purposes, dividends from net investment income and distributions from short-term capital gains are taxable as ordinary income. Long-term capital gain distributions are taxable as such.
As of October 31, 2007, the accumulated undistributed earnings on a tax basis were $10,401,649 from ordinary income and $50,667,392 from long-term capital gains, respectively. This differs from the amount shown on the Statement of Assets and Liabilities primarily due to cumulative timing differences between financial and tax reporting.
The federal income tax basis of the Fund’s investments and the net unrealized appreciation as of October 31, 2007 was as follows:
| | | | | | |
Tax basis | | Appreciation | | Depreciation | | Net Unrealized
Appreciation |
| $324,177,609 | | $49,883,946 | | $22,027,615 | | $27,856,331 |
The difference between book basis and tax basis was primarily attributable to deferred losses on wash sales and investments in real estate investment trusts.
6. Portfolio Securities
Purchases and sales of securities, other than U.S. government securities and short-term obligations, during the year ended October 31, 2007, were $254,845,410 and $343,230,022, respectively.
7. Line of Credit
The Fund, along with other affiliated registered investment companies (the “Funds”), is a party to a syndicated credit agreement (“SCA”) with two banks. The SCA provides for a commitment of $500 million. Interest on any borrowings under the SCA is incurred at market rates and a commitment fee for the unused amount is accrued daily and paid quarterly. Effective October 26, 2007, the Funds renewed the SCA with the banks. The
| | |
| 36 | | Visit our website at www.jennisondryden.com |
commitment under the renewed SCA continues to be $500 million. The Funds pay a commitment fee of .06 of 1% of the unused portion of the renewed SCA. The expiration date of the renewed SCA will be October 24, 2008. For the period from October 27, 2006 through October 26, 2007, the Funds paid a commitment fee of .07 of 1% of the unused portion of the agreement. The purpose of the SCA is to provide an alternative source of temporary funding for capital share redemptions. The Fund did not utilize the line of credit during the fiscal period ended October 31, 2007.
8. Reorganizations
Based on an approval by the shareholders on September 21, 2005 of an Agreement and Plan of Reorganization (the “Plan”) which provided for the transfer of the net assets of the Class A, B, C, and Z shares of Strategic Partners Opportunity Funds—Mid Cap Value Fund for like shares of Dryden Mid Cap Value Fund (formerly known as Strategic Partners Mid Cap Value Fund). A reorganization took place on November 25, 2005.
The reorganization was accomplished by a tax-free exchange of the following shares:
| | | | | | | | | |
Merged Fund | | Acquiring Fund |
Strategic Partners
Opportunity Funds—
Mid Cap Value Fund | | Dryden
Mid Cap Value Fund
(formerly known as Strategic
Partners Mid Cap Value Fund) |
| | | Shares | | | | Shares | | Value |
Class A | | 1,678,233 | | Class A | | 1,202,819 | | $ | 20,965,128 |
B | | 4,413,301 | | B | | 3,240,103 | | | 53,526,504 |
C | | 3,235,587 | | C | | 2,378,032 | | | 39,237,531 |
Z | | 1,213,367 | | Z | | 876,999 | | | 15,286,100 |
The aggregate net assets and unrealized appreciation of the Merged Fund immediately before the acquisitions and the acquired capital loss carryforwards from the merged funds were as follows:
| | | | | | |
Merged Fund | | Total Net Assets | | Net Unrealized
Appreciation |
Strategic Partners Opportunity Funds—
Mid Cap Value Fund | | $ | 129,015,263 | | $ | 25,786,234 |
| | |
Acquiring Fund | | Total Net Assets | | |
Dryden Mid Cap Value Fund | | $ | 305,693,627 | | | |
| | |
| Dryden Mid Cap Value Fund | | 37 |
Notes to Financial Statements
continued
9. New Accounting Pronouncements
On July 13, 2006, the Financial Accounting Standards Board (FASB) released FASB Interpretation No. 48 “Accounting for Uncertainty in Income Taxes” (FIN 48). FIN 48 provides guidance for how uncertain tax positions should be recognized, measured, presented and disclosed in the financial statements. FIN 48 requires the evaluation of tax positions taken or expected to be taken in the course of preparing the Fund’s tax returns to determine whether the tax positions are “more-likely-than-not” of being sustained by the applicable tax authority. The impact of the tax positions not deemed to meet the more-likely-than-not threshold would be recorded in the year in which they arise. On December 22, 2006, the Securities and Exchange Commission delayed the effective date until the last net asset value calculation in the first required financial reporting period for its fiscal year beginning after December 15, 2006. The Fund’s financial statements have not been impacted by the adoption of FIN 48. However, the conclusions regarding FIN 48 may be subject to review and adjustment at a later date based on factors including, but not limited to, further implementation guidance expected from FASB and on-going analysis of tax laws, regulations, and interpretations thereof.
On September 20, 2006, the FASB released Statement of Financial Accounting Standards No. 157 “Fair Value Measurements” (FAS 157). FAS 157 establishes an authoritative definition of fair value, sets out a framework for measuring fair value, and requires additional disclosures about fair-value measurements. The application of FAS 157 is required for fiscal years beginning after November 15, 2007 and interim periods within those fiscal years. At this time, management is evaluating the implications of FAS 157 and its impact, if any, in the financial statements has not yet been determined.
| | |
| 38 | | Visit our website at www.jennisondryden.com |
Financial Highlights
| | |
| October 31, 2007 | | ANNUAL REPORT |
Dryden Mid Cap Value Fund
Financial Highlights
| | | | |
| |
| | | Class A | |
| | | Year Ended
October 31, 2007(e) | |
Per Share Operating Performance: | | | | |
Net Asset Value, Beginning Of Period | | $ | 18.26 | |
| | | | |
Income from investment operations: | | | | |
Net investment income (loss) | | | 0.06 | |
Net realized and unrealized gain on investments | | | 1.68 | |
| | | | |
Total from investment operations | | | 1.74 | |
| | | | |
Less Dividends and Distributions: | | | | |
Dividends from net investment income | | | — | |
Distributions from net realized gains | | | (1.62 | ) |
| | | | |
Total dividends and distributions | | | (1.62 | ) |
| | | | |
Net asset value, end of period | | $ | 18.38 | |
| | | | |
Total Investment Return(a) | | | 9.78 | % |
Ratios/Supplemental Data: | | | | |
Net assets, end of period (in millions) | | $ | 54.8 | |
Ratios to average net assets: | | | | |
Expenses after advisory fee waiver and expense reimbursement | | | 1.48 | % |
Expenses before advisory fee waiver and expense reimbursement | | | 1.48 | % |
Net investment income (loss) | | | 0.34 | % |
Portfolio turnover rate | | | 78 | % |
| (a) | Total return does not consider the effects of sales load. Total return is calculated assuming a purchase of a share on the first day and a sale on the last day of each period reported and includes reinvestment of dividends and distributions. Total investment returns may reflect adjustments to conform to generally accepted accounting principles. Total return for periods of less than a full year are not annualized. Total return includes the effect of expense subsidies. |
| (d) | Commencement of operations. |
| (e) | Calculations are based on the average daily number of shares outstanding. |
See Notes to Financial Statements.
| | |
| 40 | | Visit our website at www.jennisondryden.com |
| | | | | | | | | | |
| Class A | |
| Year Ended October 31, | | | April 12, 2004(d)
through October 31, 2004(e) | |
| 2006(e) | | | 2005 | | |
| | | | | | | | | | |
| $ | 20.12 | | | $ | 19.33 | | | $ | 18.92 | |
| | | | | | | | | | | |
| | | | | | | | | | |
| | 0.02 | | | | (0.07 | ) | | | (0.03 | ) |
| | 2.10 | | | | 3.11 | | | | 0.44 | |
| | | | | | | | | | | |
| | 2.12 | | | | 3.04 | | | | 0.41 | |
| | | | | | | | | | | |
| | | | | | | | | | |
| | — | | | | — | | | | — | |
| | (3.98 | ) | | | (2.25 | ) | | | — | |
| | | | | | | | | | | |
| | (3.98 | ) | | | (2.25 | ) | | | — | |
| | | | | | | | | | | |
| $ | 18.26 | | | $ | 20.12 | | | $ | 19.33 | |
| | | | | | | | | | | |
| | 12.24 | % | | | 16.74 | % | | | 2.17 | % |
| | | | | | | | | | |
| $ | 45.2 | | | $ | 20.2 | | | $ | 13.7 | |
| | | | | | | | | | |
| | 1.46 | % | | | 1.60 | % | | | 1.60 | %(b) |
| | 1.46 | % | | | 1.65 | % | | | 1.64 | %(b) |
| | 0.13 | % | | | (0.26 | )% | | | (0.29 | )%(b) |
| | 80 | % | | | 98 | % | | | 80 | %(c) |
See Notes to Financial Statements.
| | |
| Dryden Mid Cap Value Fund | | 41 |
Financial Highlights
continued
| | | | |
| |
| | | Class B | |
| | | Year Ended
October 31, 2007(e) | |
Per Share Operating Performance: | | | | |
Net Asset Value, Beginning Of Period | | $ | 17.19 | |
| | | | |
Income from investment operations: | | | | |
Net investment loss | | | (0.07 | ) |
Net realized and unrealized gain on investments | | | 1.57 | |
| | | | |
Total from investment operations | | | 1.50 | |
| | | | |
Less Dividends and Distributions: | | | | |
Dividends from net investment income | | | — | |
Distributions from net realized gains | | | (1.62 | ) |
| | | | |
Total dividends and distributions | | | (1.62 | ) |
| | | | |
Net asset value, end of period | | $ | 17.07 | |
| | | | |
Total Investment Return(a) | | | 8.99 | % |
Ratios/Supplemental Data: | | | | |
Net assets, end of period (in millions) | | $ | 40.6 | |
Ratios to average net assets: | | | | |
Expenses after advisory fee waiver and expense reimbursement | | | 2.23 | % |
Expenses before advisory fee waiver and expense reimbursement | | | 2.23 | % |
Net investment loss | | | (0.42 | )% |
Portfolio turnover rate | | | 78 | % |
| (a) | Total return does not consider the effects of sales load. Total return is calculated assuming a purchase of a share on the first day and a sale on the last day of each period reported and includes reinvestment of dividends and distributions. Total investment returns may reflect adjustments to conform to generally accepted accounting principles. Total return for periods of less than a full year are not annualized. Total return includes the effect of expense subsidies. |
| (d) | Commencement of operations. |
| (e) | Calculations are based on the average daily number of shares outstanding. |
See Notes to Financial Statements.
| | |
| 42 | | Visit our website at www.jennisondryden.com |
| | | | | | | | | | |
| Class B | |
| Year Ended October 31, | | | April 12, 2004(d)
through
October 31, 2004(e) | |
| 2006(e) | | | 2005 | | |
| | | | | | | | | | |
| $ | 19.28 | | | $ | 18.74 | | | $ | 18.43 | |
| | | | | | | | | | | |
| | | | | | | | | | |
| | (0.11 | ) | | | (0.17 | ) | | | (0.11 | ) |
| | 2.00 | | | | 2.96 | | | | 0.42 | |
| | | | | | | | | | | |
| | 1.89 | | | | 2.79 | | | | 0.31 | |
| | | | | | | | | | | |
| | | | | | | | | | |
| | — | | | | — | | | | — | |
| | (3.98 | ) | | | (2.25 | ) | | | — | |
| | | | | | | | | | | |
| | (3.98 | ) | | | (2.25 | ) | | | — | |
| | | | | | | | | | | |
| $ | 17.19 | | | $ | 19.28 | | | $ | 18.74 | |
| | | | | | | | | | | |
| | 11.36 | % | | | 15.85 | % | | | 1.68 | % |
| | | | | | | | | | |
| $ | 47.7 | | | $ | 3.5 | | | $ | 1.1 | |
| | | | | | | | | | |
| | 2.21 | % | | | 2.35 | % | | | 2.35 | %(b) |
| | 2.21 | % | | | 2.40 | % | | | 2.39 | %(b) |
| | (0.67 | )% | | | (1.02 | )% | | | (1.07 | )%(b) |
| | 80 | % | | | 98 | % | | | 80 | %(c) |
See Notes to Financial Statements.
| | |
| Dryden Mid Cap Value Fund | | 43 |
Financial Highlights
continued
| | | | |
| | | Class C | |
| | | Year Ended
October 31, 2007(b) | |
Per Share Operating Performance: | | | | |
Net Asset Value, Beginning Of Year | | $ | 17.17 | |
| | | | |
Income from investment operations: | | | | |
Net investment loss | | | (0.07 | ) |
Net realized and unrealized gain on investments | | | 1.57 | |
| | | | |
Total from investment operations | | | 1.50 | |
| | | | |
Less Dividends and Distributions: | | | | |
Dividends from net investment income | | | — | |
Distributions from net realized gains | | | (1.62 | ) |
| | | | |
Total dividends and distributions | | | (1.62 | ) |
| | | | |
Net asset value, end of year | | $ | 17.05 | |
| | | | |
Total Investment Return(a) | | | 9.00 | % |
Ratios/Supplemental Data: | | | | |
Net assets, end of year (in millions) | | $ | 67.3 | |
Ratios to average net assets: | | | | |
Expenses after advisory fee waiver and expense reimbursement | | | 2.23 | % |
Expenses before advisory fee waiver and expense reimbursement | | | 2.23 | % |
Net investment loss | | | (0.42 | )% |
Portfolio turnover rate | | | 78 | % |
| (a) | Total return does not consider the effects of sales load. Total return is calculated assuming a purchase of a share on the first day and a sale on the last day of each year reported and includes reinvestment of dividends and distributions. Total investment returns may reflect adjustments to conform to generally accepted accounting principles. |
| (b) | Calculations are based on the average daily number of shares outstanding. |
See Notes to Financial Statements.
| | |
| 44 | | Visit our website at www.jennisondryden.com |
| | | | | | | | | | | | | | |
| Class C | |
| Year Ended October 31, | |
| 2006(b) | | | 2005 | | | 2004(b) | | | 2003(b) | |
| | | | | | | | | | | | | | |
| $ | 19.25 | | | $ | 18.73 | | | $ | 16.40 | | | $ | 12.84 | |
| | | | | | | | | | | | | | | |
| | | | | | | | | | | | | | |
| | (0.10 | ) | | | (0.21 | ) | | | (0.18 | ) | | | (0.16 | ) |
| | 2.00 | | | | 2.98 | | | | 2.66 | | | | 3.72 | |
| | | | | | | | | | | | | | | |
| | 1.90 | | | | 2.77 | | | | 2.48 | | | | 3.56 | |
| | | | | | | | | | | | | | | |
| | | | | | | | | | | | | | |
| | — | | | | — | | | | — | | | | — | |
| | (3.98 | ) | | | (2.25 | ) | | | (0.15 | ) | | | — | |
| | | | | | | | | | | | | | | |
| | (3.98 | ) | | | (2.25 | ) | | | (0.15 | ) | | | — | |
| | | | | | | | | | | | | | | |
| $ | 17.17 | | | $ | 19.25 | | | $ | 18.73 | | | $ | 16.40 | |
| | | | | | | | | | | | | | | |
| | 11.45 | % | | | 15.75 | % | | | 15.21 | % | | | 27.73 | % |
| | | | | | | | | | | | | | |
| $ | 80.2 | | | $ | 56.0 | | | $ | 58.6 | | | $ | 42.7 | |
| | | | | | | | | | | | | | |
| | 2.21 | % | | | 2.35 | % | | | 2.35 | % | | | 2.35 | % |
| | 2.21 | % | | | 2.40 | % | | | 2.39 | % | | | 2.52 | % |
| | (0.58 | )% | | | (1.03 | )% | | | (1.02 | )% | | | (1.16 | )% |
| | 80 | % | | | 98 | % | | | 80 | % | | | 61 | % |
See Notes to Financial Statements.
| | |
| Dryden Mid Cap Value Fund | | 45 |
Financial Highlights
continued
| | | | |
| | | Class L(c) | |
| | | Year Ended
October 31, 2007(b) | |
Per Share Operating Performance: | | | | |
Net Asset Value, Beginning Of Year | | $ | 18.07 | |
| | | | |
Income from investment operations: | | | | |
Net investment income (loss) | | | 0.01 | |
Net realized and unrealized gain on investments | | | 1.66 | |
| | | | |
Total from investment operations | | | 1.67 | |
| | | | |
Less Dividends and Distributions: | | | | |
Dividends from net investment income | | | — | |
Distributions from net realized gains | | | (1.62 | ) |
| | | | |
Total dividends and distributions | | | (1.62 | ) |
| | | | |
Net asset value, end of year | | $ | 18.12 | |
| | | | |
Total Investment Return(a) | | | 9.54 | % |
Ratios/Supplemental Data: | | | | |
Net assets, end of year (in millions) | | $ | 29.1 | |
Ratios to average net assets: | | | | |
Expenses after advisory fee waiver and expense reimbursement | | | 1.73 | % |
Expenses before advisory fee waiver and expense reimbursement | | | 1.73 | % |
Net investment income (loss) | | | 0.08 | % |
Portfolio turnover rate | | | 78 | % |
| (a) | Total return does not consider the effects of sales load. Total return is calculated assuming a purchase of a share on the first day and a sale on the last day of each year reported and includes reinvestment of dividends and distributions. Total investment returns may reflect adjustments to conform to generally accepted accounting principles. |
| (b) | Calculations are based on the average daily number of shares outstanding. |
| (c) | Prior to April 12, 2004, Class L shares were known as Class A shares. On April 12, 2004, Class A shares were redesignated as Class L shares and a new Class A was opened. |
| * | Amount is less than $0.005. |
See Notes to Financial Statements.
| | |
| 46 | | Visit our website at www.jennisondryden.com |
| | | | | | | | | | | | | | |
| Class L(c) | |
| Year Ended October 31, | |
| 2006(b) | | | 2005 | | | 2004(b) | | | 2003(b) | |
| | | | | | | | | | | | | | |
| $ | 19.98 | | | $ | 19.28 | | | $ | 16.79 | | | $ | 13.08 | |
| | | | | | | | | | | | | | | |
| | | | | | | | | | | | | | |
| | — | * | | | (0.10 | ) | | | (0.10 | ) | | | (0.09 | ) |
| | 2.07 | | | | 3.05 | | | | 2.74 | | | | 3.80 | |
| | | | | | | | | | | | | | | |
| | 2.07 | | | | 2.95 | | | | 2.64 | | | | 3.71 | |
| | | | | | | | | | | | | | | |
| | | | | | | | | | | | | | |
| | — | | | | — | | | | — | | | | — | |
| | (3.98 | ) | | | (2.25 | ) | | | (0.15 | ) | | | — | |
| | | | | | | | | | | | | | | |
| | (3.98 | ) | | | (2.25 | ) | | | (0.15 | ) | | | — | |
| | | | | | | | | | | | | | | |
| $ | 18.07 | | | $ | 19.98 | | | $ | 19.28 | | | $ | 16.79 | |
| | | | | | | | | | | | | | | |
| | 11.99 | % | | | 16.29 | % | | | 15.81 | % | | | 28.37 | % |
| | | | | | | | | | | | | | |
| $ | 38.3 | | | $ | 49.1 | | | $ | 68.0 | | | $ | 51.8 | |
| | | | | | | | | | | | | | |
| | 1.71 | % | | | 1.85 | % | | | 1.85 | % | | | 1.85 | % |
| | 1.71 | % | | | 1.90 | % | | | 1.89 | % | | | 2.01 | % |
| | (0.01 | )% | | | (0.53 | )% | | | (0.53 | )% | | | (0.66 | )% |
| | 80 | % | | | 98 | % | | | 80 | % | | | 61 | % |
See Notes to Financial Statements.
| | |
| Dryden Mid Cap Value Fund | | 47 |
Financial Highlights
continued
| | | | |
| | | Class M(c) | |
| | | Year Ended
October 31, 2007(b) | |
Per Share Operating Performance: | | | | |
Net Asset Value, Beginning Of Year | | $ | 17.16 | |
| | | | |
Income from investment operations: | | | | |
Net investment loss | | | (0.07 | ) |
Net realized and unrealized gain on investments | | | 1.56 | |
| | | | |
Total from investment operations | | | 1.49 | |
| | | | |
Less Dividends and Distributions: | | | | |
Dividends from net investment income | | | — | |
Distributions from net realized gains | | | (1.62 | ) |
| | | | |
Total dividends and distributions | | | (1.62 | ) |
| | | | |
Net asset value, end of year | | $ | 17.03 | |
| | | | |
Total Investment Return(a) | | | 8.95 | % |
Ratios/Supplemental Data: | | | | |
Net assets, end of year (in millions) | | $ | 69.6 | |
Ratios to average net assets: | | | | |
Expenses after advisory fee waiver and expense reimbursement | | | 2.23 | % |
Expenses before advisory fee waiver and expense reimbursement | | | 2.23 | % |
Net investment loss | | | (0.43 | )% |
Portfolio turnover rate | | | 78 | % |
| (a) | Total return does not consider the effects of sales load. Total return is calculated assuming a purchase of a share on the first day and a sale on the last day of each year reported and includes reinvestment of dividends and distributions. Total investment returns may reflect adjustments to conform to generally accepted accounting principles. |
| (b) | Calculations are based on the average daily number of shares outstanding. |
| (c) | Prior to April 12, 2004, Class M shares were known as Class B shares. On April 12, 2004, Class B shares were redesignated as Class M shares and a new Class B was opened. |
See Notes to Financial Statements.
| | |
| 48 | | Visit our website at www.jennisondryden.com |
| | | | | | | | | | | | | | |
| Class M(c) | |
| Year Ended October 31, | |
| 2006(b) | | | 2005 | | | 2004(b) | | | 2003(b) | |
| | | | | | | | | | | | | | |
| $ | 19.25 | | | $ | 18.73 | | | $ | 16.40 | | | $ | 12.83 | |
| | | | | | | | | | | | | | | |
| | | | | | | | | | | | | | |
| | (0.09 | ) | | | (0.22 | ) | | | (0.18 | ) | | | (0.16 | ) |
| | 1.98 | | | | 2.99 | | | | 2.66 | | | | 3.73 | |
| | | | | | | | | | | | | | | |
| | 1.89 | | | | 2.77 | | | | 2.48 | | | | 3.57 | |
| | | | | | | | | | | | | | | |
| | | | | | | | | | | | | | |
| | — | | | | — | | | | — | | | | — | |
| | (3.98 | ) | | | (2.25 | ) | | | (0.15 | ) | | | — | |
| | | | | | | | | | | | | | | |
| | (3.98 | ) | | | (2.25 | ) | | | (0.15 | ) | | | — | |
| | | | | | | | | | | | | | | |
| $ | 17.16 | | | $ | 19.25 | | | $ | 18.73 | | | $ | 16.40 | |
| | | | | | | | | | | | | | | |
| | 11.38 | % | | | 15.75 | % | | | 15.21 | % | | | 27.83 | % |
| | | | | | | | | | | | | | |
| $ | 107.8 | | | $ | 138.4 | | | $ | 147.1 | | | $ | 102.7 | |
| | | | | | | | | | | | | | |
| | 2.21 | % | | | 2.35 | % | | | 2.35 | % | | | 2.35 | % |
| | 2.21 | % | | | 2.40 | % | | | 2.39 | % | | | 2.52 | % |
| | (0.51 | )% | | | (1.03 | )% | | | (1.02 | )% | | | (1.16 | )% |
| | 80 | % | | | 98 | % | | | 80 | % | | | 61 | % |
See Notes to Financial Statements.
| | |
| Dryden Mid Cap Value Fund | | 49 |
Financial Highlights
continued
| | | | |
| | | Class X | |
| | | Year Ended
October 31, 2007(b) | |
Per Share Operating Performance: | | | | |
Net Asset Value, Beginning Of Year | | $ | 17.23 | |
| | | | |
Income from investment operations: | | | | |
Net investment income (loss) | | | 0.10 | |
Net realized and unrealized gain on investments | | | 1.58 | |
| | | | |
Total from investment operations | | | 1.68 | |
| | | | |
Less Dividends and Distributions: | | | | |
Dividends from net investment income | | | — | |
Distributions from net realized gains | | | (1.62 | ) |
| | | | |
Total dividends and distributions | | | (1.62 | ) |
| | | | |
Net asset value, end of year | | $ | 17.29 | |
| | | | |
Total Investment Return(a) | | | 10.04 | % |
Ratios/Supplemental Data: | | | | |
Net assets, end of year (in millions) | | $ | 15.7 | |
Ratios to average net assets: | | | | |
Expenses after advisory fee waiver and expense reimbursement | | | 1.23 | % |
Expenses before advisory fee waiver and expense reimbursement | | | 1.23 | % |
Net investment income (loss) | | | 0.58 | % |
Portfolio turnover rate | | | 78 | % |
| (a) | Total return does not consider the effects of sales load. Total return is calculated assuming a purchase of a share on the first day and a sale on the last day of each year reported and includes reinvestment of dividends and distributions. Total investment returns may reflect adjustments to conform to generally accepted accounting principles. |
| (b) | Calculations are based on the average daily number of shares outstanding. |
| (c) | Total return for Class X shares does not reflect the payment of bonus shares. |
See Notes to Financial Statements.
| | |
| 50 | | Visit our website at www.jennisondryden.com |
| | | | | | | | | | | | | | |
| Class X | |
| Year Ended October 31, | |
| 2006(b) | | | 2005 | | | 2004(b) | | | 2003(b) | |
| | | | | | | | | | | | | | |
| $ | 19.19 | | | $ | 18.69 | | | $ | 16.37 | | | $ | 12.81 | |
| | | | | | | | | | | | | | | |
| | | | | | | | | | | | | | |
| | 0.05 | | | | (0.22 | ) | | | (0.18 | ) | | | (0.16 | ) |
| | 1.97 | | | | 2.97 | | | | 2.65 | | | | 3.72 | |
| | | | | | | | | | | | | | | |
| | 2.02 | | | | 2.75 | | | | 2.47 | | | | 3.56 | |
| | | | | | | | | | | | | | | |
| | | | | | | | | | | | | | |
| | — | | | | — | | | | — | | | | — | |
| | (3.98 | ) | | | (2.25 | ) | | | (0.15 | ) | | | — | |
| | | | | | | | | | | | | | | |
| | (3.98 | ) | | | (2.25 | ) | | | (0.15 | ) | | | — | |
| | | | | | | | | | | | | | | |
| $ | 17.23 | | | $ | 19.19 | | | $ | 18.69 | | | $ | 16.37 | |
| | | | | | | | | | | | | | | |
| | 12.33 | % | | | 15.67 | % | | | 15.18 | %(c) | | | 27.79 | %(c) |
| | | | | | | | | | | | | | |
| $ | 19.7 | | | $ | 24.8 | | | $ | 26.4 | | | $ | 19.8 | |
| | | | | | | | | | | | | | |
| | 1.39 | % | | | 2.35 | % | | | 2.35 | % | | | 2.35 | % |
| | 1.39 | % | | | 2.40 | % | | | 2.39 | % | | | 2.52 | % |
| | 0.31 | % | | | (1.03 | )% | | | (1.02 | )% | | | (1.16 | )% |
| | 80 | % | | | 98 | % | | | 80 | % | | | 61 | % |
See Notes to Financial Statements.
| | |
| Dryden Mid Cap Value Fund | | 51 |
Financial Highlights
continued
| | | | | | | | |
| | | Class Z | |
| | | Year Ended
October 31, 2007(e) | | | November 28, 2005(d)
through
October 31, 2006(e) | |
Per Share Operating Performance: | | | | | | | | |
Net Asset Value, Beginning Of Period | | $ | 18.30 | | | $ | 17.08 | |
| | | | | | | | |
Income from investment operations: | | | | | | | | |
Net investment income | | | 0.11 | | | | 0.05 | |
Net realized and unrealized gain on investments | | | 1.71 | | | | 1.17 | |
| | | | | | | | |
Total from investment operations | | | 1.82 | | | | 1.22 | |
| | | | | | | | |
Less Dividends and Distributions: | | | | | | | | |
Dividends from net investment income | | | — | | | | — | |
Distributions from net realized gains | | | (1.62 | ) | | | — | |
| | | | | | | | |
Total dividends and distributions | | | (1.62 | ) | | | — | |
| | | | | | | | |
Net asset value, end of period | | $ | 18.50 | | | $ | 18.30 | |
| | | | | | | | |
Total Investment Return(a) | | | 10.24 | % | | | 7.14 | % |
Ratios/Supplemental Data: | | | | | | | | |
Net assets, end of period (in millions) | | $ | 13.8 | | | $ | 12.4 | |
Ratios to average net assets: | | | | | | | | |
Expenses after advisory fee waiver and expense reimbursement | | | 1.23 | % | | | 1.21 | %(b) |
Expenses before advisory fee waiver and expense reimbursement | | | 1.23 | % | | | 1.21 | %(b) |
Net investment income | | | 0.58 | % | | | 0.32 | %(b) |
Portfolio turnover rate | | | 78 | % | | | 80 | %(c) |
| (a) | Total return is calculated assuming a purchase of a share on the first day and a sale on the last day of each period reported and includes reinvestment of dividends and distributions. Total investment returns may reflect adjustments to conform to generally accepted accounting principles. Total return for periods of less than a full year are not annualized. Total return includes the effect of expense subsidies. |
| (d) | Commencement of operations. |
| (e) | Calculations are based on the average daily number of shares outstanding. |
See Notes to Financial Statements.
| | |
| 52 | | Visit our website at www.jennisondryden.com |
Report of Independent Registered Public
Accounting Firm
The Board of Directors and Shareholders of
Dryden Mid Cap Value Fund:
We have audited the accompanying statement of assets and liabilities of Dryden Mid Cap Value Fund (hereafter referred to as the “Fund”), including the portfolio of investments, as of October 31, 2007, and the related statement of operations for the year then ended, the statement of changes in net assets for each of the years in the two-year period then ended and the financial highlights for each of the years in the four-year period then ended. These financial statements and financial highlights are the responsibility of the Fund’s management. Our responsibility is to express an opinion on these financial statements and financial highlights based on our audits. The financial highlights for the year ended October 31, 2003 were audited by another independent registered public accounting firm, whose report dated December 22, 2003, expressed an unqualified opinion thereon.
We conducted our audits in accordance with the standards of the Public Company Accounting Oversight Board (United States). Those standards require that we plan and perform the audit to obtain reasonable assurance about whether the financial statements and financial highlights are free of material misstatement. An audit includes examining, on a test basis, evidence supporting the amounts and disclosures in the financial statements. Our procedures included confirmation of securities owned as of October 31, 2007, by correspondence with the custodian and brokers or by other appropriate auditing procedures where replies from brokers were not received. An audit also includes assessing the accounting principles used and significant estimates made by management, as well as evaluating the overall financial statement presentation. We believe that our audits provide a reasonable basis for our opinion.
In our opinion, the financial statements and financial highlights referred to above present fairly, in all material respects, the financial position of the Fund as of October 31, 2007, and the results of its operations for the year then ended, the changes in its net assets for each of the years in the two-year period then ended and the financial highlights for each of the years in the four-year period then ended, in conformity with U.S. generally accepted accounting principles.

New York, New York
December 21, 2007
| | |
| Dryden Mid Cap Value Fund | | 53 |
Tax Information
(Unaudited)
We are required by the Internal Revenue Code to advise you within 60 days of the Fund’s fiscal year end (October 31, 2007), as to the federal income tax status of distributions paid by the Fund during such fiscal year. For the fiscal year ended October 31, 2007, the Fund paid short-term and long-term capital gain distributions of $0.006 and $1.6131 for Class A, B, C, L, M, X and Z shares, respectively. For federal income tax purposes, distributions from short-term capital gains are taxable as ordinary income. Long-term capital gain distributions are taxable as such.
Further, we wish to advise you that 100% of ordinary income dividends paid in the fiscal year ended October 31, 2007 qualified for the corporate dividend received deduction available to corporate taxpayers.
The Fund designates 100% of ordinary income dividends as qualified for the reduced tax rate under the Jobs and Growth Tax Relief Reconciliation Act of 2003.
The Fund designates 100% of ordinary income dividends as qualified short-term capital gains (QSTCG) under the American Jobs Creation Act of 2004.
In January 2008, you will be advised on IRS Form 1099DIV or substitute 1099DIV as to federal tax status of dividends and distributions received by you in calendar year 2007.
| | |
| 54 | | Visit our website at www.jennisondryden.com |
Management of the Fund
(Unaudited)
Information pertaining to the Directors of Dryden Mid Cap Value Fund (the “Fund”) is set forth below. Directors who are not deemed to be “interested persons” of the Fund, as defined in the Investment Company Act of 1940 (the 1940 Act), are referred to as “Independent Directors.” Directors who are deemed to be “interested persons” of the Fund are referred to as “Interested Directors.” “Fund Complex”† consists of the Fund and any other investment companies managed by PI.
Independent Directors(2)
Linda W. Bynoe (55), Director since 2005(3) Oversees 59 portfolios in Fund complex
Principal occupations (last 5 years): President and Chief Executive Officer (since March 1995) of Telemat, Ltd. (management consulting); formerly Vice President at Morgan Stanley & Co.
Other Directorships held: Director of Simon Property Group, Inc. (real estate investment trust) (since May 2003); Anixter International (communication products distributor) (since January 2006); Director of Northern Trust Corporation (since April 2006).
David E.A. Carson (73), Director since 1993(3) Oversees 63 portfolios in Fund complex
Principal occupations (last 5 years): Director (since October 2007) of ICI Mutual Insurance Company; formerly Chairman and Chief Executive Officer of People’s Bank (1988-2000).
Robert E. La Blanc (73), Director since 2003(3) Oversees 61 portfolios in Fund complex
Principal occupations (last 5 years): President (since 1981) of Robert E. La Blanc Associates, Inc. (telecommunications).
Other Directorships held:(4) Director of CA, Inc. (since 2002) (software company); FiberNet Telecom Group, Inc. (since 2003) (telecom company).
Douglas H. McCorkindale (68), Director since 2003(3) Oversees 59 portfolios in Fund complex
Principal occupations (last 5 years): Formerly Chairman (February 2001-June 2006), Chief Executive Officer (June 2000-July 2005), President (September 1997-July 2005) and Vice Chairman (March 1984-May 2000) of Gannett Co. Inc. (publishing and media).
Other Directorships held:(4) Director of Continental Airlines, Inc. (since May 1993); Director of Lockheed Martin Corp. (aerospace and defense) (since May 2001).
Richard A. Redeker (64), Director since 2003(3) Oversees 60 portfolios in Fund complex
Principal occupations (last 5 years): Management Consultant; Director (since 2001); Director of Penn Tank Lines, Inc. (since 1999).
Robin B. Smith (68), Director since 2003(3) Oversees 61 portfolios in Fund complex
Principal occupations (last 5 years): Chairman of the Board (since January 2003) of Publishers Clearing House (direct marketing); formerly Chairman and Chief Executive Officer (August 1996-January 2003) of Publishers Clearing House.
Other Directorships held:(4) Formerly Director of BellSouth Corporation (1992-2006).
| | |
| Dryden Mid Cap Value Fund | | 55 |
Stephen G. Stoneburn (64), Director since 2003(3) Oversees 61 portfolios in Fund complex
Principal occupations (last 5 years): President and Chief Executive Officer (since June 1996) of Quadrant Media Corp. (publishing company); formerly President (June 1995-June 1996) of Argus Integrated Media, Inc.; Senior Vice President and Managing Director (January 1993-1995) of Cowles Business Media; Senior Vice President of Fairchild Publications, Inc. (1975-1989).
Clay T. Whitehead (69), Director since 2003(3) Oversees 61 portfolios in Fund complex
Principal occupations (last 5 years): President (since 1983) of YCO (new business development firm).
Interested Directors(1)
Judy A. Rice (59), President since 2003 and Director since 2003(3) Oversees 59 portfolios in Fund complex
Principal occupations (last 5 years): President, Chief Executive Officer, Chief Operating Officer and Officer-In-Charge (since February 2003) of Prudential Investments LLC; Vice President (since February 1999) of Prudential Investment Management Services LLC; President, Chief Executive Officer and Officer-In-Charge (since April 2003) of Prudential Mutual Fund Services LLC; formerly Director (May 2003-March 2006) and Executive Vice President (June 2005-March 2006) of AST Investment Services, Inc.; formerly Executive Vice President (September 1999-February 2003) of Prudential Investments LLC; Member of Board of Governors of the Investment Company Institute.
Robert F. Gunia (61), Vice President since 1999 and Director since 2003(3) Oversees 145 portfolios in Fund complex
Principal occupations (last 5 years): Chief Administrative Officer (since September 1999) and Executive Vice President (since December 1996) of Prudential Investments LLC; President (since April 1999) of Prudential Investment Management Services LLC; Executive Vice President (since March 1999) and Treasurer (since May 2000) of Prudential Mutual Fund Services LLC; Chief Administrative Officer, Executive Vice President and Director (since May 2003) of AST Investment Services, Inc.
Other Directorships held:(4) Vice President and Director (since May 1989) and Treasurer (since 1999) of The Asia Pacific Fund, Inc.
Information pertaining to the Officers of the Funds who are not also Directors is set forth below.
Officers(2)
Kathryn L. Quirk (55), Chief Legal Officer since 2005(3)
Principal occupations (last 5 years): Vice President and Corporate Counsel (since September 2004) of Prudential; Executive Vice President, Chief Legal Officer and Secretary (since July 2005) of Prudential Investments LLC and Prudential Mutual Fund Services LLC; formerly Managing Director, General Counsel, Chief Compliance Officer, Chief Risk Officer and Corporate Secretary (1997-2002) of Zurich Scudder Investments, Inc.
Deborah A. Docs (49), Secretary since 2003(3)
Principal occupations (last 5 years): Vice President and Corporate Counsel (since January 2001) of Prudential; Vice President (since December 1996) and Assistant Secretary (since March 1999) of PI; formerly Vice President and Assistant Secretary (May 2003-June 2005) of AST Investment Services, Inc.
Jonathan D. Shain (49), Assistant Secretary since 2003(3)
Principal occupations (last 5 years): Vice President and Corporate Counsel (since August 1998) of Prudential; Vice President and Assistant Secretary (since May 2001) of PI; Vice President and Assistant Secretary (since February 2001) of PMFS; formerly Vice President and Assistant Secretary (May 2003-June 2005) of AST Investment Services, Inc.
| | |
| 56 | | Visit our website at www.jennisondryden.com |
Claudia DiGiacomo (33), Assistant Secretary since 2005(3)
Principal occupations (last 5 years): Vice President and Corporate Counsel (since January 2005) of Prudential; Vice President and Assistant Secretary of PI (since December 2005); Associate at Sidley Austin Brown & Wood LLP (1999-2004).
Timothy J. Knierim (48), Chief Compliance Officer since 2007(3)
Principal occupations (last 5 years): Chief Compliance Officer of Prudential Investment Management, Inc. (since July 2007); formerly Chief Risk Officer of PIM and PI (2002-2007) and formerly Chief Ethics Officer of PIM and PI (2006-2007).
Valerie M. Simpson (49), Deputy Chief Compliance Officer since 2007(3)
Principal occupations (last 5 years): Vice President and Senior Compliance Officer (since March 2006) of PI; Vice President-Financial Reporting (since March 2006) for Prudential Life and Annuities Finance.
Grace C. Torres (48), Treasurer and Principal Financial and Accounting Officer since 2003(3)
Principal occupations (last 5 years): Assistant Treasurer (since March 1999) and Senior Vice President (since September 1999) of PI; Assistant Treasurer (since May 2003) and Vice President (since June 2005) of AST Investment Services, Inc.; Senior Vice President and Assistant Treasurer (since May 2003) of Prudential Annuities Advisory Services, Inc.; formerly Senior Vice President (May 2003-June 2005) of AST Investment Services, Inc.
John P. Schwartz (36), Assistant Secretary since 2006(3)
Principal occupations (last 5 years): Vice President and Corporate Counsel (since April 2005) of Prudential; Vice President and Assistant Secretary of PI (since December 2005); Associate at Sidley, Austin Brown & Wood LLP (1997-2005).
M. Sadiq Peshimam (43), Assistant Treasurer since 2006(3)
Principal occupations (last 5 years): Vice President (since 2005) and Director (2000-2005) within Prudential Mutual Fund Administration.
Peter Parrella (49), Assistant Treasurer since 2007(3)
Principal occupations (last 5 years): Vice President (since 2007) and Director (2004-2007) within Prudential Mutual Fund Administration; formerly Tax Manager at SSB Citi Fund Management LLC (1997-2004).
Andrew R. French (44), Assistant Secretary since 2006(3)
Principal occupations (last 5 years): Director and Corporate Counsel (since May 2006) of Prudential; Vice President and Assistant Secretary (since January 2007) of PI; Vice President and Assistant Secretary (since January 2007) of PMFS; formerly Senior Legal Analyst of Prudential Mutual Fund Law Department (1997-2006).
Noreen M. Fierro (43), Anti-Money Laundering Compliance Officer since 2006(3)
Principal occupations (last 5 years): Vice President, Corporate Compliance (since May 2006) of Prudential; formerly Corporate Vice President, Associate General Counsel (April 2002-May 2005) of UBS Financial Services, Inc., in their Money Laundering Prevention Group; Senior Manager (May 2005-May 2006) of Deloitte Financial Advisory Services, LLP, in their Forensic and Dispute Services, Anti-Money Laundering Group.
| | |
| Dryden Mid Cap Value Fund | | 57 |
† | The Fund Complex consists of all investment companies managed by PI. The Funds for which PI serves as manager include Jennison Dryden Mutual Funds, Strategic Partners Funds, The Prudential Variable Contract Accounts 2, 10, 11. The Target Portfolio Trust, The Prudential Series Fund, The High Yield Income Fund, Inc., The High Yield Plus Fund, Inc., Nicholas-Applegate Fund, Inc., Advanced Series Trust, and Prudential’s Gibraltar Fund, Inc. |
(1) | “Interested” Director, as defined in the 1940 Act, by reason of employment with the Manager, a Subadvisor or the Distributor. |
(2) | Unless otherwise noted, the address of the Directors and Officers is c/o: Prudential Investments LLC, Gateway Center Three, 100 Mulberry Street, Newark, NJ 07102. |
(3) | There is no set term of office for Directors and Officers. The Independent Directors have adopted a retirement policy, which calls for the retirement of Directors on December 31 of the year in which they reach the age of 75. The table shows the individual’s length of service as Director and/or Officer. |
(4) | This includes only directorships of companies required to register, or file reports with the SEC under the Securities and Exchange Act of 1934 (that is, “public companies”) or other investment companies registered under the 1940 Act. |
Additional Information about the Directors is included in the Statement of Additional Information which is available without charge, upon request, by calling (800) 521-7466 or (732) 482-7555 (Calling from outside the U.S.)
| | |
| 58 | | Visit our website at www.jennisondryden.com |
Approval of Advisory Agreements
The Board of Directors (the “Board”) of Strategic Partners Mutual Funds, Inc. oversees the management of the Dryden Mid Cap Value Fund (the “Fund”) and, as required by law, determines annually whether to renew the Fund’s management agreement with Prudential Investments LLC (“PI”) and the Fund’s subadvisory agreement with Quantitative Management Associates LLC (“QMA”). In considering the renewal of the agreements, the Board, including all of the Independent Directors, met on June 6-7, 2007 and approved the renewal of the agreements through July 31, 2008, after concluding that renewal of the agreements was in the best interests of the Fund and its shareholders.
In advance of the meetings, the Board received materials relating to the agreements, and had the opportunity to ask questions and request further information in connection with their consideration. Among other things, the Board considered comparisons with other mutual funds in relevant Peer Universes and Peer Groups. The mutual funds included in each Peer Universe or Peer Group were objectively determined solely by Lipper Inc., an independent provider of mutual fund data. The comparisons placed the Fund in various quartiles over the one-, three-, and five-year periods ending December 31, 2006, with the first quartile being the best 25% of the mutual funds (for performance, the best performing mutual funds and, for expenses, the lowest cost mutual funds).
In approving the agreements, the Board, including the Independent Directors advised by independent legal counsel, considered the factors they deemed relevant, including the nature, quality and extent of services provided, the performance of the Fund, the profitability of PI and its affiliates, expenses and fees, and the potential for economies of scale that may be shared with the Fund and its shareholders. In their deliberations, the Directors did not identify any single factor which alone was responsible for the Board’s decision to approve the agreements with respect to the Fund. In connection with their deliberations, the Board considered information provided by PI throughout the year at regular Board meetings, presentations from portfolio managers and other information, as well as information furnished at or in advance of the meetings on June 6-7, 2007.
The Directors determined that the overall arrangements between the Fund and PI, which serves as the Fund’s investment manager pursuant to a management agreement, and between PI and QMA, which serves as the Fund’s subadviser pursuant to the terms of a subadvisory agreement with PI, are fair and reasonable in light of the services performed, fees charged and such other matters as the Directors considered relevant in the exercise of their business judgment.
| | |
| Dryden Mid Cap Value Fund | | |
Approval of Advisory Agreements (continued)
The material factors and conclusions that formed the basis for the Directors’ reaching their determinations to approve the continuance of the agreements are separately discussed below.
Nature, quality and extent of services
The Board received and considered information regarding the nature and extent of services provided to the Fund by PI and QMA. The Board considered the services provided by PI, including but not limited to the oversight of the subadviser for the Fund, as well as the provision of fund recordkeeping, compliance, and other services to the Fund. With respect to PI’s oversight of the subadviser, the Board noted that PI’s Strategic Investment Research Group (“SIRG”), which is a business unit of PI, is responsible for monitoring and reporting to PI’s senior management on the performance and operations of the subadviser. The Board also considered that PI pays the salaries of all of the officers and non-independent Directors of the Fund. The Board also considered the investment subadvisory services provided by QMA, as well as adherence to the Fund’s investment restrictions and compliance with applicable Fund policies and procedures. The Board considered PI’s evaluation of the subadviser, as well as PI’s recommendation, based on its review of the subadviser, to renew the subadvisory agreement.
The Board reviewed the qualifications, backgrounds and responsibilities of PI’s senior management responsible for the oversight of the Fund and QMA, and also reviewed the qualifications, backgrounds and responsibilities of the QMA portfolio managers who are responsible for the day-to-day management of the Fund’s portfolio. The Board was provided with information pertaining to PI’s and QMA’s organizational structure, senior management, investment operations, and other relevant information pertaining to PI and QMA. The Board also noted that it received favorable compliance reports from the Fund’s Chief Compliance Officer (“CCO”) as to each of PI and QMA. The Board noted that QMA is affiliated with PI.
The Board concluded that it was satisfied with the nature, extent and quality of the investment management services provided by PI and the subadvisory services provided to the Fund by QMA, and that there was a reasonable basis on which to conclude that the Fund benefits from the services provided by PI and QMA under the management and subadvisory agreements.
Performance of Dryden Mid Cap Value Fund
The Board received and considered information about the Fund’s historical performance. The Board considered that the Fund’s gross performance in relation to its Peer Universe (the Lipper Retail and Institutional Mid-Cap Value Funds
| | |
| | Visit our website at www.jennisondryden.com |
Performance Universe) was in the second quartile over the five-year period, and in the fourth and third quartiles, respectively, over the one- and three-year periods. The Board further considered that the Fund’s net performance (which reflects any subsidies, expense caps or waivers) was in the third quartile over the three- and five- year periods, although performance was in the fourth quartile over the one-year period. The Board also noted that the Fund had underperformed against its benchmark index over the one-, three- and five-year periods. In reviewing the Fund’s performance, the Board considered the recent changes in the subadvisory structure, including the fact that QMA, the Fund’s current subadviser, had assumed responsibility for managing the Fund in January 2007, and therefore the Fund’s performance for the periods under review was not attributable to QMA. The Board concluded that, in light of the recent change in subadvisers, it would be in the interest of the Fund and its shareholders for the Fund to renew the agreements.
Fees and Expenses
The Board considered that the Fund’s contractual, actual management fee (which reflects any subsidies, waivers or expense caps) and total expenses ranked in the Expense Group’s fourth quartile. The Board also considered the assertion of PI that the fourth quartile ranking for total expenses reflected the Fund’s relatively high transfer agency fees as well as the management fee ranking. The Board accepted PI’s recommendation to continue the existing contractual cap on Fund expenses of 1.35% (exclusive of 12b-1 fees and certain other fees). The Board concluded that, in light of the Fund’s longer term performance record against its Peer Universe and the effect of transfer agency expenses on total expenses, the management and subadvisory fees are acceptable.
Costs of Services and Profits Realized by PI
The Board was provided with information on the profitability of PI and its affiliates in serving as the Fund’s investment manager. The Board discussed with PI the methodology utilized in assembling the information regarding profitability and considered its reasonableness. The Board recognized that it is difficult to make comparisons of profitability from fund management contracts because comparative information is not generally publicly available and is affected by numerous factors, including the structure of the particular adviser, the types of funds it manages, its business mix, numerous assumptions regarding allocations and the adviser’s capital structure and cost of capital. The Board did not separately consider the profitability of the subadviser, an affiliate of PI, as its profitability was reflected in the profitability report for PI. Taking these factors into account, the Board concluded that the profitability of PI and its affiliates in relation to the services rendered was not unreasonable.
| | |
| Dryden Mid Cap Value Fund | | |
Approval of Advisory Agreements (continued)
Economies of Scale
The Board received and discussed information concerning whether PI realizes economies of scale as the Fund’s assets grow beyond current levels. The Board noted that the management fee schedule for the Fund includes breakpoints, which have the effect of decreasing the fee rate as assets increase, and that at its current level of assets the Fund’s effective fee rate reflected some of those rate reductions. The Board took note that the Fund’s fee structure currently results in benefits to Fund shareholders whether or not PI realizes any economies of scale.
Other Benefits to PI and QMA
The Board considered potential ancillary benefits that might be received by PI and QMA and their affiliates as a result of their relationship with the Fund. The Board concluded that potential benefits to be derived by PI included brokerage commissions received by affiliates of PI, transfer agency fees received by the Fund’s transfer agent (which is affiliated with PI), and benefits to the reputation as well as other intangible benefits resulting from PI’s association with the Fund. The Board concluded that the potential benefits to be derived by QMA included its ability to use soft dollar credits, brokerage commissions received by affiliates of QMA, as well as the potential benefits consistent with those generally resulting from an increase in assets under management, specifically, potential access to additional research resources and benefits to the reputation. The Board concluded that the benefits derived by PI and QMA were consistent with the types of benefits generally derived by investment managers and subadvisers to mutual funds.
After full consideration of these factors, the Board concluded that the approval of the agreements was in the interest of the Fund and its shareholders.
| | |
| | Visit our website at www.jennisondryden.com |
Growth of a $10,000 Investment
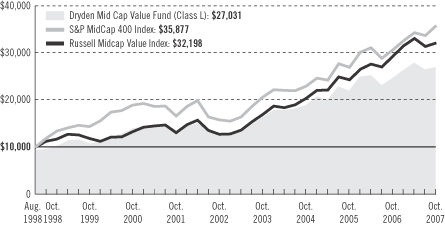
| | | | | | | | | |
| Average Annual Total Returns (With Sales Charges) as of 10/31/07 | |
| | | One Year | | | Five Years | | | Since Inception | |
Class A | | 3.75 | % | | N/A | | | 9.68 | % |
Class B | | 4.03 | | | N/A | | | 10.18 | |
Class C | | 8.01 | | | 15.65 | % | | 11.59 | |
Class L | | 3.24 | | | 14.86 | | | 11.41 | |
Class M | | 2.99 | | | 15.42 | | | 11.57 | |
Class X | | 4.04 | | | 15.71 | | | 11.77 | |
Class Z | | 10.24 | | | N/A | | | 9.08 | |
| | | | | | | | | |
| Average Annual Total Returns (Without Sales Charges) as of 10/31/07 | |
| | | One Year | | | Five Years | | | Since Inception | |
Class A | | 9.78 | % | | N/A | | | 11.44 | % |
Class B | | 8.99 | | | N/A | | | 10.58 | |
Class C | | 9.00 | | | 15.65 | % | | 11.59 | |
Class L | | 9.54 | | | 16.23 | | | 12.13 | |
Class M | | 8.95 | | | 15.65 | | | 11.57 | |
Class X | | 10.04 | | | 16.05 | | | 11.77 | |
Class Z | | 10.24 | | | N/A | | | 9.08 | |
Performance data quoted represent past performance. Past performance does not guarantee future results. The investment return and principal value of an investment will fluctuate so that an investor’s shares, when redeemed, may be worth more or less than their original cost. Current performance may be lower or higher than the
| | |
| | Visit our website at www.jennisondryden.com |
past performance data quoted. An investor may obtain performance data as of the most recent month-end by visiting our website at www.jennisondryden.com or by calling (800) 225-1852. Class A and Class L shares have a maximum initial sales charge of 5.50% and 5.75%, respectively. Class L shares are closed to most new purchases (with the exception of reinvested dividends and purchases by certain college savings plans). Gross operating expenses: Class A, 1.53%; Class B, 2.23%; Class C, 2.23%; Class L, 1.73%; Class M, 2.23%; Class X, 1.23%; Class Z, 1.23%. Net operating expenses apply to: Class A, 1.48%; Class B, 2.23%; Class C, 2.23%; Class L, 1.73%; Class M, 2.23%; Class X, 1.23%; Class Z, 1.23%, after contractual reduction through 2/28/2008.
Source: Prudential Investments LLC and Lipper Inc.
Inception dates: Class A and Class B, 4/12/04; Class C, Class L, Class M; Class X, 8/19/98; and Class Z, 11/28/05.
The graph compares a $10,000 investment in the Dryden Mid Cap Value Fund (Class L shares) with a similar investment in the S&P MidCap 400 Index and Russell Midcap Value Index by portraying the initial account values at the commencement of operations of Class L shares (August 19, 1998) and the account values at the end of the current fiscal year (October 31, 2007) as measured on a quarterly basis. The Russell Midcap Value Index data is measured from the closest month-end to inception date and not from the Fund’s actual inception date. For purposes of the graph, and unless otherwise indicated, it has been assumed that (a) the maximum applicable front-end sales charge was deducted from the initial $10,000 investment in Class L shares; (b) all recurring fees (including management fees) were deducted; and (c) all dividends and distributions were reinvested. The line graph provides information for Class L shares only. As indicated in the tables above, performance for Class A, B, C, M, X, and Z shares will vary due to the differing charges and expenses applicable to each share class (as indicated in the following paragraphs).
The S&P MidCap 400 Index is an unmanaged index of 400 domestic stocks chosen for market size, liquidity, and industry group representation. It gives a broad look at how U.S. mid-cap stock prices have performed. The Russell Midcap Value Index measures the performance of those Russell Midcap companies with lower price-to-book ratios and lower forecasted growth values. The stocks are also members of the Russell 1000 Index. The Index’s total returns include the reinvestment of all dividends, but do not include the effects of sales charges, operating expenses of a mutual fund, or taxes. The returns for the index would be lower if they included the effects of sales charges, operating expenses, or taxes. The securities that comprise the index may differ substantially from the securities in the Fund. This is not the only index that may be used to characterize performance of small- to mid-capitalization stock funds. Other indexes may portray different comparative performance. Investors cannot invest directly in an index.
Class A and Class L shares are subject to a maximum front-end sales charge of 5.50% and 5.75%, respectively. Class L shares are closed to most new purchases (with the exception of reinvested dividends and purchases by certain college savings plans). Under certain circumstances, Class A and Class L shares may be subject to a contingent deferred sales charge (CDSC) of 1%, in certain circumstances. Class B, Class C, Class M, and Class X shares are subject to a maximum CDSC of 5%, 1%, 6%, and 6%, respectively. Class A shares are subject to a 12b-1 fee of up to 0.30% annually. Class B, Class C, Class M, and Class X shares are subject to a 12b-1 fee of 1%. Class L shares are subject to a 12b-1 fee of 0.50%. Class Z shares are not subject to a 12b-1 fee. The returns in the graph and the tables do not reflect the deduction of taxes that a shareholder would pay on Fund distributions or following the redemption of Fund shares.
| | |
| Dryden Mid Cap Value Fund | | |
| | | | |
| n MAIL | | n TELEPHONE | | n WEBSITE |
Gateway Center Three 100 Mulberry Street Newark, NJ 07102 | | (800) 225-1852 | | www.jennisondryden.com |
|
| PROXY VOTING |
| The Board of Directors of the Fund has delegated to the Fund’s investment subadviser the responsibility for voting any proxies and maintaining proxy recordkeeping with respect to the Fund. A description of these proxy voting policies and procedures is available without charge, upon request, by calling (800) 225-1852 or by visiting the Securities and Exchange Commission’s website at www.sec.gov. Information regarding how the Fund voted proxies relating to portfolio securities during the most recent 12-month period ended June 30 is available on the Fund’s website and on the Commission’s website. |
|
| DIRECTORS |
Linda W. Bynoe • David E.A. Carson • Robert F. Gunia • Robert E. La Blanc •
Douglas H. McCorkindale • Richard A. Redeker • Judy A. Rice • Robin B. Smith •
Stephen G. Stoneburn • Clay T. Whitehead |
|
| OFFICERS |
| Judy A. Rice, President • Robert F. Gunia, Vice President • Grace C. Torres, Treasurer and Principal Financial and Accounting Officer • Kathryn L. Quirk, Chief Legal Officer • Deborah A. Docs, Secretary • Timothy J. Knierim, Chief Compliance Officer • Valerie M. Simpson, Deputy Chief Compliance Officer • Noreen M. Fierro, Anti-Money Laundering Compliance Officer • Jonathan D. Shain, Assistant Secretary • Claudia DiGiacomo, Assistant Secretary • John P. Schwartz, Assistant Secretary • Andrew R. French, Assistant Secretary • M. Sadiq Peshimam, Assistant Treasurer • Peter Parrella, Assistant Treasurer |
| | | | |
| MANAGER | | Prudential Investments LLC | | Gateway Center Three
100 Mulberry Street
Newark, NJ 07102 |
|
| INVESTMENT SUBADVISER | | Quantitative Management
Associates LLC | | Gateway Center Two
100 Mulberry Street
Newark, NJ 07102 |
|
| DISTRIBUTORS | | Prudential Annuities
Distributors, Inc. | | One Corporate Drive
Shelton, CT 06484 |
|
| | Prudential Investment
Management
Services LLC | | Gateway Center Three
100 Mulberry Street
Newark, NJ 07102 |
|
| CUSTODIAN | | PFPC Trust Company | | 400 Bellevue Parkway
Wilmington, DE 19809 |
|
| TRANSFER AGENT | | Prudential Mutual Fund
Services LLC | | PO Box 9658
Providence, RI 02940 |
|
| INDEPENDENT REGISTERED PUBLIC ACCOUNTING FIRM | | KPMG LLP | | 345 Park Avenue
New York, NY 10154 |
|
| FUND COUNSEL | | Willkie Farr & Gallagher LLP | | 787 Seventh Avenue
New York, NY 10019 |
|
| An investor should consider the investment objectives, risks, charges, and expenses of the Fund carefully before investing. The prospectus for the Fund contains this and other information about the Fund. An investor may obtain a prospectus by visiting our website at www.jennisondryden.com or by calling (800) 225-1852. The prospectus should be read carefully before investing. |
|
| E-DELIVERY |
| To receive your mutual fund documents on-line, go to www.icsdelivery.com/prudential/funds and enroll. Instead of receiving printed documents by mail, you will receive notification via e-mail when new materials are available. You can cancel your enrollment or change your e-mail address at any time by clicking on the change/cancel enrollment option at the icsdelivery website address. |
|
| SHAREHOLDER COMMUNICATIONS WITH DIRECTORS |
| Shareholders can communicate directly with the Board of Directors by writing to the Chair of the Board, Dryden Mid Cap Value Fund, Prudential Investments, Attn: Board of Directors, 100 Mulberry Street, Gateway Center Three, Newark, NJ 07102. Shareholders can communicate directly with an individual Director by writing to the same address. Communications are not screened before being delivered to the addressee. |
|
| AVAILABILITY OF PORTFOLIO SCHEDULE |
| The Fund files its complete schedule of portfolio holdings with the Securities and Exchange Commission for the first and third quarters of each fiscal year on Form N-Q. The Fund’s Forms N-Q are available on the Commission’s website at www.sec.gov. The Fund’s Forms N-Q may also be reviewed and copied at the Commission’s Public Reference Room in Washington, D.C. Information on the operation and location of the Public Reference Room may be obtained by calling (800) SEC-0330 (732-0330). The Fund’s schedule of portfolio holdings is also available on the Fund’s website as of the end of each fiscal quarter. |
|
| The Fund’s Statement of Additional Information contains additional information about the Fund’s Directors and is available without charge, upon request, by calling (800) 225-1852. |
Mutual Funds:
| | | | |
ARE NOT INSURED BY THE FDIC OR ANY
FEDERAL GOVERNMENT AGENCY | | MAY LOSE VALUE | | ARE NOT A DEPOSIT OF OR GUARANTEED BY ANY BANK OR ANY BANK AFFILIATE |

| | | | | | | | | | | | | | | | | | |
| Dryden Mid Cap Value Fund | | | | | | | | | | | | |
| | | Share Class | | A | | B | | C | | L* | | M** | | X** | | Z*** | | |
| | NASDAQ | | SPRAX | | SVUBX | | NCBVX | | NABVX | | NBBVX | | NBVZX | | SPVZX | | |
| | CUSIP | | 86277E807 | | 86277E872 | | 86277E856 | | 86277E880 | | 86277E864 | | 86277E849 | | 86277E435 | | |
| | | | | | | | | | | | | | | | | | |
*Closed to most new purchases (with the exception of reinvested dividends and purchases by college savings plans) and available for limited exchanges only.
**Closed to most new purchases (with the exception of reinvested dividends) and available for limited exchanges only.
***Inception date of 11/28/05.
MF202E IFS-A141786 Ed. 12/2007


(Formerly known as Strategic Partners Equity Income Fund)
| | |
| OCTOBER 31, 2007 | | ANNUAL REPORT |
Jennison Equity Income Fund
FUND TYPE
Speciality-equity income
OBJECTIVE
Income and capital appreciation
This report is not authorized for distribution to prospective investors unless preceded or accompanied by a current prospectus.
The views expressed in this report and information about the Fund’s portfolio holdings are for the period covered by this report and are subject to change thereafter.
JennisonDryden, Jennison, Prudential Financial and the Rock Prudential logo are registered service marks of The Prudential Insurance Company of America, Newark, NJ, and its affiliates.

December 14, 2007
Dear Shareholder:
We hope you find the annual report for the Jennison Equity Income Fund informative and useful. As a JennisonDryden mutual fund shareholder, you may be thinking about where you can find additional growth opportunities. You could invest in last year’s top-performing asset class and hope history repeats itself or you could stay in cash while waiting for the “right moment” to invest.
Instead, we believe it is better to take advantage of developing domestic and global investment opportunities through a diversified portfolio of stock and bond mutual funds. A diversified asset allocation offers two potential advantages. It helps you manage downside risk by not being overly exposed to any particular asset class, plus it gives you a better opportunity to have at least some of your assets in the right place at the right time. Your financial professional can help you create a diversified investment plan that may include mutual funds covering all the basic asset classes and that reflects your personal investor profile and tolerance for risk.
JennisonDryden Mutual Funds gives you a wide range of choices that can help you make progress toward your financial goals. Our funds offer the experience, resources, and professional discipline of four leading asset managers. They are recognized and respected in the institutional market and by discerning investors for excellence in their respective strategies. JennisonDryden equity funds are advised by Jennison Associates LLC, Quantitative Management Associates LLC (QMA), or Prudential Real Estate Investors (PREI). Prudential Investment Management, Inc. (PIM) advises the JennisonDryden fixed income and money market funds. Jennison Associates, QMA, and PIM are registered investment advisers and Prudential Financial companies. PREI is a registered investment adviser and a unit of PIM.
Thank you for choosing JennisonDryden Mutual Funds.
Sincerely,

Judy A. Rice, President
Jennison Equity Income Fund
| | |
| Jennison Equity Income Fund | | 1 |
Your Fund’s Performance
Fund objective
The investment objective of the Jennison Equity Income Fund is income and capital appreciation. There can be no assurance that the Fund will achieve its investment objective.
Performance data quoted represent past performance. Past performance does not guarantee future results. The investment return and principal value of an investment will fluctuate, so that an investor’s shares, when redeemed, may be worth more or less than their original cost. Current performance may be lower or higher than the past performance data quoted. An investor may obtain performance data as of the most recent month-end by visiting our website at www.jennisondryden.com or by calling (800) 225-1852. Class A and Class L shares have a maximum initial sales charge of 5.50% and 5.75%, respectively. Gross operating expenses: Class A, 1.56%; Class B, 2.26%; Class C, 2.26%; Class L, 1.76%; Class M, 2.26%; Class X, 2.26%. Net operating expenses apply to: Class A, 1.40%; Class B, 2.15%; Class C, 2.15%; Class L, 1.65%; Class M, 2.15%; Class X, 2.15%, after contractual reduction through 2/28/2008.
| | | | | | | | | |
| Cumulative Total Returns as of 10/31/07 | | | | | | | |
| | | One Year | | | Five Years | | | Since Inception1 | |
Class A2 | | 22.72 | % | | N/A | | | 53.65 | % |
Class B3 | | 21.76 | | | N/A | | | 49.18 | |
Class C | | 21.80 | | | 105.68 | % | | 106.97 | |
Class L2 | | 22.43 | | | 110.98 | | | 117.18 | |
Class M3 | | 21.76 | | | 105.78 | | | 107.28 | |
Class X | | 21.74 | | | 105.79 | | | 106.88 | |
Lipper Equity Income Funds Index4 | | 12.87 | | | 97.13 | | | * | |
S&P 500 Index5 | | 14.55 | | | 91.45 | | | ** | |
Lipper Equity Income Category Avg.6 | | 13.44 | | | 100.15 | | | *** | |
| | | | | | | | | |
| Average Annual Total Returns7 as of 9/30/07 | | | | | | | |
| | | One Year | | | Five Years | | | Since Inception1 | |
Class A2 | | 13.65 | % | | N/A | | | 9.70 | % |
Class B3 | | 14.36 | | | N/A | | | 10.14 | |
Class C | | 18.32 | | | 16.27 | % | | 7.19 | |
Class L2 | | 13.00 | | | 15.46 | | | 7.06 | |
Class M3 | | 13.36 | | | 16.06 | | | 7.21 | |
Class X | | 13.25 | | | 15.92 | | | 7.18 | |
Lipper Equity Income Funds Index4 | | 15.23 | | | 15.64 | | | * | |
S&P 500 Index5 | | 16.42 | | | 15.44 | | | ** | |
Lipper Equity Income Category Avg.6 | | 15.59 | | | 15.79 | | | *** | |
| | |
| 2 | | Visit our website at www.jennisondryden.com |
The cumulative total returns do not reflect the deduction of applicable sales charges. If reflected, the applicable sales charges would reduce the cumulative total return performance quoted. Class A and Class L shares are subject to a maximum front-end sales charge of 5.50% and 5.75%, respectively. Class L shares are closed to most new purchases (with the exception of reinvested dividends and purchases by certain college savings plans). Class M and Class X shares are also closed to most new purchases (with the exception of reinvested dividends). Class L, Class M, and Class X shares are exchangeable only with Class L, Class M, and Class X shares, respectively, offered by the other JennisonDryden Funds. Under certain circumstances, Class A and Class L shares may be subject to a contingent deferred sales charge (CDSC) of 1%. Class B, Class C, Class M, and Class X shares are subject to a maximum CDSC of 5%, 1%, 6%, and 6%, respectively.
Source: Prudential Investments LLC and Lipper Inc. Performance figures may reflect fee waivers and/or expense reimbursements. In the absence of such fee waivers and/or expense reimbursements, total returns would be lower.
1Inception dates: Class A and Class B, 4/12/04; Class C, Class L, Class M, and Class X, 12/31/97.
2Prior to April 12, 2004, Class L shares were known as Class A shares. On April 12, 2004, Class A shares were redesignated as Class L shares and a new Class A was opened.
3Prior to April 12, 2004, Class M shares were known as Class B shares. On April 12, 2004, Class B shares were redesignated as Class M shares and a new Class B was opened.
4Funds in the Lipper Equity Income Funds Index seek relatively high current income and growth of income by investing at least 65% of their portfolio in dividend-paying equity securities. These funds gross or net yield must be at least 125% of the average gross or net yield of the U.S. diversified equity fund universe.
5The Standard & Poor’s 500 Composite Stock Price Index (S&P 500 Index) is an unmanaged index of 500 stocks of large U.S. public companies. It gives a broad look at how U.S. stock prices have performed.
6Funds in the Lipper Equity Income Category Average seek relatively high current income and growth of income through investing 60% or more of their portfolio in equities.
7The average annual total returns do take into account applicable sales charges. The returns in the tables do not reflect the deduction of taxes that a shareholder would pay on Fund distributions or following the redemption of Fund shares. Without a distribution and service (12b-1) fee waiver of 0.05% for Class A shares, the returns would have been lower. Class A shares are subject to a 12b-1 fee of up to 0.30% annually. Class B, Class C, Class M, and Class X shares are subject to a 12b-1 fee of 1.00%. Class L shares are subject to a 12b-1 fee of 0.50%.
*Lipper Equity Income Funds Index Closest Month-End to Inception cumulative total returns as of 10/31/07 are 50.46% for Class A and Class B; and 92.01% for Class C, Class L, Class M, and Class X. Lipper Equity Income Funds Index Closest Month-End to Inception average annual total returns as of 9/30/07 are 12.03% for Class A and Class B; and 6.80% for Class C, Class L, Class M, and Class X.
**S&P 500 Index Closest Month-End to Inception cumulative total returns as of 10/31/07 are 46.81% for Class A and Class B; and 86.59% for Class C, Class L, Class M, and Class X. S&P 500 Index Closest Month-End to Inception average annual total returns as of 9/30/07 are 11.09% for Class A and Class B; and 6.43% for Class C, Class L, Class M, and Class X.
***Lipper Equity Income Category Average Closest Month-End to Inception cumulative total returns as of 10/31/07 are 51.80% for Class A and Class B; and 103.22% for Class C, Class L, Class M, and Class X. Lipper Equity Income Category Average Closest Month-End to Inception average annual total returns as of 9/30/07 are 12.03% for Class A and Class B; and 6.80% for Class C, Class L, Class M, and Class X.
| | |
| Jennison Equity Income Fund | | 3 |
Your Fund’s Performance (continued)
Investors cannot invest directly in an index. The returns for the S&P 500 Index would be lower if they included the effects of sales charges, operating expenses of a mutual fund, or taxes. Returns for the Lipper Average reflect the deduction of operating expenses, but not sales charges or taxes.
| | | |
Five Largest Holdings expressed as a percentage of net assets as of 10/31/07 | | | |
Bristol-Meyers Squibb Co., Pharmaceuticals | | 3.3 | % |
E.ON AG, ADR (Germany), Electric Utilities | | 2.8 | |
Digital Realty Trust, Inc., Real Estate Investment Trust | | 2.8 | |
McDonald’s Corp., Hotels, Restaurants & Leisure | | 2.3 | |
Scottish & Southern Energy PLC (United Kingdom), Electric Utilities | | 2.3 | |
Holdings reflect only long-term investments and are subject to change.
| | |
| 4 | | Visit our website at www.jennisondryden.com |
Strategy and Performance Overview
How did the Fund perform?
The Jennison Equity Income Fund’s Class A shares returned 22.72% for the 12 months ended October 31, 2007, significantly outperforming the 14.55% return of the S&P 500 Index, the 12.87% return of the Lipper Equity Income Funds Index (the benchmark Lipper Index), and the 13.44% return of the Lipper Equity Income Funds Average.
Were there changes in investment personnel relevant to the Fund’s performance?
On January 16, 2007, the name of the Fund was changed to the Jennison Equity Income Fund and shareholders approved the appointment of Jennison Associates LLC as the Fund’s manager. Specifically, the Jennison Equity Income team (the Jennison team), consisting of managing directors Shaun Hong, Bobby Edemeka, and Teresa Ho Kim, is responsible for day-to-day management of the Fund. The Jennison team’s research capabilities are augmented by 16 Jennison equity research analysts.
Were there changes to the Fund’s investment objectives and the way it is managed?
Although the Fund’s investment objective remained income and capital appreciation, the way the Fund is managed changed. AllianceBernstein and T. Rowe Price co-managed the Fund, each investing about half of its assets, until January 16, 2007. In the remaining months, the Fund’s asset manager was Jennison, which selects stocks based on internal research and analysis of individual company fundamentals rather than on overarching themes. Instead of simply identifying stocks with the highest dividend yields, Jennison uses this bottom-up stock selection to find companies with the ability to sustain and increase earnings and dividends or generate high and stable free cash flow that can be returned to investors via stock buybacks or dividends.
The Jennison team employs a value strategy to identify fundamentally sound companies it believes are undervalued. True worth is defined by valuation of earnings, free cash flow, assets, private market value, or some combination of these factors. Jennison’s proprietary fundamental research drives this stock selection process.
What were stock market conditions like during the first three months of the period?
The period from November 1, 2006, through January 31, 2007, recorded attractive stock market returns. Robust corporate earnings growth and relatively low interest rates and inflation helped boost merger-and-acquisition activity, which benefited stocks as investors were willing to pay more for shares of companies that were potential takeover targets. Stock prices also benefited as some corporations increased dividends or bought back shares at attractive prices. Value stocks outperformed growth stocks for the three-month period as they generally had for the past several years. Stocks of medium-sized companies outperformed both large and small companies.
| | |
| Jennison Equity Income Fund | | 5 |
Strategy and Performance Overview (continued)
How did the Fund perform before the change in asset managers?
For the three-months, the Fund’s Class A shares returned 6.67%, exceeding the 4.89% return of the S&P 500 Index and the 5.92% return of the Russell 1000 Value Index, the Fund’s previous benchmark index that was in use during this time of the reporting period. The portion of the Fund managed by AllianceBernstein slightly outperformed the previous benchmark index, while the portion managed by T. Rowe Price slightly underperformed.
From the perspective of sector allocation and stock selection, the Fund benefited from having a slightly larger exposure than the previous benchmark index to the consumer non-cyclical and healthcare sectors. In contrast, its overweight exposure to the technology sector, driven by AllianceBernstein and T. Rowe Price, detracted from its performance. However, some top-performing stocks in the Fund were in this sector, particularly a few positions in the computer hardware and software industries held largely by AllianceBernstein. T. Rowe Price had smaller positions in some of these shares that made a smaller positive contribution to the Fund. Medical services, banks, and media holdings helped the Fund outperform the previous benchmark index, but holdings in the insurance, oil refining, and drug industries detracted from the Fund’s performance.
From the perspective of investment style, the combination of AllianceBernstein and T. Rowe Price produces a relative value approach, which generally results in a fund with fewer value-like characteristics (such as a low price-to-earnings ratios) than the previous benchmark index. Both asset managers emphasized larger cap stocks of companies generating consistent earnings. Therefore, the Fund had a larger-cap focus with less exposure than the previous benchmark index to companies that employed leverage on their balance sheets. In the strongly value-oriented environment, these factors detracted from the Fund’s performance because they were out of favor in the market.
What were stock market conditions like in the last nine months of the period?
From February 1, 2007 through October 31, 2007, conditions in the U.S. equity market were challenging, though the overall trend was toward higher prices. In response to skyrocketing financial market volatility, the Federal Reserve first reduced the rate it charges banks to borrow from its discount window, and then cut its target for the federal funds rate on overnight loans between banks in September and October, lowering the rate to 4.5%.
Credit concerns prompted defensive investor behavior in the form of aggressive selling by “quant” hedge funds, which use computer programs to uncover attractive investment
| | |
| 6 | | Visit our website at www.jennisondryden.com |
opportunities in stocks, bonds, and other assets. This development triggered a downturn in less-liquid equities, most notably smaller-cap stocks. Credit problems that spread from U.S. subprime mortgages (home loans made to borrowers with poor credit histories) prompted central banks around the world to inject money into their monetary systems to help ensure that financial markets had enough liquidity to function normally.
Although U.S. gross domestic product grew at a solid pace, the economic expansion is expected to slow in the near term, partly reflecting a correction in the housing market. In addition, recent increases in energy and commodity prices, such as sharply higher oil prices, may boost inflation. The aforementioned rate cuts are therefore an attempt to balance upside risks to inflation against downside risks to growth.
The S&P 500 Index returned 9.21% for the nine months ended October 31, 2007. Not surprisingly, the financial sector turned in the worst performance. Consumer discretionary stocks were also weak, while energy and materials led performance.
How did the Fund perform after the change in asset managers?
For the nine-month period ended October 31, 2007, the Fund’s Class A shares returned 15.05%, outperforming the 9.21% return of the S&P 500 Index and the 7.27% return of the benchmark Index. The Fund’s positions in the energy, industrial, telecom services, and utility sectors posted the highest returns, but this strong performance was partially offset by weak results in the consumer discretionary and information technology sectors.
Which shares made the largest positive contributions to the Fund’s return after the change in asset managers?
Genco Shipping & Trading and Paragon Shipping Inc. were the industrial holdings that contributed most to the Fund’s performance, adding 128 and 100 basis points respectively to its return. (A basis point equals one one-hundredth of a percent.) Genco Shipping & Trading transports iron ore, coal, grain, steel products and other dry bulk cargoes along worldwide shipping routes. Additional vessel acquisitions and an announced public offering of primary and secondary shares of its common stock contributed to an impressive 142% return for the period. Higher rates of industrialization in China, India, and other developing nations have sharply increased global demand for iron ore/steel products and coal. Consequently, the Jennison team believes shipping rates for dry bulk vessels will remain strong for some time and expects Genco to continue to produce strong results in the favorable market backdrop.
Paragon Shipping also transports dry bulk cargoes along international shipping routes. The Fund participated in the company’s initial public offering (IPO), buying shares at
| | |
| Jennison Equity Income Fund | | 7 |
Strategy and Performance Overview (continued)
$16 in August that increased to more than $25 per share by the end of October as Paragon announced plans to buy two modern Panamax vessels. The acquisitions bring the number of vessels in Athens-based Paragon’s fleet to 11 and lower the fleet’s average age to 6.5 years. The Jennison team believes Paragon’s focus on long-term charter contracts will help reduce earnings volatility and, in turn, provide a stable platform for the firm, which pays one of the highest dividends in the sector.
Utility holdings that performed well included E.ON AG, CPFL Energia S.A., and Fortum Oyj. Shares of E.ON AG, Germany’s largest utility, rose steadily, providing a return of about 48% and contributing 119 basis points to the Fund. The Jennison team believes E.ON shares are benefiting from improved investor confidence regarding its strategic direction, particularly its pending acquisition of some of Endesa’s European assets. E.ON’s renewed commitment to improve returns on its assets, prudently invest for growth, and optimize its balance sheet should continue to enhance shareholder value.
Shares of Brazilian electricity provider CPFL Energia S.A. behaved somewhat erratically during the period. Though their price dipped sharply in August, the holding still added 123 basis points to the Fund’s return. Weakness in the share price was a result of the uncertainty surrounding tariff cuts by Brazilian power regulators at a few of the company’s distribution centers. During the reporting period, CPFL Energia purchased CMS Energy Brasil S.A., which the Jennison team believes strengthens its presence in the electricity market and demonstrates management’s ability to identify and complete acquisitions.
Finland-based Fortum Oyj, a provider of electricity and heat as well as maintenance for power plants, contributed 69 basis points to the Fund’s return. The first two calendar quarters of 2007 were characterized by warm weather and lower-than-average demand for power and heat, but both temperatures and demand were closer to average levels in the third calendar quarter. Throughout the last nine months of the reporting period, Nordic spot prices for electricity declined due to a copious flow of water into Nordic reservoirs and low prices for permits to emit carbon dioxide, which tends to discourage demand for hydroelectric power. On the other hand, power prices in Continental Europe increased due to the higher costs of coal, natural gas, and oil. Although Fortum’s main areas of operations are in Nordic countries, North/West Russia, Poland, and the Baltic countries, higher power prices in other areas of Europe ultimately translates into a positive long-term effect on the company because of an expected future convergence of power in the region.
Despite the challenging market conditions, Fortum improved its performance compared to last year and its share price ended October at all time highs. The
| | |
| 8 | | Visit our website at www.jennisondryden.com |
Jennison team believes the company’s financial position remains strong with improving net cash from operating activities. It also likes Fortum’s policy in which the company aims to pay an average dividend of 50% to 60% of earnings.
Which shares subtracted most from the Fund’s return after the change in asset managers?
The Fund held shares of many financial companies that subtracted from its return, reflecting the broad sell-off in the sector. Major financial institutions with balance sheets exposed to structured investment vehicles were hit hard, such as the Fund’s previous holdings of Citigroup Inc., Washington Mutual, and Bank of America. Negative earnings revisions and write-downs due to credit market losses pressured their stocks. Fortunately, the Jennison team trimmed the Fund’s exposure to these companies early on and sold its remaining holdings between April and July, which helped limit losses from them to a total of 61 basis points.
American Financial Trust, a REIT, detracted 64 basis points from the Fund’s return. However, since the end of the fiscal year in October, American Financial Trust announced that it had accepted a bid from Gramercy Capital in which American Financial Trust shareholders receive $5.50 per share in cash and 0.12096 shares of Gramercy Capital stock. This offer translates into an initial value of $8.43 per American Financial Trust share, a 31% premium to its closing price on the previous day.
Challenging economic conditions in the United States pressured consumer-oriented companies. Shares of GateHouse Media Inc. lost ground, subtracting 65 basis points from the Fund’s return, its largest loss of the nine-month period. The company, engaged in the publication of print and online media, sold its stake in West Virginia-based Herald-Dispatch in June and announced in October its intention to acquire several publications from Morris Publishing for $115 million. These transactions support the company’s focus on strategic, geographically suitable investment opportunities in the local media sector. They also highlight GateHouse’s move toward strong franchises in small markets near its existing properties. The Jennison team purchased shares of GateHouse in July and continued to add to the position when it believed the shares were undervalued. Although the company was recently affected by industry wide sluggish ad sales, management remains determined to continue to pay dividends.
In late May, the Fund participated in an IPO for B&G Foods, which manufactures, sells, and distributes a diverse portfolio of shelf-stable food products across the United States, Canada, and Puerto Rico. Ortega and recently acquired Cream of Wheat are two of its well-known brand names. Although B&G Foods reported a significant rise in quarterly net income for the third quarter, its share prices were
| | |
| Jennison Equity Income Fund | | 9 |
Strategy and Performance Overview (continued)
weak. The Jennison team believes shares of GateHouse Media and B&G Foods will recover as they likely suffered in sympathy with many consumer stocks.
Were there significant changes to the portfolio after the change in asset managers?
The Jennison team took profits on some shares and used the proceeds to either add to existing holdings or purchase new positions. For example, shares of BCE Inc. purchased in January were held for about six months and sold at a profit. The shares had gained sharply as the communications company weighed buyout bids from private equity investment firms and paid its shareholders consistent quarterly dividends.
Shares of Targa Resources, a producer of natural gas, natural gas liquids (NGL), and NGL products, gained rapidly in the first few months after its IPO in February. About a third of the Fund’s Targa Resources shares were sold in July after they rose almost 60% above their $21 IPO price. The proceeds were directed to existing holdings and new investments. During the remainder of the summer, Targa shares came under pressure, sliding lower with the price of natural gas. The Fund’s remaining Targa holdings were sold in early November, shortly after the reporting period ended.
In addition to its top performers, the Fund benefited from exposure to healthcare companies Bristol-Myers Squibb and Merck & Co. Although their shares gained modestly, both paid strong quarterly dividends to the Fund and together added 77 basis points to its return. In the energy sector, shares of Bonavista Energy Trust and Vermilion Energy Trust performed very well, contributing 52 and 63 basis points respectively to the Fund’s return. The Calgary-based Trusts, operating regionally throughout Canada and abroad, paid consistent cash distributions to their shareholders.
| | |
| 10 | | Visit our website at www.jennisondryden.com |
Comments on Largest Holdings
| 3.3% | Bristol-Myers Squibb Co./Pharmaceuticals |
Bristol-Myers Squibb manufactures a variety of pharmaceuticals and nutritional products and conducts research and development. Eli Lilly recently announced mixed clinical trial results for prasugrel, a competitor of Bristol-Myers’ heart disease drug Plavix. The Jennison team believes Bristol-Myers is well positioned for future growth based on a strong late-stage pipeline of drug candidates, limited downside for Plavix, and a promising outlook for its leukemia drug, Sprycel, which should benefit from a recent label expansion by the Food and Drug Administration.
| 2.8% | E.ON AG, ADR (Germany)/Electric Utilities |
E.ON, Germany’s largest utility company, operates in six markets across Europe and the Midwestern United States. The company’s business is subdivided into core energy and other activities. The Jennison team believes company management will continue to enhance shareholder value by leveraging its well-positioned coal and nuclear generation assets and its underappreciated energy exploration and production assets in attractive markets.
| 2.8% | Digital Realty Trust, Inc./Real Estate Investment Trusts |
Digital Realty Trust is a REIT focused on repositioning and managing technology-related real estate. Its portfolio currently consists of Internet gateway properties, data center properties, technology manufacturing properties, and regional or national headquarters of technology companies primarily located in North America with several properties in Europe. The Jennison team likes Digital Realty’s growth prospects compared to its peers. A recent increase in the company’s credit facility to $650 million from $500 million should enable further acquisitions, development, and redevelopment.
| 2.3% | McDonald’s Corp./Hotels, Restaurants &Leisure |
McDonald’s owns and franchises more than 30,000 restaurants in over 100 countries under the McDonald’s brand name. Its growth strategy has produced consistent increases in same-store sales in the North American, European, and Asian markets. In addition, remodels of existing locations and an increased focus on development of new units in Russia, India, and China should continue to benefit the firm.
| 2.3% | Scottish & Southern Energy PLC (United Kingdom)/Electric Utilities |
Scottish & Southern Energy is divided into five business segments—generation, transmission, distribution and supply of electricity; storage and supply of gas; electrical and utility contracting; electrical and gas domestic appliances; and telecommunications. An increased customer base has made Scottish and Southern Energy the United Kingdom’s second largest energy supplier. The Jennison team believes the company will continue to win new customers and increase margins in its existing markets, while plans to expand into the wholesale energy market in Ireland should also aid its long-term growth strategy.
| | |
| Jennison Equity Income Fund | | 11 |
Fees and Expenses (Unaudited)
As a shareholder of the Fund, you incur two types of costs: (1) transaction costs, including sales charges (loads) on purchase payments and redemptions, as applicable, and (2) ongoing costs, including management fees, distribution and/or service (12b-1) fees, and other Fund expenses, as applicable. This example is intended to help you understand your ongoing costs (in dollars) of investing in the Funds and to compare these costs with the ongoing costs of investing in other mutual funds.
The example is based on an investment of $1,000 invested on May 1, 2007, at the beginning of the period, and held through the six-month period ended October 31, 2007. The example is for illustrative purposes only; you should consult the Prospectus for information on initial and subsequent minimum investment requirements.
The Fund’s transfer agent may charge additional fees to holders of certain accounts that are not included in the expenses shown in the table on the following page. These fees apply to Individual Retirement Accounts (IRAs) and Section 403(b) accounts. As of the close of the six-month period covered by the table, IRA fees included an annual maintenance fee of $15 per account (subject to a maximum annual maintenance fee of $25 for all accounts held by the same shareholder). Section 403(b) accounts are charged an annual $25 fiduciary maintenance fee. Some of the fees may vary in amount, or may be waived, based on your total account balance or the number of JennisonDryden Funds, including the Fund, that you own. You should consider the additional fees that were charged to your Fund account over the six-month period when you estimate the total ongoing expenses paid over the period and the impact of these fees on your ending account value, as these additional expenses are not reflected in the information provided in the expense table. Additional fees have the effect of reducing investment returns.
Actual Expenses
The first line for each share class in the table on the following page provides information about actual account values and actual expenses. You may use the information on this line, together with the amount you invested, to estimate the expenses that you paid over the period. Simply divide your account value by $1,000 (for example, an $8,600 account value ÷ $1,000 = 8.6), then multiply the result by the number on the first line under the heading “Expenses Paid During the Six-Month Period” to estimate the expenses you paid on your account during this period.
Hypothetical Example for Comparison Purposes
The second line for each share class in the table on the following page provides information about hypothetical account values and hypothetical expenses based on the Fund’s actual expense ratio and an assumed rate of return of 5% per year before
| | |
| 12 | | Visit our website at www.jennisondryden.com |
expenses, which is not the Fund’s actual return. The hypothetical account values and expenses may not be used to estimate the actual ending account balance or expenses you paid for the period. You may use this information to compare the ongoing costs of investing in the Fund and other funds. To do so, compare this 5% hypothetical example with the 5% hypothetical examples that appear in the shareholder reports of the other funds.
Please note that the expenses shown in the table are meant to highlight your ongoing costs only, and do not reflect any transactional costs such as sales charges (loads). Therefore the second line for each share class in the table is useful in comparing ongoing costs only, and will not help you determine the relative total costs of owning different funds. In addition, if these transactional costs were included, your costs would have been higher.
| | | | | | | | | | | | | | |
Jennison Equity
Income Fund | | Beginning Account
Value
May 1, 2007 | | Ending Account
Value
October 31, 2007 | | Annualized
Expense Ratio
Based on the Six-
Month Period | | | Expenses Paid
During the Six-
Month Period* |
| | | | | | | | | | | | | | |
| Class A | | Actual | | $ | 1,000.00 | | $ | 1,068.70 | | 1.40 | % | | $ | 7.30 |
| | | Hypothetical | | $ | 1,000.00 | | $ | 1,018.15 | | 1.40 | % | | $ | 7.12 |
| | | | | | | | | | | | | | |
| Class B | | Actual | | $ | 1,000.00 | | $ | 1,064.40 | | 2.15 | % | | $ | 11.19 |
| | | Hypothetical | | $ | 1,000.00 | | $ | 1,014.37 | | 2.15 | % | | $ | 10.92 |
| | | | | | | | | | | | | | |
| Class C | | Actual | | $ | 1,000.00 | | $ | 1,064.50 | | 2.15 | % | | $ | 11.19 |
| | | Hypothetical | | $ | 1,000.00 | | $ | 1,014.37 | | 2.15 | % | | $ | 10.92 |
| | | | | | | | | | | | | | |
| Class L | | Actual | | $ | 1,000.00 | | $ | 1,067.30 | | 1.65 | % | | $ | 8.60 |
| | | Hypothetical | | $ | 1,000.00 | | $ | 1,016.89 | | 1.65 | % | | $ | 8.39 |
| | | | | | | | | | | | | | |
| Class M | | Actual | | $ | 1,000.00 | | $ | 1,064.40 | | 2.15 | % | | $ | 11.19 |
| | | Hypothetical | | $ | 1,000.00 | | $ | 1,014.37 | | 2.15 | % | | $ | 10.92 |
| | | | | | | | | | | | | | |
| Class X | | Actual | | $ | 1,000.00 | | $ | 1,064.60 | | 2.15 | % | | $ | 11.19 |
| | | Hypothetical | | $ | 1,000.00 | | $ | 1,014.37 | | 2.15 | % | | $ | 10.92 |
* Fund expenses (net of fee waivers or subsidies, if any) for each share class are equal to the annualized expense ratio for each share class (provided in the table), multiplied by the average account value over the period, multiplied by the 184 days in the six-month period ended October 31, 2007, and divided by the 365 days in the Fund’s fiscal year ended October 31, 2007 (to reflect the six-month period). Expenses presented in the table include the expenses of any underlying portfolios in which the Fund may invest.
| | |
| Jennison Equity Income Fund | | 13 |
Portfolio of Investments
October 31, 2007
| | | | | |
| | | Shares | | Value (Note 2) |
| | | | | |
LONG-TERM INVESTMENTS 98.4% | | | | | |
COMMON STOCKS | | | | | |
| | |
Air Freight & Logistics 1.0% | | | | | |
TNT NV (Netherlands) | | 59,700 | | $ | 2,442,135 |
| | |
Commercial Banks 1.3% | | | | | |
Turkiye Halk Bankasi AS (Turkey)* | | 399,700 | | | 3,376,105 |
| | |
Commercial Services & Supplies 1.6% | | | | | |
Waste Management, Inc. | | 111,100 | | | 4,042,929 |
| | |
Diversified Telecommunication Services 13.4% | | | | | |
Alaska Communications Systems Group, Inc.(a) | | 191,800 | | | 3,120,586 |
Chunghwa Telecom Co. Ltd., ADR (Taiwan) | | 294,690 | | | 5,658,048 |
Consolidated Communications Holdings, Inc. | | 202,600 | | | 4,033,766 |
Elisa Oyj (Finland) | | 131,800 | | | 3,908,084 |
Hellenic Telecommunications Organization SA (Greece) | | 126,600 | | | 4,632,311 |
Otelco, Inc.(a) | | 135,000 | | | 2,651,400 |
Royal KPN NV (Netherlands) | | 138,800 | | | 2,617,768 |
Telstra Corp. Ltd., ADR (Australia) | | 161,600 | | | 3,504,442 |
Verizon Communications, Inc. | | 49,800 | | | 2,294,286 |
Windstream Corp.(a) | | 139,800 | | | 1,880,310 |
| | | | | |
| | | | | 34,301,001 |
| | |
Electric Utilities 16.5% | | | | | |
Cia Energetica De Minas Gerais, ADR (Brazil)(a) | | 219,500 | | | 4,741,200 |
CPFL Energia SA, ADR (Brazil)(a) | | 76,000 | | | 5,055,520 |
E.ON AG, ADR (Germany) | | 110,300 | | | 7,180,530 |
Empire District Electric Co. (The)(a) | | 107,700 | | | 2,590,185 |
Enel SpA (Italy) | | 391,100 | | | 4,682,322 |
Fortum Oyj (Finland) | | 95,000 | | | 4,118,708 |
Progress Energy, Inc. | | 56,100 | | | 2,692,800 |
Scottish & Southern Energy PLC (United Kingdom) | | 181,303 | | | 5,865,874 |
Southern Co. | | 140,700 | | | 5,158,062 |
| | | | | |
| | | | | 42,085,201 |
| | |
Food & Staples Retailing 1.0% | | | | | |
Metro AG (Germany) | | 29,300 | | | 2,658,582 |
| | |
Food Products 1.9% | | | | | |
B&G Foods, Inc. | | 405,200 | | | 4,846,192 |
See Notes to Financial Statements.
| | |
| Jennison Equity Income Fund | | 15 |
Portfolio of Investments
October 31, 2007 continued
| | | | | |
| | | Shares | | Value (Note 2) |
COMMON STOCKS (continued) | | | |
| | | | | |
| | |
Gas Utilities 2.1% | | | | | |
Equitable Resources, Inc. | | 52,600 | | $ | 2,962,432 |
Oneok, Inc.(a) | | 49,900 | | | 2,492,006 |
| | | | | |
| | | | | 5,454,438 |
| | |
Hotels, Restaurants & Leisure 2.3% | | | | | |
McDonald’s Corp. | | 99,100 | | | 5,916,270 |
| | |
Household Products 1.1% | | | | | |
Kimberly-Clark Corp. | | 38,200 | | | 2,707,998 |
| | |
Machinery 0.7% | | | | | |
New Flyer Industries, Inc., 144A (Canada) | | 130,000 | | | 1,681,681 |
| | |
Marine 6.4% | | | | | |
Euroseas Ltd. | | 170,000 | | | 3,282,700 |
Genco Shipping & Trading Ltd.(a) | | 65,100 | | | 4,680,039 |
OceanFreight, Inc. (Greece)(a) | | 140,100 | | | 3,732,264 |
Paragon Shipping, Inc. (Class A Stock) (Greece)*(a) | | 180,200 | | | 4,519,416 |
| | | | | |
| | | | | 16,214,419 |
| | |
Media 1.8% | | | | | |
Cinemark Holdings, Inc. | | 77,700 | | | 1,337,217 |
GateHouse Media, Inc.(a) | | 293,400 | | | 3,371,166 |
| | | | | |
| | | | | 4,708,383 |
| | |
Multi-Utilities 4.5% | | | | | |
Energy East Corp. | | 100,000 | | | 2,788,000 |
Sempra Energy | | 56,100 | | | 3,450,711 |
TECO Energy, Inc.(a) | | 152,000 | | | 2,558,160 |
Xcel Energy, Inc.(a) | | 123,200 | | | 2,778,160 |
| | | | | |
| | | | | 11,575,031 |
| | |
Oil, Gas & Consumable Fuels 21.7% | | | | | |
Bonavista Energy Trust (Canada) | | 114,600 | | | 3,863,875 |
Capital Product Partners LP (Greece)(a) | | 104,700 | | | 2,817,477 |
Copano Energy LLC, E Units (cost $3,600,018, purchased 10/19/07)(c)(d) | | 113,315 | | | 3,596,618 |
Duncan Energy Partners LP(a) | | 108,600 | | | 2,573,820 |
Energy Transfer Partners LP | | 67,100 | | | 3,732,102 |
Enterprise Products Partners LP(a) | | 111,800 | | | 3,576,482 |
See Notes to Financial Statements.
| | |
| 16 | | Visit our website at www.jennisondryden.com |
| | | | | |
| | | Shares | | Value (Note 2) |
COMMON STOCKS (continued) | | | |
Oil, Gas & Consumable Fuels (Cont’d) | | | |
| | | | | |
Freehold Royalty Trust (Canada) | | 220,200 | | $ | 3,454,575 |
Harvest Energy Trust (Canada) | | 200,900 | | | 5,703,551 |
Linn Energy LLC (cost $1,109,344; purchased 06/29/07)(c)(d) | | 93,325 | | | 2,560,061 |
Linn Energy LLC, D Units (cost $2,890,658; purchased 06/29/07)(c)(d) | | 34,667 | | | 981,717 |
NAL Oil & Gas Trust (Canada) | | 247,200 | | | 3,323,390 |
ONEOK Partners LP | | 42,100 | | | 2,652,721 |
Pembina Pipeline Income Fund (Canada) | | 99,600 | | | 1,892,574 |
Regency Energy Partners LP(a) | | 104,600 | | | 3,321,050 |
SemGroup Energy Partners LP(a) | | 87,800 | | | 2,636,634 |
Targa Resources Partners LP | | 87,500 | | | 2,407,125 |
Vermilion Energy Trust (Canada) | | 96,700 | | | 4,033,219 |
Williams Partners LP(a) | | 46,800 | | | 2,141,100 |
| | | | | |
| | | | | 55,268,091 |
| | |
Pharmaceuticals 7.3% | | | | | |
Bristol-Meyers Squibb Co.(a) | | 281,300 | | | 8,436,187 |
Merck & Co., Inc. | | 88,300 | | | 5,144,358 |
Pfizer, Inc. | | 108,900 | | | 2,680,029 |
Schering-Plough Corp. | | 78,000 | | | 2,380,560 |
| | | | | |
| | | | | 18,641,134 |
| | |
Real Estate Investment Trusts 6.2% | | | | | |
American Financial Realty Trust(a) | | 444,600 | | | 2,996,604 |
Digital Realty Trust, Inc.(a) | | 162,700 | | | 7,157,173 |
Hospitality Properties Trust(a) | | 65,800 | | | 2,605,680 |
Simon Property Group, Inc.(a) | | 28,600 | | | 2,977,546 |
| | | | | |
| | | | | 15,737,003 |
| | |
Tobacco 3.2% | | | | | |
Altria Group, Inc. | | 77,400 | | | 5,644,782 |
Reynolds American, Inc.(a) | | 39,100 | | | 2,519,213 |
| | | | | |
| | | | | 8,163,995 |
| | |
Trading Companies & Distributors 3.3% | | | | | |
Aircastle Ltd.(a) | | 151,000 | | | 4,878,810 |
Babcock & Brown Air Ltd., ADR (Ireland)*(a) | | 162,000 | | | 3,601,260 |
| | | | | |
| | | | | 8,480,070 |
See Notes to Financial Statements.
| | |
| Jennison Equity Income Fund | | 17 |
Portfolio of Investments
October 31, 2007 continued
| | | | | | |
| | | Shares | | Value (Note 2) | |
| | | | | | |
COMMON STOCKS (continued) | | | | |
| | |
Transportation Infrastructure 1.1% | | | | | | |
Macquarie Infrastructure Co. LLC(a) | | 65,500 | | $ | 2,735,280 | |
| | | | | | |
TOTAL LONG-TERM INVESTMENTS
(cost $221,858,458) | | | | | 251,035,938 | |
| | | | | | |
| | |
SHORT-TERM INVESTMENT 32.0% | | | | | | |
| | |
Affiliated Money Market Mutual Fund | | | | | | |
Dryden Core Investment Fund - Taxable Money Market Series
(cost $81,666,533; includes $80,012,675 of cash collateral for securities on loan)(b)(f) | | 81,666,533 | | | 81,666,533 | |
| | | | | | |
TOTAL INVESTMENTS(e) 130.4%
(cost $303,524,991; Note 5) | | | | | 332,702,471 | |
Liabilities in excess of other assets (30.4%) | | | | | (77,474,403 | ) |
| | | | | | |
NET ASSETS 100.0% | | | | $ | 255,228,068 | |
| | | | | | |
The following abbreviations are used in portfolio descriptions:
144A—Security was purchased pursuant to Rule 144A under the securities Act of 1933 and may not be resold subject to that rule except to qualified institutional buyers. Unless otherwise noted, 144A securities are deemed to be liquid.
ADR—American Depositary Receipt
| * | Non-income producing security. |
| (a) | All or a portion of security is on loan. The aggregate market value of such securities is $78,122,870; cash collateral of $80,012,675 (included with liabilities) was received with which the portfolio purchased highly liquid short-term investments. |
| (b) | Represents security, or a portion thereof, purchased with cash collateral received for securities on loan. |
| (c) | Private Placement restricted as to resale and does not have a readily available market. The aggregate cost of such securities is $7,600,020. The aggregate value of $7,138,396 is approximately 2.8% of net assets. |
| (d) | Indicates a security that has been deemed illiquid. |
| (e) | As of October 31, 2007, 3 securities representing $7,138,396 and 2.8% of the total market value were fair valued in accordance with the policies adopted by the Board of Trustees. |
| (f) | Prudential Investments LLC, the manager of the Fund also serves as manager of the Dryden Core Investment Fund-Taxable Money Market Series. |
See Notes to Financial Statements.
| | |
| 18 | | Visit our website at www.jennisondryden.com |
The industry classification of investments and liabilities in excess of other assets shown as a percentage of net assets as of October 31, 2007 were as follows:
| | | |
Affiliated Money Market Mutual Fund (31.3% represents investments purchased with collateral from securities on loan) | | 32.0 | % |
Oil, Gas & Consumable Fuels | | 21.7 | |
Electric Utilities | | 16.5 | |
Diversified Telecommunication Services | | 13.4 | |
Pharmaceuticals | | 7.3 | |
Marine | | 6.4 | |
Real Estate Investment Trusts | | 6.2 | |
Multi-Utilities | | 4.5 | |
Trading Companies & Distributors | | 3.3 | |
Tobacco | | 3.2 | |
Hotels, Restaurants & Leisure | | 2.3 | |
Gas Utilities | | 2.1 | |
Food Products | | 1.9 | |
Media | | 1.8 | |
Commercial Services & Supplies | | 1.6 | |
Commercial Banks | | 1.3 | |
Transportation Infrastructure | | 1.1 | |
Household Products | | 1.1 | |
Food & Staples Retailing | | 1.0 | |
Air Freight & Logistics | | 1.0 | |
Machinery | | 0.7 | |
| | | |
| | 130.4 | |
Liabilities in excess of other assets | | (30.4 | ) |
| | | |
| | 100.0 | % |
| | | |
See Notes to Financial Statements.
| | |
| Jennison Equity Income Fund | | 19 |
Statement of Assets and Liabilities
as of October 31, 2007
| | | | |
ASSETS | | | | |
Investments at value: Unaffiliated investments(a) including securities on loan(c) | | $ | 251,035,938 | |
Affiliated investments(b) | | | 81,666,533 | |
Securities sold | | | 5,274,924 | |
Dividends and interest | | | 940,334 | |
Fund shares sold | | | 233,333 | |
Prepaid expenses | | | 9,862 | |
| | | | |
Total assets | | | 339,160,924 | |
| | | | |
| |
LIABILITIES | | | | |
Payable to broker for collateral for securities on loan | | | 80,012,675 | |
Securities purchased | | | 2,329,280 | |
Payable for Fund shares redeemed | | | 548,225 | |
Accrued expenses | | | 361,236 | |
Transfer agents’ fees(d) | | | 200,837 | |
Payable to investment manager | | | 164,188 | |
Distribution fees | | | 162,057 | |
Payable to custodian | | | 148,779 | |
Deferred directors’ fees | | | 3,569 | |
Withholding tax payable | | | 2,010 | |
| | | | |
Total liabilities | | | 83,932,856 | |
| | | | |
| |
NET ASSETS | | $ | 255,228,068 | |
| | | | |
| | | | | |
Net assets were comprised of: | | | | |
Common stock, at $.001 par value | | $ | 13,396 | |
Paid-in capital in excess of par | | | 180,058,128 | |
| | | | |
| | | 180,071,524 | |
Overdistribution of net investment income | | | (126,796 | ) |
Accumulated net realized gain on investments and foreign currency transactions | | | 46,092,939 | |
Net unrealized appreciation (depreciation) on investments and foreign currency | | | 29,190,401 | |
| | | | |
Net assets, October 31, 2007 | | $ | 255,228,068 | |
| | | | |
(a) Unaffiliated investments at cost | | $ | 221,858,458 | |
| | | | |
(b) Affiliated investments at cost | | $ | 81,666,533 | |
| | | | |
(c) Securities on loan at value | | $ | 78,122,870 | |
| | | | |
(d) Affiliated transfer agent fees | | $ | 32,400 | |
| | | | |
See Notes to Financial Statements.
| | |
| 20 | | Visit our website at www.jennisondryden.com |
| | | |
Class A: | | | |
Net asset value and redemption price per share | | | |
($59,341,185 ÷ 3,048,575 shares of common stock issued and outstanding) | | $ | 19.47 |
Maximum sales charge (5.5% of offering price) | | | 1.13 |
| | | |
Offering price per share | | $ | 20.60 |
| | | |
| |
Class B: | | | |
Net asset value, offering and redemption price per share | | | |
($4,956,175 ÷ 262,926 shares of common stock issued and outstanding) | | $ | 18.85 |
| | | |
| |
Class C: | | | |
Net asset value, offering and redemption price per share | | | |
($46,647,582 ÷ 2,478,730 shares of common stock issued and outstanding) | | $ | 18.82 |
| | | |
| |
Class L: | | | |
Net asset value, offering and redemption price per share | | | |
($35,545,348 ÷ 1,833,677 shares of common stock issued and outstanding) | | $ | 19.38 |
| | | |
| |
Class M: | | | |
Net asset value, offering and redemption price per share | | | |
($80,934,405 ÷ 4,293,863 shares of common stock issued and outstanding) | | $ | 18.85 |
| | | |
| |
Class X: | | | |
Net asset value, offering and redemption price per share | | | |
($27,803,373 ÷ 1,478,213 shares of common stock issued and outstanding) | | $ | 18.81 |
| | | |
See Notes to Financial Statements.
| | |
| Jennison Equity Income Fund | | 21 |
Statement of Operations
Year Ended October 31, 2007
| | | | |
NET INVESTMENT INCOME | | | | |
Investment income | | | | |
Unaffiliated dividend income | | $ | 12,971,351 | |
Affiliated income from securities loaned, net | | | 313,890 | |
Affiliated dividend income | | | 220,261 | |
Interest | | | 492 | |
Foreign taxes withheld | | | (577,229 | ) |
| | | | |
Total income | | | 12,928,765 | |
| | | | |
| |
Expenses | | | | |
Advisory fees | | | 2,184,558 | |
Distribution fees—Class A | | | 106,169 | |
Distribution fees—Class B | | | 44,830 | |
Distribution fees—Class C | | | 455,367 | |
Distribution fees—Class L | | | 183,063 | |
Distribution fees—Class M | | | 996,613 | |
Distribution fees—Class X | | | 282,459 | |
Transfer agent’s fees and expenses (including affiliated expense of $409,000) | | | 725,000 | |
Custodian’s fees and expenses | | | 99,000 | |
Reports to shareholders | | | 80,000 | |
Registration fees | | | 76,000 | |
Audit and legal fees | | | 43,000 | |
Directors’ fees | | | 15,000 | |
Insurance fees | | | 2,000 | |
Commitment fees | | | 1,000 | |
Miscellaneous | | | 12,780 | |
| | | | |
Total expenses | | | 5,306,839 | |
Less: Advisory fee waivers and expense reimbursements | | | (281,500 | ) |
| | | | |
Net expenses | | | 5,025,339 | |
| | | | |
Net investment income | | | 7,903,426 | |
| | | | |
| |
REALIZED AND UNREALIZED GAIN (LOSS) ON INVESTMENTS AND FOREIGN CURRENCY TRANSACTIONS | | | | |
Net realized gain (loss) on: | | | | |
Investments | | | 73,161,227 | |
Foreign currencies | | | (155,102 | ) |
| | | | |
| | | 73,006,125 | |
| | | | |
Net change in unrealized appreciation (depreciation) on: | | | | |
Investments | | | (29,696,493 | ) |
Foreign currencies | | | 12,921 | |
| | | | |
| | | (29,683,572 | ) |
| | | | |
Net gain on investments and foreign currencies | | | 43,322,553 | |
| | | | |
NET INCREASE IN NET ASSETS RESULTING FROM OPERATIONS | | $ | 51,225,979 | |
| | | | |
See Notes to Financial Statements.
| | |
| 22 | | Visit our website at www.jennisondryden.com |
Statement of Changes in Net Assets
| | | | | | | | |
| | | Jennison Equity Income Fund | |
| | | Year
Ended
October 31, 2007 | | | Year
Ended
October 31, 2006 | |
INCREASE (DECREASE) IN NET ASSETS | | | | | | | | |
Operations | | | | | | | | |
Net investment income | | $ | 7,903,426 | | | $ | 554,420 | |
Net realized gain on investments and foreign currencies | | | 73,006,125 | | | | 18,439,290 | |
Net change in unrealized appreciation (depreciation) on investments and foreign currencies | | | (29,683,572 | ) | | | 25,327,566 | |
| | | | | | | | |
Net increase in net assets resulting from operations | | | 51,225,979 | | | | 44,321,276 | |
| | | | | | | | |
Dividends (Note 1) | | | | | | | | |
Dividends from net investment income | | | | | | | | |
Class A | | | (1,605,295 | ) | | | (20,184 | ) |
Class B | | | (120,218 | ) | | | — | |
Class C | | | (1,180,234 | ) | | | — | |
Class L | | | (1,176,334 | ) | | | (9,947 | ) |
Class M | | | (2,431,718 | ) | | | — | |
Class X | | | (724,560 | ) | | | — | |
| | | | | | | | |
Total dividends | | | (7,238,359 | ) | | | (30,131 | ) |
| | | | | | | | |
| | |
Fund share transactions (Note 4) | | | | | | | | |
Net proceeds from shares sold | | | 17,116,330 | | | | 13,488,011 | |
Net asset value of shares issued in reinvestment of dividends and distributions | | | 6,509,802 | | | | 17,669 | |
Cost of shares redeemed | | | (79,167,291 | ) | | | (93,818,404 | ) |
| | | | | | | | |
Decrease in net assets from Fund share transactions | | | (55,541,159 | ) | | | (80,312,724 | ) |
| | | | | | | | |
Net decrease in net assets | | | (11,553,539 | ) | | | (36,021,579 | ) |
| | |
NET ASSETS | | | | | | | | |
Beginning of year | | | 266,781,607 | | | | 302,803,186 | |
| | | | | | | | |
End of year(a) | | $ | 255,228,068 | | | $ | 266,781,607 | |
| | | | | | | | |
(a) Includes undistributed net investment income of | | $ | — | | | $ | 533,310 | |
| | | | | | | | |
See Notes to Financial Statements.
| | |
| Jennison Equity Income Fund | | 23 |
Notes to Financial Statements
1. Organization
Strategic Partners Mutual Funds, Inc., formerly known as American Skandia Advisor Funds, Inc., (the “Company”) is an open-end management investment company, registered under the Investment Company Act of 1940, as amended. The Company was organized on March 5, 1997, as a Maryland Corporation. The Company operates as a series company and effective April 12, 2004, the name of the Company was changed to Strategic Partners Mutual Funds, Inc. At October 31, 2007, the Company consisted of four diversified investment portfolios (each a “Fund” and collectively the “Funds”). The information presented in these financial statements pertains to Jennison Equity Income Fund (formerly known as Strategic Partners Equity Income Fund) (“Equity Income”). The investment objective of the Fund is long term capital growth and income by investing primarily in common stocks that are believed to be selling at reasonable valuation in relation to their fundamental business prospects.
2. Significant Accounting Policies
The following accounting policies are in conformity with accounting principles generally accepted in the United States of America. Such policies are consistently followed by the Company and the Funds in the preparation of their financial statements.
Securities Valuation
Securities listed on a securities exchange (other than options on securities and indices) are valued at the last sale price on such exchange on the day of valuation or, if there was no sale on such day, at the mean between the last reported bid and asked prices, or at the last bid price on such day in the absence of an asked price. Securities that are actively traded via Nasdaq are valued at the official closing price as provided by Nasdaq. Securities that are actively traded in the over-the-counter market, including listed securities for which primary market is believed by Prudential Investments LLC (“PI” or “Manager”) in consultation with the subadviser, to be over-the-counter, are valued at market value using prices provided by an independent pricing agent or principal market maker. Futures contracts and options thereon traded on a commodities exchange or board of trade are valued at the last sale price at the close of trading on such exchange or board of trade or, if there was no sale on the applicable commodities exchange or board of trade on such day, at the mean between the most recently quoted prices on such exchange or board of trade or at the last bid price in the absence of an asked price. Prices may be obtained from independent pricing services which use information provided by market makers or
| | |
| 24 | | Visit our website at www.jennisondryden.com |
estimates of market values obtained from yield data relating to investments or securities with similar characteristics. Securities for which reliable market quotations are not readily available, or whose values have been affected by events occurring after the close of the security’s foreign market and before the Fund’s normal pricing time, are valued at fair value in accordance with the Board of Directors’ approved fair valuation procedures. When determining the fair valuation of securities some of the factors influencing the valuation include, the nature of any restrictions on disposition of the securities; assessment of the general liquidity of the securities; the issuer’s financial condition and the markets in which it does business; the cost of the investment; the size of the holding and the capitalization of issuer; the prices of any recent transactions or bids/offers for such securities or any comparable securities; any available analyst media or other reports or information deemed reliable by the investment adviser regarding the issuer or the markets or industry in which it operates. Using fair value to price securities may result in a value that is different from a security’s most recent closing price and from the price used by other mutual funds to calculate their net asset value.
Investments in mutual funds are valued at the net asset value as of the close of the New York Stock Exchange on the date of valuation.
Foreign Currency Translation
Fund securities and other assets and liabilities denominated in foreign currencies are translated each business day into U.S. dollars based on the current rates of exchange. Purchases and sales of Fund securities and income and expenses are translated into U.S. dollars on the respective dates of such transactions. Gains and losses resulting from changes in exchange rates applicable to long-term foreign securities are not reported separately from gains and losses arising from movements in securities prices. Net realized foreign exchange gains and losses include gains and losses from sales and maturities of foreign currency exchange contracts, gains and losses realized between the trade and settlement dates of foreign securities transactions, and the difference between the amount of net investment income accrued on foreign securities and the U.S. dollar amount actually received. Net unrealized foreign exchange gains and losses include gains and losses from changes in the value of assets and liabilities other than Fund securities, resulting from changes in exchange rates.
Repurchase Agreements
A repurchase agreement is a commitment to purchase securities from a seller who agrees to repurchase the securities at an agreed-upon price and date. The excess of
| | |
| Jennison Equity Income Fund | | 25 |
Notes to Financial Statements
continued
the resale price over the purchase price determines the yield on the transaction. Under the terms of the agreement, the market value, including accrued interest, of the securities will be at least equal to their repurchase price.
Repurchase agreements are recorded at cost, which, combined with accrued interest, approximates market value.
Repurchase agreements bear a risk of loss in the event that the seller defaults on its obligation to repurchase the securities. In such case, the Fund may be delayed or prevented from exercising its right to dispose of the securities.
Securities Lending
The Funds may lend their portfolio securities to broker-dealers. The loans are secured by collateral at least equal at all times to the market value of the securities loaned. Loans are subject to termination at the option of the borrower or the Funds. Upon termination of the loan, the borrower will return to the lender securities identical to the loaned securities. Should the borrower of the securities fail financially, the Funds have the right to repurchase the securities using the collateral in the open market. The Funds recognize income, net of any rebate and securities lending agent fees, for lending its securities in the form of fees or interest on the investment of any cash received as collateral. The Funds also continue to receive interest and dividends or amounts equivalent thereto, on the securities loaned and recognize any unrealized gain or loss in the market price of the securities loaned that may occur during the term of the loan.
Cash collateral received in connection with securities lending is invested in short-term investments by the lending agent. These may include the Prudential Core Money Market Series or Institutional Money Market Trust, advised by BlackRock Capital Management, Inc., or directly in high-quality, short-term instruments with a maturity date not to exceed 60 days.
Investment Transactions and Investment Income
Securities transactions are recorded on the trade date. Realized gains or losses on sales of investments and currency transactions are calculated on the identified cost basis. Dividend income is recorded on the ex-dividend date and interest income is
| | |
| 26 | | Visit our website at www.jennisondryden.com |
recorded on the accrual basis. The Fund amortizes premiums and discounts on portfolio securities as adjustments to interest income. Expenses are recorded on the accrual basis which may require the use of certain estimates by management.
Net investment income or loss (other than distribution fees, which are charged directly to the respective class) and unrealized and realized gains or losses are allocated daily to each class of shares based upon the relative proportion of net assets of each class at the beginning of the day.
Distributions to Shareholders
Distributions to shareholders are recorded on the ex-divided date. Dividends, if any, from net investment income are declared and paid at least quarterly by the Equity Income fund.
These dividends and distributions are determined in accordance with federal income tax regulations and may differ from accounting principles generally accepted in the United States of America.
Net realized gains from investment transactions, if any, are distributed at least annually. Permanent book/tax differences relating to income and gains are reclassified to paid-in capital when they arise.
Taxes
For federal income tax purposes, each Fund in the Company is treated as a separate tax paying entity. It is the Fund’s policy to continue to meet the requirements of the Internal Revenue Code applicable to regulated investment companies and to distribute all of its taxable net income and capital gains, if any, to shareholders. Therefore, no federal tax provision is required. Withholding taxes on foreign dividends are recorded net of reclaimable amounts, at the time the related income is earned.
Estimates
The preparation of the financial statements requires management to make estimates and assumptions that affect the reported amounts and disclosures in the financial statements. Actual results could differ from those estimates.
3. Agreements and Other Transactions with Affiliates
The Funds have entered into investment management agreements with Prudential Investments LLC (“Investment Manager”) which provide that the Investment Manager
| | |
| Jennison Equity Income Fund | | 27 |
Notes to Financial Statements
continued
will furnish each Fund with investment advice and investment management and administrative services. The Investment Manager has engaged Jennison Associates LLC as Sub-advisors of the Fund, as of October 31, 2007.
Advisory Fees and Expense Limitations
The Investment Manager receives a fee, computed daily and paid monthly, based on an annual rate of the average net assets. The Investment Manager pays the Sub-advisor a fee as compensation for advisory services provided to the Funds. The Investment Manager has voluntarily agreed to waive expenses in accordance with limitation expense policies as noted in the table below. The Investment Manager will reimburse the Fund for its respective operating expenses, exclusive of taxes, interest, brokerage commissions, distribution fees and extraordinary expenses, but inclusive of the advisory fee, which in the aggregate exceed specified percentages of the Fund’s average net assets while retaining their ability to be reimbursed for such fee waivers prior to the end of the fiscal year. The advisory fees and expense limitations are summarized as follows:
| | | | | | | | |
| | | Advisory Expense | | Effective Advisory Fees
Net of Waiver | | | Expense
Limitations | |
Equity Income Fund | | 0.85% to $500 million; | | 0.85 | % | | 1.15 | % |
| | 0.80% next $500 million; | | | | | | |
| | 0.75% in excess of $1 billion | | | | | | |
Management of the Company
Certain officers and directors of the Funds are officers or directors of the Investment Manager. The Funds pay no compensation directly to their officers or interested directors.
Distributor
Prudential Investment Management Services LLC (“PIMS”) and American Skandia Marketing, Incorporated (“ASMI”), both affiliates of Prudential Investments LLC, an indirect, wholly-owned subsidiary of Prudential, serve as the distributor for the Funds. The Company has adopted a separate Distribution and Service plan (each a “Plan” and collectively the “Plans”) for Class A, B, C, L, M, X and Z shares of each Fund in accordance with the requirements of Rule 12b-1 of the Investment Company Act of 1940. No distribution or service fees are paid to PIMS as distributor for Class Z shares.
| | |
| 28 | | Visit our website at www.jennisondryden.com |
Under the Plans, the Fund compensate PIMS and ASMI a distribution and service fee at an annual rate up to 0.30%, 1.00%, 1.00%, 0.50%, 1.00% and 1.00% of the average daily net assets of the Class A, B, C, L, M and X shares, respectively. For the year ended October 31, 2007, PIMS has contractually agreed to limit such fees to 0.25 of 1% of the average daily net assets of the Class A shares.
During the year ended October 31, 2007, PIMS has advised the Fund, front-end sales charges (“FESC”) and gross contingent deferred sales charges (“CDSC”) were approximately as follows:
| | | | | | | | | | | | | | | | | | |
| | | Class A
FESC | | Class A
CDSC | | Class B
CDSC | | Class C
CDSC | | Class M
CDSC | | Class X
CDSC |
Equity Income | | $ | 67,300 | | $ | 1,100 | | $ | 21,800 | | $ | 1,000 | | $ | 180,200 | | $ | 39,300 |
Transfer Agent
Prudential Mutual Fund Services LLC (“PMFS”), an affiliate of Prudential Investments LLC and an indirect, wholly-owned subsidiary of Prudential, serves as the Funds’ transfer agent. Transfer agent fees and expenses are shown in the Statements of Operations.
The Fund pays networking fees to affiliated and unaffiliated broker/dealers, including fees relating to the services of Wachovia Securities, LLC (“Wachovia”) and First Clearing, LLC (“First Clearing”), affiliated of PI. These networking fees are payments made to broker/dealers that clear mutual fund transactions through a national clearing system. These amounts are included in transfer agents’ fees and expenses on the Statement of Operations. For the year ended October 31, 2007, the Fund incurred approximately $50,200 in total networking fees, of which approximately $3,400 was paid to Wachovia and First Clearing.
Cash Sweep
The Fund invests in the Taxable Money Market Series (the “Series”), a portfolio of Dryden Core Investment Fund, pursuant to an exemptive order received from the Securities and Exchange Commission. The Series is a money market mutual fund registered under the Investment Company Act of 1940, as amended, and managed by PI.
Securities Lending Agent
Prudential Investment Management, Inc. (“PIM”), an indirect, wholly-owned subsidiary of Prudential, served as the Fund’s securities lending agent. For the year
| | |
| Jennison Equity Income Fund | | 29 |
Notes to Financial Statements
continued
ended October 31, 2007, PIM was compensated as follows for these services by the Fund:
| | | |
Fund | | PIM |
Equity Income | | $ | 135,189 |
Broker
For the year ended October 31, 2007, Prudential Equity Group, LLC earned $1,276 in brokerage commissions from transactions executed on behalf of the Fund.
4. Shares of Capital Stock
Class A shares are sold with a front-end sales charge of up to 5.50%. Purchases of $1 million or more are subject to a contingent deferred sales charge (“CDSC”) if shares are redeemed within 12 months of their purchase. Class B shares are sold with a CDSC which declines from 5% to zero depending upon the period of time the shares are held. Class B shares will automatically convert to Class A shares approximately seven years after purchase. Class M shares will automatically convert to Class A shares approximately eight years after purchase. Class C shares are sold with a CDSC of 1% during the first 12 months. Class L shares are closed to most new purchases (with the exception of reinvested dividends and purchases by certain college savings plans). Class M shares are also closed to most new purchases (with the exception of reinvested dividends). Class L shares and Class M shares are only exchangeable with Class L shares and Class M shares, respectively, offered by the other Strategic Partners Funds. Class X shares are closed to new purchases. The authorized capital stock of the Funds is 5.5 billion shares, with a par value of $.001 per share.
| | |
| 30 | | Visit our website at www.jennisondryden.com |
Transactions in shares of capital stock were as follows:
| | | | | | | |
Class A | | Shares | | | Amount | |
Year ended October 31, 2007: | | | | | | | |
Shares sold | | 504,326 | | | $ | 9,191,743 | |
Shares issued in reinvestment of dividends and distributions | | 75,520 | | | | 1,374,588 | |
Shares reacquired | | (784,318 | ) | | | (14,049,788 | ) |
| | | | | | | |
Net increase (decrease) in shares outstanding before conversion | | (204,472 | ) | | | (3,483,457 | ) |
Shares issued upon conversion from Class B, Class M and Class X | | 1,409,216 | | | | 25,415,763 | |
| | | | | | | |
Net increase (decrease) in shares outstanding | | 1,204,744 | | | $ | 21,932,306 | |
| | | | | | | |
Year ended October 31, 2006: | | | | | | | |
Shares sold | | 439,154 | | | $ | 6,730,675 | |
Shares issued in reinvestment of dividends and distributions | | 617 | | | | 9,023 | |
Shares reacquired | | (418,571 | ) | | | (6,405,325 | ) |
| | | | | | | |
Net increase (decrease) in shares outstanding before conversion | | 21,200 | | | | 334,373 | |
Shares issued upon conversion from Class B, Class M, and class X into A | | 762,062 | | | | 11,455,390 | |
| | | | | | | |
Net increase (decrease) in shares outstanding | | 783,262 | | | $ | 11,789,763 | |
| | | | | | | |
Class B | | | | | | |
Year ended October 31, 2007: | | | | | | | |
Shares sold | | 65,838 | | | $ | 1,148,830 | |
Shares issued in reinvestment of dividends and distributions | | 6,431 | | | | 114,008 | |
Shares reacquired | | (60,547 | ) | | | (1,043,828 | ) |
| | | | | | | |
Net increase (decrease) in shares outstanding before conversion | | 11,722 | | | | 219,010 | |
Shares reacquired upon conversion into Class A | | (6,212 | ) | | | (111,527 | ) |
| | | | | | | |
Net increase (decrease) in shares outstanding | | 5,510 | | | $ | 107,483 | |
| | | | | | | |
Year ended October 31, 2006: | | | | | | | |
Shares sold | | 82,750 | | | $ | 1,206,065 | |
Shares issued in reinvestment of dividends and distributions | | — | | | | — | |
Shares reacquired | | (50,634 | ) | | | (741,523 | ) |
| | | | | | | |
Net increase (decrease) in shares outstanding before conversion | | 32,116 | | | | 464,542 | |
Shares reacquired upon conversion into Class A | | (5 | ) | | | (77 | ) |
| | | | | | | |
Net increase (decrease) in shares outstanding | | 32,111 | | | $ | 464,465 | |
| | | | | | | |
Class C | | | | | | |
Year ended October 31, 2007: | | | | | | | |
Shares sold | | 187,454 | | | $ | 3,257,745 | |
Shares issued in reinvestment of dividends and distributions | | 61,248 | | | | 1,084,146 | |
Shares reacquired | | (712,301 | ) | | | (12,235,739 | ) |
| | | | | | | |
Net increase (decrease) in shares outstanding | | (463,599 | ) | | $ | (7,893,848 | ) |
| | | | | | | |
Year ended October 31, 2006: | | | | | | | |
Shares sold | | 105,348 | | | $ | 1,547,102 | |
Shares issued in reinvestment of dividends and distributions | | — | | | | — | |
Shares reacquired | | (1,156,169 | ) | | | (16,868,590 | ) |
| | | | | | | |
Net increase (decrease) in shares outstanding | | (1,050,821 | ) | | $ | (15,321,488 | ) |
| | | | | | | |
| | |
| Jennison Equity Income Fund | | 31 |
Notes to Financial Statements
continued
| | | | | | | |
Class L | | Shares | | | Amount | |
Year ended October 31, 2007: | | | | | | | |
Shares sold | | 28,679 | | | $ | 490,444 | |
Shares issued in reinvestment of dividends and distributions | | 60,767 | | | | 1,094,169 | |
Shares reacquired | | (623,099 | ) | | | (11,027,953 | ) |
| | | | | | | |
Net increase (decrease) in shares outstanding | | (533,653 | ) | | $ | (9,443,340 | ) |
| | | | | | | |
Year ended October 31, 2006: | | | | | | | |
Shares sold | | 27,514 | | | $ | 441,706 | |
Shares issued in reinvestment of dividends and distributions | | 594 | | | | 8,646 | |
Shares reacquired | | (984,395 | ) | | | (14,719,663 | ) |
| | | | | | | |
Net increase (decrease) in shares outstanding | | (956,287 | ) | | $ | (14,269,311 | ) |
| | | | | | | |
Class M | | | | | | |
Year ended October 31, 2007: | | | | | | | |
Shares sold | | 125,614 | | | $ | 2,140,519 | |
Shares issued in reinvestment of dividends and distributions | | 122,138 | | | | 2,162,317 | |
Shares reacquired | | (1,914,141 | ) | | | (32,978,663 | ) |
| | | | | | | |
Net increase (decrease) in shares outstanding before conversion | | (1,666,389 | ) | | | (28,675,827 | ) |
Shares reacquired upon conversion into Class A | | (1,442,308 | ) | | | (25,194,755 | ) |
| | | | | | | |
Net increase (decrease) in shares outstanding | | (3,108,697 | ) | | $ | (53,870,582 | ) |
| | | | | | | |
Year ended October 31, 2006: | | | | | | | |
Shares sold | | 189,138 | | | $ | 2,785,678 | |
Shares issued in reinvestment of dividends and distributions | | — | | | | — | |
Shares reacquired | | (2,995,342 | ) | | | (43,672,538 | ) |
| | | | | | | |
Net increase (decrease) in shares outstanding before conversion | | (2,806,204 | ) | | | (40,886,860 | ) |
Shares reacquired upon conversion into Class A | | (339,503 | ) | | | (4,983,053 | ) |
| | | | | | | |
Net increase (decrease) in shares outstanding | | (3,145,707 | ) | | $ | (45,869,913 | ) |
| | | | | | | |
Class X | | | | | | |
Year ended October 31, 2007: | | | | | | | |
Shares sold | | 52,564 | | | $ | 887,049 | |
Shares issued in reinvestment of dividends and distributions | | 38,478 | | | | 680,574 | |
Shares reacquired | | (454,598 | ) | | | (7,831,320 | ) |
| | | | | | | |
Net increase (decrease) in shares outstanding before conversion | | (363,556 | ) | | | (6,263,697 | ) |
Shares reacquired upon conversion into Class A | | (6,177 | ) | | | (109,481 | ) |
| | | | | | | |
Net increase (decrease) in shares outstanding | | (369,733 | ) | | $ | (6,373,178 | ) |
| | | | | | | |
Year ended October 31, 2006: | | | | | | | |
Shares sold | | 57,764 | | | $ | 776,785 | |
Shares issued in reinvestment of dividends and distributions | | — | | | | — | |
Shares reacquired | | (785,116 | ) | | | (11,410,765 | ) |
| | | | | | | |
Net increase (decrease) in shares outstanding before conversion | | (727,352 | ) | | | (10,633,980 | ) |
Shares reacquired upon conversion into Class A | | (447,571 | ) | | | (6,472,260 | ) |
| | | | | | | |
Net increase (decrease) in shares outstanding | | (1,174,923 | ) | | $ | (17,106,240 | ) |
| | | | | | | |
| | |
| 32 | | Visit our website at www.jennisondryden.com |
5. Distributions and Tax Information
Distributions to shareholders, which are determined in accordance with federal income tax regulations, which may differ from generally accepted accounting principles, are recorded on the ex-dividend date. In order to present undistributed net investment income and accumulated net realized gain on investments and foreign currency transactions on the Statement of Assets and Liabilities that more closely represent their tax character, certain adjustments have been made to undistributed net investment income and accumulated net realized gain on investments and foreign currency transactions. For the tax year ended October 31, 2007 the adjustments were to decrease undistributed net investment income and to increase accumulated net realized gain on investments and foreign currency transactions by $1,325,173 due to the treatment for book and tax purposes of foreign currency gains and losses and partnership distributions. Net investment income, net realized gains and net assets were not affected by this change.
For the fiscal years ended October 31, 2007 and October 31, 2006, the tax character of dividends paid as reflected in the Statement of Changes in Net Assets were $7,238,359 and $30,131 from ordinary income, respectively. For federal income tax purposes, dividends from net investment income and distributions from short-term capital gains are taxable as ordinary income. Long-term capital gain distributions are taxable as such.
As of October 31, 2007, the accumulated undistributed earnings on a tax basis were $861,158 from ordinary income and $57,408,066 from long-term capital gains. This differs from the amount shown on the Statement of Assets and Liabilities primarily due to cumulative timing differences between financial and tax reporting.
At October 31, 2007, for federal income tax purposes, the Fund had a capital loss carryforward of approximately $12,403,000 of which $9,574,000 expires in 2009 and $2,829,000 expires in 2010. Approximately $14,035,000 of its capital loss carryforward was used to offset net taxable realized capital gains. Certain portions of the capital loss carryforwards were assumed by the Fund as a result of acquisition. No capital gain distributions are expected to be paid to shareholders until net gains have been realized in excess of such carryforward. It is uncertain whether the Fund will be able to realize the full benefit prior to the expiration date.
The federal income tax basis of the Fund’s investments and the net unrealized appreciation as of October 31, 2007 was as follows:
| | | | | | |
Tax basis | | Appreciation | | Depreciation | | Net Unrealized
Appreciation |
$303,421,892 | | $36,548,905 | | $7,268,326 | | $29,280,579 |
| | |
| Jennison Equity Income Fund | | 33 |
Notes to Financial Statements
The difference between book basis and tax basis was primarily attributable to deferred losses on wash sales and tax adjustments due to investments in passive foreign investment companies and partnership distributions.
6. Portfolio Securities
Purchases and sales of securities, other than U.S. government securities and short-term obligations, during the year ended October 31, 2007, were $360,866,552 and $414,874,726, respectively.
7. Line of Credit
The Fund, along with other affiliated registered investment companies, is a party to a Syndicated Credit Agreement (“SCA”) with two banks. The SCA, which was renewed on October 27, 2006, provides for a commitment of $500 million. Interest on any borrowings under the SCA is incurred at contracted market rates and a commitment fee for the unused amount is accrued daily and paid quarterly. Effective October 26, 2007, the Funds renewed the SCA with the banks. The commitment under the renewed SCA continues to be $500 million. The Funds pay a commitment fee of .06 of 1% of the unused portion of the SCA. The expiration date of the renewed SCA will be October 24, 2008. For the period from October 27, 2006 through October 26, 2007, the Funds paid a commitment fee of .07 of 1% of the unused portion of the agreement. The purpose of the SCA is to provide an alternative source of temporary funding for capital share redemptions. The Fund did not utilize the line of credit during the fiscal period ended October 31, 2007.
8. New Accounting Pronouncements
On July 13, 2006, the Financial Accounting Standards Board (FASB) released FASB Interpretation No. 48 “Accounting for Uncertainty in Income Taxes” (FIN 48). FIN 48 provides guidance for how uncertain tax positions should be recognized, measured, presented and disclosed in the financial statements. FIN 48 requires the evaluation of tax positions taken or expected to be taken in the course of preparing the Fund’s tax returns to determine whether the tax positions are “more-likely-than-not” of being sustained by the applicable tax authority. The impact of the tax positions not deemed to meet the more-likely-than-not threshold would be recorded in the year in which
| | |
| 34 | | Visit our website at www.jennisondryden.com |
they arise. On December 22, 2006, the Securities and Exchange Commission delayed the effective date until the last net asset value calculation in the first required financial reporting period for its fiscal year beginning after December 15, 2006. The Portfolios’ financial statements have not been impacted by the adoption of FIN 48. However, the conclusions regarding FIN 48 may be subject to review and adjustment at a later date based on factors including, but not limited to, further implementation guidance expected from FASB and on-going analysis of tax laws, regulations, and interpretations thereof.
On September 20, 2006, the FASB released Statement of Financial Accounting Standards No. 157 “Fair Value Measurements” (FAS 157). FAS 157 establishes an authoritative definition of fair value, sets out a framework for measuring fair value, and requires additional disclosures about fair-value measurements. The application of FAS 157 is required for fiscal years beginning after November 15, 2007 and interim periods within those fiscal years. At this time, management is evaluating the implications of FAS 157 and its impact, if any, in the financial statements has not yet been determined.
| | |
| Jennison Equity Income Fund | | 35 |
Financial Highlights
| | | | |
| |
| | | Class A | |
| | | Year Ended
October 31, 2007(e) | |
Per Share Operating Performance: | | | | |
Net Asset Value, Beginning of Period | | $ | 16.45 | |
| | | | |
Income (Loss) from investment operations: | | | | |
Net investment income | | | 0.66 | |
Net realized and unrealized gain (loss) on investments | | | 3.02 | |
| | | | |
Total from investment operations | | | 3.68 | |
| | | | |
Less Dividends and Distributions: | | | | |
Dividends from net investment income | | | (0.66 | ) |
| | | | |
Total dividends and distributions | | | (0.66 | ) |
| | | | |
Net asset value, end of period | | $ | 19.47 | |
| | | | |
Total Investment Return(a) | | | 22.72 | % |
Ratios/Supplemental Data: | | | | |
Net assets, end of period (in millions) | | $ | 59.3 | |
Ratios to average net assets: | | | | |
Expenses after advisory fee waiver and expense reimbursement | | | 1.40 | % |
Expenses before advisory fee waiver and expense reimbursement | | | 1.51 | % |
Net investment income | | | 3.83 | % |
Portfolio turnover rate | | | 143 | % |
| (a) | Total return does not consider the effects of sales load. Total return is calculated assuming a purchase of a share on the first day and a sale on the last day of each period reported and includes reinvestment of dividends and distributions. Total return for periods of less than a full year are not annualized. Total returns may reflect adjustments to conform to generally accepted accounting principles. Total return includes the effect of expense subsidies. |
| (d) | Commencement of operations. |
| (e) | Calculations are based on the average daily number of shares outstanding. |
See Notes to Financial Statements.
| | |
| 36 | | Visit our website at www.jennisondryden.com |
| | | | | | | | | | |
| Class A | |
| Year Ended October 31, | | | April 12, 2004(d)
through
October 31, 2004(e) | |
| 2006(e) | | | 2005 | | |
| | | | | | | | | | |
| $ | 13.99 | | | $ | 12.99 | | | $ | 13.28 | |
| | | | | | | | | | | |
| | | | | | | | | | |
| | 0.12 | | | | 0.13 | | | | 0.04 | |
| | 2.36 | | | | 1.00 | | | | (0.33 | ) |
| | | | | | | | | | | |
| | 2.48 | | | | 1.13 | | | | (0.29 | ) |
| | | | | | | | | | | |
| | | | | | | | | | |
| | (0.02 | ) | | | (0.13 | ) | | | — | |
| | | | | | | | | | | |
| | (0.02 | ) | | | (0.13 | ) | | | — | |
| | | | | | | | | | | |
| $ | 16.45 | | | $ | 13.99 | | | $ | 12.99 | |
| | | | | | | | | | | |
| | 17.74 | % | | | 8.72 | % | | | (2.18 | )% |
| | | | | | | | | | |
| $ | 30.3 | | | $ | 14.8 | | | $ | 9.0 | |
| | | | | | | | | | |
| | 1.40 | % | | | 1.41 | % | | | 1.40 | %(b) |
| | 1.49 | % | | | 1.84 | % | | | 1.78 | %(b) |
| | 0.78 | % | | | 0.78 | % | | | 0.59 | %(b) |
| | 36 | % | | | 66 | % | | | 54 | %(c) |
See Notes to Financial Statements.
| | |
| Jennison Equity Income Fund | | 37 |
Financial Highlights
continued
| | | | |
| |
| | | Class B | |
| | | Year Ended
October 31, 2007(e) | |
Per Share Operating Performance: | | | | |
Net Asset Value, Beginning of Period | | $ | 15.89 | |
| | | | |
Income (Loss) from investment operations: | | | | |
Net investment income (loss) | | | 0.51 | |
Net realized and unrealized gain (loss) on investments | | | 2.91 | |
| | | | |
Total from investment operations | | | 3.42 | |
| | | | |
Less Dividends and Distributions: | | | | |
Dividends from net investment income | | | (0.46 | ) |
| | | | |
Total dividends and distributions | | | (0.46 | ) |
| | | | |
Net asset value, end of period | | $ | 18.85 | |
| | | | |
Total Investment Return(a) | | | 21.76 | % |
Ratios/Supplemental Data: | | | | |
Net assets, end of period (in millions) | | $ | 5.0 | |
Ratios to average net assets: | | | | |
Expenses after advisory fee waiver and expense reimbursement | | | 2.15 | % |
Expenses before advisory fee waiver and expense reimbursement | | | 2.26 | % |
Net investment income (loss) | | | 2.95 | % |
Portfolio turnover rate | | | 143 | % |
| (a) | Total return does not consider the effects of sales load. Total return is calculated assuming a purchase of a share on the first day and a sale on the last day of each period reported and includes reinvestment of dividends and distributions. Total return for periods of less than a full year are not annualized. Total returns may reflect adjustments to conform to generally accepted accounting principals. Total return includes the effect of expense subsidies. |
| (d) | Commencement of operations. |
| (e) | Calculations are based on the average daily number of shares outstanding. |
| * | Amount is less than $0.005. |
See Notes to Financial Statements.
| | |
| 38 | | Visit our website at www.jennisondryden.com |
| | | | | | | | | | |
| Class B | |
| Year Ended October 31, | | | April 12, 2004(d)
through
October 31, 2004(e) | |
| 2006(e) | | | 2005 | | |
| | | | | | | | | | |
| $ | 13.60 | | | $ | 12.63 | | | $ | 12.98 | |
| | | | | | | | | | | |
| | | | | | | | | | |
| | 0.01 | | | | — | * | | | (0.01 | ) |
| | 2.28 | | | | 0.98 | | | | (0.34 | ) |
| | | | | | | | | | | |
| | 2.29 | | | | 0.98 | | | | (0.35 | ) |
| | | | | | | | | | | |
| | | | | | | | | | |
| | — | | | | (0.01 | ) | | | — | |
| | | | | | | | | | | |
| | — | | | | (0.01 | ) | | | — | |
| | | | | | | | | | | |
| $ | 15.89 | | | $ | 13.60 | | | $ | 12.63 | |
| | | | | | | | | | | |
| | 16.84 | % | | | 7.77 | % | | | (2.70 | )% |
| | | | | | | | | | |
| $ | 4.1 | | | $ | 3.1 | | | $ | 1.1 | |
| | | | | | | | | | |
| | 2.15 | % | | | 2.16 | % | | | 2.15 | %(b) |
| | 2.24 | % | | | 2.59 | % | | | 2.53 | %(b) |
| | 0.05 | % | | | (0.04 | )% | | | (0.21 | )%(b) |
| | 36 | % | | | 66 | % | | | 54 | %(c) |
See Notes to Financial Statements.
| | |
| Jennison Equity Income Fund | | 39 |
Financial Highlights
continued
| | | | |
| | | Class C | |
| | | Year Ended
October 31, 2007(b) | |
Per Share Operating Performance: | | | | |
Net Asset Value, Beginning of Year | | $ | 15.87 | |
| | | | |
Income from investment operations: | | | | |
Net investment income (loss) | | | 0.52 | |
Net realized and unrealized gain on investments | | | 2.89 | |
| | | | |
Total from investment operations | | | 3.41 | |
| | | | |
Less Dividends and Distributions: | | | | |
Dividends from net investment income | | | (0.46 | ) |
| | | | |
Total dividends and distributions | | | (0.46 | ) |
| | | | |
Net asset value, end of year | | $ | 18.82 | |
| | | | |
Total Investment Return(a) | | | 21.80 | % |
Ratios/Supplemental Data: | | | | |
Net assets, end of year (in millions) | | $ | 46.6 | |
Ratios to average net assets: | | | | |
Expenses after advisory fee waiver and expense reimbursement | | | 2.15 | % |
Expenses before advisory fee waiver and expense reimbursement | | | 2.26 | % |
Net investment income (loss) | | | 2.89 | % |
Portfolio turnover rate | | | 143 | % |
| (a) | Total return does not consider the effects of sales load. Total return is calculated assuming a purchase of a share on the first day and a sale on the last day of each year reported and includes reinvestment of dividends and distributions. Total returns may reflect adjustments to conform to generally accepted accounting principles. Total return includes the effect of expense subsidies. |
| (b) | Calculations are based on the average daily number of shares outstanding. |
See Notes to Financial Statements.
| | |
| 40 | | Visit our website at www.jennisondryden.com |
| | | | | | | | | | | | | | |
| Class C | |
| Year Ended October 31, | |
| 2006(b) | | | 2005 | | | 2004(b) | | | 2003(b) | |
| | | | | | | | | | | | | | |
| $ | 13.57 | | | $ | 12.61 | | | $ | 11.57 | | | $ | 9.40 | |
| | | | | | | | | | | | | | | |
| | | | | | | | | | | | | | |
| | 0.01 | | | | 0.01 | | | | (0.03 | ) | | | (0.02 | ) |
| | 2.29 | | | | 0.96 | | | | 1.07 | | | | 2.19 | |
| | | | | | | | | | | | | | | |
| | 2.30 | | | | 0.97 | | | | 1.04 | | | | 2.17 | |
| | | | | | | | | | | | | | | |
| | | | | | | | | | | | | | |
| | — | | | | (0.01 | ) | | | — | | | | — | |
| | | | | | | | | | | | | | | |
| | — | | | | (0.01 | ) | | | — | | | | — | |
| | | | | | | | | | | | | | | |
| $ | 15.87 | | | $ | 13.57 | | | $ | 12.61 | | | $ | 11.57 | |
| | | | | | | | | | | | | | | |
| | 16.95 | % | | | 7.70 | % | | | 8.99 | % | | | 23.09 | % |
| | | | | | | | | | | | | | |
| $ | 46.7 | | | $ | 54.2 | | | $ | 42.5 | | | $ | 53.8 | |
| | | | | | | | | | | | | | |
| | 2.15 | % | | | 2.16 | % | | | 2.15 | % | | | 2.15 | % |
| | 2.24 | % | | | 2.59 | % | | | 2.53 | % | | | 2.59 | % |
| | 0.07 | % | | | 0.14 | % | | | (0.28 | )% | | | (0.17 | )% |
| | 36 | % | | | 66 | % | | | 54 | % | | | 60 | % |
See Notes to Financial Statements.
| | |
| Jennison Equity Income Fund | | 41 |
Financial Highlights
continued
| | | | |
| | | Class L(c) | |
| | | Year Ended
October 31, 2007(b) | |
Per Share Operating Performance: | | | | |
Net Asset Value, Beginning of Year | | $ | 16.37 | |
| | | | |
Income from investment operations: | | | | |
Net investment income | | | 0.61 | |
Net realized and unrealized gain on investments | | | 2.99 | |
| | | | |
Total from investment operations | | | 3.60 | |
| | | | |
Less Dividends and Distributions: | | | | |
Dividends from net investment income | | | (0.59 | ) |
| | | | |
Total dividends and distributions | | | (0.59 | ) |
| | | | |
Net asset value, end of year | | $ | 19.38 | |
| | | | |
Total Investment Return(a) | | | 22.43 | % |
Ratios/Supplemental Data: | | | | |
Net assets, end of year (in millions) | | $ | 35.5 | |
Ratios to average net assets: | | | | |
Expenses after advisory fee waiver and expense reimbursement | | | 1.65 | % |
Expenses before advisory fee waiver and expense reimbursement | | | 1.76 | % |
Net investment income | | | 3.37 | % |
Portfolio turnover rate | | | 143 | % |
| (a) | Total return does not consider the effects of sales load. Total return is calculated assuming a purchase of a share on the first day and a sale on the last day of each year reported and includes reinvestment of dividends and distributions. Total returns may reflect adjustments to conform to generally accepted accounting principles. Total return includes the effect of expense subsidies. |
| (b) | Calculations are based on the average daily number of shares outstanding. |
| (c) | Prior to April 12, 2004, Class L shares were known as Class A shares. On April 12, 2004, Class A shares were redesignated as Class L shares and a new Class A was opened. |
See Notes to Financial Statements.
| | |
| 42 | | Visit our website at www.jennisondryden.com |
| | | | | | | | | | | | | | |
| Class L(c) | |
| Year Ended October 31, | |
| 2006(b) | | | 2005 | | | 2004(b) | | | 2003(b) | |
| | | | | | | | | | | | | | |
| $ | 13.93 | | | $ | 12.96 | | | $ | 11.83 | | | $ | 9.56 | |
| | | | | | | | | | | | | | | |
| | | | | | | | | | | | | | |
| | 0.08 | | | | 0.08 | | | | 0.03 | | | | 0.03 | |
| | 2.36 | | | | 0.98 | | | | 1.10 | | | | 2.24 | |
| | | | | | | | | | | | | | | |
| | 2.44 | | | | 1.06 | | | | 1.13 | | | | 2.27 | |
| | | | | | | | | | | | | | | |
| | | | | | | | | | | | | | |
| | — | | | | (0.09 | ) | | | — | | | | — | |
| | | | | | | | | | | | | | | |
| | — | | | | (0.09 | ) | | | — | | | | — | |
| | | | | | | | | | | | | | | |
| $ | 16.37 | | | $ | 13.93 | | | $ | 12.96 | | | $ | 11.83 | |
| | | | | | | | | | | | | | | |
| | 17.52 | % | | | 8.19 | % | | | 9.55 | % | | | 23.74 | % |
| | | | | | | | | | | | | | |
| $ | 38.7 | | | $ | 46.3 | | | $ | 41.8 | | | $ | 55.1 | |
| | | | | | | | | | | | | | |
| | 1.65 | % | | | 1.66 | % | | | 1.65 | % | | | 1.65 | % |
| | 1.74 | % | | | 2.09 | % | | | 2.03 | % | | | 2.09 | % |
| | 0.57 | % | | | 0.67 | % | | | 0.21 | % | | | 0.32 | % |
| | 36 | % | | | 66 | % | | | 54 | % | | | 60 | % |
See Notes to Financial Statements.
| | |
| Jennison Equity Income Fund | | 43 |
Financial Highlights
continued
| | | | |
| | | Class M(c) | |
| | | Year Ended
October 31, 2007(b) | |
Per Share Operating Performance: | | | | |
Net Asset Value, Beginning of Year | | $ | 15.89 | |
| | | | |
Income from investment operations: | | | | |
Net investment income (loss) | | | 0.52 | |
Net realized and unrealized gain on investments | | | 2.90 | |
| | | | |
Total from investment operations | | | 3.42 | |
| | | | |
Less Dividends and Distributions: | | | | |
Dividends from net investment income | | | (0.46 | ) |
| | | | |
Total dividends and distributions | | | (0.46 | ) |
| | | | |
Net asset value, end of year | | $ | 18.85 | |
| | | | |
Total Investment Return(a) | | | 21.76 | % |
Ratios/Supplemental Data: | | | | |
Net assets, end of year (in millions) | | $ | 80.9 | |
Ratios to average net assets: | | | | |
Expenses after advisory fee waiver and expense reimbursement | | | 2.15 | % |
Expenses before advisory fee waiver and expense reimbursement | | | 2.26 | % |
Net investment income (loss) | | | 2.79 | % |
Portfolio turnover rate | | | 143 | % |
| (a) | Total return does not consider the effects of sales load. Total return is calculated assuming a purchase of a share on the first day and a sale on the last day of each year reported and includes reinvestment of dividends and distributions. Total returns may reflect adjustments to conform to generally accepted accounting principles. Total return includes the effect of expense subsidies. |
| (b) | Calculations are based on the average daily number of shares outstanding. |
| (c) | Prior to April 12, 2004, Class M shares were known as Class B shares. On April 12, 2004, Class B shares were redesignated as Class M shares and a new Class B was opened. |
See Notes to Financial Statements.
| | |
| 44 | | Visit our website at www.jennisondryden.com |
| | | | | | | | | | | | | | |
| Class M(c) | |
| Year Ended October 31, | |
| 2006(b) | | | 2005 | | | 2004(b) | | | 2003(b) | |
| | | | | | | | | | | | | | |
| $ | 13.60 | | | $ | 12.63 | | | $ | 11.58 | | | $ | 9.41 | |
| | | | | | | | | | | | | | | |
| | | | | | | | | | | | | | |
| | 0.01 | | | | 0.01 | | | | (0.03 | ) | | | (0.02 | ) |
| | 2.28 | | | | 0.97 | | | | 1.08 | | | | 2.19 | |
| | | | | | | | | | | | | | | |
| | 2.29 | | | | 0.98 | | | | 1.05 | | | | 2.17 | |
| | | | | | | | | | | | | | | |
| | | | | | | | | | | | | | |
| | — | | | | (0.01 | ) | | | — | | | | — | |
| | | | | | | | | | | | | | | |
| | — | | | | (0.01 | ) | | | — | | | | — | |
| | | | | | | | | | | | | | | |
| $ | 15.89 | | | $ | 13.60 | | | $ | 12.63 | | | $ | 11.58 | |
| | | | | | | | | | | | | | | |
| | 16.84 | % | | | 7.77 | % | | | 9.07 | % | | | 23.06 | % |
| | | | | | | | | | | | | | |
| $ | 117.6 | | | $ | 143.4 | | | $ | 110.2 | | | $ | 116.2 | |
| | | | | | | | | | | | | | |
| | 2.15 | % | | | 2.16 | % | | | 2.15 | % | | | 2.15 | % |
| | 2.24 | % | | | 2.59 | % | | | 2.53 | % | | | 2.59 | % |
| | 0.07 | % | | | 0.13 | % | | | (0.28 | )% | | | (0.17 | )% |
| | 36 | % | | | 66 | % | | | 54 | % | | | 60 | % |
See Notes to Financial Statements.
| | |
| Jennison Equity Income Fund | | 45 |
Financial Highlights
continued
| | | | |
| | | Class X | |
| | | Year Ended
October 31, 2007(b) | |
Per Share Operating Performance: | | | | |
Net Asset Value, Beginning of Year | | $ | 15.86 | |
| | | | |
Income From Investment Operations: | | | | |
Net investment income (loss) | | | 0.52 | |
Net realized and unrealized gain on investments | | | 2.89 | |
| | | | |
Total from investment operations | | | 3.41 | |
| | | | |
Less Dividends and Distributions: | | | | |
Dividends from net investment income | | | (0.46 | ) |
| | | | |
Total dividends and distributions | | | (0.46 | ) |
| | | | |
Net asset value, end of year | | $ | 18.81 | |
| | | | |
Total Investment Return(a) | | | 21.74 | % |
Ratios/Supplemental Data: | | | | |
Net assets, end of year (in millions) | | $ | 27.8 | |
Ratios to average net assets: | | | | |
Expenses after advisory fee waiver and expense reimbursement | | | 2.15 | % |
Expenses before advisory fee waiver and expense reimbursement | | | 2.26 | % |
Net investment income (loss) | | | 2.87 | % |
Portfolio turnover rate | | | 143 | % |
| (a) | Total return does not consider the effects of sales load. Total return is calculated assuming a purchase of a share on the first day and a sale on the last day of each year reported and includes reinvestment of dividends and distributions. Total returns may reflect adjustments to conform to generally accepted accounting principles. Total return includes the effect of expense subsidies. |
| (b) | Calculations are based on the average daily number of shares outstanding. |
| (c) | Total return for Class X shares does not reflect the payment of bonus shares. |
See Notes to Financial Statements.
| | |
| 46 | | Visit our website at www.jennisondryden.com |
| | | | | | | | | | | | | | |
| Class X | |
| Year Ended October 31, | |
| 2006(b) | | | 2005 | | | 2004(b) | | | 2003(b) | |
| | | | | | | | | | | | | | |
| $ | 13.57 | | | $ | 12.61 | | | $ | 11.56 | | | $ | 9.39 | |
| | | | | | | | | | | | | | | |
| | | | | | | | | | | | | | |
| | 0.01 | | | | 0.01 | | | | (0.03 | ) | | | (0.02 | ) |
| | 2.28 | | | | 0.96 | | | | 1.08 | | | | 2.19 | |
| | | | | | | | | | | | | | | |
| | 2.29 | | | | 0.97 | | | | 1.05 | | | | 2.17 | |
| | | | | | | | | | | | | | | |
| | | | | | | | | | | | | | |
| | — | | | | (0.01 | ) | | | — | | | | — | |
| | | | | | | | | | | | | | | |
| | — | | | | (0.01 | ) | | | — | | | | — | |
| | | | | | | | | | | | | | | |
| $ | 15.86 | | | $ | 13.57 | | | $ | 12.61 | | | $ | 11.56 | |
| | | | | | | | | | | | | | | |
| | 16.88 | % | | | 7.70 | % | | | 9.08 | %(c) | | | 23.11 | %(c) |
| | | | | | | | | | | | | | |
| $ | 29.3 | | | $ | 41.0 | | | $ | 28.5 | | | $ | 28.8 | |
| | | | | | | | | | | | | | |
| | 2.15 | % | | | 2.16 | % | | | 2.15 | % | | | 2.15 | % |
| | 2.24 | % | | | 2.59 | % | | | 2.53 | % | | | 2.59 | % |
| | 0.07 | % | | | 0.13 | % | | | (0.28 | )% | | | (0.17 | )% |
| | 36 | % | | | 66 | % | | | 54 | % | | | 60 | % |
See Notes to Financial Statements.
| | |
| Jennison Equity Income Fund | | 47 |
Report of Independent Registered Public Accounting Firm
The Board of Directors and Shareholders of
Jennison Equity Income Fund:
We have audited the accompanying statement of assets and liabilities of Jennison Equity Income Fund (hereafter referred to as the “Fund”), including the portfolio of investments, as of October 31, 2007, and the related statement of operations for the year then ended, the statement of changes in net assets for each of the years in the two-year period then ended and the financial highlights for each of the years in the four-year period then ended. These financial statements and financial highlights are the responsibility of the Fund’s management. Our responsibility is to express an opinion on these financial statements and financial highlights based on our audits. The financial highlights for the year ended October 31, 2003 were audited by another independent registered public accounting firm, whose report dated December 22, 2003, expressed an unqualified opinion thereon.
We conducted our audits in accordance with the standards of the Public Company Accounting Oversight Board (United States). Those standards require that we plan and perform the audit to obtain reasonable assurance about whether the financial statements and financial highlights are free of material misstatement. An audit includes examining, on a test basis, evidence supporting the amounts and disclosures in the financial statements. Our procedures included confirmation of securities owned as of October 31, 2007, by correspondence with the custodian and brokers or by other appropriate auditing procedures where replies from brokers were not received. An audit also includes assessing the accounting principles used and significant estimates made by management, as well as evaluating the overall financial statement presentation. We believe that our audits provide a reasonable basis for our opinion.
In our opinion, the financial statements and financial highlights referred to above present fairly, in all material respects, the financial position of the Fund as of October 31, 2007, and the results of its operations for the year then ended, the changes in its net assets for each of the years in the two-year period then ended and the financial highlights for each of the years in the four-year period then ended, in conformity with U.S. generally accepted accounting principles.

New York, New York
December 28, 2007
| | |
| 48 | | Visit our website at www.jennisondryden.com |
Tax Information
(Unaudited)
We are required by the Internal Revenue Code to advise you within 60 days of the Fund’s fiscal year end (October 31, 2007), as to the federal income tax status of dividends and distributions paid by the Fund during such fiscal year. For the fiscal year ended October 31, 2007, the Fund paid $0.6558 for Class A shares, $0.4638 for Class B shares, $0.4638 for Class C shares, $0.5868 for Class L shares, $0.4638 for Class M shares and $0.4638 for Class X shares, respectively.
Further, we wish to advise you that 69.20% of ordinary income dividends paid in the fiscal year ended October 31, 2007 qualified for the corporate dividend received deduction available to corporate taxpayers.
The Fund designates 100% of ordinary income dividends as qualified for the reduced tax rate under the Jobs and Growth Tax Relief Reconciliation Act of 2003.
The Fund intends to designate 2.70% of ordinary income dividends as qualified short-term capital gains (QSTCG) under the American Jobs Creation Act of 2004.
In January 2008, you will be advised on IRS Form 1099DIV or substitute 1099DIV as to federal tax status of dividends and distributions received by you in calendar year 2007.
| | |
| Jennison Equity Income Fund | | 49 |
Management of the Fund
(Unaudited)
Information pertaining to the Directors of Jennison Equity Income Fund (the “Fund”) is set forth below. Directors who are not deemed to be “interested persons” of the Fund, as defined in the Investment Company Act of 1940 (the 1940 Act), are referred to as “Independent Directors.” Directors who are deemed to be “interested persons” of the Fund are referred to as “Interested Directors.” “Fund Complex” consists of the Fund and any other investment companies managed by PI.
Independent Directors(2)
Linda W. Bynoe (55), Director since 2005(3) Oversees 59 portfolios in Fund complex
Principal occupations (last 5 years): President and Chief Executive Officer (since March 1995) of Telemat, Ltd. (management consulting); formerly Vice President at Morgan Stanley & Co.
Other Directorships held: Director of Simon Property Group, Inc. (real estate investment trust) (since May 2003); Anixter International (communication products distributor) (since January 2006); Director of Northern Trust Corporation (since April 2006).
David E.A. Carson (73), Director since 2003(3) Oversees 63 portfolios in Fund complex
Principal occupations (last 5 years): Director (since October 2007) of ICI Mutual Insurance Company; formerly Chairman and Chief Executive Officer of People’s Bank (1988-2000).
Robert E. La Blanc (73), Director since 2003(3) Oversees 61 portfolios in Fund complex
Principal occupations (last 5 years): President (since 1981) of Robert E. La Blanc Associates, Inc. (telecommunications).
Other Directorships held:(4) Director of CA, Inc. (since 2002) (software company); FiberNet Telecom Group, Inc. (since 2003) (telecom company).
Douglas H. McCorkindale (68), Director since 2003(3) Oversees 59 portfolios in Fund complex
Principal occupations (last 5 years): Formerly Chairman (February 2001-June 2006), Chief Executive Officer (June 2000-July 2005), President (September 1997-July 2005) and Vice Chairman (March 1984-May 2000) of Gannett Co. Inc. (publishing and media).
Other Directorships held:(4) Director of Continental Airlines, Inc. (since May 1993); Director of Lockheed Martin Corp. (aerospace and defense) (since May 2001).
Richard A. Redeker (64), Director since 2003(3) Oversees 60 portfolios in Fund complex
Principal occupations (last 5 years): Management Consultant; Director (since 2001); Director of Penn Tank Lines, Inc. (since 1999).
Robin B. Smith (68), Director since 2003(3) Oversees 61 portfolios in Fund complex
Principal occupations (last 5 years): Chairman of the Board (since January 2003) of Publishers Clearing House (direct marketing); formerly Chairman and Chief Executive Officer (August 1996-January 2003) of Publishers Clearing House.
Other Directorships held:(4) Formerly Director of BellSouth Corporation (1992-2006).
| | |
| 50 | | Visit our website at www.jennisondryden.com |
Stephen G. Stoneburn (64), Director since 2003(3) Oversees 61 portfolios in Fund complex
Principal occupations (last 5 years): President and Chief Executive Officer (since June 1996) of Quadrant Media Corp. (publishing company); formerly President (June 1995-June 1996) of Argus Integrated Media, Inc.; Senior Vice President and Managing Director (January 1993-1995) of Cowles Business Media; Senior Vice President of Fairchild Publications, Inc. (1975-1989).
Clay T. Whitehead (69), Director since 2003(3) Oversees 61 portfolios in Fund complex
Principal occupations (last 5 years): President (since 1983) of YCO (new business development firm).
Interested Directors(1)
Judy A. Rice (59), President since 2003 and Director since 2003(3) Oversees 59 portfolios in Fund complex
Principal occupations (last 5 years): President, Chief Executive Officer, Chief Operating Officer and Officer-In-Charge (since February 2003) of Prudential Investments LLC; Vice President (since February 1999) of Prudential Investment Management Services LLC; President, Chief Executive Officer and Officer-In-Charge (since April 2003) of Prudential Mutual Fund Services LLC; formerly Director (May 2003-March 2006) and Executive Vice President (June 2005-March 2006) of AST Investment Services, Inc.; formerly Executive Vice President (September 1999-February 2003) of Prudential Investments LLC; Member of Board of Governors of the Investment Company Institute.
Robert F. Gunia (61), Vice President and Director since 2003(3) Oversees 145 portfolios in Fund complex
Principal occupations (last 5 years): Chief Administrative Officer (since September 1999) and Executive Vice President (since December 1996) of Prudential Investments LLC; President (since April 1999) of Prudential Investment Management Services LLC; Executive Vice President (since March 1999) and Treasurer (since May 2000) of Prudential Mutual Fund Services LLC; Chief Administrative Officer, Executive Vice President and Director (since May 2003) of AST Investment Services, Inc.
Other Directorships held:(4) Vice President and Director (since May 1989) and Treasurer (since 1999) of The Asia Pacific Fund, Inc.
Information pertaining to the Officers of the Funds who are not also Directors is set forth below.
Officers(2)
Kathryn L. Quirk (55), Chief Legal Officer since 2005(3)
Principal occupations (last 5 years): Vice President and Corporate Counsel (since September 2004) of Prudential; Executive Vice President, Chief Legal Officer and Secretary (since July 2005) of Prudential Investments LLC and Prudential Mutual Fund Services LLC; formerly Managing Director, General Counsel, Chief Compliance Officer, Chief Risk Officer and Corporate Secretary (1997-2002) of Zurich Scudder Investments, Inc.
Deborah A. Docs (49), Secretary since 2003(3)
Principal occupations (last 5 years): Vice President and Corporate Counsel (since January 2001) of Prudential; Vice President (since December 1996) and Assistant Secretary (since March 1999) of PI; formerly Vice President and Assistant Secretary (May 2003-June 2005) of AST Investment Services, Inc.
Jonathan D. Shain (49), Assistant Secretary since 2003(3)
Principal occupations (last 5 years): Vice President and Corporate Counsel (since August 1998) of Prudential; Vice President and Assistant Secretary (since May 2001) of PI; Vice President and Assistant Secretary (since February 2001) of PMFS; formerly Vice President and Assistant Secretary (May 2003-June 2005) of AST Investment Services, Inc.
| | |
| Jennison Equity Income Fund | | 51 |
Claudia DiGiacomo (33), Assistant Secretary since 2005(3)
Principal occupations (last 5 years): Vice President and Corporate Counsel (since January 2005) of Prudential; Vice President and Assistant Secretary of PI (since December 2005); Associate at Sidley Austin Brown & Wood LLP (1999-2004).
Timothy J. Knierim (48), Chief Compliance Officer since 2007(3)
Principal occupations (last 5 years): Chief Compliance Officer of Prudential Investment Management, Inc. (since July 2007); formerly Chief Risk Officer of PIM and PI (2002-2007) and formerly Chief Ethics Officer of PIM and PI (2006-2007).
Valerie M. Simpson (49), Deputy Chief Compliance Officer since 2007(3)
Principal occupations (last 5 years): Vice President and Senior Compliance Officer (since March 2006) of PI; Vice President-Financial Reporting (since March 2006) for Prudential Life and Annuities Finance.
Grace C. Torres (48), Treasurer and Principal Financial and Accounting Officer since 2003(3)
Principal occupations (last 5 years): Assistant Treasurer (since March 1999) and Senior Vice President (since September 1999) of PI; Assistant Treasurer (since May 2003) and Vice President (since June 2005) of AST Investment Services, Inc.; Senior Vice President and Assistant Treasurer (since May 2003) of Prudential Annuities Advisory Services, Inc.; formerly Senior Vice President (May 2003-June 2005) of AST Investment Services, Inc.
John P. Schwartz (36), Assistant Secretary since 2006(3)
Principal occupations (last 5 years): Vice President and Corporate Counsel (since April 2005) of Prudential; Vice President and Assistant Secretary of PI (since December 2005); Associate at Sidley, Austin Brown & Wood LLP (1997-2005).
M. Sadiq Peshimam (43), Assistant Treasurer since 2006(3)
Principal occupations (last 5 years): Vice President (since 2005) and Director (2000-2005) within Prudential Mutual Fund Administration.
Peter Parrella (49), Assistant Treasurer since 2007(3)
Principal occupations (last 5 years): Vice President (since 2007) and Director (2004-2007) within Prudential Mutual Fund Administration; formerly Tax Manager at SSB Citi Fund Management LLC (1997-2004).
Andrew R. French (45), Assistant Secretary since 2006(3)
Principal occupations (last 5 years): Director and Corporate Counsel (since May 2006) of Prudential; Vice President and Assistant Secretary (since January 2007) of PI; Vice President and Assistant Secretary (since January 2007) of PMFS; formerly Senior Legal Analyst of Prudential Mutual Fund Law Department (1997-2006).
Noreen M. Fierro (43), Anti-Money Laundering Compliance Officer since 2006(3)
Principal occupations (last 5 years): Vice President, Corporate Compliance (since May 2006) of Prudential; formerly Corporate Vice President, Associate General Counsel (April 2002-May 2005) of UBS Financial Services, Inc., in their Money Laundering Prevention Group; Senior Manager (May 2005-May 2006) of Deloitte Financial Advisory Services, LLP, in their Forensic and Dispute Services, Anti-Money Laundering Group.
| | |
| 52 | | Visit our website at www.jennisondryden.com |
† | The Fund Complex consists of all investment companies managed by PI. The Funds for which PI serves as manager include Jennison Dryden Mutual Funds, Strategic Partners Funds, The Prudential Variable Contract Accounts 2, 10, 11. The Target Portfolio Trust, The Prudential Series Fund, The High Yield Income Fund, Inc., The High Yield Plus Fund, Inc., Nicholas-Applegate Fund, Inc., Advanced Series Trust, and Prudential’s Gibraltar Fund, Inc. |
(1) | “Interested” Director, as defined in the 1940 Act, by reason of employment with the Manager, a Subadvisor or the Distributor. |
(2) | Unless otherwise noted, the address of the Directors and Officers is c/o: Prudential Investments LLC, Gateway Center Three, 100 Mulberry Street, Newark, NJ 07102. |
(3) | There is no set term of office for Directors and Officers. The Independent Directors have adopted a retirement policy, which calls for the retirement of Directors on December 31 of the year in which they reach the age of 75. The table shows the individual’s length of service as Director and/or Officer. |
(4) | This includes only directorships of companies required to register, or file reports with the SEC under the Securities and Exchange Act of 1934 (that is, “public companies”) or other investment companies registered under the 1940 Act. |
Additional Information about the Directors is included in the Statement of Additional Information which is available without charge, upon request, by calling (800) 521-7466 or (732) 482-7555 (Calling from outside the U.S.)
| | |
| Jennison Equity Income Fund | | 53 |
Approval of Advisory Agreements
The Board of Directors (the “Board”) of Strategic Partners Mutual Funds, Inc. oversees the management of the Jennison Equity Income Fund (the “Fund”) and, as required by law, determines annually whether to renew the Fund’s management agreement with Prudential Investments LLC (“PI”) and the Fund’s subadvisory agreement with Jennison Associates LLC (“Jennison”). In considering the renewal of the agreements, the Board, including all of the Independent Directors, met on June 6-7, 2007 and approved the renewal of the agreements through July 31, 2008, after concluding that renewal of the agreements was in the best interests of the Fund and its shareholders.
In advance of the meetings, the Board received materials relating to the agreements, and had the opportunity to ask questions and request further information in connection with their consideration. Among other things, the Board considered comparisons with other mutual funds in relevant Peer Universes and Peer Groups. The mutual funds included in each Peer Universe or Peer Group were objectively determined solely by Lipper Inc., an independent provider of mutual fund data. The comparisons placed the Fund in various quartiles over the one-, three-, and five-year periods ending December 31, 2006, with the first quartile being the best 25% of the mutual funds (for performance, the best performing mutual funds and, for expenses, the lowest cost mutual funds).
In approving the agreements, the Board, including the Independent Directors advised by independent legal counsel, considered the factors they deemed relevant, including the nature, quality and extent of services provided, the performance of the Fund, the profitability of PI and its affiliates, expenses and fees, and the potential for economies of scale that may be shared with the Fund and its shareholders. In their deliberations, the Directors did not identify any single factor which alone was responsible for the Board’s decision to approve the agreements with respect to the Fund. In connection with their deliberations, the Board considered information provided by PI throughout the year at regular Board meetings, presentations from portfolio managers and other information, as well as information furnished at or in advance of the meetings on June 6-7, 2007.
The Directors determined that the overall arrangements between the Fund and PI, which serves as the Fund’s investment manager pursuant to a management agreement, and between PI and Jennison, which serves as the Fund’s subadviser pursuant to the terms of a subadvisory agreement with PI, are fair and reasonable in light of the services performed, fees charged and such other matters as the Directors considered relevant in the exercise of their business judgment.
| | |
| Jennison Equity Income Fund | | |
Approval of Advisory Agreements (continued)
The material factors and conclusions that formed the basis for the Directors’ reaching their determinations to approve the continuance of the agreements are separately discussed below.
Nature, quality and extent of services
The Board received and considered information regarding the nature and extent of services provided to the Fund by PI and Jennison. The Board considered the services provided by PI, including but not limited to the oversight of the subadviser for the Fund, as well as the provision of fund recordkeeping, compliance, and other services to the Fund. With respect to PI’s oversight of the subadviser, the Board noted that PI’s Strategic Investment Research Group (“SIRG”), which is a business unit of PI, is responsible for monitoring and reporting to PI’s senior management on the performance and operations of the subadviser. The Board also considered that PI pays the salaries of all of the officers and non-independent Directors of the Fund. The Board also considered the investment subadvisory services provided by Jennison, as well as adherence to the Fund’s investment restrictions and compliance with applicable Fund policies and procedures. The Board considered PI’s evaluation of the subadviser, as well as PI’s recommendation, based on its review of the subadviser, to renew the subadvisory agreement.
The Board reviewed the qualifications, backgrounds and responsibilities of PI’s senior management responsible for the oversight of the Fund and Jennison, and also reviewed the qualifications, backgrounds and responsibilities of the Jennison portfolio managers who are responsible for the day-to-day management of the Fund’s portfolio. The Board was provided with information pertaining to PI’s and Jennison’s organizational structure, senior management, investment operations, and other relevant information pertaining to PI and Jennison. The Board also noted that it received favorable compliance reports from the Fund’s Chief Compliance Officer (“CCO”) as to each of PI and Jennison. The Board noted that Jennison is affiliated with PI.
The Board concluded that it was satisfied with the nature, extent and quality of the investment management services provided by PI and the subadvisory services provided to the Fund by Jennison, and that there was a reasonable basis on which to conclude that the Fund benefits from the services provided by PI and Jennison under the management and subadvisory agreements.
| | |
| | Visit our website at www.jennisondryden.com |
Performance of Jennison Equity Income Fund
The Board received and considered information about the Fund’s historical performance. The Board considered that the Fund’s gross performance in relation to its Peer Universe (the Lipper Retail and Institutional Equity Income Funds Performance Universe)1 was in the second, third, and fourth quartiles over the one-, three- and five-year periods, respectively. The Board further considered that the Fund’s net performance (which reflects any subsidies, expense caps or waivers) was in the third quartile over the one-year period, and was in the fourth quartile over the three- and five-year periods. The Board also noted that the Fund outperformed its benchmark index for the one- and three-year periods, though it underperformed its benchmark index during the five-year period. In reviewing the Fund’s performance, the Board considered that Jennison, the Fund’s current subadviser, had assumed responsibility for managing the Fund in January 2007, and therefore the Fund’s performance for longer periods was not attributable to Jennison. The Board concluded that, in light of the recent change in subadvisers, it would be in the interest of the Fund and its shareholders for the Fund to renew the agreements.
Fees and Expenses
The Board considered that the Fund’s contractual and actual management fee (which reflects any subsidies, waivers or expense caps) ranked in the Expense Group’s fourth quartile. The Board also considered that the Fund’s total expenses ranked in the Expense Group’s third quartile. The Board considered the assertion of PI that the third quartile ranking for total expenses reflected the Fund’s relatively high transfer agency and custody fees. The Board accepted PI’s recommendation to continue the existing contractual cap on Fund expenses of 1.15% (exclusive of 12b-1 fees and certain other fees). The Board concluded that the management and subadvisory fees are reasonable in light of the services provided.
Costs of Services and Profits Realized by PI
The Board was provided with information on the profitability of PI and its affiliates in serving as the Fund’s investment manager. The Board discussed with PI the methodology utilized in assembling the information regarding profitability and considered its reasonableness. The Board recognized that it is difficult to make comparisons of profitability from fund management contracts because comparative information is not generally publicly available and is affected by numerous factors, including the structure of the particular adviser, the types of funds it manages, its
1 Although Lipper classifies the Fund in its Large-Cap Core Funds Performance Universe, the Equity Income Funds Performance Universe was utilized because PI believes that the funds included in this Universe provide a more appropriate basis for Fund performance comparisons.
| | |
| Jennison Equity Income Fund | | |
Approval of Advisory Agreements (continued)
business mix, numerous assumptions regarding allocations and the adviser’s capital structure and cost of capital. The Board did not separately consider the profitability of the subadviser, an affiliate of PI, as its profitability was reflected in the profitability report for PI. Taking these factors into account, the Board concluded that the profitability of PI and its affiliates in relation to the services rendered was not unreasonable.
Economies of Scale
The Board received and discussed information concerning whether PI realizes economies of scale as the Fund’s assets grow beyond current levels. The Board noted that the management fee schedule for the Fund includes breakpoints, which have the effect of decreasing the fee rate as assets increase, and that at its current level of assets the Fund’s effective fee rate reflected some of those rate reductions. The Board took note that the Fund’s fee structure currently results in benefits to Fund shareholders whether or not PI realizes any economies of scale.
Other Benefits to PI and Jennison
The Board considered potential ancillary benefits that might be received by PI and Jennison and their affiliates as a result of their relationship with the Fund. The Board concluded that potential benefits to be derived by PI included brokerage commissions received by affiliates of PI, transfer agency fees received by the Fund’s transfer agent (which is affiliated with PI), and benefits to the reputation as well as other intangible benefits resulting from PI’s association with the Fund. The Board concluded that the potential benefits to be derived by Jennison included its ability to use soft dollar credits, brokerage commissions received by affiliates of Jennison, as well as the potential benefits consistent with those generally resulting from an increase in assets under management, specifically, potential access to additional research resources and benefits to the reputation. The Board concluded that the benefits derived by PI and Jennison were consistent with the types of benefits generally derived by investment managers and subadvisers to mutual funds.
After full consideration of these factors, the Board concluded that the approval of the agreements was in the interest of the Fund and its shareholders.
| | |
| | Visit our website at www.jennisondryden.com |
Growth of a $10,000 Investment
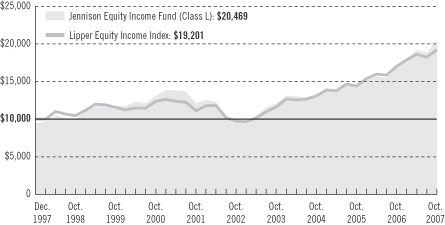
| | | | | | | | | |
| Average Annual Total Returns (With Sales Charges) as of 10/31/07 | |
| | | One Year | | | Five Years | | | Since Inception | |
Class A | | 15.97 | % | | N/A | | | 11.06 | % |
Class B | | 16.76 | | | N/A | | | 11.49 | |
Class C | | 20.80 | | | 15.51 | % | | 7.68 | |
Class L | | 15.39 | | | 14.74 | | | 7.56 | |
Class M | | 15.76 | | | 15.30 | | | 7.69 | |
Class X | | 15.74 | | | 15.19 | | | 7.67 | |
| | | | | | | | | |
| Average Annual Total Returns (Without Sales Charges) as of 10/31/07 | |
| | | One Year | | | Five Years | | | Since Inception | |
Class A | | 22.72 | % | | N/A | | | 12.85 | % |
Class B | | 21.76 | | | N/A | | | 11.91 | |
Class C | | 21.80 | | | 15.51 | % | | 7.68 | |
Class L | | 22.43 | | | 16.10 | | | 8.21 | |
Class M | | 21.76 | | | 15.53 | | | 7.69 | |
Class X | | 21.74 | | | 15.53 | | | 7.67 | |
Performance data quoted represent past performance. Past performance does not guarantee future results. The investment return and principal value of an investment will fluctuate so that an investor’s shares, when redeemed, may be worth more or less than their original cost. Current performance may be lower or higher than the past performance data quoted. An investor may obtain performance data as of the most recent month-end by visiting our website at www.jennisondryden.com or by calling (800) 225-1852. Class A and Class L shares have a maximum initial sales
| | |
| | Visit our website at www.jennisondryden.com |
charge of 5.50% and 5.75%, respectively. Class L shares are closed to most new purchases (with the exception of reinvested dividends and purchases by certain college savings plans). Gross operating expenses: Class A, 1.56%; Class B, 2.26%; Class C, 2.26%; Class L, 1.76%; Class M, 2.26%; Class X, 2.26%. Net Operating Expenses apply to: Class A, 1.40%; Class B, 2.15%; Class C, 2.15%; Class L, 1.65%; Class M, 2.15%; Class X, 2.15%, after contractual reduction through 2/28/2008.
Source: Prudential Investments LLC and Lipper Inc.
Inception dates: Class A and Class B, 4/12/04; Class C, Class L, Class M, and Class X, 12/31/97.
The graph compares a $10,000 investment in the Jennison Equity Income Fund (Class L shares) with a similar investment in the Standard & Poor’s 500 Composite Stock Price Index (S&P 500 Index) by portraying the initial account values at the commencement of operations for Class L shares (December 31, 1997) and the account values at the end of the current fiscal year (October 31, 2007) as measured on a quarterly basis. The data are measured from the closest month-end to inception date, and not from the Fund’s actual inception date. For purposes of the graph, and unless otherwise indicated, it has been assumed that (a) the maximum applicable front-end sales charge was deducted from the initial $10,000 investment in Class L shares; (b) all recurring fees (including management fees) were deducted; and (c) all dividends and distributions were reinvested. The line graph provides information for Class L shares only. As indicated in the tables above, performance for Class A, B, C, M, and X shares will vary due to the differing charges and expenses applicable to each share class (as indicated in the following paragraphs).
Funds in the Lipper Equity Income Category Average seek relatively high current income and growth of income through investing 60% or more of their portfolio in equities. The Index’s total returns include the reinvestment of all dividends, but do not include the effects of sales charges, operating expenses of a mutual fund, or taxes. The returns for the Index would be lower if they included the effects of sales charges, operating expenses, or taxes. The securities that comprise the Index may differ substantially from the securities in the Fund. This is not the only index that may be used to characterize performance of sector stock funds. Other indexes may portray different comparative performance. Investors cannot invest directly in an index.
Class A and Class L shares are subject to a maximum front-end sales charge of 5.50% and 5.75%, respectively. Class L shares are closed to most new purchases (with the exception of reinvested dividends and purchases by certain college savings plans). Under certain circumstances, Class A and Class L shares may be subject to a contingent deferred sales charge (CDSC) of 1%, in certain circumstances. Class B, Class C, Class M, and Class X shares are subject to a maximum CDSC of 5%, 1%, 6%, and 6%, respectively. Class A shares are subject to a 12b-1 fee of up to 0.30% annually. Class B, Class C, Class M, and Class X shares are subject to a 12b-1 fee of 1%. Class L shares are subject to a 12b-1 fee of 0.50%. The returns in the graph and the tables do not reflect the deduction of taxes that a shareholder would pay on Fund distributions or following the redemption of Fund shares.
| | |
| Jennison Equity Income Fund | | |
| | | | |
| n MAIL | | n TELEPHONE | | n WEBSITE |
Gateway Center Three 100 Mulberry Street Newark, NJ 07102 | | (800) 225-1852 | | www.jennisondryden.com |
|
| PROXY VOTING |
| The Board of Directors of the Fund has delegated to the Fund’s investment subadviser the responsibility for voting any proxies and maintaining proxy recordkeeping with respect to the Fund. A description of these proxy voting policies and procedures is available without charge, upon request, by calling (800) 225-1852 or by visiting the Securities and Exchange Commission’s website at www.sec.gov. Information regarding how the Fund voted proxies relating to portfolio securities during the most recent 12-month period ended June 30 is available on the Fund’s website and on the Commission’s website. |
|
| DIRECTORS |
Linda W. Bynoe • David E.A. Carson • Robert F. Gunia • Robert E. La Blanc •
Douglas H. McCorkindale • Richard A. Redeker • Judy A. Rice • Robin B. Smith •
Stephen G. Stoneburn • Clay T. Whitehead |
|
| OFFICERS |
| Judy A. Rice, President • Robert F. Gunia, Vice President • Grace C. Torres, Treasurer and Principal Financial and Accounting Officer • Kathryn L. Quirk, Chief Legal Officer • Deborah A. Docs, Secretary • Timothy J. Knierim, Chief Compliance Officer • Valerie M. Simpson, Deputy Chief Compliance Officer • Noreen M. Fierro, Anti-Money Laundering Compliance Officer • Jonathan D. Shain, Assistant Secretary • Claudia DiGiacomo, Assistant Secretary • John P. Schwartz, Assistant Secretary • Andrew R. French, Assistant Secretary • M. Sadiq Peshimam, Assistant Treasurer • Peter Parrella, Assistant Treasurer |
| | | | |
| MANAGER | | Prudential Investments LLC | | Gateway Center Three
100 Mulberry Street
Newark, NJ 07102 |
|
| INVESTMENT SUBADVISER | | Jennison Associates LLC | | 466 Lexington Avenue
New York, NY 10017 |
|
| DISTRIBUTORS | | Prudential Annuities
Distributors, Inc. | | One Corporate Drive
Shelton, CT 06484 |
|
| | Prudential Investment
Management
Services LLC | | Gateway Center Three
100 Mulberry Street
Newark, NJ 07102 |
|
| CUSTODIAN | | PFPC Trust Company | | 400 Bellevue Parkway
Wilmington, DE 19809 |
|
| TRANSFER AGENT | | Prudential Mutual Fund
Services LLC | | PO Box 9658
Providence, RI 02940 |
|
| INDEPENDENT REGISTERED PUBLIC ACCOUNTING FIRM | | KPMG LLP | | 345 Park Avenue
New York, NY 10154 |
|
| FUND COUNSEL | | Willkie Farr & Gallagher LLP | | 787 Seventh Avenue
New York, NY 10019 |
|
| An investor should consider the investment objectives, risks, charges, and expenses of the Fund carefully before investing. The prospectus for the Fund contains this and other information about the Fund. An investor may obtain a prospectus by visiting our website at www.jennisondryden.com or by calling (800) 225-1852. The prospectus should be read carefully before investing. |
|
| E-DELIVERY |
| To receive your mutual fund documents on-line, go to www.icsdelivery.com/prudential/funds and enroll. Instead of receiving printed documents by mail, you will receive notification via e-mail when new materials are available. You can cancel your enrollment or change your e-mail address at any time by clicking on the change/cancel enrollment option at the icsdelivery website address. |
|
| SHAREHOLDER COMMUNICATIONS WITH DIRECTORS |
| Shareholders can communicate directly with the Board of Directors by writing to the Chair of the Board, Jennison Equity Income Fund, Prudential Investments, Attn: Board of Directors, 100 Mulberry Street, Gateway Center Three, Newark, NJ 07102. Shareholders can communicate directly with an individual Director by writing to the same address. Communications are not screened before being delivered to the addressee. |
|
| AVAILABILITY OF PORTFOLIO SCHEDULE |
| The Fund files its complete schedule of portfolio holdings with the Securities and Exchange Commission for the first and third quarters of each fiscal year on Form N-Q. The Fund’s Forms N-Q are available on the Commission’s website at www.sec.gov. The Fund’s Forms N-Q may also be reviewed and copied at the Commission’s Public Reference Room in Washington, D.C. Information on the operation and location of the Public Reference Room may be obtained by calling (800) SEC-0330 (732-0330). The Fund’s schedule of portfolio holdings is also available on the Fund’s website as of the end of each fiscal quarter. |
|
| The Fund’s Statement of Additional Information contains additional information about the Fund’s Directors and is available without charge, upon request, by calling (800) 225-1852. |
Mutual Funds:
| | | | |
ARE NOT INSURED BY THE FDIC OR ANY
FEDERAL GOVERNMENT AGENCY | | MAY LOSE VALUE | | ARE NOT A DEPOSIT OF OR GUARANTEED BY ANY BANK OR ANY BANK AFFILIATE |

| | | | | | | | | | | | | | | | |
| Jennison Equity Income Fund | | | | | | | | | | |
| | Share Class | | A | | B | | C | | L* | | M** | | X*** | | |
| | NASDAQ | | SPQAX | | N/A | | AGOCX | | AGOAX | | AGOBX | | AXGOX | | |
| | CUSIP | | 86277C108 | | 86277C306 | | 86277C504 | | 86277C207 | | 86277C405 | | 86277C603 | | |
| | | | | | | | | | | | | | | | |
| *Closed | to most new purchases (with the exception of reinvested dividends and purchases by college savings plans) and available for limited exchanges only. |
| **Closed | to most new purchases (with the exception of reinvested dividends) and available for limited exchanges only. |
| | ***Available | for limited exchanges only. |
MF203E IFS-A141850 Ed. 12/2007


(Formerly known as Strategic Partners Money Market Fund)
| | |
| OCTOBER 31, 2007 | | ANNUAL REPORT |
Dryden Money Market Fund
FUND TYPE
Money market
OBJECTIVE
Maximum current income consistent with stability of capital and the maintenance of liquidity
This report is not authorized for distribution to prospective investors unless preceded or accompanied by a current prospectus.
The views expressed in this report and information about the Fund’s portfolio holdings are for the period covered by this report and are subject to change thereafter.
JennisonDryden, Dryden, Prudential Financial and the Rock Prudential logo are registered service marks of The Prudential Insurance Company of America, Newark, NJ, and its affiliates.

December 14, 2007
Dear Shareholder:
We hope you find the annual report for the Dryden Money Market Fund informative and useful. As a JennisonDryden mutual fund shareholder, you may be thinking about where you can find additional growth opportunities. You could invest in last year’s top-performing asset class and hope history repeats itself or you could stay in cash while waiting for the “right moment” to invest.
Instead, we believe it is better to take advantage of developing domestic and global investment opportunities through a diversified portfolio of stock and bond mutual funds. A diversified asset allocation offers two potential advantages. It helps you manage downside risk by not being overly exposed to any particular asset class, plus it gives you a better opportunity to have at least some of your assets in the right place at the right time. Your financial professional can help you create a diversified investment plan that may include mutual funds covering all the basic asset classes and that reflects your personal investor profile and tolerance for risk.
JennisonDryden Mutual Funds gives you a wide range of choices that can help you make progress toward your financial goals. Our funds offer the experience, resources, and professional discipline of four leading asset managers. They are recognized and respected in the institutional market and by discerning investors for excellence in their respective strategies. JennisonDryden equity funds are advised by Jennison Associates LLC, Quantitative Management Associates LLC (QMA), or Prudential Real Estate Investors (PREI). Prudential Investment Management, Inc. (PIM) advises the JennisonDryden fixed income and money market funds. Jennison Associates, QMA, and PIM are registered investment advisers and Prudential Financial companies. PREI is a registered investment adviser and a unit of PIM.
Thank you for choosing JennisonDryden Mutual Funds.
Sincerely,

Judy A. Rice, President
Dryden Money Market Fund
| | |
| Dryden Money Market Fund | | 1 |
Your Fund’s Performance
Fund objectives
The investment objectives of the Dryden Money Market Fund are to seek high current income and maintain high levels of liquidity. There can be no assurance that the Fund will achieve its investment objectives.
Yields will fluctuate from time to time, and past performance does not guarantee future results. Current performance may be lower or higher than the performance data quoted. An investment in the Fund is not insured or guaranteed by the Federal Deposit Insurance Corporation or any other government agency. Although the Fund seeks to preserve the value of your investment at $1 per share, it is possible to lose money by investing in the Fund. Gross operating expenses: Class A, 1.15%; Class C, 2.03%; Class D, 1.53%; Class L, 1.53%; Class M, 2.03%; Class X, 2.03%. Net operating expenses apply to: Class A, 1.05%; Class C, 1.93%; Class D, 1.43%; Class L, 1.43%; Class M, 1.93%; Class X, 1.93%, after contractual reduction through 2/28/2008.
| | | | | | | | | | | | | | |
Fund Facts* as of 10/31/07 |
| | | One-Year Total Return | | | 7-Day
Current Yield | | | Net Asset
Value (NAV) | | Weighted Avg.
Maturity (WAM) | | Net Assets
(Millions) |
Class A | | 4.47 | % | | 4.71 | % | | $ | 1.00 | | 50 Days | | $ | 6 |
Class C | | 3.56 | % | | 3.84 | % | | $ | 1.00 | | 50 Days | | $ | 7 |
Class D | | 4.08 | % | | 4.34 | % | | $ | 1.00 | | 50 Days | | $ | 7 |
Class L | | 4.08 | % | | 4.34 | % | | $ | 1.00 | | 50 Days | | $ | 9 |
Class M | | 3.57 | % | | 3.84 | % | | $ | 1.00 | | 50 Days | | $ | 25 |
Class X | | 3.56 | % | | 3.84 | % | | $ | 1.00 | | 50 Days | | $ | 7 |
Lipper Money Market Instrument Funds Avg.1 | | 4.55 | % | | N/A | | | | N/A | | N/A | | | N/A |
Source: Prudential Investments LLC and Lipper Inc. The one-year total return in the table does not reflect the deduction of taxes that a shareholder would pay on Fund distributions or following the redemption of Fund shares.
| * | Class D and Class L shares are subject to a distribution and service (12b-1) fee of 0.50%. Class C, Class M, and Class X shares are subject to a 12b-1 fee of 1%. Class A shares are subject to a 12b-1 fee of 0.125%. |
1Funds | in the Lipper Money Market Instrument Funds Average invest in high-quality financial instruments rated in the top two grades with dollar-weighted average maturities of less than 90 days. These funds typically intend to keep a constant net asset value. |
| | |
| 2 | | Visit our website at www.jennisondryden.com |
Strategy and Performance Overview
How did the Fund perform?
The Dryden Money Market Fund Class L shares returned 4.08% for the 12 months ended October 31, 2007, compared to a 4.55% return for the Lipper Money Market Instrument Funds Average.
What were conditions like in the credit markets?
When the reporting period began on November 1, 2006, the target for the federal funds rate on overnight loans between banks stood at 5.25%. The Federal Reserve (the Fed) had decided to hold monetary policy steady after gradually increasing short-term rates to remove excess monetary stimulus from the economy. Meanwhile, signs of weakness in the housing sector began to emerge and lent credence to the view that the Fed might have to cut short-term rates in 2007 to strengthen the economy.
Economic growth slowed considerably during the first three months of 2007. Additionally, key economic data pointed to a steady decline in the housing sector. In the spring, however, increases in government spending and exports helped the economy pick up steam, and expectations for lower short-term rates faded.
The outlook for continued steady monetary policy proved short lived, as concerns about the credit quality of securities backed by subprime mortgages (home loans made to borrowers with poor credit histories) spilled into the broader financial markets. Increasing concern about the creditworthiness of these mortgage-backed debt securities and the financial institutions that invested in them severely hindered liquidity in the fixed income markets.
The short-term debt market was not immune to this stress. As investors in fixed income securities shunned risk, hoarded liquidity, and sought safe haven in U.S. Treasury securities, certain financial institutions that relied heavily on collateralized borrowing had difficulty raising funds, even though they offered investors sharply higher yields.
In order to ease the credit crunch, the Fed, along with certain other central banks, aggressively added reserves to their financial systems. In mid-August, the Fed lowered the discount rate to 5.75% from 6.25%, making it less expensive for banks to borrow directly from the central bank. Despite these actions, the fragile nature of the fixed income market continued to pose a risk to economic growth. As a result, the Fed acted decisively in mid-September by reducing its target for the federal funds rate on overnight loans between banks to 4.75% from 5.25% and the discount rate to 5.25% from 5.75%. Debt markets subsequently stabilized, but aftershocks and varying levels of financial stress remain as institutions continue to publicly disclose their losses. In
| | |
| Dryden Money Market Fund | | 3 |
Strategy and Performance Overview (continued)
late October, short-term rates were cut another quarter point, which left the target for the federal funds rate at 4.50% and the discount rate at 5.00%.
How did the Fund invest during the reporting period?
We maintained a diversified portfolio that included certificates of deposit, medium term notes, repurchase agreements, commercial paper, and other high quality money market securities. The creditworthiness of companies the Fund invests in is independently determined by our research analysts and meets our high standards for credit quality. For most of the reporting period, the Fund’s average maturity was roughly in line with that of the average comparable portfolio. However, in the summer of 2007, the Fund’s average maturity was positioned shorter than its competitive average to enhance its ability to respond to rapidly changing market conditions.
| | |
| 4 | | Visit our website at www.jennisondryden.com |
Fees and Expenses (Unaudited)
As a shareholder of the Fund, you incur two types of costs: (1) transaction costs, including sales charges (loads) on purchase payments and redemptions, as applicable, and (2) ongoing costs, including management fees, distribution and/or service (12b-1) fees, and other Fund expenses, as applicable. This example is intended to help you understand your ongoing costs (in dollars) of investing in the Funds and to compare these costs with the ongoing costs of investing in other mutual funds.
The example is based on an investment of $1,000 invested on May 1, 2007, at the beginning of the period, and held through the six-month period ended October 31, 2007. The example is for illustrative purposes only; you should consult the Prospectus for information on initial and subsequent minimum investment requirements.
The Fund’s transfer agent may charge additional fees to holders of certain accounts that are not included in the expenses shown in the table on the following page. These fees apply to Individual Retirement Accounts (IRAs) and Section 403(b) accounts. As of the close of the six-month period covered by the table, IRA fees included an annual maintenance fee of $15 per account (subject to a maximum annual maintenance fee of $25 for all accounts held by the same shareholder). Section 403(b) accounts are charged an annual $25 fiduciary maintenance fee. Some of the fees may vary in amount, or may be waived, based on your total account balance or the number of JennisonDryden Funds, including the Fund, that you own. You should consider the additional fees that were charged to your Fund account over the six-month period when you estimate the total ongoing expenses paid over the period and the impact of these fees on your ending account value, as these additional expenses are not reflected in the information provided in the expense table. Additional fees have the effect of reducing investment returns.
Actual Expenses
The first line for each share class in the table on the following page provides information about actual account values and actual expenses. You may use the information on this line, together with the amount you invested, to estimate the expenses that you paid over the period. Simply divide your account value by $1,000 (for example, an $8,600 account value ÷ $1,000 = 8.6), then multiply the result by the number on the first line under the heading “Expenses Paid During the Six-Month Period” to estimate the expenses you paid on your account during this period.
Hypothetical Example for Comparison Purposes
The second line for each share class in the table on the following page provides information about hypothetical account values and hypothetical expenses based on
| | |
| Dryden Money Market Fund | | 5 |
Fees and Expenses (continued)
the Fund’s actual expense ratio and an assumed rate of return of 5% per year before expenses, which is not the Fund’s actual return. The hypothetical account values and expenses may not be used to estimate the actual ending account balance or expenses you paid for the period. You may use this information to compare the ongoing costs of investing in the Fund and other funds. To do so, compare this 5% hypothetical example with the 5% hypothetical examples that appear in the shareholder reports of the other funds.
Please note that the expenses shown in the table are meant to highlight your ongoing costs only, and do not reflect any transactional costs such as sales charges (loads). Therefore the second line for each share class in the table is useful in comparing ongoing costs only, and will not help you determine the relative total costs of owning different funds. In addition, if these transactional costs were included, your costs would have been higher.
| | | | | | | | | | | | | | |
Dryden Money
Market Fund | | Beginning Account
Value
May 1, 2007 | | Ending Account
Value
October 31, 2007 | | Annualized
Expense Ratio
Based on the Six-
Month Period | | | Expenses Paid
During the Six-
Month Period* |
| | | | | | | | | | | | | | |
| Class A | | Actual | | $ | 1,000.00 | | $ | 1,022.80 | | 1.01 | % | | $ | 5.15 |
| | | Hypothetical | | $ | 1,000.00 | | $ | 1,020.11 | | 1.01 | % | | $ | 5.14 |
| | | | | | | | | | | | | | |
| Class C | | Actual | | $ | 1,000.00 | | $ | 1,018.30 | | 1.88 | % | | $ | 9.56 |
| | | Hypothetical | | $ | 1,000.00 | | $ | 1,015.73 | | 1.88 | % | | $ | 9.55 |
| | | | | | | | | | | | | | |
| Class D | | Actual | | $ | 1,000.00 | | $ | 1,020.90 | | 1.38 | % | | $ | 7.03 |
| | | Hypothetical | | $ | 1,000.00 | | $ | 1,018.25 | | 1.38 | % | | $ | 7.02 |
| | | | | | | | | | | | | | |
| Class L | | Actual | | $ | 1,000.00 | | $ | 1,020.90 | | 1.38 | % | | $ | 7.03 |
| | | Hypothetical | | $ | 1,000.00 | | $ | 1,018.25 | | 1.38 | % | | $ | 7.02 |
| | | | | | | | | | | | | | |
| Class M | | Actual | | $ | 1,000.00 | | $ | 1,018.30 | | 1.88 | % | | $ | 9.56 |
| | | Hypothetical | | $ | 1,000.00 | | $ | 1,015.73 | | 1.88 | % | | $ | 9.55 |
| | | | | | | | | | | | | | |
| Class X | | Actual | | $ | 1,000.00 | | $ | 1,018.30 | | 1.88 | % | | $ | 9.56 |
| | | Hypothetical | | $ | 1,000.00 | | $ | 1,015.73 | | 1.88 | % | | $ | 9.55 |
* Fund expenses (net of fee waivers or subsidies, if any) for each share class are equal to the annualized expense ratio for each share class (provided in the table), multiplied by the average account value over the period, multiplied by the 184 days in the six-month period ended October 31, 2007, and divided by the 365 days in the Fund’s fiscal year ended October 31, 2007 (to reflect the six-month period). Expenses presented in the table include the expenses of any underlying portfolios in which the Fund may invest.
| | |
| 6 | | Visit our website at www.jennisondryden.com |
Portfolio of Investments
October 31, 2007
| | | | | | | |
Moody’s
Ratings
(Unaudited) | | Principal
Amount
(000)# | | Description | | Value (Note 2) |
| | | | | | | |
| CERTIFICATES OF DEPOSIT 23.2% | | | |
| P-1 | | 2,000 | | American Express Centurion
5.061%,(a) 12/13/07 | | $ | 1,999,988 |
| P-1 | | 1,000 | | Bank of Scotland PLC
5.30%, 01/14/08 | | | 1,000,017 |
| P-1 | | 700 | | Bank of the West
5.035%,(a) 11/19/07 | | | 699,996 |
| P-1 | | 1,000 | | Barclays Bank PLC
5.16%, 02/19/08 | | | 1,000,000 |
| P-1 | | 1,000 | | 5.20%, 04/11/08 | | | 1,000,000 |
| P-1 | | 2,000 | | Citibank NA
4.81%, 01/25/08 | | | 2,000,000 |
| P-1 | | 1,500 | | Fortis Bank NY
5.06%,(a) 12/12/07 | | | 1,499,966 |
| P-1 | | 900 | | 4.764%,(a) 04/28/08 | | | 898,919 |
| P-1 | | 2,000 | | Regions Bank
4.85%, 02/20/08 | | | 2,000,000 |
| Aa2 | | 1,000 | | Unicredito Italiano New York
5.56%, 12/20/07 | | | 1,000,403 |
| Aa2 | | 1,000 | | 5.19%, 02/19/08 | | | 1,000,000 |
| | | | | | | |
| | | | TOTAL CERTIFICATES OF DEPOSIT
(cost $14,099,289) | | | 14,099,289 |
| | | | | | | |
| |
| COMMERCIAL PAPER(c) 41.1% | | | |
| P-1 | | 2,000 | | Amsterdam Funding Corp.
5.10%, 11/14/07 | | | 1,996,317 |
| P-1 | | 1,000 | | Bank of America Corp.
4.985%, 02/08/08 | | | 986,291 |
| P-1 | | 2,000 | | Barton Capital Corp.
4.90%, 11/01/07 | | | 2,000,000 |
| P-1 | | 2,000 | | Cafco LLC, 144A
5.14%, 11/06/07 | | | 1,998,572 |
| P-1 | | 2,000 | | General Electric Capital Corp.
5.24%, 11/05/07 | | | 1,998,835 |
| P-1 | | 2,000 | | HBOS Treasury Service PLC, 144A
5.27%, 11/08/07 | | | 1,997,951 |
| P-1 | | 2,000 | | JPMorgan & Co.
5.03%, 02/01/08 | | | 1,974,291 |
| P-1 | | 2,000 | | Morgan Stanley
5.50%, 11/21/07 | | | 1,993,889 |
| P-1 | | 1,000 | | Nyala Funding LLC, 144A
4.90%, 11/21/07 | | | 997,278 |
See Notes to Financial Statements.
| | |
| Dryden Money Market Fund | | 7 |
Portfolio of Investments
October 31, 2007 continued
| | | | | | | |
Moody’s
Ratings
(Unaudited) | | Principal
Amount
(000)# | | Description | | Value (Note 2) |
| | | | | | | |
| COMMERCIAL PAPER (continued) | | | |
| P-1 | | 1,500 | | Prudential PLC, 144A
5.10%, 02/11/08 | | $ | 1,478,325 |
| P-1 | | 1,000 | | Societe Generale NA
4.785%, 02/01/08 | | | 987,772 |
| P-1 | | 1,000 | | Swedbank Mortgage AB
5.155%, 01/15/08 | | | 989,260 |
| P-1 | | 1,000 | | 5.135%, 02/22/08 | | | 983,882 |
| P-1 | | 2,000 | | Toyota Motor Credit Corp.
4.77%, 02/22/08 | | | 1,970,055 |
| P-1 | | 1,400 | | UBS Finance (De) LLC
5.35%, 11/07/07 | | | 1,398,752 |
| P-1 | | 1,300 | | Windmill Funding Corp., 144A
5.15%, 11/16/07 | | | 1,297,210 |
| | | | | | | |
| | | | TOTAL COMMERCIAL PAPER
(cost $25,048,680) | | | 25,048,680 |
| | | | | | | |
| |
| CORPORATE OBLIGATIONS 32.8% | | | |
| Aa1 | | 1,000 | | Australia & New Zealand Banking Group Ltd., Notes, 144A (Australia)
5.639%,(a) 07/03/08 | | | 1,000,000 |
| Aa3 | | 2,000 | | Bank of America Corp. NA
5.29%, 05/22/08 | | | 2,000,000 |
| Aa1 | | 1,000 | | Caja Madrid,
Sr. Unsec`d. Notes, 144A (Spain) 5.349%,(a) 08/12/08 | | | 1,000,000 |
| Aa1 | | 1,500 | | DNB NOR Bank ASA, Notes, 144A
4.873%,(a) 08/22/08 | | | 1,499,931 |
| P-1 | | 3,000 | | HSBC USA, Inc., Sr. Unsec`d. Notes
5.091%,(a) 08/14/08 | | | 3,000,000 |
| Aa3 | | 2,000 | | ING Verzekering NV, Notes, MTN, 144A
5.096%,(a) 09/04/08 | | | 2,000,000 |
| Aa3 | | 1,000 | | Irish Life & Permanent PLC,
Sr. Unsec`d. Notes, MTN, 144A (Ireland)
5.048%,(a) 08/20/08 | | | 1,000,041 |
| Aa3 | | 3,000 | | Merrill Lynch & Co., Inc., Notes, MTN
5.231%,(a) 08/14/08 | | | 3,000,000 |
| Aa2 | | 3,000 | | Nationwide Building Society, Notes, 144A
5.278%,(a) 07/28/08 | | | 3,000,490 |
| A1 | | 2,500 | | Paccar Financial Corp., Notes, MTN
5.091%,(a) 08/12/08 | | | 2,500,024 |
| | | | | | | |
| | | | TOTAL CORPORATE OBLIGATIONS
(cost $20,000,486) | | | 20,000,486 |
| | | | | | | |
See Notes to Financial Statements.
| | |
| 8 | | Visit our website at www.jennisondryden.com |
| | | | | | | | |
Moody’s
Ratings
(Unaudited) | | Principal
Amount
(000)# | | Description | | Value (Note 2) | |
| | | | | | | | |
| TIME DEPOSIT 3.3% | | | | |
| P-1 | | $2,000 | | Cargill, Inc.,(b)
4.82%, 11/29/07 | | $ | 2,000,000 | |
| | | | | | | | |
| | | |
| | | Shares | | | | | |
| |
| AFFILIATED MONEY MARKET MUTUAL FUND 0.8% | | | | |
| | | | Dryden Core Investment Fund—Taxable Money Market Series | | | | |
| | 511,639 | | (cost $511,639)(d) | | | 511,639 | |
| | | | | | | | |
TOTAL INVESTMENTS 101.2%
(cost $61,660,094)† | | | 61,660,094 | |
| Liabilities in excess of other assets (1.2)% | | | (761,029 | ) |
| | | | | | | | |
| NET ASSETS 100.0% | | $ | 60,899,065 | |
| | | | | | | | |
The following abbreviation is used in the portfolio descriptions:
144A—Security was purchased pursuant to Rule 144A under the securities Act of 1933 and may not be resold subject to that rule except to qualified institutional buyers. Unless otherwise noted, 144A securities are deemed to be liquid.
MTN—Medium Term Note
| # | Principal amount is shown in U.S. dollars unless otherwise stated. |
| † | The cost of securities for federal income tax purposes is substantially the same as for financial reporting purposes. |
| (a) | Indicates a variable rate security. |
| (b) | Indicates a security that has been deemed illiquid. |
| (c) | Rates shown are the effective yields at purchase date. |
| (d) | Prudential Investments LLC, the manager of the Fund, also serves as manager of the Dryden Core Investment Fund-Taxable Money Market Series. |
The security classification of investments and liabilities in excess of other assets shown as a percentage of net assets as of October 31, 2007 were as follows:
| | | |
Commercial Paper | | 41.1 | % |
Corporate Obligations | | 32.8 | |
Certificates of Deposit | | 23.2 | |
Time Deposit | | 3.3 | |
Affiliated Money Market Mutual Fund | | 0.8 | |
| | | |
| | 101.2 | |
Liabilities in excess of other assets | | (1.2 | ) |
| | | |
| | 100.0 | % |
| | | |
See Notes to Financial Statements.
| | |
| Dryden Money Market Fund | | 9 |
Statement of Assets and Liabilities
as of October 31, 2007
| | | | |
Assets | | | | |
Investments at value: | | | | |
Unaffiliated investments(a) | | $ | 61,148,455 | |
Affiliated investments(b) | | | 511,639 | |
Dividends and interest receivable | | | 166,189 | |
Prepaid expenses | | | 2,101 | |
Receivable for Fund shares sold | | | 205 | |
| | | | |
Total assets | | | 61,828,589 | |
| | | | |
| |
Liabilities | | | | |
Payable for Fund shares reacquired | | | 549,025 | |
Transfer agent fee payable(c) | | | 172,346 | |
Accrued expenses | | | 136,605 | |
Distribution fees payable | | | 41,319 | |
Management fee payable | | | 20,973 | |
Dividends payable | | | 7,355 | |
Deferred directors’ fees | | | 1,901 | |
| | | | |
Total liabilities | | | 929,524 | |
| | | | |
| |
Net Assets | | $ | 60,899,065 | |
| | | | |
| | | | | |
Net assets were comprised of: | | | | |
Common stock, at $.001 par value | | $ | 60,947 | |
Paid-in capital in excess of par | | | 60,864,192 | |
| | | | |
| | | 60,925,139 | |
Overdistribution of net investment income | | | (9,256 | ) |
Accumulated net realized loss on investment transactions | | | (16,818 | ) |
| | | | |
Net assets, October 31, 2007 | | $ | 60,899,065 | |
| | | | |
(a) Unaffiliated investments at cost | | $ | 61,148,455 | |
| | | | |
(b) Affiliated investments at cost | | $ | 511,639 | |
| | | | |
(c) Affiliated transfer agent fees | | $ | 9,200 | |
| | | | |
See Notes to Financial Statements.
| | |
| 10 | | Visit our website at www.jennisondryden.com |
| | | |
Class A: | | | |
Net asset value, offering and redemption price per share
($6,062,906 ÷ 6,062,922 shares of common stock issued and outstanding) | | $ | 1.00 |
| | | |
| |
Class C: | | | |
Net asset value, offering and redemption price per share
($6,592,217 ÷ 6,599,260 shares of common stock issued and outstanding) | | $ | 1.00 |
| | | |
| |
Class D: | | | |
Net asset value, offering and redemption price per share
($7,276,804 ÷ 7,281,791 shares of common stock issued and outstanding) | | $ | 1.00 |
| | | |
| |
Class L: | | | |
Net asset value, offering and redemption price per share
($8,519,511 ÷ 8,529,975 shares of common stock issued and outstanding) | | $ | 1.00 |
| | | |
| |
Class M: | | | |
Net asset value, offering and redemption price per share
($25,197,361 ÷ 25,218,705 shares of common stock issued and outstanding) | | $ | 1.00 |
| | | |
| |
Class X: | | | |
Net asset value, offering and redemption price per share
($7,250,266 ÷ 7,254,824 shares of common stock issued and outstanding) | | $ | 1.00 |
| | | |
See Notes to Financial Statements.
| | |
| Dryden Money Market Fund | | 11 |
Statement of Operations
Year Ended October 31, 2007
| | | | |
Net Investment Income | | | | |
Investment income | | | | |
Interest | | $ | 3,846,331 | |
Affiliated dividend income | | | 37,801 | |
| | | | |
Total income | | | 3,884,132 | |
| | | | |
| |
Expenses | | | | |
Advisory fees | | | 356,962 | |
Distribution fees—Class A | | | 5,509 | |
Distribution fees—Class C | | | 74,289 | |
Distribution fees—Class D | | | 41,953 | |
Distribution fees—Class L | | | 51,721 | |
Distribution fees—Class M | | | 325,144 | |
Distribution fees—Class X | | | 83,075 | |
Transfer agent’s fees and expenses(a) | | | 201,000 | |
Custodian’s fees and expenses | | | 103,000 | |
Legal fees and expenses | | | 25,000 | |
Audit fees | | | 18,000 | |
Directors’ fees | | | 12,000 | |
Reports to shareholders | | | 10,000 | |
Insurance fees | | | 2,000 | |
Miscellaneous | | | 11,392 | |
| | | | |
Total expenses | | | 1,321,045 | |
Less: Advisory fee waivers and expense reimbursements | | | (71,392 | ) |
| | | | |
Net expenses | | | 1,249,653 | |
| | | | |
Net investment income | | | 2,634,479 | |
| | | | |
| |
Realized Gain On Investments | | | | |
Net realized gain on investments | | | 789 | |
| | | | |
Net Increase In Net Assets Resulting From Operations | | $ | 2,635,268 | |
| | | | |
(a) Affiliated Transfer Agent’s Fees and Expenses | | $ | 121,000 | |
| | | | |
See Notes to Financial Statements.
| | |
| 12 | | Visit our website at www.jennisondryden.com |
Statement of Changes in Net Assets
| | | | | | | | |
| | | Dryden Money Market Fund | |
| | | Year
Ended
October 31, 2007 | | | Year
Ended
October 31, 2006 | |
Increase (Decrease) In Net Assets | | | | | | | | |
Operations | | | | | | | | |
Net investment income | | $ | 2,634,479 | | | $ | 2,915,343 | |
Net realized gain (loss) on investments | | | 789 | | | | (2,144 | ) |
| | | | | | | | |
Net increase in net assets resulting from operations | | | 2,635,268 | | | | 2,913,199 | |
| | | | | | | | |
Dividends (Note 2) | | | | | | | | |
Dividends from net investment income | | | | | | | | |
Class A | | | (194,551 | ) | | | (48,409 | ) |
Class C | | | (262,725 | ) | | | (277,330 | ) |
Class D | | | (334,886 | ) | | | (368,701 | ) |
Class L | | | (413,585 | ) | | | (546,141 | ) |
Class M | | | (1,138,731 | ) | | | (1,362,679 | ) |
Class X | | | (290,925 | ) | | �� | (312,391 | ) |
| | | | | | | | |
Total dividends | | | (2,635,403 | ) | | | (2,915,651 | ) |
| | | | | | | | |
| | |
Fund share transactions (Note 4) | | | | | | | | |
Net proceeds from shares sold | | | 31,173,328 | | | | 46,217,631 | |
Net asset value of shares issued in reinvestment of dividends and distributions | | | 2,312,802 | | | | 2,358,757 | |
Cost of shares reacquired | | | (56,149,343 | ) | | | (86,226,878 | ) |
| | | | | | | | |
Net decrease in net assets from Fund share transactions | | | (22,663,213 | ) | | | (37,650,490 | ) |
| | | | | | | | |
Net decrease in net assets | | | (22,663,348 | ) | | | (37,652,942 | ) |
| | |
Net Assets | | | | | | | | |
Beginning of year | | | 83,562,413 | | | | 121,215,355 | |
| | | | | | | | |
End of year | | $ | 60,899,065 | | | $ | 83,562,413 | |
| | | | | | | | |
See Notes to Financial Statements.
| | |
| Dryden Money Market Fund | | 13 |
Notes to Financial Statements
1. Organization
Strategic Partners Mutual Funds, Inc., formerly known as American Skandia Advisor Funds, Inc., (the “Company”) is an open-end management investment company, registered under the Investment Company Act of 1940, as amended. The Company was organized on March 5, 1997, as a Maryland Corporation. The Company operates as a series company and effective April 12, 2004, the name of the Company was changed to Strategic Partners Mutual Funds, Inc. At October 31, 2007, the Company consisted of three diversified investment portfolios (each a “Fund” and collectively the “Funds”). The information presented in these financial statements pertains to Dryden Money Market Fund (“Fund”). The investment objective of the Fund is to maximize current income and maintain high levels of liquidity by investing in high-quality, short-term, U.S. dollar-denominated instruments.
2. Accounting Policies
The following is a summary of significant accounting policies followed by the Fund in the preparation of its financial statements.
Securities Valuations
Portfolio securities are valued at amortized cost, which approximates market value. The amortized cost method involves valuing a security at its cost on the date of purchase and thereafter assuming a constant amortization to maturity of any discount or premium. If the amortized cost method is determined not to represent fair value, the fair value shall be determined by or under the direction of the Board of Directors. When determining the fair valuation of securities some of the factors influencing the valuation include the nature of any restrictions on disposition of securities; assessment of the general liquidity of the securities; the issuer’s financial condition and the markets in which it does business; the cost of the investment; the size of the holding and the capitalization of issuer; the prices of any recent transactions or bids/offers for such securities or any comparable securities; any available analyst media or other reports or information deemed reliable by the investment adviser regarding the issuer or the markets or industry in which it operates.
Repurchase Agreements
A repurchase agreement is a commitment to purchase securities from a seller who agrees to repurchase the securities at an agreed-upon price and date. The excess of
| | |
| 14 | | Visit our website at www.jennisondryden.com |
the resale price over the purchase price determines the yield on the transaction. Under the terms of the agreement, the market value, including accrued interest, of the securities will be at least equal to their repurchase price.
Repurchase agreements are recorded at cost, which, combined with accrued interest, approximates market value.
Repurchase agreements bear a risk of loss in the event that the seller defaults on its obligation to repurchase the securities. In such case, the Fund may be delayed or prevented from exercising its right to dispose of the securities.
Loan Participation
The Fund may invest in loan participations. When the Fund purchases a loan participation, the Fund typically enteres into a contractual relationship with the lender or third party selling such participations (“Selling Participant”), but not the borrower. As a result, the Fund assumes the credit risk of the borrower, the selling participant and any other persons Interpositioned between the Fund and borrower (“Intermediate participants”). The Fund may not directly benefit from the collateral supporting the senior loan In which It has purchased the loan participation.
Securities Transactions and Net Investment Income
Securities transactions are recorded on the trade date. Realized gains or losses on sales of securities are calculated on the identified cost basis. Interest income including amortization of premium and accretion of discount on debt securities, as required, is recorded on the accrual basis. Expenses are recorded on the accrual basis which may require the use of certain estimates by management.
Net investment income or loss (other than distribution fees, which are charged directly to the respective class) and realized gains or losses are allocated daily to each class of shares based upon the relative proportion of net assets of each class at the beginning of the day.
Dividends and Distributions to Shareholders
Dividends from net investment income are declared daily and paid monthly Dividends and distributions are determined in accordance with federal income tax regulations and may differ from accounting principles generally accepted in the United States of America.
| | |
| Dryden Money Market Fund | | 15 |
Notes to Financial Statements
continued
Net realized gains from investment transactions, if any, are distributed at least annually. Permanent book/tax differences relating to income and gains are reclassified to paid-in capital when they arise.
Taxes
For federal income tax purposes, each Fund in the Company is treated as a separate tax paying entity. It is the Fund’s policy to continue to meet the requirements of the Internal Revenue Code applicable to regulated investment companies and to distribute all of its taxable net income and capital gains, if any, to shareholders. Therefore, no federal tax provision is required.
Estimates
The preparation of the financial statements requires management to make estimates and assumptions that affect the reported amounts and disclosures in the financial statements. Actual results could differ from those estimates.
3. Agreements and Other Transactions with Affiliates
The Fund has entered into investment management agreements with Prudential Investments LLC and AST Investment Services, Inc. (co-managers) (“Investment Manager”) which provide that the Investment Manager will furnish the Fund with investment advice and investment management and administrative services. The Investment Manager has engaged Prudential Investment Management, Inc. (“PIM”) as Sub-advisor of the Fund as of October 31, 2007.
Advisory Fees and Expense Limitations
The Investment Manager receives a fee, computed daily and paid monthly, based on an annual rate of the average net assets. The Investment Manager pays the Sub-advisor a fee as compensation for advisory services provided to the Fund. The Investment Manager has voluntarily agreed to waive expenses in accordance with limitation expense policies as noted in the table below. The Investment Manager will reimburse the Fund for its respective operating expenses, exclusive of taxes, interest, brokerage commissions, distribution fees and extraordinary expenses, but inclusive of the advisory fee, which in the aggregate exceed specified percentages of the Fund’s average net assets while retaining their ability to be reimbursed for such fee waivers
| | |
| 16 | | Visit our website at www.jennisondryden.com |
prior to the end of the fiscal year. The advisory fees and expense limitations are summarized as follows:
| | | | |
Advisory
Expense | | Effective Advisory Fees
Net of Waiver | | Expense
Limitations |
| 0.50% | | 0.40% | | 1.00% |
The Investment Manager has contractually agreed to waive 0.10% of its advisory fee. Such voluntary fee waivers or reductions have been calculated prior to any fee reimbursements with respect to the expense limitations, and may be rescinded at any time and without notice to investors. All reimbursements by the Investment Manager are reflected in the Statements of Operations.
Management of the Company
Certain officers and directors of the Funds are officers or directors of the Investment Manager. The Funds pay no compensation directly to their officers or interested directors.
Distributor
Prudential Investment Management Services LLC (“PIMS”) and American Skandia Marketing, Incorporated (“ASMI”), both affiliates of Prudential Investments LLC, an indirect, wholly-owned subsidiary of Prudential, serve as the distributors for the Funds. The Company has adopted a separate Distribution and Service plan (each a “Plan” and collectively the “Plans”) for Class A, C, D, L, M and X shares of the Fund in accordance with the requirements of Rule 12b-1 of the Investment Company Act of 1940.
Under the Plans, the Fund compensates PIMS and ASMI a distribution and service fee at an annual rate of 0.125%, 1.00%, 0.50%, 0.50%, 1.00% and 1.00% of the average daily net assets of the Class A, C, D, L, M and X shares, respectively, for the year ended October 31, 2007.
During the year ended October 31, 2007 PIMS has advised the Fund gross contingent deferred sales charges (“CDSC”) were approximately as follows:
| | | | |
Class C
CDSC | | Class M
CDSC | | Class X
CDSC |
| $100 | | $141,000 | | $39,800 |
| | |
| Dryden Money Market Fund | | 17 |
Notes to Financial Statements
continued
Transfer Agent
Prudential Mutual Fund Services LLC (“PMFS”), an affiliate of Prudential Investments LLC and an indirect, wholly-owned subsidiary of Prudential, serves as the Funds’ transfer agent. Transfer agent fees and expenses are shown in the Statements of Operations.
The Fund pays networking fees to affiliated and unaffiliated broker/dealers, including fees relating to the services of Wachovia Securities, LLC (“Wachovia”) and First Clearing, LLC (“First Clearing”), affiliates of PI. These networking fees are payments made to broker/dealers that clear mutual fund transactions through a national clearing system. These amounts are included in transfer agent’s fees and expenses on the Statement of Operations. For the year ended October 31, 2007, the Fund incurred $12,300 in total networking fees, of which $850 was paid to First Clearing.
Cash Sweep
The Fund invests in the Taxable Money Market Series (the “Series”), a portfolio of Dryden Core Investment Fund, pursuant to an exemptive order received from the Securities and Exchange Commission. The Series is a money market mutual fund registered under the Investment Company Act of 1940, as amended, and managed by PI.
4. Shares of Capital Stock
The Fund offers Class A, Class C, Class D, Class L, Class M and Class X shares. Class M shares will automatically convert to Class A shares approximately eight years after purchase. Class L shares are closed to most new purchases (with the exception of reinvested dividends and purchases by certain college savings plans). Class M shares are also closed to most new purchases (with the exception of reinvested dividends). Class L shares and Class M shares are only exchangeable with Class L shares and Class M shares, respectively, offered by the other Strategic Partners Funds. Class X shares are closed to new purchases. The authorized capital stock of the Fund is 2 billion shares, with a par value of $.001 per share.
| | |
| 18 | | Visit our website at www.jennisondryden.com |
Transactions in shares of capital stock were as follows:
| | | | | | | |
Class A | | Shares | | | Amount | |
Year ended October 31, 2007: | | | | | | | |
Shares sold | | 2,300 | | | $ | 2,301 | |
Shares issued in reinvestment of dividends and distributions | | 186,903 | | | | 186,903 | |
Shares reacquired | | (1,873,023 | ) | | | (1,873,023 | ) |
| | | | | | | |
Net increase (decrease) in shares outstanding before conversion | | (1,683,820 | ) | | | (1,683,819 | ) |
Shares issued upon conversion from Class M and Class X | | 4,915,019 | | | | 4,915,019 | |
| | | | | | | |
Net increase (decrease) in shares outstanding | | 3,231,199 | | | $ | 3,231,200 | |
| | | | | | | |
Year ended October 31, 2006: | | | | | | | |
Shares sold | | 17,005 | | | $ | 17,003 | |
Shares issued in reinvestment of dividends and distributions | | 44,428 | | | | 44,428 | |
Shares reacquired | | (534,150 | ) | | | (534,150 | ) |
| | | | | | | |
Net increase (decrease) in shares outstanding before conversion | | (472,717 | ) | | | (472,719 | ) |
Shares issued upon conversion from Class M and Class X | | 3,271,718 | | | | 3,271,718 | |
| | | | | | | |
Net increase (decrease) in shares outstanding | | 2,799,001 | | | $ | 2,798,999 | |
| | | | | | | |
Class C | | | | | | |
Year ended October 31, 2007: | | | | | | | |
Shares sold | | 548,110 | | | $ | 548,110 | |
Shares issued in reinvestment of dividends and distributions | | 214,778 | | | | 214,778 | |
Shares reacquired | | (2,744,691 | ) | | | (2,744,691 | ) |
| | | | | | | |
Net increase (decrease) in shares outstanding | | (1,981,803 | ) | | $ | (1,981,803 | ) |
| | | | | | | |
Year ended October 31, 2006: | | | | | | | |
Shares sold | | 873,285 | | | $ | 873,285 | |
Shares issued in reinvestment of dividends and distributions | | 187,610 | | | | 187,610 | |
Shares reacquired | | (4,825,845 | ) | | | (4,825,845 | ) |
| | | | | | | |
Net increase (decrease) in shares outstanding | | (3,764,950 | ) | | $ | (3,764,950 | ) |
| | | | | | | |
Class D | | | | | | |
Year ended October 31, 2007: | | | | | | | |
Shares sold | | 47,095 | | | $ | 47,095 | |
Shares issued in reinvestment of dividends and distributions | | 276,605 | | | | 276,605 | |
Shares reacquired | | (2,807,417 | ) | | | (2,807,417 | ) |
| | | | | | | |
Net increase (decrease) in shares outstanding | | (2,483,717 | ) | | $ | (2,483,717 | ) |
| | | | | | | |
Year ended October 31, 2006: | | | | | | | |
Shares sold | | 167,594 | | | $ | 167,594 | |
Shares issued in reinvestment of dividends and distributions | | 251,088 | | | | 251,088 | |
Shares reacquired | | (3,672,972 | ) | | | (3,672,972 | ) |
| | | | | | | |
Net increase (decrease) in shares outstanding | | (3,254,290 | ) | | $ | (3,254,290 | ) |
| | | | | | | |
| | |
| Dryden Money Market Fund | | 19 |
Notes to Financial Statements
continued
| | | | | | | |
Class L | | Shares | | | Amount | |
Year ended October 31, 2007: | | | | | | | |
Shares sold | | 4,379,721 | | | $ | 4,379,721 | |
Shares issued in reinvestment of dividends and distributions | | 381,732 | | | | 381,732 | |
Shares reacquired | | (9,074,423 | ) | | | (9,074,423 | ) |
| | | | | | | |
Net increase (decrease) in shares outstanding | | (4,312,970 | ) | | $ | (4,312,970 | ) |
| | | | | | | |
Year ended October 31, 2006: | | | | | | | |
Shares sold | | 7,978,168 | | | $ | 7,978,168 | |
Shares issued in reinvestment of dividends and distributions | | 488,623 | | | | 488,623 | |
Shares reacquired | | (16,804,157 | ) | | | (16,804,157 | ) |
| | | | | | | |
Net increase (decrease) in shares outstanding | | (8,337,366 | ) | | $ | (8,337,366 | ) |
| | | | | | | |
Class M | | | | | | |
Year ended October 31, 2007: | | | | | | | |
Shares sold | | 17,642,301 | | | $ | 17,642,301 | |
Shares issued in reinvestment of dividends and distributions | | 994,513 | | | | 994,513 | |
Shares reacquired | | (29,141,589 | ) | | | (29,140,030 | ) |
| | | | | | | |
Net increase (decrease) in shares outstanding before conversion | | (10,504,775 | ) | | | (10,503,216 | ) |
Shares reacquired upon conversion into Class A | | (4,895,166 | ) | | | (4,896,725 | ) |
| | | | | | | |
Net increase (decrease) in shares outstanding | | (15,399,941 | ) | | $ | (15,399,941 | ) |
| | | | | | | |
Year ended October 31, 2006: | | | | | | | |
Shares sold | | 27,290,001 | | | $ | 27,290,001 | |
Shares issued in reinvestment of dividends and distributions | | 1,121,628 | | | | 1,121,628 | |
Shares reacquired | | (46,522,142 | ) | | | (46,522,142 | ) |
| | | | | | | |
Net increase (decrease) in shares outstanding before conversion | | (18,110,513 | ) | | | (18,110,513 | ) |
Shares reacquired upon conversion into Class A | | (2,187,339 | ) | | | (2,187,339 | ) |
| | | | | | | |
Net increase (decrease) in shares outstanding | | (20,297,852 | ) | | $ | (20,297,852 | ) |
| | | | | | | |
Class X | | | | | | |
Year ended October 31, 2007: | | | | | | | |
Shares sold | | 8,553,800 | | | $ | 8,553,800 | |
Shares issued in reinvestment of dividends and distributions | | 258,271 | | | | 258,271 | |
Shares reacquired | | (10,510,002 | ) | | | (10,509,759 | ) |
| | | | | | | |
Net increase (decrease) in shares outstanding before conversion | | (1,697,931 | ) | | | (1,697,688 | ) |
Shares reacquired upon conversion into Class A | | (18,051 | ) | | | (18,294 | ) |
| | | | | | | |
Net increase (decrease) in shares outstanding | | (1,715,982 | ) | | $ | (1,715,982 | ) |
| | | | | | | |
Year ended October 31, 2006: | | | | | | | |
Shares sold | | 9,891,580 | | | $ | 9,891,580 | |
Shares issued in reinvestment of dividends and distributions | | 265,380 | | | | 265,380 | |
Shares reacquired | | (13,867,612 | ) | | | (13,867,612 | ) |
| | | | | | | |
Net increase (decrease) in shares outstanding before conversion | | (3,710,652 | ) | | | (3,710,652 | ) |
Shares reacquired upon conversion into Class A | | (1,084,379 | ) | | | (1,084,379 | ) |
| | | | | | | |
Net increase (decrease) in shares outstanding | | (4,795,031 | ) | | $ | (4,795,031 | ) |
| | | | | | | |
| | |
| 20 | | Visit our website at www.jennisondryden.com |
5. Distributions and Tax Information
Distributions to shareholders, which are determined in accordance with federal income tax regulations, which may differ from generally accepted accounting principles, are recorded on the ex-dividend date. In order to present overdistribution of net investment income, accumulated net realized loss on investment transactions and paid-in capital in excess of par on the Statement of Assets and Liabilities that more closely represent their tax character, certain adjustments have been made to paid-in capital in excess of par and overdistribution of net investment income. For the tax year ended October 31, 2007, the adjustments were to decrease overdistribution of net investment income and paid-in capital in excess of par by $18,929 due to book to tax adjustments. Net investment income, net realized gains and net assets were not affected by this change.
For the years ended October 31, 2007 and October 31, 2006, the tax character of dividends paid as reflected in the Statement of Changes in Net Assets were $2,635,403 and $2,915,651 from ordinary income, respectively.
As of October 31, 2007, the Fund had no accumulated undistributed earnings on a tax basis.
At October 31, 2007, the Fund had a capital loss carryforward for tax purposes of approximately $16,800 of which $14,700 expires in 2013 and $2,100 expires in 2014. For the fiscal year ended October 31, 2007, approximately $800 of its capital loss carryforward was used to offset net realized capital gains. No capital gain distributions are expected to be paid to shareholders until net gains have been realized in excess of such carryforward. It is uncertain whether the Fund will be able to realize the full benefit prior to the expiration date.
6. New Accounting Pronouncements
On July 13, 2006, the Financial Accounting Standards Board (FASB) released FASB Interpretation No. 48 “Accounting for Uncertainty in Income Taxes” (FIN 48). FIN 48 provides guidance for how uncertain tax positions should be recognized, measured, presented and disclosed in the financial statements. FIN 48 requires the evaluation of tax positions taken or expected to be taken in the course of preparing the Fund’s tax returns to determine whether the tax positions are “more-likely-than-not” of being sustained by the applicable tax authority. The impact of the tax positions not deemed to meet the more-likely-than-not threshold would be recorded in the year in which they arise. On December 22, 2006, the Securities and Exchange Commission delayed the effective date until the last net asset value calculation in the first required financial reporting period for
| | |
| Dryden Money Market Fund | | 21 |
Notes to Financial Statements
continued
its fiscal year beginning after December 15, 2006. The Portfolios’ financial statements have not been impacted by the adoption of FIN 48. However, the conclusions regarding FIN 48 may be subject to review and adjustment at a later date based on factors including, but not limited to, further implementation guidance expected from FASB and on-going analysis of tax laws, regulations, and interpretations thereof.
On September 20, 2006, the FASB released Statement of Financial Accounting Standards No. 157 “Fair Value Measurements” (FAS 157). FAS 157 establishes an authoritative definition of fair value, sets out a framework for measuring fair value, and requires additional disclosures about fair-value measurements. The application of FAS 157 is required for fiscal years beginning after November 15, 2007 and interim periods within those fiscal years. At this time, management is evaluating the implications of FAS 157 and its impact, if any, in the financial statements has not yet been determined.
| | |
| 22 | | Visit our website at www.jennisondryden.com |
Financial Highlights
| | |
| OCTOBER 31, 2007 | | ANNUAL REPORT |
Dryden Money Market Fund
Financial Highlights
| | | | | | | | | | | | |
| | | Class A | |
| | | Year Ended October 31, | | | August 12, 2005(c)
through
October 31, 2005 | |
| | | 2007(d) | | | 2006(d) | | |
Per Share Operating Performance: | | | | | | | | | | | | |
Net Asset Value, Beginning Of Period | | $ | 1.00 | | | $ | 1.00 | | | $ | 1.00 | |
| | | | | | | | | | | | |
Income from investment operations: | | | | | | | | | | | | |
Net investment income | | | 0.044 | | | | 0.037 | | | | 0.005 | |
Net realized and unrealized gain (loss) on investments | | | — | | | | — | | | | — | * |
| | | | | | | | | | | | |
Total from investment operations | | | 0.044 | | | | 0.037 | | | | 0.005 | |
| | | | | | | | | | | | |
Less Dividends and Distributions: | | | | | | | | | | | | |
Dividends from net investment income | | | (0.044 | ) | | | (0.037 | ) | | | (0.005 | ) |
| | | | | | | | | | | | |
Net asset value, end of period | | $ | 1.00 | | | $ | 1.00 | | | $ | 1.00 | |
| | | | | | | | | | | | |
Total Investment Return(a) | | | 4.47 | % | | | 3.73 | % | | | 0.53 | % |
Ratios/Supplemental Data: | | | | | | | | | | | | |
Net assets, end of period (in millions) | | $ | 6.1 | | | $ | 2.8 | | | $ | 0.3 | |
Ratios to average net assets: | | | | | | | | | | | | |
Expenses after advisory fee waiver and expense reimbursement | | | 1.05 | % | | | 1.13 | % | | | 1.25 | %(b) |
Expenses before advisory fee waiver and expense reimbursement | | | 1.15 | % | | | 1.42 | % | | | 1.44 | %(b) |
Net investment income | | | 4.39 | % | | | 4.10 | % | | | 0.59 | %(b) |
| (a) | Total investment return is calculated assuming a purchase of a share on the first day and a sale on the last day of each period reported, and includes reinvestment of dividends and distributions. Total investment returns may reflect adjustments to conform to generally accepted accounting principles. Total returns for periods of less than a full year are not annualized. Total return includes the effect of expense subsidies. |
| (c) | Commencement of operations. |
| (d) | Calculations are based on average daily number of shares outstanding. |
| * | Amount is less than $0.005. |
See Notes to Financial Statements.
| | |
| 24 | | Visit our website at www.jennisondryden.com |
This Page Intentionally Left Blank
Financial Highlights
continued
| | | | |
| | | Class C | |
| | | Year Ended
October 31, 2007(b) | |
Per Share Operating Performance: | | | | |
Net Asset Value, Beginning Of Year | | $ | 1.00 | |
| | | | |
Income from investment operations: | | | | |
Net investment income | | | 0.035 | |
Net realized and unrealized gain on investments | | | — | |
| | | | |
Total from investment operations | | | 0.035 | |
| | | | |
Less Dividends and Distributions: | | | | |
Dividends from net investment income | | | (0.035 | ) |
Distributions from net realized gains | | | — | |
| | | | |
Total dividends and distributions | | | (0.035 | ) |
| | | | |
Net asset value, end of year | | $ | 1.00 | |
| | | | |
Total Investment Return(a) | | | 3.56 | % |
Ratios/Supplemental Data: | | | | |
Net assets, end of year (in millions) | | $ | 6.6 | |
Ratios to average net assets: | | | | |
Expenses after advisory fee waiver and expense reimbursement | | | 1.93 | % |
Expenses before advisory fee waiver and expense reimbursement | | | 2.03 | % |
Net investment income | | | 3.50 | % |
| (a) | Total investment return is calculated assuming a purchase of a share on the first day and a sale on the last day of each year reported, and includes reinvestment of dividends and distributions. Total investment returns may reflect adjustments to conform to generally accepted accounting principles. Total return includes the effect of expense subsidies. |
| (b) | Calculations are based on the average daily number of shares outstanding. |
| (c) | For the year ended October 31, 2003 the Portfolio Turnover Rate, Ratios of Expenses and Ratios of Net Investment Income represent the combined ratios for the respective Fund and its respective pro rata share of its Master Portfolio. |
| * | Amount is less than $0.005. |
| (t) | Amount is less than 0.005% |
See Notes to Financial Statements.
| | |
| 26 | | Visit our website at www.jennisondryden.com |
| | | | | | | | | | | | | | |
| Class C | |
| Year Ended October 31, | |
| 2006(b) | | | 2005 | | | 2004 | | | 2003(b)(c) | |
| | | | | | | | | | | | | | |
| $ | 1.00 | | | $ | 1.00 | | | $ | 1.00 | | | $ | 1.00 | |
| | | | | | | | | | | | | | | |
| | | | | | | | | | | | | | |
| | 0.029 | | | | 0.009 | | | | — | * | | | — | * |
| | — | | | | — | * | | | — | * | | | — | * |
| | | | | | | | | | | | | | | |
| | 0.029 | | | | 0.009 | | | | — | * | | | — | * |
| | | | | | | | | | | | | | | |
| | | | | | | | | | | | | | |
| | (0.029 | ) | | | (0.009 | ) | | | — | * | | | — | * |
| | — | | | | — | * | | | — | | | | — | * |
| | | | | | | | | | | | | | | |
| | (0.029 | ) | | | (0.009 | ) | | | — | * | | | — | * |
| | | | | | | | | | | | | | | |
| $ | 1.00 | | | $ | 1.00 | | | $ | 1.00 | | | $ | 1.00 | |
| | | | | | | | | | | | | | | |
| | 2.90 | % | | | 0.92 | % | | | 0.00 | % | | | 0.00 | % |
| | | | | | | | | | | | | | |
| $ | 8.6 | | | $ | 12.3 | | | $ | 22.1 | | | $ | 45.7 | |
| | | | | | | | | | | | | | |
| | 2.00 | % | | | 2.00 | % | | | 1.23 | % | | | 1.32 | % |
| | 2.29 | % | | | 2.26 | % | | | 1.90 | % | | | 1.92 | % |
| | 2.81 | % | | | 0.84 | % | | | 0.01 | % | | | — | (t) |
See Notes to Financial Statements.
| | |
| Dryden Money Market Fund | | 27 |
Financial Highlights
continued
| | | | |
| | | Class D | |
| |
| | | Year Ended
October 31, 2007(d) | |
Per Share Operating Performance: | | | | |
Net Asset Value, Beginning Of Period | | $ | 1.00 | |
| | | | |
Income from investment operations: | | | | |
Net investment income | | | 0.040 | |
Net realized and unrealized gain on investments | | | — | |
| | | | |
Total from investment operations | | | 0.040 | |
| | | | |
Less Dividends and Distributions: | | | | |
Dividends from net investment income | | | (0.040 | ) |
Distributions from net realized gains | | | — | |
| | | | |
Total dividends and distributions | | | (0.040 | ) |
| | | | |
Net asset value, end of period | | $ | 1.00 | |
| | | | |
Total Investment Return(a) | | | 4.08 | % |
Ratios/Supplemental Data: | | | | |
Net assets, end of period (in millions) | | $ | 7.3 | |
Ratios to average net assets: | | | | |
Expenses after advisory fee waiver and expense reimbursement | | | 1.43 | % |
Expenses before advisory fee waiver and expense reimbursement | | | 1.53 | % |
Net investment income | | | 3.99 | % |
| (a) | Total investment return is calculated assuming a purchase of a share on the first day and a sale on the last day of each period reported, and includes reinvestment of dividends and distributions. Total investment returns may reflect adjustments to conform to generally accepted accounting principles. Total returns for periods of less than a full year are not annualized. Total return includes the effect of expense subsidies. |
| (c) | Commencement of operations. |
| (d) | Calculations are based on the average daily number of shares outstanding. |
| * | Amount is less than $0.005. |
See Notes to Financial Statements.
| | |
| 28 | | Visit our website at www.jennisondryden.com |
| | | | | | | | | | |
| Class D | |
| Year Ended October 31, | | | April 12, 2004(c)
through
October 31, 2004 | |
| 2006(d) | | | 2005 | | |
| | | | | | | | | | |
| $ | 1.00 | | | $ | 1.00 | | | $ | 1.00 | |
| | | | | | | | | | | |
| | | | | | | | | | |
| | 0.034 | | | | 0.014 | | | | — | * |
| | — | | | | — | * | | | — | * |
| | | | | | | | | | | |
| | 0.034 | | | | 0.014 | | | | — | * |
| | | | | | | | | | | |
| | | | | | | | | | |
| | (0.034 | ) | | | (0.014 | ) | | | — | * |
| | — | | | | — | * | | | — | |
| | | | | | | | | | | |
| | (0.034 | ) | | | (0.014 | ) | | | — | * |
| | | | | | | | | | | |
| $ | 1.00 | | | $ | 1.00 | | | $ | 1.00 | |
| | | | | | | | | | | |
| | 3.41 | % | | | 1.42 | % | | | 0.29 | % |
| | | | | | | | | | |
| $ | 9.8 | | | $ | 13.0 | | | $ | 16.0 | |
| | | | | | | | | | |
| | 1.50 | % | | | 1.50 | % | | | 0.83 | %(b) |
| | 1.79 | % | | | 1.77 | % | | | 1.38 | %(b) |
| | 3.32 | % | | | 1.39 | % | | | 0.51 | %(b) |
See Notes to Financial Statements.
| | |
| Dryden Money Market Fund | | 29 |
Financial Highlights
continued
| | | | |
| | | Class L(c) | |
| | | Year Ended
October 31, 2007(b) | |
Per Share Operating Performance: | | | | |
Net Asset Value, Beginning Of Year | | $ | 1.00 | |
| | | | |
Income from investment operations: | | | | |
Net investment income | | | 0.040 | |
Net realized and unrealized gain (loss) on investments | | | — | |
| | | | |
Total from investment operations | | | 0.040 | |
| | | | |
Less Dividends and Distributions: | | | | |
Dividends from net investment income | | | (0.040 | ) |
Distributions from net realized gains | | | — | |
| | | | |
Total dividends and distributions | | | (0.040 | ) |
| | | | |
Net asset value, end of year | | $ | 1.00 | |
| | | | |
Total Investment Return(a) | | | 4.08 | % |
Ratios/Supplemental Data: | | | | |
Net assets, end of year (in millions) | | $ | 8.5 | |
Ratios to average net assets: | | | | |
Expenses after advisory fee waiver and expense reimbursement | | | 1.43 | % |
Expenses before advisory fee waiver and expense reimbursement | | | 1.53 | % |
Net investment income | | | 4.00 | % |
| (a) | Total investment return is calculated assuming a purchase of a share on the first day and a sale on the last day of each year reported, and includes reinvestment of dividends and distributions. Total investment returns may reflect adjustments to conform to generally accepted accounting principles. Total return includes the effect of expense subsidies. |
| (b) | Calculations are based on the average daily number of shares outstanding. |
| (c) | Prior to April 12, 2004, Class L shares were known as Class A shares. On April 12, 2004, Class A shares were redesignated as Class L shares. |
| (d) | For the year ended October 31, 2003 the Portfolio Turnover Rate, Ratios of Expenses and Ratios of Net Investment Income represent the combined ratios for the respective Fund and its respective pro rata share of its Master Portfolio. |
| * | Amount is less than $0.005. |
See Notes to Financial Statements.
| | |
| 30 | | Visit our website at www.jennisondryden.com |
| | | | | | | | | | | | | | |
| Class L(c) | |
| Year Ended October 31, | |
| 2006(b) | | | 2005 | | | 2004 | | | 2003(b)(d) | |
| | | | | | | | | | | | | | |
| $ | 1.00 | | | $ | 1.00 | | | $ | 1.00 | | | $ | 1.00 | |
| | | | | | | | | | | | | | | |
| | | | | | | | | | | | | | |
| | 0.034 | | | | 0.014 | | | | 0.010 | | | | 0.005 | |
| | — | | | | — | * | | | — | * | | | — | * |
| | | | | | | | | | | | | | | |
| | 0.034 | | | | 0.014 | | | | 0.010 | | | | 0.005 | |
| | | | | | | | | | | | | | | |
| | | | | | | | | | | | | | |
| | (0.034 | ) | | | (0.014 | ) | | | (0.010 | ) | | | (0.005 | ) |
| | — | | | | — | * | | | — | | | | — | * |
| | | | | | | | | | | | | | | |
| | (0.034 | ) | | | (0.014 | ) | | | (0.010 | ) | | | (0.005 | ) |
| | | | | | | | | | | | | | | |
| $ | 1.00 | | | $ | 1.00 | | | $ | 1.00 | | | $ | 1.00 | |
| | | | | | | | | | | | | | | |
| | 3.41 | % | | | 1.42 | % | | | 0.50 | % | | | 0.50 | % |
| | | | | | | | | | | | | | |
| $ | 12.8 | | | $ | 21.2 | | | $ | 44.8 | | | $ | 103.2 | |
| | | | | | | | | | | | | | |
| | 1.50 | % | | | 1.50 | % | | | 0.72 | % | | | 0.80 | % |
| | 1.79 | % | | | 1.77 | % | | | 1.40 | % | | | 1.42 | % |
| | 3.30 | % | | | 1.25 | % | | | 0.50 | % | | | 0.50 | % |
See Notes to Financial Statements.
| | |
| Dryden Money Market Fund | | 31 |
Financial Highlights
continued
| | | | |
| | | Class M(c) | |
| | | Year Ended
October 31, 2007(b) | |
Per Share Operating Performance: | | | | |
Net Asset Value, Beginning Of Year | | $ | 1.00 | |
| | | | |
Income from investment operations: | | | | |
Net investment income | | | 0.035 | |
Net realized and unrealized gain on investments | | | — | |
| | | | |
Total from investment operations | | | 0.035 | |
| | | | |
Less Dividends and Distributions: | | | | |
Dividends from net investment income | | | (0.035 | ) |
Distributions from net realized gains | | | — | |
| | | | |
Total dividends and distributions | | | (0.035 | ) |
| | | | |
Net asset value, end of year | | $ | 1.00 | |
| | | | |
Total Investment Return(a) | | | 3.57 | % |
Ratios/Supplemental Data: | | | | |
Net assets, end of year (in millions) | | $ | 25.2 | |
Ratios to average net assets: | | | | |
Expenses after advisory fee waiver and expense reimbursement | | | 1.93 | % |
Expenses before advisory fee waiver and expense reimbursement | | | 2.03 | % |
Net investment income | | | 3.51 | % |
| (a) | Total investment return is calculated assuming a purchase of a share on the first day and a sale on the last day of each year reported, and includes reinvestment of dividends and distributions. Total investment returns may reflect adjustments to conform to generally accepted accounting principles. Total return includes the effect of expense subsidies. |
| (b) | Calculations are based on the average daily number of shares outstanding. |
| (c) | Prior to April 12, 2004, Class M shares were known as Class B shares. On April 12, 2004, Class B shares were redesignated as Class M shares. |
| (d) | For the year ended October 31, 2003 the Portfolio Turnover Rate, Ratios of Expenses and Ratios of Net Investment Income represent the combined ratios for the respective Fund and its respective pro rata share of its Master Portfolio. |
| * | Amount is less than $0.005. |
| (t) | Amount is less than 0.005% |
See Notes to Financial Statements.
| | |
| 32 | | Visit our website at www.jennisondryden.com |
| | | | | | | | | | | | | | |
| Class M(c) | |
| Year Ended October 31, | |
| 2006(b) | | | 2005 | | | 2004 | | | 2003(b)(d) | |
| | | | | | | | | | | | | | |
| $ | 1.00 | | | $ | 1.00 | | | $ | 1.00 | | | $ | 1.00 | |
| | | | | | | | | | | | | | | |
| | | | | | | | | | | | | | |
| | 0.029 | | | | 0.009 | | | | — | * | | | — | * |
| | — | | | | — | * | | | — | * | | | — | * |
| | | | | | | | | | | | | | | |
| | 0.029 | | | | 0.009 | | | | — | * | | | — | * |
| | | | | | | | | | | | | | | |
| | | | | | | | | | | | | | |
| | (0.029 | ) | | | (0.009 | ) | | | — | * | | | — | * |
| | — | | | | — | * | | | — | | | | — | * |
| | | | | | | | | | | | | | | |
| | (0.029 | ) | | | (0.009 | ) | | | — | * | | | — | * |
| | | | | | | | | | | | | | | |
| $ | 1.00 | | | $ | 1.00 | | | $ | 1.00 | | | $ | 1.00 | |
| | | | | | | | | | | | | | | |
| | 2.90 | % | | | 0.92 | % | | | 0.00 | % | | | 0.00 | % |
| | | | | | | | | | | | | | |
| $ | 40.6 | | | $ | 60.9 | | | $ | 79.9 | | | $ | 120.2 | |
| | | | | | | | | | | | | | |
| | 2.00 | % | | | 2.00 | % | | | 1.25 | % | | | 1.31 | % |
| | 2.29 | % | | | 2.27 | % | | | 1.91 | % | | | 1.92 | % |
| | 2.84 | % | | | 0.85 | % | | | 0.01 | % | | | — | (t) |
See Notes to Financial Statements.
| | |
| Dryden Money Market Fund | | 33 |
Financial Highlights
continued
| | | | |
| | | Class X | |
| | | Year Ended
October 31, 2007(b) | |
Per Share Operating Performance: | | | | |
Net Asset Value, Beginning Of Year | | $ | 1.00 | |
| | | | |
Income from investment operations: | | | | |
Net investment income | | | 0.035 | |
Net realized and unrealized gain on investments | | | — | |
| | | | |
Total from investment operations | | | 0.035 | |
| | | | |
Less Dividends and Distributions: | | | | |
Dividends from net investment income | | | (0.035 | ) |
Distributions from net realized gains | | | — | |
| | | | |
Total dividends and distributions | | | (0.035 | ) |
| | | | |
Net asset value, end of year | | $ | 1.00 | |
| | | | |
Total Investment Return(a) | | | 3.56 | % |
Ratios/Supplemental Data: | | | | |
Net assets, end of year (in millions) | | $ | 7.3 | |
Ratios to average net assets: | | | | |
Expenses after advisory fee waiver and expense reimbursement | | | 1.93 | % |
Expenses before advisory fee waiver and expense reimbursement | | | 2.03 | % |
Net investment income | | | 3.51 | % |
| (a) | Total investment return is calculated assuming a purchase of a share on the first day and a sale on the last day of each year reported, and includes reinvestment of dividends and distributions. Total investment returns may reflect adjustments to conform to generally accepted accounting principles. Total return includes the effect of expense subsidies. |
| (b) | Calculations are based on the average daily number of shares outstanding. |
| (c) | Total return for Class X shares does not reflect the payment of bonus shares. |
| (d) | For the year ended October 31, 2003 the Portfolio Turnover Rate, Ratios of Expenses and Ratios of Net Investment Income (Loss) represent the combined ratios for the respective Fund and its respective pro rata share of its Master Portfolio. |
| * | Amount is less than $0.005. |
| (t) | Amount is less than 0.005% |
See Notes to Financial Statements.
| | |
| 34 | | Visit our website at www.jennisondryden.com |
| | | | | | | | | | | | | | |
| Class X | |
| Year Ended October 31, | |
| 2006(b) | | | 2005 | | | 2004 | | | 2003(b)(d) | |
| | | | | | | | | | | | | | |
| $ | 1.00 | | | $ | 1.00 | | | $ | 1.00 | | | $ | 1.00 | |
| | | | | | | | | | | | | | | |
| | | | | | | | | | | | | | |
| | 0.029 | | | | 0.009 | | | | — | * | | | — | * |
| | — | | | | — | * | | | — | * | | | — | * |
| | | | | | | | | | | | | | | |
| | 0.029 | | | | 0.009 | | | | — | * | | | — | * |
| | | | | | | | | | | | | | | |
| | | | | | | | | | | | | | |
| | (0.029 | ) | | | (0.009 | ) | | | — | * | | | — | * |
| | — | | | | — | * | | | — | | | | — | * |
| | | | | | | | | | | | | | | |
| | (0.029 | ) | | | (0.009 | ) | | | — | * | | | — | * |
| | | | | | | | | | | | | | | |
| $ | 1.00 | | | $ | 1.00 | | | $ | 1.00 | | | $ | 1.00 | |
| | | | | | | | | | | | | | | |
| | 2.90 | % | | | 0.92 | % | | | 0.00 | %(c) | | | 0.00 | %(c) |
| | | | | | | | | | | | | | |
| $ | 9.0 | | | $ | 13.8 | | | $ | 16.8 | | | $ | 24.9 | |
| | | | | | | | | | | | | | |
| | 2.00 | % | | | 2.00 | % | | | 1.25 | % | | | 1.30 | % |
| | 2.29 | % | | | 2.27 | % | | | 1.91 | % | | | 1.92 | % |
| | 2.83 | % | | | 0.88 | % | | | 0.01 | % | | | — | (t) |
See Notes to Financial Statements.
| | |
| Dryden Money Market Fund | | 35 |
Report of Independent Registered Public
Accounting Firm
The Board of Directors and Shareholders of
Dryden Money Market Fund:
We have audited the accompanying statement of assets and liabilities of Dryden Money Market Fund (hereafter referred to as the “Fund”), including the portfolio of investments, as of October 31, 2007, and the related statement of operations for the year then ended, the statement of changes in net assets for each of the years in the two-year period then ended and the financial highlights for each of the years in the four-year period then ended. These financial statements and financial highlights are the responsibility of the Fund’s management. Our responsibility is to express an opinion on these financial statements and financial highlights based on our audits. The financial highlights for the year ended October 31, 2003 were audited by another independent registered public accounting firm, whose report dated December 22, 2003, expressed an unqualified opinion thereon.
We conducted our audits in accordance with the standards of the Public Company Accounting Oversight Board (United States). Those standards require that we plan and perform the audit to obtain reasonable assurance about whether the financial statements and financial highlights are free of material misstatement. An audit includes examining, on a test basis, evidence supporting the amounts and disclosures in the financial statements. Our procedures included confirmation of securities owned as of October 31, 2007, by correspondence with the custodian and brokers or by other appropriate auditing procedures where replies from brokers were not received. An audit also includes assessing the accounting principles used and significant estimates made by management, as well as evaluating the overall financial statement presentation. We believe that our audits provide a reasonable basis for our opinion.
In our opinion, the financial statements and financial highlights referred to above present fairly, in all material respects, the financial position of the Fund as of October 31, 2007, and the results of its operations for the year then ended, the changes in its net assets for each of the years in the two-year period then ended and the financial highlights for each of the years in the four-year period then ended, in conformity with U.S. generally accepted accounting principles.

New York, New York
December 28, 2007
| | |
| 36 | | Visit our website at www.jennisondryden.com |
Tax Information
(Unaudited)
We are required by the Internal Revenue Code to advise you within 60 days of the Fund’s fiscal year end (October 31, 2007) as to the federal status of dividends paid by the Fund during such fiscal year. Accordingly, we are advising you in the fiscal year ended October 31, 2007, dividends were $0.044 per share for Class A, $0.035 per share for Class C, $0.040 per share for Class D, $0.040 per share for Class L, $0.035 per share for Class M and $0.035 per share for Class X, respectively, which are taxable as ordinary income.
The Fund designates 100% of the ordinary income dividends paid qualify as interest related dividends under the American Jobs Creation Act of 2004.
In January 2008, you will be advised on IRS Form 1099DIV or substitute 1099DIV as to the federal tax status of the dividends received by you in calendar year 2007.
| | |
| Dryden Money Market Fund | | 37 |
Management of the Fund
(Unaudited)
Information pertaining to the Directors of Dryden Money Market Fund (the “Fund”) is set forth below. Directors who are not deemed to be “interested persons” of the Fund, as defined in the Investment Company Act of 1940 (the 1940 Act), are referred to as “Independent Directors.” Directors who are deemed to be “interested persons” of the Fund are referred to as “Interested Directors.” “Fund Complex”† consists of the Fund and any other investment companies managed by PI.
Independent Directors(2)
Linda W. Bynoe (55), Director since 2005(3) Oversees 59 portfolios in Fund complex
Principal occupations (last 5 years): President and Chief Executive Officer (since March 1995) of Telemat, Ltd. (management consulting); formerly Vice President at Morgan Stanley & Co.
Other Directorships held: Director of Simon Property Group, Inc. (real estate investment trust) (since May 2003); Anixter International (communication products distributor) (since January 2006); Director of Northern Trust Corporation (since April 2006).
David E.A. Carson (73), Director since 1993(3) Oversees 63 portfolios in Fund complex
Principal occupations (last 5 years): Director (since October 2007) of ICI Mutual Insurance Company; formerly Chairman and Chief Executive Officer of People’s Bank (1988-2000).
Robert E. La Blanc (73), Director since 2003(3) Oversees 61 portfolios in Fund complex
Principal occupations (last 5 years): President (since 1981) of Robert E. La Blanc Associates, Inc. (telecommunications).
Other Directorships held:(4) Director of CA, Inc. (since 2002) (software company); FiberNet Telecom Group, Inc. (since 2003) (telecom company).
Douglas H. McCorkindale (68), Director since 2003(3) Oversees 59 portfolios in Fund complex
Principal occupations (last 5 years): Formerly Chairman (February 2001-June 2006), Chief Executive Officer (June 2000-July 2005), President (September 1997-July 2005) and Vice Chairman (March 1984-May 2000) of Gannett Co. Inc. (publishing and media).
Other Directorships held:(4) Director of Continental Airlines, Inc. (since May 1993); Director of Lockheed Martin Corp. (aerospace and defense) (since May 2001).
Richard A. Redeker (64), Director since 2003(3) Oversees 60 portfolios in Fund complex
Principal occupations (last 5 years): Management Consultant; Director (since 2001); Director of Penn Tank Lines, Inc. (since 1999).
Robin B. Smith (68), Director since 2003(3) Oversees 61 portfolios in Fund complex
Principal occupations (last 5 years): Chairman of the Board (since January 2003) of Publishers Clearing House (direct marketing); formerly Chairman and Chief Executive Officer (August 1996-January 2003) of Publishers Clearing House.
Other Directorships held:(4) Formerly Director of BellSouth Corporation (1992-2006).
| | |
| 38 | | Visit our website at www.jennisondryden.com |
Stephen G. Stoneburn (64), Director since 2003(3) Oversees 61 portfolios in Fund complex
Principal occupations (last 5 years): President and Chief Executive Officer (since June 1996) of Quadrant Media Corp. (publishing company); formerly President (June 1995-June 1996) of Argus Integrated Media, Inc.; Senior Vice President and Managing Director (January 1993-1995) of Cowles Business Media; Senior Vice President of Fairchild Publications, Inc. (1975-1989).
Clay T. Whitehead (69), Director since 2003(3) Oversees 61 portfolios in Fund complex
Principal occupations (last 5 years): President (since 1983) of YCO (new business development firm).
Interested Directors(1)
Judy A. Rice (59), President since 2003 and Director since 2003(3) Oversees 59 portfolios in Fund complex
Principal occupations (last 5 years): President, Chief Executive Officer, Chief Operating Officer and Officer-In-Charge (since February 2003) of Prudential Investments LLC; Vice President (since February 1999) of Prudential Investment Management Services LLC; President, Chief Executive Officer and Officer-In-Charge (since April 2003) of Prudential Mutual Fund Services LLC; formerly Director (May 2003-March 2006) and Executive Vice President (June 2005-March 2006) of AST Investment Services, Inc.; formerly Executive Vice President (September 1999-February 2003) of Prudential Investments LLC; Member of Board of Governors of the Investment Company Institute.
Robert F. Gunia (60), Vice President since 1999 and Director since 2003(3) Oversees 145 portfolios in Fund complex
Principal occupations (last 5 years): Chief Administrative Officer (since September 1999) and Executive Vice President (since December 1996) of Prudential Investments LLC; President (since April 1999) of Prudential Investment Management Services LLC; Executive Vice President (since March 1999) and Treasurer (since May 2000) of Prudential Mutual Fund Services LLC; Chief Administrative Officer, Executive Vice President and Director (since May 2003) of AST Investment Services, Inc.
Other Directorships held:(4) Vice President and Director (since May 1989) and Treasurer (since 1999) of The Asia Pacific Fund, Inc.
Information pertaining to the Officers of the Funds who are not also Directors is set forth below.
Officers(2)
Kathryn L. Quirk (55), Chief Legal Officer since 2005(3)
Principal occupations (last 5 years): Vice President and Corporate Counsel (since September 2004) of Prudential; Executive Vice President, Chief Legal Officer and Secretary (since July 2005) of Prudential Investments LLC and Prudential Mutual Fund Services LLC; formerly Managing Director, General Counsel, Chief Compliance Officer, Chief Risk Officer and Corporate Secretary (1997-2002) of Zurich Scudder Investments, Inc.
Deborah A. Docs (49), Secretary since 2003(3)
Principal occupations (last 5 years): Vice President and Corporate Counsel (since January 2001) of Prudential; Vice President (since December 1996) and Assistant Secretary (since March 1999) of PI; formerly Vice President and Assistant Secretary (May 2003-June 2005) of AST Investment Services, Inc.
Jonathan D. Shain (49), Assistant Secretary since 2003(3)
Principal occupations (last 5 years): Vice President and Corporate Counsel (since August 1998) of Prudential; Vice President and Assistant Secretary (since May 2001) of PI; Vice President and Assistant Secretary (since February 2001) of PMFS; formerly Vice President and Assistant Secretary (May 2003-June 2005) of AST Investment Services, Inc.
| | |
| Dryden Money Market Fund | | 39 |
Claudia DiGiacomo (33), Assistant Secretary since 2005(3)
Principal occupations (last 5 years): Vice President and Corporate Counsel (since January 2005) of Prudential; Vice President and Assistant Secretary of PI (since December 2005); Associate at Sidley Austin Brown & Wood LLP (1999-2004).
Timothy J. Knierim (48), Chief Compliance Officer since 2007(3)
Principal occupations (last 5 years): Chief Compliance Officer of Prudential Investment Management, Inc. (since July 2007); formerly Chief Risk Officer of PIM and PI (2002-2007) and formerly Chief Ethics Officer of PIM and PI (2006-2007).
Valerie M. Simpson (49), Deputy Chief Compliance Officer since 2007(3)
Principal occupations (last 5 years): Vice President and Senior Compliance Officer (since March 2006) of PI; Vice President-Financial Reporting (since March 2006) for Prudential Life and Annuities Finance.
Grace C. Torres (48), Treasurer and Principal Financial and Accounting Officer since 2003(3)
Principal occupations (last 5 years): Assistant Treasurer (since March 1999) and Senior Vice President (since September 1999) of PI; Assistant Treasurer (since May 2003) and Vice President (since June 2005) of AST Investment Services, Inc.; Senior Vice President and Assistant Treasurer (since May 2003) of Prudential Annuities Advisory Services, Inc.; formerly Senior Vice President (May 2003-June 2005) of AST Investment Services, Inc.
John P. Schwartz (36), Assistant Secretary since 2006(3)
Principal occupations (last 5 years): Vice President and Corporate Counsel (since April 2005) of Prudential; Vice President and Assistant Secretary of PI (since December 2005); Associate at Sidley, Austin Brown & Wood LLP (1997-2005).
M. Sadiq Peshimam (43), Assistant Treasurer since 2006(3)
Principal occupations (last 5 years): Vice President (since 2005) and Director (2000-2005) within Prudential Mutual Fund Administration.
Peter Parrella (49), Assistant Treasurer since 2007(3)
Principal occupations (last 5 years): Vice President (since 2007) and Director (2004-2007) within Prudential Mutual Fund Administration; formerly Tax Manager at SSB Citi Fund Management LLC (1997-2004).
Andrew R. French (44), Assistant Secretary since 2006(3)
Principal occupations (last 5 years): Director and Corporate Counsel (since May 2006) of Prudential; Vice President and Assistant Secretary (since January 2007) of PI; Vice President and Assistant Secretary (since January 2007) of PMFS; formerly Senior Legal Analyst of Prudential Mutual Fund Law Department (1997-2006).
Noreen M. Fierro (43), Anti-Money Laundering Compliance Officer since 2006(3)
Principal occupations (last 5 years): Vice President, Corporate Compliance (since May 2006) of Prudential; formerly Corporate Vice President, Associate General Counsel (April 2002-May 2005) of UBS Financial Services, Inc., in their Money Laundering Prevention Group; Senior Manager (May 2005-May 2006) of Deloitte Financial Advisory Services, LLP, in their Forensic and Dispute Services, Anti-Money Laundering Group.
| | |
| 40 | | Visit our website at www.jennisondryden.com |
† | The Fund Complex consists of all investment companies managed by PI. The Funds for which PI serves as manager include Jennison Dryden Mutual Funds, Strategic Partners Funds, The Prudential Variable Contract Accounts 2, 10, 11. The Target Portfolio Trust, The Prudential Series Fund, The High Yield Income Fund, Inc., The High Yield Plus Fund, Inc., Nicholas-Applegate Fund, Inc., American Skandia Trust, and Prudential’s Gibraltar Fund, Inc. |
(1) | “Interested” Director, as defined in the 1940 Act, by reason of employment with the Manager, a Subadvisor or the Distributor. |
(2) | Unless otherwise noted, the address of the Directors and Officers is c/o: Prudential Investments LLC, Gateway Center Three, 100 Mulberry Street, Newark, NJ 07102. |
(3) | There is no set term of office for Directors and Officers. The Independent Directors have adopted a retirement policy, which calls for the retirement of Directors on December 31 of the year in which they reach the age of 75. The table shows the individual’s length of service as Director and/or Officer. |
(4) | This includes only directorships of companies required to register, or file reports with the SEC under the Securities and Exchange Act of 1934 (that is, “public companies”) or other investment companies registered under the 1940 Act. |
Additional Information about the Directors is included in the Statement of Additional Information which is available without charge, upon request, by calling (800) 521-7466 or (732) 482-7555 (Calling from outside the U.S.)
| | |
| Dryden Money Market Fund | | 41 |
Approval of Advisory Agreements
The Board of Directors (the “Board”) of Strategic Partners Mutual Funds, Inc. oversees the management of the Dryden Money Market Fund (the “Fund”) and, as required by law, determines annually whether to renew the Fund’s management agreement with Prudential Investments LLC (“PI”) and AST Investment Services, Inc. (“ASI,” and together with PI, referred to jointly herein as the “Advisers”) and the Fund’s subadvisory agreement with Prudential Investment Management, Inc. (“PIM”). In considering the renewal of the agreements, the Board, including all of the Independent Directors, met on June 6-7, 2007 and approved the renewal of the agreements through July 31, 2008, after concluding that renewal of the agreements was in the best interests of the Fund and its shareholders.
In advance of the meetings, the Board received materials relating to the agreements, and had the opportunity to ask questions and request further information in connection with their consideration. Among other things, the Board considered comparisons with other mutual funds in relevant Peer Universes and Peer Groups. The mutual funds included in each Peer Universe or Peer Group were objectively determined solely by Lipper Inc., an independent provider of mutual fund data. The comparisons placed the Fund in various quartiles over the one-, three-, and five-year periods ending December 31, 2006, with the first quartile being the best 25% of the mutual funds (for performance, the best performing mutual funds and, for expenses, the lowest cost mutual funds).
In approving the agreements, the Board, including the Independent Directors advised by independent legal counsel, considered the factors they deemed relevant, including the nature, quality and extent of services provided, the performance of the Fund, the profitability of the Advisers and their affiliates, expenses and fees, and the potential for economies of scale that may be shared with the Fund and its shareholders. In their deliberations, the Directors did not identify any single factor, which alone was responsible for the Board’s decision to approve the agreements with respect to the Fund. In connection with their deliberations, the Board considered information provided by the Advisers throughout the year at regular Board meetings, presentations from portfolio managers and other information, as well as information furnished at or in advance of the meetings on June 6-7, 2007.
The Directors determined that the overall arrangements between the Fund and the Advisers, which serve as the Fund’s investment co-managers pursuant to a management agreement, and between the Advisers and PIM, which serves as the Fund’s subadviser pursuant to the terms of a subadvisory agreement with PI, are fair and reasonable in light of the services performed, fees charged and such other matters as the Directors considered relevant in the exercise of their business judgment.
Approval of Advisory Agreements (continued)
The material factors and conclusions that formed the basis for the Directors’ reaching their determinations to approve the continuance of the agreements are separately discussed below.
Nature, quality and extent of services
The Board received and considered information regarding the nature and extent of services provided to the Fund by the Advisers and PIM. The Board considered the services provided by the Advisers, including but not limited to the oversight of the subadviser for the Fund, as well as the provision of fund recordkeeping, compliance, and other services to the Fund. With respect to the Advisers’ oversight of the subadviser, the Board noted that PI’s Strategic Investment Research Group (“SIRG”), which is a business unit of PI, is responsible for monitoring and reporting to the Advisers’ senior management on the performance and operations of the subadviser. The Board also considered that the Advisers pay the salaries of all of the officers and non-independent Directors of the Fund. The Board also considered the investment subadvisory services provided by PIM, as well as adherence to the Fund’s investment restrictions and compliance with applicable Fund policies and procedures. The Board considered the Advisers’ evaluation of the subadviser, as well as PI’s recommendation, based on its review of the subadviser, to renew the subadvisory agreement.
The Board reviewed the qualifications, backgrounds and responsibilities of the Advisers’ senior management responsible for the oversight of the Fund and PIM, and also reviewed the qualifications, backgrounds and responsibilities of the PIM portfolio managers who are responsible for the day-to-day management of the Fund’s portfolio. The Board was provided with information pertaining to the Advisers and PIM’s organizational structure, senior management, investment operations, and other relevant information pertaining to the Advisers and PIM. The Board also noted that it received favorable compliance reports from the Fund’s Chief Compliance Officer (“CCO”) as to each of the Advisers and PIM. The Board noted that PIM is affiliated with PI.
The Board concluded that it was satisfied with the nature, extent and quality of the investment management services provided by the Advisers and the subadvisory services provided to the Fund by PIM, and that there was a reasonable basis on which to conclude that the Fund benefits from the services provided by the Advisers and PIM under the management and subadvisory agreements.
| | |
| | Visit our website at www.jennisondryden.com |
Performance of Dryden Money Market Fund
The Board received and considered information about the Fund’s historical performance. The Board considered that the Fund’s gross performance in relation to its Peer Universe (the Lipper retail Money Market Funds Peer Universe) was in the second quartile over the one-year period, and in the third quartile over the three- and five-year periods. The Board also considered that the Fund’s net performance (which reflects any subsidies, waivers or expense caps) was in the fourth quartile over all periods. The Board further noted that the Fund performed competitively against its Performance Universe Average during the three- and five-year periods, though it underperformed during the one-year period. In reviewing the Fund’s performance, the Board considered that PIM, the Fund’s current subadviser, had assumed responsibility for managing the Fund in late 2006, and that the Fund’s performance for longer periods was not attributable to PIM. The Board concluded that, in light of the recent change in subadvisers, it would be in the interest of the Fund and its shareholders for the Fund to renew the agreements.
Fees and Expenses
The Board considered that the Fund’s contractual and actual management fee (which reflects any subsidies, waivers or expense caps) ranked in the Expense Group’s second quartile. The Board also considered that the Fund’s total expenses ranked in the Expense Group’s fourth quartile. The Board considered the assertion of PI that the fourth quartile ranking for total expenses reflected the Fund’s relatively high transfer agency and custody fees, as well as the fact that the Fund’s relatively small asset size resulted in higher overall expenses as a percentage of Fund assets. The Board accepted the Advisers’ recommendation to continue the existing contractual cap on Fund expenses of 1.00% (exclusive of 12b-1 fees and certain other fees), and to continue the existing contractual management fee waiver of 0.10%. The Board concluded that the management and subadvisory fees are reasonable in light of the services provided.
Costs of Services and Profits Realized by the Advisers
The Board was provided with information on the profitability of the Advisers and their affiliates in serving as the Fund’s investment co-managers. The Board discussed with the Advisers the methodology utilized in assembling the information regarding profitability and considered its reasonableness. The Board recognized that it is difficult to make comparisons of profitability from fund management contracts because comparative information is not generally publicly available and is affected by numerous factors, including the structure of the particular adviser, the types of funds it manages, its business mix, numerous assumptions regarding allocations and the
Approval of Advisory Agreements (continued)
adviser’s capital structure and cost of capital. The Board did not separately consider the profitability of the subadviser, an affiliate of the Advisers, as its profitability was reflected in the profitability report for the Advisers. Taking these factors into account, the Board concluded that the profitability of the Advisers and their affiliates in relation to the services rendered was not unreasonable.
Economies of Scale
The Board received and discussed information concerning whether PI realizes economies of scale as the Fund’s assets grow beyond current levels. The Board noted that the management fee schedule for the Fund includes breakpoints, which have the effect of decreasing the fee rate as assets increase, and that at its current level of assets the Fund’s effective fee rate reflected some of those rate reductions. The Board took note that the Fund’s fee structure currently results in benefits to Fund shareholders whether or not PI realizes any economies of scale.
Other Benefits to the Advisers and PIM
The Board considered potential ancillary benefits that might be received by the Advisers and PIM and their affiliates as a result of their relationship with the Fund. The Board concluded that potential benefits to be derived by the Advisers included brokerage commissions received by affiliates of the Advisers, transfer agency fees received by the Fund’s transfer agent (which is affiliated with the Advisers), and benefits to the reputation as well as other intangible benefits resulting from the Advisers’ association with the Fund. The Board concluded that the potential benefits to be derived by PIM included its ability to use soft dollar credits, brokerage commissions received by affiliates of PIM, as well as the potential benefits consistent with those generally resulting from an increase in assets under management, specifically, potential access to additional research resources and benefits to the reputation. The Board concluded that the benefits derived by the Advisers and PIM were consistent with the types of benefits generally derived by investment managers and subadvisers to mutual funds.
After full consideration of these factors, the Board concluded that the approval of the agreements was in the interest of the Fund and its shareholders.
| | |
| | Visit our website at www.jennisondryden.com |
| | | | |
| n MAIL | | n TELEPHONE | | n WEBSITE |
Gateway Center Three 100 Mulberry Street Newark, NJ 07102 | | (800) 225-1852 | | www.jennisondryden.com |
|
| PROXY VOTING |
| The Board of Directors of the Fund has delegated to the Fund’s investment subadviser the responsibility for voting any proxies and maintaining proxy recordkeeping with respect to the Fund. A description of these proxy voting policies and procedures is available without charge, upon request, by calling (800) 225-1852 or by visiting the Securities and Exchange Commission’s website at www.sec.gov. Information regarding how the Fund voted proxies relating to portfolio securities during the most recent 12-month period ended June 30 is available on the Fund’s website and on the Commission’s website. |
|
| DIRECTORS |
| Linda W. Bynoe • David E.A. Carson • Robert F. Gunia • Robert E. La Blanc • Douglas H. McCorkindale • Richard A. Redeker • Judy A. Rice • Robin B. Smith • Stephen G. Stoneburn • Clay T. Whitehead |
|
| OFFICERS |
| Judy A. Rice, President • Robert F. Gunia, Vice President • Grace C. Torres, Treasurer and Principal Financial and Accounting Officer • Kathryn L. Quirk, Chief Legal Officer • Deborah A. Docs, Secretary • Timothy J. Knierim, Chief Compliance Officer • Valerie M. Simpson, Deputy Chief Compliance Officer • Noreen M. Fierro, Anti-Money Laundering Compliance Officer • Jonathan D. Shain, Assistant Secretary • Claudia DiGiacomo, Assistant Secretary • John P. Schwartz, Assistant Secretary • Andrew R. French, Assistant Secretary • M. Sadiq Peshimam, Assistant Treasurer • Peter Parrella, Assistant Treasurer |
| | | | |
| MANAGER/CO-MANAGERS | | Prudential Investments LLC | | Gateway Center Three
100 Mulberry Street
Newark, NJ 07102 |
|
| | AST Investment
Services, Inc. | | One Corporate Drive
Shelton, CT 06484 |
|
| INVESTMENT SUBADVISER | | Prudential Investment
Management, Inc. | | Gateway Center Two
100 Mulberry Street
Newark, NJ 07102 |
|
| DISTRIBUTORS | | Prudential Annuities
Distributors, Inc. | | One Corporate Drive
Shelton, CT 06484 |
|
| | Prudential Investment
Management
Services LLC | | Gateway Center Three
100 Mulberry Street
Newark, NJ 07102 |
|
| CUSTODIAN | | PFPC Trust Company | | 400 Bellevue Parkway
Wilmington, DE 19809 |
|
| TRANSFER AGENT | | Prudential Mutual Fund
Services LLC | | PO Box 9658
Providence, RI 02940 |
|
| INDEPENDENT REGISTERED PUBLIC ACCOUNTING FIRM | | KPMG LLP | | 345 Park Avenue
New York, NY 10154 |
|
| FUND COUNSEL | | Willkie Farr & Gallagher LLP | | 787 Seventh Avenue
New York, NY 10019 |
|
| An investor should consider the investment objectives, risks, charges, and expenses of the Fund carefully before investing. The prospectus for the Fund contains this and other information about the Fund. An investor may obtain a prospectus by visiting our website at www.jennisondryden.com or by calling (800) 225-1852. The prospectus should be read carefully before investing. |
|
| E-DELIVERY |
| To receive your mutual fund documents on-line, go to www.icsdelivery.com/prudential/funds and enroll. Instead of receiving printed documents by mail, you will receive notification via e-mail when new materials are available. You can cancel your enrollment or change your e-mail address at any time by clicking on the change/cancel enrollment option at the icsdelivery website address. |
|
| SHAREHOLDER COMMUNICATIONS WITH DIRECTORS |
| Shareholders can communicate directly with the Board of Directors by writing to the Chair of the Board, Dryden Money Market Fund, Prudential Investments, Attn: Board of Directors, 100 Mulberry Street, Gateway Center Three, Newark, NJ 07102. Shareholders can communicate directly with an individual Director by writing to the same address. Communications are not screened before being delivered to the addressee. |
|
| AVAILABILITY OF PORTFOLIO SCHEDULE |
| The Fund files its complete schedule of portfolio holdings with the Securities and Exchange Commission for the first and third quarters of each fiscal year on Form N-Q. The Fund’s Forms N-Q are available on the Commission’s website at www.sec.gov. The Fund’s Forms N-Q may also be reviewed and copied at the Commission’s Public Reference Room in Washington, D.C. Information on the operation and location of the Public Reference Room may be obtained by calling (800) SEC-0330 (732-0330). The Fund’s schedule of portfolio holdings is also available on the Fund’s website as of the end of each fiscal quarter. |
|
| The Fund’s Statement of Additional Information contains additional information about the Fund’s Directors and is available without charge, upon request, by calling (800) 225-1852. |
Mutual Funds:
| | | | |
ARE NOT INSURED BY THE FDIC OR ANY
FEDERAL GOVERNMENT AGENCY | | MAY LOSE VALUE | | ARE NOT A DEPOSIT OF OR GUARANTEED BY ANY BANK OR ANY BANK AFFILIATE |

| | | | | | | | | | | | | | | | |
| Dryden Money Market Fund | | | | | | | | | | |
| | | Share Class | | A | | C | | D | | L* | | M** | | X** | | |
| | NASDAQ | | N/A | | ASCXX | | N/A | | AASXX | | ABSXX | | ASXXX | | |
| | CUSIP | | 86277E104 | | 86277E609 | | 86277E302 | | 86277E203 | | 86277E500 | | 86277E708 | | |
| | | | | | | | | | | | | | | | |
*Closed to most new purchases (with the exception of reinvested dividends and purchases by college savings plans) and available for limited exchanges only.
**Closed to most new purchases (with the exception of reinvested dividends) and available for limited exchanges only.
MF201E IFS-A141779 Ed. 12/2007

Item 2 – Code of Ethics – – See Exhibit (a)
As of the end of the period covered by this report, the registrant has adopted a code of ethics (the “Section 406 Standards for Investment Companies – Ethical Standards for Principal Executive and Financial Officers”) that applies to the registrant’s Principal Executive Officer and Principal Financial Officer; the registrant’s Principal Financial Officer also serves as the Principal Accounting Officer.
The registrant hereby undertakes to provide any person, without charge, upon request, a copy of the code of ethics. To request a copy of the code of ethics, contact the registrant 800-225-1852, and ask for a copy of the Section 406 Standards for Investment Companies – Ethical Standards for Principal Executive and Financial Officers.
Item 3 – Audit Committee Financial Expert –
The registrant’s Board has determined that Mr. David E. A. Carson, member of the Board’s Audit Committee is an “audit committee financial expert,” and that he is “independent,” for purposes of this Item.
Item 4 – Principal Accountant Fees and Services –
(a) Audit Fees
For the fiscal years ended October 31, 2007 and October 31, 2006 KPMG LLP (“KPMG”), the Registrant’s principal accountant, billed the Registrant $60,531 and $351,200 respectively, for professional services rendered for the audit of the Registrant’s annual financial statements or services that are normally provided in connection with statutory and regulatory filings.
(b) Audit-Related Fees
None.
(c) Tax Fees
None.
(d) All Other Fees
None.
(e) (1) Audit Committee Pre-Approval Policies and Procedures
THE PRUDENTIAL MUTUAL FUNDS
AUDIT COMMITTEE POLICY
on
Pre-Approval of Services Provided by the Independent Accountants
The Audit Committee of each Prudential Mutual Fund is charged with the responsibility to monitor the independence of the Fund’s independent accountants. As part of this responsibility, the Audit Committee must pre-approve any independent accounting firm’s engagement to render audit and/or permissible non-audit services, as required by law. In evaluating a proposed engagement of the independent accountants, the Audit Committee will assess the effect that the engagement might reasonably be expected to have on the accountant’s independence. The Committee’s evaluation will be based on:
| | • | | a review of the nature of the professional services expected to be provided, |
| | • | | a review of the safeguards put into place by the accounting firm to safeguard independence, and |
| | • | | periodic meetings with the accounting firm. |
Policy for Audit and Non-Audit Services Provided to the Funds
On an annual basis, the scope of audits for each Fund, audit fees and expenses, and audit-related and non-audit services (and fees proposed in respect thereof) proposed to be performed by the Fund’s independent accountants will be presented by the Treasurer and the independent accountants to the Audit Committee for review and, as appropriate, approval prior to the initiation of such services. Such presentation shall be accompanied by confirmation by both the Treasurer and the independent accountants that the proposed services will not adversely affect the independence of the independent accountants. Proposed services shall be described in sufficient detail to enable the Audit Committee to assess the appropriateness of such services and fees, and the compatibility of the provision of such services with the auditor’s independence. The Committee shall receive periodic reports on the progress of the audit and other services which are approved by the Committee or by the Committee Chair pursuant to authority delegated in this Policy.
The categories of services enumerated under “Audit Services”, “Audit-related Services”, and “Tax Services” are intended to provide guidance to the Treasurer and the independent accountants as to those categories of services which the Committee believes are generally consistent with the independence of the independent accountants and which the Committee (or the Committee Chair) would expect upon the presentation of specific proposals to pre-approve. The enumerated categories are not intended as an exclusive list of audit, audit-related or tax services, which the Committee (or the Committee Chair) would consider for pre-approval.
Audit Services
The following categories of audit services are considered to be consistent with the role of the Fund’s independent accountants:
| | • | | Annual Fund financial statement audits |
| | • | | Seed audits (related to new product filings, as required) |
| | • | | SEC and regulatory filings and consents |
Audit-related Services
The following categories of audit-related services are considered to be consistent with the role of the Fund’s independent accountants:
| | • | | Accounting consultations |
| | • | | Fund merger support services |
| | • | | Agreed Upon Procedure Reports |
| | • | | Other Internal Control Reports |
Individual audit-related services that fall within one of these categories and are not presented to the Audit Committee as part of the annual pre-approval process will be subject to pre-approval by the Committee Chair (or any other Committee member on whom this responsibility has been delegated) so long as the estimated fee for those services does not exceed $50,000.
Tax Services
The following categories of tax services are considered to be consistent with the role of the Fund’s independent accountants:
| | • | | Tax compliance services related to the filing or amendment of the following: |
| | • | | Federal, state and local income tax compliance; and, |
| | • | | Sales and use tax compliance |
| | • | | Timely RIC qualification reviews |
| | • | | Tax distribution analysis and planning |
| | • | | Tax authority examination services |
| | • | | Tax appeals support services |
| | • | | Accounting methods studies |
| | • | | Fund merger support services |
| | • | | Tax consulting services and related projects |
Individual tax services that fall within one of these categories and are not presented to the Audit Committee as part of the annual pre-approval process will be subject to pre-approval by the Committee Chair (or any other Committee member on whom this responsibility has been delegated) so long as the estimated fee for those services does not exceed $50,000.
Other Non-audit Services
Certain non-audit services that the independent accountants are legally permitted to render will be subject to pre-approval by the Committee or by one or more Committee members to whom the Committee has delegated this authority and who will report to the full Committee any pre-approval decisions made pursuant to this Policy. Non-audit services presented for pre-approval pursuant to this paragraph will be accompanied by a confirmation from both the Treasurer and the independent accountants that the proposed services will not adversely affect the independence of the independent accountants.
Proscribed Services
The Fund’s independent accountants will not render services in the following categories of non-audit services:
| | • | | Bookkeeping or other services related to the accounting records or financial statements of the Fund |
| | • | | Financial information systems design and implementation |
| | • | | Appraisal or valuation services, fairness opinions, or contribution-in-kind reports |
| | • | | Internal audit outsourcing services |
| | • | | Management functions or human resources |
| | • | | Broker or dealer, investment adviser, or investment banking services |
| | • | | Legal services and expert services unrelated to the audit |
| | • | | Any other service that the Public Company Accounting Oversight Board determines, by regulation, is impermissible. |
Pre-approval of Non-Audit Services Provided to Other Entities Within the Prudential Fund Complex
Certain non-audit services provided to Prudential Investments LLC or any of its affiliates that also provide ongoing services to the Prudential Mutual Funds will be subject to pre-approval by the Audit Committee. The only non-audit services provided to these entities that will require pre-approval are those related directly to the operations and financial reporting of the Funds. Individual projects that are not presented to the Audit Committee as part of the annual pre-approval process will be subject to pre-approval by the Committee Chair (or any other Committee member on whom this responsibility has been delegated) so long as the estimated fee for those services does not exceed $50,000. Services presented for pre-approval pursuant to this paragraph will be accompanied by a confirmation from both the Treasurer and the independent accountants that the proposed services will not adversely affect the independence of the independent accountants.
Although the Audit Committee will not pre-approve all services provided to Prudential Investments LLC and its affiliates, the Committee will receive an annual report from the Fund’s independent accounting firm showing the aggregate fees for all services provided to Prudential Investments and its affiliates.
(e) (2) Percentage of services referred to in 4(b)- (4)(d) that were approved by the audit committee –
Not applicable.
(f) Percentage of hours expended attributable to work performed by other than full time employees of principal accountant if greater than 50%.
Not applicable.
(g) Non-Audit Fees
Not applicable to Registrant for the fiscal years 2007 and 2006. The aggregate non-audit fees billed by KPMG for services rendered to the registrant’s investment adviser and any entity controlling, controlled by, or under common control with the investment adviser that provides ongoing services to the registrant for the fiscal years 2007 and 2006 was $44,700 and $317,300, respectively.
(h) Principal Accountant’s Independence
Not applicable as KPMG has not provided non-audit services to the registrant’s investment adviser and any entity controlling, controlled by, or under common control with the investment adviser that provides ongoing services to the registrant that were not pre-approved pursuant to Rule 2-01(c)(7)(ii) of Regulation S-X.
Item 5 – Audit Committee of Listed Registrants – Not applicable.
Item 6 – Schedule of Investments – The schedule is included as part of the report to shareholders filed under Item 1 of this Form.
Item 7 – Disclosure of Proxy Voting Policies and Procedures for Closed-End Management Investment Companies – Not applicable.
Item 8 – Portfolio Managers of Closed-End Management Investment Companies – Not applicable.
Item 9 – Purchases of Equity Securities by Closed-End Management Investment Company and Affiliated Purchasers – Not applicable.
Item 10 – Submission of Matters to a Vote of Security Holders – Not applicable.
Item 11 – Controls and Procedures
| | (a) | It is the conclusion of the registrant’s principal executive officer and principal financial officer that the effectiveness of the registrant’s current disclosure controls and procedures (such disclosure controls and procedures having been evaluated within 90 days of the date of this filing) provide reasonable assurance that the information required to be disclosed by the registrant has been recorded, processed, summarized and reported within the time period specified in the Commission’s rules and forms and that the information required to be disclosed by the registrant has been accumulated and communicated to the registrant’s principal executive officer and principal financial officer in order to allow timely decisions regarding required disclosure. |
| | (b) | There has been no significant change in the registrant’s internal control over financial reporting that occurred during the registrant’s most recent fiscal quarter of the period covered by this report that has materially affected, or is likely to materially affect, the registrant’s internal control over financial reporting. |
Item 12 – Exhibits
| | | | |
| (a) | | (1) | | Code of Ethics – Attached hereto as Exhibit EX-99.CODE-ETH |
| | |
| | (2) | | Certifications pursuant to Section 302 of the Sarbanes-Oxley Act – Attached hereto as Exhibit EX-99.CERT. |
| | |
| | (3) | | Any written solicitation to purchase securities under Rule 23c-1. – Not applicable. |
| |
| (b) | | Certifications pursuant to Section 906 of the Sarbanes-Oxley Act – Attached hereto as Exhibit EX-99.906CERT. |
SIGNATURES
Pursuant to the requirements of the Securities Exchange Act of 1934 and the Investment Company Act of 1940, the registrant has duly caused this report to be signed on its behalf by the undersigned, thereunto duly authorized.
| | | | |
| (Registrant) Strategic Partners Mutual Funds, Inc. | | |
| | |
| By (Signature and Title)* | | /s/ Deborah A. Docs | | |
| | Deborah A. Docs | | |
| | Secretary | | |
| | |
| Date December 20, 2007 | | | | |
| |
| Pursuant to the requirements of the Securities Exchange Act of 1934 and the Investment Company Act of 1940, this report has been signed below by the following persons on behalf of the registrant and in the capacities and on the dates indicated. | | |
| | |
By (Signature and Title)* | | /s/ Judy A. Rice | | |
| | Judy A. Rice | | |
| | President and Principal Executive Officer | | |
| | |
| Date December 20, 2007 | | | | |
| | |
| By (Signature and Title)* | | /s/ Grace C. Torres | | |
| | Grace C. Torres | | |
| | Treasurer and Principal Financial Officer | | |
| | |
| Date December 20, 2007 | | | | |
* | Print the name and title of each signing officer under his or her signature. |