UNITED STATES
SECURITIES AND EXCHANGE COMMISSION
Washington, D.C. 20549
FORM N-CSR
CERTIFIED SHAREHOLDER REPORT OF REGISTERED
MANAGEMENT INVESTMENT COMPANIES
Investment Company Act file number: 811-08085
Strategic Partners Mutual Funds, Inc.
Exact name of registrant as specified in charter:
Gateway Center 3,
100 Mulberry Street,
Newark, New Jersey 07102
Address of principal executive offices:
Deborah A. Docs
Gateway Center 3,
100 Mulberry Street,
Newark, New Jersey 07102
Name and address of agent for service:
Registrant’s telephone number, including area code: 800-225-1852
Date of fiscal year end: 10/31/2009
Date of reporting period: 10/31/2009
Item 1 – Reports to Stockholders


| | |
| OCTOBER 31, 2009 | | ANNUAL REPORT |
Dryden Mid Cap Value Fund
FUND TYPE
Mid-cap stock
OBJECTIVE
Capital growth
This report is not authorized for distribution to prospective investors unless preceded or accompanied by a current prospectus.
The views expressed in this report and information about the Fund’s portfolio holdings are for the period covered by this report and are subject to change thereafter.
JennisonDryden, Dryden, Prudential Financial and the Rock Prudential logo are registered service marks of The Prudential Insurance Company of America, Newark, NJ, and its affiliates.

December 15, 2009
Dear Shareholder:
On December 11, 2009, the Board of Directors approved the renaming of JennisonDryden, Prudential Financial’s mutual fund family, to Prudential Investments, effective on or about February 16, 2010. As a result of this change, each of our funds will be renamed to feature “Prudential” as part of its new name. The name of your Fund will change from Dryden Mid-Cap Value Fund to Prudential Mid-Cap Value Fund.
While the name of your Fund will change, its investment objectives and portfolio management team will remain the same. No action is required on your part. If you participate in an automatic investment plan, your account will continue to be invested in the Fund under its new name.
Featuring the Prudential name in our Funds will create an immediate connection to the experience and heritage of Prudential, a name recognized by millions for helping people grow and protect their wealth.
On the following pages, you will find your Fund’s annual report, including an analysis of its performance over the fiscal year in addition to other data. If you have questions about this information or the renaming of our mutual fund family, please contact your financial professional or visit our website at www.jennisondryden.com.
Sincerely,

Judy A. Rice, President
Dryden Mid Cap Value Fund
| | |
| Dryden Mid Cap Value Fund | | 1 |
Your Fund’s Performance
Fund objective
The investment objective of the Dryden Mid Cap Value Fund is to seek capital growth. There can be no assurance that the Fund will achieve its investment objective.
Performance data quoted represent past performance. Past performance does not guarantee future results. The investment return and principal value of an investment will fluctuate, so that an investor’s shares, when redeemed, may be worth more or less than their original cost. Current performance may be lower or higher than the past performance data quoted. An investor may obtain performance data as of the most recent month-end by visiting our website at www.jennisondryden.com or by calling (800) 225-1852. Class A and Class L shares have a maximum initial sales charge of 5.50% and 5.75%, respectively. Gross operating expenses: Class A, 1.77%; Class B, 2.47%; Class C, 2.47%; Class L, 1.97%; Class M, 1.72%; Class X, 1.72%; Class Z, 1.47%. Net operating expenses apply to: Class A, 1.72%; Class B, 2.47%; Class C, 2.47%; Class L, 1.97%; Class M, 1.72%; Class X, 1.72%; Class Z, 1.47%, after contractual reduction through 2/28/2011.
| | | | | | | | | | | |
| Cumulative Total Returns as of 10/31/09 | | | | | | |
| | | One Year | | | Five Years | | | Ten Years | | | Since Inception1 |
Class A2 | | 20.16 | % | | 10.18 | % | | N/A | | | 12.57% (4/12/04) |
Class B3 | | 19.44 | | | 6.19 | | | N/A | | | 7.98 (4/12/04) |
Class C | | 19.21 | | | 6.04 | | | 81.36 | % | | — |
Class L2 | | 19.75 | | | 8.63 | | | 90.51 | | | — |
Class M3 | | 20.42 | | | 8.07 | | | 84.85 | | | — |
Class X | | 20.15 | | | 9.84 | | | 87.81 | | | — |
Class Z | | 20.41 | | | N/A | | | N/A | | | –9.05 (11/28/05) |
Russell Midcap Value Index4 | | 14.52 | | | 10.71 | | | 89.37 | | | * |
Russell Midcap Index5 | | 18.75 | | | 12.56 | | | 64.22 | | | ** |
S&P MidCap 400 Index6 | | 18.18 | | | 17.26 | | | 86.82 | | | *** |
Lipper Average7 | | 18.89 | | | 9.86 | | | 92.45 | | | **** |
| | | | | | | | | | | |
| Average Annual Total Returns8 as of 9/30/09 | | | | | | |
| | | One Year | | | Five Years | | | Ten Years | | | Since Inception1 |
Class A2 | | –7.15 | % | | 1.73 | % | | N/A | | | 1.87% (4/12/04) |
Class B3 | | –7.27 | | | 2.01 | | | N/A | | | 2.06 (4/12/04) |
Class C | | –3.44 | | | 2.10 | | | 6.81 | % | | — |
Class L2 | | –7.76 | | | 1.38 | | | 6.69 | | | — |
Class M3 | | –7.13 | | | 2.27 | | | 7.00 | | | — |
Class X | | –7.37 | | | 2.50 | | | 7.17 | | | — |
Class Z | | –1.57 | | | N/A | | | N/A | | | –1.44 (11/28/05) |
Russell Midcap Value Index4 | | –7.12 | | | 3.53 | | | 7.43 | | | * |
Russell Midcap Index5 | | –3.55 | | | 3.89 | | | 6.05 | | | ** |
S&P MidCap 400 Index6 | | –3.11 | | | 4.53 | | | 7.48 | | | *** |
Lipper Average7 | | –2.45 | | | 2.98 | | | 7.11 | | | **** |
| | |
| 2 | | Visit our website at www.jennisondryden.com |
The cumulative total returns do not reflect the deduction of applicable sales charges. If reflected, the applicable sales charges would reduce the cumulative total return performance quoted. Class A and Class L shares are subject to a maximum front-end sales charge of 5.50% and 5.75%, respectively. Class L shares are closed to most new purchases (with the exception of reinvested dividends and purchases by certain college savings plans). Class M and Class X shares are also closed to most new purchases (with the exception of reinvested dividends). Class L, Class M, and Class X shares are exchangeable only with Class L, Class M, and Class X shares, respectively, offered by the other JennisonDryden Funds. Under certain circumstances, Class A and Class L shares may be subject to a contingent deferred sales charge (CDSC) of 1%. Class B, Class C, Class M, and Class X shares are subject to a maximum CDSC of 5%, 1%, 6%, and 6%, respectively.
Source: Prudential Investments LLC and Lipper Inc. Performance figures may reflect fee waivers and/or expense reimbursements. In the absence of such fee waivers and/or expense reimbursements, total returns would be lower.
1Inception returns are provided for any share class with less than 10 calendar years of returns.
2Prior to April 12, 2004, Class L shares were known as Class A shares. On April 12, 2004, Class A shares were redesignated as Class L shares and a new Class A was opened.
3Prior to April 12, 2004, Class M shares were known as Class B shares. On April 12, 2004, Class B shares were redesignated as Class M shares and a new Class B was opened.
4The Russell Midcap Value Index measures the performance of those Russell Midcap companies with lower price-to-book ratios and lower forecasted growth values. The stocks are also members of the Russell 1000 Value Index.
5The Russell Midcap Index measures the performance of the 800 smallest companies in the Russell 1000 Index, which represent approximately 25% of the total market capitalization of the Russell 1000 Index.
6The Standard & Poor’s MidCap 400 Stock Index (S&P MidCap 400 Index) is an unmanaged index of 400 domestic stocks chosen for market size, liquidity, and industry group representation. It gives a broad look at how U.S. mid-cap stock prices have performed.
7Funds in the Lipper Mid-Cap Value Funds Average (Lipper Average), by portfolio practice, invest at least 75% of their equity assets in companies with market capitalizations (on a three-year weighted basis) less than 300% of the dollar-weighted median market capitalization of the middle 1,000 securities of the S&P SuperComposite 1500 Index. Mid-cap value funds typically have a below-average price-to-earnings ratio, price-to-book ratio, and three-year sales-per-share growth value compared with the companies in the S&P MidCap 400 Index.
8The average annual total returns take into account applicable sales charges. The returns in the tables do not reflect the deduction of taxes that a shareholder would pay on Fund distributions or following the redemption of Fund shares. Without a distribution and service (12b-1) fee waiver of 0.05% for Class A shares, the returns would have been lower. Class A shares are subject to a 12b-1 fee of up to 0.30% annually. Class B, Class C, Class M, and Class X shares are subject to a 12b-1 fee of 1.00%. Class L shares are subject to a 12b-1 fee of 0.50%.
*Russell Midcap Value Index Closest Month-End to Inception cumulative total returns as of 10/31/09 are 17.23% for Class A and Class B; and –10.52% for Class Z. Russell Midcap Value Index Closest Month-End to Inception average annual total returns as of 9/30/09 are 3.85% for Class A and Class B; and –1.61% for Class Z.
**Russell Midcap Index Closest Month-End to Inception cumulative total returns as of 10/31/09 are 16.36% for Class A and Class B; and –8.73% for Class Z. Russell Midcap Index Closest Month-End to Inception average annual total returns as of 9/30/09 are 3.64% for Class A and Class B; and –1.20% for Class Z.
| | |
| Dryden Mid Cap Value Fund | | 3 |
Your Fund’s Performance (continued)
***S&P MidCap 400 Index Closest Month-End to Inception cumulative total returns as of 10/31/09 are 17.77% for Class A and Class B; and –4.98% for Class Z. S&P MidCap 400 Index Closest Month-End to Inception average annual total returns as of 9/30/09 are 3.89% for Class A and Class B; and –0.12% for Class Z.
****Lipper Average Closest Month-End to Inception cumulative total returns as of 10/31/09 are 13.54% for Class A and Class B; and –8.95% for Class Z. Lipper Average Closest Month-End to Inception average annual total returns as of 9/30/09 are 3.05% for Class A and Class B; and –1.42% for Class Z.
Investors cannot invest directly in an index. The returns for the Russell Midcap Value Index, the Russell Midcap Index, and the S&P MidCap 400 Index would be lower if they included the effects of sales charges, operating expenses of a mutual fund, or taxes. Returns for the Lipper Average reflect the deduction of operating expenses, but not sales charges or taxes.
| | | |
| Five Largest Holdings expressed as a percentage of net assets as of 10/31/09 | | | |
CenturyTel, Inc., Diversified Telecommunication Services | | 1.3 | % |
Edison International, Electric Utilities | | 1.2 | |
Computer Sciences Corp., IT Services | | 1.1 | |
Safeway, Inc., Foods & Staples Retailing | | 1.1 | |
Xcel Energy, Inc., Multi-Utilities | | 1.0 | |
Holdings reflect only long-term investments and are subject to change.
| | |
| 4 | | Visit our website at www.jennisondryden.com |
Strategy and Performance Overview
How did the Fund perform?
The Dryden Mid-Cap Value Fund Class A shares returned 20.16% for the 12-month reporting period ended October 31, 2009, outperforming the 14.52% return of the Russell Midcap® Value Index (the Index) and the 18.89% return of the Lipper Mid-Cap Value Funds Average.
How is the Fund managed?
Quantitative Management Associates LLC (QMA) manages the Fund, which invests in a diversified portfolio of stocks that are out of favor and inexpensive based on price-to-earnings ratios and other value measures. Historically, value stocks have outperformed broad stock market averages. Constraints are placed on the portfolio with regard to sector, industry, and individual security weighting to reduce risk relative to the Index.
What were conditions like in the U.S. stock market?
Conditions in the U.S. stock market deteriorated sharply, then improved markedly during the reporting period that began November 1, 2008. Initially, stock prices repeatedly came under pressure as a bursting housing bubble in the United States kept pushing up foreclosures on residential mortgages, the economy continued to rapidly shed jobs, and businesses and consumers tightened their belts. Many financial institutions in the United States and abroad continued to take write downs and losses on debt securities linked to the troubled home loans.
The Federal Reserve (the Fed) and the U.S. Department of the Treasury took unusual steps to steady the nation’s financial system and stimulate its economy. For example, the Fed, which had tried to boost growth earlier in 2008 by repeatedly easing monetary policy, cut its target for the overnight bank lending rate in December 2008 from 1.00% to a record low range of zero to 0.25%. The Fed also purchased federal agency debt securities, mortgage-backed securities of federal agencies, and U.S. Treasury securities to support mortgage lending, aid housing markets, and improve overall conditions in the private credit markets. The federal government implemented stimulus programs such as “cash for clunkers” to encourage consumers to purchase automobiles and a tax credit for first-time home buyers to help boost home sales.
Stock prices began to rally during March 2009 and continued to soar for most of the remainder of the reporting period as it became clear the U.S. economy was starting to grow again. Government data showed the economy expanded during the July-September period after contracting for the previous four quarters. Not surprisingly, rising sales of houses and autos, along with government spending, accounted for much of that growth.
| | |
| Dryden Mid Cap Value Fund | | 5 |
Strategy and Performance Overview (continued)
Doubts about the economy, among other factors, caused the stock market to post a loss for the month of October 2009, but the Index still scored a double-digit gain for the reporting period. Among small, medium, and large companies, growth stocks (shares of firms expected to continue to generate faster-than-average earnings growth) handily outperformed value stocks, according to the Russell family of U.S. stock indexes.
How did the various sectors of mid-cap value stocks perform?
All sectors of the Index ended the reporting period in positive territory, with the exception of financials, which finished with a single-digit loss. The top four performers—consumer discretionary, information technology, healthcare, and telecommunication services—posted gains of more than 30%. The consumer staples, energy, materials, and industrials sectors scored smaller double-digit gains. The remaining sector, utilities, turned in a single-digit gain for the reporting period.
What aspects of sector allocation and stock selection contributed most to the return?
The Fund outperformed the Index primarily due to prudent stock selection in the troubled financials sector and, to a lesser extent, because it had a smaller exposure to the sector than the Index. Favorable stock selection in the materials, consumer staples, and industrials sectors also aided the Fund’s relative performance. For example, the Fund avoided shares of insurance brokers Marsh & McLennan and Aon Corp., two heavily weighted names in the Index that posted declines for the year ended October 31, 2009. Earnings of insurance brokers were disappointing due to declining demand for consulting services, ongoing pressure on commission rates, and continued erosion in pricing.
In other areas of the financials sector, the performance of real estate investment trusts (REITs) was generally flat for the reporting period. However, two key contributors to the Fund were its purchases of Hospitality Properties, a hotel REIT, and SL Green Realty, an owner and operator of office buildings in New York City. Their shares gained sharply during the time they were held by the Fund. Both benefited from deleveraging their balance sheets. Other notably beneficial decisions included not holding shares of Regions Financial and KeyCorp, both of which declined. The two regional banks are burdened by above-average exposure to commercial real estate and construction loans. Both reported sharply higher credit costs and above-average increases in nonperforming loans during the period.
Strong stock selection in the materials sector also helped the Fund outperform the Index. An overweight exposure to Celanese Corp., a manufacturer of industrial chemicals whose stock nearly doubled during the reporting period, was the single
| | |
| 6 | | Visit our website at www.jennisondryden.com |
largest contributor to the Fund’s performance in this sector. Despite weaker-than-expected revenues, the company’s earnings have exceeded investor expectations due to lower energy and raw material costs and favorable geographic exposure, especially to China. Freeport McMoran, a copper and gold mining firm, was an especially strong performer among metals and mining stocks. Freeport’s stock soared while it was held by the Fund, largely driven by the strength in metals prices, particularly copper.
Favorable selection in consumer staples also aided the Fund’s performance. Among positions in beverage stocks, soft-drink bottlers were stand-out performers, especially Coca-Cola Enterprises, PepsiAmericas, and Pepsi Bottling Group. Although soft-drink volumes declined over the period, strong pricing helped drive earnings growth. Del Monte Foods was another strong performer for the Fund. The company’s earnings, driven largely by price increases and lower energy, soybean, and other input costs, continued to exceed investor expectations.
In the industrials sector, the Fund was helped by strong rebounds in a number of machinery stocks. Some of the more prominent names included Crane, Timken, and Paccar. Each of these stocks was hit hard early in the period, as investors were concerned about the impact of the recession on their operating results.
What aspects of sector allocation and stock selection subtracted most from the return?
Poor issue selection in the consumer discretionary and healthcare sectors was the primary detractor from the Fund’s performance. Among consumer discretionary stocks, the single largest detractor from the Fund’s return was its failure to own Ford Motor shares, which gained dramatically. Ford stock rebounded sharply after investors became more optimistic about the automaker’s competitive position relative to General Motors Corporation and Chrysler Corporation, its successful debt restructuring, and the potential bottoming in the U.S. economy. Among media stocks, not holding Virgin Media and Liberty Media also penalized the Fund’s performance as shares of both firms rose strongly.
In the healthcare sector, the Fund had a larger exposure than the Index to Hill-Rom Holdings, a medical technology and service provider whose stock posted a decline for the reporting period. Failure to own Hospira, a pharmaceutical manufacturer specializing in injectable drugs, also hurt the Fund’s performance. Hospira stock gained sharply during the reporting period, as its earnings consistently exceeded investor expectations.
| | |
| Dryden Mid Cap Value Fund | | 7 |
Fees and Expenses (Unaudited)
As a shareholder of the Fund, you incur two types of costs: (1) transaction costs, including sales charges (loads) on purchase payments and redemptions, as applicable, and (2) ongoing costs, including management fees, distribution and/or service (12b-1) fees, and other Fund expenses, as applicable. This example is intended to help you understand your ongoing costs (in dollars) of investing in the Fund and to compare these costs with the ongoing costs of investing in other mutual funds.
The example is based on an investment of $1,000 invested on May 1, 2009, at the beginning of the period, and held through the six-month period ended October 31, 2009. The example is for illustrative purposes only; you should consult the Prospectus for information on initial and subsequent minimum investment requirements.
The Fund’s transfer agent may charge additional fees to holders of certain accounts that are not included in the expenses shown in the table on the following page. These fees apply to individual retirement accounts (IRAs) and Section 403(b) accounts. As of the close of the six-month period covered by the table, IRA fees included an annual maintenance fee of $15 per account (subject to a maximum annual maintenance fee of $25 for all accounts held by the same shareholder). Section 403(b) accounts are charged an annual $25 fiduciary maintenance fee. Some of the fees may vary in amount, or may be waived, based on your total account balance or the number of JennisonDryden funds, including the Fund, that you own. You should consider the additional fees that were charged to your Fund account over the six-month period when you estimate the total ongoing expenses paid over the period and the impact of these fees on your ending account value, as these additional expenses are not reflected in the information provided in the expense table. Additional fees have the effect of reducing investment returns.
Actual Expenses
The first line for each share class in the table on the following page provides information about actual account values and actual expenses. You may use the information on this line, together with the amount you invested, to estimate the expenses that you paid over the period. Simply divide your account value by $1,000 (for example, an $8,600 account value ÷ $1,000 = 8.6), then multiply the result by the number on the first line under the heading “Expenses Paid During the Six-Month Period” to estimate the expenses you paid on your account during this period.
Hypothetical Example for Comparison Purposes
The second line for each share class in the table on the following page provides information about hypothetical account values and hypothetical expenses based on the Fund’s actual expense ratio and an assumed rate of return of 5% per year before expenses, which is not the Fund’s actual return. The hypothetical account values and
| | |
| 8 | | Visit our website at www.jennisondryden.com |
expenses may not be used to estimate the actual ending account balance or expenses you paid for the period. You may use this information to compare the ongoing costs of investing in the Fund and other funds. To do so, compare this 5% hypothetical example with the 5% hypothetical examples that appear in the shareholder reports of the other funds.
Please note that the expenses shown in the table are meant to highlight your ongoing costs only and do not reflect any transactional costs such as sales charges (loads). Therefore, the second line for each share class in the table is useful in comparing ongoing costs only and will not help you determine the relative total costs of owning different funds. In addition, if these transactional costs were included, your costs would have been higher.
| | | | | | | | | | | | | | |
Dryden Mid Cap
Value Fund | | Beginning Account
Value
May 1, 2009 | | Ending Account
Value
October 31, 2009 | | Annualized
Expense Ratio
Based on the
Six-Month Period | | | Expenses Paid
During the
Six-Month Period* |
| | | | | | | | | | | | | | |
| Class A | | Actual | | $ | 1,000.00 | | $ | 1,235.50 | | 1.61 | % | | $ | 9.07 |
| | | Hypothetical | | $ | 1,000.00 | | $ | 1,017.09 | | 1.61 | % | | $ | 8.19 |
| | | | | | | | | | | | | | |
| Class B | | Actual | | $ | 1,000.00 | | $ | 1,232.10 | | 2.36 | % | | $ | 13.28 |
| | | Hypothetical | | $ | 1,000.00 | | $ | 1,013.31 | | 2.36 | % | | $ | 11.98 |
| | | | | | | | | | | | | | |
| Class C | | Actual | | $ | 1,000.00 | | $ | 1,229.90 | | 2.36 | % | | $ | 13.26 |
| | | Hypothetical | | $ | 1,000.00 | | $ | 1,013.31 | | 2.36 | % | | $ | 11.98 |
| | | | | | | | | | | | | | |
| Class L | | Actual | | $ | 1,000.00 | | $ | 1,234.90 | | 1.86 | % | | $ | 10.48 |
| | | Hypothetical | | $ | 1,000.00 | | $ | 1,015.83 | | 1.86 | % | | $ | 9.45 |
| | | | | | | | | | | | | | |
| Class M | | Actual | | $ | 1,000.00 | | $ | 1,236.30 | | 1.61 | % | | $ | 9.08 |
| | | Hypothetical | | $ | 1,000.00 | | $ | 1,017.09 | | 1.61 | % | | $ | 8.19 |
| | | | | | | | | | | | | | |
| Class X | | Actual | | $ | 1,000.00 | | $ | 1,236.10 | | 1.61 | % | | $ | 9.07 |
| | | Hypothetical | | $ | 1,000.00 | | $ | 1,017.09 | | 1.61 | % | | $ | 8.19 |
| | | | | | | | | | | | | | |
| Class Z | | Actual | | $ | 1,000.00 | | $ | 1,237.90 | | 1.36 | % | | $ | 7.67 |
| | | Hypothetical | | $ | 1,000.00 | | $ | 1,018.35 | | 1.36 | % | | $ | 6.92 |
* Fund expenses (net of fee waivers or subsidies, if any) for each share class are equal to the annualized expense ratio for each share class (provided in the table), multiplied by the average account value over the period, multiplied by the 184 days in the six-month period ended October 31, 2009, and divided by the 365 days in the Fund’s fiscal year ended October 31, 2009 (to reflect the six-month period). Expenses presented in the table include the expenses of any underlying portfolios in which the Fund may invest.
| | |
| Dryden Mid Cap Value Fund | | 9 |
Portfolio of Investments
as of October 31, 2009
| | | | | |
| | | Shares | | Value (Note 2) |
LONG-TERM INVESTMENTS 98.7% | | | | | |
| | |
COMMON STOCKS | | | | | |
Aerospace & Defense 0.4% | | | | | |
L-3 Communications Holdings, Inc. | | 6,700 | | $ | 484,343 |
| | | | | |
Auto Components 0.5% | | | | | |
Autoliv, Inc. | | 19,200 | | | 644,736 |
| | | | | |
Automobiles 0.2% | | | | | |
Harley-Davidson, Inc.(a) | | 9,800 | | | 244,216 |
| | | | | |
Beverages 1.3% | | | | | |
Coca-Cola Enterprises, Inc. | | 44,800 | | | 854,336 |
Constellation Brands, Inc. (Class A Stock)* | | 60,800 | | | 961,856 |
| | | | | |
| | | | | 1,816,192 |
| | | | | |
Building Products 0.2% | | | | | |
Masco Corp.(a) | | 22,500 | | | 264,375 |
| | | | | |
Capital Markets 1.8% | | | | | |
Ameriprise Financial, Inc. | | 38,300 | | | 1,327,861 |
Investment Technology Group, Inc.* | | 23,500 | | | 506,895 |
Raymond James Financial, Inc.(a) | | 24,800 | | | 585,528 |
| | | | | |
| | | | | 2,420,284 |
| | | | | |
Chemicals 2.8% | | | | | |
Ashland, Inc. | | 14,100 | | | 487,014 |
Cabot Corp. | | 17,800 | | | 390,354 |
Celanese Corp. (Class A Stock) | | 14,600 | | | 400,770 |
Cytec Industries, Inc.(a) | | 20,600 | | | 683,302 |
Eastman Chemical Co. | | 21,200 | | | 1,113,212 |
PPG Industries, Inc. | | 13,800 | | | 778,734 |
| | | | | |
| | | | | 3,853,386 |
| | | | | |
Commercial Banks 3.7% | | | | | |
Associated Banc-Corp. | | 47,200 | | | 604,632 |
Bank of Hawaii Corp.(a) | | 13,600 | | | 603,840 |
City National Corp. | | 15,600 | | | 587,652 |
Comerica, Inc.(a) | | 29,500 | | | 818,625 |
Commerce Bancshares, Inc. | | 16,096 | | | 617,443 |
M&T Bank Corp.(a) | | 13,500 | | | 848,475 |
TCF Financial Corp. | | 44,800 | | | 529,984 |
Wilmington Trust Corp. | | 20,300 | | | 244,615 |
Zions Bancorp(a) | | 17,000 | | | 240,720 |
| | | | | |
| | | | | 5,095,986 |
| | | | | |
See Notes to Financial Statements.
| | |
| Dryden Mid Cap Value Fund | | 11 |
Portfolio of Investments
as of October 31, 2009 continued
| | | | | |
| | | Shares | | Value (Note 2) |
COMMON STOCKS (Continued) | | | | | |
Commercial Services & Supplies 3.0% | | | | | |
Avery Dennison Corp. | | 23,400 | | $ | 834,210 |
Brink’s Co. (The) | | 14,800 | | | 351,204 |
Cintas Corp. | | 27,200 | | | 753,168 |
HNI Corp.(a) | | 17,400 | | | 457,968 |
Pitney Bowes, Inc. | | 37,800 | | | 926,100 |
RR Donnelley & Sons Co. | | 42,100 | | | 845,368 |
| | | | | |
| | | | | 4,168,018 |
| | | | | |
Communications Equipment 0.3% | | | | | |
CommScope, Inc.* | | 17,000 | | | 459,340 |
| | | | | |
Computers & Peripherals 1.8% | | | | | |
Lexmark International, Inc. (Class A Stock)* | | 32,900 | | | 838,950 |
NCR Corp.* | | 24,900 | | | 252,735 |
Seagate Technology (Cayman Islands) | | 38,300 | | | 534,285 |
Western Digital Corp.*(a) | | 25,700 | | | 865,576 |
| | | | | |
| | | | | 2,491,546 |
| | | | | |
Consumer Finance 0.8% | | | | | |
AmeriCredit Corp.*(a) | | 26,400 | | | 465,960 |
Discover Financial Services | | 46,700 | | | 660,338 |
| | | | | |
| | | | | 1,126,298 |
| | | | | |
Containers & Packaging 1.2% | | | | | |
Bemis Co., Inc. | | 7,600 | | | 196,308 |
Sealed Air Corp. | | 40,400 | | | 776,892 |
Sonoco Products Co. | | 22,900 | | | 612,575 |
| | | | | |
| | | | | 1,585,775 |
| | | | | |
Diversified Telecommunication Services 2.0% | | | | | |
CenturyTel, Inc.(a) | | 54,691 | | | 1,775,270 |
Frontier Communications Corp. | | 38,300 | | | 274,611 |
Windstream Corp. | | 67,800 | | | 653,592 |
| | | | | |
| | | | | 2,703,473 |
| | | | | |
Electric Utilities 2.4% | | | | | |
Allegheny Energy, Inc. | | 10,200 | | | 232,764 |
American Electric Power Co., Inc. | | 24,700 | | | 746,434 |
Edison International | | 50,000 | | | 1,591,000 |
Great Plains Energy, Inc. | | 31,600 | | | 546,680 |
NV Energy, Inc. | | 12,700 | | | 145,542 |
| | | | | |
| | | | | 3,262,420 |
| | | | | |
See Notes to Financial Statements.
| | |
| 12 | | Visit our website at www.jennisondryden.com |
| | | | | |
| | | Shares | | Value (Note 2) |
COMMON STOCKS (Continued) | | | |
Electrical Equipment 1.7% | | | | | |
General Cable Corp.*(a) | | 13,200 | | $ | 411,048 |
Hubbell, Inc. (Class B Stock) | | 13,000 | | | 552,890 |
Rockwell Automation, Inc.(a) | | 23,200 | | | 950,040 |
Thomas & Betts Corp.* | | 13,500 | | | 461,835 |
| | | | | |
| | | | | 2,375,813 |
| | | | | |
Electronic Equipment & Instruments 2.8% | | | | | |
Arrow Electronics, Inc.* | | 28,800 | | | 729,792 |
Avnet, Inc.* | | 36,500 | | | 904,470 |
Ingram Micro, Inc. (Class A Stock)* | | 47,000 | | | 829,550 |
Jabil Circuit, Inc. | | 46,700 | | | 624,846 |
Tech Data Corp.* | | 15,400 | | | 591,822 |
Vishay Intertechnology, Inc.* | | 27,200 | | | 169,456 |
| | | | | |
| | | | | 3,849,936 |
| | | | | |
Energy Equipment & Services 5.5% | | | | | |
BJ Services Co. | | 48,900 | | | 938,880 |
ENSCO International, Inc. | | 19,700 | | | 902,063 |
Helix Energy Solutions Group, Inc.* | | 35,200 | | | 483,296 |
Helmerich & Payne, Inc.(a) | | 13,700 | | | 520,874 |
Nabors Industries Ltd. (Bermuda)*(a) | | 45,600 | | | 949,848 |
Oil States International, Inc.*(a) | | 8,100 | | | 278,964 |
Patterson-UTI Energy, Inc.(a) | | 34,600 | | | 539,068 |
Pride International, Inc.*(a) | | 10,000 | | | 295,600 |
Rowan Cos., Inc.(a) | | 23,500 | | | 546,375 |
SEACOR Holdings, Inc.*(a) | | 7,700 | | | 625,779 |
Superior Energy Services, Inc.* | | 23,600 | | | 509,996 |
Tidewater, Inc. | | 14,600 | | | 608,382 |
Unit Corp.* | | 7,500 | | | 293,100 |
| | | | | |
| | | | | 7,492,225 |
| | | | | |
Exchange Traded Fund 0.3% | | | | | |
iShares Russell Midcap Value Index Fund | | 12,100 | | | 407,044 |
| | | | | |
Food & Staples Retailing 2.0% | | | | | |
Kroger Co. (The) | | 21,000 | | | 485,730 |
Safeway, Inc. | | 67,800 | | | 1,513,974 |
SUPERVALU, Inc. | | 48,300 | | | 766,521 |
| | | | | |
| | | | | 2,766,225 |
| | | | | |
Food Products 1.9% | | | | | |
Bunge Ltd. (Bermuda)(a) | | 22,300 | | | 1,272,438 |
Dean Foods Co.* | | 2,900 | | | 52,867 |
See Notes to Financial Statements.
| | |
| Dryden Mid Cap Value Fund | | 13 |
Portfolio of Investments
as of October 31, 2009 continued
| | | | | |
| | | Shares | | Value (Note 2) |
COMMON STOCKS (Continued) | | | |
Food Products (cont’d.) | | | | | |
Del Monte Foods Co. | | 61,300 | | $ | 662,040 |
Sara Lee Corp. | | 49,600 | | | 559,984 |
| | | | | |
| | | | | 2,547,329 |
| | | | | |
Gas Utilities 2.6% | | | | | |
Atmos Energy Corp. | | 33,300 | | | 927,405 |
Energen Corp. | | 21,500 | | | 943,420 |
ONEOK, Inc. | | 10,100 | | | 365,721 |
Questar Corp. | | 24,600 | | | 980,064 |
UGI Corp. | | 14,100 | | | 336,708 |
| | | | | |
| | | | | 3,553,318 |
| | | | | |
Healthcare Equipment & Supplies 0.8% | | | | | |
Hill-Rom Holdings, Inc.(a) | | 26,200 | | | 513,258 |
Kinetic Concepts, Inc.*(a) | | 19,200 | | | 637,248 |
| | | | | |
| | | | | 1,150,506 |
| | | | | |
Healthcare Providers & Services 4.2% | | | | | |
Aetna, Inc. | | 12,700 | | | 330,581 |
CIGNA Corp. | | 45,500 | | | 1,266,720 |
Community Health Systems, Inc.* | | 20,400 | | | 638,112 |
Coventry Health Care, Inc.* | | 34,800 | | | 690,084 |
Health Net, Inc.* | | 18,800 | | | 280,308 |
Humana, Inc.* | | 10,400 | | | 390,832 |
LifePoint Hospitals, Inc.*(a) | | 26,500 | | | 750,745 |
Lincare Holdings, Inc.*(a) | | 21,400 | | | 672,174 |
Omnicare, Inc.(a) | | 33,900 | | | 734,613 |
| | | | | |
| | | | | 5,754,169 |
| | | | | |
Healthcare Technology 0.5% | | | | | |
IMS Health, Inc. | | 43,600 | | | 714,604 |
| | | | | |
Hotels, Restaurants & Leisure 2.2% | | | | | |
Brinker International, Inc. | | 33,000 | | | 417,120 |
Carnival Corp. (Panama) | | 10,200 | | | 297,024 |
Darden Restaurants, Inc. | | 17,600 | | | 533,456 |
International Speedway Corp. (Class A Stock) | | 17,400 | | | 443,874 |
Royal Caribbean Cruises Ltd. (Liberia)*(a) | | 30,400 | | | 614,992 |
Starwood Hotels & Resorts Worldwide, Inc.(a) | | 17,200 | | | 499,832 |
Wyndham Worldwide Corp. | | 15,300 | | | 260,865 |
| | | | | |
| | | | | 3,067,163 |
| | | | | |
See Notes to Financial Statements.
| | |
| 14 | | Visit our website at www.jennisondryden.com |
| | | | | |
| | | Shares | | Value (Note 2) |
COMMON STOCKS (Continued) | | | |
Household Durables 3.9% | | | | | |
Black & Decker Corp. (The) | | 14,700 | | $ | 694,134 |
Fortune Brands, Inc. | | 22,700 | | | 884,165 |
Garmin Ltd. (Cayman Islands) | | 16,800 | | | 508,368 |
Jarden Corp. | | 23,500 | | | 643,665 |
Leggett & Platt, Inc. | | 5,500 | | | 106,315 |
Mohawk Industries, Inc.* | | 15,200 | | | 651,016 |
Newell Rubbermaid, Inc. | | 48,100 | | | 697,931 |
Stanley Works (The)(a) | | 16,900 | | | 764,387 |
Whirlpool Corp.(a) | | 5,100 | | | 365,109 |
| | | | | |
| | | | | 5,315,090 |
| | | | | |
Independent Power Producers & Energy Traders 1.0% | | | | | |
AES Corp. (The)* | | 58,000 | | | 758,060 |
Mirant Corp.*(a) | | 38,200 | | | 534,036 |
| | | | | |
| | | | | 1,292,096 |
| | | | | |
Industrial Conglomerates 1.1% | | | | | |
Carlisle Cos., Inc. | | 17,700 | | | 549,408 |
Textron, Inc.(a) | | 56,600 | | | 1,006,348 |
| | | | | |
| | | | | 1,555,756 |
| | | | | |
Insurance 7.7% | | | | | |
Allied World Assurance Co. Holdings Ltd. (Bermuda) | | 15,100 | | | 675,876 |
American Financial Group, Inc. | | 34,200 | | | 841,320 |
Arch Capital Group Ltd. (Bermuda)* | | 11,200 | | | 754,544 |
AXIS Capital Holdings Ltd. (Bermuda) | | 21,400 | | | 618,246 |
Cincinnati Financial Corp. | | 34,300 | | | 869,848 |
First American Corp.(a) | | 27,700 | | | 841,803 |
Hartford Financial Services Group, Inc. (The)(a) | | 40,300 | | | 988,156 |
HCC Insurance Holdings, Inc. | | 27,600 | | | 728,364 |
Lincoln National Corp. | | 35,000 | | | 834,050 |
PartnerRe Ltd. (Bermuda) | | 13,500 | | | 1,032,480 |
Protective Life Corp. | | 39,500 | | | 760,375 |
StanCorp Financial Group, Inc. | | 21,700 | | | 796,607 |
Unitrin, Inc. | | 19,100 | | | 374,360 |
Unum Group | | 24,100 | | | 480,795 |
| | | | | |
| | | | | 10,596,824 |
| | | | | |
IT Services 2.3% | | | | | |
Affiliated Computer Services, Inc. (Class A Stock)* | | 14,800 | | | 770,932 |
Computer Sciences Corp.* | | 30,100 | | | 1,526,371 |
Convergys Corp.* | | 45,500 | | | 493,675 |
See Notes to Financial Statements.
| | |
| Dryden Mid Cap Value Fund | | 15 |
Portfolio of Investments
as of October 31, 2009 continued
| | | | | |
| | | Shares | | Value (Note 2) |
COMMON STOCKS (Continued) | | | |
IT Services (cont’d.) | | | | | |
DST Systems, Inc.* | | 7,700 | | $ | 321,167 |
| | | | | |
| | | | | 3,112,145 |
| | | | | |
Machinery 4.3% | | | | | |
Crane Co. | | 22,800 | | | 634,980 |
Dover Corp. | | 7,700 | | | 290,136 |
Eaton Corp. | | 22,600 | | | 1,366,170 |
Gardner Denver, Inc.* | | 7,700 | | | 276,507 |
Harsco Corp. | | 5,500 | | | 173,195 |
Oshkosh Corp. | | 15,400 | | | 481,404 |
Parker Hannifin Corp. | | 9,500 | | | 503,120 |
Terex Corp.*(a) | | 27,300 | | | 552,006 |
Timken Co. | | 32,400 | | | 713,772 |
Toro Co. (The)(a) | | 8,500 | | | 314,670 |
Trinity Industries, Inc. | | 30,900 | | | 521,592 |
| | | | | |
| | | | | 5,827,552 |
| | | | | |
Media 2.3% | | | | | |
CBS Corp. (Class B Stock) | | 67,000 | | | 788,590 |
DISH Network Corp. (Class A Stock)* | | 42,800 | | | 744,720 |
Gannett Co., Inc.(a) | | 35,800 | | | 351,556 |
McGraw-Hill Cos., Inc. (The) | | 26,600 | | | 765,548 |
Meredith Corp. | | 20,300 | | | 549,318 |
| | | | | |
| | | | | 3,199,732 |
| | | | | |
Metals & Mining 2.7% | | | | | |
Allegheny Technologies, Inc.(a) | | 21,700 | | | 669,662 |
Carpenter Technology Corp. | | 25,200 | | | 529,956 |
Commercial Metals Co. | | 36,400 | | | 540,176 |
Reliance Steel & Aluminum Co. | | 16,100 | | | 587,328 |
Steel Dynamics, Inc. | | 39,800 | | | 532,922 |
United States Steel Corp.(a) | | 22,800 | | | 786,372 |
| | | | | |
| | | | | 3,646,416 |
| | | | | |
Multi-Line Retail 1.7% | | | | | |
JC Penney Co., Inc. | | 33,000 | | | 1,093,290 |
Macy’s, Inc. | | 58,600 | | | 1,029,602 |
Nordstrom, Inc. | | 6,400 | | | 203,392 |
| | | | | |
| | | | | 2,326,284 |
| | | | | |
Multi-Utilities 6.5% | | | | | |
Alliant Energy Corp. | | 14,000 | | | 371,840 |
Ameren Corp. | | 36,700 | | | 893,278 |
See Notes to Financial Statements.
| | |
| 16 | | Visit our website at www.jennisondryden.com |
| | | | | |
| | | Shares | | Value (Note 2) |
COMMON STOCKS (Continued) | | | |
Multi Utilities (cont’d.) | | | | | |
CenterPoint Energy, Inc. | | 54,900 | | $ | 691,740 |
CMS Energy Corp. | | 28,100 | | | 373,730 |
DTE Energy Co. | | 24,400 | | | 902,312 |
MDU Resources Group, Inc. | | 28,900 | | | 599,675 |
NiSource, Inc. | | 83,300 | | | 1,076,236 |
OGE Energy Corp.(a) | | 17,000 | | | 564,740 |
SCANA Corp. | | 28,100 | | | 950,904 |
Sempra Energy | | 8,800 | | | 452,760 |
TECO Energy, Inc.(a) | | 19,900 | | | 285,366 |
Vectren Corp. | | 18,000 | | | 405,720 |
Xcel Energy, Inc. | | 73,300 | | | 1,382,438 |
| | | | | |
| | | | | 8,950,739 |
| | | | | |
Office Electronics 0.6% | | | | | |
Xerox Corp.(a) | | 104,600 | | | 786,592 |
| | | | | |
Oil, Gas & Consumable Fuels 5.8% | | | | | |
Arch Coal, Inc.(a) | | 16,000 | | | 346,560 |
Cimarex Energy Co. | | 19,800 | | | 775,368 |
El Paso Corp. | | 91,000 | | | 892,710 |
Frontier Oil Corp. | | 33,300 | | | 461,538 |
Frontline Ltd. (Bermuda)(a) | | 23,900 | | | 557,587 |
Holly Corp.(a) | | 10,600 | | | 307,506 |
Murphy Oil Corp. | | 18,700 | | | 1,143,318 |
Noble Energy, Inc.(a) | | 6,800 | | | 446,284 |
Overseas Shipholding Group, Inc.(a) | | 11,800 | | | 463,150 |
Plains Exploration & Production Co.* | | 3,057 | | | 81,010 |
Southern Union Co. | | 30,600 | | | 598,842 |
St. Mary Land & Exploration Co. | | 10,800 | | | 368,280 |
Sunoco, Inc. | | 23,100 | | | 711,480 |
Talisman Energy, Inc. (Canada) | | 12,900 | | | 218,913 |
Tesoro Corp.(a) | | 31,500 | | | 445,410 |
Whiting Petroleum Corp.* | | 2,900 | | | 163,560 |
| | | | | |
| | | | | 7,981,516 |
| | | | | |
Paper & Forest Products 0.9% | | | | | |
International Paper Co. | | 55,300 | | | 1,233,743 |
| | | | | |
Personal Products 0.3% | | | | | |
Herbalife Ltd. (Cayman Islands) | | 11,500 | | | 386,975 |
| | | | | |
Pharmaceuticals 1.6% | | | | | |
Endo Pharmaceuticals Holdings, Inc.*(a) | | 25,800 | | | 577,920 |
Forest Laboratories, Inc.* | | 39,300 | | | 1,087,431 |
See Notes to Financial Statements.
| | |
| Dryden Mid Cap Value Fund | | 17 |
Portfolio of Investments
as of October 31, 2009 continued
| | | | | |
| | | Shares | | Value (Note 2) |
COMMON STOCKS (Continued) | | | | | |
Pharmaceuticals (cont’d.) | | | | | |
King Pharmaceuticals, Inc.*(a) | | 49,100 | | $ | 497,383 |
| | | | | |
| | | | | 2,162,734 |
| | | | | |
Professional Services 0.5% | | | | | |
Manpower, Inc.(a) | | 15,300 | | | 725,373 |
| | | | | |
Real Estate Investment Trusts 3.4% | | | | | |
Annaly Capital Management, Inc. | | 33,900 | | | 573,249 |
Brandywine Realty Trust | | 21,900 | | | 209,364 |
Hospitality Properties Trust | | 52,500 | | | 1,013,775 |
Host Hotels & Resorts, Inc. | | 106,400 | | | 1,075,704 |
ProLogis | | 79,100 | | | 896,203 |
SL Green Realty Corp.(a) | | 21,300 | | | 825,588 |
| | | | | |
| | | | | 4,593,883 |
| | | | | |
Real Estate Management & Development 0.8% | | | | | |
Forest City Enterprises, Inc. (Class A Stock) | | 49,300 | | | 429,896 |
Jones Lang LaSalle, Inc.(a) | | 15,000 | | | 702,750 |
| | | | | |
| | | | | 1,132,646 |
| | | | | |
Road & Rail 0.9% | | | | | |
Con-Way, Inc. | | 18,800 | | | 620,212 |
Ryder System, Inc. | | 16,300 | | | 660,965 |
| | | | | |
| | | | | 1,281,177 |
| | | | | |
Specialty Retail 2.1% | | | | | |
Abercrombie & Fitch Co. (Class A Stock) | | 8,700 | | | 285,534 |
Barnes & Noble, Inc.(a) | | 23,100 | | | 383,691 |
Foot Locker, Inc. | | 30,300 | | | 317,544 |
Limited Brands, Inc. | | 30,500 | | | 536,800 |
Penske Auto Group, Inc. | | 6,600 | | | 103,356 |
RadioShack Corp.(a) | | 32,700 | | | 552,303 |
Signet Jewelers Ltd. (Bermuda)* | | 17,600 | | | 443,696 |
Williams-Sonoma, Inc. | | 11,100 | | | 208,458 |
| | | | | |
| | | | | 2,831,382 |
| | | | | |
Thrifts & Mortgage Finance 0.1% | | | | | |
Astoria Financial Corp. | | 13,100 | | | 130,738 |
| | | | | |
Trading Companies & Distributors 0.6% | | | | | |
GATX Corp.(a) | | 15,300 | | | 415,854 |
WESCO International, Inc.* | | 17,800 | | | 454,968 |
| | | | | |
| | | | | 870,822 |
| | | | | |
See Notes to Financial Statements.
| | |
| 18 | | Visit our website at www.jennisondryden.com |
| | | | | | |
| | | Shares | | Value (Note 2) | |
COMMON STOCKS (Continued) | | | | | | |
Wireless Telecommunication Services 0.7% | | | | | | |
NII Holdings, Inc.*(a) | | 33,600 | | $ | 904,848 | |
Telephone & Data Systems, Inc. | | 2,600 | | | 77,012 | |
| | | | | | |
| | | | | 981,860 | |
| | | | | | |
TOTAL LONG-TERM INVESTMENTS
(cost $149,042,971) | | | | | 135,220,795 | |
| | | | | | |
| | |
SHORT-TERM INVESTMENT 25.3% | | | | | | |
| | |
AFFILIATED MONEY MARKET MUTUAL FUND | | | | | | |
Dryden Core Investment Fund—Taxable Money Market Series
(cost $34,568,012; includes $32,621,817 of cash collateral for securities on loan)(b)(c) | | 34,568,012 | | | 34,568,012 | |
| | | | | | |
TOTAL INVESTMENTS 124.0%
(cost $183,610,983; Note 6) | | | | | 169,788,807 | |
Liabilities in excess of other assets (24.0)% | | | | | (32,825,955 | ) |
| | | | | | |
NET ASSETS 100.0% | | | | $ | 136,962,852 | |
| | | | | | |
| * | Non-income producing security. |
| (a) | All or a portion of security is on loan. The aggregate market value of such securities is $30,419,870; cash collateral of $32,621,817 (included with liabilities) was received with which the Portfolio purchased highly liquid short-term investments. |
| (b) | Represents security, or a portion thereof, purchased with cash collateral received for securities on loan. |
| (c) | Prudential Investments LLC, the manager of the Fund also serves as manager of the Dryden Core Investment Fund-Taxable Money Market Series. |
Various inputs are used in determining the value of the Fund's investments. These inputs are summarized in the three broad levels listed below.
Level 1—quoted prices in active markets for identical securities
Level 2—other significant observable inputs (including quoted prices for similar securities, interest rates, prepayment speeds, credit risk, etc.)
Level 3—significant unobservable inputs (including the Portfolio's own assumptions in determining the fair value of investments)
See Notes to Financial Statements.
| | |
| Dryden Mid Cap Value Fund | | 19 |
Portfolio of Investments
as of October 31, 2009 continued
The following is a summary of the inputs used as of October 31, 2009 in valuing the Fund's assets carried at fair value:
| | | | | | | | | |
Investments in Securities | | Level 1 | | Level 2 | | Level 3 |
| Common Stocks | | $ | 135,220,795 | | $ | — | | $ | — |
| Affiliated Money Market Mutual Fund | | | 34,568,012 | | | — | | | — |
| | | | | | | | | |
| | $ | 169,788,807 | | $ | — | | $ | — |
| Other Financial Instruments* | | | — | | | — | | | — |
| | | | | | | | | |
| Total | | $ | 169,788,807 | | $ | — | | $ | — |
| | | | | | | | | |
| * | Other financial instruments are derivative instruments not reflected in the Portfolio of Investments, such as futures, forwards and swap contracts, which are valued at the unrealized appreciation/depreciation on the instrument. |
As of October 31, 2008 and October 31, 2009, the Fund did not use any significant unobservable inputs (Level 3) in determining the value of investments.
The industry classification of investments and liabilities in excess of other assets shown as a percentage of net assets as of October 31, 2009 were as follows:
| | | |
Affiliated Money Market Mutual Fund (23.8% represents investments purchased with collateral from securities on loan) | | 25.3 | % |
Insurance | | 7.7 | |
Multi-Utilities | | 6.5 | |
Oil, Gas & Consumable Fuels | | 5.8 | |
Energy Equipment & Services | | 5.5 | |
Machinery | | 4.3 | |
Healthcare Providers & Services | | 4.2 | |
Household Durables | | 3.9 | |
Commercial Banks | | 3.7 | |
Real Estate Investment Trusts | | 3.4 | |
Commercial Services & Supplies | | 3.0 | |
Chemicals | | 2.8 | |
Electronic Equipment & Instruments | | 2.8 | |
Metals & Mining | | 2.7 | |
Gas Utilities | | 2.6 | |
Electric Utilities | | 2.4 | |
Media | | 2.3 | |
IT Services | | 2.3 | |
Hotels, Restaurants & Leisure | | 2.2 | |
Specialty Retail | | 2.1 | |
Food & Staples Retailing | | 2.0 | |
Diversified Telecommunication Services | | 2.0 | |
See Notes to Financial Statements.
| | |
| 20 | | Visit our website at www.jennisondryden.com |
| | | |
Industry (cont’d.) | | | |
Food Products | | 1.9 | % |
Computers & Peripherals | | 1.8 | |
Capital Markets | | 1.8 | |
Electrical Equipment | | 1.7 | |
Multi-Line Retail | | 1.7 | |
Pharmaceuticals | | 1.6 | |
Beverages | | 1.3 | |
Containers & Packaging | | 1.2 | |
Industrial Conglomerates | | 1.1 | |
Independent Power Producers & Energy Traders | | 1.0 | |
Road & Rail | | 0.9 | |
Paper & Forest Products | | 0.9 | |
Healthcare Equipment & Supplies | | 0.8 | |
Real Estate Management & Development | | 0.8 | |
Consumer Finance | | 0.8 | |
Wireless Telecommunication Services | | 0.7 | |
Trading Companies & Distributors | | 0.6 | |
Office Electronics | | 0.6 | |
Professional Services | | 0.5 | |
Healthcare Technology | | 0.5 | |
Auto Components | | 0.5 | |
Aerospace & Defense | | 0.4 | |
Communications Equipment | | 0.3 | |
Exchange Traded Funds | | 0.3 | |
Personal Products | | 0.3 | |
Building Products | | 0.2 | |
Automobiles | | 0.2 | |
Thrifts & Mortgage Finance | | 0.1 | |
| | | |
| | 124.0 | |
Liabilities in excess of other assets | | (24.0 | ) |
| | | |
| | 100.0 | % |
| | | |
See Notes to Financial Statements.
| | |
| Dryden Mid Cap Value Fund | | 21 |
Statement of Assets and Liabilities
as of October 31, 2009
| | | | |
ASSETS | | | | |
Investments at value, including securities on loan of $30,419,870: | | | | |
Unaffiliated investments (cost $149,042,971) | | $ | 135,220,795 | |
Affiliated investments (cost $34,568,012) | | | 34,568,012 | |
Receivable for Fund shares sold | | | 217,004 | |
Dividends and interest receivable | | | 87,640 | |
Prepaid expenses | | | 2,071 | |
| | | | |
Total Assets | | | 170,095,522 | |
| | | | |
| |
LIABILITIES | | | | |
Payable to broker for collateral for securities on loan | | | 32,621,817 | |
Accrued expenses | | | 142,818 | |
Advisory fee payable | | | 110,653 | |
Payable for Fund shares redeemed | | | 104,282 | |
Payable to custodian | | | 64,051 | |
Distribution fee payable | | | 51,343 | |
Affiliated transfer agent fee payable | | | 32,941 | |
Deferred directors’ fee | | | 4,765 | |
| | | | |
Total Liabilities | | | 33,132,670 | |
| | | | |
| |
NET ASSETS | | $ | 136,962,852 | |
| | | | |
| | | | | |
Net assets were comprised of: | | | | |
Common stock, at $.001 par value | | $ | 13,316 | |
Paid-in capital in excess of par | | | 174,055,367 | |
| | | | |
| | | 174,068,683 | |
Undistributed net investment income | | | 278,257 | |
Accumulated net realized loss on investment transactions | | | (23,561,912 | ) |
Net unrealized depreciation on investments | | | (13,822,176 | ) |
| | | | |
Net Assets, October 31, 2009 | | $ | 136,962,852 | |
| | | | |
See Notes to Financial Statements.
| | |
| 22 | | Visit our website at www.jennisondryden.com |
| | | |
Class A: | | | |
Net asset value and redemption price per share ($62,425,582 ÷ 5,861,490 shares of common stock issued and outstanding) | | $ | 10.65 |
Maximum sales charge (5.5% of offering price) | | | 0.62 |
| | | |
Offering price per share | | $ | 11.27 |
| | | |
| |
Class B: | | | |
Net asset value, offering price and redemption price per share ($4,233,480 ÷ 438,317 shares of common stock issued and outstanding) | | $ | 9.66 |
| | | |
| |
Class C: | | | |
Net asset value, offering price and redemption price per share ($27,766,219 ÷ 2,882,947 shares of common stock issued and outstanding) | | $ | 9.63 |
| | | |
| |
Class L: | | | |
Net asset value, offering price and redemption price per share ($11,509,844 ÷ 1,100,581 shares of common stock issued and outstanding) | | $ | 10.46 |
| | | |
| |
Class M: | | | |
Net asset value, offering price and redemption price per share ($9,493,247 ÷ 975,570 shares of common stock issued and outstanding) | | $ | 9.73 |
| | | |
| |
Class X: | | | |
Net asset value, offering price and redemption price per share ($5,333,412 ÷ 544,809 shares of common stock issued and outstanding) | | $ | 9.79 |
| | | |
| |
Class Z: | | | |
Net asset value, offering price and redemption price per share ($16,201,068 ÷ 1,511,861 shares of common stock issued and outstanding) | | $ | 10.72 |
| | | |
See Notes to Financial Statements.
| | |
| Dryden Mid Cap Value Fund | | 23 |
Statement of Operations
Year Ended October 31, 2009
| | | | |
Net Investment Income | | | | |
Investment income | | | | |
Unaffiliated dividend income (net of foreign withholding tax of $344) | | $ | 3,218,225 | |
Affiliated income from securities lending, net | | | 165,702 | |
Affiliated dividend income | | | 12,996 | |
| | | | |
Total income | | | 3,396,923 | |
| | | | |
| |
Expenses | | | | |
Advisory fee | | | 1,067,350 | |
Distribution fee—Class A | | | 110,880 | |
Distribution fee—Class B | | | 105,901 | |
Distribution fee—Class C | | | 252,369 | |
Distribution fee—Class L | | | 53,253 | |
Distribution fee—Class M | | | 31,306 | |
Distribution fee—Class X | | | 13,620 | |
Transfer agent’s fee and expenses (including affiliated expenses of $158,400) | | | 398,000 | |
Registration fees | | | 77,000 | |
Custodian’s fees and expenses | | | 69,000 | |
Reports to shareholders | | | 57,000 | |
Legal fees and expenses | | | 23,000 | |
Audit fees | | | 21,000 | |
Directors’ fees | | | 17,000 | |
Miscellaneous | | | 16,426 | |
| | | | |
Total expenses | | | 2,313,105 | |
| | | | |
Net investment income | | | 1,083,818 | |
| | | | |
| |
Realized And Unrealized Gain (Loss) On Investments | | | | |
Net realized loss on investments | | | (22,282,267 | ) |
Net change in unrealized appreciation (depreciation) on investments | | | 42,721,972 | |
| | | | |
Net gain on investments | | | 20,439,705 | |
| | | | |
Net Increase In Net Assets Resulting From Operations | | $ | 21,523,523 | |
| | | | |
See Notes to Financial Statements.
| | |
| 24 | | Visit our website at www.jennisondryden.com |
Statement of Changes in Net Assets
| | | | | | | | |
| | | Year Ended October 31, | |
| | | 2009 | | | 2008 | |
Increase (Decrease) In Net Assets | | | | | | | | |
Operations | | | | | | | | |
Net investment income | | $ | 1,083,818 | | | $ | 1,931,987 | |
Net realized loss on investments transactions | | | (22,282,267 | ) | | | (846,402 | ) |
Net change in unrealized appreciation (depreciation) on investments | | | 42,721,972 | | | | (84,857,611 | ) |
| | | | | | | | |
Net increase (decrease) in net assets resulting from operations | | | 21,523,523 | | | | (83,772,026 | ) |
| | | | | | | | |
| | |
Distributions and Dividends (Note 2) | | | | | | | | |
Dividends from net investment income | | | | | | | | |
Class A | | | (769,488 | ) | | | (189,476 | ) |
Class B | | | (227,132 | ) | | | — | |
Class C | | | (382,279 | ) | | | — | |
Class L | | | (217,883 | ) | | | (31,512 | ) |
Class M | | | (399,054 | ) | | | — | |
Class X | | | (163,017 | ) | | | (92,430 | ) |
Class Z | | | (193,661 | ) | | | (78,231 | ) |
| | | | | | | | |
Total dividends | | | (2,352,514 | ) | | | (391,649 | ) |
| | | | | | | | |
Distributions from net realized gains | | | | | | | | |
Class A | | | — | | | | (11,309,130 | ) |
Class B | | | — | | | | (8,459,871 | ) |
Class C | | | — | | | | (14,447,216 | ) |
Class L | | | — | | | | (5,905,852 | ) |
Class M | | | — | | | | (14,894,261 | ) |
Class X | | | — | | | | (3,280,759 | ) |
Class Z | | | — | | | | (2,776,295 | ) |
| | | | | | | | |
Total distributions | | | — | | | | (61,073,384 | ) |
| | | | | | | | |
| | |
Capital Contributions | | | | | | | | |
Class M | | | 40,553 | | | | 52,049 | |
Class X | | | 6,801 | | | | 1,362 | |
| | | | | | | | |
| | | 47,354 | | | | 53,411 | |
| | | | | | | | |
| | |
Fund share transactions (Note 5) | | | | | | | | |
Net proceeds from shares sold | | | 15,630,053 | | | | 12,570,751 | |
Net asset value of shares issued in reinvestment of dividends and distributions | | | 2,214,203 | | | | 56,896,231 | |
Cost of shares redeemed | | | (29,885,755 | ) | | | (85,542,769 | ) |
| | | | | | | | |
Decrease in net assets from fund share transactions | | | (12,041,499 | ) | | | (16,075,787 | ) |
| | | | | | | | |
Total increase (decrease) in net assets | | | 7,176,864 | | | | (161,259,435 | ) |
| | |
NET ASSETS | | | | | | | | |
Beginning of year | | | 129,785,988 | | | | 291,045,423 | |
| | | | | | | | |
End of year (a) | | $ | 136,962,852 | | | $ | 129,785,988 | |
| | | | | | | | |
(a) Includes undistributed net investment income of: | | $ | 278,257 | | | $ | 1,546,953 | |
| | | | | | | | |
See Notes to Financial Statements.
| | |
| Dryden Mid Cap Value Fund | | 25 |
Notes to Financial Statements
1. Organization
Strategic Partners Mutual Funds, Inc., formerly known as American Skandia Advisor Funds, Inc., (the “Company”) is an open-end management investment company, registered under the Investment Company Act of 1940, as amended. The Company was organized on March 5, 1997, as a Maryland Corporation. The Company operates as a series company and effective April 12, 2004, the name of the Company was changed to Strategic Partners Mutual Funds, Inc. At October 31, 2009, the Company consisted of two diversified investment portfolios (each a “Fund” and collectively the “Funds”). The information presented in these financial statements pertains to Dryden Mid Cap Value (the “Fund”). The investment objective of the Fund is capital growth by investing primarily in common stocks of medium capitalization companies.
2. Significant Accounting Policies
The following accounting policies are in conformity with accounting principles generally accepted in the United States of America. Such policies are consistently followed by the Company and the Fund in the preparation of their financial statements.
Securities Valuation: Securities listed on a securities exchange (other than options on securities and indices) are valued at the last sale price on such exchange on the day of valuation or, if there was no sale on such day, at the mean between the last reported bid and asked prices, or at the last bid price on such day in the absence of an asked price. Securities that are actively traded via Nasdaq are valued at the official closing price as provided by Nasdaq. Securities that are actively traded in the over-the-counter market, including listed securities for which the primary market is believed by Prudential Investments LLC (“PI” or “Manager”) in consultation with the subadviser, to be over-the-counter, are valued at market value using prices provided by an independent pricing agent or principal market maker. Futures contracts and options thereon traded on a commodities exchange or board of trade are valued at the last sale price at the close of trading on such exchange or board of trade or, if there was no sale on the applicable commodities exchange or board of trade on such day, at the mean between the most recently quoted prices on such exchange or board of trade or at the last bid price in the absence of an asked price. Prices may be obtained from independent pricing services which use information provided by market makers or estimates of market values obtained from yield data relating to investments or securities with similar characteristics. Securities for which reliable
| | |
| 26 | | Visit our website at www.jennisondryden.com |
market quotations are not readily available, or whose values have been affected by events occurring after the close of the security’s foreign market and before the Fund’s normal pricing time, are valued at fair value in accordance with the Board of Directors’ approved fair valuation procedures. When determining the fair valuation of securities some of the factors influencing the valuation include, the nature of any restrictions on disposition of the securities; assessment of the general liquidity of the securities; the issuer’s financial condition and the markets in which it does business; the cost of the investment; the size of the holding and the capitalization of issuer; the prices of any recent transactions or bids/offers for such securities or any comparable securities; any available analyst media or other reports or information deemed reliable by the investment adviser regarding the issuer or the markets or industry in which it operates. Using fair value to price securities may result in a value that is different from a security’s most recent closing price and from the price used by other mutual funds to calculate their net asset value.
Investments in mutual funds are valued at the net asset value as of the close of the New York Stock Exchange on the date of valuation.
Foreign Currency Translation: Fund securities and other assets and liabilities denominated in foreign currencies are translated each business day into U.S. dollars based on the current rates of exchange. Purchases and sales of Fund securities and income and expenses are translated into U.S. dollars on the respective dates of such transactions. Gains and losses resulting from changes in exchange rates applicable to long-term foreign securities are not reported separately from gains and losses arising from movements in securities prices. Net realized foreign exchange gains and losses include gains and losses from sales and maturities of foreign currency exchange contracts, gains and losses realized between the trade and settlement dates of foreign securities transactions, and the difference between the amount of net investment income accrued on foreign securities and the U.S. dollar amount actually received. Net unrealized foreign exchange gains and losses include gains and losses from changes in the value of assets and liabilities other than Fund securities, resulting from changes in exchange rates.
Securities Lending: The Funds may lend their portfolio securities to broker-dealers. The loans are secured by collateral at least equal at all times to the market value of the securities loaned. Loans are subject to termination at the option of the borrower or the Funds. Upon termination of the loan, the borrower will return to the lender securities identical to the loaned securities. Should the borrower of the securities fail financially, the Funds have the right to repurchase the securities using the collateral in the open market. The Funds recognize income, net of any rebate and securities lending agent fees, for lending its securities in the form of fees or interest on the
| | |
| Dryden Mid Cap Value Fund | | 27 |
Notes to Financial Statements
continued
investment of any cash received as collateral. The Funds also continue to receive interest and dividends or amounts equivalent thereto, on the securities loaned and recognize any unrealized gain or loss in the market price of the securities loaned that may occur during the term of the loan.
Securities Transactions and Net Investment Investment Income: Securities transactions are recorded on the trade date. Realized gains or losses on sales of investments and currency transactions are calculated on the identified cost basis. Dividend income is recorded on the ex-dividend date and interest income is recorded on the accrual basis. The Fund amortizes premiums and discounts on portfolio securities as adjustments to interest income. Expenses are recorded on the accrual basis which may require the use of certain estimates by management.
Net investment income or loss (other than distribution fees, which are charged directly to the respective class) and unrealized and realized gains or losses are allocated daily to each class of shares based upon the relative proportion of net assets of each class at the beginning of the day.
Dividends and Distributions to Shareholders: Distributions to shareholders are recorded on the ex-dividend date. Dividends, if any, from net investment income are declared and paid at least annually. These dividends and distributions are determined in accordance with federal income tax regulations and may differ from accounting principles generally accepted in the United States of America.
Net realized gains from investment transactions, if any, are distributed at least annually. Permanent book/tax differences relating to income and gains are reclassified to paid-in capital when they arise.
Taxes: For federal income tax purposes, each Fund in the Company is treated as a separate tax paying entity. It is the Fund’s policy to continue to meet the requirements of the Internal Revenue Code applicable to regulated investment companies and to distribute all of its taxable net income and capital gains, if any, to shareholders. Therefore, no federal tax provision is required.
Withholding taxes on foreign dividends are recorded net of reclaimable amounts, at the time the related income is earned.
| | |
| 28 | | Visit our website at www.jennisondryden.com |
Estimates: The preparation of the financial statements requires management to make estimates and assumptions that affect the reported amounts and disclosures in the financial statements. Actual results could differ from those estimates.
3. Agreements
The Fund has entered into an investment management agreement with PI which provides that the Manager will furnish the Fund with investment advice and investment management and administrative services. The Manager has entered into a subadvisory agreement with Quantitative Management Associates LLC (“QMA”). The subadvisory agreement provides that QMA furnishes investment advisory services in connection with the management of the Fund. PI pays for the services of QMA, the cost of compensation of officers of the Fund, occupancy and certain clerical and bookkeeping costs of the Fund. The Fund bears all other costs and expenses.
The advisory fee paid to PI is computed daily and payable monthly at an annual rate of .90 of 1% of the average daily net assets of the Fund up to $500 million, .85 of 1% of the next $500 million and .80 of 1% of the average daily net assets in excess of $1 billion. The effective management fee rate was .90 of 1% for the year ended October 31, 2009.
Certain officers and directors of the Fund are officers or directors of the Manager. The Fund pays no compensation directly to their officers or interested directors.
Prudential Investment Management Services LLC (“PIMS”) and Prudential Annuities Distributors, Inc. (“PAD”) both affiliates of the Manager and an indirect, wholly-owned subsidiary of Prudential, serves as the distributor for the Fund. The Company has adopted a separate Distribution and Service plan (each a “Plan” and collectively the “Plans”) for Class A, B, C, L, M, X and Z shares of each Fund in accordance with the requirements of Rule 12b-1 of the Investment Company Act of 1940. No distribution or service fees are paid to PIMS as distributor for Class Z shares.
Under the Plans, the Fund compensates PIMS and PAD distribution and service fees at an annual rate up to .30%, 1.00%, 1.00%, .50%, 1.00% and 1.00% of the average daily net assets of the Class A, B, C, L, M and X shares, respectively. Through February 28, 2011, PIMS has contractually agreed to limit such fees to .25% of 1% of the average daily net assets of Class A shares.
| | |
| Dryden Mid Cap Value Fund | | 29 |
Notes to Financial Statements
continued
Management has received the maximum allowable amount of sales charges for Class M and X in accordance with regulatory limits. As such, any contingent deferred sales charges received by the manager are contributed back into the Fund and included in the Statement of Changes and Financial Highlights as a contribution to capital.
During the year ended October 31, 2008, management determined that Class M and Class X shareholders had been charged sales charges in excess of regulatory limits. The manager has paid these classes for the overcharge which is reflected as an increase in net investment income, an increase in distributions from net investment income related to Class M and X, and capital contributions to Class M and X in the Statement of Changes for the year ended October 31, 2008. The impact is also reflected in the Financial Highlights for Class M for the years ended October 31, 2008 and 2007 and for Class X for the years ended October 31, 2008, 2007, 2006 and 2005.
During the year ended October 31, 2009, PIMS has advised the Fund, front-end sales charges (“FESC”) and contingent deferred sales charges (“CDSC”) were as follows:
| | | | | | |
Class A
FESC | | Class A
CDSC | | Class B
CDSC | | Class C
CDSC |
| $21,633 | | $68 | | $8,726 | | $587 |
The Fund, along with other affiliated registered investment companies (the “Funds”), is a party to a Syndicated Credit Agreement (“SCA”) with two banks. The SCA provides for a commitment of $500 million. Interest on any borrowings under the SCA would be incurred at market rates and a commitment fee for the unused amount is accrued daily and paid quarterly. Effective October 22, 2009, the Funds renewed the SCA with the banks. The commitment under the renewed SCA continues to be $500 million. The Funds pay a commitment fee of .15 of 1% of the unused portion of the renewed SCA. The expiration date of the renewed SCA is October 20, 2010. For the period from October 24, 2008 through October 21, 2009, the Funds paid a commitment fee of .13 of 1% of the unused portion of the agreement. The purpose of the SCA is to provide an alternative source of temporary funding for capital share redemptions. The Fund did not utilize the line of credit during the year ended October 31, 2009.
4. Other Transactions with Affiliates
Prudential Mutual Fund Services LLC (“PMFS”), an affiliate of PI and an indirect, wholly-owned subsidiary of Prudential, serves as the Fund’s transfer agent. Transfer
| | |
| 30 | | Visit our website at www.jennisondryden.com |
agent fees and expenses shown in the Statements of Operations include certain out-of pocket expenses paid to non-affiliates, where applicable.
The Fund pays networking fees to affiliated and unaffiliated broker/dealers, including fees relating to the services of Wells Fargo Advisors, LLC (“Wells Fargo”) and First Clearing, LLC (“First Clearing”), affiliates of PI. These networking fees are payments made to broker/dealers that clear mutual fund transactions through a national clearing system. For the year ended October 31, 2009 the Fund incurred approximately $69,100 in total networking fees of which approximately $24,200 was paid to First Clearing. These amounts are included in transfer agent’s fees and expenses on the Statement of Operations.
The Fund invests in the Taxable Money Market Series (the “Series”), a portfolio of Dryden Core Investment Fund. The Series is a money market mutual fund registered under the Investment Company Act of 1940, as amended, and managed by PI.
Prudential Investment Management, Inc. (“PIM”), an indirect, wholly-owned subsidiary of Prudential, served as the Fund’s securities lending agent. For the year ended October 31, 2009, PIM has been compensated approximately $67,700 for these services.
5. Shares of Capital Stock
Class A shares are sold with a front-end sales charge of up to 5.50%. Purchases of $1 million or more are subject to a contingent deferred sales charge (“CDSC”) if shares are redeemed within 12 months of their purchase. Class B shares are sold with a CDSC which declines from 5% to zero depending upon the period of time the shares are held. Class B shares will automatically convert to Class A shares approximately seven years after purchase. Class M shares will automatically convert to Class A shares approximately eight years after purchase. Class C shares are sold with a CDSC of 1% during the first 12 months. Class L shares are closed to most new purchases (with the exception of reinvested dividends and purchases by certain college savings plans). Class M shares are also closed to most new purchases (with the exception of reinvested dividends). Class L shares and Class M shares are only exchangeable with Class L shares and Class M shares, respectively, offered by the other Strategic Partners and JennisonDryden Funds. Class X shares are closed to new purchases. The authorized capital stock of the Fund is 5.5 billion shares, with a par value of $.001 per share. Class Z shares are not subject to any sales or redemption charge and are offered exclusively for sale to a limited group of investors.
| | |
| Dryden Mid Cap Value Fund | | 31 |
Notes to Financial Statements
continued
Transactions in shares of capital stock, during the year ended October 31, 2009, were as follows:
| | | | | | | |
Class A | | Shares | | | Amount | |
Year ended October 31, 2009: | | | | | | | |
Shares sold | | 655,465 | | | $ | 5,625,712 | |
Shares issued in reinvestment of dividends and distributions | | 88,784 | | | | 728,915 | |
Shares reacquired | | (1,251,027 | ) | | | (10,806,289 | ) |
| | | | | | | |
Net increase (decrease) in shares outstanding before conversion | | (506,778 | ) | | | (4,451,662 | ) |
Shares issued upon conversion from Class B, Class M and Class X | | 2,384,516 | | | | 21,374,478 | |
| | | | | | | |
Net increase (decrease) in shares outstanding | | 1,877,738 | | | $ | 16,922,816 | |
| | | | | | | |
Year ended October 31, 2008: | | | | | | | |
Shares sold | | 460,650 | | | $ | 5,841,849 | |
Shares issued in reinvestment of dividends and distributions | | 839,400 | | | | 10,962,780 | |
Shares reacquired | | (1,505,353 | ) | | | (18,897,048 | ) |
| | | | | | | |
Net increase (decrease) in shares outstanding before conversion | | (205,303 | ) | | | (2,092,419 | ) |
Shares issued upon conversion from Class B, Class M and Class X | | 1,205,748 | | | | 15,508,519 | |
| | | | | | | |
Net increase (decrease) in shares outstanding | | 1,000,445 | | | $ | 13,416,100 | |
| | | | | | | |
Class B | | | | | | |
Year ended October 31, 2009: | | | | | | | |
Shares sold | | 50,125 | | | $ | 398,642 | |
Shares issued in reinvestment of dividends and distributions | | 27,766 | | | | 207,692 | |
Shares reacquired | | (413,066 | ) | | | (3,202,713 | ) |
| | | | | | | |
Net increase (decrease) in shares outstanding before conversion | | (335,175 | ) | | | (2,596,379 | ) |
Shares reacquired upon conversion into Class A | | (1,291,085 | ) | | | (10,927,101 | ) |
| | | | | | | |
Net increase (decrease) in shares outstanding | | (1,626,260 | ) | | $ | (13,523,480 | ) |
| | | | | | | |
Year ended October 31, 2008: | | | | | | | |
Shares sold | | 71,665 | | | $ | 836,744 | |
Shares issued in reinvestment of dividends and distributions | | 634,097 | | | | 7,552,019 | |
Shares reacquired | | (944,071 | ) | | | (11,396,520 | ) |
| | | | | | | |
Net increase (decrease) in shares outstanding before conversion | | (238,309 | ) | | | (3,007,757 | ) |
Shares reacquired upon conversion into Class A | | (73,780 | ) | | | (884,958 | ) |
| | | | | | | |
Net increase (decrease) in shares outstanding | | (312,089 | ) | | $ | (3,892,715 | ) |
| | | | | | | |
Class C | | | | | | |
Year ended October 31, 2009: | | | | | | | |
Shares sold | | 86,597 | | | $ | 680,548 | |
Shares issued in reinvestment of dividends and distributions | | 47,364 | | | | 353,811 | |
Shares reacquired | | (760,453 | ) | | | (5,836,852 | ) |
| | | | | | | |
Net increase (decrease) in shares outstanding | | (626,492 | ) | | $ | (4,802,493 | ) |
| | | | | | | |
| | |
| 32 | | Visit our website at www.jennisondryden.com |
| | | | | | | |
Class C | | Shares | | | Amount | |
Year ended October 31, 2008: | | | | | | | |
Shares sold | | 93,684 | | | $ | 1,103,017 | |
Shares issued in reinvestment of dividends and distributions | | 1,122,284 | | | | 13,343,962 | |
Shares reacquired | | (1,654,487 | ) | | | (19,618,780 | ) |
| | | | | | | |
Net increase (decrease) in shares outstanding | | (438,519 | ) | | $ | (5,171,801 | ) |
| | | | | | | |
Class L | | | | | | |
Year ended October 31, 2009: | | | | | | | |
Shares sold | | 6,301 | | | $ | 53,803 | |
Shares issued in reinvestment of dividends and distributions | | 24,681 | | | | 199,418 | |
Shares reacquired | | (336,075 | ) | | | (2,829,822 | ) |
| | | | | | | |
Net increase (decrease) in shares outstanding | | (305,093 | ) | | $ | (2,576,601 | ) |
| | | | | | | |
Year ended October 31, 2008: | | | | | | | |
Shares sold | | 10,511 | | | $ | 128,783 | |
Shares issued in reinvestment of dividends and distributions | | 419,371 | | | | 5,389,072 | |
Shares reacquired | | (631,440 | ) | | | (7,889,112 | ) |
| | | | | | | |
Net increase (decrease) in shares outstanding | | (201,558 | ) | | $ | (2,371,257 | ) |
| | | | | | | |
Class M | | | | | | |
Year ended October 31, 2009: | | | | | | | |
Shares sold | | 53,171 | | | $ | 392,994 | |
Shares issued in reinvestment of dividends and distributions | | 49,934 | | | | 373,507 | |
Shares reacquired | | (433,611 | ) | | | (3,275,959 | ) |
| | | | | | | |
Net increase (decrease) in shares outstanding before conversion | | (330,506 | ) | | | (2,509,458 | ) |
Shares reacquired upon conversion into Class A | | (1,151,248 | ) | | | (9,023,715 | ) |
| | | | | | | |
Net increase (decrease) in shares outstanding | | (1,481,754 | ) | | $ | (11,533,173 | ) |
| | | | | | | |
Year ended October 31, 2008: | | | | | | | |
Shares sold | | 54,013 | | | $ | 609,878 | |
Shares issued in reinvestment of dividends and distributions | | 1,140,167 | | | | 13,533,787 | |
Shares reacquired | | (1,600,638 | ) | | | (18,748,188 | ) |
| | | | | | | |
Net increase (decrease) in shares outstanding before conversion | | (406,458 | ) | | | (4,604,523 | ) |
Shares reacquired upon conversion into Class A | | (1,223,278 | ) | | | (14,289,388 | ) |
| | | | | | | |
Net increase (decrease) in shares outstanding | | (1,629,736 | ) | | $ | (18,893,911 | ) |
| | | | | | | |
Class X | | | | | | |
Year ended October 31, 2009: | | | | | | | |
Shares sold | | 14,932 | | | $ | 134,609 | |
Shares issued in reinvestment of dividends and distributions | | 21,495 | | | | 162,071 | |
Shares reacquired | | (142,040 | ) | | | (1,075,820 | ) |
| | | | | | | |
Net increase (decrease) in shares outstanding before conversion | | (105,613 | ) | | | (779,140 | ) |
Shares reacquired upon conversion into Class A | | (174,620 | ) | | | (1,423,662 | ) |
| | | | | | | |
Net increase (decrease) in shares outstanding | | (280,233 | ) | | $ | (2,202,802 | ) |
| | | | | | | |
| | |
| Dryden Mid Cap Value Fund | | 33 |
Notes to Financial Statements
continued
| | | | | | | |
Class X | | Shares | | | Amount | |
Year ended October 31, 2008: | | | | | | | |
Shares sold | | 3,280 | | | $ | 33,043 | |
Shares issued in reinvestment of dividends and distributions | | 277,149 | | | | 3,331,338 | |
Shares reacquired | | (331,877 | ) | | | (3,990,471 | ) |
| | | | | | | |
Net increase (decrease) in shares outstanding before conversion | | (51,448 | ) | | | (626,090 | ) |
Shares reacquired upon conversion into Class A | | (29,202 | ) | | | (334,173 | ) |
| | | | | | | |
Net increase (decrease) in shares outstanding | | (80,650 | ) | | $ | (960,263 | ) |
| | | | | | | |
Class Z | | | | | | |
Year ended October 31, 2009: | | | | | | | |
Shares sold | | 913,438 | | | $ | 8,343,745 | |
Shares issued in reinvestment of dividends and distributions | | 22,911 | | | | 188,789 | |
Shares reacquired | | (317,317 | ) | | | (2,858,300 | ) |
| | | | | | | |
Net increase (decrease) in shares outstanding | | 619,032 | | | $ | 5,674,234 | |
| | | | | | | |
Year ended October 31, 2008: | | | | | | | |
Shares sold | | 335,270 | | | $ | 4,017,437 | |
Shares issued in reinvestment of dividends and distributions | | 212,140 | | | | 2,783,273 | |
Shares reacquired | | (403,171 | ) | | | (5,002,650 | ) |
| | | | | | | |
Net increase (decrease) in shares outstanding | | 144,239 | | | $ | 1,798,060 | |
| | | | | | | |
6. Distributions and Tax Information
Distributions to shareholders, which are determined in accordance with federal income tax regulations, which may differ from generally accepted accounting principles, are recorded on the ex-dividend date.
For the year ended October 31, 2009, the tax character of dividends paid as reflected in the Statement of Changes in Net Assets was $2,352,514 from ordinary income. For the year ended October 31, 2008, the tax character of dividends paid as reflected in the Statement of Changes in Net Assets were $10,581,284 from ordinary income and $50,667,393 from long-term capital gains. For federal income tax purposes, dividends from net investment income and short-term capital gains are taxable as ordinary income dividends. Long-term capital gain distributions are taxable as such.
As of October 31, 2009, the accumulated undistributed earnings on a tax basis was $283,021 of ordinary income. This differs from the amount shown on the Statement of Assets and Liabilities primarily due to cumulative timing differences between financial and tax reporting.
| | |
| 34 | | Visit our website at www.jennisondryden.com |
For federal income tax purposes, the Fund had a capital loss carryforward as of October 31, 2009 of approximately $22,965,000, of which $567,000 expires in 2016 and $22,398,000 expires in 2017. No capital gain distributions are expected to be paid to shareholders until net gains have been realized in excess of such carryforward. It is uncertain whether the Fund will be able to realize the full benefit prior to the expiration dates.
The federal income tax basis of the Fund’s investments and the net unrealized depreciation as of October 31, 2009 was as follows:
| | | | | | |
Tax basis | | Appreciation | | Depreciation | | Net Unrealized
Depreciation |
| $184,208,008 | | $12,410,322 | | $(26,829,523) | | $(14,419,201) |
The difference between book basis and tax basis was primarily attributable to deferred losses on wash sales.
Management has analyzed the Fund’s tax positions taken on federal income tax returns for all open tax years and has concluded that as of October 31, 2009, no provisions for income tax would be required in the Fund’s financial statements. The Fund’s federal and state income and federal excise tax returns for tax years for which the applicable statutes of limitations have not expired are subject to examination by the Internal Revenue Service and state departments of revenue.
7. Portfolio Securities
Purchases and sales of securities, other than U.S. government securities and short-term obligations, during the year ended October 31, 2009, were $45,723,464 and $58,606,069, respectively.
8. Subsequent Events
Management has evaluated the impact of all subsequent events on the Fund through December 23, 2009, the date the financial statements were issued, and has been determined that except for the following, there were no subsequent events requiring recognition or disclosure in the financial statements.
On November 20, 2009, the Fund declared an ordinary income dividend of $0.0859 per Class A share, $0.0268 per Class B and Class C share, $0.0640 per Class L share, $0.0889 per Class M and Class X share and $0.1098 per Class Z share. The dividend paid to shareholders of record on November 23, 2009. The ex-dividend date was November 24, 2009.
| | |
| Dryden Mid Cap Value Fund | | 35 |
Financial Highlights
| | | | |
| | | Class A | |
| | | Year Ended
October 31, 2009(b) | |
Per Share Operating Performance: | | | | |
Net Asset Value, beginning of year | | $ | 9.07 | |
| | | | |
Income (loss) from investment operations: | | | | |
Net investment income (loss) | | | 0.09 | |
Net realized and unrealized gain (loss) on investments | | | 1.68 | |
| | | | |
Total from investment operations | | | 1.77 | |
| | | | |
Less Dividends and Distributions: | | | | |
Dividends from net investment income | | | (0.19 | ) |
Distributions from net realized gains | | | — | |
| | | | |
Total dividends and distributions | | | (0.19 | ) |
| | | | |
Net Asset Value, end of year | | $ | 10.65 | |
| | | | |
Total Return(a) | | | 20.16 | % |
Ratios/Supplemental Data: | | | | |
Net assets, end of year (in millions) | | $ | 62.4 | |
Ratios to average net assets(c): | | | | |
Expenses after advisory fee waiver and expense reimbursement | | | 1.72 | % |
Expenses before advisory fee waiver and expense reimbursement | | | 1.72 | % |
Net investment income (loss) | | | 0.97 | % |
For Class A, B, C, L, M, X and Z shares: | | | | |
Portfolio turnover rate | | | 38 | % |
| (a) | Total return does not consider the effects of sales load. Total return is calculated assuming a purchase of a share on the first day and a sale on the last day of each year reported and includes reinvestment of dividends and distributions. Total investment returns may reflect adjustments to conform to generally accepted accounting principles. Total return includes the effect of expense subsidies. |
| (b) | Calculations are based on the average daily number of shares outstanding. |
| (c) | Does not include expenses of the underlying portfolio in which the Fund invests. |
See Notes to Financial Statements.
| | |
| 36 | | Visit our website at www.jennisondryden.com |
| | | | | | | | | | | | | | |
| Class A | |
| Year Ended October 31, | |
| 2008(b) | | | 2007(b) | | | 2006(b) | | | 2005 | |
| | | | | | | | | | | | | | |
| $ | 18.38 | | | $ | 18.26 | | | $ | 20.12 | | | $ | 19.33 | |
| | | | | | | | | | | | | | |
| | | | | | | | | | | | | | | |
| | | | | | | | | | | | | | |
| | 0.15 | | | | 0.06 | | | | 0.02 | | | | (0.07 | ) |
| | (5.65 | ) | | | 1.68 | | | | 2.10 | | | | 3.11 | |
| | | | | | | | | | | | | | | |
| | | | | | | | | | | | | | | |
| | (5.50 | ) | | | 1.74 | | | | 2.12 | | | | 3.04 | |
| | | | | | | | | | | | | | | |
| | | | | | | | | | | | | | | |
| | | | | | | | | | | | | | |
| | (0.06 | ) | | | — | | | | — | | | | — | |
| | (3.75 | ) | | | (1.62 | ) | | | (3.98 | ) | | | (2.25 | ) |
| | | | | | | | | | | | | | | |
| | | | | | | | | | | | | | | |
| | (3.81 | ) | | | (1.62 | ) | | | (3.98 | ) | | | (2.25 | ) |
| | | | | | | | | | | | | | | |
| | | | | | | | | | | | | | | |
| $ | 9.07 | | | $ | 18.38 | | | $ | 18.26 | | | $ | 20.12 | |
| | | | | | | | | | | | | | | |
| | (36.25 | )% | | | 9.78 | % | | | 12.24 | % | | | 16.74 | % |
| | | | | | | | | | | | | | |
| $ | 36.1 | | | $ | 54.8 | | | $ | 45.2 | | | $ | 20.2 | |
| | | | | | | | | | | | | | |
| | 1.53 | % | | | 1.48 | % | | | 1.46 | % | | | 1.60 | % |
| | 1.53 | % | | | 1.48 | % | | | 1.46 | % | | | 1.65 | % |
| | 1.18 | % | | | 0.34 | % | | | 0.13 | % | | | (0.26 | )% |
| | | | | | | | | | | | | | |
| | 37 | % | | | 78 | % | | | 80 | % | | | 98 | % |
See Notes to Financial Statements.
| | |
| Dryden Mid Cap Value Fund | | 37 |
Financial Highlights
continued
| | | | |
| | | Class B | |
| | | Year Ended
October 31, 2009(b) | |
Per Share Operating Performance: | | | | |
Net Asset Value, beginning of year | | $ | 8.22 | |
| | | | |
Income (loss) from investment operations: | | | | |
Net investment income (loss) | | | 0.06 | |
Net realized and unrealized gain (loss) on investments | | | 1.49 | |
| | | | |
Total from investment operations | | | 1.55 | |
| | | | |
Less Dividends and Distributions: | | | | |
Dividends from net investment income | | | (0.11 | ) |
Distributions from net realized gains | | | — | |
| | | | |
Total dividends and distributions | | | (0.11 | ) |
| | | | |
Net Asset Value, end of year | | $ | 9.66 | |
| | | | |
Total Return(a) | | | 19.29 | % |
Ratios/Supplemental Data: | | | | |
Net assets, end of year (in millions) | | $ | 4.2 | |
Ratios to average net assets(c): | | | | |
Expenses after advisory fee waiver and expense reimbursement | | | 2.47 | % |
Expenses before advisory fee waiver and expense reimbursement | | | 2.47 | % |
Net investment income (loss) | | | 0.84 | % |
| (a) | Total return does not consider the effects of sales load. Total return is calculated assuming a purchase of a share on the first day and a sale on the last day of each year reported and includes reinvestment of dividends and distributions. Total investment returns may reflect adjustments to conform to generally accepted accounting principles. Total return includes the effect of expense subsidies. |
| (b) | Calculations are based on the average daily number of shares outstanding. |
| (c) | Does not include expenses of the underlying portfolio in which the Fund invests. |
See Notes to Financial Statements.
| | |
| 38 | | Visit our website at www.jennisondryden.com |
| | | | | | | | | | | | | | |
| Class B | |
| Year Ended October 31, | |
| 2008(b) | | | 2007(b) | | | 2006(b) | | | 2005 | |
| | | | | | | | | | | | | | |
| $ | 17.07 | | | $ | 17.19 | | | $ | 19.28 | | | $ | 18.74 | |
| | | | | | | | | | | | | | | |
| | | | | | | | | | | | | | |
| | 0.05 | | | | (0.07 | ) | | | (0.11 | ) | | | (0.17 | ) |
| | (5.15 | ) | | | 1.57 | | | | 2.00 | | | | 2.96 | |
| | | | | | | | | | | | | | | |
| | (5.10 | ) | | | 1.50 | | | | 1.89 | | | | 2.79 | |
| | | | | | | | | | | | | | | |
| | | | | | | | | | | | | | |
| | — | | | | — | | | | — | | | | — | |
| | (3.75 | ) | | | (1.62 | ) | | | (3.98 | ) | | | (2.25 | ) |
| | | | | | | | | | | | | | | |
| | (3.75 | ) | | | (1.62 | ) | | | (3.98 | ) | | | (2.25 | ) |
| | | | | | | | | | | | | | | |
| $ | 8.22 | | | $ | 17.07 | | | $ | 17.19 | | | $ | 19.28 | |
| | | | | | | | | | | | | | | |
| | (36.69 | )% | | | 8.99 | % | | | 11.36 | % | | | 15.85 | % |
| | | | | | | | | | | | | | |
| $ | 17.0 | | | $ | 40.6 | | | $ | 47.7 | | | $ | 3.5 | |
| | | | | | | | | | | | | | |
| | 2.28 | % | | | 2.23 | % | | | 2.21 | % | | | 2.35 | % |
| | 2.28 | % | | | 2.23 | % | | | 2.21 | % | | | 2.40 | % |
| | 0.43 | % | | | (0.42 | )% | | | (0.67 | )% | | | (1.02 | )% |
See Notes to Financial Statements.
| | |
| Dryden Mid Cap Value Fund | | 39 |
Financial Highlights
continued
| | | | |
| | | Class C | |
| | | Year Ended
October 31, 2009(b) | |
Per Share Operating Performance: | | | | |
Net Asset Value, beginning of year | | $ | 8.20 | |
| | | | |
Income (loss) from investment operations: | | | | |
Net investment income (loss) | | | 0.03 | |
Net realized and unrealized gain (loss) on investments | | | 1.51 | |
| | | | |
Total from investment operations | | | 1.54 | |
| | | | |
Less Dividends and Distributions: | | | | |
Dividends from net investment income | | | (0.11 | ) |
Distributions from net realized gains | | | — | |
| | | | |
Total dividends and distributions | | | (0.11 | ) |
| | | | |
Net Asset Value, end of year | | $ | 9.63 | |
| | | | |
Total Return(a) | | | 19.21 | % |
Ratios/Supplemental Data: | | | | |
Net assets, end of year (in millions) | | $ | 27.8 | |
Ratios to average net assets(c): | | | | |
Expenses after advisory fee waiver and expense reimbursement | | | 2.47 | % |
Expenses before advisory fee waiver and expense reimbursement | | | 2.47 | % |
Net investment income (loss) | | | 0.43 | % |
| (a) | Total return does not consider the effects of sales load. Total return is calculated assuming a purchase of a share on the first day and a sale on the last day of each year reported and includes reinvestment of dividends and distributions. Total investment returns may reflect adjustments to conform to generally accepted accounting principles. Total return includes the effect of expense subsidies. |
| (b) | Calculations are based on the average daily number of shares outstanding. |
| (c) | Does not include expenses of the underlying portfolio in which the Fund invests. |
See Notes to Financial Statements.
| | |
| 40 | | Visit our website at www.jennisondryden.com |
| | | | | | | | | | | | | | |
| Class C | |
| Year Ended October 31, | |
| 2008(b) | | | 2007(b) | | | 2006(b) | | | 2005 | |
| | | | | | | | | | | | | | |
| $ | 17.05 | | | $ | 17.17 | | | $ | 19.25 | | | $ | 18.73 | |
| | | | | | | | | | | | | | | |
| | | | | | | | | | | | | | |
| | 0.05 | | | | (0.07 | ) | | | (0.10 | ) | | | (0.21 | ) |
| | (5.15 | ) | | | 1.57 | | | | 2.00 | | | | 2.98 | |
| | | | | | | | | | | | | | | |
| | (5.10 | ) | | | 1.50 | | | | 1.90 | | | | 2.77 | |
| | | | | | | | | | | | | | | |
| | | | | | | | | | | | | | |
| | — | | | | — | | | | — | | | | — | |
| | (3.75 | ) | | | (1.62 | ) | | | (3.98 | ) | | | (2.25 | ) |
| | | | | | | | | | | | | | | |
| | (3.75 | ) | | | (1.62 | ) | | | (3.98 | ) | | | (2.25 | ) |
| | | | | | | | | | | | | | | |
| $ | 8.20 | | | $ | 17.05 | | | $ | 17.17 | | | $ | 19.25 | |
| | | | | | | | | | | | | | | |
| | (36.74 | )% | | | 9.00 | % | | | 11.45 | % | | | 15.75 | % |
| | | | | | | | | | | | | | |
| $ | 28.8 | | | $ | 67.3 | | | $ | 80.2 | | | $ | 56.0 | |
| | | | | | | | | | | | | | |
| | 2.28 | % | | | 2.23 | % | | | 2.21 | % | | | 2.35 | % |
| | 2.28 | % | | | 2.23 | % | | | 2.21 | % | | | 2.40 | % |
| | 0.42 | % | | | (0.42 | )% | | | (0.58 | )% | | | (1.03 | )% |
See Notes to Financial Statements.
| | |
| Dryden Mid Cap Value Fund | | 41 |
Financial Highlights
continued
| | | | |
| | | Class L | |
| | | Year Ended
October 31, 2009(b) | |
Per Share Operating Performance: | | | | |
Net Asset Value, beginning of year | | $ | 8.91 | |
| | | | |
Income (loss) from investment operations: | | | | |
Net investment income (loss) | | | 0.08 | |
Net realized and unrealized gain (loss) on investments | | | 1.63 | |
| | | | |
Total from investment operations | | | 1.71 | |
| | | | |
Less Dividends and Distributions: | | | | |
Dividends from net investment income | | | (0.16 | ) |
Distributions from net realized gains | | | — | |
| | | | |
Total dividends and distributions | | | (0.16 | ) |
| | | | |
Net Asset Value, end of year | | $ | 10.46 | |
| | | | |
Total Return(a) | | | 19.75 | % |
Ratios/Supplemental Data: | | | | |
Net assets, end of year (in millions) | | $ | 11.5 | |
Ratios to average net assets(c): | | | | |
Expenses after advisory fee waiver and expense reimbursement | | | 1.97 | % |
Expenses before advisory fee waiver and expense reimbursement | | | 1.97 | % |
Net investment income (loss) | | | 0.94 | % |
| (a) | Total return does not consider the effects of sales load. Total return is calculated assuming a purchase of a share on the first day and a sale on the last day of each year reported and includes reinvestment of dividends and distributions. Total investment returns may reflect adjustments to conform to generally accepted accounting principles. Total return includes the effect of expense subsidies. |
| (b) | Calculations are based on the average daily number of shares outstanding. |
| (c) | Does not include expenses of the underlying portfolio in which the Fund invests. |
| * | Amount is less than $0.005. |
See Notes to Financial Statements.
| | |
| 42 | | Visit our website at www.jennisondryden.com |
| | | | | | | | | | | | | | |
| Class L | |
| Year Ended October 31, | |
| 2008(b) | | | 2007(b) | | | 2006(b) | | | 2005 | |
| | | | | | | | | | | | | | |
| $ | 18.12 | | | $ | 18.07 | | | $ | 19.98 | | | $ | 19.28 | |
| | | | | | | | | | | | | | | |
| | | | | | | | | | | | | | |
| | 0.12 | | | | 0.01 | | | | — | * | | | (0.10 | ) |
| | (5.56 | ) | | | 1.66 | | | | 2.07 | | | | 3.05 | |
| | | | | | | | | | | | | | | |
| | (5.44 | ) | | | 1.67 | | | | 2.07 | | | | 2.95 | |
| | | | | | | | | | | | | | | |
| | | | | | | | | | | | | | |
| | (0.02 | ) | | | — | | | | — | | | | — | |
| | (3.75 | ) | | | (1.62 | ) | | | (3.98 | ) | | | (2.25 | ) |
| | | | | | | | | | | | | | | |
| | (3.77 | ) | | | (1.62 | ) | | | (3.98 | ) | | | (2.25 | ) |
| | | | | | | | | | | | | | | |
| $ | 8.91 | | | $ | 18.12 | | | $ | 18.07 | | | $ | 19.98 | |
| | | | | | | | | | | | | | | |
| | (36.41 | )% | | | 9.54 | % | | | 11.99 | % | | | 16.29 | % |
| | | | | | | | | | | | | | |
| $ | 12.5 | | | $ | 29.1 | | | $ | 38.3 | | | $ | 49.1 | |
| | | | | | | | | | | | | | |
| | 1.78 | % | | | 1.73 | % | | | 1.71 | % | | | 1.85 | % |
| | 1.78 | % | | | 1.73 | % | | | 1.71 | % | | | 1.90 | % |
| | 0.93 | % | | | 0.08 | % | | | (0.01 | )% | | | (0.53 | )% |
See Notes to Financial Statements.
| | |
| Dryden Mid Cap Value Fund | | 43 |
Financial Highlights
continued
| | | | |
| | | Class M | |
| | | Year Ended
October 31, 2009(b) | |
Per Share Operating Performance: | | | | |
Net Asset Value, beginning of year | | $ | 8.27 | |
| | | | |
Income (loss) from investment operations: | | | | |
Net investment income (loss) | | | 0.11 | |
Net realized and unrealized gain (loss) on investments | | | 1.50 | |
| | | | |
Total from investment operations | | | 1.61 | |
| | | | |
Less Dividends and Distributions: | | | | |
Dividends from net investment income | | | (0.18 | ) |
Distributions from net realized gains | | | — | |
| | | | |
Total dividends and distributions | | | (0.18 | ) |
| | | | |
Capital Contributions | | | 0.03 | |
| | | | |
Net Asset Value, end of year | | $ | 9.73 | |
| | | | |
Total Return(a) | | | 20.42 | % |
Ratios/Supplemental Data: | | | | |
Net assets, end of year (in millions) | | $ | 9.5 | |
Ratios to average net assets(d): | | | | |
Expenses after advisory fee waiver and expense reimbursement | | | 1.72 | % |
Expenses before advisory fee waiver and expense reimbursement | | | 1.72 | % |
Net investment income (loss) | | | 1.39 | % |
| (a) | Total return does not consider the effects of sales load. Total return is calculated assuming a purchase of a share on the first day and a sale on the last day of each year reported and includes reinvestment of dividends and distributions. Total investment returns may reflect adjustments to conform to generally accepted accounting principles. Total return includes the effect of expense subsidies. |
| (b) | Calculations are based on the average daily number of shares outstanding. |
| (c) | Total return has been adjusted to reflect the manager payment for sales charges in excess of regulatory limits. If the manager had not adjusted the Fund, the total return would have been 8.95% for the year ended October 31, 2007. |
| (d) | Does not include expenses of the underlying portfolio in which the Fund invests. |
| (e) | Certain information has been adjusted to reflect a manager payment for sales charges incurred by shareholders in excess of regulatory limits. If the manager had not adjusted the Fund, the per share operating performance would reflect a net investment loss, net realized and unrealized gain on investments and distributions from net unrealized gains of $(0.07), $1.56 and $(1.62), respectively. Furthermore, the annual expenses (both after and before fee waiver and expense reimbursement) and net investment income ratios would have been 2.23%, 2.23% and (0.43)%, respectively and the ending net asset value would be $17.03 for the year ended October 31, 2007. |
See Notes to Financial Statements.
| | |
| 44 | | Visit our website at www.jennisondryden.com |
| | | | | | | | | | | | | | |
| Class M | |
| Year Ended October 31, | |
| 2008(b) | | | 2007(b)(e) | | | 2006(b) | | | 2005 | |
| | | | | | | | | | | | | | |
| $ | 17.06 | | | $ | 17.16 | | | $ | 19.25 | | | $ | 18.73 | |
| | | | | | | | | | | | | | | |
| | | | | | | | | | | | | | |
| | 0.14 | | | | 0.02 | | | | (0.09 | ) | | | (0.22 | ) |
| | (5.10 | ) | | | 1.60 | | | | 1.98 | | | | 2.99 | |
| | | | | | | | | | | | | | | |
| | (4.96 | ) | | | 1.62 | | | | 1.89 | | | | 2.77 | |
| | | | | | | | | | | | | | | |
| | | | | | | | | | | | | | |
| | — | | | | — | | | | — | | | | — | |
| | (3.84 | ) | | | (1.74 | ) | | | (3.98 | ) | | | (2.25 | ) |
| | | | | | | | | | | | | | | |
| | (3.84 | ) | | | (1.74 | ) | | | (3.98 | ) | | | (2.25 | ) |
| | | | | | | | | | | | | | | |
| | 0.01 | | | | 0.02 | | | | — | | | | — | |
| | | | | | | | | | | | | | | |
| $ | 8.27 | | | $ | 17.06 | | | $ | 17.16 | | | $ | 19.25 | |
| | | | | | | | | | | | | | | |
| | (35.54 | )% | | | 9.92 | %(c) | | | 11.38 | % | | | 15.75 | % |
| | | | | | | | | | | | | | |
| $ | 20.3 | | | $ | 69.7 | | | $ | 107.8 | | | $ | 138.4 | |
| | | | | | | | | | | | | | |
| | 1.67 | % | | | 1.69 | % | | | 2.21 | % | | | 2.35 | % |
| | 1.67 | % | | | 1.69 | % | | | 2.21 | % | | | 2.40 | % |
| | 1.17 | % | | | 0.11 | % | | | (0.51 | )% | | | (1.03 | )% |
| | |
| Dryden Mid Cap Value Fund | | 45 |
Financial Highlights
continued
| | | | |
| | | Class X | |
| | | Year Ended
October 31, 2009(b) | |
Per Share Operating Performance: | | | | |
Net Asset Value, beginning of year | | $ | 8.37 | |
| | | | |
Income (loss) from investment operations: | | | | |
Net investment income (loss) | | | 0.10 | |
Net realized and unrealized gain (loss) on investments | | | 1.52 | |
| | | | |
Total from investment operations | | | 1.62 | |
| | | | |
Less Dividends and Distributions: | | | | |
Dividends from net investment income | | | (0.21 | ) |
Distributions from net realized gains | | | — | |
| | | | |
Total dividends and distributions | | | (0.21 | ) |
| | | | |
Capital Contributions | | | 0.01 | |
| | | | |
Net Asset Value, end of year | | $ | 9.79 | |
| | | | |
Total Return(a) | | | 20.15 | % |
Ratios/Supplemental Data: | | | | |
Net assets, end of year (in millions) | | $ | 5.3 | |
Ratios to average net assets(d): | | | | |
Expenses after advisory fee waiver and expense reimbursement | | | 1.72 | % |
Expenses before advisory fee waiver and expense reimbursement | | | 1.72 | % |
Net investment income (loss) | | | 1.24 | % |
| (a) | Total return does not consider the effects of sales load. Total return is calculated assuming a purchase of a share on the first day and a sale on the last day of each year reported and includes reinvestment of dividends and distributions. Total investment returns may reflect adjustments to conform to generally accepted accounting principles. Total return includes the effect of expense subsidies. |
| (b) | Calculations are based on the average daily number of shares outstanding. |
| (c) | Certain information has been adjusted to reflect a manager payment for sales charges incurred by shareholders in excess of regulatory limits. Total return has not been adjusted to reflect the manager payment for sales charges in excess of regulatory limits. |
| (d) | Does not include expenses of the underlying portfolio in which the Fund invests. |
| (e) | Less than $0.005 per share. |
See Notes to Financial Statements.
| | |
| 46 | | Visit our website at www.jennisondryden.com |
| | | | | | | | | | | | | | |
| Class X | |
| Year Ended October 31, | |
| 2008(b) | | | 2007(b)(c) | | | 2006(b)(c) | | | 2005(c) | |
| | | | | | | | | | | | | | |
| $ | 17.29 | | | $ | 17.23 | | | $ | 19.19 | | | $ | 18.69 | |
| | | | | | | | | | | | | | | |
| | | | | | | | | | | | | | |
| | 0.15 | | | | 0.10 | | | | 0.05 | | | | (0.21 | ) |
| | (5.21 | ) | | | 1.58 | | | | 1.97 | | | | 2.97 | |
| | | | | | | | | | | | | | | |
| | (5.06 | ) | | | 1.68 | | | | 2.02 | | | | 2.76 | |
| | | | | | | | | | | | | | | |
| | | | | | | | | | | | | | |
| | (0.11 | ) | | | — | | | | — | | | | — | |
| | (3.75 | ) | | | (1.62 | ) | | | (3.98 | ) | | | (2.26 | ) |
| | | | | | | | | | | | | | | |
| | (3.86 | ) | | | (1.62 | ) | | | (3.98 | ) | | | (2.26 | ) |
| | | | | | | | | | | | | | | |
| | — | (e) | | | — | (e) | | | — | (e) | | | — | (e) |
| | | | | | | | | | | | | | | |
| $ | 8.37 | | | $ | 17.29 | | | $ | 17.23 | | | $ | 19.19 | |
| | | | | | | | | | | | | | | |
| | (36.07 | )% | | | 10.04 | % | | | 12.33 | % | | | 15.67 | % |
| | | | | | | | | | | | | | |
| $ | 6.9 | | | $ | 15.7 | | | $ | 19.7 | | | $ | 24.8 | |
| | | | | | | | | | | | | | |
| | 1.48 | % | | | 1.23 | % | | | 1.38 | % | | | 2.32 | % |
| | 1.48 | % | | | 1.23 | % | | | 1.38 | % | | | 2.37 | % |
| | 1.23 | % | | | 0.58 | % | | | 0.32 | % | | | (0.99 | )% |
See Notes to Financial Statements.
| | |
| Dryden Mid Cap Value Fund | | 47 |
Financial Highlights
continued
| | | | |
| | | Class Z | |
| | | Year Ended
October 31, 2009(e) | |
Per Share Operating Performance: | | | | |
Net Asset Value, beginning of period | | $ | 9.14 | |
| | | | |
Income (loss) from investment operations: | | | | |
Net investment income | | | 0.11 | |
Net realized and unrealized gain (loss) on investments | | | 1.69 | |
| | | | |
Total from investment operations | | | 1.80 | |
| | | | |
Less Dividends and Distributions: | | | | |
Dividends from net investment income | | | (0.22 | ) |
Distributions from net realized gains | | | — | |
| | | | |
Total dividends and distributions | | | (0.22 | ) |
| | | | |
Net Asset Value, end of period | | $ | 10.72 | |
| | | | |
Total Return(a) | | | 20.41 | % |
Ratios/Supplemental Data: | | | | |
Net assets, end of period (in millions) | | $ | 16.2 | |
Ratios to average net assets(c): | | | | |
Expenses after advisory fee waiver and expense reimbursement | | | 1.47 | % |
Expenses before advisory fee waiver and expense reimbursement | | | 1.47 | % |
Net investment income | | | 1.18 | % |
| (a) | Total return does not consider the effects of sales load. Total return is calculated assuming a purchase of a share on the first day and a sale on the last day of each period reported and includes reinvestment of dividends and distributions. Total investment returns may reflect adjustments to conform to generally accepted accounting principles. Total return for periods of less than a full year are not annualized. Total return includes the effect of expense subsidies. |
| (c) | Does not include expenses of the underlying portfolio in which the Fund invests. |
| (d) | Commencement of operations. |
| (e) | Calculations are based on the average daily number of shares outstanding. |
See Notes to Financial Statements.
| | |
| 48 | | Visit our website at www.jennisondryden.com |
| | | | | | | | | | | | |
| Class Z | | | |
| Year Ended October 31, | | | November 28, 2005(d)
through
October 31, 2006(e) | | | |
| 2008(e) | | | 2007(e) | | | | |
| | | | | | | | | | | | |
| $ | 18.50 | | | $ | 18.30 | | | $ | 17.08 | | | |
| | | | | | | | | | | | | |
| | | | | | | | | | | | |
| | 0.18 | | | | 0.11 | | | | 0.05 | | | |
| | (5.68 | ) | | | 1.71 | | | | 1.17 | | | |
| | | | | | | | | | | | | |
| | (5.50 | ) | | | 1.82 | | | | 1.22 | | | |
| | | | | | | | | | | | | |
| | | | | | | | | | | | |
| | (0.11 | ) | | | — | | | | — | | | |
| | (3.75 | ) | | | (1.62 | ) | | | — | | | |
| | | | | | | | | | | | | |
| | (3.86 | ) | | | (1.62 | ) | | | — | | | |
| | | | | | | | | | | | | |
| $ | 9.14 | | | $ | 18.50 | | | $ | 18.30 | | | |
| | | | | | | | | | | | | |
| | (36.08 | )% | | | 10.24 | % | | | 7.14 | % | | |
| | | | | | | | | | | | |
| $ | 8.2 | | | $ | 13.8 | | | $ | 12.4 | | | |
| | | | | | | | | | | | |
| | 1.28 | % | | | 1.23 | % | | | 1.21 | %(b) | | |
| | 1.28 | % | | | 1.23 | % | | | 1.21 | %(b) | | |
| | 1.43 | % | | | 0.58 | % | | | 0.32 | %(b) | | |
See Notes to Financial Statements.
| | |
| Dryden Mid Cap Value Fund | | 49 |
Report of Independent Registered Public Accounting Firm
The Board of Directors and Shareholders
Strategic Partners Mutual Funds, Inc.:
We have audited the accompanying statement of assets and liabilities of Dryden Mid Cap Value Fund, a series of Strategic Partners Mutual Funds, Inc. (hereafter referred to as the “Fund”), including the portfolio of investments, as of October 31, 2009, and the related statement of operations for the year then ended, the statement of changes in net assets for each of the years in the two-year period then ended and the financial highlights for each of the years in the five-year period then ended. These financial statements and financial highlights are the responsibility of the Fund’s management. Our responsibility is to express an opinion on these financial statements and financial highlights based on our audits.
We conducted our audits in accordance with the standards of the Public Company Accounting Oversight Board (United States). Those standards require that we plan and perform the audit to obtain reasonable assurance about whether the financial statements and financial highlights are free of material misstatement. An audit includes examining, on a test basis, evidence supporting the amounts and disclosures in the financial statements. Our procedures included confirmation of securities owned as of October 31, 2009, by correspondence with the custodian, transfer agent and brokers or by other appropriate auditing procedures where replies from brokers were not received. An audit also includes assessing the accounting principles used and significant estimates made by management, as well as evaluating the overall financial statement presentation. We believe that our audits provide a reasonable basis for our opinion.
In our opinion, the financial statements and financial highlights referred to above present fairly, in all material respects, the financial position of the Fund as of October 31, 2009, and the results of its operations for the year then ended, the changes in its net assets for each of the years in the two-year period then ended and the financial highlights for each of the years in the five-year period then ended, in conformity with U.S. generally accepted accounting principles.

New York, New York
December 23, 2009
| | |
| 50 | | Visit our website at www.jennisondryden.com |
Tax Information
(Unaudited)
We are required by the Internal Revenue Code of 1986, as amended (“the Code”) to advise you within 60 days of the Fund’s fiscal year end (October 31, 2009), as to the federal income tax status of dividends paid by the Fund during such fiscal year. For the fiscal year ended October 31, 2009, the Fund paid ordinary income dividends of $0.19 for Class A shares, $0.11 for Class B and Class C shares, $0.16 for Class L shares, $0.18 for Class M shares, $0.21 for Class X shares and $0.22 for Class Z shares.
For the year ended October 31, 2009, the Fund designates the maximum amount allowable, but not less than 100% of ordinary income dividends paid during the fiscal year as eligible for the corporate dividend received deduction in accordance with Section 854 of the Internal Revenue Code.
For the year ended October 31, 2009, the Fund designates the maximum amount allowable, but not less than 100% of ordinary income dividends paid during the fiscal year as qualified dividend income in accordance with Section 854 of the Internal Revenue Code.
In January 2010, you will be advised on IRS Form 1099DIV or substitute 1099DIV as to federal tax status of dividends and distributions received by you in calendar year 2009.
| | |
| Dryden Mid Cap Value Fund | | 51 |
MANAGEMENT OF THE FUND
(Unaudited)
Information about Fund Directors/Trustees (referred to herein as “Board Members”) and Fund Officers is set forth below. Board Members who are not deemed to be “interested persons,” as defined in the 1940 Act, are referred to as “Independent Board Members.” Board Members who are deemed to be “interested persons” are referred to as “Interested Board Members.” The Board Members are responsible for the overall supervision of the operations of the Fund and perform the various duties imposed on the directors or trustees of investment companies by the 1940 Act.
| | | | | | |
| Independent Board Members (1) | | | | | | |
Name, Address, Age Position(s) Portfolios Overseen | | Principal Occupation(s) During Past Five Years | | | | Other Directorships Held |
Kevin J. Bannon (57) Board Member Portfolios Overseen: 57 | | Managing Director (since April 2008) of Highmount Capital LLC (registered investment adviser); formerly Executive Vice President and Chief Investment Officer (April 1993-August 2007) of Bank of New York Company; President (May 2003-May 2007) of BNY Hamilton Family of Mutual Funds. | | | | Director of Urstadt Biddle Properties (since September 2008). |
Linda W. Bynoe (57) Board Member Portfolios Overseen: 57 | | President and Chief Executive Officer (since March 1995) of Telemat Ltd. (management consulting); formerly Vice President at Morgan Stanley & Co (broker-dealer). | | | | Director of Simon Property Group, Inc. (real estate investment trust) (since May 2003); Anixter International (communication products distributor) (since January 2006); Director of Northern Trust Corporation (banking) (since April 2006). |
David E.A. Carson (75) Board Member Portfolios Overseen: 57 | | Director (since May 2008) of Liberty Bank; Director (since October 2007) of ICI Mutual Insurance Company; formerly President, Chairman and Chief Executive Officer of People’s Bank (1987 – 2000). | | | | None. |
Michael S. Hyland, CFA (64) Board Member Portfolios Overseen: 57 | | Independent Consultant (since February 2005); formerly Senior Managing Director (July 2001-February 2005) of Bear Stearns & Co, Inc.; Global Partner, INVESCO (1999-2001); Managing Director and President Salomon Brothers Asset Management (1989-1999). | | | | None. |
Robert E. La Blanc (75) Board Member Portfolios Overseen: 57 | | President (since 1981) of Robert E. La Blanc Associates, Inc. (telecommunications). | | | | Director of CA, Inc. (since 2002) (software company); FiberNet Telecom Group, Inc. (since 2003) (telecom company). |
Visit our website at www.jennisondryden.com
| | | | | | |
Douglas H. McCorkindale (70) Board Member Portfolios Overseen: 57 | | Formerly Chairman (February 2001-June 2006), Chief Executive Officer (June 2000-July 2005), President (September 1997-July 2005) and Vice Chairman (March 1984-May 2000) of Gannett Co. Inc. (publishing and media). | | | | Director of Continental Airlines, Inc. (since May 1993); Director of Lockheed Martin Corp. (aerospace and defense) (since May 2001). |
Stephen P. Munn (67) Board Member Portfolios Overseen: 57 | | Lead Director (since 2007) and formerly Chairman (1993-2007) of Carlisle Companies Incorporated (manufacturer of industrial products). | | | | None. |
Richard A. Redeker (66) Board Member Portfolios Overseen: 57 | | Retired Mutual Fund Executive (36 years); Management Consultant; Director of Penn Tank Lines, Inc. (since 1999). | | | | None. |
Robin B. Smith (70) Board Member & Independent Chair Portfolios Overseen: 57 | | Chairman of the Board (since January 2003) of Publishers Clearing House (direct marketing); formerly Chairman and Chief Executive Officer (August 1996-January 2003) of Publishers Clearing House. | | | | Formerly Director of BellSouth Corporation (telecommunications) (1992-2006). |
Stephen G. Stoneburn (66) Board Member Portfolios Overseen: 57 | | President and Chief Executive Officer (since June 1996) of Quadrant Media Corp. (publishing company); formerly President (June 1995-June 1996) of Argus Integrated Media, Inc.; Senior Vice President and Managing Director (January 1993-1995) of Cowles Business Media; Senior Vice President of Fairchild Publications, Inc (1975-1989). | | | | None. |
| | | | | | |
| Interested Board Member (1) | | | | | | |
Judy A. Rice (61) Board Member & President Portfolios Overseen: 57 | | President, Chief Executive Officer, Chief Operating Officer and Officer-In-Charge (since February 2003) of Prudential Investments LLC; President, Chief Executive Officer and Officer-In-Charge (since April 2003) of Prudential Mutual Fund Services LLC; Executive Vice President (since December 2008) of Prudential Investment Management Services LLC; formerly Vice President (February 1999-April 2006) of Prudential Investment Management Services LLC; formerly President, Chief Executive Officer, Chief Operating Officer and Officer-In-Charge (May 2003-June 2005) and Director (May 2003-March 2006) and Executive Vice President (June 2005- March 2006) of AST Investment Services, Inc.; Member of Board of Governors of the Investment Company Institute. | | | | None. |
Dryden Mid Cap Value Fund
| 1 | The year in which each individual joined the Fund’s Board is as follows: Linda W. Bynoe, 2005; David E.A. Carson, 1993; Robert E. La Blanc, 2003; Douglas H. McCorkindale, 2003, Richard A. Redeker, 2003; Robin B. Smith, 2003; Stephen G. Stoneburn, 2003; Kevin J. Bannon, 2008; Michael S. Hyland, 2008; Stephen P. Munn, 2008; Judy A. Rice, Board Member and President since 2003. |
Visit our website at www.jennisondryden.com
| | | | |
| Fund Officers (a)(1) | | | | |
Name, Address and Age
Position with Fund | | | | Principal Occupation(s) During Past Five Years |
Scott E. Benjamin (36) Vice President | | | | Executive Vice President (since June 2009) of Prudential Investments LLC and Prudential Investment Management Services LLC; Senior Vice President Product Development and Marketing, Prudential Investments (since February 2006); Vice President Product Development and Product Management, Prudential Investments (2003-2006). |
Kathryn L. Quirk (57) Chief Legal Officer | | | | Vice President and Corporate Counsel (since September 2004) of Prudential; Executive Vice President, Chief Legal Officer and Secretary (since July 2005) of PI and Prudential Mutual Fund Services LLC; Vice President and Corporate Counsel (since June 2005) and Secretary (since February 2006) of AST Investment Services, Inc.; formerly Senior Vice President and Assistant Secretary (November 2004-August 2005) of PI; formerly Assistant Secretary (June 2005-February 2006) of AST Investment Services, Inc.; formerly Managing Director, General Counsel, Chief Compliance Officer, Chief Risk Officer and Corporate Secretary (1997-2002) of Zurich Scudder Investments, Inc. |
Deborah A. Docs (51) Secretary | | | | Vice President and Corporate Counsel (since January 2001) of Prudential; Vice President (since December 1996) and Assistant Secretary (since March 1999) of PI; formerly Vice President and Assistant Secretary (May 2003-June 2005) of AST Investment Services, Inc. |
Jonathan D. Shain (51) Assistant Secretary | | | | Vice President and Corporate Counsel (since August 1998) of Prudential; Vice President and Assistant Secretary (since May 2001) of PI; Vice President and Assistant Secretary (since February 2001) of PMFS; formerly Vice President and Assistant Secretary (May 2003-June 2005) of AST Investment Services, Inc. |
Claudia DiGiacomo (35) Assistant Secretary | | | | Vice President and Corporate Counsel (since January 2005) of Prudential; Vice President and Assistant Secretary of PI (since December 2005); Associate at Sidley Austin Brown & Wood LLP (1999-2004). |
John P. Schwartz (38) Assistant Secretary | | | | Vice President and Corporate Counsel (since April 2005) of Prudential; Vice President and Assistant Secretary of PI (since December 2005); Associate at Sidley Austin Brown & Wood LLP (1997-2005). |
Andrew R. French (47) Assistant Secretary | | | | Director and Corporate Counsel (since May 2006) of Prudential; Vice President and Assistant Secretary (since January 2007) of PI; Vice President and Assistant Secretary (since January 2007) of PMFS; formerly Senior Legal Analyst of Prudential Mutual Fund Law Department (1997-2006). |
Timothy J. Knierim (50) Chief Compliance Officer | | | | Chief Compliance Officer of Prudential Investment Management, Inc. (since July 2007); formerly Chief Risk Officer of PIM and PI (2002-2007) and formerly Chief Ethics Officer of PIM and PI (2006-2007). |
Valerie M. Simpson (51) Deputy Chief Compliance Officer | | | | Chief Compliance Officer (since April 2007) of PI and AST Investment Services, Inc.; formerly Vice President-Financial Reporting (June 1999-March 2006) for Prudential Life and Annuities Finance. |
Dryden Mid Cap Value Fund
| | | | |
Theresa C. Thompson (47)
Deputy Chief Compliance
Officer | | | | Vice President, Compliance, PI (since April 2004); and Director, Compliance, PI (2001-2004). |
Noreen M. Fierro (45)
Anti-Money Laundering
Compliance Officer | | | | Vice President, Corporate Compliance (since May 2006) of Prudential; formerly Corporate Vice President, Associate General Counsel (April 2002-May 2005) of UBS Financial Services, Inc., in their Money Laundering Prevention Group; Senior Manager (May 2005-May 2006) of Deloitte Financial Advisory Services, LLP, in their Forensic and Dispute Services, Anti-Money Laundering Group. |
Grace C. Torres (50)
Treasurer and Principal
Financial and Accounting
Officer | | | | Assistant Treasurer (since March 1999) and Senior Vice President (since September 1999) of PI; Assistant Treasurer (since May 2003) and Vice President (since June 2005) of AST Investment Services, Inc.; Senior Vice President and Assistant Treasurer (since May 2003) of Prudential Annuities Advisory Services, Inc.; formerly Senior Vice President (May 2003-June 2005) of AST Investment Services, Inc. |
M. Sadiq Peshimam (45)
Assistant Treasurer | | | | Vice President (since 2005) and Director (2000-2005) within Prudential Mutual Fund Administration. |
Peter Parrella (51)
Assistant Treasurer | | | | Vice President (since 2007) and Director (2004-2007) within Prudential Mutual Fund Administration; formerly Tax Manager at SSB Citi Fund Management LLC (1997-2004). |
| (a) | Excludes the interested Board Member who also serve as President. |
| 1 | The year in which each individual became an Officer of the Fund is as follows: |
Scott E. Benjamin, 2009; Kathryn L. Quirk, 2005; Deborah A. Docs, 2003; Jonathan D. Shain, 2003; Claudia DiGiacomo, 2005; John P. Schwartz, 2006; Andrew R. French, 2006; Timothy J. Knierim, 2007; Valerie M. Simpson, 2007; Theresa C. Thompson, 2008; Noreen M. Fierro, 2006; Grace C. Torres, 2003; Peter Parrella, 2007; M. Sadiq Peshimam, 2006.
Explanatory Notes
| • | | Board Members are deemed to be “Interested,” as defined in the 1940 Act, by reason of their affiliation with Prudential Investments LLC and/or an affiliate of Prudential Investments LLC. |
| • | | Unless otherwise noted, the address of all Board Members and Officers is c/o Prudential Investments LLC, Gateway Center Three, 100 Mulberry Street, Newark, New Jersey 07102. |
| • | | There is no set term of office for Board Members or Officers. The Board Members have adopted a retirement policy, which calls for the retirement of Board Members on December 31st of the year in which they reach the age of 75. |
| • | | “Other Directorships Held” includes only directorships of companies required to register or file reports with the SEC under the Securities Exchange Act of 1934 (that is, “public companies”) or other investment companies registered under the 1940 Act. |
| • | | “Portfolios Overseen” includes all investment companies managed by Prudential Investments LLC. The investment companies for which PI serves as manager include the JennisonDryden Funds, Strategic Partners Funds, The Prudential Variable Contract Accounts, The Target Portfolio Trust, The Prudential Series Fund, Prudential’s Gibraltar Fund, Inc. and the Advanced Series Trust. |
Visit our website at www.jennisondryden.com
Approval of Advisory Agreements
The Fund’s Board of Directors
The Board of Directors (the “Board”) of Dryden Mid Cap Value Fund (the “Fund”) 1 consists of 11 individuals, 10 of whom are not “interested persons” of the Fund, as defined in the Investment Company Act of 1940, as amended (the “1940 Act”) (the “Independent Directors”). The Board is responsible for the oversight of the Fund and its operations, and performs the various duties imposed on the directors of investment companies by the 1940 Act. The Independent Directors have retained independent legal counsel to assist them in connection with their duties. The Chair of the Board is an Independent Director. The Board has established three standing committees: the Audit Committee, the Nominating and Governance Committee, and the JennisonDryden Investment Committee. Each committee is chaired by, and composed of, Independent Directors.
Annual Approval of the Fund’s Advisory Agreements
As required under the 1940 Act, the Board determines annually whether to renew the Fund’s management agreement with Prudential Investments LLC (“PI”) and the Fund’s subadvisory agreement with Quantitative Management Associates LLC (“QMA”). In considering the renewal of the agreements, the Board, including all of the Independent Directors, met on June 2-4, 2009 and approved the renewal of the agreements through July 31, 2010, after concluding that renewal of the agreements was in the best interests of the Fund and its shareholders.
In advance of the meetings, the Board requested and received materials relating to the agreements, and had the opportunity to ask questions and request further information in connection with its consideration. Among other things, the Board considered comparisons with other mutual funds in relevant Peer Universes and Peer Groups. The mutual funds included in each Peer Universe or Peer Group were objectively determined by Lipper Inc., an independent provider of mutual fund data. The comparisons placed the Fund in various quartiles over the one- and three-year periods ending December 31, 2008, with the first quartile being the best 25% of the mutual funds (for performance, the best performing mutual funds and, for expenses, the lowest cost mutual funds).
In approving the agreements, the Board, including the Independent Directors advised by independent legal counsel, considered the factors it deemed relevant, including the nature, quality and extent of services provided by PI and the subadviser, the performance of the Fund, the profitability of PI and its affiliates, expenses and fees, and the potential for economies of scale that may be shared with the Fund and its
| 1 | Dryden Mid Cap Value Fund is a series of Strategic Partners Mutual Funds, Inc. |
| | |
| Dryden Mid Cap Value Fund | | |
Approval of Advisory Agreements (continued)
shareholders. In their deliberations, the Directors did not identify any single factor which alone was responsible for the Board’s decision to approve the agreements with respect to the Fund. In connection with its deliberations, the Board considered information provided by PI throughout the year at regular Board meetings, presentations from portfolio managers and other information, as well as information furnished at or in advance of the meetings on June 2-4, 2009.
The Directors determined that the overall arrangements between the Fund and PI, which serves as the Fund’s investment manager pursuant to a management agreement, and between PI and QMA, which serves as the Fund’s subadviser pursuant to the terms of a subadvisory agreement with PI, are fair and reasonable in light of the services performed, fees charged and such other matters as the Directors considered relevant in the exercise of their business judgment.
The material factors and conclusions that formed the basis for the Directors’ reaching their determinations to approve the continuance of the agreements are separately discussed below.
Nature, Quality, and Extent of Services
The Board received and considered information regarding the nature, quality and extent of services provided to the Fund by PI and QMA. The Board considered the services provided by PI, including but not limited to the oversight of the subadviser for the Fund, as well as the provision of fund recordkeeping, compliance, and other services to the Fund. With respect to PI’s oversight of the subadviser, the Board noted that PI’s Strategic Investment Research Group (“SIRG”), which is a business unit of PI, is responsible for monitoring and reporting to PI’s senior management on the performance and operations of the subadviser. The Board also considered that PI pays the salaries of all of the officers and non-independent Directors of the Fund. The Board also considered the investment subadvisory services provided by QMA, as well as adherence to the Fund’s investment restrictions and compliance with applicable Fund policies and procedures. The Board considered PI’s evaluation of the subadviser, as well as PI’s recommendation, based on its review of the subadviser, to renew the subadvisory agreement.
The Board reviewed the qualifications, backgrounds and responsibilities of PI’s senior management responsible for the oversight of the Fund and QMA, and also reviewed the qualifications, backgrounds and responsibilities of the QMA portfolio managers who are responsible for the day-to-day management of the Fund’s portfolio. The Board was provided with information pertaining to PI’s and QMA’s organizational structure, senior management, investment operations, and other relevant information pertaining to PI and QMA. The Board also noted that it received favorable
| | |
| | Visit our website at www.jennisondryden.com |
compliance reports from the Fund’s Chief Compliance Officer (“CCO”) as to each of PI and QMA. The Board noted that QMA is affiliated with PI.
The Board concluded that it was satisfied with the nature, extent and quality of the investment management services provided by PI and the subadvisory services provided to the Fund by QMA, and that there was a reasonable basis on which to conclude that the Fund benefits from the services provided by PI and QMA under the management and subadvisory agreements.
Performance of the Fund
The Board received and considered information about the Fund’s historical performance. The Board considered that the Fund’s gross performance in relation to its Peer Universe (the Lipper Mid-Cap Value Funds Performance Universe) was in the second quartile over the one-year period, and in the third quartile over the three-year period. The Board also noted that the Fund outperformed its benchmark index over all periods. The Board concluded that, in light of the Fund’s competitive performance vis-à-vis its benchmark index, it would be in the interest of the Fund and its shareholders for the Fund to renew the agreements.
Fees and Expenses
The Board considered the Fund’s actual management fees (which reflects any subsidies, expense caps or waivers) and total expenses both ranked in the Expense Group’s fourth quartile. The Board noted information provided by PI indicating that the Fund’s actual management fee was 13.1 basis points higher than the median actual management fee for all funds included in the Expense Group, and that the Fund’s total expenses were 22.3 basis points higher than the median total expenses for all funds included in the Expense Group. The Board further noted information provided by PI indicating that the Fund’s fourth quartile ranking for total expenses was primarily attributable to management expenses, custodian and transfer agency expenses.
As part of its review of the Fund’s management fee, the Board considered that the management fee arrangements for the Fund represented the result of several years of review and discussion between the Board and PI. In its review, the Board considered such things as the difficulty in managing the Fund, the size of the Fund, fees of competitors, Fund’s performance, expenses of service providers and such other aspects that the Directors deemed important in the exercise of their business judgment. The Board concluded that the management fees and total expenses were reasonable in light of the services provided.
| | |
| Dryden Mid Cap Value Fund | | |
Approval of Advisory Agreements (continued)
Costs of Services and Profits Realized by PI
The Board was provided with information on the profitability of PI and its affiliates in serving as the Fund’s investment manager. The Board discussed with PI the methodology utilized in assembling the information regarding profitability and considered its reasonableness. The Board recognized that it is difficult to make comparisons of profitability from fund management contracts because comparative information is not generally publicly available and is affected by numerous factors, including the structure of the particular adviser, the types of funds it manages, its business mix, numerous assumptions regarding allocations and the adviser’s capital structure and cost of capital. The Board did not separately consider the profitability of the subadviser, an affiliate of PI, as its profitability was reflected in the profitability report for PI. Taking these factors into account, the Board concluded that the profitability of PI and its affiliates in relation to the services rendered was not unreasonable.
Economies of Scale
The Board received and discussed information concerning whether PI realizes economies of scale as the Fund’s assets grow beyond current levels. The Board noted that the management fee schedule for the Fund includes breakpoints, which have the effect of decreasing the fee rate as assets increase, and that at its current level of assets the Fund’s effective fee rate reflected some of those rate reductions. The Board took note that the Fund’s fee structure currently results in benefits to Fund shareholders whether or not PI realizes any economies of scale.
Other Benefits to PI and QMA
The Board considered potential ancillary benefits that might be received by PI and QMA and their affiliates as a result of their relationship with the Fund. The Board concluded that potential benefits to be derived by PI included brokerage commissions received by affiliates of PI, transfer agency fees received by the Fund’s transfer agent (which is affiliated with PI), and benefits to the reputation as well as other intangible benefits resulting from PI’s association with the Fund. The Board concluded that the potential benefits to be derived by QMA included its ability to use soft dollar credits, brokerage commissions received by affiliates of QMA, as well as the potential benefits consistent with those generally resulting from an increase in assets under management, specifically, potential access to additional research resources and benefits to the reputation. The Board concluded that the benefits derived by PI and QMA were consistent with the types of benefits generally derived by investment managers and subadvisers to mutual funds.
After full consideration of these factors, the Board concluded that the approval of the agreements was in the interest of the Fund and its shareholders.
| | |
| | Visit our website at www.jennisondryden.com |
Growth of a $10,000 Investment
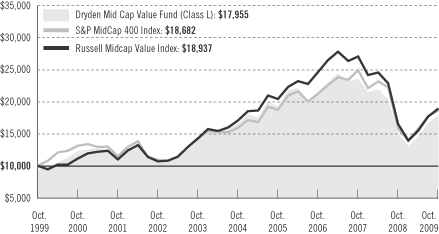
| | | | | | | | | | | |
| Average Annual Total Returns (With Sales Charges) as of 10/31/09 |
| | | One Year | | | Five Year | | | Ten Years | | | Since Inception |
Class A | | 13.55 | % | | 0.81 | % | | N/A | | | 1.12% (4/12/04) |
Class B | | 14.44 | | | 1.11 | | | N/A | | | 1.30 (4/12/04) |
Class C | | 18.21 | | | 1.18 | | | 6.13 | % | | — |
Class L | | 12.86 | | | 0.47 | | | 6.03 | | | — |
Class M | | 14.42 | | | 1.37 | | | 6.34 | | | — |
Class X | | 14.15 | | | 1.60 | | | 6.51 | | | — |
Class Z | | 20.41 | | | N/A | | | N/A | | | –2.39 (11/28/05) |
| | | | | | | | | | | |
| Average Annual Total Returns (Without Sales Charges) as of 10/31/09 |
| | | One Year | | | Five Years | | | Ten Years | | | Since Inception |
Class A | | 20.16 | % | | 1.96 | % | | N/A | | | 2.15% (4/12/04) |
Class B | | 19.44 | | | 1.21 | | | N/A | | | 1.39 (4/12/04) |
Class C | | 19.21 | | | 1.18 | | | 6.13 | % | | — |
Class L | | 19.75 | | | 1.67 | | | 6.66 | | | — |
Class M | | 20.42 | | | 1.57 | | | 6.34 | | | — |
Class X | | 20.15 | | | 1.89 | | | 6.51 | | | — |
Class Z | | 20.41 | | | N/A | | | N/A | | | –2.39 (11/28/05) |
Performance data quoted represent past performance. Past performance does not guarantee future results. The investment return and principal value of an investment will fluctuate so that an investor’s shares, when redeemed, may be worth more or
| | |
| | Visit our website at www.jennisondryden.com |
less than their original cost. Current performance may be lower or higher than the past performance data quoted. An investor may obtain performance data as of the most recent month-end by visiting our website at www.jennisondryden.com or by calling (800) 225-1852. Class A and Class L shares have a maximum initial sales charge of 5.50% and 5.75%, respectively. Class L shares are closed to most new purchases (with the exception of reinvested dividends and purchases by certain college savings plans). Gross operating expenses: Class A, 1.77%; Class B, 2.47%; Class C, 2.47%; Class L, 1.97%; Class M, 1.72%; Class X, 1.72%; Class Z, 1.47%. Net operating expenses apply to: Class A, 1.72%; Class B, 2.47%; Class C, 2.47%; Class L, 1.97%; Class M, 1.72%; Class X, 1.72%; Class Z, 1.47%, after contractual reduction through 2/28/2011.
Source: Prudential Investments LLC and Lipper Inc.
Inception returns are provided for any share class with less than 10 calendar years of returns.
The graph compares a $10,000 investment in the Dryden Mid Cap Value Fund (Class L shares) with a similar investment in the S&P MidCap 400 Index and Russell Midcap Value Index by portraying the initial account values at the beginning of the 10-year period for Class L shares (October 31, 1999) and the account values at the end of the current fiscal year (October 31, 2009) as measured on a quarterly basis. The Russell Midcap Value Index data is measured from the closest month-end to inception date and not from the Fund’s actual inception date. For purposes of the graph, and unless otherwise indicated, it has been assumed that (a) the maximum applicable front-end sales charge was deducted from the initial $10,000 investment in Class L shares; (b) all recurring fees (including management fees) were deducted; and (c) all dividends and distributions were reinvested. The line graph provides information for Class L shares only. As indicated in the tables above, performance for Class A, B, C, M, X, and Z shares will vary due to the differing charges and expenses applicable to each share class (as indicated in the following paragraphs).
The S&P MidCap 400 Index is an unmanaged index of 400 domestic stocks chosen for market size, liquidity, and industry group representation. It gives a broad look at how U.S. mid-cap stock prices have performed. The Russell Midcap Value Index measures the performance of those Russell Midcap companies with lower price-to-book ratios and lower forecasted growth values. The stocks are also members of the Russell 1000 Index. The Index’s total returns include the reinvestment of all dividends, but do not include the effects of sales charges, operating expenses of a mutual fund, or taxes. The returns for the index would be lower if they included the effects of sales charges, operating expenses, or taxes. The securities that comprise the index may differ substantially from the securities in the Fund. This is not the only index that may be used to characterize performance of small- to mid-capitalization stock funds. Other indexes may portray different comparative performance. Investors cannot invest directly in an index.
Class A and Class L shares are subject to a maximum front-end sales charge of 5.50% and 5.75%, respectively. Class L shares are closed to most new purchases (with the exception of reinvested dividends and purchases by certain college savings plans). Under certain circumstances, Class A and Class L shares may be subject to a contingent deferred sales charge (CDSC) of 1%. Class B, Class C, Class M, and Class X shares are subject to a maximum CDSC of 5%, 1%, 6%, and 6%, respectively. Class A shares are subject to a 12b-1 fee of up to 0.30% annually. Class B, Class C, Class M, and Class X shares are subject to a 12b-1 fee of 1%. Class L shares are subject to a 12b-1 fee of 0.50%. Class Z shares are not subject to a 12b-1 fee. The returns in the graph and the tables do not reflect the deduction of taxes that a shareholder would pay on Fund distributions or following the redemption of Fund shares.
| | |
| Dryden Mid Cap Value Fund | | |
| | | | |
| n MAIL | | n TELEPHONE | | n WEBSITE |
Gateway Center Three 100 Mulberry Street Newark, NJ 07102 | | (800) 225-1852 | | www.jennisondryden.com |
|
| PROXY VOTING |
| The Board of Directors of the Fund has delegated to the Fund’s investment subadviser the responsibility for voting any proxies and maintaining proxy recordkeeping with respect to the Fund. A description of these proxy voting policies and procedures is available without charge, upon request, by calling (800) 225-1852 or by visiting the Securities and Exchange Commission’s website at www.sec.gov. Information regarding how the Fund voted proxies relating to portfolio securities during the most recent 12-month period ended June 30 is available on the Fund’s website and on the Commission’s website. |
|
| DIRECTORS |
| Kevin J. Bannon • Linda W. Bynoe • David E.A. Carson • Michael S. Hyland • Robert E. La Blanc • Douglas H. McCorkindale • Stephen P. Munn • Richard A. Redeker • Judy A. Rice • Robin B. Smith • Stephen G. Stoneburn |
|
| OFFICERS |
| Judy A. Rice, President • Scott E. Benjamin, Vice President • Grace C. Torres, Treasurer and Principal Financial and Accounting Officer • Kathryn L. Quirk, Chief Legal Officer • Deborah A. Docs, Secretary • Timothy J. Knierim, Chief Compliance Officer • Valerie M. Simpson, Deputy Chief Compliance Officer • Theresa C. Thompson, Deputy Chief Compliance Officer • Noreen M. Fierro, Anti-Money Laundering Compliance Officer • Jonathan D. Shain, Assistant Secretary • Claudia DiGiacomo, Assistant Secretary • John P. Schwartz, Assistant Secretary • Andrew R. French, Assistant Secretary • M. Sadiq Peshimam, Assistant Treasurer • Peter Parrella, Assistant Treasurer |
| | | | |
| MANAGER | | Prudential Investments LLC | | Gateway Center Three
100 Mulberry Street
Newark, NJ 07102 |
|
| INVESTMENT SUBADVISER | | Quantitative Management
Associates LLC | | Gateway Center Two
100 Mulberry Street
Newark, NJ 07102 |
|
| DISTRIBUTORS | | Prudential Annuities
Distributors, Inc. | | One Corporate Drive
Shelton, CT 06484 |
|
| | Prudential Investment
Management
Services LLC | | Gateway Center Three
100 Mulberry Street
Newark, NJ 07102 |
|
| CUSTODIAN | | PFPC Trust Company | | 400 Bellevue Parkway
Wilmington, DE 19809 |
|
| TRANSFER AGENT | | Prudential Mutual Fund
Services LLC | | PO Box 9658
Providence, RI 02940 |
|
| INDEPENDENT REGISTERED PUBLIC ACCOUNTING FIRM | | KPMG LLP | | 345 Park Avenue
New York, NY 10154 |
|
| FUND COUNSEL | | Willkie Farr & Gallagher LLP | | 787 Seventh Avenue
New York, NY 10019 |
|
| An investor should consider the investment objectives, risks, charges, and expenses of the Fund carefully before investing. The prospectus for the Fund contains this and other information about the Fund. An investor may obtain a prospectus by visiting our website at www.jennisondryden.com or by calling (800) 225-1852. The prospectus should be read carefully before investing. |
|
| E-DELIVERY |
| To receive your mutual fund documents online, go to www.prudential.com/edelivery/mutualfunds and enroll. Instead of receiving printed documents by mail, you will receive notification via email when new materials are available. You can cancel your enrollment or change your email address at any time by visiting the website address above. |
|
| SHAREHOLDER COMMUNICATIONS WITH DIRECTORS |
| Shareholders can communicate directly with the Board of Directors by writing to the Chair of the Board, Dryden Mid Cap Value Fund, Prudential Investments, Attn: Board of Directors, 100 Mulberry Street, Gateway Center Three, Newark, NJ 07102. Shareholders can communicate directly with an individual Director by writing to the same address. Communications are not screened before being delivered to the addressee. |
|
| AVAILABILITY OF PORTFOLIO SCHEDULE |
| The Fund files its complete schedule of portfolio holdings with the Securities and Exchange Commission for the first and third quarters of each fiscal year on Form N-Q. The Fund’s Forms N-Q are available on the Commission’s website at www.sec.gov. The Fund’s Forms N-Q may also be reviewed and copied at the Commission’s Public Reference Room in Washington, D.C. Information on the operation and location of the Public Reference Room may be obtained by calling (202) 551-8090. The Fund’s schedule of portfolio holdings is also available on the Fund’s website as of the end of each fiscal quarter. |
|
| The Fund’s Statement of Additional Information contains additional information about the Fund’s Directors and is available without charge, upon request, by calling (800) 225-1852. |
Mutual Funds:
| | | | |
ARE NOT INSURED BY THE FDIC OR ANY
FEDERAL GOVERNMENT AGENCY | | MAY LOSE VALUE | | ARE NOT A DEPOSIT OF OR GUARANTEED BY ANY BANK OR ANY BANK AFFILIATE |

| | | | | | | | | | | | | | | | | | |
| Dryden Mid Cap Value Fund | | | | | | | | | | | | |
| | | Share Class | | A | | B | | C | | L* | | M** | | X** | | Z | | |
| | NASDAQ | | SPRAX | | SVUBX | | NCBVX | | NABVX | | NBBVX | | NBVZX | | SPVZX | | |
| | CUSIP | | 86277E807 | | 86277E872 | | 86277E856 | | 86277E880 | | 86277E864 | | 86277E849 | | 86277E435 | | |
| | | | | | | | | | | | | | | | | | |
*Closed to most new purchases (with the exception of reinvested dividends and purchases by college savings plans) and available for limited exchanges only.
**Closed to most new purchases (with the exception of reinvested dividends) and available for limited exchanges only.
MF202E 0168513-00001-00


| | |
| OCTOBER 31, 2009 | | ANNUAL REPORT |
Jennison Equity Income Fund
FUND TYPE
Equity income
OBJECTIVE
Income and capital appreciation
This report is not authorized for distribution to prospective investors unless preceded or accompanied by a current prospectus.
The views expressed in this report and information about the Fund’s portfolio holdings are for the period covered by this report and are subject to change thereafter.
JennisonDryden, Jennison, Prudential Financial and the Rock Prudential logo are registered service marks of The Prudential Insurance Company of America, Newark, NJ, and its affiliates.

December 15, 2009
Dear Shareholder:
On December 11, 2009, the Board of Directors approved the renaming of JennisonDryden, Prudential Financial’s mutual fund family, to Prudential Investments, effective on or about February 16, 2010. As a result of this change, each of our Funds will be renamed to feature “Prudential” as part of its new name. The name of your Fund will change from Jennison Equity Income Fund to Prudential Jennison Equity Income Fund.
While the name of your Fund will change, its investment objectives and portfolio management team will remain the same. No action is required on your part. If you participate in an automatic investment plan, your account will continue to be invested in the Fund under its new name.
Featuring the Prudential name in our Funds will create an immediate connection to the experience and heritage of Prudential, a name recognized by millions for helping people grow and protect their wealth.
On the following pages, you will find your Fund’s annual report, including an analysis of its performance over the fiscal year in addition to other data. If you have questions about this information or the renaming of our mutual fund family, please contact your financial professional or visit our website at www.jennisondryden.com.
Sincerely,

Judy A. Rice, President
Jennison Equity Income Fund
| | |
| Jennison Equity Income Fund | | 1 |
Your Fund’s Performance
Fund objective
The investment objective of the Jennison Equity Income Fund is income and capital appreciation. There can be no assurance that the Fund will achieve its investment objective.
Performance data quoted represent past performance. Past performance does not guarantee future results. The investment return and principal value of an investment will fluctuate, so that an investor’s shares, when redeemed, may be worth more or less than their original cost. Current performance may be lower or higher than the past performance data quoted. An investor may obtain performance data as of the most recent month-end by visiting our website at www.jennisondryden.com or by calling (800) 225-1852. Class A and Class L shares have a maximum initial sales charge of 5.50% and 5.75%, respectively. Gross operating expenses: Class A, 1.71%; Class B, 2.41%; Class C, 2.41%; Class L, 1.91%; Class M, 2.41%; Class X, 2.41%; Class Z, 1.41%. Net operating expenses apply to: Class A, 1.40%; Class B, 2.15%; Class C, 2.15%; Class L, 1.65%; Class M, 2.15%; Class X, 2.15%; Class Z, 1.15%, after contractual reduction through 2/28/2011.
| | | | | | | | | | | |
| Cumulative Total Returns as of 10/31/09 | | | | | | |
| | | One Year | | | Five Years | | | Ten Years | | | Since Inception1 |
Class A2 | | 28.09 | % | | 21.81 | % | | N/A | | | 19.15% (4/12/04) |
Class B3 | | 27.15 | | | 17.17 | | | N/A | | | 14.01 (4/12/04) |
Class C | | 27.22 | | | 17.21 | | | 28.45 | % | | — |
Class L2 | | 27.73 | | | 19.99 | | | 34.84 | | | — |
Class M3 | | 27.03 | | | 17.06 | | | 28.37 | | | — |
Class X | | 27.09 | | | 17.37 | | | 28.73 | | | — |
Class Z | | 28.27 | | | N/A | | | N/A | | | –7.23 (8/25/08) |
Lipper Equity Income Funds Index4 | | 9.86 | | | 3.51 | | | 17.20 | | | * |
S&P 500 Index5 | | 9.80 | | | 1.67 | | | –9.10 | | | **
|
Lipper Average6 | | 9.29 | | | 6.95 | | | 25.84 | | | *** |
| | | | | | | | | | | |
| Average Annual Total Returns7 as of 9/30/09 | | | | | | |
| | | One Year | | | Five Years | | | Ten Years | | | Since Inception1 |
Class A2 | | 0.31 | % | | 3.40 | % | | N/A | | | 2.50% (4/12/04) |
Class B3 | | 0.29 | | | 3.61 | | | N/A | | | 2.60 (4/12/04) |
Class C | | 4.30 | | | 3.75 | | | 3.09 | % | | — |
Class L2 | | –0.23 | | | 3.04 | | | 2.99 | | | — |
Class M3 | | –0.71 | | | 3.47 | | | 3.09 | | | — |
Class X | | –0.59 | | | 3.38 | | | 3.12 | | | — |
Class Z | | 6.29 | | | N/A | | | N/A | | | –5.18 (8/25/08) |
Lipper Equity Income Funds Index4 | | –6.56 | | | 1.24 | | | 2.10 | | | * |
S&P 500 Index5 | | –6.91 | | | 1.01 | | | –0.15 | | | ** |
Lipper Average6 | | –6.42 | | | 1.76 | | | 2.67 | | | *** |
| | |
| 2 | | Visit our website at www.jennisondryden.com |
The cumulative total returns do not reflect the deduction of applicable sales charges. If reflected, the applicable sales charges would reduce the cumulative total returns performance quoted. Class A and Class L shares are subject to a maximum front-end sales charge of 5.50% and 5.75%, respectively. Class L shares are closed to most new purchases (with the exception of reinvested dividends and purchases by certain college savings plans). Class M and Class X shares are also closed to most new purchases (with the exception of reinvested dividends). Class L, Class M, and Class X shares are exchangeable only with Class L, Class M, and Class X shares, respectively, offered by the other JennisonDryden Funds. Under certain circumstances, Class A and Class L shares may be subject to a contingent deferred sales charge (CDSC) of 1%. Class B, Class C, Class M, and Class X shares are subject to a maximum CDSC of 5%, 1%, 6%, and 6%, respectively. Class Z shares are not subject to a sales charge.
Source: Prudential Investments LLC and Lipper Inc. Performance figures may reflect fee waivers and/or expense reimbursements. In the absence of such fee waivers and/or expense reimbursements, total returns would be lower.
1Inception returns are provided for any share class with less than 10 calendar years of returns.
2Prior to April 12, 2004, Class L shares were known as Class A shares. On April 12, 2004, Class A shares were redesignated as Class L shares and a new Class A was opened.
3Prior to April 12, 2004, Class M shares were known as Class B shares. On April 12, 2004, Class B shares were redesignated as Class M shares and a new Class B was opened.
4Funds in the Lipper Equity Income Funds Index seek relatively high current income and growth of income by investing at least 65% of their portfolio in dividend-paying equity securities. These funds’ gross or net yield must be at least 125% of the average gross or net yield of the U.S. diversified equity fund universe.
5The Standard & Poor’s 500 Composite Stock Price Index (S&P 500 Index) is an unmanaged index of 500 stocks of large U.S. public companies. It gives a broad look at how U.S. stock prices have performed.
6Funds in the Lipper Equity Income Funds Average (Lipper Average) seek relatively high current income and growth of income through investing 60% or more of their portfolio in equities.
7The average annual total returns take into account applicable sales charges. The returns in the tables do not reflect the deduction of taxes that a shareholder would pay on Fund distributions or following the redemption of Fund shares. Without a distribution and service (12b-1) fee waiver of 0.05% for Class A shares, the returns would have been lower. Class A shares are subject to a 12b-1 fee of up to 0.30% annually. Class B, Class C, Class M, and Class X shares are subject to a 12b-1 fee of 1.00%. Class L shares are subject to a 12b-1 fee of 0.50%. Class Z shares are not subject to a 12b-1 fee.
*Lipper Equity Income Funds Index Closest Month-End to Inception cumulative total returns as of 10/31/09 are 6.24% for Class A and Class B; and –15.34% for Class Z. Lipper Equity Income Funds Index Closest Month-End to Inception average annual total returns as of 9/30/09 are 1.41% for Class A and Class B; and –12.94% for Class Z.
**S&P 500 Index Closest Month-End to Inception cumulative total returns as of 10/31/09 are 3.04% for Class A and Class B; and –16.77% for Class Z. S&P 500 Index Closest Month-End to Inception average annual total returns as of 9/30/09 are 0.89% for Class A and Class B; and –14.11% for Class Z.
***Lipper Average Closest Month-End to Inception cumulative total returns as of 10/31/09 are 8.80% for Class A and Class B; and –14.79% for Class Z. Lipper Average Closest Month-End to Inception average annual total returns as of 9/30/09 are 1.72% for Class A and Class B; and –12.57% for Class Z.
Investors cannot invest directly in an index. The returns for the S&P 500 Index would be lower if they included the effects of sales charges, operating expenses of a mutual fund, or taxes. Returns for the Lipper Average reflect the deduction of operating expenses, but not sales charges or taxes.
| | |
| Jennison Equity Income Fund | | 3 |
Your Fund’s Performance (continued)
| | | |
| Five Largest Holdings expressed as a percentage of net assets as of 10/31/09 | | | |
B&G Foods, Inc., Food Products | | 3.3 | % |
Microsoft Corp., Software | | 2.7 | |
Pfizer Inc., Pharmaceuticals | | 2.5 | |
Consolidated Communications Holdings, Inc., Diversified Telecommunication Services | | 2.3 | |
ConAgra Foods, Inc., Food Products | | 2.2 | |
Holdings reflect only long-term investments and are subject to change.
| | |
| 4 | | Visit our website at www.jennisondryden.com |
Strategy and Performance Overview
How did the Fund perform?
The Jennison Equity Income Fund’s Class A shares returned 28.09% for the 12-month reporting period ended October 31, 2009, significantly outperforming the 9.86% return of the Lipper Equity Income Funds Index (the Index) and the 9.29% return of the Lipper Equity Income Funds Average.
How is the Fund managed?
Jennison Associates manages the Fund, whose investment objective is income and capital appreciation. The Fund seeks companies with the ability to sustain and grow their dividends. It employs a value strategy to identify firms the manager believes are fundamentally sound but valued at a discount to their true worth as defined by their earnings, free cash flow, assets, private market value, or a combination of these factors.
What were conditions like in the U.S. stock market during the reporting period?
A severe credit crisis in the United States that began during 2007 escalated in September 2008, with an extraordinary series of events such as the federal government’s takeover of the Federal National Mortgage Association (Fannie Mae), the Federal Home Loan Mortgage Corp. (Freddie Mac), and American International Group Inc. (AIG) and the failure of Lehman Brothers Holdings. When the reporting period began on November 1, 2008, the financial markets and broader economy were still in turmoil.
The credit crunch prompted unprecedented coordination between the U.S. Department of the Treasury and the U.S. Federal Reserve Bank to resuscitate credit markets and stabilize the financial system. Inflation concerns abated as declining demand for goods and services in the United States and the weakening global economy hit commodities prices. The ongoing correction in the housing market, debt deflation, rising unemployment, and stalled production and consumption all contributed to the most severe recession in recent history. Corporations across the globe announced workforce reductions and capital-expenditure cuts.
President Obama moved swiftly after his inauguration in January 2009 to revive the economy and place his stamp on public policy. The Treasury Department introduced broad new credit-stimulus programs concurrent with initiatives to peel away layers of distressed bank loans, while simultaneously laying the groundwork for regulatory overhaul. Further capital was injected into major banks as part of a move to stabilize institutions considered too big to fail. An $800 billion fiscal stimulus package was enacted. Efforts to fundamentally reform healthcare and improve education resulted in proposed increases in tax-rates and significant deficit spending in a time of drastic revenue shortfalls.
| | |
| Jennison Equity Income Fund | | 5 |
Strategy and Performance Overview (continued)
The U.S. equity market rebounded sharply and conditions in the credit markets improved as the economy began to stabilize in the spring of 2009 and growth resumed in the final months of the reporting period. A combination of low home prices due to rising foreclosures, low interest rates, increased availability of mortgage credit, and a tax credit for first-time home buyers stimulated housing activity. Household spending showed signs of stabilizing, although it remained constrained by ongoing job losses, sluggish income growth, lower housing wealth, and tight credit. The decline in same-store sales gains moderated, reflecting a less competitive environment created by several closures/bankruptcies and reduced markdown activity. Corporations bolstered profits by reducing inventories and cutting costs such as labor expenses, contributing to the acceleration in monthly job losses and a U.S. unemployment rate that climbed above 10.0% in October 2009, based on government data released shortly after the reporting period ended. The severity of the situation continued to cast significant uncertainty on the coming quarters.
Which holdings made the largest positive contribution to the Fund’s return?
Select holdings from the financials sector were among the most significant contributors to performance. Shares of Goldman Sachs, Morgan Stanley, and Annaly Capital Management each contributed more than a full percentage point to the Fund’s return. Goldman Sachs and Morgan Stanley advanced due to strong capital markets activity, declining systemic risks, and an improving investment banking deal pipeline. Jennison believes these holdings are among the best in class and should continue to benefit from stronger balance sheets and better navigation of the current market environment.
Annaly Capital Management is a real estate investment trust (REIT) that owns, manages, and finances a portfolio of mortgage-backed securities guaranteed by Fannie Mae and Freddie Mac. The company benefited from attractive spreads between the return on their assets and their low borrowing costs. Jennison continues to believe Annaly’s management team may be the best in the mortgage-backed securities market.
Consumer staples holdings B&G Foods and Cadbury PLC were also key contributors to performance. Britain’s leading confectionary company, Cadbury, soared on news that Kraft Foods is seeking to acquire it. Cadbury operates in 60 countries and has number one or number two market share positions in 20 of the world’s 50 largest confectionary markets. A Kraft takeover would combine Kraft products such as Toblerone chocolates, Oreo cookies, and Ritz crackers with Cadbury’s Trident and Dentyne gums, Halls cough drops, and Cadbury Dairy Milk chocolates. B&G Foods advanced as the company reported strong financial results for the past few quarters and is realizing the benefits of price increases and cost cutting initiatives that were
| | |
| 6 | | Visit our website at www.jennisondryden.com |
implemented in the fourth quarter of 2008. Jennison continues to like this holding for its strong portfolio of food products and attractive dividend yield.
Which holdings detracted most from the Fund’s return?
FairPoint Communications, a provider of communications services in rural and small urban communities, was the single largest detractor from performance. The company’s stock price declined substantially following a decision by its board of directors to suspend its quarterly dividend. In addition, the company continues to face regulatory hurdles and integration issues with its Northern New England operations, which were recently acquired from Verizon. Jennison believes there are other attractive opportunities in the telecom services space and decided to exit this position.
Select holdings from the energy sector also hurt the Fund’s return. This was largely due to the weak performance of Advantage Oil & Gas and ONEOK Partners, which were hurt by volatile commodity prices during the reporting period. While the Fund sold both holdings at a loss, it continues to have a significant exposure to the energy sector as Jennison believes the demand for oil and natural gas will tend to outweigh the supply in the longer term. It is likely that the financial crisis exacerbated the sell-off that occurred during the fourth quarter of 2008 and the first quarter of 2009, as many speculative investors were forced to reduce risk overall. The most easily exploited sources of production for many commodities have largely been tapped, and it is costlier to develop new production and extend the life of existing areas. Jennison believes the costs of incremental production will keep commodities prices higher than expected over the long term.
Were there significant changes to the Fund?
As an active manager of mutual funds, Jennison constructs equity portfolios from the bottom up based on internal analysis of individual company fundamentals rather than on overarching themes. During the reporting period, there were no significant changes to the Fund. Jennison bought and sold individual positions based on company fundamentals and a stock’s risk/reward profile. Determining the weighting of a stock in a portfolio is as much a part of the bottom-up process as the decision to purchase the stock. Sector and industry allocations are a result of this stock selection process.
| | |
| Jennison Equity Income Fund | | 7 |
Comments on Largest Holdings
| 3.3% | B&G Foods, Inc., Food Products |
Please see the comments on the largest contributors to the Fund’s return.
| 2.7% | Microsoft Corp., Software |
Microsoft develops, manufactures, and licenses software products and services for a range of computing devices. Jennison expects the company to benefit in 2010 as corporations upgrade their computers and move to Microsoft’s new operating system, Windows 7. Jennsion believes financial leverage at Microsoft will increase in the wake of structural cost improvements, and it likes the company’s free cash flow. With capital expenditures expected to decline, investments in research and development moderating, and no major mergers planned, Microsoft could use its cash to benefit shareholders by increasing the amount of its dividend or repurchasing some of its stock. Jennison also believes the firm’s gross margins could expand as higher-margin businesses improve.
| 2.5% | Pfizer Inc., Pharmaceuticals |
Pfizer is a pharmaceutical company engaged in the discovery, manufacture, and marketing of prescription medicines for humans and animals. Jennison expects the company to benefit from a significant reduction in operating expenses related to synergies created by its acquisition of its rival, Wyeth. In addition, Jennison expects Pfizer to significantly increase its dividend and sees a lot of potential in its robust pipeline of drug candidates in the longer term.
| 2.3% | Consolidated Communications Holdings, Inc., Diversified Telecommunication Services |
The company offers a wide range of telecommunications services, including local and long distance phone service, dial-up and high-speed Internet access, and digital TV to residential and business customers in Illinois and Texas. Jennison continues to favor Consolidated for the sustainability of its dividend and growth businesses including video, DSL, and Voice over Internet Protocol (VoIP).
| 2.2% | ConAgra Foods, Inc., Food Products |
ConAgra is a packaged food company that services grocery retailers, restaurants, and other food service providers. The company’s portfolio of brands includes Chef Boyardee, Healthy Choice, Hebrew National, Hunt’s, and Reddi-Wip. Jennison believes ConAgra’s ability to increase prices will offset concerns about input costs, and a notable increase in new product innovation should drive incremental revenue growth, while positively affecting product mix.
| | |
| 8 | | Visit our website at www.jennisondryden.com |
Fees and Expenses (Unaudited)
As a shareholder of the Fund, you incur two types of costs: (1) transaction costs, including sales charges (loads) on purchase payments and redemptions, as applicable, and (2) ongoing costs, including management fees, distribution and/or service (12b-1) fees, and other Fund expenses, as applicable. This example is intended to help you understand your ongoing costs (in dollars) of investing in the Funds and to compare these costs with the ongoing costs of investing in other mutual funds.
The example is based on an investment of $1,000 invested on May 1, 2009, at the beginning of the period, and held through the six-month period ended October 31, 2009. The example is for illustrative purposes only; you should consult the Prospectus for information on initial and subsequent minimum investment requirements.
The Fund’s transfer agent may charge additional fees to holders of certain accounts that are not included in the expenses shown in the table on the following page. These fees apply to individual retirement accounts (IRAs) and Section 403(b) accounts. As of the close of the six-month period covered by the table, IRA fees included an annual maintenance fee of $15 per account (subject to a maximum annual maintenance fee of $25 for all accounts held by the same shareholder). Section 403(b) accounts are charged an annual $25 fiduciary maintenance fee. Some of the fees may vary in amount, or may be waived, based on your total account balance or the number of JennisonDryden funds, including the Fund, that you own. You should consider the additional fees that were charged to your Fund account over the six-month period when you estimate the total ongoing expenses paid over the period and the impact of these fees on your ending account value, as these additional expenses are not reflected in the information provided in the expense table. Additional fees have the effect of reducing investment returns.
Actual Expenses
The first line for each share class in the table on the following page provides information about actual account values and actual expenses. You may use the information on this line, together with the amount you invested, to estimate the expenses that you paid over the period. Simply divide your account value by $1,000 (for example, an $8,600 account value ÷ $1,000 = 8.6), then multiply the result by the number on the first line under the heading “Expenses Paid During the Six-Month Period” to estimate the expenses you paid on your account during this period.
Hypothetical Example for Comparison Purposes
The second line for each share class in the table on the following page provides information about hypothetical account values and hypothetical expenses based on the Fund’s actual expense ratio and an assumed rate of return of 5% per year before expenses, which is not the Fund’s actual return. The hypothetical account values and
| | |
| Jennison Equity Income Fund | | 9 |
Fees and Expenses (continued)
expenses may not be used to estimate the actual ending account balance or expenses you paid for the period. You may use this information to compare the ongoing costs of investing in the Fund and other funds. To do so, compare this 5% hypothetical example with the 5% hypothetical examples that appear in the shareholder reports of the other funds.
Please note that the expenses shown in the table are meant to highlight your ongoing costs only and do not reflect any transactional costs such as sales charges (loads). Therefore, the second line for each share class in the table is useful in comparing ongoing costs only and will not help you determine the relative total costs of owning different funds. In addition, if these transactional costs were included, your costs would have been higher.
| | | | | | | | | | | | | | |
Jennison Equity
Income Fund | | Beginning Account
Value
May 1, 2009 | | Ending Account
Value
October 31, 2009 | | Annualized
Expense Ratio
Based on the
Six-Month Period | | | Expenses Paid
During the
Six-Month Period* |
| | | | | | | | | | | | | | |
| Class A | | Actual | | $ | 1,000.00 | | $ | 1,261.30 | | 1.40 | % | | $ | 7.98 |
| | | Hypothetical | | $ | 1,000.00 | | $ | 1,018.15 | | 1.40 | % | | $ | 7.12 |
| | | | | | | | | | | | | | |
| Class B | | Actual | | $ | 1,000.00 | | $ | 1,255.80 | | 2.15 | % | | $ | 12.22 |
| | | Hypothetical | | $ | 1,000.00 | | $ | 1,014.37 | | 2.15 | % | | $ | 10.92 |
| | | | | | | | | | | | | | |
| Class C | | Actual | | $ | 1,000.00 | | $ | 1,256.40 | | 2.15 | % | | $ | 12.23 |
| | | Hypothetical | | $ | 1,000.00 | | $ | 1,014.37 | | 2.15 | % | | $ | 10.92 |
| | | | | | | | | | | | | | |
| Class L | | Actual | | $ | 1,000.00 | | $ | 1,259.60 | | 1.65 | % | | $ | 9.40 |
| | | Hypothetical | | $ | 1,000.00 | | $ | 1,016.89 | | 1.65 | % | | $ | 8.39 |
| | | | | | | | | | | | | | |
| Class M | | Actual | | $ | 1,000.00 | | $ | 1,256.10 | | 2.15 | % | | $ | 12.23 |
| | | Hypothetical | | $ | 1,000.00 | | $ | 1,014.37 | | 2.15 | % | | $ | 10.92 |
| | | | | | | | | | | | | | |
| Class X | | Actual | | $ | 1,000.00 | | $ | 1,255.20 | | 2.15 | % | | $ | 12.22 |
| | | Hypothetical | | $ | 1,000.00 | | $ | 1,014.37 | | 2.15 | % | | $ | 10.92 |
| | | | | | | | | | | | | | |
| Class Z | | Actual | | $ | 1,000.00 | | $ | 1,262.50 | | 1.15 | % | | $ | 6.56 |
| | | Hypothetical | | $ | 1,000.00 | | $ | 1,019.41 | | 1.15 | % | | $ | 5.85 |
* Fund expenses (net of fee waivers or subsidies, if any) for each share class are equal to the annualized expense ratio for each share class (provided in the table), multiplied by the average account value over the period, multiplied by the 184 days in the six-month period ended October 31, 2009, and divided by the 365 days in the Fund’s fiscal year ended October 31, 2009 (to reflect the six-month period). Expenses presented in the table include the expenses of any underlying portfolios in which the Fund may invest.
| | |
| 10 | | Visit our website at www.jennisondryden.com |
Portfolio of Investments
as of October 31, 2009
| | | | | |
| Shares | | Description | | Value (Note 2) |
| | | | | |
LONG-TERM INVESTMENTS 97.9% | | | |
COMMON STOCKS 85.3% | | | |
| |
Airlines 0.6% | | | |
| 232,400 | | Jazz Air Income Fund (Canada) | | $ | 865,553 |
| |
Beverages 1.6% | | | |
| 48,100 | | Molson Coors Brewing Co. (Class B Stock)(a) | | | 2,355,457 |
| |
Capital Markets 3.6% | | | |
| 17,300 | | Goldman Sachs Group, Inc. (The) | | | 2,943,941 |
| 72,300 | | Morgan Stanley | | | 2,322,276 |
| | | | | |
| | | | | 5,266,217 |
| |
Commercial Services & Supplies 5.1% | | | |
| 203,500 | | BFI Canada Ltd. (Canada) | | | 2,614,158 |
| 149,800 | | IESI-BFC Ltd. (Canada) | | | 1,924,930 |
| 67,800 | | Republic Services, Inc. | | | 1,756,698 |
| 38,600 | | Waste Management, Inc. | | | 1,153,368 |
| | | | | |
| | | | | 7,449,154 |
| |
Communications Equipment 1.5% | | | |
| 52,600 | | QUALCOMM, Inc. | | | 2,178,166 |
| |
Diversified Financial Services 2.9% | | | |
| 42,400 | | Bank of America Corp. | | | 618,192 |
| 32,800 | | JPMorgan Chase & Co. | | | 1,370,056 |
| 100,000 | | TCW Energy Partners LLC, 144A (original cost $2,000,000;
purchased 12/14/07)*(c)(d) | | | 2,278,699 |
| | | | | |
| | | | | 4,266,947 |
| |
Diversified Telecommunication Services 7.9% | | | |
| 191,800 | | Alaska Communications Systems Group, Inc. | | | 1,492,204 |
| 25,400 | | BCE, Inc. (Canada) | | | 609,092 |
| 67,900 | | CenturyTel, Inc.(a) | | | 2,204,034 |
| 248,200 | | Consolidated Communications Holdings, Inc. | | | 3,430,124 |
| 135,000 | | Otelco, Inc. (One Share of Class A Common Stock and $7.50
Principal amount of 13% senior subordinated notes due 2019), IDS | | | 1,761,750 |
| 209,400 | | Windstream Corp. | | | 2,018,616 |
| | | | | |
| | | | | 11,515,820 |
See Notes to Financial Statements.
| | |
| Jennison Equity Income Fund | | 11 |
Portfolio of Investments
as of October 31, 2009 continued
| | | | | |
| Shares | | Description | | Value (Note 2) |
| | | | | |
COMMON STOCKS (Continued) | | | |
| |
Electric Utilities 5.6% | | | |
| 93,238 | | Cia Energetica de Minas Gerais, ADR (Brazil)(a) | | $ | 1,472,228 |
| 76,000 | | CPFL Energia SA, 144A (Brazil) | | | 1,330,949 |
| 272,600 | | Equatorial Energia SA (Brazil) | | | 2,585,801 |
| 86,000 | | Great Plains Energy, Inc. | | | 1,487,800 |
| 64,600 | | Portland General Electric Co. | | | 1,200,914 |
| | | | | |
| | | | | 8,077,692 |
| |
Food & Staples Retailing 1.0% | | | |
| 62,900 | | Kroger Co. (The) | | | 1,454,877 |
| |
Food Products 7.6% | | | |
| 614,092 | | B&G Foods, Inc. (Class A Stock) | | | 4,796,059 |
| 36,800 | | Bunge Ltd. (Bermuda) | | | 2,099,808 |
| 18,700 | | Cadbury PLC, ADR (United Kingdom) | | | 946,968 |
| 153,200 | | ConAgra Foods, Inc. | | | 3,217,200 |
| | | | | |
| | | | | 11,060,035 |
| |
Gas Utilities 1.3% | | | |
| 49,900 | | ONEOK, Inc. | | | 1,806,879 |
| |
Healthcare Equipment & Supplies 0.8% | | | |
| 20,700 | | Baxter International, Inc. | | | 1,119,042 |
| |
Hotels, Restaurants & Leisure 1.7% | | | |
| 42,100 | | McDonald’s Corp. | | | 2,467,481 |
| |
Household Products 1.9% | | | |
| 44,600 | | Kimberly-Clark Corp. | | | 2,727,736 |
| |
Machinery 1.9% | | | |
247,100 | | New Flyer Industries, Inc. (One Share of Common Stock and $5.53
Principal amount of 14% subordinated notes), IDS (Canada)(d) | | | 2,041,564 |
| 79,800 | | New Flyer Industries, Inc. (One Share of Common Stock and $5.53 Principal amount of 14% subordinated notes), IDS (Canada), 144A(d) | | | 659,315 |
| | | | | |
| | | | | 2,700,879 |
| |
Multi-Utilities 8.5% | | | |
| 49,200 | | Ameren Corp. | | | 1,197,528 |
| 203,200 | | CenterPoint Energy, Inc. | | | 2,560,320 |
| 291,600 | | Centrica PLC (United Kingdom) | | | 1,184,621 |
| 83,500 | | CMS Energy Corp. | | | 1,110,550 |
| 223,200 | | NiSource, Inc. | | | 2,883,744 |
See Notes to Financial Statements.
| | |
| 12 | | Visit our website at www.jennisondryden.com |
| | | | | |
| Shares | | Description | | Value (Note 2) |
| | | | | |
COMMON STOCKS (Continued) | | | |
| |
Multi-Utilities (cont’d.) | | | |
| 54,200 | | NorthWestern Corp. | | $ | 1,308,930 |
| 40,400 | | Sempra Energy | | | 2,078,580 |
| | | | | |
| | | | | 12,324,273 |
| |
Oil, Gas & Consumable Fuels 7.9% | | | |
| 90,000 | | ARC Energy Trust, UTS, 144A (Canada) | | | 1,622,753 |
| 69,100 | | Baytex Energy Trust, UTS (Canada) | | | 1,692,297 |
| 87,000 | | Bonavista Energy Trust, UTS (Canada) | | | 1,690,874 |
| 73,500 | | Crescent Point Energy Corp. (Canada) | | | 2,499,699 |
| 96,200 | | Freehold Royalty Trust, UTS (Canada) | | | 1,320,244 |
| 80,700 | | Pembina Pipeline Income Fund, UTS (Canada) | | | 1,164,950 |
| 52,700 | | Vermilion Energy Trust, UTS (Canada) | | | 1,418,743 |
| | | | | |
| | | | | 11,409,560 |
| |
Pharmaceuticals 6.6% | | | |
| 23,000 | | Abbott Laboratories | | | 1,163,110 |
| 61,000 | | Bristol-Myers Squibb Co. | | | 1,329,800 |
| 21,200 | | Johnson & Johnson | | | 1,251,860 |
| 216,000 | | Pfizer, Inc. | | | 3,678,480 |
| 54,400 | | Roche Holding AG, ADR (Switzerland) | | | 2,170,560 |
| | | | | |
| | | | | 9,593,810 |
| |
Real Estate Investment Trusts 8.5% | | | |
| 178,800 | | Annaly Capital Management, Inc. | | | 3,023,508 |
| 28,800 | | Boston Properties, Inc.(a) | | | 1,750,176 |
| 518,800 | | Chimera Investment Corp. | | | 1,810,612 |
| 26,200 | | Digital Realty Trust, Inc.(a) | | | 1,182,406 |
| 116,200 | | Education Realty Trust, Inc. | | | 582,162 |
| 65,000 | | HCP, Inc. | | | 1,923,350 |
| 269,300 | | MFA Financial, Inc. | | | 1,998,206 |
| | | | | |
| | | | | 12,270,420 |
| |
Software 2.7% | | | |
| 141,500 | | Microsoft Corp. | | | 3,923,795 |
|
Tobacco 4.1% |
| 82,700 | | Altria Group, Inc. | | | 1,497,697 |
| 28,300 | | Lorillard, Inc. | | | 2,199,476 |
| 48,600 | | Philip Morris International, Inc. | | | 2,301,696 |
| | | | | |
| | | | | 5,998,869 |
See Notes to Financial Statements.
| | |
| Jennison Equity Income Fund | | 13 |
Portfolio of Investments
as of October 31, 2009 continued
| | | | | |
| Shares | | Description | | Value (Note 2) |
| | | | | |
COMMON STOCKS (Continued) | | | |
|
Transportation Infrastructure 1.0% |
| 60,100 | | Atlantia SpA (Italy) | | $ | 1,421,155 |
| |
Wireless Telecommunication Services 1.0% | | | |
| 164,500 | | Centennial Communications Corp.*(a) | | | 1,391,670 |
| | | | | |
| | TOTAL COMMON STOCKS
(cost $122,089,299) | | | 123,645,487 |
| | | | | |
PREFERRED STOCKS 7.5% | | | |
| |
Electric Utilities 0.7% | | | |
| 16,100 | | Great Plains Energy, Inc., CVT, 12.00% | | | 994,980 |
| |
Independent Power Producers & Energy Traders 1.8% | | | |
| 105,539 | | Constellation Energy Group, Inc., Series A, 8.625% | | | 2,614,201 |
| |
Leisure Equipment & Products 1.4% | | | |
| 17,800 | | Callaway Golf Co., Series B, 144A, 7.50%(d) | | | 2,113,750 |
| |
Oil, Gas & Consumable Fuels 2.3% | | | |
| 21,700 | | Whiting Petroleum Corp., CVT, 6.25% | | | 3,304,259 |
| |
Pharmaceuticals 1.3% | | | |
| 1,800 | | Mylan, Inc., 6.50% | | | 1,854,000 |
| | | | | |
| | TOTAL PREFERRED STOCKS
(cost $8,370,951) | | | 10,881,190 |
| | | | | |
See Notes to Financial Statements.
| | |
| 14 | | Visit our website at www.jennisondryden.com |
| | | | | | | | | |
Moody’s
Ratings†
(Unaudited) | | Principal
Amount (000)# | | Description | | Value (Note 2) | |
| | | | | | | | | |
CONVERTIBLE BONDS 3.3% | | | | | | |
|
Capital Markets 1.7% | |
| NR | | $ | 11,390 | | Morgan Stanley & Co International PLC, PERQS
(United Kingdom)(d)
5.50%, 08/30/10 | | $ | 2,444,187 | |
| | | | | | | | | |
|
Wireless Telecommunication Services 1.6% | |
| NR | | | 2,000 | | SBA Communications Corp.
4.00%, 10/01/14 | | | 2,317,500 | |
| | | | | | | | | |
| | | | | TOTAL CONVERTIBLE BONDS
(cost $4,499,995) | | | 4,761,687 | |
| | | | | | | | | |
CORPORATE BOND 1.8% | |
|
Coal | |
| B1 | | | 2,600 | | Arch Coal, Inc., Sr. Notes, 144A(d)
8.75%, 08/01/16 | | | 2,665,000 | |
| | | | | | | | | |
| | | | | (cost $2,535,790) | | | | |
| | | | | TOTAL LONG-TERM INVESTMENTS
(cost $137,496,035) | | | 141,953,364 | |
| | | | | | | | | |
| | | |
| Shares | | | | | | | |
SHORT-TERM INVESTMENT 9.5% | |
|
AFFILIATED MONEY MARKET MUTUAL FUND | |
| 13,789,555 | |
| Dryden Core Investment Fund - Taxable Money Market Series
(cost $13,789,555; includes $9,802,915 of cash collateral for
securities on loan)(b)(e) | | | 13,789,555 | |
| | | | | | | | | |
| |
| TOTAL INVESTMENTS(f) 107.4%
(cost $151,285,590; Note 5) | | | 155,742,919 | |
| | | Liabilities in excess of other assets (7.4)% | | | (10,753,660 | ) |
| | | | | | | | | |
| | | NET ASSETS 100.0% | | $ | 144,989,259 | |
| | | | | | | | | |
The following abbreviations are used in Portfolio descriptions:
144A—Security was purchased pursuant to Rule 144A under the Securities Act of 1933 and may not be resold subject to that rule except to qualified institutional buyers. Unless otherwise noted, 144A securities are deemed to be liquid.
ADR—American Depositary Receipt
CVT—Convertible Security
IDS—Income Depository receipt
NR—Not Rated by Moody’s or Standard & Poor’s
PERQS—Performance Equity-Linked Redemption Quarterly-Pay Securities
UTS—Unit Trust Security
| # | Principal amount is shown in U.S. dollars unless otherwise stated. |
See Notes to Financial Statements.
| | |
| Jennison Equity Income Fund | | 15 |
Portfolio of Investments
as of October 31, 2009 continued
| † | The rating reflected is as of October 31, 2009. Rating of certain bonds may have changed subsequent to that date. |
| * | Non-income producing security. |
| (a) | All or a portion of security is on loan. The aggregate market value of such securities is $9,408,471; cash collateral of $9,802,915 (included with liabilities) was received with which the Portfolio purchased highly liquid short-term investments. |
| (b) | Represents security, or a portion thereof, purchased with cash collateral received for securities on loan. |
| (c) | Private Placement restricted as to resale and does not have a readily available market. The original cost of such security is $2,000,000. The value of $2,278,699 is approximately 1.6% of net assets. |
| (d) | Indicates a security that has been deemed illiquid. |
| (e) | Prudential Investments LLC, the manager of the Fund also serves as manager of the Dryden Core Investment Fund-Taxable Money Market Series. |
| (f) | As of October 31, 2009, 3 securities representing $4,884,475 and 3.4% of net assets were fair valued in accordance with the policies adopted by the Board of Trustees. |
Various inputs are used in determining the value of the Fund’s investments. These inputs are summarized in the three broad levels listed below.
Level 1—quoted prices in active markets for identical securities
Level 2—other significant observable inputs (including quoted prices for similar securities, interest rates, prepayment speeds, credit risk, etc.)
Level 3—significant unobservable inputs (including the Portfolio’s own assumptions in determining the fair value of investments)
The following is a summary of the inputs used as of October 31, 2009 in valuing the Fund’s assets carried at fair value:
| | | | | | | | | |
Investments in Securities | | Level 1 | | Level 2 | | Level 3 |
Common Stocks | | $ | 118,761,012 | | $ | 2,605,776 | | $ | 2,278,699 |
Preferred Stocks | | | 8,767,440 | | | 2,113,750 | | | — |
Convertible Bonds | | | — | | | 4,761,687 | | | — |
Corporate Bond | | | — | | | 2,665,000 | | | — |
Affiliated Money Market Mutual Fund | | | 13,789,555 | | | — | | | — |
| | | | | | | | | |
| | $ | 141,318,007 | | $ | 12,146,213 | | $ | 2,278,699 |
Other Financial Instruments* | | | — | | | — | | | — |
| | | | | | | | | |
Total | | $ | 141,318,007 | | $ | 12,146,213 | | $ | 2,278,699 |
| | | | | | | | | |
| * | Other financial instruments are derivative instruments not reflected in the Portfolio of Investments, such as futures, forwards and swap contracts, which are valued at the unrealized appreciation/depreciation on the instrument. |
See Notes to Financial Statements.
| | |
| 16 | | Visit our website at www.jennisondryden.com |
The following is a reconciliation of assets in which significant unobservable inputs (Level 3) were used in determining fair value:
| | | | |
| | | Common
Stocks | |
Balance as of 10/31/08 | | $ | 4,269,167 | |
Accrued discounts/premiums | | | — | |
Realized gain (loss) | | | — | |
Change in unrealized appreciation (depreciation) | | | 278,699 | |
Net purchases (sales) | | | | |
Transfers in and/or out of Level 3 | | | (2,269,167 | ) |
| | | | |
Balance as of 10/31/09 | | $ | 2,278,699 | |
| | | | |
The industry classification of investments and liabilities in excess of other assets shown as a percentage of net assets as of October 31, 2009 were as follows:
| | | |
Oil, Gas & Consumable Fuels | | 10.2 | % |
Affiliated Money Market Mutual Fund
(6.8% represents investments purchased with collateral from securities on loan) | | 9.5 | |
Multi-Utilities | | 8.5 | |
Real Estate Investment Trusts | | 8.5 | |
Diversified Telecommunication Services | | 7.9 | |
Pharmaceuticals | | 7.9 | |
Food Products | | 7.6 | |
Electric Utilities | | 6.3 | |
Capital Markets | | 5.3 | |
Commercial Services & Supplies | | 5.1 | |
Tobacco | | 4.1 | |
Diversified Financial Services | | 2.9 | |
Software | | 2.7 | |
Wireless Telecommunication Services | | 2.6 | |
Household Products | | 1.9 | |
Machinery | | 1.9 | |
Coal | | 1.8 | |
Independent Power Producers & Energy Traders | | 1.8 | |
Hotels, Restaurants & Leisure | | 1.7 | |
Beverages | | 1.6 | |
Communications Equipment | | 1.5 | |
Leisure Equipment & Products | | 1.4 | |
Gas Utilities | | 1.3 | |
Food & Staples Retailing | | 1.0 | |
Transportation Infrastructure | | 1.0 | |
Healthcare Equipment & Supplies | | 0.8 | |
Airlines | | 0.6 | |
| | | |
| | 107.4 | |
Liabilities in excess of other assets | | (7.4 | ) |
| | | |
| | 100.0 | % |
| | | |
See Notes to Financial Statements.
| | |
| Jennison Equity Income Fund | | 17 |
Statements of Assets and Liabilities
as of October 31, 2009
| | | | |
Assets | | | | |
Investments at value, including securities on loan of $9,408,471: | | | | |
Unaffiliated investments (cost $137,496,035) | | $ | 141,953,364 | |
Affiliated investments (cost $13,789,555) | | | 13,789,555 | |
Receivable for investments sold | | | 1,061,319 | |
Dividends and interest receivable | | | 864,753 | |
Receivable for Fund shares sold | | | 422,202 | |
Prepaid expenses | | | 2,206 | |
| | | | |
Total Assets | | | 158,093,399 | |
| | | | |
| |
Liabilities | | | | |
Payable to broker for collateral for securities on loan | | | 9,802,915 | |
Payable for investments purchased | | | 2,664,036 | |
Accrued expenses | | | 220,382 | |
Payable for Fund shares redeemed | | | 134,989 | |
Advisory fee payable | | | 102,861 | |
Payable to custodian | | | 75,290 | |
Distribution fee payable | | | 69,482 | |
Affiliated transfer agent’s fee | | | 30,375 | |
Deferred directors’ fee | | | 3,810 | |
| | | | |
Total Liabilities | | | 13,104,140 | |
| | | | |
| |
Net Assets | | $ | 144,989,259 | |
| | | | |
| | | | | |
Net assets were comprised of: | | | | |
Common stock, at $.001 par value | | $ | 13,636 | |
Paid-in capital in excess of par | | | 184,107,367 | |
| | | | |
| | | 184,121,003 | |
Undistributed net investment income | | | 1,971,850 | |
Accumulated net realized loss on investments and foreign currency transactions | | | (45,591,732 | ) |
Net unrealized appreciation (depreciation) on investments and foreign currencies | | | 4,488,138 | |
| | | | |
Net Assets, October 31, 2009 | | $ | 144,989,259 | |
| | | | |
See Notes to Financial Statements.
| | |
| 18 | | Visit our website at www.jennisondryden.com |
| | | |
Class A: | | | |
Net asset value and redemption price per share
($75,277,957 ÷ 6,934,533 shares of common stock issued and outstanding) | | $ | 10.86 |
Maximum sales charge (5.5% of offering price) | | | 0.63 |
| | | |
Offering price per share | | $ | 11.49 |
| | | |
| |
Class B: | | | |
Net asset value, offering price and redemption price per share
($4,550,365 ÷ 441,574 shares of common stock issued and outstanding) | | $ | 10.30 |
| | | |
| |
Class C: | | | |
Net asset value, offering price and redemption price per share
($27,279,355 ÷ 2,652,355 shares of common stock issued and outstanding) | | $ | 10.28 |
| | | |
| |
Class L: | | | |
Net asset value, offering price and redemption price per share
($17,124,556 ÷ 1,590,446 shares of common stock issued and outstanding) | | $ | 10.77 |
| | | |
| |
Class M: | | | |
Net asset value, offering price and redemption price per share
($12,069,540 ÷ 1,171,862 shares of common stock issued and outstanding) | | $ | 10.30 |
| | | |
| |
Class X: | | | |
Net asset value, offering price and redemption price per share
($8,595,126 ÷ 836,263 shares of common stock issued and outstanding) | | $ | 10.28 |
| | | |
| |
Class Z: | | | |
Net asset value, offering price and redemption price per share
($92,360 ÷ 8,500 shares of common stock issued and outstanding) | | $ | 10.87 |
| | | |
See Notes to Financial Statements.
| | |
| Jennison Equity Income Fund | | 19 |
Statement of Operations
Year Ended October 31, 2009
| | | | |
Net Investment Income | | | | |
Investment income | | | | |
Unaffiliated dividend income | | $ | 7,267,609 | |
Interest income | | | 491,122 | |
Affiliated income from securities lending, net | | | 62,896 | |
Affiliated dividend income | | | 53,268 | |
Foreign taxes withheld | | | (343,147 | ) |
| | | | |
Total income | | | 7,531,748 | |
| | | | |
| |
Expenses | | | | |
Advisory fee | | | 1,018,906 | |
Distribution fee—Class A | | | 132,045 | |
Distribution fee—Class B | | | 34,178 | |
Distribution fee—Class C | | | 226,575 | |
Distribution fee—Class L | | | 78,818 | |
Distribution fee—Class M | | | 158,055 | |
Distribution fee—Class X | | | 93,959 | |
Transfer agent’s fee and expenses (including affiliated of $134,600) | | | 355,000 | |
Custodian’s fees and expenses | | | 92,000 | |
Registration fees | | | 92,000 | |
Reports to shareholders | | | 50,000 | |
Audit fees | | | 24,000 | |
Legal fees and expenses | | | 20,000 | |
Directors’ fees | | | 18,000 | |
Insurance fees | | | 4,000 | |
Miscellaneous | | | 13,071 | |
| | | | |
Total expenses | | | 2,410,607 | |
Less: Advisory fee waivers and expense reimbursements | | | (303,108 | ) |
| | | | |
Net expenses | | | 2,107,499 | |
| | | | |
Net investment income | | | 5,424,249 | |
| | | | |
| |
Realized And Unrealized Gain (Loss) On Investment And Foreign Currency Transactions | | | | |
Net realized loss on: | | | | |
Investment transactions | | | (28,121,831 | ) |
Foreign currency transactions | | | (33,049 | ) |
| | | | |
| | | (28,154,880 | ) |
| | | | |
Net change in unrealized appreciation (depreciation) on: | | | | |
Investments | | | 51,976,564 | |
Foreign currencies | | | 48,658 | |
| | | | |
| | | 52,025,222 | |
| | | | |
Net gain on investments and foreign currencies | | | 23,870,342 | |
| | | | |
Net Increase In Net Assets Resulting From Operations | | $ | 29,294,591 | |
| | | | |
See Notes to Financial Statements.
| | |
| 20 | | Visit our website at www.jennisondryden.com |
Statement of Changes in Net Assets
| | | | | | | | |
| | | Year Ended October 31, | |
| | | 2009 | | | 2008 | |
Increase (Decrease) In Net Assets | | | | | | | | |
Operations | | | | | | | | |
Net investment income | | $ | 5,424,249 | | | $ | 8,334,100 | |
Net realized loss on investments and foreign currency transactions | | | (28,154,880 | ) | | | (19,600,482 | ) |
Net change in unrealized appreciation (depreciation) on investments and foreign currencies | | | 52,025,222 | | | | (76,727,485 | ) |
| | | | | | | | |
Net increase (decrease) in net assets resulting from operations | | | 29,294,591 | | | | (87,993,867 | ) |
| | | | | | | | |
| | |
Dividends and Distributions (Note 1) | | | | | | | | |
Dividends from net investment income | | | | | | | | |
Class A | | | (590,362 | ) | | | (1,943,877 | ) |
Class B | | | (38,103 | ) | | | (124,145 | ) |
Class C | | | (274,873 | ) | | | (1,084,801 | ) |
Class L | | | (206,801 | ) | | | (894,814 | ) |
Class M | | | (249,769 | ) | | | (1,527,384 | ) |
Class X | | | (133,216 | ) | | | (665,772 | ) |
Class Z | | | (10 | ) | | | — | |
| | | | | | | | |
Total Dividends | | | (1,493,134 | ) | | | (6,240,793 | ) |
| | | | | | | | |
Distributions from net realized gains | | | | | | | | |
Class A | | | — | | | | (13,789,687 | ) |
Class B | | | — | | | | (1,143,626 | ) |
Class C | | | — | | | | (10,704,138 | ) |
Class L | | | — | | | | (7,898,485 | ) |
Class M | | | — | | | | (17,695,805 | ) |
Class X | | | — | | | | (6,199,047 | ) |
| | | | | | | | |
Total Distributions | | | — | | | | (57,430,788 | ) |
| | | | | | | | |
| | |
Fund share transactions (Note 4) | | | | | | | | |
Net proceeds from shares sold | | | 20,423,724 | | | | 15,476,936 | |
Net asset value of shares issued in reinvestment of dividends
and distributions | | | 1,409,556 | | | | 60,377,674 | |
Cost of shares redeemed | | | (26,916,228 | ) | | | (57,146,480 | ) |
| | | | | | | | |
Increase (decrease) in net assets from Fund share transactions | | | (5,082,948 | ) | | | 18,708,130 | |
| | | | | | | | |
Total increase (decrease) in net assets | | | 22,718,509 | | | | (132,957,318 | ) |
| | |
Net Assets | | | | | | | | |
Beginning of year | | | 122,270,750 | | | | 255,228,068 | |
| | | | | | | | |
End of year (a) | | $ | 144,989,259 | | | $ | 122,270,750 | |
| | | | | | | | |
(a) Includes undistributed net investment income of | | $ | 1,971,850 | | | $ | 926,341 | |
| | | | | | | | |
See Notes to Financial Statements.
| | |
| Jennison Equity Income Fund | | 21 |
Notes to Financial Statements
1. Organization
Strategic Partners Mutual Funds, Inc., formerly known as American Skandia Advisor Funds, Inc., (the “Company”) is an open-end management investment company, registered under the Investment Company Act of 1940, as amended. The Company was organized on March 5, 1997, as a Maryland Corporation. The Company operates as a series company and effective April 12, 2004, the name of the Company was changed to Strategic Partners Mutual Funds, Inc. At October 31, 2009, the Company consisted of two diversified investment portfolios (each a “Fund” and collectively the “Funds”). The information presented in these financial statements pertains to Jennison Equity Income Fund (the “Fund”). The investment objective of the Fund is long term capital growth and income by investing primarily in common stocks that are believed to be selling at reasonable valuation in relation to their fundamental business prospects.
2. Significant Accounting Policies
The following accounting policies are in conformity with accounting principles generally accepted in the United States of America. Such policies are consistently followed by the Company and the Funds in the preparation of their financial statements.
Securities Valuation: Securities listed on a securities exchange (other than options on securities and indices) are valued at the last sale price on such exchange on the day of valuation or, if there was no sale on such day, at the mean between the last reported bid and asked prices, or at the last bid price on such day in the absence of an asked price. Securities that are actively traded via Nasdaq are valued at the official closing price as provided by Nasdaq. Securities that are actively traded in the over-the-counter market, including listed securities for which primary market is believed by Prudential Investments LLC (“PI” or “Manager”) in consultation with the subadviser, to be over-the-counter, are valued at market value using prices provided by an independent pricing agent or principal market maker. Futures contracts and options thereon traded on a commodities exchange or board of trade are valued at the last sale price at the close of trading on such exchange or board of trade or, if there was no sale on the applicable commodities exchange or board of trade on such day, at the mean between the most recently quoted prices on such exchange or board of trade or at the last bid price in the absence of an asked price. Prices may be obtained from independent pricing services which use information provided by market makers or estimates of market values obtained from yield data relating to
| | |
| 22 | | Visit our website at www.jennisondryden.com |
investments or securities with similar characteristics. Securities for which reliable market quotations are not readily available, or whose values have been affected by events occurring after the close of the security’s foreign market and before the Fund’s normal pricing time, are valued at fair value in accordance with the Board of Directors’ approved fair valuation procedures. When determining the fair valuation of securities some of the factors influencing the valuation include, the nature of any restrictions on disposition of the securities; assessment of the general liquidity of the securities; the issuer’s financial condition and the markets in which it does business; the cost of the investment; the size of the holding and the capitalization of issuer; the prices of any recent transactions or bids/offers for such securities or any comparable securities; any available analyst media or other reports or information deemed reliable by the investment adviser regarding the issuer or the markets or industry in which it operates. Using fair value to price securities may result in a value that is different from a security’s most recent closing price and from the price used by other mutual funds to calculate their net asset value.
Investments in mutual funds are valued at the net asset value as of the close of the New York Stock Exchange on the date of valuation.
Foreign Currency Translation: Fund securities and other assets and liabilities denominated in foreign currencies are translated each business day into U.S. dollars based on the current rates of exchange. Purchases and sales of Fund securities and income and expenses are translated into U.S. dollars on the respective dates of such transactions. Gains and losses resulting from changes in exchange rates applicable to long-term foreign securities are not reported separately from gains and losses arising from movements in securities prices. Net realized foreign exchange gains and losses include gains and losses from sales and maturities of foreign currency exchange contracts, gains and losses realized between the trade and settlement dates of foreign securities transactions, and the difference between the amount of net investment income accrued on foreign securities and the U.S. dollar amount actually received. Net unrealized foreign exchange gains and losses include gains and losses from changes in the value of assets and liabilities other than Fund securities, resulting from changes in exchange rates.
Repurchase Agreements: A repurchase agreement is a commitment to purchase securities from a seller who agrees to repurchase the securities at an agreed-upon price and date. The excess of the resale price over the purchase price determines the yield on the transaction. Under the terms of the agreement, the market value, including accrued interest, of the securities will be at least equal to their repurchase price. Repurchase agreements are recorded at cost, which, combined with accrued interest, approximates market value.
| | |
| Jennison Equity Income Fund | | 23 |
Notes to Financial Statements
continued
Repurchase agreements bear a risk of loss in the event that the seller defaults on its obligation to repurchase the securities. In such case, the Fund may be delayed or prevented from exercising its right to dispose of the securities.
Securities Lending: The Funds may lend their portfolio securities to broker-dealers. The loans are secured by collateral at least equal at all times to the market value of the securities loaned. Loans are subject to termination at the option of the borrower or the Funds. Upon termination of the loan, the borrower will return to the lender securities identical to the loaned securities. Should the borrower of the securities fail financially, the Funds have the right to repurchase the securities using the collateral in the open market. The Funds recognize income, net of any rebate and securities lending agent fees, for lending its securities in the form of fees or interest on the investment of any cash received as collateral. The Funds also continue to receive interest and dividends or amounts equivalent thereto, on the securities loaned and recognize any unrealized gain or loss in the market price of the securities loaned that may occur during the term of the loan.
Securities Transactions and Investment Income: Securities transactions are recorded on the trade date. Realized gains or losses on sales of investments and currency transactions are calculated on the identified cost basis. Dividend income is recorded on the ex-dividend date and interest income is recorded on the accrual basis. The Fund amortizes premiums and discounts on portfolio securities as adjustments to interest income. Expenses are recorded on the accrual basis which may require the use of certain estimates by management.
Net investment income or loss (other than distribution fees, which are charged directly to the respective class) and unrealized and realized gains or losses are allocated daily to each class of shares based upon the relative proportion of net assets of each class at the beginning of the day.
Dividends and Distributions to Shareholders: Distributions to shareholders are recorded on the ex-divided date. Dividends, if any, from net investment income are declared and paid at least quarterly. These dividends and distributions are determined in accordance with federal income tax regulations and may differ from accounting principles generally accepted in the United States of America.
Net realized gains from investment transactions, if any are distributed at least annually. Permanent book/tax differences relating to income and gains are reclassified to paid-in capital when they arise.
| | |
| 24 | | Visit our website at www.jennisondryden.com |
Taxes: For federal income tax purposes, each Fund in the Company is treated as a separate tax paying entity. It is the Funds’ policy to continue to meet the requirements of the Internal Revenue Code applicable to regulated investment companies and to distribute all of its taxable net income and capital gains, if any, to shareholders. Therefore, no federal tax provision is required. Withholding taxes on foreign dividends are recorded net of reclaimable amounts, at the time the related income is earned.
Estimates: The preparation of the financial statements requires management to make estimates and assumptions that affect the reported amounts and disclosures in the financial statements. Actual results could differ from those estimates.
3. Agreements
The Fund has entered into investment management agreements with PI which provides that the Manager will furnish the Fund with investment advice and investment management and administrative services. The Manager has entered into a subadvisory agreement with Jennison Associates LLC.
Advisory Fees and Expense Limitations: The Manager receives a fee, computed daily and paid monthly, based on an annual rate of the average net assets. The Manager pays the subadvisor a fee as compensation for advisory services provided to the Fund. The Manager has contractually agreed to waive expenses in accordance with limitation expense policies as noted in the table below. The Manager will reimburse the Fund for its operating expenses, exclusive of taxes, interest, brokerage commissions, distribution fees and extraordinary expenses, but inclusive of the advisory fee, which in the aggregate exceed specified percentages of the Fund’s average net assets while retaining their ability to be reimbursed for such fee waivers prior to the end of the fiscal year. The advisory fee and expense limitation are summarized as follows:
| | | | | | |
Advisory Expense | | Effective Advisory Fees
Net of Waiver | | | Expense
Limitation | |
0.85% to $500 million; | | 0.85 | % | | 1.15 | % |
0.80% next $500 million; | | | | | | |
0.75% in excess of $1 billion | | | | | | |
Such contractual fee waivers have been calculated prior to any fee reimbursements with respect to the expense limitations. All reimbursements by the Manager are reflected in the Statements of Operations.
Certain officers and directors of the Funds are officers or directors of the Manager. The Funds pay no compensation directly to their officers or interested directors.
| | |
| Jennison Equity Income Fund | | 25 |
Notes to Financial Statements
continued
Prudential Investment Management Services LLC (“PIMS”) and American Skandia Marketing, Incorporated (“ASMI”), both affiliates of Prudential Investments LLC and an indirect, wholly-owned subsidiary of Prudential serves as the distributor for the Funds. The Company has adopted a separate Distribution and Service plan (each a “Plan” and collectively the “Plans”) for Class A, B, C, L, M, X and Z shares of each Fund in accordance with the requirements of Rule 12b-1 of the Investment Company Act of 1940. No distribution or service fees are paid to PIMS as distributor for Class Z shares.
Under the Plans, the Fund compensate PIMS and ASMI a distribution and service fee at an annual rate up to 0.30%, 1.00%, 1.00%, 0.50%, 1.00% and 1.00% of the average daily net assets of the Class A, B, C, L, M and X shares, respectively. For the year ended October 31, 2009, PIMS has contractually agreed to limit such fees to 0.25 of 1% of the average daily net assets of the Class A shares.
During the year ended October 31, 2009, PIMS has advised the Fund, front-end sales charges (“FESC”) and gross contingent deferred sales charges (“CDSC”) were as follows:
| | | | | | | | |
Class A FESC | | Class B CDSC | | Class C CDSC | | Class M CDSC | | Class X CDSC |
| $120,992 | | $7,468 | | $1,116 | | $16,154 | | $5,700 |
4. Other Transactions with Affiliates
Prudential Mutual Fund Services LLC (“PMFS”), an affiliate of Prudential Investments LLC and an indirect, wholly-owned subsidiary of Prudential, serves as the Fund’s transfer agent. Transfer agent fees and expenses are shown in the Statements of Operations.
The Fund pays networking fees to affiliated and unaffiliated broker/dealers, including fees relating to the services of Wells Fargo Advisors, LLC (“Wells Fargo”) and First Clearing, LLC (“First Clearing”), affiliated of PI. These networking fees are payments made to broker/dealers that clear mutual fund transactions through a national clearing system. These amounts are included in transfer agent’s fees and expenses on the Statement of Operations. For the year ended October 31, 2009, the Fund incurred $43,100 in total networking fees, of which $6,000 was paid to First Clearing.
The Fund invests in the Taxable Money Market Series (the “Series”), a portfolio of Dryden Core Investment Fund. The Series is a money market mutual fund registered under the Investment Company Act of 1940, as amended, and managed by PI.
| | |
| 26 | | Visit our website at www.jennisondryden.com |
Prudential Investment Management, Inc. (“PIM”), an indirect, wholly-owned subsidiary of Prudential, served as the Fund’s securities lending agent. For the year ended October 31, 2009, PIM has been compensated approximately $105,000 for these services.
5. Shares of Capital Stock
Class A shares are sold with a front-end sales charge of up to 5.50%. Purchases of $1 million or more are subject to a contingent deferred sales charge (“CDSC”) if shares are redeemed within 12 months of their purchase. Class B shares are sold with a CDSC which declines from 5% to zero depending upon the period of time the shares are held. Class B shares will automatically convert to Class A shares approximately seven years after purchase. Class M shares will automatically convert to Class A shares approximately eight years after purchase. Class C shares are sold with a CDSC of 1% during the first 12 months. Class L shares are closed to most new purchases (with the exception of reinvested dividends and purchases by certain college savings plans). Class M shares are also closed to most new purchases (with the exception of reinvested dividends). Class L shares and Class M shares are only exchangeable with Class L shares and Class M shares, respectively, offered by the other Strategic Partners and JennisonDryden Funds. Class X shares are closed to new purchases. Class Z shares are not subject to any sales or redemption charge and are offered exclusively for a sale to a limited group of investors. The authorized capital stock of the Funds is 5.5 billion shares, with a par value of $.001 per share.
Transactions in shares of capital were as follows:
| | | | | | | |
Class A | | Shares | | | Amount | |
Year ended October 31, 2009: | | | | | | | |
Shares sold | | 1,574,591 | | | $ | 15,407,901 | |
Shares issued in reinvestment of dividends and distributions | | 71,554 | | | | 552,250 | |
Shares reacquired | | (1,391,270 | ) | | | (12,238,721 | ) |
| | | | | | | |
Net increase (decrease) in shares outstanding before conversion | | 254,875 | | | | 3,721,430 | |
Shares issued upon conversion from Class B, Class M and Class X | | 1,485,293 | | | | 13,281,873 | |
| | | | | | | |
Net increase (decrease) in shares outstanding | | 1,740,168 | | | $ | 17,003,303 | |
| | | | | | | |
Year ended October 31, 2008: | | | | | | | |
Shares sold | | 798,547 | | | $ | 10,182,259 | |
Shares issued in reinvestment of dividends and distributions | | 1,124,209 | | | | 15,098,192 | |
Shares reacquired | | (1,522,481 | ) | | | (18,987,245 | ) |
| | | | | | | |
Net increase (decrease) in shares outstanding before conversion | | 400,275 | | | | 6,293,206 | |
Shares issued upon conversion from Class B, Class M, and Class X into A | | 1,745,515 | | | | 22,234,927 | |
| | | | | | | |
Net increase (decrease) in shares outstanding | | 2,145,790 | | | $ | 28,528,133 | |
| | | | | | | |
| | |
| Jennison Equity Income Fund | | 27 |
Notes to Financial Statements
continued
| | | | | | | |
Class B | | Shares | | | Amount | |
Year ended October 31, 2009: | | | | | | | |
Shares sold | | 133,883 | | | $ | 1,184,156 | |
Shares issued in reinvestment of dividends and distributions | | 4,915 | | | | 36,257 | |
Shares reacquired | | (65,742 | ) | | | (537,845 | ) |
| | | | | | | |
Net increase (decrease) in shares outstanding before conversion | | 73,056 | | | | 682,568 | |
Shares reacquired upon conversion into Class A | | (3,047 | ) | | | (26,885 | ) |
| | | | | | | |
Net increase (decrease) in shares outstanding | | 70,009 | | | $ | 655,683 | |
| | | | | | | |
Year ended October 31, 2008: | | | | | | | |
Shares sold | | 102,638 | | | $ | 1,219,155 | |
Shares issued in reinvestment of dividends and distributions | | 93,538 | | | | 1,206,882 | |
Shares reacquired | | (78,490 | ) | | | (968,435 | ) |
| | | | | | | |
Net increase (decrease) in shares outstanding before conversion | | 117,686 | | | | 1,457,602 | |
Shares reacquired upon conversion into Class A | | (9,047 | ) | | | (105,186 | ) |
| | | | | | | |
Net increase (decrease) in shares outstanding | | 108,639 | | | $ | 1,352,416 | |
| | | | | | | |
Class C | | | | | | |
Year ended October 31, 2009: | | | | | | | |
Shares sold | | 361,578 | | | $ | 3,353,254 | |
Shares issued in reinvestment of dividends and distributions | | 34,904 | | | | 256,782 | |
Shares reacquired | | (574,291 | ) | | | (4,739,575 | ) |
| | | | | | | |
Net increase (decrease) in shares outstanding | | (177,809 | ) | | $ | (1,129,539 | ) |
| | | | | | | |
Year ended October 31, 2008: | | | | | | | |
Shares sold | | 260,750 | | | $ | 3,171,604 | |
Shares issued in reinvestment of dividends and distributions | | 868,084 | | | | 11,180,250 | |
Shares reacquired | | (777,400 | ) | | | (9,434,202 | ) |
| | | | | | | |
Net increase (decrease) in shares outstanding | | 351,434 | | | $ | 4,917,652 | |
| | | | | | | |
Class L | | | | | | |
Year ended October 31, 2009: | | | | | | | |
Shares sold | | 5,698 | | | $ | 56,942 | |
Shares issued in reinvestment of dividends and distributions | | 26,126 | | | | 200,584 | |
Shares reacquired | | (433,408 | ) | | | (3,748,181 | ) |
| | | | | | | |
Net increase (decrease) in shares outstanding | | (401,584 | ) | | $ | (3,490,655 | ) |
| | | | | | | |
Year ended October 31, 2008: | | | | | | | |
Shares sold | | 15,236 | | | $ | 204,027 | |
Shares issued in reinvestment of dividends and distributions | | 637,860 | | | | 8,535,877 | |
Shares reacquired | | (494,743 | ) | | | (6,158,147 | ) |
| | | | | | | |
Net increase (decrease) in shares outstanding | | 158,353 | | | $ | 2,581,757 | |
| | | | | | | |
| | |
| 28 | | Visit our website at www.jennisondryden.com |
| | | | | | | |
Class M | | Shares | | | Amount | |
Year ended October 31, 2009: | | | | | | | |
Shares sold | | 12,484 | | | $ | 100,748 | |
Shares issued in reinvestment of dividends and distributions | | 31,623 | | | | 233,065 | |
Shares reacquired | | (434,412 | ) | | | (3,502,770 | ) |
| | | | | | | |
Net increase (decrease) in shares outstanding before conversion | | (390,305 | ) | | | (3,168,957 | ) |
Shares reacquired upon conversion into Class A | | (1,154,160 | ) | | | (9,804,921 | ) |
| | | | | | | |
Net increase (decrease) in shares outstanding | | (1,544,465 | ) | | $ | (12,973,878 | ) |
| | | | | | | |
Year ended October 31, 2008: | | | | | | | |
Shares sold | | 44,700 | | | $ | 605,499 | |
Shares issued in reinvestment of dividends and distributions | | 1,365,632 | | | | 17,647,609 | |
Shares reacquired | | (1,294,819 | ) | | | (16,176,620 | ) |
| | | | | | | |
Net increase (decrease) in shares outstanding before conversion | | 115,513 | | | | 2,076,488 | |
Shares reacquired upon conversion into Class A | | (1,693,049 | ) | | | (20,927,040 | ) |
| | | | | | | |
Net increase (decrease) in shares outstanding | | (1,577,536 | ) | | $ | (18,850,552 | ) |
| | | | | | | |
Class X | | | | | | |
Year ended October 31, 2009: | | | | | | | |
Shares sold | | 27,204 | | | $ | 230,831 | |
Shares issued in reinvestment of dividends and distributions | | 17,753 | | | | 130,608 | |
Shares reacquired | | (267,040 | ) | | | (2,149,106 | ) |
| | | | | | | |
Net increase (decrease) in shares outstanding before conversion | | (222,083 | ) | | | (1,787,667 | ) |
Shares reacquired upon conversion into Class A | | (403,347 | ) | | | (3,450,067 | ) |
| | | | | | | |
Net increase (decrease) in shares outstanding | | (625,430 | ) | | $ | (5,237,734 | ) |
| | | | | | | |
Year ended October 31, 2008: | | | | | | | |
Shares sold | | 7,854 | | | $ | 93,392 | |
Shares issued in reinvestment of dividends and distributions | | 521,502 | | | | 6,708,864 | |
Shares reacquired | | (426,866 | ) | | | (5,421,831 | ) |
| | | | | | | |
Net increase (decrease) in shares outstanding before conversion | | 102,490 | | | | 1,380,425 | |
Shares reacquired upon conversion into Class A | | (119,010 | ) | | | (1,202,701 | ) |
| | | | | | | |
Net increase (decrease) in shares outstanding | | (16,520 | ) | | $ | 177,724 | |
| | | | | | | |
Class Z | | | | | | |
Year ended October 31, 2009: | | | | | | | |
Shares sold | | 8,418 | | | $ | 89,892 | |
Shares issued in reinvestment of dividends and distributions | | 1 | | | | 10 | |
Shares reacquired | | (3 | ) | | | (30 | ) |
| | | | �� | | | |
Net increase (decrease) in shares outstanding | | 8,416 | | | $ | 89,872 | |
| | | | | | | |
Year ended October 31, 2008: | | | | | | | |
Shares sold | | 84 | | | $ | 1,000 | |
Shares issued in reinvestment of dividends and distributions | | — | | | | — | |
Shares reacquired | | — | | | | — | |
| | | | | | | |
Net increase (decrease) in shares outstanding | | 84 | | | $ | 1,000 | |
| | | | | | | |
| | |
| Jennison Equity Income Fund | | 29 |
Notes to Financial Statements
continued
6. Distributions and Tax Information
Distributions to shareholders, which are determined in accordance with federal income tax regulations, which may differ from generally accepted accounting principles, are recorded on the ex-dividend date. In order to present undistributed net investment income, accumulated net realized loss on investments and foreign currency transactions and paid-in capital in excess of par on the Statement of Assets and Liabilities that more closely represent their tax character, certain adjustments have been made to undistributed net investment income, accumulated net realized loss on investments and foreign currency transactions and paid-in capital in excess of par. For the tax year ended October 31, 2009, the adjustments were to decrease undistributed net investment income by $2,885,606, to decrease accumulated net realized loss on investments and foreign currency transactions by $12,461,309 and decrease paid-in capital in excess of par by $9,575,703 due to the different treatment for book and tax purposes of certain transactions involving foreign securities and currencies, investments in passive foreign investments companies and partnerships and the expiration of a capital loss carryforward. Net investment income, net realized loss and net assets were not affected by this change.
For the fiscal year ended October 31, 2009 the tax character of dividends paid as reflected in the Statement of Changes in Net Assets was $1,493,134 from ordinary income. For the fiscal year ended October 31, 2008 the tax character of dividends paid as reflected in the Statement of Changes in Net Assets were $6,263,515 from ordinary income and $57,408,066 from long term capital gains. For federal income tax purposes, dividends from net investment income and distributions from short-term capital gains are taxable as ordinary income. Long-term capital gain distributions are taxable as such.
As of October 31, 2009, the accumulated undistributed earnings on a tax basis was $2,134,656 from ordinary income. This differs from the amount shown on the Statement of Assets and Liabilities primarily due to cumulative timing differences between financial and tax reporting.
At October 31, 2009, for federal income tax purposes, the Fund had a capital loss carryforward of approximately $45,233,000 of which $2,829,000 expires in 2010, $18,315,000 expires in 2016 and $24,089,000 expires in 2017. As of October 31, 2009, approximately $9,574,000 of the capital loss carryforward was written off due to expiration. No capital gain distributions are expected to be paid to shareholders until net gains have been realized in excess of such carryforward. It is uncertain whether the Fund will be able to realize the full benefit prior to the expiration date.
| | |
| 30 | | Visit our website at www.jennisondryden.com |
The federal income tax basis of the Fund’s investments and the net unrealized appreciation as of October 31, 2009 was as follows:
| | | | | | |
Tax basis | | Appreciation | | Depreciation | | Net Unrealized
Appreciation |
$151,803,421 | | $14,508,460 | | $(10,568,962) | | $3,939,498 |
The difference between book basis and tax basis was primarily attributable to deferred losses on wash sales, mark-to-market of open passive foreign investment companies and investments in partnerships.
Management has analyzed the Fund’s tax positions taken on federal income tax returns for all open tax years and has concluded that as of October 31, 2009, no provisions for income tax would be required in the Fund’s financial statements. The Fund’s federal and state income and federal excise tax returns for tax years for which the applicable statutes of limitations have not expired are subject to examination by the Internal Revenue Service and state departments of revenue.
7. Portfolio Securities
Purchases and sales of securities, other than U.S. government securities and short term obligations, during the year ended October 31, 2009, were $87,965,813 and $72,794,842, respectively.
8. Borrowings
The Fund, along with other affiliated registered investment companies, is a party to a Syndicated credit Agreement (“SCA”) with two banks. The SCA provides for a commitment of $500 million. Interest on any borrowings under the SCA would be incurred at market rates and a commitment fee for the unused amount is accrued daily and paid quarterly. Effective October 22, 2009, the Funds renewed the SCA with the two banks. The commitment under the renewed SCA continues to be $500 million. The Funds pay a commitment fee of .15 of 1% of the unused portion of the renewed SCA. The expiration date of the renewed SCA is October 20, 2010. For the period from October 24, 2008 through October 21, 2009, the Funds paid a commitment fee of .13 of 1% of the unused portion of the agreement. The purpose of the SCA is to provide an alternative source of temporary funding for capital share redemptions.
The Fund did not utilize the line of credit during the year ended October 31, 2009.
| | |
| Jennison Equity Income Fund | | 31 |
Notes to Financial Statements
continued
9. Subsequent Events
Management has evaluated the impact of all subsequent events on the Fund through December 23, 2009, the date the financial statements were issued, and has been determined that, except for the following, there were no subsequent events requiring recognition or disclosure in the financial statements.
On December 16, 2009, the Fund declared an ordinary income dividend of $0.2313 per Class A share, $0.1651 per Class B, Class C, Class M, and Class X share, $0.2082 per Class L share, and $0.2557 per Class Z share. The dividend paid to shareholders of record on December 17, 2009. The ex-dividend date was December 18, 2009.
| | |
| 32 | | Visit our website at www.jennisondryden.com |
Financial Highlights
| | |
| OCTOBER 31, 2009 | | ANNUAL REPORT |
Jennison Equity Income Fund
Financial Highlights
| | | | |
| | | Class A | |
| | | Year Ended
October 31, 2009(b) | |
Per Share Operating Performance: | | | | |
Net Asset Value, Beginning Of Year | | $ | 8.60 | |
| | | | |
Income from investment operations: | | | | |
Net investment income | | | .44 | |
Net realized and unrealized gain (loss) on investments | | | 1.93 | |
| | | | |
Total from investment operations | | | 2.37 | |
| | | | |
Less Dividends and Distributions: | | | | |
Dividends from net investment income | | | (.11 | ) |
Distributions from net realized gains | | | — | |
| | | | |
Total dividends and distributions | | | (.11 | ) |
| | | | |
Net asset value, end of year | | $ | 10.86 | |
| | | | |
Total Return(a) | | | 28.09 | % |
Ratios/Supplemental Data: | | | | |
Net assets, end of year (in millions) | | $ | 75.3 | |
Ratios to average net assets(c): | | | | |
Expenses after advisory fee waiver and expense reimbursement | | | 1.40 | % |
Expenses before advisory fee waiver and expense reimbursement | | | 1.66 | % |
Net investment income | | | 4.79 | % |
For Class A, B, C, L, M, X, and Z shares: | | | | |
Portfolio turnover rate | | | 63 | % |
| (a) | Total return does not consider the effects of sales load. Total return is calculated assuming a purchase of a share on the first day and a sale on the last day of each year reported and includes reinvestment of dividends and distributions. Total returns may reflect adjustments to conform with generally accepted accounting principles. Total return includes the effect of expense subsidies. |
| (b) | Calculations are based on the average daily number of shares outstanding. |
| (c) | Does not include expenses of the underlying portfolio in which the Fund invests. |
See Notes to Financial Statements.
| | |
| 34 | | Visit our website at www.jennisondryden.com |
| | | | | | | | | | | | | | |
| Class A | |
| Year Ended October 31, | |
| 2008(b) | | | 2007(b) | | | 2006(b) | | | 2005 | |
| | | | | | | | | | | | | | |
| $ | 19.47 | | | $ | 16.45 | | | $ | 13.99 | | | $ | 12.99 | |
| | | | | | | | | | | | | | | |
| | | | | | | | | | | | | | |
| | .60 | | | | .66 | | | | .12 | | | | .13 | |
| | (6.57 | ) | | | 3.02 | | | | 2.36 | | | | 1.00 | |
| | | | | | | | | | | | | | | |
| | (5.97 | ) | | | 3.68 | | | | 2.48 | | | | 1.13 | |
| | | | | | | | | | | | | | | |
| | | | | | | | | | | | | | |
| | (.49 | ) | | | (.66 | ) | | | (.02 | ) | | | (.13 | ) |
| | (4.41 | ) | | | — | | | | — | | | | — | |
| | | | | | | | | | | | | | | |
| | (4.90 | ) | | | (.66 | ) | | | (.02 | ) | | | (.13 | ) |
| | | | | | | | | | | | | | | |
| $ | 8.60 | | | $ | 19.47 | | | $ | 16.45 | | | $ | 13.99 | |
| | | | | | | | | | | | | | | |
| | (39.46 | )% | | | 22.72 | % | | | 17.74 | % | | | 8.72 | % |
| | | | | | | | | | | | | | |
| $ | 44.7 | | | $ | 59.3 | | | $ | 30.3 | | | $ | 14.8 | |
| | | | | | | | | | | | | | |
| | 1.41 | % | | | 1.40 | % | | | 1.40 | % | | | 1.41 | % |
| | 1.50 | % | | | 1.51 | % | | | 1.49 | % | | | 1.84 | % |
| | 4.75 | % | | | 3.83 | % | | | .78 | % | | | .78 | % |
| | | | | | | | | | | | | | |
| | 66 | % | | | 143 | % | | | 36 | % | | | 66 | % |
See Notes to Financial Statements.
| | |
| Jennison Equity Income Fund | | 35 |
Financial Highlights
continued
| | | | |
| | | Class B | |
| | | Year Ended
October 31, 2009(b) | |
Per Share Operating Performance: | | | | |
Net Asset Value, Beginning Of Year | | $ | 8.22 | |
| | | | |
Income from investment operations: | | | | |
Net investment income (loss) | | | .36 | |
Net realized and unrealized gain (loss) on investments | | | 1.82 | |
| | | | |
Total from investment operations | | | 2.18 | |
| | | | |
Less Dividends and Distributions: | | | | |
Dividends from net investment income | | | (.10 | ) |
Distributions from net realized gains | | | — | |
| | | | |
Total dividends and distributions | | | (.10 | ) |
| | | | |
Net asset value, end of year | | $ | 10.30 | |
| | | | |
Total Return(a) | | | 27.03 | % |
Ratios/Supplemental Data: | | | | |
Net assets, end of year (in millions) | | $ | 4.6 | |
Ratios to average net assets(c): | | | | |
Expenses after advisory fee waiver and expense reimbursement | | | 2.15 | % |
Expenses before advisory fee waiver and expense reimbursement | | | 2.41 | % |
Net investment income (loss) | | | 4.11 | % |
| (a) | Total return does not consider the effects of sales load. Total return is calculated assuming a purchase of a share on the first day and a sale on the last day of each year reported and includes reinvestment of dividends and distributions. Total returns may reflect adjustments to conform with generally accepted accounting principles. Total return includes the effect of expense subsidies. |
| (b) | Calculations are based on the average daily number of shares outstanding. |
| (c) | Does not include expenses of the underlying portfolio in which the Fund invests. |
| * | Amount is less than $0.005. |
See Notes to Financial Statements.
| | |
| 36 | | Visit our website at www.jennisondryden.com |
| | | | | | | | | | | | | | |
| Class B | |
| Year Ended October 31, | |
| 2008(b) | | | 2007(b) | | | 2006(b) | | | 2005 | |
| | | | | | | | | | | | | | |
| $ | 18.85 | | | $ | 15.89 | | | $ | 13.60 | | | $ | 12.63 | |
| | | | | | | | | | | | | | | |
| | | | | | | | | | | | | | |
| | .49 | | | | .51 | | | | .01 | | | | — | * |
| | (6.31 | ) | | | 2.91 | | | | 2.28 | | | | .98 | |
| | | | | | | | | | | | | | | |
| | (5.82 | ) | | | 3.42 | | | | 2.29 | | | | .98 | |
| | | | | | | | | | | | | | | |
| | | | | | | | | | | | | | |
| | (.40 | ) | | | (.46 | ) | | | — | | | | (.01 | ) |
| | (4.41 | ) | | | — | | | | — | | | | — | |
| | | | | | | | | | | | | | | |
| | (4.81 | ) | | | (.46 | ) | | | — | | | | (.01 | ) |
| | | | | | | | | | | | | | | |
| $ | 8.22 | | | $ | 18.85 | | | $ | 15.89 | | | $ | 13.60 | |
| | | | | | | | | | | | | | | |
| | (39.89 | )% | | | 21.76 | % | | | 16.84 | % | | | 7.77 | % |
| | | | | | | | | | | | | | |
| $ | 3.1 | | | $ | 5.0 | | | $ | 4.1 | | | $ | 3.1 | |
| | | | | | | | | | | | | | |
| | 2.16 | % | | | 2.15 | % | | | 2.15 | % | | | 2.16 | % |
| | 2.24 | % | | | 2.26 | % | | | 2.24 | % | | | 2.59 | % |
| | 3.98 | % | | | 2.95 | % | | | .05 | % | | | (.04 | )% |
See Notes to Financial Statements.
| | |
| Jennison Equity Income Fund | | 37 |
Financial Highlights
continued
| | | | |
| | | Class C | |
| | | Year Ended
October 31, 2009(b) | |
Per Share Operating Performance: | | | | |
Net Asset Value, Beginning Of Year | | $ | 8.20 | |
| | | | |
Income from investment operations: | | | | |
Net investment income | | | .35 | |
Net realized and unrealized gain (loss) on investments | | | 1.83 | |
| | | | |
Total from investment operations | | | 2.18 | |
| | | | |
Less Dividends and Distributions: | | | | |
Dividends from net investment income | | | (.10 | ) |
Distributions from net realized gains | | | — | |
| | | | |
Total dividends and distributions | | | (.10 | ) |
| | | | |
Net asset value, end of year | | $ | 10.28 | |
| | | | |
Total Return(a) | | | 27.09 | % |
Ratios/Supplemental Data: | | | | |
Net assets, end of year (in millions) | | $ | 27.3 | |
Ratios to average net assets(c): | | | | |
Expenses after advisory fee waiver and expense reimbursement | | | 2.15 | % |
Expenses before advisory fee waiver and expense reimbursement | | | 2.41 | % |
Net investment income | | | 4.13 | % |
| (a) | Total return does not consider the effects of sales load. Total return is calculated assuming a purchase of a share on the first day and a sale on the last day of each year reported and includes reinvestment of dividends and distributions. Total returns may reflect adjustments to conform with generally accepted accounting principles. Total return includes the effect of expense subsidies. |
| (b) | Calculations are based on the average daily number of shares outstanding. |
| (c) | Does not include expenses of the underlying portfolio in which the Fund invests. |
See Notes to Financial Statements.
| | |
| 38 | | Visit our website at www.jennisondryden.com |
| | | | | | | | | | | | | | |
| Class C | |
| Year Ended October 31, | |
| 2008(b) | | | 2007(b) | | | 2006(b) | | | 2005 | |
| | | | | | | | | | | | | | |
| $ | 18.82 | | | $ | 15.87 | | | $ | 13.57 | | | $ | 12.61 | |
| | | | | | | | | | | | | | | |
| | | | | | | | | | | | | | |
| | .49 | | | | .52 | | | | .01 | | | | .01 | |
| | (6.30 | ) | | | 2.89 | | | | 2.29 | | | | .96 | |
| | | | | | | | | | | | | | | |
| | (5.81 | ) | | | 3.41 | | | | 2.30 | | | | .97 | |
| | | | | | | | | | | | | | | |
| | | | | | | | | | | | | | |
| | (.40 | ) | | | (.46 | ) | | | — | | | | (.01 | ) |
| | (4.41 | ) | | | — | | | | — | | | | — | |
| | | | | | | | | | | | | | | |
| | (4.81 | ) | | | (.46 | ) | | | — | | | | (.01 | ) |
| | | | | | | | | | | | | | | |
| $ | 8.20 | | | $ | 18.82 | | | $ | 15.87 | | | $ | 13.57 | |
| | | | | | | | | | | | | | | |
| | (39.91 | )% | | | 21.80 | % | | | 16.95 | % | | | 7.70 | % |
| | | | | | | | | | | | | | |
| $ | 23.2 | | | $ | 46.6 | | | $ | 46.7 | | | $ | 54.2 | |
| | | | | | | | | | | | | | |
| | 2.16 | % | | | 2.15 | % | | | 2.15 | % | | | 2.16 | % |
| | 2.25 | % | | | 2.26 | % | | | 2.24 | % | | | 2.59 | % |
| | 3.96 | % | | | 2.89 | % | | | .07 | % | | | .14 | % |
See Notes to Financial Statements.
| | |
| Jennison Equity Income Fund | | 39 |
Financial Highlights
continued
| | | | |
| | | Class L | |
| | | Year Ended October 31, 2009(b) | |
Per Share Operating Performance: | | | | |
Net Asset Value, Beginning Of Year | | $ | 8.55 | |
| | | | |
Income from investment operations: | | | | |
Net investment income | | | .42 | |
Net realized and unrealized gain (loss) on investments | | | 1.91 | |
| | | | |
Total from investment operations | | | 2.33 | |
| | | | |
Less Dividends and Distributions: | | | | |
Dividends from net investment income | | | (.11 | ) |
Distributions from net realized gains | | | — | |
| | | | |
Total dividends and distributions | | | (.11 | ) |
| | | | |
Net asset value, end of year | | $ | 10.77 | |
| | | | |
Total Return(a) | | | 27.73 | % |
Ratios/Supplemental Data: | | | | |
Net assets, end of year (in millions) | | $ | 17.1 | |
Ratios to average net assets(c): | | | | |
Expenses after advisory fee waiver and expense reimbursement | | | 1.65 | % |
Expenses before advisory fee waiver and expense reimbursement | | | 1.91 | % |
Net investment income | | | 4.69 | % |
| (a) | Total return does not consider the effects of sales load. Total return is calculated assuming a purchase of a share on the first day and a sale on the last day of each year reported and includes reinvestment of dividends and distributions. Total returns may reflect adjustments to conform with generally accepted accounting principles. Total return includes the effect of expense subsidies. |
| (b) | Calculations are based on the average daily number of shares outstanding. |
| (c) | Does not include expenses of the underlying portfolio in which the Fund invests. |
See Notes to Financial Statements.
| | |
| 40 | | Visit our website at www.jennisondryden.com |
| | | | | | | | | | | | | | |
| Class L | |
| Year Ended October 31, | |
| 2008(b) | | | 2007(b) | | | 2006(b) | | | 2005 | |
| | | | | | | | | | | | | | |
| $ | 19.38 | | | $ | 16.37 | | | $ | 13.93 | | | $ | 12.96 | |
| | | | | | | | | | | | | | | |
| | | | | | | | | | | | | | |
| | .57 | | | | .61 | | | | .08 | | | | .08 | |
| | (6.54 | ) | | | 2.99 | | | | 2.36 | | | | .98 | |
| | | | | | | | | | | | | | | |
| | (5.97 | ) | | | 3.60 | | | | 2.44 | | | | 1.06 | |
| | | | | | | | | | | | | | | |
| | | | | | | | | | | | | | |
| | (.45 | ) | | | (.59 | ) | | | — | | | | (.09 | ) |
| | (4.41 | ) | | | — | | | | — | | | | — | |
| | | | | | | | | | | | | | | |
| | (4.86 | ) | | | (.59 | ) | | | — | | | | (.09 | ) |
| | | | | | | | | | | | | | | |
| $ | 8.55 | | | $ | 19.38 | | | $ | 16.37 | | | $ | 13.93 | |
| | | | | | | | | | | | | | | |
| | (39.63 | )% | | | 22.43 | % | | | 17.52 | % | | | 8.19 | % |
| | | | | | | | | | | | | | |
| $ | 17.0 | | | $ | 35.5 | | | $ | 38.7 | | | $ | 46.3 | |
| | | | | | | | | | | | | | |
| | 1.66 | % | | | 1.65 | % | | | 1.65 | % | | | 1.66 | % |
| | 1.75 | % | | | 1.76 | % | | | 1.74 | % | | | 2.09 | % |
| | 4.45 | % | | | 3.37 | % | | | .57 | % | | | .67 | % |
See Notes to Financial Statements.
| | |
| Jennison Equity Income Fund | | 41 |
Financial Highlights
continued
| | | | |
| | | Class M | |
| | | Year Ended
October 31, 2009(b) | |
Per Share Operating Performance: | | | | |
Net Asset Value, Beginning Of Year | | $ | 8.22 | |
| | | | |
Income from investment operations: | | | | |
Net investment income | | | .36 | |
Net realized and unrealized gain (loss) on investments | | | 1.82 | |
| | | | |
Total from investment operations | | | 2.18 | |
| | | | |
Less Dividends and Distributions: | | | | |
Dividends from net investment income | | | (.10 | ) |
Distributions from net realized gains | | | — | |
| | | | |
Total dividends and distributions | | | (.10 | ) |
| | | | |
Net asset value, end of year | | $ | 10.30 | |
| | | | |
Total Return(a) | | | 27.03 | % |
Ratios/Supplemental Data: | | | | |
Net assets, end of year (in millions) | | $ | 12.1 | |
Ratios to average net assets(c): | | | | |
Expenses after advisory fee waiver and expense reimbursement | | | 2.15 | % |
Expenses before advisory fee waiver and expense reimbursement | | | 2.41 | % |
Net investment income | | | 4.29 | % |
| (a) | Total return does not consider the effects of sales load. Total return is calculated assuming a purchase of a share on the first day and a sale on the last day of each year reported and includes reinvestment of dividends and distributions. Total returns may reflect adjustments to conform with generally accepted accounting principles. Total return includes the effect of expense subsidies. |
| (b) | Calculations are based on the average daily number of shares outstanding. |
| (c) | Does not include expenses of the underlying portfolio in which the Fund invests. |
See Notes to Financial Statements.
| | |
| 42 | | Visit our website at www.jennisondryden.com |
| | | | | | | | | | | | | | |
| Class M | |
| Year Ended October 31, | |
| 2008(b) | | | 2007(b) | | | 2006(b) | | | 2005 | |
| | | | | | | | | | | | | | |
| $ | 18.85 | | | $ | 15.89 | | | $ | 13.60 | | | $ | 12.63 | |
| | | | | | | | | | | | | | | |
| | | | | | | | | | | | | | |
| | .49 | | | | .52 | | | | .01 | | | | .01 | |
| | (6.31 | ) | | | 2.90 | | | | 2.28 | | | | .97 | |
| | | | | | | | | | | | | | | |
| | (5.82 | ) | | | 3.42 | | | | 2.29 | | | | .98 | |
| | | | | | | | | | | | | | | |
| | | | | | | | | | | | | | |
| | (.40 | ) | | | (.46 | ) | | | — | | | | (.01 | ) |
| | (4.41 | ) | | | — | | | | — | | | | — | |
| | | | | | | | | | | | | | | |
| | (4.81 | ) | | | (.46 | ) | | | — | | | | (.01 | ) |
| | | | | | | | | | | | | | | |
| $ | 8.22 | | | $ | 18.85 | | | $ | 15.89 | | | $ | 13.60 | |
| | | | | | | | | | | | | | | |
| | (39.89 | )% | | | 21.76 | % | | | 16.84 | % | | | 7.77 | % |
| | | | | | | | | | | | | | |
| $ | 22.3 | | | $ | 80.9 | | | $ | 117.6 | | | $ | 143.4 | |
| | | | | | | | | | | | | | |
| | 2.16 | % | | | 2.15 | % | | | 2.15 | % | | | 2.16 | % |
| | 2.25 | % | | | 2.26 | % | | | 2.24 | % | | | 2.59 | % |
| | 3.90 | % | | | 2.79 | % | | | .07 | % | | | .13 | % |
| | |
| Jennison Equity Income Fund | | 43 |
Financial Highlights
continued
| | | | |
| | | Class X | |
| | | Year Ended October 31, 2009(b) | |
Per Share Operating Performance: | | | | |
Net Asset Value, Beginning Of Year | | $ | 8.20 | |
| | | | |
Income from investment operations: | | | | |
Net investment income | | | .36 | |
Net realized and unrealized gain (loss) on investments | | | 1.82 | |
| | | | |
Total from investment operations | | | 2.18 | |
| | | | |
Less Dividends and Distributions: | | | | |
Dividends from net investment income | | | (.10 | ) |
Distributions from net realized gains | | | — | |
| | | | |
Total dividends and distributions | | | (.10 | ) |
| | | | |
Net asset value, end of year | | $ | 10.28 | |
| | | | |
Total Return(a) | | | 27.09 | % |
Ratios/Supplemental Data: | | | | |
Net assets, end of year (in millions) | | $ | 8.6 | |
Ratios to average net assets(c): | | | | |
Expenses after advisory fee waiver and expense reimbursement | | | 2.15 | % |
Expenses before advisory fee waiver and expense reimbursement | | | 2.41 | % |
Net investment income | | | 4.24 | % |
| (a) | Total return does not consider the effects of sales load. Total return is calculated assuming a purchase of a share on the first day and a sale on the last day of each year reported and includes reinvestment of dividends and distributions. Total returns may reflect adjustments to conform with generally accepted accounting principles. Total return includes the effect of expense subsidies. |
| (b) | Calculations are based on the average daily number of shares outstanding. |
| (c) | Does not include expenses of the underlying portfolio in which the Fund invests. |
| | |
| 44 | | Visit our website at www.jennisondryden.com |
| | | | | | | | | | | | | | |
| Class X | |
| Year Ended October 31, | |
| 2008(b) | | | 2007(b) | | | 2006(b) | | | 2005 | |
| | | | | | | | | | | | | | |
| $ | 18.81 | | | $ | 15.86 | | | $ | 13.57 | | | $ | 12.61 | |
| | | | | | | | | | | | | | | |
| | | | | | | | | | | | | | |
| | .51 | | | | .52 | | | | .01 | | | | .01 | |
| | (6.28 | ) | | | 2.89 | | | | 2.28 | | | | .96 | |
| | | | | | | | | | | | | | | |
| | (5.77 | ) | | | 3.41 | | | | 2.29 | | | | .97 | |
| | | | | | | | | | | | | | | |
| | | | | | | | | | | | | | |
| | (.43 | ) | | | (.46 | ) | | | — | | | | (.01 | ) |
| | (4.41 | ) | | | — | | | | — | | | | — | |
| | | | | | | | | | | | | | | |
| | (4.84 | ) | | | (.46 | ) | | | — | | | | (.01 | ) |
| | | | | | | | | | | | | | | |
| $ | 8.20 | | | $ | 18.81 | | | $ | 15.86 | | | $ | 13.57 | |
| | | | | | | | | | | | | | | |
| | (39.74 | )% | | | 21.74 | % | | | 16.88 | % | | | 7.70 | % |
| | | | | | | | | | | | | | |
| $ | 12.0 | | | $ | 27.8 | | | $ | 29.3 | | | $ | 41.0 | |
| | | | | | | | | | | | | | |
| | 1.93 | % | | | 2.15 | % | | | 2.15 | % | | | 2.16 | % |
| | 2.02 | % | | | 2.26 | % | | | 2.24 | % | | | 2.59 | % |
| | 4.18 | % | | | 2.87 | % | | | .07 | % | | | .13 | % |
| | |
| Jennison Equity Income Fund | | 45 |
Financial Highlights
continued
| | | | | | | | |
| | | Class Z | |
| | | Year Ended October 31,
2009(e) | | | August 22, 2008(d) through October 31,
2008(e) | |
Per Share Operating Performance: | | | | | | | | |
Net Asset Value, Beginning Of Period | | $ | 8.60 | | | $ | 11.89 | |
| | | | | | | | |
Income from investment operations: | | | | | | | | |
Net investment income | | | .27 | | | | .13 | |
Net realized and unrealized gain (loss) on investments | | | 2.11 | | | | (3.42 | ) |
| | | | | | | | |
Total from investment operations | | | 2.38 | | | | (3.29 | ) |
| | | | | | | | |
Less Dividends and Distributions: | | | | | | | | |
Dividends from net investment income | | | (.11 | ) | | | — | |
Distributions from net realized gains | | | — | | | | — | |
| | | | | | | | |
Total dividends and distributions | | | (.11 | ) | | | — | |
| | | | | | | | |
Net asset value, end of period | | $ | 10.87 | | | $ | 8.60 | |
| | | | | | | | |
Total Return(a) | | | 28.27 | % | | | (27.67 | )% |
Ratios/Supplemental Data: | | | | | | | | |
Net assets, end of period (in millions) | | $ | — | (c) | | $ | — | (c) |
Ratios to average net assets(f): | | | | | | | | |
Expenses after advisory fee waiver and expense reimbursement | | | 1.15 | % | | | 1.03 | %(b) |
Expenses before advisory fee waiver and expense reimbursement | | | 1.41 | % | | | 1.03 | %(b) |
Net investment income | | | 2.44 | % | | | 6.92 | %(b) |
| (a) | Total return does not consider the effects of sales load. Total return is calculated assuming a purchase of a share on the first day and a sale on the last day of each period reported and includes reinvestment of dividends and distributions. Total return for periods of less than a full year are not annualized. Total returns may reflect adjustments to conform with generally accepted accounting principles. Total return includes the effect of expense subsidies. |
| (c) | Net assets were $724 and $92,360 on October 31, 2008 and October 31, 2009, respectively. |
| (d) | Commencement of operations. |
| (e) | Calculations are based on the average daily number of shares outstanding. |
| (f) | Does not include expenses of the underlying portfolio in which the Fund invests. |
See Notes to Financial Statements.
| | |
| 46 | | Visit our website at www.jennisondryden.com |
Report of Independent Registered Public Accounting Firm
The Board of Directors and Shareholders
Strategic Partners Mutual Funds, Inc.:
We have audited the accompanying statement of assets and liabilities of Jennison Equity Income Fund, a series of Strategic Partners Mutual Funds, Inc. (hereafter referred to as the “Fund”), including the portfolio of investments, as of October 31, 2009, and the related statement of operations for the year then ended, the statement of changes in net assets for each of the years in the two-year period then ended and the financial highlights for each of the years in the five-year period then ended. These financial statements and financial highlights are the responsibility of the Fund’s management. Our responsibility is to express an opinion on these financial statements and financial highlights based on our audits.
We conducted our audits in accordance with the standards of the Public Company Accounting Oversight Board (United States). Those standards require that we plan and perform the audit to obtain reasonable assurance about whether the financial statements and financial highlights are free of material misstatement. An audit includes examining, on a test basis, evidence supporting the amounts and disclosures in the financial statements. Our procedures included confirmation of securities owned as of October 31, 2009, by correspondence with the custodian, transfer agent and brokers or by other appropriate auditing procedures where replies from brokers were not received. An audit also includes assessing the accounting principles used and significant estimates made by management, as well as evaluating the overall financial statement presentation. We believe that our audits provide a reasonable basis for our opinion.
In our opinion, the financial statements and financial highlights referred to above present fairly, in all material respects, the financial position of the Fund as of October 31, 2009, and the results of its operations for the year then ended, the changes in its net assets for each of the years in the two-year period then ended and the financial highlights for each of the years in the five-year period then ended, in conformity with U.S. generally accepted accounting principles.

New York, New York
December 23, 2009
| | |
| Jennison Equity Income Fund | | 47 |
Tax Information
(Unaudited)
We are required by the Internal Revenue Code of 1986, as amended (“the Code”), to advise you within 60 days of the Fund’s fiscal year end (October 31, 2009), as to the federal income tax status of dividends paid by the Fund during such fiscal year. For the fiscal year ended October 31, 2009, the Fund paid ordinary income dividends of $0.11, $0.10, $0.10, $0.11, $0.10, $0.10 and $0.11 per share for Class A, B, C, L, M, X and Class Z shares, respectively.
For the fiscal year ended October 31, 2009, the Fund designates the maximum amount allowable, but not less than 89.92% of the ordinary income dividends paid in the fiscal year as eligible for the corporate dividend received deduction in accordance with Section 854 of the Internal Revenue Code.
For the fiscal year ended October 31, 2009, the Fund designates the maximum amount allowable, but not less than 100% of ordinary income dividends paid during the fiscal year as qualified dividend income in accordance with Section 854 of the Internal Revenue Code.
In January 2010, you will be advised on IRS Form 1099DIV or substitute 1099DIV as to federal tax status of dividends and distributions received by you in calendar year 2009.
| | |
| 48 | | Visit our website at www.jennisondryden.com |
MANAGEMENT OF THE FUND
(Unaudited)
Information about Fund Directors/Trustees (referred to herein as “Board Members”) and Fund Officers is set forth below. Board Members who are not deemed to be “interested persons,” as defined in the 1940 Act, are referred to as “Independent Board Members.” Board Members who are deemed to be “interested persons” are referred to as “Interested Board Members.” The Board Members are responsible for the overall supervision of the operations of the Fund and perform the various duties imposed on the directors or trustees of investment companies by the 1940 Act.
| | | | |
| Independent Board Members (1) | | |
| Name, Address, Age | | Principal Occupation(s) During Past Five | | Other Directorships Held |
| Position(s) | | Years | | |
| Portfolios Overseen | | | | |
Kevin J. Bannon (57) Board Member Portfolios Overseen: 57 | | Managing Director (since April 2008) of Highmount Capital LLC (registered investment adviser); formerly Executive Vice President and Chief Investment Officer (April 1993-August 2007) of Bank of New York Company; President (May 2003-May 2007) of BNY Hamilton Family of Mutual Funds. | | Director of Urstadt Biddle Properties (since September 2008). |
Linda W. Bynoe (57) Board Member Portfolios Overseen: 57 | | President and Chief Executive Officer (since March 1995) of Telemat Ltd. (management consulting); formerly Vice President at Morgan Stanley & Co (broker-dealer). | | Director of Simon Property Group, Inc. (real estate investment trust) (since May 2003); Anixter International (communication products distributor) (since January 2006); Director of Northern Trust Corporation (banking) (since April 2006). |
David E.A. Carson (75) Board Member Portfolios Overseen: 57 | | Director (since May 2008) of Liberty Bank; Director (since October 2007) of ICI Mutual Insurance Company; formerly President, Chairman and Chief Executive Officer of People’s Bank (1987 – 2000). | | None. |
Michael S. Hyland, CFA (64) Board Member Portfolios Overseen: 57 | | Independent Consultant (since February 2005); formerly Senior Managing Director (July 2001-February 2005) of Bear Stearns & Co, Inc.; Global Partner, INVESCO (1999-2001); Managing Director and President Salomon Brothers Asset Management (1989-1999). | | None. |
Robert E. La Blanc (75) Board Member Portfolios Overseen: 57 | | President (since 1981) of Robert E. La Blanc Associates, Inc. (telecommunications). | | Director of CA, Inc. (since 2002) (software company); FiberNet Telecom Group, Inc. (since 2003) (telecom company). |
Jennison Equity Income Fund
| | | | |
Douglas H. McCorkindale (70) Board Member Portfolios Overseen: 57 | | Formerly Chairman (February 2001-June 2006), Chief Executive Officer (June 2000-July 2005), President (September 1997-July 2005) and Vice Chairman (March 1984-May 2000) of Gannett Co. Inc. (publishing and media). | | Director of Continental Airlines, Inc. (since May 1993); Director of Lockheed Martin Corp. (aerospace and defense) (since May 2001). |
Stephen P. Munn (67) Board Member Portfolios Overseen: 57 | | Lead Director (since 2007) and formerly Chairman (1993-2007) of Carlisle Companies Incorporated (manufacturer of industrial products). | | None. |
Richard A. Redeker (66) Board Member Portfolios Overseen: 57 | | Retired Mutual Fund Executive (36 years); Management Consultant; Director of Penn Tank Lines, Inc. (since 1999). | | None. |
Robin B. Smith (70) Board Member & Independent Chair Portfolios Overseen: 57 | | Chairman of the Board (since January 2003) of Publishers Clearing House (direct marketing); formerly Chairman and Chief Executive Officer (August 1996-January 2003) of Publishers Clearing House. | | Formerly Director of BellSouth Corporation (telecommunications) (1992-2006). |
Stephen G. Stoneburn (66) Board Member Portfolios Overseen: 57 | | President and Chief Executive Officer (since June 1996) of Quadrant Media Corp. (publishing company); formerly President (June 1995-June 1996) of Argus Integrated Media, Inc.; Senior Vice President and Managing Director (January 1993-1995) of Cowles Business Media; Senior Vice President of Fairchild Publications, Inc (1975-1989). | | None. |
| | | | |
| Interested Board Member (1) | | | | |
Judy A. Rice (61) Board Member & President Portfolios Overseen: 57 | | President, Chief Executive Officer, Chief Operating Officer and Officer-In-Charge (since February 2003) of Prudential Investments LLC; President, Chief Executive Officer and Officer-In-Charge (since April 2003) of Prudential Mutual Fund Services LLC; Executive Vice President (since December 2008) of Prudential Investment Management Services LLC; formerly Vice President (February 1999-April 2006) of Prudential Investment Management Services LLC; formerly President, Chief Executive Officer, Chief Operating Officer and Officer-In-Charge (May 2003-June 2005) and Director (May 2003-March 2006) and Executive Vice President (June 2005- March 2006) of AST Investment Services, Inc.; Member of Board of Governors of the Investment Company Institute. | | None. |
| 1 | The year in which each individual joined the Fund’s Board is as follows: Linda W. Bynoe, 2005; David E.A. Carson, 1993; Robert E. La Blanc, 2003; Douglas H. McCorkindale, 2003, Richard A. Redeker, 2003; Robin B. Smith, 2003; Stephen G. Stoneburn, 2003; Kevin J. Bannon, 2008; Michael S. Hyland, 2008; Stephen P. Munn, 2008; Judy A. Rice, Board Member and President since 2003. |
Visit our website at www.jennisondryden.com
| | |
| Fund Officers (a)(1) | | |
| Name, Address and Age | | Principal Occupation(s) During Past Five Years |
| Position with Fund | | |
Scott E. Benjamin (36) Vice President | | Executive Vice President (since June 2009) of Prudential Investments LLC and Prudential Investment Management Services LLC; Senior Vice President Product Development and Marketing, Prudential Investments (since February 2006); Vice President Product Development and Product Management, Prudential Investments (2003-2006). |
Kathryn L. Quirk (57) Chief Legal Officer | | Vice President and Corporate Counsel (since September 2004) of Prudential; Executive Vice President, Chief Legal Officer and Secretary (since July 2005) of PI and Prudential Mutual Fund Services LLC; Vice President and Corporate Counsel (since June 2005) and Secretary (since February 2006) of AST Investment Services, Inc.; formerly Senior Vice President and Assistant Secretary (November 2004-August 2005) of PI; formerly Assistant Secretary (June 2005-February 2006) of AST Investment Services, Inc.; formerly Managing Director, General Counsel, Chief Compliance Officer, Chief Risk Officer and Corporate Secretary (1997-2002) of Zurich Scudder Investments, Inc. |
Deborah A. Docs (51) Secretary | | Vice President and Corporate Counsel (since January 2001) of Prudential; Vice President (since December 1996) and Assistant Secretary (since March 1999) of PI; formerly Vice President and Assistant Secretary (May 2003-June 2005) of AST Investment Services, Inc. |
Jonathan D. Shain (51) Assistant Secretary | | Vice President and Corporate Counsel (since August 1998) of Prudential; Vice President and Assistant Secretary (since May 2001) of PI; Vice President and Assistant Secretary (since February 2001) of PMFS; formerly Vice President and Assistant Secretary (May 2003-June 2005) of AST Investment Services, Inc. |
Claudia DiGiacomo (35) Assistant Secretary | | Vice President and Corporate Counsel (since January 2005) of Prudential; Vice President and Assistant Secretary of PI (since December 2005); Associate at Sidley Austin Brown & Wood LLP (1999-2004). |
John P. Schwartz (38) Assistant Secretary | | Vice President and Corporate Counsel (since April 2005) of Prudential; Vice President and Assistant Secretary of PI (since December 2005); Associate at Sidley Austin Brown & Wood LLP (1997-2005). |
Andrew R. French (47) Assistant Secretary | | Director and Corporate Counsel (since May 2006) of Prudential; Vice President and Assistant Secretary (since January 2007) of PI; Vice President and Assistant Secretary (since January 2007) of PMFS; formerly Senior Legal Analyst of Prudential Mutual Fund Law Department (1997-2006). |
Timothy J. Knierim (50) Chief Compliance Officer | | Chief Compliance Officer of Prudential Investment Management, Inc. (since July 2007); formerly Chief Risk Officer of PIM and PI (2002-2007) and formerly Chief Ethics Officer of PIM and PI (2006-2007). |
Valerie M. Simpson (51) Deputy Chief Compliance Officer | | Chief Compliance Officer (since April 2007) of PI and AST Investment Services, Inc.; formerly Vice President-Financial Reporting (June 1999-March 2006) for Prudential Life and Annuities Finance. |
Jennison Equity Income Fund
| | |
Theresa C. Thompson (47) Deputy Chief Compliance Officer | | Vice President, Compliance, PI (since April 2004); and Director, Compliance, PI (2001-2004). |
Noreen M. Fierro (45) Anti-Money Laundering Compliance Officer | | Vice President, Corporate Compliance (since May 2006) of Prudential; formerly Corporate Vice President, Associate General Counsel (April 2002-May 2005) of UBS Financial Services, Inc., in their Money Laundering Prevention Group; Senior Manager (May 2005-May 2006) of Deloitte Financial Advisory Services, LLP, in their Forensic and Dispute Services, Anti-Money Laundering Group. |
Grace C. Torres (50) Treasurer and Principal Financial and Accounting Officer | | Assistant Treasurer (since March 1999) and Senior Vice President (since September 1999) of PI; Assistant Treasurer (since May 2003) and Vice President (since June 2005) of AST Investment Services, Inc.; Senior Vice President and Assistant Treasurer (since May 2003) of Prudential Annuities Advisory Services, Inc.; formerly Senior Vice President (May 2003-June 2005) of AST Investment Services, Inc. |
M. Sadiq Peshimam (45) Assistant Treasurer | | Vice President (since 2005) and Director (2000-2005) within Prudential Mutual Fund Administration. |
Peter Parrella (51) Assistant Treasurer | | Vice President (since 2007) and Director (2004-2007) within Prudential Mutual Fund Administration; formerly Tax Manager at SSB Citi Fund Management LLC (1997-2004). |
| (a) | Excludes the interested Board Member who also serve as President. |
| 1 | The year in which each individual became an Officer of the Fund is as follows: |
Scott E. Benjamin, 2009; Kathryn L. Quirk, 2005; Deborah A. Docs, 2003; Jonathan D. Shain, 2003; Claudia DiGiacomo, 2005; John P. Schwartz, 2006; Andrew R. French, 2006; Timothy J. Knierim, 2007; Valerie M. Simpson, 2007; Theresa C. Thompson, 2008; Noreen M. Fierro, 2006; Grace C. Torres, 2003; Peter Parrella, 2007; M. Sadiq Peshimam, 2006.
Explanatory Notes
| • | | Board Members are deemed to be “Interested,” as defined in the 1940 Act, by reason of their affiliation with Prudential Investments LLC and/or an affiliate of Prudential Investments LLC. |
| • | | Unless otherwise noted, the address of all Board Members and Officers is c/o Prudential Investments LLC, Gateway Center Three, 100 Mulberry Street, Newark, New Jersey 07102. |
| • | | There is no set term of office for Board Members or Officers. The Board Members have adopted a retirement policy, which calls for the retirement of Board Members on December 31st of the year in which they reach the age of 75. |
| • | | “Other Directorships Held” includes only directorships of companies required to register or file reports with the SEC under the Securities Exchange Act of 1934 (that is, “public companies”) or other investment companies registered under the 1940 Act. |
| • | | “Portfolios Overseen” includes all investment companies managed by Prudential Investments LLC. The investment companies for which PI serves as manager include the JennisonDryden Funds, Strategic Partners Funds, The Prudential Variable Contract Accounts, The Target Portfolio Trust, The Prudential Series Fund, Prudential’s Gibraltar Fund, Inc. and the Advanced Series Trust. |
Visit our website at www.jennisondryden.com
Approval of Advisory Agreements
The Fund’s Board of Directors
The Board of Directors (the “Board”) of Jennison Equity Income Fund (the “Fund”)1 consists of 11 individuals, 10 of whom are not “interested persons” of the Fund, as defined in the Investment Company Act of 1940, as amended (the “1940 Act”) (the “Independent Directors”). The Board is responsible for the oversight of the Fund and its operations, and performs the various duties imposed on the directors of investment companies by the 1940 Act. The Independent Directors have retained independent legal counsel to assist them in connection with their duties. The Chair of the Board is an Independent Director. The Board has established three standing committees: the Audit Committee, the Nominating and Governance Committee, and the JennisonDryden Investment Committee. Each committee is chaired by, and composed of, Independent Directors.
Annual Approval of the Fund’s Advisory Agreements
As required under the 1940 Act, the Board determines annually whether to renew the Fund’s management agreement with Prudential Investments LLC (“PI”) and the Fund’s subadvisory agreement with Jennison Associates LLC (“Jennison”). In considering the renewal of the agreements, the Board, including all of the Independent Directors, met on June 2-4, 2009 and approved the renewal of the agreements through July 31, 2010, after concluding that renewal of the agreements was in the best interests of the Fund and its shareholders.
In advance of the meetings, the Board requested and received materials relating to the agreements, and had the opportunity to ask questions and request further information in connection with its consideration. Among other things, the Board considered comparisons with other mutual funds in relevant Peer Universes and Peer Groups. The mutual funds included in each Peer Universe or Peer Group were objectively determined by Lipper Inc., an independent provider of mutual fund data. The comparisons placed the Fund in various quartiles over the one- and three-year periods ending December 31, 2008, with the first quartile being the best 25% of the mutual funds (for performance, the best performing mutual funds and, for expenses, the lowest cost mutual funds).
In approving the agreements, the Board, including the Independent Directors advised by independent legal counsel, considered the factors it deemed relevant, including the nature, quality and extent of services provided by PI and the subadviser, the
| 1 | Jennison Equity Income Fund is a series of Strategic Partners Mutual Funds, Inc. |
| | |
| Jennison Equity Income Fund | | |
Approval of Advisory Agreements (continued)
performance of the Fund, the profitability of PI and its affiliates, expenses and fees, and the potential for economies of scale that may be shared with the Fund and its shareholders. In their deliberations, the Directors did not identify any single factor which alone was responsible for the Board’s decision to approve the agreements with respect to the Fund. In connection with its deliberations, the Board considered information provided by PI throughout the year at regular Board meetings, presentations from portfolio managers and other information, as well as information furnished at or in advance of the meetings on June 2-4, 2009.
The Directors determined that the overall arrangements between the Fund and PI, which serves as the Fund’s investment manager pursuant to a management agreement, and between PI and Jennison, which serves as the Fund’s subadviser pursuant to the terms of a subadvisory agreement with PI, are fair and reasonable in light of the services performed, fees charged and such other matters as the Directors considered relevant in the exercise of their business judgment.
The material factors and conclusions that formed the basis for the Directors’ reaching their determinations to approve the continuance of the agreements are separately discussed below.
Nature, Quality, and Extent of Services
The Board received and considered information regarding the nature, quality and extent of services provided to the Fund by PI and Jennison. The Board considered the services provided by PI, including but not limited to the oversight of the subadviser for the Fund, as well as the provision of fund recordkeeping, compliance, and other services to the Fund. With respect to PI’s oversight of the subadviser, the Board noted that PI’s Strategic Investment Research Group (“SIRG”), which is a business unit of PI, is responsible for monitoring and reporting to PI’s senior management on the performance and operations of the subadviser. The Board also considered that PI pays the salaries of all of the officers and non-independent Directors of the Fund. The Board also considered the investment subadvisory services provided by Jennison, as well as adherence to the Fund’s investment restrictions and compliance with applicable Fund policies and procedures. The Board considered PI’s evaluation of the subadviser, as well as PI’s recommendation, based on its review of the subadviser, to renew the subadvisory agreement.
The Board reviewed the qualifications, backgrounds and responsibilities of PI’s senior management responsible for the oversight of the Fund and Jennison, and also reviewed the qualifications, backgrounds and responsibilities of the Jennison portfolio managers who are responsible for the day-to-day management of the Fund’s portfolio. The Board was provided with information pertaining to PI’s and Jennison’s organizational
| | |
| | Visit our website at www.jennisondryden.com |
structure, senior management, investment operations, and other relevant information pertaining to PI and Jennison. The Board also noted that it received favorable compliance reports from the Fund’s Chief Compliance Officer (“CCO”) as to each of PI and Jennison. The Board noted that Jennison is affiliated with PI.
The Board concluded that it was satisfied with the nature, extent and quality of the investment management services provided by PI and the subadvisory services provided to the Fund by Jennison, and that there was a reasonable basis on which to conclude that the Fund benefits from the services provided by PI and Jennison under the management and subadvisory agreements.
Performance of the Fund
The Board received and considered information about the Fund’s historical performance. The Board considered that the Fund’s gross performance in relation to its Peer Universe (the Lipper Equity Income Funds Performance Universe) was in the third quartile over the one-year period, and in the second quartile over the three-year period The Board noted that the Fund outperformed or performed competitively against its benchmark index for all periods. The Board also noted that the Fund outperformed its benchmark index and Peer Universe median with a first quartile ranking during the first quarter of 2009, and that the Fund’s recent outperformance positively affected the Fund’s longer-term performance record. The Board concluded that, in light of the Fund’s competitive performance, it would be in the interest of the Fund and its shareholders to renew the agreements.
Fees and Expenses
The Board considered that the Fund’s actual management fee (which reflects any subsidies, expense caps or waivers) and total expenses ranked in the Expense Group’s fourth quartile. The Board noted PI’s explanation that the Fund’s actual management fee was 1.9 basis points higher than the median actual management fee for all funds included in the Expense Group, and also noted PI’s explanation that the Fund’s total expenses were 13 basis points higher than the median total expenses for all funds included in the Expense Group. The Board also considered that the Fund’s fourth quartile ranking for total expenses was reflective, in part, of its relatively small asset size. The Board considered that PI has agreed to reimburse expenses and/or waive fees so that the Fund’s annual operating expenses do not exceed 1.15% (exclusive of 12b-1 fees and certain other fees) of the Fund’s average daily net assets; the Board agreed that PI should not discontinue the existing cap on Fund expenses. The Board concluded that the management fees and total expenses were reasonable in light of the services provided.
| | |
| Jennison Equity Income Fund | | |
Approval of Advisory Agreements (continued)
Costs of Services and Profits Realized by PI
The Board was provided with information on the profitability of PI and its affiliates in serving as the Fund’s investment manager. The Board discussed with PI the methodology utilized in assembling the information regarding profitability and considered its reasonableness. The Board recognized that it is difficult to make comparisons of profitability from fund management contracts because comparative information is not generally publicly available and is affected by numerous factors, including the structure of the particular adviser, the types of funds it manages, its business mix, numerous assumptions regarding allocations and the adviser’s capital structure and cost of capital. The Board did not separately consider the profitability of the subadviser, an affiliate of PI, as its profitability was reflected in the profitability report for PI. Taking these factors into account, the Board concluded that the profitability of PI and its affiliates in relation to the services rendered was not unreasonable.
Economies of Scale
The Board received and discussed information concerning whether PI realizes economies of scale as the Fund’s assets grow beyond current levels. The Board noted that the management fee schedule for the Fund includes breakpoints, which have the effect of decreasing the fee rate as assets increase, and that at its current level of assets the Fund’s effective fee rate reflected some of those rate reductions. The Board took note that the Fund’s fee structure currently results in benefits to Fund shareholders whether or not PI realizes any economies of scale.
Other Benefits to PI and Jennison
The Board considered potential ancillary benefits that might be received by PI and Jennison and their affiliates as a result of their relationship with the Fund. The Board concluded that potential benefits to be derived by PI included brokerage commissions received by affiliates of PI, transfer agency fees received by the Fund’s transfer agent (which is affiliated with PI), and benefits to the reputation as well as other intangible benefits resulting from PI’s association with the Fund. The Board concluded that the potential benefits to be derived by Jennison included its ability to use soft dollar credits, brokerage commissions received by affiliates of Jennison, as well as the potential benefits consistent with those generally resulting from an increase in assets under management, specifically, potential access to additional research resources and benefits to the reputation. The Board concluded that the benefits derived by PI and Jennison were consistent with the types of benefits generally derived by investment managers and subadvisers to mutual funds.
After full consideration of these factors, the Board concluded that the approval of the agreements was in the interest of the Fund and its shareholders.
| | |
| | Visit our website at www.jennisondryden.com |
Growth of a $10,000 Investment
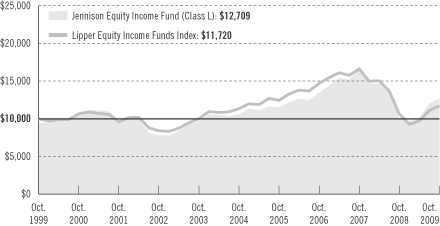
| | | | | | | | | | | |
| Average Annual Total Returns (With Sales Charges) as of 10/31/09 |
| | | One Year | | | Five Years | | | Ten Years | | | Since Inception |
Class A | | 21.05 | % | | 2.86 | % | | N/A | | | 2.16% (4/12/04) |
Class B | | 22.15 | | | 3.08 | | | N/A | | | 2.26 (4/12/04) |
Class C | | 26.22 | | | 3.23 | | | 2.54 | % | | — |
Class L | | 20.39 | | | 2.49 | | | 2.43 | | | — |
Class M | | 21.03 | | | 2.91 | | | 2.53 | | | — |
Class X | | 21.09 | | | 2.82 | | | 2.56 | | | — |
Class Z | | 28.27 | | | N/A | | | N/A | | | –6.13 (8/25/08) |
| | | | | | | | | | | |
| Average Annual Total Returns (Without Sales Charges) as of 10/31/09 |
| | | One Year | | | Five Years | | | Ten Years | | | Since Inception |
Class A | | 28.09 | % | | 4.03 | % | | N/A | | | 3.21% (4/12/04) |
Class B | | 27.15 | | | 3.22 | | | N/A | | | 2.39 (4/12/04) |
Class C | | 27.22 | | | 3.23 | | | 2.54 | % | | — |
Class L | | 27.73 | | | 3.71 | | | 3.03 | | | — |
Class M | | 27.03 | | | 3.20 | | | 2.53 | | | — |
Class X | | 27.09 | | | 3.25 | | | 2.56 | | | — |
Class Z | | 28.27 | | | N/A | | | N/A | | | –6.13 (8/25/08) |
Performance data quoted represent past performance. Past performance does not guarantee future results. The investment return and principal value of an investment will fluctuate so that an investor’s shares, when redeemed, may be worth more or
| | |
| | Visit our website at www.jennisondryden.com |
less than their original cost. Current performance may be lower or higher than the past performance data quoted. An investor may obtain performance data as of the most recent month-end by visiting our website at www.jennisondryden.com or by calling (800) 225-1852. Class A and Class L shares have a maximum initial sales charge of 5.50% and 5.75%, respectively. Class L shares are closed to most new purchases (with the exception of reinvested dividends and purchases by certain college savings plans). Gross operating expenses: Class A, 1.71%; Class B, 2.41%; Class C, 2.41%; Class L, 1.91%; Class M, 2.41%; Class X, 2.41%; Class Z, 1.41%. Net operating expenses apply to: Class A, 1.40%; Class B, 2.15%; Class C, 2.15%; Class L, 1.65%; Class M, 2.15%; Class X, 2.15%; Class Z, 1.15%, after contractual reduction through 2/28/2011.
Source: Prudential Investments LLC and Lipper Inc.
Inception returns are provided for any share class with less than 10 years of returns.
The graph compares a $10,000 investment in the Jennison Equity Income Fund (Class L shares) with a similar investment in the Lipper Equity Income Funds Index by portraying the initial account values at the beginning of the 10-year period for Class L shares (October 31, 1999) and the account values at the end of the current fiscal year (October 31, 2009) as measured on a quarterly basis. The data are measured from the closest month-end to inception date, and not from the Fund’s actual inception date. For purposes of the graph, and unless otherwise indicated, it has been assumed that (a) the maximum applicable front-end sales charge was deducted from the initial $10,000 investment in Class L shares; (b) all recurring fees (including management fees) were deducted; and (c) all dividends and distributions were reinvested. The line graph provides information for Class L shares only. As indicated in the tables above, performance for Class A, B, C, M, X, and Z shares will vary due to the differing charges and expenses applicable to each share class (as indicated in the following paragraphs).
Funds in the Lipper Equity Income Funds Index seek relatively high current income and growth of income through investing at least 65% of their portfolio in dividend-paying equity securities. These funds’ gross or net yield must be at least 125% of the average gross or net yield of the U.S. diversified equity fund universe. The Index’s total returns include the reinvestment of all dividends, but do not include the effects of sales charges, operating expenses of a mutual fund, or taxes. The returns for the Index would be lower if they included the effects of sales charges, operating expenses, or taxes. The securities that comprise the Index may differ substantially from the securities in the Fund. This is not the only index that may be used to characterize performance of sector stock funds. Other indexes may portray different comparative performance. Investors cannot invest directly in an index.
Class A and Class L shares are subject to a maximum front-end sales charge of 5.50% and 5.75%, respectively. Class L shares are closed to most new purchases (with the exception of reinvested dividends and purchases by certain college savings plans). Under certain circumstances, Class A and Class L shares may be subject to a contingent deferred sales charge (CDSC) of 1%, in certain circumstances. Class B, Class C, Class M, and Class X shares are subject to a maximum CDSC of 5%, 1%, 6%, and 6%, respectively. Class Z shares are not subject to a sales charge. Class A shares are subject to a 12b-1 fee of up to 0.30% annually. Class B, Class C, Class M, and Class X shares are subject to a 12b-1 fee of 1%. Class L shares are subject to a 12b-1 fee of 0.50%. Class Z shares are not subject to a 12b-1 fee. The returns in the graph and the tables do not reflect the deduction of taxes that a shareholder would pay on Fund distributions or following the redemption of Fund shares.
| | |
| Jennison Equity Income Fund | | |
| | | | |
| n MAIL | | n TELEPHONE | | n WEBSITE |
Gateway Center Three 100 Mulberry Street Newark, NJ 07102 | | (800) 225-1852 | | www.jennisondryden.com |
|
| PROXY VOTING |
| The Board of Directors of the Fund has delegated to the Fund’s investment subadviser the responsibility for voting any proxies and maintaining proxy recordkeeping with respect to the Fund. A description of these proxy voting policies and procedures is available without charge, upon request, by calling (800) 225-1852 or by visiting the Securities and Exchange Commission’s website at www.sec.gov. Information regarding how the Fund voted proxies relating to portfolio securities during the most recent 12-month period ended June 30 is available on the Fund’s website and on the Commission’s website. |
|
| DIRECTORS |
Kevin J. Bannon • Linda W. Bynoe • David E.A. Carson • Michael S. Hyland •
Robert E. La Blanc • Douglas H. McCorkindale • Stephen P. Munn • Richard A. Redeker • Judy A. Rice • Robin B. Smith • Stephen G. Stoneburn |
|
| OFFICERS |
| Judy A. Rice, President • Scott E. Benjamin, Vice President • Grace C. Torres, Treasurer and Principal Financial and Accounting Officer • Kathryn L. Quirk, Chief Legal Officer • Deborah A. Docs, Secretary • Timothy J. Knierim, Chief Compliance Officer • Valerie M. Simpson, Deputy Chief Compliance Officer • Theresa C. Thompson, Deputy Chief Compliance Officer • Noreen M. Fierro, Anti-Money Laundering Compliance Officer • Jonathan D. Shain, Assistant Secretary • Claudia DiGiacomo, Assistant Secretary • John P. Schwartz, Assistant Secretary • Andrew R. French, Assistant Secretary • M. Sadiq Peshimam, Assistant Treasurer • Peter Parrella, Assistant Treasurer |
| | | | |
| MANAGER | | Prudential Investments LLC | | Gateway Center Three
100 Mulberry Street
Newark, NJ 07102 |
|
| INVESTMENT SUBADVISER | | Jennison Associates LLC | | 466 Lexington Avenue
New York, NY 10017 |
|
| DISTRIBUTORS | | Prudential Annuities
Distributors, Inc. | | One Corporate Drive
Shelton, CT 06484 |
|
| | Prudential Investment
Management Services LLC | | Gateway Center Three
100 Mulberry Street
Newark, NJ 07102 |
|
| CUSTODIAN | | PFPC Trust Company | | 400 Bellevue Parkway
Wilmington, DE 19809 |
|
| TRANSFER AGENT | | Prudential Mutual Fund
Services LLC | | PO Box 9658
Providence, RI 02940 |
|
| INDEPENDENT REGISTERED PUBLIC ACCOUNTING FIRM | | KPMG LLP | | 345 Park Avenue
New York, NY 10154 |
|
| FUND COUNSEL | | Willkie Farr & Gallagher LLP | | 787 Seventh Avenue
New York, NY 10019 |
|
| An investor should consider the investment objectives, risks, charges, and expenses of the Fund carefully before investing. The prospectus for the Fund contains this and other information about the Fund. An investor may obtain a prospectus by visiting our website at www.jennisondryden.com or by calling (800) 225-1852. The prospectus should be read carefully before investing. |
|
| E-DELIVERY |
| To receive your mutual fund documents online, go to www.prudential.com/edelivery/mutualfunds and enroll. Instead of receiving printed documents by mail, you will receive notification via email when new materials are available. You can cancel your enrollment or change your email address at any time by visiting the website address above. |
|
| SHAREHOLDER COMMUNICATIONS WITH DIRECTORS |
| Shareholders can communicate directly with the Board of Directors by writing to the Chair of the Board, Jennison Equity Income Fund, Prudential Investments, Attn: Board of Directors, 100 Mulberry Street, Gateway Center Three, Newark, NJ 07102. Shareholders can communicate directly with an individual Director by writing to the same address. Communications are not screened before being delivered to the addressee. |
|
| AVAILABILITY OF PORTFOLIO SCHEDULE |
| The Fund files its complete schedule of portfolio holdings with the Securities and Exchange Commission for the first and third quarters of each fiscal year on Form N-Q. The Fund’s Forms N-Q are available on the Commission’s website at www.sec.gov. The Fund’s Forms N-Q may also be reviewed and copied at the Commission’s Public Reference Room in Washington, D.C. Information on the operation and location of the Public Reference Room may be obtained by calling (202) 551-8090. The Fund’s schedule of portfolio holdings is also available on the Fund’s website as of the end of each month. |
|
| The Fund’s Statement of Additional Information contains additional information about the Fund’s Directors and is available without charge, upon request, by calling (800) 225-1852. |
Mutual Funds:
| | | | |
ARE NOT INSURED BY THE FDIC OR ANY
FEDERAL GOVERNMENT AGENCY | | MAY LOSE VALUE | | ARE NOT A DEPOSIT OF OR GUARANTEED BY ANY BANK OR ANY BANK AFFILIATE |

| | | | | | | | | | | | | | | | | | |
| | | Jennison Equity Income Fund | | | | | | | | | | | | |
| | | Share Class | | A | | B | | C | | L* | | M** | | X*** | | Z | | |
| | NASDAQ | | SPQAX | | JEIBX | | AGOCX | | AGOAX | | AGOBX | | AXGOX | | JDEZX | | |
| | CUSIP | | 86277C108 | | 86277C306 | | 86277C504 | | 86277C207 | | 86277C405 | | 86277C603 | | 86277E427 | | |
| | | | | | | | | | | | | | | | | | |
*Closed to most new purchases (with the exception of reinvested dividends and purchases by college savings plans) and available for limited exchanges only.
**Closed to most new purchases (with the exception of reinvested dividends) and available for limited exchanges only.
***Available for limited exchanges only.
MF203E 0168448-00001-00

Item 2 – Code of Ethics – See Exhibit (a)
As of the end of the period covered by this report, the registrant has adopted a code of ethics (the “Section 406 Standards for Investment Companies – Ethical Standards for Principal Executive and Financial Officers”) that applies to the registrant’s Principal Executive Officer and Principal Financial Officer; the registrant’s Principal Financial Officer also serves as the Principal Accounting Officer.
The registrant hereby undertakes to provide any person, without charge, upon request, a copy of the code of ethics. To request a copy of the code of ethics, contact the registrant 800-225-1852, and ask for a copy of the Section 406 Standards for Investment Companies – Ethical Standards for Principal Executive and Financial Officers.
Item 3 – Audit Committee Financial Expert –
The registrant’s Board has determined that Mr. David E. A. Carson, member of the Board’s Audit Committee is an “audit committee financial expert,” and that he is “independent,” for purposes of this Item.
Item 4 – Principal Accountant Fees and Services –
(a) Audit Fees
For the fiscal years ended October 31, 2009 and October 31, 2008, KPMG LLP (“KPMG”), the Registrant’s principal accountant, billed the Registrant $44,365 and $63,609, respectively, for professional services rendered for the audit of the Registrant’s annual financial statements or services that are normally provided in connection with statutory and regulatory filings.
(b) Audit-Related Fees
None.
(c) Tax Fees
None.
(d) All Other Fees
None.
(e) (1) Audit Committee Pre-Approval Policies and Procedures
THE PRUDENTIAL MUTUAL FUNDS
AUDIT COMMITTEE POLICY
on
Pre-Approval of Services Provided by the Independent Accountants
The Audit Committee of each Prudential Mutual Fund is charged with the responsibility to monitor the independence of the Fund’s independent accountants. As part of this responsibility, the Audit Committee must pre-approve any independent accounting firm’s engagement to render audit and/or permissible non-audit services, as required by law. In evaluating a proposed engagement of the independent accountants, the Audit Committee will assess the effect that the engagement might reasonably be expected to have on the accountant’s independence. The Committee’s evaluation will be based on:
| | • | | a review of the nature of the professional services expected to be provided, |
| | • | | a review of the safeguards put into place by the accounting firm to safeguard independence, and |
| | • | | periodic meetings with the accounting firm. |
Policy for Audit and Non-Audit Services Provided to the Funds
On an annual basis, the scope of audits for each Fund, audit fees and expenses, and audit-related and non-audit services (and fees proposed in respect thereof) proposed to be performed by the Fund’s independent accountants will be presented by the Treasurer and the independent accountants to the Audit Committee for review and, as appropriate, approval prior to the initiation of such services. Such presentation shall be accompanied by confirmation by both the Treasurer and the independent accountants that the proposed services will not adversely affect the independence of the independent accountants. Proposed services shall be described in sufficient detail to enable the Audit Committee to assess the appropriateness of such services and fees, and the compatibility of the provision of such services with the auditor’s independence. The Committee shall receive periodic reports on the progress of the audit and other services which are approved by the Committee or by the Committee Chair pursuant to authority delegated in this Policy.
The categories of services enumerated under “Audit Services”, “Audit-related Services”, and “Tax Services” are intended to provide guidance to the Treasurer and the independent accountants as to those categories of services which the Committee believes are generally consistent with the independence of the independent accountants and which the Committee (or the Committee Chair) would expect upon the presentation of specific proposals to pre-approve. The enumerated categories are not intended as an exclusive list of audit, audit-related or tax services, which the Committee (or the Committee Chair) would consider for pre-approval.
Audit Services
The following categories of audit services are considered to be consistent with the role of the Fund’s independent accountants:
| | • | | Annual Fund financial statement audits |
| | • | | Seed audits (related to new product filings, as required) |
| | • | | SEC and regulatory filings and consents |
Audit-related Services
The following categories of audit-related services are considered to be consistent with the role of the Fund’s independent accountants:
| | • | | Accounting consultations |
| | • | | Fund merger support services |
| | • | | Agreed Upon Procedure Reports |
| | • | | Other Internal Control Reports |
Individual audit-related services that fall within one of these categories and are not presented to the Audit Committee as part of the annual pre-approval process will be subject to pre-approval by the Committee Chair (or any other Committee member on whom this responsibility has been delegated) so long as the estimated fee for those services does not exceed $50,000.
Tax Services
The following categories of tax services are considered to be consistent with the role of the Fund’s independent accountants:
| | • | | Tax compliance services related to the filing or amendment of the following: |
| | • | | Federal, state and local income tax compliance; and, |
| | • | | Sales and use tax compliance |
| | • | | Timely RIC qualification reviews |
| | • | | Tax distribution analysis and planning |
| | • | | Tax authority examination services |
| | • | | Tax appeals support services |
| | • | | Accounting methods studies |
| | • | | Fund merger support services |
| | • | | Tax consulting services and related projects |
Individual tax services that fall within one of these categories and are not presented to the Audit Committee as part of the annual pre-approval process will be subject to pre-approval by the Committee Chair (or any other Committee member on whom this responsibility has been delegated) so long as the estimated fee for those services does not exceed $50,000.
Other Non-audit Services
Certain non-audit services that the independent accountants are legally permitted to render will be subject to pre-approval by the Committee or by one or more Committee members to whom the Committee has delegated this authority and who will report to the full Committee any pre-approval decisions made pursuant to this Policy. Non-audit services presented for pre-approval pursuant to this paragraph will be accompanied by a confirmation from both the Treasurer and the independent accountants that the proposed services will not adversely affect the independence of the independent accountants.
Proscribed Services
The Fund’s independent accountants will not render services in the following categories of non-audit services:
| | • | | Bookkeeping or other services related to the accounting records or financial statements of the Fund |
| | • | | Financial information systems design and implementation |
| | • | | Appraisal or valuation services, fairness opinions, or contribution-in-kind reports |
| | • | | Internal audit outsourcing services |
| | • | | Management functions or human resources |
| | • | | Broker or dealer, investment adviser, or investment banking services |
| | • | | Legal services and expert services unrelated to the audit |
| | • | | Any other service that the Public Company Accounting Oversight Board determines, by regulation, is impermissible. |
Pre-approval of Non-Audit Services Provided to Other Entities Within the Prudential Fund Complex
Certain non-audit services provided to Prudential Investments LLC or any of its affiliates that also provide ongoing services to the Prudential Mutual Funds will be subject to pre-approval by the Audit Committee. The only non-audit services provided to these entities that will require pre-approval are those related directly to the operations and financial reporting of the Funds. Individual projects that are not presented to the Audit Committee as part of the annual pre-approval process will be subject to pre-approval by the Committee Chair (or any other Committee member on whom this responsibility has been delegated) so long as the estimated fee for those services does not exceed $50,000. Services presented for pre-approval pursuant to this paragraph will be accompanied by a confirmation from both the Treasurer and the independent accountants that the proposed services will not adversely affect the independence of the independent accountants.
Although the Audit Committee will not pre-approve all services provided to Prudential Investments LLC and its affiliates, the Committee will receive an annual report from the Fund’s independent accounting firm showing the aggregate fees for all services provided to Prudential Investments and its affiliates.
(e) (2) Percentage of services referred to in 4(b) – 4(d) that were approved by the audit committee –
Not applicable.
(f) Percentage of hours expended attributable to work performed by other than full time employees of principal accountant if greater than 50%.
The percentage of hours expended on the principal accountant’s engagement to audit the registrant’s financial statements for the most recent fiscal year that were attributed to work performed by persons other than the principal accountant’s full-time, permanent employees was 0%.
(g) Non-Audit Fees
Not applicable to Registrant for the fiscal years 2009 and 2008. The aggregate non-audit fees billed by KPMG for services rendered to the registrant’s investment adviser and any entity controlling, controlled by, or under common control with the investment adviser that provides ongoing services to the registrant for the fiscal years 2009 and 2008 was $0 and $0, respectively.
(h) Principal Accountant’s Independence
Not applicable as KPMG has not provided non-audit services to the registrant’s investment adviser and any entity controlling, controlled by, or under common control with the investment adviser that provides ongoing services to the registrant that were not pre-approved pursuant to Rule 2-01(c)(7)(ii) of Regulation S-X.
Item 5 – Audit Committee of Listed Registrants – Not applicable.
Item 6 – Schedule of Investments – The schedule is included as part of the report to shareholders filed under Item 1 of this Form.
Item 7 – Disclosure of Proxy Voting Policies and Procedures for Closed-End Management Investment Companies – Not applicable.
Item 8 – Portfolio Managers of Closed-End Management Investment Companies – Not applicable.
Item 9 – Purchases of Equity Securities by Closed-End Management Investment Company and Affiliated Purchasers – Not applicable.
Item 10 – Submission of Matters to a Vote of Security Holders – Not applicable.
Item 11 – Controls and Procedures
| | (a) | It is the conclusion of the registrant’s principal executive officer and principal financial officer that the effectiveness of the registrant’s current disclosure controls and procedures (such disclosure controls and procedures having been evaluated within 90 days of the date of this filing) provide reasonable assurance that the information required to be disclosed by the registrant has been recorded, processed, summarized and reported within the time period specified in the Commission’s rules and forms and that the information required to be disclosed by the registrant has been accumulated and communicated to the registrant’s principal executive officer and principal financial officer in order to allow timely decisions regarding required disclosure. |
| | (b) | There has been no significant change in the registrant’s internal control over financial reporting that occurred during the registrant’s most recent fiscal quarter of the period covered by this report that has materially affected, or is likely to materially affect, the registrant’s internal control over financial reporting. |
Item 12 – Exhibits
| | (a) | (1) Code of Ethics – Attached hereto as Exhibit EX-99.CODE-ETH |
| | (2) | Certifications pursuant to Section 302 of the Sarbanes-Oxley Act – Attached hereto as Exhibit EX-99.CERT. |
| | (3) | Any written solicitation to purchase securities under Rule 23c-1. – Not applicable. |
| | (b) | Certifications pursuant to Section 906 of the Sarbanes-Oxley Act – Attached hereto as Exhibit EX-99.906CERT. |
SIGNATURES
Pursuant to the requirements of the Securities Exchange Act of 1934 and the Investment Company Act of 1940, the registrant has duly caused this report to be signed on its behalf by the undersigned, thereunto duly authorized.
| | | | | | |
| (Registrant) | | Strategic Partners Mutual Funds, Inc. | | | | |
| | | | |
| By (Signature and Title)* | | /S/ DEBORAH A. DOCS | | |
| | Deborah A. Docs | | |
| | Secretary | | |
Pursuant to the requirements of the Securities Exchange Act of 1934 and the Investment Company Act of 1940, this report has been signed below by the following persons on behalf of the registrant and in the capacities and on the dates indicated.
| | | | |
| By (Signature and Title)* | | /S/ JUDY A. RICE | | |
| | Judy A. Rice | | |
| | President and Principal Executive Officer | | |
| | | | |
| By (Signature and Title)* | | /S/ GRACE C. TORRES | | |
| | Grace C. Torres Treasurer and Principal Financial Officer | | |
| * | Print the name and title of each signing officer under his or her signature. |