UNITED STATES
SECURITIES AND EXCHANGE COMMISSION
Washington, D.C. 20549
FORM N-CSR
CERTIFIED SHAREHOLDER REPORT OF REGISTERED
MANAGEMENT INVESTMENT COMPANIES
| | |
| Investment Company Act file number: | | 811-08085 |
| |
| Exact name of registrant as specified in charter: | | Prudential Investment Portfolios, Inc. 10 |
| |
| Address of principal executive offices: | | Gateway Center 3, 100 Mulberry Street, Newark, New Jersey 07102 |
| |
| Name and address of agent for service: | | Deborah A. Docs Gateway Center 3, 100 Mulberry Street, Newark, New Jersey 07102 |
| |
| Registrant’s telephone number, including area code: | | 800-225-1852 |
| |
| Date of fiscal year end: | | 10/31/2011 |
| |
| Date of reporting period: | | 10/31/2011 |
Item 1 – Reports to Stockholders

PRUDENTIAL INVESTMENTS»MUTUAL FUNDS
PRUDENTIAL JENNISON EQUITY INCOME FUND
ANNUAL REPORT · OCTOBER 31, 2011
Fund Type
Equity income
Objective
Income and capital appreciation
This report is not authorized for distribution to prospective investors unless preceded or accompanied by a current prospectus.
The views expressed in this report and information about the Fund’s portfolio holdings are for the period covered by this report and are subject to change thereafter.
Prudential Investments, Prudential, Jennison, the Prudential logo, and the Rock symbol are service marks of Prudential Financial, Inc. and its related entities, registered in many jurisdictions worldwide.

December 15, 2011
Dear Shareholder:
After leading Prudential Investments for the past eight years, I have decided to retire at the end of 2011 from my positions as President of Prudential Investments and President and Director of the Prudential Jennison Equity Income Fund (the Fund). Effective January 1, 2012, I will become Chairman of Prudential Investments and act as an advisor to the business during 2012 to help facilitate a smooth transition to my successor, Stuart Parker.
Stuart, who will become President of Prudential Investments and President and Director of the Fund on January 1, 2012, previously served as the Executive Vice President of Retail Mutual Fund Distribution at Prudential Investments. With more than 20 years of investment industry experience, Stuart brings a deep understanding of the needs and challenges facing today’s investors.
We hope you find the annual report for the Fund informative. We recognize that ongoing market volatility may make it a difficult time to be an investor. We continue to believe a prudent response to uncertainty is to maintain a diversified portfolio, including stock and bond mutual funds consistent with your tolerance for risk, time horizon, and financial goals.
Your financial professional can help you create a diversified investment plan that reflects your personal investor profile and risk tolerance. Keep in mind that diversification and asset allocation strategies do not assure a profit or protect against loss in declining markets. We encourage you to call your financial professional before making any investment decision.
Prudential Investments provides a wide range of mutual funds to choose from that can help you make progress toward your financial goals. Our funds offer the experience, resources, and professional discipline of Prudential Financial’s affiliated asset managers.
Finally, I’ve been privileged to have had the opportunity to help you address your investment needs, and I thank you for choosing the Prudential Investments family of mutual funds.
Sincerely,

Judy A. Rice, President
Prudential Jennison Equity Income Fund
| | | | |
| Prudential Jennison Equity Income Fund | | | 1 | |
Your Fund’s Performance
Performance data quoted represent past performance. Past performance does not guarantee future results. The investment return and principal value of an investment will fluctuate, so that an investor’s shares, when redeemed, may be worth more or less than their original cost. Current performance may be lower or higher than the past performance data quoted. An investor may obtain performance data as of the most recent month-end by visiting our website at www.prudentialfunds.com or by calling (800) 225-1852. Class A and Class L shares have a maximum initial sales charge of 5.50% and 5.75%, respectively. Gross operating expenses: Class A, 1.27%; Class B, 1.97%; Class C, 1.97%; Class L, 1.46%; Class M, 1.95%; Class Q, 0.89%; Class R, 1.76%; Class X, 1.95%; Class Z, 0.98%. Net operating expenses: Class A, 1.22%; Class B, 1.97%; Class C, 1.97%; Class L, 1.46%; Class M, 1.95%; Class Q, 0.89%; Class R, 1.51%; Class X, 1.95%; Class Z, 0.98%, after contractual reduction through 2/29/2013.
| | | | | | | | | | | | | | | | |
Cumulative Total Returns (Without Sales Charges) as of 10/31/11 | |
| | | One Year | | | Five Years | | | Ten Years | | | Since Inception | |
Class A | | | 4.16 | % | | | 24.09 | % | | | N/A | | | | 55.37% (4/12/04) | |
Class B | | | 3.45 | | | | 19.55 | | | | N/A | | | | 46.48 (4/12/04) | |
Class C | | | 3.37 | | | | 19.60 | | | | 60.77 | % | | | — | |
Class L | | | 3.93 | | | | 22.49 | | | | 68.86 | | | | — | |
Class M | | | 3.45 | | | | 19.47 | | | | 60.76 | | | | — | |
Class Q | | | N/A | | | | N/A | | | | N/A | | | | –1.06 (1/18/11) | |
Class R | | | N/A | | | | N/A | | | | N/A | | | | –1.50 (1/18/11) | |
Class X | | | 3.37 | | | | 19.78 | | | | 61.15 | | | | — | |
Class Z | | | 4.42 | | | | N/A | | | | N/A | | | | 21.53 (8/25/08) | |
Lipper Equity Income Funds Index | | | 7.08 | | | | –1.87 | | | | 50.57 | | | | — | |
S&P 500 Index | | | 8.07 | | | | 1.25 | | | | 43.67 | | | | — | |
Lipper Average | | | 7.13 | | | | 4.61 | | | | 63.17 | | | | — | |
| | | | | | | | | | | | | | | | |
Average Annual Total Returns (With Sales Charges) as of 9/30/11 | |
| | | One Year | | | Five Years | | | Ten Years | | | Since Inception | |
Class A | | | –6.67 | % | | | 2.03 | % | | | N/A | | | | 4.01% (4/12/04) | |
Class B | | | –6.78 | | | | 2.28 | | | | N/A | | | | 3.98 (4/12/04) | |
Class C | | | –2.99 | | | | 2.40 | | | | 4.25 | % | | | — | |
Class L | | | –7.16 | | | | 1.69 | | | | 4.15 | | | | — | |
Class M | | | –7.73 | | | | 2.13 | | | | 4.25 | | | | — | |
Class Q | | | N/A | | | | N/A | | | | N/A | | | | N/A (1/18/11) | |
Class R | | | N/A | | | | N/A | | | | N/A | | | | N/A (1/18/11) | |
Class X | | | –7.82 | | | | 2.03 | | | | 4.28 | | | | — | |
Class Z | | | –1.07 | | | | N/A | | | | N/A | | | | 3.44 (8/25/08) | |
Lipper Equity Income Funds Index | | | 0.27 | | | | –1.64 | | | | 3.24 | | | | — | |
S&P 500 Index | | | 1.13 | | | | –1.18 | | | | 2.82 | | | | — | |
Lipper Average | | | 0.54 | | | | –0.48 | | | | 3.94 | | | | — | |
| | |
| 2 | | Visit our website at www.prudentialfunds.com |
| | | | | | | | | | | | | | | | |
Average Annual Total Returns (With Sales Charges) as of 10/31/11 | |
| | | One Year | | | Five Years | | | Ten Years | | | Since Inception | |
Class A | | | –1.57 | % | | | 3.24 | % | | | N/A | | | | 5.22% (4/12/04) | |
Class B | | | –1.55 | | | | 3.50 | | | | N/A | | | | 5.18 (4/12/04) | |
Class C | | | 2.37 | | | | 3.64 | | | | 4.86 | % | | | — | |
Class L | | | –2.05 | | | | 2.91 | | | | 4.76 | | | | — | |
Class M | | | –2.55 | | | | 3.35 | | | | 4.86 | | | | — | |
Class Q | | | N/A | | | | N/A | | | | N/A | | | | N/A (1/18/11) | |
Class R | | | N/A | | | | N/A | | | | N/A | | | | N/A (1/18/11) | |
Class X | | | –2.63 | | | | 3.27 | | | | 4.89 | | | | — | |
Class Z | | | 4.42 | | | | N/A | | | | N/A | | | | 6.32 (8/25/08) | |
| | | | | | | | | | | | | | | | |
Average Annual Total Returns (Without Sales Charges) as of 10/31/11 | |
| | | One Year | | | Five Years | | | Ten Years | | | Since Inception | |
Class A | | | 4.16 | % | | | 4.41 | % | | | N/A | | | | 6.01% (4/12/04) | |
Class B | | | 3.45 | | | | 3.64 | | | | N/A | | | | 5.18 (4/12/04) | |
Class C | | | 3.37 | | | | 3.64 | | | | 4.86 | % | | | — | |
Class L | | | 3.93 | | | | 4.14 | | | | 5.38 | | | | — | |
Class M | | | 3.45 | | | | 3.62 | | | | 4.86 | | | | — | |
Class Q | | | N/A | | | | N/A | | | | N/A | | | | N/A (1/18/11) | |
Class R | | | N/A | | | | N/A | | | | N/A | | | | N/A (1/18/11) | |
Class X | | | 3.37 | | | | 3.68 | | | | 4.89 | | | | — | |
Class Z | | | 4.42 | | | | N/A | | | | N/A | | | | 6.32 (8/25/08) | |
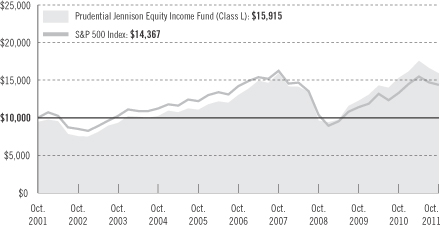
Growth of a $10,000 Investment
| | | | |
| Prudential Jennison Equity Income Fund | | | 3 | |
Your Fund’s Performance (continued)
The graph compares a $10,000 investment in the Prudential Jennison Equity Income Fund (Class L shares) with a similar investment in the S&P 500 Index by portraying the initial account values at the beginning of the 10-year period for Class L shares (October 31, 2001) and the account values at the end of the current fiscal year (October 31, 2011) as measured on a quarterly basis. The data are measured from the closest month-end to inception date, and not from the Fund’s actual inception date. For purposes of the graph, and unless otherwise indicated, it has been assumed that (a) the maximum applicable front-end sales charge was deducted from the initial $10,000 investment in Class L shares; (b) all recurring fees (including management fees) were deducted; and (c) all dividends and distributions were reinvested. The line graph provides information for Class L shares only. As indicated in the tables above, performance for Class A, Class B, Class C, Class M, Class Q, Class R, Class X, and Class Z shares will vary due to the differing charges and expenses applicable to each share class (as indicated in the following paragraphs).
Total returns and the ending account values in the graph include changes in share price and reinvestment of dividends and capital gains distributions in a hypothetical investment for the periods shown. The Fund’s total returns do not reflect the deduction of income taxes on an individual’s investment. Taxes may reduce your actual investment returns on income or gains paid by the Fund or any gains you may realize if you sell your shares.
Source: Prudential Investments LLC and Lipper Inc. Performance figures may reflect fee waivers and/or expense reimbursements. In the absence of such fee waivers and/or expense reimbursements, total returns would be lower.
Inception returns are provided for any share class with less than 10 calendar years of returns.
The average annual total returns take into account applicable sales charges. Class A and Class L shares are subject to a maximum front-end sales charge of 5.50% and 5.75%, respectively. Under certain limited circumstances, an exchange may be made from Class A to Class Z shares of the Fund. Class L, Class M, and Class X shares are closed to most new purchases (with the exception of reinvested dividends). Under certain circumstances, Class A and Class L shares may be subject to a contingent deferred sales charge (CDSC) of 1%. Class B, Class C, Class M, and Class X shares are subject to a maximum CDSC of 5%, 1%, 6%, and 6%, respectively. Class Q, Class R, and Class Z shares are not subject to a sales charge. Class A shares are subject to a 12b-1 fee of up to 0.30% annually. Class B, Class C, Class M, and Class X shares are subject to a 12b-1 fee of 1%. Class L shares are subject to a 12b-1 fee of 0.50%. Class R shares are subject to a 12b-1 fee of up to 0.75%. Class Q and Class Z shares are not subject to a 12b-1 fee. Prior to April 12, 2004, Class L shares were known as Class A shares. On April 12, 2004, Class A shares were redesignated as Class L shares and a new Class A was opened. Prior to April 12, 2004, Class M shares were known as Class B shares. On April 12, 2004, Class B shares were redesignated as Class M shares and a new Class B was opened. The returns in the tables and graph do not reflect the deduction of taxes that a shareholder would pay on Fund distributions or following the redemption of Fund shares. Without a distribution and service (12b-1) fee waiver of 0.05% and 0.25% for Class A and Class R shares, respectively, the returns shown in the tables would have been lower.
Benchmark Definitions
Standard & Poor’s 500 Composite Stock Price Index
The Standard & Poor’s 500 Composite Stock Price Index (S&P 500 Index) is an unmanaged index of 500 stocks of large U.S. public companies. It gives a broad look at how U.S. stock prices have performed. S&P 500 Index
| | |
| 4 | | Visit our website at www.prudentialfunds.com |
Closest Month-End to Inception cumulative total returns as of 10/31/11 are 29.76% for Class A and Class B; –1.06% for Class Q and Class R; and 4.82% for Class Z. S&P 500 Index Closest Month-End to Inception average annual total returns as of 9/30/11 are 2.11% for Class A and Class B; and –1.82% for Class Z. Class Q and Class R shares have been in existence for less than one year and have no average annual total return performance information available.
Lipper Equity Income Funds Index
Funds in the Lipper Equity Income Funds Index seek relatively high current income and growth of income by investing at least 65% of their portfolio in dividend-paying equity securities. These funds’ gross or net yield must be at least 125% of the average gross or net yield of the U.S. diversified equity fund universe. Lipper Equity Income Funds Index Closest Month-End to Inception cumulative total returns as of 10/31/11 are 30.81% for Class A and Class B; –1.55% for Class Q and Class R; and 4.24% for Class Z. Lipper Equity Income Funds Index Closest Month-End to Inception average annual total returns as of 9/30/11 are 2.34% for Class A and Class B; and –1.72% for Class Z. Class Q and Class R shares have been in existence for less than one year and have no average annual total return performance information available.
Lipper Equity Income Funds Average
Funds in the Lipper Equity Income Funds Average (Lipper Average) seek relatively high current income and growth of income through investing 60% or more of their portfolio in dividend-paying equity securities. Lipper Average Closest Month-End to Inception cumulative total returns as of 10/31/11 are 39.50% for Class A and Class B; –0.50% for Class Q and Class R; and 6.52% for Class Z. Lipper Average Closest Month-End to Inception average annual total returns as of 9/30/11 are 3.10% for Class A and Class B; and –1.10% for Class Z. Class Q and Class R shares have been in existence for less than one year and have no average annual total return performance information available.
Investors cannot invest directly in an index or average. The returns for the Index would be lower if they included the effects of sales charges, operating expenses of a mutual fund, or taxes. Returns for the Lipper Average reflect the deduction of operating expenses, but not sales charges or taxes.
| | | | |
Five Largest Holdings expressed as a percentage of net assets as of 10/31/11 | | | | |
Citigroup, Inc., CVT, 7.50%, Diversified Financial Services | | | 2.4 | % |
National Grid PLC, ADR (United Kingdom), Multi-Utilities | | | 2.3 | |
Oracle Corp., Software | | | 2.3 | |
Philip Morris International, Inc., Tobacco | | | 2.2 | |
Frontier Communications Corp., Diversified Telecommunication Services | | | 2.2 | |
Holdings reflect only long-term investments and are subject to change.
| | | | |
| Prudential Jennison Equity Income Fund | | | 5 | |
Strategy and Performance Overview
How did the Fund perform?
Prudential Jennison Equity Income Fund Class L shares returned 3.93% for the 12-month reporting period ended October 31, 2011. The Class L shares underperformed the 7.08% gain of the Lipper Equity Income Funds Index, the 7.13% gain of the Lipper Equity Income Funds Average, and the 8.07% gain of the S&P 500 Index.
How is the Fund managed?
Jennison Associates manages the Fund with an investment objective of income and capital appreciation. The Fund seeks companies with the ability to sustain and grow their dividends. It employs a value strategy to identify firms Jennison believes are fundamentally sound but valued at a discount to their true worth, as defined by the value of their earnings, free cash flow, the value of their assets, their private market value, or a combination of these factors.
How did the U.S. stock market perform?
The U.S. equity market, as measured by the S&P 500 Index, returned 8.07% for the period. However, the market was exceptionally volatile, buffeted by political turmoil in the Middle East and North Africa (MENA) region, a devastating earthquake and tsunami in Japan, heightened anxiety over government debt in the euro zone and United States, and prospects for a global economic slowdown.
| | • | | The market continued an uptrend through April 2011, then declined for five consecutive months, with the largest losses in August and September. Investors grew increasingly worried about a prolonged European government-debt crisis and slowing global economic growth. Stock prices rebounded sharply in October, however, with signs that the economies of the United States and China could prove more resilient than originally thought, despite continued uncertainty in Europe. |
| | • | | Solid gains in corporate earnings and continued corporate and personal spending provided tailwinds that allowed the U.S. economy to continue expanding, although at a generally lackluster rate. Business production and housing measures were mixed, and overall job growth remained anemic. |
| | • | | Stock prices were also pressured during the summer by acrimony and political gamesmanship in the Congressional debate over raising the U.S. debt ceiling. A last-minute accord averted an immediate crisis, but the lack of a longer-term solution highlighted the scope of Washington’s fiscal problems. The subsequent downgrade by Standard & Poor’s of the U.S. long-term sovereign credit rating to AA+ from AAA fueled additional anxiety. |
| | • | | Estimates of the impact of falling confidence across the globe led to reductions in forecasts of gross domestic product (GDP) growth and corporate earnings. |
| | |
| 6 | | Visit our website at www.prudentialfunds.com |
| | Commodity prices moved broadly lower, as oil and copper, two widely regarded barometers of economic health, finished the summer with steep declines (although they posted noteworthy comebacks in October). |
Which holdings made the largest positive contribution to the Fund’s return?
Holdings in the consumer staples, information technology, and utilities sectors made the largest contributions to the Fund’s return.
| | • | | B&G Foods drove the consumer staples contribution. It manufactures and distributes shelf-stable food products in the United States, Canada, and Puerto Rico. During the year, its sales grew and gross profit margins increased as it shifted its product mix to new higher-margin products. Jennison continues to like this holding for its strong portfolio of products and attractive dividend yield. Its prospects remain good as it follows consumer spending trends away from traditional channels such as grocery stores to non-traditional channels such as Wal-Mart, pharmacies, and dollar stores. |
| | • | | Rackspace Hosting, a technology firm, also was a leading contributor. It provides a range of web-hosting and managed-network services to more than 100,000 enterprise customers around the world. Primarily offering traditional hosting services with dedicated servers, Rackspace is expanding into cloud hosting, which lets customers use pooled server resources on an on-demand basis. Rackspace may continue to benefit from the trend among corporations of all sizes toward outsourcing their data-warehousing and software application needs in order to get better returns on investment. |
| | • | | ONEOK, a diversified energy company engaged in the gathering, processing, storage, and transportation of natural gas in the U.S., boosted performance in the utilities sector. Jennison likes its solid earnings growth and attractive dividend yield, supported by strong free cash flow and an expanding midstream business (in between downstream production and upstream delivery) in liquid natural gas. In addition, ONEOK is the general partner of ONEOK Partners, a master limited partnership, where most of its midstream natural gas business is housed. Jennison expects this midstream exposure to yield significant growth opportunities from shale gas and oil drilling in the United States. |
Which holdings subtracted most from the Fund’s return?
A Paris-based media conglomerate and a French auto equipment supplier, which both suffered from the heightened anxiety over European sovereign debt, were significant detractors.
| | • | | Lagardere was in the midst of a major restructuring when it was added to the portfolio. It planned to sell its non-core assets and refocus on sports marketing |
| | | | |
| Prudential Jennison Equity Income Fund | | | 7 | |
Strategy and Performance Overview (continued)
| | and core media retail distribution. With its shares trading at a 50% discount to the sum of its parts, Jennison saw it as a value opportunity potentially able to return capital to shareholders. Lagardere sold its magazine business to Hearst in July, but the worsening European sovereign debt crisis hurt its plans to divest other key assets. The Fund eliminated the position in September. |
| | • | | Faurecia supplies most of the world’s major carmakers with parts, ranging from seats and doors to exhaust systems. Earlier in the year, there was some uncertainty about how the Japanese earthquake might affect production. Management, however, maintained its earnings estimates for the year. As auto sales and manufacturing rates rebounded, Faurecia shares performed well. However, as the European financial crisis in August and September intensified, the automotive industry appeared vulnerable to a downturn. In October, Jennison exited the position in favor of other investment candidates. |
| | • | | Frontier Communications was a notable performer for most of the first half of the period. It posted solid first-quarter financial results, and improved revenue and expense trends were possible indications of further cost savings after it acquired select Verizon access lines in July 2010. Around mid-2011, concerns over increasing competition and uncertainties over costs linked to its acquisitions raised questions about the company’s free cash flow projections. Jennison continues to believe the acquisition will help drive longer-term growth and remains confident the company’s free cash flow will support its above-average dividend yield. |
Were there significant changes to the Fund?
Jennison did not make any strategic changes to the portfolio during the period. However, the Fund added or eliminated positions because of company fundamentals and risk-reward characteristics of certain stocks.
| | • | | Significant new positions were established including Boeing, Williams Companies, International Power, and Sara Lee. |
| | • | | Positions in other securities, including AT&T, CenterPoint Energy, International Business Machines (IBM), and NiSource were eliminated. |
During the reporting period, the Fund’s use of derivatives was limited, with no meaningful impact on performance.
The Portfolio of Investments following this report shows the size of the Fund’s positions at period-end.
| | |
| 8 | | Visit our website at www.prudentialfunds.com |
Comments on the Fund’s Five Largest Holdings
| 2.4% | Citigroup, Inc., CVT, 7.50%, Diversified Financial Services |
Jennison believes Citigroup has made great strides since the financial crisis by reducing its riskier assets and selling non-core, poorly performing business units. Like financial firms generally, Citigroup came under pressure during the summer owing to concerns about slower economic growth, investors’ reduced appetite for risk, and the ever-changing regulatory environment of the financial services industry. (All were reflected in the company’s poor third-quarter 2011 results.) Nevertheless, Jennison continues to like Citigroup’s fundamentals. Its balance sheet is dramatically improved, and with its ample cash, Jennison believes the company is well positioned for a resumption of more normal returns. These preferred shares are convertible into common stock on December 15, 2012. And in the interim, the Fund benefits from the security’s coupon (7.90% on an annualized basis, based on the closing price on October 31, 2011).
| 2.3% | National Grid PLC, ADR (United Kingdom), Multi-Utilities |
National Grid owns and operates the electricity transmission network in England and Wales as well as Britain’s high pressure natural gas transmission system. In the United States, National Grid’s transmission networks are concentrated in the Northeast, where the company distributes electricity and natural gas to customers in Massachusetts, New Hampshire, Rhode Island, and New York. Jennison continues to like National Grid for its attractive combination of earnings growth, driven by electric grid investment in the United Kingdom and earnings recovery among its U.S. utilities, as well as for its above-average dividend yield.
| 2.3% | Oracle Corp., Software |
Oracle provides a range of tools for managing business data, supporting business operations, and facilitating collaboration and software application development. Jennison believes the company is positioned for continued earnings growth and market share gains through product upgrades and cross-selling to its well-diversified customer base. Oracle can also benefit from new product cycles and offerings with superior technological integration and open standards.
| 2.2% | Philip Morris International Inc., Tobacco |
Philip Morris manufactures and markets many leading brands of cigarettes and tobacco products in more than 160 countries. Its products and market share produce considerable pricing power and some degree of insulation from economic fluctuations. Jennison expects its rising free cash flow to support continued dividend growth and an above-average dividend yield.
| 2.2% | Frontier Communications Corp., Diversified Telecommunication Services |
Please see comments on largest detractors from Fund’s return.
| | | | |
| Prudential Jennison Equity Income Fund | | | 9 | |
Fees and Expenses (Unaudited)
As a shareholder of the Fund, you incur two types of costs: (1) transaction costs, including sales charges (loads) on purchase payments and redemptions, as applicable, and (2) ongoing costs, including management fees, distribution and/or service (12b-1) fees, and other Fund expenses, as applicable. This example is intended to help you understand your ongoing costs (in dollars) of investing in the Fund and to compare these costs with the ongoing costs of investing in other mutual funds.
The example is based on an investment of $1,000 invested on May 1, 2011, at the beginning of the period, and held through the six-month period ended October 31, 2011. The example is for illustrative purposes only; you should consult the Prospectus for information on initial and subsequent minimum investment requirements.
The Fund’s transfer agent may charge additional fees to holders of certain accounts that are not included in the expenses shown in the table on the following page. These fees apply to individual retirement accounts (IRAs) and Section 403(b) accounts. As of the close of the six-month period covered by the table, IRA fees included an annual maintenance fee of $15 per account (subject to a maximum annual maintenance fee of $25 for all accounts held by the same shareholder). Section 403(b) accounts are charged an annual $25 fiduciary maintenance fee. Some of the fees may vary in amount, or may be waived, based on your total account balance or the number of Prudential Investments funds, including the Fund, that you own. You should consider the additional fees that were charged to your Fund account over the six-month period when you estimate the total ongoing expenses paid over the period and the impact of these fees on your ending account value, as these additional expenses are not reflected in the information provided in the expense table. Additional fees have the effect of reducing investment returns.
Actual Expenses
The first line for each share class in the table on the following page provides information about actual account values and actual expenses. You may use the information on this line, together with the amount you invested, to estimate the expenses that you paid over the period. Simply divide your account value by $1,000 (for example, an $8,600 account value ÷ $1,000 = 8.6), then multiply the result by the number on the first line under the heading “Expenses Paid During the Six-Month Period” to estimate the expenses you paid on your account during this period.
Hypothetical Example for Comparison Purposes
The second line for each share class in the table on the following page provides information about hypothetical account values and hypothetical expenses based on the Fund’s actual expense ratio and an assumed rate of return of 5% per year before
| | |
| 10 | | Visit our website at www.prudentialfunds.com |
expenses, which is not the Fund’s actual return. The hypothetical account values and expenses may not be used to estimate the actual ending account balance or expenses you paid for the period. You may use this information to compare the ongoing costs of investing in the Fund and other funds. To do so, compare this 5% hypothetical example with the 5% hypothetical examples that appear in the shareholder reports of the other funds.
Please note that the expenses shown in the table are meant to highlight your ongoing costs only and do not reflect any transactional costs such as sales charges (loads). Therefore, the second line for each share class in the table is useful in comparing ongoing costs only and will not help you determine the relative total costs of owning different funds. In addition, if these transactional costs were included, your costs would have been higher.
| | | | | | | | | | | | | | | | | | |
Prudential Jennison
Equity Income Fund | | Beginning Account
Value
May 1, 2011 | | | Ending Account
Value
October 31, 2011 | | | Annualized
Expense Ratio
Based on the
Six-Month Period | | | Expenses Paid
During the
Six-Month Period* | |
| | | | | | | | | | | | | | | | | | |
| Class A | | Actual | | $ | 1,000.00 | | | $ | 906.70 | | | | 1.23 | % | | $ | 5.91 | |
| | | Hypothetical | | $ | 1,000.00 | | | $ | 1,019.00 | | | | 1.23 | % | | $ | 6.26 | |
| | | | | | | | | | | | | | | | | | |
| Class B | | Actual | | $ | 1,000.00 | | | $ | 903.40 | | | | 1.98 | % | | $ | 9.50 | |
| | | Hypothetical | | $ | 1,000.00 | | | $ | 1,015.22 | | | | 1.98 | % | | $ | 10.06 | |
| | | | | | | | | | | | | | | | | | |
| Class C | | Actual | | $ | 1,000.00 | | | $ | 903.10 | | | | 1.98 | % | | $ | 9.50 | |
| | | Hypothetical | | $ | 1,000.00 | | | $ | 1,015.22 | | | | 1.98 | % | | $ | 10.06 | |
| | | | | | | | | | | | | | | | | | |
| Class L | | Actual | | $ | 1,000.00 | | | $ | 905.50 | | | | 1.48 | % | | $ | 7.11 | |
| | | Hypothetical | | $ | 1,000.00 | | | $ | 1,017.74 | | | | 1.48 | % | | $ | 7.53 | |
| | | | | | | | | | | | | | | | | | |
| Class M | | Actual | | $ | 1,000.00 | | | $ | 903.30 | | | | 1.96 | % | | $ | 9.40 | |
| | | Hypothetical | | $ | 1,000.00 | | | $ | 1,015.32 | | | | 1.96 | % | | $ | 9.96 | |
| | | | | | | | | | | | | | | | | | |
| Class Q | | Actual | | $ | 1,000.00 | | | $ | 908.80 | | | | 0.89 | % | | $ | 4.28 | |
| | | Hypothetical | | $ | 1,000.00 | | | $ | 1,020.72 | | | | 0.89 | % | | $ | 4.53 | |
| | | | | | | | | | | | | | | | | | |
| Class R | | Actual | | $ | 1,000.00 | | | $ | 905.50 | | | | 1.50 | % | | $ | 7.20 | |
| | | Hypothetical | | $ | 1,000.00 | | | $ | 1,017.64 | | | | 1.50 | % | | $ | 7.63 | |
| | | | | | | | | | | | | | | | | | |
| Class X | | Actual | | $ | 1,000.00 | | | $ | 903.10 | | | | 1.97 | % | | $ | 9.45 | |
| | | Hypothetical | | $ | 1,000.00 | | | $ | 1,015.27 | | | | 1.97 | % | | $ | 10.01 | |
| | | | | | | | | | | | | | | | | | |
| Class Z | | Actual | | $ | 1,000.00 | | | $ | 907.20 | | | | 0.99 | % | | $ | 4.76 | |
| | | Hypothetical | | $ | 1,000.00 | | | $ | 1,020.21 | | | | 0.99 | % | | $ | 5.04 | |
| | | | |
| Prudential Jennison Equity Income Fund | | | 11 | |
Fees and Expenses (continued)
* Fund expenses (net of fee waivers or subsidies, if any) for each share class are equal to the annualized expense ratio for each share class (provided in the table), multiplied by the average account value over the period, multiplied by the 184 days in the six-month period ended October 31, 2011, and divided by 365 days. Expenses presented in the table include the expenses of any underlying portfolios in which the Fund may invest.
| | |
| 12 | | Visit our website at www.prudentialfunds.com |
Portfolio of Investments
as of October 31, 2011
| | | | | | |
| Shares | | Description | | Value (Note 2) | |
| | | | | | |
LONG-TERM INVESTMENTS 99.1% | | | | |
COMMON STOCKS 87.0% | | | | |
| |
Aerospace & Defense 1.4% | | | | |
| 433,970 | | Boeing Co. (The) | | $ | 28,550,886 | |
| |
Air Freight & Logistics 1.4% | | | | |
| 406,280 | | United Parcel Service, Inc. (Class B Stock) | | | 28,537,107 | |
| |
Automobiles 0.8% | | | | |
| 203,611 | | Bayerische Motoren Werke AG (Germany) | | | 16,540,163 | |
| |
Beverages 0.7% | | | | |
| 214,591 | | Coca-Cola Co. (The)(a) | | | 14,660,857 | |
| |
Capital Markets 0.5% | | | | |
| 611,905 | | Morgan Stanley | | | 10,794,004 | |
| |
Chemicals 1.9% | | | | |
| 541,543 | | Monsanto Co. | | | 39,397,253 | |
| |
Communications Equipment 3.2% | | | | |
| 1,305,195 | | Finisar Corp.*(a) | | | 26,743,446 | |
| 764,270 | | QUALCOMM, Inc. | | | 39,436,332 | |
| | | | | | |
| | | | | 66,179,778 | |
| |
Computers & Peripherals 1.0% | | | | |
| 49,033 | | Apple, Inc.* | | | 19,847,578 | |
| |
Diversified Financial Services 0.6% | | | | |
| 100,000 | | Gateway Energy & Resource Holdings LLC, 144A
(original cost $2,000,000; purchased 12/14/07)*(b)(c) | | | 1,782,043 | |
| 309,225 | | JPMorgan Chase & Co. | | | 10,748,661 | |
| | | | | | |
| | | | | 12,530,704 | |
| |
Diversified Telecommunication Services 7.2% | | | | |
| 1,375,823 | | Alaska Communications Systems Group, Inc.(a) | | | 9,727,068 | |
| 451,866 | | BCE, Inc. (Canada) | | | 17,911,438 | |
| 1,149,646 | | CenturyLink, Inc. | | | 40,536,518 | |
| 1,683,138 | | City Telecom HK Ltd., ADR (Hong Kong) | | | 16,124,462 | |
| 1,257,741 | | Deutsche Telekom AG (Germany) | | | 15,978,511 | |
| 7,251,318 | | Frontier Communications Corp.(a) | | | 45,393,251 | |
See Notes to Financial Statements.
| | | | |
| Prudential Jennison Equity Income Fund | | | 13 | |
Portfolio of Investments
as of October 31, 2011 continued
| | | | | | |
| Shares | | Description | | Value (Note 2) | |
| | | | | | |
COMMON STOCKS (Continued) | | | | |
| |
Diversified Telecommunication Services (cont’d.) | | | | |
| 202,498 | | Otelco, Inc. (One Share of Class A Common Stock and $7.50 Principal amount of 13% senior subordinated notes due 2019), IDS | | $ | 3,369,567 | |
| | | | | | |
| | | | | 149,040,815 | |
| |
Electric Utilities 4.2% | | | | |
| 583,112 | | Exelon Corp. | | | 25,884,342 | |
| 668,176 | | FirstEnergy Corp. | | | 30,041,193 | |
| 1,417,412 | | Scottish & Southern Energy PLC (United Kingdom) | | | 30,624,814 | |
| | | | | | |
| | | | | 86,550,349 | |
| |
Electrical Equipment 0.8% | | | | |
| 501,941 | | Woodward, Inc. | | | 17,005,761 | |
| |
Food Products 8.4% | | | | |
| 1,617,781 | | B&G Foods, Inc. | | | 34,329,313 | |
| 289,220 | | Bunge Ltd. (Bermuda) | | | 17,865,119 | |
| 291,602 | | J.M. Smucker Co. (The)(a) | | | 22,459,186 | |
| 534,480 | | Kraft Foods, Inc. (Class A Stock) | | | 18,803,007 | |
| 2,393,959 | | Sara Lee Corp. | | | 42,612,470 | |
| 3,622,554 | | Tate & Lyle PLC (United Kingdom) | | | 37,900,502 | |
| | | | | | |
| | | | | 173,969,597 | |
| |
Independent Power Producers & Energy Traders 2.8% | | | | |
| 900,000 | | Atlantic Power Corp. (Canada) | | | 12,150,000 | |
| 3,706,450 | | International Power PLC (United Kingdom) | | | 20,106,310 | |
| 1,539,151 | | Northland Power, Inc. (Canada) | | | 25,540,564 | |
| | | | | | |
| | | | | 57,796,874 | |
| |
Internet Software & Services 1.1% | | | | |
| 553,582 | | Rackspace Hosting, Inc.* | | | 22,912,759 | |
| |
Media 5.6% | | | | |
| 2,642,630 | | British Sky Broadcasting Group PLC (United Kingdom) | | | 29,796,882 | |
| 1,486,860 | | Cinemark Holdings, Inc.(a) | | | 30,733,396 | |
| 1,316,009 | | Comcast Corp. (Class A Stock) | | | 30,860,411 | |
| 1,427,084 | | News Corp. (Class A Stock) | | | 25,002,512 | |
| | | | | | |
| | | | | 116,393,201 | |
| |
Multi-Utilities 2.3% | | | | |
| 953,291 | | National Grid PLC, ADR (United Kingdom) | | | 47,731,280 | |
See Notes to Financial Statements.
| | |
| 14 | | Visit our website at www.prudentialfunds.com |
| | | | | | |
| Shares | | Description | | Value (Note 2) | |
| | | | | | |
COMMON STOCKS (Continued) | | | | |
| |
Oil, Gas & Consumable Fuels 12.4% | | | | |
| 454,774 | | Baytex Energy Corp. (Canada) | | $ | 24,040,173 | |
| 526,346 | | Bonavista Energy Corp., UTS (Canada) | | | 13,550,076 | |
| 335,378 | | CONSOL Energy, Inc. | | | 14,340,763 | |
| 645,287 | | Crescent Point Energy Corp. (Canada) | | | 27,559,436 | |
| 217,200 | | Crescent Point Energy Corp., 144A (Canada) | | | 9,276,352 | |
| 508,637 | | Marathon Petroleum Corp. | | | 18,260,068 | |
| 1,650,973 | | NAL Energy Corp. (Canada)(b) | | | 14,625,625 | |
| 170,000 | | NAL Energy Corp., 144A, UTS (Canada)(b) | | | 1,505,994 | |
| 981,353 | | Peyto Exploration & Development Corp. (Canada)(b) | | | 21,414,023 | |
| 156,000 | | Peyto Exploration & Development Corp., 144A (Canada)(b) | | | 3,404,063 | |
| 2,174,215 | | Provident Energy Ltd. (Canada) | | | 19,698,388 | |
| 1,281,257 | | Targa Resources Corp. | | | 43,229,611 | |
| 134,630 | | Whiting Petroleum Corp.* | | | 6,267,027 | |
| 1,298,897 | | Williams Cos., Inc. (The) | | | 39,109,789 | |
| | | | | | |
| | | | | 256,281,388 | |
| |
Pharmaceuticals 5.3% | | | | |
| 1,097,679 | | Bristol-Myers Squibb Co. | | | 34,675,680 | |
| 603,731 | | Johnson & Johnson | | | 38,874,239 | |
| 1,875,127 | | Pfizer, Inc. | | | 36,114,946 | |
| | | | | | |
| | | | | 109,664,865 | |
| |
Real Estate Investment Trusts 5.5% | | | | |
| 695,884 | | Digital Realty Trust, Inc.(a) | | | 43,374,450 | |
| 2,241,384 | | First Potomac Realty Trust | | | 31,850,067 | |
| 206,128 | | Health Care REIT, Inc.(a) | | | 10,860,884 | |
| 4,171,779 | | MFA Financial, Inc. | | | 28,159,508 | |
| | | | | | |
| | | | | 114,244,909 | |
| |
Real Estate Management & Development 0.5% | | | | |
| 927,666 | | Direcional Engenharia SA (Brazil) | | | 4,862,972 | |
| 1,114,076 | | Direcional Engenharia SA, 144A (Brazil)(b) | | | 5,840,163 | |
| | | | | | |
| | | | | 10,703,135 | |
| |
Road & Rail 1.2% | | | | |
| 596,409 | | J.B. Hunt Transport Services, Inc. | | | 25,234,065 | |
See Notes to Financial Statements.
| | | | |
| Prudential Jennison Equity Income Fund | | | 15 | |
Portfolio of Investments
as of October 31, 2011 continued
| | | | | | |
| Shares | | Description | | Value (Note 2) | |
| | | | | | |
COMMON STOCKS (Continued) | | | | |
| |
Semiconductors & Semiconductor Equipment 3.9% | | | | |
| 1,772,809 | | Intel Corp. | | $ | 43,504,733 | |
| 1,113,382 | | Xilinx, Inc.(a) | | | 37,253,762 | |
| | | | | | |
| | | | | 80,758,495 | |
| |
Software 3.6% | | | | |
| 2,086,256 | | Activision Blizzard, Inc.(a) | | | 27,934,968 | |
| 1,425,681 | | Oracle Corp. | | | 46,719,566 | |
| | | | | | |
| | | | | 74,654,534 | |
| |
Tobacco 5.0% | | | | |
| 804,990 | | Altria Group, Inc. | | | 22,177,475 | |
| 655,748 | | Philip Morris International, Inc. | | | 45,817,113 | |
| 901,533 | | Reynolds American, Inc. | | | 34,871,296 | |
| | | | | | |
| | | | | 102,865,884 | |
| |
Transportation Infrastructure 0.7% | | | | |
| 553,566 | | CCR SA (Brazil) | | | 15,257,444 | |
| |
Wireless Telecommunication Services 5.0% | | | | |
| 813,805 | | NII Holdings, Inc.* | | | 19,148,832 | |
| 985,944 | | Rogers Communications, Inc. (Class B Stock) (Canada) | | | 35,955,921 | |
| 786,378 | | Tim Participacoes SA, ADR (Brazil)(a) | | | 20,477,283 | |
| 1,025,633 | | Vodafone Group PLC, ADR (United Kingdom) | | | 28,553,623 | |
| | | | | | |
| | | | | 104,135,659 | |
| | | | | | |
| | TOTAL COMMON STOCKS
(cost $1,765,820,141) | | | 1,802,239,344 | |
| | | | | | |
| |
PREFERRED STOCKS 7.3% | | | | |
| |
Airlines 0.5% | | | | |
| 364,902 | | Continental Airlines Finance Trust II, CVT, 6.00% | | | 11,038,286 | |
| |
Diversified Financial Services 2.4% | | | | |
| 524,602 | | Citigroup, Inc., CVT, 7.50% | | | 49,858,174 | |
| |
Electric Utilities 1.7% | | | | |
| 310,733 | | Great Plains Energy, Inc., CVT, 12.00% | | | 20,011,205 | |
| 275,000 | | PPL Corp., CVT, 8.75%(b) | | | 15,012,250 | |
| | | | | | |
| | | | | 35,023,455 | |
See Notes to Financial Statements.
| | |
| 16 | | Visit our website at www.prudentialfunds.com |
| | | | | | | | | | | | |
| Shares | | Description | | | | | | | | Value (Note 2) | |
| | | | | | | | | | | | |
PREFERRED STOCKS (Continued) | | | | | | | | | | |
| | | | |
Insurance 1.8% | | | | | | | | | | |
| 537,800 | | Metlife, Inc., CVT, 5.00%(b) | | | | | | | | $ | 36,521,998 | |
| | | | |
Leisure Equipment & Products 0.5% | | | | | | | | | | |
| 46,500 | | Callaway Golf Co., Series B,
144A, CVT, 7.50%(b) | | | | | | | | | 4,632,563 | |
| 55,120 | | Callaway Golf Co., Series B,
CVT, 7.50%(b) | | | | | | | | | 5,491,330 | |
| | | | | | | | | | | | |
| | | | | | | | | | | 10,123,893 | |
| | | | |
Oil, Gas & Consumable Fuels 0.3% | | | | | | | | | | |
| 28,902 | | Whiting Petroleum Corp.,
CVT, 6.25% | | | | | | | | | 6,529,251 | |
| | | | |
Real Estate Investment Trusts 0.1% | | | | | | | | | | |
| 104,534 | | DuPont Fabros Redeemable Perpetual, 7.875% | | | | | | | | | 2,571,536 | |
| | | | | | | | | | | | |
| | TOTAL PREFERRED STOCKS
(cost $171,980,883) | | | | | | | | | 151,666,593 | |
| | | | | | | | | | | | |
| | | | | | | | | | | | | | | | |
| | | | | |
Description | | Moody’s
Ratings†
(Unaudited) | | Interest
Rate | | Maturity
Date | | | Principal
Amount (000)# | | | | |
| | | | | | | | | | | | | | | | |
CONVERTIBLE BONDS 4.8% | | | | | | | | | | | | | | | | |
| | | | | |
Airlines 0.9% | | | | | | | | | | | | | | | | |
United Continental Holdings, Inc. Unsec’d. Notes | | CCC+(d) | | 6.00% | | | 10/15/29 | | | $ | 7,750 | | | | 18,270,625 | |
| | | |
Investment Banking & Brokerage 3.9% | | | | | | | | | | | | |
CS Equity Linked Notes, Sr. Unsec’d. Notes (Switzerland)(b) | | NR | | 11.50 | | | 03/22/12 | | | | 26,000 | | | | 27,944,800 | |
GS Apple, Inc.,
Sr. Unsec’d. Notes, 144A(b) | | NR | | 7.90 | | | 02/29/12 | | | | 72,912 | | | | 29,211,761 | |
GS NetApp, Inc.,
Sr. Unsec’d. Notes, 144A(b) | | NR | | 4.50 | | | 12/06/11 | | | | 54,350 | | | | 22,469,975 | |
| | | | | | | | | | | | | | | | |
| | | | | | | | | | | | | | | 79,626,536 | |
| | | | | | | | | | | | | | | | |
TOTAL CONVERTIBLE BONDS
(cost $107,957,286) | | | | | | | | | | | 97,897,161 | |
| | | | | | | | | | | | | | | | |
TOTAL LONG-TERM INVESTMENTS
(cost $2,045,758,310) | | | | | | | | | | | 2,051,803,098 | |
| | | | | | | | | | | | | | | | |
See Notes to Financial Statements.
| | | | |
| Prudential Jennison Equity Income Fund | | | 17 | |
Portfolio of Investments
as of October 31, 2011 continued
| | | | | | |
| Shares | | Description | | Value (Note 2) | |
SHORT-TERM INVESTMENT 7.7% | |
|
AFFILIATED MONEY MARKET MUTUAL FUND | |
| 159,986,065 | | Prudential Investment Portfolios 2 - Prudential Core Taxable Money Market Fund
(cost $159,986,065; includes $131,178,596 of cash collateral for securities on loan)(e)(f) | | $ | 159,986,065 | |
| | | | | | |
| | TOTAL INVESTMENTS 106.8%
(cost $2,205,744,375; Note 5) | | | 2,211,789,163 | |
| | Liabilities in excess of other assets (6.8)% | | | (140,850,597 | ) |
| | | | | | |
| | NET ASSETS 100.0% | | $ | 2,070,938,566 | |
| | | | | | |
The following abbreviations are used in the Portfolio descriptions:
144A—Security was purchased pursuant to Rule 144A under the Securities Act of 1933 and may not be resold subject to that rule except to qualified institutional buyers. Unless otherwise noted, 144A securities are deemed to be liquid.
ADR—American Depositary Receipt
CVT—Convertible Security
IDS—Income Depositary Receipt
NR—Not Rated by Moody’s or Standard & Poor’s
REIT—Real Estate Investment Trust
UTS—Unit Trust Security
| † | The ratings reflected are as of October 31, 2011. Ratings of certain bonds may have changed subsequent to that date. |
| # | Principal amount is shown in U.S. dollars unless otherwise stated. |
| * | Non-income producing security. |
| (a) | All or a portion of security is on loan. The aggregate market value of such securities, including those sold and pending settlement, is $125,637,742; cash collateral of $131,178,596 (included with liabilities) was received with which the Portfolio purchased highly liquid short-term investments. |
| (b) | Indicates a security or securities that have been deemed illiquid. |
| (c) | Private Placement restricted as to resale and does not have a readily available market. The aggregate original cost of such securities is $2,000,000. The aggregate value of $1,782,043 is approximately 0.1% of net assets. |
| (d) | Standard & Poor’s rating. |
| (e) | Represents security, or a portion thereof, purchased with cash collateral received for securities on loan. |
| (f) | Prudential Investments LLC, the manager of the Fund also serves as manager of the Prudential Investment Portfolio 2 - Prudential Core Taxable Money Market Fund. |
See Notes to Financial Statements.
| | |
| 18 | | Visit our website at www.prudentialfunds.com |
Various inputs are used in determining the value of the Fund’s investments. These inputs are summarized in the three broad levels listed below.
Level 1—quoted prices generally for securities actively traded on a regulated securities exchange and for open-end mutual funds which trade at daily net asset value.
Level 2—other significant observable inputs (including, but not limited to, quoted prices for similar securities, interest rates, prepayment speeds, foreign currency exchange rates, and amortized cost) generally for debt securities, swaps, forward foreign currency contracts and for foreign stocks priced using vendor modeling tools.
Level 3—significant unobservable inputs for securities valued in accordance with Board approved fair valuation procedures.
The following is a summary of the inputs used as of October 31, 2011 in valuing such portfolio securities:
| | | | | | | | | | | | |
| | | Level 1 | | | Level 2 | | | Level 3 | |
Investments in Securities | | | | | | | | | | | | |
Common Stocks | | $ | 1,649,510,119 | | | $ | 150,947,182 | | | $ | 1,782,043 | |
Preferred Stocks | | | 151,666,593 | | | | — | | | | — | |
Convertible Bonds | | | — | | | | 97,897,161 | | | | — | |
Affiliated Money Market Mutual Fund | | | 159,986,065 | | | | — | | | | — | |
| | | | | | | | | | | | |
Total | | $ | 1,961,162,777 | | | $ | 248,844,343 | | | $ | 1,782,043 | |
| | | | | | | | | | | | |
The industry classification of investments and liabilities in excess of other assets shown as a percentage of net assets as of October 31, 2011 were as follows:
| | | | |
Oil, Gas & Consumable Fuels | | | 12.7 | % |
Food Products | | | 8.4 | |
Affiliated Money Market Mutual Fund (6.3% represents investments purchased with collateral from securities on loan) | | | 7.7 | |
Diversified Telecommunication Services | | | 7.2 | |
Electric Utilities | | | 5.9 | |
Real Estate Investment Trusts | | | 5.6 | |
Media | | | 5.6 | |
Pharmaceuticals | | | 5.3 | |
Wireless Telecommunication Services | | | 5.0 | |
Tobacco | | | 5.0 | % |
Semiconductors & Semiconductor Equipment | | | 3.9 | |
Investment Banking & Brokerage | | | 3.9 | |
Software | | | 3.6 | |
Communications Equipment | | | 3.2 | |
Diversified Financial Services | | | 3.0 | |
Independent Power Producers & Energy Traders | | | 2.8 | |
Multi-Utilities | | | 2.3 | |
Chemicals | | | 1.9 | |
Insurance | | | 1.8 | |
See Notes to Financial Statements.
| | | | |
| Prudential Jennison Equity Income Fund | | | 19 | |
Portfolio of Investments
as of October 31, 2011 continued
| | | | |
Industry (cont’d.) | | | |
Airlines | | | 1.4 | % |
Aerospace & Defense | | | 1.4 | |
Air Freight & Logistics | | | 1.4 | |
Road & Rail | | | 1.2 | |
Internet Software & Services | | | 1.1 | |
Computers & Peripherals | | | 1.0 | |
Electrical Equipment | | | 0.8 | |
Automobiles | | | 0.8 | |
Transportation Infrastructure | | | 0.7 | % |
Beverages | | | 0.7 | |
Capital Markets | | | 0.5 | |
Real Estate Management & Development | | | 0.5 | |
Leisure Equipment & Products | | | 0.5 | |
| | | | |
| | | 106.8 | |
Liabilities in excess of other assets | | | (6.8 | ) |
| | | | |
| | | 100.0 | % |
| | | | |
The Fund invested in various derivative instruments during the reporting period. The primary type of risk associated with these derivative instruments is equity risk.
The effect of such derivative instruments on the Fund’s financial position and financial performance as reflected in the Statement of Operations is presented in the summary below. The Fund did not hold any derivative instruments as of October 31, 2011, accordingly, no derivative positions were presented in the Statements of Assets and Liabilities.
The effects of derivative instruments on the Statement of Operations for the year ended October 31, 2011 are as follows:
| | | | |
Amount of Realized Gain or (Loss) on Derivatives Recognized in Income | |
Derivatives not accounted for as hedging
instruments, carried at fair value | | Options
Written | |
Equity contracts | | $ | 266,395 | |
| | | | |
For the year ended October 31, 2011, the Fund did not have any unrealized appreciation or (depreciation) on derivatives recognized in income.
For the year ended October 31, 2011, the average premium received for written options was $34,829.
See Notes to Financial Statements.
| | |
| 20 | | Visit our website at www.prudentialfunds.com |
Financial Statements
| | |
| OCTOBER 31, 2011 | | ANNUAL REPORT |
Prudential Jennison Equity Income Fund
Statement of Assets and Liabilities
as of October 31, 2011
| | | | |
Assets | | | | |
Investments at value, including securities on loan of $125,637,742: | | | | |
Unaffiliated Investments (cost $2,045,758,310) | | $ | 2,051,803,098 | |
Affiliated Investments (cost $159,986,065) | | | 159,986,065 | |
Foreign currency, at value (cost $497,358) | | | 531,585 | |
Receivable for investments sold | | | 45,999,541 | |
Receivable for Fund shares sold | | | 13,794,147 | |
Dividends and interest receivable | | | 3,895,347 | |
Prepaid expenses | | | 31,296 | |
| | | | |
Total assets | | | 2,276,041,079 | |
| | | | |
| |
Liabilities | | | | |
Payable to broker for collateral for securities on loan | | | 131,178,596 | |
Payable for investments purchased | | | 56,714,876 | |
Payable for Fund shares reacquired | | | 8,506,104 | |
Payable to custodian | | | 6,242,226 | |
Advisory fee payable | | | 1,312,458 | |
Distribution fee payable | | | 645,595 | |
Accrued expenses | | | 430,067 | |
Affiliated transfer agent fee payable | | | 72,591 | |
| | | | |
Total liabilities | | | 205,102,513 | |
| | | | |
| |
Net Assets | | $ | 2,070,938,566 | |
| | | | |
| | | | | |
Net assets were comprised of: | | | | |
Common stock, at $.001 par value | | $ | 162,043 | |
Paid-in capital in excess of par | | | 2,129,705,491 | |
| | | | |
| | | 2,129,867,534 | |
Undistributed net investment income | | | 2,902,093 | |
Accumulated net realized loss on investment and foreign currency transactions | | | (67,919,298 | ) |
Net unrealized appreciation (depreciation) on investments and foreign currencies | | | 6,088,237 | |
| | | | |
Net assets, October 31, 2011 | | $ | 2,070,938,566 | |
| | | | |
See Notes to Financial Statements.
| | |
| 22 | | Visit our website at www.prudentialfunds.com |
| | | | |
Class A | | | | |
Net asset value and redemption price per share
($934,995,521 ÷ 72,040,576 shares of common stock issued and outstanding) | | $ | 12.98 | |
Maximum sales charge (5.5% of offering price) | | | 0.76 | |
| | | | |
Maximum offering price to public | | $ | 13.74 | |
| | | | |
| |
Class B | | | | |
Net asset value, offering price and redemption price per share
($58,827,207 ÷ 4,780,492 shares of common stock issued and outstanding) | | $ | 12.31 | |
| | | | |
| |
Class C | | | | |
Net asset value, offering price and redemption price per share
($499,092,401 ÷ 40,645,511 shares of common stock issued and outstanding) | | $ | 12.28 | |
| | | | |
| |
Class L | | | | |
Net asset value, offering price and redemption price per share
($16,578,374 ÷ 1,287,218 shares of common stock issued and outstanding) | | $ | 12.88 | |
| | | | |
| |
Class M | | | | |
Net asset value, offering price and redemption price per share
($1,311,928 ÷ 106,703 shares of common stock issued and outstanding) | | $ | 12.30 | |
| | | | |
| |
Class Q | | | | |
Net asset value, offering price and redemption price per share
($980,969 ÷ 75,528 shares of common stock issued and outstanding) | | $ | 12.99 | |
| | | | |
| |
Class R | | | | |
Net asset value, offering price and redemption price per share
($3,014,194 ÷ 232,246 shares of common stock issued and outstanding) | | $ | 12.98 | |
| | | | |
| |
Class X | | | | |
Net asset value, offering price and redemption price per share
($2,693,868 ÷ 219,552 shares of common stock issued and outstanding) | | $ | 12.27 | |
| | | | |
| |
Class Z | | | | |
Net asset value, offering price and redemption price per share
($553,444,104 ÷ 42,655,591 shares of common stock issued and outstanding) | | $ | 12.97 | |
| | | | |
See Notes to Financial Statements.
| | | | |
| Prudential Jennison Equity Income Fund | | | 23 | |
Statement of Operations
Year Ended October 31, 2011
| | | | |
Net Investment Income | | | | |
Investment Income | | | | |
Unaffiliated dividend income (net of foreign withholding tax of $1,824,521) | | $ | 72,767,601 | |
Unaffiliated interest income | | | 2,196,926 | |
Affiliated income from securities lending, net | | | 518,366 | |
Affiliated dividend income | | | 103,557 | |
| | | | |
Total income | | | 75,586,450 | |
| | | | |
| |
Expenses | | | | |
Advisory fee | | | 11,956,892 | |
Distribution fee—Class A | | | 1,803,327 | |
Distribution fee—Class B | | | 420,143 | |
Distribution fee—Class C | | | 3,560,906 | |
Distribution fee—Class L | | | 89,574 | |
Distribution fee—Class M | | | 28,966 | |
Distribution fee—Class R | | | 5,859 | |
Distribution fee—Class X | | | 38,187 | |
Transfer agent’s fee and expenses (including affiliated expense of $327,000) | | | 1,623,000 | |
Registration fees | | | 339,000 | |
Custodian’s fees and expenses | | | 326,000 | |
Reports to shareholders | | | 156,000 | |
Legal fees and expenses | | | 41,000 | |
Directors’ fees | | | 33,000 | |
Audit fees | | | 25,000 | |
Insurance fees | | | 12,000 | |
Miscellaneous | | | 21,059 | |
| | | | |
Total expenses | | | 20,479,913 | |
| | | | |
Net investment income | | | 55,106,537 | |
| | | | |
|
Realized And Unrealized Gain (Loss) On Investment And Foreign Currency Transactions | |
Net realized gain (loss) on: | | | | |
Investment transactions | | | (25,040,766 | ) |
Options written | | | 266,395 | |
Foreign currency transactions | | | (2,054,979 | ) |
| | | | |
| | | (26,829,350 | ) |
| | | | |
Net change in unrealized appreciation (depreciation) on: | | | | |
Investments | | | (43,036,164 | ) |
Foreign currencies | | | 43,223 | |
| | | | |
| | | (42,992,941 | ) |
| | | | |
Net loss on investments and foreign currencies | | | (69,822,291 | ) |
| | | | |
Net Decrease In Net Assets Resulting From Operations | | $ | (14,715,754 | ) |
| | | | |
See Notes to Financial Statements.
| | |
| 24 | | Visit our website at www.prudentialfunds.com |
Statement of Changes in Net Assets
| | | | | | | | |
| | | Year Ended October 31, | |
| | | 2011 | | | 2010 | |
Increase (Decrease) In Net Assets | | | | | | | | |
Operations | | | | | | | | |
Net investment income | | $ | 55,106,537 | | | $ | 8,317,494 | |
Net realized gain (loss) on investment and foreign currency transactions | | | (26,829,350 | ) | | | 4,675,578 | |
Net change in unrealized appreciation on investments and foreign currencies | | | (42,992,941 | ) | | | 44,593,040 | |
| | | | | | | | |
Net increase in net assets resulting from operations | | | (14,715,754 | ) | | | 57,586,112 | |
| | | | | | | | |
| | |
Dividends and Distributions (Note 1) | | | | | | | | |
Dividends from net investment income | | | | | | | | |
Class A | | | (25,624,158 | ) | | | (6,563,049 | ) |
Class B | | | (1,266,725 | ) | | | (317,393 | ) |
Class C | | | (10,814,696 | ) | | | (1,906,319 | ) |
Class L | | | (600,499 | ) | | | (844,391 | ) |
Class M | | | (85,574 | ) | | | (362,623 | ) |
Class Q | | | (6,607 | ) | | | — | |
Class R | | | (38,789 | ) | | | — | |
Class X | | | (114,795 | ) | | | (278,862 | ) |
Class Z | | | (13,357,666 | ) | | | (575,619 | ) |
| | | | | | | | |
Total dividends | | | (51,909,509 | ) | | | (10,848,256 | ) |
| | | | | | | | |
| | |
Fund share transactions (Note 4) | | | | | | | | |
Net proceeds from shares sold | | | 1,940,207,862 | | | | 394,173,232 | |
Net asset value of shares issued in reinvestment of dividends and distributions | | | 38,231,007 | | | | 9,674,929 | |
Cost of shares redeemed | | | (376,903,828 | ) | | | (59,552,099 | ) |
| | | | | | | | |
Increase in net assets from Fund share transactions | | | 1,601,535,041 | | | | 344,296,062 | |
| | | | | | | | |
| | |
Capital Contributions (Note 5) | | | | | | | | |
Proceeds from regulatory settlement | | | — | | | | 5,611 | |
| | | | | | | | |
Total increase in net assets | | | 1,534,909,778 | | | | 391,039,529 | |
| | |
Net Assets | | | | | | | | |
Beginning of year | | | 536,028,788 | | | | 144,989,259 | |
| | | | | | | | |
End of year(a) | | $ | 2,070,938,566 | | | $ | 536,028,788 | |
| | | | | | | | |
(a) Includes undistributed net investment income of | | $ | 2,902,093 | | | $ | 1,722,027 | |
| | | | | | | | |
See Notes to Financial Statements.
| | | | |
| Prudential Jennison Equity Income Fund | | | 25 | |
Notes to Financial Statements
1. Organization
Prudential Investment Portfolios, Inc. 10 (the “Company”) is an open-end management investment company, registered under the Investment Company Act of 1940, as amended, (“1940 Act”). The Company was organized on March 5, 1997, as a Maryland Corporation. The Company operates as a series company. At October 31, 2011, the Company consisted of two diversified investment portfolios (each a “Fund” and collectively the “Funds”). The information presented in these financial statements pertains to Prudential Jennison Equity Income Fund (the “Fund”). The investment objective of the Fund is long term capital growth and income by investing primarily in common stocks that are believed to be selling at reasonable valuation in relation to their fundamental business prospects.
2. Significant Accounting Policies
The following accounting policies are in conformity with accounting principles generally accepted in the United States of America. Such policies are consistently followed by the Company and the Funds in the preparation of their financial statements.
Securities Valuation: Securities listed on a securities exchange (other than options on securities and indices) are valued at the last sale price on such exchange on the day of valuation or, if there was no sale on such day, at the mean between the last reported bid and asked prices, or at the last bid price on such day in the absence of an asked price. Securities that are actively traded via NASDAQ are valued at the official closing price as provided by NASDAQ. Securities that are actively traded in the over-the-counter market, including listed securities for which primary market is believed by Prudential Investments LLC (“PI” or “Manager”) in consultation with the subadviser, to be over-the-counter, are valued at market value using prices provided by an independent pricing agent or principal market maker. Futures contracts and options thereon traded on a commodities exchange or board of trade are valued at the last sale price at the close of trading on such exchange or board of trade or, if there was no sale on the applicable commodities exchange or board of trade on such day, at the mean between the most recently quoted prices on such exchange or board of trade or at the last bid price in the absence of an asked price. Prices may be obtained from independent pricing services which use information provided by market makers or estimates of market values obtained from yield data relating to
| | |
| 26 | | Visit our website at www.prudentialfunds.com |
investments or securities with similar characteristics. Securities for which reliable market quotations are not readily available, or whose values have been affected by events occurring after the close of the security’s foreign market and before the Fund’s normal pricing time, are valued at fair value in accordance with the Board of Directors’ approved fair valuation procedures. When determining the fair valuation of securities some of the factors influencing the valuation include, the nature of any restrictions on disposition of the securities; assessment of the general liquidity of the securities; the issuer’s financial condition and the markets in which it does business; the cost of the investment; the size of the holding and the capitalization of issuer; the prices of any recent transactions or bids/offers for such securities or any comparable securities; any available analyst media or other reports or information deemed reliable by the investment adviser regarding the issuer or the markets or industry in which it operates. Using fair value to price securities may result in a value that is different from a security’s most recent closing price and from the price used by other mutual funds to calculate their net asset value.
Investments in open-end, non-exchange traded mutual funds are valued at the net asset value as of the close of the New York Stock Exchange on the date of valuation.
Foreign Currency Translation: Fund securities and other assets and liabilities denominated in foreign currencies are translated each business day into U.S. dollars based on the current rates of exchange. Purchases and sales of Fund securities and income and expenses are translated into U.S. dollars on the respective dates of such transactions. Gains and losses resulting from changes in exchange rates applicable to long-term foreign securities are not reported separately from gains and losses arising from movements in securities prices. Net realized foreign exchange gains and losses include gains and losses from sales and maturities of foreign currency exchange contracts, gains and losses realized between the trade and settlement dates of foreign securities transactions, and the difference between the amount of net investment income accrued on foreign securities and the U.S. dollar amount actually received. Net unrealized foreign exchange gains and losses include gains and losses from changes in the value of assets and liabilities other than Fund securities, resulting from changes in exchange rates.
Options: The Fund may either purchase or write options in order to hedge against adverse market movements or fluctuations in value caused by changes in prevailing interest rates or foreign currency exchange rates with respect to securities or financial instruments which the Fund currently owns or intends to purchase. The Fund’s principal reason for writing options is to realize, through receipt of premiums, a greater current return than would be realized on the underlying security alone. When the Fund purchases an option, it pays a premium and an amount equal to that
| | | | |
| Prudential Jennison Equity Income Fund | | | 27 | |
Notes to Financial Statements
continued
premium is recorded as an asset. When the Fund writes an option, it receives a premium and an amount equal to that premium is recorded as a liability. The asset or liability is adjusted daily to reflect the current market value of the option.
If an option expires unexercised, the Fund realizes a gain or loss to the extent of the premium received or paid. If an option is exercised, the premium received or paid is recorded as an adjustment to the proceeds from the sale or the cost basis of the purchase. The difference between the premium and the amount received or paid on at a closing purchase or sale transaction is also treated as a realized gain or loss. Gain or loss on purchased options is included in net realized gain or loss on investment transactions. Gain or loss on written options is presented separately as net realized gain or loss on written options transactions.
The Fund, as writer of an option, may have no control over whether the underlying securities or financial instruments may be sold (called) or purchased (put). As a result, the Fund bears the market risk of an unfavorable change in the price of the security or financial instrument underlying the written option. Over-the-counter options involve the risk of the potential inability of the counterparties to meet the terms of their contracts.
Securities Lending: The Funds may lend their portfolio securities to broker-dealers. The loans are secured by collateral at least equal at all times to the market value of the securities loaned. Loans are subject to termination at the option of the borrower or the Funds. Upon termination of the loan, the borrower will return to the lender securities identical to the loaned securities. Should the borrower of the securities fail financially, the Funds have the right to repurchase the securities using the collateral in the open market. The Funds recognize income, net of any rebate and securities lending agent fees, for lending its securities in the form of fees or interest on the investment of any cash received as collateral. The Funds also continue to receive interest and dividends or amounts equivalent thereto, on the securities loaned and recognize any unrealized gain or loss in the market price of the securities loaned that may occur during the term of the loan.
Securities Transactions and Investment Income: Securities transactions are recorded on the trade date. Realized gains or losses on sales of investments and currency transactions are calculated on the identified cost basis. Dividend income is recorded on the ex-dividend date and interest income is recorded on the accrual basis. The
| | |
| 28 | | Visit our website at www.prudentialfunds.com |
Fund amortizes premiums and discounts on portfolio securities as adjustments to interest income. Expenses are recorded on the accrual basis which may require the use of certain estimates by management.
Net investment income or loss (other than distribution fees, which are charged directly to the respective class) and unrealized and realized gains or losses are allocated daily to each class of shares based upon the relative proportion of net assets of each class at the beginning of the day.
Dividends and Distributions to Shareholders: Dividends and distributions to shareholders are recorded on the ex-divided date. Dividends, if any, from net investment income are declared and paid at least quarterly. These dividends and distributions are determined in accordance with federal income tax regulations and may differ from accounting principles generally accepted in the United States of America.
Net realized gains from investment transactions, if any are distributed at least annually. Permanent book/tax differences relating to income and gains are reclassified to paid-in capital when they arise.
Taxes: For federal income tax purposes, each Fund in the Company is treated as a separate tax paying entity. It is the Funds’ policy to continue to meet the requirements of the Internal Revenue Code applicable to regulated investment companies and to distribute all of its taxable net income and capital gains, if any, to shareholders. Therefore, no federal tax provision is required. Withholding taxes on foreign dividends are recorded net of reclaimable amounts, at the time the related income is earned.
Estimates: The preparation of the financial statements requires management to make estimates and assumptions that affect the reported amounts and disclosures in the financial statements. Actual results could differ from those estimates.
3. Agreements
The Fund has entered into investment management agreements with PI which provides that the Manager will furnish the Fund with investment advice and investment management and administrative services. The Manager has entered into a subadvisory agreement with Jennison Associates LLC.
Advisory Fees and Expense Limitations: The Manager receives a fee, computed daily and paid monthly, based on an annual rate of the average net assets. The Manager
| | | | |
| Prudential Jennison Equity Income Fund | | | 29 | |
Notes to Financial Statements
continued
pays the subadvisor a fee as compensation for advisory services provided to the Fund. The Manager has voluntarily agreed through February 29, 2012 to waive expenses in accordance with limitation expense policies as noted in the table below. The Manager will reimburse the Fund for its operating expenses, exclusive of taxes, interest, brokerage commissions, distribution fees and extraordinary expenses, but inclusive of the advisory fee, which in the aggregate exceed specified percentages of the Fund’s average net assets while retaining their ability to be reimbursed for such fee waivers prior to the end of the fiscal year. The advisory fee and expense limitation are summarized as follows:
| | | | |
Advisory Expense | | Effective Advisory Fees | | Fees
Limitation |
| 0.85% to $500 million; | | 0.80% | | 1.15% |
| 0.80% next $500 million; | | | | |
| 0.75% in excess of $1 billion | | | | |
Such contractual fee waivers or reductions have been calculated prior to any fee reimbursements with respect to the expense limitations, and may be rescinded at any time and without notice to investors. All reimbursements by the Manager are reflected in the Statements of Operations.
Certain officers and directors of the Fund are officers or directors of the Manager. The Fund pays no compensation directly to its officers or interested directors.
The Fund has distribution agreements with Prudential Investment Management Services LLC (“PIMS”) and Prudential Annuities Distributors, Inc. (“PAD”). PIMS and PAD are both affiliates of PI and indirect, wholly-owned subsidiaries of Prudential. PIMS serves as the distributor of the Fund’s Class A, Class B, Class C, Class Q, Class R and Class Z shares. PIMS, together with PAD, serves as co-distributor of the Fund’s Class L, Class M, and Class X shares.
The Company has adopted a separate Distribution and Service plan (each a “Plan” and collectively the “Plans”) for the Class A, Class B, Class C, Class L, Class M, Class R, and Class X shares of the Fund in accordance with Rule 12b-1 of the 1940 Act, as amended. No distribution or service fees are paid to PIMS as distributor for the Fund’s Class Q or Class Z shares.
| | |
| 30 | | Visit our website at www.prudentialfunds.com |
Under the Plans, the Fund compensates PIMS and PAD a distribution and service fee at the annual rate of 0.30%, 1.00%, 1.00%, 0.50%, 1.00%, 0.75% and 1.00% of the average daily net assets of the Class A, B, C, L, M, R and X shares, respectively. Through February 28, 2013, PIMS has contractually agreed to limit such fees to 0.25% and 0.50% of the average daily net assets of the Class A shares and Class R shares, respectively.
During the year ended October 31, 2011, PIMS has advised the Fund, front-end sales charges (“FESC”) and gross contingent deferred sales charges (“CDSC”) were as follows:
| | | | | | | | | | |
Class A
FESC | | Class A
CDSC | | Class B
CDSC | | Class C
CDSC | | Class M
CDSC | | Class X
CDSC |
| $6,643,102 | | $134,616 | | $70,414 | | $121,033 | | $633 | | $396 |
4. Other Transactions with Affiliates
Prudential Mutual Fund Services LLC (“PMFS”), an affiliate of Prudential Investments LLC and an indirect, wholly-owned subsidiary of Prudential, serves as the Fund’s transfer agent. Transfer agent fees and expenses are shown in the Statements of Operations.
The Fund invests in the Prudential Core Taxable Money Market Fund (the “Core Fund”), a series of the Prudential Investment Portfolios 2, registered under the 1940 Act, as amended, and managed by PI. Earnings from the Core Fund are disclosed on the Statement of Operations as affiliated dividend income.
Prudential Investment Management, Inc. (“PIM”), an indirect, wholly-owned subsidiary of Prudential, served as the Fund’s securities lending agent. For the year ended October 31, 2011, PIM has been compensated approximately $154,700 for these services.
5. Shares of Capital Stock
Class A shares are sold with a front-end sales charge of up to 5.50%. Purchases of $1 million or more are subject to a contingent deferred sales charge (“CDSC”) if shares are redeemed within 12 months of their purchase. The Class A shares CDSC is waived for purchases by certain retirement and/or benefit plans. Class B shares are sold with a CDSC which declines from 5% to zero depending upon the period of time the shares are held. Class B shares will automatically convert to Class A shares approximately seven years after purchase. Class M shares will automatically convert to Class A
| | | | |
| Prudential Jennison Equity Income Fund | | | 31 | |
Notes to Financial Statements
continued
shares approximately eight years after purchase. Under certain limited circumstances, an exchange may be made from Class A, Class B or Class C shares to Class Z shares of the Fund. In addition, under limited circumstances, an exchange may be made from Class Z to Class A or Class Q shares of the Fund. Class C shares are sold with a CDSC of 1% on shares redeemed within the first 12 months of purchase. Class L shares are closed to most new purchases (with the exception of reinvested dividends and purchases by certain college savings plans). Class M shares are also closed to new initial purchases (with the exception of reinvested dividends). Class L shares and Class M shares are only exchangeable with Class L shares and Class M shares, respectively, offered by the other Prudential Investments Funds. Class X shares are closed to new purchases. Class Q and Class Z shares are not subject to any sales or redemption charge and are offered exclusively for a sale to a limited group of investors. The authorized capital stock of the Funds is 5.5 billion shares, with a par value of $.001 per share. Of the Company’s authorized capital stock, 725 million authorized shares have been allocated to the Fund and divided into nine classes, designated Class A, Class B, Class C, Class L, Class M, Class Q, Class R, Class X and Class Z capital stock. Class A consists of 250 million authorized shares. Class B shares consists of 20 million authorized shares. Class C and Class Z shares each consist of 150 million authorized shares. Class L shares consists of 3 million authorized shares. Class M and Class X shares consist of 1 million authorized shares. Class Q and Class R shares consist of 75 million authorized shares.
For the year ended October 31, 2010, the Fund received $5,611 related to settlement of regulatory proceedings involving allegations of improper trading. The amounts relating to an affiliate and third party were $2,709 and $2,902, respectively. The total amount is presented in the Fund’s statement of changes in net assets. The Fund was not involved in the proceedings or the calculation of the payment.
| | |
| 32 | | Visit our website at www.prudentialfunds.com |
Transactions in shares of capital were as follows:
| | | | | | | | |
Class A | | Shares | | | Amount | |
Year ended October 31, 2011: | | | | | | | | |
Shares sold | | | 65,288,718 | | | $ | 879,345,539 | |
Shares issued in reinvestment of dividends and distributions | | | 1,615,902 | | | | 21,397,405 | |
Shares reacquired | | | (13,729,926 | ) | | | (180,041,038 | ) |
| | | | | | | | |
Net increase (decrease) in shares outstanding before conversion | | | 53,174,694 | | | | 720,701,906 | |
Shares issued upon conversion from Class B, Class M, Class X and Class Z | | | 549,468 | | | | 7,324,894 | |
Shares reacquired upon conversion into Class Z | | | (5,969,165 | ) | | | (79,633,360 | ) |
| | | | | | | | |
Net increase (decrease) in shares outstanding | | | 47,754,997 | | | $ | 648,393,440 | |
| | | | | | | | |
Year ended October 31, 2010: | | | | | | | | |
Shares sold | | | 19,212,861 | | | $ | 233,415,430 | |
Shares issued in reinvestment of dividends and distributions | | | 507,305 | | | | 6,039,148 | |
Shares reacquired | | | (3,345,082 | ) | | | (39,318,804 | ) |
| | | | | | | | |
Net increase (decrease) in shares outstanding before conversion | | | 16,375,084 | | | | 200,135,774 | |
Shares issued upon conversion from Class B, Class M and Class X | | | 975,962 | | | | 11,599,063 | |
| | | | | | | | |
Net increase (decrease) in shares outstanding | | | 17,351,046 | | | $ | 211,734,837 | |
| | | | | | | | |
Class B | | | | | | |
Year ended October 31, 2011: | | | | | | | | |
Shares sold | | | 3,846,248 | | | $ | 49,392,988 | |
Shares issued in reinvestment of dividends and distributions | | | 68,020 | | | | 855,637 | |
Shares reacquired | | | (388,679 | ) | | | (4,849,074 | ) |
| | | | | | | | |
Net increase (decrease) in shares outstanding before conversion | | | 3,525,589 | | | | 45,399,551 | |
Shares reacquired upon conversion into Class A | | | (115,243 | ) | | | (1,455,257 | ) |
| | | | | | | | |
Net increase (decrease) in shares outstanding | | | 3,410,346 | | | $ | 43,944,294 | |
| | | | | | | | |
Year ended October 31, 2010: | | | | | | | | |
Shares sold | | | 1,042,501 | | | $ | 12,036,820 | |
Shares issued in reinvestment of dividends and distributions | | | 23,128 | | | | 261,749 | |
Shares reacquired | | | (122,446 | ) | | | (1,376,757 | ) |
| | | | | | | | |
Net increase (decrease) in shares outstanding before conversion | | | 943,183 | | | | 10,921,812 | |
Shares reacquired upon conversion into Class A | | | (14,611 | ) | | | (165,963 | ) |
| | | | | | | | |
Net increase (decrease) in shares outstanding | | | 928,572 | | | $ | 10,755,849 | |
| | | | | | | | |
| | | | |
| Prudential Jennison Equity Income Fund | | | 33 | |
Notes to Financial Statements
continued
| | | | | | | | |
Class C | | Shares | | | Amount | |
Year ended October 31, 2011: | | | | | | | | |
Shares sold | | | 35,447,474 | | | $ | 453,427,921 | |
Shares issued in reinvestment of dividends and distributions | | | 547,492 | | | | 6,869,547 | |
Shares reacquired | | | (4,095,001 | ) | | | (50,448,164 | ) |
| | | | | | | | |
Net increase (decrease) in shares outstanding before conversion | | | 31,899,965 | | | | 409,849,304 | |
Shares reacquired upon conversion into Class Z | | | (15,363 | ) | | | (187,038 | ) |
| | | | | | | | |
Net increase (decrease) in shares outstanding | | | 31,884,602 | | | $ | 409,662,266 | |
| | | | | | | | |
Year ended October 31, 2010: | | | | | | | | |
Shares sold | | | 6,736,938 | | | $ | 78,127,438 | |
Shares issued in reinvestment of dividends and distributions | | | 140,872 | | | | 1,591,522 | |
Shares reacquired | | | (769,256 | ) | | | (8,594,389 | ) |
| | | | | | | | |
Net increase (decrease) in shares outstanding | | | 6,108,554 | | | $ | 71,124,571 | |
| | | | | | | | |
Class L | | | | | | |
Year ended October 31, 2011: | | | | | | | | |
Shares sold | | | 14,053 | | | $ | 192,437 | |
Shares issued in reinvestment of dividends and distributions | | | 44,303 | | | | 583,742 | |
Shares reacquired | | | (169,355 | ) | | | (2,261,841 | ) |
| | | | | | | | |
Net increase (decrease) in shares outstanding before conversion | | | (110,999 | ) | | | (1,485,662 | ) |
Shares reacquired upon conversion into Class Z | | | (892 | ) | | | (12,490 | ) |
| | | | | | | | |
Net increase (decrease) in shares outstanding | | | (111,891 | ) | | $ | (1,498,152 | ) |
| | | | | | | | |
Year ended October 31, 2010: | | | | | | | | |
Shares sold | | | 8,644 | | | $ | 99,354 | |
Shares issued in reinvestment of dividends and distributions | | | 69,803 | | | | 819,919 | |
Shares reacquired | | | (269,784 | ) | | | (3,178,990 | ) |
| | | | | | | | |
Net increase (decrease) in shares outstanding | | | (191,337 | ) | | $ | (2,259,717 | ) |
| | | | | | | | |
| | |
| 34 | | Visit our website at www.prudentialfunds.com |
| | | | | | | | |
Class M | | Shares | | | Amount | |
Year ended October 31, 2011: | | | | | | | | |
Shares sold | | | 4,390 | | | $ | 56,525 | |
Shares issued in reinvestment of dividends and distributions | | | 6,315 | | | | 79,873 | |
Shares reacquired | | | (8,934 | ) | | | (138,371 | ) |
| | | | | | | | |
Net increase (decrease) in shares outstanding before conversion | | | 1,771 | | | | (1,973 | ) |
Shares reacquired upon conversion into Class A | | | (283,314 | ) | | | (3,601,984 | ) |
| | | | | | | | |
Net increase (decrease) in shares outstanding | | | (281,543 | ) | | $ | (3,603,957 | ) |
| | | | | | | | |
Year ended October 31, 2010: | | | | | | | | |
Shares sold | | | 9,510 | | | $ | 106,392 | |
Shares issued in reinvestment of dividends and distributions | | | 29,835 | | | | 334,748 | |
Shares reacquired | | | (156,847 | ) | | | (1,754,632 | ) |
| | | | | | | | |
Net increase (decrease) in shares outstanding before conversion | | | (117,502 | ) | | | (1,313,492 | ) |
Shares reacquired upon conversion into Class A | | | (666,114 | ) | | | (7,520,254 | ) |
| | | | | | | | |
Net increase (decrease) in shares outstanding | | | (783,616 | ) | | $ | (8,833,746 | ) |
| | | | | | | | |
Class Q | | | | | | |
Period January 18, 2011* through October 31, 2011: | | | | | | | | |
Shares sold | | | 75,032 | | | $ | 922,515 | |
Shares issued in reinvestment of dividends and distributions | | | 521 | | | | 6,607 | |
Shares reacquired | | | (25 | ) | | | (319 | ) |
| | | | | | | | |
Net increase (decrease) in shares outstanding before conversion | | | 75,528 | | | $ | 928,803 | |
| | | | | | | | |
Class R | | | | | | |
Period January 18, 2011* through October 31, 2011: | | | | | | | | |
Shares sold | | | 284,014 | | | $ | 3,859,580 | |
Shares issued in reinvestment of dividends and distributions | | | 2,435 | | | | 31,687 | |
Shares reacquired | | | (54,203 | ) | | | (695,394 | ) |
| | | | | | | | |
Net increase (decrease) in shares outstanding before conversion | | | 232,246 | | | $ | 3,195,873 | |
| | | | | | | | |
Class X | | | | | | |
Year ended October 31, 2011: | | | | | | | | |
Shares sold | | | 3,085 | | | $ | 38,070 | |
Shares issued in reinvestment of dividends and distributions | | | 8,968 | | | | 112,972 | |
Shares reacquired | | | (52,374 | ) | | | (677,261 | ) |
| | | | | | | | |
Net increase (decrease) in shares outstanding before conversion | | | (40,321 | ) | | | (526,219 | ) |
Shares reacquired upon conversion into Class A | | | (155,568 | ) | | | (1,966,322 | ) |
| | | | | | | | |
Net increase (decrease) in shares outstanding | | | (195,889 | ) | | $ | (2,492,541 | ) |
| | | | | | | | |
Year ended October 31, 2010: | | | | | | | | |
Shares sold | | | 12,798 | | | $ | 143,145 | |
Shares issued in reinvestment of dividends and distributions | | | 24,459 | | | | 274,244 | |
Shares reacquired | | | (110,948 | ) | | | (1,241,284 | ) |
| | | | | | | | |
Net increase (decrease) in shares outstanding before conversion | | | (73,691 | ) | | | (823,895 | ) |
Shares reacquired upon conversion into Class A | | | (347,131 | ) | | | (3,912,846 | ) |
| | | | | | | | |
Net increase (decrease) in shares outstanding | | | (420,822 | ) | | $ | (4,736,741 | ) |
| | | | | | | | |
| | | | |
| Prudential Jennison Equity Income Fund | | | 35 | |
Notes to Financial Statements
continued
| | | | | | | | |
Class Z | | Shares | | | Amount | |
Year ended October 31, 2011: | | | | | | | | |
Shares sold | | | 41,254,920 | | | $ | 552,972,287 | |
Shares issued in reinvestment of dividends and distributions | | | 629,594 | | | | 8,293,537 | |
Shares reacquired | | | (10,645,917 | ) | | | (137,792,366 | ) |
| | | | | | | | |
Net increase (decrease) in shares outstanding before conversion | | | 31,238,597 | | | | 423,473,458 | |
Shares issued upon conversion from Class A, Class C and Class L | | | 5,987,867 | | | | 79,832,887 | |
Shares reacquired upon conversion into Class A | | | (24,219 | ) | | | (301,330 | ) |
| | | | | | | | |
Net increase (decrease) in shares outstanding | | | 37,202,245 | | | $ | 503,005,015 | |
| | | | | | | | |
Year ended October 31, 2010: | | | | | | | | |
Shares sold | | | 5,765,732 | | | $ | 70,244,653 | |
Shares issued in reinvestment of dividends and distributions | | | 29,320 | | | | 353,599 | |
Shares reacquired | | | (350,206 | ) | | | (4,087,243 | ) |
| | | | | | | | |
Net increase (decrease) in shares outstanding | | | 5,444,846 | | | $ | 66,511,009 | |
| | | | | | | | |
| * | Commencement of operations. |
6. Distributions and Tax Information
Distributions to shareholders, which are determined in accordance with federal income tax regulations, which may differ from generally accepted accounting principles, are recorded on the ex-dividend date. In order to present undistributed net investment income, accumulated net realized loss on investment and foreign currency transactions and paid-in capital in excess of par on the Statement of Assets and Liabilities that more closely represent their tax character, certain adjustments have been made to undistributed net investment income and accumulated net realized loss on investment and foreign currency transactions. For the year ended October 31, 2011, the adjustments were to decrease undistributed net investment income and decrease accumulated net realized loss on investment and foreign currency transactions by $2,016,962 due to the different treatment for book and tax purposes of certain transactions involving foreign securities and currencies and investment in partnerships. Net investment income, net realized gain (loss) on investment and foreign currency transactions and net assets were not affected by this change.
For the years ended October 31, 2011 and 2010, the tax character of dividends paid as reflected in the Statement of Changes in Net Assets were $51,909,509 and $10,848,256 of ordinary income, respectively.
| | |
| 36 | | Visit our website at www.prudentialfunds.com |
As of October 31, 2011 the accumulated undistributed earnings on a tax basis was $2,921,752 of ordinary income. This differs from the amount shown on the Statement of Assets and Liabilities primarily due to cumulative timing differences between financial and tax reporting.
For the federal income tax purposes, the Fund had a capital loss carryforward as of October 31, 2011 of approximately $63,389,000 of which $16,679,000 expires in 2016, $26,282,000 expires in 2017 and $20,428,000 expires in 2019. Accordingly, no capital gains distributions are expected to be paid to shareholders until net gains have been realized in excess of such carryforward. Under the recently enacted Regulated Investment Company Modernization Act of 2010 (“the Act”), the Fund is permitted to carryforward capital losses incurred in taxable years beginning after December 22, 2010 (“post-enactment losses”) for an unlimited period. However, any post-enactment losses are required to be utilized before the utilization of losses incurred prior to the effective date of the Act. As a result of this ordering rule, capital loss carryforwards related to the taxable years beginning prior to the effective date of the Act may have an increased likelihood to expire unused. Additionally, post-enactment capital losses that are carried forward will retain their character as either short-term or long-term capital losses rather than being considered all short-term as under previous law.
The United States federal income tax basis of the Fund’s investments and the net unrealized appreciation as of October 31, 2011 were as follows:
| | | | | | | | | | |
Tax Basis | | Appreciation | | Depreciation | | Net
Unrealized
Appreciation | | Other Cost
Basis
Adjustment | | Total Net
Unrealized
Appreciation |
| $2,210,294,208 | | $115,476,261 | | $(113,981,306) | | $1,494,955 | | $43,449 | | $1,538,404 |
The difference between book basis and tax basis was primarily attributable to deferred losses on wash sales, investments in partnerships and Real Estate Investment Trusts.
Management has analyzed the Fund’s tax positions taken on federal income tax returns for all open tax years and has concluded that no provision for income tax is required in the Fund’s financial statements for the current reporting period. The Fund’s federal and state income and federal excise tax returns for tax years for which the applicable statutes of limitations have not expired are subject to examination by the Internal Revenue Service and state departments of revenue.
| | | | |
| Prudential Jennison Equity Income Fund | | | 37 | |
Notes to Financial Statements
continued
7. Portfolio Securities
Purchases and sales of securities, other than U.S. government securities and short term obligations, during the year ended October 31, 2011, were $2,622,860,723 and $1,009,331,029 , respectively.
Transactions in options written during the year ended October 31, 2011, were as follows:
| | | | | | | | |
| | | Notional
Amount
(000) | | | Premium
Received | |
Options outstanding at October 31, 2010 | | | — | | | $ | — | |
Options written | | | 180,000 | | | | 266,395 | |
Options expired | | | (180,000 | ) | | | (266,395 | ) |
Options closed | | | — | | | | — | |
| | | | | | | | |
Options outstanding at October 31, 2011 | | | — | | | $ | — | |
| | | | | | | | |
8. Borrowings
The Fund, along with other affiliated registered investment companies (the “Companies”), is a party to a syndicated Credit Agreement (“SCA”) with a group of banks. The purpose of the SCA is to provide an alternative source of temporary funding for capital share redemptions. The SCA provides for a commitment of $750 million for the period December 17, 2010 through December 16, 2011. The Companies pay an annualized commitment fee of 0.10% of the unused portion of the SCA. Prior to December 17, 2010, the Companies had another Syndicated Credit Agreement (the “Expired SCA”) of a $500 million commitment with an annualized commitment fee of 0.15% of the unused portion. Interest on any borrowings under these is contracted market rates. The commitment fee for the unused amount is accrued daily and paid quarterly. The SCA has been renewed on substantially similar terms with an increase in the amount of commitment to $900 million.
The Fund did not borrow any amounts pursuant to the SCA during the year ended October 31, 2011.
Note 9. New Accounting Pronouncements
In April 2011, the Financial Accounting Standards Board (“FASB”) issued Accounting Standards Update (“ASU”) No. 2011-03 “Reconsideration of Effective control for
| | |
| 38 | | Visit our website at www.prudentialfunds.com |
Repurchase Agreements.” The objective of ASU No. 2011-03 is to improve the accounting for repurchase agreements and other agreements that both entitle and obligate a transferor to repurchase or redeem financial assets before their maturity. Under previous guidance, whether or not to account for a transaction as a sale was based on, in part, if the entity maintained effective control over the transferred financial assets. ASU No. 2011-03 removes the transferor’s ability criterion from the effective control assessment. This guidance is effective prospectively for interim and annual reporting periods beginning on or after December 15, 2011. At this time, management is evaluating the implications of ASU No. 2011-03 and its impact on the financial statements has not been determined.
In May 2011, the FASB issued ASU No. 2011-04 “Amendments to Achieve Common Fair Value Measurement and Disclosure Requirements in U.S. GAAP and IFRSs.” ASU No. 2011-04 includes common requirements for measurement of and disclosure about fair value between U.S. GAAP and IFRS. ASU No. 2011-04 will require reporting entities to disclose quantitative information about the unobservable inputs used in the fair value measurements categorized within Level 3 of the fair value hierarchy. In addition, ASU No. 2011-04 will require reporting entities to make disclosures about amounts and reasons for all transfers in and out of Level 1 and Level 2 fair value measurements. The new and revised disclosures are effective for interim and annual reporting periods beginning after December 15, 2011. At this time, management is evaluating the implications of ASU No. 2011-04 and its impact on the financial statements has not been determined.
Note 10. Dividends to Shareholders
Subsequent to the fiscal year end, the Fund declared an ordinary income dividend on December 14, 2011 to shareholders of record on December 15, 2011. The ex-dividend date was December 16, 2011. The per share amount declared was as follows:
| | | | |
| | | Ordinary Income | |
Class A | | $ | 0.11791 | |
Class B | | $ | 0.09178 | |
Class C | | $ | 0.09178 | |
Class L | | $ | 0.10857 | |
Class M | | $ | 0.09178 | |
Class R | | $ | 0.10857 | |
Class Q | | $ | 0.13243 | |
Class X | | $ | 0.09178 | |
Class Z | | $ | 0.12739 | |
| | | | |
| Prudential Jennison Equity Income Fund | | | 39 | |
Financial Highlights
| | | | | | | | | | | | | | | | | | | | |
| Class A Shares | |
| | | Year Ended October 31, | |
| | | 2011(b) | | | 2010(b) | | | 2009(b) | | | 2008(b) | | | 2007(b) | |
| Per Share Operating Performance: | | | | | | | | | | | | | | | | | | | | |
| Net Asset Value, Beginning Of Year | | | $12.92 | | | | $10.86 | | | | $8.60 | | | | $19.47 | | | | $16.45 | |
| Income from investment operations: | | | | | | | | | | | | | | | | | | | | |
| Net investment income | | | .52 | | | | .43 | | | | .44 | | | | .60 | | | | .66 | |
| Net realized and unrealized gain (loss) on investments | | | .02 | | | | 2.24 | | | | 1.93 | | | | (6.57 | ) | | | 3.02 | |
| Total from investment operations | | | .54 | | | | 2.67 | | | | 2.37 | | | | (5.97 | ) | | | 3.68 | |
| Less Dividends and Distributions: | | | | | | | | | | | | | | | | | | | | |
| Dividends from net investment income | | | (.48 | ) | | | (.61 | ) | | | (.11 | ) | | | (.49 | ) | | | (.66 | ) |
| Distributions from net realized gains | | | - | | | | - | | | | - | | | | (4.41 | ) | | | - | |
| Total dividends and distributions | | | (.48 | ) | | | (.61 | ) | | | (.11 | ) | | | (4.90 | ) | | | (.66 | ) |
| Capital Contributions (Note 5) | | | - | | | | - | * | | | - | | | | - | | | | - | |
| Net asset value, end of year | | | $12.98 | | | | $12.92 | | | | $10.86 | | | | $8.60 | | | | $19.47 | |
| Total Return(a) | | | 4.16% | | | | 25.19% | | | | 28.09% | | | | (39.46)% | | | | 22.72% | |
| |
| Ratios/Supplemental Data: | |
| Net assets, end of year (in millions) | | | $935.0 | | | | $313.7 | | | | $75.3 | | | | $44.7 | | | | $59.3 | |
| Ratios to average net assets(c): | | | | | | | | | | | | | | | | | | | | |
| Expenses after advisory fee waiver and expense reimbursement | | | 1.22% | | | | 1.44% | | | | 1.40% | | | | 1.41% | | | | 1.40% | |
| Expenses before advisory fee waiver and expense reimbursement | | | 1.22% | | | | 1.45% | | | | 1.66% | | | | 1.50% | | | | 1.51% | |
| Net investment income | | | 3.88% | | | | 3.62% | | | | 4.79% | | | | 4.75% | | | | 3.83% | |
| For Class A, B, C, L, M, Q, R, X, and Z shares: | | | | | | | | | | | | | | | | | | | | |
| Portfolio turnover rate | | | 70% | | | | 49% | | | | 63% | | | | 66% | | | | 143% | |
(a) Total return does not consider the effects of sales load. Total return is calculated assuming a purchase of a share on the first day and a sale on the last day of each year reported and includes reinvestment of dividends and distributions. Total returns may reflect adjustments to conform with generally accepted accounting principles. Total return includes the effect of expense subsidies.
(b) Calculations are based on the average daily number of shares outstanding.
(c) Does not include expenses of the underlying portfolio in which the Fund invests.
* Amount is less than $.005.
See Notes to Financial Statements.
| | |
| 40 | | Visit our website at www.prudentialfunds.com |
| | | | | | | | | | | | | | | | | | | | |
| Class B Shares | |
| | | Year Ended October 31, | |
| | | 2011(b) | | | 2010(b) | | | 2009(b) | | | 2008(b) | | | 2007(b) | |
| Per Share Operating Performance: | | | | | | | | | | | | | | | | | | | | |
| Net Asset Value, Beginning Of Year | | | $12.27 | | | | $10.30 | | | | $8.22 | | | | $18.85 | | | | $15.89 | |
| Income from investment operations: | | | | | | | | | | | | | | | | | | | | |
| Net investment income | | | .39 | | | | .32 | | | | .36 | | | | .49 | | | | .51 | |
| Net realized and unrealized gain (loss) on investments | | | .04 | | | | 2.13 | | | | 1.82 | | | | (6.31 | ) | | | 2.91 | |
| Total from investment operations | | | .43 | | | | 2.45 | | | | 2.18 | | | | (5.82 | ) | | | 3.42 | |
| Less Dividends and Distributions: | | | | | | | | | | | | | | | | | | | | |
| Dividends from net investment income | | | (.39 | ) | | | (.48 | ) | | | (.10 | ) | | | (.40 | ) | | | (.46 | ) |
| Distributions from net realized gains | | | - | | | | - | | | | - | | | | (4.41 | ) | | | - | |
| Total dividends and distributions | | | (.39 | ) | | | (.48 | ) | | | (.10 | ) | | | (4.81 | ) | | | (.46 | ) |
| Capital Contributions (Note 5) | | | - | | | | - | * | | | - | | | | - | | | | - | |
| Net asset value, end of year | | | $12.31 | | | | $12.27 | | | | $10.30 | | | | $8.22 | | | | $18.85 | |
| Total Return(a) | | | 3.45% | | | | 24.32% | | | | 27.03% | | | | (39.89)% | | | | 21.76% | |
| |
| Ratios/Supplemental Data: | |
| Net assets, end of year (in millions) | | | $58.8 | | | | $16.8 | | | | $4.6 | | | | $3.1 | | | | $5.0 | |
| Ratios to average net assets(c): | | | | | | | | | | | | | | | | | | | | |
| Expenses after advisory fee waiver and expense reimbursement | | | 1.97% | | | | 2.19% | | | | 2.15% | | | | 2.16% | | | | 2.15% | |
| Expenses before advisory fee waiver and expense reimbursement | | | 1.97% | | | | 2.20% | | | | 2.41% | | | | 2.24% | | | | 2.26% | |
| Net investment income | | | 3.07% | | | | 2.85% | | | | 4.11% | | | | 3.98% | | | | 2.95% | |
(a) Total return does not consider the effects of sales load. Total return is calculated assuming a purchase of a share on the first day and a sale on the last day of each year reported and includes reinvestment of dividends and distributions. Total returns may reflect adjustments to conform with generally accepted accounting principles. Total return includes the effect of expense subsidies.
(b) Calculations are based on the average daily number of shares outstanding.
(c) Does not include expenses of the underlying portfolio in which the Fund invests.
* Amount is less than $.005.
See Notes to Financial Statements.
| | | | |
| Prudential Jennison Equity Income Fund | | | 41 | |
Financial Highlights
continued
| | | | | | | | | | | | | | | | | | | | |
| Class C Shares | |
| | | Year Ended October 31, | |
| | | 2011(b) | | | 2010(b) | | | 2009(b) | | | 2008(b) | | | 2007(b) | |
| Per Share Operating Performance: | | | | | | | | | | | | | | | | | | | | |
| Net Asset Value, Beginning Of Year | | | $12.25 | | | | $10.28 | | | | $8.20 | | | | $18.82 | | | | $15.87 | |
| Income from investment operations: | | | | | | | | | | | | | | | | | | | | |
| Net investment income | | | .39 | | | | .32 | | | | .35 | | | | .49 | | | | .52 | |
| Net realized and unrealized gain (loss) on investments | | | .03 | | | | 2.13 | | | | 1.83 | | | | (6.30 | ) | | | 2.89 | |
| Total from investment operations | | | .42 | | | | 2.45 | | | | 2.18 | | | | (5.81 | ) | | | 3.41 | |
| Less Dividends and Distributions: | | | | | | | | | | | | | | | | | | | | |
| Dividends from net investment income | | | (.39 | ) | | | (.48 | ) | | | (.10 | ) | | | (.40 | ) | | | (.46 | ) |
| Distributions from net realized gains | | | - | | | | - | | | | - | | | | (4.41 | ) | | | - | |
| Total dividends and distributions | | | (.39 | ) | | | (.48 | ) | | | (.10 | ) | | | (4.81 | ) | | | (.46 | ) |
| Capital Contributions (Note 5) | | | - | | | | - | * | | | - | | | | - | | | | - | |
| Net asset value, end of year | | | $12.28 | | | | $12.25 | | | | $10.28 | | | | $8.20 | | | | $18.82 | |
| Total Return(a) | | | 3.37% | | | | 24.37% | | | | 27.09% | | | | (39.91)% | | | | 21.80% | |
| |
| Ratios/Supplemental Data: | |
| Net assets, end of year (in millions) | | | $499.1 | | | | $107.3 | | | | $27.3 | | | | $23.2 | | | | $46.6 | |
| Ratios to average net assets(c): | | | | | | | | | | | | | | | | | | | | |
| Expenses after advisory fee waiver and expense reimbursement | | | 1.97% | | | | 2.19% | | | | 2.15% | | | | 2.16% | | | | 2.15% | |
| Expenses before advisory fee waiver and expense reimbursement | | | 1.97% | | | | 2.20% | | | | 2.41% | | | | 2.25% | | | | 2.26% | |
| Net investment income | | | 3.08% | | | | 2.85% | | | | 4.13% | | | | 3.96% | | | | 2.89% | |
(a) Total return does not consider the effects of sales load. Total return is calculated assuming a purchase of a share on the first day and a sale on the last day of each year reported and includes reinvestment of dividends and distributions. Total returns may reflect adjustments to conform with generally accepted accounting principles. Total return includes the effect of expense subsidies.
(b) Calculations are based on the average daily number of shares outstanding.
(c) Does not include expenses of the underlying portfolio in which the Fund invests.
* Amount is less than $.005.
See Notes to Financial Statements.
| | |
| 42 | | Visit our website at www.prudentialfunds.com |
| | | | | | | | | | | | | | | | | | | | |
| Class L Shares | |
| | | Year Ended October 31, | |
| | | 2011(b) | | | 2010(b) | | | 2009(b) | | | 2008(b) | | | 2007(b) | |
| Per Share Operating Performance: | | | | | | | | | | | | | | | | | | | | |
| Net Asset Value, Beginning Of Year | | | $12.82 | | | | $10.77 | | | | $8.55 | | | | $19.38 | | | | $16.37 | |
| Income from investment operations: | | | | | | | | | | | | | | | | | | | | |
| Net investment income | | | .51 | | | | .39 | | | | .42 | | | | .57 | | | | .61 | |
| Net realized and unrealized gain (loss) on investments | | | - | * | | | 2.22 | | | | 1.91 | | | | (6.54 | ) | | | 2.99 | |
| Total from investment operations | | | .51 | | | | 2.61 | | | | 2.33 | | | | (5.97 | ) | | | 3.60 | |
| Less Dividends and Distributions: | | | | | | | | | | | | | | | | | | | | |
| Dividends from net investment income | | | (.45 | ) | | | (.56 | ) | | | (.11 | ) | | | (.45 | ) | | | (.59 | ) |
| Distributions from net realized gains | | | - | | | | - | | | | - | | | | (4.41 | ) | | | - | |
| Total dividends and distributions | | | (.45 | ) | | | (.56 | ) | | | (.11 | ) | | | (4.86 | ) | | | (.59 | ) |
| Capital Contributions (Note 5) | | | - | | | | - | * | | | - | | | | - | | | | - | |
| Net asset value, end of year | | | $12.88 | | | | $12.82 | | | | $10.77 | | | | $8.55 | | | | $19.38 | |
| Total Return(a) | | | 3.93% | | | | 24.84% | | | | 27.73% | | | | (39.63)% | | | | 22.43% | |
| |
| Ratios/Supplemental Data: | |
| Net assets, end of year (in millions) | | | $16.6 | | | | $17.9 | | | | $17.1 | | | | $17.0 | | | | $35.5 | |
| Ratios to average net assets(c): | | | | | | | | | | | | | | | | | | | | |
| Expenses after advisory fee waiver and expense reimbursement | | | 1.46% | | | | 1.69% | | | | 1.65% | | | | 1.66% | | | | 1.65% | |
| Expenses before advisory fee waiver and expense reimbursement | | | 1.46% | | | | 1.70% | | | | 1.91% | | | | 1.75% | | | | 1.76% | |
| Net investment income | | | 3.79% | | | | 3.31% | | | | 4.69% | | | | 4.45% | | | | 3.37% | |
(a) Total return does not consider the effects of sales load. Total return is calculated assuming a purchase of a share on the first day and a sale on the last day of each year reported and includes reinvestment of dividends and distributions. Total returns may reflect adjustments to conform with generally accepted accounting principles. Total return includes the effect of expense subsidies.
(b) Calculations are based on the average daily number of shares outstanding.
(c) Does not include expenses of the underlying portfolio in which the Fund invests.
* Amount is less than $.005.
See Notes to Financial Statements.
| | | | |
| Prudential Jennison Equity Income Fund | | | 43 | |
Financial Highlights
continued
| | | | | | | | | | | | | | | | | | | | |
| Class M Shares | |
| | | Year Ended October 31, | |
| | | 2011(b) | | | 2010(b) | | | 2009(b) | | | 2008(b) | | | 2007(b) | |
| Per Share Operating Performance: | | | | | | | | | | | | | | | | | | | | |
| Net Asset Value, Beginning Of Year | | | $12.26 | | | | $10.30 | | | | $8.22 | | | | $18.85 | | | | $15.89 | |
| Income from investment operations: | | | | | | | | | | | | | | | | | | | | |
| Net investment income | | | .46 | | | | .31 | | | | .36 | | | | .49 | | | | .52 | |
| Net realized and unrealized gain (loss) on investments | | | (.03 | ) | | | 2.13 | | | | 1.82 | | | | (6.31 | ) | | | 2.90 | |
| Total from investment operations | | | .43 | | | | 2.44 | | | | 2.18 | | | | (5.82 | ) | | | 3.42 | |
| Less Dividends and Distributions: | | | | | | | | | | | | | | | | | | | | |
| Dividends from net investment income | | | (.39 | ) | | | (.48 | ) | | | (.10 | ) | | | (.40 | ) | | | (.46 | ) |
| Distributions from net realized gains | | | - | | | | - | | | | - | | | | (4.41 | ) | | | - | |
| Total dividends and distributions | | | (.39 | ) | | | (.48 | ) | | | (.10 | ) | | | (4.81 | ) | | | (.46 | ) |
| Capital Contributions (Note 5) | | | - | | | | - | * | | | - | | | | - | | | | - | |
| Net asset value, end of year | | | $12.30 | | | | $12.26 | | | | $10.30 | | | | $8.22 | | | | $18.85 | |
| Total Return(a) | | | 3.45% | | | | 24.22% | | | | 27.03% | | | | (39.89)% | | | | 21.76% | |
| |
| Ratios/Supplemental Data: | |
| Net assets, end of year (in millions) | | | $1.3 | | | | $4.8 | | | | $12.1 | | | | $22.3 | | | | $80.9 | |
| Ratios to average net assets(c): | | | | | | | | | | | | | | | | | | | | |
| Expenses after advisory fee waiver and expense reimbursement | | | 1.95% | | | | 2.19% | | | | 2.15% | | | | 2.16% | | | | 2.15% | |
| Expenses before advisory fee waiver and expense reimbursement | | | 1.95% | | | | 2.20% | | | | 2.41% | | | | 2.25% | | | | 2.26% | |
| Net investment income | | | 3.58% | | | | 2.74% | | | | 4.29% | | | | 3.90% | | | | 2.79% | |
(a) Total return does not consider the effects of sales load. Total return is calculated assuming a purchase of a share on the first day and a sale on the last day of each year reported and includes reinvestment of dividends and distributions. Total returns may reflect adjustments to conform with generally accepted accounting principles. Total return includes the effect of expense subsidies.
(b) Calculations are based on the average daily number of shares outstanding.
(c) Does not include expenses of the underlying portfolio in which the Fund invests.
* Amount is less than $.005.
See Notes to Financial Statements.
| | |
| 44 | | Visit our website at www.prudentialfunds.com |
| | | | |
| Class Q Shares | |
| | | January 18,
2011(d)
through
October 31,
2011(b) | |
| Per Share Operating Performance: | | | | |
| Net Asset Value, Beginning Of Period | | | $13.52 | |
| Income from investment operations: | | | | |
| Net investment income | | | .29 | |
| Net realized and unrealized gain (loss) on investments | | | (.43 | ) |
| Total from investment operations | | | (.14 | ) |
| Less Dividends and Distributions: | | | | |
| Dividends from net investment income | | | (.39 | ) |
| Distributions from net realized gains | | | - | |
| Total dividends and distributions | | | (.39 | ) |
| Net asset value, end of period | | | $12.99 | |
| Total Return(a) | | | (1.06)% | |
| |
| Ratios/Supplemental Data: | |
| Net assets, end of period (in millions) | | | $1.0 | |
| Ratios to average net assets(c): | | | | |
| Expenses after advisory fee waiver and expense reimbursement | | | .89% | (e) |
| Expenses before advisory fee waiver and expense reimbursement | | | .89% | (e) |
| Net investment income | | | 2.99% | (e) |
(a) Total return does not consider the effects of sales load. Total return is calculated assuming a purchase of a share on the first day and a sale on the last day of each period reported and includes reinvestment of dividends and distributions. Total returns may reflect adjustments to conform with generally accepted accounting principles. Total return includes the effect of expense subsidies. Total returns for periods less than one full year are not annualized.
(b) Calculations are based on the average daily number of shares outstanding.
(c) Does not include expenses of the underlying portfolio in which the Fund invests.
(d) Commencement of operations.
(e) Annualized.
See Notes to Financial Statements.
| | | | |
| Prudential Jennison Equity Income Fund | | | 45 | |
Financial Highlights
continued
| | | | |
| Class R Shares | | | |
| | | January 18,
2011(d)
through
October 31,
2011(b) | |
| Per Share Operating Performance: | | | | |
| Net Asset Value, Beginning Of Period | | | $13.52 | |
| Income from investment operations: | | | | |
| Net investment income | | | .32 | |
| Net realized and unrealized gain (loss) on investments | | | (.52 | ) |
| Total from investment operations | | | (.20 | ) |
| Less Dividends and Distributions: | | | | |
| Dividends from net investment income | | | (.34 | ) |
| Distributions from net realized gains | | | - | |
| Total dividends and distributions | | | (.34 | ) |
| Net asset value, end of period | | | $12.98 | |
| Total Return(a) | | | (1.50)% | |
| |
| Ratios/Supplemental Data: | | | |
| Net assets, end of period (in millions) | | | $3.0 | |
| Ratios to average net assets(c): | | | | |
| Expenses after advisory fee waiver and expense reimbursement | | | 1.51% | (e) |
| Expenses before advisory fee waiver and expense reimbursement | | | 1.51% | (e) |
| Net investment income | | | 3.09% | (e) |
(a) Total return does not consider the effects of sales load. Total return is calculated assuming a purchase of a share on the first day and a sale on the last day of each period reported and includes reinvestment of dividends and distributions. Total returns may reflect adjustments to conform with generally accepted accounting principles. Total return includes the effect of expense subsidies. Total returns for periods less than one full year are not annualized.
(b) Calculations are based on the average daily number of shares outstanding.
(c) Does not include expenses of the underlying portfolio in which the Fund invests.
(d) Commencement of operations.
(e) Annualized.
See Notes to Financial Statements.
| | |
| 46 | | Visit our website at www.prudentialfunds.com |
| | | | | | | | | | | | | | | | | | | | |
| Class X Shares | | | | | | | | | | | | | | | |
| | | Year Ended October 31, | |
| | | 2011(b) | | | 2010(b) | | | 2009(b) | | | 2008(b) | | | 2007(b) | |
| Per Share Operating Performance: | | | | | | | | | | | | | | | | | | | | |
| Net Asset Value, Beginning Of Year | | | $12.24 | | | | $10.28 | | | | $8.20 | | | | $18.81 | | | | $15.86 | |
| Income from investment operations: | | | | | | | | | | | | | | | | | | | | |
| Net investment income | | | .44 | | | | .31 | | | | .36 | | | | .51 | | | | .52 | |
| Net realized and unrealized gain (loss) on investments | | | (.02 | ) | | | 2.13 | | | | 1.82 | | | | (6.28 | ) | | | 2.89 | |
| Total from investment operations | | | .42 | | | | 2.44 | | | | 2.18 | | | | (5.77 | ) | | | 3.41 | |
| Less Dividends and Distributions: | | | | | | | | | | | | | | | | | | | | |
| Dividends from net investment income | | | (.39 | ) | | | (.48 | ) | | | (.10 | ) | | | (.43 | ) | | | (.46 | ) |
| Distributions from net realized gains | | | - | | | | - | | | | - | | | | (4.41 | ) | | | - | |
| Total dividends and distributions | | | (.39 | ) | | | (.48 | ) | | | (.10 | ) | | | (4.84 | ) | | | (.46 | ) |
| Capital Contributions (Note 5) | | | - | | | | - | * | | | - | | | | - | | | | - | |
| Net asset value, end of year | | | $12.27 | | | | $12.24 | | | | $10.28 | | | | $8.20 | | | | $18.81 | |
| Total Return(a) | | | 3.37% | | | | 24.27% | | | | 27.09% | | | | (39.74)% | | | | 21.74% | |
| |
| Ratios/Supplemental Data: | | | | | | | | | | | | | | | |
| Net assets, end of year (in millions) | | | $2.7 | | | | $5.1 | | | | $8.6 | | | | $12.0 | | | | $27.8 | |
| Ratios to average net assets(c): | | | | | | | | | | | | | | | | | | | | |
| Expenses after advisory fee waiver and expense reimbursement | | | 1.95% | | | | 2.19% | | | | 2.15% | | | | 1.93% | | | | 2.15% | |
| Expenses before advisory fee waiver and expense reimbursement | | | 1.95% | | | | 2.20% | | | | 2.41% | | | | 2.02% | | | | 2.26% | |
| Net investment income | | | 3.42% | | | | 2.74% | | | | 4.24% | | | | 4.18% | | | | 2.87% | |
(a) Total return does not consider the effects of sales load. Total return is calculated assuming a purchase of a share on the first day and a sale on the last day of each year reported and includes reinvestment of dividends and distributions. Total returns may reflect adjustments to conform with generally accepted accounting principles. Total return includes the effect of expense subsidies.
(b) Calculations are based on the average daily number of shares outstanding.
(c) Does not include expenses of the underlying portfolio in which the Fund invests.
* Amount is less than $.005.
See Notes to Financial Statements.
| | | | |
| Prudential Jennison Equity Income Fund | | | 47 | |
Financial Highlights
continued
| | | | | | | | | | | | | | | | |
| Class Z Shares | |
| | | Year Ended October 31, | | | August 22,
2008(d)
through
October 31, | |
| | | 2011(e) | | | 2010(e) | | | 2009(e) | | | 2008(e) | |
| Per Share Operating Performance: | | | | | | | | | | | | | | | | |
| Net Asset Value, Beginning Of Period | | | $12.91 | | | | $10.87 | | | | $8.60 | | | | $11.89 | |
| Income from investment operations: | | | | | | | | | | | | | | | | |
| Net investment income | | | .53 | | | | .47 | | | | .27 | | | | .13 | |
| Net realized and unrealized gain (loss) on investments | | | .04 | | | | 2.22 | | | | 2.11 | | | | (3.42 | ) |
| Total from investment operations | | | .57 | | | | 2.69 | | | | 2.38 | | | | (3.29 | ) |
| Less Dividends and Distributions: | | | | | | | | | | | | | | | | |
| Dividends from net investment income | | | (.51 | ) | | | (.65 | ) | | | (.11 | ) | | | - | |
| Distributions from net realized gains | | | - | | | | - | | | | - | | | | - | |
| Total dividends and distributions | | | (.51 | ) | | | (.65 | ) | | | (.11 | ) | | | - | |
| Capital Contributions (Note 5) | | | - | | | | - | * | | | - | | | | - | |
| Net asset value, end of period | | | $12.97 | | | | $12.91 | | | | $10.87 | | | | $8.60 | |
| Total Return(a) | | | 4.42% | | | | 25.45% | | | | 28.27% | | | | (27.67)% | |
| |
| Ratios/Supplemental Data: | |
| Net assets, end of period (in millions) | | | $553.4 | | | | $70.4 | | | | $- | (c) | | | $- | (c) |
| Ratios to average net assets(f): | | | | | | | | | | | | | | | | |
| Expenses after advisory fee waiver and expense reimbursement | | | .98% | | | | 1.19% | | | | 1.15% | | | | 1.03% | (b) |
| Expenses before advisory fee waiver and expense reimbursement | | | .98% | | | | 1.20% | | | | 1.41% | | | | 1.03% | (b) |
| Net investment income | | | 4.00% | | | | 3.90% | | | | 2.44% | | | | 6.92% | (b) |
(a) Total return does not consider the effects of sales load. Total return is calculated assuming a purchase of a share on the first day and a sale on the last day of each period reported and includes reinvestment of dividends and distributions. Total return for periods of less than a full year are not annualized. Total returns may reflect adjustments to conform with generally accepted accounting principles. Total return includes the effect of expense subsidies. Total returns for periods less than one full year are not annualized.
(b) Annualized.
| (c) | Net assets were $724 and $92,360 on October 31, 2008 and October 31, 2009, respectively. |
| (d) | Commencement of operations. |
| (e) | Calculations are based on the average daily number of shares outstanding. |
| (f) | Does not include expenses of the underlying portfolio in which the Fund invests. |
| * | Amount is less than $.005. |
See Notes to Financial Statements.
| | |
| 48 | | Visit our website at www.prudentialfunds.com |
Report of Independent Registered Public
Accounting Firm
The Board of Directors and Shareholders
Prudential Investment Portfolios, Inc. 10:
We have audited the accompanying statement of assets and liabilities of Prudential Jennison Equity Income Fund, a series of Prudential Investment Portfolios, Inc. 10 (hereafter referred to as the “Fund”), including the portfolio of investments, as of October 31, 2011, and the related statement of operations for the year then ended, the statement of changes in net assets for each of the years in the two-year period then ended and the financial highlights for each of the years in the five-year period then ended. These financial statements and financial highlights are the responsibility of the Fund’s management. Our responsibility is to express an opinion on these financial statements and financial highlights based on our audits.
We conducted our audits in accordance with the standards of the Public Company Accounting Oversight Board (United States). Those standards require that we plan and perform the audit to obtain reasonable assurance about whether the financial statements and financial highlights are free of material misstatement. An audit includes examining, on a test basis, evidence supporting the amounts and disclosures in the financial statements. Our procedures included confirmation of securities owned as of October 31, 2011, by correspondence with the custodian, transfer agent and brokers or by other appropriate auditing procedures when replies from brokers were not received. An audit also includes assessing the accounting principles used and significant estimates made by management, as well as evaluating the overall financial statement presentation. We believe that our audits provide a reasonable basis for our opinion.
In our opinion, the financial statements and financial highlights referred to above present fairly, in all material respects, the financial position of the Fund as of October 31, 2011, and the results of its operations for the year then ended, the changes in its net assets for each of the years in the two-year period then ended and the financial highlights for each of the years in the five-year period then ended, in conformity with U.S. generally accepted accounting principles.

New York, New York
December 22, 2011
| | | | |
| Prudential Jennison Equity Income Fund | | | 49 | |
Tax Information
(Unaudited)
We are required by the Internal Revenue Code of 1986, as amended (“the Code”), to advise you within 60 days of the Fund’s year end (October 31, 2011), as to the federal income tax status of dividends paid by the Fund during such year. We are advising you that during its year ended October 31, 2011, the Fund paid ordinary income dividends of $0.48 per share for Class A, $0.39 per share for Class B, C, M, Q and X, $0.45 per share for Class L, $0.34 per share for Class R and $0.51 per share for Class Z.
For the year ended October 31, 2011, the Fund designates the maximum amount allowable under Section 854 of the Internal Revenue Code but not less than the following percentages of the ordinary income distributions paid as 1) qualified dividend income (QDI); and 2) eligible for corporate dividends received deduction (DRD).
| | | | | | | | |
| | | QDI | | | DRD | |
| | |
Prudential Jennison Equity Income Fund | | | 100% | | | | 52.38% | |
In January 2012, you will be advised on IRS Form 1099 DIV or substitute 1099 DIV as to the federal tax status of distributions received by you in calendar year 2011.
| | |
| 50 | | Visit our website at www.prudentialfunds.com |
INFORMATION ABOUT BOARD MEMBERS AND OFFICERS
(Unaudited)
Information about Board Members and Officers is set forth below. Board Members who are not deemed to be “interested persons” of the Fund, as defined in the 1940 Act, are referred to as “Independent Board Members.” Board Members who are deemed to be “interested persons” of the Fund are referred to as “Interested Board Members.” The Board Members are responsible for the overall supervision of the operations of the Fund and perform the various duties imposed on the directors of investment companies by the 1940 Act.
| | | | |
Independent Board Members(1) | | | | |
Name, Address, Age Position(s) Portfolios Overseen | | Principal Occupation(s) During Past Five Years | | Other Directorships Held |
Kevin J. Bannon (59) Board Member Portfolios Overseen: 58 | | Managing Director (since April 2008) and Chief Investment Officer (since October 2008) of Highmount Capital LLC (registered investment adviser); formerly Executive Vice President and Chief Investment Officer (April 1993-August 2007) of Bank of New York Company; President (May 2003-May 2007) of BNY Hamilton Family of Mutual Funds. | | Director of Urstadt Biddle Properties (since September 2008). |
Linda W. Bynoe (59) Board Member Portfolios Overseen: 58 | | President and Chief Executive Officer (since March 1995) and formerly Chief Operating Officer (December 1989-February 1995) of Telemat Ltd. (management consulting); formerly Vice President (January 1985-June 1989) at Morgan Stanley & Co (broker-dealer). | | Director of Simon Property Group, Inc. (retail real estate) (since May 2003); Director of Anixter International, Inc. (communication products distributor) (since January 2006); Director of Northern Trust Corporation (financial services) (since April 2006); Trustee of Equity Residential (residential real estate) (since December 2009); formerly Director of Dynegy Inc. (power generation) (September 2002-May 2006). |
Michael S. Hyland, CFA (66) Board Member Portfolios Overseen: 58 | | Independent Consultant (since February 2005); formerly Senior Managing Director (July 2001-February 2005) of Bear Stearns & Co, Inc.; Global Partner, INVESCO (1999-2001); Managing Director and President of Salomon Brothers Asset Management (1989-1999). | | None. |
Douglas H. McCorkindale (72) Board Member Portfolios Overseen: 58 | | Formerly Chairman (February 2001-June 2006), Chief Executive Officer (June 2000-July 2005), President (September 1997-July 2005) and Vice Chairman (March 1984-May 2000) of Gannett Co. Inc. (publishing and media). | | Director of Lockheed Martin Corp. (aerospace and defense) (since May 2001). |
Prudential Jennison Equity Income Fund
| | | | |
Independent Board Members(1) | | | | |
Name, Address, Age Position(s) Portfolios Overseen | | Principal Occupation(s) During Past Five Years | | Other Directorships Held |
Stephen P. Munn (69) Board Member Portfolios Overseen: 58 | | Lead Director (since 2007) and formerly Chairman (1993-2007) of Carlisle Companies Incorporated (manufacturer of industrial products). | | Lead Director (since 2007) of Carlisle Companies Incorporated (manufacturer of industrial products). |
Richard A. Redeker (68) Board Member & Independent Chair Portfolios Overseen: 58 | | Retired Mutual Fund Senior Executive (43 years); Management Consultant; Independent Directors Council (organization of 2,800 Independent Mutual Fund Directors)-Executive Committee, Chair of Policy Steering Committee, Governing Council. | | None. |
Robin B. Smith (72) Board Member Portfolios Overseen: 58 | | Chairman of the Board (since January 2003) of Publishers Clearing House (direct marketing); Member of the Board of Directors of ADLPartner (marketing) (since December 2010); formerly Chairman and Chief Executive Officer (August 1996-January 2003) of Publishers Clearing House. | | Formerly Director of BellSouth Corporation (telecommunications) (1992-2006). |
Stephen G. Stoneburn (68) Board Member Portfolios Overseen: 58 | | President and Chief Executive Officer (since June 1996) of Quadrant Media Corp. (publishing company); formerly President (June 1995-June 1996) of Argus Integrated Media, Inc.; Senior Vice President and Managing Director (January 1993-1995) of Cowles Business Media; Senior Vice President of Fairchild Publications, Inc (1975-1989). | | None. |
Visit our website at www.prudentialfunds.com
| | | | |
| Interested Board Members(1) | | | | |
Name, Address, Age Position(s) Portfolios Overseen | | Principal Occupation(s) During Past Five Years | | Other Directorships Held |
Judy A. Rice* (63) Board Member & President Portfolios Overseen: 58 | | President, Chief Executive Officer, Chief Operating Officer and Officer-In-Charge (since February 2003) of Prudential Investments LLC; President, Chief Executive Officer and Officer-In-Charge (since April 2003) of Prudential Mutual Fund Services LLC; President, Chief Executive Officer (since May 2011) and Executive Vice President (since December 2008) of Prudential Investment Management Services LLC; Member of the Board of Directors of Jennison Associates LLC (since November 2010); formerly Vice President (February 1999-April 2006) of Prudential Investment Management Services LLC; President, COO, CEO and Manager of PIFM Holdco, LLC (since April 2006); formerly President, Chief Executive Officer, Chief Operating Officer and Officer-In-Charge (May 2003-June 2005) and Director (May 2003-March 2006) and Executive Vice President (June 2005-March 2006) of AST Investment Services, Inc.; Member of Board of Governors of the Investment Company Institute. | | None. |
Stuart S. Parker* (49) Board Member & President Portfolios Overseen: 58 | | President of Prudential Investments LLC (since January 2012); Executive Vice President of Jennison Associates LLC and Head of Retail Distribution of Prudential Investments LLC (June 2005 - December 2011). | | None. |
Scott E. Benjamin (38) Board Member & Vice President Portfolios Overseen: 58 | | Executive Vice President (since June 2009) of Prudential Investments LLC and Prudential Investment Management Services LLC; Executive Vice President (since September 2009) of AST Investment Services, Inc.; Senior Vice President of Product Development and Marketing, Prudential Investments (since February 2006); Vice President of Product Development and Product Management, Prudential Investments (2003-2006). | | None. |
* Ms. Rice has announced her retirement as President and Board Member effective December 31, 2011. Ms. Rice has been appointed as Vice President effective January 1, 2012. The Board has appointed Stuart S. Parker as President and Board Member effective January 1, 2012.
Prudential Jennison Equity Income Fund
(1) The year in which each individual joined the Fund’s Board is as follows:
Linda W. Bynoe, 2005; Douglas H. McCorkindale, 2003, Richard A. Redeker, 2003; Robin B. Smith, 2003; Stephen G. Stoneburn, 2003; Kevin J. Bannon, 2008; Michael S. Hyland, 2008; Stephen P. Munn, 2008; Judy A. Rice, Board Member and President since 2003; Scott E. Benjamin, Board Member since 2010 and Vice President since 2009.
| | | | |
| Fund Officers(a)(1) | | | | |
Name, Address and Age Position with Fund | | | | Principal Occupation(s) During Past Five Years |
Kathryn L. Quirk (59) Chief Legal Officer | | | | Vice President and Corporate Counsel (since September 2004) of Prudential; Executive Vice President, Chief Legal Officer and Secretary (since July 2005) of PI and Prudential Mutual Fund Services LLC; Vice President and Corporate Counsel (since June 2005) and Secretary (since February 2006) of AST Investment Services, Inc.; formerly Senior Vice President and Assistant Secretary (November 2004-August 2005) of PI; formerly Assistant Secretary (June 2005-February 2006) of AST Investment Services, Inc.; formerly Managing Director, General Counsel, Chief Compliance Officer, Chief Risk Officer and Corporate Secretary (1997-2002) of Zurich Scudder Investments, Inc. |
Deborah A. Docs (53) Secretary | | | | Vice President and Corporate Counsel (since January 2001) of Prudential; Vice President (since December 1996) and Assistant Secretary (since March 1999) of PI; formerly Vice President and Assistant Secretary (May 2003-June 2005) of AST Investment Services, Inc. |
Jonathan D. Shain (53) Assistant Secretary | | | | Vice President and Corporate Counsel (since August 1998) of Prudential; Vice President and Assistant Secretary (since May 2001) of PI; Vice President and Assistant Secretary (since February 2001) of PMFS; formerly Vice President and Assistant Secretary (May 2003-June 2005) of AST Investment Services, Inc. |
Claudia DiGiacomo (37) Assistant Secretary | | | | Vice President and Corporate Counsel (since January 2005) of Prudential; Vice President and Assistant Secretary of PI (since December 2005); Associate at Sidley Austin Brown & Wood LLP (1999-2004). |
John P. Schwartz (40) Assistant Secretary | | | | Vice President and Corporate Counsel (since April 2005) of Prudential; Vice President and Assistant Secretary of PI (since December 2005); Associate at Sidley Austin Brown & Wood LLP (1997-2005). |
Andrew R. French (49) Assistant Secretary | | | | Vice President and Corporate Counsel (since February 2010) of Prudential; formerly Director and Corporate Counsel (2006-2010) of Prudential; Vice President and Assistant Secretary (since January 2007) of PI; Vice President and Assistant Secretary (since January 2007) of PMFS. |
Timothy J. Knierim (52) Chief Compliance Officer | | | | Chief Compliance Officer of Prudential Investment Management, Inc. (since July 2007); formerly Chief Risk Officer of PIM and PI (2002-2007) and formerly Chief Ethics Officer of PIM and PI (2006-2007). |
Valerie M. Simpson (53) Deputy Chief Compliance Officer | | | | Chief Compliance Officer (since April 2007) of PI and AST Investment Services, Inc.; formerly Vice President-Financial Reporting (June 1999-March 2006) for Prudential Life and Annuities Finance. |
Visit our website at www.prudentialfunds.com
| | | | |
| Fund Officers(a)(1) | | | | |
Name, Address and Age Position with Fund | | | | Principal Occupation(s) During Past Five Years |
Theresa C. Thompson (49) Deputy Chief Compliance Officer | | | | Vice President, Compliance, PI (since April 2004); and Director, Compliance, PI (2001-2004). |
Richard W. Kinville (43) Anti-Money Laundering Compliance Officer | | | | Vice President, Corporate Compliance, Anti-Money Laundering Unit (since January 2005) of Prudential; committee member of the American Council of Life Insurers Anti-Money Laundering and Critical Infrastructure Committee (since January 2007); formerly Investigator and Supervisor in the Special Investigations Unit for the New York Central Mutual Fire Insurance Company (August 1994-January 1999); Investigator in AXA Financial’s Internal Audit Department and Manager in AXA’s Anti-Money Laundering Office (January 1999-January 2005); first chair of the American Council of Life Insurers Anti-Money Laundering and Critical Infrastructure Committee (June 2007-December 2009). |
Grace C. Torres (52) Treasurer and Principal Financial and Accounting Officer | | | | Assistant Treasurer (since March 1999) and Senior Vice President (since September 1999) of PI; Assistant Treasurer (since May 2003) and Vice President (since June 2005) of AST Investment Services, Inc.; Senior Vice President and Assistant Treasurer (since May 2003) of Prudential Annuities Advisory Services, Inc.; formerly Senior Vice President (May 2003-June 2005) of AST Investment Services, Inc. |
M. Sadiq Peshimam (47) Assistant Treasurer | | | | Vice President (since 2005) of Prudential Investments LLC. |
Peter Parrella (53) Assistant Treasurer | | | | Vice President (since 2007) and Director (2004-2007) within Prudential Mutual Fund Administration; formerly Tax Manager at SSB Citi Fund Management LLC (1997-2004). |
(a) Excludes Ms. Rice and Mr. Benjamin, interested Board Members who also serve as President and Vice President, respectively.
(1) The year in which each individual became an Officer of the Fund is as follows:
Kathryn L. Quirk, 2005; Deborah A. Docs, 2003; Jonathan D. Shain, 2003; Claudia DiGiacomo, 2005; John P. Schwartz, 2006; Andrew R. French, 2006; Timothy J. Knierim, 2007; Valerie M. Simpson, 2007; Theresa C. Thompson, 2008; Richard W. Kinville, 2011; Grace C. Torres, 2003; Peter Parrella, 2007; M. Sadiq Peshimam, 2006.
Explanatory Notes to Tables:
| n | Board Members are deemed to be “Interested,” as defined in the 1940 Act, by reason of their affiliation with Prudential Investments LLC and/or an affiliate of Prudential Investments LLC. |
| n | Unless otherwise noted, the address of all Board Members and Officers is c/o Prudential Investments LLC, Gateway Center Three, 100 Mulberry Street, Newark, New Jersey 07102-4077. |
| n | There is no set term of office for Board Members or Officers. The Board Members have adopted a retirement policy, which calls for the retirement of Board Members on December 31 of the year in which they reach the age of 75. |
| n | “Other Directorships Held” includes only directorships of companies required to register or file reports with the SEC under the 1934 Act) (that is, “public companies”) or other investment companies registered under the 1940 Act. |
| n | “Portfolios Overseen” includes all investment companies managed by Prudential Investments LLC. The investment companies for which PI serves as manager include the Prudential Investments Mutual Funds, The Prudential Variable Contract Accounts, Target Mutual Funds, The Prudential Series Fund, Prudential’s Gibraltar Fund, Inc. and the Advanced Series Trust. |
Prudential Jennison Equity Income Fund
Approval of Advisory Agreements
The Fund’s Board of Directors
The Board of Directors (the “Board”) of Prudential Jennison Equity Income Fund (the “Fund”)1 consists of 10 individuals, eight of whom are not “interested persons” of the Fund, as defined in the Investment Company Act of 1940, as amended (the “1940 Act”) (the “Independent Directors”). The Board is responsible for the oversight of the Fund and its operations, and performs the various duties imposed on the directors of investment companies by the 1940 Act. The Independent Directors have retained independent legal counsel to assist them in connection with their duties. The Chair of the Board is an Independent Director. The Board has established three standing committees: the Audit Committee, the Nominating and Governance Committee, and the Investment Committee. Each committee is chaired by, and composed of, Independent Directors.
Annual Approval of the Fund’s Advisory Agreements
As required under the 1940 Act, the Board determines annually whether to renew the Fund’s management agreement with Prudential Investments LLC (“PI”) and the Fund’s subadvisory agreement with Jennison Associates LLC (“Jennison”). In considering the renewal of the agreements, the Board, including all of the Independent Directors, met on June 6-8, 2011 and approved the renewal of the agreements through July 31, 2012, after concluding that the renewal of the agreements was in the best interests of the Fund and its shareholders.
In advance of the meetings, the Board requested and received materials relating to the agreements, and had the opportunity to ask questions and request further information in connection with its consideration. Among other things, the Board considered comparative fee information from PI and Jennison. Also, the Board considered comparisons with other mutual funds in relevant Peer Universes and Peer Groups. The mutual funds included in each Peer Universe or Peer Group were objectively determined by Lipper Inc. (“Lipper”), an independent provider of mutual fund data. The comparisons placed the Fund in various quartiles over the one-, three- and five-year periods ending December 31, 2010, with the first quartile being the best 25% of the mutual funds (for performance, the best performing mutual funds and, for expenses, the lowest cost mutual funds).
In approving the agreements, the Board, including the Independent Directors advised by independent legal counsel, considered the factors it deemed relevant, including the nature, quality and extent of services provided by PI and the subadviser, the performance of the Fund, the profitability of PI and its affiliates, expenses and fees, and the potential for economies of scale that may be shared with the Fund and its
| 1 | Prudential Jennison Equity Income Fund is a series of Prudential Investment Portfolios, Inc. 10. |
Prudential Jennison Equity Income Fund
Approval of Advisory Agreements (continued)
shareholders as the Fund’s assets grow. In their deliberations, the Directors did not identify any single factor which alone was responsible for the Board’s decision to approve the agreements with respect to the Fund. In connection with its deliberations, the Board considered information provided by PI throughout the year at regular Board meetings, presentations from portfolio managers and other information, as well as information furnished at or in advance of the meetings on June 6-8, 2011.
The Directors determined that the overall arrangements between the Fund and PI, which serves as the Fund’s investment manager pursuant to a management agreement, and between PI and Jennison, which serves as the Fund’s subadviser pursuant to the terms of a subadvisory agreement with PI, are in the interest of the Fund and its shareholders in light of the services performed, fees charged and such other matters as the Directors considered relevant in the exercise of their business judgment.
The material factors and conclusions that formed the basis for the Directors’ reaching their determinations to approve the continuance of the agreements are separately discussed below.
Nature, Quality and Extent of Services
The Board received and considered information regarding the nature, quality and extent of services provided to the Fund by PI and Jennison. The Board considered the services provided by PI, including but not limited to the oversight of the subadviser for the Fund, as well as the provision of fund recordkeeping, compliance, and other services to the Fund. With respect to PI’s oversight of the subadviser, the Board noted that PI’s Strategic Investment Research Group (“SIRG”), which is a business unit of PI, is responsible for monitoring and reporting to PI’s senior management on the performance and operations of the subadviser. The Board also considered that PI pays the salaries of all of the officers and non-independent Directors of the Fund. The Board also considered the investment subadvisory services provided by Jennison, as well as adherence to the Fund’s investment restrictions and compliance with applicable Fund policies and procedures. The Board considered PI’s evaluation of the subadviser, as well as PI’s recommendation, based on its review of the subadviser, to renew the subadvisory agreement.
The Board reviewed the qualifications, backgrounds and responsibilities of PI’s senior management responsible for the oversight of the Fund and Jennison, and also reviewed the qualifications, backgrounds and responsibilities of the Jennison portfolio managers who are responsible for the day-to-day management of the Fund’s portfolio. The Board was provided with information pertaining to PI’s and Jennison’s organizational structure, senior management, investment operations, and other relevant information pertaining to PI and Jennison. The Board also noted that it received favorable
Visit our website at www.prudentialfunds.com
compliance reports from the Fund’s Chief Compliance Officer (“CCO”) as to each of PI and Jennison. The Board noted that Jennison is affiliated with PI.
The Board concluded that it was satisfied with the nature, extent and quality of the investment management services provided by PI and the subadvisory services provided to the Fund by Jennison, and that there was a reasonable basis on which to conclude that the Fund benefits from the services provided by PI and Jennison under the management and subadvisory agreements.
Performance of the Fund
The Board received and considered information about the Fund’s historical performance. The Board considered that the Fund’s gross performance in relation to its Peer Universe (the Lipper Equity Income Funds Performance Universe) was in the first quartile over the one-, three- and five-year periods. The Board noted that the Fund outperformed its benchmark index for all periods. The Board concluded that, in light of the Fund’s competitive performance, it would be in the interest of the Fund and its shareholders to renew the agreements.
Fees and Expenses
The Board considered that the Fund’s actual management fee (which reflects any subsidies, expense caps or waivers) ranked in the Expense Group’s fourth quartile and that the Fund’s total expenses ranked in the Expense Group’s third quartile. The Board accepted PI’s recommendation to allow the existing expense cap of 1.150% (exclusive of 12b-1 fees and certain other fees) to expire at the end of its contractual period, on February 29, 2012, noting PI’s explanation that due to a significant increase in Fund assets since the end of its most recent fiscal year, the Fund’s total expenses were lower than the expense cap, and would rank in the second quartile of the Expense Group. The Board concluded that the management fees (including subadvisory fees) and total expenses were reasonable in light of the services provided.
Costs of Services and Profits Realized by PI
The Board was provided with information on the profitability of PI and its affiliates in serving as the Fund’s investment manager. The Board discussed with PI the methodology utilized in assembling the information regarding profitability and considered its reasonableness. The Board recognized that it is difficult to make comparisons of profitability from fund management contracts because comparative information is not generally publicly available and is affected by numerous factors, including the structure of the particular adviser, the types of funds it manages, its business mix, numerous assumptions regarding allocations and the adviser’s capital structure and cost of capital. The Board did not separately consider the profitability of the subadviser, an affiliate of PI,
Prudential Jennison Equity Income Fund
Approval of Advisory Agreements (continued)
as its profitability was reflected in the profitability report for PI. Taking these factors into account, the Board concluded that the profitability of PI and its affiliates in relation to the services rendered was not unreasonable.
Economies of Scale
The Board noted that the management fee schedule for the Fund includes breakpoints, which have the effect of decreasing the fee rate as assets increase, but at the current level of assets, the Fund does not realize the effect of those rate reductions. The Board received and discussed information concerning whether PI realizes economies of scale as the Fund’s assets grow beyond current levels. The Board took note that the Fund’s fee structure would result in benefits to Fund shareholders when (and if) assets reach the levels at which the fee rate is reduced. These benefits will accrue whether or not PI is then realizing any economies of scale.
Other Benefits to PI and Jennison
The Board considered potential ancillary benefits that might be received by PI and Jennison and their affiliates as a result of their relationship with the Fund. The Board concluded that potential benefits to be derived by PI included fees received by affiliates of PI for serving as the Fund’s securities lending agent, transfer agency fees received by the Fund’s transfer agent (which is affiliated with PI), and benefits to the reputation as well as other intangible benefits resulting from PI’s association with the Fund. The Board concluded that the potential benefits to be derived by Jennison included its ability to use soft dollar credits, as well as the potential benefits consistent with those generally resulting from an increase in assets under management, specifically, potential access to additional research resources and benefits to the reputation. The Board concluded that the benefits derived by PI and Jennison were consistent with the types of benefits generally derived by investment managers and subadvisers to mutual funds.
After full consideration of these factors, the Board concluded that the approval of the agreements was in the interest of the Fund and its shareholders.
Visit our website at www.prudentialfunds.com
| | | | |
| n MAIL | | n TELEPHONE | | n WEBSITE |
Gateway Center Three 100 Mulberry Street Newark, NJ 07102 | | (800) 225-1852 | | www.prudentialfunds.com |
|
| PROXY VOTING |
| The Board of Directors of the Fund has delegated to the Fund’s investment subadviser the responsibility for voting any proxies and maintaining proxy recordkeeping with respect to the Fund. A description of these proxy voting policies and procedures is available without charge, upon request, by calling (800) 225-1852 or by visiting the Securities and Exchange Commission’s website at www.sec.gov. Information regarding how the Fund voted proxies relating to portfolio securities during the most recent 12-month period ended June 30 is available on the Fund’s website and on the Commission’s website. |
|
| DIRECTORS |
Kevin J. Bannon • Scott E. Benjamin • Linda W. Bynoe • Michael S. Hyland •
Douglas H. McCorkindale • Stephen P. Munn • Richard A. Redeker • Judy A. Rice • Robin B. Smith • Stephen G. Stoneburn |
|
| OFFICERS |
| Judy A. Rice, President • Scott E. Benjamin, Vice President • Grace C. Torres, Treasurer and Principal Financial and Accounting Officer • Kathryn L. Quirk, Chief Legal Officer • Deborah A. Docs, Secretary • Timothy J. Knierim, Chief Compliance Officer • Valerie M. Simpson, Deputy Chief Compliance Officer • Theresa C. Thompson, Deputy Chief Compliance Officer • Richard W. Kinville, Anti-Money Laundering Compliance Officer • Jonathan D. Shain, Assistant Secretary • Claudia DiGiacomo, Assistant Secretary • John P. Schwartz, Assistant Secretary • Andrew R. French, Assistant Secretary • M. Sadiq Peshimam, Assistant Treasurer • Peter Parrella, Assistant Treasurer |
| | | | |
| MANAGER | | Prudential Investments LLC | | Gateway Center Three
100 Mulberry Street
Newark, NJ 07102 |
|
| INVESTMENT SUBADVISER | | Jennison Associates LLC | | 466 Lexington Avenue
New York, NY 10017 |
|
| DISTRIBUTORS | | Prudential Annuities
Distributors, Inc. | | One Corporate Drive
Shelton, CT 06484 |
| | Prudential Investment
Management Services LLC | | Gateway Center Three
100 Mulberry Street
Newark, NJ 07102 |
|
| CUSTODIAN | | The Bank of New York Mellon | | One Wall Street
New York, NY 10286 |
|
| TRANSFER AGENT | | Prudential Mutual Fund
Services LLC | | PO Box 9658
Providence, RI 02940 |
|
| INDEPENDENT REGISTERED PUBLIC ACCOUNTING FIRM | | KPMG LLP | | 345 Park Avenue
New York, NY 10154 |
|
| FUND COUNSEL | | Willkie Farr & Gallagher LLP | | 787 Seventh Avenue
New York, NY 10019 |
|
| An investor should consider the investment objectives, risks, charges, and expenses of the Fund carefully before investing. The prospectus and summary prospectus contain this and other information about the Fund. An investor may obtain a prospectus and summary prospectus by visiting our website at www.prudentialfunds.com or by calling (800) 225-1852. The prospectus and summary prospectus should be read carefully before investing. |
|
| E-DELIVERY |
| To receive your mutual fund documents online, go to www.prudentialfunds.com/edelivery and enroll. Instead of receiving printed documents by mail, you will receive notification via email when new materials are available. You can cancel your enrollment or change your email address at any time by visiting the website address above. |
|
| SHAREHOLDER COMMUNICATIONS WITH DIRECTORS |
| Shareholders can communicate directly with the Board of Directors by writing to the Chair of the Board, Prudential Jennison Equity Income Fund, Prudential Investments, Attn: Board of Directors, 100 Mulberry Street, Gateway Center Three, Newark, NJ 07102. Shareholders can communicate directly with an individual Director by writing to the same address. Communications are not screened before being delivered to the addressee. |
|
| AVAILABILITY OF PORTFOLIO SCHEDULE |
| The Fund files its complete schedule of portfolio holdings with the Securities and Exchange Commission for the first and third quarters of each fiscal year on Form N-Q. The Fund’s Forms N-Q are available on the Commission’s website at www.sec.gov. The Fund’s Forms N-Q may also be reviewed and copied at the Commission’s Public Reference Room in Washington, D.C. Information on the operation and location of the Public Reference Room may be obtained by calling (202) 551-8090. The Fund’s schedule of portfolio holdings is also available on the Fund’s website as of the end of each month. |
|
| The Fund’s Statement of Additional Information contains additional information about the Fund’s Directors and is available without charge, upon request, by calling (800) 225-1852. |
Mutual Funds:
| | | | |
ARE NOT INSURED BY THE FDIC OR ANY
FEDERAL GOVERNMENT AGENCY | | MAY LOSE VALUE | | ARE NOT A DEPOSIT OF OR GUARANTEED BY ANY BANK OR ANY BANK AFFILIATE |

PRUDENTIAL JENNISON EQUITY INCOME FUND
| | | | | | | | | | | | | | | | | | | | |
| | | SHARE CLASS | | A | | B | | C | | L | | M | | Q | | R | | X | | Z |
| | NASDAQ | | SPQAX | | JEIBX | | AGOCX | | AGOAX | | AGOBX | | PJIQX | | PJERX | | AXGOX | | JDEZX |
| | CUSIP | | 74441L808 | | 74441L881 | | 74441L873 | | 74441L865 | | 74441L857 | | 74441L816 | | 74441L790 | | 74441L840 | | 74441L832 |
MF203E 0215424-00001-00

PRUDENTIAL INVESTMENTS»MUTUAL FUNDS
PRUDENTIAL MID-CAP VALUE FUND
ANNUAL REPORT · OCTOBER 31, 2011
Fund Type
Mid-cap stock
Objective
Capital growth
This report is not authorized for distribution to prospective investors unless preceded or accompanied by a current prospectus.
The views expressed in this report and information about the Fund’s portfolio holdings are for the period covered by this report and are subject to change thereafter.
Prudential Investments, Prudential, the Prudential logo, and the Rock symbol are service marks of Prudential Financial, Inc. and its related entities, registered in many jurisdictions worldwide.

December 15, 2011
Dear Shareholder:
After leading Prudential Investments for the past eight years, I have decided to retire at the end of 2011 from my positions as President of Prudential Investments and President and Director of the Prudential Mid-Cap Value Fund (the Fund). Effective January 1, 2012, I will become Chairman of Prudential Investments and act as an advisor to the business during 2012 to help facilitate a smooth transition to my successor, Stuart Parker.
Stuart, who will become President of Prudential Investments and President and Director of the Fund on January 1, 2012, previously served as the Executive Vice President of Retail Mutual Fund Distribution at Prudential Investments. With more than 20 years of investment industry experience, Stuart brings a deep understanding of the needs and challenges facing today’s investors.
We hope you find the annual report for the Fund informative. We recognize that ongoing market volatility may make it a difficult time to be an investor. We continue to believe a prudent response to uncertainty is to maintain a diversified portfolio, including stock and bond mutual funds consistent with your tolerance for risk, time horizon, and financial goals.
Your financial professional can help you create a diversified investment plan that reflects your personal investor profile and risk tolerance. Keep in mind that diversification and asset allocation strategies do not assure a profit or protect against loss in declining markets. We encourage you to call your financial professional before making any investment decision.
Prudential Investments provides a wide range of mutual funds to choose from that can help you make progress toward your financial goals. Our funds offer the experience, resources, and professional discipline of Prudential Financial’s affiliated asset managers.
Finally, I’ve been privileged to have had the opportunity to help you address your investment needs, and I thank you for choosing the Prudential Investments family of mutual funds.
Sincerely,

Judy A. Rice, President
Prudential Mid-Cap Value Fund
| | | | |
| Prudential Mid-Cap Value Fund | | | 1 | |
Your Fund’s Performance
Performance data quoted represent past performance. Past performance does not guarantee future results. The investment return and principal value of an investment will fluctuate, so that an investor’s shares, when redeemed, may be worth more or less than their original cost. Current performance may be lower or higher than the past performance data quoted. An investor may obtain performance data as of the most recent month-end by visiting our website at www.prudentialfunds.com or by calling (800) 225-1852. Class A and Class L shares have a maximum initial sales charge of 5.50% and 5.75%, respectively. Gross operating expenses: Class A, 1.68%; Class B, 2.38%; Class C, 2.38%; Class L, 1.88%; Class M, 2.38%; Class Q, 1.13%; Class X, 2.38%; Class Z, 1.38%. Net operating expenses: Class A, 1.63%; Class B, 2.38%; Class C, 2.38%; Class L, 1.88%; Class M, 1.63%; Class Q, 1.13%; Class X, 1.63%; Class Z, 1.38%, after contractual reduction for Class A through 2/28/2013.
| | | | | | | | | | | | | | | | |
Cumulative Total Returns (Without Sales Charges) as of 10/31/11 | |
| | | One Year | | | Five Years | | | Ten Years | | | Since Inception | |
Class A | | | 5.90 | % | | | 10.55 | % | | | N/A | | | | 47.99% (4/12/04) | |
Class B | | | 5.14 | | | | 6.62 | | | | N/A | | | | 39.87 (4/12/04) | |
Class C | | | 5.07 | | | | 6.46 | | | | 98.49 | % | | | — | |
Class L | | | 5.77 | | | | 9.19 | | | | 108.64 | | | | — | |
Class M | | | 5.97 | | | | 10.32 | | | | 105.57 | | | | — | |
Class Q | | | N/A | | | | N/A | | | | N/A | | | | –3.79 (1/18/11) | |
Class X | | | 6.01 | | | | 11.25 | | | | 108.97 | | | | — | |
Class Z | | | 6.26 | | | | 12.18 | | | | N/A | | | | 20.26 (11/28/05) | |
Russell Midcap Value Index | | | 5.83 | | | | 3.72 | | | | 131.64 | | | | — | |
Russell Midcap Index | | | 7.85 | | | | 11.82 | | | | 122.99 | | | | — | |
S&P MidCap 400 Index | | | 8.55 | | | | 21.74 | | | | 124.56 | | | | — | |
Lipper Average | | | 4.19 | | | | 2.62 | | | | 112.89 | | | | — | |
| | |
| 2 | | Visit our website at www.prudentialfunds.com |
| | | | | | | | | | | | | | | | |
Average Annual Total Returns (With Sales Charges) as of 9/30/11 | |
| | | One Year | | | Five Years | | | Ten Years | | | Since Inception | |
Class A | | | –7.32 | % | | | –0.38 | % | | | N/A | | | | 2.96% (4/12/04) | |
Class B | | | –7.50 | | | | –0.09 | | | | N/A | | | | 2.98 (4/12/04) | |
Class C | | | –3.61 | | | | 0.03 | | | | 5.74 | % | | | — | |
Class L | | | –7.74 | | | | –0.67 | | | | 5.62 | | | | — | |
Class M | | | –7.70 | | | | 0.45 | | | | 6.10 | | | | — | |
Class Q | | | N/A | | | | N/A | | | | N/A | | | | N/A (1/18/11) | |
Class X | | | –7.78 | | | | 0.51 | | | | 6.26 | | | | — | |
Class Z | | | –1.60 | | | | 1.08 | | | | N/A | | | | 1.16 (11/28/05) | |
Russell Midcap Value Index | | | –2.36 | | | | –0.84 | | | | 7.54 | | | | — | |
Russell Midcap Index | | | –0.88 | | | | 0.56 | | | | 7.45 | | | | — | |
S&P MidCap 400 Index | | | –1.28 | | | | 2.20 | | | | 7.50 | | | | — | |
Lipper Average | | | –4.84 | | | | –1.38 | | | | 6.60 | | | | — | |
| | | | | | | | | | | | | | | | |
Average Annual Total Returns (With Sales Charges) as of 10/31/11 | |
| | | One Year | | | Five Year | | | Ten Years | | | Since Inception | |
Class A | | | 0.08 | % | | | 0.88 | % | | | N/A | | | | 4.54% (4/12/04) | |
Class B | | | 0.14 | | | | 1.15 | | | | N/A | | | | 4.54 (4/12/04) | |
Class C | | | 4.07 | | | | 1.26 | | | | 7.10 | % | | | — | |
Class L | | | –0.31 | | | | 0.57 | | | | 7.00 | | | | — | |
Class M | | | –0.03 | | | | 1.71 | | | | 7.47 | | | | — | |
Class Q | | | N/A | | | | N/A | | | | N/A | | | | N/A (1/18/11) | |
Class X | | | 0.01 | | | | 1.75 | | | | 7.65 | | | | — | |
Class Z | | | 6.26 | | | | 2.33 | | | | N/A | | | | 3.16 (11/28/05) | |
| | | | | | | | | | | | | | | | |
Average Annual Total Returns (Without Sales Charges) as of 10/31/11 | |
| | | One Year | | | Five Years | | | Ten Years | | | Since Inception | |
Class A | | | 5.90 | % | | | 2.03 | % | | | N/A | | | | 5.33% (4/12/04) | |
Class B | | | 5.14 | | | | 1.29 | | | | N/A | | | | 4.54 (4/12/04) | |
Class C | | | 5.07 | | | | 1.26 | | | | 7.10 | % | | | — | |
Class L | | | 5.77 | | | | 1.77 | | | | 7.63 | | | | — | |
Class M | | | 5.97 | | | | 1.98 | | | | 7.47 | | | | — | |
Class Q | | | N/A | | | | N/A | | | | N/A | | | | N/A (1/18/11) | |
Class X | | | 6.01 | | | | 2.16 | | | | 7.65 | | | | — | |
Class Z | | | 6.26 | | | | 2.33 | | | | N/A | | | | 3.16 (11/28/05) | |
| | | | |
| Prudential Mid-Cap Value Fund | | | 3 | |
Your Fund’s Performance (continued)
Growth of a $10,000 Investment
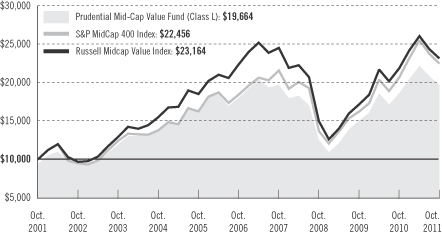
The graph compares a $10,000 investment in the Prudential Mid-Cap Value Fund (Class L shares) with a similar investment in the S&P MidCap 400 Index and Russell Midcap Value Index by portraying the initial account values at the beginning of the 10-year period for Class L shares (October 31, 2001) and the account values at the end of the current fiscal year (October 31, 2011) as measured on a quarterly basis. The Russell Midcap Value Index data is measured from the closest month-end to inception date and not from the Fund’s actual inception date. For purposes of the graph, and unless otherwise indicated, it has been assumed that (a) the maximum applicable front-end sales charge was deducted from the initial $10,000 investment in Class L shares; (b) all recurring fees (including management fees) were deducted; and (c) all dividends and distributions were reinvested. The line graph provides information for Class L shares only. As indicated in the tables above, performance for Class A, Class B, Class C, Class M, Class Q, Class X, and Class Z shares will vary due to the differing charges and expenses applicable to each share class (as indicated in the following paragraphs).
Total returns and the ending account values in the graph include changes in share price and reinvestment of dividends and capital gains distributions in a hypothetical investment for the periods shown. The Fund’s total returns do not reflect the deduction of income taxes on an individual’s investment. Taxes may reduce your actual investment returns on income or gains paid by the Fund or any gains you may realize if you sell your shares.
Source: Prudential Investments LLC and Lipper Inc. Performance figures may reflect fee waivers and/or expense reimbursements. In the absence of such fee waivers and/or expense reimbursements, total returns would be lower.
Inception returns are provided for any share class with less than 10 calendar years of returns.
The average annual total returns take into account applicable sales charges. Class A and Class L shares are subject to a maximum front-end sales charge of 5.50% and 5.75%, respectively. Under certain limited
| | |
| 4 | | Visit our website at www.prudentialfunds.com |
circumstances, an exchange may be made from Class A to Class Z shares of the Fund. In addition, under certain limited circumstances, an exchange may be made from Class Z to Class A or Class Q shares of the Fund. Class L, Class M, and Class X shares are closed to most new purchases (with the exception of reinvested dividends and purchases by certain college savings plans). Under certain circumstances, Class A and Class L shares may be subject to a contingent deferred sales charge (CDSC) of 1%. Class B, Class C, Class M, and Class X shares are subject to a maximum CDSC of 5%, 1%, 6%, and 6%, respectively. Class A shares are subject to a 12b-1 fee of up to 0.30% annually. Class B, Class C, Class M, and Class X shares are subject to a 12b-1 fee of 1%. Class L shares are subject to a 12b-1 fee of 0.50%. Class Q shares and Class Z shares are not subject to a sales charge or a 12b-1 fee. Prior to April 12, 2004, Class L shares were known as Class A shares. On April 12, 2004, Class A shares were redesignated as Class L shares and a new Class A was opened. Prior to April 12, 2004, Class M shares were known as Class B shares. On April 12, 2004, Class B shares were redesignated as Class M shares and a new Class B was opened. The returns in the tables and graph do not reflect the deduction of taxes that a shareholder would pay on Fund distributions or following the redemption of Fund shares. Without a distribution and service (12b-1) fee waiver of 0.05% for Class A shares, the returns shown in the tables would have been lower.
Benchmark Definitions
Russell Midcap Value Index
The Russell Midcap Value Index is an unmanaged index which measures the performance of those Russell Midcap companies with lower price-to-book ratios and lower forecasted growth values. The stocks are also members of the Russell 1000 Value Index. Russell Midcap Value Index Closest Month-End to Inception cumulative total returns as of 10/31/11 are 58.17% for Class A and Class B; –4.25% for Class Q; and 20.74% for Class Z. Russell Midcap Value Index Closest Month-End to Inception average annual total returns as of 9/30/11 are 4.64% for Class A and Class B; and 1.21% for Class Z. Class Q shares have been in existence for less than one year and have no average annual total return performance information available.
Russell Midcap Index
The Russell Midcap Index is an unmanaged index which measures the performance of the 800 smallest companies in the Russell 1000 Index, which represent approximately 25% of the total market capitalization of the Russell 1000 Index. Russell Midcap Index Closest Month-End to Inception cumulative total returns as of 10/31/11 are 60.26% for Class A and Class B; –3.00% for Class Q; and 25.71% for Class Z. Russell Midcap Index Closest Month-End to Inception average annual total returns as of 9/30/11 are 4.77% for Class A and Class B; and 1.84% for Class Z. Class Q shares have been in existence for less than one year and have no average annual total return performance information available.
Standard & Poor’s MidCap 400 Stock Index
The Standard & Poor’s MidCap 400 Stock Index (S&P MidCap 400 Index) is an unmanaged index of 400 domestic stocks chosen for market capitalization, liquidity, and industry group representation. It gives a broad look at how U.S. mid-cap stock prices have performed. S&P MidCap 400 Index Closest Month-End to Inception cumulative total returns as of 10/31/11 are 63.16% for Class A and Class B; –3.00% for Class Q; and 31.65% for Class Z. S&P MidCap 400 Index Closest Month-End to Inception average annual total returns as of 9/30/11 are 4.93% for Class A and Class B; and 2.54% for Class Z. Class Q shares have been in existence for less than one year and have no average annual total return performance information available.
Lipper Mid-Cap Value Funds Average
Funds in the Lipper Mid-Cap Value Funds Average (Lipper Average), by portfolio practice, invest at least 75% of their equity assets in companies with market capitalizations (on a three-year weighted basis) less than 300% of
| | | | |
| Prudential Mid-Cap Value Fund | | | 5 | |
Your Fund’s Performance (continued)
the dollar-weighted median market capitalization of the middle 1,000 securities of the S&P SuperComposite 1500 Index. Mid-cap value funds typically have a below-average price-to-earnings ratio, price-to-book ratio, and three-year sales-per-share growth value compared with the companies in the S&P MidCap 400 Index. Lipper Average Closest Month-End to Inception cumulative total returns as of 10/31/11 are 42.36% for Class A and Class B; –6.26% for Class Q; and 14.73% for Class Z. Lipper Average Closest Month-End to Inception average annual total returns as of 9/30/11 are 2.86% for Class A and Class B; and 0.01% for Class Z. Class Q shares have been in existence for less than one year and have no average annual total return performance information available.
Investors cannot invest directly in an index or average. The returns for the indexes would be lower if they included the effects of sales charges, operating expenses of a mutual fund, or taxes. Returns for the Lipper Average reflect the deduction of operating expenses, but not sales charges or taxes.
| | | | |
Five Largest Holdings expressed as a percentage of net assets as of 10/31/11 | | | | |
Valero Energy Corp., Oil, Gas & Consumable Fuels | | | 1.5 | % |
Humana, Inc., Healthcare Providers & Services | | | 1.4 | |
iShares Russell Midcap Value Index Fund, Exchange Traded Fund | | | 1.2 | |
Annaly Capital Management, Inc., Real Estate Investment Trusts | | | 1.2 | |
PPL Corp., Electric Utilities | | | 1.1 | |
| | |
| 6 | | Visit our website at www.prudentialfunds.com |
Strategy and Performance Overview
How did the Fund perform?
Prudential Mid-Cap Value Fund Class L shares returned 5.77% for the 12-month reporting period ended October 31, 2011, slightly underperforming the 5.83% gain of the benchmark, the Russell Midcap® Value Index (the Index). However, the Class L shares outperformed the Lipper Mid-Cap Value Funds Average, which rose 4.19%.
How is the Fund managed?
Quantitative Management Associates LLC (QMA) manages the Fund, which invests in a diversified portfolio of mid-cap stocks that QMA believes are attractively priced when evaluated using quantitative measures such as price-to-earnings (P/E) ratios. Although the strategy emphasizes attractive valuations, QMA also considers other quantifiable characteristics. Historically, value stocks have outperformed broad stock market averages. Constraints are placed on the portfolio with regard to sector, industry, and individual security weighting to reduce risk relative to the Index.
What were conditions like in the mid-cap segment of the U.S. stock market?
Along with the broader equity market, prices of stocks of medium-size companies went on a rollercoaster ride during the period that began November 1, 2010.
| | • | | The Index posted gains for each of the first six months of the period. Early on, stock prices rose as the Federal Reserve launched a new bond-buying program, quantitative easing II (QE2), which aimed to help boost economic growth in the United States. Also, President Obama and Congress reached a deal in December that extended the Bush tax cuts, extended unemployment benefits, and reduced payroll taxes. Better-than-expected global economic data also encouraged investment in stocks. |
| | • | | The market rally initially continued during 2011, despite shocks such as regime change in North Africa and the Middle East and a powerful earthquake, tsunami, and nuclear disaster in Japan during March. Data suggested the U.S. economic recovery remained on track, even though the housing market remained weak and job growth remained sluggish. |
| | • | | But beginning in May, the broader stock market and the Index suffered five consecutive monthly losses. Higher energy prices, the tragedy in Japan, a renewed flare-up in a European sovereign-debt crisis, and extreme weather in the United States took a toll on U.S. economic growth. During the summer, the global economy entered a dangerous phase with pronounced downside risk. Fears of a systemic shock to the world’s financial system increased as European authorities failed to contain the region’s debt crisis. The developed world faced a bleak outlook as the U.S. and U.K. economies risked double-dipping into recession and the euro zone economy also appeared headed for downturn. |
| | | | |
| Prudential Mid-Cap Value Fund | | | 7 | |
Strategy and Performance Overview (continued)
| | • | | Stocks, however, ended on a strong note. The Index scored a double-digit gain in October, driven largely by continued solid corporate earnings, what was then viewed as progress towards alleviating the European debt crisis, and data that suggested the U.S. economy was not sliding into a double-dip recession. |
| | • | | Stocks of medium-size companies slightly underperformed stocks of large companies for the period, as measured by Russell U.S. indexes. |
How did the stock market sectors perform?
Sectors in the Index turned in a mixed performance for the period.
| | • | | Utilities and consumer staples, two of the more defensive sectors, posted double-digit increases, the largest of the period. Energy, healthcare, and consumer discretionary delivered more modest double-digit gains, while industrials finished with a single-digit increase. |
| | • | | Telecommunications services posted a double-digit loss, the largest decline of the period. Information technology, financials, and materials also finished in the red. |
What aspects of sector allocation and stock selection contributed most to the Fund’s return?
Primary contributors to the Fund’s performance were its strong stock selection in the healthcare, utilities, and consumer discretionary sectors. It also had a smaller exposure than the Index to the financials sector, which was another key contributor to its results.
| | • | | Within the healthcare sector, the Fund benefited from holding Kinetic Concepts, a maker of wound-care products that agreed to be acquired by a consortium led by Apax Partners. Not holding the stock of Boston Scientific, a manufacturer of cardiovascular devices, also aided performance, as the firm struggled with recurring product recalls and a poor competitive position relative to peers. |
| | • | | The Fund was also aided by its larger-than-benchmark exposure to managed care companies, including Humana, Coventry Health Care, and Aetna. Investors appear to believe the new regulatory environment will not be as onerous as previously expected. Humana stock performed well due to the Medicare-focused managed care company’s consensus-beating earnings, an increase in its stock buyback plans, and the establishment of its first quarterly dividend. |
| | • | | An overweight and favorable stock selection among utilities, the best-performing sector during the period, also contributed to results. The stocks of |
| | |
| 8 | | Visit our website at www.prudentialfunds.com |
| | diversified and regulated utilities, including NiSource, CenterPoint Energy, and ONEOK benefited from their relatively stable earnings growth and attractive dividend yields in the current low-interest-rate environment. |
| | • | | Strong stock selection within the consumer discretionary sector also aided results. Among consumer service stocks, Weight Watchers International was a standout as its stock more than doubled during the period. The firm’s successful marketing and new Points Plus diet plan are delivering strong growth globally. Within media, a larger-than-benchmark exposure to McGraw-Hill aided performance, as a decision to split into two companies was received favorably by investors. |
| | • | | The Fund’s performance was aided by its smaller-than-benchmark exposure to financials, especially commercial banks, which were battered during the period. Not holding Regions Financial and SunTrust Banks were key contributors as the two banks’ earnings and capital levels are being pressured by the prolonged decline in real estate prices in the Southeast and by the ongoing low-interest-rate environment. Among insurance companies, not holding Genworth Financial, whose primary businesses include long-term care and mortgage insurance, also helped performance. Elevated mortgage delinquencies, inadequate pricing on portions of the long-term care business, and ongoing low interest rates are pressuring the company’s earnings and capital position. |
What aspects of sector allocation and stock selection subtracted most from the return?
Primary detractors from the Fund’s performance were its larger-than-benchmark exposure to telecommunications (the worst-performing sector of the period) and poor stock selection in the information technology sector.
| | • | | In telecommunications, larger-than-benchmark exposure to wireless carriers, especially NII Holdings and Metro PCS Communications, penalized results. Earnings estimates were reduced for NII, a provider of mobile communications for business customers in Latin America. This reflected the highly competitive environment in Brazil and Mexico, as well as NII’s ever-increasing spending on infrastructure and expected foreign-exchange losses from a sharp deterioration in Latin American currencies versus the U.S. dollar. No less competitive, stocks of stand-alone domestic wireless carriers also fell, including Metro PCS. Its near-term earnings estimates declined sharply due to increases in capital spending, higher customer retention costs, and other economic headwinds. |
| | • | | In information technology, not holding Motorola Mobility (the mobile devices and cable-box business of the former Motorola) was the sector’s single largest |
| | | | |
| Prudential Mid-Cap Value Fund | | | 9 | |
Strategy and Performance Overview (continued)
| | detractor from performance. Motorola Mobility stock soared after Google offered to buy the company at an attractive premium. A larger-than-benchmark exposure to Xerox also hurt results. Apparently, investors were disappointed by Xerox management’s reduced guidance for near-term cash flow, sub-par equipment installations, and slow progress on growing its services business. |
| | • | | The Fund’s holding in Computer Sciences, an investment technology services firm with a major exposure to government spending, also penalized its results. Three matters continue to weigh on the stock: the early termination of a major government contract in the United Kingdom, depressed federal government spending, and an investigation by the Securities and Exchange Commission into accounting issues in one of the firm’s divisions. |
| | |
| 10 | | Visit our website at www.prudentialfunds.com |
Fees and Expenses (Unaudited)
As a shareholder of the Fund, you incur two types of costs: (1) transaction costs, including sales charges (loads) on purchase payments and redemptions, as applicable, and (2) ongoing costs, including management fees, distribution and/or service (12b-1) fees, and other Fund expenses, as applicable. This example is intended to help you understand your ongoing costs (in dollars) of investing in the Fund and to compare these costs with the ongoing costs of investing in other mutual funds.
The example is based on an investment of $1,000 invested on May 1, 2011, at the beginning of the period, and held through the six-month period ended October 31, 2011. The example is for illustrative purposes only; you should consult the Prospectus for information on initial and subsequent minimum investment requirements.
The Fund’s transfer agent may charge additional fees to holders of certain accounts that are not included in the expenses shown in the table on the following page. These fees apply to individual retirement accounts (IRAs) and Section 403(b) accounts. As of the close of the six-month period covered by the table, IRA fees included an annual maintenance fee of $15 per account (subject to a maximum annual maintenance fee of $25 for all accounts held by the same shareholder). Section 403(b) accounts are charged an annual $25 fiduciary maintenance fee. Some of the fees may vary in amount, or may be waived, based on your total account balance or the number of Prudential Investments funds, including the Fund, that you own. You should consider the additional fees that were charged to your Fund account over the six-month period when you estimate the total ongoing expenses paid over the period and the impact of these fees on your ending account value, as these additional expenses are not reflected in the information provided in the expense table. Additional fees have the effect of reducing investment returns.
Actual Expenses
The first line for each share class in the table on the following page provides information about actual account values and actual expenses. You may use the information on this line, together with the amount you invested, to estimate the expenses that you paid over the period. Simply divide your account value by $1,000 (for example, an $8,600 account value ÷ $1,000 = 8.6), then multiply the result by the number on the first line under the heading “Expenses Paid During the Six-Month Period” to estimate the expenses you paid on your account during this period.
Hypothetical Example for Comparison Purposes
The second line for each share class in the table on the following page provides information about hypothetical account values and hypothetical expenses based on the Fund’s actual expense ratio and an assumed rate of return of 5% per year before expenses, which is not the Fund’s actual return. The hypothetical account values and
| | | | |
| Prudential Mid-Cap Value Fund | | | 11 | |
Fees and Expenses (continued)
expenses may not be used to estimate the actual ending account balance or expenses you paid for the period. You may use this information to compare the ongoing costs of investing in the Fund and other funds. To do so, compare this 5% hypothetical example with the 5% hypothetical examples that appear in the shareholder reports of the other funds.
Please note that the expenses shown in the table are meant to highlight your ongoing costs only and do not reflect any transactional costs such as sales charges (loads). Therefore, the second line for each share class in the table is useful in comparing ongoing costs only and will not help you determine the relative total costs of owning different funds. In addition, if these transactional costs were included, your costs would have been higher.
| | | | | | | | | | | | | | | | | | |
Prudential Mid-Cap
Value Fund | | Beginning Account
Value
May 1, 2011 | | | Ending Account
Value
October 31, 2011 | | | Annualized
Expense Ratio
Based on the
Six-Month Period | | | Expenses Paid
During the
Six-Month Period* | |
| | | | | | | | | | | | | | | | | | |
| Class A | | Actual | | $ | 1,000.00 | | | $ | 886.50 | | | | 1.63 | % | | $ | 7.75 | |
| | | Hypothetical | | $ | 1,000.00 | | | $ | 1,016.99 | | | | 1.63 | % | | $ | 8.29 | |
| | | | | | | | | | | | | | | | | | |
| Class B | | Actual | | $ | 1,000.00 | | | $ | 882.60 | | | | 2.38 | % | | $ | 11.29 | |
| | | Hypothetical | | $ | 1,000.00 | | | $ | 1,013.21 | | | | 2.38 | % | | $ | 12.08 | |
| | | | | | | | | | | | | | | | | | |
| Class C | | Actual | | $ | 1,000.00 | | | $ | 882.90 | | | | 2.38 | % | | $ | 11.30 | |
| | | Hypothetical | | $ | 1,000.00 | | | $ | 1,013.21 | | | | 2.38 | % | | $ | 12.08 | |
| | | | | | | | | | | | | | | | | | |
| Class L | | Actual | | $ | 1,000.00 | | | $ | 885.80 | | | | 1.88 | % | | $ | 8.94 | |
| | | Hypothetical | | $ | 1,000.00 | | | $ | 1,015.73 | | | | 1.88 | % | | $ | 9.55 | |
| | | | | | | | | | | | | | | | | | |
| Class M | | Actual | | $ | 1,000.00 | | | $ | 886.30 | | | | 1.63 | % | | $ | 7.75 | |
| | | Hypothetical | | $ | 1,000.00 | | | $ | 1,016.99 | | | | 1.63 | % | | $ | 8.29 | |
| | | | | | | | | | | | | | | | | | |
| Class Q | | Actual | | $ | 1,000.00 | | | $ | 888.00 | | | | 1.15 | % | | $ | 5.47 | |
| | | Hypothetical | | $ | 1,000.00 | | | $ | 1,019.41 | | | | 1.15 | % | | $ | 5.85 | |
| | | | | | | | | | | | | | | | | | |
| Class X | | Actual | | $ | 1,000.00 | | | $ | 886.30 | | | | 1.63 | % | | $ | 7.75 | |
| | | Hypothetical | | $ | 1,000.00 | | | $ | 1,016.99 | | | | 1.63 | % | | $ | 8.29 | |
| | | | | | | | | | | | | | | | | | |
| Class Z | | Actual | | $ | 1,000.00 | | | $ | 887.30 | | | | 1.38 | % | | $ | 6.56 | |
| | | Hypothetical | | $ | 1,000.00 | | | $ | 1,018.25 | | | | 1.38 | % | | $ | 7.02 | |
* Fund expenses (net of fee waivers or subsidies, if any) for each share class are equal to the annualized expense ratio for each share class (provided in the table), multiplied by the average account value over the period, multiplied by the 184 days in the six-month period ended October 31, 2011, and divided by 365 days. Expenses presented in the table include the expenses of any underlying portfolios in which the Fund may invest.
| | |
| 12 | | Visit our website at www.prudentialfunds.com |
Portfolio of Investments
as of October 31, 2011
| | | | | | |
| Shares | | Description | | Value (Note 2) | |
| | | | | | |
LONG-TERM INVESTMENTS 99.5% | | | | |
COMMON STOCKS 98.3% | | | | |
| |
Aerospace & Defense 2.6% | | | | |
| 9,500 | | Alliant Techsystems, Inc. | | $ | 551,760 | |
| 21,900 | | ITT Corp. | | | 998,640 | |
| 17,800 | | L-3 Communications Holdings, Inc. | | | 1,206,484 | |
| 31,700 | | Textron, Inc. | | | 615,614 | |
| | | | | | |
| | | | | 3,372,498 | |
| |
Airlines 0.6% | | | | |
| 10,400 | | Delta Air Lines, Inc.* | | | 88,608 | |
| 52,700 | | Southwest Airlines Co. | | | 450,585 | |
| 12,000 | | United Continental Holdings, Inc.*(a) | | | 231,840 | |
| | | | | | |
| | | | | 771,033 | |
| |
Auto Components 1.0% | | | | |
| 9,200 | | Autoliv, Inc.(a) | | | 531,484 | |
| 13,600 | | Federal-Mogul Corp.* | | | 229,296 | |
| 12,100 | | TRW Automotive Holdings Corp.* | | | 509,410 | |
| | | | | | |
| | | | | 1,270,190 | |
| |
Auto Parts & Equipment 0.4% | | | | |
| 10,400 | | Lear Corp. | | | 487,864 | |
| |
Beverages 0.9% | | | | |
| 37,400 | | Constellation Brands, Inc. (Class A Stock)* | | | 756,228 | |
| 9,300 | | Molson Coors Brewing Co. (Class B Stock) | | | 393,762 | |
| | | | | | |
| | | | | 1,149,990 | |
| |
Capital Markets 1.8% | | | | |
| 25,200 | | Ameriprise Financial, Inc. | | | 1,176,336 | |
| 16,900 | | E*Trade Financial Corp.* | | | 183,365 | |
| 48,800 | | Janus Capital Group, Inc. | | | 320,128 | |
| 22,600 | | Raymond James Financial, Inc. | | | 686,362 | |
| | | | | | |
| | | | | 2,366,191 | |
| |
Chemicals 1.2% | | | | |
| 12,200 | | Ashland, Inc. | | | 646,112 | |
| 3,300 | | CF Industries Holdings, Inc. | | | 535,491 | |
| 1,300 | | Cytec Industries, Inc. | | | 58,071 | |
| 4,000 | | PPG Industries, Inc. | | | 345,640 | |
| | | | | | |
| | | | | 1,585,314 | |
See Notes to Financial Statements.
| | | | |
| Prudential Mid-Cap Value Fund | | | 13 | |
Portfolio of Investments
as of October 31, 2011 continued
| | | | | | |
| Shares | | Description | | Value (Note 2) | |
| | | | | | |
COMMON STOCKS (Continued) | | | | |
| |
Commercial Banks 5.0% | | | | |
| 13,600 | | Bank of Hawaii Corp.(a) | | $ | 574,328 | |
| 9,200 | | BOK Financial Corp. | | | 480,424 | |
| 2,600 | | Comerica, Inc. | | | 66,430 | |
| 17,745 | | Commerce Bancshares, Inc. | | | 688,506 | |
| 118,000 | | Fifth Third Bancorp | | | 1,417,180 | |
| 1,500 | | First Citizens BancShares, Inc. (Class A Stock) | | | 244,575 | |
| 73,900 | | Huntington Bancshares, Inc. | | | 382,802 | |
| 148,600 | | KeyCorp | | | 1,049,116 | |
| 14,500 | | M&T Bank Corp.(a) | | | 1,103,595 | |
| 44,800 | | TCF Financial Corp. | | | 476,672 | |
| | | | | | |
| | | | | 6,483,628 | |
| |
Commercial Services & Supplies 1.3% | | | | |
| 24,500 | | Corrections Corp. of America* | | | 544,635 | |
| 24,200 | | Pitney Bowes, Inc.(a) | | | 493,196 | |
| 39,500 | | RR Donnelley & Sons Co.(a) | | | 643,850 | |
| | | | | | |
| | | | | 1,681,681 | |
| |
Communications Equipment 0.8% | | | | |
| 17,100 | | EchoStar Corp. (Class A Stock)* | | | 450,756 | |
| 15,900 | | Harris Corp.(a) | | | 600,225 | |
| | | | | | |
| | | | | 1,050,981 | |
| |
Computers 0.8% | | | | |
| 20,300 | | SanDisk Corp.* | | | 1,028,601 | |
| |
Computers & Peripherals 2.2% | | | | |
| 14,600 | | Diebold, Inc. | | | 471,288 | |
| 21,700 | | Lexmark International, Inc. (Class A Stock)*(a) | | | 687,890 | |
| 41,000 | | Seagate Technology PLC (Ireland) | | | 662,150 | |
| 38,100 | | Western Digital Corp.* | | | 1,014,984 | |
| | | | | | |
| | | | | 2,836,312 | |
| |
Construction & Engineering 0.6% | | | | |
| 22,400 | | URS Corp.* | | | 799,680 | |
| |
Consumer Finance 1.7% | | | | |
| 49,100 | | Discover Financial Services | | | 1,156,796 | |
| 73,300 | | SLM Corp. | | | 1,002,011 | |
| | | | | | |
| | | | | 2,158,807 | |
See Notes to Financial Statements.
| | |
| 14 | | Visit our website at www.prudentialfunds.com |
| | | | | | |
| Shares | | Description | | Value (Note 2) | |
| | | | | | |
COMMON STOCKS (Continued) | | | | |
| |
Containers & Packaging 0.9% | | | | |
| 23,300 | | Owens-Illinois, Inc.* | | $ | 467,864 | |
| 37,900 | | Sealed Air Corp. | | | 674,620 | |
| | | | | | |
| | | | | 1,142,484 | |
| |
Diversified Consumer Services 1.1% | | | | |
| 5,700 | | Apollo Group, Inc. (Class A Stock)* | | | 269,895 | |
| 37,800 | | H&R Block, Inc. | | | 577,962 | |
| 59,700 | | Service Corp. International | | | 597,000 | |
| | | | | | |
| | | | | 1,444,857 | |
| |
Diversified Financial Services 1.5% | | | | |
| 26,100 | | Leucadia National Corp. | | | 700,263 | |
| 33,400 | | NASDAQ OMX Group, Inc. (The)* | | | 836,670 | |
| 14,300 | | NYSE Euronext, Inc. | | | 379,951 | |
| | | | | | |
| | | | | 1,916,884 | |
| |
Diversified Telecommunication Services 1.6% | | | | |
| 20,491 | | CenturyLink, Inc. | | | 722,513 | |
| 91,600 | | Frontier Communications Corp. | | | 573,416 | |
| 67,800 | | Windstream Corp. | | | 825,126 | |
| | | | | | |
| | | | | 2,121,055 | |
| |
Electric Utilities 5.9% | | | | |
| 8,000 | | American Electric Power Co., Inc. | | | 314,240 | |
| 31,300 | | Edison International | | | 1,270,780 | |
| 16,100 | | Entergy Corp. | | | 1,113,637 | |
| 12,240 | | FirstEnergy Corp. | | | 550,310 | |
| 4,300 | | Great Plains Energy, Inc. | | | 89,182 | |
| 11,000 | | Northeast Utilities | | | 380,270 | |
| 31,200 | | NV Energy, Inc. | | | 500,448 | |
| 22,100 | | Pepco Holdings, Inc. | | | 437,580 | |
| 8,800 | | Pinnacle West Capital Corp. | | | 401,104 | |
| 50,300 | | PPL Corp. | | | 1,477,311 | |
| 13,900 | | Progress Energy, Inc. | | | 724,190 | |
| 12,700 | | Wisconsin Energy Corp. | | | 411,861 | |
| | | | | | |
| | | | | 7,670,913 | |
| |
Electronic Equipment, Instruments & Components 0.6% | | | | |
| 1,100 | | Itron, Inc.* | | | 40,469 | |
| 8,200 | | Tech Data Corp.* | | | 403,276 | |
See Notes to Financial Statements.
| | | | |
| Prudential Mid-Cap Value Fund | | | 15 | |
Portfolio of Investments
as of October 31, 2011 continued
| | | | | | |
| Shares | | Description | | Value (Note 2) | |
| | | | | | |
COMMON STOCKS (Continued) | | | | |
| |
Electronic Equipment, Instruments & Components (cont’d.) | | | | |
| 27,200 | | Vishay Intertechnology, Inc.* | | $ | 292,400 | |
| | | | | | |
| | | | | 736,145 | |
| |
Energy Equipment & Services 3.5% | | | | |
| 15,700 | | Atwood Oceanics, Inc.* | | | 671,018 | |
| 10,300 | | Diamond Offshore Drilling, Inc. | | | 675,062 | |
| 4,600 | | Helmerich & Payne, Inc.(a) | | | 244,628 | |
| 71,700 | | Nabors Industries Ltd. (Bermuda)* | | | 1,314,261 | |
| 17,300 | | Rowan Cos., Inc.* | | | 596,677 | |
| 7,700 | | SEACOR Holdings, Inc.(a) | | | 655,655 | |
| 12,700 | | Superior Energy Services, Inc.*(a) | | | 357,124 | |
| | | | | | |
| | | | | 4,514,425 | |
| |
Environmental Control | | | | |
| 800 | | Republic Services, Inc. | | | 22,768 | |
| |
Financial - Bank & Trust 0.3% | | | | |
| 49,000 | | First Niagara Financial Group, Inc. | | | 450,310 | |
| |
Financial Services | | | | |
| 1,100 | | Interactive Brokers Group, Inc. (Class A Stock) | | | 16,918 | |
| |
Food & Staples Retailing 1.6% | | | | |
| 20,800 | | Kroger Co. (The) | | | 482,144 | |
| 54,300 | | Safeway, Inc. | | | 1,051,791 | |
| 72,600 | | SUPERVALU, Inc.(a) | | | 582,252 | |
| | | | | | |
| | | | | 2,116,187 | |
| |
Food Products 2.4% | | | | |
| 47,800 | | ConAgra Foods, Inc. | | | 1,210,774 | |
| 44,600 | | Dean Foods Co.* | | | 433,512 | |
| 30,400 | | Smithfield Foods, Inc.*(a) | | | 694,944 | |
| 43,600 | | Tyson Foods, Inc. (Class A Stock) | | | 841,480 | |
| | | | | | |
| | | | | 3,180,710 | |
| |
Gas Utilities 2.7% | | | | |
| 27,600 | | Atmos Energy Corp. | | | 947,232 | |
| 15,500 | | Energen Corp. | | | 760,430 | |
| 9,200 | | ONEOK, Inc. | | | 699,660 | |
| 30,700 | | Questar Corp. | | | 591,589 | |
See Notes to Financial Statements.
| | |
| 16 | | Visit our website at www.prudentialfunds.com |
| | | | | | |
| Shares | | Description | | Value (Note 2) | |
| | | | | | |
COMMON STOCKS (Continued) | | | | |
| |
Gas Utilities (cont’d.) | | | | |
| 18,500 | | UGI Corp. | | $ | 530,395 | |
| | | | | | |
| | | | | 3,529,306 | |
| |
Healthcare Equipment & Services | | | | |
| 1,000 | | Universal Health Services, Inc. (Class B Stock) | | | 39,970 | |
| |
Healthcare Equipment & Supplies 0.2% | | | | |
| 3,900 | | Teleflex, Inc. | | | 233,454 | |
| |
Healthcare Providers & Services 4.7% | | | | |
| 11,400 | | Aetna, Inc. | | | 453,264 | |
| 30,100 | | CIGNA Corp. | | | 1,334,634 | |
| 20,100 | | Community Health Systems, Inc.* | | | 351,348 | |
| 28,100 | | Coventry Health Care, Inc.* | | | 893,861 | |
| 22,000 | | Humana, Inc. | | | 1,867,580 | |
| 15,100 | | LifePoint Hospitals, Inc.* | | | 583,766 | |
| 20,800 | | Omnicare, Inc.(a) | | | 620,256 | |
| | | | | | |
| | | | | 6,104,709 | |
| |
Healthcare Services 0.2% | | | | |
| 5,400 | | Quest Diagnostics, Inc. | | | 301,320 | |
| |
Hotels, Restaurants & Leisure 1.1% | | | | |
| 4,100 | | Penn National Gaming, Inc.* | | | 147,600 | |
| 21,100 | | Royal Caribbean Cruises Ltd. (Liberia) | | | 627,092 | |
| 18,600 | | Wyndham Worldwide Corp. | | | 626,262 | |
| | | | | | |
| | | | | 1,400,954 | |
| |
Household Durables 1.1% | | | | |
| 4,000 | | Jarden Corp. | | | 128,120 | |
| 43,900 | | Newell Rubbermaid, Inc. | | | 649,720 | |
| 14,000 | | Whirlpool Corp.(a) | | | 711,340 | |
| | | | | | |
| | | | | 1,489,180 | |
| |
Independent Power Producers & Energy Traders 1.6% | | | | |
| 99,800 | | AES Corp. (The)* | | | 1,119,756 | |
| 45,100 | | NRG Energy, Inc.* | | | 966,042 | |
| | | | | | |
| | | | | 2,085,798 | |
See Notes to Financial Statements.
| | | | |
| Prudential Mid-Cap Value Fund | | | 17 | |
Portfolio of Investments
as of October 31, 2011 continued
| | | | | | |
| Shares | | Description | | Value (Note 2) | |
| | | | | | |
COMMON STOCKS (Continued) | | | | |
| |
Insurance 9.4% | | | | |
| 14,700 | | Allied World Assurance Co. Holdings AG (Switzerland) | | $ | 854,070 | |
| 28,400 | | American Financial Group, Inc. | | | 1,017,572 | |
| 11,200 | | Aon Corp. | | | 522,144 | |
| 27,500 | | Arch Capital Group Ltd. (Bermuda)* | | | 989,175 | |
| 28,300 | | Cincinnati Financial Corp. | | | 819,002 | |
| 7,700 | | CNA Financial Corp. | | | 204,820 | |
| 10,600 | | Endurance Specialty Holdings Ltd. (Bermuda) | | | 394,320 | |
| 37,800 | | Fidelity National Financial, Inc. (Class A Stock) | | | 583,632 | |
| 45,700 | | Hartford Financial Services Group, Inc. (The) | | | 879,725 | |
| 27,600 | | HCC Insurance Holdings, Inc. | | | 734,436 | |
| 35,000 | | Lincoln National Corp. | | | 666,750 | |
| 1,700 | | Marsh & McLennan Cos., Inc. | | | 52,054 | |
| 35,800 | | Principal Financial Group, Inc.(a) | | | 922,924 | |
| 31,900 | | Progressive Corp. (The) | | | 606,419 | |
| 25,200 | | Protective Life Corp. | | | 468,720 | |
| 16,200 | | Reinsurance Group of America, Inc. | | | 846,126 | |
| 15,900 | | StanCorp Financial Group, Inc. | | | 539,646 | |
| 24,100 | | Unum Group | | | 574,544 | |
| 18,600 | | Validus Holdings Ltd. (Bermuda) | | | 508,896 | |
| | | | | | |
| | | | | 12,184,975 | |
| |
Internet 0.5% | | | | |
| 41,400 | | Liberty Media Holding Corp. - Interactive (Class A Stock)* | | | 680,202 | |
| |
Internet & Catalog Retail 0.2% | | | | |
| 11,300 | | Expedia, Inc. | | | 296,738 | |
| |
IT Services 2.1% | | | | |
| 22,400 | | Amdocs Ltd. (Guernsey)* | | | 672,448 | |
| 25,800 | | Computer Sciences Corp. | | | 811,668 | |
| 11,400 | | Convergys Corp.*(a) | | | 121,980 | |
| 11,800 | | DST Systems, Inc. | | | 592,242 | |
| 40,800 | | SAIC, Inc.*(a) | | | 507,144 | |
| | | | | | |
| | | | | 2,705,482 | |
| |
Machinery 1.2% | | | | |
| 10,100 | | CNH Global NV (Netherlands)* | | | 375,518 | |
| 16,700 | | Harsco Corp. | | | 384,935 | |
| 10,300 | | Navistar International Corp.* | | | 433,321 | |
| 16,200 | | Oshkosh Corp.* | | | 337,932 | |
| | | | | | |
| | | | | 1,531,706 | |
See Notes to Financial Statements.
| | |
| 18 | | Visit our website at www.prudentialfunds.com |
| | | | | | |
| Shares | | Description | | Value (Note 2) | |
| | | | | | |
COMMON STOCKS (Continued) | | | | |
| |
Media 1.8% | | | | |
| 21,800 | | CBS Corp. (Class B Stock) | | $ | 562,658 | |
| 29,400 | | DISH Network Corp. (Class A Stock)* | | | 710,598 | |
| 48,600 | | Gannett Co., Inc.(a) | | | 568,134 | |
| 1,300 | | Washington Post Co. (The) (Class B Stock)(a) | | | 442,208 | |
| | | | | | |
| | | | | 2,283,598 | |
| |
Multi-Line Retail 1.0% | | | | |
| 42,600 | | Macy’s, Inc.(a) | | | 1,300,578 | |
| |
Multi-Utilities 9.2% | | | | |
| 14,300 | | Alliant Energy Corp. | | | 583,154 | |
| 39,800 | | Ameren Corp. | | | 1,268,824 | |
| 47,100 | | CenterPoint Energy, Inc. | | | 981,564 | |
| 28,100 | | CMS Energy Corp. | | | 585,042 | |
| 17,700 | | Consolidated Edison, Inc. | | | 1,024,299 | |
| 23,000 | | DTE Energy Co. | | | 1,198,530 | |
| 28,900 | | MDU Resources Group, Inc. | | | 595,629 | |
| 49,000 | | NiSource, Inc. | | | 1,082,410 | |
| 17,000 | | OGE Energy Corp. | | | 879,580 | |
| 13,100 | | SCANA Corp. | | | 553,868 | |
| 23,800 | | Sempra Energy | | | 1,278,774 | |
| 11,100 | | TECO Energy, Inc.(a) | | | 206,127 | |
| 18,000 | | Vectren Corp. | | | 510,840 | |
| 46,200 | | Xcel Energy, Inc. | | | 1,194,270 | |
| | | | | | |
| | | | | 11,942,911 | |
| |
Office Electronics 1.1% | | | | |
| 168,700 | | Xerox Corp. | | | 1,379,966 | |
| |
Oil & Gas Exploration/Production | | | | |
| 4,654 | | Lone Pine Resources, Inc.* | | | 35,045 | |
| |
Oil, Gas & Consumable Fuels 5.8% | | | | |
| 33,400 | | El Paso Corp. | | | 835,334 | |
| 7,600 | | Forest Oil Corp.* | | | 88,616 | |
| 23,200 | | Frontline Ltd. (Bermuda)(a) | | | 120,640 | |
| 19,500 | | Murphy Oil Corp. | | | 1,079,715 | |
| 4,900 | | Noble Energy, Inc. | | | 437,766 | |
| 22,500 | | Plains Exploration & Production Co.* | | | 708,750 | |
| 28,100 | | Quicksilver Resources, Inc.* | | | 216,370 | |
| 23,500 | | Spectra Energy Corp. | | | 672,805 | |
See Notes to Financial Statements.
| | | | |
| Prudential Mid-Cap Value Fund | | | 19 | |
Portfolio of Investments
as of October 31, 2011 continued
| | | | | | |
| Shares | | Description | | Value (Note 2) | |
| | | | | | |
COMMON STOCKS (Continued) | | | | |
| |
Oil, Gas & Consumable Fuels (cont’d.) | | | | |
| 49,800 | | Tesoro Corp.* | | $ | 1,291,812 | |
| 1,700 | | Unit Corp.* | | | 83,402 | |
| 81,300 | | Valero Energy Corp. | | | 1,999,980 | |
| | | | | | |
| | | | | 7,535,190 | |
| |
Paper & Forest Products 1.3% | | | | |
| 8,600 | | Domtar Corp. | | | 704,426 | |
| 37,900 | | International Paper Co. | | | 1,049,830 | |
| | | | | | |
| | | | | 1,754,256 | |
| |
Pharmaceuticals 1.3% | | | | |
| 14,800 | | Endo Pharmaceuticals Holdings, Inc.* | | | 478,188 | |
| 37,400 | | Forest Laboratories, Inc.* | | | 1,170,620 | |
| | | | | | |
| | | | | 1,648,808 | |
| |
Real Estate Investment Trusts 5.8% | | | | |
| 90,400 | | Annaly Capital Management, Inc. | | | 1,523,240 | |
| 49,200 | | Brandywine Realty Trust | | | 448,212 | |
| 171,900 | | Chimera Investment Corp. | | | 517,419 | |
| 35,400 | | CommonWealth REIT | | | 684,990 | |
| 56,100 | | Duke Realty Corp. | | | 688,908 | |
| 1,700 | | Equity Residential | | | 99,756 | |
| 35,500 | | Hospitality Properties Trust | | | 853,065 | |
| 59,449 | | Host Hotels & Resorts, Inc.(a) | | | 848,337 | |
| 25,600 | | Mack-Cali Realty Corp.(a) | | | 718,336 | |
| 9,150 | | ProLogis, Inc. | | | 272,304 | |
| 12,100 | | SL Green Realty Corp.(a) | | | 834,779 | |
| | | | | | |
| | | | | 7,489,346 | |
| |
Real Estate Management & Development 0.5% | | | | |
| 41,200 | | Forest City Enterprises, Inc. (Class A Stock)* | | | 563,616 | |
| 800 | | Jones Lang LaSalle, Inc. | | | 51,696 | |
| | | | | | |
| | | | | 615,312 | |
| |
Road & Rail 0.5% | | | | |
| 12,700 | | Ryder System, Inc. | | | 646,938 | |
| |
Semiconductors & Semiconductor Equipment 1.0% | | | | |
| 44,000 | | Marvell Technology Group Ltd. (Bermuda)* | | | 615,560 | |
| 77,900 | | Micron Technology, Inc.* | | | 435,461 | |
See Notes to Financial Statements.
| | |
| 20 | | Visit our website at www.prudentialfunds.com |
| | | | | | |
| Shares | | Description | | Value (Note 2) | |
| | | | | | |
COMMON STOCKS (Continued) | | | | |
| |
Semiconductors & Semiconductor Equipment (cont’d.) | | | | |
| 16,000 | | Teradyne, Inc.*(a) | | $ | 229,120 | |
| | | | | | |
| | | | | 1,280,141 | |
| |
Shipbuilding 0.2% | | | | |
| 7,000 | | Huntington Ingalls Industries, Inc.* | | | 206,500 | |
| |
Software 0.4% | | | | |
| 26,700 | | CA, Inc. | | | 578,322 | |
| |
Specialty Retail 1.1% | | | | |
| 4,800 | | Aeropostale, Inc.*(a) | | | 65,568 | |
| 26,900 | | American Eagle Outfitters, Inc. | | | 353,197 | |
| 33,100 | | GameStop Corp. (Class A Stock)*(a) | | | 846,367 | |
| 16,200 | | RadioShack Corp.(a) | | | 192,942 | |
| | | | | | |
| | | | | 1,458,074 | |
| |
Telecommunications 0.3% | | | | |
| 7,000 | | tw telecom, Inc.* | | | 129,500 | |
| 6,000 | | United States Cellular Corp.* | | | 239,220 | |
| | | | | | |
| | | | | 368,720 | |
| |
Thrifts & Mortgage Finance 0.5% | | | | |
| 44,200 | | New York Community Bancorp, Inc. | | | 588,302 | |
| |
Tobacco 0.1% | | | | |
| 1,100 | | Lorillard, Inc. | | | 121,726 | |
| |
Water Utilities 0.2% | | | | |
| 8,300 | | American Water Works Co., Inc. | | | 253,399 | |
| |
Wireless Telecommunication Services 0.9% | | | | |
| 33,900 | | MetroPCS Communications, Inc.* | | | 288,150 | |
| 17,300 | | NII Holdings, Inc.* | | | 407,069 | |
| 20,500 | | Telephone & Data Systems, Inc.(a) | | | 475,190 | |
| | | | | | |
| | | | | 1,170,409 | |
| | | | | | |
| | TOTAL COMMON STOCKS
(cost $121,215,958) | | | 127,617,761 | |
| | | | | | |
See Notes to Financial Statements.
| | | | |
| Prudential Mid-Cap Value Fund | | | 21 | |
Portfolio of Investments
as of October 31, 2011 continued
| | | | | | |
| Shares | | Description | | Value (Note 2) | |
| | | | | | |
EXCHANGE TRADED FUND 1.2% | | | | |
| 36,600 | | iShares Russell Midcap Value Index Fund
(cost $1,546,382)(a) | | $ | 1,589,172 | |
| | | | | | |
| | TOTAL LONG-TERM INVESTMENTS
(cost $122,762,340) | | | 129,206,933 | |
| | | | | | |
SHORT-TERM INVESTMENT 14.4% | | | | |
| |
AFFILIATED MONEY MARKET MUTUAL FUND | | | | |
| 18,602,462 | | Prudential Investment Portfolios 2 - Prudential Core Taxable Money Market Fund
(cost $18,602,462; includes $18,242,873 of cash collateral for securities on loan)(b)(c) | | | 18,602,462 | |
| | | | | | |
| | TOTAL INVESTMENTS 113.9%
(cost $141,364,802; Note 6) | | | 147,809,395 | |
| | Liabilities in excess of other assets (13.9%) | | | (17,996,277 | ) |
| | | | | | |
| | NET ASSETS 100.0% | | $ | 129,813,118 | |
| | | | | | |
The following abbreviations are used in the Portfolio descriptions:
REIT—Real Estate Investment Trust
NASDAQ—National Association of Securities Dealers Automated Quotations
NYSE—New York Stock Exchange
| * | Non-income producing security. |
| (a) | All or a portion of security is on loan. The aggregate market value of such securities, including those sold and pending settlement, is $17,251,727; cash collateral of $18,242,873 (included with liabilities) was received with which the Portfolio purchased highly liquid short-term investments. |
| (b) | Represents security, or a portion thereof, purchased with cash collateral received for securities on loan. |
| (c) | Prudential Investments LLC, the manager of the Fund also serves as manager of the Prudential Investment Portfolios 2 - Prudential Core Taxable Money Market Fund. |
Various inputs are used in determining the value of the Fund’s investments. These inputs are summarized in the three broad levels listed below.
Level 1—quoted prices generally for securities actively traded on a regulated securities exchange and for open-end mutual funds which trade at daily net asset value.
Level 2—other significant observable inputs (including, but not limited to, quoted prices for similar securities, interest rates, prepayment speeds, foreign currency exchange rates, and amortized cost) generally for debt securities, swaps, forward foreign currency contracts and for foreign stocks priced using vendor modeling tools.
See Notes to Financial Statements.
| | |
| 22 | | Visit our website at www.prudentialfunds.com |
Level 3—significant unobservable inputs for securities valued in accordance with Board approved fair valuation procedures.
The following is a summary of the inputs used as of October 31, 2011 in valuing such portfolio securities:
| | | | | | | | | | | | |
| | | Level 1 | | | Level 2 | | | Level 3 | |
Investments in Securities | | | | | | | | | | | | |
Common Stocks | | $ | 127,617,761 | | | $ | — | | | $ | — | |
Exchanged Traded Fund | | | 1,589,172 | | | | — | | | | — | |
Affiliated Money Market Mutual Fund | | | 18,602,462 | | | | — | | | | — | |
| | | | | | | | | | | | |
Total | | $ | 147,809,395 | | | $ | — | | | $ | — | |
| | | | | | | | | | | | |
The industry classification of investments and liabilities in excess of other assets shown as a percentage of net assets as of October 31, 2011 were as follows:
| | | | |
Affiliated Money Market Mutual Fund (14.1% represents investments purchased with collateral from securities on loan) | | | 14.4 | % |
Insurance | | | 9.4 | |
Multi-Utilities | | | 9.2 | |
Electric Utilities | | | 5.9 | |
Oil, Gas & Consumable Fuels | | | 5.8 | |
Real Estate Investment Trusts | | | 5.8 | |
Commercial Banks | | | 5.0 | |
Healthcare Providers & Services | | | 4.7 | |
Energy Equipment & Services | | | 3.5 | |
Gas Utilities | | | 2.7 | |
Aerospace & Defense | | | 2.6 | |
Food Products | | | 2.4 | |
Computers & Peripherals | | | 2.2 | |
IT Services | | | 2.1 | |
Capital Markets | | | 1.8 | |
Media | | | 1.8 | |
Consumer Finance | | | 1.7 | |
Diversified Telecommunication Services | | | 1.6 | |
Food & Staples Retailing | | | 1.6 | |
Independent Power Producers & Energy Traders | | | 1.6 | |
Diversified Financial Services | | | 1.5 | |
Paper & Forest Products | | | 1.3 | |
Commercial Services & Supplies | | | 1.3 | |
Pharmaceuticals | | | 1.3 | |
Exchange Traded Fund | | | 1.2 | % |
Chemicals | | | 1.2 | |
Machinery | | | 1.2 | |
Household Durables | | | 1.1 | |
Specialty Retail | | | 1.1 | |
Diversified Consumer Services | | | 1.1 | |
Hotels, Restaurants & Leisure | | | 1.1 | |
Office Electronics | | | 1.1 | |
Multi-Line Retail | | | 1.0 | |
Semiconductors & Semiconductor Equipment | | | 1.0 | |
Auto Components | | | 1.0 | |
Wireless Telecommunication Services | | | 0.9 | |
Beverages | | | 0.9 | |
Containers & Packaging | | | 0.9 | |
Communications Equipment | | | 0.8 | |
Computers | | | 0.8 | |
Construction & Engineering | | | 0.6 | |
Airlines | | | 0.6 | |
Electronic Equipment, Instruments & Components | | | 0.6 | |
Internet | | | 0.5 | |
Road & Rail | | | 0.5 | |
Real Estate Management & Development | | | 0.5 | |
Thrifts & Mortgage Finance | | | 0.5 | |
Software | | | 0.4 | |
Auto Parts & Equipment | | | 0.4 | |
Financial—Bank & Trust | | | 0.3 | |
See Notes to Financial Statements.
| | | | |
| Prudential Mid-Cap Value Fund | | | 23 | |
Portfolio of Investments
as of October 31, 2011 continued
| | | | |
Industry (cont’d.) | | | |
Telecommunications | | | 0.3 | % |
Healthcare Services | | | 0.2 | |
Internet & Catalog Retail | | | 0.2 | |
Water Utilities | | | 0.2 | |
Healthcare Equipment & Supplies | | | 0.2 | % |
Shipbuilding | | | 0.2 | |
Tobacco | | | 0.1 | |
| | | | |
| | | 113.9 | |
Liabilities in excess of other assets | | | (13.9 | ) |
| | | | |
| | | 100.0 | % |
| | | | |
See Notes to Financial Statements.
| | |
| 24 | | Visit our website at www.prudentialfunds.com |
Financial Statements
| | |
| OCTOBER 31, 2011 | | ANNUAL REPORT |
Prudential Mid-Cap Value Fund
Statement of Assets and Liabilities
as of October 31, 2011
| | | | |
Assets | | | | |
Investments at value, including securities on loan of $17,251,727: | | | | |
Unaffiliated Investments (cost $122,762,340) | | $ | 129,206,933 | |
Affiliated Investments (cost $18,602,462) | | | 18,602,462 | |
Receivable for investments sold | | | 532,946 | |
Receivable for Fund shares sold | | | 140,271 | |
Dividends receivable | | | 109,242 | |
Prepaid expenses | | | 2,447 | |
| | | | |
Total assets | | | 148,594,301 | |
| | | | |
| |
Liabilities | | | | |
Payable to broker for collateral for securities on loan | | | 18,242,873 | |
Payable for Fund shares reaquired | | | 271,567 | |
Accrued expenses | | | 105,366 | |
Advisory fee payable | | | 95,082 | |
Distribution fee payable | | | 43,423 | |
Affiliated transfer agent fee payable | | | 22,150 | |
Deferred directors’ fee | | | 722 | |
| | | | |
Total liabilities | | | 18,781,183 | |
| | | | |
| |
Net Assets | | $ | 129,813,118 | |
| | | | |
| | | | | |
Net assets were comprised of: | | | | |
Common stock, at $.001 par value | | $ | 9,653 | |
Paid-in capital in excess of par | | | 128,881,855 | |
| | | | |
| | | 128,891,508 | |
Undistributed net investment income | | | 205,220 | |
Accumulated net realized loss on investment transactions | | | (5,728,203 | ) |
Net unrealized appreciation on investments | | | 6,444,593 | |
| | | | |
Net assets, October 31, 2011 | | $ | 129,813,118 | |
| | | | |
See Notes to Financial Statements.
| | |
| 26 | | Visit our website at www.prudentialfunds.com |
| | | | |
Class A | | | | |
Net asset value and redemption price per share
($68,070,323 ÷ 4,922,452 shares of common stock issued and outstanding) | | $ | 13.83 | |
Maximum sales charge (5.5% of offering price) | | | .80 | |
| | | | |
Maximum offering price to public | | $ | 14.63 | |
| | | | |
| |
Class B | | | | |
Net asset value, offering price and redemption price per share
($2,962,434 ÷ 237,345 shares of common stock issued and outstanding) | | $ | 12.48 | |
| | | | |
| |
Class C | | | | |
Net asset value, offering price and redemption price per share
($27,303,431 ÷ 2,194,068 shares of common stock issued and outstanding) | | $ | 12.44 | |
| | | | |
| |
Class L | | | | |
Net asset value, offering price and redemption price per share
($10,894,739 ÷ 802,440 shares of common stock issued and outstanding) | | $ | 13.58 | |
| | | | |
| |
Class M | | | | |
Net asset value, offering price and redemption price per share
($995,436 ÷ 78,831 shares of common stock issued and outstanding) | | $ | 12.63 | |
| | | | |
| |
Class Q | | | | |
Net asset value, offering price and redemption price per share
($12,664,612 ÷ 907,588 shares of common stock issued and outstanding) | | $ | 13.95 | |
| | | | |
| |
Class X | | | | |
Net asset value, offering price and redemption price per share
($1,880,848 ÷ 148,041 shares of common stock issued and outstanding) | | $ | 12.70 | |
| | | | |
| |
Class Z | | | | |
Net asset value, offering price and redemption price per share
($5,041,295 ÷ 361,758 shares of common stock issued and outstanding) | | $ | 13.94 | |
| | | | |
See Notes to Financial Statements.
| | | | |
| Prudential Mid-Cap Value Fund | | | 27 | |
Statement of Operations
Year Ended October 31, 2011
| | | | |
Net Investment Income | | | | |
Investment Income | | | | |
Unaffiliated dividend income (net of foreign withholding tax of $1,385) | | $ | 3,181,014 | |
Affiliated income from securities lending, net | | | 59,023 | |
Affiliated dividend income | | | 3,026 | |
| | | | |
Total income | | | 3,243,063 | |
| | | | |
| |
Expenses | | | | |
Advisory fee | | | 1,294,174 | |
Distribution fee—Class A | | | 183,466 | |
Distribution fee—Class B | | | 38,592 | |
Distribution fee—Class C | | | 307,064 | |
Distribution fee—Class L | | | 60,381 | |
Distribution fee—Class M | | | 6,137 | |
Distribution fee—Class X | | | 7,386 | |
Transfer agent’s fee and expenses (including affiliated expense of $120,400) | | | 332,000 | |
Registration fees | | | 112,000 | |
Custodian’s fees and expenses | | | 77,000 | |
Reports to shareholders | | | 49,000 | |
Legal fees and expenses | | | 34,000 | |
Audit fees | | | 22,000 | |
Directors’ fees | | | 13,000 | |
Insurance fees | | | 3,000 | |
Loan interest expense (Note 8) | | | 273 | |
Miscellaneous | | | 16,007 | |
| | | | |
Net expenses | | | 2,555,480 | |
| | | | |
Net investment income | | | 687,583 | |
| | | | |
| |
Realized And Unrealized Gain (Loss) On Investments | | | | |
Net realized gain on investment transactions | | | 15,594,385 | |
Net change in unrealized appreciation (depreciation) on investments | | | (7,936,946 | ) |
| | | | |
Net gain on investments | | | 7,657,439 | |
| | | | |
Net Increase In Net Assets Resulting From Operations | | $ | 8,345,022 | |
| | | | |
See Notes to Financial Statements.
| | |
| 28 | | Visit our website at www.prudentialfunds.com |
Statement of Changes in Net Assets
| | | | | | | | |
| | | Year Ended October 31, | |
| | | 2011 | | | 2010 | |
Increase (Decrease) In Net Assets | | | | | | | | |
Operations | | | | | | | | |
Net investment income | | $ | 687,583 | | | $ | 704,261 | |
Net realized gain on investment transactions | | | 15,594,385 | | | | 2,239,324 | |
Net change in unrealized appreciation (depreciation) on investments | | | (7,936,946 | ) | | | 28,203,715 | |
| | | | | | | | |
Net increase in net assets resulting from operations | | | 8,345,022 | | | | 31,147,300 | |
| | | | | | | | |
| | |
Dividends (Note 2) | | | | | | | | |
Dividends from net investment income | | | | | | | | |
Class A | | | (326,017 | ) | | | (504,714 | ) |
Class B | | | — | | | | (11,609 | ) |
Class C | | | — | | | | (76,553 | ) |
Class L | | | (28,452 | ) | | | (69,526 | ) |
Class M | | | (18,606 | ) | | | (80,304 | ) |
Class X | | | (18,794 | ) | | | (46,515 | ) |
Class Z | | | (116,800 | ) | | | (166,991 | ) |
| | | | | | | | |
Total dividends | | | (508,669 | ) | | | (956,212 | ) |
| | | | | | | | |
| | |
Fund share transactions (Note 5) | | | | | | | | |
Net proceeds from shares sold | | | 9,988,166 | | | | 10,102,227 | |
Net asset value of shares issued in reinvestment of dividends | | | 489,215 | | | | 919,643 | |
Cost of shares redeemed | | | (32,875,461 | ) | | | (33,817,992 | ) |
| | | | | | | | |
Decrease in net assets from fund share transactions | | | (22,398,080 | ) | | | (22,796,122 | ) |
| | | | | | | | |
| | |
Capital Contributions | | | | | | | | |
Class M (Note 3) | | | 404 | | | | 4,414 | |
Class X (Note 3) | | | 458 | | | | 2,295 | |
Proceeds from regulatory settlement (Note 5) | | | — | | | | 9,456 | |
| | | | | | | | |
| | | 862 | | | | 16,165 | |
| | | | | | | | |
Total increase (decrease) in net assets | | | (14,560,865 | ) | | | 7,411,131 | |
| | |
Net Assets | | | | | | | | |
Beginning of year | | | 144,373,983 | | | | 136,962,852 | |
| | | | | | | | |
End of year(a) | | $ | 129,813,118 | | | $ | 144,373,983 | |
| | | | | | | | |
(a) Includes undistributed net investment income of: | | $ | 205,220 | | | $ | 26,306 | |
| | | | | | | | |
See Notes to Financial Statements.
| | | | |
| Prudential Mid-Cap Value Fund | | | 29 | |
Notes to Financial Statements
1. Organization
Prudential Investment Portfolios, Inc. 10 (the “Company”) is an open-end management investment company, registered under the Investment Company Act of 1940, as amended, (“1940 Act”). The Company was organized on March 5, 1997, as a Maryland Corporation. The Company operates as a series company. At October 31, 2011, the Company consisted of two diversified investment portfolios (each a “Fund” and collectively the “Funds”). The information presented in these financial statements pertains to Prudential Mid-Cap Value Fund (the “Fund”). The investment objective of the Fund is capital growth by investing primarily in common stocks of medium capitalization companies.
2. Significant Accounting Policies
The following accounting policies are in conformity with accounting principles generally accepted in the United States of America. Such policies are consistently followed by the Company and the Fund in the preparation of their financial statements.
Securities Valuation: Securities listed on a securities exchange (other than options on securities and indices) are valued at the last sale price on such exchange on the day of valuation or, if there was no sale on such day, at the mean between the last reported bid and asked prices, or at the last bid price on such day in the absence of an asked price. Securities that are actively traded via NASDAQ are valued at the official closing price as provided by NASDAQ. Securities that are actively traded in the over-the-counter market, including listed securities for which the primary market is believed by Prudential Investments LLC (“PI” or “Manager”) in consultation with the subadviser, to be over-the-counter, are valued at market value using prices provided by an independent pricing agent or principal market maker. Futures contracts and options thereon traded on a commodities exchange or board of trade are valued at the last sale price at the close of trading on such exchange or board of trade or, if there was no sale on the applicable commodities exchange or board of trade on such day, at the mean between the most recently quoted prices on such exchange or board of trade or at the last bid price in the absence of an asked price. Prices may be obtained from independent pricing services which use information provided by market makers or estimates of market values obtained from yield data relating to investments or securities with similar characteristics. Securities for which reliable market quotations are not readily available, or whose values have been affected by
| | |
| 30 | | Visit our website at www.prudentialfunds.com |
events occurring after the close of the security’s foreign market and before the Fund’s normal pricing time, are valued at fair value in accordance with the Board of Directors’ approved fair valuation procedures. When determining the fair valuation of securities some of the factors influencing the valuation include, the nature of any restrictions on disposition of the securities; assessment of the general liquidity of the securities; the issuer’s financial condition and the markets in which it does business; the cost of the investment; the size of the holding and the capitalization of issuer; the prices of any recent transactions or bids/offers for such securities or any comparable securities; any available analyst media or other reports or information deemed reliable by the investment adviser regarding the issuer or the markets or industry in which it operates. Using fair value to price securities may result in a value that is different from a security’s most recent closing price and from the price used by other mutual funds to calculate their net asset value.
Investments in open-end, non-exchange-traded mutual funds are valued at the net asset value as of the close of the New York Stock Exchange on the date of valuation.
Foreign Currency Translation: Fund securities and other assets and liabilities denominated in foreign currencies are translated each business day into U.S. dollars based on the current rates of exchange. Purchases and sales of Fund securities and income and expenses are translated into U.S. dollars on the respective dates of such transactions. Gains and losses resulting from changes in exchange rates applicable to long-term foreign securities are not reported separately from gains and losses arising from movements in securities prices. Net realized foreign exchange gains and losses include gains and losses from sales and maturities of foreign currency exchange contracts, gains and losses realized between the trade and settlement dates of foreign securities transactions, and the difference between the amount of net investment income accrued on foreign securities and the U.S. dollar amount actually received. Net unrealized foreign exchange gains and losses include gains and losses from changes in the value of assets and liabilities other than Fund securities, resulting from changes in exchange rates.
Securities Lending: The Funds may lend their portfolio securities to broker-dealers. The loans are secured by collateral at least equal at all times to the market value of the securities loaned. Loans are subject to termination at the option of the borrower or the Funds. Upon termination of the loan, the borrower will return to the lender securities identical to the loaned securities. Should the borrower of the securities fail financially, the Funds have the right to repurchase the securities using the collateral in the open market. The Funds recognize income, net of any rebate and securities lending agent fees, for lending its securities in the form of fees or interest on the investment of any cash received as collateral. The Funds also continue to receive
| | | | |
| Prudential Mid-Cap Value Fund | | | 31 | |
Notes to Financial Statements
continued
interest and dividends or amounts equivalent thereto, on the securities loaned and recognize any unrealized gain or loss in the market price of the securities loaned that may occur during the term of the loan.
Securities Transactions and Net Investment Income: Securities transactions are recorded on the trade date. Realized gains or losses on sales of investments and currency transactions are calculated on the identified cost basis. Dividend income is recorded on the ex-dividend date and interest income is recorded on the accrual basis. The Fund amortizes premiums and discounts on portfolio securities as adjustments to interest income. Expenses are recorded on the accrual basis which may require the use of certain estimates by management.
Net investment income or loss (other than distribution fees, which are charged directly to the respective class) and unrealized and realized gains or losses are allocated daily to each class of shares based upon the relative proportion of net assets of each class at the beginning of the day.
Dividends and Distributions to Shareholders: Dividends and distributions to shareholders are recorded on the ex-dividend date. Dividends, if any, from net investment income are declared and paid at least annually. These dividends and distributions are determined in accordance with federal income tax regulations and may differ from accounting principles generally accepted in the United States of America.
Net realized gains from investment transactions, if any, are distributed at least annually. Permanent book/tax differences relating to income and gains are reclassified to paid-in capital when they arise.
Taxes: For federal income tax purposes, each Fund in the Company is treated as a separate tax paying entity. It is the Fund’s policy to continue to meet the requirements of the Internal Revenue Code applicable to regulated investment companies and to distribute all of its taxable net income and capital gains, if any, to shareholders. Therefore, no federal tax provision is required.
Withholding taxes on foreign dividends are recorded net of reclaimable amounts, at the time the related income is earned.
Estimates: The preparation of the financial statements requires management to make estimates and assumptions that affect the reported amounts and disclosures in the financial statements. Actual results could differ from those estimates.
| | |
| 32 | | Visit our website at www.prudentialfunds.com |
3. Agreements
The Fund has entered into an investment management agreement with PI which provides that the Manager will furnish the Fund with investment advice and investment management and administrative services. The Manager has entered into a subadvisory agreement with Quantitative Management Associates LLC (“QMA”). The subadvisory agreement provides that QMA furnishes investment advisory services in connection with the management of the Fund. PI pays for the services of QMA, the cost of compensation of officers of the Fund, occupancy and certain clerical and bookkeeping costs of the Fund. The Fund bears all other costs and expenses.
The advisory fee paid to PI is computed daily and payable monthly at an annual rate of ..90% of the average daily net assets of the Fund up to $500 million, .85% of the next $500 million and .80% of the average daily net assets in excess of $1 billion. The effective management fee rate was .90% for the year ended October 31, 2011.
Certain officers and directors of the Fund are officers or directors of the Manager. The Fund pays no compensation directly to their officers or interested directors.
The Fund has distribution agreements with Prudential Investment Management Services LLC (“PIMS”) and Prudential Annuities Distributors, Inc. (“PAD”). PIMS and PAD are both affiliates of PI and indirect, wholly-owned subsidiaries of Prudential. PIMS serves as the distributor of the Fund’s Class A, Class B, Class C, Class Q and Class Z shares. PIMS, together with PAD, serves as co-distributor of the Fund’s Class L, Class M and Class X shares.
The Company has adopted a separate Distribution and Service plan (each a “Plan” and collectively the “Plans”) for the Class A, Class B, Class C, Class L, Class M and Class X shares of the Fund in accordance with Rule 12b-1 of the 1940 Act, as amended. No distribution or service fees are paid to PIMS as distributor for the Fund’s Class Q or Class Z shares.
Under the Plans, the Fund compensates PIMS and PAD a distribution and service fee at the annual rate of .30%, 1.00%, 1.00%, .50%, 1.00% and 1.00% of the average daily net assets of the Class A, B, C, L, M, and X shares, respectively. Through February 28, 2013, PIMS has contractually agreed to limit such fees to .25% of the average daily net assets of the Class A shares.
Management has received the maximum allowable amount of sales charges for Class M and X in accordance with regulatory limits. As such, any contingent deferred sales charges received by the Manager are contributed back into the Fund and included in the Statement of Changes in Net Assets and Financial Highlights as a contribution to capital.
| | | | |
| Prudential Mid-Cap Value Fund | | | 33 | |
Notes to Financial Statements
continued
During the year ended October 31, 2008, management determined that Class M and Class X shareholders had been charged sales charges in excess of regulatory limits. The Manager has paid these classes for the overcharge which is reflected in the Financial Highlights for Class M and Class X for the years ended October 31, 2008 and 2007.
During the year ended October 31, 2011, PIMS has advised the Fund, front-end sales charges (“FESC”) and contingent deferred sales charges (“CDSC”) were as follows:
| | | | | | |
Class A
FESC | | Class A
CDSC | | Class B
CDSC | | Class C
CDSC |
| $39,292 | | $878 | | $8,388 | | $623 |
4. Other Transactions with Affiliates
Prudential Mutual Fund Services LLC (“PMFS”), an affiliate of PI and an indirect, wholly-owned subsidiary of Prudential, serves as the Fund’s transfer agent. Transfer agent fees and expenses shown in the Statements of Operations include certain out-of pocket expenses paid to non-affiliates, where applicable.
The Fund invests in the Prudential Core Taxable Money Market Fund (the “Core Fund”), a series of Prudential Investment Portfolios 2, registered under the 1940 Act, as amended, and managed by PI. Earnings from the Core Fund are disclosed on the Statement of Operations as affiliated dividend income.
Prudential Investment Management, Inc. (“PIM”), an indirect, wholly-owned subsidiary of Prudential, served as the Fund’s securities lending agent. For the year ended October 31, 2011, PIM has been compensated approximately $17,600 for these services.
5. Shares of Capital Stock
Class A shares are sold with a front-end sales charge of up to 5.50%. Purchases of $1 million or more are subject to a contingent deferred sales charge (“CDSC”) if shares are redeemed within 12 months of their purchase. The Class A CDSC is waived for purchases by certain retirement and/or benefit plans. Class B shares are sold with a CDSC which declines from 5% to zero depending upon the period of time the shares are held. Class B shares will automatically convert to Class A shares approximately seven years after purchase. Class M shares will automatically convert to Class A
| | |
| 34 | | Visit our website at www.prudentialfunds.com |
shares approximately eight years after purchase. In addition, under certain limited circumstances, an exchange may be made from Class A, Class B or Class C to Class Z shares of the Fund. In addition, under certain limited circumstances, an exchange may be made from Class Z to Class A or Class Q shares of the Fund. Class C shares are sold with a CDSC of 1% on shares redeemed within the first 12 months after purchase. Class L shares are closed to new initial purchases (with the exception of reinvested dividends). Class M shares are also closed to new initial purchases (with the exception of reinvested dividends). Class L shares and Class M shares are only exchangeable with Class L shares and Class M shares, respectively, offered by the other Prudential Investments Funds. Class X shares are closed to new purchases. The authorized capital stock of the Company is 5.5 billion shares, with a par value of $.001 per share. Of the Company’s authorized capital stock, 175 million authorized shares have been allocated to the Fund and divided into eight classes, designated Class A, Class B, Class C, Class L, Class M, Class Q, Class X and Class Z capital stock, each of which consists of 50 million, 10 million, 30 million, 2 million, 2 million, 40 million, 1 million and 40 million authorized shares, respectively. Class Q and Class Z shares are not subject to any sales or redemption charge and are offered exclusively for sale to a limited group of investors.
For the year ended October 31, 2010, the Fund received $9,456 related to an affiliate’s settlement of regulatory proceedings involving allegations of improper trading. This amount is presented in the Fund’s Statement of Changes in Net Assets. The Fund was not involved in the proceedings or the calculation of the payment.
Transactions in shares of capital stock, during the year ended October 31, 2011, were as follows:
| | | | | | | | |
Class A | | Shares | | | Amount | |
Year ended October 31, 2011: | | | | | | | | |
Shares sold | | | 290,278 | | | $ | 4,197,030 | |
Shares issued in reinvestment of dividends and distributions | | | 23,751 | | | | 312,088 | |
Shares reacquired | | | (1,404,217 | ) | | | (19,651,476 | ) |
| | | | | | | | |
Net increase (decrease) in shares outstanding before conversion | | | (1,090,188 | ) | | | (15,142,358 | ) |
Shares issued upon conversion from Class B, Class M, Class X and Class Z | | | 440,046 | | | | 6,200,949 | |
Shares reacquired upon conversion into Class Z | | | (41,496 | ) | | | (604,311 | ) |
| | | | | | | | |
Net increase (decrease) in shares outstanding | | | (691,638 | ) | | $ | (9,545,720 | ) |
| | | | | | | | |
Year ended October 31, 2010: | | | | | | | | |
Shares sold | | | 404,212 | | | $ | 4,908,947 | |
Shares issued in reinvestment of dividends and distributions | | | 43,339 | | | | 485,837 | |
Shares reacquired | | | (1,318,165 | ) | | | (15,943,513 | ) |
| | | | | | | | |
Net increase (decrease) in shares outstanding before conversion | | | (870,614 | ) | | | (10,548,729 | ) |
Shares issued upon conversion from Class B, Class M and Class X | | | 623,214 | | | | 7,543,399 | |
| | | | | | | | |
Net increase (decrease) in shares outstanding | | | (247,400 | ) | | $ | (3,005,330 | ) |
| | | | | | | | |
| | | | |
| Prudential Mid-Cap Value Fund | | | 35 | |
Notes to Financial Statements
continued
| | | | | | | | |
Class B | | Shares | | | Amount | |
Year ended October 31, 2011: | | | | | | | | |
Shares sold | | | 55,268 | | | $ | 723,351 | |
Shares reacquired | | | (68,301 | ) | | | (872,904 | ) |
| | | | | | | | |
Net increase (decrease) in shares outstanding before conversion | | | (13,033 | ) | | | (149,553 | ) |
Shares reacquired upon conversion into Class A | | | (94,292 | ) | | | (1,207,901 | ) |
| | | | | | | | |
Net increase (decrease) in shares outstanding | | | (107,325 | ) | | $ | (1,357,454 | ) |
| | | | | | | | |
Year ended October 31, 2010: | | | | | | | | |
Shares sold | | | 49,822 | | | $ | 546,299 | |
Shares issued in reinvestment of dividends and distributions | | | 1,074 | | | | 10,968 | |
Shares reacquired | | | (122,162 | ) | | | (1,333,469 | ) |
| | | | | | | | |
Net increase (decrease) in shares outstanding before conversion | | | (71,266 | ) | | | (776,202 | ) |
Shares reacquired upon conversion into Class A | | | (22,381 | ) | | | (242,722 | ) |
| | | | | | | | |
Net increase (decrease) in shares outstanding | | | (93,647 | ) | | $ | (1,018,924 | ) |
| | | | | | | | |
Class C | | | | | | |
Year ended October 31, 2011: | | | | | | | | |
Shares sold | | | 80,138 | | | $ | 1,027,265 | |
Shares reacquired | | | (409,203 | ) | | | (5,238,736 | ) |
| | | | | | | | |
Net increase (decrease) in shares outstanding before conversion | | | (329,065 | ) | | | (4,211,471 | ) |
Shares reacquired upon conversion into Class Z | | | (3,092 | ) | | | (36,187 | ) |
| | | | | | | | |
Net increase (decrease) in shares outstanding | | | (332,157 | ) | | $ | (4,247,658 | ) |
| | | | | | | | |
Year ended October 31, 2010: | | | | | | | | |
Shares sold | | | 129,215 | | | $ | 1,424,846 | |
Shares issued in reinvestment of dividends and distributions | | | 7,083 | | | | 72,109 | |
Shares reacquired | | | (493,020 | ) | | | (5,371,179 | ) |
| | | | | | | | |
Net increase (decrease) in shares outstanding | | | (356,722 | ) | | $ | (3,874,224 | ) |
| | | | | | | | |
Class L | | | | | | |
Year ended October 31, 2011: | | | | | | | | |
Shares sold | | | 2,104 | | | $ | 29,731 | |
Shares issued in reinvestment of dividends and distributions | | | 2,026 | | | | 26,190 | |
Shares reacquired | | | (123,155 | ) | | | (1,710,840 | ) |
| | | | | | | | |
Net increase (decrease) in shares outstanding | | | (119,025 | ) | | $ | (1,654,919 | ) |
| | | | | | | | |
Year ended October 31, 2010: | | | | | | | | |
Shares sold | | | 6,206 | | | $ | 71,673 | |
Shares issued in reinvestment of dividends and distributions | | | 5,802 | | | | 63,992 | |
Shares reacquired | | | (191,124 | ) | | | (2,253,688 | ) |
| | | | | | | | |
Net increase (decrease) in shares outstanding | | | (179,116 | ) | | $ | (2,118,023 | ) |
| | | | | | | | |
| | |
| 36 | | Visit our website at www.prudentialfunds.com |
| | | | | | | | |
Class M | | Shares | | | Amount | |
Year ended October 31, 2011: | | | | | | | | |
Shares sold | | | 1,863 | | | $ | 23,544 | |
Shares issued in reinvestment of dividends and distributions | | | 1,448 | | | | 17,371 | |
Shares reacquired | | | (20,792 | ) | | | (292,886 | ) |
| | | | | | | | |
Net increase (decrease) in shares outstanding before conversion | | | (17,481 | ) | | | (251,971 | ) |
Shares reacquired upon conversion into Class A | | | (236,407 | ) | | | (3,049,310 | ) |
| | | | | | | | |
Net increase (decrease) in shares outstanding | | | (253,888 | ) | | $ | (3,301,281 | ) |
| | | | | | | | |
Year ended October 31, 2010: | | | | | | | | |
Shares sold | | | 3,554 | | | $ | 39,700 | |
Shares issued in reinvestment of dividends and distributions | | | 7,294 | | | | 74,621 | |
Shares reacquired | | | (124,930 | ) | | | (1,349,836 | ) |
| | | | | | | | |
Net increase (decrease) in shares outstanding before conversion | | | (114,082 | ) | | | (1,235,515 | ) |
Shares reacquired upon conversion into Class A | | | (528,769 | ) | | | (5,869,335 | ) |
| | | | | | | | |
Net increase (decrease) in shares outstanding | | | (642,851 | ) | | $ | (7,104,850 | ) |
| | | | | | | | |
Class Q | | | | | | |
Period January 18, 2011* through October 31, 2011: | | | | | | | | |
Shares sold | | | 41,920 | | | $ | 601,415 | |
Shares reacquired | | | (94,765 | ) | | | (1,400,000 | ) |
| | | | | | | | |
Net increase (decrease) in shares outstanding before conversion | | | (52,845 | ) | | | (798,585 | ) |
Shares issued upon conversion from Class Z | | | 960,433 | | | | 13,926,271 | |
| | | | | | | | |
Net increase (decrease) in shares outstanding | | | 907,588 | | | $ | 13,127,686 | |
| | | | | | | | |
Class X | | | | | | |
Year ended October 31, 2011: | | | | | | | | |
Shares sold | | | 1,294 | | | $ | 17,524 | |
Shares issued in reinvestment of dividends and distributions | | | 1,551 | | | | 18,723 | |
Shares reacquired | | | (53,793 | ) | | | (719,031 | ) |
| | | | | | | | |
Net increase (decrease) in shares outstanding before conversion | | | (50,948 | ) | | | (682,784 | ) |
Shares reacquired upon conversion into Class A | | | (137,949 | ) | | | (1,786,509 | ) |
| | | | | | | | |
Net increase (decrease) in shares outstanding | | | (188,897 | ) | | $ | (2,469,293 | ) |
| | | | | | | | |
Year ended October 31, 2010: | | | | | | | | |
Shares sold | | | 4,857 | | | $ | 53,770 | |
Shares issued in reinvestment of dividends and distributions | | | 4,484 | | | | 46,190 | |
Shares reacquired | | | (86,694 | ) | | | (958,612 | ) |
| | | | | | | | |
Net increase (decrease) in shares outstanding before conversion | | | (77,353 | ) | | | (858,652 | ) |
Shares reacquired upon conversion into Class A | | | (130,518 | ) | | | (1,431,342 | ) |
| | | | | | | | |
Net increase (decrease) in shares outstanding | | | (207,871 | ) | | $ | (2,289,994 | ) |
| | | | | | | | |
| | | | |
| Prudential Mid-Cap Value Fund | | | 37 | |
Notes to Financial Statements
continued
| | | | | | | | |
Class Z | | Shares | | | Amount | |
Year ended October 31, 2011: | | | | | | | | |
Shares sold | | | 231,095 | | | $ | 3,368,306 | |
Shares issued in reinvestment of dividends and distributions | | | 8,694 | | | | 114,843 | |
Shares reacquired | | | (223,907 | ) | | | (2,989,588 | ) |
| | | | | | | | |
Net increase (decrease) in shares outstanding before conversion | | | 15,882 | | | | 493,561 | |
Shares issued upon conversion from Class A and Class C | | | 43,991 | | | | 640,497 | |
Shares reacquired upon conversion into Class A and Class Q | | | (972,300 | ) | | | (14,083,499 | ) |
| | | | | | | | |
Net increase (decrease) in shares outstanding | | | (912,427 | ) | | $ | (12,949,441 | ) |
| | | | | | | | |
Year ended October 31, 2010: | | | | | | | | |
Shares sold | | | 258,483 | | | $ | 3,056,992 | |
Shares issued in reinvestment of dividends and distributions | | | 14,736 | | | | 165,926 | |
Shares reacquired | | | (510,895 | ) | | | (6,607,695 | ) |
| | | | | | | | |
Net increase (decrease) in shares outstanding | | | (237,676 | ) | | $ | (3,384,777 | ) |
| | | | | | | | |
| * | Commencement of operations. |
6. Distributions and Tax Information
Distributions to shareholders, which are determined in accordance with federal income tax regulations, which may differ from generally accepted accounting principles, are recorded on the ex-dividend date.
For the years ended October 31, 2011 and 2010, the tax character of dividends paid as reflected in the Statement of Changes in Net Assets were $508,669 and $956,212 of ordinary income, respectively.
As of October 31, 2011, the accumulated undistributed earnings on a tax basis was $205,942 of ordinary income. This differs from the amount shown on the Statement of Assets and Liabilities primarily due to cumulative timing differences between financial and tax reporting.
For federal income tax purposes, the Fund had a capital loss carryforward as of October 31, 2011 of approximately $5,273,000 which expires in 2017. The Fund utilized capital loss carryforward to offset net taxable capital gains realized in the fiscal year ended October 31, 2011 of approximately $15,693,000. Accordingly, no capital gains distributions are expected to be paid to shareholders until net gains have been realized in excess of such carryforward. Under the recently enacted Regulated
| | |
| 38 | | Visit our website at www.prudentialfunds.com |
Investment Company Modernization Act of 2010 (“the Act”), the Fund is permitted to carryforward capital losses incurred in taxable years beginning after December 22, 2010 (“post-enactment losses”) for an unlimited period. However, any post-enactment losses are required to be utilized before the utilization of losses incurred prior to the effective date of the Act. As a result of this ordering rule, capital loss carryforwards related to the taxable years beginning prior to the effective date of the Act may have an increased likelihood to expire unused. Additionally, post-enactment capital losses that are carried forward will retain their character as either short-term or long-term capital losses rather than being considered all short-term as under previous law.
The federal income tax basis of the Fund’s investments and the net unrealized appreciation as of October 31, 2011 was as follows:
| | | | | | |
Tax Basis | | Appreciation | | Depreciation | | Net
Unrealized
Appreciation |
| $141,820,279 | | $17,483,207 | | $(11,494,091) | | $5,989,116 |
The difference between book basis and tax basis was primarily attributable to deferred losses on wash sales.
Management has analyzed the Fund’s tax positions taken on federal income tax returns for all open tax years and has concluded that no provision for income tax is required in the Fund’s financial statements for the current reporting period. The Fund’s federal and state income and federal excise tax returns for tax years for which the applicable statutes of limitations have not expired are subject to examination by the Internal Revenue Service and state departments of revenue.
7. Portfolio Securities
Purchases and sales of securities, other than U.S. government securities and short term obligations, during the year ended October 31, 2011, were $53,358,523 and $73,695,923, respectively.
8. Borrowings
The Fund, along with other affiliated registered investment companies (the “Companies”), is a party to a syndicated Credit Agreement (“SCA”) with a group of banks. The purpose of the SCA is to provide an alternative source of temporary funding for capital share redemptions. The SCA provides for a commitment of
| | | | |
| Prudential Mid-Cap Value Fund | | | 39 | |
Notes to Financial Statements
continued
$750 million for the period December 17, 2010 through December 16, 2011. The Companies pay an annualized commitment fee of 0.10% of the unused portion of the SCA. Prior to December 17, 2010, the Companies had another Syndicated Credit Agreement (the “Expired SCA”) of a $500 million commitment with an annualized commitment fee of 0.15% of the unused portion. Interest on any borrowings under these SCAs is paid at contracted market rates. The commitment fee for the unused amount is accrued daily and paid quarterly. The SCA has been renewed on substantially similar terms with an increase in the amount of commitment to $900 million.
The Fund utilized the SCA during the year ended October 31, 2011. The average daily balance for the 3 days the Fund had loans outstanding during the year was approximately $2,246,000 borrowed at a weighted average interest rate of 1.46%. At October 31, 2011, the Fund did not have an outstanding loan amount.
Note 9. Dividends to Shareholders
Subsequent to the fiscal year end, the Fund declared ordinary income dividends on November 17, 2011 to shareholders of record on November 18, 2011. The ex-dividend date was November 21, 2011. The per share amounts declared were as follows:
| | | | |
| | | Ordinary Income | |
Class A | | $ | 0.10582 | |
Class B | | $ | 0.01537 | |
Class C | | $ | 0.01537 | |
Class L | | $ | 0.07152 | |
Class M | | $ | 0.10582 | |
Class Q | | $ | 0.17696 | |
Class X | | $ | 0.10582 | |
Class Z | | $ | 0.14127 | |
Note 10. New Accounting Pronouncements
In April 2011, the Financial Accounting Standards Board (“FASB”) issued Accounting Standards Update (“ASU”) No. 2011-03 “Reconsideration of Effective control for Repurchase Agreements.” The objective of ASU No. 2011-03 is to improve the accounting for repurchase agreements and other agreements that both entitle and obligate a transferor to repurchase or redeem financial assets before their maturity. Under previous guidance, whether or not to account for a transaction as a sale was
| | |
| 40 | | Visit our website at www.prudentialfunds.com |
based on, in part, if the entity maintained effective control over the transferred financial assets. ASU No. 2011-03 removes the transferor’s ability criterion from the effective control assessment. This guidance is effective prospectively for interim and annual reporting periods beginning on or after December 15, 2011. At this time, management is evaluating the implications of ASU No. 2011-03 and its impact on the financial statements has not been determined.
In May 2011, the FASB issued ASU No. 2011-04 “Amendments to Achieve Common Fair Value Measurement and Disclosure Requirements in U.S. GAAP and IFRSs.” ASU No. 2011-04 includes common requirements for measurement of and disclosure about fair value between U.S. GAAP and IFRS. ASU No. 2011-04 will require reporting entities to disclose quantitative information about the unobservable inputs used in the fair value measurements categorized within Level 3 of the fair value hierarchy. In addition, ASU No. 2011-04 will require reporting entities to make disclosures about amounts and reasons for all transfers in and out of Level 1 and Level 2 fair value measurements. The new and revised disclosures are effective for interim and annual reporting periods beginning after December 15, 2011. At this time, management is evaluating the implications of ASU No. 2011-04 and its impact on the financial statements has not been determined.
| | | | |
| Prudential Mid-Cap Value Fund | | | 41 | |
Financial Highlights
| | | | | | | | | | | | | | | | | | | | |
| Class A Shares | |
| | | Year Ended October 31, | |
| | | 2011 | | | 2010 | | | 2009 | | | 2008 | | | 2007 | |
| Per Share Operating Performance(b): | | | | | | | | | | | | | | | | | | | | |
| Net Asset Value, Beginning Of Year | | | $13.12 | | | | $10.65 | | | | $9.07 | | | | $18.38 | | | | $18.26 | |
| Income (loss) from investment operations: | | | | | | | | | | | | | | | | | | | | |
| Net investment income | | | .09 | | | | .08 | | | | .09 | | | | .15 | | | | .06 | |
| Net realized and unrealized gain (loss) on investments | | | .68 | | | | 2.48 | | | | 1.68 | | | | (5.65 | ) | | | 1.68 | |
| Total from investment operations | | | .77 | | | | 2.56 | | | | 1.77 | | | | (5.50 | ) | | | 1.74 | |
| Less Dividends and Distributions: | | | | | | | | | | | | | | | | | | | | |
| Dividends from net investment income | | | (.06 | ) | | | (.09 | ) | | | (.19 | ) | | | (.06 | ) | | | - | |
| Distributions from net realized gains | | | - | | | | - | | | | - | | | | (3.75 | ) | | | (1.62 | ) |
| Total dividends and distributions | | | (.06 | ) | | | (.09 | ) | | | (.19 | ) | | | (3.81 | ) | | | (1.62 | ) |
| Capital Contributions (Note 5) | | | - | | | | - | * | | | - | | | | - | | | | - | |
| Net asset value, end of year | | | $13.83 | | | | $13.12 | | | | $10.65 | | | | $9.07 | | | | $18.38 | |
| Total Return(a) | | | 5.90% | | | | 24.14% | | | | 20.16% | | | | (36.25)% | | | | 9.78% | |
| |
| Ratios/Supplemental Data: | |
| Net assets, end of year (in millions) | | | $68.1 | | | | $73.6 | | | | $62.4 | | | | $36.1 | | | | $54.8 | |
| Ratios to average net assets(c): | | | | | | | | | | | | | | | | | | | | |
Expenses after advisory fee waiver and
expense reimbursement | | | 1.63% | | | | 1.61% | | | | 1.72% | | | | 1.53% | | | | 1.48% | |
Expenses before advisory fee waiver and
expense reimbursement | | | 1.63% | | | | 1.61% | | | | 1.72% | | | | 1.53% | | | | 1.48% | |
| Net investment income | | | .63% | | | | .65% | | | | .97% | | | | 1.18% | | | | .34% | |
| For Class A, B, C, L, M, Q, X and Z shares: | | | | | | | | | | | | | | | | | | | | |
| Portfolio turnover rate | | | 37% | | | | 26% | | | | 38% | | | | 37% | | | | 78% | |
(a) Total return does not consider the effects of sales load. Total return is calculated assuming a purchase of a share on the first day and a sale on the last day of each year reported and includes reinvestment of dividends and distributions. Total returns may reflect adjustments to conform to generally accepted accounting principles. Total return includes the effect of expense subsidies.
(b) Calculated based on average shares outstanding during the year.
(c) Does not include expenses of the underlying portfolio in which the Fund invests.
* Less than $.005.
See Notes to Financial Statements.
| | |
| 42 | | Visit our website at www.prudentialfunds.com |
| | | | | | | | | | | | | | | | | | | | |
| Class B Shares | | | | | | | | | | | | | | | |
| | | Year Ended October 31, | |
| | | 2011 | | | 2010 | | | 2009 | | | 2008 | | | 2007 | |
| Per Share Operating Performance(b): | | | | | | | | | | | | | | | | | | | | |
| Net Asset Value, Beginning Of Year | | | $11.87 | | | | $9.66 | | | | $8.22 | | | | $17.07 | | | | $17.19 | |
| Income (loss) from investment operations: | | | | | | | | | | | | | | | | | | | | |
| Net investment income (loss) | | | (.02 | ) | | | (.01 | ) | | | .06 | | | | .05 | | | | (.07 | ) |
| Net realized and unrealized gain (loss) on investments | | | .63 | | | | 2.25 | | | | 1.49 | | | | (5.15 | ) | | | 1.57 | |
| Total from investment operations | | | .61 | | | | 2.24 | | | | 1.55 | | | | (5.10 | ) | | | 1.50 | |
| Less Dividends and Distributions: | | | | | | | | | | | | | | | | | | | | |
| Dividends from net investment income | | | - | | | | (.03 | ) | | | (.11 | ) | | | - | | | | - | |
| Distributions from net realized gains | | | - | | | | - | | | | - | | | | (3.75 | ) | | | (1.62 | ) |
| Total dividends and distributions | | | - | | | | (.03 | ) | | | (.11 | ) | | | (3.75 | ) | | | (1.62 | ) |
| Capital Contributions (Note 5) | | | - | | | | - | * | | | - | | | | - | | | | - | |
| Net asset value, end of year | | | $12.48 | | | | $11.87 | | | | $9.66 | | | | $8.22 | | | | $17.07 | |
| Total Return(a) | | | 5.14% | | | | 23.20% | | | | 19.29% | | | | (36.69)% | | | | 8.99% | |
| |
| Ratios/Supplemental Data: | | | | | | | | | | | | | | | |
| Net assets, end of year (in millions) | | | $3.0 | | | | $4.1 | | | | $4.2 | | | | $17.0 | | | | $40.6 | |
| Ratios to average net assets(c): | | | | | | | | | | | | | | | | | | | | |
Expenses after advisory fee waiver and
expense reimbursement | | | 2.38% | | | | 2.36% | | | | 2.47% | | | | 2.28% | | | | 2.23% | |
Expenses before advisory fee waiver and
expense reimbursement | | | 2.38% | | | | 2.36% | | | | 2.47% | | | | 2.28% | | | | 2.23% | |
| Net investment income (loss) | | | (.12)% | | | | (.08)% | | | | .84% | | | | .43% | | | | (.42)% | |
(a) Total return does not consider the effects of sales load. Total return is calculated assuming a purchase of a share on the first day and a sale on the last day of each year reported and includes reinvestment of dividends and distributions. Total returns may reflect adjustments to conform to generally accepted accounting principles. Total return includes the effect of expense subsidies.
(b) Calculated based on average shares outstanding during the year.
(c) Does not include expenses of the underlying portfolio in which the Fund invests.
* Less than $.005.
See Notes to Financial Statements.
| | | | |
| Prudential Mid-Cap Value Fund | | | 43 | |
Financial Highlights
continued
| | | | | | | | | | | | | | | | | | | | |
| Class C Shares | |
| | | Year Ended October 31, | |
| | | 2011 | | | 2010 | | | 2009 | | | 2008 | | | 2007 | |
| Per Share Operating Performance(b): | | | | | | | | | | | | | | | | | | | | |
| Net Asset Value, Beginning Of Year | | | $11.84 | | | | $9.63 | | | | $8.20 | | | | $17.05 | | | | $17.17 | |
| Income (loss) from investment operations: | | | | | | | | | | | | | | | | | | | | |
| Net investment income (loss) | | | (.02 | ) | | | (.01 | ) | | | .03 | | | | .05 | | | | (.07 | ) |
| Net realized and unrealized gain (loss) on investments | | | .62 | | | | 2.25 | | | | 1.51 | | | | (5.15 | ) | | | 1.57 | |
| Total from investment operations | | | .60 | | | | 2.24 | | | | 1.54 | | | | (5.10 | ) | | | 1.50 | |
| Less Dividends and Distributions: | | | | | | | | | | | | | | | | | | | | |
| Dividends from net investment income | | | - | | | | (.03 | ) | | | (.11 | ) | | | - | | | | - | |
| Distributions from net realized gains | | | - | | | | - | | | | - | | | | (3.75 | ) | | | (1.62 | ) |
| Total dividends and distributions | | | - | | | | (.03 | ) | | | (.11 | ) | | | (3.75 | ) | | | (1.62 | ) |
| Capital Contributions (Note 5) | | | - | | | | - | * | | | - | | | | - | | | | - | |
| Net asset value, end of year | | | $12.44 | | | | $11.84 | | | | $9.63 | | | | $8.20 | | | | $17.05 | |
| Total Return(a) | | | 5.07% | | | | 23.27% | | | | 19.21% | | | | (36.74)% | | | | 9.00% | |
| |
| Ratios/Supplemental Data: | |
| Net assets, end of year (in millions) | | | $27.3 | | | | $29.9 | | | | $27.8 | | | | $28.8 | | | | $67.3 | |
| Ratios to average net assets(c): | | | | | | | | | | | | | | | | | | | | |
Expenses after advisory fee waiver and
expense reimbursement | | | 2.38% | | | | 2.36% | | | | 2.47% | | | | 2.28% | | | | 2.23% | |
Expenses before advisory fee waiver and
expense reimbursement | | | 2.38% | | | | 2.36% | | | | 2.47% | | | | 2.28% | | | | 2.23% | |
| Net investment income (loss) | | | (.12)% | | | | (.09)% | | | | .43% | | | | .42% | | | | (.42)% | |
(a) Total return does not consider the effects of sales load. Total return is calculated assuming a purchase of a share on the first day and a sale on the last day of each year reported and includes reinvestment of dividends and distributions. Total returns may reflect adjustments to conform to generally accepted accounting principles. Total return includes the effect of expense subsidies.
(b) Calculated based on average shares outstanding during the year.
(c) Does not include expenses of the underlying portfolio in which the Fund invests.
* Less than $.005.
See Notes to Financial Statements.
| | |
| 44 | | Visit our website at www.prudentialfunds.com |
| | | | | | | | | | | | | | | | | | | | |
| Class L Shares | |
| | | Year Ended October 31, | |
| | | 2011 | | | 2010 | | | 2009 | | | 2008 | | | 2007 | |
| Per Share Operating Performance(b): | | | | | | | | | | | | | | | | | | | | |
| Net Asset Value, Beginning Of Year | | | $12.87 | | | | $10.46 | | | | $8.91 | | | | $18.12 | | | | $18.07 | |
| Income (loss) from investment operations: | | | | | | | | | | | | | | | | | | | | |
| Net investment income | | | .05 | | | | .05 | | | | .08 | | | | .12 | | | | .01 | |
| Net realized and unrealized gain (loss) on investments | | | .69 | | | | 2.42 | | | | 1.63 | | | | (5.56 | ) | | | 1.66 | |
| Total from investment operations | | | .74 | | | | 2.47 | | | | 1.71 | | | | (5.44 | ) | | | 1.67 | |
| Less Dividends and Distributions: | | | | | | | | | | | | | | | | | | | | |
| Dividends from net investment income | | | (.03 | ) | | | (.06 | ) | | | (.16 | ) | | | (.02 | ) | | | - | |
| Distributions from net realized gains | | | - | | | | - | | | | - | | | | (3.75 | ) | | | (1.62 | ) |
| Total dividends and distributions | | | (.03 | ) | | | (.06 | ) | | | (.16 | ) | | | (3.77 | ) | | | (1.62 | ) |
| Capital Contributions (Note 5) | | | - | | | | - | * | | | - | | | | - | | | | - | |
| Net asset value, end of year | | | $13.58 | | | | $12.87 | | | | $10.46 | | | | $8.91 | | | | $18.12 | |
| Total Return(a) | | | 5.77% | | | | 23.75% | | | | 19.75% | | | | (36.41)% | | | | 9.54% | |
| |
| Ratios/Supplemental Data: | |
| Net assets, end of year (in millions) | | | $10.9 | | | | $11.9 | | | | $11.5 | | | | $12.5 | | | | $29.1 | |
| Ratios to average net assets(c): | | | | | | | | | | | | | | | | | | | | |
Expenses after advisory fee waiver and
expense reimbursement | | | 1.88% | | | | 1.86% | | | | 1.97% | | | | 1.78% | | | | 1.73% | |
Expenses before advisory fee waiver and
expense reimbursement | | | 1.88% | | | | 1.86% | | | | 1.97% | | | | 1.78% | | | | 1.73% | |
| Net investment income | | | .38% | | | | .41% | | | | .94% | | | | .93% | | | | .08% | |
(a) Total return does not consider the effects of sales load. Total return is calculated assuming a purchase of a share on the first day and a sale on the last day of each year reported and includes reinvestment of dividends and distributions. Total returns may reflect adjustments to conform to generally accepted accounting principles. Total return includes the effect of expense subsidies.
(b) Calculated based on average shares outstanding during the year.
(c) Does not include expenses of the underlying portfolio in which the Fund invests.
* Less than $.005.
See Notes to Financial Statements.
| | | | |
| Prudential Mid-Cap Value Fund | | | 45 | |
Financial Highlights
continued
| | | | | | | | | | | | | | | | | | | | |
| Class M Shares | | | | | | | | | | | | | | | |
| | | Year Ended October 31, | |
| | | 2011 | | | 2010 | | | 2009 | | | 2008 | | | 2007(e) | |
| Per Share Operating Performance(b): | | | | | | | | | | | | | | | | | | | | |
| Net Asset Value, Beginning Of Year | | | $11.98 | | | | $9.73 | | | | $8.27 | | | | $17.06 | | | | $17.16 | |
| Income (loss) from investment operations: | | | | | | | | | | | | | | | | | | | | |
| Net investment income | | | .09 | | | | .08 | | | | .11 | | | | .14 | | | | .02 | |
| Net realized and unrealized gain (loss) on investments | | | .62 | | | | 2.25 | | | | 1.50 | | | | (5.10 | ) | | | 1.60 | |
| Total from investment operations | | | .71 | | | | 2.33 | | | | 1.61 | | | | (4.96 | ) | | | 1.62 | |
| Less Dividends and Distributions: | | | | | | | | | | | | | | | | | | | | |
| Dividends from net investment income | | | (.06 | ) | | | (.09 | ) | | | (.18 | ) | | | - | | | | - | |
| Distributions from net realized gains | | | - | | | | - | | | | - | | | | (3.84 | ) | | | (1.74 | ) |
| Total dividends and distributions | | | (.06 | ) | | | (.09 | ) | | | (.18 | ) | | | (3.84 | ) | | | (1.74 | ) |
| Capital Contributions (Note 3 and 5) | | | - | * | | | 0.01 | | | | .03 | | | | .01 | | | | .02 | |
| Net asset value, end of year | | | $12.63 | | | | $11.98 | | | | $9.73 | | | | $8.27 | | | | $17.06 | |
| Total Return(a) | | | 5.97% | | | | 24.19% | | | | 20.42% | | | | (35.54)% | | | | 9.92% | (c) |
| |
| Ratios/Supplemental Data: | | | | | | | | | | | | | | | |
| Net assets, end of year (in millions) | | | $1.0 | | | | $4.0 | | | | $9.5 | | | | $20.3 | | | | $69.7 | |
| Ratios to average net assets(d): | | | | | | | | | | | | | | | | | | | | |
Expenses after advisory fee waiver and
expense reimbursement | | | 1.63% | | | | 1.61% | | | | 1.72% | | | | 1.67% | | | | 1.69% | |
Expenses before advisory fee waiver and
expense reimbursement | | | 1.63% | | | | 1.61% | | | | 1.72% | | | | 1.67% | | | | 1.69% | |
| Net investment income | | | .66% | | | | .74% | | | | 1.39% | | | | 1.17% | | | | .11% | |
(a) Total return does not consider the effects of sales load. Total return is calculated assuming a purchase of a share on the first day and a sale on the last day of each year reported and includes reinvestment of dividends and distributions. Total returns may reflect adjustments to conform to generally accepted accounting principles. Total return includes the effect of expense subsidies.
(b) Calculated based on average shares outstanding during the year.
(c) Total return has been adjusted to reflect the manager payment for sales charges in excess of regulatory limits. If the manager had not adjusted the Fund, the total return would have been 8.95% for the year ended October 31, 2007.
(d) Does not include expenses of the underlying portfolio in which the Fund invests.
(e) Certain information has been adjusted to reflect a manager payment for sales charges incurred by shareholders in excess of regulatory limits. If the manager had not adjusted the Fund, the per share operating performance would reflect a net investment loss, net realized and unrealized gain on investments and distributions from net unrealized gains of $(.07), $1.56 and $(1.62), respectively. Furthermore, the annual expenses (both after and before fee waiver and expense reimbursement) and net investment income ratios would have been 2.23%, 2.23% and (.43)%, respectively and the ending net asset value would have been $17.03 for the year ended October 31, 2007.
* Less than $.005.
See Notes to Financial Statements.
| | |
| 46 | | Visit our website at www.prudentialfunds.com |
| | | | |
| Class Q Shares | |
| | | January 18, 2011(d) through October 31,
2011 | |
| Per Share Operating Performance(b): | | | | |
| Net Asset Value, Beginning Of Period | | | $14.50 | |
| Income (loss) from investment operations: | | | | |
| Net investment income | | | .11 | |
| Net realized and unrealized loss on investments | | | (.66 | ) |
| Total from investment operations | | | (.55 | ) |
| Net asset value, end of period | | | $13.95 | |
| Total Return(a) | | | (3.79)% | |
| |
| Ratios/Supplemental Data: | |
| Net assets, end of period (in millions) | | | $12.7 | |
| Ratios to average net assets(c): | | | | |
| Expenses after advisory fee waiver and expense reimbursement | | | 1.13% | (e) |
| Expenses before advisory fee waiver and expense reimbursement | | | 1.13% | (e) |
| Net investment income | | | .99% | (e) |
(a) Total return is calculated assuming a purchase of a share on the first day and a sale on the last day of each period reported and includes reinvestment of dividends and distributions. Total returns may reflect adjustments to conform to generally accepted accounting principles. Total return includes the effect of expense subsidies. Total returns for periods less than one full year are not annualized.
(b) Calculated based on average shares outstanding during the period.
(c) Does not include expenses of the underlying portfolio in which the Fund invests.
(d) Commencement of operations.
(e) Annualized.
See Notes to Financial Statements.
| | | | |
| Prudential Mid-Cap Value Fund | | | 47 | |
Financial Highlights
continued
| | | | | | | | | | | | | | | | | | | | |
| Class X Shares | | | | | | | | | | | | | | | |
| | | Year Ended October 31, | |
| | | 2011 | | | 2010 | | | 2009 | | | 2008 | | | 2007(c) | |
| Per Share Operating Performance(b): | | | | | | | | | | | | | | | | | | | | |
| Net Asset Value, Beginning Of Year | | | $12.05 | | | | $9.79 | | | | $8.37 | | | | $17.29 | | | | $17.23 | |
| Income (loss) from investment operations: | | | | | | | | | | | | | | | | | | | | |
| Net investment income | | | .09 | | | | .08 | | | | .10 | | | | .15 | | | | .10 | |
| Net realized and unrealized gain (loss) on investments | | | .62 | | | | 2.26 | | | | 1.52 | | | | (5.21 | ) | | | 1.58 | |
| Total from investment operations | | | .71 | | | | 2.34 | | | | 1.62 | | | | (5.06 | ) | | | 1.68 | |
| Less Dividends and Distributions: | | | | | | | | | | | | | | | | | | | | |
| Dividends from net investment income | | | (.06 | ) | | | (.09 | ) | | | (.21 | ) | | | (.11 | ) | | | - | |
| Distributions from net realized gains | | | - | | | | - | | | | - | | | | (3.75 | ) | | | (1.62 | ) |
| Total dividends and distributions | | | (.06 | ) | | | (.09 | ) | | | (.21 | ) | | | (3.86 | ) | | | (1.62 | ) |
| Capital Contributions (Note 3 and 5) | | | - | * | | | .01 | | | | .01 | | | | - | * | | | - | * |
| Net asset value, end of year | | | $12.70 | | | | $12.05 | | | | $9.79 | | | | $8.37 | | | | $17.29 | |
| Total Return(a) | | | 5.93% | | | | 24.15% | | | | 20.15% | | | | (36.07)% | | | | 10.04% | |
| |
| Ratios/Supplemental Data: | | | | | | | | | | | | | | | |
| Net assets, end of year (in millions) | | | $1.9 | | | | $4.1 | | | | $5.3 | | | | $6.9 | | | | $15.7 | |
| Ratios to average net assets(d): | | | | | | | | | | | | | | | | | | | | |
| Expenses after advisory fee waiver and expense reimbursement | | | 1.63% | | | | 1.61% | | | | 1.72% | | | | 1.48% | | | | 1.23% | |
| Expenses before advisory fee waiver and expense reimbursement | | | 1.63% | | | | 1.61% | | | | 1.72% | | | | 1.48% | | | | 1.23% | |
| Net investment income | | | .65% | | | | .69% | | | | 1.24% | | | | 1.23% | | | | .58% | |
(a) Total return does not consider the effects of sales load. Total return is calculated assuming a purchase of a share on the first day and a sale on the last day of each year reported and includes reinvestment of dividends and distributions. Total returns may reflect adjustments to conform to generally accepted accounting principles. Total return includes the effect of expense subsidies.
(b) Calculated based on average shares outstanding during the year.
(c) Certain information has been adjusted to reflect a manager payment for sales charges incurred by shareholders in excess of regulatory limits. Total Return has not been adjusted to reflect the manager payment for sales charges in excess of regulatory limits.
(d) Does not include expenses of the underlying portfolio in which the Fund invests.
* Less than $.005.
See Notes to Financial Statements.
| | |
| 48 | | Visit our website at www.prudentialfunds.com |
| | | | | | | | | | | | | | | | | | | | |
| Class Z Shares | | | | | | | | | | | | | | | |
| | | Year Ended October 31, | |
| | | 2011 | | | 2010 | | | 2009 | | | 2008 | | | 2007 | |
| Per Share Operating Performance(b): | | | | | | | | | | | | | | | | | | | | |
| Net Asset Value, Beginning Of Year | | | $13.21 | | | | $10.72 | | | | $9.14 | | | | $18.50 | | | | $18.30 | |
| Income (loss) from investment operations: | | | | | | | | | | | | | | | | | | | | |
| Net investment income | | | .15 | | | | .11 | | | | .11 | | | | .18 | | | | .11 | |
| Net realized and unrealized gain (loss) on investments | | | .67 | | | | 2.49 | | | | 1.69 | | | | (5.68 | ) | | | 1.71 | |
| Total from investment operations | | | .82 | | | | 2.60 | | | | 1.80 | | | | (5.50 | ) | | | 1.82 | |
| Less Dividends and Distributions: | | | | | | | | | | | | | | | | | | | | |
| Dividends from net investment income | | | (.09 | ) | | | (.11 | ) | | | (.22 | ) | | | (.11 | ) | | | - | |
| Distributions from net realized gains | | | - | | | | - | | | | - | | | | (3.75 | ) | | | (1.62 | ) |
| Total dividends and distributions | | | (.09 | ) | | | (.11 | ) | | | (.22 | ) | | | (3.86 | ) | | | (1.62 | ) |
| Capital Contributions (Note 5) | | | - | | | | - | * | | | - | | | | - | | | | - | |
| Net asset value, end of year | | | $13.94 | | | | $13.21 | | | | $10.72 | | | | $9.14 | | | | $18.50 | |
| Total Return(a) | | | 6.26% | | | | 24.43% | | | | 20.41% | | | | (36.08)% | | | | 10.24% | |
| |
| Ratios/Supplemental Data: | | | | | | | | | | | | | | | |
| Net assets, end of year (in millions) | | | $5.0 | | | | $16.8 | | | | $16.2 | | | | $8.2 | | | | $13.8 | |
| Ratios to average net assets(c): | | | | | | | | | | | | | | | | | | | | |
| Expenses after advisory fee waiver and expense reimbursement | | | 1.38% | | | | 1.36% | | | | 1.47% | | | | 1.28% | | | | 1.23% | |
| Expenses before advisory fee waiver and expense reimbursement | | | 1.38% | | | | 1.36% | | | | 1.47% | | | | 1.28% | | | | 1.23% | |
| Net investment income | | | 1.07% | | | | .90% | | | | 1.18% | | | | 1.43% | | | | .58% | |
(a) Total return is calculated assuming a purchase of a share on the first day and a sale on the last day of each year reported and includes reinvestment of dividends and distributions. Total returns may reflect adjustments to conform to generally accepted accounting principles. Total return includes the effect of expense subsidies.
(b) Calculated based on average shares outstanding during the year.
(c) Does not include expenses of the underlying portfolio in which the Fund invests.
* Less than $.005.
See Notes to Financial Statements.
| | | | |
| Prudential Mid-Cap Value Fund | | | 49 | |
Report of Independent Registered Public
Accounting Firm
The Board of Directors and Shareholders
Prudential Investment Portfolios, Inc. 10:
We have audited the accompanying statement of assets and liabilities of Prudential Mid-Cap Value Fund, a series of Prudential Investment Portfolios, Inc. 10 (hereafter referred to as the “Fund”), including the portfolio of investments, as of October 31, 2011, and the related statement of operations for the year then ended, the statement of changes in net assets for each of the years in the two-year period then ended and the financial highlights for each of the years in the five-year period then ended. These financial statements and financial highlights are the responsibility of the Fund’s management. Our responsibility is to express an opinion on these financial statements and financial highlights based on our audits.
We conducted our audits in accordance with the standards of the Public Company Accounting Oversight Board (United States). Those standards require that we plan and perform the audit to obtain reasonable assurance about whether the financial statements and financial highlights are free of material misstatement. An audit includes examining, on a test basis, evidence supporting the amounts and disclosures in the financial statements. Our procedures included confirmation of securities owned as of October 31, 2011, by correspondence with the custodian, transfer agent and brokers or by other appropriate auditing procedures when replies from brokers were not received. An audit also includes assessing the accounting principles used and significant estimates made by management, as well as evaluating the overall financial statement presentation. We believe that our audits provide a reasonable basis for our opinion.
In our opinion, the financial statements and financial highlights referred to above present fairly, in all material respects, the financial position of the Fund as of October 31, 2011, and the results of its operations for the year then ended, the changes in its net assets for each of the years in the two-year period then ended and the financial highlights for each of the years in the five-year period then ended, in conformity with U.S. generally accepted accounting principles.

New York, New York
December 22, 2011
| | |
| 50 | | Visit our website at www.prudentialfunds.com |
Tax Information
(Unaudited)
We are required by the Internal Revenue Code of 1986, as amended (“the Code”) to advise you within 60 days of the Fund’s fiscal year end (October 31, 2011), as to the federal income tax status of dividends paid by the Fund during such fiscal year. For the fiscal year ended October 31, 2011, the Fund paid ordinary income dividends of $0.06 for Class A shares, $0.03 for Class L shares, $0.06 for Class M shares and Class X shares and $0.09 for Class Z shares.
For the year ended October 31, 2011, the Fund designates the maximum amount allowable, but not less than 100% of ordinary income dividends paid during the fiscal year as eligible for the corporate dividend received deduction in accordance with Section 854 of the Internal Revenue Code.
For the year ended October 31, 2011, the Fund designates the maximum amount allowable, but not less than 100% of ordinary income dividends paid during the fiscal year as qualified dividend income in accordance with Section 854 of the Internal Revenue Code.
In January 2012, you will be advised on IRS Form 1099DIV or substitute 1099DIV as to federal tax status of dividends and distributions received by you in calendar year 2011.
| | | | |
| Prudential Mid-Cap Value Fund | | | 51 | |
INFORMATION ABOUT BOARD MEMBERS AND OFFICERS
(Unaudited)
Information about Board Members and Officers is set forth below. Board Members who are not deemed to be “interested persons” of the Fund, as defined in the 1940 Act, are referred to as “Independent Board Members.” Board Members who are deemed to be “interested persons” of the Fund are referred to as “Interested Board Members.” The Board Members are responsible for the overall supervision of the operations of the Fund and perform the various duties imposed on the directors of investment companies by the 1940 Act.
| | | | |
Independent Board Members(1) | | | | |
Name, Address, Age Position(s) Portfolios Overseen | | Principal Occupation(s) During Past Five Years | | Other Directorships Held |
Kevin J. Bannon (59) Board Member Portfolios Overseen: 58 | | Managing Director (since April 2008) and Chief Investment Officer (since October 2008) of Highmount Capital LLC (registered investment adviser); formerly Executive Vice President and Chief Investment Officer (April 1993-August 2007) of Bank of New York Company; President (May 2003-May 2007) of BNY Hamilton Family of Mutual Funds. | | Director of Urstadt Biddle Properties (since September 2008). |
Linda W. Bynoe (59) Board Member Portfolios Overseen: 58 | | President and Chief Executive Officer (since March 1995) and formerly Chief Operating Officer (December 1989-February 1995) of Telemat Ltd. (management consulting); formerly Vice President (January 1985-June 1989) at Morgan Stanley & Co (broker-dealer). | | Director of Simon Property Group, Inc. (retail real estate) (since May 2003); Director of Anixter International, Inc. (communication products distributor) (since January 2006); Director of Northern Trust Corporation (financial services) (since April 2006); Trustee of Equity Residential (residential real estate) (since December 2009); formerly Director of Dynegy Inc. (power generation) (September 2002-May 2006). |
Michael S. Hyland, CFA (66) Board Member Portfolios Overseen: 58 | | Independent Consultant (since February 2005); formerly Senior Managing Director (July 2001-February 2005) of Bear Stearns & Co, Inc.; Global Partner, INVESCO (1999-2001); Managing Director and President of Salomon Brothers Asset Management (1989-1999). | | None. |
Douglas H. McCorkindale (72) Board Member Portfolios Overseen: 58 | | Formerly Chairman (February 2001-June 2006), Chief Executive Officer (June 2000-July 2005), President (September 1997-July 2005) and Vice Chairman (March 1984-May 2000) of Gannett Co. Inc. (publishing and media). | | Director of Lockheed Martin Corp. (aerospace and defense) (since May 2001). |
Visit our website at www.prudentialfunds.com
| | | | |
Independent Board Members(1) | | | | |
Name, Address, Age Position(s) Portfolios Overseen | | Principal Occupation(s) During Past Five Years | | Other Directorships Held |
Stephen P. Munn (69) Board Member Portfolios Overseen: 58 | | Lead Director (since 2007) and formerly Chairman (1993-2007) of Carlisle Companies Incorporated (manufacturer of industrial products). | | Lead Director (since 2007) of Carlisle Companies Incorporated (manufacturer of industrial products). |
Richard A. Redeker (68) Board Member & Independent Chair Portfolios Overseen: 58 | | Retired Mutual Fund Senior Executive (43 years); Management Consultant; Independent Directors Council (organization of 2,800 Independent Mutual Fund Directors)-Executive Committee, Chair of Policy Steering Committee, Governing Council. | | None. |
Robin B. Smith (72) Board Member Portfolios Overseen: 58 | | Chairman of the Board (since January 2003) of Publishers Clearing House (direct marketing); Member of the Board of Directors of ADLPartner (marketing) (since December 2010); formerly Chairman and Chief Executive Officer (August 1996-January 2003) of Publishers Clearing House. | | Formerly Director of BellSouth Corporation (telecommunications) (1992-2006). |
Stephen G. Stoneburn (68) Board Member Portfolios Overseen: 58 | | President and Chief Executive Officer (since June 1996) of Quadrant Media Corp. (publishing company); formerly President (June 1995-June 1996) of Argus Integrated Media, Inc.; Senior Vice President and Managing Director (January 1993-1995) of Cowles Business Media; Senior Vice President of Fairchild Publications, Inc (1975-1989). | | None. |
Prudential Mid-Cap Value Fund
| | | | |
| Interested Board Members(1) | | | | |
Name, Address, Age Position(s) Portfolios Overseen | | Principal Occupation(s) During Past Five Years | | Other Directorships Held |
Judy A. Rice* (63) Board Member & President Portfolios Overseen: 58 | | President, Chief Executive Officer, Chief Operating Officer and Officer-In-Charge (since February 2003) of Prudential Investments LLC; President, Chief Executive Officer and Officer-In-Charge (since April 2003) of Prudential Mutual Fund Services LLC; President, Chief Executive Officer (since May 2011) and Executive Vice President (since December 2008) of Prudential Investment Management Services LLC; Member of the Board of Directors of Jennison Associates LLC (since November 2010); formerly Vice President (February 1999-April 2006) of Prudential Investment Management Services LLC; President, COO, CEO and Manager of PIFM Holdco, LLC (since April 2006); formerly President, Chief Executive Officer, Chief Operating Officer and Officer-In-Charge (May 2003-June 2005) and Director (May 2003-March 2006) and Executive Vice President (June 2005-March 2006) of AST Investment Services, Inc.; Member of Board of Governors of the Investment Company Institute. | | None. |
Stuart S. Parker* (49) Board Member & President Portfolios Overseen: 58 | | President of Prudential Investments LLC (since January 2012); Executive Vice President of Jennison Associates LLC and Head of Retail Distribution of Prudential Investments LLC (June 2005 - December 2011). | | None. |
Scott E. Benjamin (38) Board Member & Vice President Portfolios Overseen: 58 | | Executive Vice President (since June 2009) of Prudential Investments LLC and Prudential Investment Management Services LLC; Executive Vice President (since September 2009) of AST Investment Services, Inc.; Senior Vice President of Product Development and Marketing, Prudential Investments (since February 2006); Vice President of Product Development and Product Management, Prudential Investments (2003-2006). | | None. |
*Ms. Rice has announced her retirement as President and Board Member effective December 31, 2011. Ms. Rice has been appointed as Vice President effective January 1, 2012. The Board has appointed Stuart S. Parker as President and Board Member effective January 1, 2012.
Visit our website at www.prudentialfunds.com
(1) The year in which each individual joined the Fund’s Board is as follows:
Linda W. Bynoe, 2005; Douglas H. McCorkindale, 2003, Richard A. Redeker, 2003; Robin B. Smith, 2003; Stephen G. Stoneburn, 2003; Kevin J. Bannon, 2008; Michael S. Hyland, 2008; Stephen P. Munn, 2008; Judy A. Rice, Board Member and President since 2003; Scott E. Benjamin, Board Member since 2010 and Vice President since 2009.
| | |
| Fund Officers(a)(1) | | |
Name, Address and Age Position with Fund | | Principal Occupation(s) During Past Five Years |
Kathryn L. Quirk (59) Chief Legal Officer | | Vice President and Corporate Counsel (since September 2004) of Prudential; Executive Vice President, Chief Legal Officer and Secretary (since July 2005) of PI and Prudential Mutual Fund Services LLC; Vice President and Corporate Counsel (since June 2005) and Secretary (since February 2006) of AST Investment Services, Inc.; formerly Senior Vice President and Assistant Secretary (November 2004-August 2005) of PI; formerly Assistant Secretary (June 2005-February 2006) of AST Investment Services, Inc.; formerly Managing Director, General Counsel, Chief Compliance Officer, Chief Risk Officer and Corporate Secretary (1997-2002) of Zurich Scudder Investments, Inc. |
Deborah A. Docs (53) Secretary | | Vice President and Corporate Counsel (since January 2001) of Prudential; Vice President (since December 1996) and Assistant Secretary (since March 1999) of PI; formerly Vice President and Assistant Secretary (May 2003-June 2005) of AST Investment Services, Inc. |
Jonathan D. Shain (53) Assistant Secretary | | Vice President and Corporate Counsel (since August 1998) of Prudential; Vice President and Assistant Secretary (since May 2001) of PI; Vice President and Assistant Secretary (since February 2001) of PMFS; formerly Vice President and Assistant Secretary (May 2003-June 2005) of AST Investment Services, Inc. |
Claudia DiGiacomo (37) Assistant Secretary | | Vice President and Corporate Counsel (since January 2005) of Prudential; Vice President and Assistant Secretary of PI (since December 2005); Associate at Sidley Austin Brown & Wood LLP (1999-2004). |
John P. Schwartz (40) Assistant Secretary | | Vice President and Corporate Counsel (since April 2005) of Prudential; Vice President and Assistant Secretary of PI (since December 2005); Associate at Sidley Austin Brown & Wood LLP (1997-2005). |
Andrew R. French (49) Assistant Secretary | | Vice President and Corporate Counsel (since February 2010) of Prudential; formerly Director and Corporate Counsel (2006-2010) of Prudential; Vice President and Assistant Secretary (since January 2007) of PI; Vice President and Assistant Secretary (since January 2007) of PMFS. |
Timothy J. Knierim (52) Chief Compliance Officer | | Chief Compliance Officer of Prudential Investment Management, Inc. (since July 2007); formerly Chief Risk Officer of PIM and PI (2002-2007) and formerly Chief Ethics Officer of PIM and PI (2006-2007). |
Valerie M. Simpson (53) Deputy Chief Compliance Officer | | Chief Compliance Officer (since April 2007) of PI and AST Investment Services, Inc.; formerly Vice President-Financial Reporting (June 1999-March 2006) for Prudential Life and Annuities Finance. |
Prudential Mid-Cap Value Fund
| | |
| Fund Officers(a)(1) | | |
Name, Address and Age Position with Fund | | Principal Occupation(s) During Past Five Years |
Theresa C. Thompson (49) Deputy Chief Compliance Officer | | Vice President, Compliance, PI (since April 2004); and Director, Compliance, PI (2001-2004). |
Richard W. Kinville (43) Anti-Money Laundering Compliance Officer | | Vice President, Corporate Compliance, Anti-Money Laundering Unit (since January 2005) of Prudential; committee member of the American Council of Life Insurers Anti-Money Laundering and Critical Infrastructure Committee (since January 2007); formerly Investigator and Supervisor in the Special Investigations Unit for the New York Central Mutual Fire Insurance Company (August 1994-January 1999); Investigator in AXA Financial’s Internal Audit Department and Manager in AXA’s Anti-Money Laundering Office (January 1999-January 2005); first chair of the American Council of Life Insurers Anti-Money Laundering and Critical Infrastructure Committee (June 2007-December 2009). |
Grace C. Torres (52) Treasurer and Principal Financial and Accounting Officer | | Assistant Treasurer (since March 1999) and Senior Vice President (since September 1999) of PI; Assistant Treasurer (since May 2003) and Vice President (since June 2005) of AST Investment Services, Inc.; Senior Vice President and Assistant Treasurer (since May 2003) of Prudential Annuities Advisory Services, Inc.; formerly Senior Vice President (May 2003-June 2005) of AST Investment Services, Inc. |
M. Sadiq Peshimam (47) Assistant Treasurer | | Vice President (since 2005) of Prudential Investments LLC. |
Peter Parrella (53) Assistant Treasurer | | Vice President (since 2007) and Director (2004-2007) within Prudential Mutual Fund Administration; formerly Tax Manager at SSB Citi Fund Management LLC (1997-2004). |
(a) Excludes Ms. Rice and Mr. Benjamin, interested Board Members who also serve as President and Vice President, respectively.
(1) The year in which each individual became an Officer of the Fund is as follows:
Kathryn L. Quirk, 2005; Deborah A. Docs, 2003; Jonathan D. Shain, 2003; Claudia DiGiacomo, 2005; John P. Schwartz, 2006; Andrew R. French, 2006; Timothy J. Knierim, 2007; Valerie M. Simpson, 2007; Theresa C. Thompson, 2008; Richard W. Kinville, 2011; Grace C. Torres, 2003; Peter Parrella, 2007; M. Sadiq Peshimam, 2006.
Explanatory Notes to Tables:
| n | Board Members are deemed to be “Interested,” as defined in the 1940 Act, by reason of their affiliation with Prudential Investments LLC and/or an affiliate of Prudential Investments LLC. |
| n | Unless otherwise noted, the address of all Board Members and Officers is c/o Prudential Investments LLC, Gateway Center Three, 100 Mulberry Street, Newark, New Jersey 07102-4077. |
| n | There is no set term of office for Board Members or Officers. The Board Members have adopted a retirement policy, which calls for the retirement of Board Members on December 31 of the year in which they reach the age of 75. |
| n | “Other Directorships Held” includes only directorships of companies required to register or file reports with the SEC under the 1934 Act) (that is, “public companies”) or other investment companies registered under the 1940 Act. |
| n | “Portfolios Overseen” includes all investment companies managed by Prudential Investments LLC. The investment companies for which PI serves as manager include the Prudential Investments Mutual Funds, The Prudential Variable Contract Accounts, Target Mutual Funds, The Prudential Series Fund, Prudential’s Gibraltar Fund, Inc. and the Advanced Series Trust. |
Visit our website at www.prudentialfunds.com
Approval of Advisory Agreements
The Fund’s Board of Directors
The Board of Directors (the “Board”) of Prudential Mid-Cap Value Fund (the “Fund”)1 consists of 10 individuals, eight of whom are not “interested persons” of the Fund, as defined in the Investment Company Act of 1940, as amended (the “1940 Act”) (the “Independent Directors”). The Board is responsible for the oversight of the Fund and its operations, and performs the various duties imposed on the directors of investment companies by the 1940 Act. The Independent Directors have retained independent legal counsel to assist them in connection with their duties. The Chair of the Board is an Independent Director. The Board has established three standing committees: the Audit Committee, the Nominating and Governance Committee, and the Investment Committee. Each committee is chaired by, and composed of, Independent Directors.
Annual Approval of the Fund’s Advisory Agreements
As required under the 1940 Act, the Board determines annually whether to renew the Fund’s management agreement with Prudential Investments LLC (“PI”) and the Fund’s subadvisory agreement with Quantitative Management Associates LLC (“QMA”). In considering the renewal of the agreements, the Board, including all of the Independent Directors, met on June 6-8, 2011 and approved the renewal of the agreements through July 31, 2012, after concluding that the renewal of the agreements was in the best interests of the Fund and its shareholders.
In advance of the meetings, the Board requested and received materials relating to the agreements, and had the opportunity to ask questions and request further information in connection with its consideration. Among other things, the Board considered comparative fee information from PI and QMA. Also, the Board considered comparisons with other mutual funds in relevant Peer Universes and Peer Groups. The mutual funds included in each Peer Universe or Peer Group were objectively determined by Lipper Inc. (“Lipper”), an independent provider of mutual fund data. The comparisons placed the Fund in various quartiles over the one-, three- and five-year periods ending December 31, 2010, with the first quartile being the best 25% of the mutual funds (for performance, the best performing mutual funds and, for expenses, the lowest cost mutual funds).
In approving the agreements, the Board, including the Independent Directors advised by independent legal counsel, considered the factors it deemed relevant, including the nature, quality and extent of services provided by PI and the subadviser, the performance of the Fund, the profitability of PI and its affiliates, expenses and fees, and the potential for economies of scale that may be shared with the Fund and its
| 1 | Prudential Mid-Cap Value Fund is a series of Prudential Investment Portfolios, Inc. 10. |
Prudential Mid-Cap Value Fund
Approval of Advisory Agreements (continued)
shareholders as the Fund’s assets grow. In their deliberations, the Directors did not identify any single factor which alone was responsible for the Board’s decision to approve the agreements with respect to the Fund. In connection with its deliberations, the Board considered information provided by PI throughout the year at regular Board meetings, presentations from portfolio managers and other information, as well as information furnished at or in advance of the meetings on June 6-8, 2011.
The Directors determined that the overall arrangements between the Fund and PI, which serves as the Fund’s investment manager pursuant to a management agreement, and between PI and QMA, which serves as the Fund’s subadviser pursuant to the terms of a subadvisory agreement with PI, are in the interest of the Fund and its shareholders in light of the services performed, fees charged and such other matters as the Directors considered relevant in the exercise of their business judgment.
The material factors and conclusions that formed the basis for the Directors’ reaching their determinations to approve the continuance of the agreements are separately discussed below.
Nature, Quality and Extent of Services
The Board received and considered information regarding the nature, quality and extent of services provided to the Fund by PI and QMA. The Board considered the services provided by PI, including but not limited to the oversight of the subadviser for the Fund, as well as the provision of fund recordkeeping, compliance, and other services to the Fund. With respect to PI’s oversight of the subadviser, the Board noted that PI’s Strategic Investment Research Group (“SIRG”), which is a business unit of PI, is responsible for monitoring and reporting to PI’s senior management on the performance and operations of the subadviser. The Board also considered that PI pays the salaries of all of the officers and non-independent Directors of the Fund. The Board also considered the investment subadvisory services provided by QMA, as well as adherence to the Fund’s investment restrictions and compliance with applicable Fund policies and procedures. The Board considered PI’s evaluation of the subadviser, as well as PI’s recommendation, based on its review of the subadviser, to renew the subadvisory agreement.
The Board reviewed the qualifications, backgrounds and responsibilities of PI’s senior management responsible for the oversight of the Fund and QMA, and also reviewed the qualifications, backgrounds and responsibilities of the QMA portfolio managers who are responsible for the day-to-day management of the Fund’s portfolio. The Board was provided with information pertaining to PI’s and QMA’s organizational structure, senior management, investment operations, and other relevant information
Visit our website at www.prudentialfunds.com
pertaining to PI and QMA. The Board also noted that it received favorable compliance reports from the Fund’s Chief Compliance Officer (“CCO”) as to each of PI and QMA. The Board noted that QMA is affiliated with PI.
The Board concluded that it was satisfied with the nature, extent and quality of the investment management services provided by PI and the subadvisory services provided to the Fund by QMA, and that there was a reasonable basis on which to conclude that the Fund benefits from the services provided by PI and QMA under the management and subadvisory agreements.
Performance of the Fund
The Board received and considered information about the Fund’s historical performance. The Board considered that the Fund’s gross performance in relation to its Peer Universe (the Lipper Mid-Cap Value Funds Performance Universe) was in the first quartile over the three-year period, in the second quartile over the five-year period, and in the third quartile over the one-year period. The Board also noted that the Fund outperformed its benchmark index over the three- and five-year periods, though it underperformed its benchmark index over the one-year period. The Board further noted that the Fund’s performance was in the first quartile for the first quarter of 2011. The Board concluded that, in light of the Fund’s competitive performance over longer time periods, it would be in the interest of the Fund and its shareholders for the Fund to renew the agreements.
Fees and Expenses
The Board considered the Fund’s actual management fees (which reflects any subsidies, expense caps or waivers) and total expenses both ranked in the Expense Group’s fourth quartile. The Board considered PI’s explanation that the Fund’s fourth quartile ranking for total expenses was attributable to relatively high transfer agency fees resulting from a large number of small balance accounts.
The Board concluded that the management fees and total expenses were reasonable in light of the services provided, including the Fund’s subadvisory fees and competitive performance over longer time periods.
Costs of Services and Profits Realized by PI
The Board was provided with information on the profitability of PI and its affiliates in serving as the Fund’s investment manager. The Board discussed with PI the methodology utilized in assembling the information regarding profitability and considered its reasonableness. The Board recognized that it is difficult to make comparisons of profitability from fund management contracts because comparative information is not
Prudential Mid-Cap Value Fund
Approval of Advisory Agreements (continued)
generally publicly available and is affected by numerous factors, including the structure of the particular adviser, the types of funds it manages, its business mix, numerous assumptions regarding allocations and the adviser’s capital structure and cost of capital. The Board did not separately consider the profitability of the subadviser, an affiliate of PI, as its profitability was reflected in the profitability report for PI. Taking these factors into account, the Board concluded that the profitability of PI and its affiliates in relation to the services rendered was not unreasonable.
Economies of Scale
The Board received and discussed information concerning whether PI realizes economies of scale as the Fund’s assets grow beyond current levels. The Board noted that the management fee schedule for the Fund includes breakpoints, which have the effect of decreasing the fee rate as assets increase, but at the current level of assets, the Fund does not realize the effect of those rate reductions. The Board took note that the Fund’s fee structure would result in benefits to Fund shareholders when (and if) assets reach the levels at which the fee rate is reduced. These benefits will accrue whether or not PI is then realizing any economies of scale.
Other Benefits to PI and QMA
The Board considered potential ancillary benefits that might be received by PI and QMA and their affiliates as a result of their relationship with the Fund. The Board concluded that potential benefits to be derived by PI included fees received by affiliates of PI for serving as the Fund’s securities lending agent, transfer agency fees received by the Fund’s transfer agent (which is affiliated with PI), and benefits to the reputation as well as other intangible benefits resulting from PI’s association with the Fund. The Board concluded that the potential benefits to be derived by QMA included its ability to use soft dollar credits, as well as the potential benefits consistent with those generally resulting from an increase in assets under management, specifically, potential access to additional research resources and benefits to the reputation. The Board concluded that the benefits derived by PI and QMA were consistent with the types of benefits generally derived by investment managers and subadvisers to mutual funds.
After full consideration of these factors, the Board concluded that the approval of the agreements was in the interest of the Fund and its shareholders.
Visit our website at www.prudentialfunds.com
| | | | |
| n MAIL | | n TELEPHONE | | n WEBSITE |
Gateway Center Three 100 Mulberry Street Newark, NJ 07102 | | (800) 225-1852 | | www.prudentialfunds.com |
|
| PROXY VOTING |
| The Board of Directors of the Fund has delegated to the Fund’s investment subadviser the responsibility for voting any proxies and maintaining proxy recordkeeping with respect to the Fund. A description of these proxy voting policies and procedures is available without charge, upon request, by calling (800) 225-1852 or by visiting the Securities and Exchange Commission’s website at www.sec.gov. Information regarding how the Fund voted proxies relating to portfolio securities during the most recent 12-month period ended June 30 is available on the Fund’s website and on the Commission’s website. |
|
| DIRECTORS |
| Kevin J. Bannon • Scott E. Benjamin • Linda W. Bynoe • Michael S. Hyland • Douglas H. McCorkindale • Stephen P. Munn • Richard A. Redeker • Judy A. Rice • Robin B. Smith • Stephen G. Stoneburn |
|
| OFFICERS |
| Judy A. Rice, President • Scott E. Benjamin, Vice President • Grace C. Torres, Treasurer and Principal Financial and Accounting Officer • Kathryn L. Quirk, Chief Legal Officer • Deborah A. Docs, Secretary • Timothy J. Knierim, Chief Compliance Officer • Valerie M. Simpson, Deputy Chief Compliance Officer • Theresa C. Thompson, Deputy Chief Compliance Officer • Richard W. Kinville, Anti-Money Laundering Compliance Officer • Jonathan D. Shain, Assistant Secretary • Claudia DiGiacomo, Assistant Secretary • John P. Schwartz, Assistant Secretary • Andrew R. French, Assistant Secretary • M. Sadiq Peshimam, Assistant Treasurer • Peter Parrella, Assistant Treasurer |
| | | | |
| MANAGER | | Prudential Investments LLC | | Gateway Center Three
100 Mulberry Street
Newark, NJ 07102 |
|
| INVESTMENT SUBADVISER | | Quantitative Management
Associates LLC | | Gateway Center Two
100 Mulberry Street
Newark, NJ 07102 |
|
| DISTRIBUTORS | | Prudential Annuities
Distributors, Inc. | | One Corporate Drive
Shelton, CT 06484 |
| | |
| | Prudential Investment
Management Services LLC | | Gateway Center Three
100 Mulberry Street
Newark, NJ 07102 |
|
| CUSTODIAN | | The Bank of New York Mellon | | One Wall Street
New York, NY 10286 |
|
| TRANSFER AGENT | | Prudential Mutual Fund
Services LLC | | PO Box 9658
Providence, RI 02940 |
|
| INDEPENDENT REGISTERED PUBLIC ACCOUNTING FIRM | | KPMG LLP | | 345 Park Avenue
New York, NY 10154 |
|
| FUND COUNSEL | | Willkie Farr & Gallagher LLP | | 787 Seventh Avenue
New York, NY 10019 |
|
| An investor should consider the investment objectives, risks, charges, and expenses of the Fund carefully before investing. The prospectus and summary prospectus contain this and other information about the Fund. An investor may obtain a prospectus and summary prospectus by visiting our website at www.prudentialfunds.com or by calling (800) 225-1852. The prospectus and summary prospectus should be read carefully before investing. |
|
| E-DELIVERY |
| To receive your mutual fund documents online, go to www.prudentialfunds.com/edelivery and enroll. Instead of receiving printed documents by mail, you will receive notification via email when new materials are available. You can cancel your enrollment or change your email address at any time by visiting the website address above. |
|
| SHAREHOLDER COMMUNICATIONS WITH DIRECTORS |
| Shareholders can communicate directly with the Board of Directors by writing to the Chair of the Board, Prudential Mid-Cap Value Fund, Prudential Investments, Attn: Board of Directors, 100 Mulberry Street, Gateway Center Three, Newark, NJ 07102. Shareholders can communicate directly with an individual Director by writing to the same address. Communications are not screened before being delivered to the addressee. |
|
| AVAILABILITY OF PORTFOLIO SCHEDULE |
| The Fund files its complete schedule of portfolio holdings with the Securities and Exchange Commission for the first and third quarters of each fiscal year on Form N-Q. The Fund’s Forms N-Q are available on the Commission’s website at www.sec.gov. The Fund’s Forms N-Q may also be reviewed and copied at the Commission’s Public Reference Room in Washington, D.C. Information on the operation and location of the Public Reference Room may be obtained by calling (202) 551-8090. The Fund’s schedule of portfolio holdings is also available on the Fund’s website as of the end of each month. |
|
| The Fund’s Statement of Additional Information contains additional information about the Fund’s Directors and is available without charge, upon request, by calling (800) 225-1852. |
Mutual Funds:
| | | | |
ARE NOT INSURED BY THE FDIC OR ANY
FEDERAL GOVERNMENT AGENCY | | MAY LOSE VALUE | | ARE NOT A DEPOSIT OF OR GUARANTEED BY ANY BANK OR ANY BANK AFFILIATE |

PRUDENTIAL MID-CAP VALUE FUND
| | | | | | | | | | | | | | | | |
| SHARE CLASS | | A | | B | | C | | L | | M | | Q | | X | | Z |
| NASDAQ | | SPRAX | | SVUBX | | NCBVX | | NABVX | | NBBVX | | PMVQX | | NBVZX | | SPVZX |
| CUSIP | | 74441L105 | | 74441L204 | | 74441L303 | | 74441L402 | | 74441L501 | | 74441L824 | | 74441L600 | | 74441L709 |
MF202E 0215422-00001-00
Item 2 – Code of Ethics — See Exhibit (a)
As of the end of the period covered by this report, the registrant has adopted a code of ethics (the “Section 406 Standards for Investment Companies – Ethical Standards for Principal Executive and Financial Officers”) that applies to the registrant’s Principal Executive Officer and Principal Financial Officer; the registrant’s Principal Financial Officer also serves as the Principal Accounting Officer.
The registrant hereby undertakes to provide any person, without charge, upon request, a copy of the code of ethics. To request a copy of the code of ethics, contact the registrant 800-225-1852, and ask for a copy of the Section 406 Standards for Investment Companies - Ethical Standards for Principal Executive and Financial Officers.
Item 3 – Audit Committee Financial Expert –
The registrant’s Board has determined that Mr. Stephen P. Munn, member of the Board’s Audit Committee is an “audit committee financial expert,” and that he is “independent,” for purposes of this Item.
Item 4 – Principal Accountant Fees and Services –
(a) Audit Fees
For the fiscal years ended October 31, 2011 and October 31, 2010, KPMG LLP (“KPMG”), the Registrant’s principal accountant, billed the Registrant $47,000 and $46,000, respectively, for professional services rendered for the audit of the Registrant’s annual financial statements or services that are normally provided in connection with statutory and regulatory filings.
(b) Audit-Related Fees
None.
(c) Tax Fees
None.
(d) All Other Fees
None.
(e) (1) Audit Committee Pre-Approval Policies and Procedures
THE PRUDENTIAL MUTUAL FUNDS
AUDIT COMMITTEE POLICY
on
Pre-Approval of Services Provided by the Independent Accountants
The Audit Committee of each Prudential Mutual Fund is charged with the responsibility to monitor the independence of the Fund’s independent accountants. As part of this responsibility, the Audit Committee must pre-approve any independent accounting firm’s engagement to render audit and/or permissible non-audit services, as required by law. In evaluating a proposed engagement of the independent accountants, the Audit Committee will assess the effect that the engagement might reasonably be expected to have on the accountant’s independence. The Committee’s evaluation will be based on:
| | • | | a review of the nature of the professional services expected to be provided, |
| | • | | a review of the safeguards put into place by the accounting firm to safeguard independence, and |
| | • | | periodic meetings with the accounting firm. |
Policy for Audit and Non-Audit Services Provided to the Funds
On an annual basis, the scope of audits for each Fund, audit fees and expenses, and audit-related and non-audit services (and fees proposed in respect thereof) proposed to be performed by the Fund’s independent accountants will be presented by the Treasurer and the independent accountants to the Audit Committee for review and, as appropriate, approval prior to the initiation of such services. Such presentation shall be accompanied by confirmation by both the Treasurer and the independent accountants that the proposed services will not adversely affect the independence of the independent accountants. Proposed services shall be described in sufficient detail to enable the Audit Committee to assess the appropriateness of such services and fees, and the compatibility of the provision of such services with the auditor’s independence. The Committee shall receive periodic reports on the progress of the audit and other services which are approved by the Committee or by the Committee Chair pursuant to authority delegated in this Policy.
The categories of services enumerated under “Audit Services”, “Audit-related Services”, and “Tax Services” are intended to provide guidance to the Treasurer and the independent accountants as to those categories of services which the Committee believes are generally consistent with the independence of the independent accountants and which the Committee (or the Committee Chair) would expect upon the presentation of specific proposals to pre-approve. The enumerated categories are not intended as an exclusive list of audit, audit-related or tax services, which the Committee (or the Committee Chair) would consider for pre-approval.
Audit Services
The following categories of audit services are considered to be consistent with the role of the Fund’s independent accountants:
| | • | | Annual Fund financial statement audits |
| | • | | Seed audits (related to new product filings, as required) |
| | • | | SEC and regulatory filings and consents |
Audit-related Services
The following categories of audit-related services are considered to be consistent with the role of the Fund’s independent accountants:
| | • | | Accounting consultations |
| | • | | Fund merger support services |
| | • | | Agreed Upon Procedure Reports |
| | • | | Other Internal Control Reports |
Individual audit-related services that fall within one of these categories and are not presented to the Audit Committee as part of the annual pre-approval process will be subject to pre-approval by the Committee Chair (or any other Committee member on whom this responsibility has been delegated) so long as the estimated fee for those services does not exceed $50,000.
Tax Services
The following categories of tax services are considered to be consistent with the role of the Fund’s independent accountants:
| | • | | Tax compliance services related to the filing or amendment of the following: |
| | • | | Federal, state and local income tax compliance; and, |
| | • | | Sales and use tax compliance |
| | • | | Timely RIC qualification reviews |
| | • | | Tax distribution analysis and planning |
| | • | | Tax authority examination services |
| | • | | Tax appeals support services |
| | • | | Accounting methods studies |
| | • | | Fund merger support services |
| | • | | Tax consulting services and related projects |
Individual tax services that fall within one of these categories and are not presented to the Audit Committee as part of the annual pre-approval process will be subject to pre-approval by the Committee Chair (or any other Committee member on whom this responsibility has been delegated) so long as the estimated fee for those services does not exceed $50,000.
Other Non-audit Services
Certain non-audit services that the independent accountants are legally permitted to render will be subject to pre-approval by the Committee or by one or more Committee members to whom the Committee has delegated this authority and who will report to the full Committee any pre-approval decisions made pursuant to this Policy. Non-audit services presented for pre-approval pursuant to this paragraph will be accompanied by a confirmation from both the Treasurer and the independent accountants that the proposed services will not adversely affect the independence of the independent accountants.
Proscribed Services
The Fund’s independent accountants will not render services in the following categories of non-audit services:
| | • | | Bookkeeping or other services related to the accounting records or financial statements of the Fund |
| | • | | Financial information systems design and implementation |
| | • | | Appraisal or valuation services, fairness opinions, or contribution-in-kind reports |
| | • | | Internal audit outsourcing services |
| | • | | Management functions or human resources |
| | • | | Broker or dealer, investment adviser, or investment banking services |
| | • | | Legal services and expert services unrelated to the audit |
| | • | | Any other service that the Public Company Accounting Oversight Board determines, by regulation, is impermissible. |
Pre-approval of Non-Audit Services Provided to Other Entities Within the Prudential Fund Complex
Certain non-audit services provided to Prudential Investments LLC or any of its affiliates that also provide ongoing services to the Prudential Mutual Funds will be subject to pre-approval by the Audit Committee. The only non-audit services provided to these entities that will require pre-approval are those related directly to the operations and financial reporting of the Funds. Individual projects that are not presented to the Audit Committee as part of the annual pre-approval process will be subject to pre-approval by the Committee Chair (or any other Committee member on whom this responsibility has been delegated) so long as the estimated fee for those services does not exceed $50,000. Services presented for pre-approval pursuant to this paragraph will be accompanied by a confirmation from both the Treasurer and the independent accountants that the proposed services will not adversely affect the independence of the independent accountants.
Although the Audit Committee will not pre-approve all services provided to Prudential Investments LLC and its affiliates, the Committee will receive an annual report from the Fund’s independent accounting firm showing the aggregate fees for all services provided to Prudential Investments and its affiliates.
(e) (2) Percentage of services referred to in 4(b) – 4(d) that were approved by the audit committee –
Not applicable.
(f) Percentage of hours expended attributable to work performed by other than full time employees of principal accountant if greater than 50%.
The percentage of hours expended on the principal accountant’s engagement to audit the registrant’s financial statements for the most recent fiscal year that were attributed to work performed by persons other than the principal accountant’s full-time, permanent employees was 0%.
(g) Non-Audit Fees
Not applicable to Registrant for the fiscal years 2011 and 2010. The aggregate non-audit fees billed by KPMG for services rendered to the registrant’s investment adviser and any entity controlling, controlled by, or under common control with the investment adviser that provides ongoing services to the registrant for the fiscal years 2011 and 2010 was $0 and $0, respectively.
(h) Principal Accountant’s Independence
Not applicable as KPMG has not provided non-audit services to the registrant’s investment adviser and any entity controlling, controlled by, or under common control with the investment adviser that provides ongoing services to the registrant that were not pre-approved pursuant to Rule 2-01(c)(7)(ii) of Regulation S-X.
| | |
Item 5 – | | Audit Committee of Listed Registrants – Not applicable. |
| |
Item 6 – | | Schedule of Investments – The schedule is included as part of the report to shareholders filed under Item 1 of this Form. |
| |
Item 7 – | | Disclosure of Proxy Voting Policies and Procedures for Closed-End Management Investment Companies – Not applicable. |
| |
Item 8 – | | Portfolio Managers of Closed-End Management Investment Companies – Not applicable. |
| |
Item 9 – | | Purchases of Equity Securities by Closed-End Management Investment Company and Affiliated Purchasers – Not applicable. |
| |
Item 10 – | | Submission of Matters to a Vote of Security Holders – Not applicable. |
| |
Item 11 – | | Controls and Procedures |
| | (a) | It is the conclusion of the registrant’s principal executive officer and principal financial officer that the effectiveness of the registrant’s current disclosure controls and procedures (such disclosure controls and procedures having been evaluated within 90 days of the date of this filing) provide reasonable assurance that the information required to be disclosed by the registrant has been recorded, processed, summarized and reported within the time period specified in the Commission’s rules and forms and that the information required to be disclosed by the registrant has been accumulated and communicated to the registrant’s principal executive officer and principal financial officer in order to allow timely decisions regarding required disclosure. |
| | (b) | There has been no significant change in the registrant’s internal control over financial reporting that occurred during the registrant’s most recent fiscal quarter of the period covered by this report that has materially affected, or is likely to materially affect, the registrant’s internal control over financial reporting. |
Item 12 – Exhibits
| | (a) (1) | Code of Ethics – Attached hereto as Exhibit EX-99.CODE-ETH |
| | (2) | Certifications pursuant to Section 302 of the Sarbanes-Oxley Act – Attached hereto as Exhibit EX-99.CERT. |
| | (3) | Any written solicitation to purchase securities under Rule 23c-1. – Not applicable. |
(b) Certifications pursuant to Section 906 of the Sarbanes-Oxley Act – Attached hereto as Exhibit EX-99.906CERT.
SIGNATURES
Pursuant to the requirements of the Securities Exchange Act of 1934 and the Investment Company Act of 1940, the registrant has duly caused this report to be signed on its behalf by the undersigned, thereunto duly authorized.
| | | | |
| Registrant: | | Prudential Investment Portfolios, Inc. 10 | | |
| | |
| By: | | /s/ Deborah A. Docs | | |
| | Deborah A. Docs | | |
| | Secretary | | |
| | |
| Date: | | December 20, 2011 | | |
Pursuant to the requirements of the Securities Exchange Act of 1934 and the Investment Company Act of 1940, this report has been signed below by the following persons on behalf of the registrant and in the capacities and on the dates indicated.
| | | | |
| By: | | /s/ Judy A. Rice | | |
| | Judy A. Rice | | |
| | President and Principal Executive Officer | | |
| | |
| Date: | | December 20, 2011 | | |
| | |
| By: | | /s/ Grace C. Torres | | |
| | Grace C. Torres | | |
| | Treasurer and Principal Financial Officer | | |
| | |
| Date: | | December 20, 2011 | | |