UNITED STATES
SECURITIES AND EXCHANGE COMMISSION
Washington, D.C. 20549
FORM N-CSR
CERTIFIED SHAREHOLDER REPORT OF REGISTERED
MANAGEMENT INVESTMENT COMPANIES
| | |
| Investment Company Act file number: | | 811-08085 |
| |
| Exact name of registrant as specified in charter: | | Prudential Investment Portfolios, Inc. 10 |
| |
| Address of principal executive offices: | | Gateway Center 3, |
| | 100 Mulberry Street, |
| | Newark, New Jersey 07102 |
| |
| Name and address of agent for service: | | Deborah A. Docs |
| | Gateway Center 3, |
| | 100 Mulberry Street, |
| | Newark, New Jersey 07102 |
| |
| Registrant’s telephone number, including area code: | | 800-225-1852 |
| |
| Date of fiscal year end: | | 10/31/2013 |
| |
| Date of reporting period: | | 10/31/2013 |
Item 1 – Reports to Stockholders

PRUDENTIAL INVESTMENTS»MUTUAL FUNDS
PRUDENTIAL JENNISON EQUITY INCOME FUND
ANNUAL REPORT · OCTOBER 31, 2013
Fund Type
Equity Income
Objective
Income and Capital Appreciation
This report is not authorized for distribution to prospective investors unless preceded or accompanied by a current prospectus.
The views expressed in this report and information about the Fund’s portfolio holdings are for the period covered by this report and are subject to change thereafter.
Mutual funds are distributed by Prudential Investment Management Services LLC. Jennison Associates is a registered investment advisor. Both are Prudential Financial companies. © 2013 Prudential Financial, Inc., and its related entities. Prudential Investments, Prudential, Jennison Associates, Jennison, the Prudential logo, Bring Your Challenges, and the Rock symbol are service marks of Prudential Financial, Inc., and its related entities, registered in many jurisdictions worldwide.

December 16, 2013
Dear Shareholder:
We hope you find the annual report for the Prudential Jennison Equity Income Fund informative and useful. The report covers performance for the 12-month period that ended October 31, 2013.
We recognize that ongoing market volatility may make it a difficult time to be an investor. We continue to believe a prudent response to uncertainty is to maintain a diversified portfolio of funds consistent with your tolerance for risk, time horizon, and financial goals.
Your financial advisor can help you create a diversified investment plan that may include funds covering all the basic asset classes and that reflects your personal investor profile and risk tolerance. Keep in mind, however, that diversification and asset allocation strategies do not assure a profit or protect against loss in declining markets.
Prudential Investments® is dedicated to helping you solve your toughest investment challenges—whether it’s capital growth, reliable income, or protection from market volatility and other risks. We offer the expertise of Prudential Financial’s affiliated asset managers* that strive to be leaders in a broad range of funds to help you stay on course to the future you envision. They also manage money for major corporations and pension funds around the world, which means you benefit from the same expertise, innovation, and attention to risk demanded by today’s most sophisticated investors.
Thank you for choosing the Prudential Investments family of funds.
Sincerely,

Stuart S. Parker, President
Prudential Jennison Equity Income Fund
*Most of Prudential Investments’ equity funds are advised by Jennison Associates LLC, Quantitative Management Associates LLC (QMA), or Prudential Real Estate Investors. Prudential Investments’ fixed income and money market funds are advised by Prudential Investment Management, Inc. (PIM) through its Prudential Fixed Income unit. Jennison Associates, QMA, and PIM are registered investment advisers and Prudential Financial companies. Prudential Real Estate Investors is a unit of PIM.
| | | | |
| Prudential Jennison Equity Income Fund | | | 1 | |
Your Fund’s Performance (Unaudited)
Performance data quoted represent past performance. Past performance does not guarantee future results. The investment return and principal value of an investment will fluctuate, so that an investor’s shares, when redeemed, may be worth more or less than their original cost. Current performance may be lower or higher than the past performance data quoted. An investor may obtain performance data as of the most recent month-end by visiting our website at www.prudentialfunds.com or by calling (800) 225-1852.
| | | | | | | | | | | | | | | | |
Cumulative Total Returns (Without Sales Charges) as of 10/31/13 | |
| | | One Year | | | Five Years | | | Ten Years | | | Since Inception | |
Class A | | | 25.14 | % | | | 131.53 | % | | | N/A | | | | 115.37% (4/12/04) | |
Class B | | | 24.16 | | | | 122.92 | | | | N/A | | | | 99.88 (4/12/04) | |
Class C | | | 24.22 | | | | 123.11 | | | | 124.04 | % | | | — | |
Class Q | | | 25.64 | | | | N/A | | | | N/A | | | | 38.10 (1/18/11) | |
Class R | | | 24.86 | | | | N/A | | | | N/A | | | | 35.81 (1/18/11) | |
Class X | | | 24.24 | | | | 122.99 | | | | 124.63 | | | | — | |
Class Z | | | 25.47 | | | | 134.13 | | | | N/A | | | | 69.35 (8/25/08) | |
Lipper Equity Income Funds Index | | | 24.54 | | | | 92.94 | | | | 104.98 | | | | — | |
S&P 500 Index | | | 27.16 | | | | 102.55 | | | | 105.21 | | | | — | |
Lipper Equity Income Funds Average | | | 23.47 | | | | 90.55 | | | | 115.72 | | | | — | |
| | | | | | | | | | | | | | | | |
Average Annual Total Returns (With Sales Charges) as of 9/30/13 | |
| | | One Year | | | Five Years | | | Ten Years | | | Since Inception | |
Class A | | | 12.71 | % | | | 11.31 | % | | | N/A | | | | 7.30% (4/12/04) | |
Class B | | | 13.45 | | | | 11.61 | | | | N/A | | | | 7.11 (4/12/04) | |
Class C | | | 17.50 | | | | 11.75 | | | | 8.36 | % | | | — | |
Class Q | | | 19.75 | | | | N/A | | | | N/A | | | | 10.91 (1/18/11) | |
Class R | | | 19.06 | | | | N/A | | | | N/A | | | | 10.27 (1/18/11) | |
Class X | | | 12.43 | | | | 11.35 | | | | 8.38 | | | | — | |
Class Z | | | 19.57 | | | | 12.82 | | | | N/A | | | | 9.95 (8/25/08) | |
Lipper Equity Income Funds Index | | | 18.88 | | | | 9.17 | | | | 7.53 | | | | — | |
S&P 500 Index | | | 19.34 | | | | 10.01 | | | | 7.56 | | | | — | |
Lipper Equity Income Funds Average | | | 17.78 | | | | 9.08 | | | | 7.97 | | | | — | |
| | |
| 2 | | Visit our website at www.prudentialfunds.com |
| | | | | | | | | | | | | | | | |
Average Annual Total Returns (With Sales Charges) as of 10/31/13 | |
| | | One Year | | | Five Years | | | Ten Years | | | Since Inception | |
Class A | | | 18.26 | % | | | 16.95 | % | | | N/A | | | | 7.72% (4/12/04) | |
Class B | | | 19.16 | | | | 17.28 | | | | N/A | | | | 7.52 (4/12/04) | |
Class C | | | 23.22 | | | | 17.41 | | | | 8.40 | % | | | — | |
Class Q | | | 25.64 | | | | N/A | | | | N/A | | | | 12.28 (1/18/11) | |
Class R | | | 24.86 | | | | N/A | | | | N/A | | | | 11.61 (1/18/11) | |
Class X | | | 18.24 | | | | 17.08 | | | | 8.43 | | | | — | |
Class Z | | | 25.47 | | | | 18.55 | | | | N/A | | | | 10.69 (8/25/08) | |
| | | | | | | | | | | | | | | | |
Average Annual Total Returns (Without Sales Charges) as of 10/31/13 | |
| | | One Year | | | Five Years | | | Ten Years | | | Since Inception | |
Class A | | | 25.14 | % | | | 18.28 | % | | | N/A | | | | 8.36% (4/12/04) | |
Class B | | | 24.16 | | | | 17.39 | | | | N/A | | | | 7.52 (4/12/04) | |
Class C | | | 24.22 | | | | 17.41 | | | | 8.40 | % | | | — | |
Class Q | | | 25.64 | | | | N/A | | | | N/A | | | | 12.28 (1/18/11) | |
Class R | | | 24.86 | | | | N/A | | | | N/A | | | | 11.61 (1/18/11) | |
Class X | | | 24.24 | | | | 17.40 | | | | 8.43 | | | | — | |
Class Z | | | 25.47 | | | | 18.55 | | | | N/A | | | | 10.69 (8/25/08) | |
Growth of a $10,000 Investment

The graph compares a $10,000 investment in the Prudential Jennison Equity Income Fund (Class A shares) with a similar investment in the Lipper Equity Income Index and the S&P 500 Index by portraying the initial account values at the commencement of operations for Class A shares (April 12, 2004) and the account values at the end
| | | | |
| Prudential Jennison Equity Income Fund | | | 3 | |
Your Fund’s Performance (continued)
of the current fiscal year (October 31, 2013) as measured on a quarterly basis. The data are measured from the closest month-end to inception date, and not from the Fund’s actual inception date. For purposes of the graph, and unless otherwise indicated, it has been assumed that (a) the maximum applicable front-end sales charge was deducted from the initial $10,000 investment in Class A shares; (b) all recurring fees (including management fees) were deducted; and (c) all dividends and distributions were reinvested. The line graph provides information for Class A shares only. As indicated in the tables above, performance for Class B, Class C, Class Q, Class R, Class X, and Class Z shares will vary due to the differing charges and expenses applicable to each share class (as indicated in the following paragraphs). Without waiver of fees and/or expense reimbursement, if any, the returns would have been lower.
Although Class C and Class X shares have 10 calendar years of returns, returns for Class A shares are displayed because Class X shares are closed to new investors, and displaying the returns for Class A shares is consistent with the prospectuses issued by the other funds in the Prudential Investments Fund Family.
Past performance does not predict future performance. Total returns and the ending account values in the graph include changes in share price and reinvestment of dividends and capital gains distributions in a hypothetical investment for the periods shown. The Fund’s total returns do not reflect the deduction of income taxes on an individual’s investment. Taxes may reduce your actual investment returns on income or gains paid by the Fund or any gains you may realize if you sell your shares.
Source: Prudential Investments LLC and Lipper Inc.
Inception returns are provided for any share class with less than 10 calendar years of returns.
The average annual total returns take into account applicable sales charges, which are described for each share class in the table below.
| | | | | | | | | | | | | | |
| | Class A | | Class B | | Class C | | Class Q | | Class R | | Class X | | Class Z |
Maximum initial sales charge | | 5.50% of
the public
offering
price | | None | | None | | None | | None | | None | | None |
Contingent deferred sales charge (CDSC) (as a percentage of the lower of original purchase price or sale proceeds) | | 1% on sales
of $1 million
or more
made within
12 months of
purchase | | 5% (Yr. 1)
4% (Yr. 2)
3% (Yr. 3)
2% (Yr. 4)
1% (Yr. 5)
1% (Yr. 6)
0% (Yr. 7) | | 1% on sales
made within
12 months
of purchase | | None | | None | | 6% (Yr. 1)
5% (Yr. 2)
4% (Yr. 3)
4% (Yr. 4)
3% (Yr. 5)
2% (Yr. 6)
2% (Yr. 7)
1% (Yr. 8)
0% (Yr. 9) | | None |
Annual distribution and service (12b-1) fees (shown as a percentage of average daily net assets) | | .30%
(.25%
currently) | | 1% | | 1% | | None | | .75%
(.50%
currently) | | 1% | | None |
| | |
| 4 | | Visit our website at www.prudentialfunds.com |
Class X shares are closed to new initial purchases. Class X shares are only available through exchanges from the same class of shares of certain other Prudential Investments funds.
Benchmark Definitions
Lipper Equity Income Funds Index
Funds in the Lipper Equity Income Funds Index seek relatively high current income and growth of income by investing at least 65% of their portfolios in dividend-paying equity securities. These funds’ gross or net yields must be at least 125% of the average gross or net yield of the U.S. diversified equity fund universe. Lipper Equity Income Funds Index Closest Month-End to Inception cumulative total returns as of 10/31/13 are 86.58% for Class A and Class B; 40.42% for Class Q and Class R; and 48.69% for Class Z. Lipper Equity Income Funds Index Closest Month-End to Inception average annual total returns as of 9/30/13 are 6.34% for Class A and Class B; 11.88% for Class Q and Class R; and 7.27% for Class Z.
S&P 500 Index
The S&P 500 Index is an unmanaged index of 500 stocks of large U.S. public companies. It gives a broad look at how U.S. stock prices have performed. S&P 500 Index Closest Month-End to Inception cumulative total returns as of 10/31/13 are 90.08% for Class A and Class B; 44.93% for Class Q and Class R; and 53.54% for Class Z. S&P 500 Index Closest Month-End to Inception average annual total returns as of 9/30/13 are 6.49% for Class A and Class B; 13.01% for Class Q and Class R; and 7.84% for Class Z.
Lipper Equity Income Funds Average
Funds in the Lipper Equity Income Funds Average (Lipper Average) seek relatively high current income and growth of income through investing 65% or more of their portfolios in dividend-paying equity securities. The Lipper Equity Income Funds Average is based on the return of all mutual funds in the Lipper Equity Income Funds category and does not include the effect of any sales charges or taxes payable by an investor. Lipper Average Closest Month-End to Inception cumulative total returns as of 10/31/13 are 96.72% for Class A and Class B; 39.48% for Class Q and Class R; and 49.17% for Class Z. Lipper Average Closest Month-End to Inception average annual total returns as of 9/30/13 are 6.85% for Class A and Class B; 11.57% for Class Q and Class R; and 7.27% for Class Z.
Investors cannot invest directly in an index or average. The returns for the Indexes would be lower if they included the effects of sales charges, operating expenses of a mutual fund, or taxes. Returns for the Lipper Average reflect the deduction of mutual fund operating expenses, but not sales charges or taxes.
| | | | |
Five Largest Holdings expressed as a percentage of net assets as of 10/31/13 | | | | |
Apple, Inc., Computers and Peripherals | | | 3.5 | % |
Bristol-Myers Squibb Co., Pharmaceuticals | | | 2.7 | |
Targa Resources Corp., Oil, Gas & Consumable Fuels | | | 2.4 | |
Wells Fargo & Co., Commercial Banks | | | 2.2 | |
Frontier Communications Corp., Diversified Telecommunication Services | | | 2.2 | |
Holdings reflect only long-term investments and are subject to change.
| | | | |
| Prudential Jennison Equity Income Fund | | | 5 | |
Strategy and Performance Overview
How did the Fund perform?
The Prudential Jennison Equity Income Fund’s Class A shares returned 25.14% for the 12-month reporting period ended October 31, 2013, outperforming the 24.54% return of the Lipper Equity Income Funds Index and the 23.47% return of the Lipper Equity Income Funds Average, but underperforming the 27.16% return of the S&P 500 Index.
What was the market environment like for stocks during the period?
| | • | | The U.S. equity market advanced strongly in the 12 months ended October 31, 2013, reflecting a more optimistic economic outlook. Housing and employment indicators improved, consumer confidence rose, and strength in corporate profits continued. |
| | • | | Conditions in Europe appeared to stabilize, relieving earlier worries of sustained deterioration. |
| | • | | In China, economic growth slowed but to levels sufficiently expansionary to give investors conviction that global GDP, although moderating, remained solid. |
| | • | | Concerns that the U.S. Federal Reserve would begin scaling back its quantitative easing program took a toll in early summer. However, the market soon refocused on individual company fundamentals and showed renewed appreciation for companies with strong growth. |
Which holdings made the largest positive contribution to the Fund’s return?
The Fund’s leading contributors were relatively well diversified by sector. Energy infrastructure company Cheniere Energy topped the list. Other noteworthy contributors included specialty retailer GameStop from consumer discretionary and pharmaceutical company Bristol-Myers Squibb from the healthcare sector. Targa Resources, another energy infrastructure holding, also helped, as did UK-based beverage company Britvic from the consumer staples sector.
| | • | | Cheniere Energy’s steady upward climb of the past two years steepened toward the end of the period. The company remains on track with construction of its natural gas liquefaction and export facility in Louisiana, and its Corpus Christi, Texas, project. Jennison continues to see Cheniere as extremely well positioned to take advantage of the shifting dynamics in the liquefied natural gas market. With a number of 20-year sale and purchase agreements already signed, Jennison believes Cheniere should enjoy good cash flow for some time to come. |
| | |
| 6 | | Visit our website at www.prudentialfunds.com |
| | • | | GameStop shares moved up strongly in the second half of the year, once it became clear Sony and Microsoft would not block used video games from working on their latest consoles. As the leading video game retailer, GameStop is well positioned, in Jennison’s view, to benefit from the new console format. The company continues to take significant market share in both the new and used software categories, and Jennison believes that sales growth will improve with the release of new games in the next few quarters and from multiple digital initiatives. |
| | • | | Bristol-Myers Squibb enjoyed a strong gain for the period, which was largely a reflection of positive sentiment toward the company’s active oncology immune therapy pipeline. Active immune therapy, which leverages a patient’s own immune system, could result in more durable responses to cancers. Jennison believes Bristol-Myers will continue to benefit from product momentum, new product launches, and strong business development deals. Jennison also has confidence in the company’s ability to sustain its healthy dividend yield over the long run. |
Which holdings detracted most from the Fund’s return?
The major detractors also were relatively diversified by sector. They included energy sector holding Lightstream Resources, Iron Mountain from the industrials sector, Darden Restaurants from consumer discretionary, and Corpbanca from the financials sector.
| | • | | Lightstream Resources, a Western-Canada-based oil and gas exploration and production company, changed its name from PetroBakken Energy on the last day of 2012. Lightstream explores and develops Canadian light oil and natural gas interests, with activities focused in southeast Saskatchewan, central Alberta, and northeast British Columbia. Year-over-year comparisons, thus far, have been difficult, and investors remain skeptical of management’s ability to execute. Jennison sees 2014 as a critical year for the company to prove its strategy is working by lowering costs and achieving consistent year-over-year growth. |
| | • | | Shares of document storage company Iron Mountain fell dramatically in June on the news that the Internal Revenue Service (IRS) was reconsidering its application to convert to a real estate investment trust (REIT) structure. Management had proposed a shift to REIT status, because it would allow Iron Mountain to pay lower taxes and higher dividends to shareholders. The uncertainty over when the IRS will make a decision remains an overhang to the stock. Jennison continues to like the steady revenue stream realized by Iron Mountain’s business model. If the REIT conversion proves to be definitively out |
| | | | |
| Prudential Jennison Equity Income Fund | | | 7 | |
Strategy and Performance Overview (continued)
| | of the question, Jennison would expect the company to explore other avenues for returning capital to shareholders. |
| | • | | Shares of Darden Restaurants sold off dramatically in early December, after the company preannounced fiscal 2013 second-quarter financial results that fell far short of expectations. Management also scaled back its outlook for fiscal 2013 earnings, as all three of its top restaurant chains posted negative same-store sales. Darden, which owns and operates close to 2,000 full-service restaurants across the U.S. and Canada, including the chains Olive Garden, Red Lobster, and Longhorn Steakhouse, has struggled to find the right strategy. Jennison exited the position in mid-December. |
Were there significant changes to the Fund?
During the reporting period there were some changes to the portfolio. The Fund scaled back its position in utilities in favor of sectors such as information technology, with greater exposure to what Jennison believes is a strengthening economy. The Fund’s energy allocation also declined; part of that was due to underperformance of selected energy holdings, but it also reflected conversion of some of the stock of one of the Fund’s more successful energy holdings, Cheniere, into structured notes.
The Fund added or exited individual positions based on company fundamentals and the stocks’ risk-reward characteristics. Significant positions established included Wells Fargo, Citigroup, MetLife, and Thermo Fisher Scientific. Positions in other securities, including Maximum Integrated Products, Philip Morris International, BCE, and Williams Companies, were eliminated.
Did the Fund hold derivatives and did they affect performance?
The Fund’s exposure to derivatives was minimal and included put and call equity options and structured notes.
These holdings had a positive but incremental effect on performance.
The Portfolio of Investments following this report shows the size of the Fund’s positions at period-end.
| | |
| 8 | | Visit our website at www.prudentialfunds.com |
Comments on Largest Holdings
| 3.5% | Apple, Computers and Peripherals |
Over the past year Apple was hurt by slowing revenue growth and lowered earnings projections. Jennison believes recent product launches can revive its growth outlook.
| 2.7% | Bristol-Myers Squibb, Pharmaceuticals |
Bristol-Myers Squib is discussed in the positive contributors to performance section on page 6.
| 2.4% | Targa Resources, Oil, Gas, and Consumable Fuels |
In Jennison’s view, Targa Resources is well positioned to take advantage of the upstream shale trends driving an extensive build out of oil and gas infrastructure. Jennison believes management has established a good track record of execution and that the company’s aggressive program of expansion projects will help sustain robust dividend growth.
| 2.2% | Wells Fargo, Commercial Banks |
A position Jennison added in mid-May, Wells Fargo is the best managed of the traditional banks with numerous avenues for growth, in Jennison’s view. With mortgage lending likely to slow in a rising interest-rate environment, Jennison sees Wells Fargo as well-positioned with its proven expertise in managing costs through mortgage cycles. Jennison expects the bank’s book value and earnings to grow strongly over time.
| 2.2% | Frontier Communications, Diversified Telecommunication Services |
Frontier Communications benefited from what Jennison saw as good execution and improving fundamentals in the past year. As its promotional pricing gained traction, the company sustained strong broadband momentum, a trend Jennison views as key to improving top-line growth. Its progress and continued revenue improvements helped to boost Jennison’s confidence in Frontier’s ability to maintain its above-average dividend yield over the near to intermediate term.
| | | | |
| Prudential Jennison Equity Income Fund | | | 9 | |
Fees and Expenses (Unaudited)
As a shareholder of the Fund, you incur two types of costs: (1) transaction costs, including sales charges (loads) on purchase payments and redemptions, as applicable, and (2) ongoing costs, including management fees, distribution and/or service (12b-1) fees, and other Fund expenses, as applicable. This example is intended to help you understand your ongoing costs (in dollars) of investing in the Fund and to compare these costs with the ongoing costs of investing in other mutual funds.
The example is based on an investment of $1,000 invested on May 1, 2013, at the beginning of the period, and held through the six-month period ended October 31, 2013. The example is for illustrative purposes only; you should consult the Prospectus for information on initial and subsequent minimum investment requirements.
Actual Expenses
The first line for each share class in the table on the following page provides information about actual account values and actual expenses. You may use the information on this line, together with the amount you invested, to estimate the expenses that you paid over the period. Simply divide your account value by $1,000 (for example, an $8,600 account value ÷ $1,000 = 8.6), then multiply the result by the number on the first line under the heading “Expenses Paid During the Six-Month Period” to estimate the expenses you paid on your account during this period.
Hypothetical Example for Comparison Purposes
The second line for each share class in the table on the following page provides information about hypothetical account values and hypothetical expenses based on the Fund’s actual expense ratio and an assumed rate of return of 5% per year before expenses, which is not the Fund’s actual return. The hypothetical account values and expenses may not be used to estimate the actual ending account balance or expenses you paid for the period. You may use this information to compare the ongoing costs of investing in the Fund and other funds. To do so, compare this 5% hypothetical example with the 5% hypothetical examples that appear in the shareholder reports of the other funds.
The Fund’s transfer agent may charge additional fees to holders of certain accounts that are not included in the expenses shown in the table on the following page. These fees apply to individual retirement accounts (IRAs) and Section 403(b) accounts. As of the close of the six-month period covered by the table, IRA fees included an annual maintenance fee of $15 per account (subject to a maximum annual maintenance fee of $25 for all accounts held by the same shareholder). Section 403(b) accounts are charged an annual $25 fiduciary maintenance fee. Some of the fees may vary in amount, or may be waived, based on your total account balance or the number of Prudential Investments funds, including the Fund, that you own. You should consider
| | |
| 10 | | Visit our website at www.prudentialfunds.com |
the additional fees that were charged to your Fund account over the six-month period when you estimate the total ongoing expenses paid over the period and the impact of these fees on your ending account value, as these additional expenses are not reflected in the information provided in the expense table. Additional fees have the effect of reducing investment returns.
Please note that the expenses shown in the table are meant to highlight your ongoing costs only and do not reflect any transactional costs such as sales charges (loads). Therefore, the second line for each share class in the table is useful in comparing ongoing costs only and will not help you determine the relative total costs of owning different funds. In addition, if these transactional costs were included, your costs would have been higher.
| | | | | | | | | | | | | | | | | | |
Prudential
Jennison Equity
Income Fund | | Beginning Account
Value
May 1, 2013 | | | Ending Account
Value
October 31, 2013 | | | Annualized
Expense Ratio
Based on the
Six-Month Period | | | Expenses Paid
During the
Six-Month Period* | |
| | | | | | | | | | | | | | | | | | |
| Class A | | Actual | | $ | 1,000.00 | | | $ | 1,085.50 | | | | 1.16 | % | | $ | 6.10 | |
| | | Hypothetical | | $ | 1,000.00 | | | $ | 1,019.36 | | | | 1.16 | % | | $ | 5.90 | |
| | | | | | | | | | | | | | | | | | |
| Class B | | Actual | | $ | 1,000.00 | | | $ | 1,081.20 | | | | 1.91 | % | | $ | 10.02 | |
| | | Hypothetical | | $ | 1,000.00 | | | $ | 1,015.58 | | | | 1.91 | % | | $ | 9.70 | |
| | | | | | | | | | | | | | | | | | |
| Class C | | Actual | | $ | 1,000.00 | | | $ | 1,081.40 | | | | 1.91 | % | | $ | 10.02 | |
| | | Hypothetical | | $ | 1,000.00 | | | $ | 1,015.58 | | | | 1.91 | % | | $ | 9.70 | |
| | | | | | | | | | | | | | | | | | |
| Class Q | | Actual | | $ | 1,000.00 | | | $ | 1,088.00 | | | | 0.80 | % | | $ | 4.21 | |
| | | Hypothetical | | $ | 1,000.00 | | | $ | 1,021.17 | | | | 0.80 | % | | $ | 4.08 | |
| | | | | | | | | | | | | | | | | | |
| Class R | | Actual | | $ | 1,000.00 | | | $ | 1,084.30 | | | | 1.41 | % | | $ | 7.41 | |
| | | Hypothetical | | $ | 1,000.00 | | | $ | 1,018.10 | | | | 1.41 | % | | $ | 7.17 | |
| | | | | | | | | | | | | | | | | | |
| Class X | | Actual | | $ | 1,000.00 | | | $ | 1,081.50 | | | | 1.91 | % | | $ | 10.02 | |
| | | Hypothetical | | $ | 1,000.00 | | | $ | 1,015.58 | | | | 1.91 | % | | $ | 9.70 | |
| | | | | | | | | | | | | | | | | | |
| Class Z | | Actual | | $ | 1,000.00 | | | $ | 1,086.90 | | | | 0.91 | % | | $ | 4.79 | |
| | | Hypothetical | | $ | 1,000.00 | | | $ | 1,020.62 | | | | 0.91 | % | | $ | 4.63 | |
*Fund expenses (net of fee waivers or subsidies, if any) for each share class are equal to the annualized expense ratio for each share class (provided in the table), multiplied by the average account value over the period, multiplied by the 184 days in the six-month period ended October 31, 2013, and divided by 365 days. Expenses presented in the table include the expenses of any underlying Funds in which the Fund may invest.
| | | | |
| Prudential Jennison Equity Income Fund | | | 11 | |
Fees and Expenses (continued)
The Fund’s annual expense ratios for the year ended October 31, 2013, are as follows:
| | | | |
Class | | Gross Operating Expenses | | Net Operating Expenses |
A | | 1.21% | | 1.16% |
B | | 1.91 | | 1.91 |
C | | 1.91 | | 1.91 |
Q | | 0.81 | | 0.81 |
R | | 1.66 | | 1.41 |
X | | 1.91 | | 1.91 |
Z | | 0.91 | | 0.91 |
Net operating expenses shown above reflect any fee waivers and/or expense reimbursements. Additional information on Fund expenses and any fee waivers and/or expense reimbursements can be found in the “Financial Highlights” tables in this report and in the Notes to the Financial Statements in this report.
| | |
| 12 | | Visit our website at www.prudentialfunds.com |
Portfolio of Investments
as of October 31, 2013
| | | | | | |
| Shares | | Description | | Value (Note 2) | |
LONG-TERM INVESTMENTS 98.5% | | | | |
COMMON STOCKS 90.3% | | | | |
| |
Aerospace & Defense 1.3% | | | | |
| 410,640 | | Boeing Co. (The) | | $ | 53,588,520 | |
| |
Air Freight & Logistics 0.2% | | | | |
| 1,048,616 | | TNT Express NV (Netherlands) | | | 9,667,754 | |
| |
Beverages 2.5% | | | | |
| 6,617,918 | | Britvic PLC (United Kingdom) | | | 66,320,310 | |
| 752,429 | | Molson Coors Brewing Co. (Class B Stock) | | | 40,631,166 | |
| | | | | | |
| | | | | 106,951,476 | |
| |
Biotechnology 0.7% | | | | |
| 118,351 | | Biogen Idec, Inc.* | | | 28,900,131 | |
| |
Capital Markets 1.1% | | | | |
| 1,840,247 | | Azimut Holding SpA (Italy) | | | 46,682,077 | |
| |
Chemicals 1.5% | | | | |
| 597,549 | | Monsanto Co. | | | 62,670,939 | |
| |
Commercial Banks 2.8% | | | | |
| 1,439,268 | | Corpbanca SA, ADR (Chile)(a) | | | 24,755,410 | |
| 2,199,680 | | Wells Fargo & Co. | | | 93,904,339 | |
| | | | | | |
| | | | | 118,659,749 | |
| |
Commercial Services & Supplies 1.9% | | | | |
| 838,515 | | Covanta Holding Corp. | | | 14,397,303 | |
| 805,674 | | Iron Mountain, Inc. | | | 21,382,588 | |
| 1,019,399 | | Waste Management, Inc. | | | 44,384,632 | |
| | | | | | |
| | | | | 80,164,523 | |
| |
Computers & Peripherals 3.5% | | | | |
| 287,297 | | Apple, Inc. | | | 150,069,588 | |
| |
Construction & Engineering 0.7% | | | | |
| 393,295 | | Fluor Corp. | | | 29,190,355 | |
| |
Diversified Financial Services 3.8% | | | | |
| 2,675,835 | | Bank of America Corp. | | | 37,354,657 | |
| 1,678,039 | | Citigroup, Inc. | | | 81,854,743 | |
See Notes to Financial Statements.
| | | | |
| Prudential Jennison Equity Income Fund | | | 13 | |
Portfolio of Investments
as of October 31, 2013 continued
| | | | | | |
| Shares | | Description | | Value (Note 2) | |
COMMON STOCKS (Continued) | | | | |
| |
Diversified Financial Services (cont’d.) | | | | |
| 100,000 | | Gateway Energy & Resource Holdings LLC, 144A
(original cost $2,000,000; purchased 12/14/07)*(b)(c) | | $ | 1,622,215 | |
| 815,414 | | JPMorgan Chase & Co. | | | 42,026,437 | |
| | | | | | |
| | | | | 162,858,052 | |
| |
Diversified Telecommunication Services 4.8% | | | | |
| 823,098 | | Cogent Communications Group, Inc. | | | 28,915,433 | |
| 20,928,639 | | Frontier Communications Corp.(a) | | | 92,295,298 | |
| 3,222,344 | | Vivendi SA (France) | | | 81,589,224 | |
| | | | | | |
| | | | | 202,799,955 | |
| |
Electric Utilities 1.7% | | | | |
| 375,608 | | Alupar Investimento SA*, (Brazil) | | | 2,833,575 | |
| 1,777,926 | | Alupar Investimento SA, 144A (Brazil)*(b) | | | 13,412,620 | |
| 1,594,572 | | NRG Yield, Inc. (Class A Stock)(a) | | | 56,479,740 | |
| | | | | | |
| | | | | 72,725,935 | |
| |
Food Products 4.7% | | | | |
| 379,958 | | Bunge Ltd. | | | 31,205,951 | |
| 1,785,543 | | Mondelez International, Inc. (Class A Stock) | | | 60,065,666 | |
| 1,531,134 | | Pinnacle Foods, Inc. | | | 41,478,420 | |
| 3,153,939 | | Tate & Lyle PLC (United Kingdom) | | | 40,026,741 | |
| 689,726 | | Unilever NV (Netherlands) | | | 27,395,917 | |
| | | | | | |
| | | | | 200,172,695 | |
| |
Hotels, Restaurants & Leisure 3.2% | | | | |
| 887,594 | | Carnival Corp. | | | 30,755,132 | |
| 671,863 | | SeaWorld Entertainment Inc | | | 20,176,046 | |
| 725,396 | | Starbucks Corp. | | | 58,793,346 | |
| 3,066,099 | | Wendy’s Co. (The)(a) | | | 26,644,400 | |
| | | | | | |
| | | | | 136,368,924 | |
| |
Household Products 1.5% | | | | |
| 776,684 | | Procter & Gamble Co. (The) | | | 62,717,233 | |
| |
Industrial Conglomerates 4.1% | | | | |
| 2,147,380 | | General Electric Co. | | | 56,132,513 | |
| 1,425,180 | | Koninklijke Philips NV (Netherlands) | | | 50,367,085 | |
| 514,701 | | Siemens AG, ADR (Germany)(a) | | | 65,886,875 | |
| | | | | | |
| | | | | 172,386,473 | |
See Notes to Financial Statements.
| | | | | | |
| Shares | | Description | | Value (Note 2) | |
COMMON STOCKS (Continued) | | | | |
| |
Insurance 1.7% | | | | |
| 1,515,355 | | MetLife, Inc. | | $ | 71,691,445 | |
| |
Internet Software & Services 2.9% | | | | |
| 986,637 | | Rackspace Hosting, Inc.*(a) | | | 50,545,414 | |
| 4,868,260 | | Telecity Group PLC (United Kingdom) | | | 59,517,025 | |
| 413,482 | | Yahoo!, Inc.*(a) | | | 13,615,962 | |
| | | | | | |
| | | | | 123,678,401 | |
| |
Leisure Equipment & Products 1.4% | | | | |
| 1,347,478 | | Mattel, Inc.(a) | | | 59,787,599 | |
| |
Life Sciences Tools & Services 1.6% | | | | |
| 690,519 | | Thermo Fisher Scientific, Inc.(a) | | | 67,518,948 | |
| |
Machinery 0.8% | | | | |
| 523,186 | | IDEX Corp. | | | 36,178,312 | |
| |
Media 4.0% | | | | |
| 1,708,565 | | Cinemark Holdings, Inc. | | | 56,058,018 | |
| 595,090 | | Lagardere SCA (France) | | | 21,619,283 | |
| 1,162,377 | | Thomson Reuters Corp. (Canada)(a) | | | 43,670,504 | |
| 398,007 | | Time Warner Cable, Inc. | | | 47,820,541 | |
| | | | | | |
| | | | | 169,168,346 | |
| |
Oil, Gas & Consumable Fuels 9.3% | | | | |
| 755,435 | | Cheniere Energy, Inc.*(a) | | | 30,066,313 | |
| 530,556 | | Crosstex Energy, Inc. | | | 16,282,764 | |
| 517,513 | | HollyFrontier Corp. | | | 23,836,649 | |
| 3,554,515 | | Lightstream Resources Ltd (Canada) | | | 22,841,078 | |
| 1,165,906 | | Pembina Pipeline Corp. (Canada) | | | 38,241,717 | |
| 443,583 | | Pembina Pipeline Corp., Reg D (Canada)(b) | | | 14,549,522 | |
| 865,392 | | Phillips 66 | | | 55,757,206 | |
| 859,971 | | SemGroup Corp. (Class A Stock) | | | 51,933,649 | |
| 1,336,523 | | Targa Resources Corp. | | | 103,660,724 | |
| 352,625 | | Tesoro Corp. | | | 17,239,836 | |
| 576,707 | | Western Refining, Inc.(a) | | | 18,610,335 | |
| | | | | | |
| | | | | 393,019,793 | |
See Notes to Financial Statements.
| | | | |
| Prudential Jennison Equity Income Fund | | | 15 | |
Portfolio of Investments
as of October 31, 2013 continued
| | | | | | |
| Shares | | Description | | Value (Note 2) | |
COMMON STOCKS (Continued) | | | | |
| |
Pharmaceuticals 8.6% | | | | |
| 2,156,151 | | Bristol-Myers Squibb Co. | | $ | 113,241,051 | |
| 1,719,269 | | Merck & Co., Inc. | | | 77,521,839 | |
| 168,427 | | Novo Nordisk A/S, ADR (Denmark) | | | 28,071,728 | |
| 284,451 | | Perrigo Co.(a) | | | 39,222,948 | |
| 2,654,986 | | Pfizer, Inc. | | | 81,454,971 | |
| 865,824 | | Zoetis, Inc. | | | 27,411,988 | |
| | | | | | |
| | | | | 366,924,525 | |
| |
Real Estate Investment Trusts 5.1% | | | | |
| 2,743,191 | | First Potomac Realty Trust | | | 33,713,818 | |
| 1,297,570 | | Geo Group, Inc. (The) | | | 45,765,294 | |
| 7,508,853 | | MFA Financial, Inc. | | | 55,640,601 | |
| 896,774 | | ProLogis, Inc.(a) | | | 35,826,121 | |
| 1,772,257 | | Starwood Property Trust, Inc. | | | 45,529,282 | |
| | | | | | |
| | | | | 216,475,116 | |
| |
Road & Rail 3.5% | | | | |
| 453,723 | | Canadian Pacific Railway Ltd. (Canada) | | | 64,914,150 | |
| 538,809 | | J.B. Hunt Transport Services, Inc. | | | 40,426,839 | |
| 292,608 | | Union Pacific Corp. | | | 44,300,851 | |
| | | | | | |
| | | | | 149,641,840 | |
| |
Semiconductors & Semiconductor Equipment 1.8% | | | | |
| 1,656,822 | | Xilinx, Inc. | | | 75,252,855 | |
| |
Software 3.8% | | | | |
| 3,297,011 | | Activision Blizzard, Inc. | | | 54,862,263 | |
| 618,751 | | Intuit, Inc.(a) | | | 44,185,009 | |
| 1,803,781 | | Microsoft Corp. | | | 63,763,658 | |
| | | | | | |
| | | | | 162,810,930 | |
|
Specialty Retail 3.2% | |
| 1,216,704 | | GameStop Corp. (Class A Stock)(a) | | | 66,699,713 | |
| 685,849 | | Gap, Inc. (The) | | | 25,369,555 | |
| 540,500 | | Home Depot, Inc. (The) | | | 42,099,545 | |
| | | | | | |
| | | | | 134,168,813 | |
|
Wireless Telecommunication Services 2.6% | |
| 628,189 | | Crown Castle International Corp.* | | | 47,754,928 | |
See Notes to Financial Statements.
| | | | | | |
| Shares | | Description | | Value (Note 2) | |
COMMON STOCKS (Continued) | | | | |
|
Wireless Telecommunication Services (cont’d.) | |
| 1,646,165 | | Vodafone Group PLC, ADR (United Kingdom) | | $ | 60,611,795 | |
| | | | | | |
| | | | | 108,366,723 | |
| | | | | | |
| | TOTAL COMMON STOCKS
(Cost $3,257,602,461) | | | 3,831,258,025 | |
| | | | | | |
PREFERRED STOCKS 1.7% | |
|
Aerospace & Defense 0.8% | |
| 510,924 | | United Technologies Corp., CVT, 7.50%(a)(b) | | | 32,331,270 | |
|
Airlines 0.3% | |
| 281,902 | | Continental Airlines Finance Trust II, CVT, 6.00%(a) | | | 12,861,779 | |
|
Diversified Telecommunication Services 0.3% | |
| 242,300 | | Intelsat SA , CVT, 5.750% | | | 13,132,660 | |
|
Insurance 0.3% | |
| 413,000 | | MetLife, Inc., CVT, 5.00%(b) | | | 11,865,490 | |
| | | | | | |
| | TOTAL PREFERRED STOCKS
(Cost $58,820,798) | | | 70,191,199 | |
| | | | | | |
| | | | | | | | | | | | | | | | |
| | | | | |
Description | | Moody’s
Ratings†
(Unaudited) | | Interest
Rate | | Maturity
Date | | | Principal
Amount (000)# | | | | |
CONVERTIBLE BONDS 6.5% | | | | | | | | | | | | | | |
| | | | | |
Airlines 0.8% | | | | | | | | | | | | | | | | |
United Continental
Holdings, Inc.,
Sr. Unsec’d. Notes | | CCC+(d) | | 6.00% | | | 10/15/29 | | | | 9,122 | | | | 35,872,265 | |
| | | | | |
Energy 1.8% | | | | | | | | | | | | | | | | |
BAC Cheniere Energy, Inc. Notes, 144A | | NR | | 5.94% | | | 03/27/14 | (b) | | | 130,159 | | | | 45,451,453 | |
| | NR | | 9.00% | | | 04/28/14 | (b) | | | 78,125 | | | | 30,890,625 | |
| | | | | | | | | | | | | | | | |
| | | | | | | | | | | | | | | 76,342,078 | |
| | | | |
Financial Services 1.1% | | | | | | | | | | | | | | |
JPM Yahoo, Inc.
Notes, 144A | | NR | | 6.95% | | | 04/21/14 | (b) | | | 138,079 | | | | 45,179,449 | |
| | | | |
Leisure Equipment & Products 0.3% | | | | | | | | | | | | | | |
Callaway Golf Co. | | NR | | 3.75% | | | 08/15/19 | | | | 12,500 | | | | 15,460,937 | |
See Notes to Financial Statements.
| | | | |
| Prudential Jennison Equity Income Fund | | | 17 | |
Portfolio of Investments
as of October 31, 2013 continued
| | | | | | | | | | | | | | | | |
| Description | | Moody’s
Ratings†
(Unaudited) | | Interest
Rate | | Maturity
Date | | | Principal
Amount (000)# | | | Value (Note 2) | |
CONVERTIBLE BONDS (Continued) | | | | | | | | | | | | | | |
| | | | |
Oil, Gas & Consumable Fuels 0.7% | | | | | | | | | | | | | | |
BAC Williams Co. Notes, 144A | | NR | | 6.22% | | | 11/22/13 | (b) | | | 83,000 | | | $ | 29,938,100 | |
| | | | |
Pharmaceuticals 1.8% | | | | | | | | | | | | | | |
GS Endo Health Solutions Notes, 144A | | NR | | 3.55% | | | 04/22/14 | (b) | | | 94,723 | | | | 41,129,557 | |
| | NR | | 4.15% | | | 12/24/13 | (b) | | | 78,700 | | | | 33,967,880 | |
| | | | | | | | | | | | | | | | |
| | | | | | | | | | | | | | | 75,097,437 | |
| | | | | | | | | | | | | | | | |
TOTAL CONVERTIBLE BONDS
(cost $262,112,425) | | | | | | | | | | | | | 277,890,266 | |
| | | | | | | | | | | | | | | | |
TOTAL LONG-TERM INVESTMENTS
(cost $3,578,535,684) | | | | | | | | | | | | | 4,179,339,490 | |
| | | | | | | | | | | | | | | | |
| | | | | | |
| | |
Shares | | | | | |
SHORT-TERM INVESTMENT 10.5% | | | | |
|
AFFILIATED MONEY MARKET MUTUAL FUND 10.5% | |
| 445,931,052 | | Prudential Investment Portfolios 2 - Prudential Core Taxable
Money Market Fund (cost $445,931,052; includes $385,948,498 of cash collateral for securities on loan)(e)(f) | | | 445,931,052 | |
| | | | | | |
| | TOTAL INVESTMENTS 109.0%
(cost $4,024,466,736; Note 6) | | | 4,625,270,542 | |
| | Liabilities in excess of other assets (9.0)% | | | (381,331,652 | ) |
| | | | | | |
| | NET ASSETS 100.0% | | $ | 4,243,938,890 | |
| | | | | | |
The following abbreviations are used in the Portfolio descriptions:
144A—Security was purchased pursuant to Rule 144A under the Securities Act of 1933 and may not be resold subject to that rule except to qualified institutional buyers. Unless otherwise noted, 144A securities are deemed to be liquid.
Reg D—Regulation D is an exemption offered by the Securities and Exchange Commission that allows for the sale of equity or debt securities to investors in a private placement transaction. Most of the companies that utilize Regulation D are privately held companies that are seeking to raise private capital from investors.
ADR—American Depositary Receipt
CVT—Convertible Security
NR—Not Rated by Moody’s or Standard & Poor’s
| † | The ratings reflected are as of October 31, 2013. Ratings of certain bonds may have changed subsequent to that date. |
| # | Principal amount is shown in U.S. dollars unless otherwise stated. |
| * | Non-income producing security. |
See Notes to Financial Statements.
| (a) | All or a portion of security is on loan. The aggregate market value of such securities, including those sold and pending settlement, is $378,180,770; cash collateral of $385,948,498 (included with liabilities) was received with which the Portfolio purchased highly liquid short-term investments. |
| (b) | Indicates a security or securities that have been deemed illiquid. |
| (c) | Private Placement restricted as to resale and does not have a readily available market. The aggregate original cost of such security is $2,000,000. The aggregate value of $1,622,215 is approximately 0.0% of net assets. |
| (d) | Standard & Poor’s rating. |
| (e) | Represents security, or a portion thereof, purchased with cash collateral received for securities on loan. |
| (f) | Prudential Investments LLC, the manager of the Fund also serves as manager of the Prudential Investment Portfolio 2 - Prudential Core Taxable Money Market Fund. |
Various inputs are used in determining the value of the Fund’s investments. These inputs are summarized in the three broad levels listed below.
Level 1—quoted prices generally in active markets for identical securities.
Level 2—other significant observable inputs including, but not limited to, quoted prices for similar securities, interest rates and yield curves, prepayment speeds, foreign currency exchange rates, and amortized cost.
Level 3—significant unobservable inputs for securities valued in accordance with Board approved fair valuation procedures.
The following is a summary of the inputs used as of October 31, 2013 in valuing such portfolio securities:
| | | | | | | | | | | | |
| | | Level 1 | | | Level 2 | | | Level 3 | |
Investments in Securities | | | | | | | | | | | | |
Common Stocks | | $ | 3,520,166,621 | | | $ | 311,091,404 | | | $ | — | |
Preferred Stocks | | | 70,191,199 | | | | — | | | | — | |
Convertible Bonds | | | — | | | | 51,333,202 | | | | 226,557,064 | |
Affiliated Money Market Mutual Fund | | | 445,931,052 | | | | — | | | | — | |
| | | | | | | | | | | | |
Total | | $ | 4,036,288,872 | | | $ | 362,424,606 | | | $ | 226,557,064 | |
| | | | | | | | | | | | |
See Notes to Financial Statements.
| | | | |
| Prudential Jennison Equity Income Fund | | | 19 | |
Portfolio of Investments
as of October 31, 2013 continued
The following is a reconciliation of assets in which significant unobservable inputs (Level 3) were used in determining fair value:
| | | | |
| | | Convertible
Bonds | |
Balance as of 10/31/12 | | $ | 207,145,546 | |
Accrued discounts/premiums | | | — | |
Realized gain (loss) | | | 14,134,826 | |
Change in unrealized appreciation (depreciation)* | | | 5,637,464 | |
Purchases | | | 223,395,696 | |
Sales | | | (211,811,155 | ) |
Transfers into Level 3 | | | — | |
Transfers out of Level 3 | | | (11,945,313 | ) |
| | | | |
Balance as of 10/31/13 | | $ | 226,557,064 | |
| | | | |
| * | Of which, $2,783,583 was included in Net Assets relating to securities held at the reporting period end. |
Fair Value of Level 2 investments at 10/31/12 was $40,883,348. An amount of $64,695,957 was transferred from Level 1 into Level 2 at 10/31/13 as a result of fair valuing such foreign securities using third party vendor modeling tools. Such fair values are used to reflect the impact of significant market movements between the time at which the fund normally values its securities and the earlier closing of foreign markets.
It is the Portfolio’s policy to recognize transfers in and transfers out at the fair value as of the beginning of period. At the reporting period end, there was one Convertible Bond security transferred out of Level 3 as a result of being priced by a formula with observable inputs.
Level 3 securities as presented in the table above are being fair valued using pricing methodologies approved by the Valuation Committee, which contain unobservable inputs. Such methodologies include, but are not limited to, using prices provided by a single broker/dealer, the cost of the investment, and broker quotes adjusted for changes in yields of compariable U.S. Government and other securities using fixed income securities valuation model.
See Notes to Financial Statements.
The valuation techniques and significant amounts of unobservable inputs used in the fair value measurement of the Fund’s Level 3 securities are outlined in the table below.
| | | | | | | | | | |
| | | Fair Value
October 31,
2013 | | | Valuation
Methodologies | | Unobservable
Input(s) | | Range (Weighted
Average) |
Convertible Bonds
investments | | $ | 226,557,064 | | | Market approach | | Offered quote | | $32.72 - $43.42 ($38.04) |
The industry classification of investments and liabilities in excess of other assets shown as a percentage of net assets as of October 31, 2013 were as follows:
| | | | |
Affiliated Money Market Mutual Fund (9.1% represents investments purchased with collateral from securities on loan) | | | 10.5 | % |
Pharmaceuticals | | | 10.4 | |
Oil, Gas & Consumable Fuels | | | 10.0 | |
Real Estate Investment Trusts | | | 5.1 | |
Diversified Telecommunication Services | | | 5.1 | |
Food Products | | | 4.7 | |
Industrial Conglomerates | | | 4.1 | |
Media | | | 4.0 | |
Diversified Financial Services | | | 3.8 | |
Software | | | 3.8 | |
Computers & Peripherals | | | 3.5 | |
Road & Rail | | | 3.5 | |
Hotels, Restaurants & Leisure | | | 3.2 | |
Specialty Retail | | | 3.2 | |
Internet Software & Services | | | 2.9 | |
Commercial Banks | | | 2.8 | |
Wireless Telecommunication Services | | | 2.6 | |
Beverages | | | 2.5 | |
Aerospace & Defense | | | 2.1 | |
Insurance | | | 2.0 | % |
Commercial Services & Supplies | | | 1.9 | |
Energy | | | 1.8 | |
Semiconductors & Semiconductor Equipment | | | 1.8 | |
Leisure Equipment & Products | | | 1.7 | |
Electric Utilities | | | 1.7 | |
Life Sciences Tools & Services | | | 1.6 | |
Household Products | | | 1.5 | |
Chemicals | | | 1.5 | |
Airlines | | | 1.1 | |
Capital Markets | | | 1.1 | |
Financial Services | | | 1.1 | |
Machinery | | | 0.8 | |
Construction & Engineering | | | 0.7 | |
Biotechnology | | | 0.7 | |
Air Freight & Logistics | | | 0.2 | |
| | | | |
| | | 109.0 | |
Liabilities in excess of other assets | | | (9.0 | ) |
| | | | |
| | | 100.0 | % |
| | | | |
The Fund invested in various derivative instruments during the reporting period. The primary types of risk associated with these derivative instruments was equity contracts risk. The effect of such derivative instruments on the Fund’s financial position and financial performance as reflected in the Statement of Assets and Liabilities and Statement of Operations is presented in the summary below.
The Fund did not hold any derivative instruments as of October 31, 2013, accordingly, no derivative positions were presented in the Statements of Assets and Liabilities.
See Notes to Financial Statements.
| | | | |
| Prudential Jennison Equity Income Fund | | | 21 | |
Portfolio of Investments
as of October 31, 2013 continued
The effects of derivative instruments on the Statement of Operations for the year ended October 31, 2013 are as follows:
| | | | | | | | | | | | | | | | |
Amount of Realized Gain or (Loss) on Derivatives Recognized in Income | |
Derivatives not accounted for as hedging
instruments, carried at fair value | | Rights | | | Options
Purchased | | | Options
Written | | | Total | |
Equity contracts | | $ | (506 | ) | | $ | 117,151 | | | $ | 2,123,273 | | | $ | 2,239,918 | |
| | | | | | | | | | | | | | | | |
| | | | |
Change in Unrealized Appreciation or (Depreciation) on Derivatives Recognized in Income | |
Derivatives not accounted for as hedging
instruments, carried at fair value | | Options
Written | |
Equity contracts | | $ | (307,101 | ) |
| | | | |
For the year ended October 31, 2013, the Fund’s average cost for options purchased was $104,965 and premiums received for options written was $383,855.
See Notes to Financial Statements.
PRUDENTIAL INVESTMENTS»MUTUAL FUNDS
FINANCIAL STATEMENTS
ANNUAL REPORT · OCTOBER 31, 2013
Prudential Jennison Equity Income Fund
Statement of Assets and Liabilities
as of October 31, 2013
| | | | |
Assets | | | | |
Investments at value, including securities on loan of $378,180,770: | | | | |
Unaffiliated Investments (cost $3,578,535,684) | | $ | 4,179,339,490 | |
Affiliated Investments (cost $445,931,052) | | | 445,931,052 | |
Cash | | | 60 | |
Receivable for investments sold | | | 19,271,934 | |
Receivable for Fund shares sold | | | 13,225,861 | |
Dividends and interest receivable | | | 3,735,366 | |
Tax reclaim receivable | | | 846,575 | |
Prepaid expenses | | | 39,489 | |
| | | | |
Total assets | | | 4,662,389,827 | |
| | | | |
| |
Liabilities | | | | |
Payable to broker for collateral for securities on loan | | | 385,948,498 | |
Payable for investments purchased | | | 14,736,791 | |
Payable for Fund shares reacquired | | | 12,780,337 | |
Management fee payable | | | 2,665,959 | |
Distribution fee payable | | | 1,384,187 | |
Accrued expenses | | | 827,910 | |
Affiliated transfer agent fee payable | | | 103,795 | |
Deferred directors’ fee | | | 2,824 | |
Payable to custodian | | | 636 | |
| | | | |
Total liabilities | | | 418,450,937 | |
| | | | |
| |
Net Assets | | $ | 4,243,938,890 | |
| | | | |
| | | | | |
Net assets were comprised of: | | | | |
Common stock, at $.001 par value | | $ | 256,445 | |
Paid-in capital in excess of par | | | 3,458,224,064 | |
| | | | |
| | | 3,458,480,509 | |
Undistributed net investment income | | | 2,474,263 | |
Accumulated net realized gain on investment and foreign currency transactions | | | 182,164,892 | |
Net unrealized appreciation on investments and foreign currencies | | | 600,819,226 | |
| | | | |
Net assets, October 31, 2013 | | $ | 4,243,938,890 | |
| | | | |
See Notes to Financial Statements.
| | | | |
Class A: | | | | |
Net asset value and redemption price per share
($1,738,260,011 ÷ 103,194,280 shares of common stock issued and outstanding) | | $ | 16.84 | |
Maximum sales charge (5.5% of offering price) | | | 0.98 | |
| | | | |
Maximum offering price to public | | $ | 17.82 | |
| | | | |
| |
Class B: | | | | |
Net asset value, offering price and redemption price per share
($159,282,922 ÷ 10,016,799 shares of common stock issued and outstanding) | | $ | 15.90 | |
| | | | |
| |
Class C: | | | | |
Net asset value, offering price and redemption price per share
($1,066,637,275 ÷ 67,226,829 shares of common stock issued and outstanding) | | $ | 15.87 | |
| | | | |
| |
Class Q: | | | | |
Net asset value, offering price and redemption price per share
($2,725,655 ÷ 161,713 shares of common stock issued and outstanding) | | $ | 16.85 | |
| | | | |
| |
Class R: | | | | |
Net asset value, offering price and redemption price per share
($22,442,104 ÷ 1,332,538 shares of common stock issued and outstanding) | | $ | 16.84 | |
| | | | |
| |
Class X: | | | | |
Net asset value, offering price and redemption price per share
($441,787 ÷ 27,864 shares of common stock issued and outstanding) | | $ | 15.86 | |
| | | | |
| |
Class Z: | | | | |
Net asset value, offering price and redemption price per share
($1,254,149,136 ÷ 74,485,437 shares of common stock issued and outstanding) | | $ | 16.84 | |
| | | | |
See Notes to Financial Statements.
| | | | |
| Prudential Jennison Equity Income Fund | | | 25 | |
Statement of Operations
Year Ended October 31, 2013
| | | | |
Net Income | | | | |
Income | | | | |
Unaffiliated dividend income (net of foreign withholding tax of $4,559,451) | | $ | 118,801,438 | |
Interest income | | | 9,937,624 | |
Affiliated income from securities lending, net | | | 2,295,574 | |
Affiliated dividend income | | | 74,009 | |
| | | | |
Total income | | | 131,108,645 | |
| | | | |
| |
Expenses | | | | |
Management fee | | | 26,547,502 | |
Distribution fee—Class A | | | 3,649,086 | |
Distribution fee—Class B | | | 1,194,492 | |
Distribution fee—Class C | | | 8,515,721 | |
Distribution fee—Class R | | | 73,302 | |
Distribution fee—Class X | | | 8,240 | |
Transfer agent’s fee and expenses (including affiliated expense of $486,000) (Note 3) | | | 3,605,000 | |
Custodian’s fees and expenses | | | 617,000 | |
Registration fees | | | 195,000 | |
Reports to shareholders | | | 190,000 | |
Directors’ fees | | | 68,000 | |
Insurance | | | 53,000 | |
Legal fees and expenses | | | 45,000 | |
Audit fee | | | 39,000 | |
Loan interest expense (Note 8) | | | 121 | |
Miscellaneous | | | 68,173 | |
| | | | |
Net expenses | | | 44,868,637 | |
| | | | |
Net investment income | | | 86,240,008 | |
| | | | |
| |
Realized And Unrealized Gain (Loss) On Investment And Foreign Currencies | | | | |
Net realized gain (loss) on: | | | | |
Investment transactions | | | 301,921,179 | |
Options written | | | 2,123,273 | |
Foreign currency transactions | | | (555,914 | ) |
| | | | |
| | | 303,488,538 | |
| | | | |
Net change in unrealized appreciation (depreciation) on: | | | | |
Investments | | | 386,624,219 | |
Options written | | | (307,101 | ) |
Foreign currencies | | | 40,894 | |
| | | | |
| | | 386,358,012 | |
| | | | |
Net gain on investments and foreign currencies | | | 689,846,550 | |
| | | | |
Net Increase In Net Assets Resulting From Operations | | $ | 776,086,558 | |
| | | | |
See Notes to Financial Statements.
Statement of Changes in Net Assets
| | | | | | | | |
| | | Year Ended October 31, | |
| | | 2013 | | | 2012 | |
Increase (Decrease) In Net Assets | | | | | | | | |
Operations | | | | | | | | |
Net investment income | | $ | 86,240,008 | | | $ | 100,575,718 | |
Net realized gain (loss) on investment and foreign currency transactions | | | 303,488,538 | | | | (25,846,865 | ) |
Net change in unrealized appreciation (depreciation) on investments and foreign currencies | | | 386,358,012 | | | | 174,137,611 | |
| | | | | | | | |
Net increase in net assets resulting from operations | | | 776,086,558 | | | | 248,866,464 | |
| | | | | | | | |
| | |
Dividends and Distributions (Note 1) | | | | | | | | |
Dividends from net investment income | | | | | | | | |
Class A | | | (43,485,665 | ) | | | (38,203,072 | ) |
Class B | | | (2,823,988 | ) | | | (2,206,926 | ) |
Class C | | | (20,929,195 | ) | | | (17,715,427 | ) |
Class L | | | — | | | | (342,726 | ) |
Class M | | | — | | | | (5,624 | ) |
Class Q | | | (78,867 | ) | | | (65,183 | ) |
Class R | | | (385,089 | ) | | | (186,068 | ) |
Class X | | | (23,415 | ) | | | (49,399 | ) |
Class Z | | | (33,431,806 | ) | | | (26,190,952 | ) |
| | | | | | | | |
Total dividends | | | (101,158,025 | ) | | | (84,965,377 | ) |
| | | | | | | | |
| | |
Fund share transactions (Net of share conversions) (Note 5) | | | | | | | | |
Net proceeds from shares sold | | | 1,254,342,637 | | | | 1,261,357,984 | |
Net asset value of shares issued in reinvestment of dividends and distributions | | | 77,643,037 | | | | 64,040,759 | |
Net asset value of shares issued in merger (Note 9) | | | 168,106,726 | | | | — | |
Cost of shares redeemed | | | (811,906,121 | ) | | | (679,414,318 | ) |
| | | | | | | | |
Net increase in net assets from Fund share transactions | | | 688,186,279 | | | | 645,984,425 | |
| | | | | | | | |
Total increase in net assets | | | 1,363,114,812 | | | | 809,885,512 | |
| | |
Net Assets | | | | | | | | |
Beginning of year | | | 2,880,824,078 | | | | 2,070,938,566 | |
| | | | | | | | |
End of year(a) | | $ | 4,243,938,890 | | | $ | 2,880,824,078 | |
| | | | | | | | |
(a) Includes undistributed net investment income of | | $ | 2,474,263 | | | $ | 17,745,727 | |
| | | | | | | | |
See Notes to Financial Statements.
| | | | |
| Prudential Jennison Equity Income Fund | | | 27 | |
Notes to Financial Statements
1. Organization
Prudential Investment Portfolios, Inc. 10 (the “Company”) is an open-end management investment company, registered under the Investment Company Act of 1940, as amended, (“1940 Act”). The Company was organized on March 5, 1997, as a Maryland Corporation. The Company operates as a series company. At October 31, 2013, the Company consisted of two diversified investment portfolios (each a “Fund” and collectively the “Funds”). The information presented in these financial statements pertains to Prudential Jennison Equity Income Fund (the “Fund”). The investment objective of the Fund is income and capital appreciation.
2. Significant Accounting Policies
The following is a summary of significant accounting policies followed by the Fund in the preparation of the financial statements.
Security Valuation: The Fund holds securities and other assets that are fair valued at the close of each day the New York Stock Exchange (“NYSE”) is open for trading. Fair value is the price that would be received to sell an asset or paid to transfer a liability in an orderly transaction between market participants on the measurement date. The Board of Trustees (the “Board”) has adopted Valuation Procedures for security valuation under which fair valuation responsibilities have been delegated to Prudential Investments LLC (“PI” or “Manager”). Under the current Valuation Procedures, the established Valuation Committee is responsible for supervising the valuation of portfolio securities and other assets. The Valuation Procedures permit the Fund to utilize independent pricing vendor services, quotations from market makers, and alternative valuation methods when market quotations are either not readily available or not representative of fair value. A record of the Valuation Committee’s actions is subject to the Board’s review, approval, and ratification at its next regularly-scheduled quarterly meeting.
Various inputs determine how the Fund’s investments are valued, all of which are categorized according to the three broad levels (Level 1, 2, or 3) detailed in the table following the Portfolio of Investments.
Common stocks, exchange-traded funds, and derivative instruments that are traded on a national securities exchange are valued at the last sale price as of the close of
trading on the applicable exchange. Securities traded via NASDAQ are valued at the NASDAQ official closing price. To the extent these securities are valued at the last sale price or NASDAQ official closing price; they are classified as Level 1 in the fair value hierarchy.
In the event that no sale or official closing price on valuation date exists, these securities are generally valued at the mean between the last reported bid and asked prices, or at the last bid price in the absence of an asked price. These securities are classified as Level 2 in the fair value hierarchy, as the inputs are observable and considered to be significant to the valuation.
Common stocks traded on foreign securities exchanges are valued using pricing vendor services that provide model prices derived using adjustment factors based on information such as local closing price, relevant general and sector indices, currency fluctuations, depositary receipts, and futures, as applicable. Securities valued using such model prices are classified as Level 2 in the fair value hierarchy, as the adjustment factors are observable and considered to be significant to the valuation.
Investments in open-end, non-exchange-traded mutual funds are valued at their net asset values as of the close of the NYSE on the date of valuation. These securities are classified as Level 1 in the fair value hierarchy since they may be purchased or sold at their net asset values on the date of valuation.
Fixed income securities traded in the over-the-counter market are generally valued at prices provided by approved independent pricing vendors. The pricing vendors provide these prices after evaluating observable inputs including, but not limited to yield curves, yield spreads, credit ratings, deal terms, tranche level attributes, default rates, cash flows, prepayment speeds, broker/dealer quotations, and reported trades. Securities valued using such vendor prices are classified as Level 2 in the fair value hierarchy.
Over-the-counter derivative instruments are generally valued using pricing vendor services, which derive the valuation based on inputs such as underlying asset prices, indices, spreads, interest rates, and exchange rates. These instruments are categorized as Level 2 in the fair value hierarchy.
Securities and other assets that cannot be priced according to the methods described above are valued based on pricing methodologies approved by the Board of Trustees. In the event that significant unobservable inputs are used when determining such valuations, the securities will be classified as Level 3 in the fair value hierarchy.
| | | | |
| Prudential Jennison Equity Income Fund | | | 29 | |
Notes to Financial Statements
continued
When determining the fair value of securities, some of the factors influencing the valuation include: the nature of any restrictions on disposition of the securities; assessment of the general liquidity of the securities; the issuer’s financial condition and the markets in which it does business; the cost of the investment; the size of the holding and the capitalization of the issuer; the prices of any recent transactions or bids/offers for such securities or any comparable securities; any available analyst media or other reports or information deemed reliable by the investment adviser regarding the issuer or the markets or industry in which it operates. Using fair value to price securities may result in a value that is different from a security’s most recent closing price and from the price used by other mutual funds to calculate their net asset values.
Foreign Currency Translation: Fund securities and other assets and liabilities denominated in foreign currencies are translated each business day into U.S. dollars based on the current rates of exchange. Purchases and sales of Fund securities and income and expenses are translated into U.S. dollars on the respective dates of such transactions. Gains and losses resulting from changes in exchange rates applicable to long-term foreign securities are not reported separately from gains and losses arising from movements in securities prices. Net realized foreign exchange gains and losses include gains and losses from sales and maturities of foreign currency exchange contracts, gains and losses realized between the trade and settlement dates of foreign securities transactions, and the difference between the amount of net investment income accrued on foreign securities and the U.S. dollar amount actually received. Net unrealized foreign exchange gains and losses include gains and losses from changes in the value of assets and liabilities other than Fund securities, resulting from changes in exchange rates.
Options: The Fund may either purchase or write options in order to hedge against adverse market movements or fluctuations in value caused by changes in prevailing interest rates or foreign currency exchange rates with respect to securities or financial instruments which the Fund currently owns or intends to purchase. The Fund’s principal reason for writing options is to realize, through receipt of premiums, a greater current return than would be realized on the underlying security alone. When the Fund purchases an option, it pays a premium and an amount equal to that premium is recorded as an asset. When the Fund writes an option, it receives a premium and an amount equal to that premium is recorded as a liability. The asset or liability is adjusted daily to reflect the current market value of the option.
If an option expires unexercised, the Fund realizes a gain or loss to the extent of the premium received or paid. If an option is exercised, the premium received or paid is recorded as an adjustment to the proceeds from the sale or the cost basis of the purchase. The difference between the premium and the amount received or paid on at a closing purchase or sale transaction is also treated as a realized gain or loss. Gain or loss on purchased options is included in net realized gain or loss on investment transactions. Gain or loss on written options is presented separately as net realized gain or loss on written options transactions.
The Fund, as writer of an option, may have no control over whether the underlying securities or financial instruments may be sold (called) or purchased (put). As a result, the Fund bears the market risk of an unfavorable change in the price of the security or financial instrument underlying the written option. Over-the-counter options involve the risk of the potential inability of the counterparties to meet the terms of their contracts.
When a Fund writes an option on a swap, an amount equal to any premium received by the Fund is recorded as a liability and is subsequently adjusted to the current market value of the written option on the swap. If a call option on a swap is exercised, the Fund becomes obligated to pay a fixed interest rate (noted as the strike price) and receive a variable interest rate on a notional amount. If a put option on a swap is exercised, the Fund becomes obligated to pay a variable interest rate and receive a fixed interest rate (noted as the strike price) on a notional amount. Premiums received from writing options on swaps that expire or are exercised are treated as realized gains upon the expiration or exercise of such options on swaps. The risk associated with writing put and call options on swaps is that the Fund will be obligated to be party to a swap agreement if an option on a swap is exercised.
Securities Lending: The Fund may lend its portfolio securities to banks and broker-dealers. The loans are secured by collateral at least equal to the market value of the securities loaned. Collateral pledged by each borrower is invested in a highly liquid short-term money market fund and is marked to market daily, based on the previous day’s market value, such that the value of the collateral exceeds the value of the loaned securities. Loans are subject to termination at the option of the borrower or the Fund. Upon termination of the loan, the borrower will return to the Fund securities identical to the loaned securities. Should the borrower of the securities fail financially, the Fund has the right to repurchase the securities using the collateral in the open market. The Fund recognizes income, net of any rebate and securities lending agent fees, for lending its securities, and any interest on the investment of cash received as collateral. The Fund also continues to receive interest and dividends or amounts equivalent thereto, on the securities loaned and recognizes any unrealized gain or loss in the market price of the securities loaned that may occur during the term of the loan.
| | | | |
| Prudential Jennison Equity Income Fund | | | 31 | |
Notes to Financial Statements
continued
Securities Transactions and Net Investment Income: Securities transactions are recorded on the trade date. Realized gains or losses from investment and currency transactions are calculated on the identified cost basis. Dividend income is recorded on the ex-dividend date. Interest income, including amortization of premium and accretion of discount on debt securities, as required, is recorded on an accrual basis. Expenses are recorded on an accrual basis, which may require the use of certain estimates by management, that may differ from actual.
Net investment income or loss (other than distribution fees which are charged directly to the respective class) and unrealized and realized gains or losses are allocated daily to each class of shares based upon the relative proportion of adjusted net assets of each class at the beginning of the day.
Dividends and Distributions to Shareholders: Dividends and distributions to shareholders are recorded on the ex-divided date. Dividends, if any, from net investment income are declared and paid at least quarterly. These dividends and distributions are determined in accordance with federal income tax regulations and may differ from accounting principles generally accepted in the United States of America.
Net realized gains from investment transactions, if any, are distributed at least annually. Permanent book/tax differences relating to income and gains are reclassified to paid-in capital when they arise.
Taxes: For federal income tax purposes, each Fund in the Company is treated as a separate tax paying entity. It is the Funds’ policy to continue to meet the requirements of the Internal Revenue Code applicable to regulated investment companies and to distribute all of its taxable net income and capital gains, if any, to shareholders. Therefore, no federal tax provision is required. Withholding taxes on foreign dividends are recorded net of reclaimable amounts, at the time the related income is earned.
Estimates: The preparation of the financial statements requires management to make estimates and assumptions that affect the reported amounts and disclosures in the financial statements. Actual results could differ from those estimates.
3. Agreements
The Fund has entered into investment management agreements with PI which provides that the Manager will furnish the Fund with investment advice and investment management and administrative services. The Manager has entered into a subadvisory agreement with Jennison Associates LLC.
Advisory Fee and Expense Limitations: The Manager receives a fee, computed daily and paid monthly, based on an annual rate of the average net assets. The Manager pays the subadvisor a fee as compensation for advisory services provided to the Fund. The Manager has voluntarily agreed to waive expenses in accordance with limitation expense policies as noted in the table below. The Manager will reimburse the Fund for its operating expenses, exclusive of taxes, interest, brokerage commissions, distribution fees and extraordinary expenses, but inclusive of the advisory fee, which in the aggregate exceed specified percentages of the Fund’s average net assets while retaining their ability to be reimbursed for such fee waivers prior to the end of the fiscal year. The advisory fee and expense limitation are summarized as follows:
| | | | |
Advisory Fee | | Effective Advisory Fee | | Expense
Limitation |
| .85% to $500 million; | | .77% | | 1.15% |
| .80% next $500 million; | | | | |
| .75% next $1.5 billion; | | | | |
| .725% in excess of $2.5 billion | | | | |
Such contractual fee waivers or reductions have been calculated prior to any fee reimbursements with respect to the expense limitations, and may be rescinded at any time and without notice to investors. All reimbursements by the Manager are reflected in the Statements of Operations.
Certain officers and directors of the Fund are officers or directors of the Manager. The Fund pays no compensation directly to its officers or interested directors.
The fund has distribution agreements with Prudential Investment Management Services LLC (“PIMS”) and Prudential Annuities Distributors, Inc. (“PAD”). PIMS and PAD are both affiliates of PI and indirect, wholly-owned subsidiaries of Prudential. PIMS serves as the distributor of the Fund’s Class A, Class B, Class C, Class Q, Class R and Class Z shares. PIMS, together with PAD, serves as co-distributor of the Fund’s Class X shares.
The Company has adopted a separate Distribution and Service plan (each a “Plan” and collectively the “Plans”) for the Class A, Class B, Class C, Class R and Class X shares of
| | | | |
| Prudential Jennison Equity Income Fund | | | 33 | |
Notes to Financial Statements
continued
the Fund in accordance with Rule 12b-1 of the 1940 Act. No distribution or service fees are paid to PIMS as distributor for the Fund’s Class Q or Class Z shares.
Under the Plans, the Fund compensate PIMS and PAD a distribution and service fee at an annual rate up to .30%, 1.00%, 1.00%, .75% and 1.00% of the average daily net assets of the Class A, B, C, R and X shares, respectively. Through February 28, 2015, PIMS has contractually agreed to limit such fees to .25% and .50% of the average daily net assets of the Class A shares and Class R shares, respectively.
During the year ended October 31, 2013, PIMS has advised the Fund, front-end sales charges (“FESC”) and gross contingent deferred sales charges (“CDSC”) were as follows:
| | | | | | |
Class A
FESC | | Class A
CDSC | | Class B
CDSC | | Class C
CDSC |
| $3,735,737 | | $18,436 | | $210,065 | | $97,514 |
4. Other Transactions with Affiliates
Prudential Mutual Fund Services LLC (“PMFS”), an affiliate of Prudential Investments LLC and an indirect, wholly-owned subsidiary of Prudential, serves as the Fund’s transfer agent. Transfer agent fees and expenses are shown in the Statements of Operations.
The Fund invests in the Prudential Core Taxable Money Market Fund (the “Core Fund”), a portfolio of the Prudential Investment Portfolios 2, registered under the 1940 Act, and managed by PI. Earnings from the Core Fund are disclosed on the Statement of Operations as affiliated dividend income.
Prudential Investment Management, Inc. (“PIM”), an indirect, wholly-owned subsidiary of Prudential, served as the Fund’s securities lending agent. For the year ended October 31, 2013, PIM has been compensated approximately $682,000 for these services.
5. Shares of Capital Stock
The Fund offers Class A, Class B, Class C, Class Q, Class R, Class X and Class Z shares. Class A shares are sold with a front-end sales charge of up to 5.50%. Purchases of $1 million or more are subject to a contingent deferred sales charge (“CDSC”) if shares are redeemed within 12 months of their purchase. Class B shares are sold with a CDSC which declines from 5% to zero depending upon the period of time the shares are held. Class B shares will automatically convert to Class A shares approximately seven years after purchase. Class C shares are sold with a CDSC of 1% on shares redeemed within the first 12 months of purchase. The last conversion of Class M and Class L shares to Class A shares was completed as of April 13, 2012 and August 24, 2012, respectively. There are no Class M and Class L shares outstanding and Class M and Class L shares are no longer being offered for sale. Class X shares are closed to new purchases. Class X shares will automatically convert to Class A shares approximately ten years after purchase. Class Q, Class R and Class Z shares are not subject to any sales or redemption charge and are offered exclusively for sale to a limited group of investors.
Under certain circumstances, an exchange may be made from specified share classes of the Fund to one or more other share classes of the Fund as presented in the table of transactions in shares of capital.
Of the Company’s authorized capital stock, 725 million authorized shares have been allocated to the Fund and divided into eight classes, designated Class A, Class B, Class C, Class M, Class Q, Class R, Class X and Class Z capital stock, each of which consists of 253 million, 20 million, 150 million, 1 million, 75 million, 75 million, 1 million and 150 million authorized shares, respectively.
| | | | |
| Prudential Jennison Equity Income Fund | | | 35 | |
Notes to Financial Statements
continued
Transactions in shares of capital were as follows:
| | | | | | | | |
Class A | | Shares | | | Amount | |
Year ended October 31, 2013: | | | | | | | | |
Shares sold | | | 28,325,470 | | | $ | 433,427,788 | |
Shares issued in merger | | | 7,610,532 | | | | 114,043,817 | |
Shares issued in reinvestment of dividends and distributions | | | 2,470,850 | | | | 36,541,259 | |
Shares reacquired | | | (25,026,307 | ) | | | (379,361,580 | ) |
| | | | | | | | |
Net increase (decrease) in shares outstanding before conversion | | | 13,380,545 | | | | 204,651,284 | |
Shares issued upon conversion from Class B, Class C, Class X and Class Z | | | 405,206 | | | | 6,168,718 | |
Shares reacquired upon conversion into Class Z | | | (483,118 | ) | | | (7,480,271 | ) |
| | | | | | | | |
Net increase (decrease) in shares outstanding | | | 13,302,633 | | | $ | 203,339,731 | |
| | | | | | | | |
Year ended October 31, 2012: | | | | | | | | |
Shares sold | | | 36,549,724 | | | $ | 492,916,487 | |
Shares issued in reinvestment of dividends and distributions | | | 2,353,383 | | | | 31,743,465 | |
Shares reacquired | | | (22,353,402 | ) | | | (302,936,200 | ) |
| | | | | | | | |
Net increase (decrease) in shares outstanding before conversion | | | 16,549,705 | | | | 221,723,752 | |
Shares issued upon conversion from Class B, Class X and Class Z | | | 1,652,448 | | | | 22,823,129 | |
Shares reacquired upon conversion into Class Z | | | (351,082 | ) | | | (4,798,190 | ) |
| | | | | | | | |
Net increase (decrease) in shares outstanding | | | 17,851,071 | | | $ | 239,748,691 | |
| | | | | | | | |
Class B | | | | | | |
Year ended October 31, 2013: | | | | | | | | |
Shares sold | | | 2,928,030 | | | $ | 42,560,655 | |
Shares issued in merger | | | 1,112,052 | | | | 15,752,745 | |
Shares issued in reinvestment of dividends and distributions | | | 137,354 | | | | 1,916,390 | |
Shares reacquired | | | (887,237 | ) | | | (12,758,306 | ) |
| | | | | | | | |
Net increase (decrease) in shares outstanding before conversion | | | 3,290,199 | | | | 47,471,484 | |
Shares reacquired upon conversion into Class A | | | (160,991 | ) | | | (2,346,248 | ) |
| | | | | | | | |
Net increase (decrease) in shares outstanding | | | 3,129,208 | | | $ | 45,125,236 | |
| | | | | | | | |
Year ended October 31, 2012: | | | | | | | | |
Shares sold | | | 2,784,134 | | | $ | 35,711,191 | |
Shares issued in reinvestment of dividends and distributions | | | 113,961 | | | | 1,459,974 | |
Shares reacquired | | | (652,083 | ) | | | (8,380,672 | ) |
| | | | | | | | |
Net increase (decrease) in shares outstanding before conversion | | | 2,246,012 | | | | 28,790,493 | |
Shares reacquired upon conversion into Class A | | | (138,913 | ) | | | (1,792,049 | ) |
| | | | | | | | |
Net increase (decrease) in shares outstanding | | | 2,107,099 | | | $ | 26,998,444 | |
| | | | | | | | |
| | | | | | | | |
Class C | | Shares | | | Amount | |
Year ended October 31, 2013: | | | | | | | | |
Shares sold | | | 20,066,526 | | | $ | 291,143,523 | |
Shares issued in merger | | | 2,513,330 | | | | 35,553,074 | |
Shares issued in reinvestment of dividends and distributions | | | 1,082,292 | | | | 15,041,870 | |
Shares reacquired | | | (8,233,400 | ) | | | (118,003,465 | ) |
| | | | | | | | |
Net increase (decrease) in shares outstanding before conversion | | | 15,428,748 | | | | 223,735,002 | |
Shares reacquired upon conversion into Class A and Class Z | | | (912,358 | ) | | | (13,065,924 | ) |
| | | | | | | | |
Net increase (decrease) in shares outstanding | | | 14,516,390 | | | $ | 210,669,078 | |
| | | | | | | | |
Year ended October 31, 2012: | | | | | | | | |
Shares sold | | | 19,981,446 | | | $ | 255,542,349 | |
Shares issued in reinvestment of dividends and distributions | | | 950,413 | | | | 12,153,690 | |
Shares reacquired | | | (8,687,100 | ) | | | (111,305,404 | ) |
| | | | | | | | |
Net increase (decrease) in shares outstanding before conversion | | | 12,244,759 | | | | 156,390,635 | |
Shares reacquired upon conversion into Class Z | | | (179,831 | ) | | | (2,300,077 | ) |
| | | | | | | | |
Net increase (decrease) in shares outstanding | | | 12,064,928 | | | $ | 154,090,558 | |
| | | | | | | | |
Class Q | | | | | | |
Year ended October 31, 2013: | | | | | | | | |
Shares sold | | | 72,650 | | | $ | 1,096,724 | |
Shares issued in reinvestment of dividends and distributions | | | 5,343 | | | | 78,867 | |
Shares reacquired | | | (74,070 | ) | | | (1,104,393 | ) |
| | | | | | | | |
Net increase (decrease) in shares outstanding | | | 3,923 | | | $ | 71,198 | |
| | | | | | | | |
Year ended October 31, 2012: | | | | | | | | |
Shares sold | | | 90,865 | | | $ | 1,255,623 | |
Shares issued in reinvestment of dividends and distributions | | | 4,797 | | | | 65,183 | |
Shares reacquired | | | (13,400 | ) | | | (183,578 | ) |
| | | | | | | | |
Net increase (decrease) in shares outstanding | | | 82,262 | | | $ | 1,137,228 | |
| | | | | | | | |
Class R | | | | | | |
Year ended October 31, 2013: | | | | | | | | |
Shares sold | | | 868,863 | | | $ | 13,429,543 | |
Shares issued in merger | | | 192 | | | | 2,880 | |
Shares issued in reinvestment of dividends and distributions | | | 24,623 | | | | 367,230 | |
Shares reacquired | | | (201,382 | ) | | | (3,095,665 | ) |
| | | | | | | | |
Net increase (decrease) in shares outstanding | | | 692,296 | | | $ | 10,703,988 | |
| | | | | | | | |
Year ended October 31, 2012: | | | | | | | | |
Shares sold | | | 497,501 | | | $ | 6,763,238 | |
Shares issued in reinvestment of dividends and distributions | | | 12,463 | | | | 170,247 | |
Shares reacquired | | | (101,968 | ) | | | (1,374,331 | ) |
| | | | | | | | |
Net increase (decrease) in shares outstanding | | | 407,996 | | | $ | 5,559,154 | |
| | | | | | | | |
| | | | |
| Prudential Jennison Equity Income Fund | | | 37 | |
Notes to Financial Statements
continued
| | | | | | | | |
Class X | | Shares | | | Amount | |
Year ended October 31, 2013: | | | | | | | | |
Shares sold | | | 1,800 | | | $ | 25,734 | |
Shares issued in merger | | | 6,216 | | | | 87,873 | |
Shares issued in reinvestment of dividends and distributions | | | 1,703 | | | | 23,233 | |
Shares reacquired | | | (5,705 | ) | | | (82,011 | ) |
| | | | | | | | |
Net increase (decrease) in shares outstanding before conversion | | | 4,014 | | | | 54,829 | |
Shares reacquired upon conversion into Class A | | | (72,036 | ) | | | (1,033,133 | ) |
| | | | | | | | |
Net increase (decrease) in shares outstanding | | | (68,022 | ) | | $ | (978,304 | ) |
| | | | | | | | |
Year ended October 31, 2012: | | | | | | | | |
Shares sold | | | 2,361 | | | $ | 29,727 | |
Shares issued in reinvestment of dividends and distributions | | | 3,882 | | | | 48,864 | |
Shares reacquired | | | (19,238 | ) | | | (243,118 | ) |
| | | | | | | | |
Net increase (decrease) in shares outstanding before conversion | | | (12,995 | ) | | | (164,527 | ) |
Shares reacquired upon conversion into Class A | | | (110,671 | ) | | | (1,412,712 | ) |
| | | | | | | | |
Net increase (decrease) in shares outstanding | | | (123,666 | ) | | $ | (1,577,239 | ) |
| | | | | | | | |
Class Z | | | | | | |
Year ended October 31, 2013: | | | | | | | | |
Shares sold | | | 30,752,301 | | | $ | 472,658,670 | |
Shares issued in merger | | | 177,971 | | | | 2,666,337 | |
Shares issued in reinvestment of dividends and distributions | | | 1,598,627 | | | | 23,674,188 | |
Shares reacquired | | | (19,481,771 | ) | | | (297,500,701 | ) |
| | | | | | | | |
Net increase (decrease) in shares outstanding before conversion | | | 13,047,128 | | | | 201,498,494 | |
Shares issued upon conversion from Class A and Class C | | | 1,343,373 | | | | 20,536,992 | |
Shares reacquired upon conversion into Class A | | | (184,844 | ) | | | (2,780,134 | ) |
| | | | | | | | |
Net increase (decrease) in shares outstanding | | | 14,205,657 | | | $ | 219,255,352 | |
| | | | | | | | |
Year ended October 31, 2012: | | | | | | | | |
Shares sold | | | 34,694,205 | | | $ | 468,961,731 | |
Shares issued in reinvestment of dividends and distributions | | | 1,336,870 | | | | 18,057,420 | |
Shares reacquired | | | (18,805,478 | ) | | | (253,313,148 | ) |
| | | | | | | | |
Net increase (decrease) in shares outstanding before conversion | | | 17,225,597 | | | | 233,706,003 | |
Shares issued upon conversion from Class A and Class C | | | 522,280 | | | | 7,098,267 | |
Shares reacquired upon conversion into Class A | | | (123,688 | ) | | | (1,680,381 | ) |
| | | | | | | | |
Net increase (decrease) in shares outstanding | | | 17,624,189 | | | $ | 239,123,889 | |
| | | | | | | | |
6. Tax Information
Distributions to shareholders, which are determined in accordance with federal income tax regulations and which may differ from generally accepted accounting
principles, are recorded on the ex-dividend date. In order to present undistributed net investment income, accumulated net realized gain on investment and foreign currency transactions and paid-in capital in excess of par on the Statement of Assets and Liabilities that more closely represent their tax character, certain adjustments have been made to undistributed net investment income, accumulated net realized gain on investment and foreign currency transactions and paid-in capital in excess of par. For the year ended October 31, 2013, the adjustments were to decrease undistributed net investment income by $353,447, decrease accumulated net realized gain on investment and foreign currency transactions by $28,324,190 and increase paid-in capital in excess of par by $28,677,637 due to differences in the treatment for book and tax purposes of certain transactions involving foreign securities and currencies, investment in partnerships reclassification of capital carryforward and wash sales due to the reorganization and other book to tax differences. Net investment income, net realized gain (loss) on investment and foreign currency transactions and net assets were not affected by this change.
For the years ended October 31, 2013 and 2012, the tax character of dividends paid as reflected in the Statement of Changes in Net Assets were $101,158,025 and $84,965,377 of ordinary income, respectively.
As of October 31, 2013 the accumulated undistributed earnings on a tax basis were $2,477,087 of ordinary income and $189,423,216 of long-term capital gains. This differs from the amount shown on the Statement of Assets and Liabilities primarily due to cumulative timing differences between financial and tax reporting.
The United States federal income tax basis of the Fund’s investments and the net unrealized appreciation as of October 31, 2013 were as follows:
| | | | | | | | | | |
Tax Basis | | Appreciation | | Depreciation | | Net
Unrealized
Appreciation | | Other Cost
Basis
Adjustment | | Total Net
Unrealized
Appreciation |
| $4,031,725,060 | | $699,421,039 | | $(105,875,557) | | $593,545,482 | | $15,420 | | $593,560,902 |
The difference between book basis and tax basis is primarily attributable to deferred losses on wash sales, investment in partnerships and other cost basis differences between financial and tax reporting. Other cost basis adjustments are primarily attributable to appreciation (depreciation) of foreign currencies and options.
The Fund utilized approximately $112,200,000 of its capital loss carryforward to offset net taxable gains realized in the fiscal year ended October 31, 2013. Certain
| | | | |
| Prudential Jennison Equity Income Fund | | | 39 | |
Notes to Financial Statements
continued
portion of the capital loss carryforward was assumed and utilized by the Fund as a result of an acquisition.
Management has analyzed the Fund’s tax positions taken on federal income tax returns for all open tax years and has concluded that no provision for income tax is required in the Fund’s financial statements for the current reporting period. The Fund’s federal and state income and federal excise tax returns for tax years for which the applicable statutes of limitations have not expired are subject to examination by the Internal Revenue Service and state departments of revenue.
7. Portfolio Securities
Purchases and sales of securities, other than short term obligations, during the year ended October 31, 2013, were $3,601,733,605 and $3,110,502,459, respectively.
| | | | | | | | |
| | | Notional
Amount
(000) | | | Premium
Received | |
Options outstanding at October 31, 2012 | | | 50 | | | $ | 606,476 | |
Written options | | | 193 | | | | 1,735,849 | |
Expired options | | | (168 | ) | | | (1,720,235 | ) |
Excercised options | | | — | | | | — | |
Closed options | | | (75 | ) | | | (622,090 | ) |
| | | | | | | | |
Options outstanding at October 31, 2013 | | | — | | | $ | — | |
| | | | | | | | |
8. Borrowings
The Fund, along with other affiliated registered investment companies (the “Funds”), is a party to a Syndicated Credit Agreement (“SCA”) with a group of banks. The purpose of the SCA is to provide an alternative source of temporary funding for capital share redemptions. The SCA provides for a commitment of $900 million for the period November 15, 2012 through November 4, 2013. The Funds pay an annualized commitment fee of .08% of the unused portion of the SCA. Prior to November 15, 2012, the Funds had another Syndicated Credit Agreement with substantially similar terms. Interest on any borrowings under the SCA is paid at contracted market rates. The commitment fee for the unused amount is accrued daily and paid quarterly.
Subsequent to the fiscal year end, the SCA has been renewed effective November 5, 2013 at substantially similar terms through November 4, 2014.
The Fund borrowed $2,995,000 for one day at an interest rate of 1.4575% pursuant to the SCA during the year ended October 31, 2013.
Note 9. Reorganization
On December 4, 2012, the Board of Trustees of the Company approved an Agreement and Plan of Reorganization (the “Plan”) which provided for the transfer of all the assets of the following portfolio for shares of the acquiring portfolio and the assumption of the liabilities of the portfolio. Shareholders approved the Plan at a meeting on June 7, 2013 and the reorganization took place on June 21, 2013.
The purpose of the transaction was to combine two funds with comparable investment objectives and policies.
The acquisition was accomplished by a tax-free exchange of the following shares on June 21, 2013:
| | | | | | | | | | | | | | | | |
| Merged Portfolio | | | Acquiring Portfolio | |
Target Growth Asset
Allocation Fund | | | Jennison Equity
Income Portfolio | |
Class | | Shares | | | Class | | | Shares | | | Value | |
| A | | | 8,584,038 | | | | A | | | | 7,610,532 | | | $ | 114,043,817 | |
| B | | | 1,293,742 | | | | B | | | | 1,112,052 | | | | 15,752,745 | |
| C | | | 2,917,774 | | | | C | | | | 2,513,330 | | | | 35,553,074 | |
| R | | | 218 | | | | R | | | | 192 | | | | 2,880 | |
| X | | | 7,101 | | | | X | | | | 6,216 | | | | 87,873 | |
| Z | | | 195,311 | | | | Z | | | | 177,971 | | | | 2,666,337 | |
For financial reporting purposes, assets received and shares issued by Jennison Equity Income Portfolio were recorded at fair value; however, the cost basis of the investments received from Target Growth Asset Allocation Fund was carried forward to reflect the tax-free status of the acquisition.
| | | | |
| Prudential Jennison Equity Income Fund | | | 41 | |
Notes to Financial Statements
continued
The net assets and net unrealized appreciation (depreciation) immediately before the acquisitions were as follows:
| | | | | | | | | | | | | | | | |
| Merged Portfolio | | | Acquiring Portfolio | |
Target Growth Asset
Allocation Fund | | | Jennison Equity
Income Portfolio | |
Class | | Net Assets | | | Unrealized
Appreciation | | | Class | | | Net Assets | |
| A | | $ | 114,043,817 | | | $ | 9,081,317 | | | | A | | | $ | 1,416,383,180 | |
| B | | | 15,752,745 | | | | 9,232,717 | | | | B | | | | 116,255,227 | |
| C | | | 35,553,074 | | | | 7,264,184 | | | | C | | | | 854,459,849 | |
| R | | | 2,880 | | | | 4,463 | | | | Q | | | | 2,194,387 | |
| X | | | 87,873 | | | | (360,578 | ) | | | R | | | | 16,001,929 | |
| Z | | | 2,666,337 | | | | 9,013,263 | | | | X | | | | 600,811 | |
| | | | | | | | | | | Z | | | | 1,058,696,322 | |
Assuming the acquisition had been completed on November 1, 2012, Jennison Equity Income Portfolio’s results of operations for the year ended October 31, 2013 were as follows:
| | | | |
Net investment income | | $ | 87,324,855 | (a) |
Net realized and unrealized | | $ | 710,167,851 | (b) |
| | | | |
Gain (loss) on investments | | $ | 797,492,706 | |
| | | | |
| (a) | $86,240,008, as reported in the Statement of Operations, plus $619,847 Net Investment Income from Merged Fund pre-merger, plus $465,000 of pro-forma eliminated expenses. |
| (b) | $689,846,550, as reported in the Statement of Operations, plus $20,321,301 Net Realized and Unrealized Gain (loss) on Investments from Merger Fund pre-merger. |
Because both Jennison Equity Income Portfolio and Target Growth Asset Allocation Fund sold and redeemed shares throughout the period, it is not practicable to provide pro-forma information on a per-share basis.
Because the combined investment portfolios have been managed as a single integrated portfolio since the acquisition was completed, it is also not practicable to separate the amounts of revenue and earnings of Target Growth Asset Allocation Fund that have been included in Jennison Equity Income Portfolio’s Statement of Operations since June 21, 2013.
Note 10. New Accounting Pronouncement
In January 2013, the Financial Accounting Standards Board (“FASB”) issued Accounting Standards Update (“ASU”) No. 2013-01 “Clarifying the Scope of Disclosures about Offsetting Assets and Liabilities” which replaced ASU No. 2011-11 “Disclosures about Offsetting Assets and Liabilities”. The updates create new disclosure requirements requiring entities to disclose both gross and net information for derivatives and other financial instruments that are either offset in the Statement of Assets and Liabilities or subject to an enforceable master netting arrangement or similar agreement. The disclosure requirements are effective for annual reporting periods beginning on or after January 1, 2013 and interim periods within those annual periods. Management is currently evaluating the application of ASU No. 2013-01 and its impact, if any, on the Fund’s financial statements.
Note 11. Dividends and Distributions to Shareholders
Subsequent to the fiscal year end, the Fund declared an ordinary income dividend and a long-term capital gain distribution on December 18, 2013 to shareholders of record on December 19, 2013. The ex-dividend date was December 20, 2013. The per share amount declared was as follows:
| | | | | | | | |
| | | Ordinary Income | | | Long-Term
Capital Gains | |
Class A | | $ | 0.06894 | | | $ | 0.73485 | |
Class B | | $ | 0.03535 | | | $ | 0.73485 | |
Class C | | $ | 0.03535 | | | $ | 0.73485 | |
Class Q | | $ | 0.08689 | | | $ | 0.73485 | |
Class R | | $ | 0.05670 | | | $ | 0.73485 | |
Class X | | $ | 0.03535 | | | $ | 0.73485 | |
Class Z | | $ | 0.08119 | | | $ | 0.73485 | |
| | | | |
| Prudential Jennison Equity Income Fund | | | 43 | |
Financial Highlights
| | | | | | | | | | | | | | | | | | | | |
| Class A Shares | |
| | | Year Ended October 31, | |
| | | 2013(b) | | | 2012(b) | | | 2011(b) | | | 2010(b) | | | 2009(b) | |
| Per Share Operating Performance: | | | | | | | | | | | | | | | | | | | | |
| Net Asset Value, Beginning Of Year | | | $13.90 | | | | $12.98 | | | | $12.92 | | | | $10.86 | | | | $8.60 | |
| Income from investment operations: | | | | | | | | | | | | | | | | | | | | |
| Net investment income | | | .40 | | | | .55 | | | | .52 | | | | .43 | | | | .44 | |
| Net realized and unrealized gain on investments | | | 3.01 | | | | .83 | | | | .02 | | | | 2.24 | | | | 1.93 | |
| Total from investment operations | | | 3.41 | | | | 1.38 | | | | .54 | | | | 2.67 | | | | 2.37 | |
| Less Dividends and Distributions: | | | | | | | | | | | | | | | | | | | | |
| Dividends from net investment income | | | (.47 | ) | | | (.46 | ) | | | (.48 | ) | | | (.61 | ) | | | (.11 | ) |
| Distributions from net realized gains | | | - | | | | - | | | | - | | | | - | | | | - | |
| Total dividends and distributions | | | (.47 | ) | | | (.46 | ) | | | (.48 | ) | | | (.61 | ) | | | (.11 | ) |
| Capital Contributions(d) | | | - | | | | - | | | | - | | | | - | * | | | - | |
| Net asset value, end of year | | | $16.84 | | | | $13.90 | | | | $12.98 | | | | $12.92 | | | | $10.86 | |
| Total Return(a) | | | 25.14% | | | | 10.77% | | | | 4.16% | | | | 25.19% | | | | 28.09% | |
| |
| Ratios/Supplemental Data: | | | | | | | | | | | | | | | |
| Net assets, end of year (in millions) | | | $1,738.3 | | | | $1,249.1 | | | | $935.0 | | | | $313.7 | | | | $75.3 | |
| Ratios to average net assets(c)(e): | | | | | | | | | | | | | | | | | | | | |
| Expenses after advisory fee waiver and/or expense reimbursement | | | 1.16% | | | | 1.17% | | | | 1.22% | | | | 1.44% | | | | 1.40% | |
| Expenses before advisory fee waiver and/or expense reimbursement | | | 1.21% | | | | 1.22% | | | | 1.27% | | | | 1.50% | | | | 1.71% | |
| Net investment income | | | 2.63% | | | | 4.07% | | | | 3.88% | | | | 3.62% | | | | 4.79% | |
| Portfolio turnover rate | | | 91% | | | | 72% | | | | 70% | | | | 49% | | | | 63% | |
(a) Total return does not consider the effects of sales load. Total return is calculated assuming a purchase of a share on the first day and a sale on the last day of each year reported and includes reinvestment of dividends and distributions. Total returns may reflect adjustments to conform with generally accepted accounting principles. Total return includes the effect of expense subsidies.
(b) Calculations are based on the average daily number of shares outstanding.
(c) Does not include expenses of the underlying portfolio in which the Fund invests.
(d) The Fund received payments related to a former affiliates and to an unaffiliated-third party’s settlement of regulatory proceedings involving allegations of improper trading in Fund shares during the fiscal year ended October 31, 2010. The fund was not involved in the proceedings or in the calculation of the amount of the settlement.
(e) The distributor of the Fund has contractually agreed to limit its distribution and service (12b-1) fees to .25% of the average daily net assets of the Class A shares.
* Amount is less than $0.005.
See Notes to Financial Statements.
| | | | | | | | | | | | | | | | | | | | |
| Class B Shares | |
| | | Year Ended October 31, | |
| | | 2013(b) | | | 2012(b) | | | 2011(b) | | | 2010(b) | | | 2009(b) | |
| Per Share Operating Performance: | | | | | | | | | | | | | | | | | | | | |
| Net Asset Value, Beginning Of Year | | | $13.15 | | | | $12.31 | | | | $12.27 | | | | $10.30 | | | | $8.22 | |
| Income from investment operations: | | | | | | | | | | | | | | | | | | | | |
| Net investment income | | | .25 | | | | .43 | | | | .39 | | | | .32 | | | | .36 | |
| Net realized and unrealized gain on investments | | | 2.87 | | | | .77 | | | | .04 | | | | 2.13 | | | | 1.82 | |
| Total from investment operations | | | 3.12 | | | | 1.20 | | | | .43 | | | | 2.45 | | | | 2.18 | |
| Less Dividends and Distributions: | | | | | | | | | | | | | | | | | | | | |
| Dividends from net investment income | | | (.37 | ) | | | (.36 | ) | | | (.39 | ) | | | (.48 | ) | | | (.10 | ) |
| Distributions from net realized gains | | | - | | | | - | | | | - | | | | - | | | | - | |
| Total dividends and distributions | | | (.37 | ) | | | (.36 | ) | | | (.39 | ) | | | (.48 | ) | | | (.10 | ) |
| Capital Contributions(d) | | | - | | | | - | | | | - | | | | - | * | | | - | |
| Net asset value, end of year | | | $15.90 | | | | $13.15 | | | | $12.31 | | | | $12.27 | | | | $10.30 | |
| Total Return(a) | | | 24.16% | | | | 9.91% | | | | 3.45% | | | | 24.32% | | | | 27.03% | |
| |
| Ratios/Supplemental Data: | |
| Net assets, end of year (in millions) | | | $159.3 | | | | $90.6 | | | | $58.8 | | | | $16.8 | | | | $4.6 | |
| Ratios to average net assets(c): | | | | | | | | | | | | | | | | | | | | |
| Expenses after advisory fee waiver and/or expense reimbursement | | | 1.91% | | | | 1.92% | | | | 1.97% | | | | 2.19% | | | | 2.15% | |
| Expenses before advisory fee waiver and/or expense reimbursement | | | 1.91% | | | | 1.92% | | | | 1.97% | | | | 2.20% | | | | 2.41% | |
| Net investment income | | | 1.81% | | | | 3.33% | | | | 3.07% | | | | 2.85% | | | | 4.11% | |
| Portfolio turnover rate | | | 91% | | | | 72% | | | | 70% | | | | 49% | | | | 63% | |
(a) Total return does not consider the effects of sales load. Total return is calculated assuming a purchase of a share on the first day and a sale on the last day of each year reported and includes reinvestment of dividends and distributions. Total returns may reflect adjustments to conform with generally accepted accounting principles. Total return includes the effect of expense subsidies.
(b) Calculations are based on the average daily number of shares outstanding.
(c) Does not include expenses of the underlying portfolio in which the Fund invests.
(d) The Fund received payments related to a former affiliates and to an unaffiliated-third party’s settlement of regulatory proceedings involving allegations of improper trading in Fund shares during the fiscal year ended October 31, 2010. The fund was not involved in the proceedings or in the calculation of the amount of the settlement.
* Amount is less than $0.005.
See Notes to Financial Statements.
| | | | |
| Prudential Jennison Equity Income Fund | | | 45 | |
Financial Highlights
continued
| | | | | | | | | | | | | | | | | | | | |
| Class C Shares | |
| | | Year Ended October 31, | |
| | | 2013(b) | | | 2012(b) | | | 2011(b) | | | 2010(b) | | | 2009(b) | |
| Per Share Operating Performance: | | | | | | | | | | | | | | | | | | | | |
| Net Asset Value, Beginning Of Year | | | $13.12 | | | | $12.28 | | | | $12.25 | | | | $10.28 | | | | $8.20 | |
| Income from investment operations: | | | | | | | | | | | | | | | | | | | | |
| Net investment income | | | .27 | | | | .43 | | | | .39 | | | | .32 | | | | .35 | |
| Net realized and unrealized gain on investments | | | 2.85 | | | | .77 | | | | .03 | | | | 2.13 | | | | 1.83 | |
| Total from investment operations | | | 3.12 | | | | 1.20 | | | | .42 | | | | 2.45 | | | | 2.18 | |
| Less Dividends and Distributions: | | | | | | | | | | | | | | | | | | | | |
| Dividends from net investment income | | | (.37 | ) | | | (.36 | ) | | | (.39 | ) | | | (.48 | ) | | | (.10 | ) |
| Distributions from net realized gains | | | - | | | | - | | | | - | | | | - | | | | - | |
| Total dividends and distributions | | | (.37 | ) | | | (.36 | ) | | | (.39 | ) | | | (.48 | ) | | | (.10 | ) |
| Capital Contributions(d) | | | - | | | | - | | | | - | | | | - | * | | | - | |
| Net asset value, end of year | | | $15.87 | | | | $13.12 | | | | $12.28 | | | | $12.25 | | | | $10.28 | |
| Total Return(a) | | | 24.22% | | | | 9.93% | | | | 3.37% | | | | 24.37% | | | | 27.09% | |
| |
| Ratios/Supplemental Data: | |
| Net assets, end of year (in millions) | | | $1,066.6 | | | | $691.5 | | | | $499.1 | | | | $107.3 | | | | $27.3 | |
| Ratios to average net assets(c): | | | | | | | | | | | | | | | | | | | | |
| Expenses after advisory fee waiver and/or expense reimbursement | | | 1.91% | | | | 1.92% | | | | 1.97% | | | | 2.19% | | | | 2.15% | |
| Expenses before advisory fee waiver and/or expense reimbursement | | | 1.91% | | | | 1.92% | | | | 1.97% | | | | 2.20% | | | | 2.41% | |
| Net investment income | | | 1.87% | | | | 3.33% | | | | 3.08% | | | | 2.85% | | | | 4.13% | |
| Portfolio turnover rate | | | 91% | | | | 72% | | | | 70% | | | | 49% | | | | 63% | |
(a) Total return does not consider the effects of sales load. Total return is calculated assuming a purchase of a share on the first day and a sale on the last day of each year reported and includes reinvestment of dividends and distributions. Total returns may reflect adjustments to conform with generally accepted accounting principles. Total return includes the effect of expense subsidies.
(b) Calculations are based on the average daily number of shares outstanding.
(c) Does not include expenses of the underlying portfolio in which the Fund invests.
(d) The Fund received payments related to a former affiliates and to an unaffiliated-third party’s settlement of regulatory proceedings involving allegations of improper trading in Fund shares during the fiscal year ended October 31, 2010. The fund was not involved in the proceedings or in the calculation of the amount of the settlement.
* Amount is less than $0.005.
See Notes to Financial Statements.
| | | | | | | | | | | | | | | | | | | | | | |
| Class L Shares | |
| | | Period
Ended
August 24, | | | | | Year Ended October 31, | |
| | | 2012(b)(f) | | | | | 2011(b) | | | 2010(b) | | | 2009(b) | | | 2008(b) | |
| Per Share Operating Performance: | | | | | | | | | | | | | | | | | | | | | | |
| Net Asset Value, Beginning Of Period | | | $12.88 | | | | | | $12.82 | | | | $10.77 | | | | $8.55 | | | | $19.38 | |
| Income from investment operations: | | | | | | | | | | | | | | | | | | | | | | |
| Net investment income | | | .44 | | | | | | .51 | | | | .39 | | | | .42 | | | | .57 | |
| Net realized and unrealized gain (loss) on investments | | | .76 | | | | | | - | * | | | 2.22 | | | | 1.91 | | | | (6.54 | ) |
| Total from investment operations | | | 1.20 | | | | | | .51 | | | | 2.61 | | | | 2.33 | | | | (5.97 | ) |
| Less Dividends and Distributions: | | | | | | | | | | | | | | | | | | | | | | |
| Dividends from net investment income | | | (.27 | ) | | | | | (.45 | ) | | | (.56 | ) | | | (.11 | ) | | | (.45 | ) |
| Distributions from net realized gains | | | - | | | | | | - | | | | - | | | | - | | | | (4.41 | ) |
| Total dividends and distributions | | | (.27 | ) | | | | | (.45 | ) | | | (.56 | ) | | | (.11 | ) | | | (4.86 | ) |
| Capital Contributions(g) | | | - | | | | | | - | | | | - | * | | | - | | | | - | |
| Net asset value, end of period | | | $13.81 | | | | | | $12.88 | | | | $12.82 | | | | $10.77 | | | | $8.55 | |
| Total Return(a) | | | 9.51% | | | | | | 3.93% | | | | 24.84% | | | | 27.73% | | | | (39.63)% | |
| |
| Ratios/Supplemental Data: | |
| Net assets, end of period (in millions) | | | $16.7 | | | | | | $16.6 | | | | $17.9 | | | | $17.1 | | | | $17.0 | |
| Ratios to average net assets(c): | | | | | | | | | | | | | | | | | | | | | | |
| Expenses after advisory fee waiver and/or expense reimbursement | | | 1.42% | (d) | | | | | 1.46% | | | | 1.69% | | | | 1.65% | | | | 1.66% | |
| Expenses before advisory fee waiver and/or expense reimbursement | | | 1.42% | (d) | | | | | 1.46% | | | | 1.70% | | | | 1.91% | | | | 1.75% | |
| Net investment income | | | 4.03% | (d) | | | | | 3.79% | | | | 3.31% | | | | 4.69% | | | | 4.45% | |
| Portfolio turnover rate | | | 72% | (e) | | | | | 70% | | | | 49% | | | | 63% | | | | 66% | |
(a) Total return does not consider the effects of sales load. Total return is calculated assuming a purchase of a share on the first day and a sale on the last day of each period reported and includes reinvestment of dividends and distributions. Total returns may reflect adjustments to conform with generally accepted accounting principles. Total return includes the effect of expense subsidies. Total returns for periods less than one full year are not annualized.
(b) Calculations are based on the average daily number of shares outstanding.
(c) Does not include expenses of the underlying portfolio in which the Fund invests.
(d) Annualized.
(e) Not Annualized.
(f) End of operations.
(g) The Fund received payments related to a former affiliates and to an unaffiliated-third party’s settlement of regulatory proceedings involving allegations of improper trading in Fund shares during the fiscal year ended October 31, 2010. The fund was not involved in the proceedings or in the calculation of the amount of the settlement.
* Amount is less than $0.005.
See Notes to Financial Statements.
| | | | |
| Prudential Jennison Equity Income Fund | | | 47 | |
Financial Highlights
continued
| | | | | | | | | | | | | | | | | | | | | | |
| Class M Shares | |
| | | Period
Ended
April 13, | | | | | Year Ended October 31, | |
| | | 2012(b)(f) | | | | | 2011(b) | | | 2010(b) | | | 2009(b) | | | 2008(b) | |
| Per Share Operating Performance: | | | | | | | | | | | | | | | | | | | | | | |
| Net Asset Value, Beginning Of Period | | | $12.30 | | | | | | $12.26 | | | | $10.30 | | | | $8.22 | | | | $18.85 | |
| Income from investment operations: | | | | | | | | | | | | | | | | | | | | | | |
| Net investment income | | | .18 | | | | | | .46 | | | | .31 | | | | .36 | | | | .49 | |
| Net realized and unrealized gain (loss) on investments | | | .70 | | | | | | (.03 | ) | | | 2.13 | | | | 1.82 | | | | (6.31 | ) |
| Total from investment operations | | | .88 | | | | | | .43 | | | | 2.44 | | | | 2.18 | | | | (5.82 | ) |
| Less Dividends and Distributions: | | | | | | | | | | | | | | | | | | | | | | |
| Dividends from net investment income | | | (.14 | ) | | | | | (.39 | ) | | | (.48 | ) | | | (.10 | ) | | | (.40 | ) |
| Distributions from net realized gains | | | - | | | | | | - | | | | - | | | | - | | | | (4.41 | ) |
| Total dividends and distributions | | | (.14 | ) | | | | | (.39 | ) | | | (.48 | ) | | | (.10 | ) | | | (4.81 | ) |
| Capital Contributions(g) | | | - | | | | | | - | | | | - | * | | | - | | | | - | |
| Net asset value, end of period | | | $13.04 | | | | | | $12.30 | | | | $12.26 | | | | $10.30 | | | | $8.22 | |
| Total Return(a) | | | 7.24% | | | | | | 3.45% | | | | 24.22% | | | | 27.03% | | | | (39.89)% | |
| |
| Ratios/Supplemental Data: | | | | | | | | | | | | | | | | | |
| Net assets, end of period (in millions) | | | $.1 | | | | | | $1.3 | | | | $4.8 | | | | $12.1 | | | | $22.3 | |
| Ratios to average net assets(c): | | | | | | | | | | | | | | | | | | | | | | |
| Expenses after advisory fee waiver and/or expense reimbursement | | | 1.91% | (d) | | | | | 1.95% | | | | 2.19% | | | | 2.15% | | | | 2.16% | |
| Expenses before advisory fee waiver and/or expense reimbursement | | | 1.91% | (d) | | | | | 1.95% | | | | 2.20% | | | | 2.41% | | | | 2.25% | |
| Net investment income | | | 2.97% | (d) | | | | | 3.58% | | | | 2.74% | | | | 4.29% | | | | 3.90% | |
| Portfolio turnover rate | | | 72% | (e) | | | | | 70% | | | | 49% | | | | 63% | | | | 66% | |
(a) Total return does not consider the effects of sales load. Total return is calculated assuming a purchase of a share on the first day and a sale on the last day of each period reported and includes reinvestment of dividends and distributions.
Total returns may reflect adjustments to conform with generally accepted accounting principles. Total return includes the effect of expense subsidies. Total returns for periods less than one full year are not annualized.
(b) Calculations are based on the average daily number of shares outstanding.
(c) Does not include expenses of the underlying portfolio in which the Fund invests.
(d) Annualized.
(e) Not Annualized.
(f) End of operations.
(g) The Fund received payments related to a former affiliates and to an unaffiliated-third party’s settlement of regulatory proceedings involving allegations of improper trading in Fund shares during the fiscal year ended October 31, 2010. The fund was not involved in the proceedings or in the calculation of the amount of the settlement.
* Amount is less than $0.005.
See Notes to Financial Statements.
| | | | | | | | | | | | | | |
| Class Q Shares | |
| | | Year Ended
October 31, | | | | | January 18,
2011(d)
through
October 31, | |
| | | 2013(b) | | | 2012(b) | | | | | 2011(b) | |
| Per Share Operating Performance: | | | | | | | | | | | | | | |
| Net Asset Value, Beginning Of Period | | | $13.90 | | | | $12.99 | | | | | | $13.52 | |
| Income from investment operations: | | | | | | | | | | | | | | |
| Net investment income | | | .46 | | | | .62 | | | | | | .29 | |
| Net realized and unrealized gain (loss) on investments | | | 3.01 | | | | .80 | | | | | | (.43 | ) |
| Total from investment operations | | | 3.47 | | | | 1.42 | | | | | | (.14 | ) |
| Less Dividends and Distributions: | | | | | | | | | | | | | | |
| Dividends from net investment income | | | (.52 | ) | | | (.51 | ) | | | | | (.39 | ) |
| Distributions from net realized gains | | | - | �� | | | - | | | | | | - | |
| Total dividends and distributions | | | (.52 | ) | | | (.51 | ) | | | | | (.39 | ) |
| Net asset value, end of period | | | $16.85 | | | | $13.90 | | | | | | $12.99 | |
| Total Return(a) | | | 25.64% | | | | 11.09% | | | | | | (1.06)% | |
| |
| Ratios/Supplemental Data: | | | | | | | | | | | |
| Net assets, end of period (in millions) | | | $2.7 | | | | $2.2 | | | | | | $1.0 | |
| Ratios to average net assets(c): | | | | | | | | | | | | | | |
| Expenses after advisory fee waiver and/or expense reimbursement | | | .81% | | | | .81% | | | | | | .89% | (e) |
| Expenses before advisory fee waiver and/or expense reimbursement | | | .81% | | | | .81% | | | | | | .89% | (e) |
| Net investment income | | | 3.00% | | | | 4.57% | | | | | | 2.99% | (e) |
| Portfolio turnover rate | | | 91% | | | | 72% | | | | | | 70% | (f) |
(a) Total return is calculated assuming a purchase of a share on the first day and a sale on the last day of each period reported and includes reinvestment of dividends and distributions. Total returns may reflect adjustments to conform with generally accepted accounting principles. Total return includes the effect of expense subsidies. Total returns for periods less than one full year are not annualized.
(b) Calculations are based on the average daily number of shares outstanding.
(c) Does not include expenses of the underlying portfolio in which the Fund invests.
(d) Commencement of operations.
(e) Annualized.
(f) Not Annualized.
See Notes to Financial Statements.
| | | | |
| Prudential Jennison Equity Income Fund | | | 49 | |
Financial Highlights
continued
| | | | | | | | | | | | | | |
| Class R Shares | |
| | | Year Ended
October 31, | | | | | January 18,
2011(d)
through
October 31, | |
| | | 2013(b) | | | 2012(b) | | | | | 2011(b) | |
| Per Share Operating Performance: | | | | | | | | | | | | | | |
| Net Asset Value, Beginning Of Period | | | $13.89 | | | | $12.98 | | | | | | $13.52 | |
| Income from investment operations: | | | | | | | | | | | | | | |
| Net investment income | | | .34 | | | | .52 | | | | | | .32 | |
| Net realized and unrealized gain (loss) on investments | | | 3.05 | | | | .81 | | | | | | (.52 | ) |
| Total from investment operations | | | 3.39 | | | | 1.33 | | | | | | (.20 | ) |
| Less Dividends and Distributions: | | | | | | | | | | | | | | |
| Dividends from net investment income | | | (.44 | ) | | | (.42 | ) | | | | | (.34 | ) |
| Distributions from net realized gains | | | - | | | | - | | | | | | - | |
| Total dividends and distributions | | | (.44 | ) | | | (.42 | ) | | | | | (.34 | ) |
| Net asset value, end of period | | | $16.84 | | | | $13.89 | | | | | | $12.98 | |
| Total Return(a) | | | 24.86% | | | | 10.42% | | | | | | (1.50)% | |
| |
| Ratios/Supplemental Data: | | | | | | | | | | | |
| Net assets, end of period (in millions) | | | $22.4 | | | | $8.9 | | | | | | $3.0 | |
| Ratios to average net assets(c)(g): | | | | | | | | | | | | | | |
| Expenses after advisory fee waiver and/or expense reimbursement | | | 1.41% | | | | 1.42% | | | | | | 1.51% | (e) |
| Expenses before advisory fee waiver and/or expense reimbursement | | | 1.66% | | | | 1.67% | | | | | | 1.76% | (e) |
| Net investment income | | | 2.25% | | | | 3.83% | | | | | | 3.09% | (e) |
| Portfolio turnover rate | | | 91% | | | | 72% | | | | | | 70% | (f) |
(a) Total return is calculated assuming a purchase of a share on the first day and a sale on the last day of each period reported and includes reinvestment of dividends and distributions. Total returns may reflect adjustments to conform with generally accepted accounting principles. Total return includes the effect of expense subsidies. Total returns for periods less than one full year are not annualized.
(b) Calculations are based on the average daily number of shares outstanding.
(c) Does not include expenses of the underlying portfolio in which the Fund invests.
(d) Commencement of operations.
(e) Annualized.
(f) Not Annualized.
(g) The distributor of the Fund has contractually agreed to limit its distribution and service (12b-1) fees to .50% of the average daily net assets of the Class R shares.
See Notes to Financial Statements.
| | | | | | | | | | | | | | | | | | | | |
| Class X Shares | |
| | | Year Ended October 31, | |
| | | 2013(b) | | | 2012(b) | | | 2011(b) | | | 2010(b) | | | 2009(b) | |
| Per Share Operating Performance: | | | | | | | | | | | | | | | | | | | | |
| Net Asset Value, Beginning Of Year | | | $13.11 | | | | $12.27 | | | | $12.24 | | | | $10.28 | | | | $8.20 | |
| Income from investment operations: | | | | | | | | | | | | | | | | | | | | |
| Net investment income | | | .33 | | | | .41 | | | | .44 | | | | .31 | | | | .36 | |
| Net realized and unrealized gain (loss) on investments | | | 2.79 | | | | .79 | | | | (.02 | ) | | | 2.13 | | | | 1.82 | |
| Total from investment operations | | | 3.12 | | | | 1.20 | | | | .42 | | | | 2.44 | | | | 2.18 | |
| Less Dividends and Distributions: | | | | | | | | | | | | | | | | | | | | |
| Dividends from net investment income | | | (.37 | ) | | | (.36 | ) | | | (.39 | ) | | | (.48 | ) | | | (.10 | ) |
| Distributions from net realized gains | | | - | | | | - | | | | - | | | | - | | | | - | |
| Total dividends and distributions | | | (.37 | ) | | | (.36 | ) | | | (.39 | ) | | | (.48 | ) | | | (.10 | ) |
| Capital Contributions(d) | | | - | | | | - | | | | - | | | | - | * | | | - | |
| Net asset value, end of year | | | $15.86 | | | | $13.11 | | | | $12.27 | | | | $12.24 | | | | $10.28 | |
| Total Return(a) | | | 24.24% | | | | 9.94% | | | | 3.37% | | | | 24.27% | | | | 27.09% | |
| |
| Ratios/Supplemental Data: | |
| Net assets, end of year (in millions) | | | $.4 | | | | $1.3 | | | | $2.7 | | | | $5.1 | | | | $8.6 | |
| Ratios to average net assets(c): | | | | | | | | | | | | | | | | | | | | |
| Expenses after advisory fee waiver and/or expense reimbursement | | | 1.91% | | | | 1.92% | | | | 1.95% | | | | 2.19% | | | | 2.15% | |
| Expenses before advisory fee waiver and/or expense reimbursement | | | 1.91% | | | | 1.92% | | | | 1.95% | | | | 2.20% | | | | 2.41% | |
| Net investment income | | | 2.16% | | | | 3.20% | | | | 3.42% | | | | 2.74% | | | | 4.24% | |
| Portfolio turnover rate | | | 91% | | | | 72% | | | | 70% | | | | 49% | | | | 63% | |
(a) Total return does not consider the effects of sales load. Total return is calculated assuming a purchase of a share on the first day and a sale on the last day of each year reported and includes reinvestment of dividends and distributions. Total returns may reflect adjustments to conform with generally accepted accounting principles. Total return includes the effect of expense subsidies.
(b) Calculations are based on the average daily number of shares outstanding.
(c) Does not include expenses of the underlying portfolio in which the Fund invests.
(d) The Fund received payments related to a former affiliates and to an unaffiliated-third party’s settlement of regulatory proceedings involving allegations of improper trading in Fund shares during the fiscal year ended October 31, 2010. The fund was not involved in the proceedings or in the calculation of the amount of the settlement.
* Amount is less than $0.005.
See Notes to Financial Statements.
| | | | |
| Prudential Jennison Equity Income Fund | | | 51 | |
Financial Highlights
continued
| | | | | | | | | | | | | | | | | | | | |
| Class Z Shares | | | | | | | | | | | | | | | |
| | | Year Ended October 31, | |
| | | 2013(c) | | | 2012(c) | | | 2011(c) | | | 2010(c) | | | 2009(c) | |
| Per Share Operating Performance: | | | | | | | | | | | | | | | | | | | | |
| Net Asset Value, Beginning Of Year | | | $13.89 | | | | $12.97 | | | | $12.91 | | | | $10.87 | | | | $8.60 | |
| Income from investment operations: | | | | | | | | | | | | | | | | | | | | |
| Net investment income | | | .43 | | | | .59 | | | | .53 | | | | .47 | | | | .27 | |
| Net realized and unrealized gain on investments | | | 3.03 | | | | .82 | | | | .04 | | | | 2.22 | | | | 2.11 | |
| Total from investment operations | | | 3.46 | | | | 1.41 | | | | .57 | | | | 2.69 | | | | 2.38 | |
| Less Dividends and Distributions: | | | | | | | | | | | | | | | | | | | | |
| Dividends from net investment income | | | (.51 | ) | | | (.49 | ) | | | (.51 | ) | | | (.65 | ) | | | (.11 | ) |
| Distributions from net realized gains | | | - | | | | - | | | | - | | | | - | | | | - | |
| Total dividends and distributions | | | (.51 | ) | | | (.49 | ) | | | (.51 | ) | | | (.65 | ) | | | (.11 | ) |
| Capital Contributions(e) | | | - | | | | - | | | | - | | | | - | * | | | - | |
| Net asset value, end of year | | | $16.84 | | | | $13.89 | | | | $12.97 | | | | $12.91 | | | | $10.87 | |
| Total Return(a) | | | 25.47% | | | | 11.06% | | | | 4.42% | | | | 25.45% | | | | 28.27% | |
| |
| Ratios/Supplemental Data: | | | | | | | | | | | | | | | |
| Net assets, end of year (in millions) | | | $1,254.1 | | | | $837.3 | | | | $553.4 | | | | $70.4 | | | | $- | (b) |
| Ratios to average net assets(d): | | | | | | | | | | | | | | | | | | | | |
| Expenses after advisory fee waiver and/or expense reimbursement | | | .91% | | | | .92% | | | | .98% | | | | 1.19% | | | | 1.15% | |
| Expenses before advisory fee waiver and/or expense reimbursement | | | .91% | | | | .92% | | | | .98% | | | | 1.20% | | | | 1.41% | |
| Net investment income | | | 2.87% | | | | 4.33% | | | | 4.00% | | | | 3.90% | | | | 2.44% | |
| Portfolio turnover rate | | | 91% | | | | 72% | | | | 70% | | | | 49% | | | | 63% | |
(a) Total return is calculated assuming a purchase of a share on the first day and a sale on the last day of each year reported and includes reinvestment of dividends and distributions. Total returns may reflect adjustments to conform with generally accepted accounting principles. Total return includes the effect of expense subsidies.
(b) Net assets were $92,360 on October 31, 2009.
(c) Calculations are based on the average daily number of shares outstanding.
(d) Does not include expenses of the underlying portfolio in which the Fund invests.
(e) The Fund received payments related to a former affiliates and to an unaffiliated-third party’s settlement of regulatory proceedings involving allegations of improper trading in Fund shares during the fiscal year ended October 31, 2010. The fund was not involved in the proceedings or in the calculation of the amount of the settlement.
* Amount is less than $0.005.
See Notes to Financial Statements.
Report of Independent Registered Public
Accounting Firm
The Board of Directors and Shareholders
Prudential Investment Portfolios, Inc. 10:
We have audited the accompanying statement of assets and liabilities of Prudential Jennison Equity Income Fund, a series of Prudential Investment Portfolios, Inc. 10, (hereafter referred to as the “Fund”), including the portfolio of investments, as of October 31, 2013, and the related statement of operations for the year then ended, the statements of changes in net assets for each of the years in the two-year period then ended and the financial highlights for each of the years in the five-year period then ended. These financial statements and financial highlights are the responsibility of the Fund’s management. Our responsibility is to express an opinion on these financial statements and financial highlights based on our audits.
We conducted our audits in accordance with the standards of the Public Company Accounting Oversight Board (United States). Those standards require that we plan and perform the audit to obtain reasonable assurance about whether the financial statements and financial highlights are free of material misstatement. An audit includes examining, on a test basis, evidence supporting the amounts and disclosures in the financial statements. Our procedures included confirmation of securities owned as of October 31, 2013, by correspondence with the custodian, transfer agent and brokers or by other appropriate auditing procedures when replies from brokers were not received. An audit also includes assessing the accounting principles used and significant estimates made by management, as well as evaluating the overall financial statement presentation. We believe that our audits provide a reasonable basis for our opinion.
In our opinion, the financial statements and financial highlights referred to above present fairly, in all material respects, the financial position of the Fund as of October 31, 2013, and the results of its operations for the year then ended, the changes in its net assets for each of the years in the two-year period then ended and the financial highlights for each of the years in the five-year period then ended, in conformity with U.S. generally accepted accounting principles.

New York, New York
December 20, 2013
| | | | |
| Prudential Jennison Equity Income Fund | | | 53 | |
Tax Information
(Unaudited)
For the year ended October 31, 2013, the Fund reports the maximum amount allowable under Section 854 of the Internal Revenue Code but not less than the following percentages of the ordinary income dividends paid as 1) qualified dividend income (QDI); and 2) eligible for corporate dividends received deduction (DRD):
| | | | | | | | |
| | | QDI | | | DRD | |
| | |
Prudential Jennison Equity Income Fund | | | 100.00% | | | | 69.04% | |
In January 2014, you will be advised on IRS Form 1099-DIV or substitute 1099-DIV as to the federal tax status of distributions received by you in calendar year 2013.
INFORMATION ABOUT BOARD MEMBERS AND OFFICERS
(Unaudited)
Information about Board Members and Officers of the Fund is set forth below. Board Members who are not deemed to be “interested persons” of the Fund, as defined in the 1940 Act, are referred to as “Independent Board Members.” Board Members who are deemed to be “interested persons” of the Fund are referred to as “Interested Board Members.” The Board Members are responsible for the overall supervision of the operations of the Fund and perform the various duties imposed on the directors of investment companies by the 1940 Act. The Board in turn elects the Officers, who are responsible for administering the day-to-day operations of the Fund.
| | | | |
| Independent Board Members(1) |
Name, Address, Age Position(s) Portfolios Overseen | | Principal Occupation(s) During Past Five Years | | Other Directorships Held |
Ellen S. Alberding (55) Board Member Portfolios Overseen: 64 | | President and Board Member, The Joyce Foundation (charitable foundation) (since 2002); Vice Chair, City Colleges of Chicago (community college system) (since 2011); Trustee, Skills for America’s Future (national initiative to connect employers to community colleges) (since 2011); Trustee, National Park Foundation (charitable foundation for national park system) (since 2009); Trustee, Economic Club of Chicago (since 2009). | | None. |
Kevin J. Bannon (61) Board Member Portfolios Overseen: 64 | | Managing Director (since April 2008) and Chief Investment Officer (since October 2008) of Highmount Capital LLC (registered investment adviser); formerly Executive Vice President and Chief Investment Officer (April 1993-August 2007) of Bank of New York Company; President (May 2003-May 2007) of BNY Hamilton Family of Mutual Funds. | | Director of Urstadt Biddle Properties (since September 2008). |
Linda W. Bynoe (61) Board Member Portfolios Overseen: 64 | | President and Chief Executive Officer (since March 1995) and formerly Chief Operating Officer (December 1989-February 1995) of Telemat Ltd. (management consulting); formerly Vice President (January 1985-June 1989) at Morgan Stanley & Co (broker-dealer). | | Director of Simon Property Group, Inc. (retail real estate) (May 2003-May 2012); Director of Anixter International, Inc. (communication products distributor) (since January 2006); Director of Northern Trust Corporation (financial services) (since April 2006); Trustee of Equity Residential (residential real estate) (since December 2009). |
Prudential Jennison Equity Income Fund
| | | | |
| Independent Board Members(1) |
Name, Address, Age Position(s) Portfolios Overseen | | Principal Occupation(s) During Past Five Years | | Other Directorships Held |
Keith F. Hartstein (57) Board Member Portfolios Overseen: 64 | | Formerly President and Chief Executive Officer (2005-2012), Senior Vice President (2004-2005), Senior Vice President of Sales and Marketing (1997-2004), and various executive management positions (1990-1997), John Hancock Funds, LLC (asset management); Chairman, Investment Company Institute’s Sales Force Marketing Committee (2003-2008). | | None. |
Michael S. Hyland, CFA (68) Board Member Portfolios Overseen: 64 | | Independent Consultant (since February 2005); formerly Senior Managing Director (July 2001-February 2005) of Bear Stearns & Co, Inc.; Global Partner, INVESCO (1999-2001); Managing Director and President of Salomon Brothers Asset Management (1989-1999). | | None. |
Douglas H. McCorkindale (74) Board Member Portfolios Overseen: 64 | | Formerly Chairman (February 2001-June 2006), Chief Executive Officer (June 2000-July 2005), President (September 1997-July 2005) and Vice Chairman (March 1984-May 2000) of Gannett Co. Inc. (publishing and media). | | Director of Lockheed Martin Corp. (aerospace and defense) (since May 2001). |
Stephen P. Munn (71) Board Member Portfolios Overseen: 64 | | Lead Director (since 2007) and formerly Chairman (1993-2007) of Carlisle Companies Incorporated (manufacturer of industrial products). | | Lead Director (since 2007) of Carlisle Companies Incorporated (manufacturer of industrial products). |
James E. Quinn (61) Board Member Portfolios Overseen: 64 | | Formerly President (2003-2012) and Director (2003-2008), and Vice Chairman and Director (1998-2003), Tiffany & Company (jewelry retailing); Director, Mutual of America Capital Management Corporation (asset management) (since 1996); Director, Hofstra University (since 2008); Vice Chairman, Museum of the City of New York (since 1984). | | Director of Deckers Outdoor Corporation (footwear manufacturer) (since 2011). |
Richard A. Redeker (70) Board Member & Independent Chair Portfolios Overseen: 64 | | Retired Mutual Fund Senior Executive (44 years); Management Consultant; Independent Directors Council (organization of 2,800 Independent Mutual Fund Directors)-Executive Committee, Chair of Policy Steering Committee, Governing Council. | | None. |
Visit our website at www.prudentialfunds.com
| | | | |
| Independent Board Members(1) |
Name, Address, Age Position(s) Portfolios Overseen | | Principal Occupation(s) During Past Five Years | | Other Directorships Held |
Robin B. Smith (74) Board Member Portfolios Overseen: 64 | | Chairman of the Board (since January 2003) of Publishers Clearing House (direct marketing); Member of the Board of Directors of ADLPartner (marketing) (since December 2010); formerly Chairman and Chief Executive Officer (August 1996-January 2003) of Publishers Clearing House. | | Formerly Director of BellSouth Corporation (telecommunications) (1992-2006). |
Stephen G. Stoneburn (70) Board Member Portfolios Overseen: 64 | | Chairman, (since July 2011), President and Chief Executive Officer (since June 1996) of Quadrant Media Corp. (publishing company); formerly President (June 1995-June 1996) of Argus Integrated Media, Inc.; Senior Vice President and Managing Director (January 1993-1995) of Cowles Business Media; Senior Vice President of Fairchild Publications, Inc. (1975-1989). | | None. |
| | | | |
| Interested Board Members(1) |
Name, Address, Age Position(s) Portfolios Overseen | | Principal Occupation(s) During Past Five Years | | Other Directorships Held |
Stuart S. Parker (51) Board Member & President Portfolios Overseen: 59 | | President of Prudential Investments LLC (since January 2012); Executive Vice President of Prudential Investment Management Services LLC (since December 2012); Executive Vice President of Jennison Associates LLC and Head of Retail Distribution of Prudential Investments LLC (June 2005 - December 2011). | | None. |
Scott E. Benjamin (40) Board Member & Vice President Portfolios Overseen: 64 | | Executive Vice President (since June 2009) of Prudential Investments LLC; Executive Vice President (June 2009-June 2012) and Vice President (since June 2012) of Prudential Investment Management Services LLC; Executive Vice President (since September 2009) of AST Investment Services, Inc.; Senior Vice President of Product Development and Marketing, Prudential Investments (since February 2006); Vice President of Product Development and Product Management, Prudential Investments (2003-2006). | | None. |
Prudential Jennison Equity Income Fund
| (1) | The year in which each individual joined the Fund’s Board is as follows: |
Ellen S. Alberding, 2013; Linda W. Bynoe, 2005; Douglas H. McCorkindale, 2003, Richard A. Redeker, 2003; Robin B. Smith, 2003; Stephen G. Stoneburn, 2003; Kevin J. Bannon, 2008; Keith F. Hartstein, 2013; Michael S. Hyland, 2008; Stephen P. Munn, 2008; James E. Quinn, 2013; Stuart S. Parker, Board Member and President since 2012; Scott E. Benjamin, Board Member since 2010 and Vice President since 2009.
| | | | |
| Fund Officers(a) |
Name, Address and Age Position with Fund | | Principal Occupation(s) During Past Five Years | | Length of Service as Fund Officer |
Raymond A. O’Hara (58) Chief Legal Officer | | Vice President and Corporate Counsel (since July 2010) of Prudential Insurance Company of America (Prudential); Vice President (March 2011-Present) of Pruco Life Insurance Company and Pruco Life Insurance Company of New Jersey; Vice President and Corporate Counsel (March 2011-Present) of Prudential Annuities Life Assurance Corporation; Chief Legal Officer of Prudential Investments LLC (since June 2012); Chief Legal Officer of Prudential Mutual Fund Services LLC (since June 2012) and Corporate Counsel of AST Investment Services, Inc. (since June 2012); formerly Assistant Vice President and Corporate Counsel (September 2008-July 2010) of The Hartford Financial Services Group, Inc.; formerly Associate (September 1980-December 1987) and Partner (January 1988–August 2008) of Blazzard & Hasenauer, P.C. (formerly, Blazzard, Grodd & Hasenauer, P.C.). | | Since 2012 |
Deborah A. Docs (55) Secretary | | Vice President and Corporate Counsel (since January 2001) of Prudential; Vice President (since December 1996) and Assistant Secretary (since March 1999) of Prudential Investments LLC; formerly Vice President and Assistant Secretary (May 2003-June 2005) of AST Investment Services, Inc. | | Since 2004 |
Jonathan D. Shain (55) Assistant Secretary | | Vice President and Corporate Counsel (since August 1998) of Prudential; Vice President and Assistant Secretary (since May 2001) of Prudential Investments LLC; Vice President and Assistant Secretary (since February 2001) of Prudential Mutual Fund Services LLC; formerly Vice President and Assistant Secretary (May 2003-June 2005) of AST Investment Services, Inc. | | Since 2005 |
Claudia DiGiacomo (39) Assistant Secretary | | Vice President and Corporate Counsel (since January 2005) of Prudential; Vice President and Assistant Secretary of Prudential Investments LLC (since December 2005); Associate at Sidley Austin Brown & Wood LLP (1999-2004). | | Since 2005 |
Andrew R. French (51) Assistant Secretary | | Vice President and Corporate Counsel (since February 2010) of Prudential; formerly Director and Corporate Counsel (2006-2010) of Prudential; Vice President and Assistant Secretary (since January 2007) of Prudential Investments LLC; Vice President and Assistant Secretary (since January 2007) of Prudential Mutual Fund Services LLC. | | Since 2006 |
Visit our website at www.prudentialfunds.com
| | | | |
| Fund Officers(a) |
Name, Address and Age Position with Fund | | Principal Occupation(s) During Past Five Years | | Length of Service as Fund Officer |
Amanda S. Ryan (35) Assistant Secretary | | Director and Corporate Counsel (since March 2012) of Prudential; Director and Assistant Secretary (since June 2012) of Prudential Investments LLC; Associate at Ropes & Gray LLP (2008-2012). | | Since 2012 |
Bruce Karpati (43) Chief Compliance Officer | | Chief Compliance Officer of the Prudential Investments Funds, Target Funds, Advanced Series Trust, the Prudential Series Fund and Prudential’s Gibraltar Fund, Inc. (May 2013 - Present); formerly National Chief (May 2012 - May 2013) and Co-Chief (January 2010 - May 2012) of the Asset Management Unit, Division of Enforcement, of the U.S. Securities and Exchange Commission; Assistant Regional Director (January 2005 - January 2010) of the U.S. Securities and Exchange Commission. | | Since 2013 |
Theresa C. Thompson (51) Deputy Chief Compliance Officer | | Vice President, Compliance, Prudential Investments LLC (since April 2004); and Director, Compliance, Prudential Investments LLC (2001-2004). | | Since 2008 |
Richard W. Kinville (45) Anti-Money Laundering Compliance Officer | | Vice President, Corporate Compliance, Anti-Money Laundering Unit (since January 2005) of Prudential; committee member of the American Council of Life Insurers Anti-Money Laundering and Critical Infrastructure Committee (since January 2007); formerly Investigator and Supervisor in the Special Investigations Unit for the New York Central Mutual Fire Insurance Company (August 1994-January 1999); Investigator in AXA Financial’s Internal Audit Department and Manager in AXA’s Anti-Money Laundering Office (January 1999-January 2005); first chair of the American Council of Life Insurers Anti-Money Laundering and Critical Infrastructure Committee (June 2007-December 2009). | | Since 2011 |
Grace C. Torres (54) Treasurer and Principal Financial and Accounting Officer | | Assistant Treasurer (since March 1999) and Senior Vice President (since September 1999) of Prudential Investments LLC; Assistant Treasurer (since May 2003) and Vice President (since June 2005) of AST Investment Services, Inc.; Senior Vice President and Assistant Treasurer (since May 2003) of Prudential Annuities Advisory Services, Inc.; formerly Senior Vice President (May 2003-June 2005) of AST Investment Services, Inc. | | Since 1998 |
M. Sadiq Peshimam (49) Assistant Treasurer | | Vice President (since 2005) of Prudential Investments LLC. | | Since 2006 |
Peter Parrella (55) Assistant Treasurer | | Vice President (since 2007) and Director (2004-2007) within Prudential Mutual Fund Administration; formerly Tax Manager at SSB Citi Fund Management LLC (1997-2004). | | Since 2007 |
| (a) | Excludes Mr. Parker and Mr. Benjamin, interested Board Members who also serve as President and Vice President, respectively. |
Prudential Jennison Equity Income Fund
Explanatory Notes to Tables:
| • | | Board Members are deemed to be “Interested,” as defined in the 1940 Act, by reason of their affiliation with Prudential Investments LLC and/or an affiliate of Prudential Investments LLC. |
| • | | Unless otherwise noted, the address of all Board Members and Officers is c/o Prudential Investments LLC, Gateway Center Three, 100 Mulberry Street, Newark, New Jersey 07102-4077. |
| • | | There is no set term of office for Board Members or Officers. The Board Members have adopted a retirement policy, which calls for the retirement of Board Members on December 31 of the year in which they reach the age of 75. |
| • | | “Other Directorships Held” includes only directorships of companies required to register or file reports with the SEC under the 1934 Act (that is, “public companies”) or other investment companies registered under the 1940 Act. |
| • | | “Portfolios Overseen” includes all investment companies managed by Prudential Investments LLC. The investment companies for which Prudential Investments LLC serves as manager include the Prudential Investments Mutual Funds, The Prudential Variable Contract Accounts, Target Mutual Funds, Prudential Short Duration High Yield Fund, Inc., Prudential Global Short Duration High Yield Fund, Inc., The Prudential Series Fund, Prudential’s Gibraltar Fund, Inc. and the Advanced Series Trust. |
Visit our website at www.prudentialfunds.com
Approval of Advisory Agreements
The Fund’s Board of Directors
The Board of Directors (the “Board”) of Prudential Jennison Equity Income Fund (the “Fund”)1 consists of ten individuals, eight of whom are not “interested persons” of the Fund, as defined in the Investment Company Act of 1940, as amended (the “1940 Act”) (the “Independent Directors”)2. The Board is responsible for the oversight of the Fund and its operations, and performs the various duties imposed on the directors of investment companies by the 1940 Act. The Independent Directors have retained independent legal counsel to assist them in connection with their duties. The Chair of the Board is an Independent Director. The Board has established three standing committees: the Audit Committee, the Nominating and Governance Committee, and the Investment Committee. Each committee is chaired by, and composed of, Independent Directors.
Annual Approval of the Fund’s Advisory Agreements
As required under the 1940 Act, the Board determines annually whether to renew the Fund’s management agreement with Prudential Investments LLC (“PI”) and the Fund’s subadvisory agreement with Jennison Associates LLC (“Jennison”). In considering the renewal of the agreements, the Board, including all of the Independent Directors, met on June 4-6, 2013 and approved the renewal of the agreements through July 31, 2014, after concluding that the renewal of the agreements was in the best interests of the Fund and its shareholders.
In advance of the meetings, the Board requested and received materials relating to the agreements, and had the opportunity to ask questions and request further information in connection with its consideration. Among other things, the Board considered comparative fee information from PI and Jennison. Also, the Board considered comparisons with other mutual funds in relevant Peer Universes and Peer Groups, as is further discussed below.
In approving the agreements, the Board, including the Independent Directors advised by independent legal counsel, considered the factors it deemed relevant, including the nature, quality and extent of services provided by PI and the subadviser, the performance of the Fund, the profitability of PI and its affiliates, expenses and fees, and the potential for economies of scale that may be shared with the Fund and its shareholders as the Fund’s assets grow. In their deliberations, the Directors did not identify any single factor which alone was responsible for the Board’s decision to approve the agreements with respect to the Fund. In connection with its deliberations, the Board considered information provided by PI throughout the year at regular Board
| 1 | Prudential Jennison Equity Income Fund is a series of Prudential Investment Portfolios, Inc. 10. |
| 2 | Ms. Alberding and Mssrs. Hartstein and Quinn were elected to the Board effective September 1, 2013. |
Prudential Jennison Equity Income Fund
Approval of Advisory Agreements (continued)
meetings, presentations from portfolio managers and other information, as well as information furnished at or in advance of the meetings on June 4-6, 2013.
The Directors determined that the overall arrangements between the Fund and PI, which serves as the Fund’s investment manager pursuant to a management agreement, and between PI and Jennison, which serves as the Fund’s subadviser pursuant to the terms of a subadvisory agreement with PI, are in the best interests of the Fund and its shareholders in light of the services performed, fees charged and such other matters as the Directors considered relevant in the exercise of their business judgment.
The material factors and conclusions that formed the basis for the Directors’ reaching their determinations to approve the continuance of the agreements are separately discussed below.
Nature, Quality and Extent of Services
The Board received and considered information regarding the nature, quality and extent of services provided to the Fund by PI and Jennison. The Board considered the services provided by PI, including but not limited to the oversight of the subadviser for the Fund, as well as the provision of fund recordkeeping, compliance, and other services to the Fund. With respect to PI’s oversight of the subadviser, the Board noted that PI’s Strategic Investment Research Group (“SIRG”), which is a business unit of PI, is responsible for monitoring and reporting to PI’s senior management on the performance and operations of the subadviser. The Board also considered that PI pays the salaries of all of the officers and non-independent Directors of the Fund. The Board also considered the investment subadvisory services provided by Jennison, as well as adherence to the Fund’s investment restrictions and compliance with applicable Fund policies and procedures. The Board considered PI’s evaluation of the subadviser, as well as PI’s recommendation, based on its review of the subadviser, to renew the subadvisory agreement.
The Board considered the qualifications, backgrounds and responsibilities of PI’s senior management responsible for the oversight of the Fund and Jennison, and also considered the qualifications, backgrounds and responsibilities of the Jennison portfolio managers who are responsible for the day-to-day management of the Fund’s portfolio. The Board was provided with information pertaining to PI’s and Jennison’s organizational structure, senior management, investment operations, and other relevant information pertaining to PI and Jennison. The Board also noted that it received favorable compliance reports from the Fund’s Chief Compliance Officer (“CCO”) as to each of PI and Jennison. The Board noted that Jennison is affiliated with PI.
Visit our website at www.prudentialfunds.com
The Board concluded that it was satisfied with the nature, extent and quality of the investment management services provided by PI and the subadvisory services provided to the Fund by Jennison, and that there was a reasonable basis on which to conclude that the Fund benefits from the services provided by PI and Jennison under the management and subadvisory agreements.
Costs of Services and Profits Realized by PI
The Board was provided with information on the profitability of PI and its affiliates in serving as the Fund’s investment manager. The Board discussed with PI the methodology utilized in assembling the information regarding profitability and considered its reasonableness. The Board recognized that it is difficult to make comparisons of profitability from fund management contracts because comparative information is not generally publicly available and is affected by numerous factors, including the structure of the particular adviser, the types of funds it manages, its business mix, numerous assumptions regarding allocations and the adviser’s capital structure and cost of capital. The Board separately considered information regarding the profitability of the subadviser, an affiliate of PI. Taking these factors into account, the Board concluded that the profitability of PI and its affiliates in relation to the services rendered was not unreasonable.
Economies of Scale
The Board noted that the management fee schedule for the Fund includes breakpoints, which have the effect of decreasing the fee rate as assets increase, and that at its current level of assets the Fund’s effective fee rate reflected some of those rate reductions. The Board received and discussed information concerning whether PI realizes economies of scale as the Fund’s assets grow beyond current levels. The Board took note that the Fund’s fee structure currently results in benefits to Fund shareholders whether or not PI realizes any economies of scale. The Board recognized the inherent limitations of any analysis of economies of scale, stemming largely from the Board’s understanding that most of PI’s costs are not specific to individual funds, but rather are incurred across a variety of products and services.
Other Benefits to PI and Jennison
The Board considered potential ancillary benefits that might be received by PI and Jennison and their affiliates as a result of their relationship with the Fund. The Board concluded that potential benefits to be derived by PI included fees received by affiliates of PI for serving as the Fund’s securities lending agent, transfer agency fees received by the Fund’s transfer agent (which is affiliated with PI), and benefits to the reputation as well as other intangible benefits resulting from PI’s association with the Fund. The Board concluded that the potential benefits to be derived by Jennison included its ability to use soft dollar credits, as well as the potential benefits consistent
Prudential Jennison Equity Income Fund
Approval of Advisory Agreements (continued)
with those generally resulting from an increase in assets under management, specifically, potential access to additional research resources and benefits to the reputation. The Board concluded that the benefits derived by PI and Jennison were consistent with the types of benefits generally derived by investment managers and subadvisers to mutual funds.
Performance of the Fund / Fees and Expenses
The Board considered certain additional specific factors and made related conclusions relating to the historical performance of the Fund for the one-, three- and five-year periods ended December 31, 2012.
The Board also considered the Fund’s actual management fee, as well as the Fund’s net total expense ratio, for the fiscal year ended October 31, 2012. The Board considered the management fee for the Fund as compared to the management fee charged by PI to other funds and the fee charged by other advisers to comparable mutual funds in a Peer Group. The actual management fee represents the fee rate actually paid by Fund shareholders and includes any fee waivers or reimbursements. The net total expense ratio for the Fund represents the actual expense ratio incurred by Fund shareholders.
The mutual funds included in the Peer Universe (the Lipper Equity Income Funds Performance Universe) and the Peer Group were objectively determined by Lipper Inc. (“Lipper”), an independent provider of mutual fund data. The comparisons placed the Fund in various quartiles, with the first quartile being the best 25% of the mutual funds (for performance, the best performing mutual funds and, for expenses, the lowest cost mutual funds).
The section below summarizes key factors considered by the Board and the Board’s conclusions regarding the Fund’s performance, fees and overall expenses. The table sets forth gross performance comparisons (which do not reflect the impact on performance of fund expenses, or any subsidies, expense caps or waivers that may be applicable) with the Peer Universe, actual management fees with the Peer Group (which reflect the impact of any subsidies or fee waivers), and net total expenses with the Peer Group, each of which were key factors considered by the Board.
| | | | | | | | |
| Performance | | 1 Year | | 3 Years | | 5 Years | | 10 Years |
| | | 3rd Quartile | | 3rd Quartile | | 1st Quartile | | N/A |
| Actual Management Fees: 4th Quartile |
| Net Total Expenses: 4th Quartile |
Visit our website at www.prudentialfunds.com
| | • | | The Board noted that the Fund outperformed its benchmark index over the one-, three- and five-year periods. |
| | • | | The Board considered that when it reviewed the Fund’s agreements a year earlier, the Fund ranked in the first quartile of its Peer Universe for the three- and five-year periods. |
| | • | | The Board noted information provided by PI indicating that the Fund’s net expenses were only 6 basis points higher than the median of all funds included in the Peer Group. |
| | • | | The Board concluded that, in light of the Fund’s competitive performance against its benchmark index, it would be in the best interests of the Fund and its shareholders to renew the agreements. |
| | • | | The Board concluded that the management fees (including subadvisory fees) and total expenses were reasonable in light of the services provided. |
* * *
After full consideration of these factors, the Board concluded that approval of the agreements was in the best interests of the Fund and its shareholders.
Prudential Jennison Equity Income Fund
| | | | |
| n MAIL | | n TELEPHONE | | n WEBSITE |
Gateway Center Three 100 Mulberry Street Newark, NJ 07102 | | (800) 225-1852 | | www.prudentialfunds.com |
|
| PROXY VOTING |
| The Board of Directors of the Fund has delegated to the Fund’s investment subadviser the responsibility for voting any proxies and maintaining proxy recordkeeping with respect to the Fund. A description of these proxy voting policies and procedures is available without charge, upon request, by calling (800) 225-1852 or by visiting the Securities and Exchange Commission’s website at www.sec.gov. Information regarding how the Fund voted proxies relating to portfolio securities during the most recent 12-month period ended June 30 is available on the Fund’s website and on the Securities and Exchange Commission’s website. |
|
| DIRECTORS |
Ellen S. Alberding • Kevin J. Bannon • Scott E. Benjamin • Linda W. Bynoe •
Keith F. Hartstein • Michael S. Hyland • Douglas H. McCorkindale • Stephen P. Munn •
Stuart S. Parker • James E. Quinn • Richard A. Redeker • Robin B. Smith •
Stephen G. Stoneburn |
|
| OFFICERS |
| Stuart S. Parker, President • Scott E. Benjamin, Vice President • Grace C. Torres, Treasurer and Principal Financial and Accounting Officer • Raymond A. O’Hara, Chief Legal Officer • Deborah A. Docs, Secretary • Bruce Karpati, Chief Compliance Officer • Theresa C. Thompson, Deputy Chief Compliance Officer • Richard W. Kinville, Anti-Money Laundering Compliance Officer • Jonathan D. Shain, Assistant Secretary • Claudia DiGiacomo, Assistant Secretary • Amanda S. Ryan, Assistant Secretary • Andrew R. French, Assistant Secretary • M. Sadiq Peshimam, Assistant Treasurer • Peter Parrella, Assistant Treasurer |
| | | | |
| MANAGER | | Prudential Investments LLC | | Gateway Center Three
100 Mulberry Street
Newark, NJ 07102 |
|
| INVESTMENT SUBADVISER | | Jennison Associates LLC | | 466 Lexington Avenue
New York, NY 10017 |
|
| DISTRIBUTOR | | Prudential Investment
Management Services LLC | | Gateway Center Three
100 Mulberry Street
Newark, NJ 07102 |
|
| CUSTODIAN | | The Bank of New York Mellon | | One Wall Street
New York, NY 10286 |
|
| TRANSFER AGENT | | Prudential Mutual Fund
Services LLC | | PO Box 9658
Providence, RI 02940 |
|
| INDEPENDENT REGISTERED PUBLIC ACCOUNTING FIRM | | KPMG LLP | | 345 Park Avenue
New York, NY 10154 |
|
| FUND COUNSEL | | Willkie Farr & Gallagher LLP | | 787 Seventh Avenue
New York, NY 10019 |
|
| An investor should consider the investment objectives, risks, charges, and expenses of the Fund carefully before investing. The prospectus and summary prospectus contain this and other information about the Fund. An investor may obtain a prospectus and summary prospectus by visiting our website at www.prudentialfunds.com or by calling (800) 225-1852. The prospectus and summary prospectus should be read carefully before investing. |
|
| E-DELIVERY |
| To receive your mutual fund documents online, go to www.prudentialfunds.com/edelivery and enroll. Instead of receiving printed documents by mail, you will receive notification via email when new materials are available. You can cancel your enrollment or change your email address at any time by visiting the website address above. |
|
| SHAREHOLDER COMMUNICATIONS WITH DIRECTORS |
| Shareholders can communicate directly with the Board of Directors by writing to the Chair of the Board, Prudential Jennison Equity Income Fund, Prudential Investments, Attn: Board of Directors, 100 Mulberry Street, Gateway Center Three, Newark, NJ 07102. Shareholders can communicate directly with an individual Director by writing to the same address. Communications are not screened before being delivered to the addressee. |
|
| AVAILABILITY OF PORTFOLIO SCHEDULE |
| The Fund files its complete schedule of portfolio holdings with the Securities and Exchange Commission for the first and third quarters of each fiscal year on Form N-Q. The Fund’s Forms N-Q are available on the Commission’s website at www.sec.gov. The Fund’s Forms N-Q may also be reviewed and copied at the Commission’s Public Reference Room in Washington, D.C. Information on the operation and location of the Public Reference Room may be obtained by calling 1-800-SEC-0330. The Fund’s schedule of portfolio holdings is also available on the Fund’s website as of the end of each month. |
|
| The Fund’s Statement of Additional Information contains additional information about the Fund’s Directors and is available without charge, upon request, by calling (800) 225-1852. |
Mutual Funds:
| | | | |
ARE NOT INSURED BY THE FDIC OR ANY
FEDERAL GOVERNMENT AGENCY | | MAY LOSE VALUE | | ARE NOT A DEPOSIT OF OR GUARANTEED BY ANY BANK OR ANY BANK AFFILIATE |

PRUDENTIAL JENNISON EQUITY INCOME FUND
| | | | | | | | | | | | | | | | |
| | | SHARE CLASS | | A | | B | | C | | Q | | R | | X | | Z |
| | NASDAQ | | SPQAX | | JEIBX | | AGOCX | | PJIQX | | PJERX | | AXGOX | | JDEZX |
| | CUSIP | | 74441L808 | | 74441L881 | | 74441L873 | | 74441L816 | | 74441L790 | | 74441L840 | | 74441L832 |
MF203E 0255300-00001-00

PRUDENTIAL INVESTMENTS»MUTUAL FUNDS
PRUDENTIAL MID-CAP VALUE FUND
ANNUAL REPORT · OCTOBER 31, 2013
Fund Type
Mid-Cap Stock
Objective
Capital growth
This report is not authorized for distribution to prospective investors unless preceded or accompanied by a current prospectus.
The views expressed in this report and information about the Fund’s portfolio holdings are for the period covered by this report and are subject to change thereafter.
Mutual funds are distributed by Prudential Investment Management Services LLC, a Prudential Financial company. Quantitative Management Associates, LLC (QMA) is a wholly owned subsidiary of Prudential Investment Management, Inc. (PIM). QMA and PIM are registered investment advisors and Prudential Financial companies. © 2013 Prudential Financial, Inc., and its related entities. Prudential Investments, Prudential, the Prudential logo, Bring Your Challenges, and the Rock symbol are service marks of Prudential Financial, Inc., and its related entities, registered in many jurisdictions worldwide.

December 16, 2013
Dear Shareholder:
We hope you find the annual report for the Prudential Mid-Cap Value Fund informative and useful. The report covers performance for the 12-month period that ended October 31, 2013.
We recognize that ongoing market volatility may make it a difficult time to be an investor. We continue to believe a prudent response to uncertainty is to maintain a diversified portfolio of funds consistent with your tolerance for risk, time horizon, and financial goals.
Your financial advisor can help you create a diversified investment plan that may include funds covering all the basic asset classes and that reflects your personal investor profile and risk tolerance. Keep in mind, however, that diversification and asset allocation strategies do not assure a profit or protect against loss in declining markets.
Prudential Investments® is dedicated to helping you solve your toughest investment challenges—whether it’s capital growth, reliable income, or protection from market volatility and other risks. We offer the expertise of Prudential Financial’s affiliated asset managers* that strive to be leaders in a broad range of funds to help you stay on course to the future you envision. They also manage money for major corporations and pension funds around the world, which means you benefit from the same expertise, innovation, and attention to risk demanded by today’s most sophisticated investors.
Thank you for choosing the Prudential Investments family of funds.
Sincerely,

Stuart S. Parker, President
Prudential Mid-Cap Value Fund
*Most of Prudential Investments’ equity funds are advised by Jennison Associates LLC, Quantitative Management Associates LLC (QMA), or Prudential Real Estate Investors. Prudential Investments’ fixed income and money market funds are advised by Prudential Investment Management, Inc. (PIM) through its Prudential Fixed Income unit. Jennison Associates, QMA, and PIM are registered investment advisers and Prudential Financial companies. Prudential Real Estate Investors is a unit of PIM.
| | | | |
| Prudential Mid-Cap Value Fund | | | 1 | |
Your Fund’s Performance (Unaudited)
Performance data quoted represent past performance. Past performance does not guarantee future results. The investment return and principal value of an investment will fluctuate, so that an investor’s shares, when redeemed, may be worth more or less than their original cost. Current performance may be lower or higher than the past performance data quoted. An investor may obtain performance data as of the most recent month-end by visiting our website at www.prudentialfunds.com or by calling (800) 225-1852.
| | | | | | | | | | | | | | |
Cumulative Total Returns (Without Sales Charges) as of 10/31/13 |
| | | One Year | | | Five Years | | | Ten Years | | | Since Inception |
Class A | | | 36.32 | % | | | 139.37 | % | | | N/A | | | 124.25% (4/12/04) |
Class B | | | 35.28 | | | | 131.06 | | | | N/A | | | 108.89 (4/12/04) |
Class C | | | 35.24 | | | | 130.60 | | | | 136.30 | % | | — |
Class Q | | | 36.91 | | | | N/A | | | | N/A | | | 47.27 (1/18/11) |
Class X | | | 36.26 | | | | 139.60 | | | | 152.27 | | | — |
Class Z | | | 36.60 | | | | 142.50 | | | | N/A | | | 83.18 (11/28/05) |
Russell Midcap Value Index | | | 33.45 | | | | 137.11 | | | | 174.45 | | | — |
S&P MidCap 400 Stock Index | | | 33.48 | | | | 145.03 | | | | 169.95 | | | — |
Russell Midcap Index | | | 33.79 | | | | 145.38 | | | | 167.70 | | | — |
Lipper Mid-Cap Value Funds Average | | | 34.70 | | | | 132.89 | | | | 145.57 | | | — |
| | | | | | | | | | | | | | |
Average Annual Total Returns (With Sales Charges) as of 9/30/13 |
| | | One Year | | | Five Years | | | Ten Years | | | Since Inception |
Class A | | | 22.79 | % | | | 11.18 | % | | | N/A | | | 7.74% (4/12/04) |
Class B | | | 23.97 | | | | 11.51 | | | | N/A | | | 7.58 (4/12/04) |
Class C | | | 27.98 | | | | 11.62 | | | | 9.29 | % | | — |
Class Q | | | 30.50 | | | | N/A | | | | N/A | | | 13.45 (1/18/11) |
Class X | | | 23.96 | | | | 12.14 | | | | 10.01 | | | — |
Class Z | | | 30.27 | | | | 12.74 | | | | N/A | | | 7.40 (11/28/05) |
Russell Midcap Value Index | | | 27.77 | | | | 11.86 | | | | 10.91 | | | — |
S&P MidCap 400 Stock Index | | | 27.68 | | | | 13.08 | | | | 10.84 | | | — |
Russell Midcap Index | | | 27.91 | | | | 12.97 | | | | 10.78 | | | — |
Lipper Mid-Cap Value Funds Average | | | 29.66 | | | | 11.95 | | | | 9.63 | | | — |
| | |
| 2 | | Visit our website at www.prudentialfunds.com |
| | | | | | | | | | | | | | |
Average Annual Total Returns (With Sales Charges) as of 10/31/13 |
| | | One Year | | | Five Year | | | Ten Years | | | Since Inception |
Class A | | | 28.83 | % | | | 17.73 | % | | | N/A | | | 8.18% (4/12/04) |
Class B | | | 30.28 | | | | 18.13 | | | | N/A | | | 8.01 (4/12/04) |
Class C | | | 34.24 | | | | 18.19 | | | | 8.98 | % | | — |
Class Q | | | 36.91 | | | | N/A | | | | N/A | | | 14.90 (1/18/11) |
Class X | | | 30.26 | | | | 18.80 | | | | 9.69 | | | — |
Class Z | | | 36.60 | | | | 19.38 | | | | N/A | | | 7.94 (11/28/05) |
| | | | | | | | | | | | | | |
Average Annual Total Returns (Without Sales Charges) as of 10/31/13 |
| | | One Year | | | Five Years | | | Ten Years | | | Since Inception |
Class A | | | 36.32 | % | | | 19.07 | % | | | N/A | | | 8.82% (4/12/04) |
Class B | | | 35.28 | | | | 18.23 | | | | N/A | | | 8.01 (4/12/04) |
Class C | | | 35.24 | | | | 18.19 | | | | 8.98 | % | | — |
Class Q | | | 36.91 | | | | N/A | | | | N/A | | | 14.90 (1/18/11) |
Class X | | | 36.26 | | | | 19.10 | | | | 9.69 | | | — |
Class Z | | | 36.60 | | | | 19.38 | | | | N/A | | | 7.94 (11/28/05) |
Growth of a $10,000 Investment
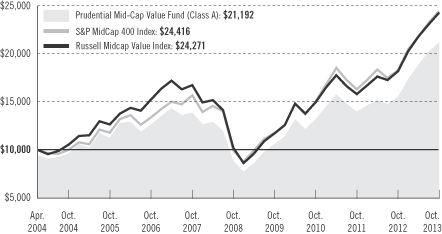
The graph compares a $10,000 investment in the Prudential Mid-Cap Value Fund (Class A shares) with a similar investment in the S&P MidCap 400 Index and Russell Midcap Value Index by portraying the initial account values at the commencement of operations for Class A shares (April 12, 2004) and the account values at the end of the current fiscal year (October 31, 2013) as measured on a quarterly basis. The Russell Midcap Value Index data is measured from the closest month-end to inception date and not from the Fund’s actual inception date. For
| | | | |
| Prudential Mid-Cap Value Fund | | | 3 | |
Your Fund’s Performance (continued)
purposes of the graph, and unless otherwise indicated, it has been assumed that (a) the maximum applicable front-end sales charge was deducted from the initial $10,000 investment in Class A shares; (b) all recurring fees (including management fees) were deducted; and (c) all dividends and distributions were reinvested. The line graph provides information for Class A shares only. As indicated in the tables above, performance for Class B, Class C, Class Q, Class X, and Class Z shares will vary due to the differing charges and expenses applicable to each share class (as indicated in the following paragraphs). Without waiver of fees and/or expense reimbursement, if any, the returns would have been lower.
Although Class X and Class C shares have 10 calendar years of returns, returns for Class A shares are displayed above because Class X shares are closed to new investors and displaying the returns for Class A shares is consistent with the annual reports and prospectuses issued by the other funds in the Prudential Investments fund family.
Past performance does not predict future performance. Total returns and the ending account values in the graph include changes in share price and reinvestment of dividends and capital gains distributions in a hypothetical investment for the periods shown. The Fund’s total returns do not reflect the deduction of income taxes on an individual’s investment. Taxes may reduce your actual investment returns on income or gains paid by the Fund or any gains you may realize if you sell your shares.
Source: Prudential Investments LLC and Lipper Inc.
Inception returns are provided for any share class with less than 10 calendar years of returns.
The average annual total returns take into account applicable sales charges, which are described for each share class in the table below.
| | | | | | | | | | | | |
| | Class A | | Class B | | Class C | | Class Q | | Class X | | Class Z |
Maximum initial sales charge | | 5.50% of
the public
offering
price | | None | | None | | None | | None | | None |
Contingent deferred sales charge (CDSC) (as a percentage of the lower of original purchase price or sale proceeds) | | 1% on sales
of $1 million
or more
made within
12 months of
purchase | | 5% (Yr. 1)
4% (Yr. 2)
3% (Yr. 3)
2% (Yr. 4)
1% (Yr. 5)
1% (Yr. 6)
0% (Yr. 7) | | 1% on sales
made within
12 months
of purchase | | None | | 6% (Yr. 1)
5% (Yr. 2)
4% (Yr. 3)
4% (Yr. 4)
3% (Yr. 5)
2% (Yr. 6)
2% (Yr. 7)
1% (Yr. 8)
0% (Yr. 9)
0% (Yr. 10) | | None |
| | |
| 4 | | Visit our website at www.prudentialfunds.com |
| | | | | | | | | | | | |
| | Class A | | Class B | | Class C | | Class Q | | Class X | | Class Z |
Annual distribution and service (12b-1) fees (shown as a percentage of average daily net assets) | | .30%
(.25%
currently) | | 1% | | 1% | | None | | 1% | | None |
Class X shares are closed to new initial purchases. Class X shares are only available through exchanges from the same class of shares of certain other Prudential Investments funds.
Benchmark Definitions
Russell Midcap Value Index
The Russell Midcap Value Index is an unmanaged index which measures the performance of those Russell Midcap companies with lower price-to-book ratios and lower forecasted growth values. The stocks are also members of the Russell 1000 Value Index. Russell Midcap Value Index Closest Month-End to Inception cumulative total returns as of 10/31/13 are 142.71% for Class A and Class B; 46.93% for Class Q; and 85.27% for Class Z. Russell Midcap Value Index Closest Month-End to Inception average annual total returns as of 9/30/13 are 9.27% for Class A and Class B; 13.61% for Class Q; and 7.58% for Class Z.
Standard & Poor’s MidCap 400 Stock Index
The Standard & Poor’s MidCap 400 Stock Index (S&P MidCap 400 Index) is an unmanaged index of 400 domestic stocks chosen for market capitalization, liquidity, and industry group representation. It gives a broad look at how U.S. mid-cap stock prices have performed. S&P MidCap 400 Index Closest Month-End to Inception cumulative total returns as of 10/31/13 are 144.16% for Class A and Class B; 45.15% for Class Q; and 97.01% for Class Z. S&P MidCap 400 Index Closest Month-End to Inception average annual total returns as of 9/30/13 are 9.43% for Class A and Class B; 13.43% for Class Q; and 8.54% for Class Z.
Russell Midcap Index
The Russell Midcap Index is an unmanaged index which measures the performance of the 800 smallest companies in the Russell 1000 Index, which represent approximately 25% of the total market capitalization of the Russell 1000 Index. Russell Midcap Index Closest Month-End to Inception cumulative total returns as of 10/31/13 are 140.45% for Class A and Class B; 45.54% for Class Q; and 88.61% for Class Z. Russell Midcap Index Closest Month-End to Inception average annual total returns as of 9/30/13 are 9.27% for Class A and Class B; 13.62% for Class Q; and 7.96% for Class Z.
Lipper Mid-Cap Value Funds Average
Funds in the Lipper Mid-Cap Value Funds Average (Lipper Average), by portfolio practice, invest at least 75% of their equity assets in companies with market capitalizations (on a three-year weighted basis) less than 300% of the dollar-weighted median market capitalization of the middle 1,000 securities of the S&P SuperComposite 1500 Index. Mid-cap value funds typically have a below-average price-to-earnings ratio, price-to-book ratio, and three-year sales-per-share growth value compared with the companies in the S&P MidCap 400 Index. Lipper Average Closest Month-End to Inception cumulative total returns as of 10/31/13 are 117.22% for Class A and
| | | | |
| Prudential Mid-Cap Value Fund | | | 5 | |
Your Fund’s Performance (continued)
Class B; 41.15% for Class Q; and 76.30% for Class Z. Lipper Average Closest Month-End to Inception average annual total returns as of 9/30/13 are 7.99% for Class A and Class B; 12.17% for Class Q; and 6.89% for Class Z.
Investors cannot invest directly in an index or average. The returns for the Indexes would be lower if they included the effects of sales charges, operating expenses of a mutual fund, or taxes. Returns for the Lipper Average reflect the deduction of operating expenses, but not sales charges or taxes.
| | | | |
Five Largest Holdings expressed as a percentage of net assets as of 10/31/13 | | | | |
Edison International, Electric Utilites | | | 1.3 | % |
Western Digital Corp., Computers & Peripherals | | | 1.2 | |
Bunge Ltd., Food Products | | | 1.2 | |
Southwest Airlines Co., Airlines | | | 1.2 | |
CA, Inc., Software | | | 1.1 | |
Holdings reflect only long-term investments and are subject to change.
| | |
| 6 | | Visit our website at www.prudentialfunds.com |
Strategy and Performance Overview
How did the Fund perform?
Prudential Mid-Cap Value Fund’s Class A shares gained 36.32% for the 12-month reporting period ended October 31, 2013, outperforming the 33.45% gain of the benchmark Russell Midcap Value® Index (the Index), and outperforming the 34.70% gain of the Lipper Mid-Cap Value Funds Average.
What were conditions like for mid-cap stocks in the U.S. stock market?
Along with the broader equity market, prices of stocks of medium-sized U.S. companies performed well during the period that began November 1, 2012, benefiting from twin headwinds of worldwide monetary accommodation and improving corporate fundamentals, despite moderate gross domestic product (GDP) growth, high unemployment, and middle-of-the-road growth in the jobs market.
| | • | | The U.S. stock market advanced in November and December. Stocks experienced gains, despite a tumultuous 2012 when investors were confronted at home with issues related to the fiscal cliff and the looming sequester. Abroad, the main concerns were the euro-zone sovereign debt crisis and an apparent weakening in China’s economy. |
| | • | | In January, stocks advanced along with the resolution of the U.S. fiscal cliff negotiations and increased confidence that central banks would maintain accommodative monetary policy. In February, the fiscal “sequestration” curtailed government spending. Labor markets improved slightly but unemployment remained elevated. In March, U.S. equity markets were temporarily sidetracked by a banking crisis flare-up in Cyprus, a member of the European Union, although stocks recovered on generally strong corporate earnings. The U.S. equity market closed the quarter with one of its strongest finishes ever. |
| | • | | During the second quarter, stocks peaked in mid-May. The housing industry improved, auto sales were strong, and consumer spending rose. Six-month employment gains averaged over 200,000 jobs per month although unemployment remained elevated. The Federal Reserve (the Fed) announced that it could begin to “taper” its bond-buying stimulus program later in the year on upbeat economic news, sending interest-rate yields on U.S. Treasuries higher, as investors feared that extremely low borrowing rates were coming to an end. After a very volatile June, U.S. equities ended the quarter in record territory. |
| | • | | During the third quarter, U.S. equities rose on corporate earnings strength and an improving economy relative to much of the rest of the world. But in August stocks slumped on continued anxiety that the Fed would begin scaling back its |
| | | | |
| Prudential Mid-Cap Value Fund | | | 7 | |
Strategy and Performance Overview (continued)
| | bond-buying program. Investor confidence recovered around the middle of September after the Federal Open Market Committee (FOMC) announced that more signs of economic improvement, especially in labor markets, were necessary before the Fed would begin to taper. Budget-ceiling debates and a looming shutdown of the Federal government pressured stocks, and equities closed the quarter with modest gains. |
| | • | | Despite the 16-day partial government shutdown in October, there was minimal U.S. stock market turbulence. Stocks posted another solid gain for the month, building on September’s rally. |
| | • | | For the period, mid-cap value stocks outperformed both small-cap and large-cap value stocks as measured by the Russell Midcap Value Index, the Russell 2000 Value®, and the Russell 1000® Indexes, respectively. Mid-cap value stocks trailed mid-cap growth stocks by less than 50 basis points (a basis point is one hundredth of a percent). |
How did the stock market sectors perform?
All sectors within the Index posted double-digit returns. Information technology, healthcare, industrials, consumer discretionary, consumer staples, telecommunication services, and energy achieved the strongest gains. Financials, materials, and utilities also delivered double-digit gains, although their returns fell short of the Index’s performance.
What aspects of sector allocation and stock selection contributed most to the Fund’s return?
| | • | | The primary contributor to the Fund’s outperformance was strong stock selection in several sectors, including financials, consumer discretionary, industrials, and energy. |
| | • | | Within the financials sector, an underweight to stocks in the real estate investment trust (REIT) industry, which performed poorly during the reporting period, boosted Fund results. Because they are highly leveraged, REITs are vulnerable to increases in interest rates. Investors began selling REITS in May and June after the Fed announced that a “tapering” of its bond-buying stimulus program could commence later in the year on the heels of strengthening economic news. The sell-off resumed in August amidst renewed fears of Fed tapering. However, the Fund’s holdings in the hard-hit industry were among the better performers. For example, the Fund held an overweight position in CommonWealth REIT, an owner and operator of suburban office properties that showed steady improvement in operating results and ongoing progress in restructuring its portfolio of properties. |
| | |
| 8 | | Visit our website at www.prudentialfunds.com |
| | • | | Also within the financials sector, the Fund’s above-benchmark exposure to commercial banks, including First Republic Bank and East West Bancorp, combined with an underweight position in M&T Bank, boosted returns. Operating results of both First Republic Bank and East West Bancorp were boosted by better-than-expected loan growth and tight control over operating expenses. |
| | • | | Among consumer discretionary stocks, the Fund held overweight positions in auto component companies, including Delphi Automotive, TRW Automotive, and Lear Corp. These companies reported strong earnings due to recovering volumes in the U.S. and Europe, and subsequently utilized attractive cash flows to support share-buyback programs. The Fund’s holdings in Best Buy and GameStop, two specialty retailers with impressive stock price gains, also contributed to performance. Best Buy’s earnings improved following the successful implementation of a turnaround strategy. GameStop, a video game retailer, was well positioned to take advantage of the new game console cycle underway in the important holiday season market. Relative to the Index, the Fund’s performance benefited from avoiding J.C. Penney, which was plagued by liquidity concerns. |
| | • | | Within the industrials sector, the Fund held an overweight in aerospace and defense stocks and in particular, holdings in Alliant Techsystems helped drive Fund returns. Strong results from Alliant Techsystems’ commercial ammunition business offset weak results in their defense contracting division due to the impact of the government sequester on the Pentagon. |
| | • | | Among energy stocks, overweight positions in Valero Energy and Cimarex Energy made the largest contribution to Fund results. Despite the earnings challenge facing domestic oil refiners, Valero’s stock has benefited from capital restructuring, including the spinoff of some of the company’s midstream assets. Investors bid up the stock price of Cimarex Energy, an independent oil and gas exploration and production company, on the basis of its attractive inventory of liquids-rich drilling locations in the U.S. |
What aspects of sector allocation and stock selection subtracted most from the Fund’s return?
| | • | | The Fund’s overweight to the utilities sector and weak stock selection among telecommunication service companies detracted from performance during an otherwise strong period. |
| | • | | Utilities lagged all other sectors within the Index. Much of the sector’s poor relative performance occurred among electric utilities, a group plagued by the |
| | | | |
| Prudential Mid-Cap Value Fund | | | 9 | |
Strategy and Performance Overview (continued)
| | prospect of rising interest rates, uncertainty with pending rate cases, potential nuclear plant closures, and low power prices. The Fund’s overweight position relative to the Index in Entergy Corp. was the largest detractor after the stock price declined due in part to a failed merger that would have added to earnings. |
| | • | | Within the telecommunications sector, the Fund’s holding in CenturyLink detracted the most from performance. CenturyLink’s stock price dropped after investors questioned whether the company’s dividend cut in February implied the potential for further deterioration in the company’s business. |
| | |
| 10 | | Visit our website at www.prudentialfunds.com |
Fees and Expenses (Unaudited)
As a shareholder of the Fund, you incur two types of costs: (1) transaction costs, including sales charges (loads) on purchase payments and redemptions, as applicable, and (2) ongoing costs, including management fees, distribution and/or service (12b-1) fees, and other Fund expenses, as applicable. This example is intended to help you understand your ongoing costs (in dollars) of investing in the Fund and to compare these costs with the ongoing costs of investing in other mutual funds.
The example is based on an investment of $1,000 invested on May 1, 2013, at the beginning of the period, and held through the six-month period ended October 31, 2013. The example is for illustrative purposes only; you should consult the Prospectus for information on initial and subsequent minimum investment requirements.
Actual Expenses
The first line for each share class in the table on the following page provides information about actual account values and actual expenses. You may use the information on this line, together with the amount you invested, to estimate the expenses that you paid over the period. Simply divide your account value by $1,000 (for example, an $8,600 account value ÷ $1,000 = 8.6), then multiply the result by the number on the first line under the heading “Expenses Paid During the Six-Month Period” to estimate the expenses you paid on your account during this period.
Hypothetical Example for Comparison Purposes
The second line for each share class in the table on the following page provides information about hypothetical account values and hypothetical expenses based on the Fund’s actual expense ratio and an assumed rate of return of 5% per year before expenses, which is not the Fund’s actual return. The hypothetical account values and expenses may not be used to estimate the actual ending account balance or expenses you paid for the period. You may use this information to compare the ongoing costs of investing in the Fund and other funds. To do so, compare this 5% hypothetical example with the 5% hypothetical examples that appear in the shareholder reports of the other funds.
The Fund’s transfer agent may charge additional fees to holders of certain accounts that are not included in the expenses shown in the table on the following page. These fees apply to individual retirement accounts (IRAs) and Section 403(b) accounts. As of the close of the six-month period covered by the table, IRA fees included an annual maintenance fee of $15 per account (subject to a maximum annual maintenance fee of $25 for all accounts held by the same shareholder). Section 403(b) accounts are charged an annual $25 fiduciary maintenance fee. Some of the fees may vary in amount, or may be waived, based on your total account balance or the number of
| | | | |
| Prudential Mid-Cap Value Fund | | | 11 | |
Fees and Expenses (continued)
Prudential Investments funds, including the Fund, that you own. You should consider the additional fees that were charged to your Fund account over the six-month period when you estimate the total ongoing expenses paid over the period and the impact of these fees on your ending account value, as these additional expenses are not reflected in the information provided in the expense table. Additional fees have the effect of reducing investment returns.
Please note that the expenses shown in the table are meant to highlight your ongoing costs only and do not reflect any transactional costs such as sales charges (loads). Therefore, the second line for each share class in the table is useful in comparing ongoing costs only and will not help you determine the relative total costs of owning different funds. In addition, if these transactional costs were included, your costs would have been higher.
| | | | | | | | | | | | | | | | | | |
Prudential
Mid-Cap
Value Fund | | Beginning Account
Value
May 1, 2013 | | | Ending Account
Value
October 31, 2013 | | | Annualized
Expense Ratio
Based on the
Six-Month Period | | | Expenses Paid
During the
Six-Month Period* | |
| | | | | | | | | | | | | | | | | | |
| Class A | | Actual | | $ | 1,000.00 | | | $ | 1,120.80 | | | | 1.26 | % | | $ | 6.74 | |
| | | Hypothetical | | $ | 1,000.00 | | | $ | 1,018.85 | | | | 1.26 | % | | $ | 6.41 | |
| | | | | | | | | | | | | | | | | | |
| Class B | | Actual | | $ | 1,000.00 | | | $ | 1,116.80 | | | | 2.01 | % | | $ | 10.72 | |
| | | Hypothetical | | $ | 1,000.00 | | | $ | 1,015.07 | | | | 2.01 | % | | $ | 10.21 | |
| | | | | | | | | | | | | | | | | | |
| Class C | | Actual | | $ | 1,000.00 | | | $ | 1,116.50 | | | | 2.01 | % | | $ | 10.72 | |
| | | Hypothetical | | $ | 1,000.00 | | | $ | 1,015.07 | | | | 2.01 | % | | $ | 10.21 | |
| | | | | | | | | | | | | | | | | | |
| Class Q | | Actual | | $ | 1,000.00 | | | $ | 1,123.20 | | | | 0.85 | % | | $ | 4.55 | |
| | | Hypothetical | | $ | 1,000.00 | | | $ | 1,020.92 | | | | 0.85 | % | | $ | 4.33 | |
| | | | | | | | | | | | | | | | | | |
| Class X | | Actual | | $ | 1,000.00 | | | $ | 1,120.30 | | | | 1.26 | % | | $ | 6.73 | |
| | | Hypothetical | | $ | 1,000.00 | | | $ | 1,018.85 | | | | 1.26 | % | | $ | 6.41 | |
| | | | | | | | | | | | | | | | | | |
| Class Z | | Actual | | $ | 1,000.00 | | | $ | 1,122.10 | | | | 1.01 | % | | $ | 5.40 | |
| | | Hypothetical | | $ | 1,000.00 | | | $ | 1,020.11 | | | | 1.01 | % | | $ | 5.14 | |
*Fund expenses (net of fee waivers or subsidies, if any) for each share class are equal to the annualized expense ratio for each share class (provided in the table), multiplied by the average account value over the period, multiplied by the 184 days in the six-month period ended October 31, 2013, and divided by 365 days. Expenses presented in the table include the expenses of any underlying Funds in which the Fund may invest.
| | |
| 12 | | Visit our website at www.prudentialfunds.com |
The Fund’s annual expense ratios for the year ended October 31, 2013, are as follows:
| | | | |
Class | | Gross Operating Expenses | | Net Operating Expenses |
A | | 1.57% | | 1.40% |
B | | 2.28 | | 2.15 |
C | | 2.27 | | 2.15 |
Q | | 1.10 | | 0.96 |
X | | 2.29 | | 1.48 |
Z | | 1.26 | | 1.10 |
Net operating expenses shown above reflect any fee waivers and/or expense reimbursements. Additional information on Fund expenses and any fee waivers and/or expense reimbursements can be found in the “Financial Highlights” tables in this report and in the Notes to the Financial Statements in this report.
| | | | |
| Prudential Mid-Cap Value Fund | | | 13 | |
Portfolio of Investments
as of October 31, 2013
| | | | | | |
| Shares | | Description | | Value (Note 2) | |
LONG-TERM INVESTMENTS 99.3% | | | | |
COMMON STOCKS 98.9% | | | | |
| |
Aerospace & Defense 2.6% | | | | |
| 11,600 | | Alliant Techsystems, Inc.(a) | | $ | 1,262,892 | |
| 110,800 | | Exelis, Inc. | | | 1,827,092 | |
| 23,500 | | L-3 Communications Holdings, Inc. | | | 2,360,575 | |
| | | | | | |
| | | | | 5,450,559 | |
| |
Airlines 2.4% | | | | |
| 22,900 | | Alaska Air Group, Inc. | | | 1,618,114 | |
| 40,700 | | Delta Air Lines, Inc. | | | 1,073,666 | |
| 142,400 | | Southwest Airlines Co. | | | 2,452,128 | |
| | | | | | |
| | | | | 5,143,908 | |
| |
Auto Components 2.4% | | | | |
| 13,800 | | Delphi Automotive PLC (United Kingdom) | | | 789,360 | |
| 9,400 | | Goodyear Tire & Rubber Co. (The) | | | 197,212 | |
| 25,100 | | Lear Corp. | | | 1,942,489 | |
| 28,500 | | TRW Automotive Holdings Corp.* | | | 2,140,635 | |
| | | | | | |
| | | | | 5,069,696 | |
| |
Beverages 1.0% | | | | |
| 39,900 | | Molson Coors Brewing Co. (Class B Stock) | | | 2,154,600 | |
| |
Biotechnology 0.4% | | | | |
| 9,000 | | United Therapeutics Corp.*(a) | | | 796,680 | |
| |
Capital Markets 1.3% | | | | |
| 17,700 | | Ameriprise Financial, Inc. | | | 1,779,558 | |
| 23,600 | | Raymond James Financial, Inc. | | | 1,077,340 | |
| | | | | | |
| | | | | 2,856,898 | |
| |
Chemicals 0.8% | | | | |
| 2,900 | | CF Industries Holdings, Inc. | | | 625,240 | |
| 14,200 | | Eastman Chemical Co. | | | 1,118,818 | |
| | | | | | |
| | | | | 1,744,058 | |
| |
Commercial Banks 6.8% | | | | |
| 27,600 | | BankUnited, Inc. | | | 849,252 | |
| 12,400 | | BOK Financial Corp. | | | 759,252 | |
| 10,700 | | Comerica, Inc. | | | 463,310 | |
| 2,200 | | Commerce Bancshares, Inc. | | | 101,222 | |
See Notes to Financial Statements.
| | | | |
| Prudential Mid-Cap Value Fund | | | 15 | |
Portfolio of Investments
as of October 31, 2013 continued
| | | | | | |
| Shares | | Description | | Value (Note 2) | |
COMMON STOCKS (Continued) | | | | |
| |
Commercial Banks (cont’d.) | | | | |
| 33,700 | | East West Bancorp, Inc. | | $ | 1,135,353 | |
| 111,200 | | Fifth Third Bancorp | | | 2,116,136 | |
| 2,400 | | First Citizens BancShares, Inc. (Class A Stock) | | | 508,152 | |
| 49,000 | | First Niagara Financial Group, Inc. | | | 540,470 | |
| 24,700 | | First Republic Bank | | | 1,261,429 | |
| 19,900 | | Fulton Financial Corp. | | | 242,979 | |
| 145,500 | | Huntington Bancshares, Inc. | | | 1,280,400 | |
| 137,100 | | KeyCorp | | | 1,717,863 | |
| 125,500 | | Regions Financial Corp. | | | 1,208,565 | |
| 67,800 | | SunTrust Banks, Inc. | | | 2,280,792 | |
| | | | | | |
| | | | | 14,465,175 | |
| |
Commercial Services & Supplies 0.1% | | | | |
| 5,500 | | Pitney Bowes, Inc. | | | 117,370 | |
| |
Communications Equipment 1.6% | | | | |
| 159,300 | | Brocade Communications Systems, Inc.* | | | 1,277,586 | |
| 33,200 | | Harris Corp. | | | 2,057,072 | |
| | | | | | |
| | | | | 3,334,658 | |
| |
Computers & Peripherals 1.4% | | | | |
| 4,100 | | SanDisk Corp. | | | 284,950 | |
| 37,100 | | Western Digital Corp. | | | 2,583,273 | |
| | | | | | |
| | | | | 2,868,223 | |
| |
Construction & Engineering 1.4% | | | | |
| 25,500 | | AECOM Technology Corp.* | | | 810,390 | |
| 31,100 | | Jacobs Engineering Group, Inc.* | | | 1,891,502 | |
| 4,400 | | URS Corp. | | | 238,568 | |
| | | | | | |
| | | | | 2,940,460 | |
| |
Consumer Finance 0.9% | | | | |
| 73,900 | | SLM Corp. | | | 1,874,843 | |
| |
Containers & Packaging 2.0% | | | | |
| 32,300 | | Ball Corp. | | | 1,579,147 | |
| 32,800 | | Owens-Illinois, Inc.* | | | 1,042,712 | |
| 7,600 | | Rock-Tenn Co. (Class A Stock) | | | 813,276 | |
| 18,000 | | Sonoco Products Co.(a) | | | 731,520 | |
| | | | | | |
| | | | | 4,166,655 | |
See Notes to Financial Statements.
| | | | | | |
| Shares | | Description | | Value (Note 2) | |
COMMON STOCKS (Continued) | | | | |
| |
Diversified Consumer Services 0.1% | | | | |
| 10,000 | | Service Corp. International | | $ | 180,100 | |
| |
Diversified Financial Services 0.8% | | | | |
| 43,100 | | Leucadia National Corp. | | | 1,221,454 | |
| 12,200 | | NASDAQ OMX Group, Inc. (The) | | | 432,246 | |
| | | | | | |
| | | | | 1,653,700 | |
| |
Diversified Telecommunication Services 0.3% | | | | |
| 16,391 | | CenturyLink, Inc. | | | 554,999 | |
| 18,700 | | Frontier Communications Corp.(a) | | | 82,467 | |
| | | | | | |
| | | | | 637,466 | |
| |
Electric Utilities 6.0% | | | | |
| 55,300 | | Edison International | | | 2,711,359 | |
| 18,300 | | Entergy Corp. | | | 1,184,376 | |
| 38,700 | | FirstEnergy Corp. | | | 1,465,569 | |
| 39,700 | | Great Plains Energy, Inc. | | | 930,568 | |
| 46,900 | | NV Energy, Inc. | | | 1,113,406 | |
| 15,700 | | OGE Energy Corp. | | | 579,330 | |
| 22,200 | | Pinnacle West Capital Corp. | | | 1,243,866 | |
| 55,900 | | PPL Corp. | | | 1,712,217 | |
| 1,400 | | Westar Energy, Inc.(a) | | | 44,254 | |
| 58,400 | | Xcel Energy, Inc.(a) | | | 1,685,424 | |
| | | | | | |
| | | | | 12,670,369 | |
| |
Electrical Equipment 0.3% | | | | |
| 23,200 | | Babcock & Wilcox Co. (The) | | | 747,272 | |
| |
Electronic Equipment, Instruments & Components 3.0% | | | | |
| 41,100 | | Arrow Electronics, Inc.* | | | 1,973,622 | |
| 44,900 | | Avnet, Inc. | | | 1,782,530 | |
| 51,300 | | Ingram Micro, Inc. (Class A Stock)* | | | 1,188,621 | |
| 70,300 | | Jabil Circuit, Inc. | | | 1,466,458 | |
| | | | | | |
| | | | | 6,411,231 | |
| |
Energy Equipment & Services 2.3% | | | | |
| 14,500 | | Diamond Offshore Drilling, Inc. | | | 897,985 | |
| 13,500 | | Helmerich & Payne, Inc. | | | 1,046,925 | |
| 55,400 | | Nabors Industries Ltd. | | | 968,392 | |
| 5,100 | | Oil States International, Inc.* | | | 554,013 | |
| 53,000 | | Superior Energy Services, Inc.* | | | 1,421,990 | |
| | | | | | |
| | | | | 4,889,305 | |
See Notes to Financial Statements.
| | | | |
| Prudential Mid-Cap Value Fund | | | 17 | |
Portfolio of Investments
as of October 31, 2013 continued
| | | | | | |
| Shares | | Description | | Value (Note 2) | |
COMMON STOCKS (Continued) | | | | |
| |
Food & Staples Retailing 0.7% | | | | |
| 36,500 | | Kroger Co. (The) | | $ | 1,563,660 | |
| |
Food Products 2.2% | | | | |
| 30,700 | | Bunge Ltd. | | | 2,521,391 | |
| 18,500 | | Ingredion, Inc. | | | 1,216,560 | |
| 36,200 | | Tyson Foods, Inc. (Class A Stock) | | | 1,001,654 | |
| | | | | | |
| | | | | 4,739,605 | |
| |
Gas Utilities 1.8% | | | | |
| 26,500 | | AGL Resources, Inc. | | | 1,268,290 | |
| 29,300 | | Atmos Energy Corp. | | | 1,297,111 | |
| 29,100 | | UGI Corp. | | | 1,203,867 | |
| | | | | | |
| | | | | 3,769,268 | |
| |
Healthcare Equipment & Supplies 0.1% | | | | |
| 2,100 | | Hill-Rom Holdings, Inc. | | | 86,709 | |
| 2,600 | | St. Jude Medical, Inc. | | | 149,214 | |
| | | | | | |
| | | | | 235,923 | |
| |
Healthcare Providers & Services 4.0% | | | | |
| 9,300 | | Aetna, Inc. | | | 583,110 | |
| 12,900 | | Cardinal Health, Inc. | | | 756,714 | |
| 15,800 | | Cigna Corp. | | | 1,216,284 | |
| 51,000 | | HCA Holdings, Inc. | | | 2,404,140 | |
| 8,700 | | Humana, Inc. | | | 801,705 | |
| 15,600 | | LifePoint Hospitals, Inc.* | | | 805,584 | |
| 22,400 | | Universal Health Services, Inc. (Class B Stock) | | | 1,804,544 | |
| | | | | | |
| | | | | 8,372,081 | |
| |
Hotels, Restaurants & Leisure 1.0% | | | | |
| 49,400 | | Royal Caribbean Cruises Ltd. | | | 2,076,776 | |
| |
Household Durables 0.6% | | | | |
| 8,200 | | Whirlpool Corp. | | | 1,197,282 | |
| |
Independent Power Producers & Energy Traders 0.9% | | | | |
| 140,000 | | AES Corp. | | | 1,972,600 | |
See Notes to Financial Statements.
| | | | | | |
| Shares | | Description | | Value (Note 2) | |
COMMON STOCKS (Continued) | | | | |
| |
Insurance 9.0% | | | | |
| 9,500 | | Allied World Assurance Co. Holdings AG | | $ | 1,028,755 | |
| 33,600 | | American Financial Group, Inc. | | | 1,890,336 | |
| 300 | | American National Insurance Co. | | | 30,321 | |
| 26,700 | | Aspen Insurance Holdings Ltd. | | | 1,041,567 | |
| 26,400 | | AXIS Capital Holdings Ltd. | | | 1,251,888 | |
| 2,900 | | CNA Financial Corp. | | | 117,711 | |
| 10,300 | | Everest Re Group Ltd. | | | 1,583,522 | |
| 25,700 | | HCC Insurance Holdings, Inc. | | | 1,173,205 | |
| 26,400 | | Kemper Corp. | | | 977,328 | |
| 19,800 | | Lincoln National Corp. | | | 899,118 | |
| 12,800 | | PartnerRe Ltd. | | | 1,282,688 | |
| 24,200 | | Principal Financial Group, Inc.(a) | | | 1,148,532 | |
| 16,600 | | ProAssurance Corp. | | | 752,312 | |
| 17,800 | | Protective Life Corp. | | | 820,224 | |
| 17,400 | | Reinsurance Group of America, Inc. | | | 1,238,532 | |
| 8,400 | | RenaissanceRe Holdings Ltd. | | | 787,164 | |
| 26,200 | | Unum Group | | | 831,588 | |
| 17,500 | | W.R. Berkley Corp. | | | 768,425 | |
| 43,800 | | XL Group PLC (Ireland) | | | 1,338,966 | |
| | | | | | |
| | | | | 18,962,182 | |
| |
IT Services 4.3% | | | | |
| 53,700 | | Amdocs Ltd. | | | 2,064,765 | |
| 56,600 | | Booz Allen Hamilton Holding Corp. | | | 1,120,680 | |
| 42,200 | | Computer Sciences Corp. | | | 2,078,772 | |
| 58,300 | | CoreLogic, Inc.* | | | 1,939,641 | |
| 19,300 | | DST Systems, Inc. | | | 1,636,061 | |
| 10,600 | | Western Union Co. (The) | | | 180,412 | |
| | | | | | |
| | | | | 9,020,331 | |
| |
Life Sciences Tools & Services 0.5% | | | | |
| 19,200 | | Agilent Technologies, Inc. | | | 974,592 | |
| |
Machinery 3.5% | | | | |
| 30,800 | | AGCO Corp. | | | 1,798,104 | |
| 5,700 | | Dover Corp. | | | 523,203 | |
| 14,300 | | Ingersoll-Rand PLC | | | 965,679 | |
| 36,600 | | Oshkosh Corp.* | | | 1,741,794 | |
| 19,000 | | Trinity Industries, Inc. | | | 961,970 | |
| 9,500 | | Valmont Industries, Inc. | | | 1,334,750 | |
| | | | | | |
| | | | | 7,325,500 | |
See Notes to Financial Statements.
| | | | |
| Prudential Mid-Cap Value Fund | | | 19 | |
Portfolio of Investments
as of October 31, 2013 continued
| | | | | | |
| Shares | | Description | | Value (Note 2) | |
COMMON STOCKS (Continued) | | | | |
| |
Media 0.9% | | | | |
| 48,600 | | Gannett Co., Inc.(a) | | $ | 1,344,762 | |
| 18,300 | | Starz (Class A Stock)* | | | 551,745 | |
| | | | | | |
| | | | | 1,896,507 | |
| |
Metals & Mining 1.3% | | | | |
| 59,500 | | Newmont Mining Corp. | | | 1,621,970 | |
| 14,200 | | Reliance Steel & Aluminum Co. | | | 1,040,718 | |
| | | | | | |
| | | | | 2,662,688 | |
| |
Multi-Line Retail 1.0% | | | | |
| 20,400 | | Kohl’s Corp.(a) | | | 1,158,720 | |
| 19,900 | | Macy’s, Inc. | | | 917,589 | |
| | | | | | |
| | | | | 2,076,309 | |
| |
Multi-Utilities 4.3% | | | | |
| 24,700 | | Alliant Energy Corp. | | | 1,289,834 | |
| 37,700 | | Ameren Corp. | | | 1,363,986 | |
| 17,700 | | CenterPoint Energy, Inc. | | | 435,420 | |
| 5,100 | | CMS Energy Corp. | | | 140,046 | |
| 5,400 | | Consolidated Edison, Inc. | | | 314,388 | |
| 22,900 | | DTE Energy Co. | | | 1,583,306 | |
| 12,800 | | Integrys Energy Group, Inc. | | | 751,104 | |
| 900 | | MDU Resources Group, Inc. | | | 26,802 | |
| 56,700 | | Public Service Enterprise Group, Inc. | | | 1,899,450 | |
| 7,100 | | SCANA Corp. | | | 331,073 | |
| 1,000 | | Sempra Energy | | | 91,140 | |
| 20,900 | | Wisconsin Energy Corp.(a) | | | 880,099 | |
| | | | | | |
| | | | | 9,106,648 | |
| |
Office Electronics 1.1% | | | | |
| 230,500 | | Xerox Corp. | | | 2,291,170 | |
| |
Oil, Gas & Consumable Fuels 6.3% | | | | |
| 12,900 | | Cimarex Energy Co. | | | 1,359,015 | |
| 29,300 | | CVR Energy, Inc. | | | 1,163,796 | |
| 111,300 | | Denbury Resources, Inc.* | | | 2,113,587 | |
| 20,000 | | Energen Corp. | | | 1,566,400 | �� |
| 24,900 | | HollyFrontier Corp. | | | 1,146,894 | |
| 17,400 | | Marathon Petroleum Corp. | | | 1,246,884 | |
| 24,200 | | Murphy Oil Corp. | | | 1,459,744 | |
See Notes to Financial Statements.
| | | | | | |
| Shares | | Description | | Value (Note 2) | |
COMMON STOCKS (Continued) | | | | |
| |
Oil, Gas & Consumable Fuels (cont’d.) | | | | |
| 3,900 | | Noble Energy, Inc. | | $ | 292,227 | |
| 17,000 | | Tesoro Corp. | | | 831,130 | |
| 32,700 | | Whiting Petroleum Corp.* | | | 2,187,303 | |
| | | | | | |
| | | | | 13,366,980 | |
| |
Paper & Forest Products 0.3% | | | | |
| 8,300 | | Domtar Corp. | | | 703,093 | |
| |
Pharmaceuticals 0.6% | | | | |
| 7,632 | | Actavis PLC* | | | 1,179,755 | |
| |
Real Estate Investment Trusts 7.5% | | | | |
| 19,900 | | American Capital Agency Corp. | | | 432,228 | |
| 46,800 | | Annaly Capital Management, Inc.(a) | | | 551,772 | |
| 11,500 | | Boston Properties, Inc. | | | 1,190,250 | |
| 98,200 | | Brandywine Realty Trust | | | 1,397,386 | |
| 78,100 | | CBL & Associates Properties, Inc. | | | 1,547,161 | |
| 40,902 | | Corrections Corp. of America | | | 1,513,374 | |
| 19,900 | | Equity Lifestyle Properties, Inc. | | | 756,001 | |
| 14,600 | | Hatteras Financial Corp. | | | 265,720 | |
| 28,400 | | HCP, Inc. | | | 1,178,600 | |
| 53,500 | | Hospitality Properties Trust | | | 1,571,830 | |
| 54,100 | | Host Hotels & Resorts, Inc. | | | 1,003,555 | |
| 29,100 | | MFA Financial, Inc. | | | 215,631 | |
| 4,900 | | Mid-America Apartment Communities, Inc. | | | 325,360 | |
| 52,200 | | Piedmont Office Realty Trust, Inc. (Class A Stock)(a) | | | 964,656 | |
| 25,800 | | Post Properties, Inc. | | | 1,180,092 | |
| 26,600 | | Ventas, Inc. | | | 1,735,384 | |
| | | | | | |
| | | | | 15,829,000 | |
| |
Road & Rail 1.6% | | | | |
| 8,000 | | AMERCO | | | 1,615,440 | |
| 26,200 | | Ryder System, Inc. | | | 1,724,746 | |
| | | | | | |
| | | | | 3,340,186 | |
| |
Semiconductors & Semiconductor Equipment 0.3% | | | | |
| 60,000 | | Marvell Technology Group Ltd. | | | 720,000 | |
See Notes to Financial Statements.
| | | | |
| Prudential Mid-Cap Value Fund | | | 21 | |
Portfolio of Investments
as of October 31, 2013 continued
| | | | | | |
| Shares | | Description | | Value (Note 2) | |
COMMON STOCKS (Continued) | | | | |
| |
Software 1.8% | | | | |
| 83,800 | | Activision Blizzard, Inc. | | $ | 1,394,432 | |
| 75,700 | | CA, Inc. | | | 2,404,232 | |
| 800 | | Symantec Corp. | | | 18,192 | |
| | | | | | |
| | | | | 3,816,856 | |
| |
Specialty Retail 2.3% | | | | |
| 19,500 | | Ascena Retail Group, Inc.* | | | 385,905 | |
| 35,300 | | Best Buy Co., Inc. | | | 1,510,840 | |
| 23,800 | | Foot Locker, Inc. | | | 825,860 | |
| 32,400 | | Guess?, Inc.(a) | | | 1,012,500 | |
| 5,250 | | Murphy USA, Inc.* | | | 213,045 | |
| 53,600 | | Staples, Inc. | | | 864,032 | |
| | | | | | |
| | | | | 4,812,182 | |
| |
Textiles, Apparel & Luxury Goods 0.3% | | | | |
| 10,400 | | Hanesbrands, Inc. | | | 708,448 | |
| |
Thrifts & Mortgage Finance 0.7% | | | | |
| 34,200 | | New York Community Bancorp, Inc.(a) | | | 554,382 | |
| 44,600 | | Washington Federal, Inc. | | | 1,015,988 | |
| | | | | | |
| | | | | 1,570,370 | |
| |
Trading Companies & Distributors 2.1% | | | | |
| 25,300 | | GATX Corp. | | | 1,304,215 | |
| 59,700 | | MRC Global, Inc.* | | | 1,668,615 | |
| 23,900 | | United Rentals, Inc.*(a) | | | 1,543,701 | |
| | | | | | |
| | | | | 4,516,531 | |
| | | | | | |
| | TOTAL COMMON STOCKS
(cost $173,329,932) | | | 208,979,749 | |
| | | | | | |
| |
EXCHANGE TRADED FUND 0.4% | | | | |
| 15,200 | | iShares Russell Mid-Cap Value ETF
(cost $802,711) | | | 968,240 | |
| | | | | | |
| | TOTAL LONG-TERM INVESTMENTS
(cost $174,132,643) | | | 209,947,989 | |
| | | | | | |
See Notes to Financial Statements.
| | | | | | |
| Shares | | Description | | Value (Note 2) | |
SHORT-TERM INVESTMENT 7.8% | | | | |
AFFILIATED MONEY MARKET MUTUAL FUND | | | | |
| 16,511,620 | | Prudential Investment Portfolios 2 - Prudential Core Taxable Money Market Fund
(cost $16,511,620; includes $12,149,104 of cash collateral for securities on loan) (Note 4)(b)(c) | | $ | 16,511,620 | |
| | | | | | |
| | TOTAL INVESTMENTS 107.1%
(Cost $190,644,263; Note 5) | | | 226,459,609 | |
| | Liabilities in excess of other assets (7.1)% | | | (15,075,258 | ) |
| | | | | | |
| | NET ASSETS 100.0% | | $ | 211,384,351 | |
| | | | | | |
The following abbreviation is used in the Portfolio descriptions:
NASDAQ—National Association for Securities Dealers Automated Quotations.
| * | Non-income producing security. |
| (a) | All or a portion of security is on loan. The aggregate market value of such securities, including those sold and pending settlement, is $11,877,143; cash collateral of $12,149,104 (included with liabilities) was received with which the Portfolio purchased highly liquid short-term investments. |
| (b) | Represents security, or a portion thereof, purchased with cash collateral received for securities on loan. |
| (c) | Prudential Investments LLC, the manager of the Fund also serves as manager of the Prudential Investment Portfolios 2 - Prudential Core Taxable Money Market Fund. |
Various inputs are used in determining the value of the Portfolio’s investments. These inputs are summarized in the three broad levels listed below.
Level 1—quoted prices generally in active markets for identical securities.
Level 2—other significant observable inputs including, but not limited to, quoted prices for similar securities, interest rates and yield curves, prepayment speeds, foreign currency exchange rates, and amortized cost.
Level 3—significant unobservable inputs for securities valued in accordance with Board approved fair valuation procedures.
See Notes to Financial Statements.
| | | | |
| Prudential Mid-Cap Value Fund | | | 23 | |
Portfolio of Investments
as of October 31, 2013 continued
The following is a summary of the inputs used as of October 31, 2013 in valuing such portfolio securities:
| | | | | | | | | | | | |
| | | Level 1 | | | Level 2 | | | Level 3 | |
Investments in Securities | | | | | | | | | | | | |
Common Stocks | | $ | 208,979,749 | | | $ | — | | | $ | — | |
Exchanged Traded Fund | | | 968,240 | | | | — | | | | — | |
Affiliated Money Market Mutual Fund | | | 16,511,620 | | | | — | | | | — | |
| | | | | | | | | | | | |
Total | | $ | 226,459,609 | | | $ | — | | | $ | — | |
| | | | | | | | | | | | |
The industry classification of investments and liabilities in excess of other assets shown as a percentage of net assets as of October 31, 2013 were as follows:
| | | | |
Insurance | | | 9.0 | % |
Affiliated Money Market Mutual Fund
(5.7% represents investments purchased with collateral from securities on loan) | | | 7.8 | |
Real Estate Investment Trusts | | | 7.5 | |
Commercial Banks | | | 6.8 | |
Oil, Gas & Consumable Fuels | | | 6.3 | |
Electric Utilities | | | 6.0 | |
Multi-Utilities | | | 4.3 | |
IT Services | | | 4.3 | |
Healthcare Providers & Services | | | 4.0 | |
Machinery | | | 3.5 | |
Electronic Equipment, Instruments & Components | | | 3.0 | |
Aerospace & Defense | | | 2.6 | |
Airlines | | | 2.4 | |
Auto Components | | | 2.4 | |
Energy Equipment & Services | | | 2.3 | |
Specialty Retail | | | 2.3 | |
Food Products | | | 2.2 | |
Trading Companies & Distributors | | | 2.1 | |
Containers & Packaging | | | 2.0 | |
Software | | | 1.8 | |
Gas Utilities | | | 1.8 | |
Road & Rail | | | 1.6 | |
Communications Equipment | | | 1.6 | |
Construction & Engineering | | | 1.4 | |
Computers & Peripherals | | | 1.4 | |
Capital Markets | | | 1.3 | |
Metals & Mining | | | 1.3 | |
Office Electronics | | | 1.1 | |
Beverages | | | 1.0 | % |
Hotels, Restaurants & Leisure | | | 1.0 | |
Multi-Line Retail | | | 1.0 | |
Independent Power Producers & Energy Traders | | | 0.9 | |
Media | | | 0.9 | |
Consumer Finance | | | 0.9 | |
Chemicals | | | 0.8 | |
Diversified Financial Services | | | 0.8 | |
Thrifts & Mortgage Finance | | | 0.7 | |
Food & Staples Retailing | | | 0.7 | |
Household Durables | | | 0.6 | |
Pharmaceuticals | | | 0.6 | |
Life Sciences Tools & Services | | | 0.5 | |
Exchange Traded Funds | | | 0.4 | |
Biotechnology | | | 0.4 | |
Electrical Equipment | | | 0.3 | |
Semiconductors & Semiconductor Equipment | | | 0.3 | |
Textiles, Apparel & Luxury Goods | | | 0.3 | |
Paper & Forest Products | | | 0.3 | |
Diversified Telecommunication Services | | | 0.3 | |
Healthcare Equipment & Supplies | | | 0.1 | |
Diversified Consumer Services | | | 0.1 | |
Commercial Services & Supplies | | | 0.1 | |
| | | | |
| | | 107.1 | |
Liabilities in excess of other assets | | | (7.1 | ) |
| | | | |
| | | 100.0 | % |
| | | | |
See Notes to Financial Statements.
PRUDENTIAL INVESTMENTS»MUTUAL FUNDS
FINANCIAL STATEMENTS
ANNUAL REPORT · OCTOBER 31, 2013
Mid-Cap Value Fund
Statement of Assets and Liabilities
as of October 31, 2013
| | | | |
Assets | | | | |
Investments at value, including securities on loan of $11,877,143: | | | | |
Unaffiliated investments (cost $174,132,643) | | $ | 209,947,989 | |
Affiliated investments (cost $16,511,620) | | | 16,511,620 | |
Receivable for investments sold | | | 3,873,575 | |
Receivable for Fund shares sold | | | 1,127,368 | |
Dividends and interest receivable | | | 96,674 | |
Prepaid expenses | | | 1,657 | |
| | | | |
Total assets | | | 231,558,883 | |
| | | | |
| |
Liabilities | | | | |
Payable to broker for collateral for securities on loan | | | 12,149,104 | |
Payable for investments purchased | | | 6,941,182 | |
Payable for Fund shares reacquired | | | 767,650 | |
Accrued expenses | | | 137,526 | |
Management fee payable | | | 101,671 | |
Distribution fee payable | | | 59,276 | |
Affiliated transfer agent fee payable | | | 17,635 | |
Deferred directors’ fee | | | 488 | |
| | | | |
Total liabilities | | | 20,174,532 | |
| | | | |
| |
Net Assets | | $ | 211,384,351 | |
| | | | |
| | | | | |
Net assets were comprised of: | | | | |
Common stock, at $.001 par value | | $ | 10,527 | |
Paid-in capital in excess of par | | | 154,696,877 | |
| | | | |
| | | 154,707,404 | |
Undistributed net investment income | | | 759,202 | |
Accumulated net realized gain on investment transactions | | | 20,102,399 | |
Net unrealized appreciation on investments | | | 35,815,346 | |
| | | | |
Net assets, October 31, 2013 | | $ | 211,384,351 | |
| | | | |
See Notes to Financial Statements.
| | | | |
Class A | | | | |
Net asset value and redemption price per share
($120,386,558 ÷ 5,869,446 shares of common stock issued and outstanding) | | $ | 20.51 | |
Maximum sales charge (5.5% of offering price) | | | 1.19 | |
| | | | |
Maximum offering price to public | | $ | 21.70 | |
| | | | |
| |
Class B | | | | |
Net asset value, offering price and redemption price per share
($5,409,015 ÷ 293,024 shares of common stock issued and outstanding) | | $ | 18.46 | |
| | | | |
| |
Class C | | | | |
Net asset value, offering price and redemption price per share
($37,531,794 ÷ 2,039,598 shares of common stock issued and outstanding) | | $ | 18.40 | |
| | | | |
| |
Class Q | | | | |
Net asset value, offering price and redemption price per share
($20,759,202 ÷ 1,003,464 shares of common stock issued and outstanding) | | $ | 20.69 | |
| | | | |
| |
Class X | | | | |
Net asset value, offering price and redemption price per share
($290,543 ÷ 15,444 shares of common stock issued and outstanding) | | $ | 18.81 | |
| | | | |
| |
Class Z | | | | |
Net asset value, offering price and redemption price per share
($27,007,239 ÷ 1,306,003 shares of common stock issued and outstanding) | | $ | 20.68 | |
| | | | |
See Notes to Financial Statements.
| | | | |
| Prudential Mid-Cap Value Fund | | | 27 | |
Statement of Operations
Year Ended October 31, 2013
| | | | |
Net Investment Income | | | | |
Income | | | | |
Unaffiliated dividend income | | $ | 3,877,267 | |
Affiliated income from securities lending, net | | | 63,973 | |
Affiliated dividend income | | | 3,517 | |
Interest income | | | 39 | |
| | | | |
Total income | | | 3,944,796 | |
| | | | |
| |
Expenses | | | | |
Advisory fee | | | 1,336,328 | |
Distribution fee—Class A | | | 235,405 | |
Distribution fee—Class B | | | 33,310 | |
Distribution fee—Class C | | | 306,357 | |
Distribution fee—Class X | | | 1,504 | |
Transfer agent’s fee and expenses (including affiliated expense of $78,800) (Note 3) | | | 275,000 | |
Registration fees | | | 79,000 | |
Custodian’s fees and expenses | | | 70,000 | |
Reports to shareholders | | | 39,000 | |
Audit fee | | | 22,000 | |
Legal fees and expenses | | | 20,000 | |
Directors’ fees | | | 12,000 | |
Insurance | | | 2,000 | |
Miscellaneous | | | 16,405 | |
| | | | |
Total expenses | | | 2,448,309 | |
Expense reimbursement (Note 2) | | | (179,516 | ) |
| | | | |
Net expenses | | | 2,268,793 | |
| | | | |
Net investment income | | | 1,676,003 | |
| | | | |
| |
Realized And Unrealized Gain (Loss) On Investments | | | | |
Net realized gain on investment transactions | | | 20,689,267 | |
Net change in unrealized appreciation on investments | | | 22,408,591 | |
| | | | |
Net gain on investments | | | 43,097,858 | |
| | | | |
Net Increase In Net Assets Resulting From Operations | | $ | 44,773,861 | |
| | | | |
See Notes to Financial Statements.
Statement of Changes in Net Assets
| | | | | | | | |
| | | Year Ended October 31, | |
| | | 2013 | | | 2012 | |
Increase (Decrease) In Net Assets | | | | | | | | |
Operations | | | | | | | | |
Net investment income | | $ | 1,676,003 | | | $ | 1,235,502 | |
Net realized gain on investment transactions | | | 20,689,267 | | | | 5,141,335 | |
Net change in unrealized appreciation on investments | | | 22,408,591 | | | | 6,962,162 | |
| | | | | | | | |
Net increase in net assets resulting from operations | | | 44,773,861 | | | | 13,338,999 | |
| | | | | | | | |
| | |
Dividends (Note 2) | | | | | | | | |
Dividends from net investment income | | | | | | | | |
Class A | | | (1,064,477 | ) | | | (516,098 | ) |
Class B | | | (20,813 | ) | | | (3,638 | ) |
Class C | | | (217,003 | ) | | | (33,512 | ) |
Class L | | | — | | | | (57,080 | ) |
Class M | | | — | | | | (6,926 | ) |
Class Q | | | (103,556 | ) | | | (160,607 | ) |
Class X | | | (13,204 | ) | | | (15,116 | ) |
Class Z | | | (93,311 | ) | | | (52,182 | ) |
| | | | | | | | |
Total dividends | | | (1,512,364 | ) | | | (845,159 | ) |
| | | | | | | | |
| | |
Fund share transactions (Net of share conversions) (Note 5) | | | | | | | | |
Net proceeds from shares sold | | | 72,676,529 | | | | 6,527,418 | |
Net asset value of shares issued in reinvestment of dividends | | | 1,460,123 | | | | 814,146 | |
Cost of shares redeemed | | | (26,351,128 | ) | | | (29,311,244 | ) |
| | | | | | | | |
Net increase (decrease) in net assets from fund share transactions | | | 47,785,524 | | | | (21,969,680 | ) |
| | | | | | | | |
| | |
Capital Contributions | | | | | | | | |
Class X (Note 3) | | | — | | | | 52 | |
| | | | | | | | |
Total increase (decrease) in net assets | | | 91,047,021 | | | | (9,475,788 | ) |
| | |
Net Assets | | | | | | | | |
Beginning of year | | | 120,337,330 | | | | 129,813,118 | |
| | | | | | | | |
End of year(a) | | $ | 211,384,351 | | | $ | 120,337,330 | |
| | | | | | | | |
(a) Includes undistributed net investment income of: | | $ | 759,202 | | | $ | 595,563 | |
| | | | | | | | |
See Notes to Financial Statements.
| | | | |
| Prudential Mid-Cap Value Fund | | | 29 | |
Notes to Financial Statements
1. Organization
Prudential Investment Portfolios, Inc. 10 (the “Company”) is an open-end management investment company, registered under the Investment Company Act of 1940, as amended, (“1940 Act”). The Company was organized on March 5, 1997, as a Maryland Corporation. The Company operates as a series company. At October 30, 2013, the Company consisted of two diversified investment portfolios (each a “Fund” and collectively the “Funds”). The information presented in these financial statements pertains to Prudential Mid-Cap Value Fund (the “Fund”). The investment objective of the Fund is capital growth.
2. Significant Accounting Policies
The following is a summary of significant accounting policies followed by the Fund in the preparation of the financial statements.
Security Valuation: The Fund holds securities and other assets that are fair valued at the close of each day the New York Stock Exchange (“NYSE”) is open for trading. Fair value is the price that would be received to sell an asset or paid to transfer a liability in an orderly transaction between market participants on the measurement date. The Board of Trustees (the “Board”) has adopted Valuation Procedures for security valuation under which fair valuation responsibilities have been delegated to Prudential Investments LLC (“PI” or “Manager”). Under the current Valuation Procedures, the established Valuation Committee is responsible for supervising the valuation of portfolio securities and other assets. The Valuation Procedures permit the Fund to utilize independent pricing vendor services, quotations from market makers, and alternative valuation methods when market quotations are either not readily available or not representative of fair value. A record of the Valuation Committee’s actions is subject to the Board’s review, approval, and ratification at its next regularly-scheduled quarterly meeting.
Various inputs determine how the Fund’s investments are valued, all of which are categorized according to the three broad levels (Level 1, 2, or 3) detailed in the table following the Portfolio of Investments.
Common stocks, exchange-traded funds, and derivative instruments that are traded on a national securities exchange are valued at the last sale price as of the close of
trading on the applicable exchange. Securities traded via NASDAQ are valued at the NASDAQ official closing price. To the extent these securities are valued at the last sale price or NASDAQ official closing price; they are classified as Level 1 in the fair value hierarchy.
In the event that no sale or official closing price on valuation date exists, these securities are generally valued at the mean between the last reported bid and asked prices, or at the last bid price in the absence of an asked price. These securities are classified as Level 2 in the fair value hierarchy, as the inputs are observable and considered to be significant to the valuation.
Common stocks traded on foreign securities exchanges are valued using pricing vendor services that provide model prices derived using adjustment factors based on information such as local closing price, relevant general and sector indices, currency fluctuations, depositary receipts, and futures, as applicable. Securities valued using such model prices are classified as Level 2 in the fair value hierarchy, as the adjustment factors are observable and considered to be significant to the valuation.
Investments in open-end, non-exchange-traded mutual funds are valued at their net asset values as of the close of the NYSE on the date of valuation. These securities are classified as Level 1 in the fair value hierarchy since they may be purchased or sold at their net asset values on the date of valuation.
Fixed income securities traded in the over-the-counter market are generally valued at prices provided by approved independent pricing vendors. The pricing vendors provide these prices after evaluating observable inputs including, but not limited to yield curves, yield spreads, credit ratings, deal terms, tranche level attributes, default rates, cash flows, prepayment speeds, broker/dealer quotations, and reported trades. Securities valued using such vendor prices are classified as Level 2 in the fair value hierarchy.
Over-the-counter derivative instruments are generally valued using pricing vendor services, which derive the valuation based on inputs such as underlying asset prices, indices, spreads, interest rates, and exchange rates. These instruments are categorized as Level 2 in the fair value hierarchy.
Securities and other assets that cannot be priced according to the methods described above are valued based on pricing methodologies approved by the Board of Trustees. In the event that significant unobservable inputs are used when determining such valuations, the securities will be classified as Level 3 in the fair value hierarchy.
| | | | |
| Prudential Mid-Cap Value Fund | | | 31 | |
Notes to Financial Statements
continued
When determining the fair value of securities, some of the factors influencing the valuation include: the nature of any restrictions on disposition of the securities; assessment of the general liquidity of the securities; the issuer’s financial condition and the markets in which it does business; the cost of the investment; the size of the holding and the capitalization of the issuer; the prices of any recent transactions or bids/offers for such securities or any comparable securities; any available analyst media or other reports or information deemed reliable by the investment adviser regarding the issuer or the markets or industry in which it operates. Using fair value to price securities may result in a value that is different from a security’s most recent closing price and from the price used by other mutual funds to calculate their net asset values.
Foreign Currency Translation: Fund securities and other assets and liabilities denominated in foreign currencies are translated each business day into U.S. dollars based on the current rates of exchange. Purchases and sales of Fund securities and income and expenses are translated into U.S. dollars on the respective dates of such transactions. Gains and losses resulting from changes in exchange rates applicable to long-term foreign securities are not reported separately from gains and losses arising from movements in securities prices. Net realized foreign exchange gains and losses include gains and losses from sales and maturities of foreign currency exchange contracts, gains and losses realized between the trade and settlement dates of foreign securities transactions, and the difference between the amount of net investment income accrued on foreign securities and the U.S. dollar amount actually received. Net unrealized foreign exchange gains and losses include gains and losses from changes in the value of assets and liabilities other than Fund securities, resulting from changes in exchange rates.
Securities Lending: The Fund may lend its portfolio securities to banks and broker-dealers. The loans are secured by collateral at least equal to the market value of the securities loaned. Collateral pledged by each borrower is invested in a highly liquid short-term money market fund and is marked to market daily, based on the previous day’s market value, such that the value of the collateral exceeds the value of the loaned securities. Loans are subject to termination at the option of the borrower or the Fund. Upon termination of the loan, the borrower will return to the Fund securities identical to the loaned securities. Should the borrower of the securities fail financially, the Fund has the right to repurchase the securities using the collateral in the open market. The Fund recognizes income, net of any rebate and securities lending agent
fees, for lending its securities, and any interest on the investment of cash received as collateral. The Fund also continues to receive interest and dividends or amounts equivalent thereto, on the securities loaned and recognizes any unrealized gain or loss in the market price of the securities loaned that may occur during the term of the loan.
Securities Transactions and Net Investment Income: Securities transactions are recorded on the trade date. Realized gains or losses from investment and currency transactions are calculated on the identified cost basis. Dividend income is recorded on the ex-dividend date. Interest income, including amortization of premium and accretion of discount on debt securities, as required, is recorded on an accrual basis. Expenses are recorded on an accrual basis, which may require the use of certain estimates by management, that may differ from actual.
Net investment income or loss (other than distribution fees which are charged directly to the respective class) and unrealized and realized gains or losses are allocated daily to each class of shares based upon the relative proportion of adjusted net assets of each class at the beginning of the day.
Dividends and Distributions to Shareholders: Dividends and distributions to shareholders are recorded on the ex-dividend date. Dividends, if any, from net investment income are declared and paid at least annually. These dividends and distributions are determined in accordance with federal income tax regulations and may differ from accounting principles generally accepted in the United States of America.
Net realized gains from investment transactions, if any, are distributed at least annually. Permanent book/tax differences relating to income and gains are reclassified to paid-in capital when they arise.
Taxes: For federal income tax purposes, each Fund in the Company is treated as a separate tax paying entity. It is the Fund’s policy to continue to meet the requirements of the Internal Revenue Code applicable to regulated investment companies and to distribute all of its taxable net income and capital gains, if any, to shareholders. Therefore, no federal tax provision is required.
Withholding taxes on foreign dividends are recorded net of reclaimable amounts, at the time the related income is earned.
Estimates: The preparation of the financial statements requires management to make estimates and assumptions that affect the reported amounts and disclosures in the financial statements. Actual results could differ from those estimates.
| | | | |
| Prudential Mid-Cap Value Fund | | | 33 | |
Notes to Financial Statements
continued
3. Agreements
The Fund has entered into an investment management agreement with PI which provides that the Manager will furnish the Fund with investment advice and investment management and administrative services. The Manager has entered into a subadvisory agreement with Quantitative Management Associates LLC (“QMA”), a wholly-owned subsidiary of Prudential Investment Management, Inc. The subadvisory agreement provides that QMA furnishes investment advisory services in connection with the management of the Fund. PI pays for the services of QMA, the cost of compensation of officers of the Fund, occupancy and certain clerical and bookkeeping costs of the Fund. The Fund bears all other costs and expenses.
The advisory fee paid to PI is computed daily and payable monthly at an annual rate of .90% of the average daily net assets of the Fund up to $500 million, .85% of the next $500 million and .80% of the average daily net assets in excess of $1 billion. The effective management fee rate was .78% for the year ended October 31, 2013.
Certain officers and directors of the Fund are officers or directors of the Manager. The Fund pays no compensation directly to their officers or interested directors.
Prudential Investment Management Services LLC (“PIMS”) and Prudential Annuities Distributors, Inc. (“PAD”), both affiliates of the Manager and an indirect, wholly owned subsidiary of Prudential Financial, Inc. (“Prudential”), serve as the distributors of the Fund. The Company has adopted a separate Distribution and Service plan (each a “Plan” and collectively the “Plans”) for Class A, B, C, and X shares of each Fund in accordance with the requirements of Rule 12b-1 of the 1940 Act. No distribution or service fees are paid to PIMS as distributor for Class Q or Class Z shares.
Under the Plans, the Fund compensates PIMS and PAD distribution and service fees at an annual rate up to .30%, 1.00%, 1.00%, and 1.00% of the average daily net assets of the Class A, B, C, and X shares, respectively. Through February 28, 2015, PIMS has contractually agreed to limit such fees to .25% of the average daily net assets of Class A shares.
Management has received the maximum allowable amount of sales charges for Class M and X in accordance with regulatory limits. As such, any contingent deferred sales charges received by the Manager are contributed back into the Fund and included in the Statement of Changes in Net Assets and Financial Highlights as a contribution to capital.
Effective as of May 16, 2013, PI has agreed to reimburse Fund expenses and/or waive its investment management fee so that the Fund’s annual operating expenses do not exceed 0.98% (exclusive of 12b-1 fees and certain other expenses) of the Fund’s average net assets through February 28, 2015.
During the year ended October 31, 2013, PIMS has advised the Fund, front-end sales charges (“FESC”) and contingent deferred sales charges (“CDSC”) were as follows:
| | | | | | |
Class A
FESC | | Class A
CDSC | | Class B
CDSC | | Class C
CDSC |
| $246,488 | | $18 | | $7,423 | | $1,754 |
4. Other Transactions with Affiliates
Prudential Mutual Fund Services LLC (“PMFS”), an affiliate of PI and an indirect, wholly-owned subsidiary of Prudential, serves as the Fund’s transfer agent. Transfer agent fees and expenses shown in the Statements of Operations include certain out-of pocket expenses paid to non-affiliates, where applicable.
The Fund invests in the Prudential Core Taxable Money Market Fund (the “Core Fund”), a portfolio of Prudential Investment Portfolios 2, registered under the 1940 Act, and managed by PI. Earnings from the Core Fund are disclosed on the Statement of Operations as affiliated dividend income.
Prudential Investment Management, Inc. (“PIM”), an indirect, wholly-owned subsidiary of Prudential, served as the Fund’s securities lending agent. For the year ended October 31, 2013, PIM has been compensated approximately $19,040 for these services.
5. Shares of Capital Stock
The Fund offers Class A, Class B, Class C, Class Q, Class X and Class Z shares. Class A shares are sold with a front-end sales charge of up to 5.50%. Purchases of $1 million or more are subject to a contingent deferred sales charge (“CDSC”) if shares are redeemed within 12 months of their purchase. Class B shares are sold with a CDSC which declines from 5% to zero depending upon the period of time the shares are held. Class B shares will automatically convert to Class A shares approximately seven years after purchase. Class C shares are sold with a CDSC of 1% on shares redeemed within the first 12 months of purchase. The last conversion of Class M and Class L shares to Class A shares was completed as of April 13, 2012 and August 24, 2012,
| | | | |
| Prudential Mid-Cap Value Fund | | | 35 | |
Notes to Financial Statements
continued
respectively. There are no Class M and Class L shares outstanding and Class M and Class L shares are no longer being offered for sale. Class X shares are closed to new purchases. Class X shares will automatically convert to Class A shares approximately ten years after purchase. Class Q and Class Z shares are not subject to any sales or redemption charge and are offered exclusively for sale to a limited group of investors.
Under certain circumstances, an exchange may be made from specified share classes of the Fund to one or more other share classes of the Fund as presented in the table of transactions in shares of beneficial interest.
The authorized capital stock of the Company is 5.5 billion shares, with a par value of $.001 per share. Of the Company’s authorized capital stock, 175 million authorized shares have been allocated to the Fund and divided into seven classes, designated Class A, Class B, Class C, Class M, Class Q, Class X and Class Z capital stock, each of which consists of 52 million, 10 million, 30 million, 2 million, 40 million, 1 million and 40 million authorized shares, respectively.
Transactions in shares of capital stock, during the year ended October 31, 2013, were as follows:
| | | | | | | | |
Class A | | Shares | | | Amount | |
Year ended October 31, 2013: | | | | | | | | |
Shares sold | | | 1,557,559 | | | $ | 29,373,540 | |
Shares issued in reinvestment of dividends and distributions | | | 66,535 | | | | 1,028,123 | |
Shares reacquired | | | (1,000,984 | ) | | | (17,650,681 | ) |
| | | | | | | | |
Net increase (decrease) in shares outstanding before conversion | | | 623,110 | | | | 12,750,982 | |
Shares issued upon conversion from Class B, Class X and Class Z | | | 78,173 | | | | 1,388,735 | |
Shares reacquired upon conversion into Class Z | | | (19,274 | ) | | | (322,973 | ) |
| | | | | | | | |
Net increase (decrease) in shares outstanding | | | 682,009 | | | $ | 13,816,744 | |
| | | | | | | | |
Year ended October 31, 2012: | | | | | | | | |
Shares sold | | | 209,967 | | | $ | 3,047,766 | |
Shares issued in reinvestment of dividends and distributions | | | 37,694 | | | | 494,924 | |
Shares reacquired | | | (878,327 | ) | | | (12,751,665 | ) |
| | | | | | | | |
Net increase (decrease) in shares outstanding before conversion | | | (630,666 | ) | | | (9,208,975 | ) |
Shares issued upon conversion from Class B, Class L, Class M and Class X | | | 897,838 | | | | 13,340,802 | |
Shares reacquired upon conversion into Class Z | | | (2,187 | ) | | | (31,182 | ) |
| | | | | | | | |
Net increase (decrease) in shares outstanding | | | 264,985 | | | $ | 4,100,645 | |
| | | | | | | | |
| | | | | | | | |
Class B | | Shares | | | Amount | |
Year ended October 31, 2013: | | | | | | | | |
Shares sold | | | 181,530 | | | $ | 3,104,412 | |
Shares issued in reinvestment of dividends and distributions | | | 1,318 | | | | 18,441 | |
Shares reacquired | | | (32,715 | ) | | | (534,735 | ) |
| | | | | | | | |
Net increase (decrease) in shares outstanding before conversion | | | 150,133 | | | | 2,588,118 | |
Shares reacquired upon conversion into Class A | | | (37,049 | ) | | | (601,073 | ) |
| | | | | | | | |
Net increase (decrease) in shares outstanding | | | 113,084 | | | $ | 1,987,045 | |
| | | | | | | | |
Year ended October 31, 2012: | | | | | | | | |
Shares sold | | | 39,324 | | | $ | 514,195 | |
Shares issued in reinvestment of dividends and distributions | | | 279 | | | | 3,323 | |
Shares reacquired | | | (33,778 | ) | | | (440,207 | ) |
| | | | | | | | |
Net increase (decrease) in shares outstanding before conversion | | | 5,825 | | | | 77,311 | |
Shares reacquired upon conversion into Class A | | | (63,230 | ) | | | (830,881 | ) |
| | | | | | | | |
Net increase (decrease) in shares outstanding | | | (57,405 | ) | | $ | (753,570 | ) |
| | | | | | | | |
Class C | | | | | | |
Year ended October 31, 2013: | | | | | | | | |
Shares sold | | | 406,193 | | | $ | 6,892,724 | |
Shares issued in reinvestment of dividends and distributions | | | 14,905 | | | | 207,893 | |
Shares reacquired | | | (262,382 | ) | | | (4,185,833 | ) |
| | | | | | | | |
Net increase (decrease) in shares outstanding before conversion | | | 158,716 | | | | 2,914,784 | |
Shares reacquired upon conversion into Class Z | | | (12,752 | ) | | | (196,712 | ) |
| | | | | | | | |
Net increase (decrease) in shares outstanding | | | 145,964 | | | $ | 2,718,072 | |
| | | | | | | | |
Year ended October 31, 2012: | | | | | | | | |
Shares sold | | | 61,639 | | | $ | 810,376 | |
Shares issued in reinvestment of dividends and distributions | | | 2,646 | | | | 31,466 | |
Shares reacquired | | | (363,982 | ) | | | (4,785,266 | ) |
| | | | | | | | |
Net increase (decrease) in shares outstanding before conversion | | | (299,697 | ) | | | (3,943,424 | ) |
Shares reacquired upon conversion into Class Z | | | (737 | ) | | | (10,090 | ) |
| | | | | | | | |
Net increase (decrease) in shares outstanding | | | (300,434 | ) | | $ | (3,953,514 | ) |
| | | | | | | | |
Class L | | | | | | |
Period ended August 24, 2012*: | | | | | | | | |
Shares sold | | | 1,754 | | | $ | 24,745 | |
Shares issued in reinvestment of dividends and distributions | | | 4,053 | | | | 52,366 | |
Shares reacquired | | | (86,600 | ) | | | (1,223,833 | ) |
| | | | | | | | |
Net increase (decrease) in shares outstanding before conversion | | | (80,793 | ) | | | (1,146,722 | ) |
Shares reacquired upon conversion into Class A | | | (721,647 | ) | | | (10,611,751 | ) |
| | | | | | | | |
Net increase (decrease) in shares outstanding | | | (802,440 | ) | | $ | (11,758,473 | ) |
| | | | | | | | |
| | | | |
| Prudential Mid-Cap Value Fund | | | 37 | |
Notes to Financial Statements
continued
| | | | | | | | |
Class M | | Shares | | | Amount | |
Period ended April 13, 2012*: | | | | | | | | |
Shares sold | | | — | | | $ | — | |
Shares issued in reinvestment of dividends and distributions | | | 526 | | | | 6,299 | |
Shares reacquired | | | (2,614 | ) | | | (33,062 | ) |
| | | | | | | | |
Net increase (decrease) in shares outstanding before conversion | | | (2,088 | ) | | | (26,763 | ) |
Shares reacquired upon conversion into Class A | | | (76,743 | ) | | | (1,000,953 | ) |
| | | | | | | | |
Net increase (decrease) in shares outstanding | | | (78,831 | ) | | $ | (1,027,716 | ) |
| | | | | | | | |
Class Q | | | | | | |
Year ended October 31, 2013: | | | | | | | | |
Shares sold | | | 705,264 | | | $ | 13,987,357 | |
Shares issued in reinvestment of dividends and distributions | | | 6,669 | | | | 103,556 | |
Shares reacquired | | | (78,842 | ) | | | (1,397,487 | ) |
| | | | | | | | |
Net increase (decrease) in shares outstanding | | | 633,091 | | | $ | 12,693,426 | |
| | | | | | | | |
Year ended October 31, 2012: | | | | | | | | |
Shares sold | | | 5,663 | | | $ | 80,130 | |
Shares issued in reinvestment of dividends and distributions | | | 12,176 | | | | 160,607 | |
Shares reacquired | | | (555,054 | ) | | | (8,248,440 | ) |
| | | | | | | | |
Net increase (decrease) in shares outstanding | | | (537,215 | ) | | $ | (8,007,703 | ) |
| | | | | | | | |
Class X | | | | | | |
Year ended October 31, 2013: | | | | | | | | |
Shares sold | | | 917 | | | $ | 14,023 | |
Shares issued in reinvestment of dividends and distributions | | | 926 | | | | 13,124 | |
Shares reacquired | | | (6,662 | ) | | | (104,737 | ) |
| | | | | | | | |
Net increase (decrease) in shares outstanding before conversion | | | (4,819 | ) | | | (77,590 | ) |
Shares reacquired upon conversion into Class A | | | (48,390 | ) | | | (781,133 | ) |
| | | | | | | | |
Net increase (decrease) in shares outstanding | | | (53,209 | ) | | $ | (858,723 | ) |
| | | | | | | | |
Year ended October 31, 2012: | | | | | | | | |
Shares sold | | | 1,391 | | | $ | 18,499 | |
Shares issued in reinvestment of dividends and distributions | | | 1,251 | | | | 15,092 | |
Shares reacquired | | | (14,866 | ) | | | (197,208 | ) |
| | | | | | | | |
Net increase (decrease) in shares outstanding before conversion | | | (12,224 | ) | | | (163,617 | ) |
Shares reacquired upon conversion into Class A | | | (67,164 | ) | | | (897,217 | ) |
| | | | | | | | |
Net increase (decrease) in shares outstanding | | | (79,388 | ) | | $ | (1,060,834 | ) |
| | | | | | | | |
| | | | | | | | |
Class Z | | Shares | | | Amount | |
Year ended October 31, 2013: | | | | | | | | |
Shares sold | | | 1,009,334 | | | $ | 19,304,473 | |
Shares issued in reinvestment of dividends and distributions | | | 5,721 | | | | 88,986 | |
Shares reacquired | | | (135,526 | ) | | | (2,477,655 | ) |
| | | | | | | | |
Net increase (decrease) in shares outstanding before conversion | | | 879,529 | | | | 16,915,804 | |
Shares issued upon conversion from Class A and Class C | | | 30,559 | | | | 519,685 | |
Shares reacquired upon conversion into Class A | | | (327 | ) | | | (6,529 | ) |
| | | | | | | | |
Net increase (decrease) in shares outstanding | | | 909,761 | | | $ | 17,428,960 | |
| | | | | | | | |
Year ended October 31, 2012: | | | | | | | | |
Shares sold | | | 139,251 | | | $ | 2,031,707 | |
Shares issued in reinvestment of dividends and distributions | | | 3,793 | | | | 50,069 | |
Shares reacquired | | | (111,388 | ) | | | (1,631,563 | ) |
| | | | | | | | |
Net increase (decrease) in shares outstanding before conversion | | | 31,656 | | | | 450,213 | |
Shares issued upon conversion from Class A and Class C | | | 2,828 | | | | 41,272 | |
| | | | | | | | |
Net increase (decrease) in shares outstanding | | | 34,484 | | | $ | 491,485 | |
| | | | | | | | |
| * | As of April 13, 2012, the last conversion of Class M shares to Class A shares was completed. There are no Class M shares outstanding and Class M shares are no longer being offered for sale. As of August 24, 2012, the last conversion of Class L shares to Class A shares was completed. There are no Class L shares outstanding and Class L shares are no longer being offered for sale. |
6. Tax Information
Distributions to shareholders, which are determined in accordance with federal income tax regulations, which may differ from generally accepted accounting principles, are recorded on the ex-dividend date.
For the years ended October 31, 2013 and October 31, 2012, the tax character of dividends paid by the Fund were $1,512,364 and $845,159 of ordinary income, respectively.
As of October 31, 2013, the accumulated undistributed earnings on a tax basis was $5,044,151 of ordinary income and $16,009,882 of long-term capital gains. This differs from the amount shown on the Statement of Assets and Liabilities primarily due to cumulative timing differences between financial and tax reporting.
The United States federal income tax basis of the Fund’s investments and the net unrealized appreciation as of October 31, 2013 were as follows:
| | | | | | |
Tax Basis | | Appreciation | | Depreciation | | Net
Unrealized
Appreciation |
| $190,836,207 | | $36,782,761 | | $(1,159,359) | | $35,623,402 |
| | | | |
| Prudential Mid-Cap Value Fund | | | 39 | |
Notes to Financial Statements
continued
The difference between book basis and tax basis was primarily attributable to deferred losses on wash sales.
The Fund utilized approximately $436,000 of its capital loss carryforward to offset net taxable gains realized in the fiscal year ended October 31, 2013.
Management has analyzed the Fund’s tax positions taken on federal income tax returns for all open tax years and has concluded that no provision for income tax is required in the Fund’s financial statements for the current reporting period. The Fund’s federal and state income and federal excise tax returns for tax years for which the applicable statutes of limitations have not expired are subject to examination by the Internal Revenue Service and state departments of revenue.
7. Portfolio Securities
Purchases and sales of securities, other than U.S. government securities and short term obligations, during the year ended October 31, 2013, were $169,870,678 and $122,783,650, respectively.
8. Borrowings
The Fund, along with other affiliated registered investment companies (the “Funds”), is a party to a Syndicated Credit Agreement (“SCA”) with a group of banks. The purpose of the SCA is to provide an alternative source of temporary funding for capital share redemptions. The SCA provides for a commitment of $900 million for the period November 15, 2012 through November 4, 2013. The Funds pay an annualized commitment fee of .08% of the unused portion of the SCA. Prior to November 15, 2012, the Funds had another Syndicated Credit Agreement with substantially similar terms. Interest on any borrowings under the SCA is paid at contracted market rates. The commitment fee for the unused amount is accrued daily and paid quarterly.
Subsequent to the fiscal year end, the SCA has been renewed effective November 5, 2013 at substantially similar terms through November 4, 2014.
The Fund did not borrow any amounts pursuant to the SCA during the year ended October 31, 2013.
Note 9. New Accounting Pronouncement
In January 2013, the Financial Accounting Standards Board (“FASB”) issued Accounting Standards Update (“ASU”) No. 2013-01 “Clarifying the Scope of Disclosures about Offsetting Assets and Liabilities” which replaced ASU No. 2011-11 “Disclosures about Offsetting Assets and Liabilities”. The updates create new disclosure requirements requiring entities to disclose both gross and net information for derivatives and other financial instruments that are either offset in the Statement of Assets and Liabilities or subject to an enforceable master netting arrangement or similar agreement. The disclosure requirements are effective for annual reporting periods beginning on or after January 1, 2013 and interim periods within those annual periods. Management is currently evaluating the application of ASU No. 2013-01 and its impact, if any, on the Fund’s financial statements.
Note 10. Dividends and Distributions to Shareholders
Subsequent to the fiscal year end, the Fund declared ordinary income dividends and capital gains distributions on December 6, 2013 to shareholders of record on December 9, 2013. The ex-dividend date was December 10, 2013. The per share amounts declared were as follows:
| | | | | | |
| | | Ordinary
Income | | Short-Term
Capital Gains | | Long-Term
Capital Gains |
| Class A | | $0.15422 | | $0.3966 | | $1.4807 |
| Class B | | $0.03514 | | $0.3966 | | $1.4807 |
| Class C | | $0.03514 | | $0.3966 | | $1.4807 |
| Class Q | | $0.23436 | | $0.3966 | | $1.4807 |
| Class X | | $0.15422 | | $0.3966 | | $1.4807 |
| Class Z | | $0.20292 | | $0.3966 | | $1.4807 |
| | | | |
| Prudential Mid-Cap Value Fund | | | 41 | |
Financial Highlights
| | | | | | | | | | | | | | | | | | | | |
| Class A Shares | |
| | | Year Ended October 31, | |
| | | 2013 | | | 2012 | | | 2011 | | | 2010 | | | 2009 | |
| Per Share Operating Performance(b): | | | | | | | | | | | | | | | | | | | | |
| Net Asset Value, Beginning Of Year | | | $15.25 | | | | $13.83 | | | | $13.12 | | | | $10.65 | | | | $9.07 | |
| Income (loss) from investment operations: | | | | | | | | | | | | | | | | | | | | |
| Net investment income | | | .23 | | | | .17 | | | | .09 | | | | .08 | | | | .09 | |
| Net realized and unrealized gain on investments | | | 5.24 | | | | 1.36 | | | | .68 | | | | 2.48 | | | | 1.68 | |
| Total from investment operations | | | 5.47 | | | | 1.53 | | | | .77 | | | | 2.56 | | | | 1.77 | |
| Less Dividends and Distributions: | | | | | | | | | | | | | | | | | | | | |
| Dividends from net investment income | | | (.21 | ) | | | (.11 | ) | | | (.06 | ) | | | (.09 | ) | | | (.19 | ) |
| Capital contributions(d) | | | - | | | | - | | | | - | | | | - | * | | | - | |
| Net asset value, end of year | | | $20.51 | | | | $15.25 | | | | $13.83 | | | | $13.12 | | | | $10.65 | |
| Total Return(a): | | | 36.32% | | | | 11.16% | | | | 5.90% | | | | 24.14% | | | | 20.16% | |
| |
| Ratios/Supplemental Data: | |
| Net assets, end of year (in millions) | | | $120.4 | | | | $79.1 | | | | $68.1 | | | | $73.6 | | | | $62.4 | |
| Ratios to average net assets(c): | | | | | | | | | | | | | | | | | | | | |
| Expenses After Waivers and/or Expense Reimbursement | | | 1.40% | | | | 1.67% | | | | 1.63% | | | | 1.61% | | | | 1.72% | |
| Expenses Before Waivers and/or Expense Reimbursement | | | 1.52% | | | | 1.67% | | | | 1.63% | | | | 1.61% | | | | 1.72% | |
| Net investment income | | | 1.27% | | | | 1.16% | | | | .63% | | | | .65% | | | | .97% | |
| Portfolio turnover rate | | | 83% | | | | 25% | | | | 37% | | | | 26% | | | | 38% | |
(a) Total return does not consider the effects of sales load. Total return is calculated assuming a purchase of a share on the first day and a sale on the last day of each year reported and includes reinvestment of dividends and distributions. Total returns may reflect adjustments to conform to generally accepted accounting principles. Total return includes the effect of expense subsidies.
(b) Calculated based on average shares outstanding during the year.
(c) Does not include expenses of the underlying portfolio in which the Fund invests.
(d) The Fund received payments related to a former affiliates and to an unaffiliated-third party's settlement of regulatory proceedings involving allegations of improper trading in Fund shares during the fiscal year ended October 31, 2010. The fund was not involved in the proceedings or in the calculation of the amount of the settlement.
* Less than $0.005.
See Notes to Financial Statements.
| | | | | | | | | | | | | | | | | | | | |
| Class B Shares | |
| | | Year Ended October 31, | |
| | | 2013 | | | 2012 | | | 2011 | | | 2010 | | | 2009 | |
| Per Share Operating Performance(b): | | | | | | | | | | | | | | | | | | | | |
| Net Asset Value, Beginning Of Year | | | $13.76 | | | | $12.48 | | | | $11.87 | | | | $9.66 | | | | $8.22 | |
| Income (loss) from investment operations: | | | | | | | | | | | | | | | | | | | | |
| Net investment income (loss) | | | .08 | | | | .05 | | | | (.02 | ) | | | (.01 | ) | | | .06 | |
| Net realized and unrealized gain on investments | | | 4.74 | | | | 1.25 | | | | .63 | | | | 2.25 | | | | 1.49 | |
| Total from investment operations | | | 4.82 | | | | 1.30 | | | | .61 | | | | 2.24 | | | | 1.55 | |
| Less Dividends and Distributions: | | | | | | | | | | | | | | | | | | | | |
| Dividends from net investment income | | | (.12 | ) | | | (.02 | ) | | | - | | | | (.03 | ) | | | (.11 | ) |
| Capital contributions(d) | | | - | | | | - | | | | - | | | | - | * | | | - | |
| Net Asset Value, end of year | | | $18.46 | | | | $13.76 | | | | $12.48 | | | | $11.87 | | | | $9.66 | |
| Total Return(a): | | | 35.28% | | | | 10.40% | | | | 5.14% | | | | 23.20% | | | | 19.29% | |
| |
| Ratios/Supplemental Data: | | | | |
| Net assets, end of year (in millions) | | | $5.4 | | | | $2.5 | | | | $3.0 | | | | $4.1 | | | | $4.2 | |
| Ratios to average net assets(c): | | | | | | | | | | | | | | | | | | | | |
| Expenses After Waivers and/or Expense Reimbursement | | | 2.15% | | | | 2.42% | | | | 2.38% | | | | 2.36% | | | | 2.47% | |
| Expenses Before Waivers and/or Expense Reimbursement | | | 2.28% | | | | 2.42% | | | | 2.38% | | | | 2.36% | | | | 2.47% | |
| Net investment income (loss) | | | .48% | | | | .40% | | | | (.12)% | | | | (.08)% | | | | .84% | |
| Portfolio turnover rate | | | 83% | | | | 25% | | | | 37% | | | | 26% | | | | 38% | |
(a) Total return does not consider the effects of sales load. Total return is calculated assuming a purchase of a share on the first day and a sale on the last day of each year reported and includes reinvestment of dividends and distributions. Total returns may reflect adjustments to conform to generally accepted accounting principles. Total return includes the effect of expense subsidies.
(b) Calculated based on average shares outstanding during the year.
(c) Does not include expenses of the underlying portfolio in which the Fund invests.
(d) The Fund received payments related to a former affiliates and to an unaffiliated-third party's settlement of regulatory proceedings involving allegations of improper trading in Fund shares during the fiscal year ended October 31, 2010. The fund was not involved in the proceedings or in the calculation of the amount of the settlement.
* Less than $0.005.
See Notes to Financial Statements.
| | | | |
| Prudential Mid-Cap Value Fund | | | 43 | |
Financial Highlights
continued
| | | | | | | | | | | | | | | | | | | | |
| Class C Shares | |
| | | Year Ended October 31, | |
| | | 2013 | | | 2012 | | | 2011 | | | 2010 | | | 2009 | |
| Per Share Operating Performance(b): | |
| Net Asset Value, Beginning Of Year | | | $13.72 | | | | $12.44 | | | | $11.84 | | | | $9.63 | | | | $8.20 | |
| Income (loss) from investment operations: | |
| Net investment income (loss) | | | .08 | | | | .05 | | | | (.02 | ) | | | (.01 | ) | | | .03 | |
| Net realized and unrealized gain on investments | | | 4.72 | | | | 1.25 | | | | .62 | | | | 2.25 | | | | 1.51 | |
| Total from investment operations | | | 4.80 | | | | 1.30 | | | | .60 | | | | 2.24 | | | | 1.54 | |
| Less Dividends and Distributions: | | | | | | | | | | | | | | | | | | | | |
| Dividends from net investment income | | | (.12 | ) | | | (.02 | ) | | | - | | | | (.03 | ) | | | (.11 | ) |
| Capital contributions(d) | | | - | | | | - | | | | - | | | | - | * | | | - | |
| Net asset value, end of year | | | $18.40 | | | | $13.72 | | | | $12.44 | | | | $11.84 | | | | $9.63 | |
| Total Return(a): | | | 35.24% | | | | 10.43% | | | | 5.07% | | | | 23.27% | | | | 19.21% | |
| |
| Ratios/Supplemental Data: | | | | | | | | | | | | | | | |
| Net assets, end of year (in millions) | | | $37.5 | | | | $26.0 | | | | $27.3 | | | | $29.9 | | | | $27.8 | |
| Ratios to average net assets(c): | | | | | | | | | | | | | | | | | | | | |
| Expenses After Waivers and/or Expense Reimbursement | | | 2.15% | | | | 2.42% | | | | 2.38% | | | | 2.36% | | | | 2.47% | |
| Expenses Before Waivers and/or Expense Reimbursement | | | 2.27% | | | | 2.42% | | | | 2.38% | | | | 2.36% | | | | 2.47% | |
| Net investment income (loss) | | | .53% | | | | .40% | | | | (.12)% | | | | (.09)% | | | | .43% | |
| Portfolio turnover rate | | | 83% | | | | 25% | | | | 37% | | | | 26% | | | | 38% | |
(a) Total return does not consider the effects of sales load. Total return is calculated assuming a purchase of a share on the first day and a sale on the last day of each year reported and includes reinvestment of dividends and distributions. Total returns may reflect adjustments to conform to generally accepted accounting principles.
Total return includes the effect of expense subsidies.
(b) Calculated based on average shares outstanding during the year.
(c) Does not include expenses of the underlying portfolio in which the Fund invests.
(d) The Fund received payments related to a former affiliates and to an unaffiliated-third party's settlement of regulatory proceedings involving allegations of improper trading in Fund shares during the fiscal year ended October 31, 2010. The fund was not involved in the proceedings or in the calculation of the amount of the settlement.
* Less than $.005.
See Notes to Financial Statements.
| | | | | | | | | | | | | | | | | | | | | | |
| Class L Shares | |
| | | Period Ended
August 24, | | | | | Year Ended October 31, | |
| | | 2012(f) | | | | | 2011 | | | 2010 | | | 2009 | | | 2008 | |
| Per Share Operating Performance(b): | |
| Net Asset Value, Beginning Of Period | | | $13.58 | | | | | | $12.87 | | | | $10.46 | | | | $8.91 | | | | $18.12 | |
| Income (loss) from investment operations: | | | | | |
| Net investment income | | | .09 | | | | | | .05 | | | | .05 | | | | .08 | | | | .12 | |
| Net realized and unrealized gain (loss) on investments | | | 1.08 | | | | | | .69 | | | | 2.42 | | | | 1.63 | | | | (5.56 | ) |
| Total from investment operations | | | 1.17 | | | | | | .74 | | | | 2.47 | | | | 1.71 | | | | (5.44 | ) |
| Less Dividends and Distributions: | | | | | |
| Dividends from net investment income | | | (.07 | ) | | | | | (.03 | ) | | | (.06 | ) | | | (.16 | ) | | | (.02 | ) |
| Distributions from net realized gains | | | - | | | | | | - | | | | - | | | | - | | | | (3.75 | ) |
| Total dividends and distributions | | | (.07 | ) | | | | | (.03 | ) | | | (.06 | ) | | | (.16 | ) | | | (3.77 | ) |
| Capital contributions(g) | | | - | | | | | | - | | | | - | * | | | - | | | | - | |
| Net asset value, end of period | | | $14.68 | | | | | | $13.58 | | | | $12.87 | | | | $10.46 | | | | $8.91 | |
| Total Return(a): | | | 8.70% | | | | | | 5.77% | | | | 23.75% | | | | 19.75% | | | | (36.41)% | |
| |
| Ratios/Supplemental Data: | | | | | | | | | | | | | | | | | |
| Net assets, end of period (in millions) | | | $10.6 | | | | | | $10.9 | | | | $11.9 | | | | $11.5 | | | | $12.5 | |
| Ratios to average net assets(c): | | | | | | | | | | | | | | | | | | | | | | |
| Expenses After Waivers and/or Expense Reimbursement | | | 1.93% | (d) | | | | | 1.88% | | | | 1.86% | | | | 1.97% | | | | 1.78% | |
| Expenses Before Waivers and/or Expense Reimbursement | | | 1.93% | (d) | | | | | 1.88% | | | | 1.86% | | | | 1.97% | | | | 1.78% | |
| Net investment income | | | .81% | (d) | | | | | .38% | | | | .41% | | | | .94% | | | | .93% | |
| Portfolio turnover rate | | | 25% | (e) | | | | | 37% | | | | 26% | | | | 38% | | | | 37% | |
(a) Total return does not consider the effects of sales load. Total return is calculated assuming a purchase of a share on the first day and a sale on the last day of each period reported and includes reinvestment of dividends and distributions. Total returns may reflect adjustments to conform to generally accepted accounting principles.
Total return includes the effect of expense subsidies. Total returns for periods less than one full year are not annualized.
(b) Calculated based on average shares outstanding during the year.
(c) Does not include expenses of the underlying portfolio in which the Fund invests.
(d) Annualized.
(e) Not Annualized.
(f) End of operations.
(g) The Fund received payments related to a former affiliates and to an unaffiliated-third party's settlement of regulatory proceedings involving allegations of improper trading in Fund shares during the fiscal year ended October 31, 2010. The fund was not involved in the proceedings or in the calculation of the amount of the settlement.
See Notes to Financial Statements.
| | | | |
| Prudential Mid-Cap Value Fund | | | 45 | |
Financial Highlights
continued
| | | | | | | | | | | | | | | | | | | | | | |
| Class M Shares | |
| | | Period Ended April 13, | | | | | Year Ended October 31, | |
| | | 2012(f) | | | | | 2011 | | | 2010 | | | 2009 | | | 2008 | |
| Per Share Operating Performance(b): | |
| Net Asset Value, Beginning Of Period | | | $12.63 | | | | | | $11.98 | | | | $9.73 | | | | $8.27 | | | | $17.06 | |
| Income (loss) from investment operations: | |
| Net investment income | | | .08 | | | | | | .09 | | | | .08 | | | | .11 | | | | .14 | |
| Net realized and unrealized gain (loss) on investments | | | .70 | | | | | | .62 | | | | 2.25 | | | | 1.50 | | | | (5.10 | ) |
| Total from investment operations | | | .78 | | | | | | .71 | | | | 2.33 | | | | 1.61 | | | | (4.96 | ) |
| Less Dividends and Distributions: | |
| Dividends from net investment income | | | (.11 | ) | | | | | (.06 | ) | | | (.09 | ) | | | (.18 | ) | | | - | |
| Distributions from net realized gains | | | - | | | | | | - | | | | - | | | | - | | | | (3.84 | ) |
| Total dividends and distributions | | | (.11 | ) | | | | | (.06 | ) | | | (.09 | ) | | | (.18 | ) | | | (3.84 | ) |
| Capital contributions (Note 3)(g) | | | - | | | | | | - | * | | | .01 | | | | .03 | | | | .01 | |
| Net asset value, end of period | | | $13.30 | | | | | | $12.63 | | | | $11.98 | | | | $9.73 | | | | $8.27 | |
| Total Return(a): | | | 6.23% | | | | | | 5.97% | | | | 24.19% | | | | 20.42% | | | | (35.54)% | |
| |
| Ratios/Supplemental Data: | | | | |
| Net assets, end of period (in millions) | | | $.1 | | | | | | $1.0 | | | | $4.0 | | | | $9.5 | | | | $20.3 | |
| Ratios to average net assets(c): | |
| Expenses After Waivers and/or Expense Reimbursement | | | 1.64% | (d) | | | | | 1.63% | | | | 1.61% | | | | 1.72% | | | | 1.67% | |
| Expenses Before Waivers and/or Expense Reimbursement | | | 1.64% | (d) | | | | | 1.63% | | | | 1.61% | | | | 1.72% | | | | 1.67% | |
| Net investment income | | | 1.30% | (d) | | | | | .66% | | | | .74% | | | | 1.39% | | | | 1.17% | |
| Portfolio turnover rate | | | 25% | (e) | | | | | 37% | | | | 26% | | | | 38% | | | | 37% | |
(a) Total return does not consider the effects of sales load. Total return is calculated assuming a purchase of a share on the first day and a sale on the last day of each period reported and includes reinvestment of dividends and distributions. Total returns may reflect adjustments to conform to generally accepted accounting principles.
Total return includes the effect of expense subsidies. Total returns for periods less than one full year are not annualized.
(b) Calculated based on average shares outstanding during the period.
(c) Does not include expenses of the underlying portfolio in which the Fund invests.
(d) Annualized.
(e) Not Annualized.
(f) End of operations.
(g) The Fund received payments related to a former affiliates and to an unaffiliated-third party's settlement of regulatory proceedings involving allegations of improper trading in Fund shares during the fiscal year ended October 31, 2010. The fund was not involved in the proceedings or in the calculation of the amount of the settlement.
* Less than $.005.
See Notes to Financial Statements.
| | | | | | | | | | | | | | |
| Class Q Shares | |
| | | Year Ended October 31, | | | | | January 18, 2011(d)
through October 31, | |
| | | 2013 | | | 2012 | | | | | 2011 | |
| Per Share Operating Performance(b): | |
| Net Asset Value, Beginning Of Period | | | $15.39 | | | | $13.95 | | | | | | $14.50 | |
| Income (loss) from investment operations: | |
| Net investment income | | | .31 | | | | .24 | | | | | | .11 | |
| Net realized and unrealized gain (loss) on investments | | | 5.28 | | | | 1.38 | | | | | | (.66 | ) |
| Total from investment operations | | | 5.59 | | | | 1.62 | | | | | | (.55 | ) |
| Less Dividends and Distributions: | |
| Dividends from net investment income | | | (.29 | ) | | | (.18 | ) | | | | | - | |
| Net asset value, end of period | | | $20.69 | | | | $15.39 | | | | | | $13.95 | |
| Total Return(a): | | | 36.91% | | | | 11.80% | | | | | | (3.79)% | |
| |
| Ratios/Supplemental Data: | | | | | | | | | | | |
| Net assets, end of period (in millions) | | | $20.8 | | | | $5.7 | | | | | | $12.7 | |
| Ratios to average net assets(c): | | | | | | | | | | | | | | |
| Expenses After Waivers and/or Expense Reimbursement | | | .96% | | | | 1.14% | | | | | | 1.13% | (e) |
| Expenses Before Waivers and/or Expense Reimbursement | | | 1.10% | | | | 1.14% | | | | | | 1.13% | (e) |
| Net investment income | | | 1.67% | | | | 1.67% | | | | | | .99% | (e) |
| Portfolio turnover rate | | | 83% | | | | 25% | | | | | | 37% | |
(a) Total return is calculated assuming a purchase of a share on the first day and a sale on the last day of each period reported and includes reinvestment of dividends and distributions. Total returns may reflect adjustments to conform to generally accepted accounting principles. Total return includes the effect of expense subsidies. Total returns for periods less than one full year are not annualized.
(b) Calculated based on average shares outstanding during the period.
(c) Does not include expenses of the underlying portfolio in which the Fund invests.
(d) Commencement of operations.
(e) Annualized.
See Notes to Financial Statements.
| | | | |
| Prudential Mid-Cap Value Fund | | | 47 | |
Financial Highlights
continued
| | | | | | | | | | | | | | | | | | | | |
| Class X Shares | |
| | | Year Ended October 31, | |
| | | 2013 | | | 2012 | | | 2011 | | | 2010 | | | 2009 | |
| Per Share Operating Performance(b): | | | | | | | | | | | | | | | | | | | | |
| Net Asset Value, Beginning Of Year | | | $14.01 | | | | $12.70 | | | | $12.05 | | | | $9.79 | | | | $8.37 | |
| Income (loss) from investment operations: | | | | | | | | | | | | | | | | | | | | |
| Net investment income | | | .23 | | | | .15 | | | | .09 | | | | .08 | | | | .10 | |
| Net realized and unrealized gain on investments | | | 4.78 | | | | 1.27 | | | | .62 | | | | 2.26 | | | | 1.52 | |
| Total from investment operations | | | 5.01 | | | | 1.42 | | | | .71 | | | | 2.34 | | | | 1.62 | |
| Less Dividends and Distributions: | | | | | | | | | | | | | | | | | | | | |
| Dividends from net investment income | | | (.21 | ) | | | (.11 | ) | | | (.06 | ) | | | (.09 | ) | | | (.21 | ) |
| Capital contributions (Note 3)(d) | | | - | | | | - | * | | | - | * | | | .01 | | | | .01 | |
| Net asset value, end of year | | | $18.81 | | | | $14.01 | | | | $12.70 | | | | $12.05 | | | | $9.79 | |
| Total Return(a): | | | 36.26% | | | | 11.28% | | | | 5.93% | | | | 24.15% | | | | 20.15% | |
| |
| Ratios/Supplemental Data: | |
| Net assets, end of year (in millions) | | | $.3 | | | | $1.0 | | | | $1.9 | | | | $4.1 | | | | $5.3 | |
| Ratios to average net assets(c): | | | | | | | | | | | | | | | | | | | | |
| Expenses After Waivers and/or Expense Reimbursement | | | 1.48% | | | | 1.67% | | | | 1.63% | | | | 1.61% | | | | 1.72% | |
| Expenses Before Waivers and/or Expense Reimbursement | | | 1.54% | | | | 1.67% | | | | 1.63% | | | | 1.61% | | | | 1.72% | |
| Net investment income | | | 1.48% | | | | 1.13% | | | | .65% | | | | .69% | | | | 1.24% | |
| Portfolio turnover rate | | | 83% | | | | 25% | | | | 37% | | | | 26% | | | | 38% | |
(a) Total return does not consider the effects of sales load. Total return is calculated assuming a purchase of a share on the first day and a sale on the last day of each year reported and includes reinvestment of dividends and distributions. Total returns may reflect adjustments to conform to generally accepted accounting principles.
Total return includes the effect of expense subsidies.
(b) Calculated based on average shares outstanding during the year.
(c) Does not include expenses of the underlying portfolio in which the Fund invests.
(d) The Fund received payments related to a former affiliates and to an unaffiliated-third party's settlement of regulatory proceedings involving allegations of improper trading in Fund shares during the fiscal year ended October 31, 2010. The fund was not involved in the proceedings or in the calculation of the amount of the settlement.
* Less than $.005.
See Notes to Financial Statements.
| | | | | | | | | | | | | | | | | | | | |
| Class Z Shares | |
| | | Year Ended October 31, | |
| | | 2013 | | | 2012 | | | 2011 | | | 2010 | | | 2009 | |
| Per Share Operating Performance(b): | |
| Net Asset Value, Beginning Of Year | | | $15.38 | | | | $13.94 | | | | $13.21 | | | | $10.72 | | | | $9.14 | |
| Income (loss) from investment operations: | | | | | | | | | | | | | | | | | | | | |
| Net investment income | | | .25 | | | | .20 | | | | .15 | | | | .11 | | | | .11 | |
| Net realized and unrealized gain on investments | | | 5.30 | | | | 1.38 | | | | .67 | | | | 2.49 | | | | 1.69 | |
| Total from investment operations | | | 5.55 | | | | 1.58 | | | | .82 | | | | 2.60 | | | | 1.80 | |
| Less Dividends and Distributions: | | | | | | | | | | | | | | | | | | | | |
| Dividends from net investment income | | | (.25 | ) | | | (.14 | ) | | | (.09 | ) | | | (.11 | ) | | | (.22 | ) |
| Capital contributions(d) | | | - | | | | - | | | | - | | | | - | * | | | - | |
| Net asset value, end of year | | | $20.68 | | | | $15.38 | | | | $13.94 | | | | $13.21 | | | | $10.72 | |
| Total Return(a): | | | 36.60% | | | | 11.51% | | | | 6.26% | | | | 24.43% | | | | 20.41% | |
| |
| Ratios/Supplemental Data: | | | | | | | | | | | | | | | |
| Net assets, end of year (in millions) | | | $27.0 | | | | $6.1 | | | | $5.0 | | | | $16.8 | | | | $16.2 | |
| Ratios to average net assets(c): | | | | | | | | | | | | | | | | | | | | |
| Expenses After Waivers and/or Expense Reimbursement | | | 1.10% | | | | 1.42% | | | | 1.38% | | | | 1.36% | | | | 1.47% | |
| Expenses Before Waivers and/or Expense Reimbursement | | | 1.26% | | | | 1.42% | | | | 1.38% | | | | 1.36% | | | | 1.47% | |
| Net investment income | | | 1.36% | | | | 1.39% | | | | 1.07% | | | | .90% | | | | 1.18% | |
| Portfolio turnover rate | | | 83% | | | | 25% | | | | 37% | | | | 26% | | | | 38% | |
(a) Total return is calculated assuming a purchase of a share on the first day and a sale on the last day of each year reported and includes reinvestment of dividends and distributions. Total returns may reflect adjustments to conform to generally accepted accounting principles. Total return includes the effect of expense subsidies.
(b) Calculated based on average shares outstanding during the year.
| (c) | Does not include expenses of the underlying portfolio in which the Fund invests. |
(d) The Fund received payments related to a former affiliates and to an unaffiliated-third party's settlement of regulatory proceedings involving allegations of improper trading in Fund shares during the fiscal year ended October 31, 2010. The fund was not involved in the proceedings or in the calculation of the amount of the settlement.
* Less than $.005.
See Notes to Financial Statements.
| | | | |
| Prudential Mid-Cap Value Fund | | | 49 | |
Report of Independent Registered Public
Accounting Firm
The Board of Directors and Shareholders
Prudential Investment Portfolios, Inc. 10:
We have audited the accompanying statement of assets and liabilities of Prudential Mid Cap Value Fund, a series of Prudential Investment Portfolios, Inc. 10, (hereafter referred to as the “Fund”), including the portfolio of investments, as of October 31, 2013, and the related statement of operations for the year then ended, the statements of changes in net assets for each of the years in the two-year period then ended and the financial highlights for each of the years in the five-year period then ended. These financial statements and financial highlights are the responsibility of the Fund’s management. Our responsibility is to express an opinion on these financial statements and financial highlights based on our audits.
We conducted our audits in accordance with the standards of the Public Company Accounting Oversight Board (United States). Those standards require that we plan and perform the audit to obtain reasonable assurance about whether the financial statements and financial highlights are free of material misstatement. An audit includes examining, on a test basis, evidence supporting the amounts and disclosures in the financial statements. Our procedures included confirmation of securities owned as of October 31, 2013, by correspondence with the custodian, transfer agent and brokers or by other appropriate auditing procedures when replies from brokers were not received. An audit also includes assessing the accounting principles used and significant estimates made by management, as well as evaluating the overall financial statement presentation. We believe that our audits provide a reasonable basis for our opinion.
In our opinion, the financial statements and financial highlights referred to above present fairly, in all material respects, the financial position of the Fund as of October 31, 2013, and the results of its operations for the year then ended, the changes in its net assets for each of the years in the two-year period then ended and the financial highlights for each of the years in the five-year period then ended, in conformity with U.S. generally accepted accounting principles.

New York, New York
December 20, 2013
Tax Information
(Unaudited)
For the year ended October 31, 2013, the Fund reports the maximum amount allowable under Section 854 of the Internal Revenue Code, but not less than, the following percentages of the ordinary income dividends paid as 1) qualified dividend income (QDI); and 2) eligible for corporate dividends received deduction (DRD):
| | | | | | | | |
| | | QDI | | | DRD | |
Prudential Mid-Cap Value Fund | | | 68.69% | | | | 68.19% | |
In January 2014, you will be advised on IRS Form 1099-DIV or substitute 1099-DIV as to the federal tax status of dividends received by you in calendar year 2013.
| | | | |
| Prudential Mid-Cap Value Fund | | | 51 | |
INFORMATION ABOUT BOARD MEMBERS AND OFFICERS
(Unaudited)
Information about Board Members and Officers of the Fund is set forth below. Board Members who are not deemed to be “interested persons” of the Fund, as defined in the 1940 Act, are referred to as “Independent Board Members.” Board Members who are deemed to be “interested persons” of the Fund are referred to as “Interested Board Members.” The Board Members are responsible for the overall supervision of the operations of the Fund and perform the various duties imposed on the directors of investment companies by the 1940 Act. The Board in turn elects the Officers, who are responsible for administering the day-to-day operations of the Fund.
| | | | |
| Independent Board Members(1) |
Name, Address, Age Position(s) Portfolios Overseen | | Principal Occupation(s) During Past Five Years | | Other Directorships Held |
Ellen S. Alberding (55) Board Member Portfolios Overseen: 64 | | President and Board Member, The Joyce Foundation (charitable foundation) (since 2002); Vice Chair, City Colleges of Chicago (community college system) (since 2011); Trustee, Skills for America’s Future (national initiative to connect employers to community colleges) (since 2011); Trustee, National Park Foundation (charitable foundation for national park system) (since 2009); Trustee, Economic Club of Chicago (since 2009). | | None. |
Kevin J. Bannon (61) Board Member Portfolios Overseen: 64 | | Managing Director (since April 2008) and Chief Investment Officer (since October 2008) of Highmount Capital LLC (registered investment adviser); formerly Executive Vice President and Chief Investment Officer (April 1993-August 2007) of Bank of New York Company; President (May 2003-May 2007) of BNY Hamilton Family of Mutual Funds. | | Director of Urstadt Biddle Properties (since September 2008). |
Linda W. Bynoe (61) Board Member Portfolios Overseen: 64 | | President and Chief Executive Officer (since March 1995) and formerly Chief Operating Officer (December 1989-February 1995) of Telemat Ltd. (management consulting); formerly Vice President (January 1985-June 1989) at Morgan Stanley & Co (broker-dealer). | | Director of Simon Property Group, Inc. (retail real estate) (May 2003-May 2012); Director of Anixter International, Inc. (communication products distributor) (since January 2006); Director of Northern Trust Corporation (financial services) (since April 2006); Trustee of Equity Residential (residential real estate) (since December 2009). |
Prudential Mid-Cap Value Fund
| | | | |
| Independent Board Members(1) |
Name, Address, Age Position(s) Portfolios Overseen | | Principal Occupation(s) During Past Five Years | | Other Directorships Held |
Keith F. Hartstein (57) Board Member Portfolios Overseen: 64 | | Formerly President and Chief Executive Officer (2005-2012), Senior Vice President (2004-2005), Senior Vice President of Sales and Marketing (1997-2004), and various executive management positions (1990-1997), John Hancock Funds, LLC (asset management); Chairman, Investment Company Institute’s Sales Force Marketing Committee (2003-2008). | | None. |
Michael S. Hyland, CFA (68) Board Member Portfolios Overseen: 64 | | Independent Consultant (since February 2005); formerly Senior Managing Director (July 2001-February 2005) of Bear Stearns & Co, Inc.; Global Partner, INVESCO (1999-2001); Managing Director and President of Salomon Brothers Asset Management (1989-1999). | | None. |
Douglas H. McCorkindale (74) Board Member Portfolios Overseen: 64 | | Formerly Chairman (February 2001-June 2006), Chief Executive Officer (June 2000-July 2005), President (September 1997-July 2005) and Vice Chairman (March 1984-May 2000) of Gannett Co. Inc. (publishing and media). | | Director of Lockheed Martin Corp. (aerospace and defense) (since May 2001). |
Stephen P. Munn (71) Board Member Portfolios Overseen: 64 | | Lead Director (since 2007) and formerly Chairman (1993-2007) of Carlisle Companies Incorporated (manufacturer of industrial products). | | Lead Director (since 2007) of Carlisle Companies Incorporated (manufacturer of industrial products). |
James E. Quinn (61) Board Member Portfolios Overseen: 64 | | Formerly President (2003-2012) and Director (2003-2008), and Vice Chairman and Director (1998-2003), Tiffany & Company (jewelry retailing); Director, Mutual of America Capital Management Corporation (asset management) (since 1996); Director, Hofstra University (since 2008); Vice Chairman, Museum of the City of New York (since 1984). | | Director of Deckers Outdoor Corporation (footwear manufacturer) (since 2011). |
Richard A. Redeker (70) Board Member & Independent Chair Portfolios Overseen: 64 | | Retired Mutual Fund Senior Executive (44 years); Management Consultant; Independent Directors Council (organization of 2,800 Independent Mutual Fund Directors)-Executive Committee, Chair of Policy Steering Committee, Governing Council. | | None. |
Visit our website at www.prudentialfunds.com
| | | | |
| Independent Board Members(1) |
Name, Address, Age Position(s) Portfolios Overseen | | Principal Occupation(s) During Past Five Years | | Other Directorships Held |
Robin B. Smith (74) Board Member Portfolios Overseen: 64 | | Chairman of the Board (since January 2003) of Publishers Clearing House (direct marketing); Member of the Board of Directors of ADLPartner (marketing) (since December 2010); formerly Chairman and Chief Executive Officer (August 1996-January 2003) of Publishers Clearing House. | | Formerly Director of BellSouth Corporation (telecommunications) (1992-2006). |
Stephen G. Stoneburn (70) Board Member Portfolios Overseen: 64 | | Chairman, (since July 2011), President and Chief Executive Officer (since June 1996) of Quadrant Media Corp. (publishing company); formerly President (June 1995-June 1996) of Argus Integrated Media, Inc.; Senior Vice President and Managing Director (January 1993-1995) of Cowles Business Media; Senior Vice President of Fairchild Publications, Inc. (1975-1989). | | None. |
| | | | |
| Interested Board Members(1) |
Name, Address, Age Position(s) Portfolios Overseen | | Principal Occupation(s) During Past Five Years | | Other Directorships Held |
Stuart S. Parker (51) Board Member & President Portfolios Overseen: 59 | | President of Prudential Investments LLC (since January 2012); Executive Vice President of Prudential Investment Management Services LLC (since December 2012); Executive Vice President of Jennison Associates LLC and Head of Retail Distribution of Prudential Investments LLC (June 2005 - December 2011). | | None. |
Scott E. Benjamin (40) Board Member & Vice President Portfolios Overseen: 64 | | Executive Vice President (since June 2009) of Prudential Investments LLC; Executive Vice President (June 2009-June 2012) and Vice President (since June 2012) of Prudential Investment Management Services LLC; Executive Vice President (since September 2009) of AST Investment Services, Inc.; Senior Vice President of Product Development and Marketing, Prudential Investments (since February 2006); Vice President of Product Development and Product Management, Prudential Investments (2003-2006). | | None. |
Prudential Mid-Cap Value Fund
| (1) | The year in which each individual joined the Fund’s Board is as follows: |
Ellen S. Alberding, 2013; Linda W. Bynoe, 2005; Douglas H. McCorkindale, 2003, Richard A. Redeker, 2003; Robin B. Smith, 2003; Stephen G. Stoneburn, 2003; Kevin J. Bannon, 2008; Keith F. Hartstein, 2013; Michael S. Hyland, 2008; Stephen P. Munn, 2008; James E. Quinn, 2013; Stuart S. Parker, Board Member and President since 2012; Scott E. Benjamin, Board Member since 2010 and Vice President since 2009.
| | | | |
| Fund Officers(a) |
Name, Address and Age Position with Fund | | Principal Occupation(s) During Past Five Years | | Length of Service as Fund Officer |
Raymond A. O’Hara (58) Chief Legal Officer | | Vice President and Corporate Counsel (since July 2010) of Prudential Insurance Company of America (Prudential); Vice President (March 2011-Present) of Pruco Life Insurance Company and Pruco Life Insurance Company of New Jersey; Vice President and Corporate Counsel (March 2011-Present) of Prudential Annuities Life Assurance Corporation; Chief Legal Officer of Prudential Investments LLC (since June 2012); Chief Legal Officer of Prudential Mutual Fund Services LLC (since June 2012) and Corporate Counsel of AST Investment Services, Inc. (since June 2012); formerly Assistant Vice President and Corporate Counsel (September 2008-July 2010) of The Hartford Financial Services Group, Inc.; formerly Associate (September 1980-December 1987) and Partner (January 1988–August 2008) of Blazzard & Hasenauer, P.C. (formerly, Blazzard, Grodd & Hasenauer, P.C.). | | Since 2012 |
Deborah A. Docs (55) Secretary | | Vice President and Corporate Counsel (since January 2001) of Prudential; Vice President (since December 1996) and Assistant Secretary (since March 1999) of Prudential Investments LLC; formerly Vice President and Assistant Secretary (May 2003-June 2005) of AST Investment Services, Inc. | | Since 2004 |
Jonathan D. Shain (55) Assistant Secretary | | Vice President and Corporate Counsel (since August 1998) of Prudential; Vice President and Assistant Secretary (since May 2001) of Prudential Investments LLC; Vice President and Assistant Secretary (since February 2001) of Prudential Mutual Fund Services LLC; formerly Vice President and Assistant Secretary (May 2003-June 2005) of AST Investment Services, Inc. | | Since 2005 |
Claudia DiGiacomo (39) Assistant Secretary | | Vice President and Corporate Counsel (since January 2005) of Prudential; Vice President and Assistant Secretary of Prudential Investments LLC (since December 2005); Associate at Sidley Austin Brown & Wood LLP (1999-2004). | | Since 2005 |
Andrew R. French (51) Assistant Secretary | | Vice President and Corporate Counsel (since February 2010) of Prudential; formerly Director and Corporate Counsel (2006-2010) of Prudential; Vice President and Assistant Secretary (since January 2007) of Prudential Investments LLC; Vice President and Assistant Secretary (since January 2007) of Prudential Mutual Fund Services LLC. | | Since 2006 |
Visit our website at www.prudentialfunds.com
| | | | |
| Fund Officers(a) |
Name, Address and Age Position with Fund | | Principal Occupation(s) During Past Five Years | | Length of Service as Fund Officer |
Amanda S. Ryan (35) Assistant Secretary | | Director and Corporate Counsel (since March 2012) of Prudential; Director and Assistant Secretary (since June 2012) of Prudential Investments LLC; Associate at Ropes & Gray LLP (2008-2012). | | Since 2012 |
Bruce Karpati (43) Chief Compliance Officer | | Chief Compliance Officer of the Prudential Investments Funds, Target Funds, Advanced Series Trust, the Prudential Series Fund and Prudential’s Gibraltar Fund, Inc. (May 2013 - Present); formerly National Chief (May 2012 - May 2013) and Co-Chief (January 2010 - May 2012) of the Asset Management Unit, Division of Enforcement, of the U.S. Securities and Exchange Commission; Assistant Regional Director (January 2005 - January 2010) of the U.S. Securities and Exchange Commission. | | Since 2013 |
Theresa C. Thompson (51) Deputy Chief Compliance Officer | | Vice President, Compliance, Prudential Investments LLC (since April 2004); and Director, Compliance, Prudential Investments LLC (2001-2004). | | Since 2008 |
Richard W. Kinville (45) Anti-Money Laundering Compliance Officer | | Vice President, Corporate Compliance, Anti-Money Laundering Unit (since January 2005) of Prudential; committee member of the American Council of Life Insurers Anti-Money Laundering and Critical Infrastructure Committee (since January 2007); formerly Investigator and Supervisor in the Special Investigations Unit for the New York Central Mutual Fire Insurance Company (August 1994-January 1999); Investigator in AXA Financial’s Internal Audit Department and Manager in AXA’s Anti-Money Laundering Office (January 1999-January 2005); first chair of the American Council of Life Insurers Anti-Money Laundering and Critical Infrastructure Committee (June 2007-December 2009). | | Since 2011 |
Grace C. Torres (54) Treasurer and Principal Financial and Accounting Officer | | Assistant Treasurer (since March 1999) and Senior Vice President (since September 1999) of Prudential Investments LLC; Assistant Treasurer (since May 2003) and Vice President (since June 2005) of AST Investment Services, Inc.; Senior Vice President and Assistant Treasurer (since May 2003) of Prudential Annuities Advisory Services, Inc.; formerly Senior Vice President (May 2003-June 2005) of AST Investment Services, Inc. | | Since 1998 |
M. Sadiq Peshimam (49) Assistant Treasurer | | Vice President (since 2005) of Prudential Investments LLC. | | Since 2006 |
Peter Parrella (55) Assistant Treasurer | | Vice President (since 2007) and Director (2004-2007) within Prudential Mutual Fund Administration; formerly Tax Manager at SSB Citi Fund Management LLC (1997-2004). | | Since 2007 |
| (a) | Excludes Mr. Parker and Mr. Benjamin, interested Board Members who also serve as President and Vice President, respectively. |
Prudential Mid-Cap Value Fund
Explanatory Notes to Tables:
| • | | Board Members are deemed to be “Interested,” as defined in the 1940 Act, by reason of their affiliation with Prudential Investments LLC and/or an affiliate of Prudential Investments LLC. |
| • | | Unless otherwise noted, the address of all Board Members and Officers is c/o Prudential Investments LLC, Gateway Center Three, 100 Mulberry Street, Newark, New Jersey 07102-4077. |
| • | | There is no set term of office for Board Members or Officers. The Board Members have adopted a retirement policy, which calls for the retirement of Board Members on December 31 of the year in which they reach the age of 75. |
| • | | “Other Directorships Held” includes only directorships of companies required to register or file reports with the SEC under the 1934 Act (that is, “public companies”) or other investment companies registered under the 1940 Act. |
| • | | “Portfolios Overseen” includes all investment companies managed by Prudential Investments LLC. The investment companies for which Prudential Investments LLC serves as manager include the Prudential Investments Mutual Funds, The Prudential Variable Contract Accounts, Target Mutual Funds, Prudential Short Duration High Yield Fund, Inc., Prudential Global Short Duration High Yield Fund, Inc., The Prudential Series Fund, Prudential’s Gibraltar Fund, Inc. and the Advanced Series Trust. |
Visit our website at www.prudentialfunds.com
Approval of Advisory Agreements
The Fund’s Board of Directors
The Board of Directors (the “Board”) of Prudential Mid-Cap Value Fund (the “Fund”)1 consists of ten individuals, eight of whom are not “interested persons” of the Fund, as defined in the Investment Company Act of 1940, as amended (the “1940 Act”) (the “Independent Directors”).2 The Board is responsible for the oversight of the Fund and its operations, and performs the various duties imposed on the directors of investment companies by the 1940 Act. The Independent Directors have retained independent legal counsel to assist them in connection with their duties. The Chair of the Board is an Independent Director. The Board has established three standing committees: the Audit Committee, the Nominating and Governance Committee, and the Investment Committee. Each committee is chaired by, and composed of, Independent Directors.
Annual Approval of the Fund’s Advisory Agreements
As required under the 1940 Act, the Board determines annually whether to renew the Fund’s management agreement with Prudential Investments LLC (“PI”) and the Fund’s subadvisory agreement with Quantitative Management Associates LLC (“QMA”). In considering the renewal of the agreements, the Board, including all of the Independent Directors, met on June 4-6, 2013 and approved the renewal of the agreements through July 31, 2014, after concluding that the renewal of the agreements was in the best interests of the Fund and its shareholders.
In advance of the meetings, the Board requested and received materials relating to the agreements, and had the opportunity to ask questions and request further information in connection with its consideration. Among other things, the Board considered comparative fee information from PI and QMA. Also, the Board considered comparisons with other mutual funds in relevant Peer Universes and Peer Groups, as is further discussed below.
In approving the agreements, the Board, including the Independent Directors advised by independent legal counsel, considered the factors it deemed relevant, including the nature, quality and extent of services provided by PI and the subadviser, the performance of the Fund, the profitability of PI and its affiliates, expenses and fees, and the potential for economies of scale that may be shared with the Fund and its shareholders as the Fund’s assets grow. In their deliberations, the Directors did not identify any single factor which alone was responsible for the Board’s decision to approve the agreements with respect to the Fund. In connection with its deliberations, the Board considered information provided by PI throughout the year at regular Board
| 1 | Prudential Mid Cap Value Fund is a series of Prudential Investment Portfolios, Inc. 10 |
| 2 | Ms. Alberding and Messrs. Hartstein and Quinn were elected to the Board effective September 1, 2013. |
Prudential Mid-Cap Value Fund
Approval of Advisory Agreements (continued)
meetings, presentations from portfolio managers and other information, as well as information furnished at or in advance of the meetings on June 4-6, 2013.
The Directors determined that the overall arrangements between the Fund and PI, which serves as the Fund’s investment manager pursuant to a management agreement, and between PI and QMA, which serves as the Fund’s subadviser pursuant to the terms of a subadvisory agreement with PI, are in the best interests of the Fund and its shareholders in light of the services performed, fees charged and such other matters as the Directors considered relevant in the exercise of their business judgment.
The material factors and conclusions that formed the basis for the Directors’ reaching their determinations to approve the continuance of the agreements are separately discussed below.
Nature, Quality and Extent of Services
The Board received and considered information regarding the nature, quality and extent of services provided to the Fund by PI and QMA. The Board considered the services provided by PI, including but not limited to the oversight of the subadviser for the Fund, as well as the provision of fund recordkeeping, compliance, and other services to the Fund. With respect to PI’s oversight of the subadviser, the Board noted that PI’s Strategic Investment Research Group (“SIRG”), which is a business unit of PI, is responsible for monitoring and reporting to PI’s senior management on the performance and operations of the subadviser. The Board also considered that PI pays the salaries of all of the officers and non-independent Directors of the Fund. The Board also considered the investment subadvisory services provided by QMA, as well as adherence to the Fund’s investment restrictions and compliance with applicable Fund policies and procedures. The Board considered PI’s evaluation of the subadviser, as well as PI’s recommendation, based on its review of the subadviser, to renew the subadvisory agreement.
The Board considered the qualifications, backgrounds and responsibilities of PI’s senior management responsible for the oversight of the Fund and QMA, and also considered the qualifications, backgrounds and responsibilities of the QMA portfolio managers who are responsible for the day-to-day management of the Fund’s portfolio. The Board was provided with information pertaining to PI’s and QMA’s organizational structure, senior management, investment operations, and other relevant information pertaining to PI and QMA. The Board also noted that it received favorable compliance reports from the Fund’s Chief Compliance Officer (“CCO”) as to each of PI and QMA. The Board noted that QMA is affiliated with PI.
Visit our website at www.prudentialfunds.com
The Board concluded that it was satisfied with the nature, extent and quality of the investment management services provided by PI and the subadvisory services provided to the Fund by QMA, and that there was a reasonable basis on which to conclude that the Fund benefits from the services provided by PI and QMA under the management and subadvisory agreements.
Costs of Services and Profits Realized by PI
The Board was provided with information on the profitability of PI and its affiliates in serving as the Fund’s investment manager. The Board discussed with PI the methodology utilized in assembling the information regarding profitability and considered its reasonableness. The Board recognized that it is difficult to make comparisons of profitability from fund management contracts because comparative information is not generally publicly available and is affected by numerous factors, including the structure of the particular adviser, the types of funds it manages, its business mix, numerous assumptions regarding allocations and the adviser’s capital structure and cost of capital. The Board separately considered information regarding the profitability of the subadviser, an affiliate of PI. Taking these factors into account, the Board concluded that the profitability of PI and its affiliates in relation to the services rendered was not unreasonable.
Economies of Scale
The Board received and discussed information concerning whether PI realizes economies of scale as the Fund’s assets grow beyond current levels. The Board noted that the management fee schedule for the Fund includes breakpoints, which have the effect of decreasing the fee rate as assets increase, but at the current level of assets, the Fund does not realize the effect of those rate reductions. The Board took note that the Fund’s fee structure would result in benefits to Fund shareholders when (and if) assets reach the levels at which the fee rate is reduced. These benefits will accrue whether or not PI is then realizing any economies of scale. The Board recognized the inherent limitations of any analysis of economies of scale, stemming largely from the Board’s understanding that most of PI’s costs are not specific to individual funds, but rather are incurred across a variety of products and services.
Other Benefits to PI and QMA
The Board considered potential ancillary benefits that might be received by PI and QMA and their affiliates as a result of their relationship with the Fund. The Board concluded that potential benefits to be derived by PI included fees received by affiliates of PI for serving as the Fund’s securities lending agent, transfer agency fees received by the Fund’s transfer agent (which is affiliated with PI), and benefits to its reputation as well as other intangible benefits resulting from PI’s association with the
Prudential Mid-Cap Value Fund
Approval of Advisory Agreements (continued)
Fund. The Board concluded that the potential benefits to be derived by QMA included its ability to use soft dollar credits, as well as the potential benefits consistent with those generally resulting from an increase in assets under management, specifically, potential access to additional research resources and benefits to its reputation. The Board concluded that the benefits derived by PI and QMA were consistent with the types of benefits generally derived by investment managers and subadvisers to mutual funds.
Performance of the Fund / Fees and Expenses
The Board considered certain additional specific factors and made related conclusions relating to the historical performance of the Fund for the one-, three- and five-year periods ended December 31, 2012.
The Board also considered the Fund’s actual management fee, as well as the Fund’s net total expense ratio, for the fiscal year ended October 31, 2012. The Board considered the management fee for the Fund as compared to the management fee charged by PI to other funds and the fee charged by other advisers to comparable mutual funds in a Peer Group. The actual management fee represents the fee rate actually paid by Fund shareholders and includes any fee waivers or reimbursements. The net total expense ratio for the Fund represents the actual expense ratio incurred by Fund shareholders.
The mutual funds included in the Peer Universe (the Lipper Mid-Cap Value Funds Performance Universe) and the Peer Group were objectively determined by Lipper Inc. (“Lipper”), an independent provider of mutual fund data. The comparisons placed the Fund in various quartiles, with the first quartile being the best 25% of the mutual funds (for performance, the best performing mutual funds and, for expenses, the lowest cost mutual funds).
The section below summarizes key factors considered by the Board and the Board’s conclusions regarding the Fund’s performance, fees and overall expenses. The table sets forth gross performance comparisons (which do not reflect the impact on performance of fund expenses, or any subsidies, expense caps or waivers that may be applicable) with the Peer Universe, actual management fees with the Peer Group (which reflect the impact of any subsidies or fee waivers), and net total expenses with the Peer Group, each of which were key factors considered by the Board.
| | | | | | | | |
| Performance | | 1 Year | | 3 Years | | 5 Years | | 10 Years |
| | | 3rd Quartile | | 3rd Quartile | | 1st Quartile | | N/A |
| Actual Management Fees: 4th Quartile |
| Net Total Expenses: 4th Quartile |
Visit our website at www.prudentialfunds.com
| | • | | The Board noted that the Fund outperformed its benchmark index over the five-year period, though it underperformed its benchmark index over the one- and three- year periods. |
| | • | | The Board considered that when it reviewed the Fund’s agreements a year earlier, the Fund ranked in the first or second quartile of its Peer Universe for all periods. |
| | • | | The Board noted its disappointment with the Fund’s one- and three-year performance, but noted that the Fund’s five-year performance was strong. The Board also considered information provided by PI indicating that the Fund’s performance for the first quarter of 2013 was in the first quartile of its Peer Universe. |
| | • | | The Board noted PI’s explanation that it had implemented an expense cap in May 2013, which would have resulted in a second quartile ranking for net total expenses if it had been in effect during the most recent fiscal year. |
| | • | | The Board accepted PI’s recommendation to continue the existing expense cap of 0.98% (exclusive of 12b-1 fees and certain other fees) through February 28, 2014. |
| | • | | The Board concluded that it was reasonable to continue to monitor the Fund’s performance, and therefore it would be in the best interests of the Fund and its shareholders to renew the agreements. |
| | • | | The Board concluded that the management fees (including subadvisory fees) and total expenses were reasonable in light of the services provided. |
* * *
After full consideration of these factors, the Board concluded that approval of the agreements was in the best interests of the Fund and its shareholders.
Prudential Mid-Cap Value Fund
| | | | |
| n MAIL | | n TELEPHONE | | n WEBSITE |
Gateway Center Three 100 Mulberry Street Newark, NJ 07102 | | (800) 225-1852 | | www.prudentialfunds.com |
|
| PROXY VOTING |
| The Board of Directors of the Fund has delegated to the Fund’s investment subadviser the responsibility for voting any proxies and maintaining proxy recordkeeping with respect to the Fund. A description of these proxy voting policies and procedures is available without charge, upon request, by calling (800) 225-1852 or by visiting the Securities and Exchange Commission’s website at www.sec.gov. Information regarding how the Fund voted proxies relating to portfolio securities during the most recent 12-month period ended June 30 is available on the Fund’s website and on the Securities and Exchange Commission’s website. |
|
| DIRECTORS |
| Ellen S. Alberding • Kevin J. Bannon • Scott E. Benjamin • Linda W. Bynoe • Keith F. Hartstein • Michael S. Hyland • Douglas H. McCorkindale • Stephen P. Munn • Stuart S. Parker • James E. Quinn • Richard A. Redeker • Robin B. Smith • Stephen G. Stoneburn |
|
| OFFICERS |
| Stuart S. Parker, President • Scott E. Benjamin, Vice President • Grace C. Torres, Treasurer and Principal Financial and Accounting Officer • Raymond A. O’Hara, Chief Legal Officer • Deborah A. Docs, Secretary • Bruce Karpati, Chief Compliance Officer • Theresa C. Thompson, Deputy Chief Compliance Officer • Richard W. Kinville, Anti-Money Laundering Compliance Officer • Jonathan D. Shain, Assistant Secretary • Claudia DiGiacomo, Assistant Secretary • Amanda S. Ryan, Assistant Secretary • Andrew R. French, Assistant Secretary • M. Sadiq Peshimam, Assistant Treasurer • Peter Parrella, Assistant Treasurer |
| | | | |
| MANAGER | | Prudential Investments LLC | | Gateway Center Three
100 Mulberry Street
Newark, NJ 07102 |
|
| INVESTMENT SUBADVISER | | Quantitative Management
Associates LLC | | Gateway Center Two
100 Mulberry Street
Newark, NJ 07102 |
|
| DISTRIBUTOR | | Prudential Investment
Management Services LLC | | Gateway Center Three
100 Mulberry Street
Newark, NJ 07102 |
|
| CUSTODIAN | | The Bank of New York Mellon | | One Wall Street
New York, NY 10286 |
|
| TRANSFER AGENT | | Prudential Mutual Fund
Services LLC | | PO Box 9658
Providence, RI 02940 |
|
| INDEPENDENT REGISTERED PUBLIC ACCOUNTING FIRM | | KPMG LLP | | 345 Park Avenue
New York, NY 10154 |
|
| FUND COUNSEL | | Willkie Farr & Gallagher LLP | | 787 Seventh Avenue
New York, NY 10019 |
|
| An investor should consider the investment objectives, risks, charges, and expenses of the Fund carefully before investing. The prospectus and summary prospectus contain this and other information about the Fund. An investor may obtain a prospectus and summary prospectus by visiting our website at www.prudentialfunds.com or by calling (800) 225-1852. The prospectus and summary prospectus should be read carefully before investing. |
|
| E-DELIVERY |
| To receive your mutual fund documents online, go to www.prudentialfunds.com/edelivery and enroll. Instead of receiving printed documents by mail, you will receive notification via email when new materials are available. You can cancel your enrollment or change your email address at any time by visiting the website address above. |
|
| SHAREHOLDER COMMUNICATIONS WITH DIRECTORS |
| Shareholders can communicate directly with the Board of Directors by writing to the Chair of the Board, Prudential Mid-Cap Value Fund, Prudential Investments, Attn: Board of Directors, 100 Mulberry Street, Gateway Center Three, Newark, NJ 07102. Shareholders can communicate directly with an individual Director by writing to the same address. Communications are not screened before being delivered to the addressee. |
|
| AVAILABILITY OF PORTFOLIO SCHEDULE |
| The Fund files its complete schedule of portfolio holdings with the Securities and Exchange Commission for the first and third quarters of each fiscal year on Form N-Q. The Fund’s Forms N-Q are available on the Commission’s website at www.sec.gov. The Fund’s Forms N-Q may also be reviewed and copied at the Commission’s Public Reference Room in Washington, D.C. Information on the operation and location of the Public Reference Room may be obtained by calling 1-800-SEC-0330. The Fund’s schedule of portfolio holdings is also available on the Fund’s website as of the end of each month. |
|
| The Fund’s Statement of Additional Information contains additional information about the Fund’s Directors and is available without charge, upon request, by calling (800) 225-1852. |
Mutual Funds:
| | | | |
ARE NOT INSURED BY THE FDIC OR ANY
FEDERAL GOVERNMENT AGENCY | | MAY LOSE VALUE | | ARE NOT A DEPOSIT OF OR GUARANTEED BY ANY BANK OR ANY BANK AFFILIATE |

PRUDENTIAL MID-CAP VALUE FUND
| | | | | | | | | | | | |
| SHARE CLASS | | A | | B | | C | | Q | | X | | Z |
| NASDAQ | | SPRAX | | SVUBX | | NCBVX | | PMVQX | | NBVZX | | SPVZX |
| CUSIP | | 74441L105 | | 74441L204 | | 74441L303 | | 74441L824 | | 74441L600 | | 74441L709 |
MF202E 0255302-00001-00
Item 2 – Code of Ethics — See Exhibit (a)
As of the end of the period covered by this report, the registrant has adopted a code of ethics (the “Section 406 Standards for Investment Companies – Ethical Standards for Principal Executive and Financial Officers”) that applies to the registrant’s Principal Executive Officer and Principal Financial Officer; the registrant’s Principal Financial Officer also serves as the Principal Accounting Officer.
The registrant hereby undertakes to provide any person, without charge, upon request, a copy of the code of ethics. To request a copy of the code of ethics, contact the registrant 800-225-1852, and ask for a copy of the Section 406 Standards for Investment Companies - Ethical Standards for Principal Executive and Financial Officers.
Item 3 – Audit Committee Financial Expert –
The registrant’s Board has determined that Mr. Stephen P. Munn, member of the Board’s Audit Committee is an “audit committee financial expert,” and that he is “independent,” for purposes of this Item.
Item 4 – Principal Accountant Fees and Services –
(a) Audit Fees
For the fiscal years ended October 31, 2013 and October 31, 2012, KPMG LLP (“KPMG”), the Registrant’s principal accountant, billed the Registrant $57,000 and $51,000, respectively, for professional services rendered for the audit of the Registrant’s annual financial statements or services that are normally provided in connection with statutory and regulatory filings.
(b) Audit-Related Fees
None.
(c) Tax Fees
Not applicable for the fiscal year ended October 31, 2013. During the fiscal year ended October 31, 2012, KPMG billed the Registrant $357 for professional services rendered in connection with agreed upon procedures performed related to the receipt of payments pursuant to certain fair fund settlement orders.
(d) All Other Fees
None.
(e) (1) Audit Committee Pre-Approval Policies and Procedures
THE PRUDENTIAL MUTUAL FUNDS
AUDIT COMMITTEE POLICY
on
Pre-Approval of Services Provided by the Independent Accountants
The Audit Committee of each Prudential Mutual Fund is charged with the responsibility to monitor the independence of the Fund’s independent accountants. As part of this responsibility, the Audit Committee must pre-approve any independent accounting firm’s engagement to render audit and/or permissible non-audit services, as required by law. In evaluating a proposed engagement of the independent accountants, the Audit Committee will assess the effect that the engagement might reasonably be expected to have on the accountant’s independence. The Committee’s evaluation will be based on:
| | • | | a review of the nature of the professional services expected to be provided, |
| | • | | a review of the safeguards put into place by the accounting firm to safeguard independence, and |
| | • | | periodic meetings with the accounting firm. |
Policy for Audit and Non-Audit Services Provided to the Funds
On an annual basis, the scope of audits for each Fund, audit fees and expenses, and audit-related and non-audit services (and fees proposed in respect thereof) proposed to be performed by the Fund’s independent accountants will be presented by the Treasurer and the independent accountants to the Audit Committee for review and, as appropriate, approval prior to the initiation of such services. Such presentation shall be accompanied by confirmation by both the Treasurer and the independent accountants that the proposed services will not adversely affect the independence of the independent accountants. Proposed services shall be described in sufficient detail to enable the Audit Committee to assess the appropriateness of such services and fees, and the compatibility of the provision of such services with the auditor’s independence. The Committee shall receive periodic reports on the progress of the audit and other services which are approved by the Committee or by the Committee Chair pursuant to authority delegated in this Policy.
The categories of services enumerated under “Audit Services”, “Audit-related Services”, and “Tax Services” are intended to provide guidance to the Treasurer and the independent accountants as to those categories of services which the Committee believes are generally consistent with the independence of the independent accountants and which the Committee (or the Committee Chair) would expect upon the presentation of specific proposals to pre-approve. The enumerated categories are not intended as an exclusive list of audit, audit-related or tax services, which the Committee (or the Committee Chair) would consider for pre-approval.
Audit Services
The following categories of audit services are considered to be consistent with the role of the Fund’s independent accountants:
| | • | | Annual Fund financial statement audits |
| | • | | Seed audits (related to new product filings, as required) |
| | • | | SEC and regulatory filings and consents |
Audit-related Services
The following categories of audit-related services are considered to be consistent with the role of the Fund’s independent accountants:
| | • | | Accounting consultations |
| | • | | Fund merger support services |
| | • | | Agreed Upon Procedure Reports |
| | • | | Other Internal Control Reports |
Individual audit-related services that fall within one of these categories and are not presented to the Audit Committee as part of the annual pre-approval process will be subject to pre-approval by the Committee Chair (or any other Committee member on whom this responsibility has been delegated) so long as the estimated fee for those services does not exceed $50,000.
Tax Services
The following categories of tax services are considered to be consistent with the role of the Fund’s independent accountants:
| | • | | Tax compliance services related to the filing or amendment of the following: |
| | • | | Federal, state and local income tax compliance; and, |
| | • | | Sales and use tax compliance |
| | • | | Timely RIC qualification reviews |
| | • | | Tax distribution analysis and planning |
| | • | | Tax authority examination services |
| | • | | Tax appeals support services |
| | • | | Accounting methods studies |
| | • | | Fund merger support services |
| | • | | Tax consulting services and related projects |
Individual tax services that fall within one of these categories and are not presented to the Audit Committee as part of the annual pre-approval process will be subject to pre-approval by the Committee Chair (or any other Committee member on whom this responsibility has been delegated) so long as the estimated fee for those services does not exceed $50,000.
Other Non-audit Services
Certain non-audit services that the independent accountants are legally permitted to render will be subject to pre-approval by the Committee or by one or more Committee members to whom the Committee has delegated this authority and who will report to the full Committee any pre-
approval decisions made pursuant to this Policy. Non-audit services presented for pre-approval pursuant to this paragraph will be accompanied by a confirmation from both the Treasurer and the independent accountants that the proposed services will not adversely affect the independence of the independent accountants.
Proscribed Services
The Fund’s independent accountants will not render services in the following categories of non-audit services:
| | • | | Bookkeeping or other services related to the accounting records or financial statements of the Fund |
| | • | | Financial information systems design and implementation |
| | • | | Appraisal or valuation services, fairness opinions, or contribution-in-kind reports |
| | • | | Internal audit outsourcing services |
| | • | | Management functions or human resources |
| | • | | Broker or dealer, investment adviser, or investment banking services |
| | • | | Legal services and expert services unrelated to the audit |
| | • | | Any other service that the Public Company Accounting Oversight Board determines, by regulation, is impermissible. |
Pre-approval of Non-Audit Services Provided to Other Entities Within the Prudential Fund Complex
Certain non-audit services provided to Prudential Investments LLC or any of its affiliates that also provide ongoing services to the Prudential Mutual Funds will be subject to pre-approval by the Audit Committee. The only non-audit services provided to these entities that will require pre-approval are those related directly to the operations and financial reporting of the Funds. Individual projects that are not presented to the Audit Committee as part of the annual pre-approval process will be subject to pre-approval by the Committee Chair (or any other Committee member on whom this responsibility has been delegated) so long as the estimated fee for those services does not exceed $50,000. Services presented for pre-approval pursuant to this paragraph will be accompanied by a confirmation from both the Treasurer and the independent accountants that the proposed services will not adversely affect the independence of the independent accountants.
Although the Audit Committee will not pre-approve all services provided to Prudential Investments LLC and its affiliates, the Committee will receive an annual report from the Fund’s independent accounting firm showing the aggregate fees for all services provided to Prudential Investments and its affiliates.
| (e) | (2) Percentage of services referred to in 4(b) – 4(d) that were approved by the audit committee – |
One hundred percent of the services described in Item 4(c) was approved by the audit committee.
(f) Percentage of hours expended attributable to work performed by other than full time employees of principal accountant if greater than 50%.
The percentage of hours expended on the principal accountant’s engagement to audit the registrant’s financial statements for the most recent fiscal year that were attributed to work performed by persons other than the principal accountant’s full-time, permanent employees was 0%.
(g) Non-Audit Fees
Not applicable to Registrant for the fiscal years 2013 and 2012. The aggregate non-audit fees billed by KPMG for services rendered to the registrant’s investment adviser and any entity controlling, controlled by, or under common control with the investment adviser that provides ongoing services to the registrant for the fiscal years 2013 and 2012 was $0 and $0, respectively.
(h) Principal Accountant’s Independence
Not applicable as KPMG has not provided non-audit services to the registrant’s investment adviser and any entity controlling, controlled by, or under common control with the investment adviser that provides ongoing services to the registrant that were not pre-approved pursuant to Rule 2-01(c)(7)(ii) of Regulation S-X.
| | |
| Item 5 – | | Audit Committee of Listed Registrants – Not applicable. |
| |
| Item 6 – | | Schedule of Investments – The schedule is included as part of the report to shareholders filed under Item 1 of this Form. |
| |
| Item 7 – | | Disclosure of Proxy Voting Policies and Procedures for Closed-End Management Investment Companies – Not applicable. |
| |
| Item 8 – | | Portfolio Managers of Closed-End Management Investment Companies – Not applicable. |
| |
| Item 9 – | | Purchases of Equity Securities by Closed-End Management Investment Company and Affiliated Purchasers – Not applicable. |
| |
| Item 10 – | | Submission of Matters to a Vote of Security Holders – Not applicable. |
| |
| Item 11 – | | Controls and Procedures |
| | (a) | It is the conclusion of the registrant’s principal executive officer and principal financial officer that the effectiveness of the registrant’s current disclosure controls and procedures (such disclosure controls and procedures having been evaluated within 90 days of the date of this filing) provide reasonable assurance that the information required to be disclosed by the registrant has been recorded, processed, summarized and reported within the time period specified in the Commission’s rules and forms and that the information required to be disclosed by the registrant has been accumulated and communicated to the registrant’s principal executive officer and principal financial officer in order to allow timely decisions regarding required disclosure. |
| | (b) | There has been no significant change in the registrant’s internal control over financial reporting that occurred during the registrant’s most recent fiscal quarter of the period covered by this report that has materially affected, or is likely to materially affect, the registrant’s internal control over financial reporting. |
Item 12 – Exhibits
| | (a) | (1) Code of Ethics – Attached hereto as Exhibit EX-99.CODE-ETH |
| | (2) | Certifications pursuant to Section 302 of the Sarbanes-Oxley Act – Attached hereto as Exhibit EX-99.CERT. |
| | (3) | Any written solicitation to purchase securities under Rule 23c-1. – Not applicable. |
| | (b) | Certifications pursuant to Section 906 of the Sarbanes-Oxley Act – Attached hereto as Exhibit EX-99.906CERT. |
SIGNATURES
Pursuant to the requirements of the Securities Exchange Act of 1934 and the Investment Company Act of 1940, the registrant has duly caused this report to be signed on its behalf by the undersigned, thereunto duly authorized.
| | |
| Registrant: | | Prudential Investment Portfolios, Inc. 10 |
| |
| By: | | /s/ Deborah A. Docs |
| | Deborah A. Docs |
| | Secretary |
| |
| Date: | | December 19, 2013 |
Pursuant to the requirements of the Securities Exchange Act of 1934 and the Investment Company Act of 1940, this report has been signed below by the following persons on behalf of the registrant and in the capacities and on the dates indicated.
| | |
| By: | | /s/ Stuart S. Parker |
| | Stuart S. Parker |
| | President and Principal Executive Officer |
| |
| Date: | | December 19, 2013 |
| |
| By: | | /s/ Grace C. Torres |
| | Grace C. Torres |
| | Treasurer and Principal Financial Officer |
| |
| Date: | | December 19, 2013 |