UNITED STATES
SECURITIES AND EXCHANGE COMMISSION
Washington, D.C. 20549
FORM N-CSR
CERTIFIED SHAREHOLDER REPORT OF REGISTERED
MANAGEMENT INVESTMENT COMPANIES
| | |
| Investment Company Act file number: | | 811-08085 |
| |
| Exact name of registrant as specified in charter: | | Prudential Investment Portfolios, Inc. 10 |
| |
| Address of principal executive offices: | | Gateway Center 3, 100 Mulberry Street, Newark, New Jersey 07102 |
| |
| Name and address of agent for service: | | Deborah A. Docs Gateway Center 3, 100 Mulberry Street, Newark, New Jersey 07102 |
| |
| Registrant’s telephone number, including area code: | | 800-225-1852 |
| |
| Date of fiscal year end: | | 10/31/2010 |
| |
| Date of reporting period: | | 10/31/2010 |
Item 1 – Reports to Stockholders

| | |
| ANNUAL REPORT | | OCTOBER 31, 2010 |
Prudential Mid-Cap Value Fund
| | | | |
Fund Type Mid-cap stock Objective Capital growth | | | | This report is not authorized for distribution to prospective investors unless preceded or accompanied by a current prospectus. The views expressed in this report and information about the Fund’s portfolio holdings are for the period covered by this report and are subject to change thereafter. Prudential Investments, Prudential, the Prudential logo and the Rock symbol are service marks of Prudential Financial, Inc. and its related entities, registered in many jurisdictions worldwide. |
| | |

| | To enroll in e-delivery, go to www.prudentialfunds.com/edelivery |
December 15, 2010
Dear Shareholder:
We hope you find the annual report for the Prudential Mid-Cap Value Fund informative and useful. Because of ongoing market volatility, we understand that this is a difficult time to be an investor. While it is impossible to predict what the future holds, we continue to believe a prudent response to uncertainty is to maintain a diversified portfolio, including stock and bond mutual funds consistent with your tolerance for risk, time horizon, and financial goals.
A diversified asset allocation offers two potential advantages: It limits your exposure to any particular asset class; plus it provides a better opportunity to invest some of your assets in the right place at the right time. Your financial professional can help you create a diversified investment plan that may include mutual funds covering all the basic asset classes and that reflects your personal investor profile and risk tolerance. Keep in mind that diversification and asset allocation strategies do not assure a profit or protect against loss in declining markets.
Prudential Investments® provides a wide range of mutual funds to choose from that can help you make progress toward your financial goals. Our funds offer the experience, resources, and professional discipline of Prudential Financial’s affiliated asset managers. Most of Prudential Investments’ equity funds are advised by Jennison Associates LLC, Quantitative Management Associates LLC (QMA), or Prudential Real Estate Investors. Prudential Investment Management, Inc. (PIM) advises the Prudential Investments fixed income and money market funds through its Prudential Fixed Income unit. Jennison Associates, QMA, and PIM are registered investment advisers and Prudential Financial companies. Prudential Real Estate Investors is a unit of PIM.
Thank you for choosing the Prudential Investments family of mutual funds.
Sincerely,

Judy A. Rice, President
Prudential Mid-Cap Value Fund
| | | | |
| Prudential Mid-Cap Value Fund | | | 1 | |
Your Fund’s Performance
Performance data quoted represent past performance. Past performance does not guarantee future results. The investment return and principal value of an investment will fluctuate, so that an investor’s shares, when redeemed, may be worth more or less than their original cost. Current performance may be lower or higher than the past performance data quoted. An investor may obtain performance data as of the most recent month-end by visiting our website at www.prudentialfunds.com or by calling (800) 225-1852. Class A and Class L shares have a maximum initial sales charge of 5.50% and 5.75%, respectively. Gross operating expenses: Class A, 1.66%; Class B, 2.36%; Class C, 2.36%; Class L, 1.86%; Class M, 2.36%; Class X, 2.36%; Class Z, 1.36%. Net operating expenses: Class A, 1.61%; Class B, 2.36%; Class C, 2.36%; Class L, 1.86%; Class M, 1.61%; Class X, 1.61%; Class Z, 1.36%, after contractual reduction for Class A through 2/29/2012.
| | | | | | | | | | | | | | | | |
Cumulative Total Returns (Without Sales Charges) as of 10/31/10 | |
| | | One Year | | | Five Years | | | Ten Years | | | Since Inception | |
Class A | | | 24.14 | % | | | 17.16 | % | | | N/A | | | | 39.74% (4/12/04) | |
Class B | | | 23.20 | | | | 12.93 | | | | N/A | | | | 33.03 (4/12/04) | |
Class C | | | 23.27 | | | | 12.93 | | | | 72.16 | % | | | — | |
Class L | | | 23.75 | | | | 15.60 | | | | 80.71 | | | | — | |
Class M | | | 24.19 | | | | 15.96 | | | | 76.78 | | | | — | |
Class X | | | 24.15 | | | | 17.89 | | | | 79.60 | | | | — | |
Class Z | | | 24.43 | | | | N/A | | | | N/A | | | | 13.17 (11/28/05) | |
Russell Midcap Value Index | | | 27.49 | | | | 18.11 | | | | 115.86 | | | | — | |
Russell Midcap Index | | | 27.71 | | | | 21.73 | | | | 69.51 | | | | — | |
S&P MidCap 400 Index | | | 27.64 | | | | 27.21 | | | | 81.12 | | | | — | |
Lipper Average | | | 22.77 | | | | 17.27 | | | | 99.25 | | | | — | |
| | | | | | | | | | | | | | | | |
Average Annual Total Returns (With Sales Charges) as of 9/30/10 | |
| | | One Year | | | Five Years | | | Ten Years | | | Since Inception | |
Class A | | | 8.29 | % | | | 0.08 | % | | | N/A | | | | 3.74% (4/12/04) | |
Class B | | | 8.83 | | | | 0.38 | | | | N/A | | | | 3.87 (4/12/04) | |
Class C | | | 12.76 | | | | 0.48 | | | | 5.24 | % | | | — | |
Class L | | | 7.78 | | | | –0.22 | | | | 5.13 | | | | — | |
Class M | | | 8.72 | | | | 0.79 | | | | 5.51 | | | | — | |
Class X | | | 8.73 | | | | 1.01 | | | | 5.68 | | | | — | |
Class Z | | | 14.92 | | | | N/A | | | | N/A | | | | 1.74 (11/28/05) | |
Russell Midcap Value Index | | | 16.93 | | | | 1.97 | | | | 7.80 | | | | — | |
Russell Midcap Index | | | 17.54 | | | | 2.60 | | | | 4.86 | | | | — | |
S&P MidCap 400 Index | | | 17.78 | | | | 3.77 | | | | 5.40 | | | | — | |
Lipper Average | | | 13.96 | | | | 1.83 | | | | 6.82 | | | | — | |
| | |
| 2 | | Visit our website at www.prudentialfunds.com |
| | | | | | | | | | | | | | | | |
Average Annual Total Returns (With Sales Charges) as of 10/31/10 | |
| | | One Year | | | Five Year | | | Ten Years | | | Since Inception | |
Class A | | | 17.31 | % | | | 2.06 | % | | | N/A | | | | 4.33% (4/12/04) | |
Class B | | | 18.20 | | | | 2.35 | | | | N/A | | | | 4.45 (4/12/04) | |
Class C | | | 22.27 | | | | 2.46 | | | | 5.58 | % | | | — | |
Class L | | | 16.64 | | | | 1.73 | | | | 5.47 | | | | — | |
Class M | | | 18.19 | | | | 2.78 | | | | 5.86 | | | | — | |
Class X | | | 18.15 | | | | 3.01 | | | | 6.03 | | | | — | |
Class Z | | | 24.43 | | | | N/A | | | | N/A | | | | 2.55 (11/28/05) | |
| | | | | | | | | | | | | | | | |
Average Annual Total Returns (Without Sales Charges) as of 10/31/10 | |
| | | One Year | | | Five Years | | | Ten Years | | | Since Inception | |
Class A | | | 24.14 | % | | | 3.22 | % | | | N/A | | | | 5.24% (4/12/04) | |
Class B | | | 23.20 | | | | 2.46 | | | | N/A | | | | 4.45 (4/12/04) | |
Class C | | | 23.27 | | | | 2.46 | | | | 5.58 | % | | | — | |
Class L | | | 23.75 | | |
| 2.94
|
| | | 6.10 | | | | — | |
Class M | | | 24.19 | | | | 3.01 | | | | 5.86 | | | | — | |
Class X | | | 24.15 | | | | 3.35 | | | | 6.03 | | | | — | |
Class Z | | | 24.43 | | | | N/A | | | | N/A | | | | 2.55 (11/28/05) | |
Growth of a $10,000 Investment
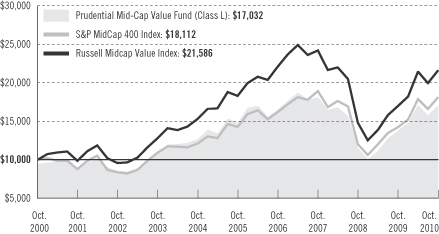
The graph compares a $10,000 investment in the Prudential Mid-Cap Value Fund (Class L shares) with a similar investment in the S&P MidCap 400 Index and Russell Midcap Value Index by portraying the initial account values
| | | | |
| Prudential Mid-Cap Value Fund | | | 3 | |
Your Fund’s Performance (continued)
at the beginning of the 10-year period for Class L shares (October 31, 2000) and the account values at the end of the current fiscal year (October 31, 2010) as measured on a quarterly basis. The Russell Midcap Value Index data is measured from the closest month-end to inception date and not from the Fund’s actual inception date. For purposes of the graph, and unless otherwise indicated, it has been assumed that (a) the maximum applicable front-end sales charge was deducted from the initial $10,000 investment in Class L shares; (b) all recurring fees (including management fees) were deducted; and (c) all dividends and distributions were reinvested. The line graph provides information for Class L shares only. As indicated in the tables above, performance for Class A, Class B, Class C, Class M, Class X, and Class Z shares will vary due to the differing charges and expenses applicable to each share class (as indicated in the following paragraphs).
Source: Prudential Investments LLC and Lipper Inc. Performance figures may reflect fee waivers and/or expense reimbursements. In the absence of such fee waivers and/or expense reimbursements, total returns would be lower.
Inception returns are provided for any share class with less than 10 calendar years of returns.
The average annual total returns take into account applicable sales charges. Class A and Class L shares are subject to a maximum front-end sales charge of 5.50% and 5.75%, respectively. Class L, Class M, and Class X shares are closed to most new purchases (with the exception of reinvested dividends and purchases by certain college savings plans). Under certain circumstances, Class A and Class L shares may be subject to a contingent deferred sales charge (CDSC) of 1%. Class B, Class C, Class M, and Class X shares are subject to a maximum CDSC of 5%, 1%, 6%, and 6%, respectively. Class A shares are subject to a 12b-1 fee of up to 0.30% annually. Class B, Class C, Class M, and Class X shares are subject to a 12b-1 fee of 1%. Class L shares are subject to a 12b-1 fee of 0.50%. Class Z shares are not subject to a 12b-1 fee. Prior to April 12, 2004, Class L shares were known as Class A shares. On April 12, 2004, Class A shares were redesignated as Class L shares and a new Class A was opened. Prior to April 12, 2004, Class M shares were known as Class B shares. On April 12, 2004, Class B shares were redesignated as Class M shares and a new Class B was opened. The returns in the graph and the tables do not reflect the deduction of taxes that a shareholder would pay on Fund distributions or following the redemption of Fund shares. Without a distribution and service (12b-1) fee waiver of 0.05% for Class A shares, the returns would have been lower.
Benchmark Definitions
Russell Midcap Value
The Russell Midcap Value Index is an unmanaged index which measures the performance of those Russell Midcap companies with lower price-to-book ratios and lower forecasted growth values. The stocks are also members of the Russell 1000 Value Index. Russell Midcap Value Index Closest Month-End to Inception cumulative total returns as of 10/31/10 are 49.95% for Class A and Class B; and 14.08% for Class Z. Russell Midcap Value Index Closest Month-End to Inception average annual total returns as of 9/30/10 are 5.76% for Class A and Class B; and 1.97% for Class Z.
Russell Midcap Index
The Russell Midcap Index is an unmanaged index which measures the performance of the 800 smallest companies in the Russell 1000 Index, which represent approximately 25% of the total market capitalization of the Russell 1000 Index. Russell Midcap Index Closest Month-End to Inception cumulative total returns as of 10/31/10 are 48.60% for Class A and Class B; and 16.56% for Class Z. Russell Midcap Index Closest Month-End to Inception average annual total returns as of 9/30/10 are 5.66% for Class A and Class B; and 2.41% for Class Z.
| | |
| 4 | | Visit our website at www.prudentialfunds.com |
Standard & Poor’s MidCap 400 Stock Index
The Standard & Poor’s MidCap 400 Stock Index (S&P MidCap 400 Index) is an unmanaged index of 400 domestic stocks chosen for market capitalization, liquidity, and industry group representation. It gives a broad look at how U.S. mid-cap stock prices have performed. S&P MidCap 400 Index Closest Month-End to Inception cumulative total returns as of 10/31/10 are 50.31% for Class A and Class B; and 21.28% for Class Z. S&P MidCap 400 Index Closest Month-End to Inception average annual total returns as of 9/30/10 are 5.92% for Class A and Class B; and 3.35% for Class Z.
Lipper Mid-Cap Value Funds Average
Funds in the Lipper Mid-Cap Value Funds Average (Lipper Average), by portfolio practice, invest at least 75% of their equity assets in companies with market capitalizations (on a three-year weighted basis) less than 300% of the dollar-weighted median market capitalization of the middle 1,000 securities of the S&P SuperComposite 1500 Index. Mid-cap value funds typically have a below-average price-to-earnings ratio, price-to-book ratio, and three-year sales-per-share growth value compared with the companies in the S&P MidCap 400 Index. Lipper Average Closest Month-End to Inception cumulative total returns as of 10/31/10 are 40.34% for Class A and Class B; and 12.40% for Class Z. Lipper Average Closest Month-End to Inception average annual total returns as of 9/30/10 are 4.79% for Class A and Class B; and 1.71% for Class Z.
Investors cannot invest directly in an index or average. The returns for the Russell Midcap Value Index, the Russell Midcap Index, and the S&P MidCap 400 Index would be lower if they included the effects of sales charges, operating expenses of a mutual fund, or taxes. Returns for the Lipper Average reflect the deduction of operating expenses, but not sales charges or taxes.
| | | | |
Five Largest Holdings expressed as a percentage of net assets as of 10/31/10 | | | | |
Xerox Corp., Office Electronics | | | 1.2 | % |
Century Link, Inc., Diversified Telecommunication Services | | | 1.1 | |
Edison International, Electric Utilities | | | 1.1 | |
Murphy Oil Corp., Oil, Gas & Consumable Fuels | | | 1.0 | |
Host Hotels & Resorts, Inc., Real Estate Investment Trusts | | | 1.0 | |
Holdings reflect only long-term investments and are subject to change.
| | | | |
| Prudential Mid-Cap Value Fund | | | 5 | |
Strategy and Performance Overview
How did the Fund perform?
The Prudential Mid-Cap Value Fund Class A shares gained 24.14% for the 12-month reporting period ended October 31, 2010, underperforming the 27.49% gain of the Russell Midcap® Value Index (the Index) but outperforming the 22.77% gain of the Lipper Mid-Cap Value Funds Average.
How is the Fund managed?
Quantitative Management Associates LLC (QMA) manages the Fund, which invests in a diversified portfolio of stocks that are out of favor and inexpensive based on price-to-earnings ratios and other value measures. Historically, value stocks have outperformed broad stock market averages. Constraints are placed on the portfolio with regard to sector, industry, and individual security weighting to reduce risk relative to the Index.
What were conditions like in the mid-cap segment of the U.S. stock market?
Stocks of medium-size companies significantly outperformed stocks of large companies for the reporting period as measured by Russell U.S. indexes. This occurred as increased activity in mergers and acquisitions helped shares of small and medium-size companies (both of which are often takeover targets) gain more than shares of large companies. Also, earnings growth for small- and mid-cap stocks is typically stronger than that of large-cap stocks as the U.S. economy climbs out of recessions. The most recent recession in the United States ended in June 2009, though the economy continues to battle high unemployment.
How did the various sectors perform?
All 10 sectors of the Index posted double-digit gains for the reporting period. The telecommunications, consumer discretionary, and materials sectors outperformed the Index. The remaining seven sectors—industrials, information technology, utilities, consumer staples, healthcare, energy, and financials—scored gains that ranged from 22.90% to 26.22%.
What aspects of sector allocation and stock selection contributed most to performance?
The primary contributors to the Fund’s performance were its strong stock selection in the healthcare and materials sectors. Within healthcare, Hill-Rom Holdings, a manufacturer of hospital beds, was a standout. Despite a challenging environment for spending on healthcare capital equipment, Hill-Rom’s earnings continued to beat expectations, driven by the benefits of its restructuring initiatives. Among pharmaceutical companies, an overweight in Endo Pharmaceuticals, a drug company specializing in pain management, also helped performance. Endo’s stock gained strongly as investors reacted favorably to recent strategic acquisitions that have strengthened the company’s longer-term growth prospects.
| | |
| 6 | | Visit our website at www.prudentialfunds.com |
Among healthcare providers, the Fund’s timely sale of Lincare Holdings, a leading player in the in-home oxygen business, contributed to its performance. As the reporting period progressed, Lincare stock began to trend lower due to growing investor concern about the effect on earnings growth of potential reimbursement cuts and the introduction of competitive bidding.
Favorable security selection among stocks in the materials sector also helped the Fund’s performance. Within the metals industry, the Fund benefited from the timely sale of its shares of U.S. Steel. After a strong performance in late 2009, U. S. Steel and other steel-company stocks weakened in early 2010 as an expected recovery in earnings growth failed to materialize due to sluggish demand and rising materials costs.
The Fund had a larger exposure than the Index to Carpenter Technology, which helped its results as the manufacturer of specialty metals turned in above-consensus earnings. Carpenter’s major markets, which are commercial aerospace and energy, have been more robust, despite the muted economic recovery. The Fund also benefited from avoiding shares of Vulcan Materials, whose earnings were hurt by the delayed turn in the residential and commercial construction markets.
What aspects of sector allocation and stock selection subtracted most from performance?
The Fund’s performance was penalized by adverse selection within the industrials, utilities, and energy sectors. In industrials, the Fund was hurt by having a larger exposure than the Index to R.R. Donnelley and Pitney Bowes, two commercial services stocks that declined during the reporting period. Earnings of Donnelley, a global printer heavily sensitive to business and consumer spending, have been depressed by unfavorable developments in the foreign exchange markets and weak end markets. Earnings expectations have also been reduced for Pitney Bowes, a provider of mail-processing equipment, reflecting ongoing weakness in the small business and international markets. In the machinery industry, not holding Cummins, an engine manufacturer whose stock more than doubled in price during the reporting period, penalized the Fund’s performance.
��
In the utilities sector, having a larger exposure than the Index to independent power producers hurt the Fund’s performance. Holdings in Mirant Corp. and AES Corp. were the primary detractors as earnings of both companies were pressured by falling natural gas prices.
In the energy sector, the Fund had a larger exposure to the equipment and services industry than to the stronger-performing exploration and production segment. This hurt the Fund’s results.
The Portfolio of Investments following this report shows the size of the Fund’s positions at period-end.
| | | | |
| Prudential Mid-Cap Value Fund | | | 7 | |
Fees and Expenses (Unaudited)
As a shareholder of the Fund, you incur two types of costs: (1) transaction costs, including sales charges (loads) on purchase payments and redemptions, as applicable, and (2) ongoing costs, including management fees, distribution and/or service (12b-1) fees, and other Fund expenses, as applicable. This example is intended to help you understand your ongoing costs (in dollars) of investing in the Fund and to compare these costs with the ongoing costs of investing in other mutual funds.
The example is based on an investment of $1,000 invested on May 1, 2010, at the beginning of the period, and held through the six-month period ended October 31, 2010. The example is for illustrative purposes only; you should consult the Prospectus for information on initial and subsequent minimum investment requirements.
The Fund’s transfer agent may charge additional fees to holders of certain accounts that are not included in the expenses shown in the table on the following page. These fees apply to individual retirement accounts (IRAs) and Section 403(b) accounts. As of the close of the six-month period covered by the table, IRA fees included an annual maintenance fee of $15 per account (subject to a maximum annual maintenance fee of $25 for all accounts held by the same shareholder). Section 403(b) accounts are charged an annual $25 fiduciary maintenance fee. Some of the fees may vary in amount, or may be waived, based on your total account balance or the number of Prudential Investments funds, including the Fund, that you own. You should consider the additional fees that were charged to your Fund account over the six-month period when you estimate the total ongoing expenses paid over the period and the impact of these fees on your ending account value, as these additional expenses are not reflected in the information provided in the expense table. Additional fees have the effect of reducing investment returns.
Actual Expenses
The first line for each share class in the table on the following page provides information about actual account values and actual expenses. You may use the information on this line, together with the amount you invested, to estimate the expenses that you paid over the period. Simply divide your account value by $1,000 (for example, an $8,600 account value ÷ $1,000 = 8.6), then multiply the result by the number on the first line under the heading “Expenses Paid During the Six-Month Period” to estimate the expenses you paid on your account during this period.
Hypothetical Example for Comparison Purposes
The second line for each share class in the table on the following page provides information about hypothetical account values and hypothetical expenses based on the Fund’s actual expense ratio and an assumed rate of return of 5% per year before expenses, which is not the Fund’s actual return. The hypothetical account values and
| | |
| 8 | | Visit our website at www.prudentialfunds.com |
expenses may not be used to estimate the actual ending account balance or expenses you paid for the period. You may use this information to compare the ongoing costs of investing in the Fund and other funds. To do so, compare this 5% hypothetical example with the 5% hypothetical examples that appear in the shareholder reports of the other funds.
Please note that the expenses shown in the table are meant to highlight your ongoing costs only and do not reflect any transactional costs such as sales charges (loads). Therefore, the second line for each share class in the table is useful in comparing ongoing costs only and will not help you determine the relative total costs of owning different funds. In addition, if these transactional costs were included, your costs would have been higher.
| | | | | | | | | | | | | | | | | | |
Prudential Mid-Cap
Value Fund | | Beginning Account
Value
May 1, 2010 | | | Ending Account
Value
October 31, 2010 | | | Annualized
Expense Ratio
Based on the
Six-Month Period | | | Expenses Paid
During the
Six-Month Period* | |
| | | | | | | | | | | | | | | | | | |
| Class A | | Actual | | $ | 1,000.00 | | | $ | 1,001.50 | | | | 1.65 | % | | $ | 8.32 | |
| | | Hypothetical | | $ | 1,000.00 | | | $ | 1,016.89 | | | | 1.65 | % | | $ | 8.39 | |
| | | | | | | | | | | | | | | | | | |
| Class B | | Actual | | $ | 1,000.00 | | | $ | 997.50 | | | | 2.40 | % | | $ | 12.08 | |
| | | Hypothetical | | $ | 1,000.00 | | | $ | 1,013.11 | | | | 2.40 | % | | $ | 12.18 | |
| | | | | | | | | | | | | | | | | | |
| Class C | | Actual | | $ | 1,000.00 | | | $ | 997.50 | | | | 2.40 | % | | $ | 12.08 | |
| | | Hypothetical | | $ | 1,000.00 | | | $ | 1,013.11 | | | | 2.40 | % | | $ | 12.18 | |
| | | | | | | | | | | | | | | | | | |
| Class L | | Actual | | $ | 1,000.00 | | | $ | 999.20 | | | | 1.90 | % | | $ | 9.57 | |
| | | Hypothetical | | $ | 1,000.00 | | | $ | 1,015.63 | | | | 1.90 | % | | $ | 9.65 | |
| | | | | | | | | | | | | | | | | | |
| Class M | | Actual | | $ | 1,000.00 | | | $ | 1,000.80 | | | | 1.65 | % | | $ | 8.32 | |
| | | Hypothetical | | $ | 1,000.00 | | | $ | 1,016.89 | | | | 1.65 | % | | $ | 8.39 | |
| | | | | | | | | | | | | | | | | | |
| Class X | | Actual | | $ | 1,000.00 | | | $ | 1,000.80 | | | | 1.65 | % | | $ | 8.32 | |
| | | Hypothetical | | $ | 1,000.00 | | | $ | 1,016.89 | | | | 1.65 | % | | $ | 8.39 | |
| | | | | | | | | | | | | | | | | | |
| Class Z | | Actual | | $ | 1,000.00 | | | $ | 1,002.30 | | | | 1.40 | % | | $ | 7.07 | |
| | | Hypothetical | | $ | 1,000.00 | | | $ | 1,018.15 | | | | 1.40 | % | | $ | 7.12 | |
* Fund expenses (net of fee waivers or subsidies, if any) for each share class are equal to the annualized expense ratio for each share class (provided in the table), multiplied by the average account value over the period, multiplied by the 184 days in the six-month period ended October 31, 2010, and divided by the 365 days in the Fund’s fiscal year ended October 31, 2010 (to reflect the six-month period). Expenses presented in the table include the expenses of any underlying portfolios in which the Fund may invest.
| | | | |
| Prudential Mid-Cap Value Fund | | | 9 | |
Portfolio of Investments
as of October 31, 2010
| | | | | | | | |
| | | Shares | | | Value (Note 2) | |
| | | | | | | | |
LONG-TERM INVESTMENTS 98.4% | | | | | | | | |
| | |
COMMON STOCKS | | | | | | | | |
| | |
Aerospace & Defense 1.1% | | | | | | | | |
Alliant Techsystems, Inc.* | | | 500 | | | $ | 38,120 | |
ITT Corp. | | | 11,400 | | | | 537,966 | |
L-3 Communications Holdings, Inc. | | | 14,200 | | | | 1,025,098 | |
| | | | | | | | |
| | | | | | | 1,601,184 | |
| | | | | | | | |
| | |
Auto Components 0.7% | | | | | | | | |
Autoliv, Inc. | | | 12,000 | | | | 855,600 | |
Goodyear Tire & Rubber Co. (The)* | | | 21,600 | | | | 220,752 | |
| | | | | | | | |
| | | | | | | 1,076,352 | |
| | | | | | | | |
| | |
Beverages 1.0% | | | | | | | | |
Coca-Cola Enterprises, Inc. | | | 25,100 | | | | 602,651 | |
Constellation Brands, Inc. (Class A Stock)* | | | 45,000 | | | | 887,850 | |
| | | | | | | | |
| | | | | | | 1,490,501 | |
| | | | | | | | |
| | |
Biotechnology 0.4% | | | | | | | | |
Cephalon, Inc.* | | | 8,200 | | | | 544,808 | |
| | | | | | | | |
| | |
Capital Markets 1.5% | | | | | | | | |
Ameriprise Financial, Inc. | | | 25,800 | | | | 1,333,602 | |
Raymond James Financial, Inc. | | | 28,000 | | | | 790,160 | |
| | | | | | | | |
| | | | | | | 2,123,762 | |
| | | | | | | | |
| | |
Chemicals 2.5% | | | | | | | | |
Ashland, Inc. | | | 17,700 | | | | 913,851 | |
Celanese Corp. (Class A Stock) | | | 14,600 | | | | 520,490 | |
Cytec Industries, Inc. | | | 15,900 | | | | 787,368 | |
Eastman Chemical Co. | | | 3,200 | | | | 251,424 | |
PPG Industries, Inc. | | | 13,800 | | | | 1,058,460 | |
| | | | | | | | |
| | | | | | | 3,531,593 | |
| | | | | | | | |
| | |
Commercial Banks 2.4% | | | | | | | | |
Bank of Hawaii Corp. | | | 13,600 | | | | 587,384 | |
City National Corp. | | | 3,400 | | | | 175,338 | |
Comerica, Inc. | | | 7,700 | | | | 275,506 | |
Commerce Bancshares, Inc. | | | 16,900 | | | | 622,596 | |
See Notes to Financial Statements.
| | | | |
| Prudential Mid-Cap Value Fund | | | 11 | |
Portfolio of Investments
as of October 31, 2010 continued
| | | | | | | | |
| | | Shares | | | Value (Note 2) | |
| | | | | | | | |
COMMON STOCKS (Continued) | | | | | | | | |
| | |
Commercial Banks (cont’d.) | | | | | | | | |
Fifth Third Bancorp | | | 30,700 | | | $ | 385,592 | |
M&T Bank Corp.(a) | | | 11,800 | | | | 882,050 | |
TCF Financial Corp. | | | 44,800 | | | | 589,568 | |
| | | | | | | | |
| | | | | | | 3,518,034 | |
| | | | | | | | |
| | |
Commercial Services & Supplies 2.0% | | | | | | | | |
Avery Dennison Corp. | | | 23,400 | | | | 850,590 | |
Cintas Corp.(a) | | | 27,200 | | | | 747,184 | |
Pitney Bowes, Inc.(a) | | | 25,200 | | | | 552,888 | |
RR Donnelley & Sons Co. | | | 38,900 | | | | 717,705 | |
| | | | | | | | |
| | | | | | | 2,868,367 | |
| | | | | | | | |
| | |
Communications Equipment 0.6% | | | | | | | | |
CommScope, Inc.*(a) | | | 19,400 | | | | 614,204 | |
Harris Corp. | | | 6,000 | | | | 271,140 | |
| | | | | | | | |
| | | | | | | 885,344 | |
| | | | | | | | |
| | |
Computers & Peripherals 1.6% | | | | | | | | |
Diebold, Inc.(a) | | | 5,100 | | | | 156,315 | |
Lexmark International, Inc. (Class A Stock)* | | | 21,700 | | | | 825,251 | |
NCR Corp.* | | | 24,900 | | | | 341,628 | |
Seagate Technology PLC (Ireland)* | | | 29,500 | | | | 432,175 | |
Western Digital Corp.* | | | 16,800 | | | | 537,936 | |
| | | | | | | | |
| | | | | | | 2,293,305 | |
| | | | | | | | |
| | |
Construction & Engineering 0.2% | | | | | | | | |
Chicago Bridge & Iron Co. NV (Netherlands)* | | | 12,600 | | | | 317,646 | |
| | | | | | | | |
| | |
Consumer Finance 1.2% | | | | | | | | |
Discover Financial Services | | | 46,700 | | | | 824,255 | |
SLM Corp.* | | | 73,300 | | | | 872,270 | |
| | | | | | | | |
| | | | | | | 1,696,525 | |
| | | | | | | | |
| | |
Containers & Packaging 1.2% | | | | | | | | |
Owens-Illinois, Inc.* | | | 21,300 | | | | 597,039 | |
Sealed Air Corp. | | | 40,400 | | | | 935,260 | |
Sonoco Products Co. | | | 6,700 | | | | 224,450 | |
| | | | | | | | |
| | | | | | | 1,756,749 | |
| | | | | | | | |
See Notes to Financial Statements.
| | |
| 12 | | Visit our website at www.prudentialfunds.com |
| | | | | | | | |
| | | Shares | | | Value (Note 2) | |
| | | | | | | | |
COMMON STOCKS (Continued) | | | | | | | | |
| | |
Diversified Consumer Services 1.0% | | | | | | | | |
H&R Block, Inc. | | | 44,000 | | | $ | 518,760 | |
Service Corp. International | | | 59,700 | | | | 494,316 | |
Weight Watchers International, Inc. | | | 14,300 | | | | 478,907 | |
| | | | | | | | |
| | | | | | | 1,491,983 | |
| | | | | | | | |
| | |
Diversified Financial Services 0.6% | | | | | | | | |
NASDAQ OMX Group, Inc. (The)* | | | 43,600 | | | | 916,472 | |
| | | | | | | | |
| | |
Diversified Telecommunication Services 2.3% | | | | | | | | |
CenturyLink, Inc.(a) | | | 39,891 | | | | 1,650,689 | |
Frontier Communications Corp. | | | 91,600 | | | | 804,248 | |
Windstream Corp. | | | 67,800 | | | | 858,348 | |
| | | | | | | | |
| | | | | | | 3,313,285 | |
| | | | | | | | |
| | |
Electric Utilities 4.5% | | | | | | | | |
Allegheny Energy, Inc. | | | 22,700 | | | | 526,640 | |
American Electric Power Co., Inc. | | | 8,000 | | | | 299,520 | |
Edison International | | | 42,000 | | | | 1,549,800 | |
FirstEnergy Corp.(a) | | | 21,100 | | | | 766,352 | |
Northeast Utilities | | | 11,000 | | | | 344,080 | |
NV Energy, Inc. | | | 28,000 | | | | 382,480 | |
Pepco Holdings, Inc.(a) | | | 22,100 | | | | 425,646 | |
Pinnacle West Capital Corp. | | | 8,800 | | | | 362,208 | |
PPL Corp. | | | 42,900 | | | | 1,154,010 | |
Progress Energy, Inc. | | | 13,900 | | | | 625,500 | |
| | | | | | | | |
| | | | | | | 6,436,236 | |
| | | | | | | | |
| | |
Electrical Equipment 1.1% | | | | | | | | |
General Cable Corp.* | | | 5,200 | | | | 145,288 | |
Hubbell, Inc. (Class B Stock) | | | 13,000 | | | | 702,260 | |
Thomas & Betts Corp.* | | | 16,100 | | | | 701,155 | |
| | | | | | | | |
| | | | | | | 1,548,703 | |
| | | | | | | | |
| | |
Electronic Equipment & Instruments 1.6% | | | | | | | | |
Arrow Electronics, Inc.* | | | 23,200 | | | | 686,952 | |
Avnet, Inc.* | | | 26,800 | | | | 798,104 | |
Jabil Circuit, Inc. | | | 30,700 | | | | 470,938 | |
See Notes to Financial Statements.
| | | | |
| Prudential Mid-Cap Value Fund | | | 13 | |
Portfolio of Investments
as of October 31, 2010 continued
| | | | | | | | |
| | | Shares | | | Value (Note 2) | |
| | | | | | | | |
COMMON STOCKS (Continued) | | | | | | | | |
| | |
Electronic Equipment & Instruments (cont’d.) | | | | | | | | |
Vishay Intertechnology, Inc.* | | | 27,200 | | | $ | 307,360 | |
| | | | | | | | |
| | | | | | | 2,263,354 | |
| | | | | | | | |
| | |
Energy Equipment & Services 4.1% | | | | | | | | |
Atwood Oceanics, Inc.* | | | 7,300 | | | | 237,323 | |
Diamond Offshore Drilling, Inc. | | | 6,000 | | | | 396,960 | |
Helmerich & Payne, Inc.(a) | | | 8,900 | | | | 380,742 | |
McDermott International, Inc. (Panama)* | | | 15,400 | | | | 237,622 | |
Nabors Industries Ltd. (Bermuda)* | | | 43,300 | | | | 904,970 | |
Oil States International, Inc.* | | | 8,100 | | | | 414,072 | |
Patterson-UTI Energy, Inc. | | | 19,600 | | | | 380,436 | |
Pride International, Inc.* | | | 10,000 | | | | 303,200 | |
Rowan Cos., Inc.*(a) | | | 22,000 | | | | 723,800 | |
SEACOR Holdings, Inc.* | | | 7,700 | | | | 729,575 | |
Superior Energy Services, Inc.* | | | 23,600 | | | | 651,832 | |
Tidewater, Inc. | | | 12,900 | | | | 595,077 | |
| | | | | | | | |
| | | | | | | 5,955,609 | |
| | | | | | | | |
| | |
Exchange Traded Fund 0.7% | | | | | | | | |
iShares Russell Midcap Value Index Fund | | | 23,300 | | | | 976,969 | |
| | | | | | | | |
| | |
Food & Staples Retailing 1.5% | | | | | | | | |
Kroger Co. (The) | | | 14,300 | | | | 314,600 | |
Safeway, Inc. | | | 54,300 | | | | 1,243,470 | |
SUPERVALU, Inc.(a) | | | 58,100 | | | | 626,899 | |
| | | | | | | | |
| | | | | | | 2,184,969 | |
| | | | | | | | |
| | |
Food Products 3.2% | | | | | | | | |
ConAgra Foods, Inc. | | | 47,800 | | | | 1,075,022 | |
Corn Products International, Inc. | | | 20,900 | | | | 889,295 | |
Dean Foods Co.* | | | 33,700 | | | | 350,480 | |
Del Monte Foods Co. | | | 56,500 | | | | 810,210 | |
Sara Lee Corp. | | | 61,500 | | | | 881,295 | |
Tyson Foods, Inc. (Class A Stock) | | | 43,600 | | | | 677,980 | |
| | | | | | | | |
| | | | | | | 4,684,282 | |
| | | | | | | | |
| | |
Gas Utilities 2.2% | | | | | | | | |
Atmos Energy Corp. | | | 23,000 | | | | 677,350 | |
See Notes to Financial Statements.
| | |
| 14 | | Visit our website at www.prudentialfunds.com |
| | | | | | | | |
| | | Shares | | | Value (Note 2) | |
| | | | | | | | |
COMMON STOCKS (Continued) | | | | | | | | |
| | |
Gas Utilities (cont’d.) | | | | | | | | |
Energen Corp. | | | 15,500 | | | $ | 691,920 | |
ONEOK, Inc. | | | 13,700 | | | | 682,534 | |
Questar Corp. | | | 32,800 | | | | 556,616 | |
UGI Corp. | | | 18,500 | | | | 556,665 | |
| | | | | | | | |
| | | | | | | 3,165,085 | |
| | | | | | | | |
| | |
Healthcare Equipment & Supplies 1.1% | | | | | | | | |
Beckman Coulter, Inc. | | | 6,500 | | | | 346,060 | |
Cooper Cos., Inc. (The)(a) | | | 7,900 | | | | 389,786 | |
Kinetic Concepts, Inc.* | | | 17,300 | | | | 657,919 | |
Teleflex, Inc.(a) | | | 3,900 | | | | 217,425 | |
| | | | | | | | |
| | | | | | | 1,611,190 | |
| | | | | | | | |
| | |
Healthcare Providers & Services 4.0% | | | | | | | | |
Aetna, Inc. | | | 14,700 | | | | 438,942 | |
CIGNA Corp. | | | 35,300 | | | | 1,242,207 | |
Community Health Systems, Inc.* | | | 14,800 | | | | 445,184 | |
Coventry Health Care, Inc.* | | | 32,600 | | | | 763,492 | |
Health Net, Inc.* | | | 23,200 | | | | 623,848 | |
Humana, Inc.* | | | 19,100 | | | | 1,113,339 | |
LifePoint Hospitals, Inc.* | | | 15,100 | | | | 512,192 | |
Omnicare, Inc.(a) | | | 23,300 | | | | 561,996 | |
| | | | | | | | |
| | | | | | | 5,701,200 | |
| | | | | | | | |
| | |
Hotels, Restaurants & Leisure 1.6% | | | | | | | | |
Brinker International, Inc.(a) | | | 23,200 | | | | 430,128 | |
Darden Restaurants, Inc. | | | 9,600 | | | | 438,816 | |
Royal Caribbean Cruises Ltd. (Liberia)*(a) | | | 19,000 | | | | 751,260 | |
Wyndham Worldwide Corp.(a) | | | 21,800 | | | | 626,750 | |
| | | | | | | | |
| | | | | | | 2,246,954 | |
| | | | | | | | |
| | |
Household Durables 2.9% | | | | | | | | |
Fortune Brands, Inc.(a) | | | 19,500 | | | | 1,053,975 | |
Garmin Ltd. (Switzerland)(a) | | | 22,100 | | | | 725,764 | |
Jarden Corp. | | | 18,900 | | | | 605,934 | |
Mohawk Industries, Inc.* | | | 9,600 | | | | 550,464 | |
Newell Rubbermaid, Inc. | | | 43,900 | | | | 774,835 | |
Whirlpool Corp.(a) | | | 6,800 | | | | 515,644 | |
| | | | | | | | |
| | | | | | | 4,226,616 | |
| | | | | | | | |
See Notes to Financial Statements.
| | | | |
| Prudential Mid-Cap Value Fund | | | 15 | |
Portfolio of Investments
as of October 31, 2010 continued
| | | | | | | | |
| | | Shares | | | Value (Note 2) | |
| | | | | | | | |
COMMON STOCKS (Continued) | | | | | | | | |
| | |
Household Products 0.6% | | | | | | | | |
Energizer Holdings, Inc.* | | | 11,400 | | | $ | 852,492 | |
| | | | | | | | |
| | |
Independent Power Producers & Energy Traders 1.7% | | | | | | | | |
AES Corp. (The)* | | | 51,800 | | | | 618,492 | |
Constellation Energy Group, Inc. | | | 15,900 | | | | 480,816 | |
Mirant Corp.* | | | 39,400 | | | | 418,034 | |
NRG Energy, Inc.* | | | 46,100 | | | | 917,851 | |
| | | | | | | | |
| | | | | | | 2,435,193 | |
| | | | | | | | |
| | |
Industrial Conglomerates 0.9% | | | | | | | | |
Carlisle Cos., Inc.(a) | | | 17,700 | | | | 620,739 | |
Textron, Inc.(a) | | | 34,800 | | | | 724,536 | |
| | | | | | | | |
| | | | | | | 1,345,275 | |
| | | | | | | | |
| | |
Insurance 9.8% | | | | | | | | |
Allied World Assurance Co. Holdings Ltd. (Bermuda) | | | 15,100 | | | | 863,871 | |
American Financial Group, Inc. | | | 29,000 | | | | 886,820 | |
AON Corp. | | | 11,000 | | | | 437,250 | |
Arch Capital Group Ltd. (Bermuda)* | | | 11,200 | | | | 967,568 | |
Aspen Insurance Holdings Ltd. (Bermuda) | | | 14,100 | | | | 400,017 | |
AXIS Capital Holdings Ltd. (Bermuda) | | | 21,400 | | | | 727,814 | |
Cincinnati Financial Corp. | | | 34,300 | | | | 1,009,792 | |
Endurance Specialty Holdings Ltd. (Bermuda) | | | 14,000 | | | | 579,600 | |
First American Financial Corp. | | | 27,700 | | | | 388,908 | |
Hartford Financial Services Group, Inc. (The)(a) | | | 42,100 | | | | 1,009,558 | |
HCC Insurance Holdings, Inc. | | | 27,600 | | | | 730,848 | |
Lincoln National Corp. | | | 35,000 | | | | 856,800 | |
PartnerRe Ltd. (Bermuda) | | | 13,500 | | | | 1,070,820 | |
Principal Financial Group, Inc.(a) | | | 20,900 | | | | 560,956 | |
Progressive Corp. (The) | | | 29,600 | | | | 626,336 | |
Protective Life Corp. | | | 37,000 | | | | 886,890 | |
RenaissanceRe Holdings Ltd. (Bermuda) | | | 8,600 | | | | 518,236 | |
StanCorp Financial Group, Inc. | | | 15,900 | | | | 682,110 | |
Unitrin, Inc. | | | 19,100 | | | | 464,130 | |
Unum Group | | | 24,100 | | | | 540,322 | |
| | | | | | | | |
| | | | | | | 14,208,646 | |
| | | | | | | | |
| | |
IT Services 1.9% | | | | | | | | |
Computer Sciences Corp. | | | 25,800 | | | | 1,265,490 | |
See Notes to Financial Statements.
| | |
| 16 | | Visit our website at www.prudentialfunds.com |
| | | | | | | | |
| | | Shares | | | Value (Note 2) | |
| | | | | | | | |
COMMON STOCKS (Continued) | | | | | | | | |
| | |
IT Services (cont’d.) | | | | | | | | |
Convergys Corp.* | | | 24,500 | | | $ | 277,340 | |
CoreLogic, Inc. | | | 27,700 | | | | 486,689 | |
DST Systems, Inc. | | | 9,600 | | | | 415,392 | |
Total System Services, Inc. | | | 16,900 | | | | 263,809 | |
| | | | | | | | |
| | | | | | | 2,708,720 | |
| | | | | | | | |
| | |
Machinery 3.6% | | | | | | | | |
Crane Co. | | | 17,900 | | | | 684,854 | |
Eaton Corp. | | | 13,300 | | | | 1,181,439 | |
Harsco Corp. | | | 16,700 | | | | 387,106 | |
Oshkosh Corp.* | | | 16,200 | | | | 478,062 | |
SPX Corp. | | | 10,600 | | | | 710,836 | |
Timken Co. | | | 11,900 | | | | 492,898 | |
Toro Co. (The) | | | 8,500 | | | | 482,460 | |
Trinity Industries, Inc. | | | 32,900 | | | | 747,817 | |
| | | | | | | | |
| | | | | | | 5,165,472 | |
| | | | | | | | |
| | |
Media 2.4% | | | | | | | | |
CBS Corp. (Class B Stock) | | | 67,000 | | | | 1,134,310 | |
DISH Network Corp. (Class A Stock) | | | 42,800 | | | | 850,008 | |
Gannett Co., Inc. | | | 43,600 | | | | 516,660 | |
McGraw-Hill Cos., Inc. (The) | | | 17,100 | | | | 643,815 | |
Meredith Corp. | | | 10,600 | | | | 359,870 | |
| | | | | | | | |
| | | | | | | 3,504,663 | |
| | | | | | | | |
| | |
Metals & Mining 0.7% | | | | | | | | |
Carpenter Technology Corp. | | | 8,600 | | | | 306,676 | |
Reliance Steel & Aluminum Co. | | | 16,100 | | | | 673,785 | |
| | | | | | | | |
| | | | | | | 980,461 | |
| | | | | | | | |
| | |
Multi-Line Retail 1.5% | | | | | | | | |
JC Penney Co., Inc.(a) | | | 27,400 | | | | 854,332 | |
Macy’s, Inc. | | | 46,800 | | | | 1,106,352 | |
Nordstrom, Inc. | | | 6,400 | | | | 246,464 | |
| | | | | | | | |
| | | | | | | 2,207,148 | |
| | | | | | | | |
| | |
Multi-Utilities 6.8% | | | | | | | | |
Alliant Energy Corp. | | | 5,500 | | | | 200,915 | |
See Notes to Financial Statements.
| | | | |
| Prudential Mid-Cap Value Fund | | | 17 | |
Portfolio of Investments
as of October 31, 2010 continued
| | | | | | | | |
| | | Shares | | | Value (Note 2) | |
| | | | | | | | |
COMMON STOCKS (Continued) | | | | | | | | |
| | |
Multi-Utilities (cont’d.) | | | | | | | | |
Ameren Corp. | | | 38,400 | | | $ | 1,112,832 | |
CenterPoint Energy, Inc. | | | 47,100 | | | | 779,976 | |
CMS Energy Corp.(a) | | | 28,100 | | | | 516,478 | |
Consolidated Edison, Inc. | | | 9,800 | | | | 487,256 | |
DTE Energy Co. | | | 24,400 | | | | 1,140,944 | |
MDU Resources Group, Inc. | | | 28,900 | | | | 575,977 | |
NiSource, Inc. | | | 52,900 | | | | 915,699 | |
OGE Energy Corp. | | | 17,000 | | | | 750,720 | |
SCANA Corp. | | | 10,700 | | | | 436,988 | |
Sempra Energy | | | 19,500 | | | | 1,042,860 | |
TECO Energy, Inc. | | | 11,100 | | | | 195,249 | |
Vectren Corp. | | | 18,000 | | | | 492,840 | |
Xcel Energy, Inc. | | | 46,200 | | | | 1,102,332 | |
| | | | | | | | |
| | | | | | | 9,751,066 | |
| | | | | | | | |
| | |
Office Electronics 1.2% | | | | | | | | |
Xerox Corp. | | | 144,300 | | | | 1,688,310 | |
| | | | | | | | |
| | |
Oil, Gas & Consumable Fuels 5.4% | | | | | | | | |
El Paso Corp. | | | 78,200 | | | | 1,036,932 | |
Frontline Ltd. (Bermuda) | | | 9,000 | | | | 258,750 | |
Holly Corp. | | | 10,600 | | | | 346,938 | |
Murphy Oil Corp. | | | 22,500 | | | | 1,466,100 | |
Noble Energy, Inc.(a) | | | 5,800 | | | | 472,584 | |
Southern Union Co. | | | 30,600 | | | | 768,978 | |
Spectra Energy Corp. | | | 23,500 | | | | 558,595 | |
Sunoco, Inc. | | | 20,900 | | | | 783,123 | |
Talisman Energy, Inc. (Canada) | | | 12,900 | | | | 234,006 | |
Teekay Corp. (Marshall Island) | | | 14,400 | | | | 457,920 | |
Tesoro Corp. | | | 41,400 | | | | 536,544 | |
Valero Energy Corp. | | | 50,700 | | | | 910,065 | |
| | | | | | | | |
| | | | | | | 7,830,535 | |
| | | | | | | | |
| | |
Paper & Forest Products 0.9% | | | | | | | | |
Domtar Corp. (Canada) | | | 4,500 | | | | 357,120 | |
International Paper Co. | | | 35,100 | | | | 887,328 | |
| | | | | | | | |
| | | | | | | 1,244,448 | |
| | | | | | | | |
See Notes to Financial Statements.
| | |
| 18 | | Visit our website at www.prudentialfunds.com |
| | | | | | | | |
| | | Shares | | | Value (Note 2) | |
| | | | | | | | |
COMMON STOCKS (Continued) | | | | | | | | |
| | |
Personal Products 0.4% | | | | | | | | |
Herbalife Ltd. (Cayman Islands) | | | 8,600 | | | $ | 549,196 | |
| | | | | | | | |
| | |
Pharmaceuticals 1.9% | | | | | | | | |
Endo Pharmaceuticals Holdings, Inc.* | | | 25,800 | | | | 947,892 | |
Forest Laboratories, Inc.* | | | 39,300 | | | | 1,298,865 | |
King Pharmaceuticals, Inc.* | | | 38,900 | | | | 550,046 | |
| | | | | | | | |
| | | | | | | 2,796,803 | |
| | | | | | | | |
| | |
Real Estate Investment Trusts 4.7% | | | | | | | | |
Annaly Capital Management, Inc. | | | 57,800 | | | | 1,023,638 | |
Brandywine Realty Trust | | | 21,900 | | | | 262,143 | |
Duke Realty Corp. | | | 56,100 | | | | 699,567 | |
Hospitality Properties Trust | | | 35,500 | | | | 809,755 | |
Host Hotels & Resorts, Inc. | | | 89,249 | | | | 1,418,167 | |
Mack-Cali Realty Corp. | | | 13,300 | | | | 446,614 | |
ProLogis(a) | | | 79,100 | | | | 1,079,715 | |
SL Green Realty Corp.(a) | | | 16,900 | | | | 1,110,668 | |
| | | | | | | | |
| | | | | | | 6,850,267 | |
| | | | | | | | |
| | |
Real Estate Management & Development 1.0% | | | | | | | | |
Forest City Enterprises, Inc. (Class A Stock)*(a) | | | 49,300 | | | | 719,287 | |
Jones Lang LaSalle, Inc.(a) | | | 8,600 | | | | 671,316 | |
| | | | | | | | |
| | | | | | | 1,390,603 | |
| | | | | | | | |
| | |
Road & Rail 0.4% | | | | | | | | |
Ryder System, Inc. | | | 12,700 | | | | 555,625 | |
| | | | | | | | |
| | |
Semiconductors 0.3% | | | | | | | | |
Micron Technology, Inc.*(a) | | | 56,000 | | | | 463,120 | |
| | | | | | | | |
| | |
Specialty Retail 1.4% | | | | | | | | |
Foot Locker, Inc. | | | 9,600 | | | | 152,928 | |
GameStop Corp. (Class A Stock)*(a) | | | 31,500 | | | | 619,290 | |
Limited Brands, Inc. | | | 15,300 | | | | 449,667 | |
RadioShack Corp.(a) | | | 6,600 | | | | 132,858 | |
Signet Jewelers Ltd. (Bermuda)*(a) | | | 17,600 | | | | 619,168 | |
| | | | | | | | |
| | | | | | | 1,973,911 | |
| | | | | | | | |
See Notes to Financial Statements.
| | | | |
| Prudential Mid-Cap Value Fund | | | 19 | |
Portfolio of Investments
as of October 31, 2010 continued
| | | | | | | | |
| | | Shares | | | Value (Note 2) | |
| | | | | | | | |
COMMON STOCKS (Continued) | | | | | | | | |
| | |
Thrifts & Mortgage Finance 0.3% | | | | | | | | |
Astoria Financial Corp. | | | 13,100 | | | $ | 162,702 | |
New York Community Bancorp, Inc.(a) | | | 17,500 | | | | 296,275 | |
| | | | | | | | |
| | | | | | | 458,977 | |
| | | | | | | | |
| | |
Tobacco 0.3% | | | | | | | | |
Lorillard, Inc. | | | 5,800 | | | | 494,972 | |
| | | | | | | | |
| | |
Trading Companies & Distributors 0.9% | | | | | | | | |
GATX Corp. | | | 18,600 | | | | 588,876 | |
WESCO International, Inc.*(a) | | | 17,800 | | | | 762,196 | |
| | | | | | | | |
| | | | | | | 1,351,072 | |
| | | | | | | | |
| | |
Wireless Telecommunication Services 0.6% | | | | | | | | |
NII Holdings, Inc.* | | | 19,000 | | | | 794,390 | |
Telephone & Data Systems, Inc.(a) | | | 2,600 | | | | 90,558 | |
| | | | | | | | |
| | | | | | | 884,948 | |
| | | | | | | | |
Total long-term investments
(cost $127,737,461) | | | | | | | 142,119,000 | |
| | | | | | | | |
| | |
SHORT-TERM INVESTMENT 16.6% | | | | | | | | |
| | |
AFFILIATED MONEY MARKET MUTUAL FUND | | | | | | | | |
Prudential Investment Portfolios 2 - Prudential Core Taxable Money Market Fund (cost $23,973,761; includes $22,415,948 of cash collateral for securities on loan)(b)(c) | | | 23,973,761 | | | | 23,973,761 | |
| | | | | | | | |
TOTAL INVESTMENTS 115.0%
(cost $151,711,222; Note 6) | | | | | | | 166,092,761 | |
Liabilities in excess of other assets (15.0)% | | | | | | | (21,718,778 | ) |
| | | | | | | | |
NET ASSETS 100.0% | | | | | | $ | 144,373,983 | |
| | | | | | | | |
| * | Non-income producing security. |
| (a) | All or a portion of security is on loan. The aggregate market value of such securities, including those sold and pending settlement, is $21,758,830; cash collateral of $22,415,948 (included with liabilities) was received with which the Portfolio purchased highly liquid short-term investments. |
See Notes to Financial Statements.
| | |
| 20 | | Visit our website at www.prudentialfunds.com |
| (b) | Represents security, or a portion thereof, purchased with cash collateral received for securities on loan. |
| (c) | Prudential Investments LLC, the manager of the Fund also serves as manager of the Prudential Investment Portfolios 2—Prudential Core Taxable Money Market Fund. |
Various inputs are used in determining the value of the Fund’s investments. These inputs are summarized in the three broad levels listed below.
Level 1—quoted prices in active markets for identical securities, generally for stocks and mutual funds with daily NAVs
Level 2—other significant observable inputs (including quoted prices for similar securities, interest rates, repayment speeds, credit risk, etc. and amortized cost), generally for foreign stocks priced through vendor modeling tools and debt securities
Level 3—significant unobservable inputs (including the Fund’s own assumptions in determining the fair value of investments)
The following is a summary of the inputs used as of October 31, 2010 in valuing the Fund’s assets carried at fair value:
| | | | | | | | | | | | |
| | | Level 1 | | | Level 2 | | | Level 3 | |
Investments in Securities | | | | | | | | | | | | |
Common Stocks | | $ | 142,119,000 | | | $ | — | | | $ | — | |
Affiliated Money Market Mutual Fund | | | 23,973,761 | | | | — | | | | — | |
| | | | | | | | | | | | |
Total | | $ | 166,092,761 | | | $ | — | | | $ | — | |
| | | | | | | | | | | | |
The industry classification of investments and liabilities in excess of other assets shown as a percentage of net assets as of October 31, 2010 were as follows:
| | | | |
Affiliated Money Market Mutual Fund (15.5% represents investments purchased with collateral from securities on loan) | | | 16.6 | % |
Insurance | | | 9.8 | |
Multi-Utilities | | | 6.8 | |
Oil, Gas & Consumable Fuels | | | 5.4 | |
Real Estate Investment Trusts | | | 4.7 | |
Electric Utilities | | | 4.5 | |
Energy Equipment & Services | | | 4.1 | |
Healthcare Providers & Services | | | 4.0 | |
Machinery | | | 3.6 | |
Food Products | | | 3.2 | |
Household Durables | | | 2.9 | |
Chemicals | | | 2.5 | |
Commercial Banks | | | 2.4 | |
Media | | | 2.4 | |
Diversified Telecommunication Services | | | 2.3 | |
See Notes to Financial Statements.
| | | | |
| Prudential Mid-Cap Value Fund | | | 21 | |
Portfolio of Investments
as of October 31, 2010 continued
| | | | |
| Industry (cont’d.) | | | | |
Gas Utilities | | | 2.2 | % |
Commercial Services & Supplies | | | 2.0 | |
Pharmaceuticals | | | 1.9 | |
IT Services | | | 1.9 | |
Independent Power Producers & Energy Traders | | | 1.7 | |
Computers & Peripherals | | | 1.6 | |
Electronic Equipment & Instruments | | | 1.6 | |
Hotels, Restaurants & Leisure | | | 1.6 | |
Multi-Line Retail | | | 1.5 | |
Food & Staples Retailing | | | 1.5 | |
Capital Markets | | | 1.5 | |
Specialty Retail | | | 1.4 | |
Containers & Packaging | | | 1.2 | |
Consumer Finance | | | 1.2 | |
Office Electronics | | | 1.2 | |
Healthcare Equipment & Supplies | | | 1.1 | |
Aerospace & Defense | | | 1.1 | |
Electrical Equipment | | | 1.1 | |
Diversified Consumer Services | | | 1.0 | |
Beverages | | | 1.0 | |
Real Estate Management & Development | | | 1.0 | |
Trading Companies & Distributors | | | 0.9 | |
Industrial Conglomerates | | | 0.9 | |
Paper & Forest Products | | | 0.9 | |
Auto Components | | | 0.7 | |
Metals & Mining | | | 0.7 | |
Exchange Traded Fund | | | 0.7 | |
Diversified Financial Services | | | 0.6 | |
Communications Equipment | | | 0.6 | |
Wireless Telecommunication Services | | | 0.6 | |
Household Products | | | 0.6 | |
Road & Rail | | | 0.4 | |
Personal Products | | | 0.4 | |
Biotechnology | | | 0.4 | |
Tobacco | | | 0.3 | |
Semiconductors | | | 0.3 | |
Thrifts & Mortgage Finance | | | 0.3 | |
Construction & Engineering | | | 0.2 | |
| | | | |
| | | 115.0 | |
Liabilities in excess of other assets | | | (15.0 | ) |
| | | | |
| | | 100.0 | % |
| | | | |
See Notes to Financial Statements.
| | |
| 22 | | Visit our website at www.prudentialfunds.com |
Financial Statements
| | |
| OCTOBER 31, 2010 | | ANNUAL REPORT |
Prudential Mid-Cap Value Fund
Statement of Assets and Liabilities
as of October 31, 2010
| | | | |
Assets | |
Investments at value, including securities on loan of $21,758,830: | | | | |
Unaffiliated Investments (cost $127,737,461) | | $ | 142,119,000 | |
Affiliated Investments (cost $23,973,761) | | | 23,973,761 | |
Receivable for investments sold | | | 1,233,091 | |
Dividends receivable | | | 113,189 | |
Receivable for Fund shares sold | | | 84,684 | |
Prepaid expenses | | | 2,650 | |
| | | | |
Total assets | | | 167,526,375 | |
| | | | |
| |
Liabilities | | | | |
Payable to broker for collateral for securities on loan | | | 22,415,948 | |
Payable for Fund shares redeemed | | | 382,232 | |
Accrued expenses | | | 128,516 | |
Advisory fee payable | | | 109,900 | |
Distribution fee payable | | | 50,914 | |
Payable to custodian | | | 38,049 | |
Affiliated transfer agent fee payable | | | 22,190 | |
Deferred directors’ fee | | | 4,643 | |
| | | | |
Total liabilities | | | 23,152,392 | |
| | | | |
| |
Net Assets | | $ | 144,373,983 | |
| | | | |
| | | | | |
Net assets were comprised of: | | | | |
Common stock, at $.001 par value | | $ | 11,350 | |
Paid-in capital in excess of par | | | 151,277,376 | |
| | | | |
| | | 151,288,726 | |
Undistributed net investment income | | | 26,306 | |
Accumulated net realized loss on investment transactions | | | (21,322,588 | ) |
Net unrealized appreciation on investments | | | 14,381,539 | |
| | | | |
Net assets, October 31, 2010 | | $ | 144,373,983 | |
| | | | |
See Notes to Financial Statements.
| | |
| 24 | | Visit our website at www.prudentialfunds.com |
| | | | |
Class A: | | | | |
Net asset value and redemption price per share
($73,637,981 ÷ 5,614,090 shares of common stock issued and outstanding) | | $ | 13.12 | |
Maximum sales charge (5.5% of offering price) | | | 0.76 | |
| | | | |
Offering price per share | | $ | 13.88 | |
| | | | |
| |
Class B: | | | | |
Net asset value, offering price and redemption price per share
($4,091,700 ÷ 344,670 shares of common stock issued and outstanding) | | $ | 11.87 | |
| | | | |
| |
Class C: | | | | |
Net asset value, offering price and redemption price per share
($29,900,106 ÷ 2,526,225 shares of common stock issued and outstanding) | | $ | 11.84 | |
| | | | |
| |
Class L: | | | | |
Net asset value, offering price and redemption price per share
($11,863,340 ÷ 921,465 shares of common stock issued and outstanding) | | $ | 12.87 | |
| | | | |
| |
Class M: | | | | |
Net asset value, offering price and redemption price per share
($3,986,609 ÷ 332,719 shares of common stock issued and outstanding) | | $ | 11.98 | |
| | | | |
| |
Class X: | | | | |
Net asset value, offering price and redemption price per share
($4,061,417 ÷ 336,938 shares of common stock issued and outstanding) | | $ | 12.05 | |
| | | | |
| |
Class Z: | | | | |
Net asset value, offering price and redemption price per share
($16,832,830 ÷ 1,274,185 shares of common stock issued and outstanding) | | $ | 13.21 | |
| | | | |
See Notes to Financial Statements.
| | | | |
| Prudential Mid-Cap Value Fund | | | 25 | |
Statement of Operations
Year Ended October 31, 2010
| | | | |
Net Investment Income | | | | |
Investment Income | | | | |
Unaffiliated dividend income (net of foreign withholding tax of $434) | | $ | 3,183,347 | |
Affiliated income from securities lending, net | | | 77,772 | |
Affiliated dividend income | | | 4,261 | |
| | | | |
Total income | | | 3,265,380 | |
| | | | |
| |
Expenses | | | | |
Advisory fee | | | 1,293,490 | |
Distribution fee—Class A | | | 174,607 | |
Distribution fee—Class B | | | 42,249 | |
Distribution fee—Class C | | | 295,203 | |
Distribution fee—Class L | | | 59,421 | |
Distribution fee—Class M | | | 16,350 | |
Distribution fee—Class X | | | 11,766 | |
Transfer agent’s fee and expenses (including affiliated expenses of $124,200) | | | 371,000 | |
Registration fees | | | 77,000 | |
Reports to shareholders | | | 77,000 | |
Custodian’s fees and expenses | | | 66,000 | |
Legal fees and expenses | | | 23,000 | |
Audit fees | | | 22,000 | |
Directors’ fees | | | 14,000 | |
Miscellaneous | | | 18,033 | |
| | | | |
Total expenses | | | 2,561,119 | |
| | | | |
Net investment income | | | 704,261 | |
| | | | |
| |
Realized And Unrealized Gain On Investments | | | | |
Net realized gain on investments | | | 2,239,324 | |
Net change in unrealized appreciation (depreciation) on investments | | | 28,203,715 | |
| | | | |
Net gain on investments | | | 30,443,039 | |
| | | | |
Net Increase In Net Assets Resulting From Operations | | $ | 31,147,300 | |
| | | | |
See Notes to Financial Statements.
| | |
| 26 | | Visit our website at www.prudentialfunds.com |
Statement of Changes in Net Assets
| | | | | | | | |
| | | Year Ended October 31, | |
| | | 2010 | | | 2009 | |
Increase (Decrease) In Net Assets | | | | | | | | |
Operations | | | | | | | | |
Net investment income | | $ | 704,261 | | | $ | 1,083,818 | |
Net realized gain (loss) on investment transactions | | | 2,239,324 | | | | (22,282,267 | ) |
Net change in unrealized appreciation (depreciation) on investments | | | 28,203,715 | | | | 42,721,972 | |
| | | | | | | | |
Net increase in net assets resulting from operations | | | 31,147,300 | | | | 21,523,523 | |
| | | | | | | | |
| | |
Dividends (Note 2) | | | | | | | | |
Dividends from net investment income | | | | | | | | |
Class A | | | (504,714 | ) | | | (769,488 | ) |
Class B | | | (11,609 | ) | | | (227,132 | ) |
Class C | | | (76,553 | ) | | | (382,279 | ) |
Class L | | | (69,526 | ) | | | (217,883 | ) |
Class M | | | (80,304 | ) | | | (399,054 | ) |
Class X | | | (46,515 | ) | | | (163,017 | ) |
Class Z | | | (166,991 | ) | | | (193,661 | ) |
| | | | | | | | |
Total dividends | | | (956,212 | ) | | | (2,352,514 | ) |
| | | | | | | | |
| | |
Fund share transactions (Note 5) | | | | | | | | |
Net proceeds from shares sold | | | 10,102,227 | | | | 15,630,053 | |
Net asset value of shares issued in reinvestment of dividends | | | 919,643 | | | | 2,214,203 | |
Cost of shares redeemed | | | (33,817,992 | ) | | | (29,885,755 | ) |
| | | | | | | | |
Decrease in net assets from fund share transactions | | | (22,796,122 | ) | | | (12,041,499 | ) |
| | | | | | | | |
| | |
Capital Contributions | | | | | | | | |
Class M (Note 3) | | | 4,414 | | | | 40,553 | |
Class X (Note 3) | | | 2,295 | | | | 6,801 | |
Proceeds from regulatory settlement (Note 5) | | | 9,456 | | | | — | |
| | | | | | | | |
| | | 16,165 | | | | 47,354 | |
| | | | | | | | |
Total increase in net assets | | | 7,411,131 | | | | 7,176,864 | |
| | |
Net Assets | | | | | | | | |
Beginning of year | | | 136,962,852 | | | | 129,785,988 | |
| | | | | | | | |
End of year(a) | | $ | 144,373,983 | | | $ | 136,962,852 | |
| | | | | | | | |
(a) Includes undistributed net investment income of: | | $ | 26,306 | | | $ | 278,257 | |
| | | | | | | | |
See Notes to Financial Statements.
| | | | |
| Prudential Mid-Cap Value Fund | | | 27 | |
Notes to Financial Statements
1. Organization
Prudential Investments Portfolios, Inc. 10 (the “Company”) is an open-end management investment company, registered under the Investment Company Act of 1940, as amended. The Company was organized on March 5, 1997, as a Maryland Corporation. The Company operates as a series company. At October 31, 2010, the Company consisted of two diversified investment portfolios (each a “Fund” and collectively the “Funds”). The information presented in these financial statements pertains to Prudential Mid-Cap Value Fund (the “Fund”). The investment objective of the Fund is capital growth by investing primarily in common stocks of medium capitalization companies.
2. Significant Accounting Policies
The following accounting policies are in conformity with accounting principles generally accepted in the United States of America. Such policies are consistently followed by the Company and the Fund in the preparation of their financial statements.
Securities Valuation: Securities listed on a securities exchange (other than options on securities and indices) are valued at the last sale price on such exchange on the day of valuation or, if there was no sale on such day, at the mean between the last reported bid and asked prices, or at the last bid price on such day in the absence of an asked price. Securities that are actively traded via NASDAQ are valued at the official closing price as provided by NASDAQ. Securities that are actively traded in the over-the-counter market, including listed securities for which the primary market is believed by Prudential Investments LLC (“PI” or “Manager”) in consultation with the subadviser, to be over-the-counter, are valued at market value using prices provided by an independent pricing agent or principal market maker. Futures contracts and options thereon traded on a commodities exchange or board of trade are valued at the last sale price at the close of trading on such exchange or board of trade or, if there was no sale on the applicable commodities exchange or board of trade on such day, at the mean between the most recently quoted prices on such exchange or board of trade or at the last bid price in the absence of an asked price. Prices may be obtained from independent pricing services which use information provided by market makers or estimates of market values obtained from yield data relating to investments or securities with similar characteristics. Securities for which reliable market quotations are not readily available, or whose values have been affected by
| | |
| 28 | | Visit our website at www.prudentialfunds.com |
events occurring after the close of the security’s foreign market and before the Fund’s normal pricing time, are valued at fair value in accordance with the Board of Directors’ approved fair valuation procedures. When determining the fair valuation of securities some of the factors influencing the valuation include, the nature of any restrictions on disposition of the securities; assessment of the general liquidity of the securities; the issuer’s financial condition and the markets in which it does business; the cost of the investment; the size of the holding and the capitalization of issuer; the prices of any recent transactions or bids/offers for such securities or any comparable securities; any available analyst media or other reports or information deemed reliable by the investment adviser regarding the issuer or the markets or industry in which it operates. Using fair value to price securities may result in a value that is different from a security’s most recent closing price and from the price used by other mutual funds to calculate their net asset value.
Investments in open end, non exchange-traded mutual funds are valued at the net asset value as of the close of the New York Stock Exchange on the date of valuation.
Foreign Currency Translation: Fund securities and other assets and liabilities denominated in foreign currencies are translated each business day into U.S. dollars based on the current rates of exchange. Purchases and sales of Fund securities and income and expenses are translated into U.S. dollars on the respective dates of such transactions. Gains and losses resulting from changes in exchange rates applicable to long-term foreign securities are not reported separately from gains and losses arising from movements in securities prices. Net realized foreign exchange gains and losses include gains and losses from sales and maturities of foreign currency exchange contracts, gains and losses realized between the trade and settlement dates of foreign securities transactions, and the difference between the amount of net investment income accrued on foreign securities and the U.S. dollar amount actually received. Net unrealized foreign exchange gains and losses include gains and losses from changes in the value of assets and liabilities other than Fund securities, resulting from changes in exchange rates.
Securities Lending: The Funds may lend their portfolio securities to broker-dealers. The loans are secured by collateral at least equal at all times to the market value of the securities loaned. Loans are subject to termination at the option of the borrower or the Funds. Upon termination of the loan, the borrower will return to the lender securities identical to the loaned securities. Should the borrower of the securities fail financially, the Funds have the right to repurchase the securities using the collateral in the open market. The Funds recognize income, net of any rebate and securities lending agent fees, for lending its securities in the form of fees or interest on the investment of any cash received as collateral. The Funds also continue to receive
| | | | |
| Prudential Mid-Cap Value Fund | | | 29 | |
Notes to Financial Statements
continued
interest and dividends or amounts equivalent thereto, on the securities loaned and recognize any unrealized gain or loss in the market price of the securities loaned that may occur during the term of the loan.
Securities Transactions and Net Investment Income: Securities transactions are recorded on the trade date. Realized gains or losses on sales of investments and currency transactions are calculated on the identified cost basis. Dividend income is recorded on the ex-dividend date and interest income is recorded on the accrual basis. The Fund amortizes premiums and discounts on portfolio securities as adjustments to interest income. Expenses are recorded on the accrual basis which may require the use of certain estimates by management.
Net investment income or loss (other than distribution fees, which are charged directly to the respective class) and unrealized and realized gains or losses are allocated daily to each class of shares based upon the relative proportion of net assets of each class at the beginning of the day.
Dividends and Distributions to Shareholders: Distributions to shareholders are recorded on the ex-dividend date. Dividends, if any, from net investment income are declared and paid at least annually. These dividends and distributions are determined in accordance with federal income tax regulations and may differ from accounting principles generally accepted in the United States of America.
Net realized gains from investment transactions, if any, are distributed at least annually. Permanent book/tax differences relating to income and gains are reclassified to paid-in capital when they arise.
Taxes: For federal income tax purposes, each Fund in the Company is treated as a separate tax paying entity. It is the Fund’s policy to continue to meet the requirements of the Internal Revenue Code applicable to regulated investment companies and to distribute all of its taxable net income and capital gains, if any, to shareholders. Therefore, no federal tax provision is required.
Withholding taxes on foreign dividends are recorded net of reclaimable amounts, at the time the related income is earned.
| | |
| 30 | | Visit our website at www.prudentialfunds.com |
Estimates: The preparation of the financial statements requires management to make estimates and assumptions that affect the reported amounts and disclosures in the financial statements. Actual results could differ from those estimates.
3. Agreements
The Fund has entered into an investment management agreement with PI which provides that the Manager will furnish the Fund with investment advice and investment management and administrative services. The Manager has entered into a subadvisory agreement with Quantitative Management Associates LLC (“QMA”). The subadvisory agreement provides that QMA furnishes investment advisory services in connection with the management of the Fund. PI pays for the services of QMA, the cost of compensation of officers of the Fund, occupancy and certain clerical and bookkeeping costs of the Fund. The Fund bears all other costs and expenses.
The advisory fee paid to PI is computed daily and payable monthly at an annual rate of 0.90% of the average daily net assets of the Fund up to $500 million, 0.85% of the next $500 million and 0.80% of the average daily net assets in excess of $1 billion. The effective management fee rate was 0.90% for the year ended October 31, 2010.
Certain officers and directors of the Fund are officers or directors of the Manager. The Fund pays no compensation directly to their officers or interested directors.
Prudential Investment Management Services LLC (“PIMS”) and Prudential Annuities Distributors, Inc. (“PAD”) both affiliates of the Manager and an indirect, wholly owned subsidiary of Prudential, serve as the distributors of the Fund. The Company has adopted a separate Distribution and Service plan (each a “Plan” and collectively the “Plans”) for Class A, B, C, L, M, X and Z shares of each Fund in accordance with the requirements of Rule 12b-1 of the Investment Company Act of 1940. No distribution or service fees are paid to PIMS as distributor for Class Z shares.
Under the Plans, the Fund compensates PIMS and PAD distribution and service fees at an annual rate up to 0.30%, 1.00%, 1.00%, 0.50%, 1.00% and 1.00% of the average daily net assets of the Class A, B, C, L, M and X shares, respectively. Through February 29, 2012, PIMS has contractually agreed to limit such fees to 0.25% of the average daily net assets of Class A shares.
Management has received the maximum allowable amount of sales charges for Class M and X in accordance with regulatory limits. As such, any contingent deferred sales charges received by the Manager are contributed back into the Fund and included
| | | | |
| Prudential Mid-Cap Value Fund | | | 31 | |
Notes to Financial Statements
continued
in the Statement of Changes in Net Assets and Financial Highlights as a contribution to capital.
During the year ended October 31, 2008, management determined that Class M and Class X shareholders had been charged sales charges in excess of regulatory limits. The Manager has paid these classes for the overcharge which is reflected in the Financial Highlights for Class M for the years ended October 31, 2008 and 2007 and for Class X for the years ended October 31, 2008, 2007, and 2006.
During the year ended October 31, 2010, PIMS has advised the Fund, front-end sales charges (“FESC”) and contingent deferred sales charges (“CDSC”) were as follows:
| | | | | | | | |
Class A
FESC | | Class A
CDSC | | Class B
CDSC | | Class C
CDSC | | Class L
CDSC |
| $38,588 | | $25 | | $5,214 | | $541 | | $42 |
4. Other Transactions with Affiliates
Prudential Mutual Fund Services LLC (“PMFS”), an affiliate of PI and an indirect, wholly-owned subsidiary of Prudential, serves as the Fund’s transfer agent. Transfer agent fees and expenses shown in the Statements of Operations include certain out-of pocket expenses paid to non-affiliates, where applicable.
The Fund pays networking fees to affiliated and unaffiliated broker/dealers, including fees relating to the services of Wells Fargo, LLC (“Wells Fargo”), an affiliate of PI through December 31, 2009. These networking fees are payments made to broker/dealers that clear mutual fund transactions through a national clearing system. For the year ended October 31, 2010, the Fund incurred approximately $77,300 in total networking fees, of which approximately $5,700 was paid to Wells Fargo through December 31, 2009. These amounts are included in transfer agent’s fees and expenses on the Statement of Operations.
The Fund invests in the Prudential Core Taxable Money Market Fund (the “Core Fund”), a portfolio of Prudential Investment Portfolios 2 registered under the Investment Company Act of 1940, as amended, and managed by PI. Earnings from the Core Fund are disclosed on the Statement of Operations as affiliated dividend income.
| | |
| 32 | | Visit our website at www.prudentialfunds.com |
Prudential Investment Management, Inc. (“PIM”), an indirect, wholly-owned subsidiary of Prudential, served as the Fund’s securities lending agent. For the year ended October 31, 2010, PIM has been compensated approximately $27,400 for these services.
5. Shares of Capital Stock
Class A shares are sold with a front-end sales charge of up to 5.50%. Purchases of $1 million or more are subject to a contingent deferred sales charge (“CDSC”) if shares are redeemed within 12 months of their purchase. Class B shares are sold with a CDSC which declines from 5% to zero depending upon the period of time the shares are held. Class B shares will automatically convert to Class A shares approximately seven years after purchase. Class M shares will automatically convert to Class A shares approximately eight years after purchase. Class C shares are sold with a CDSC of 1% during the first 12 months. Class L shares are closed to most new purchases (with the exception of reinvested dividends and purchases by certain college savings plans). Class M shares are also closed to most new purchases (with the exception of reinvested dividends). Class L shares and Class M shares are only exchangeable with Class L shares and Class M shares, respectively, offered by the other Prudential Investments Funds. Class X shares are closed to new purchases. The authorized capital stock of the Company is 5.5 billion shares, with a par value of $.001 per share. Of the Company’s authorized capital stock, 200 million authorized shares have been allocated to the Fund and divided into eight classes, designated Class A, Class B, Class C, Class L, Class M, Class Q, Class X and Class Z capital stock. Class A, Class C, Class Q and Class Z shares each consist of 40 million authorized shares. Class B, Class L, Class M and Class X shares each consist of 10 million authorized shares. Class Q will commence on or about January 18, 2011. Class Q and Class Z shares are not subject to any sales or redemption charge and are offered exclusively for sale to a limited group of investors.
For the year ended October 31, 2010, the Fund received $9,456 related to an affiliate’s settlement of regulatory proceedings involving allegations of improper trading. This amount is presented in the Fund’s Statement of Changes in Net Assets. The Fund was not involved in the proceedings or the calculation of the payment.
| | | | |
| Prudential Mid-Cap Value Fund | | | 33 | |
Notes to Financial Statements
continued
Transactions in shares of capital stock, during the year ended October 31, 2010, were as follows:
| | | | | | | | |
Class A | | Shares | | | Amount | |
Year ended October 31, 2010: | | | | | | | | |
Shares sold | | | 404,212 | | | $ | 4,908,947 | |
Shares issued in reinvestment of dividends and distributions | | | 43,339 | | | | 485,837 | |
Shares reacquired | | | (1,318,165 | ) | | | (15,943,513 | ) |
| | | | | | | | |
Net increase (decrease) in shares outstanding before conversion | | | (870,614 | ) | | | (10,548,729 | ) |
Shares issued upon conversion from Class B, Class M and Class X | | | 623,214 | | | | 7,543,399 | |
| | | | | | | | |
Net increase (decrease) in shares outstanding | | | (247,400 | ) | | $ | (3,005,330 | ) |
| | | | | | | | |
Year ended October 31, 2009: | | | | | | | | |
Shares sold | | | 655,465 | | | $ | 5,625,712 | |
Shares issued in reinvestment of dividends and distributions | | | 88,784 | | | | 728,915 | |
Shares reacquired | | | (1,251,027 | ) | | | (10,806,289 | ) |
| | | | | | | | |
Net increase (decrease) in shares outstanding before conversion | | | (506,778 | ) | | | (4,451,662 | ) |
Shares issued upon conversion from Class B, Class M and Class X | | | 2,384,516 | | | | 21,374,478 | |
| | | | | | | | |
Net increase (decrease) in shares outstanding | | | 1,877,738 | | | $ | 16,922,816 | |
| | | | | | | | |
Class B | | | | | | |
Year ended October 31, 2010: | | | | | | | | |
Shares sold | | | 49,822 | | | $ | 546,299 | |
Shares issued in reinvestment of dividends and distributions | | | 1,074 | | | | 10,968 | |
Shares reacquired | | | (122,162 | ) | | | (1,333,469 | ) |
| | | | | | | | |
Net increase (decrease) in shares outstanding before conversion | | | (71,266 | ) | | | (776,202 | ) |
Shares reacquired upon conversion into Class A | | | (22,381 | ) | | | (242,722 | ) |
| | | | | | | | |
Net increase (decrease) in shares outstanding | | | (93,647 | ) | | $ | (1,018,924 | ) |
| | | | | | | | |
Year ended October 31, 2009: | | | | | | | | |
Shares sold | | | 50,125 | | | $ | 398,642 | |
Shares issued in reinvestment of dividends and distributions | | | 27,766 | | | | 207,692 | |
Shares reacquired | | | (413,066 | ) | | | (3,202,713 | ) |
| | | | | | | | |
Net increase (decrease) in shares outstanding before conversion | | | (335,175 | ) | | | (2,596,379 | ) |
Shares reacquired upon conversion into Class A | | | (1,291,085 | ) | | | (10,927,101 | ) |
| | | | | | | | |
Net increase (decrease) in shares outstanding | | | (1,626,260 | ) | | $ | (13,523,480 | ) |
| | | | | | | | |
| | |
| 34 | | Visit our website at www.prudentialfunds.com |
| | | | | | | | |
Class C | | Shares | | | Amount | |
Year ended October 31, 2010: | | | | | | | | |
Shares sold | | | 129,215 | | | $ | 1,424,846 | |
Shares issued in reinvestment of dividends and distributions | | | 7,083 | | | | 72,109 | |
Shares reacquired | | | (493,020 | ) | | | (5,371,179 | ) |
| | | | | | | | |
Net increase (decrease) in shares outstanding | | | (356,722 | ) | | $ | (3,874,224 | ) |
| | | | | | | | |
Year ended October 31, 2009: | | | | | | | | |
Shares sold | | | 86,597 | | | $ | 680,548 | |
Shares issued in reinvestment of dividends and distributions | | | 47,364 | | | | 353,811 | |
Shares reacquired | | | (760,453 | ) | | | (5,836,852 | ) |
| | | | | | | | |
Net increase (decrease) in shares outstanding | | | (626,492 | ) | | $ | (4,802,493 | ) |
| | | | | | | | |
Class L | | | | | | |
Year ended October 31, 2010: | | | | | | | | |
Shares sold | | | 6,206 | | | $ | 71,673 | |
Shares issued in reinvestment of dividends and distributions | | | 5,802 | | | | 63,992 | |
Shares reacquired | | | (191,124 | ) | | | (2,253,688 | ) |
| | | | | | | | |
Net increase (decrease) in shares outstanding | | | (179,116 | ) | | $ | (2,118,023 | ) |
| | | | | | | | |
Year ended October 31, 2009: | | | | | | | | |
Shares sold | | | 6,301 | | | $ | 53,803 | |
Shares issued in reinvestment of dividends and distributions | | | 24,681 | | | | 199,418 | |
Shares reacquired | | | (336,075 | ) | | | (2,829,822 | ) |
| | | | | | | | |
Net increase (decrease) in shares outstanding | | | (305,093 | ) | | $ | (2,576,601 | ) |
| | | | | | | | |
Class M | | | | | | |
Year ended October 31, 2010: | | | | | | | | |
Shares sold | | | 3,554 | | | $ | 39,700 | |
Shares issued in reinvestment of dividends and distributions | | | 7,294 | | | | 74,621 | |
Shares reacquired | | | (124,930 | ) | | | (1,349,836 | ) |
| | | | | | | | |
Net increase (decrease) in shares outstanding before conversion | | | (114,082 | ) | | | (1,235,515 | ) |
Shares reacquired upon conversion into Class A | | | (528,769 | ) | | | (5,869,335 | ) |
| | | | | | | | |
Net increase (decrease) in shares outstanding | | | (642,851 | ) | | $ | (7,104,850 | ) |
| | | | | | | | |
Year ended October 31, 2009: | | | | | | | | |
Shares sold | | | 53,171 | | | $ | 392,994 | |
Shares issued in reinvestment of dividends and distributions | | | 49,934 | | | | 373,507 | |
Shares reacquired | | | (433,611 | ) | | | (3,275,959 | ) |
| | | | | | | | |
Net increase (decrease) in shares outstanding before conversion | | | (330,506 | ) | | | (2,509,458 | ) |
Shares reacquired upon conversion into Class A | | | (1,151,248 | ) | | | (9,023,715 | ) |
| | | | | | | | |
Net increase (decrease) in shares outstanding | | | (1,481,754 | ) | | $ | (11,533,173 | ) |
| | | | | | | | |
| | | | |
| Prudential Mid-Cap Value Fund | | | 35 | |
Notes to Financial Statements
continued
| | | | | | | | |
Class X | | Shares | | | Amount | |
Year ended October 31, 2010: | | | | | | | | |
Shares sold | | | 4,857 | | | $ | 53,770 | |
Shares issued in reinvestment of dividends and distributions | | | 4,484 | | | | 46,190 | |
Shares reacquired | | | (86,694 | ) | | | (958,612 | ) |
| | | | | | | | |
Net increase (decrease) in shares outstanding before conversion | | | (77,353 | ) | | | (858,652 | ) |
Shares reacquired upon conversion into Class A | | | (130,518 | ) | | | (1,431,342 | ) |
| | | | | | | | |
Net increase (decrease) in shares outstanding | | | (207,871 | ) | | $ | (2,289,994 | ) |
| | | | | | | | |
Year ended October 31, 2009: | | | | | | | | |
Shares sold | | | 14,932 | | | $ | 134,609 | |
Shares issued in reinvestment of dividends and distributions | | | 21,495 | | | | 162,071 | |
Shares reacquired | | | (142,040 | ) | | | (1,075,820 | ) |
| | | | | | | | |
Net increase (decrease) in shares outstanding before conversion | | | (105,613 | ) | | | (779,140 | ) |
Shares reacquired upon conversion into Class A | | | (174,620 | ) | | | (1,423,662 | ) |
| | | | | | | | |
Net increase (decrease) in shares outstanding | | | (280,233 | ) | | $ | (2,202,802 | ) |
| | | | | | | | |
Class Z | | | | | | |
Year ended October 31, 2010: | | | | | | | | |
Shares sold | | | 258,483 | | | $ | 3,056,992 | |
Shares issued in reinvestment of dividends and distributions | | | 14,736 | | | | 165,926 | |
Shares reacquired | | | (510,895 | ) | | | (6,607,695 | ) |
| | | | | | | | |
Net increase (decrease) in shares outstanding | | | (237,676 | ) | | $ | (3,384,777 | ) |
| | | | | | | | |
Year ended October 31, 2009: | | | | | | | | |
Shares sold | | | 913,438 | | | $ | 8,343,745 | |
Shares issued in reinvestment of dividends and distributions | | | 22,911 | | | | 188,789 | |
Shares reacquired | | | (317,317 | ) | | | (2,858,300 | ) |
| | | | | | | | |
Net increase (decrease) in shares outstanding | | | 619,032 | | | $ | 5,674,234 | |
| | | | | | | | |
6. Distributions and Tax Information
Distributions to shareholders, which are determined in accordance with federal income tax regulations, which may differ from generally accepted accounting principles, are recorded on the ex-dividend date.
For the year ended October 31, 2010, the tax character of dividends paid as reflected in the Statement of Changes in Net Assets was $956,212 from ordinary income. For the year ended October 31, 2009, the tax character of dividends paid as reflected in the Statement of Changes in Net Assets was $2,352,514 from ordinary income.
As of October 31, 2010, the accumulated undistributed earnings on a tax basis was $30,948 of ordinary income. This differs from the amount shown on the Statement of
| | |
| 36 | | Visit our website at www.prudentialfunds.com |
Assets and Liabilities primarily due to cumulative timing differences between financial and tax reporting.
For federal income tax purposes, the Fund had a capital loss carryforward as of October 31, 2010 of approximately $20,966,000 which expires in 2017. The Fund utilized capital loss carryforward to offset net taxable capital gains realized in the fiscal year ended October 31, 2010 of approximately $1,999,000. No capital gain distributions are expected to be paid to shareholders until net gains have been realized in excess of such carryforward. It is uncertain whether the Fund will be able to realize the full benefit prior to the expiration dates.
The federal income tax basis of the Fund’s investments and the net unrealized appreciation as of October 31, 2010 was as follows:
| | | | | | |
Tax Basis | | Appreciation | | Depreciation | | Net
Unrealized
Appreciation |
| $152,067,670 | | $22,811,449 | | $(8,786,358) | | $14,025,091 |
The difference between book basis and tax basis was primarily attributable to deferred losses on wash sales.
Management has analyzed the Fund’s tax positions taken on federal income tax returns for all open tax years and has concluded that as of October 31, 2010, no provisions for income tax would be required in the Fund’s financial statements. The Fund’s federal and state income and federal excise tax returns for tax years for which the applicable statutes of limitations have not expired are subject to examination by the Internal Revenue Service and state departments of revenue.
7. Portfolio Securities
Purchases and sales of securities, other than U.S. government securities and short term obligations, during the year ended October 31, 2010, were $36,114,676 and $58,736,035, respectively.
| | | | |
| Prudential Mid-Cap Value Fund | | | 37 | |
Notes to Financial Statements
continued
8. Borrowings
The Fund, along with other affiliated registered investment companies (the “Funds”), is a party to a Syndicated Credit Agreement (“SCA”) with two banks. The SCA provides for a commitment of $500 million. Interest on any borrowings under the SCA would be incurred at contracted market rates and a commitment fee for the unused amount is accrued daily and paid quarterly. The Funds pay an annualized commitment fee of 0.15% of the unused portion of the SCA. The expiration date of the SCA has been extended from October 20, 2010 to December 17, 2010 under the same terms. Effective December 17, 2010 the Fund, along with the Funds entered into a new Syndicated Credit Agreement (“New SCA”) with a group of banks. The New SCA provides for a commitment of $750 million. The Funds will pay an annualized commitment fee of 0.10% of the unused portion of the New SCA. The expiration date of the New SCA is December 16, 2011. Interest on any borrowings under the New SCA will be incurred at contracted market rates and a commitment fee for the unused amount is accrued daily and paid quarterly. The purpose of the SCA is to provide an alternative source of temporary funding for capital share redemptions. The Fund did not borrow any amounts pursuant to the SCA during the year ended October 31, 2010.
9. Notice of Dividends to Shareholders
The Fund declared ordinary income dividends on November 26, 2010 to shareholders of record on November 29, 2010. The ex-dividend date was November 30, 2010. The per share amounts declared were as follows:
| | | | |
| | | Ordinary Income | |
Class A | | $ | 0.06149 | |
Class B | | | — | |
Class C | | | — | |
Class L | | $ | 0.03131 | |
Class M | | $ | 0.06149 | |
Class X | | $ | 0.06149 | |
Class Z | | $ | 0.09204 | |
10. New Accounting Pronouncements
In January 2010, the Financial Accounting Standards Board (“FASB”) issued Accounting Standards Update (“ASU”) No. 2010-06 “Improving Disclosures about
| | |
| 38 | | Visit our website at www.prudentialfunds.com |
Fair Value Measurements”. ASU 2010-06 will require reporting entities to make new disclosures about purchases, sales, issuances, and settlements in the roll forward of activity in Level 3 fair value measurements. The new and revised disclosures are effective for interim and annual reporting periods beginning after December 15, 2010. At this time, management is evaluating the implications of ASU No. 2010-06 and its impact on the financial statements has not been determined.
11. Subsequent Event
Class Q shares are scheduled to commence operations on or about January 18, 2011. These shares will be available only to limited groups of investors.
| | | | |
| Prudential Mid-Cap Value Fund | | | 39 | |
Financial Highlights
| | | | | | | | | | | | | | | | | | | | |
| Class A Shares | |
| | | Year Ended October 31, | |
| | | 2010(b) | | | 2009(b) | | | 2008(b) | | | 2007(b) | | | 2006(b) | |
| Per Share Operating Performance: | | | | | | | | | | | | | | | | | | | | |
| Net Asset Value, Beginning Of Year | | | $10.65 | | | | $9.07 | | | | $18.38 | | | | $18.26 | | | | $20.12 | |
| Income (loss) from investment operations: | | | | | | | | | | | | | | | | | | | | |
| Net investment income | | | .08 | | | | .09 | | | | .15 | | | | .06 | | | | .02 | |
| Net realized and unrealized gain (loss) on investments | | | 2.48 | | | | 1.68 | | | | (5.65 | ) | | | 1.68 | | | | 2.10 | |
| Total from investment operations | | | 2.56 | | | | 1.77 | | | | (5.50 | ) | | | 1.74 | | | | 2.12 | |
| Less Dividends and Distributions: | | | | | | | | | | | | | | | | | | | | |
| Dividends from net investment income | | | (.09 | ) | | | (.19 | ) | | | (.06 | ) | | | - | | | | - | |
| Distributions from net realized gains | | | - | | | | - | | | | (3.75 | ) | | | (1.62 | ) | | | (3.98 | ) |
| Total dividends and distributions | | | (.09 | ) | | | (.19 | ) | | | (3.81 | ) | | | (1.62 | ) | | | (3.98 | ) |
| Capital Contributions | | | - | * | | | - | | | | - | | | | - | | | | - | |
| Net asset value, end of year | | | $13.12 | | | | $10.65 | | | | $9.07 | | | | $18.38 | | | | $18.26 | |
| Total Return(a) | | | 24.14% | | | | 20.16% | | | | (36.25)% | | | | 9.78% | | | | 12.24% | |
| |
| Ratios/Supplemental Data: | |
| Net assets, end of year (in millions) | | | $73.6 | | | | $62.4 | | | | $36.1 | | | | $54.8 | | | | $45.2 | |
| Ratios to average net assets(c): | | | | | | | | | | | | | | | | | | | | |
Expenses after advisory fee waiver and
expense reimbursement | | | 1.61% | | | | 1.72% | | | | 1.53% | | | | 1.48% | | | | 1.46% | |
Expenses before advisory fee waiver and
expense reimbursement | | | 1.61% | | | | 1.72% | | | | 1.53% | | | | 1.48% | | | | 1.46% | |
| Net investment income | | | .65% | | | | .97% | | | | 1.18% | | | | .34% | | | | .13% | |
| For Class A, B, C, L, M, X and Z shares: | | | | | | | | | | | | | | | | | | | | |
| Portfolio turnover rate | | | 26% | | | | 38% | | | | 37% | | | | 78% | | | | 80% | |
(a) Total return does not consider the effects of sales load. Total return is calculated assuming a purchase of a share on the first day and a sale on the last day of each year reported and includes reinvestment of dividends and distributions. Total returns may reflect adjustments to conform to generally accepted accounting principles. Total return includes the effect of expense subsidies.
(b) Calculated based on average shares outstanding during the year.
(c) Does not include expenses of the underlying portfolio in which the Fund invests.
* Less than $0.005.
See Notes to Financial Statements.
| | |
| 40 | | Visit our website at www.prudentialfunds.com |
| | | | | | | | | | | | | | | | | | | | |
| Class B Shares | |
| | | Year Ended October 31, | |
| | | 2010(b) | | | 2009(b) | | | 2008(b) | | | 2007(b) | | | 2006(b) | |
| Per Share Operating Performance: | | | | | | | | | | | | | | | | | | | | |
| Net Asset Value, Beginning Of Year | | | $9.66 | | | | $8.22 | | | | $17.07 | | | | $17.19 | | | | $19.28 | |
| Income (loss) from investment operations: | | | | | | | | | | | | | | | | | | | | |
| Net investment income (loss) | �� | | (.01 | ) | | | .06 | | | | .05 | | | | (.07 | ) | | | (.11 | ) |
| Net realized and unrealized gain (loss) on investments | | | 2.25 | | | | 1.49 | | | | (5.15 | ) | | | 1.57 | | | | 2.00 | |
| Total from investment operations | | | 2.24 | | | | 1.55 | | | | (5.10 | ) | | | 1.50 | | | | 1.89 | |
| Less Dividends and Distributions: | | | | | | | | | | | | | | | | | | | | |
| Dividends from net investment income | | | (.03 | ) | | | (.11 | ) | | | - | | | | - | | | | - | |
| Distributions from net realized gains | | | - | | | | - | | | | (3.75 | ) | | | (1.62 | ) | | | (3.98 | ) |
| Total dividends and distributions | | | (.03 | ) | | | (.11 | ) | | | (3.75 | ) | | | (1.62 | ) | | | (3.98 | ) |
| Capital Contributions | | | - | * | | | - | | | | - | | | | - | | | | - | |
| Net asset value, end of year | | | $11.87 | | | | $9.66 | | | | $8.22 | | | | $17.07 | | | | $17.19 | |
| Total Return(a) | | | 23.20% | | | | 19.29% | | | | (36.69)% | | | | 8.99% | | | | 11.36% | |
| |
| Ratios/Supplemental Data: | |
| Net assets, end of year (in millions) | | | $4.1 | | | | $4.2 | | | | $17.0 | | | | $40.6 | | | | $47.7 | |
| Ratios to average net assets(c): | | | | | | | | | | | | | | | | | | | | |
| Expenses after advisory fee waiver and expense reimbursement | | | 2.36% | | | | 2.47% | | | | 2.28% | | | | 2.23% | | | | 2.21% | |
| Expenses before advisory fee waiver and expense reimbursement | | | 2.36% | | | | 2.47% | | | | 2.28% | | | | 2.23% | | | | 2.21% | |
| Net investment income (loss) | | | (.08)% | | | | .84% | | | | .43% | | | | (.42)% | | | | (.67)% | |
(a) Total return does not consider the effects of sales load. Total return is calculated assuming a purchase of a share on the first day and a sale on the last day of each year reported and includes reinvestment of dividends and distributions. Total returns may reflect adjustments to conform to generally accepted accounting principles. Total return includes the effect of expense subsidies.
(b) Calculated based on average shares outstanding during the year.
(c) Does not include expenses of the underlying portfolio in which the Fund invests.
* Less than $0.005.
See Notes to Financial Statements.
| | | | |
| Prudential Mid-Cap Value Fund | | | 41 | |
Financial Highlights
continued
| | | | | | | | | | | | | | | | | | | | |
| Class C Shares | |
| | | Year Ended October 31, | |
| | | 2010(b) | | | 2009(b) | | | 2008(b) | | | 2007(b) | | | 2006(b) | |
| Per Share Operating Performance: | | | | | | | | | | | | | | | | | | | | |
| Net Asset Value, Beginning Of Year | | | $9.63 | | | | $8.20 | | | | $17.05 | | | | $17.17 | | | | $19.25 | |
| Income (loss) from investment operations: | | | | | | | | | | | | | | | | | | | | |
| Net investment income (loss) | | | (.01 | ) | | | .03 | | | | .05 | | | | (.07 | ) | | | (.10 | ) |
| Net realized and unrealized gain (loss) on investments | | | 2.25 | | | | 1.51 | | | | (5.15 | ) | | | 1.57 | | | | 2.00 | |
| Total from investment operations | | | 2.24 | | | | 1.54 | | | | (5.10 | ) | | | 1.50 | | | | 1.90 | |
| Less Dividends and Distributions: | | | | | | | | | | | | | | | | | | | | |
| Dividends from net investment income | | | (.03 | ) | | | (.11 | ) | | | - | | | | - | | | | - | |
| Distributions from net realized gains | | | - | | | | - | | | | (3.75 | ) | | | (1.62 | ) | | | (3.98 | ) |
| Total dividends and distributions | | | (.03 | ) | | | (.11 | ) | | | (3.75 | ) | | | (1.62 | ) | | | (3.98 | ) |
| Capital Contributions | | | - | * | | | - | | | | - | | | | - | | | | - | |
| Net asset value, end of year | | | $11.84 | | | | $9.63 | | | | $8.20 | | | | $17.05 | | | | $17.17 | |
| Total Return(a) | | | 23.27% | | | | 19.21% | | | | (36.74)% | | | | 9.00% | | | | 11.45% | |
| |
| Ratios/Supplemental Data: | |
| Net assets, end of year (in millions) | | | $29.9 | | | | $27.8 | | | | $28.8 | | | | $67.3 | | | | $80.2 | |
| Ratios to average net assets(c): | | | | | | | | | | | | | | | | | | | | |
| Expenses after advisory fee waiver and expense reimbursement | | | 2.36% | | | | 2.47% | | | | 2.28% | | | | 2.23% | | | | 2.21% | |
| Expenses before advisory fee waiver and expense reimbursement | | | 2.36% | | | | 2.47% | | | | 2.28% | | | | 2.23% | | | | 2.21% | |
| Net investment income (loss) | | | (.09)% | | | | .43% | | | | .42% | | | | (.42)% | | | | (.58)% | |
(a) Total return does not consider the effects of sales load. Total return is calculated assuming a purchase of a share on the first day and a sale on the last day of each year reported and includes reinvestment of dividends and distributions. Total returns may reflect adjustments to conform to generally accepted accounting principles. Total return includes the effect of expense subsidies.
(b) Calculated based on average shares outstanding during the year.
(c) Does not include expenses of the underlying portfolio in which the Fund invests.
* Less than $0.005.
See Notes to Financial Statements.
| | |
| 42 | | Visit our website at www.prudentialfunds.com |
| | | | | | | | | | | | | | | | | | | | |
| Class L Shares | |
| | | Year Ended October 31, | |
| | | 2010(b) | | | 2009(b) | | | 2008(b) | | | 2007(b) | | | 2006(b) | |
| Per Share Operating Performance: | | | | | | | | | | | | | | | | | | | | |
| Net Asset Value, Beginning Of Year | | | $10.46 | | | | $8.91 | | | | $18.12 | | | | $18.07 | | | | $19.98 | |
| Income (loss) from investment operations: | | | | | | | | | | | | | | | | | | | | |
| Net investment income (loss) | | | .05 | | | | .08 | | | | .12 | | | | .01 | | | | - | * |
| Net realized and unrealized gain (loss) on investments | | | 2.42 | | | | 1.63 | | | | (5.56 | ) | | | 1.66 | | | | 2.07 | |
| Total from investment operations | | | 2.47 | | | | 1.71 | | | | (5.44 | ) | | | 1.67 | | | | 2.07 | |
| Less Dividends and Distributions: | | | | | | | | | | | | | | | | | | | | |
| Dividends from net investment income | | | (.06 | ) | | | (.16 | ) | | | (.02 | ) | | | - | | | | - | |
| Distributions from net realized gains | | | - | | | | - | | | | (3.75 | ) | | | (1.62 | ) | | | (3.98 | ) |
| Total dividends and distributions | | | (.06 | ) | | | (.16 | ) | | | (3.77 | ) | | | (1.62 | ) | | | (3.98 | ) |
| Capital Contributions | | | - | * | | | - | | | | - | | | | - | | | | - | |
| Net asset value, end of year | | | $12.87 | | | | $10.46 | | | | $8.91 | | | | $18.12 | | | | $18.07 | |
| Total Return(a) | | | 23.75% | | | | 19.75% | | | | (36.41)% | | | | 9.54% | | | | 11.99% | |
| |
| Ratios/Supplemental Data: | |
| Net assets, end of year (in millions) | | | $11.9 | | | | $11.5 | | | | $12.5 | | | | $29.1 | | | | $38.3 | |
| Ratios to average net assets(c): | | | | | | | | | | | | | | | | | | | | |
| Expenses after advisory fee waiver and expense reimbursement | | | 1.86% | | | | 1.97% | | | | 1.78% | | | | 1.73% | | | | 1.71% | |
| Expenses before advisory fee waiver and expense reimbursement | | | 1.86% | | | | 1.97% | | | | 1.78% | | | | 1.73% | | | | 1.71% | |
| Net investment income (loss) | | | .41% | | | | .94% | | | | .93% | | | | .08% | | | | (.01)% | |
(a) Total return does not consider the effects of sales load. Total return is calculated assuming a purchase of a share on the first day and a sale on the last day of each year reported and includes reinvestment of dividends and distributions. Total returns may reflect adjustments to conform to generally accepted accounting principles. Total return includes the effect of expense subsidies.
(b) Calculated based on average shares outstanding during the year.
(c) Does not include expenses of the underlying portfolio in which the Fund invests.
* Less than $0.005.
See Notes to Financial Statements.
| | | | |
| Prudential Mid-Cap Value Fund | | | 43 | |
Financial Highlights
continued
| | | | | | | | | | | | | | | | | | | | |
| Class M Shares | |
| | | Year Ended October 31, | |
| | | 2010(b) | | | 2009(b) | | | 2008(b) | | | 2007(b)(e) | | | 2006(b) | |
| Per Share Operating Performance: | | | | | | | | | | | | | | | | | | | | |
| Net Asset Value, Beginning Of Year | | | $9.73 | | | | $8.27 | | | | $17.06 | | | | $17.16 | | | | $19.25 | |
| Income (loss) from investment operations: | | | | | | | | | | | | | | | | | | | | |
| Net investment income (loss) | | | .08 | | | | .11 | | | | .14 | | | | .02 | | | | (.09 | ) |
| Net realized and unrealized gain (loss) on investments | | | 2.25 | | | | 1.50 | | | | (5.10 | ) | | | 1.60 | | | | 1.98 | |
| Total from investment operations | | | 2.33 | | | | 1.61 | | | | (4.96 | ) | | | 1.62 | | | | 1.89 | |
| Less Dividends and Distributions: | | | | | | | | | | | | | | | | | | | | |
| Dividends from net investment income | | | (.09 | ) | | | (.18 | ) | | | - | | | | - | | | | - | |
| Distributions from net realized gains | | | - | | | | - | | | | (3.84 | ) | | | (1.74 | ) | | | (3.98 | ) |
| Total dividends and distributions | | | (.09 | ) | | | (.18 | ) | | | (3.84 | ) | | | (1.74 | ) | | | (3.98 | ) |
| Capital Contributions | | | .01 | | | | .03 | | | | .01 | | | | .02 | | | | - | |
| Net asset value, end of year | | | $11.98 | | | | $9.73 | | | | $8.27 | | | | $17.06 | | | | $17.16 | |
| Total Return(a) | | | 24.19% | | | | 20.42% | | | | (35.54)% | | | | 9.92% | (c) | | | 11.38% | |
| |
| Ratios/Supplemental Data: | |
| Net assets, end of year (in millions) | | | $4.0 | | | | $9.5 | | | | $20.3 | | | | $69.7 | | | | $107.8 | |
| Ratios to average net assets(d): | | | | | | | | | | | | | | | | | | | | |
| Expenses after advisory fee waiver and expense reimbursement | | | 1.61% | | | | 1.72% | | | | 1.67% | | | | 1.69% | | | | 2.21% | |
| Expenses before advisory fee waiver and expense reimbursement | | | 1.61% | | | | 1.72% | | | | 1.67% | | | | 1.69% | | | | 2.21% | |
| Net investment income (loss) | | | .74% | | | | 1.39% | | | | 1.17% | | | | .11% | | | | (.51)% | |
(a) Total return does not consider the effects of sales load. Total return is calculated assuming a purchase of a share on the first day and a sale on the last day of each year reported and includes reinvestment of dividends and distributions. Total returns may reflect adjustments to conform to generally accepted accounting principles. Total return includes the effect of expense subsidies.
(b) Calculated based on average shares outstanding during the year.
(c) Total return has been adjusted to reflect the manager payment for sales charges in excess of regulatory limits. If the manager had not adjusted the Fund, the total return would have been 8.95% for the year ended October 31, 2007.
(d) Does not include expenses of the underlying portfolio in which the Fund invests.
(e) Certain information has been adjusted to reflect a manager payment for sales charges incurred by shareholders in excess of regulatory limits. If the manager had not adjusted the Fund, the per share operating performance would reflect a net investment loss, net realized and unrealized gain on investments and distributions from net unrealized gains of $(.07), $1.56 and $(1.62), respectively. Furthermore, the annual expenses (both after and before fee waiver and expense reimbursement) and net investment income ratios would have been 2.23%, 2.23% and (.43)%, respectively and the ending net asset value would be $17.03 for the year ended October 31, 2007.
See Notes to Financial Statements.
| | |
| 44 | | Visit our website at www.prudentialfunds.com |
| | | | | | | | | | | | | | | | | | | | |
| Class X Shares | |
| | | Year Ended October 31, | |
| | | 2010(b) | | | 2009(b) | | | 2008(b) | | | 2007(b)(c) | | | 2006(b)(c) | |
| Per Share Operating Performance: | | | | | | | | | | | | | | | | | | | | |
| Net Asset Value, Beginning Of Year | | | $9.79 | | | | $8.37 | | | | $17.29 | | | | $17.23 | | | | $19.19 | |
| Income (loss) from investment operations: | | | | | | | | | | | | | | | | | | | | |
| Net investment income | | | .08 | | | | .10 | | | | .15 | | | | .10 | | | | .05 | |
| Net realized and unrealized gain (loss) on investments | | | 2.26 | | | | 1.52 | | | | (5.21 | ) | | | 1.58 | | | | 1.97 | |
| Total from investment operations | | | 2.34 | | | | 1.62 | | | | (5.06 | ) | | | 1.68 | | | | 2.02 | |
| Less Dividends and Distributions: | | | | | | | | | | | | | | | | | | | | |
| Dividends from net investment income | | | (.09 | ) | | | (.21 | ) | | | (.11 | ) | | | - | | | | - | |
| Distributions from net realized gains | | | - | | | | - | | | | (3.75 | ) | | | (1.62 | ) | | | (3.98 | ) |
| Total dividends and distributions | | | (.09 | ) | | | (.21 | ) | | | (3.86 | ) | | | (1.62 | ) | | | (3.98 | ) |
| Capital Contributions | | | .01 | | | | .01 | | | | - | * | | | - | * | | | - | * |
| Net asset value, end of year | | | $12.05 | | | | $9.79 | | | | $8.37 | | | | $17.29 | | | | $17.23 | |
| Total Return(a) | | | 24.15% | | | | 20.15% | | | | (36.07)% | | | | 10.04% | | | | 12.33% | |
| |
| Ratios/Supplemental Data: | |
| Net assets, end of year (in millions) | | | $4.1 | | | | $5.3 | | | | $6.9 | | | | $15.7 | | | | $19.7 | |
| Ratios to average net assets(d): | | | | | | | | | | | | | | | | | | | | |
| Expenses after advisory fee waiver and expense reimbursement | | | 1.61% | | | | 1.72% | | | | 1.48% | | | | 1.23% | | | | 1.38% | |
| Expenses before advisory fee waiver and expense reimbursement | | | 1.61% | | | | 1.72% | | | | 1.48% | | | | 1.23% | | | | 1.38% | |
| Net investment income | | | .69% | | | | 1.24% | | | | 1.23% | | | | .58% | | | | .32% | |
(a) Total return does not consider the effects of sales load. Total return is calculated assuming a purchase of a share on the first day and a sale on the last day of each year reported and includes reinvestment of dividends and distributions. Total returns may reflect adjustments to conform to generally accepted accounting principles. Total return includes the effect of expense subsidies.
(b) Calculated based on average shares outstanding during the year.
(c) Certain information has been adjusted to reflect a manager payment for sales charges incurred by shareholders in excess of regulatory limits. Total Return has not been adjusted to reflect the manager payment for sales charges in excess of regulatory limits.
(d) Does not include expenses of the underlying portfolio in which the Fund invests.
* Less than $0.005.
See Notes to Financial Statements.
| | | | |
| Prudential Mid-Cap Value Fund | | | 45 | |
Financial Highlights
continued
| | | | | | | | | | | | | | | | | | | | |
| Class Z Shares | |
| | | Year Ended October 31, | | | November 28,
2005(d)
through
October 31, | |
| | | 2010(e) | | | 2009(e) | | | 2008(e) | | | 2007(e) | | | 2006(e) | |
| Per Share Operating Performance: | | | | | | | | | | | | | | | | | | | | |
| Net Asset Value, Beginning Of Period | | | $10.72 | | | | $9.14 | | | | $18.50 | | | | $18.30 | | | | $17.08 | |
| Income (loss) from investment operations: | | | | | | | | | | | | | | | | | | | | |
| Net investment income | | | .11 | | | | .11 | | | | .18 | | | | .11 | | | | .05 | |
| Net realized and unrealized gain (loss) on investments | | | 2.49 | | | | 1.69 | | | | (5.68 | ) | | | 1.71 | | | | 1.17 | |
| Total from investment operations | | | 2.60 | | | | 1.80 | | | | (5.50 | ) | | | 1.82 | | | | 1.22 | |
| Less Dividends and Distributions: | | | | | | | | | | | | | | | | | | | | |
| Dividends from net investment income | | | (.11 | ) | | | (.22 | ) | | | (.11 | ) | | | - | | | | - | |
| Distributions from net realized gains | | | - | | | | - | | | | (3.75 | ) | | | (1.62 | ) | | | - | |
| Total dividends and distributions | | | (.11 | ) | | | (.22 | ) | | | (3.86 | ) | | | (1.62 | ) | | | - | |
| Capital Contributions | | | - | * | | | - | | | | - | | | | - | | | | - | |
| Net asset value, end of period | | | $13.21 | | | | $10.72 | | | | $9.14 | | | | $18.50 | | | | $18.30 | |
| Total Return(a) | | | 24.43% | | | | 20.41% | | | | (36.08)% | | | | 10.24% | | | | 7.14% | |
| |
| Ratios/Supplemental Data: | |
| Net assets, end of period (in millions) | | | $16.8 | | | | $16.2 | | | | $8.2 | | | | $13.8 | | | | $12.4 | |
| Ratios to average net assets(c): | | | | | | | | | | | | | | | | | | | | |
Expenses after advisory fee waiver and
expense reimbursement | | | 1.36% | | | | 1.47% | | | | 1.28% | | | | 1.23% | | | | 1.21% | (b) |
Expenses before advisory fee waiver and
expense reimbursement | | | 1.36% | | | | 1.47% | | | | 1.28% | | | | 1.23% | | | | 1.21% | (b) |
| Net investment income | | | .90% | | | | 1.18% | | | | 1.43% | | | | .58% | | | | .32% | (b) |
(a) Total return does not consider the effects of sales load. Total return is calculated assuming a purchase of a share on the first day and a sale on the last day of each period reported and includes reinvestment of dividends and distributions. Total returns may reflect adjustments to conform to generally accepted accounting principles. Total return for periods of less than a full year are not annualized. Total return includes the effect of expense subsidies.
(b) Annualized.
(c) Does not include expenses of the underlying portfolio in which the Fund invests.
(d) Commencement of operations.
(e) Calculated based on average shares outstanding during the period.
* Less than $0.005.
See Notes to Financial Statements.
| | |
| 46 | | Visit our website at www.prudentialfunds.com |
Report of Independent Registered Public
Accounting Firm
The Board of Directors and Shareholders
Prudential Investment Portfolios, Inc. 10:
We have audited the accompanying statement of assets and liabilities of Prudential Mid-Cap Value Fund (formerly Dryden Mid Cap Value Fund), a series of Prudential Investment Portfolios, Inc. 10 (formerly Strategic Partners Mutual Funds, Inc.) (hereafter referred to as the “Fund”), including the portfolio of investments, as of October 31, 2010, and the related statement of operations for the year then ended, the statement of changes in net assets for each of the years in the two-year period then ended and the financial highlights for each of the years in the five-year period then ended. These financial statements and financial highlights are the responsibility of the Fund’s management. Our responsibility is to express an opinion on these financial statements and financial highlights based on our audits.
We conducted our audits in accordance with the standards of the Public Company Accounting Oversight Board (United States). Those standards require that we plan and perform the audit to obtain reasonable assurance about whether the financial statements and financial highlights are free of material misstatement. An audit includes examining, on a test basis, evidence supporting the amounts and disclosures in the financial statements. Our procedures included confirmation of securities owned as of October 31, 2010, by correspondence with the custodian, transfer agent and brokers or by other appropriate auditing procedures when replies from brokers were not received. An audit also includes assessing the accounting principles used and significant estimates made by management, as well as evaluating the overall financial statement presentation. We believe that our audits provide a reasonable basis for our opinion.
In our opinion, the financial statements and financial highlights referred to above present fairly, in all material respects, the financial position of the Fund as of October 31, 2010, and the results of its operations for the year then ended, the changes in its net assets for each of the years in the two-year period then ended and the financial highlights for each of the years in the five-year period then ended, in conformity with U.S. generally accepted accounting principles.

New York, New York
December 20, 2010
| | | | |
| Prudential Mid-Cap Value Fund | | | 47 | |
Tax Information
(Unaudited)
We are required by the Internal Revenue Code of 1986, as amended (“the Code”) to advise you within 60 days of the Fund’s fiscal year end (October 31, 2010), as to the federal income tax status of dividends paid by the Fund during such fiscal year. For the fiscal year ended October 31, 2010, the Fund paid ordinary income dividends of $0.09 for Class A shares, $0.03 for Class B and Class C shares, $0.06 for Class L shares, $0.09 for Class M shares and Class X shares and $0.11 for Class Z shares.
For the year ended October 31, 2010, the Fund designates the maximum amount allowable, but not less than 100% of ordinary income dividends paid during the fiscal year as eligible for the corporate dividend received deduction in accordance with Section 854 of the Internal Revenue Code.
For the year ended October 31, 2010, the Fund designates the maximum amount allowable, but not less than 100% of ordinary income dividends paid during the fiscal year as qualified dividend income in accordance with Section 854 of the Internal Revenue Code.
In January 2011, you will be advised on IRS Form 1099DIV or substitute 1099DIV as to federal tax status of dividends and distributions received by you in calendar year 2010.
| | |
| 48 | | Visit our website at www.prudentialfunds.com |
MANAGEMENT OF THE FUND
(Unaudited)
Information about Fund Directors/Trustees (referred to herein as “Board Members”) and Fund Officers is set forth below. Board Members who are not deemed to be “interested persons,” as defined in the 1940 Act, are referred to as “Independent Board Members.” Board Members who are deemed to be “interested persons” are referred to as “Interested Board Members.” The Board Members are responsible for the overall supervision of the operations of the Fund and perform the various duties imposed on the directors or trustees of investment companies by the 1940 Act.
| | | | |
Independent Board Members (1) |
Name, Address, Age Position(s) Portfolios Overseen | | Principal Occupation(s) During Past Five Years | | Other Directorships Held |
Kevin J. Bannon (58) Board Member Portfolios Overseen: 58 | | Managing Director (since April 2008) and Chief Investment Officer (since October 2008) of Highmount Capital LLC (registered investment adviser); formerly Executive Vice President and Chief Investment Officer (April 1993-August 2007) of Bank of New York Company; President (May 2003-May 2007) of BNY Hamilton Family of Mutual Funds. | | Director of Urstadt Biddle Properties (since September 2008). |
Linda W. Bynoe (58) Board Member Portfolios Overseen: 58 | | President and Chief Executive Officer (since March 1995) and formerly Chief Operating Officer (December 1989- February 1995) of Telemat Ltd. (management consulting); formerly Vice President (January 1985-June 1989) at Morgan Stanley & Co (broker-dealer). | | Director of Simon Property Group, Inc. (retail real estate) (since May 2003); Anixter International, Inc. (communication products distributor) (since January 2006); Director of Northern Trust Corporation (financial services) (since April 2006); Trustee of Equity Residential (residential real estate) (since December 2009); formerly Director of Dynegy Inc. (power generation) (September 2002-May 2006), CitiStreet Funds, Inc. (mutual funds) (May 1993-February 2005), AM- CH, Inc. (restaurant holding company) (November 2004-February 2005). |
Michael S. Hyland, CFA (65) Board Member Portfolios Overseen: 58 | | Independent Consultant (since February 2005); formerly Senior Managing Director (July 2001-February 2005) of Bear Stearns & Co, Inc.; Global Partner, INVESCO (1999-2001); Managing Director and President of Salomon Brothers Asset Management (1989-1999). | | None. |
Prudential Mid-Cap Value Fund
| | | | |
Douglas H. McCorkindale (71) Board Member Portfolios Overseen: 58 | | Formerly Chairman (February 2001-June 2006), Chief Executive Officer (June 2000-July 2005), President (September 1997-July 2005) and Vice Chairman (March 1984-May 2000) of Gannett Co. Inc. (publishing and media). | | Director of Continental Airlines, Inc. (since May 1993); Director of Lockheed Martin Corp. (aerospace and defense) (since May 2001). |
Stephen P. Munn (68) Board Member Portfolios Overseen: 58 | | Lead Director (since 2007) and formerly Chairman (1993-2007) of Carlisle Companies Incorporated (manufacturer of industrial products). | | Lead Director (since 2007) of Carlisle Companies Incorporated (manufacturer of industrial products). |
Richard A. Redeker (67) Board Member Portfolios Overseen: 58 | | Retired Mutual Fund Senior Executive (42 years); Management Consultant; Independent Directors Council (organization of 2,800 Independent Mutual Fund Directors)-Executive Committee, Chair of Policy Steering Committee, Governing Council. | | None. |
Robin B. Smith (71) Board Member & Independent Chair Portfolios Overseen: 58 | | Chairman of the Board (since January 2003) of Publishers Clearing House (direct marketing); formerly Chairman and Chief Executive Officer (August 1996-January 2003) of Publishers Clearing House. | | Formerly Director of BellSouth Corporation (telecommunications) (1992-2006). |
Stephen G. Stoneburn (67) Board Member Portfolios Overseen: 58 | | President and Chief Executive Officer (since June 1996) of Quadrant Media Corp. (publishing company); formerly President (June 1995-June 1996) of Argus Integrated Media, Inc.; Senior Vice President and Managing Director (January 1993-1995) of Cowles Business Media; Senior Vice President of Fairchild Publications, Inc (1975-1989). | | None. |
Visit our website at www.prudentialfunds.com
| | | | |
Interested Board Members (1) | | | | |
Name, Address, Age Position(s) Portfolios Overseen | | Principal Occupation(s) During Past Five Years | | Other Directorships Held |
Judy A. Rice (62) Board Member & President Portfolios Overseen: 58 | | President, Chief Executive Officer, Chief Operating Officer and Officer-In-Charge (since February 2003) of Prudential Investments LLC; President, Chief Executive Officer and Officer-In-Charge (since April 2003) of Prudential Mutual Fund Services LLC; Executive Vice President (since December 2008) of Prudential Investment Management Services LLC; Member of the Board of Directors of Jennison Associates LLC (since November 2010); formerly Vice President (February 1999-April 2006) of Prudential Investment Management Services LLC; formerly President, Chief Executive Officer, Chief Operating Officer and Officer-In-Charge (May 2003-June 2005) and Director (May 2003-March 2006) and Executive Vice President (June 2005-March 2006) of AST Investment Services, Inc.; Member of Board of Governors of the Investment Company Institute. | | None. |
Scott E. Benjamin (37) Board Member & Vice President Portfolios Overseen: 58 | | Executive Vice President (since June 2009) of Prudential Investments LLC and Prudential Investment Management Services LLC; Executive Vice President (since September 2009) of AST Investment Services, Inc.; Senior Vice President of Product Development and Marketing, Prudential Investments (since February 2006); Vice President of Product Development and Product Management, Prudential Investments (2003-2006). | | None. |
| (1) | The year in which each individual joined the Fund’s Board is as follows: Linda W. Bynoe, 2005; Douglas H. McCorkindale, 2003, Richard A. Redeker, 2003; Robin B. Smith, 2003; Stephen G. Stoneburn, 2003; Kevin J. Bannon, 2008; Michael S. Hyland, 2008; Stephen P. Munn, 2008; Judy A. Rice, Board Member and President since 2003; Scott E. Benjamin, Board Member since 2010 and Vice President since 2009. |
Prudential Mid-Cap Value Fund
| | |
Fund Officers (a)(1) |
Name, Address and Age Position with Fund | | Principal Occupation(s) During Past Five Years |
Kathryn L. Quirk (58) Chief Legal Officer | | Vice President and Corporate Counsel (since September 2004) of Prudential; Executive Vice President, Chief Legal Officer and Secretary (since July 2005) of PI and Prudential Mutual Fund Services LLC; Vice President and Corporate Counsel (since June 2005) and Secretary (since February 2006) of AST Investment Services, Inc.; formerly Senior Vice President and Assistant Secretary (November 2004-August 2005) of PI; formerly Assistant Secretary (June 2005-February 2006) of AST Investment Services, Inc.; formerly Managing Director, General Counsel, Chief Compliance Officer, Chief Risk Officer and Corporate Secretary (1997-2002) of Zurich Scudder Investments, Inc. |
Deborah A. Docs (52) Secretary | | Vice President and Corporate Counsel (since January 2001) of Prudential; Vice President (since December 1996) and Assistant Secretary (since March 1999) of PI; formerly Vice President and Assistant Secretary (May 2003-June 2005) of AST Investment Services, Inc. |
Jonathan D. Shain (52) Assistant Secretary | | Vice President and Corporate Counsel (since August 1998) of Prudential; Vice President and Assistant Secretary (since May 2001) of PI; Vice President and Assistant Secretary (since February 2001) of PMFS; formerly Vice President and Assistant Secretary (May 2003-June 2005) of AST Investment Services, Inc. |
Claudia DiGiacomo (36) Assistant Secretary | | Vice President and Corporate Counsel (since January 2005) of Prudential; Vice President and Assistant Secretary of PI (since December 2005); Associate at Sidley Austin Brown & Wood LLP (1999-2004). |
John P. Schwartz (39) Assistant Secretary | | Vice President and Corporate Counsel (since April 2005) of Prudential; Vice President and Assistant Secretary of PI (since December 2005); Associate at Sidley Austin Brown & Wood LLP (1997-2005). |
Andrew R. French (48) Assistant Secretary | | Vice President and Corporate Counsel (since February 2010) of Prudential; formerly Director and Corporate Counsel (2006-2010) of Prudential; Vice President and Assistant Secretary (since January 2007) of PI; Vice President and Assistant Secretary (since January 2007) of PMFS; formerly Senior Legal Analyst of Prudential Mutual Fund Law Department (1997-2006). |
Timothy J. Knierim (51) Chief Compliance Officer | | Chief Compliance Officer of Prudential Investment Management, Inc. (since July 2007); formerly Chief Risk Officer of PIM and PI (2002-2007) and formerly Chief Ethics Officer of PIM and PI (2006-2007). |
Valerie M. Simpson (52) Deputy Chief Compliance Officer | | Chief Compliance Officer (since April 2007) of PI and AST Investment Services, Inc.; formerly Vice President-Financial Reporting (June 1999-March 2006) for Prudential Life and Annuities Finance. |
Theresa C. Thompson (48) Deputy Chief Compliance Officer | | Vice President, Compliance, PI (since April 2004); and Director, Compliance, PI (2001-2004). |
Visit our website at www.prudentialfunds.com
| | |
Noreen M. Fierro (46) Anti-Money Laundering Compliance Officer | | Vice President, Corporate Compliance (since May 2006) of Prudential; formerly Corporate Vice President, Associate General Counsel (April 2002-May 2005) of UBS Financial Services, Inc., in their Money Laundering Prevention Group; Senior Manager (May 2005-May 2006) of Deloitte Financial Advisory Services, LLP, in their Forensic and Dispute Services, Anti-Money Laundering Group. |
Grace C. Torres (51) Treasurer and Principal Financial and Accounting Officer | | Assistant Treasurer (since March 1999) and Senior Vice President (since September 1999) of PI; Assistant Treasurer (since May 2003) and Vice President (since June 2005) of AST Investment Services, Inc.; Senior Vice President and Assistant Treasurer (since May 2003) of Prudential Annuities Advisory Services, Inc.; formerly Senior Vice President (May 2003-June 2005) of AST Investment Services, Inc. |
M. Sadiq Peshimam (46) Assistant Treasurer | | Vice President (since 2005) of Prudential Investments LLC. |
Peter Parrella (52) Assistant Treasurer | | Vice President (since 2007) and Director (2004-2007) within Prudential Mutual Fund Administration; formerly Tax Manager at SSB Citi Fund Management LLC (1997-2004). |
| (a) | Excludes Ms. Rice and Mr. Benjamin, interested Board Members who also serve as President and Vice President, respectively. |
| (1) | The year in which each individual became an Officer of the Fund is as follows: |
Kathryn L. Quirk, 2005; Deborah A. Docs, 2003; Jonathan D. Shain, 2003; Claudia DiGiacomo, 2005; John P. Schwartz, 2006; Andrew R. French, 2006; Timothy J. Knierim, 2007; Valerie M. Simpson, 2007; Theresa C. Thompson, 2008; Noreen M. Fierro, 2006; Grace C. Torres, 2003; Peter Parrella, 2007; M. Sadiq Peshimam, 2006.
Explanatory Notes to Tables:
| | n | Board Members are deemed to be “Interested,” as defined in the 1940 Act, by reason of their affiliation with Prudential Investments LLC and/or an affiliate of Prudential Investments LLC. |
| | n | Unless otherwise noted, the address of all Board Members and Officers is c/o Prudential Investments LLC, Gateway Center Three, 100 Mulberry Street, Newark, New Jersey 07102-4077. |
| | n | There is no set term of office for Board Members or Officers. The Board Members have adopted a retirement policy, which calls for the retirement of Board Members on December 31 of the year in which they reach the age of 75. |
| | n | “Other Directorships Held” includes only directorships of companies required to register or file reports with the Commission under the Securities Exchange Act of 1934, as amended (the “Exchange Act”) (that is, “public companies”) or other investment companies registered under the 1940 Act. |
| | n | “Portfolios Overseen” includes all investment companies managed by Prudential Investments LLC. The investment companies for which PI serves as manager include the Prudential Investments Mutual Funds, The Prudential Variable Contract Accounts, Target Mutual Funds, The Prudential Series Fund, Prudential’s Gibraltar Fund, Inc. and the Advanced Series Trust. |
Prudential Mid-Cap Value Fund
Approval of Advisory Agreements
The Fund’s Board of Directors
The Board of Directors (the “Board”) of Prudential Mid-Cap Value Fund (the “Fund”)1 consists of 10 individuals, eight of whom are not “interested persons” of the Fund, as defined in the Investment Company Act of 1940, as amended (the “1940 Act”) (the “Independent Directors”). The Board is responsible for the oversight of the Fund and its operations, and performs the various duties imposed on the directors of investment companies by the 1940 Act. The Independent Directors have retained independent legal counsel to assist them in connection with their duties. The Chair of the Board is an Independent Director. The Board has established three standing committees: the Audit Committee, the Nominating and Governance Committee, and the Investment Committee. Each committee is chaired by, and composed of, Independent Directors.
Annual Approval of the Fund’s Advisory Agreements
As required under the 1940 Act, the Board determines annually whether to renew the Fund’s management agreement with Prudential Investments LLC (“PI”) and the Fund’s subadvisory agreement with Quantitative Management Associates LLC (“QMA”). In considering the renewal of the agreements, the Board, including all of the Independent Directors, met on June 21-23, 2010 and approved the renewal of the agreements through July 31, 2011, after concluding that the renewal of the agreements was in the best interests of the Fund and its shareholders.
In advance of the meetings, the Board requested and received materials relating to the agreements, and had the opportunity to ask questions and request further information in connection with its consideration. Among other things, the Board considered comparative fee information from PI and QMA. Also, the Board considered comparisons with other mutual funds in relevant Peer Universes and Peer Groups. The mutual funds included in each Peer Universe or Peer Group were objectively determined by Lipper Inc. (“Lipper”), an independent provider of mutual fund data. The comparisons placed the Fund in various quartiles over the one-, three-, and five-year periods ending December 31, 2009, with the first quartile being the best 25% of the mutual funds (for performance, the best performing mutual funds and, for expenses, the lowest cost mutual funds).
In approving the agreements, the Board, including the Independent Directors advised by independent legal counsel, considered the factors it deemed relevant, including the nature, quality and extent of services provided by PI and the subadviser, the performance of the Fund, the profitability of PI and its affiliates, expenses and fees, and the potential for economies of scale that may be shared with the Fund and its
| 1 | Prudential Mid-Cap Value Fund is a series of Prudential Investment Portfolios, Inc. 10. |
Prudential Mid-Cap Value Fund
Approval of Advisory Agreements (continued)
shareholders as the Fund’s assets grow. In their deliberations, the Directors did not identify any single factor which alone was responsible for the Board’s decision to approve the agreements with respect to the Fund. In connection with its deliberations, the Board considered information provided by PI throughout the year at regular Board meetings, presentations from portfolio managers and other information, as well as information furnished at or in advance of the meetings on June 21-23, 2010.
The Directors determined that the overall arrangements between the Fund and PI, which serves as the Fund’s investment manager pursuant to a management agreement, and between PI and QMA, which serves as the Fund’s subadviser pursuant to the terms of a subadvisory agreement with PI, are in the interest of the Fund and its shareholders in light of the services performed, fees charged and such other matters as the Directors considered relevant in the exercise of their business judgment.
The material factors and conclusions that formed the basis for the Directors’ reaching their determinations to approve the continuance of the agreements are separately discussed below.
Nature, Quality, and Extent of Services
The Board received and considered information regarding the nature, quality and extent of services provided to the Fund by PI and QMA. The Board considered the services provided by PI, including but not limited to the oversight of the subadviser for the Fund, as well as the provision of fund recordkeeping, compliance, and other services to the Fund. With respect to PI’s oversight of the subadviser, the Board noted that PI’s Strategic Investment Research Group (“SIRG”), which is a business unit of PI, is responsible for monitoring and reporting to PI’s senior management on the performance and operations of the subadviser. The Board also considered that PI pays the salaries of all of the officers and non-independent Directors of the Fund. The Board also considered the investment subadvisory services provided by QMA, as well as adherence to the Fund’s investment restrictions and compliance with applicable Fund policies and procedures. The Board considered PI’s evaluation of the subadviser, as well as PI’s recommendation, based on its review of the subadviser, to renew the subadvisory agreement.
The Board reviewed the qualifications, backgrounds and responsibilities of PI’s senior management responsible for the oversight of the Fund and QMA, and also reviewed the qualifications, backgrounds and responsibilities of the QMA portfolio managers who are responsible for the day-to-day management of the Fund’s portfolio. The Board was provided with information pertaining to PI’s and QMA’s organizational structure, senior management, investment operations, and other relevant information
Visit our website at www.prudentialfunds.com
pertaining to PI and QMA. The Board also noted that it received favorable compliance reports from the Fund’s Chief Compliance Officer (“CCO”) as to each of PI and QMA. The Board noted that QMA is affiliated with PI.
The Board concluded that it was satisfied with the nature, extent and quality of the investment management services provided by PI and the subadvisory services provided to the Fund by QMA, and that there was a reasonable basis on which to conclude that the Fund benefits from the services provided by PI and QMA under the management and subadvisory agreements.
Performance of the Fund
The Board received and considered information about the Fund’s historical performance. The Board considered that the Fund’s gross performance in relation to its Peer Universe (the Lipper Mid-Cap Value Funds Performance Universe) was in the first quartile over the three-year period, and in the second quartile over the one- and five-year periods. The Board also noted that the Fund outperformed its benchmark index over all periods. The Board concluded that, in light of the Fund’s competitive performance, it would be in the interest of the Fund and its shareholders for the Fund to renew the agreements.
Fees and Expenses
The Board considered the Fund’s actual management fees (which reflects any subsidies, expense caps or waivers) and total expenses both ranked in the Expense Group’s fourth quartile. The Board considered PI’s explanation that the Fund’s fourth quartile ranking for total expenses was attributable to relatively high transfer agency fees resulting from a large number of small balance accounts.
The Board concluded that the management fees and total expenses were reasonable in light of the services provided, including the Fund’s strong performance.
Costs of Services and Profits Realized by PI
The Board was provided with information on the profitability of PI and its affiliates in serving as the Fund’s investment manager. The Board discussed with PI the methodology utilized in assembling the information regarding profitability and considered its reasonableness. The Board recognized that it is difficult to make comparisons of profitability from fund management contracts because comparative information is not generally publicly available and is affected by numerous factors, including the structure of the particular adviser, the types of funds it manages, its business mix, numerous
Prudential Mid-Cap Value Fund
Approval of Advisory Agreements (continued)
assumptions regarding allocations and the adviser’s capital structure and cost of capital. The Board did not separately consider the profitability of the subadviser, an affiliate of PI, as its profitability was reflected in the profitability report for PI. Taking these factors into account, the Board concluded that the profitability of PI and its affiliates in relation to the services rendered was not unreasonable.
Economies of Scale
The Board received and discussed information concerning whether PI realizes economies of scale as the Fund’s assets grow beyond current levels. The Board noted that the management fee schedule for the Fund includes breakpoints, which have the effect of decreasing the fee rate as assets increase, but at the current level of assets the Fund does not realize the effect of those rate reductions. The Board took note that the Fund’s fee structure would result in benefits to Fund shareholders when (and if) assets reach the levels at which the fee rate is reduced. These benefits will accrue whether or not PI is then realizing any economies of scale.
Other Benefits to PI and QMA
The Board considered potential ancillary benefits that might be received by PI and QMA and their affiliates as a result of their relationship with the Fund. The Board concluded that potential benefits to be derived by PI included brokerage commissions received by affiliates of PI, transfer agency fees received by the Fund’s transfer agent (which is affiliated with PI), and benefits to the reputation as well as other intangible benefits resulting from PI’s association with the Fund. The Board concluded that the potential benefits to be derived by QMA included its ability to use soft dollar credits, brokerage commissions received by affiliates of QMA, as well as the potential benefits consistent with those generally resulting from an increase in assets under management, specifically, potential access to additional research resources and benefits to the reputation. The Board concluded that the benefits derived by PI and QMA were consistent with the types of benefits generally derived by investment managers and subadvisers to mutual funds.
After full consideration of these factors, the Board concluded that the approval of the agreements was in the interest of the Fund and its shareholders.
Visit our website at www.prudentialfunds.com
| | | | |
| n MAIL | | n TELEPHONE | | n WEBSITE |
Gateway Center Three 100 Mulberry Street Newark, NJ 07102 | | (800) 225-1852 | | www.prudentialfunds.com |
|
| PROXY VOTING |
| The Board of Directors of the Fund has delegated to the Fund’s investment subadviser the responsibility for voting any proxies and maintaining proxy recordkeeping with respect to the Fund. A description of these proxy voting policies and procedures is available without charge, upon request, by calling (800) 225-1852 or by visiting the Securities and Exchange Commission’s website at www.sec.gov. Information regarding how the Fund voted proxies relating to portfolio securities during the most recent 12-month period ended June 30 is available on the Fund’s website and on the Commission’s website. |
|
| DIRECTORS |
| Kevin J. Bannon • Scott E. Benjamin • Linda W. Bynoe • Michael S. Hyland • Douglas H. McCorkindale • Stephen P. Munn • Richard A. Redeker • Judy A. Rice • Robin B. Smith • Stephen G. Stoneburn |
|
| OFFICERS |
| Judy A. Rice, President • Scott E. Benjamin, Vice President • Grace C. Torres, Treasurer and Principal Financial and Accounting Officer • Kathryn L. Quirk, Chief Legal Officer • Deborah A. Docs, Secretary • Timothy J. Knierim, Chief Compliance Officer • Valerie M. Simpson, Deputy Chief Compliance Officer • Theresa C. Thompson, Deputy Chief Compliance Officer • Noreen M. Fierro, Anti-Money Laundering Compliance Officer • Jonathan D. Shain, Assistant Secretary • Claudia DiGiacomo, Assistant Secretary • John P. Schwartz, Assistant Secretary • Andrew R. French, Assistant Secretary • M. Sadiq Peshimam, Assistant Treasurer • Peter Parrella, Assistant Treasurer |
| | | | |
| MANAGER | | Prudential Investments LLC | | Gateway Center Three
100 Mulberry Street
Newark, NJ 07102 |
|
| INVESTMENT SUBADVISER | | Quantitative Management
Associates LLC | | Gateway Center Two
100 Mulberry Street
Newark, NJ 07102 |
|
| DISTRIBUTORS | | Prudential Annuities
Distributors, Inc. | | One Corporate Drive
Shelton, CT 06484 |
| | |
| | Prudential Investment
Management
Services LLC | | Gateway Center Three
100 Mulberry Street
Newark, NJ 07102 |
|
| CUSTODIAN | | PFPC Trust Company | | 301 Bellevue Parkway
Wilmington, DE 19809 |
|
| TRANSFER AGENT | | Prudential Mutual Fund
Services LLC | | PO Box 9658
Providence, RI 02940 |
|
| INDEPENDENT REGISTERED PUBLIC ACCOUNTING FIRM | | KPMG LLP | | 345 Park Avenue
New York, NY 10154 |
|
| FUND COUNSEL | | Willkie Farr & Gallagher LLP | | 787 Seventh Avenue
New York, NY 10019 |
|
| An investor should consider the investment objectives, risks, charges, and expenses of the Fund carefully before investing. The prospectus for the Fund contains this and other information about the Fund. An investor may obtain a prospectus by visiting our website at www.prudentialfunds.com or by calling (800) 225-1852. The prospectus should be read carefully before investing. |
|
| E-DELIVERY |
| To receive your mutual fund documents online, go to www.prudentialfunds.com/edelivery and enroll. Instead of receiving printed documents by mail, you will receive notification via email when new materials are available. You can cancel your enrollment or change your email address at any time by visiting the website address above. |
|
| SHAREHOLDER COMMUNICATIONS WITH DIRECTORS |
| Shareholders can communicate directly with the Board of Directors by writing to the Chair of the Board, Prudential Mid-Cap Value Fund, Prudential Investments, Attn: Board of Directors, 100 Mulberry Street, Gateway Center Three, Newark, NJ 07102. Shareholders can communicate directly with an individual Director by writing to the same address. Communications are not screened before being delivered to the addressee. |
|
| AVAILABILITY OF PORTFOLIO SCHEDULE |
| The Fund files its complete schedule of portfolio holdings with the Securities and Exchange Commission for the first and third quarters of each fiscal year on Form N-Q. The Fund’s Forms N-Q are available on the Commission’s website at www.sec.gov. The Fund’s Forms N-Q may also be reviewed and copied at the Commission’s Public Reference Room in Washington, D.C. Information on the operation and location of the Public Reference Room may be obtained by calling (202) 551-8090. The Fund’s schedule of portfolio holdings is also available on the Fund’s website as of the end of each fiscal quarter. |
|
| The Fund’s Statement of Additional Information contains additional information about the Fund’s Directors and is available without charge, upon request, by calling (800) 225-1852. |
Mutual Funds:
| | | | |
ARE NOT INSURED BY THE FDIC OR ANY
FEDERAL GOVERNMENT AGENCY | | MAY LOSE VALUE | | ARE NOT A DEPOSIT OF OR GUARANTEED BY ANY BANK OR ANY BANK AFFILIATE |

| | | | | | | | | | | | | | | | | | |
| | | Prudential Mid-Cap Value Fund | | | | | | | | | | | | |
| | | Share Class | | A | | B | | C | | L* | | M** | | X** | | Z | | |
| | NASDAQ | | SPRAX | | SVUBX | | NCBVX | | NABVX | | NBBVX | | NBVZX | | SPVZX | | |
| | CUSIP | | 74441L105 | | 74441L204 | | 74441L303 | | 74441L402 | | 74441L501 | | 74441L600 | | 74441L709 | | |
| | | | | | | | | | | | | | | | | | |
*Closed to most new purchases (with the exception of reinvested dividends and purchases by college savings plans) and available for limited exchanges only.
**Closed to most new purchases (with the exception of reinvested dividends) and available for limited exchanges only.
MF202E 0192529-00001-00

| | |
| ANNUAL REPORT | | OCTOBER 31, 2010 |
Prudential Jennison Equity Income Fund
| | | | |
Fund Type Equity income Objective Income and capital appreciation | | | | This report is not authorized for distribution to prospective investors unless preceded or accompanied by a current prospectus. The views expressed in this report and information about the Fund’s portfolio holdings are for the period covered by this report and are subject to change thereafter. Prudential Investments, Prudential, Jennison, the Prudential logo and the Rock symbol are service marks of Prudential Financial, Inc. and its related entities, registered in many jurisdictions worldwide. |
| | |

| | To enroll in e-delivery, go to www.prudentialfunds.com/edelivery |
December 15, 2010
Dear Shareholder:
We hope you find the annual report for the Prudential Jennison Equity Income Fund informative and useful. Because of ongoing market volatility, we understand that this is a difficult time to be an investor. While it is impossible to predict what the future holds, we continue to believe a prudent response to uncertainty is to maintain a diversified portfolio, including stock and bond mutual funds consistent with your tolerance for risk, time horizon, and financial goals.
A diversified asset allocation offers two potential advantages: It limits your exposure to any particular asset class; plus it provides a better opportunity to invest some of your assets in the right place at the right time. Your financial professional can help you create a diversified investment plan that may include mutual funds covering all the basic asset classes and that reflects your personal investor profile and risk tolerance. Keep in mind that diversification and asset allocation strategies do not assure a profit or protect against loss in declining markets.
Prudential Investments® provides a wide range of mutual funds to choose from that can help you make progress toward your financial goals. Our funds offer the experience, resources, and professional discipline of Prudential Financial’s affiliated asset managers. Most of Prudential Investments’ equity funds are advised by Jennison Associates LLC, Quantitative Management Associates LLC (QMA), or Prudential Real Estate Investors. Prudential Investment Management, Inc. (PIM) advises the Prudential Investments fixed income and money market funds through its Prudential Fixed Income unit. Jennison Associates, QMA, and PIM are registered investment advisers and Prudential Financial companies. Prudential Real Estate Investors is a unit of PIM.
Thank you for choosing the Prudential Investments family of mutual funds.
Sincerely,

Judy A. Rice, President
Prudential Jennison Equity Income Fund
| | | | |
| Prudential Jennison Equity Income Fund | | | 1 | |
Your Fund’s Performance
Performance data quoted represent past performance. Past performance does not guarantee future results. The investment return and principal value of an investment will fluctuate, so that an investor’s shares, when redeemed, may be worth more or less than their original cost. Current performance may be lower or higher than the past performance data quoted. An investor may obtain performance data as of the most recent month-end by visiting our website at www.prudentialfunds.com or by calling (800) 225-1852. Class A and Class L shares have a maximum initial sales charge of 5.50% and 5.75%, respectively. Gross operating expenses: Class A, 1.50%; Class B, 2.20%; Class C, 2.20%; Class L, 1.70%; Class M, 2.20%; Class X, 2.20%; Class Z, 1.20%. Net operating expenses: Class A, 1.44%; Class B, 2.19%; Class C, 2.19%; Class L, 1.69%; Class M, 2.19%; Class X, 2.19%; Class Z, 1.19%, after contractual reduction through 2/29/2012.
| | | | | | | | | | | | | | | | |
| Cumulative Total Returns (Without Sales Charges) as of 10/31/10 | |
| | | One Year | | | Five Years | | | Ten Years | | | Since Inception | |
Class A | | | 25.19 | % | | | 40.27 | % | | | N/A | | | | 49.17% (4/12/04) | |
Class B | | | 24.20 | | | | 35.03 | | | | N/A | | | | 41.60 (4/12/04) | |
Class C | | | 24.25 | | | | 35.22 | | | | 43.72 | % | | | — | |
Class L | | | 24.84 | | | | 38.45 | | | | 50.84 | | | | — | |
Class M | | | 24.22 | | | | 34.93 | | | | 43.51 | | | | — | |
Class X | | | 24.27 | | | | 35.43 | | | | 44.05 | | | | — | |
Class Z | | | 25.45 | | | | N/A | | | | N/A | | | | 16.39 (8/25/08) | |
Lipper Equity Income Funds Index | | | 14.98 | | | | 8.12 | | | | 26.21 | | | | — | |
S&P 500 Index | | | 16.54 | | | | 8.99 | | | | –0.14 | | | | — | |
Lipper Average | | | 16.51 | | | | 13.91 | | | | 37.15 | | | | — | |
| | | | | | | | | | | | | | | | |
| Average Annual Total Returns (With Sales Charges) as of 9/30/10 | |
| | | One Year | | | Five Years | | | Ten Years | | | Since Inception | |
Class A | | | 12.14 | % | | | 4.85 | % | | | N/A | | | | 4.85% (4/12/04) | |
Class B | | | 12.90 | | | | 5.08 | | | | N/A | | | | 4.94 (4/12/04) | |
Class C | | | 16.84 | | | | 5.22 | | | | 3.58 | % | | | — | |
Class L | | | 11.57 | | | | 4.47 | | | | 3.47 | | | | — | |
Class M | | | 11.81 | | | | 4.92 | | | | 3.58 | | | | — | |
Class X | | | 11.84 | | | | 4.85 | | | | 3.61 | | | | — | |
Class Z | | | 19.01 | | | | N/A | | | | N/A | | | | 5.65 (8/25/08) | |
Lipper Equity Income Funds Index | | | 9.83 | | | | 0.58 | | | | 2.27 | | | | — | |
S&P 500 Index | | | 10.18 | | | | 0.64 | | | | –0.43 | | | | — | |
Lipper Average | | | 11.40 | | | | 1.48 | | | | 2.89 | | | | — | |
| | |
| 2 | | Visit our website at www.prudentialfunds.com |
| | | | | | | | | | | | | | | | |
Average Annual Total Returns (With Sales Charges) as of 10/31/10 | |
| | | One Year | | | Five Years | | | Ten Years | | | Since Inception | |
Class A | | | 18.30 | % | | | 5.80 | % | | | N/A | | | | 5.38% (4/12/04) | |
Class B | | | 19.20 | | | | 6.05 | | | | N/A | | | | 5.45 (4/12/04) | |
Class C | | | 23.25 | | | | 6.22 | | | | 3.69 | % | | | — | |
Class L | | | 17.66 | | | | 5.47 | | | | 3.58 | | | | — | |
Class M | | | 18.22 | | | | 5.89 | | | | 3.68 | | | | — | |
Class X | | | 18.27 | | | | 5.82 | | | | 3.72 | | | | — | |
Class Z | | | 25.45 | | | | N/A | | | | N/A | | | | 7.19 (8/25/08) | |
| | | | | | | | | | | | | | | | |
Average Annual Total Returns (Without Sales Charges) as of 10/31/10 | |
| | | One Year | | | Five Years | | | Ten Years | | | Since Inception | |
Class A | | | 25.19 | % | | | 7.00 | % | | | N/A | | | | 6.29% (4/12/04) | |
Class B | | | 24.20 | | | | 6.19 | | | | N/A | | | | 5.45 (4/12/04) | |
Class C | | | 24.25 | | | | 6.22 | | | | 3.69 | % | | | — | |
Class L | | | 24.84 | | | | 6.72 | | | | 4.20 | | | | — | |
Class M | | | 24.22 | | | | 6.17 | | | | 3.68 | | | | — | |
Class X | | | 24.27 | | | | 6.25 | | | | 3.72 | | | | — | |
Class Z | | | 25.45 | | | | N/A | | | | N/A | | | | 7.19 (8/25/08) | |
Growth of a $10,000 Investment
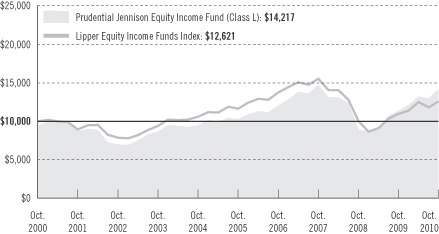
The graph compares a $10,000 investment in the Prudential Jennison Equity Income Fund (Class L shares) with a similar investment in the Lipper Equity Income Funds Index by portraying the initial account values at the beginning of the 10-year period for Class L shares (October 31, 2000) and the account values at the end of the current fiscal year (October 31, 2010) as measured on a quarterly basis. The data are measured from the closest
| | | | |
| Prudential Jennison Equity Income Fund | | | 3 | |
Your Fund’s Performance (continued)
month-end to inception date, and not from the Fund’s actual inception date. For purposes of the graph, and unless otherwise indicated, it has been assumed that (a) the maximum applicable front-end sales charge was deducted from the initial $10,000 investment in Class L shares; (b) all recurring fees (including management fees) were deducted; and (c) all dividends and distributions were reinvested. The line graph provides information for Class L shares only. As indicated in the tables above, performance for Class A, Class B, Class C, Class M, Class X, and Class Z shares will vary due to the differing charges and expenses applicable to each share class (as indicated in the following paragraphs).
Source: Prudential Investments LLC and Lipper Inc. Performance figures may reflect fee waivers and/or expense reimbursements. In the absence of such fee waivers and/or expense reimbursements, total returns would be lower.
Inception returns are provided for any share class with less than 10 calendar years of returns.
The average annual total returns take into account applicable sales charges. Class A and Class L shares are subject to a maximum front-end sales charge of 5.50% and 5.75%, respectively. Class L, Class M, and Class X shares are closed to most new purchases (with the exception of reinvested dividends and purchases by certain college savings plans). Under certain circumstances, Class A and Class L shares may be subject to a contingent deferred sales charge (CDSC) of 1%. Class B, Class C, Class M, and Class X shares are subject to a maximum CDSC of 5%, 1%, 6%, and 6%, respectively. Class Z shares are not subject to a sales charge. Class A shares are subject to a 12b-1 fee of up to 0.30% annually. Class B, Class C, Class M, and Class X shares are subject to a 12b-1 fee of 1%. Class L shares are subject to a 12b-1 fee of 0.50%. Class Z shares are not subject to a 12b-1 fee. Prior to April 12, 2004, Class L shares were known as Class A shares. On April 12, 2004, Class A shares were redesignated as Class L shares and a new Class A was opened. Prior to April 12, 2004, Class M shares were known as Class B shares. On April 12, 2004, Class B shares were redesignated as Class M shares and a new Class B was opened. The returns in the graph and the tables do not reflect the deduction of taxes that a shareholder would pay on Fund distributions or following the redemption of Fund shares. Without a distribution and service (12b-1) fee waiver of 0.05% for Class A shares, the returns would have been lower.
Benchmark Definitions
Standard & Poor’s 500 Composite Stock Price Index
The Standard & Poor’s 500 Composite Stock Price Index (S&P 500 Index) is an unmanaged index of 500 stocks of large U.S. public companies. It gives a broad look at how U.S. stock prices have performed. S&P 500 Index Closest Month-End to Inception cumulative total returns as of 10/31/10 are 20.08% for Class A and Class B; and –3.01% for Class Z. S&P 500 Index Closest Month-End to Inception average annual total returns as of 9/30/10 are 2.27% for Class A and Class B; and –3.21% for Class Z.
Lipper Equity Income Funds Index
Funds in the Lipper Equity Income Funds Index seek relatively high current income and growth of income by investing at least 65% of their portfolio in dividend-paying equity securities. These funds’ gross or net yield must be at least 125% of the average gross or net yield of the U.S. diversified equity fund universe. Lipper Equity Income Funds Index Closest Month-End to Inception cumulative total returns as of 10/31/10 are 22.16% for Class A and Class B; and –2.65% for Class Z. Lipper Equity Income Funds Index Closest Month-End to Inception average annual total returns as of 9/30/10 are 2.66% for Class A and Class B; and –2.67% for Class Z.
| | |
| 4 | | Visit our website at www.prudentialfunds.com |
Lipper Equity Income Funds Average
Funds in the Lipper Equity Income Funds Average (Lipper Average) seek relatively high current income and growth of income through investing 60% or more of their portfolio in dividend-paying equity securities. Lipper Average Closest Month-End to Inception cumulative total returns as of 10/31/10 are 28.64% for Class A and Class B; and –1.02% for Class Z. Lipper Average Closest Month-End to Inception average annual total returns as of 9/30/10 are 3.37% for Class A and Class B; and –1.98% for Class Z.
Investors cannot invest directly in an index or average. The returns for the S&P 500 Index would be lower if they included the effects of sales charges, operating expenses of a mutual fund, or taxes. Returns for the Lipper Average reflect the deduction of operating expenses, but not sales charges or taxes.
| | | | |
Five Largest Holdings expressed as a percentage of net assets as of 10/31/10 | | | | |
B&G Foods, Inc., Food Products | | | 2.5 | % |
CenterPoint Energy, Inc., Multi-Utilities | | | 2.5 | |
ConAgra Foods, Inc., Food Products | | | 2.1 | |
NiSource, Inc., Multi-Utilities | | | 2.0 | |
ProLogis, Real Estate Investment Trusts | | | 2.0 | |
Holdings reflect only long-term investments and are subject to change.
| | | | |
| Prudential Jennison Equity Income Fund | | | 5 | |
Strategy and Performance Overview
How did the Fund perform?
For the 12-month reporting period ended October 31, 2010, the Prudential Jennison Equity Income Fund Class A shares gained 25.19%, which widely exceeded the 14.98% return of the Fund’s benchmark, the Lipper Equity Income Index (the Index) and the 16.51% return of the Lipper Equity Income Funds Average.
How is the Fund managed?
Jennison Associates manages the Fund, whose investment objective is income and capital appreciation. The Fund seeks companies with the ability to sustain and grow their dividends. It employs a value strategy to identify firms that Jennison believes are fundamentally sound but valued at a discount to their true worth, as defined by the value of their earnings, free cash flow, the value of their assets, their private market value, or a combination of these factors.
What was the market environment like for stocks during the period?
U.S. equity market strength at the beginning and end of the fiscal year, aided by continued, albeit slow, economic growth, more than offset declines during the period’s middle months, when expansion appeared to be losing steam.
In late 2009, distressed sale prices, low interest rates, increased mortgage credit, and tax credits stimulated housing activity. Manufacturing activity increased and corporate profits improved largely due to workforce and inventory reductions.
Clouds gathered on the horizon in early 2010, however, as the pace of improvement decelerated. Markets grappled with the effects of reduced stimulus, persistently subpar job growth, and flagging confidence indicators.
In Europe, a sovereign debt crisis in several European Union member states weakened the euro and prompted the European Central Bank to intervene. Attempts in China to cool the domestic property market likewise raised fears that global growth might slow more than anticipated.
Domestic markets saw additional volatility linked to turns in Washington policy debates. In March, an overhaul in the U.S. healthcare system was enacted. In July, the President signed sweeping financial regulatory legislation that expands federal banking and securities regulation, subjecting a wider range of financial companies to government oversight.
At the end of the period, housing activity, consumer spending, retail sales, and personal income were rising, as was consumer confidence. However, business production measures were mixed, overall job growth remained anemic, and credit expansion continued to be weak. Given the overall uncertainty, businesses prolonged their pause in investing and hiring.
| | |
| 6 | | Visit our website at www.prudentialfunds.com |
Which holdings made the largest positive contribution to the Fund’s return?
The consumer staples sector made the most significant contribution to the Fund’s return, largely due to the strong performance of food products companies B&G Foods and Tate & Lyle. B&G Foods manufactures and distributes 16 brands of shelf-stable food products across the U.S., Canada and Puerto Rico. The company’s stock price benefited from sales volume growth and price increases. Jennison continues to like this holding for its strong portfolio of products and attractive dividend yield. Consumer staples holding Tate & Lyle also advanced. The company provides ingredients and products to the food and beverage industry. New management is focused on strategic growth and recently divested the company’s relatively lower margin commodity business in order to reinvest that capital in a higher margin business. As this transition occurs, the company is generating significant free cash flow that should allow it to sustain its attractive dividend yield.
Shares of waste management company IESI-BFC appreciated following the consistent delivery of strong financial results that topped expectations. The company provides non-hazardous solid waste collection and landfill disposal services for municipal, commercial, industrial and residential customers in Canada and the United States. Jennison believes the advantages associated with the company’s merger with Waste Services should allow for significant revenue growth over the next few years.
Which holdings detracted most from the Fund’s performance?
The most significant detractor from performance was Aegean Marine Petroleum Network. The company is a supplier and marketer of marine fuel and lubricants to ocean-going vessels at port and at sea. Aegean purchases fuel from refineries and oil producers and sells it to ship operators, fuel brokers, and other users. The company’s stock price fell following the announcement of second quarter earnings that missed consensus estimates due to higher-than-expected interest expenses and taxes related to the company’s acquisition of Verbeke Bunkering.
Roche Holding declined on news that an advisory panel recommended that the Food and Drug Administration (FDA) revoke approval of the company’s tumor-fighting drug Avastin as a treatment for breast cancer. The decision prompted many Wall Street analysts to reduce their earnings projections for the company. Avastin is the world’s best-selling cancer drug and remains an approved treatment for colon, lung, kidney, and brain cancers.
Another holding that detracted from performance was Microsoft. Corporate upgrades of aging personal computers and moves to Microsoft’s Windows 7 have taken longer than anticipated. Jennison believes Microsoft also faces a threat that notebooks will
| | | | |
| Prudential Jennison Equity Income Fund | | | 7 | |
Strategy and Performance Overview (continued)
be overwhelmed by tablet-style devices in which Windows does not yet have a presence. Given the lack of clear direction, Jennison decided to exit the position.
Were there significant changes to the Fund?
During the reporting period there were no significant changes to the portfolio. Rather, the Fund added or exited individual positions based on company fundamentals and the stock’s risk-reward characteristics. The Fund held derivatives in the form of structured notes, which had a modestly negative effect on performance.
The Portfolio of Investments following this report shows the size of the Fund’s positions at period-end.
| | |
| 8 | | Visit our website at www.prudentialfunds.com |
Comments on the Fund’s Five Largest Holdings
| 2.5% | B&G Foods, Inc., Food Products |
Please see comments on largest contributors to the Fund’s return.
| 2.5% | CenterPoint Energy, Inc., Multi-Utilities |
CenterPoint Energy operates an electric transmission and distribution utility based in Houston as well as a natural gas distribution business. Jennison likes the stability and steady growth of CenterPoint’s regulated utility business and sees significant growth potential in its natural gas pipeline business.
| 2.1% | ConAgra Foods, Inc., Food Products |
ConAgra Foods is a packaged food company that services grocery retailers, restaurants and other foodservice providers. The company’s portfolio of brands includes Chef Boyardee, Healthy Choice, Hebrew National, Hunt’s and Reddi-Wip. Jennison believes ConAgra’s ability to increase prices will offset input cost concerns and the notable increase in new product innovation should drive revenue growth while positively impacting product mix.
| 2.0% | NiSource, Inc., Multi-Utilities |
NiSource is engaged in natural gas transmission, storage and distribution as well as electric generation, transmission and distribution. Jennison likes NiSource for the direction of its regulated utility business and believes increased investment in its natural gas infrastructure business will help drive growth over the long term. Additionally, Jennison thinks the stock’s valuation is attractive as it currently trades below book value.
| 2.0% | ProLogis, Real Estate Investment Trusts |
ProLogis manages and leases industrial space to customers in North America, Europe, and Asia. Recent efforts by management have removed the long standing overhang of significant debt on its balance sheet and possible credit downgrade. Jennison believes they are at a turning point where they can focus on rebalancing their portfolio and growing funds from operations by developing assets. The investment team thinks the company is well positioned to benefit from improving fundamentals in the industrial sector.
| | | | |
| Prudential Jennison Equity Income Fund | | | 9 | |
Fees and Expenses (Unaudited)
As a shareholder of the Fund, you incur two types of costs: (1) transaction costs, including sales charges (loads) on purchase payments and redemptions, as applicable, and (2) ongoing costs, including management fees, distribution and/or service (12b-1) fees, and other Fund expenses, as applicable. This example is intended to help you understand your ongoing costs (in dollars) of investing in the Fund and to compare these costs with the ongoing costs of investing in other mutual funds.
The example is based on an investment of $1,000 invested on May 1, 2010, at the beginning of the period, and held through the six-month period ended October 31, 2010. The example is for illustrative purposes only; you should consult the Prospectus for information on initial and subsequent minimum investment requirements.
The Fund’s transfer agent may charge additional fees to holders of certain accounts that are not included in the expenses shown in the table on the following page. These fees apply to individual retirement accounts (IRAs) and Section 403(b) accounts. As of the close of the six-month period covered by the table, IRA fees included an annual maintenance fee of $15 per account (subject to a maximum annual maintenance fee of $25 for all accounts held by the same shareholder). Section 403(b) accounts are charged an annual $25 fiduciary maintenance fee. Some of the fees may vary in amount, or may be waived, based on your total account balance or the number of Prudential Investments funds, including the Fund, that you own. You should consider the additional fees that were charged to your Fund account over the six-month period when you estimate the total ongoing expenses paid over the period and the impact of these fees on your ending account value, as these additional expenses are not reflected in the information provided in the expense table. Additional fees have the effect of reducing investment returns.
Actual Expenses
The first line for each share class in the table on the following page provides information about actual account values and actual expenses. You may use the information on this line, together with the amount you invested, to estimate the expenses that you paid over the period. Simply divide your account value by $1,000 (for example, an $8,600 account value ÷ $1,000 = 8.6), then multiply the result by the number on the first line under the heading “Expenses Paid During the Six-Month Period” to estimate the expenses you paid on your account during this period.
Hypothetical Example for Comparison Purposes
The second line for each share class in the table on the following page provides information about hypothetical account values and hypothetical expenses based on the Fund’s actual expense ratio and an assumed rate of return of 5% per year before expenses, which is not the Fund’s actual return. The hypothetical account values and
| | |
| 10 | | Visit our website at www.prudentialfunds.com |
expenses may not be used to estimate the actual ending account balance or expenses you paid for the period. You may use this information to compare the ongoing costs of investing in the Fund and other funds. To do so, compare this 5% hypothetical example with the 5% hypothetical examples that appear in the shareholder reports of the other funds.
Please note that the expenses shown in the table are meant to highlight your ongoing costs only and do not reflect any transactional costs such as sales charges (loads). Therefore, the second line for each share class in the table is useful in comparing ongoing costs only and will not help you determine the relative total costs of owning different funds. In addition, if these transactional costs were included, your costs would have been higher.
| | | | | | | | | | | | | | | | | | |
Prudential Jennison
Equity Income Fund | | Beginning Account
Value
May 1, 2010 | | | Ending Account
Value
October 31, 2010 | | | Annualized
Expense Ratio
Based on the
Six-Month Period | | | Expenses Paid
During the
Six-Month Period* | |
| | | | | | | | | | | | | | | | | | |
| Class A | | Actual | | $ | 1,000.00 | | | $ | 1,073.40 | | | | 1.46 | % | | $ | 7.63 | |
| | | Hypothetical | | $ | 1,000.00 | | | $ | 1,017.85 | | | | 1.46 | % | | $ | 7.43 | |
| | | | | | | | | | | | | | | | | | |
| Class B | | Actual | | $ | 1,000.00 | | | $ | 1,069.20 | | | | 2.21 | % | | $ | 11.53 | |
| | | Hypothetical | | $ | 1,000.00 | | | $ | 1,014.06 | | | | 2.21 | % | | $ | 11.22 | |
| | | | | | | | | | | | | | | | | | |
| Class C | | Actual | | $ | 1,000.00 | | | $ | 1,070.20 | | | | 2.21 | % | | $ | 11.53 | |
| | | Hypothetical | | $ | 1,000.00 | | | $ | 1,014.06 | | | | 2.21 | % | | $ | 11.22 | |
| | | | | | | | | | | | | | | | | | |
| Class L | | Actual | | $ | 1,000.00 | | | $ | 1,071.80 | | | | 1.71 | % | | $ | 8.93 | |
| | | Hypothetical | | $ | 1,000.00 | | | $ | 1,016.59 | | | | 1.71 | % | | $ | 8.69 | |
| | | | | | | | | | | | | | | | | | |
| Class M | | Actual | | $ | 1,000.00 | | | $ | 1,069.20 | | | | 2.21 | % | | $ | 11.53 | |
| | | Hypothetical | | $ | 1,000.00 | | | $ | 1,014.06 | | | | 2.21 | % | | $ | 11.22 | |
| | | | | | | | | | | | | | | | | | |
| Class X | | Actual | | $ | 1,000.00 | | | $ | 1,069.40 | | | | 2.21 | % | | $ | 11.53 | |
| | | Hypothetical | | $ | 1,000.00 | | | $ | 1,014.06 | | | | 2.21 | % | | $ | 11.22 | |
| | | | | | | | | | | | | | | | | | |
| Class Z | | Actual | | $ | 1,000.00 | | | $ | 1,074.80 | | | | 1.21 | % | | $ | 6.33 | |
| | | Hypothetical | | $ | 1,000.00 | | | $ | 1,019.11 | | | | 1.21 | % | | $ | 6.16 | |
* Fund expenses (net of fee waivers or subsidies, if any) for each share class are equal to the annualized expense ratio for each share class (provided in the table), multiplied by the average account value over the period, multiplied by the 184 days in the six-month period ended October 31, 2010, and divided by the 365 days in the Fund’s fiscal year ended October 31, 2010 (to reflect the six-month period). Expenses presented in the table include the expenses of any underlying portfolios in which the Fund may invest.
| | | | |
| Prudential Jennison Equity Income Fund | | | 11 | |
Portfolio of Investments
as of October 31, 2010
| | | | | | |
| Shares | | Description | | Value (Note 2) | |
| | | | | | |
LONG-TERM INVESTMENTS 94.8% | |
COMMON STOCKS 82.6% | | | | |
| |
Air Freight & Logistics 1.9% | | | | |
| 154,518 | | United Parcel Service, Inc. (Class B Stock) | | $ | 10,405,242 | |
| | | | | | |
| | |
Airlines 1.1% | | | | | | |
| 179,254 | | Ryanair Holdings PLC, ADR (Ireland) | | | 5,849,058 | |
| | | | | | |
| |
Capital Markets 1.4% | | | | |
| 47,044 | | Goldman Sachs Group, Inc. (The) | | | 7,571,732 | |
| | | | | | |
| | |
Chemicals 0.9% | | | | | | |
| 89,884 | | Scotts Miracle-Gro Co. (The) (Class A Stock) | | | 4,799,806 | |
| | | | | | |
| |
Commercial Services & Supplies 3.6% | | | | |
| 234,823 | | IESI-BFC Ltd. (NYSE) (Canada) | | | 5,490,162 | |
| 144,700 | | IESI-BFC Ltd. (TSX) (Canada) | | | 3,386,596 | |
| 187,575 | | Republic Services, Inc. | | | 5,591,611 | |
| 131,256 | | Waste Management, Inc. | | | 4,688,464 | |
| | | | | | |
| | | | | 19,156,833 | |
| | | | | | |
| |
Communications Equipment 1.9% | | | | |
| 22,538 | | Juniper Networks, Inc. | | | 730,006 | |
| 204,706 | | QUALCOMM, Inc. | | | 9,238,382 | |
| | | | | | |
| | | | | 9,968,388 | |
| | | | | | |
| |
Construction & Engineering 1.3% | | | | |
| 635,865 | | Ferrovial SA (Spain) | | | 7,249,935 | |
| | | | | | |
| |
Diversified Financial Services 0.9% | | | | |
| 79,279 | | JPMorgan Chase & Co. | | | 2,983,269 | |
| 100,000 | | TCW Energy Partners LLC, 144A
(original cost $2,000,000; purchased 12/14/07)(b)(d) | | | 1,951,682 | |
| | | | | | |
| | | | | 4,934,951 | |
| | | | | | |
| |
Diversified Telecommunication Services 9.3% | | | | |
| 250,161 | | Alaska Communications Systems Group, Inc. | | | 2,509,115 | |
| 355,273 | | AT&T, Inc. | | | 10,125,280 | |
| 171,836 | | CenturyLink, Inc.(a) | | | 7,110,574 | |
| 617,963 | | City Telecom HK Ltd., ADR (Hong Kong) | | | 8,021,160 | |
See Notes to Financial Statements.
| | | | |
| Prudential Jennison Equity Income Fund | | | 13 | |
Portfolio of Investments
as of October 31, 2010 continued
| | | | | | |
| Shares | | Description | | Value (Note 2) | |
| | | | | | |
COMMON STOCKS (Continued) | | | | |
| |
Diversified Telecommunication Services (cont’d.) | | | | |
| 321,250 | | Consolidated Communications Holdings, Inc. | | $ | 5,949,550 | |
| 956,147 | | Frontier Communications Corp.(a) | | | 8,394,971 | |
| 202,498 | | Otelco, Inc. (One Share of Class A Common Stock and $7.50 Principal amount of 13% senior subordinated notes due 2019), IDS(a) | | | 3,359,442 | |
| 329,899 | | Windstream Corp. | | | 4,176,521 | |
| | | | | | |
| | | | | 49,646,613 | |
| | | | | | |
| |
Electric Utilities 2.9% | | | | |
| 289,052 | | FirstEnergy Corp. | | | 10,498,368 | |
| 169,034 | | UIL Holdings Corp. | | | 4,895,225 | |
| | | | | | |
| | | | | 15,393,593 | |
| | | | | | |
| |
Food & Staples Retailing 0.9% | | | | |
| 89,095 | | Wal-Mart Stores, Inc. | | | 4,826,276 | |
| | | | | | |
| |
Food Products 9.0% | | | | |
| 1,087,302 | | B&G Foods, Inc. | | | 13,319,450 | |
| 494,515 | | ConAgra Foods, Inc. | | | 11,121,642 | |
| 195,846 | | Kraft Foods, Inc. (Class A Stock) | | | 6,319,950 | |
| 114,628 | | Smucker, (J.M.) Co. (The) | | | 7,368,288 | |
| 1,280,521 | | Tate & Lyle PLC (United Kingdom) | | | 10,300,307 | |
| | | | | | |
| | | | | 48,429,637 | |
| | | | | | |
| |
Gas Utilities 1.3% | | | | |
| 145,390 | | ONEOK, Inc. | | | 7,243,330 | |
| | | | | | |
| |
Hotels, Restaurants & Leisure 1.0% | | | | |
| 106,070 | | Yum! Brands, Inc. | | | 5,256,829 | |
| | | | | | |
| |
Independent Power Producers & Energy Traders 1.4% | | | | |
| 465,424 | | Northland Power Income Fund (Canada) | | | 7,301,485 | |
| | | | | | |
| |
Internet Software & Services 1.2% | | | | |
| 252,579 | | Rackspace Hosting, Inc.*(a) | | | 6,304,372 | |
| | | | | | |
| |
IT Services 2.0% | | | | |
| 74,131 | | International Business Machines Corp. | | | 10,645,212 | |
| | | | | | |
See Notes to Financial Statements.
| | |
| 14 | | Visit our website at www.prudentialfunds.com |
| | | | | | |
| Shares | | Description | | Value (Note 2) | |
| | | | | | |
COMMON STOCKS (Continued) | | | | |
| |
Machinery 0.5% | | | | |
| 247,100 | | New Flyer Industries, Inc. (One Share of Common Stock and $5.53 Principal amount of 14% subordinated notes), IDS (Canada) | | $ | 2,800,741 | |
| | | | | | |
| |
Media 2.0% | | | | |
| 338,975 | | Comcast Corp. (Class A Stock) | | | 6,976,105 | |
| 252,478 | | News Corp. (Class A Stock) | | | 3,650,832 | |
| | | | | | |
| | | | | 10,626,937 | |
| | | | | | |
| |
Multi-Utilities 6.3% | | | | |
| 797,573 | | CenterPoint Energy, Inc. | | | 13,207,809 | |
| 206,678 | | National Grid PLC, ADR (United Kingdom)(a) | | | 9,813,071 | |
| 630,689 | | NiSource, Inc. | | | 10,917,227 | |
| | | | | | |
| | | | | 33,938,107 | |
| | | | | | |
| |
Oil, Gas & Consumable Fuels 8.7% | | | | |
| 154,710 | | Baytex Energy Trust, UTS (Canada) | | | 5,764,271 | |
| 216,809 | | Bonavista Energy Trust, UTS (Canada) | | | 5,476,027 | |
| 182,127 | | Crescent Point Energy Corp., (Canada) | | | 7,214,365 | |
| 52,200 | | Crescent Point Energy Corp., 144A (Canada) | | | 2,067,732 | |
| 170,000 | | NAL Oil & Gas Trust, 144A, UTS (Canada) | | | 2,051,868 | |
| 249,500 | | NAL Oil & Gas Trust, UTS (Canada) | | | 3,011,418 | |
| 142,100 | | Pembina Pipeline Corp. UTS (Canada) | | | 3,072,169 | |
| 388,100 | | Peyto Energy Trust (Canada) | | | 5,879,150 | |
| 332,003 | | Spectra Energy Corp. | | | 7,891,711 | |
| 102,409 | | Vermilion Energy, Inc. (Canada) | | | 4,010,408 | |
| | | | | | |
| | | | | 46,439,119 | |
| | | | | | |
| |
Pharmaceuticals 4.2% | | | | |
| 311,817 | | Bristol-Myers Squibb Co. | | | 8,387,877 | |
| 160,673 | | Merck & Co., Inc. | | | 5,829,217 | |
| 473,758 | | Pfizer, Inc. | | | 8,243,389 | |
| | | | | | |
| | | | | 22,460,483 | |
| | | | | | |
| |
Real Estate Investment Trusts 8.5% | | | | |
| 127,245 | | Annaly Capital Management, Inc.(a) | | | 2,253,509 | |
| 951,528 | | Chimera Investment Corp. | | | 3,901,265 | |
| 99,618 | | Digital Realty Trust, Inc.(a) | | | 5,950,183 | |
| 548,093 | | First Potomac Realty Trust(a) | | | 9,032,573 | |
See Notes to Financial Statements.
| | | | |
| Prudential Jennison Equity Income Fund | | | 15 | |
Portfolio of Investments
as of October 31, 2010 continued
| | | | | | |
| Shares | | Description | | Value (Note 2) | |
| | | | | | |
COMMON STOCKS (Continued) | | | | |
| |
Real Estate Investment Trusts (cont’d.) | | | | |
| 192,080 | | HCP, Inc.(a) | | $ | 6,916,801 | |
| 849,984 | | MFA Financial, Inc. | | | 6,723,373 | |
| 786,873 | | ProLogis(a) | | | 10,740,816 | |
| | | | | | |
| | | | | 45,518,520 | |
| | | | | | |
| |
Real Estate Management & Development 0.6% | | | | |
| 212,648 | | Hudson Pacific Properties, Inc. | | | 3,402,368 | |
| | | | | | |
| |
Road & Rail 1.4% | | | | |
| 209,439 | | J.B. Hunt Transport Services, Inc. | | | 7,531,426 | |
| | | | | | |
| |
Semiconductors & Semiconductor Equipment 2.2% | | | | |
| 190,445 | | Intel Corp. | | | 3,822,231 | |
| 299,288 | | Xilinx, Inc.(a) | | | 8,023,911 | |
| | | | | | |
| | | | | 11,846,142 | |
| | | | | | |
| |
Software 1.4% | | | | |
| 255,000 | | Oracle Corp. | | | 7,497,000 | |
| | | | | | |
| |
Tobacco 3.0% | | | | |
| 198,229 | | Altria Group, Inc. | | | 5,038,981 | |
| 62,723 | | Lorillard, Inc. | | | 5,352,781 | |
| 95,730 | | Philip Morris International, Inc. | | | 5,600,205 | |
| | | | | | |
| | | | | 15,991,967 | |
| | | | | | |
| |
Transportation Infrastructure 0.9% | | | | |
| 317,582 | | Aegean Marine Petroleum Network, Inc. (Marshall Island) | | | 5,084,488 | |
| | | | | | |
| |
Wireless Telecommunication Services 0.9% | | | | |
| 80,247 | | America Movil SAB de CV (Class L Stock), ADR (Mexico) | | | 4,594,943 | |
| | | | | | |
| | TOTAL COMMON STOCKS
(cost $400,561,921) | | | 442,715,533 | |
| | | | | | |
See Notes to Financial Statements.
| | |
| 16 | | Visit our website at www.prudentialfunds.com |
| | | | | | |
| Shares | | Description | | Value (Note 2) | |
| | | | | | |
PREFERRED STOCKS 7.1% | | | | |
| |
Commercial Banks 0.7% | | | | |
| 186,609 | | National Bank of Greece SA, Series A, 9.00%(a) | | $ | 3,926,253 | |
| | | | | | |
| |
Electric Utilities 0.9% | | | | |
| 78,436 | | Great Plains Energy, Inc., CVT, 12.00% | | | 5,019,904 | |
| | | | | | |
| |
Food Products 0.7% | | | | |
| 6,500 | | Bunge Ltd., CVT, 5.125% | | | 3,828,500 | |
| | | | | | |
| |
Leisure Equipment & Products 1.3% | | | | |
| 11,720 | | Callaway Golf Co., Series B, CVT, 7.50%(b) | | | 1,371,111 | |
| 46,500 | | Callaway Golf Co., Series B, 144A, CVT, 7.50%(b) | | | 5,364,938 | |
| | | | | | |
| | | | | 6,736,049 | |
| | | | | | |
| |
Oil, Gas & Consumable Fuels 1.3% | | | | |
| 28,902 | | Whiting Petroleum Corp., CVT, 6.25% | | | 6,933,156 | |
| | | | | | |
| |
Pharmaceuticals 0.6% | | | | |
| 2,500 | | Mylan, Inc., CVT, 6.50% | | | 2,974,025 | |
| | | | | | |
| |
Real Estate Investment Trusts 1.6% | | | | |
| 345,000 | | DuPont Fabros Redeemable Perpetual, 7.875%* | | | 8,607,750 | |
| | | | | | |
| | TOTAL PREFERRED STOCKS
(cost $33,479,665) | | | 38,025,637 | |
| | | | | | |
| | | | | | | | | | | | |
| | | | |
Moody’s
Ratings†
(Unaudited) | | | | | Principal
Amount (000)# | | Description | | | |
CONVERTIBLE BONDS 5.1% | | | | | | |
| | |
Electric Utilities 0.9% | | | | | | |
| NR | | | | | | $ 8,100 | | PPL Corp., Equity Unit(b) 9.50%, 07/01/13 | | | 4,502,790 | |
| | | | | | | | | | | | |
See Notes to Financial Statements.
| | | | |
| Prudential Jennison Equity Income Fund | | | 17 | |
Portfolio of Investments
as of October 31, 2010 continued
| | | | | | | | | | | | |
Moody’s
Ratings†
(Unaudited) | | | Principal
Amount
(000)# | | | Description | | Value
(Note 2) | |
| | | | | | | | | | | | |
| CONVERTIBLE BONDS (Continued) | | | | |
| |
| Investment Banking & Brokerage 3.3% | | | | |
| | NR | | | $ | 7,000 | | | GS Dividend Linked Notes, 144A
(original cost $7,000,000; purchased 08/06/10)(b)(d)
1.45%, 01/04/13 | | $ | 7,647,481 | |
| | NR | | | | 20,357 | | | GS Juniper Networks Note, 144A
(original cost $6,493,915; purchased 10/27/10)(b)(d)
6.55%, 05/03/11 | | | 6,471,726 | |
| | NR | | | | 12,000 | | | MS Juniper networks, Notes, 144A, MTN(b)
4.42%, 02/24/11 | | | 3,626,400 | |
| | | | | | | | | | | | |
| | | | | | | | | | | 17,745,607 | |
| | | | | | | | | | | | |
| |
| Wireless Telecommunication Services 0.9% | | | | |
| | NR | | | | 1,400 | | | SBA Communications Corp.,
Notes
4.00%, 10/01/14 | | | 2,033,500 | |
| | NR | | | | 2,000 | | | Notes, 144A
4.00%, 10/01/14(b) | | | 2,905,000 | |
| | | | | | | | | | | | |
| | | | | | | | | | | 4,938,500 | |
| | | | | | | | | | | | |
| | | | | | | | TOTAL CONVERTIBLE BONDS
(cost $24,805,529) | | | 27,186,897 | |
| | | | | | | | | | | | |
| | | | | | | | TOTAL LONG-TERM INVESTMENTS
(cost $458,847,115) | | | 507,928,067 | |
| | | | | | | | | | | | |
| | | | | | | | |
| | |
Shares | | | | | | |
| SHORT-TERM INVESTMENT 14.3% | |
|
| AFFILIATED MONEY MARKET MUTUAL FUND | |
| | 76,662,298 | | | Prudential Investment Portfolios 2 - Prudential Core Taxable Money Market Fund (cost $76,662,298; includes $46,243,013 of cash collateral for securities on loan)(c)(e) | | | 76,662,298 | |
| | | | | | | | |
| | | | TOTAL INVESTMENTS(f) 109.1%
(cost $535,509,413; Note 5) | | | 584,590,365 | |
| | | | Liabilities in excess of other assets (9.1)% | | | (48,561,577 | ) |
| | | | | | | | |
| | | | NET ASSETS 100.0% | | $ | 536,028,788 | |
| | | | | | | | |
See Notes to Financial Statements.
| | |
| 18 | | Visit our website at www.prudentialfunds.com |
The following abbreviations are used in the Portfolio descriptions:
144A—Security was purchased pursuant to Rule 144A under the Securities Act of 1933 and may not be resold subject to that rule except to qualified institutional buyers. Unless otherwise noted, 144A securities are deemed to be liquid.
ADR—American Depositary Receipt
CVT—Convertible Security
IDS—Income Depositary Receipt
MTN—Medium Term Note
NR—Not Rated by Moody’s or Standard & Poor’s
NYSE—New York Stock Exchange
TSX—Toronto Stock Exchange
UTS—Unit Trust Security
| † | The rating reflected as of October 31, 2010. Rating of certain bonds may have changed subsequently to that date. |
| # | Principal amount is shown in U.S. dollars unless otherwise stated. |
| * | Non-income producing security. |
| (a) | All or a portion of security is on loan. The aggregate market value of such securities, including those sold and pending settlement, is $45,449,655; cash collateral of $46,243,013 (included with liabilities) was received with which the Portfolio purchased highly liquid short-term investments. |
| (b) | Indicates a security or securities that have been deemed illiquid. |
| (c) | Represents security, or a portion thereof, purchased with cash collateral received for securities on loan. |
| (d) | Private Placement restricted as to resale and does not have a readily available market. The aggregate original cost of such securities is $15,493,915. The aggregate value of $16,070,889 is approximately 3.0% of net assets. |
| (e) | Prudential Investments LLC, the manager of the Fund also serves as manager of the Prudential Investment Portfolio 2—Prudential Core Taxable Money Market Fund. |
| (f) | As of October 31, 2010, 1 security representing $1,951,682 and 0.4% of net assets was fair valued in accordance with the policies adopted by the Board of Trustees. |
The industry classification of investments and liabilities in excess of other assets shown as a percentage of net assets as of October 31, 2010 were as follows:
| | | | |
Affiliated Money Market Mutual Fund
(8.6% represents investments purchased with collateral from securities on loan) | | | 14.3 | % |
Real Estate Investment Trusts | | | 10.1 | |
Oil, Gas & Consumable Fuels | | | 10.0 | |
Food Products | | | 9.7 | |
Diversified Telecommunication Services | | | 9.3 | |
Multi-Utilities | | | 6.3 | |
Pharmaceuticals | | | 4.8 | |
Electric Utilities | | | 4.7 | |
Commercial Services & Supplies | | | 3.6 | |
Investment Banking & Brokerage | | | 3.3 | |
Tobacco | | | 3.0 | |
Semiconductors & Semiconductor Equipment | | | 2.2 | |
IT Services | | | 2.0 | |
Media | | | 2.0 | |
See Notes to Financial Statements.
| | | | |
| Prudential Jennison Equity Income Fund | | | 19 | |
Portfolio of Investments
as of October 31, 2010 continued
| | | | |
| Industry (cont’d.) | | | | |
Air Freight & Logistics | | | 1.9 | % |
Communications Equipment | | | 1.9 | |
Wireless Telecommunication Services | | | 1.8 | |
Capital Markets | | | 1.4 | |
Road & Rail | | | 1.4 | |
Software | | | 1.4 | |
Independent Power Producers & Energy Traders | | | 1.4 | |
Construction & Engineering | | | 1.3 | |
Gas Utilities | | | 1.3 | |
Leisure Equipment & Products | | | 1.3 | |
Internet Software & Services | | | 1.2 | |
Airlines | | | 1.1 | |
Hotels, Restaurants & Leisure | | | 1.0 | |
Transportation Infrastructure | | | 0.9 | |
Diversified Financial Services | | | 0.9 | |
Food & Staples Retailing | | | 0.9 | |
Chemicals | | | 0.9 | |
Commercial Banks | | | 0.7 | |
Real Estate Management & Development | | | 0.6 | |
Machinery | | | 0.5 | |
| | | | |
| | | 109.1 | |
Liabilities in excess of other assets | | | (9.1 | ) |
| | | | |
| | | 100.0 | % |
| | | | |
Various inputs are used in determining the value of the Fund’s investments. These inputs are summarized in the three broad levels listed below.
Level 1—quoted prices in active markets for identical securities, generally for stocks and mutual funds with daily NAVs
Level 2—other significant observable inputs (including quoted prices for similar securities, interest rates, prepayment speeds, credit risk, etc., and amortized cost), generally for foreign stocks priced through vendor modeling tools and debt securities
Level 3—significant unobservable inputs (including the Fund’s own assumptions in determining the fair value of investments)
See Notes to Financial Statements.
| | |
| 20 | | Visit our website at www.prudentialfunds.com |
The following is a summary of the inputs used as of October 31, 2010 in valuing the Fund’s assets carried at fair value:
| | | | | | | | | | | | |
| | | Level 1 | | | Level 2 | | | Level 3 | |
Investments in Securities | | | | | | | | | | | | |
Common Stocks | | $ | 440,763,851 | | | $ | — | | | $ | 1,951,682 | |
Preferred Stocks | | | 38,025,637 | | | | — | | | | — | |
Convertible Bonds | | | — | | | | 27,186,897 | | | | — | |
Affiliated Money Market Mutual Fund | | | 76,662,298 | | | | — | | | | — | |
| | | | | | | | | | | | |
Total | | $ | 555,451,786 | | | $ | 27,186,897 | | | $ | 1,951,682 | |
| | | | | | | | | | | | |
The Fund invested in various derivative instruments during the reporting period. The primary type of risk associated with these derivative instruments is equity risk.
The effect of such derivative instruments on the Fund’s financial position and financial performance as reflected in the Statement of Assets and Liabilities and Statement of Operations is presented in the summary below.
The Fund did not hold any derivative instruments as of October 31, 2010, accordingly, no derivative positions were presented in the Statement of Assets and Liabilities.
The effects of derivative instruments on the Statement of Operations for the year ended October 31, 2010 are as follows:
| | | | | | | | | | | | |
Amount of Realized Gain or (Loss) on Derivatives Recognized in Income | |
Derivatives not accounted for as hedging
instruments, carried at fair value | | Purchased
Options | | | Written
Options | | | Total | |
Equity contracts | | $ | 79,498 | | | $ | 24,000 | | | $ | 103,498 | |
| | | | | | | | | | | | |
For the year ended October 31, 2010, the Fund did not have any unrealized appreciation or (depreciation) on derivatives recognized in income.
For the year ended October 31, 2010, the average premium received for written options was $4,800.
See Notes to Financial Statements.
| | | | |
| Prudential Jennison Equity Income Fund | | | 21 | |
Statement of Assets and Liabilities
as of October 31, 2010
| | | | |
Assets | | | | |
Investments at value, including securities on loan of $45,449,655: | | | | |
Unaffiliated Investments (cost $458,847,115) | | $ | 507,928,067 | |
Affiliated Investments (cost $76,662,298) | | | 76,662,298 | |
Cash | | | 7,816,582 | |
Receivable for Fund shares sold | | | 22,560,812 | |
Receivable for investments sold | | | 4,540,401 | |
Dividends and interest receivable | | | 1,408,425 | |
Prepaid expenses | | | 4,941 | |
| | | | |
Total assets | | | 620,921,526 | |
| | | | |
| |
Liabilities | | | | |
Payable to broker for collateral for securities on loan | | | 46,243,013 | |
Payable for investments purchased | | | 27,765,409 | |
Payable for Fund shares redeemed | | | 10,183,248 | |
Advisory fee payable | | | 327,574 | |
Accrued expenses | | | 171,113 | |
Distribution fee payable | | | 164,830 | |
Affiliated transfer agent fee payable | | | 33,736 | |
Deferred directors’ fee | | | 3,815 | |
| | | | |
Total liabilities | | | 84,892,738 | |
| | | | |
| |
Net Assets | | $ | 536,028,788 | |
| | | | |
| | | | | |
Net assets were comprised of: | | | | |
Common stock, at $.001 par value | | $ | 42,073 | |
Paid-in capital in excess of par | | | 528,290,420 | |
| | | | |
| | | 528,332,493 | |
Undistributed net investment income | | | 1,722,027 | |
Accumulated net realized loss on investment and foreign currency transactions | | | (43,106,910 | ) |
Net unrealized appreciation (depreciation) on investments and foreign currencies | | | 49,081,178 | |
| | | | |
Net assets, October 31, 2010 | | $ | 536,028,788 | |
| | | | |
See Notes to Financial Statements.
| | |
| 22 | | Visit our website at www.prudentialfunds.com |
| | | | |
Class A: | | | | |
Net asset value and redemption price per share
($313,707,405 ÷ 24,285,579 shares of common stock issued and outstanding) | | $ | 12.92 | |
Maximum sales charge (5.5% of offering price) | | | 0.75 | |
| | | | |
Offering price per share | | $ | 13.67 | |
| | | | |
| |
Class B: | | | | |
Net asset value, offering price and redemption price per share
($16,816,831 ÷ 1,370,146 shares of common stock issued and outstanding) | | $ | 12.27 | |
| | | | |
| |
Class C: | | | | |
Net asset value, offering price and redemption price per share
($107,291,938 ÷ 8,760,909 shares of common stock issued and outstanding) | | $ | 12.25 | |
| | | | |
| |
Class L: | | | | |
Net asset value, offering price and redemption price per share
($17,940,613 ÷ 1,399,109 shares of common stock issued and outstanding) | | $ | 12.82 | |
| | | | |
| |
Class M: | | | | |
Net asset value, offering price and redemption price per share
($4,761,162 ÷ 388,246 shares of common stock issued and outstanding) | | $ | 12.26 | |
| | | | |
| |
Class X: | | | | |
Net asset value, offering price and redemption price per share
($5,084,587 ÷ 415,441 shares of common stock issued and outstanding) | | $ | 12.24 | |
| | | | |
| |
Class Z: | | | | |
Net asset value, offering price and redemption price per share
($70,426,252 ÷ 5,453,346 shares of common stock issued and outstanding) | | $ | 12.91 | |
| | | | |
See Notes to Financial Statements.
| | | | |
| Prudential Jennison Equity Income Fund | | | 23 | |
Statement of Operations
Year Ended October 31, 2010
| | | | |
Net Investment Income | | | | |
Investment Income | | | | |
Unaffiliated dividend income | | $ | 12,401,484 | |
Interest income | | | 376,764 | |
Affiliated income from securities lending, net | | | 67,842 | |
Affiliated dividend income | | | 25,863 | |
Foreign taxes withheld | | | (471,513 | ) |
| | | | |
Total income | | | 12,400,440 | |
| | | | |
| |
Expenses | | | | |
Advisory fee | | | 2,091,450 | |
Distribution fee—Class A | | | 356,351 | |
Distribution fee—Class B | | | 81,882 | |
Distribution fee—Class C | | | 490,728 | |
Distribution fee—Class L | | | 88,144 | |
Distribution fee—Class M | | | 81,480 | |
Distribution fee—Class X | | | 64,568 | |
Transfer agent’s fee and expenses (including affiliated of $165,000) | | | 454,000 | |
Tax expense | | | 90,000 | |
Custodian’s fees and expenses | | | 82,000 | |
Registration fees | | | 81,000 | |
Reports to shareholders | | | 72,000 | |
Audit fees | | | 25,000 | |
Legal fees and expenses | | | 22,000 | |
Directors’ fees | | | 16,000 | |
Insurance fees | | | 3,000 | |
Miscellaneous | | | 14,601 | |
| | | | |
Total expenses | | | 4,114,204 | |
Less: Advisory fee waivers and expense reimbursements | | | (31,258 | ) |
| | | | |
Net expenses | | | 4,082,946 | |
| | | | |
Net investment income | | | 8,317,494 | |
| | | | |
| |
Realized And Unrealized Gain (Loss) On Investment And Foreign Currency Transactions | | | | |
Net realized gain (loss) on: | | | | |
Investment transactions | | | 4,789,319 | |
Written options | | | 24,000 | |
Foreign currency transactions | | | (137,741 | ) |
| | | | |
| | | 4,675,578 | |
| | | | |
Net change in unrealized appreciation (depreciation) on: | | | | |
Investments | | | 44,623,556 | |
Foreign currencies | | | (30,516 | ) |
| | | | |
| | | 44,593,040 | |
| | | | |
Net gain on investments and foreign currencies | | | 49,268,618 | |
| | | | |
Net Increase In Net Assets Resulting From Operations | | $ | 57,586,112 | |
| | | | |
See Notes to Financial Statements.
| | |
| 24 | | Visit our website at www.prudentialfunds.com |
Statement of Changes in Net Assets
| | | | | | | | |
| | | Year Ended October 31, | |
| | | 2010 | | | 2009 | |
Increase (Decrease) In Net Assets | | | | | | | | |
Operations | | | | | | | | |
Net investment income | | $ | 8,317,494 | | | $ | 5,424,249 | |
Net realized gain (loss) on investment and foreign currency transactions | | | 4,675,578 | | | | (28,154,880 | ) |
Net change in unrealized appreciation (depreciation) on investments and foreign currencies | | | 44,593,040 | | | | 52,025,222 | |
| | | | | | | | |
Net increase in net assets resulting from operations | | | 57,586,112 | | | | 29,294,591 | |
| | | | | | | | |
| | |
Dividends and Distributions (Note 1) | | | | | | | | |
Dividends from net investment income | | | | | | | | |
Class A | | | (6,563,049 | ) | | | (590,362 | ) |
Class B | | | (317,393 | ) | | | (38,103 | ) |
Class C | | | (1,906,319 | ) | | | (274,873 | ) |
Class L | | | (844,391 | ) | | | (206,801 | ) |
Class M | | | (362,623 | ) | | | (249,769 | ) |
Class X | | | (278,862 | ) | | | (133,216 | ) |
Class Z | | | (575,619 | ) | | | (10 | ) |
| | | | | | | | |
Total dividends | | | (10,848,256 | ) | | | (1,493,134 | ) |
| | | | | | | | |
| | |
Fund share transactions (Note 4) | | | | | | | | |
Net proceeds from shares sold | | | 394,173,232 | | | | 20,423,724 | |
Net asset value of shares issued in reinvestment of dividends and distributions | | | 9,674,929 | | | | 1,409,556 | |
Cost of shares redeemed | | | (59,552,099 | ) | | | (26,916,228 | ) |
| | | | | | | | |
Increase (decrease) in net assets from Fund share transactions | | | 344,296,062 | | | | (5,082,948 | ) |
| | | | | | | | |
| | |
Capital Contributions (Note 5) | | | | | | | | |
Proceeds from regulatory settlement | | | 5,611 | | | | — | |
| | | | | | | | |
Total increase in net assets | | | 391,039,529 | | | | 22,718,509 | |
| | |
Net Assets | | | | | | | | |
Beginning of year | | | 144,989,259 | | | | 122,270,750 | |
| | | | | | | | |
End of year(a) | | $ | 536,028,788 | | | $ | 144,989,259 | |
| | | | | | | | |
(a) Includes undistributed net investment income of | | $ | 1,722,027 | | | $ | 1,971,850 | |
| | | | | | | | |
See Notes to Financial Statements.
| | | | |
| Prudential Jennison Equity Income Fund | | | 25 | |
Notes to Financial Statements
1. Organization
Prudential Investments Portfolios, Inc. 10 (the “Company”) is an open-end management investment company, registered under the Investment Company Act of 1940, as amended. The Company was organized on March 5, 1997, as a Maryland Corporation. The Company operates as a series company. At October 31, 2010, the Company consisted of two diversified investment portfolios (each a “Fund” and collectively the “Funds”). The information presented in these financial statements pertains to Prudential Jennison Equity Income Fund (the “Fund”). The investment objective of the Fund is long term capital growth and income by investing primarily in common stocks that are believed to be selling at reasonable valuation in relation to their fundamental business prospects.
2. Significant Accounting Policies
The following accounting policies are in conformity with accounting principles generally accepted in the United States of America. Such policies are consistently followed by the Company and the Funds in the preparation of their financial statements.
Securities Valuation: Securities listed on a securities exchange (other than options on securities and indices) are valued at the last sale price on such exchange on the day of valuation or, if there was no sale on such day, at the mean between the last reported bid and asked prices, or at the last bid price on such day in the absence of an asked price. Securities that are actively traded via NASDAQ are valued at the official closing price as provided by NASDAQ. Securities that are actively traded in the over-the-counter market, including listed securities for which primary market is believed by Prudential Investments LLC (“PI” or “Manager”) in consultation with the subadviser, to be over-the-counter, are valued at market value using prices provided by an independent pricing agent or principal market maker. Futures contracts and options thereon traded on a commodities exchange or board of trade are valued at the last sale price at the close of trading on such exchange or board of trade or, if there was no sale on the applicable commodities exchange or board of trade on such day, at the mean between the most recently quoted prices on such exchange or board of trade or at the last bid price in the absence of an asked price. Prices may be obtained from independent pricing services which use information provided by market makers or estimates of market values obtained from yield data relating to investments or securities with similar characteristics. Securities for which reliable
| | |
| 26 | | Visit our website at www.prudentialfunds.com |
market quotations are not readily available, or whose values have been affected by events occurring after the close of the security’s foreign market and before the Fund’s normal pricing time, are valued at fair value in accordance with the Board of Directors’ approved fair valuation procedures. When determining the fair valuation of securities some of the factors influencing the valuation include, the nature of any restrictions on disposition of the securities; assessment of the general liquidity of the securities; the issuer’s financial condition and the markets in which it does business; the cost of the investment; the size of the holding and the capitalization of issuer; the prices of any recent transactions or bids/offers for such securities or any comparable securities; any available analyst media or other reports or information deemed reliable by the investment adviser regarding the issuer or the markets or industry in which it operates. Using fair value to price securities may result in a value that is different from a security’s most recent closing price and from the price used by other mutual funds to calculate their net asset value.
Investments in open end, non exchange-traded mutual funds are valued at the net asset value as of the close of the New York Stock Exchange on the date of valuation.
Foreign Currency Translation: Fund securities and other assets and liabilities denominated in foreign currencies are translated each business day into U.S. dollars based on the current rates of exchange. Purchases and sales of Fund securities and income and expenses are translated into U.S. dollars on the respective dates of such transactions. Gains and losses resulting from changes in exchange rates applicable to long-term foreign securities are not reported separately from gains and losses arising from movements in securities prices. Net realized foreign exchange gains and losses include gains and losses from sales and maturities of foreign currency exchange contracts, gains and losses realized between the trade and settlement dates of foreign securities transactions, and the difference between the amount of net investment income accrued on foreign securities and the U.S. dollar amount actually received. Net unrealized foreign exchange gains and losses include gains and losses from changes in the value of assets and liabilities other than Fund securities, resulting from changes in exchange rates.
Options: The Fund may either purchase or write options in order to hedge against adverse market movements or fluctuations in value caused by changes in prevailing interest rates or foreign currency exchange rates with respect to securities or financial instruments which the Fund currently owns or intends to purchase. The Fund’s principal reason for writing options is to realize, through receipt of premiums, a greater current return than would be realized on the underlying security alone. When the Fund purchases an option, it pays a premium and an amount equal to that premium is recorded as an asset. When the Fund writes an option, it receives a
| | | | |
| Prudential Jennison Equity Income Fund | | | 27 | |
Notes to Financial Statements
continued
premium and an amount equal to that premium is recorded as a liability. The asset or liability is adjusted daily to reflect the current market value of the option.
If an option expires unexercised, the Fund realizes a gain or loss to the extent of the premium received or paid. If an option is exercised, the premium received or paid is recorded as an adjustment to the proceeds from the sale or the cost basis of the purchase. The difference between the premium and the amount received or paid on at a closing purchase or sale transaction is also treated as a realized gain or loss. Gain or loss on purchased options is included in net realized gain or loss on investment transactions. Gain or loss on written options is presented separately as net realized gain or loss on written options transactions.
The Fund, as writer of an option, may have no control over whether the underlying securities or financial instruments may be sold (called) or purchased (put). As a result, the Fund bears the market risk of an unfavorable change in the price of the security or financial instrument underlying the written option. Over-the-counter options involve the risk of the potential inability of the counterparties to meet the terms of their contracts.
When a Fund writes an option on a swap, an amount equal to any premium received by the Fund is recorded as a liability and is subsequently adjusted to the current market value of the written option on the swap. If a call option on a swap is exercised, the Fund becomes obligated to pay a fixed interest rate (noted as the strike price) and receive a variable interest rate on a notional amount. If a put option on a swap is exercised, the Fund becomes obligated to pay a variable interest rate and receive a fixed interest rate (noted as the strike price) on a notional amount. Premiums received from writing options on swaps that expire or are exercised are treated as realized gains upon the expiration or exercise of such options on swaps. The risk associated with writing put and call options on swaps is that the Fund will be obligated to be party to a swap agreement if an option on a swap is exercised.
Repurchase Agreements: A repurchase agreement is a commitment to purchase securities from a seller who agrees to repurchase the securities at an agreed-upon price and date. The excess of the resale price over the purchase price determines the yield on the transaction. Under the terms of the agreement, the market value, including accrued interest, of the securities will be at least equal to their repurchase price. Repurchase agreements are recorded at cost, which, combined with accrued interest, approximates market value.
| | |
| 28 | | Visit our website at www.prudentialfunds.com |
Repurchase agreements bear a risk of loss in the event that the seller defaults on its obligation to repurchase the securities. In such case, the Fund may be delayed or prevented from exercising its right to dispose of the securities.
Securities Lending: The Funds may lend their portfolio securities to broker-dealers. The loans are secured by collateral at least equal at all times to the market value of the securities loaned. Loans are subject to termination at the option of the borrower or the Funds. Upon termination of the loan, the borrower will return to the lender securities identical to the loaned securities. Should the borrower of the securities fail financially, the Funds have the right to repurchase the securities using the collateral in the open market. The Funds recognize income, net of any rebate and securities lending agent fees, for lending its securities in the form of fees or interest on the investment of any cash received as collateral. The Funds also continue to receive interest and dividends or amounts equivalent thereto, on the securities loaned and recognize any unrealized gain or loss in the market price of the securities loaned that may occur during the term of the loan.
Securities Transactions and Investment Income: Securities transactions are recorded on the trade date. Realized gains or losses on sales of investments and currency transactions are calculated on the identified cost basis. Dividend income is recorded on the ex-dividend date and interest income is recorded on the accrual basis. The Fund amortizes premiums and discounts on portfolio securities as adjustments to interest income. Expenses are recorded on the accrual basis which may require the use of certain estimates by management.
Net investment income or loss (other than distribution fees, which are charged directly to the respective class) and unrealized and realized gains or losses are allocated daily to each class of shares based upon the relative proportion of net assets of each class at the beginning of the day.
Dividends and Distributions to Shareholders: Distributions to shareholders are recorded on the ex-divided date. Dividends, if any, from net investment income are declared and paid at least quarterly. These dividends and distributions are determined in accordance with federal income tax regulations and may differ from accounting principles generally accepted in the United States of America.
Net realized gains from investment transactions, if any are distributed at least annually. Permanent book/tax differences relating to income and gains are reclassified to paid-in capital when they arise.
Taxes: For federal income tax purposes, each Fund in the Company is treated as a separate tax paying entity. It is the Funds’ policy to continue to meet the requirements
| | | | |
| Prudential Jennison Equity Income Fund | | | 29 | |
Notes to Financial Statements
continued
of the Internal Revenue Code applicable to regulated investment companies and to distribute all of its taxable net income and capital gains, if any, to shareholders. Therefore, no federal tax provision is required. Withholding taxes on foreign dividends are recorded net of reclaimable amounts, at the time the related income is earned.
Estimates: The preparation of the financial statements requires management to make estimates and assumptions that affect the reported amounts and disclosures in the financial statements. Actual results could differ from those estimates.
3. Agreements
The Fund has entered into investment management agreements with PI which provides that the Manager will furnish the Fund with investment advice and investment management and administrative services. The Manager has entered into a subadvisory agreement with Jennison Associates LLC.
Advisory Fees and Expense Limitations: The Manager receives a fee, computed daily and paid monthly, based on an annual rate of the average net assets. The Manager pays the subadvisor a fee as compensation for advisory services provided to the Fund. The Manager has voluntarily agreed to waive expenses in accordance with limitation expense policies as noted in the table below. The Manager will reimburse the Fund for its operating expenses, exclusive of taxes, interest, brokerage commissions, distribution fees and extraordinary expenses, but inclusive of the advisory fee, which in the aggregate exceed specified percentages of the Fund’s average net assets while retaining their ability to be reimbursed for such fee waivers prior to the end of the fiscal year. The advisory fee and expense limitation are summarized as follows:
| | | | |
Advisory Expense | | Effective Advisory Fees
Net of Waiver | | Fees
Limitation |
| 0.85% to $500 million; | | 0.85% | | 1.15% |
| 0.80% next $500 million; | | | | |
| 0.75% in excess of $1 billion | | | | |
Such contractual fee waivers or reductions have been calculated prior to any fee reimbursements with respect to the expense limitations, and may be rescinded at any time and without notice to investors. All reimbursements by the Manager are reflected in the Statements of Operations.
Certain officers and directors of the Funds are officers or directors of the Manager. The Funds pay no compensation directly to their officers or interested directors.
| | |
| 30 | | Visit our website at www.prudentialfunds.com |
Prudential Investment Management Services LLC (“PIMS”) and American Skandia Marketing, Incorporated (“ASMI”), both affiliates of Prudential Investments LLC and an indirect, wholly-owned subsidiary of Prudential serve as the distributor of the Fund. The Company has adopted a separate Distribution and Service plan (each a “Plan” and collectively the “Plans”) for Class A, B, C, L, M, X and Z shares of each Fund in accordance with the requirements of Rule 12b-1 of the Investment Company Act of 1940. No distribution or service fees are paid to PIMS as distributor for Class Z shares.
Under the Plans, the Fund compensate PIMS and ASMI a distribution and service fee at an annual rate up to 0.30%, 1.00%, 1.00%, 0.50%, 1.00% and 1.00% of the average daily net assets of the Class A, B, C, L, M and X shares, respectively. Through February 29, 2012, PIMS has contractually agreed to limit such fees to 0.25% of the average daily net assets of the Class A shares.
During the year ended October 31, 2010, PIMS has advised the Fund, front-end sales charges (“FESC”) and gross contingent deferred sales charges (“CDSC”) were as follows:
| | | | | | | | | | |
Class A
FESC | | Class A
CDSC | | Class B
CDSC | | Class C
CDSC | | Class M
CDSC | | Class X
CDSC |
| $1,497,849 | | $1,036 | | $22,136 | | $11,499 | | $3,958 | | $1,648 |
4. Other Transactions with Affiliates
Prudential Mutual Fund Services LLC (“PMFS”), an affiliate of Prudential Investments LLC and an indirect, wholly-owned subsidiary of Prudential, serves as the Fund’s transfer agent. Transfer agent fees and expenses are shown in the Statements of Operations.
The Fund pays networking fees to affiliated and unaffiliated broker/dealers, including fees relating to the services of Wells Fargo, LLC (“Wells Fargo”), an affiliate of PI through December 31, 2009. These networking fees are payments made to broker/dealers that clear mutual fund transactions through a national clearing system. For the year ended October 31, 2010, the Fund incurred approximately $107,900 in total networking fees, of which approximately $1,600 was paid to Wells Fargo. These amounts are included in transfer agent fees and expenses in the Statement of Operations.
The Fund invests in the Prudential Core Taxable Money Market Fund (the “Core Fund”), a portfolio of the Prudential Investment Portfolios 2 registered under the Investment Company Act of 1940, as amended, and managed by PI. Earnings from
| | | | |
| Prudential Jennison Equity Income Fund | | | 31 | |
Notes to Financial Statements
continued
the Core Fund are disclosed on the Statement of Operations as affiliated dividend income.
Prudential Investment Management, Inc. (“PIM”), an indirect, wholly-owned subsidiary of Prudential, served as the Fund’s securities lending agent. For the year ended October 31, 2010, PIM has been compensated approximately $22,200 for these services.
5. Shares of Capital Stock
Class A shares are sold with a front-end sales charge of up to 5.50%. Purchases of $1 million or more are subject to a contingent deferred sales charge (“CDSC”) if shares are redeemed within 12 months of their purchase. Class B shares are sold with a CDSC which declines from 5% to zero depending upon the period of time the shares are held. Class B shares will automatically convert to Class A shares approximately seven years after purchase. Class M shares will automatically convert to Class A shares approximately eight years after purchase. Class C shares are sold with a CDSC of 1% during the first 12 months. Class L shares are closed to most new purchases (with the exception of reinvested dividends and purchases by certain college savings plans). Class M shares are also closed to most new purchases (with the exception of reinvested dividends). Class L shares and Class M shares are only exchangeable with Class L shares and Class M shares, respectively, offered by the other Prudential Investments Funds. Class X shares are closed to new purchases. Class Q and Class Z shares are not subject to any sales or redemption charge and are offered exclusively for a sale to a limited group of investors. The authorized capital stock of the Funds is 5.5 billion shares, with a par value of $.001 per share. Of the Company’s authorized capital stock, 400 million authorized shares have been allocated to the Fund and divided into nine classes, designated Class A, Class B, Class C, Class L, Class M, Class Q, Class R, Class X and Class Z capital stock. Class A consists of 90 million authorized shares. Class B, Class L, Class M and Class X shares each consist of 10 million authorized shares. Class C consists of 75 million authorized shares. Class Q, Class R and Class Z shares each consist of 65 million authorized shares. Class R and Class Q will commence on or about January 18, 2011.
For the year ended October 31, 2010 the Fund received $5,611 related to settlement of regulatory proceedings involving allegations of improper trading. The amounts relating to an affiliate and third party were $2,709 and $2,902, respectively.
| | |
| 32 | | Visit our website at www.prudentialfunds.com |
The total amount is presented in the Fund’s statement of changes in net assets. The Fund was not involved in the proceedings or the calculation of the payment.
Transactions in shares of capital were as follows:
| | | | | | | | |
Class A | | Shares | | | Amount | |
Year ended October 31, 2010: | | | | | | | | |
Shares sold | | | 19,212,861 | | | $ | 233,415,430 | |
Shares issued in reinvestment of dividends and distributions | | | 507,305 | | | | 6,039,148 | |
Shares reacquired | | | (3,345,082 | ) | | | (39,318,804 | ) |
| | | | | | | | |
Net increase (decrease) in shares outstanding before conversion | | | 16,375,084 | | | | 200,135,774 | |
Shares issued upon conversion from Class B, Class M and Class X | | | 975,962 | | | | 11,599,063 | |
| | | | | | | | |
Net increase (decrease) in shares outstanding | | | 17,351,046 | | | $ | 211,734,837 | |
| | | | | | | | |
Year ended October 31, 2009: | | | | | | | | |
Shares sold | | | 1,574,591 | | | $ | 15,407,901 | |
Shares issued in reinvestment of dividends and distributions | | | 71,554 | | | | 552,250 | |
Shares reacquired | | | (1,391,270 | ) | | | (12,238,721 | ) |
| | | | | | | | |
Net increase (decrease) in shares outstanding before conversion | | | 254,875 | | | | 3,721,430 | |
Shares issued upon conversion from Class B, Class M and Class X | | | 1,485,293 | | | | 13,281,873 | |
| | | | | | | | |
Net increase (decrease) in shares outstanding | | | 1,740,168 | | | $ | 17,003,303 | |
| | | | | | | | |
Class B | | | | | | |
Year ended October 31, 2010: | | | | | | | | |
Shares sold | | | 1,042,501 | | | $ | 12,036,820 | |
Shares issued in reinvestment of dividends and distributions | | | 23,128 | | | | 261,749 | |
Shares reacquired | | | (122,446 | ) | | | (1,376,757 | ) |
| | | | | | | | |
Net increase (decrease) in shares outstanding before conversion | | | 943,183 | | | | 10,921,812 | |
Shares reacquired upon conversion into Class A | | | (14,611 | ) | | | (165,963 | ) |
| | | | | | | | |
Net increase (decrease) in shares outstanding | | | 928,572 | | | $ | 10,755,849 | |
| | | | | | | | |
Year ended October 31, 2009: | | | | | | | | |
Shares sold | | | 133,883 | | | $ | 1,184,156 | |
Shares issued in reinvestment of dividends and distributions | | | 4,915 | | | | 36,257 | |
Shares reacquired | | | (65,742 | ) | | | (537,845 | ) |
| | | | | | | | |
Net increase (decrease) in shares outstanding before conversion | | | 73,056 | | | | 682,568 | |
Shares reacquired upon conversion into Class A | | | (3,047 | ) | | | (26,885 | ) |
| | | | | | | | |
Net increase (decrease) in shares outstanding | | | 70,009 | | | $ | 655,683 | |
| | | | | | | | |
| | | | |
| Prudential Jennison Equity Income Fund | | | 33 | |
Notes to Financial Statements
continued
| | | | | | | | |
Class C | | Shares | | | Amount | |
Year ended October 31, 2010: | | | | | | | | |
Shares sold | | | 6,736,938 | | | $ | 78,127,438 | |
Shares issued in reinvestment of dividends and distributions | | | 140,872 | | | | 1,591,522 | |
Shares reacquired | | | (769,256 | ) | | | (8,594,389 | ) |
| | | | | | | | |
Net increase (decrease) in shares outstanding | | | 6,108,554 | | | $ | 71,124,571 | |
| | | | | | | | |
Year ended October 31, 2009: | | | | | | | | |
Shares sold | | | 361,578 | | | $ | 3,353,254 | |
Shares issued in reinvestment of dividends and distributions | | | 34,904 | | | | 256,782 | |
Shares reacquired | | | (574,291 | ) | | | (4,739,575 | ) |
| | | | | | | | |
Net increase (decrease) in shares outstanding | | | (177,809 | ) | | $ | (1,129,539 | ) |
| | | | | | | | |
Class L | | | | | | |
Year ended October 31, 2010: | | | | | | | | |
Shares sold | | | 8,644 | | | $ | 99,354 | |
Shares issued in reinvestment of dividends and distributions | | | 69,803 | | | | 819,919 | |
Shares reacquired | | | (269,784 | ) | | | (3,178,990 | ) |
| | | | | | | | |
Net increase (decrease) in shares outstanding | | | (191,337 | ) | | $ | (2,259,717 | ) |
| | | | | | | | |
Year ended October 31, 2009: | | | | | | | | |
Shares sold | | | 5,698 | | | $ | 56,942 | |
Shares issued in reinvestment of dividends and distributions | | | 26,126 | | | | 200,584 | |
Shares reacquired | | | (433,408 | ) | | | (3,748,181 | ) |
| | | | | | | | |
Net increase (decrease) in shares outstanding | | | (401,584 | ) | | $ | (3,490,655 | ) |
| | | | | | | | |
Class M | | | | | | |
Year ended October 31, 2010: | | | | | | | | |
Shares sold | | | 9,510 | | | $ | 106,392 | |
Shares issued in reinvestment of dividends and distributions | | | 29,835 | | | | 334,748 | |
Shares reacquired | | | (156,847 | ) | | | (1,754,632 | ) |
| | | | | | | | |
Net increase (decrease) in shares outstanding before conversion | | | (117,502 | ) | | | (1,313,492 | ) |
Shares reacquired upon conversion into Class A | | | (666,114 | ) | | | (7,520,254 | ) |
| | | | | | | | |
Net increase (decrease) in shares outstanding | | | (783,616 | ) | | $ | (8,833,746 | ) |
| | | | | | | | |
Year ended October 31, 2009: | | | | | | | | |
Shares sold | | | 12,484 | | | $ | 100,748 | |
Shares issued in reinvestment of dividends and distributions | | | 31,623 | | | | 233,065 | |
Shares reacquired | | | (434,412 | ) | | | (3,502,770 | ) |
| | | | | | | | |
Net increase (decrease) in shares outstanding before conversion | | | (390,305 | ) | | | (3,168,957 | ) |
Shares reacquired upon conversion into Class A | | | (1,154,160 | ) | | | (9,804,921 | ) |
| | | | | | | | |
Net increase (decrease) in shares outstanding | | | (1,544,465 | ) | | $ | (12,973,878 | ) |
| | | | | | | | |
| | |
| 34 | | Visit our website at www.prudentialfunds.com |
| | | | | | | | |
Class X | | Shares | | | Amount | |
Year ended October 31, 2010: | | | | | | | | |
Shares sold | | | 12,798 | | | $ | 143,145 | |
Shares issued in reinvestment of dividends and distributions | | | 24,459 | | | | 274,244 | |
Shares reacquired | | | (110,948 | ) | | | (1,241,284 | ) |
| | | | | | | | |
Net increase (decrease) in shares outstanding before conversion | | | (73,691 | ) | | | (823,895 | ) |
Shares reacquired upon conversion into Class A | | | (347,131 | ) | | | (3,912,846 | ) |
| | | | | | | | |
Net increase (decrease) in shares outstanding | | | (420,822 | ) | | $ | (4,736,741 | ) |
| | | | | | | | |
Year ended October 31, 2009: | | | | | | | | |
Shares sold | | | 27,204 | | | $ | 230,831 | |
Shares issued in reinvestment of dividends and distributions | | | 17,753 | | | | 130,608 | |
Shares reacquired | | | (267,040 | ) | | | (2,149,106 | ) |
| | | | | | | | |
Net increase (decrease) in shares outstanding before conversion | | | (222,083 | ) | | | (1,787,667 | ) |
Shares reacquired upon conversion into Class A | | | (403,347 | ) | | | (3,450,067 | ) |
| | | | | | | | |
Net increase (decrease) in shares outstanding | | | (625,430 | ) | | $ | (5,237,734 | ) |
| | | | | | | | |
Class Z | | | | | | |
Year ended October 31, 2010: | | | | | | | | |
Shares sold | | | 5,765,732 | | | $ | 70,244,653 | |
Shares issued in reinvestment of dividends and distributions | | | 29,320 | | | | 353,599 | |
Shares reacquired | | | (350,206 | ) | | | (4,087,243 | ) |
| | | | | | | | |
Net increase (decrease) in shares outstanding | | | 5,444,846 | | | $ | 66,511,009 | |
| | | | | | | | |
Year ended October 31, 2009: | | | | | | | | |
Shares sold | | | 8,418 | | | $ | 89,892 | |
Shares issued in reinvestment of dividends and distributions | | | 1 | | | | 10 | |
Shares reacquired | | | (3 | ) | | | (30 | ) |
| | | | | | | | |
Net increase (decrease) in shares outstanding | | | 8,416 | | | $ | 89,872 | |
| | | | | | | | |
6. Distributions and Tax Information
Distributions to shareholders, which are determined in accordance with federal income tax regulations, which may differ from generally accepted accounting principles, are recorded on the ex-dividend date. In order to present undistributed net investment income, accumulated net realized loss on investment and foreign currency transactions and paid-in capital in excess of par on the Statement of Assets and Liabilities that more closely represent their tax character, certain adjustments have been made to undistributed net investment income, accumulated net realized loss on investment and foreign currency transactions and paid-in capital in excess of par. For the fiscal year ended October 31, 2010, the adjustments were to increase undistributed net investment income by $2,280,939, to increase accumulated net realized loss on investment and foreign currency transactions by $2,190,756 and decrease paid-in capital in excess of par by $90,183 due to the different treatment
| | | | |
| Prudential Jennison Equity Income Fund | | | 35 | |
Notes to Financial Statements
continued
for book and tax purposes of certain transactions involving foreign securities and currencies, investments in passive foreign investment companies and partnerships and other book to tax differences. Net investment income, net realized gain and net assets were not affected by this change.
For the fiscal year ended October 31, 2010 and the fiscal year ended October 31, 2009 the tax character of dividends paid as reflected in the Statement of Changes in Net Assets were $10,848,256 and $1,493,134 of ordinary income, respectively.
As of October 31, 2010 the accumulated undistributed earnings on a tax basis was $1,764,331 of ordinary income. This differs from the amount shown on the Statement of Assets and Liabilities primarily due to cumulative timing differences between financial and tax reporting.
For the federal income tax purposes, the Fund had a capital loss carryforward as of October 31, 2010 of approximately $42,961,000 of which $16,679,000 expires in 2016 and $26,282,000 expires in 2017. The Fund utilized approximately $4,465,000 of its capital loss carryforward to offset net taxable gains realized in the fiscal year ended October 31, 2010. No capital gain distributions are expected to be paid to shareholders until net gains have been realized in excess of such carryforward. It is uncertain whether the Fund will be able to realize the full benefit prior to the expiration date.
The federal income tax basis of the Fund’s investments and the net unrealized appreciation as of October 31, 2010 was as follows:
| | | | | | |
Tax basis | | Appreciation | | Depreciation | | Net Unrealized
Appreciation |
| $535,613,429 | | $53,680,236 | | $(4,703,300) | | $48,976,936 |
The difference between book basis and tax basis was primarily attributable to deferred losses on wash sales, investments in passive foreign investment companies and partnerships.
Management has analyzed the Fund’s tax positions taken on federal income tax returns for all open tax years and has concluded that as of October 31, 2010, no provisions for income tax would be required in the Fund’s financial statements. The
| | |
| 36 | | Visit our website at www.prudentialfunds.com |
Fund’s federal and state income and federal excise tax returns for tax years for which the applicable statutes of limitations have not expired are subject to examination by the Internal Revenue Service and state departments of revenue.
7. Portfolio Securities
Purchases and sales of securities, other than U.S. government securities and short term obligations, during the year ended October 31, 2010, were $437,255,338 and $118,388,887, respectively.
8. Borrowings
The Fund, along with other affiliated registered investment companies (the “Funds”), is a party to a Syndicated Credit Agreement (“SCA”) with two banks. The SCA provides for a commitment of $500 million. Interest on any borrowings under the SCA would be incurred at contracted market rates and a commitment fee for the unused amount is accrued daily and paid quarterly. The Funds pay an annualized commitment fee of 0.15% of the unused portion of the SCA. The expiration date of the SCA has been extended from October 20, 2010 to December 17, 2010 under the same terms. Effective December 17, 2010 the Fund, along with the Funds entered into a new Syndicated Credit Agreement (“New SCA”) with a group of banks. The New SCA provides for a commitment of $750 million. The Funds will pay an annualized commitment fee of 0.10% of the unused portion of the New SCA. The expiration date of the New SCA is December 16, 2011. Interest on any borrowings under the New SCA will be incurred at contracted market rates and a commitment fee for the unused amount is accrued daily and paid quarterly. The purpose of the SCA is to provide an alternative source of temporary funding for capital share redemptions. The Fund did not borrow any amounts pursuant to the SCA during the year ended October 31, 2010.
| | | | |
| Prudential Jennison Equity Income Fund | | | 37 | |
Notes to Financial Statements
continued
9. Notice of Dividends to Shareholders
The Fund declared ordinary income dividends on December 15, 2010 to shareholders of record on December 16, 2010. The ex-dividend date was December 17, 2010. The per share amounts declared were as follows:
| | | | |
| | | Ordinary Income | |
Class A | | $ | 0.11793 | |
Class B | | $ | 0.09101 | |
Class C | | $ | 0.09101 | |
Class L | | $ | 0.10849 | |
Class M | | $ | 0.09101 | |
Class X | | $ | 0.09101 | |
Class Z | | $ | 0.12757 | |
10. New Accounting Pronouncements
In January 2010, the Financial Accounting Standards Board (“FASB”) issued Accounting Standards Update (“ASU”) No. 2010-06 “Improving Disclosures about Fair Value Measurements”. ASU 2010-06 will require reporting entities to make new disclosures about purchases, sales, issuances, and settlements in the roll forward of activity in Level 3 fair value measurements. The new and revised disclosures are effective for interim and annual reporting periods beginning after December 15, 2010. At this time, management is evaluating the implications of ASU No. 2010-06 and its impact on the financial statements has not been determined.
11. Subsequent Event
Class R and Class Q shares are scheduled to commence operations on or about January 18, 2011. These shares will be available to limited groups of investors.
| | |
| 38 | | Visit our website at www.prudentialfunds.com |
Financial Highlights
| | | | | | | | | | | | | | | | | | | | |
| Class A Shares | |
| | | Year Ended October 31, | |
| | | 2010(b) | | | 2009(b) | | | 2008(b) | | | 2007(b) | | | 2006(b) | |
| Per Share Operating Performance: | | | | | | | | | | | | | | | | | | | | |
| Net Asset Value, Beginning Of Year | | | $10.86 | | | | $8.60 | | | | $19.47 | | | | $16.45 | | | | $13.99 | |
| Income from investment operations: | | | | | | | | | | | | | | | | | | | | |
| Net investment income | | | .43 | | | | .44 | | | | .60 | | | | .66 | | | | .12 | |
| Net realized and unrealized gain (loss) on investments | | | 2.24 | | | | 1.93 | | | | (6.57 | ) | | | 3.02 | | | | 2.36 | |
| Total from investment operations | | | 2.67 | | | | 2.37 | | | | (5.97 | ) | | | 3.68 | | | | 2.48 | |
| Less Dividends and Distributions: | | | | | | | | | | | | | | | | | | | | |
| Dividends from net investment income | | | (.61 | ) | | | (.11 | ) | | | (.49 | ) | | | (.66 | ) | | | (.02 | ) |
| Distributions from net realized gains | | | - | | | | - | | | | (4.41 | ) | | | - | | | | - | |
| Total dividends and distributions | | | (.61 | ) | | | (.11 | ) | | | (4.90 | ) | | | (.66 | ) | | | (.02 | ) |
| Capital Contributions | | | - | * | | | - | | | | - | | | | - | | | | - | |
| Net Asset Value, end of year | | | $12.92 | | | | $10.86 | | | | $8.60 | | | | $19.47 | | | | $16.45 | |
| Total Return(a) | | | 25.19% | | | | 28.09% | | | | (39.46)% | | | | 22.72% | | | | 17.74% | |
| |
| Ratios/Supplemental Data: | |
| Net assets, end of year (in millions) | | | $313.7 | | | | $75.3 | | | | $44.7 | | | | $59.3 | | | | $30.3 | |
| Ratios to average net assets(c): | | | | | | | | | | | | | | | | | | | | |
Expenses after advisory fee waiver and
expense reimbursement | | | 1.44% | | | | 1.40% | | | | 1.41% | | | | 1.40% | | | | 1.40% | |
Expenses before advisory fee waiver and
expense reimbursement | | | 1.45% | | | | 1.66% | | | | 1.50% | | | | 1.51% | | | | 1.49% | |
| Net investment income | | | 3.62% | | | | 4.79% | | | | 4.75% | | | | 3.83% | | | | .78% | |
| For Class A, B, C, L, M, X, and Z shares: | | | | | | | | | | | | | | | | | | | | |
| Portfolio turnover rate | | | 49% | | | | 63% | | | | 66% | | | | 143% | | | | 36% | |
(a) Total return does not consider the effects of sales load. Total return is calculated assuming a purchase of a share on the first day and a sale on the last day of each year reported and includes reinvestment of dividends and distributions. Total returns may reflect adjustments to conform with generally accepted accounting principles. Total return includes the effect of expense subsidies.
(b) Calculations are based on the average daily number of shares outstanding.
(c) Does not include expenses of the underlying portfolio in which the Fund invests.
* Amount is less than $0.005.
See Notes to Financial Statements.
| | | | |
| Prudential Jennison Equity Income Fund | | | 39 | |
Financial Highlights
continued
| | | | | | | | | | | | | | | | | | | | |
| Class B Shares | |
| | | Year Ended October 31, | |
| | | 2010(b) | | | 2009(b) | | | 2008(b) | | | 2007(b) | | | 2006(b) | |
| Per Share Operating Performance: | | | | | | | | | | | | | | | | | | | | |
| Net Asset Value, Beginning Of Year | | | $10.30 | | | | $8.22 | | | | $18.85 | | | | $15.89 | | | | $13.60 | |
| Income from investment operations: | | | | | | | | | | | | | | | | | | | | |
| Net investment income | | | .32 | | | | .36 | | | | .49 | | | | .51 | | | | .01 | |
| Net realized and unrealized gain (loss) on investments | | | 2.13 | | | | 1.82 | | | | (6.31 | ) | | | 2.91 | | | | 2.28 | |
| Total from investment operations | | | 2.45 | | | | 2.18 | | | | (5.82 | ) | | | 3.42 | | | | 2.29 | |
| Less Dividends and Distributions: | | | | | | | | | | | | | | | | | | | | |
| Dividends from net investment income | | | (.48 | ) | | | (.10 | ) | | | (.40 | ) | | | (.46 | ) | | | - | |
| Distributions from net realized gains | | | - | | | | - | | | | (4.41 | ) | | | - | | | | - | |
| Total dividends and distributions | | | (.48 | ) | | | (.10 | ) | | | (4.81 | ) | | | (.46 | ) | | | - | |
| Capital Contributions | | | - | * | | | - | | | | - | | | | - | | | | - | |
| Net Asset Value, end of year | | | $12.27 | | | | $10.30 | | | | $8.22 | | | | $18.85 | | | | $15.89 | |
| Total Return(a) | | | 24.32% | | | | 27.03% | | | | (39.89)% | | | | 21.76% | | | | 16.84% | |
| |
| Ratios/Supplemental Data: | |
| Net assets, end of year (in millions) | | | $16.8 | | | | $4.6 | | | | $3.1 | | | | $5.0 | | | | $4.1 | |
| Ratios to average net assets(c): | | | | | | | | | | | | | | | | | | | | |
Expenses after advisory fee waiver and
expense reimbursement | | | 2.19% | | | | 2.15% | | | | 2.16% | | | | 2.15% | | | | 2.15% | |
Expenses before advisory fee waiver and
expense reimbursement | | | 2.20% | | | | 2.41% | | | | 2.24% | | | | 2.26% | | | | 2.24% | |
| Net investment income | | | 2.85% | | | | 4.11% | | | | 3.98% | | | | 2.95% | | | | .05% | |
(a) Total return does not consider the effects of sales load. Total return is calculated assuming a purchase of a share on the first day and a sale on the last day of each year reported and includes reinvestment of dividends and distributions. Total returns may reflect adjustments to conform with generally accepted accounting principles. Total return includes the effect of expense subsidies.
(b) Calculations are based on the average daily number of shares outstanding.
(c) Does not include expenses of the underlying portfolio in which the Fund invests.
* Amount is less than $0.005.
See Notes to Financial Statements.
| | |
| 40 | | Visit our website at www.prudentialfunds.com |
| | | | | | | | | | | | | | | | | | | | |
| Class C Shares | |
| | | Year Ended October 31, | |
| | | 2010(b) | | | 2009(b) | | | 2008(b) | | | 2007(b) | | | 2006(b) | |
| Per Share Operating Performance: | | | | | | | | | | | | | | | | | | | | |
| Net Asset Value, Beginning Of Year | | | $10.28 | | | | $8.20 | | | | $18.82 | | | | $15.87 | | | | $13.57 | |
| Income from investment operations: | | | | | | | | | | | | | | | | | | | | |
| Net investment income | | | .32 | | | | .35 | | | | .49 | | | | .52 | | | | .01 | |
| Net realized and unrealized gain (loss) on investments | | | 2.13 | | | | 1.83 | | | | (6.30 | ) | | | 2.89 | | | | 2.29 | |
| Total from investment operations | | | 2.45 | | | | 2.18 | | | | (5.81 | ) | | | 3.41 | | | | 2.30 | |
| Less Dividends and Distributions: | | | | | | | | | | | | | | | | | | | | |
| Dividends from net investment income | | | (.48 | ) | | | (.10 | ) | | | (.40 | ) | | | (.46 | ) | | | - | |
| Distributions from net realized gains | | | - | | | | - | | | | (4.41 | ) | | | - | | | | - | |
| Total dividends and distributions | | | (.48 | ) | | | (.10 | ) | | | (4.81 | ) | | | (.46 | ) | | | - | |
| Capital Contributions | | | - | * | | | - | | | | - | | | | - | | | | - | |
| Net Asset Value, end of year | | | $12.25 | | | | $10.28 | | | | $8.20 | | | | $18.82 | | | | $15.87 | |
| Total Return(a) | | | 24.37% | | | | 27.09% | | | | (39.91)% | | | | 21.80% | | | | 16.95% | |
| |
| Ratios/Supplemental Data: | | | | | | | | | | | | | | | |
| Net assets, end of year (in millions) | | | $107.3 | | | | $27.3 | | | | $23.2 | | | | $46.6 | | | | $46.7 | |
| Ratios to average net assets(c): | | | | | | | | | | | | | | | | | | | | |
Expenses after advisory fee waiver
and expense reimbursement | | | 2.19% | | | | 2.15% | | | | 2.16% | | | | 2.15% | | | | 2.15% | |
Expenses before advisory fee waiver
and expense reimbursement | | | 2.20% | | | | 2.41% | | | | 2.25% | | | | 2.26% | | | | 2.24% | |
| Net investment income | | | 2.85% | | | | 4.13% | | | | 3.96% | | | | 2.89% | | | | .07% | |
(a) Total return does not consider the effects of sales load. Total return is calculated assuming a purchase of a share on the first day and a sale on the last day of each year reported and includes reinvestment of dividends and distributions. Total returns may reflect adjustments to conform with generally accepted accounting principles. Total return includes the effect of expense subsidies.
(b) Calculations are based on the average daily number of shares outstanding.
(c) Does not include expenses of the underlying portfolio in which the Fund invests.
* Amount is less than $0.005.
See Notes to Financial Statements.
| | | | |
| Prudential Jennison Equity Income Fund | | | 41 | |
Financial Highlights
continued
| | | | | | | | | | | | | | | | | | | | |
| Class L Shares | |
| | | Year Ended October 31, | |
| | | 2010(b) | | | 2009(b) | | | 2008(b) | | | 2007(b) | | | 2006(b) | |
| Per Share Operating Performance: | | | | | | | | | | | | | | | | | | | | |
| Net Asset Value, Beginning Of Year | | | $10.77 | | | | $8.55 | | | | $19.38 | | | | $16.37 | | | | $13.93 | |
| Income from investment operations: | | | | | | | | | | | | | | | | | | | | |
| Net investment income | | | .39 | | | | .42 | | | | .57 | | | | .61 | | | | .08 | |
| Net realized and unrealized gain (loss) on investments | | | 2.22 | | | | 1.91 | | | | (6.54 | ) | | | 2.99 | | | | 2.36 | |
| Total from investment operations | | | 2.61 | | | | 2.33 | | | | (5.97 | ) | | | 3.60 | | | | 2.44 | |
| Less Dividends and Distributions: | | | | | | | | | | | | | | | | | | | | |
| Dividends from net investment income | | | (.56 | ) | | | (.11 | ) | | | (.45 | ) | | | (.59 | ) | | | - | |
| Distributions from net realized gains | | | - | | | | - | | | | (4.41 | ) | | | - | | | | - | |
| Total dividends and distributions | | | (.56 | ) | | | (.11 | ) | | | (4.86 | ) | | | (.59 | ) | | | - | |
| Capital Contributions | | | - | * | | | - | | | | - | | | | - | | | | - | |
| Net Asset Value, end of year | | | $12.82 | | | | $10.77 | | | | $8.55 | | | | $19.38 | | | | $16.37 | |
| Total Return(a) | | | 24.84% | | | | 27.73% | | | | (39.63)% | | | | 22.43% | | | | 17.52% | |
| |
| Ratios/Supplemental Data: | |
| Net assets, end of year (in millions) | | | $17.9 | | | | $17.1 | | | | $17.0 | | | | $35.5 | | | | $38.7 | |
| Ratios to average net assets(c): | | | | | | | | | | | | | | | | | | | | |
| Expenses after advisory fee waiver and expense reimbursement | | | 1.69% | | | | 1.65% | | | | 1.66% | | | | 1.65% | | | | 1.65% | |
| Expenses before advisory fee waiver and expense reimbursement | | | 1.70% | | | | 1.91% | | | | 1.75% | | | | 1.76% | | | | 1.74% | |
| Net investment income | | | 3.31% | | | | 4.69% | | | | 4.45% | | | | 3.37% | | | | .57% | |
(a) Total return does not consider the effects of sales load. Total return is calculated assuming a purchase of a share on the first day and a sale on the last day of each year reported and includes reinvestment of dividends and distributions. Total returns may reflect adjustments to conform with generally accepted accounting principles. Total return includes the effect of expense subsidies.
(b) Calculations are based on the average daily number of shares outstanding.
(c) Does not include expenses of the underlying portfolio in which the Fund invests.
* Amount is less than $0.005.
See Notes to Financial Statements.
| | |
| 42 | | Visit our website at www.prudentialfunds.com |
| | | | | | | | | | | | | | | | | | | | |
| Class M Shares | |
| | | Year Ended October 31, | |
| | | 2010(b) | | | 2009(b) | | | 2008(b) | | | 2007(b) | | | 2006(b) | |
| Per Share Operating Performance: | | | | | | | | | | | | | | | | | | | | |
| Net Asset Value, Beginning Of Year | | | $10.30 | | | | $8.22 | | | | $18.85 | | | | $15.89 | | | | $13.60 | |
| Income from investment operations: | | | | | | | | | | | | | | | | | | | | |
| Net investment income | | | .31 | | | | .36 | | | | .49 | | | | .52 | | | | .01 | |
| Net realized and unrealized gain (loss) on investments | | | 2.13 | | | | 1.82 | | | | (6.31 | ) | | | 2.90 | | | | 2.28 | |
| Total from investment operations | | | 2.44 | | | | 2.18 | | | | (5.82 | ) | | | 3.42 | | | | 2.29 | |
| Less Dividends and Distributions: | | | | | | | | | | | | | | | | | | | | |
| Dividends from net investment income | | | (.48 | ) | | | (.10 | ) | | | (.40 | ) | | | (.46 | ) | | | - | |
| Distributions from net realized gains | | | - | | | | - | | | | (4.41 | ) | | | - | | | | - | |
| Total dividends and distributions | | | (.48 | ) | | | (.10 | ) | | | (4.81 | ) | | | (.46 | ) | | | - | |
| Capital Contributions | | | - | * | | | - | | | | - | | | | - | | | | - | |
| Net Asset Value, end of year | | | $12.26 | | | | $10.30 | | | | $8.22 | | | | $18.85 | | | | $15.89 | |
| Total Return(a) | | | 24.22% | | | | 27.03% | | | | (39.89 | )% | | | 21.76% | | | | 16.84% | |
| |
| Ratios/Supplemental Data: | | | | | | | | | | | | | | | |
| Net assets, end of year (in millions) | | | $4.8 | | | | $12.1 | | | | $22.3 | | | | $80.9 | | | | $117.6 | |
| Ratios to average net assets(c): | | | | | | | | | | | | | | | | | | | | |
Expenses after advisory fee waiver
and expense reimbursement | | | 2.19% | | | | 2.15% | | | | 2.16% | | | | 2.15% | | | | 2.15% | |
Expenses before advisory fee waiver
and expense reimbursement | | | 2.20% | | | | 2.41% | | | | 2.25% | | | | 2.26% | | | | 2.24% | |
| Net investment income | | | 2.74% | | | | 4.29% | | | | 3.90% | | | | 2.79% | | | | .07% | |
(a) Total return does not consider the effects of sales load. Total return is calculated assuming a purchase of a share on the first day and a sale on the last day of each year reported and includes reinvestment of dividends and distributions. Total returns may reflect adjustments to conform with generally accepted accounting principles. Total return includes the effect of expense subsidies.
(b) Calculations are based on the average daily number of shares outstanding.
(c) Does not include expenses of the underlying portfolio in which the Fund invests.
* Amount is less than $0.005.
See Notes to Financial Statements.
| | | | |
| Prudential Jennison Equity Income Fund | | | 43 | |
Financial Highlights
continued
| | | | | | | | | | | | | | | | | | | | |
| Class X Shares | |
| | | Year Ended October 31, | |
| | | 2010(b) | | | 2009(b) | | | 2008(b) | | | 2007(b) | | | 2006(b) | |
| Per Share Operating Performance: | | | | | | | | | | | | | | | | | | | | |
| Net Asset Value, Beginning Of Year | | | $10.28 | | | | $8.20 | | | | $18.81 | | | | $15.86 | | | | $13.57 | |
| Income from investment operations: | | | | | | | | | | | | | | | | | | | | |
| Net investment income | | | .31 | | | | .36 | | | | .51 | | | | .52 | | | | .01 | |
| Net realized and unrealized gain (loss) on investments | | | 2.13 | | | | 1.82 | | | | (6.28 | ) | | | 2.89 | | | | 2.28 | |
| Total from investment operations | | | 2.44 | | | | 2.18 | | | | (5.77 | ) | | | 3.41 | | | | 2.29 | |
| Less Dividends and Distributions: | | | | | | | | | | | | | | | | | | | | |
| Dividends from net investment income | | | (.48 | ) | | | (.10 | ) | | | (.43 | ) | | | (.46 | ) | | | - | |
| Distributions from net realized gains | | | - | | | | - | | | | (4.41 | ) | | | - | | | | - | |
| Total dividends and distributions | | | (.48 | ) | | | (.10 | ) | | | (4.84 | ) | | | (.46 | ) | | | - | |
| Capital Contributions | | | - | * | | | - | | | | - | | | | - | | | | - | |
| Net Asset Value, end of year | | | $12.24 | | | | $10.28 | | | | $8.20 | | | | $18.81 | | | | $15.86 | |
| Total Return(a) | | | 24.27% | | | | 27.09% | | | | (39.74)% | | | | 21.74% | | | | 16.88% | |
| |
| Ratios/Supplemental Data: | |
| Net assets, end of year (in millions) | | | $5.1 | | | | $8.6 | | | | $12.0 | | | | $27.8 | | | | $29.3 | |
| Ratios to average net assets(c): | | | | | | | | | | | | | | | | | | | | |
| Expenses after advisory fee waiver and expense reimbursement | | | 2.19% | | | | 2.15% | | | | 1.93% | | | | 2.15% | | | | 2.15% | |
| Expenses before advisory fee waiver and expense reimbursement | | | 2.20% | | | | 2.41% | | | | 2.02% | | | | 2.26% | | | | 2.24% | |
| Net investment income | | | 2.74% | | | | 4.24% | | | | 4.18% | | | | 2.87% | | | | .07% | |
(a) Total return does not consider the effects of sales load. Total return is calculated assuming a purchase of a share on the first day and a sale on the last day of each year reported and includes reinvestment of dividends and distributions. Total returns may reflect adjustments to conform with generally accepted accounting principles. Total return includes the effect of expense subsidies.
(b) Calculations are based on the average daily number of shares outstanding.
(c) Does not include expenses of the underlying portfolio in which the Fund invests.
* Amount is less than $0.005.
See Notes to Financial Statements.
| | |
| 44 | | Visit our website at www.prudentialfunds.com |
| | | | | | | | | | | | |
| Class Z Shares | |
| | | Year Ended October 31, | | | August 22,
2008 (d)
through
October 31, | |
| | | 2010(e) | | | 2009(e) | | | 2008 (e) | |
| Per Share Operating Performance: | | | | | | | | | | | | |
| Net Asset Value, Beginning Of Period | | | $10.87 | | | | $8.60 | | | | $11.89 | |
| Income from investment operations: | | | | | | | | | | | | |
| Net investment income | | | .47 | | | | .27 | | | | .13 | |
| Net realized and unrealized gain (loss) on investments | | | 2.22 | | | | 2.11 | | | | (3.42 | ) |
| Total from investment operations | | | 2.69 | | | | 2.38 | | | | (3.29 | ) |
| Less Dividends and Distributions: | | | | | | | | | | | | |
| Dividends from net investment income | | | (.65 | ) | | | (.11 | ) | | | - | |
| Distributions from net realized gains | | | - | | | | - | | | | - | |
| Total dividends and distributions | | | (.65 | ) | | | (.11 | ) | | | - | |
| Capital Contributions | | | - | * | | | - | | | | - | |
| Net Asset Value, end of period | | | $12.91 | | | | $10.87 | | | | $8.60 | |
| Total Return(a) | | | 25.45% | | | | 28.27% | | | | (27.67 | )% |
| |
| Ratios/Supplemental Data: | |
| Net assets, end of period (in millions) | | | $70.4 | | | | $- | (c) | | | $- | (c) |
| Ratios to average net assets(f): | | | | | | | | | | | | |
Expenses after advisory fee waiver and
expense reimbursement | | | 1.19% | | | | 1.15% | | | | 1.03% | (b) |
Expenses before advisory fee waiver and
expense reimbursement | | | 1.20% | | | | 1.41% | | | | 1.03% | (b) |
| Net investment income | | | 3.90% | | | | 2.44% | | | | 6.92% | (b) |
(a) Total return does not consider the effects of sales load. Total return is calculated assuming a purchase of a share on the first day and a sale on the last day of each period reported and includes reinvestment of dividends and distributions. Total return for periods of less than a full year are not annualized. Total returns may reflect adjustments to conform with generally accepted accounting principles. Total return includes the effect of expense subsidies.
(b) Annualized.
(c) Net assets were $724 and $92,360 on October 31, 2008 and October 31, 2009, respectively.
(d) Commencement of operations.
(e) Calculations are based on the average daily number of shares outstanding.
(f) Does not include expenses of the underlying portfolio in which the Fund invests.
* Amount is less than $0.005.
See Notes to Financial Statements.
| | | | |
| Prudential Jennison Equity Income Fund | | | 45 | |
Report of Independent Registered Public
Accounting Firm
The Board of Directors and Shareholders
Prudential Investment Portfolios, Inc. 10:
We have audited the accompanying statement of assets and liabilities of Prudential Jennison Equity Income Fund (formerly Jennison Equity Income Fund), a series of Prudential Investment Portfolios, Inc. 10 (formerly Strategic Partners Mutual Funds, Inc.) (hereafter referred to as the “Fund”), including the portfolio of investments, as of October 31, 2010, and the related statement of operations for the year then ended, the statement of changes in net assets for each of the years in the two-year period then ended and the financial highlights for each of the years in the five-year period then ended. These financial statements and financial highlights are the responsibility of the Fund’s management. Our responsibility is to express an opinion on these financial statements and financial highlights based on our audits.
We conducted our audits in accordance with the standards of the Public Company Accounting Oversight Board (United States). Those standards require that we plan and perform the audit to obtain reasonable assurance about whether the financial statements and financial highlights are free of material misstatement. An audit includes examining, on a test basis, evidence supporting the amounts and disclosures in the financial statements. Our procedures included confirmation of securities owned as of October 31, 2010, by correspondence with the custodian, transfer agent and brokers or by other appropriate auditing procedures when replies from brokers were not received. An audit also includes assessing the accounting principles used and significant estimates made by management, as well as evaluating the overall financial statement presentation. We believe that our audits provide a reasonable basis for our opinion.
In our opinion, the financial statements and financial highlights referred to above present fairly, in all material respects, the financial position of the Fund as of October 31, 2010, and the results of its operations for the year then ended, the changes in its net assets for each of the years in the two-year period then ended and the financial highlights for each of the years in the five-year period then ended, in conformity with U.S. generally accepted accounting principles.

New York, New York
December 20, 2010
| | |
| 46 | | Visit our website at www.prudentialfunds.com |
Tax Information
(Unaudited)
We are required by the Internal Revenue Code of 1986, as amended (“the Code”), to advise you within 60 days of the Fund’s fiscal year end (October 31, 2010), as to the federal income tax status of dividends paid by the Fund during such fiscal year. We are advising you that during its fiscal year ended October 31, 2010, the Fund paid ordinary income dividends of $0.61 per share for Class A, $0.48 per share for Class B, C, M and X, $0.56 per share for Class L and $0.65 per share for Class Z.
For the fiscal year ended October 31, 2010, the Fund designates the maximum amount allowable under Section 854 of the Internal Revenue Code but not less than the following percentages of the ordinary income distributions paid as 1) qualified dividend income (QDI); and 2) eligible for corporate dividends received deduction (DRD).
| | | | | | | | |
| | | QDI | | | DRD | |
| | |
Prudential Jennison Equity Income Fund | | | 100% | | | | 69.63% | |
In January 2011, you will be advised on IRS Form 1099 DIV or substitute 1099 DIV as to the federal tax status of distributions received by you in calendar year 2010.
| | | | |
| Prudential Jennison Equity Income Fund | | | 47 | |
MANAGEMENT OF THE FUND
(Unaudited)
Information about Fund Directors/Trustees (referred to herein as “Board Members”) and Fund Officers is set forth below. Board Members who are not deemed to be “interested persons,” as defined in the 1940 Act, are referred to as “Independent Board Members.” Board Members who are deemed to be “interested persons” are referred to as “Interested Board Members.” The Board Members are responsible for the overall supervision of the operations of the Fund and perform the various duties imposed on the directors or trustees of investment companies by the 1940 Act.
| | | | |
Independent Board Members (1) |
Name, Address, Age Position(s) Portfolios Overseen | | Principal Occupation(s) During Past Five Years | | Other Directorships Held |
Kevin J. Bannon (58) Board Member Portfolios Overseen: 58 | | Managing Director (since April 2008) and Chief Investment Officer (since October 2008) of Highmount Capital LLC (registered investment adviser); formerly Executive Vice President and Chief Investment Officer (April 1993-August 2007) of Bank of New York Company; President (May 2003-May 2007) of BNY Hamilton Family of Mutual Funds. | | Director of Urstadt Biddle Properties (since September 2008). |
Linda W. Bynoe (58) Board Member Portfolios Overseen: 58 | | President and Chief Executive Officer (since March 1995) and formerly Chief Operating Officer (December 1989- February 1995) of Telemat Ltd. (management consulting); formerly Vice President (January 1985-June 1989) at Morgan Stanley & Co (broker-dealer). | | Director of Simon Property Group, Inc. (retail real estate) (since May 2003); Anixter International, Inc. (communication products distributor) (since January 2006); Director of Northern Trust Corporation (financial services) (since April 2006); Trustee of Equity Residential (residential real estate) (since December 2009); formerly Director of Dynegy Inc. (power generation) (September 2002-May 2006), CitiStreet Funds, Inc. (mutual funds) (May 1993-February 2005), AM- CH, Inc. (restaurant holding company) (November 2004-February 2005). |
Michael S. Hyland, CFA (65) Board Member Portfolios Overseen: 58 | | Independent Consultant (since February 2005); formerly Senior Managing Director (July 2001-February 2005) of Bear Stearns & Co, Inc.; Global Partner, INVESCO (1999-2001); Managing Director and President of Salomon Brothers Asset Management (1989-1999). | | None. |
Visit our website at www.prudentialfunds.com
| | | | |
Douglas H. McCorkindale (71) Board Member Portfolios Overseen: 58 | | Formerly Chairman (February 2001-June 2006), Chief Executive Officer (June 2000-July 2005), President (September 1997-July 2005) and Vice Chairman (March 1984-May 2000) of Gannett Co. Inc. (publishing and media). | | Director of Continental Airlines, Inc. (since May 1993); Director of Lockheed Martin Corp. (aerospace and defense) (since May 2001). |
Stephen P. Munn (68) Board Member Portfolios Overseen: 58 | | Lead Director (since 2007) and formerly Chairman (1993-2007) of Carlisle Companies Incorporated (manufacturer of industrial products). | | Lead Director (since 2007) of Carlisle Companies Incorporated (manufacturer of industrial products). |
Richard A. Redeker (67) Board Member Portfolios Overseen: 58 | | Retired Mutual Fund Senior Executive (42 years); Management Consultant; Independent Directors Council (organization of 2,800 Independent Mutual Fund Directors)-Executive Committee, Chair of Policy Steering Committee, Governing Council. | | None. |
Robin B. Smith (71) Board Member & Independent Chair Portfolios Overseen: 58 | | Chairman of the Board (since January 2003) of Publishers Clearing House (direct marketing); formerly Chairman and Chief Executive Officer (August 1996-January 2003) of Publishers Clearing House. | | Formerly Director of BellSouth Corporation (telecommunications) (1992-2006). |
Stephen G. Stoneburn (67) Board Member Portfolios Overseen: 58 | | President and Chief Executive Officer (since June 1996) of Quadrant Media Corp. (publishing company); formerly President (June 1995-June 1996) of Argus Integrated Media, Inc.; Senior Vice President and Managing Director (January 1993-1995) of Cowles Business Media; Senior Vice President of Fairchild Publications, Inc (1975-1989). | | None. |
Prudential Jennison Equity Income Fund
| | | | |
Interested Board Members (1) |
Name, Address, Age
Position(s) Portfolios Overseen | | Principal Occupation(s) During Past Five Years | | Other Directorships Held |
Judy A. Rice (62) Board Member & President Portfolios Overseen: 58 | | President, Chief Executive Officer, Chief Operating Officer and Officer-In-Charge (since February 2003) of Prudential Investments LLC; President, Chief Executive Officer and Officer-In-Charge (since April 2003) of Prudential Mutual Fund Services LLC; Executive Vice President (since December 2008) of Prudential Investment Management Services LLC; Member of the Board of Directors of Jennison Associates LLC (since November 2010); formerly Vice President (February 1999-April 2006) of Prudential Investment Management Services LLC; formerly President, Chief Executive Officer, Chief Operating Officer and Officer-In-Charge (May 2003-June 2005) and Director (May 2003-March 2006) and Executive Vice President (June 2005-March 2006) of AST Investment Services, Inc.; Member of Board of Governors of the Investment Company Institute. | | None. |
Scott E. Benjamin (37) Board Member & Vice President Portfolios Overseen: 58 | | Executive Vice President (since June 2009) of Prudential Investments LLC and Prudential Investment Management Services LLC; Executive Vice President (since September 2009) of AST Investment Services, Inc.; Senior Vice President of Product Development and Marketing, Prudential Investments (since February 2006); Vice President of Product Development and Product Management, Prudential Investments (2003-2006). | | None. |
| (1) | The year in which each individual joined the Fund’s Board is as follows: Linda W. Bynoe, 2005; Douglas H. McCorkindale, 2003, Richard A. Redeker, 2003; Robin B. Smith, 2003; Stephen G. Stoneburn, 2003; Kevin J. Bannon, 2008; Michael S. Hyland, 2008; Stephen P. Munn, 2008; Judy A. Rice, Board Member and President since 2003; Scott E. Benjamin, Board Member since 2010 and Vice President since 2009. |
Visit our website at www.prudentialfunds.com
| | |
Fund Officers (a)(1) |
Name, Address and Age Position with Fund | | Principal Occupation(s) During Past Five Years |
Kathryn L. Quirk (58) Chief Legal Officer | | Vice President and Corporate Counsel (since September 2004) of Prudential; Executive Vice President, Chief Legal Officer and Secretary (since July 2005) of PI and Prudential Mutual Fund Services LLC; Vice President and Corporate Counsel (since June 2005) and Secretary (since February 2006) of AST Investment Services, Inc.; formerly Senior Vice President and Assistant Secretary (November 2004-August 2005) of PI; formerly Assistant Secretary (June 2005-February 2006) of AST Investment Services, Inc.; formerly Managing Director, General Counsel, Chief Compliance Officer, Chief Risk Officer and Corporate Secretary (1997-2002) of Zurich Scudder Investments, Inc. |
Deborah A. Docs (52) Secretary | | Vice President and Corporate Counsel (since January 2001) of Prudential; Vice President (since December 1996) and Assistant Secretary (since March 1999) of PI; formerly Vice President and Assistant Secretary (May 2003-June 2005) of AST Investment Services, Inc. |
Jonathan D. Shain (52) Assistant Secretary | | Vice President and Corporate Counsel (since August 1998) of Prudential; Vice President and Assistant Secretary (since May 2001) of PI; Vice President and Assistant Secretary (since February 2001) of PMFS; formerly Vice President and Assistant Secretary (May 2003-June 2005) of AST Investment Services, Inc. |
Claudia DiGiacomo (36) Assistant Secretary | | Vice President and Corporate Counsel (since January 2005) of Prudential; Vice President and Assistant Secretary of PI (since December 2005); Associate at Sidley Austin Brown & Wood LLP (1999-2004). |
John P. Schwartz (39) Assistant Secretary | | Vice President and Corporate Counsel (since April 2005) of Prudential; Vice President and Assistant Secretary of PI (since December 2005); Associate at Sidley Austin Brown & Wood LLP (1997-2005). |
Andrew R. French (48) Assistant Secretary | | Vice President and Corporate Counsel (since February 2010) of Prudential; formerly Director and Corporate Counsel (2006-2010) of Prudential; Vice President and Assistant Secretary (since January 2007) of PI; Vice President and Assistant Secretary (since January 2007) of PMFS; formerly Senior Legal Analyst of Prudential Mutual Fund Law Department (1997-2006). |
Timothy J. Knierim (51) Chief Compliance Officer | | Chief Compliance Officer of Prudential Investment Management, Inc. (since July 2007); formerly Chief Risk Officer of PIM and PI (2002-2007) and formerly Chief Ethics Officer of PIM and PI (2006-2007). |
Valerie M. Simpson (52) Deputy Chief Compliance Officer | | Chief Compliance Officer (since April 2007) of PI and AST Investment Services, Inc.; formerly Vice President-Financial Reporting (June 1999-March 2006) for Prudential Life and Annuities Finance. |
Theresa C. Thompson (48) Deputy Chief Compliance Officer | | Vice President, Compliance, PI (since April 2004); and Director, Compliance, PI (2001-2004). |
Prudential Jennison Equity Income Fund
| | |
Noreen M. Fierro (46) Anti-Money Laundering Compliance Officer | | Vice President, Corporate Compliance (since May 2006) of Prudential; formerly Corporate Vice President, Associate General Counsel (April 2002-May 2005) of UBS Financial Services, Inc., in their Money Laundering Prevention Group; Senior Manager (May 2005-May 2006) of Deloitte Financial Advisory Services, LLP, in their Forensic and Dispute Services, Anti-Money Laundering Group. |
Grace C. Torres (51) Treasurer and Principal Financial and Accounting Officer | | Assistant Treasurer (since March 1999) and Senior Vice President (since September 1999) of PI; Assistant Treasurer (since May 2003) and Vice President (since June 2005) of AST Investment Services, Inc.; Senior Vice President and Assistant Treasurer (since May 2003) of Prudential Annuities Advisory Services, Inc.; formerly Senior Vice President (May 2003-June 2005) of AST Investment Services, Inc. |
M. Sadiq Peshimam (46) Assistant Treasurer | | Vice President (since 2005) of Prudential Investments LLC. |
Peter Parrella (52) Assistant Treasurer | | Vice President (since 2007) and Director (2004-2007) within Prudential Mutual Fund Administration; formerly Tax Manager at SSB Citi Fund Management LLC (1997-2004). |
| (a) | Excludes Ms. Rice and Mr. Benjamin, interested Board Members who also serve as President and Vice President, respectively. |
| (1) | The year in which each individual became an Officer of the Fund is as follows: |
Kathryn L. Quirk, 2005; Deborah A. Docs, 2003; Jonathan D. Shain, 2003; Claudia DiGiacomo, 2005; John P. Schwartz, 2006; Andrew R. French, 2006; Timothy J. Knierim, 2007; Valerie M. Simpson, 2007; Theresa C. Thompson, 2008; Noreen M. Fierro, 2006; Grace C. Torres, 2003; Peter Parrella, 2007; M. Sadiq Peshimam, 2006.
Explanatory Notes to Tables:
| | n | Board Members are deemed to be “Interested,” as defined in the 1940 Act, by reason of their affiliation with Prudential Investments LLC and/or an affiliate of Prudential Investments LLC. |
| | n | Unless otherwise noted, the address of all Board Members and Officers is c/o Prudential Investments LLC, Gateway Center Three, 100 Mulberry Street, Newark, New Jersey 07102-4077. |
| | n | There is no set term of office for Board Members or Officers. The Board Members have adopted a retirement policy, which calls for the retirement of Board Members on December 31 of the year in which they reach the age of 75. |
| | n | “Other Directorships Held” includes only directorships of companies required to register or file reports with the Commission under the Securities Exchange Act of 1934, as amended (the “Exchange Act”) (that is, “public companies”) or other investment companies registered under the 1940 Act. |
| | n | “Portfolios Overseen” includes all investment companies managed by Prudential Investments LLC. The investment companies for which PI serves as manager include the Prudential Investments Mutual Funds, The Prudential Variable Contract Accounts, Target Mutual Funds, The Prudential Series Fund, Prudential’s Gibraltar Fund, Inc. and the Advanced Series Trust. |
Visit our website at www.prudentialfunds.com
Approval of Advisory Agreements
The Fund’s Board of Directors
The Board of Directors (the “Board”) of Prudential Jennison Equity Income Fund (the “Fund”)1 consists of 10 individuals, eight of whom are not “interested persons” of the Fund, as defined in the Investment Company Act of 1940, as amended (the “1940 Act”) (the “Independent Directors”). The Board is responsible for the oversight of the Fund and its operations, and performs the various duties imposed on the directors of investment companies by the 1940 Act. The Independent Directors have retained independent legal counsel to assist them in connection with their duties. The Chair of the Board is an Independent Director. The Board has established three standing committees: the Audit Committee, the Nominating and Governance Committee, and the Investment Committee. Each committee is chaired by, and composed of, Independent Directors.
Annual Approval of the Fund’s Advisory Agreements
As required under the 1940 Act, the Board determines annually whether to renew the Fund’s management agreement with Prudential Investments LLC (“PI”) and the Fund’s subadvisory agreement with Jennison Associates LLC (“Jennison”). In considering the renewal of the agreements, the Board, including all of the Independent Directors, met on June 21-23, 2010 and approved the renewal of the agreements through July 31, 2011, after concluding that the renewal of the agreements was in the best interests of the Fund and its shareholders.
In advance of the meetings, the Board requested and received materials relating to the agreements, and had the opportunity to ask questions and request further information in connection with its consideration. Among other things, the Board considered comparative fee information from PI and Jennison. Also, the Board considered comparisons with other mutual funds in relevant Peer Universes and Peer Groups. The mutual funds included in each Peer Universe or Peer Group were objectively determined by Lipper Inc. (“Lipper”), an independent provider of mutual fund data. The comparisons placed the Fund in various quartiles over the one-, three-, and five-year periods ending December 31, 2009, with the first quartile being the best 25% of the mutual funds (for performance, the best performing mutual funds and, for expenses, the lowest cost mutual funds).
In approving the agreements, the Board, including the Independent Directors advised by independent legal counsel, considered the factors it deemed relevant, including the nature, quality and extent of services provided by PI and the subadviser, the
| 1 | Prudential Jennison Equity Income Fund is a series of Prudential Investment Portfolios, Inc. 10. |
Prudential Jennison Equity Income Fund
Approval of Advisory Agreements (continued)
performance of the Fund, the profitability of PI and its affiliates, expenses and fees, and the potential for economies of scale that may be shared with the Fund and its shareholders as the Fund’s assets grow. In their deliberations, the Directors did not identify any single factor which alone was responsible for the Board’s decision to approve the agreements with respect to the Fund. In connection with its deliberations, the Board considered information provided by PI throughout the year at regular Board meetings, presentations from portfolio managers and other information, as well as information furnished at or in advance of the meetings on June 21-23, 2010.
The Directors determined that the overall arrangements between the Fund and PI, which serves as the Fund’s investment manager pursuant to a management agreement, and between PI and Jennison, which serves as the Fund’s subadviser pursuant to the terms of a subadvisory agreement with PI, are in the interest of the Fund and its shareholders in light of the services performed, fees charged and such other matters as the Directors considered relevant in the exercise of their business judgment.
The material factors and conclusions that formed the basis for the Directors’ reaching their determinations to approve the continuance of the agreements are separately discussed below.
Nature, Quality, and Extent of Services
The Board received and considered information regarding the nature, quality and extent of services provided to the Fund by PI and Jennison. The Board considered the services provided by PI, including but not limited to the oversight of the subadviser for the Fund, as well as the provision of fund recordkeeping, compliance, and other services to the Fund. With respect to PI’s oversight of the subadviser, the Board noted that PI’s Strategic Investment Research Group (“SIRG”), which is a business unit of PI, is responsible for monitoring and reporting to PI’s senior management on the performance and operations of the subadviser. The Board also considered that PI pays the salaries of all of the officers and non-independent Directors of the Fund. The Board also considered the investment subadvisory services provided by Jennison, as well as adherence to the Fund’s investment restrictions and compliance with applicable Fund policies and procedures. The Board considered PI’s evaluation of the subadviser, as well as PI’s recommendation, based on its review of the subadviser, to renew the subadvisory agreement.
The Board reviewed the qualifications, backgrounds and responsibilities of PI’s senior management responsible for the oversight of the Fund and Jennison, and also reviewed the qualifications, backgrounds and responsibilities of the Jennison portfolio
Visit our website at www.prudentialfunds.com
managers who are responsible for the day-to-day management of the Fund’s portfolio. The Board was provided with information pertaining to PI’s and Jennison’s organizational structure, senior management, investment operations, and other relevant information pertaining to PI and Jennison. The Board also noted that it received favorable compliance reports from the Fund’s Chief Compliance Officer (“CCO”) as to each of PI and Jennison. The Board noted that Jennison is affiliated with PI.
The Board concluded that it was satisfied with the nature, extent and quality of the investment management services provided by PI and the subadvisory services provided to the Fund by Jennison, and that there was a reasonable basis on which to conclude that the Fund benefits from the services provided by PI and Jennison under the management and subadvisory agreements.
Performance of the Fund
The Board received and considered information about the Fund’s historical performance. The Board considered that the Fund’s gross performance in relation to its Peer Universe (the Lipper Equity Income Funds Performance Universe) was in the first quartile over the one-, three-, and five-year periods. The Board noted that the Fund outperformed its benchmark index for all periods. The Board concluded that, in light of the Fund’s competitive performance, it would be in the interest of the Fund and its shareholders to renew the agreements.
Fees and Expenses
The Board considered that the Fund’s actual management fee (which reflects any subsidies, expense caps or waivers) ranked in the Expense Group’s first quartile and that the Fund’s total expenses ranked in the Expense Group’s third quartile. The Board noted PI’s explanation that the Fund’s total expenses were 4.5 basis points higher than the median total expenses for all funds included in the Expense Group. The Board considered that PI has agreed to reimburse expenses and/or waive fees so that the Fund’s annual operating expenses do not exceed 1.150% (exclusive of 12b-1 fees and certain other fees) of the Fund’s average daily net assets through February 28, 2011. The Board concluded that the management fees and total expenses were reasonable in light of the services provided.
Costs of Services and Profits Realized by PI
The Board was provided with information on the profitability of PI and its affiliates in serving as the Fund’s investment manager. The Board discussed with PI the methodology utilized in assembling the information regarding profitability and considered its reasonableness. The Board recognized that it is difficult to make
Prudential Jennison Equity Income Fund
Approval of Advisory Agreements (continued)
comparisons of profitability from fund management contracts because comparative information is not generally publicly available and is affected by numerous factors, including the structure of the particular adviser, the types of funds it manages, its business mix, numerous assumptions regarding allocations and the adviser’s capital structure and cost of capital. However, the Board considered that the cost of services provided by PI to the Fund during the year ended December 31, 2009 exceeded the management fees paid by the Fund, resulting in an operating loss to PI. The Board did not separately consider the profitability of the subadviser, an affiliate of PI, as its profitability was reflected in the profitability report for PI. Taking these factors into account, the Board concluded that the profitability of PI and its affiliates in relation to the services rendered was not unreasonable.
Economies of Scale
The Board noted that the management fee schedule for the Fund includes breakpoints, which have the effect of decreasing the fee rate as assets increase, but at the current level of assets the Fund does not realize the effect of those rate reductions. The Board received and discussed information concerning whether PI realizes economies of scale as the Fund’s assets grow beyond current levels. The Board took note that the Fund’s fee structure would result in benefits to Fund shareholders when (and if) assets reach the levels at which the fee rate is reduced. These benefits will accrue whether or not PI is then realizing any economies of scale.
Other Benefits to PI and Jennison
The Board considered potential ancillary benefits that might be received by PI and Jennison and their affiliates as a result of their relationship with the Fund. The Board concluded that potential benefits to be derived by PI included brokerage commissions received by affiliates of PI, transfer agency fees received by the Fund’s transfer agent (which is affiliated with PI), and benefits to the reputation as well as other intangible benefits resulting from PI’s association with the Fund. The Board concluded that the potential benefits to be derived by Jennison included its ability to use soft dollar credits, brokerage commissions received by affiliates of Jennison, as well as the potential benefits consistent with those generally resulting from an increase in assets under management, specifically, potential access to additional research resources and benefits to the reputation. The Board concluded that the benefits derived by PI and Jennison were consistent with the types of benefits generally derived by investment managers and subadvisers to mutual funds.
After full consideration of these factors, the Board concluded that the approval of the agreements was in the interest of the Fund and its shareholders.
Visit our website at www.prudentialfunds.com
| | | | |
| n MAIL | | n TELEPHONE | | n WEBSITE |
Gateway Center Three 100 Mulberry Street Newark, NJ 07102 | | (800) 225-1852 | | www.prudentialfunds.com |
|
| PROXY VOTING |
| The Board of Directors of the Fund has delegated to the Fund’s investment subadviser the responsibility for voting any proxies and maintaining proxy recordkeeping with respect to the Fund. A description of these proxy voting policies and procedures is available without charge, upon request, by calling (800) 225-1852 or by visiting the Securities and Exchange Commission’s website at www.sec.gov. Information regarding how the Fund voted proxies relating to portfolio securities during the most recent 12-month period ended June 30 is available on the Fund’s website and on the Commission’s website. |
|
| DIRECTORS |
Kevin J. Bannon • Scott E. Benjamin • Linda W. Bynoe • Michael S. Hyland •
Douglas H. McCorkindale • Stephen P. Munn • Richard A. Redeker • Judy A. Rice • Robin B. Smith • Stephen G. Stoneburn |
|
| OFFICERS |
| Judy A. Rice, President • Scott E. Benjamin, Vice President • Grace C. Torres, Treasurer and Principal Financial and Accounting Officer • Kathryn L. Quirk, Chief Legal Officer • Deborah A. Docs, Secretary • Timothy J. Knierim, Chief Compliance Officer • Valerie M. Simpson, Deputy Chief Compliance Officer • Theresa C. Thompson, Deputy Chief Compliance Officer • Noreen M. Fierro, Anti-Money Laundering Compliance Officer • Jonathan D. Shain, Assistant Secretary • Claudia DiGiacomo, Assistant Secretary • John P. Schwartz, Assistant Secretary • Andrew R. French, Assistant Secretary • M. Sadiq Peshimam, Assistant Treasurer • Peter Parrella, Assistant Treasurer |
| | | | |
| MANAGER | | Prudential Investments LLC | | Gateway Center Three
100 Mulberry Street
Newark, NJ 07102 |
|
| INVESTMENT SUBADVISER | | Jennison Associates LLC | | 466 Lexington Avenue
New York, NY 10017 |
|
| DISTRIBUTORS | | Prudential Annuities
Distributors, Inc. | | One Corporate Drive
Shelton, CT 06484 |
| | |
| | Prudential Investment
Management Services LLC | | Gateway Center Three
100 Mulberry Street
Newark, NJ 07102 |
|
| CUSTODIAN | | PFPC Trust Company | | 301 Bellevue Parkway
Wilmington, DE 19809 |
|
| TRANSFER AGENT | | Prudential Mutual Fund
Services LLC | | PO Box 9658
Providence, RI 02940 |
|
| INDEPENDENT REGISTERED PUBLIC ACCOUNTING FIRM | | KPMG LLP | | 345 Park Avenue
New York, NY 10154 |
|
| FUND COUNSEL | | Willkie Farr & Gallagher LLP | | 787 Seventh Avenue
New York, NY 10019 |
|
| An investor should consider the investment objectives, risks, charges, and expenses of the Fund carefully before investing. The prospectus for the Fund contains this and other information about the Fund. An investor may obtain a prospectus by visiting our website at www.prudentialfunds.com or by calling (800) 225-1852. The prospectus should be read carefully before investing. |
|
| E-DELIVERY |
| To receive your mutual fund documents online, go to www.prudentialfunds.com/edelivery and enroll. Instead of receiving printed documents by mail, you will receive notification via email when new materials are available. You can cancel your enrollment or change your email address at any time by visiting the website address above. |
|
| SHAREHOLDER COMMUNICATIONS WITH DIRECTORS |
| Shareholders can communicate directly with the Board of Directors by writing to the Chair of the Board, Prudential Jennison Equity Income Fund, Prudential Investments, Attn: Board of Directors, 100 Mulberry Street, Gateway Center Three, Newark, NJ 07102. Shareholders can communicate directly with an individual Director by writing to the same address. Communications are not screened before being delivered to the addressee. |
|
| AVAILABILITY OF PORTFOLIO SCHEDULE |
| The Fund files its complete schedule of portfolio holdings with the Securities and Exchange Commission for the first and third quarters of each fiscal year on Form N-Q. The Fund’s Forms N-Q are available on the Commission’s website at www.sec.gov. The Fund’s Forms N-Q may also be reviewed and copied at the Commission’s Public Reference Room in Washington, D.C. Information on the operation and location of the Public Reference Room may be obtained by calling (202) 551-8090. The Fund’s schedule of portfolio holdings is also available on the Fund’s website as of the end of each month. |
|
| The Fund’s Statement of Additional Information contains additional information about the Fund’s Directors and is available without charge, upon request, by calling (800) 225-1852. |
Mutual Funds:
| | | | |
ARE NOT INSURED BY THE FDIC OR ANY
FEDERAL GOVERNMENT AGENCY | | MAY LOSE VALUE | | ARE NOT A DEPOSIT OF OR GUARANTEED BY ANY BANK OR ANY BANK AFFILIATE |

| | | | | | | | | | | | | | | | | | |
| | | Prudential Jennison Equity Income Fund | | | | | | | | | | | | |
| | | Share Class | | A | | B | | C | | L* | | M** | | X*** | | Z | | |
| | NASDAQ | | SPQAX | | JEIBX | | AGOCX | | AGOAX | | AGOBX | | AXGOX | | JDEZX | | |
| | CUSIP | | 74441L808 | | 74441L881 | | 74441L873 | | 74441L865 | | 74441L857 | | 74441L840 | | 74441L832 | | |
| | | | | | | | | | | | | | | | | | |
*Closed to most new purchases (with the exception of reinvested dividends and purchases by college savings plans) and available for limited exchanges only.
**Closed to most new purchases (with the exception of reinvested dividends) and available for limited exchanges only.
***Available for limited exchanges only.
MF203E 0192571-00001-00
Item 2 – Code of Ethics – See Exhibit (a)
As of the end of the period covered by this report, the registrant has adopted a code of ethics (the “Section 406 Standards for Investment Companies – Ethical Standards for Principal Executive and Financial Officers”) that applies to the registrant’s Principal Executive Officer and Principal Financial Officer; the registrant’s Principal Financial Officer also serves as the Principal Accounting Officer.
The registrant hereby undertakes to provide any person, without charge, upon request, a copy of the code of ethics. To request a copy of the code of ethics, contact the registrant 800-225-1852, and ask for a copy of the Section 406 Standards for Investment Companies – Ethical Standards for Principal Executive and Financial Officers.
Item 3 – Audit Committee Financial Expert –
The registrant’s Board has determined that Mr. Stephen P. Munn, member of the Board’s Audit Committee is an “audit committee financial expert,” and that he is “independent,” for purposes of this Item.
Item 4 – Principal Accountant Fees and Services –
(a) Audit Fees
For the fiscal years ended October 31, 2010 and October 31, 2009, KPMG LLP (“KPMG”), the Registrant’s principal accountant, billed the Registrant $46,000 and $44,365, respectively, for professional services rendered for the audit of the Registrant’s annual financial statements or services that are normally provided in connection with statutory and regulatory filings.
(b) Audit-Related Fees
None.
(c) Tax Fees
None.
(d) All Other Fees
None.
(e) (1) Audit Committee Pre-Approval Policies and Procedures
THE PRUDENTIAL MUTUAL FUNDS
AUDIT COMMITTEE POLICY
on
Pre-Approval of Services Provided by the Independent Accountants
The Audit Committee of each Prudential Mutual Fund is charged with the responsibility to monitor the independence of the Fund’s independent accountants. As part of this responsibility, the Audit Committee must pre-approve any independent accounting firm’s engagement to render audit and/or permissible non-audit services, as required by law. In evaluating a proposed engagement of the independent accountants, the Audit Committee will assess the effect that the engagement might reasonably be expected to have on the accountant’s independence. The Committee’s evaluation will be based on:
| | • | | a review of the nature of the professional services expected to be provided, |
| | • | | a review of the safeguards put into place by the accounting firm to safeguard independence, and |
| | • | | periodic meetings with the accounting firm. |
Policy for Audit and Non-Audit Services Provided to the Funds
On an annual basis, the scope of audits for each Fund, audit fees and expenses, and audit-related and non-audit services (and fees proposed in respect thereof) proposed to be performed by the Fund’s independent accountants will be presented by the Treasurer and the independent accountants to the Audit Committee for review and, as appropriate, approval prior to the initiation of such services. Such presentation shall be accompanied by confirmation by both the Treasurer and the independent accountants that the proposed services will not adversely affect the independence of the independent accountants. Proposed services shall be described in sufficient detail to enable the Audit Committee to assess the appropriateness of such services and fees, and the compatibility of the provision of such services with the auditor’s independence. The Committee shall receive periodic reports on the progress of the audit and other services which are approved by the Committee or by the Committee Chair pursuant to authority delegated in this Policy.
The categories of services enumerated under “Audit Services”, “Audit-related Services”, and “Tax Services” are intended to provide guidance to the Treasurer and the independent accountants as to those categories of services which the Committee believes are generally consistent with the independence of the independent accountants and which the Committee (or the Committee Chair) would expect upon the presentation of specific proposals to pre-approve. The enumerated categories are not intended as an exclusive list of audit, audit-related or tax services, which the Committee (or the Committee Chair) would consider for pre-approval.
Audit Services
The following categories of audit services are considered to be consistent with the role of the Fund’s independent accountants:
| | • | | Annual Fund financial statement audits |
| | • | | Seed audits (related to new product filings, as required) |
| | • | | SEC and regulatory filings and consents |
Audit-related Services
The following categories of audit-related services are considered to be consistent with the role of the Fund’s independent accountants:
| | • | | Accounting consultations |
| | • | | Fund merger support services |
| | • | | Agreed Upon Procedure Reports |
| | • | | Other Internal Control Reports |
Individual audit-related services that fall within one of these categories and are not presented to the Audit Committee as part of the annual pre-approval process will be subject to pre-approval by the Committee Chair (or any other Committee member on whom this responsibility has been delegated) so long as the estimated fee for those services does not exceed $50,000.
Tax Services
The following categories of tax services are considered to be consistent with the role of the Fund’s independent accountants:
| | • | | Tax compliance services related to the filing or amendment of the following: |
| | • | | Federal, state and local income tax compliance; and, |
| | • | | Sales and use tax compliance |
| | • | | Timely RIC qualification reviews |
| | • | | Tax distribution analysis and planning |
| | • | | Tax authority examination services |
| | • | | Tax appeals support services |
| | • | | Accounting methods studies |
| | • | | Fund merger support services |
| | • | | Tax consulting services and related projects |
Individual tax services that fall within one of these categories and are not presented to the Audit Committee as part of the annual pre-approval process will be subject to pre-approval by the Committee Chair (or any other Committee member on whom this responsibility has been delegated) so long as the estimated fee for those services does not exceed $50,000.
Other Non-audit Services
Certain non-audit services that the independent accountants are legally permitted to render will be subject to pre-approval by the Committee or by one or more Committee members to whom the Committee has delegated this authority and who will report to the full Committee any pre-approval decisions made pursuant to this Policy. Non-audit services presented for pre-approval pursuant to this paragraph will be accompanied by a confirmation from both the Treasurer and the independent accountants that the proposed services will not adversely affect the independence of the independent accountants.
Proscribed Services
The Fund’s independent accountants will not render services in the following categories of non-audit services:
| | • | | Bookkeeping or other services related to the accounting records or financial statements of the Fund |
| | • | | Financial information systems design and implementation |
| | • | | Appraisal or valuation services, fairness opinions, or contribution-in-kind reports |
| | • | | Internal audit outsourcing services |
| | • | | Management functions or human resources |
| | • | | Broker or dealer, investment adviser, or investment banking services |
| | • | | Legal services and expert services unrelated to the audit |
| | • | | Any other service that the Public Company Accounting Oversight Board determines, by regulation, is impermissible. |
Pre-approval of Non-Audit Services Provided to Other Entities Within the Prudential Fund Complex
Certain non-audit services provided to Prudential Investments LLC or any of its affiliates that also provide ongoing services to the Prudential Mutual Funds will be subject to pre-approval by the Audit Committee. The only non-audit services provided to these entities that will require pre-approval are those related directly to the operations and financial reporting of the Funds. Individual projects that are not presented to the Audit Committee as part of the annual pre-approval process will be subject to pre-approval by the Committee Chair (or any other Committee member on whom this responsibility has been delegated) so long as the estimated fee for those services does not exceed $50,000. Services presented for pre-approval pursuant to this paragraph will be accompanied by a confirmation from both the Treasurer and the independent accountants that the proposed services will not adversely affect the independence of the independent accountants.
Although the Audit Committee will not pre-approve all services provided to Prudential Investments LLC and its affiliates, the Committee will receive an annual report from the Fund’s independent accounting firm showing the aggregate fees for all services provided to Prudential Investments and its affiliates.
(e) (2) Percentage of services referred to in 4(b) – 4(d) that were approved by the audit committee –
Not applicable.
(f) Percentage of hours expended attributable to work performed by other than full time employees of principal accountant if greater than 50%.
The percentage of hours expended on the principal accountant’s engagement to audit the registrant’s financial statements for the most recent fiscal year that were attributed to work performed by persons other than the principal accountant’s full-time, permanent employees was 0%.
(g) Non-Audit Fees
Not applicable to Registrant for the fiscal years 2010 and 2009. The aggregate non-audit fees billed by KPMG for services rendered to the registrant’s investment adviser and any entity controlling, controlled by, or under common control with the investment adviser that provides ongoing services to the registrant for the fiscal years 2010 and 2009 was $0 and $0, respectively.
(h) Principal Accountant’s Independence
Not applicable as KPMG has not provided non-audit services to the registrant’s investment adviser and any entity controlling, controlled by, or under common control with the investment adviser that provides ongoing services to the registrant that were not pre-approved pursuant to Rule 2-01(c)(7)(ii) of Regulation S-X.
Item 5 – Audit Committee of Listed Registrants – Not applicable.
Item 6 – Schedule of Investments – The schedule is included as part of the report to shareholders filed under Item 1 of this Form.
Item 7 – Disclosure of Proxy Voting Policies and Procedures for Closed-End Management Investment Companies – Not applicable.
Item 8 – Portfolio Managers of Closed-End Management Investment Companies – Not applicable.
Item 9 – Purchases of Equity Securities by Closed-End Management Investment Company and Affiliated Purchasers – Not applicable.
Item 10 – Submission of Matters to a Vote of Security Holders – Not applicable.
Item 11 – Controls and Procedures
| | (a) | It is the conclusion of the registrant’s principal executive officer and principal financial officer that the effectiveness of the registrant’s current disclosure controls and procedures (such disclosure controls and procedures having been evaluated within 90 days of the date of this filing) provide reasonable assurance that the information required to be disclosed by the registrant has been recorded, processed, summarized and reported within the time period specified in the Commission’s rules and forms and that the information required to be disclosed by the registrant has been accumulated and communicated to the registrant’s principal executive officer and principal financial officer in order to allow timely decisions regarding required disclosure. |
| | (b) | There has been no significant change in the registrant’s internal control over financial reporting that occurred during the registrant’s most recent fiscal quarter of the period covered by this report that has materially affected, or is likely to materially affect, the registrant’s internal control over financial reporting. |
Item 12 – Exhibits
| | | | |
| (a) | | (1) | | Code of Ethics – Attached hereto as Exhibit EX-99.CODE-ETH |
| | |
| | (2) | | Certifications pursuant to Section 302 of the Sarbanes-Oxley Act – Attached hereto as Exhibit EX-99.CERT. |
| | |
| | (3) | | Any written solicitation to purchase securities under Rule 23c-1. �� Not applicable. |
| |
| (b) | | Certifications pursuant to Section 906 of the Sarbanes-Oxley Act – Attached hereto as Exhibit EX-99.906CERT. |
SIGNATURES
Pursuant to the requirements of the Securities Exchange Act of 1934 and the Investment Company Act of 1940, the registrant has duly caused this report to be signed on its behalf by the undersigned, thereunto duly authorized.
| | |
| Registrant: | | Prudential Investment Portfolios, Inc. 10 |
| | |
| |
| By: | | /S/ DEBORAH A. DOCS |
| | Deborah A. Docs |
| | Secretary |
| |
Date: | | December 21, 2010 |
Pursuant to the requirements of the Securities Exchange Act of 1934 and the Investment Company Act of 1940, this report has been signed below by the following persons on behalf of the registrant and in the capacities and on the dates indicated.
| | |
| |
| By: | | /S/ JUDY A. RICE |
| | Judy A. Rice |
| | President and Principal Executive Officer |
| |
Date: | | December 21, 2010 |
| |
| By: | | /S/ GRACE C. TORRES |
| | Grace C. Torres |
| | Treasurer and Principal Financial Officer |
| |
Date: | | December 21, 2010 |