UNITED STATES
SECURITIES AND EXCHANGE COMMISSION
Washington, D.C. 20549
FORM N-CSR
CERTIFIED SHAREHOLDER REPORT OF REGISTERED MANAGEMENT
INVESTMENT COMPANIES
| | |
| Investment Company Act file number: | | 811-08085 |
| |
| Exact name of registrant as specified in charter: | | Prudential Investment Portfolios, Inc. 10 |
| |
| Address of principal executive offices: | | Gateway Center 3, |
| | 100 Mulberry Street, |
| | Newark, New Jersey 07102 |
| |
| Name and address of agent for service: | | Deborah A. Docs |
| | Gateway Center 3, |
| | 100 Mulberry Street, |
| | Newark, New Jersey 07102 |
| |
| Registrant’s telephone number, including area code: | | 800-225-1852 |
| |
| Date of fiscal year end: | | 10/31/2012 |
| |
| Date of reporting period: | | 10/31/2012 |
Item 1 – Reports to Stockholders –

PRUDENTIAL INVESTMENTS»MUTUAL FUNDS
PRUDENTIAL JENNISON EQUITY INCOME FUND
ANNUAL REPORT · OCTOBER 31, 2012
Fund Type
Equity Income
Objective
Income and Capital Appreciation
This report is not authorized for distribution to prospective investors unless preceded or accompanied by a current prospectus.
The views expressed in this report and information about the Fund’s portfolio holdings are for the period covered by this report and are subject to change thereafter.
Prudential Investments, Prudential, Jennison, the Prudential logo, the Rock symbol, and Bring Your Challenges are service marks of Prudential Financial, Inc. and its related entities, registered in many jurisdictions worldwide.

December 14, 2012
Dear Shareholder:
We hope you find the annual report for the Prudential Jennison Equity Income Fund informative and useful. The report covers performance for the 12-month period that ended October 31, 2012.
We recognize that ongoing market volatility may make it a difficult time to be an investor. We continue to believe a prudent response to uncertainty is to maintain a diversified portfolio of funds consistent with your tolerance for risk, time horizon, and financial goals.
Your financial advisor can help you create a diversified investment plan that may include funds covering all the basic asset classes and that reflects your personal investor profile and risk tolerance. Keep in mind, however, that diversification and asset allocation strategies do not assure a profit or protect against loss in declining markets.
Prudential Investments® is dedicated to helping you solve your toughest investment challenges—whether it’s capital growth, reliable income, or protection from market volatility and other risks. We offer the expertise of Prudential Financial’s affiliated asset managers* that strive to be leaders in a broad range of funds to help you stay on course to the future you envision. They also manage money for major corporations and pension funds around the world, which means you benefit from the same expertise, innovation, and attention to risk demanded by today’s most sophisticated investors.
Thank you for choosing the Prudential Investments family of funds.
Sincerely,

Stuart S. Parker, President
Prudential Jennison Equity Income Fund
*Most of Prudential Investments’ equity funds are advised by Jennison Associates LLC, Quantitative Management Associates LLC (QMA), or Prudential Real Estate Investors. Prudential Investments’ fixed income and money market funds are advised by Prudential Investment Management, Inc. (PIM) through its Prudential Fixed Income unit. Jennison Associates, QMA, and PIM are registered investment advisers and Prudential Financial companies. Prudential Real Estate Investors is a unit of PIM.
| | | | |
| Prudential Jennison Equity Income Fund | | | 1 | |
Your Fund’s Performance
Performance data quoted represent past performance. Past performance does not guarantee future results. The investment return and principal value of an investment will fluctuate, so that an investor’s shares, when redeemed, may be worth more or less than their original cost. Current performance may be lower or higher than the past performance data quoted. An investor may obtain performance data as of the most recent month-end by visiting our website at www.prudentialfunds.com or by calling (800) 225-1852. Class A shares have a maximum initial sales charge of 5.50% and 5.75%, respectively. Gross operating expenses: Class A, 1.22%; Class B, 1.92%; Class C, 1.92%; Class Q, 0.81%; Class R, 1.67%; Class X, 1.92%; Class Z, 0.92%. Net operating expenses: Class A, 1.17%; Class B, 1.92%; Class C, 1.92%; Class Q, 0.81%; Class R, 1.42%; Class X, 1.92%; Class Z, 0.92%, after contractual reduction through 2/28/2014.
| | | | | | | | | | | | | | |
Cumulative Total Returns (Without Sales Charges) as of 10/31/12 |
| | | One Year | | | Five Years | | | Ten Years | | | Since Inception |
Class A | | | 10.77 | % | | | 12.01 | % | | | N/A | | | 72.11% (4/12/2004) |
Class B | | | 9.91 | | | | 7.92 | | | | N/A | | | 60.99 (4/12/2004) |
Class C | | | 9.93 | | | | 7.94 | | | | 122.00 | % | | — |
Class Q | | | 11.09 | | | | N/A | | | | N/A | | | 9.91 (1/18/2011) |
Class R | | | 10.42 | | | | N/A | | | | N/A | | | 8.77 (1/18/2011) |
Class X | | | 9.94 | | | | 8.17 | | | | 122.59 | | | — |
Class Z | | | 11.06 | | | | N/A | | | | N/A | | | 34.97 (8/25/2008) |
Lipper Equity Income Funds Index | | | 14.53 | | | | –0.43 | | | | 96.29 | | | — |
S&P 500 Index | | | 15.19 | | | | 1.81 | | | | 94.92 | | | — |
Lipper Equity Income Funds Average | | | 13.18 | | | | 3.63 | | | | 109.12 | | | — |
| | | | | | | | | | | | | | |
Average Annual Total Returns (With Sales Charges) as of 9/30/12 |
| | | One Year | | | Five Years | | | Ten Years | | | Since Inception |
Class A | | | 15.14 | % | | | 2.30 | % | | | N/A | | | 5.97% (4/12/2004) |
Class B | | | 15.90 | | | | 2.54 | | | | N/A | | | 5.85 (4/12/2004) |
Class C | | | 19.96 | | | | 2.68 | �� | | | 9.26 | % | | — |
Class Q | | | 22.29 | | | | N/A | | | | N/A | | | 6.02 (1/18/2011) |
Class R | | | 21.54 | | | | N/A | | | | N/A | | | 5.41 (1/18/2011) |
Class X | | | 14.97 | | | | 2.33 | | | | 9.28 | | | — |
Class Z | | | 22.17 | | | | N/A | | | | N/A | | | 7.72 (8/25/2008) |
Lipper Equity Income Funds Index | | | 26.78 | | | | 0.26 | | | | 7.68 | | | — |
S&P 500 Index | | | 30.17 | | | | 1.05 | | | | 8.01 | | | — |
Lipper Equity Income Funds Average | | | 25.41 | | | | 1.04 | | | | 8.24 | | | — |
| | |
| 2 | | Visit our website at www.prudentialfunds.com |
| | | | | | | | | | | | | | |
Average Annual Total Returns (With Sales Charges) as of 10/31/12 |
| | | One Year | | | Five Years | | | Ten Years | | | Since Inception |
Class A | | | 4.68 | % | | | 1.14 | % | | | N/A | | | 5.85% (4/12/2004) |
Class B | | | 4.91 | | | | 1.40 | | | | N/A | | | 5.72 (4/12/2004) |
Class C | | | 8.93 | | | | 1.54 | | | | 8.30 | % | | — |
Class Q | | | 11.09 | | | | N/A | | | | N/A | | | 5.43 (1/18/2011) |
Class R | | | 10.42 | | | | N/A | | | | N/A | | | 4.81 (1/18/2011) |
Class X | | | 3.94 | | | | 1.19 | | | | 8.33 | | | — |
Class Z | | | 11.06 | | | | N/A | | | | N/A | | | 7.43 (8/25/2008) |
| | | | | | | | | | | | | | |
Average Annual Total Returns (Without Sales Charges) as of 10/31/12 |
| | | One Year | | | Five Years | | | Ten Years | | | Since Inception |
Class A | | | 10.77 | % | | | 2.29 | % | | | N/A | | | 6.55% (4/12/2004) |
Class B | | | 9.91 | | | | 1.54 | | | | N/A | | | 5.72 (4/12/2004) |
Class C | | | 9.93 | | | | 1.54 | | | | 8.30 | % | | — |
Class Q | | | 11.09 | | | | N/A | | | | N/A | | | 5.43 (1/18/2011) |
Class R | | | 10.42 | | | | N/A | | | | N/A | | | 4.81 (1/18/2011) |
Class X | | | 9.94 | | | | 1.58 | | | | 8.33 | | | — |
Class Z | | | 11.06 | | | | N/A | | | | N/A | | | 7.43 (8/25/2008) |
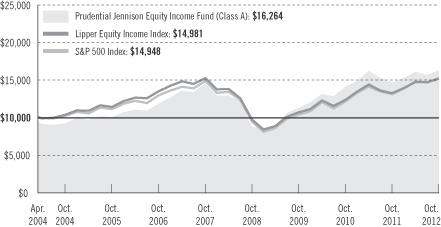
Growth of a $10,000 Investment
| | | | |
| Prudential Jennison Equity Income Fund | | | 3 | |
Your Fund’s Performance (continued)
The graph compares a $10,000 investment in the Prudential Jennison Equity Income Fund (Class A shares) with a similar investment in the Lipper Equity Income Index and the S&P 500 Index by portraying the initial account values at the commencement of operations for Class A shares (April 12, 2004) and the account values at the end of the current fiscal year (October 31, 2012) as measured on a quarterly basis. The data are measured from the closest month-end to inception date, and not from the Fund’s actual inception date. For purposes of the graph, and unless otherwise indicated, it has been assumed that (a) the maximum applicable front-end sales charge was deducted from the initial $10,000 investment in Class A shares; (b) all recurring fees (including management fees) were deducted; and (c) all dividends and distributions were reinvested. The line graph provides information for Class A shares only. As indicated in the tables above, performance for Class B, Class C, Class Q, Class R, Class X, and Class Z shares will vary due to the differing charges and expenses applicable to each share class (as indicated in the following paragraphs). Without waiver of fees and/or expense reimbursement, if any, the returns would have been lower.
Although Class X is the only share class offered by the Fund with 10 calendar years of returns, returns for Class A shares are displayed because Class X shares are closed to new investors.
Total returns and the ending account values in the graph include changes in share price and reinvestment of dividends and capital gains distributions in a hypothetical investment for the periods shown. The Fund’s total returns do not reflect the deduction of income taxes on an individual’s investment. Taxes may reduce your actual investment returns on income or gains paid by the Fund or any gains you may realize if you sell your shares.
Source: Prudential Investments LLC and Lipper Inc.
Inception returns are provided for any share class with less than 10 calendar years of returns.
The average annual total returns take into account applicable sales charges. Class A shares are subject to a maximum front-end sales charge of 5.50% and a 12b-1 fee of 0.30% annually. All investors who purchase Class A shares in an amount of $1 million or more and sell those shares within 12 months of purchase are subject to a contingent deferred sales charge (CDSC) of 1%. The Class A CDSC is waived for purchases by certain retirement or benefit plans. Under certain circumstances, an exchange may be made from specified share classes of the Fund to one or more other share classes of the Fund. Class C shares are not subject to a front-end sales charge. Class B, Class C, and Class X shares are subject to a maximum CDSC of 5%, 1%, and 6%, respectively. Class Q, Class R, and Class Z shares are not subject to a sales charge. Class B, Class C, and Class X shares are subject to a 12b-1 fee of 1%. Class R shares are subject to a 12b-1 fee of up to 0.75%. Class X shares are not offered to new purchasers and are available only through exchanges from the same share class of certain other Prudential Investments mutual funds. Class Q and Class Z shares are not subject to a 12b-1 fee. The returns in the tables and graph reflect the share class expense structure in effect at the close of the fiscal period. The returns in the tables and graph do not reflect the deduction of taxes that a shareholder would pay on Fund distributions or following the redemption of Fund shares.
| | |
| 4 | | Visit our website at www.prudentialfunds.com |
Benchmark Definitions
Lipper Equity Income Funds Index
Funds in the Lipper Equity Income Funds Index are unmanaged and seek relatively high current income and growth of income by investing at least 65% of their portfolios in dividend-paying equity securities. These funds’ gross or net yields must be at least 125% of the average gross or net yield of the U.S. diversified equity fund universe. Lipper Equity Income Funds Index Closest Month-End to Inception cumulative total returns as of 10/31/12 are 49.81% for Class A and Class B; 12.75% for Class Q and Class R; and 19.39% for Class Z. Lipper Equity Income Funds Index Closest Month-End to Inception average annual total returns as of 9/30/12 are 4.95% for Class A and Class B; 7.88% for Class Q and Class R; and 4.60% for Class Z.
S&P 500 Index
The S&P 500 Index is an unmanaged index of 500 stocks of large U.S. public companies. It gives a broad look at how U.S. stock prices have performed. S&P 500 Index Closest Month-End to Inception cumulative total returns as of 10/31/12 are 49.48% for Class A and Class B; 13.97% for Class Q and Class R; and 20.74% for Class Z. S&P 500 Index Closest Month-End to Inception average annual total returns as of 9/30/12 are 5.07% for Class A and Class B; 9.38% for Class Q and Class R; and 5.20% for Class Z.
Lipper Equity Income Funds Average
Funds in the Lipper Equity Income Funds Average (Lipper Average) seek relatively high current income and growth of income through investing 65% or more of their portfolios in dividend-paying equity securities. Lipper Average Closest Month-End to Inception cumulative total returns as of 10/31/12 are 58.00% for Class A and Class B; 12.67% for Class Q and Class R; and 21.01% for Class Z. Lipper Average Closest Month-End to Inception average annual total returns as of 9/30/12 are 5.54% for Class A and Class B; 7.91% for Class Q and Class R; and 4.93% for Class Z.
Investors cannot invest directly in an index or average. The returns for the Indexes would be lower if they included the effects of sales charges, operating expenses of a mutual fund, or taxes. Returns for the Lipper Average reflect the deduction of operating expenses, but not sales charges or taxes.
| | | | |
Five Largest Holdings expressed as a percentage of net assets as of 10/31/12 | | | | |
Bristol-Myers Squibb Co., Pharmaceuticals Maxim Integrated Products, Inc., Semiconductors & Semiconductor Equipment Frontier Communications Corp., Diversified Telecommunication Services Targa Resources Corp., Oil, Gas & Consumable Fuels Cheniere Energy, Inc., Oil, Gas & Consumable Fuels | |
| 2.7
2.6 2.6 2.4 2.3 | %
|
Holdings reflect only long-term investments and are subject to change.
| | | | |
| Prudential Jennison Equity Income Fund | | | 5 | |
Strategy and Performance Overview
How did the Fund perform?
The Jennison Equity Income Fund Class A shares returned 10.77% for the 12-month reporting period ended October 31, 2012, underperforming the 14.53% gain of the Lipper Equity Income Funds Index, the 13.18% gain of the Lipper Equity Income Funds Average, and the 15.19% gain of the S&P 500 Index.
What was the market environment like for stocks during the period?
Equity markets were highly volatile in the 12 months ended October 31, 2012 — up strongly in the first five months, down sharply in May, then back on an upward trajectory beginning in June. The gyrations reflected swings in sentiment around European sovereign debt issues and uncertainty about global growth. Stock prices rose and fell as sentiment veered between optimism and pessimism, often based on short-term data.
U.S. economic growth proceeded at a subpar pace, and unemployment remained high as the job market expanded at a meager pace. Personal income and spending increased at generally lackluster rates, and business and housing indicators were inconsistent.
With the implementation of austerity measures, many European economies contracted. Growth in China, a key engine of global economic expansion, slowed. Volatile raw materials, commodities, food, and energy prices reflected shifts in economic expectations.
Which holdings made the largest positive contribution to the Fund’s return?
The Fund’s energy infrastructure holdings Targa Resources, Cheniere Energy, and Williams Companies made the most significant contributions to absolute return over the past 12 months. Gains by consumer sector positions also helped, led by media giant Comcast and tobacco company Philip Morris International.
Targa Resources, a master limited partnership, weathered the year’s extreme commodity price volatility, and ended the year as the leading Fund contributor. Targa benefits from one of the largest portfolios in North America of strategically located Southern U.S. and Gulf Coast infrastructure assets, including gathering systems, processing plants, and natural gas liquid fractionators and import-export facilities. Jennison continues to see Targa as well positioned to take advantage of upstream developments in the Permian Basin and elsewhere. Management has planned an aggressive program of projects for expansion, which Jennison believes will help sustain robust dividend growth in the coming year.
| | |
| 6 | | Visit our website at www.prudentialfunds.com |
Cheniere Energy posted a large gain for the period, marking a number of important milestones toward development of a natural gas liquefaction facility in Louisiana. In April, Cheniere received its last critical permit from the Federal Energy Regulatory Commission and gave orders to begin construction in August. Jennison continues to see Cheniere as extremely well positioned to take advantage of the shifting dynamics in the liquefied natural gas market.
Williams Companies recently completed a major restructuring, which included spinning off its exploration and production business into a separate, publicly traded company. Williams is now one of the dominant natural gas infrastructure companies in the U.S. Its assets encompass strategic pipelines and other facilities in a number of key basins, including the Marcellus and Utica shales, as well as deepwater Gulf of Mexico and the Rocky Mountain region. Like many energy-related companies, the stock came under pressure in the second quarter, and then rallied through mid-October. Williams, in Jennison’s view, remains well positioned to sustain its robust dividend growth by capitalizing on stepped-up natural gas production and expanding its business.
Which holdings detracted most from the Fund’s return?
The year’s detractors were somewhat more diversified by sector, including the tech sector’s Finisar, NII Holdings, and Leighton Holdings. Losses recorded by Monster Beverages and Oracle positions also hurt period returns.
Shares of fiber optic component provider Finisar never fully recovered from the company’s disappointing fourth quarter 2011 results. The stock rallied in the first two months of 2012 on expectations the company would benefit from strong new product introductions. However, the ongoing lack of visibility regarding Chinese telecommunications capital spending remained a challenge for the stock throughout the year.
Shares of Latin American wireless telecom service provider NII Holdings remained under pressure most of the year. Although the strengthening of the U.S. dollar against Latin American currencies and increasing competition were partly to blame, the bigger problems related to poor execution. The company repeatedly failed to meet its targets. Additions to its subscriber base repeatedly came in weaker than expected, margins disappointed, and there were repeated delays in the company’s 3G rollout in Peru. Given what Jennison saw as increased execution risk, it closed the position in May.
Leighton Holdings is one of Australia’s largest engineering and construction firms. The company had taken write-offs in 2010 and 2011 on two major projects and also
| | | | |
| Prudential Jennison Equity Income Fund | | | 7 | |
Strategy and Performance Overview (continued)
made changes in management. Jennison initiated the position after the new management team affirmed the projects were on-track. However, additional delays and cost overruns led to an unexpected write-down, which appeared to damage management’s credibility with investors. Jennison made the decision to exit the position in favor of other investment candidates that were seen as having more promising risk-reward profiles.
Were there significant changes to the Portfolio?
During the reporting period there were no significant changes to the portfolio’s positioning. Rather, the Fund added or exited individual positions based on company fundamentals and the stock’s risk-reward characteristics. Significant positions established included Maxim Integrated Products, Cheniere Energy, and Union Pacific. Positions in other securities, including Intel, Johnson & Johnson, and Reynolds American were eliminated.
The Portfolio of Investments following this report shows the size of the Fund’s positions at period-end.
| | |
| 8 | | Visit our website at www.prudentialfunds.com |
Comments on Largest Holdings
| 2.7% | Bristol-Myers Squibb, Pharmaceuticals |
Bristol-Myers Squibb is a global biopharmaceutical company, known for blockbuster drugs used in the treatment of major health concerns including heart disease, hypertension, and HIV. In 2012, the company turned its attention to strategic acquisitions, stressing the development of biologics and specialty drugs with long patent lives. At the end of June, management announced authorization of an additional $3 billion for share repurchases, a move seen by some as evidence of continued confidence in the firm’s new product portfolio and late stage pipeline. Jennison sees Bristol-Myers’ management as determined to contain operating expenses even as it takes steps to enhance its product portfolio, which should help to sustain the company’s healthy dividend yield over the long run.
| 2.6% | Maxim Integrated Products, Semiconductors & Semiconductor Equipment |
Maxim Integrated Products designs, manufactures, and markets a wide range of products, including linear and mixed-signal integrated circuits. More recently, Maxim results have been driven by smart phone growth in its consumer sector, which has left the firm somewhat more vulnerable to global macroeconomic concerns. Jennison sees Maxim as well positioned for the longer term, given the diversity of its customer and product base, and the relative stability of its pricing power. Jennison also believes the stock offers an attractive yield, particularly for a tech company.
| 2.6% | Frontier Communications, Diversified Telecommunication Services |
Frontier Communications is a telephone wire line company serving primarily rural areas and small to mid-sized towns in more than 25 states. Toward the end of the period, signs emerged suggesting the company’s efforts to cut costs and exploit the prospects of its 2010 acquisition of access lines from Verizon were finally starting to pay off. The increased visibility of progress and continued revenue improvements helped to boost Jennison’s confidence in Frontier’s ability to maintain its above-average dividend yield over the near to intermediate term.
| 2.4% | Targa Resources, Oil, Gas & Consumable Fuels |
Please see Strategy and Performance Overview for Targa Resources.
| 2.3% | Cheniere Energy, Oil, Gas & Consumable Fuels |
Please see Strategy and Performance Overview for Cheniere Energy.
| | | | |
| Prudential Jennison Equity Income Fund | | | 9 | |
Fees and Expenses (Unaudited)
As a shareholder of the Fund, you incur two types of costs: (1) transaction costs, including sales charges (loads) on purchase payments and redemptions, as applicable, and (2) ongoing costs, including management fees, distribution and/or service (12b-1) fees, and other Fund expenses, as applicable. This example is intended to help you understand your ongoing costs (in dollars) of investing in the Fund and to compare these costs with the ongoing costs of investing in other mutual funds.
The example is based on an investment of $1,000 invested on May 1, 2012, at the beginning of the period, and held through the six-month period ended October 31, 2012. The example is for illustrative purposes only; you should consult the Prospectus for information on initial and subsequent minimum investment requirements.
The Fund’s transfer agent may charge additional fees to holders of certain accounts that are not included in the expenses shown in the table on the following page. These fees apply to individual retirement accounts (IRAs) and Section 403(b) accounts. As of the close of the six-month period covered by the table, IRA fees included an annual maintenance fee of $15 per account (subject to a maximum annual maintenance fee of $25 for all accounts held by the same shareholder). Section 403(b) accounts are charged an annual $25 fiduciary maintenance fee. Some of the fees may vary in amount, or may be waived, based on your total account balance or the number of Prudential Investments funds, including the Fund, that you own. You should consider the additional fees that were charged to your Fund account over the six-month period when you estimate the total ongoing expenses paid over the period and the impact of these fees on your ending account value, as these additional expenses are not reflected in the information provided in the expense table. Additional fees have the effect of reducing investment returns.
Actual Expenses
The first line for each share class in the table on the following page provides information about actual account values and actual expenses. You may use the information on this line, together with the amount you invested, to estimate the expenses that you paid over the period. Simply divide your account value by $1,000 (for example, an $8,600 account value ÷ $1,000 = 8.6), then multiply the result by the number on the first line under the heading “Expenses Paid During the Six-Month Period” to estimate the expenses you paid on your account during this period.
Hypothetical Example for Comparison Purposes
The second line for each share class in the table on the following page provides information about hypothetical account values and hypothetical expenses based on the Fund’s actual expense ratio and an assumed rate of return of 5% per year before expenses, which is not the Fund’s actual return. The hypothetical account values and
| | |
| 10 | | Visit our website at www.prudentialfunds.com |
expenses may not be used to estimate the actual ending account balance or expenses you paid for the period. You may use this information to compare the ongoing costs of investing in the Fund and other funds. To do so, compare this 5% hypothetical example with the 5% hypothetical examples that appear in the shareholder reports of the other funds.
Please note that the expenses shown in the table are meant to highlight your ongoing costs only and do not reflect any transactional costs such as sales charges (loads). Therefore, the second line for each share class in the table is useful in comparing ongoing costs only and will not help you determine the relative total costs of owning different funds. In addition, if these transactional costs were included, your costs would have been higher.
| | | | | | | | | | | | | | | | | | |
Prudential
Jennison Equity
Income Fund | | Beginning Account
Value
May 1, 2012 | | | Ending Account
Value
October 31, 2012 | | | Annualized
Expense Ratio
Based on the
Six-Month Period | | | Expenses Paid
During the
Six-Month Period* | |
| | | | | | | | | | | | | | | | | | |
| Class A | | Actual | | $ | 1,000.00 | | | $ | 1,010.20 | | | | 1.17 | % | | $ | 5.91 | |
| | | Hypothetical | | $ | 1,000.00 | | | $ | 1,019.25 | | | | 1.17 | % | | $ | 5.94 | |
| | | | | | | | | | | | | | | | | | |
| Class B | | Actual | | $ | 1,000.00 | | | $ | 1,006.40 | | | | 1.92 | % | | $ | 9.68 | |
| | | Hypothetical | | $ | 1,000.00 | | | $ | 1,015.48 | | | | 1.92 | % | | $ | 9.73 | |
| | | | | | | | | | | | | | | | | | |
| Class C | | Actual | | $ | 1,000.00 | | | $ | 1,005.60 | | | | 1.92 | % | | $ | 9.68 | |
| | | Hypothetical | | $ | 1,000.00 | | | $ | 1,015.48 | | | | 1.92 | % | | $ | 9.73 | |
| | | | | | | | | | | | | | | | | | |
| Class Q | | Actual | | $ | 1,000.00 | | | $ | 1,011.30 | | | | 0.80 | % | | $ | 4.04 | |
| | | Hypothetical | | $ | 1,000.00 | | | $ | 1,021.11 | | | | 0.80 | % | | $ | 4.06 | |
| | | | | | | | | | | | | | | | | | |
| Class R | | Actual | | $ | 1,000.00 | | | $ | 1,008.20 | | | | 1.42 | % | | $ | 7.17 | |
| | | Hypothetical | | $ | 1,000.00 | | | $ | 1,018.00 | | | | 1.42 | % | | $ | 7.20 | |
| | | | | | | | | | | | | | | | | | |
| Class X | | Actual | | $ | 1,000.00 | | | $ | 1,005.70 | | | | 1.92 | % | | $ | 9.68 | |
| | | Hypothetical | | $ | 1,000.00 | | | $ | 1,015.48 | | | | 1.92 | % | | $ | 9.73 | |
| | | | | | | | | | | | | | | | | | |
| Class Z | | Actual | | $ | 1,000.00 | | | $ | 1,010.70 | | | | 0.92 | % | | $ | 4.65 | |
| | | Hypothetical | | $ | 1,000.00 | | | $ | 1,020.51 | | | | 0.92 | % | | $ | 4.67 | |
*Fund expenses (net of fee waivers or subsidies, if any) for each share class are equal to the annualized expense ratio for each share class (provided in the table), multiplied by the average account value over the period, multiplied by the 184 days in the six-month period ended October 31, 2012, and divided by 366 days. Expenses presented in the table include the expenses of any underlying funds in which the Fund may invest.
| | | | |
| Prudential Jennison Equity Income Fund | | | 11 | |
Portfolio of Investments
as of October 31, 2012
| | | | | | |
| Shares | | Description | | Value (Note 2) | |
LONG-TERM INVESTMENTS 98.9% | | | | |
COMMON STOCKS 83.7% | | | | |
| |
Aerospace & Defense 3.2% | | | | |
| 439,575 | | Boeing Co. (The) | | $ | 30,963,663 | |
| 3,700,484 | | Exelis, Inc. | | | 40,927,353 | |
| 256,694 | | United Technologies Corp. | | | 20,063,203 | |
| | | | | | |
| | | | | 91,954,219 | |
| |
Beverages 0.8% | | | | |
| 4,231,730 | | Britvic PLC (United Kingdom) | | | 24,529,789 | |
| |
Capital Markets 1.4% | | | | |
| 249,219 | | Goldman Sachs Group, Inc. (The) | | | 30,501,913 | |
| 639,179 | | Morgan Stanley | | | 11,108,931 | |
| | | | | | |
| | | | | 41,610,844 | |
| |
Chemicals 2.3% | | | | |
| 168,032 | | CF Industries Holdings, Inc. | | | 34,478,486 | |
| 361,707 | | Monsanto Co. | | | 31,132,121 | |
| | | | | | |
| | | | | 65,610,607 | |
| |
Commercial Services & Supplies 0.7% | | | | |
| 598,614 | | Iron Mountain, Inc. | | | 20,712,044 | |
| |
Communications Equipment 1.4% | | | | |
| 1,096,537 | | Finisar Corp.*(a) | | | 12,632,106 | |
| 456,652 | | QUALCOMM, Inc. | | | 26,748,391 | |
| | | | | | |
| | | | | 39,380,497 | |
| |
Computers & Peripherals 2.1% | | | | |
| 102,702 | | Apple, Inc. | | | 61,117,960 | |
| |
Construction & Engineering 0.4% | | | | |
| 1,005,362 | | UGL Ltd. (Australia)(a) | | | 11,145,874 | |
| |
Diversified Financial Services 1.0% | | | | |
| 100,000 | | Gateway Energy & Resource Holdings LLC, 144A
(original cost $2,000,000; purchased 12/14/07)*(b)(c) | | | 1,543,086 | |
| 682,696 | | JPMorgan Chase & Co. | | | 28,454,769 | |
| | | | | | |
| | | | | 29,997,855 | |
| |
Diversified Telecommunication Services 7.1% | | | | |
| 1,205,754 | | BCE, Inc. (Canada) | | | 52,709,106 | |
See Notes to Financial Statements.
| | | | |
| Prudential Jennison Equity Income Fund | | | 13 | |
Portfolio of Investments
as of October 31, 2012 continued
| | | | | | |
| Shares | | Description | | Value (Note 2) | |
COMMON STOCKS (Continued) | | | | |
| |
Diversified Telecommunication Services (cont’d.) | | | | |
| 742,509 | | CenturyLink, Inc. | | $ | 28,497,496 | |
| 935,360 | | City Telecom HK Ltd., ADR (Hong Kong) | | | 4,106,230 | |
| 784,813 | | Cogent Communications Group, Inc. | | | 17,038,290 | |
| 15,606,323 | | Frontier Communications Corp.(a) | | | 73,661,845 | |
| 1,440,077 | | Vivendi SA (France) | | | 29,463,417 | |
| | | | | | |
| | | | | 205,476,384 | |
| |
Electric Utilities 3.2% | | | | |
| 433,755 | | FirstEnergy Corp. | | | 19,831,279 | |
| 1,329,285 | | Great Plains Energy, Inc. | | | 29,829,155 | |
| 1,791,967 | | SSE PLC (United Kingdom) | | | 41,873,381 | |
| | | | | | |
| | | | | 91,533,815 | |
| |
Food Products 7.5% | | | | |
| 559,810 | | B&G Foods, Inc. | | | 16,945,449 | |
| 976,182 | | BRF - Brasil Foods SA (Brazil) | | | 17,759,250 | |
| 545,820 | | Bunge Ltd. (Bermuda) | | | 38,769,594 | |
| 3,279,707 | | De Master Blenders 1753 NV (Netherlands)* | | | 40,082,379 | |
| 865,782 | | Hillshire Brands Co. | | | 22,518,990 | |
| 372,694 | | Kraft Foods Group Inc* | | | 16,950,123 | |
| 1,063,950 | | Mondelez International, Inc. | | | 28,237,233 | |
| 3,007,238 | | Tate & Lyle PLC (United Kingdom) | | | 35,232,540 | |
| | | | | | |
| | | | | 216,495,558 | |
| |
Hotels, Restaurants & Leisure 1.5% | | | | |
| 820,214 | | Darden Restaurants, Inc.(a) | | | 43,159,661 | |
| |
Household Durables 0.5% | | | | |
| 1,347,766 | | Direcional Engenharia SA (Brazil) | | | 8,069,144 | |
| 1,114,076 | | Direcional Engenharia SA, 144A (Brazil)(b) | | | 6,670,030 | |
| | | | | | |
| | | | | 14,739,174 | |
| |
Independent Power Producers & Energy Traders 1.1% | | | | |
| 1,588,789 | | Northland Power, Inc. (Canada) | | | 30,797,452 | |
| |
Machinery 0.9% | | | | |
| 580,011 | | IDEX Corp. | | | 24,667,868 | |
| |
Media 5.3% | | | | |
| 2,763,922 | | British Sky Broadcasting Group PLC (United Kingdom) | | | 31,623,617 | |
| 1,511,875 | | Cinemark Holdings, Inc. | | | 37,328,194 | |
See Notes to Financial Statements.
| | |
| 14 | | Visit our website at www.prudentialfunds.com |
| | | | | | |
| Shares | | Description | | Value (Note 2) | |
COMMON STOCKS (Continued) | | | | |
| |
Media (cont’d.) | | | | |
| 1,082,658 | | Comcast Corp. (Class A Stock) | | $ | 40,610,502 | |
| 1,496,054 | | Thomson Reuters Corp. (Canada)(a) | | | 42,278,486 | |
| | | | | | |
| | | | | 151,840,799 | |
| |
Multi-Utilities 2.9% | | | | |
| 868,451 | | National Grid PLC, ADR (United Kingdom)(a) | | | 49,510,391 | |
| 1,332,329 | | NiSource, Inc. | | | 33,934,420 | |
| | | | | | |
| | | | | 83,444,811 | |
| |
Oil, Gas & Consumable Fuels 11.1% | | | | |
| 886,730 | | Baytex Energy Corp. (Canada) | | | 40,352,319 | |
| 4,203,393 | | Cheniere Energy, Inc.*(a) | | | 67,632,593 | |
| 368,614 | | Eni SpA, ADR (Italy) | | | 16,915,697 | |
| 1,249,881 | | Pembina Pipeline Corp (Canada)(a) | | | 34,934,174 | |
| 3,143,372 | | PetroBakken Energy Ltd. (Class A Stock) (Canada) | | | 39,687,530 | |
| 1,336,523 | | Targa Resources Corp. | | | 68,069,116 | |
| 1,497,523 | | Williams Cos., Inc. (The) | | | 52,398,330 | |
| | | | | | |
| | | | | 319,989,759 | |
| |
Pharmaceuticals 7.4% | | | | |
| 2,313,565 | | Bristol-Myers Squibb Co. | | | 76,926,036 | |
| 1,107,198 | | Merck & Co., Inc.(a) | | | 50,521,445 | |
| 181,421 | | Novo Nordisk A/S, ADR (Denmark) | | | 29,079,972 | |
| 2,289,608 | | Pfizer, Inc. | | | 56,942,551 | |
| | | | | | |
| | | | | 213,470,004 | |
| |
Real Estate Investment Trusts 5.6% | | | | |
| 2,383,228 | | Annaly Capital Management, Inc.(a) | | | 38,465,300 | |
| 523,063 | | Digital Realty Trust, Inc.(a) | | | 32,131,760 | |
| 3,590,390 | | First Potomac Realty Trust(a) | | | 42,761,545 | |
| 5,804,760 | | MFA Financial, Inc. | | | 47,424,889 | |
| | | | | | |
| | | | | 160,783,494 | |
| |
Real Estate Management & Development 0.3% | | | | |
| 11,733,162 | | SOHO China Ltd. (China) | | | 7,978,499 | |
| |
Road & Rail 2.5% | | | | |
| 490,497 | | J.B. Hunt Transport Services, Inc. | | | 28,792,174 | |
| 359,681 | | Union Pacific Corp. | | | 44,251,553 | |
| | | | | | |
| | | | | 73,043,727 | |
See Notes to Financial Statements.
| | | | |
| Prudential Jennison Equity Income Fund | | | 15 | |
Portfolio of Investments
as of October 31, 2012 continued
| | | | | | |
| Shares | | Description | | Value (Note 2) | |
COMMON STOCKS (Continued) | | | | |
| |
Semiconductors & Semiconductor Equipment 4.5% | | | | |
| 2,683,524 | | Maxim Integrated Products, Inc. | | $ | 73,863,998 | |
| 1,660,601 | | Xilinx, Inc.(a) | | | 54,401,289 | |
| | | | | | |
| | | | | 128,265,287 | |
| |
Software 1.3% | | | | |
| 2,722,966 | | Activision Blizzard, Inc. | | | 29,653,099 | |
| 139,995 | | Intuit, Inc. | | | 8,319,903 | |
| | | | | | |
| | | | | 37,973,002 | |
| |
Specialty Retail 1.2% | | | | |
| 1,578,519 | | GameStop Corp. (Class A Stock)(a) | | | 36,037,589 | |
| |
Tobacco 3.7% | | | | |
| 343,288 | | Lorillard, Inc. | | | 39,824,841 | |
| 752,146 | | Philip Morris International, Inc. | | | 66,610,050 | |
| | | | | | |
| | | | | 106,434,891 | |
| |
Transportation Infrastructure 0.8% | | | | |
| 2,638,544 | | CCR SA (Brazil) | | | 23,201,987 | |
| |
Wireless Telecommunication Services 2.0% | | | | |
| 596,433 | | Rogers Communications, Inc. (Class B Stock) (Canada) | | | 26,180,348 | |
| 1,106,553 | | Vodafone Group PLC, ADR (United Kingdom) | | | 30,120,373 | |
| | | | | | |
| | | | | 56,300,721 | |
| | | | | | |
| | TOTAL COMMON STOCKS
(cost $2,213,065,649) | | | 2,411,694,171 | |
| | | | | | |
| |
PREFERRED STOCKS 7.4% | | | | |
| |
Aerospace & Defense 1.0% | | | | |
| 510,924 | | United Technologies Corp., CVT, 7.50%(b) | | | 27,784,047 | |
| |
Airlines 0.4% | | | | |
| 364,902 | | Continental Airlines Finance Trust II, CVT, 6.00% | | | 12,144,377 | |
| |
Diversified Financial Services 1.8% | | | | |
| 524,602 | | Citigroup, Inc., CVT, 7.50% | | | 53,614,324 | |
| |
Electric Utilities 2.9% | | | | |
| 380,000 | | NextEra Energy, Inc., CVT, 5.60%(b) | | | 19,427,500 | |
| 875,000 | | NextEra Energy, Inc., CVT, 5.89%(a)(b) | | | 45,508,750 | |
See Notes to Financial Statements.
| | |
| 16 | | Visit our website at www.prudentialfunds.com |
| | | | | | |
| Shares | | Description | | Value (Note 2) | |
PREFERRED STOCKS (Continued) | | | | |
| |
Electric Utilities (cont’d.) | | | | |
| 335,200 | | PPL Corp., CVT, 8.75%(b) | | | $ 18,157,784 | |
| | | | | | |
| | | | | 83,094,034 | |
| |
Insurance 1.0% | | | | |
| 609,300 | | Metlife, Inc., CVT, 5.00%(b) | | | 28,326,357 | |
| |
Leisure Equipment & Products 0.3% | | | | |
| 101,620 | | Callaway Golf Co., Series B, CVT, 7.50% | | | 9,298,230 | |
| | | | | | |
| | TOTAL PREFERRED STOCKS
(cost $223,983,553) | | | 214,261,369 | |
| | | | | | |
| | | | | | | | | | | | | | | | |
| | | | | |
| Description | | Moody’s
Ratings†
(Unaudited) | | Interest
Rate | | Maturity
Date | | | Principal
Amount (000)# | | | | |
CONVERTIBLE BONDS 7.8% | | | | | | | | | | | | | | |
| | | | | |
Airlines 0.6% | | | | | | | | | | | | | | | | |
United Continental
Holdings, Inc.,
Sr. Unsec’d. Notes | | CCC+(d) | | 6.00% | | | 10/15/29 | | | $ | 7,750 | | | | 17,897,656 | |
| | | |
Investment Banking & Brokerage 6.8% | | | | | | | | | | | | |
BAC Monster Beverage Corp., Notes, 144A(b) | | NR | | 7.11% | | | 02/26/13 | | | | 72,488 | | | | 33,387,788 | |
BAC Rackspace Hosting, Notes, 144A(b) | | NR | | 6.35% | | | 03/21/13 | | | | 53,126 | | | | 33,846,320 | |
GS Charter Communications, Notes, 144A(b) | | NR | | 2.50% | | | 03/26/13 | | | | 54,245 | | | | 41,675,631 | |
GS Transocean Ltd.,
Sr. Unsec’d. Notes, 144A(b) | | NR | | 6.65% | | | 12/03/12 | | | | 74,750 | | | | 34,487,549 | |
MS Rackspace Hosting,
Sr. Unsec’d. Notes, 144A(b) | | NR | | 9.25% | | | 11/21/12 | | | | 88,235 | | | | 51,802,945 | |
| | | | | | | | | | | | | | | | |
| | | | | | | | | | | | | | | 195,200,233 | |
| | | |
Leisure Equipment & Products 0.4% | | | | | | | | | | | | |
Callaway Golf Co., Notes, 144A(a)(b) | | | | 3.75% | | | 08/15/19 | | | | 12,500 | | | | 11,945,313 | |
| | | | | | | | | | | | | | | | |
TOTAL CONVERTIBLE BONDS
(cost $234,023,320) | | | | | | | | | | | | | | | 225,043,202 | |
| | | | | | | | | | | | | | | | |
TOTAL LONG-TERM INVESTMENTS
(cost $2,671,072,522) | | | | | | | | | | | | | 2,850,998,742 | |
| | | | | | | | | | | | | | | | |
See Notes to Financial Statements.
| | | | |
| Prudential Jennison Equity Income Fund | | | 17 | |
Portfolio of Investments
as of October 31, 2012 continued
| | | | | | |
| Shares | | Description | | Value (Note 2) | |
SHORT-TERM INVESTMENT 10.3% | | | | |
| |
AFFILIATED MONEY MARKET MUTUAL FUND 10.3% | | | | |
| 295,210,778 | | Prudential Investment Portfolios 2 - Prudential Core Taxable Money Market Fund
(cost $295,210,778; includes $251,155,277 of cash collateral for securities on loan)(e)(f) | | $ | 295,210,778 | |
| | | | | | |
| | TOTAL INVESTMENTS, BEFORE OPTIONS WRITTEN 109.2%
(cost $2,966,283,300; Note 6) | | | 3,146,209,520 | |
| | | | | | |
| | |
Notional
Amount (000)# | | | | | |
OPTIONS WRITTEN* | | | | |
| |
Call Options | | | | |
| $ 13 | | Apple, Inc.,
expiring 01/19/13, Strike Price $675.00 | | | (105,000 | ) |
| 13 | | expiring 01/19/13, Strike Price $680.00 | | | (96,250 | ) |
| 13 | | expiring 12/22/12, Strike Price $670.00 | | | (51,250 | ) |
| 13 | | expiring 12/22/12, Strike Price $675.00 | | | (46,875 | ) |
| | | | | | |
| | TOTAL OPTIONS WRITTEN
(premiums received $606,476) | | | (299,375 | ) |
| | | | | | |
| | TOTAL INVESTMENTS, NET OF OPTIONS WRITTEN 109.2%
(cost $2,965,676,824; Note 6) | | | 3,145,910,145 | |
| | Liabilities in excess of other assets (9.2%) | | | (265,086,067 | ) |
| | | | | | |
| | NET ASSETS 100.0% | | $ | 2,880,824,078 | |
| | | | | | |
The following abbreviations are used in the Portfolio descriptions:
144A—Security was purchased pursuant to Rule 144A under the Securities Act of 1933 and may not be resold subject to that rule except to qualified institutional buyers. Unless otherwise noted, 144A securities are deemed to be liquid.
ADR—American Depositary Receipt
CVT—Convertible Security
NR—Not Rated by Moody’s or Standard & Poor’s
| # | Principal or notional amount is shown in U.S. dollars unless otherwise stated. |
| † | The ratings reflected are as of October 31, 2012. Ratings of certain bonds may have changed subsequent to that date. The Fund’s current Statement of Additional Information contains a description of Moody’s and Standard & Poor’s ratings. |
| * | Non-income producing security. |
| (a) | All or a portion of security is on loan. The aggregate market value of such securities, including those sold and pending settlement, is $242,318,894; cash collateral of $251,155,277 (included with liabilities) was received with which the Portfolio purchased highly liquid short-term investments. |
See Notes to Financial Statements.
| | |
| 18 | | Visit our website at www.prudentialfunds.com |
| (b) | Indicates a security or securities that have been deemed illiquid. |
| (c) | Private Placement restricted as to resale and does not have a readily available market. The aggregate original cost of such security is $2,000,000. The aggregate value of $1,543,086 is approximately 0.1% of net assets. |
| (d) | Standard & Poor’s rating. |
| (e) | Represents security, or a portion thereof, purchased with cash collateral received for securities on loan. |
| (f) | Prudential Investments LLC, the manager of the Fund also serves as manager of the Prudential Investment Portfolio 2 - Prudential Core Taxable Money Market Fund. |
Various inputs are used in determining the value of the Fund’s investments. These inputs are summarized in the three broad levels listed below.
Level 1—quoted prices generally in active markets for identical securities.
Level 2—other significant observable inputs including, but not limited to, quoted prices for similar securities, interest rates and yield curves, prepayment speeds, foreign currency exchange rates, and amortized cost.
Level 3—significant unobservable inputs for securities valued in accordance with Board approved fair valuation procedures.
The following is a summary of the inputs used as of October 31, 2012 in valuing such portfolio securities:
| | | | | | | | | | | | |
| | | Level 1 | | | Level 2 | | | Level 3 | |
Investments in Securities | | | | | | | | | | | | |
Common Stocks | | $ | 2,410,151,085 | | | $ | 1,543,086 | | | $ | — | |
Preferred Stocks | | | 192,818,763 | | | | 21,442,606 | | | | — | |
Convertible Bonds | | | — | | | | 17,897,656 | | | | 207,145,546 | |
Options Written | | | (299,375 | ) | | | — | | | | — | |
Affiliated Money Market Mutual Fund | | | 295,210,778 | | | | — | | | | — | |
| | | | | | | | | | | | |
Total | | $ | 2,897,881,251 | | | $ | 40,883,348 | | | $ | 207,145,546 | |
| | | | | | | | | | | | |
Fair Value of Level 2 investments at 10/31/11 was $248,844,343, which was the result of third-party vendor modeling tools. An amount of $98,322,198 was transferred from Level 2 into Level 1 at 10/31/12 as a result of using quoted prices in active market for such foreign securities.
See Notes to Financial Statements.
| | | | |
| Prudential Jennison Equity Income Fund | | | 19 | |
Portfolio of Investments
as of October 31, 2012 continued
The following is a reconciliation of assets in which significant unobservable inputs (Level 3) were used in determining fair value:
| | | | | | | | |
| | | Common
Stock | | | Convertible
Bonds | |
Balance as of 10/31/11 | | $ | 1,782,043 | | | $ | — | |
Accrued discounts/premiums | | | — | | | | — | |
Realized gain (loss) | | | — | | | | — | |
Change in unrealized appreciation (depreciation)* | | | — | | | | (2,408,283 | ) |
Purchases | | | — | | | | 209,553,829 | |
Sales | | | — | | | | — | |
Transfers into Level 3 | | | — | | | | — | |
Transfers out of Level 3 | | | (1,782,043 | ) | | | — | |
| | | | | | | | |
Balance as of 10/31/12 | | $ | — | | | $ | 207,145,546 | |
| | | | | | | | |
| * | Of which, $(2,408,283) was included in Net Assets relating to securities held at the reporting period end. |
It is the Fund’s policy to recognize transfers in and transfers out at the fair value as of the beginning of period. At the reporting period end, there was one Common Stock security transferred out of Level 3 as a result of being priced by a formula with observable inputs.
Level 3 securities as presented in the table above are being fair valued using pricing methodologies approved by the Valuation Committee, which contain unobservable inputs. Such methodologies include, but are not limited to, using prices provided by a single broker/dealer and using subadvisor valuation models for securities not priced on an exchange.
The valuation techniques and significant amounts of unobservable inputs used in the fair value measurement of the Fund’s Level 3 securities are outlined in the table below.
| | | | | | | | | | |
| | | Fair Value
October 31,
2012 | | | Valuation
Methodologies | | Unobservable
Input(s) | | Range (Weighted
Average) |
Convertible Bonds
investments | | $ | 207,145,546 | | | Market approach | | Offered quote | | $46.06 - $95.56 ($61.17) |
The industry classification of investments and liabilities in excess of other assets shown as a percentage of net assets as of October 31, 2012 were as follows:
| | | | |
Oil, Gas & Consumable Fuels | | | 11.1 | % |
Affiliated Money Market Mutual Fund (8.7% represents investments purchased with collateral from securities on loan) | | | 10.3 | |
Food Products | | | 7.5 | |
Pharmaceuticals | | | 7.4 | % |
Diversified Telecommunication Services | | | 7.1 | |
Investment Banking & Brokerage | | | 6.8 | |
Electric Utilities | | | 6.1 | |
Real Estate Investment Trusts | | | 5.6 | |
See Notes to Financial Statements.
| | |
| 20 | | Visit our website at www.prudentialfunds.com |
| | | | |
Industry (cont’d.) | | | |
Media | | | 5.3 | % |
Semiconductors & Semiconductor Equipment | | | 4.5 | |
Aerospace & Defense | | | 4.2 | |
Tobacco | | | 3.7 | |
Multi-Utilities | | | 2.9 | |
Diversified Financial Services | | | 2.8 | |
Road & Rail | | | 2.5 | |
Chemicals | | | 2.3 | |
Computers & Peripherals | | | 2.1 | |
Wireless Telecommunication Services | | | 2.0 | |
Hotels, Restaurants & Leisure | | | 1.5 | |
Capital Markets | | | 1.4 | |
Communications Equipment | | | 1.4 | |
Software | | | 1.3 | |
Specialty Retail | | | 1.2 | |
Independent Power Producers & Energy Traders | | | 1.1 | % |
Airlines | | | 1.0 | |
Insurance | | | 1.0 | |
Machinery | | | 0.9 | |
Beverages | | | 0.8 | |
Transportation Infrastructure | | | 0.8 | |
Leisure Equipment & Products | | | 0.7 | |
Commercial Services & Supplies | | | 0.7 | |
Household Durables | | | 0.5 | |
Construction & Engineering | | | 0.4 | |
Real Estate Management & Development | | | 0.3 | |
| | | | |
| | | 109.2 | |
Options Written | | | — | * |
Liabilities in excess of other assets | | | (9.2 | ) |
| | | | |
| | | 100.0 | % |
| | | | |
The Fund invested in various derivative instruments during the reporting period. The primary types of risk associated with these derivative instruments was equity contracts risk. The effect of such derivative instruments on the Fund’s financial position and financial performance as reflected in the Statement of Assets and Liabilities and Statement of Operations is presented in the summary below.
Fair values of derivative instruments as of October 31, 2012 as presented in the Statement of Assets and Liabilities:
| | | | | | | | | | | | |
Derivatives not accounted for
as hedging instruments,
carried at fair value | | Asset Derivatives | | | Liability Derivatives | |
| | Balance
Sheet Location | | Fair
Value | | | Balance
Sheet Location | | Fair
Value | |
| Equity contracts | | — | | $ | — | | | Options written | | $ | 299,375 | |
| | | | | | | | | | | | |
The effects of derivative instruments on the Statement of Operations for the year ended October 31, 2012 are as follows:
| | | | |
Change in Unrealized Appreciation or (Depreciation) on Derivatives Recognized in Income | |
Derivatives not accounted for as hedging
instruments, carried at fair value | | Options Written | |
Equity contracts | | $ | 307,101 | |
| | | | |
For the year ended October 31, 2012, the Fund’s average premiums received for options written was $121,295.
See Notes to Financial Statements.
| | | | |
| Prudential Jennison Equity Income Fund | | | 21 | |
Statement of Assets and Liabilities
as of October 31, 2012
| | | | |
Assets | | | | |
Investments at value, including securities on loan of $242,318,894: | | | | |
Unaffiliated Investments (cost $2,671,072,522) | | $ | 2,850,998,742 | |
Affiliated Investments (cost $295,210,778) | | | 295,210,778 | |
Dividends and interest receivable | | | 5,987,408 | |
Receivable for Fund shares sold | | | 5,782,477 | |
Receivable for investments sold | | | 3,066,181 | |
Tax reclaim receivable | | | 546,409 | |
Prepaid expenses | | | 39,850 | |
| | | | |
Total assets | | | 3,161,631,845 | |
| | | | |
| |
Liabilities | | | | |
Payable to broker for collateral for securities on loan | | | 251,155,277 | |
Payable for investments purchased | | | 11,515,368 | |
Payable to custodian | | | 8,664,183 | |
Payable for Fund shares reacquired | | | 5,705,287 | |
Advisory fee payable | | | 1,882,324 | |
Distribution fee payable | | | 937,912 | |
Accrued expenses | | | 576,493 | |
Options written (premiums received $606,476) | | | 299,375 | |
Affiliated transfer agent fee payable | | | 71,548 | |
| | | | |
Total liabilities | | | 280,807,767 | |
| | | | |
| |
Net Assets | | $ | 2,880,824,078 | |
| | | | |
| | | | | |
Net assets were comprised of: | | | | |
Common stock, at $.001 par value | | $ | 210,663 | |
Paid-in capital in excess of par | | | 2,775,641,296 | |
| | | | |
| | | 2,775,851,959 | |
Undistributed net investment income | | | 17,745,727 | |
Accumulated net realized loss on investment and foreign currency transactions | | | (92,999,456 | ) |
Net unrealized appreciation on investments and foreign currencies | | | 180,225,848 | |
| | | | |
Net assets, October 31, 2012 | | $ | 2,880,824,078 | |
| | | | |
See Notes to Financial Statements.
| | |
| 22 | | Visit our website at www.prudentialfunds.com |
| | | | |
Class A: | | | | |
Net asset value and redemption price per share
($1,249,149,021 ÷ 89,891,647 shares of common stock issued and outstanding) | | $ | 13.90 | |
Maximum sales charge (5.5% of offering price) | | | 0.81 | |
| | | | |
Maximum offering price to public | | $ | 14.71 | |
| | | | |
| |
Class B: | | | | |
Net asset value, offering price and redemption price per share
($90,555,381 ÷ 6,887,591 shares of common stock issued and outstanding) | | $ | 13.15 | |
| | | | |
| |
Class C: | | | | |
Net asset value, offering price and redemption price per share
($691,480,563 ÷ 52,710,439 shares of common stock issued and outstanding) | | $ | 13.12 | |
| | | | |
| |
Class Q: | | | | |
Net asset value, offering price and redemption price per share
($2,193,787 ÷ 157,790 shares of common stock issued and outstanding) | | $ | 13.90 | |
| | | | |
| |
Class R: | | | | |
Net asset value, offering price and redemption price per share
($8,895,814 ÷ 640,242 shares of common stock issued and outstanding) | | $ | 13.89 | |
| | | | |
| |
Class X: | | | | |
Net asset value, offering price and redemption price per share
($1,256,839 ÷ 95,886 shares of common stock issued and outstanding) | | $ | 13.11 | |
| | | | |
| |
Class Z: | | | | |
Net asset value, offering price and redemption price per share
($837,292,673 ÷ 60,279,780 shares of common stock issued and outstanding) | | $ | 13.89 | |
| | | | |
See Notes to Financial Statements.
| | | | |
| Prudential Jennison Equity Income Fund | | | 23 | |
Statement of Operations
Year Ended October 31, 2012
| | | | |
Net Investment Income | | | | |
Investment Income | | | | |
Unaffiliated dividend income (net of foreign withholding tax of $2,766,073) | | $ | 120,690,715 | |
Unaffiliated interest income | | | 11,197,536 | |
Affiliated income from securities lending, net | | | 2,025,594 | |
Affiliated dividend income | | | 67,320 | |
| | | | |
Total income | | | 133,981,165 | |
| | | | |
| |
Expenses | | | | |
Advisory fee | | | 19,868,775 | |
Distribution fee—Class A | | | 2,810,745 | |
Distribution fee—Class B | | | 765,467 | |
Distribution fee—Class C | | | 6,150,748 | |
Distribution fee—Class L | | | 68,315 | |
Distribution fee—Class M | | | 2,589 | |
Distribution fee—Class R | | | 28,330 | |
Distribution fee—Class X | | | 18,487 | |
Transfer agent’s fee and expenses (including affiliated expense of $438,000) (Note 3) | | | 2,771,000 | |
Custodian’s fees and expenses | | | 329,000 | |
Registration fees | | | 245,000 | |
Reports to shareholders | | | 140,000 | |
Directors’ fees | | | 59,000 | |
Legal fees and expenses | | | 47,000 | |
Insurance fees | | | 45,000 | |
Audit fees | | | 29,000 | |
Loan interest expense (Note 7) | | | 326 | |
Miscellaneous | | | 26,665 | |
| | | | |
Net expenses | | | 33,405,447 | |
| | | | |
Net investment income | | | 100,575,718 | |
| | | | |
| |
Realized And Unrealized Gain (Loss) On Investment And Foreign Currencies | | | | |
Net realized loss on: | | | | |
Investment transactions | | | (25,397,115 | ) |
Foreign currency transactions | | | (449,750 | ) |
| | | | |
| | | (25,846,865 | ) |
| | | | |
Net change in unrealized appreciation (depreciation) on: | | | | |
Investments | | | 173,881,432 | |
Options written | | | 307,101 | |
Foreign currencies | | | (50,922 | ) |
| | | | |
| | | 174,137,611 | |
| | | | |
Net gain on investments and foreign currencies | | | 148,290,746 | |
| | | | |
Net Increase In Net Assets Resulting From Operations | | $ | 248,866,464 | |
| | | | |
See Notes to Financial Statements.
| | |
| 24 | | Visit our website at www.prudentialfunds.com |
Statement of Changes in Net Assets
| | | | | | | | |
| | | Year Ended October 31, | |
| | | 2012 | | | 2011 | |
Increase (Decrease) In Net Assets | | | | | | | | |
Operations | | | | | | | | |
Net investment income | | $ | 100,575,718 | | | $ | 55,106,537 | |
Net realized loss on investment and foreign currency transactions | | | (25,846,865 | ) | | | (26,829,350 | ) |
Net change in unrealized appreciation (depreciation) on investments and foreign currencies | | | 174,137,611 | | | | (42,992,941 | ) |
| | | | | | | | |
Net increase (decrease) in net assets resulting from operations | | | 248,866,464 | | | | (14,715,754 | ) |
| | | | | | | | |
| | |
Dividends and Distributions (Note 1) | | | | | | | | |
Dividends from net investment income | | | | | | | | |
Class A | | | (38,203,072 | ) | | | (25,624,158 | ) |
Class B | | | (2,206,926 | ) | | | (1,266,725 | ) |
Class C | | | (17,715,427 | ) | | | (10,814,696 | ) |
Class L | | | (342,726 | ) | | | (600,499 | ) |
Class M | | | (5,624 | ) | | | (85,574 | ) |
Class Q | | | (65,183 | ) | | | (6,607 | ) |
Class R | | | (186,068 | ) | | | (38,789 | ) |
Class X | | | (49,399 | ) | | | (114,795 | ) |
Class Z | | | (26,190,952 | ) | | | (13,357,666 | ) |
| | | | | | | | |
Total dividends | | | (84,965,377 | ) | | | (51,909,509 | ) |
| | | | | | | | |
| | |
Fund share transactions (Net of share conversions) (Note 5) | | | | | | | | |
Net proceeds from shares sold | | | 1,261,357,984 | | | | 1,940,207,862 | |
Net asset value of shares issued in reinvestment of dividends
and distributions | | | 64,040,759 | | | | 38,231,007 | |
Cost of shares redeemed | | | (679,414,318 | ) | | | (376,903,828 | ) |
| | | | | | | | |
Net increase in net assets from Fund share transactions | | | 645,984,425 | | | | 1,601,535,041 | |
| | | | | | | | |
Total increase in net assets | | | 809,885,512 | | | | 1,534,909,778 | |
| | |
Net Assets | | | | | | | | |
Beginning of year | | | 2,070,938,566 | | | | 536,028,788 | |
| | | | | | | | |
End of year(a) | | $ | 2,880,824,078 | | | $ | 2,070,938,566 | |
| | | | | | | | |
(a) Includes undistributed net investment income of | | $ | 17,745,727 | | | $ | 2,902,093 | |
| | | | | | | | |
See Notes to Financial Statements.
| | | | |
| Prudential Jennison Equity Income Fund | | | 25 | |
Notes to Financial Statements
1. Organization
Prudential Investment Portfolios, Inc. 10 (the “Company”) is an open-end management investment company, registered under the Investment Company Act of 1940, as amended, (“1940 Act”). The Company was organized on March 5, 1997, as a Maryland Corporation. The Company operates as a series company. At October 31, 2012, the Company consisted of two diversified investment portfolios (each a “Fund” and collectively the “Funds”). The information presented in these financial statements pertains to Prudential Jennison Equity Income Fund (the “Fund”). The investment objective of the Fund is income and capital appreciation.
2. Significant Accounting Policies
The following accounting policies are in conformity with accounting principles generally accepted in the United States of America. Such policies are consistently followed by the Company and the Funds in the preparation of their financial statements.
Securities Valuation: The Fund holds portfolio securities and other assets that are fair valued at the close of each day the New York Stock Exchange (“NYSE”) is open for trading. Fair value is the price that would be received to sell an asset or paid to transfer a liability in an orderly transaction between market participants on the measurement date. The Board of Trustees (the “Board”) has delegated fair valuation responsibilities to Prudential Investments LLC (“PI” or “Manager”) through the adoption of Valuation Procedures for valuation of the Fund’s securities. Under the current Valuation Procedures, a Valuation Committee is established and responsible for supervising the valuation of portfolio securities and other assets. The Valuation Procedures allow the Fund to utilize independent pricing vendor services, quotations from market makers and other valuation methods in events when market quotations are not readily available or not representative of the fair value of the securities. A record of the Valuation Committee’s actions is subject to review, approval and ratification by the Board at its next regularly scheduled quarterly meeting.
Various inputs are used in determining the value of the Fund’s investments, which are summarized in the three broad level hierarchies based on any observable inputs used as described in the table following the Fund’s Portfolio of Investments. The valuation methodologies and significant inputs used in determining the fair value of
| | |
| 26 | | Visit our website at www.prudentialfunds.com |
securities and other assets classified as Level 1, Level 2 and Level 3 of the hierarchy are as follows:
Common stocks, exchange-traded funds and financial derivative instruments (including futures contracts and certain options and swap contracts on securities), that are traded on a national securities exchange are valued at the last sale price as of the close of trading on the applicable exchange. Securities traded via NASDAQ are valued at the NASDAQ official closing price. To the extent these securities are valued at the last sale price or NASDAQ official closing price, they are classified as Level 1 of the fair value hierarchy.
In the event there is no sale or official closing price on such day, these securities are valued at the mean between the last reported bid and asked prices, or at the last bid price in the absence of an asked price. These securities are classified as Level 2 of the fair value hierarchy as these inputs are considered as significant other observable inputs to the valuation.
For common stocks traded on foreign securities exchanges, certain valuation adjustments will be applied when events occur after the close of the security’s foreign market and before the Fund’s normal pricing time. These securities are valued using pricing vendor services that provide model prices derived using adjustment factors based on information such as local closing price, relevant general and sector indices, currency fluctuations, depositary receipts, and futures, as applicable. Securities valued using such model prices are classified as Level 2 of the fair value hierarchy as the adjustment factors are considered as significant other observable inputs to the valuation.
Investments in open-end, non-exchange-traded mutual funds are valued at their net asset values as of the close of the NYSE on the date of valuation. These securities are classified as Level 1 as they have the ability to be purchased or sold at their net asset values on the date of valuation.
Fixed income securities traded in the over-the-counter market, such as corporate bonds, municipal bonds, U.S. Government agencies issues and guaranteed obligations, U.S. Treasury obligations and sovereign issues are usually valued at prices provided by approved independent pricing vendors. The pricing vendors provide these prices usually after evaluating observable inputs including yield curves, credit rating, yield spreads, default rates, cash flows as well as broker/dealer quotations and reported trades. Securities valued using such vendor prices are classified as Level 2 of the fair value hierarchy.
Asset-backed and mortgage-related securities are usually valued by approved independent pricing vendors. The pricing vendors provide the prices using their
| | | | |
| Prudential Jennison Equity Income Fund | | | 27 | |
Notes to Financial Statements
continued
internal pricing model with input from deal term, tranche level attributes, yield curve, prepayment speeds, and broker/dealer quotes. Securities valued using such vendor prices are classified as Level 2 of the fair value hierarchy.
Short-term debt securities of sufficient credit quality, which mature in 60 days or less, are valued using amortized cost method, which approximates fair value. The amortized cost method involves valuing a security at its cost on the date of purchase and thereafter assuming a constant amortization to maturity of the difference between the principal amount due at maturity and cost. These securities are categorized as Level 2 of the fair value hierarchy.
Over-the-counter financial derivative instruments, such as option contracts, foreign currency contracts and swaps agreements, are usually valued using pricing vendor services, which derive the valuation based on underlying asset prices, indices, spreads, interest rates, exchange rates and other inputs. These instruments are categorized as Level 2 of the fair value hierarchy.
Securities and other assets that cannot be priced using the methods described above are valued with pricing methodologies approved by the Valuation Committee. In the event there are unobservable inputs used when determining such valuations, the securities will be classified as Level 3 of the fair value hierarchy.
When determining the fair value of securities, some of the factors influencing the valuation include: the nature of any restrictions on disposition of the securities; assessment of the general liquidity of the securities; the issuer’s financial condition and the markets in which it does business; the cost of the investment; the size of the holding and the capitalization of the issuer; the prices of any recent transactions or bids/offers for such securities or any comparable securities; any available analyst media or other reports or information deemed reliable by the investment adviser regarding the issuer or the markets or industry in which it operates. Using fair value to price securities may result in a value that is different from a security’s most recent closing price and from the price used by other mutual funds to calculate their net asset values.
Foreign Currency Translation: Fund securities and other assets and liabilities denominated in foreign currencies are translated each business day into U.S. dollars based on the current rates of exchange. Purchases and sales of Fund securities and income and expenses are translated into U.S. dollars on the respective dates of such transactions. Gains and losses resulting from changes in exchange rates applicable to long-term foreign securities are not reported separately from gains and losses arising from movements in securities prices. Net realized foreign exchange gains and losses
| | |
| 28 | | Visit our website at www.prudentialfunds.com |
include gains and losses from sales and maturities of foreign currency exchange contracts, gains and losses realized between the trade and settlement dates of foreign securities transactions, and the difference between the amount of net investment income accrued on foreign securities and the U.S. dollar amount actually received. Net unrealized foreign exchange gains and losses include gains and losses from changes in the value of assets and liabilities other than Fund securities, resulting from changes in exchange rates.
Options: The Fund may either purchase or write options in order to hedge against adverse market movements or fluctuations in value caused by changes in prevailing interest rates or foreign currency exchange rates with respect to securities or financial instruments which the Fund currently owns or intends to purchase. The Fund’s principal reason for writing options is to realize, through receipt of premiums, a greater current return than would be realized on the underlying security alone. When the Fund purchases an option, it pays a premium and an amount equal to that premium is recorded as an asset. When the Fund writes an option, it receives a premium and an amount equal to that premium is recorded as a liability. The asset or liability is adjusted daily to reflect the current market value of the option.
If an option expires unexercised, the Fund realizes a gain or loss to the extent of the premium received or paid. If an option is exercised, the premium received or paid is recorded as an adjustment to the proceeds from the sale or the cost basis of the purchase. The difference between the premium and the amount received or paid on at a closing purchase or sale transaction is also treated as a realized gain or loss. Gain or loss on purchased options is included in net realized gain or loss on investment transactions. Gain or loss on written options is presented separately as net realized gain or loss on written options transactions.
The Fund, as writer of an option, may have no control over whether the underlying securities or financial instruments may be sold (called) or purchased (put). As a result, the Fund bears the market risk of an unfavorable change in the price of the security or financial instrument underlying the written option. Over-the-counter options involve the risk of the potential inability of the counterparties to meet the terms of their contracts.
When a Fund writes an option on a swap, an amount equal to any premium received by the Fund is recorded as a liability and is subsequently adjusted to the current market value of the written option on the swap. If a call option on a swap is exercised, the Fund becomes obligated to pay a fixed interest rate (noted as the strike price) and receive a variable interest rate on a notional amount. If a put option on a swap is exercised, the Fund becomes obligated to pay a variable interest rate and receive a fixed interest rate (noted as the strike price) on a notional amount. Premiums
| | | | |
| Prudential Jennison Equity Income Fund | | | 29 | |
Notes to Financial Statements
continued
received from writing options on swaps that expire or are exercised are treated as realized gains upon the expiration or exercise of such options on swaps. The risk associated with writing put and call options on swaps is that the Fund will be obligated to be party to a swap agreement if an option on a swap is exercised.
Securities Lending: The Fund may lend their portfolio securities to banks and broker-dealers. The loans are secured by collateral at least equal to the market value of the securities loaned. Collateral pledged by each borrower is invested in a highly liquid short-term money market fund and is marked to market daily, based on the previous day’s market value, such that the value of the collateral exceeds the value of the loaned securities. Loans are subject to termination at the option of the borrower or the Fund. Upon termination of the loan, the borrower will return to the lender securities identical to the loaned securities. Should the borrower of the securities fail financially, the Fund has the right to repurchase the securities using the collateral in the open market. The Fund recognizes income, net of any rebate and securities lending agent fees, for lending its securities, and any interest on the investment of any cash received as collateral. The Fund also continues to receive interest and dividends or amounts equivalent thereto, on the securities loaned and recognizes any unrealized gain or loss in the market price of the securities loaned that may occur during the term of the loan.
Securities Transactions and Net Investment Income: Securities transactions are recorded on the trade date. Realized gains or losses from investment and currency transactions are calculated on the identified cost basis. Dividend income is recorded on the ex-dividend date. Interest income, including amortization of premium and accretion of discount on debt securities, as required, is recorded on an accrual basis. Expenses are recorded on an accrual basis, which may require the use of certain estimates by management, that may differ from actual.
Net investment income or loss (other than distribution fees which are charged directly to the respective class) and unrealized and realized gains or losses are allocated daily to each class of shares based upon the relative proportion of adjusted net assets of each class at the beginning of the day.
Dividends and Distributions to Shareholders: Dividends and distributions to shareholders are recorded on the ex-divided date. Dividends, if any, from net investment income are declared and paid at least quarterly. These dividends and distributions are determined in accordance with federal income tax regulations
| | |
| 30 | | Visit our website at www.prudentialfunds.com |
and may differ from accounting principles generally accepted in the United States of America.
Net realized gains from investment transactions, if any, are distributed at least annually. Permanent book/tax differences relating to income and gains are reclassified to paid-in capital when they arise.
Taxes: For federal income tax purposes, each Fund in the Company is treated as a separate tax paying entity. It is the Funds’ policy to continue to meet the requirements of the Internal Revenue Code applicable to regulated investment companies and to distribute all of its taxable net income and capital gains, if any, to shareholders. Therefore, no federal tax provision is required. Withholding taxes on foreign dividends are recorded net of reclaimable amounts, at the time the related income is earned.
Estimates: The preparation of the financial statements requires management to make estimates and assumptions that affect the reported amounts and disclosures in the financial statements. Actual results could differ from those estimates.
3. Agreements
The Fund has entered into investment management agreements with PI which provides that the Manager will furnish the Fund with investment advice and investment management and administrative services. The Manager has entered into a subadvisory agreement with Jennison Associates LLC.
Advisory Fee and Expense Limitations: The Manager receives a fee, computed daily and paid monthly, based on an annual rate of the average net assets. The Manager pays the subadvisor a fee as compensation for advisory services provided to the Fund. The Manager has voluntarily agreed to waive expenses in accordance with limitation expense policies as noted in the table below. The Manager will reimburse the Fund for its operating expenses, exclusive of taxes, interest, brokerage commissions, distribution fees and extraordinary expenses, but inclusive of the advisory fee, which in the aggregate exceed specified percentages of the Fund’s average net assets while retaining their ability to be reimbursed for such fee waivers prior to the end of the fiscal year. The advisory fee and expense limitation are summarized as follows:
| | | | | | |
November 1, 2011-
June 30, 2012 Advisory Fee | | Effective July 1, 2012
Advisory Fee | | Effective Advisory Fee | | Expense
Limitation |
| .85% to $500 million; | | .85% to $500 million; | | .78% | | 1.15% |
| .80% next $500 million; | | .80% next $500 million; | | | | |
| .75% in excess of $1 billion | | .75% on the next $1.5 billion;
.725% in excess of $2.5 billion | | | | |
| | | | |
| Prudential Jennison Equity Income Fund | | | 31 | |
Notes to Financial Statements
continued
Such contractual fee waivers or reductions have been calculated prior to any fee reimbursements with respect to the expense limitations, and may be rescinded at any time and without notice to investors. All reimbursements by the Manager are reflected in the Statements of Operations.
Certain officers and directors of the Fund are officers or directors of the Manager. The Fund pays no compensation directly to its officers or interested directors.
The fund has distribution agreements with Prudential Investment Management Services LLC (“PIMS”) and Prudential Annuities Distributors, Inc. (“PAD”). PIMS and PAD are both affiliates of PI and indirect, wholly-owned subsidiaries of Prudential. PIMS serves as the distributor of the Fund’s Class A, Class B, Class C, Class Q, Class R and Class Z shares. PIMS, together with PAD, serves as co-distributor of the Fund’s Class L, Class M and Class X shares.
The Company has adopted a separate Distribution and Service plan (each a “Plan” and collectively the “Plans”) for the Class A, Class B, Class C, Class L, Class M, Class R and Class X shares of the Fund in accordance with Rule 12b-1 of the 1940 Act. No distribution or service fees are paid to PIMS as distributor for the Fund’s Class Q or Class Z shares.
Under the Plans, the Fund compensate PIMS and PAD a distribution and service fee at an annual rate up to .30%, 1.00%, 1.00%, .50%, 1.00%, .75% and 1.00% of the average daily net assets of the Class A, B, C, L, M, R and X shares, respectively. Through February 28, 2014, PIMS has contractually agreed to limit such fees to .25% and .50% of the average daily net assets of the Class A shares and Class R shares, respectively.
During the year ended October 31, 2012, PIMS has advised the Fund, front-end sales charges (“FESC”) and gross contingent deferred sales charges (“CDSC”) were as follows:
| | | | | | | | |
Class A
FESC | | Class A
CDSC | | Class B
CDSC | | Class C
CDSC | | Class X
CDSC |
| $4,604,083 | | $25,133 | | $116,318 | | $154,705 | | $32 |
| | |
| 32 | | Visit our website at www.prudentialfunds.com |
4. Other Transactions with Affiliates
Prudential Mutual Fund Services LLC (“PMFS”), an affiliate of Prudential Investments LLC and an indirect, wholly-owned subsidiary of Prudential, serves as the Fund’s transfer agent. Transfer agent fees and expenses are shown in the Statements of Operations.
The Fund invests in the Prudential Core Taxable Money Market Fund (the “Core Fund”), a portfolio of the Prudential Investment Portfolios 2, registered under the 1940 Act, and managed by PI. Earnings from the Core Fund are disclosed on the Statement of Operations as affiliated dividend income.
Prudential Investment Management, Inc. (“PIM”), an indirect, wholly-owned subsidiary of Prudential, served as the Fund’s securities lending agent. For the year ended October 31, 2012, PIM has been compensated approximately $608,000 for these services.
5. Shares of Capital Stock
The Fund offers Class A, Class B, Class C, Class Q, Class R, Class X and Class Z shares. Class A shares are sold with a front-end sales charge of up to 5.50%. Purchases of $1 million or more are subject to a contingent deferred sales charge (“CDSC”) if shares are redeemed within 12 months of their purchase. Class B shares are sold with a CDSC which declines from 5% to zero depending upon the period of time the shares are held. Class B shares will automatically convert to Class A shares approximately seven years after purchase. Class C shares are sold with a CDSC of 1% on shares redeemed within the first 12 months of purchase. The last conversion of Class M and Class L shares to Class A shares was completed as of April 13, 2012 and August 24, 2012, respectively. There are no Class M and Class L shares outstanding and Class M and Class L shares are no longer being offered for sale. Class X shares are closed to new purchases. Class X shares will automatically convert to Class A shares approximately ten years after purchase. Class Q, Class R and Class Z shares are not subject to any sales or redemption charge and are offered exclusively for sale to a limited group of investors.
Under certain circumstances, an exchange may be made from specified share classes of the Fund to one or more other share classes of the Fund as presented in the table of transactions in shares of beneficial interest.
Of the Company’s authorized capital stock, 725 million authorized shares have been allocated to the Fund and divided into eight classes, designated Class A, Class B, Class C, Class M, Class Q, Class R, Class X and Class Z capital stock, each of which consists of 253 million, 20 million, 150 million, 1 million, 75 million, 75 million, 1 million and 150 million authorized shares, respectively.
| | | | |
| Prudential Jennison Equity Income Fund | | | 33 | |
Notes to Financial Statements
continued
Transactions in shares of capital were as follows:
| | | | | | | | |
Class A | | Shares | | | Amount | |
Year ended October 31, 2012: | | | | | | | | |
Shares sold | | | 36,549,724 | | | $ | 492,916,487 | |
Shares issued in reinvestment of dividends and distributions | | | 2,353,383 | | | | 31,743,465 | |
Shares reacquired | | | (22,353,402 | ) | | | (302,936,200 | ) |
| | | | | | | | |
Net increase (decrease) in shares outstanding before conversion | | | 16,549,705 | | | | 221,723,752 | |
Shares issued upon conversion from Class B, Class L, Class M,
Class X and Class Z | | | 1,652,448 | | | | 22,823,129 | |
Shares reacquired upon conversion into Class Z | | | (351,082 | ) | | | (4,798,190 | ) |
| | | | | | | | |
Net increase (decrease) in shares outstanding | | | 17,851,071 | | | $ | 239,748,691 | |
| | | | | | | | |
Year ended October 31, 2011: | | | | | | | | |
Shares sold | | | 65,288,718 | | | $ | 879,345,539 | |
Shares issued in reinvestment of dividends and distributions | | | 1,615,902 | | | | 21,397,405 | |
Shares reacquired | | | (13,729,926 | ) | | | (180,041,038 | ) |
| | | | | | | | |
Net increase (decrease) in shares outstanding before conversion | | | 53,174,694 | | | | 720,701,906 | |
Shares issued upon conversion from Class B, Class M, Class X and Class Z | | | 549,468 | | | | 7,324,894 | |
Shares reacquired upon conversion into Class Z | | | (5,969,165 | ) | | | (79,633,360 | ) |
| | | | | | | | |
Net increase (decrease) in shares outstanding | | | 47,754,997 | | | $ | 648,393,440 | |
| | | | | | | | |
Class B | | | | | | |
Year ended October 31, 2012: | | | | | | | | |
Shares sold | | | 2,784,134 | | | $ | 35,711,191 | |
Shares issued in reinvestment of dividends and distributions | | | 113,961 | | | | 1,459,974 | |
Shares reacquired | | | (652,083 | ) | | | (8,380,672 | ) |
| | | | | | | | |
Net increase (decrease) in shares outstanding before conversion | | | 2,246,012 | | | | 28,790,493 | |
Shares reacquired upon conversion into Class A | | | (138,913 | ) | | | (1,792,049 | ) |
| | | | | | | | |
Net increase (decrease) in shares outstanding | | | 2,107,099 | | | $ | 26,998,444 | |
| | | | | | | | |
Year ended October 31, 2011: | | | | | | | | |
Shares sold | | | 3,846,248 | | | $ | 49,392,988 | |
Shares issued in reinvestment of dividends and distributions | | | 68,020 | | | | 855,637 | |
Shares reacquired | | | (388,679 | ) | | | (4,849,074 | ) |
| | | | | | | | |
Net increase (decrease) in shares outstanding before conversion | | | 3,525,589 | | | | 45,399,551 | |
Shares reacquired upon conversion into Class A | | | (115,243 | ) | | | (1,455,257 | ) |
| | | | | | | | |
Net increase (decrease) in shares outstanding | | | 3,410,346 | | | $ | 43,944,294 | |
| | | | | | | | |
| | |
| 34 | | Visit our website at www.prudentialfunds.com |
| | | | | | | | |
Class C | | Shares | | | Amount | |
Year ended October 31, 2012: | | | | | | | | |
Shares sold | | | 19,981,446 | | | $ | 255,542,349 | |
Shares issued in reinvestment of dividends and distributions | | | 950,413 | | | | 12,153,690 | |
Shares reacquired | | | (8,687,100 | ) | | | (111,305,404 | ) |
| | | | | | | | |
Net increase (decrease) in shares outstanding before conversion | | | 12,244,759 | | | | 156,390,635 | |
Shares reacquired upon conversion into Class Z | | | (179,831 | ) | | | (2,300,077 | ) |
| | | | | | | | |
Net increase (decrease) in shares outstanding | | | 12,064,928 | | | $ | 154,090,558 | |
| | | | | | | | |
Year ended October 31, 2011: | | | | | | | | |
Shares sold | | | 35,447,474 | | | $ | 453,427,921 | |
Shares issued in reinvestment of dividends and distributions | | | 547,492 | | | | 6,869,547 | |
Shares reacquired | | | (4,095,001 | ) | | | (50,448,164 | ) |
| | | | | | | | |
Net increase (decrease) in shares outstanding before conversion | | | 31,899,965 | | | | 409,849,304 | |
Shares reacquired upon conversion into Class Z | | | (15,363 | ) | | | (187,038 | ) |
| | | | | | | | |
Net increase (decrease) in shares outstanding | | | 31,884,602 | | | $ | 409,662,266 | |
| | | | | | | | |
Class L | | | | | | |
Period ended August 24, 2012**: | | | | | | | | |
Shares sold | | | 13,169 | | | $ | 172,361 | |
Shares issued in reinvestment of dividends and distributions | | | 25,949 | | | | 336,609 | |
Shares reacquired | | | (117,421 | ) | | | (1,569,995 | ) |
| | | | | | | | |
Net increase (decrease) in shares outstanding before conversion | | | (78,303 | ) | | | (1,061,025 | ) |
Shares reacquired upon conversion into Class A | | | (1,208,915 | ) | | | (16,694,150 | ) |
| | | | | | | | |
Net increase (decrease) in shares outstanding | | | (1,287,218 | ) | | $ | (17,755,175 | ) |
| | | | | | | | |
Year ended October 31, 2011: | | | | | | | | |
Shares sold | | | 14,053 | | | $ | 192,437 | |
Shares issued in reinvestment of dividends and distributions | | | 44,303 | | | | 583,742 | |
Shares reacquired | | | (169,355 | ) | | | (2,261,841 | ) |
| | | | | | | | |
Net increase (decrease) in shares outstanding before conversion | | | (110,999 | ) | | | (1,485,662 | ) |
Shares reacquired upon conversion into Class Z | | | (892 | ) | | | (12,490 | ) |
| | | | | | | | |
Net increase (decrease) in shares outstanding | | | (111,891 | ) | | $ | (1,498,152 | ) |
| | | | | | | | |
Class M | | | | | | |
Period ended April 13, 2012**: | | | | | | | | |
Shares sold | | | 439 | | | $ | 5,277 | |
Shares issued in reinvestment of dividends and distributions | | | 443 | | | | 5,307 | |
Shares reacquired | | | (8,862 | ) | | | (107,872 | ) |
| | | | | | | | |
Net increase (decrease) in shares outstanding before conversion | | | (7,980 | ) | | | (97,288 | ) |
Shares reacquired upon conversion into Class A | | | (98,723 | ) | | | (1,243,837 | ) |
| | | | | | | | |
Net increase (decrease) in shares outstanding | | | (106,703 | ) | | $ | (1,341,125 | ) |
| | | | | | | | |
Year ended October 31, 2011: | | | | | | | | |
Shares sold | | | 4,390 | | | $ | 56,525 | |
Shares issued in reinvestment of dividends and distributions | | | 6,315 | | | | 79,873 | |
Shares reacquired | | | (8,934 | ) | | | (138,371 | ) |
| | | | | | | | |
Net increase (decrease) in shares outstanding before conversion | | | 1,771 | | | | (1,973 | ) |
Shares reacquired upon conversion into Class A | | | (283,314 | ) | | | (3,601,984 | ) |
| | | | | | | | |
Net increase (decrease) in shares outstanding | | | (281,543 | ) | | $ | (3,603,957 | ) |
| | | | | | | | |
| | | | |
| Prudential Jennison Equity Income Fund | | | 35 | |
Notes to Financial Statements
continued
| | | | | | | | |
Class Q | | Shares | | | Amount | |
Year ended October 31, 2012: | | | | | | | | |
Shares sold | | | 90,865 | | | $ | 1,255,623 | |
Shares issued in reinvestment of dividends and distributions | | | 4,797 | | | | 65,183 | |
Shares reacquired | | | (13,400 | ) | | | (183,578 | ) |
| | | | | | | | |
Net increase (decrease) in shares outstanding | | | 82,262 | | | $ | 1,137,228 | |
| | | | | | | | |
Period January 18, 2011* through October 31, 2011: | | | | | | | | |
Shares sold | | | 75,032 | | | $ | 922,515 | |
Shares issued in reinvestment of dividends and distributions | | | 521 | | | | 6,607 | |
Shares reacquired | | | (25 | ) | | | (319 | ) |
| | | | | | | | |
Net increase (decrease) in shares outstanding before conversion | | | 75,528 | | | $ | 928,803 | |
| | | | | | | | |
Class R | | | | | | |
Year ended October 31, 2012: | | | | | | | | |
Shares sold | | | 497,501 | | | $ | 6,763,238 | |
Shares issued in reinvestment of dividends and distributions | | | 12,463 | | | | 170,247 | |
Shares reacquired | | | (101,968 | ) | | | (1,374,331 | ) |
| | | | | | | | |
Net increase (decrease) in shares outstanding | | | 407,996 | | | $ | 5,559,154 | |
| | | | | | | | |
Period January 18, 2011* through October 31, 2011: | | | | | | | | |
Shares sold | | | 284,014 | | | $ | 3,859,580 | |
Shares issued in reinvestment of dividends and distributions | | | 2,435 | | | | 31,687 | |
Shares reacquired | | | (54,203 | ) | | | (695,394 | ) |
| | | | | | | | |
Net increase (decrease) in shares outstanding before conversion | | | 232,246 | | | $ | 3,195,873 | |
| | | | | | | | |
Class X | | | | | | |
Year ended October 31, 2012: | | | | | | | | |
Shares sold | | | 2,361 | | | $ | 29,727 | |
Shares issued in reinvestment of dividends and distributions | | | 3,882 | | | | 48,864 | |
Shares reacquired | | | (19,238 | ) | | | (243,118 | ) |
| | | | | | | | |
Net increase (decrease) in shares outstanding before conversion | | | (12,995 | ) | | | (164,527 | ) |
Shares reacquired upon conversion into Class A | | | (110,671 | ) | | | (1,412,712 | ) |
| | | | | | | | |
Net increase (decrease) in shares outstanding | | | (123,666 | ) | | $ | (1,577,239 | ) |
| | | | | | | | |
Year ended October 31, 2011: | | | | | | | | |
Shares sold | | | 3,085 | | | $ | 38,070 | |
Shares issued in reinvestment of dividends and distributions | | | 8,968 | | | | 112,972 | |
Shares reacquired | | | (52,374 | ) | | | (677,261 | ) |
| | | | | | | | |
Net increase (decrease) in shares outstanding before conversion | | | (40,321 | ) | | | (526,219 | ) |
Shares reacquired upon conversion into Class A | | | (155,568 | ) | | | (1,966,322 | ) |
| | | | | | | | |
Net increase (decrease) in shares outstanding | | | (195,889 | ) | | $ | (2,492,541 | ) |
| | | | | | | | |
| | |
| 36 | | Visit our website at www.prudentialfunds.com |
| | | | | | | | |
Class Z | | Shares | | | Amount | |
Year ended October 31, 2012: | | | | | | | | |
Shares sold | | | 34,694,205 | | | $ | 468,961,731 | |
Shares issued in reinvestment of dividends and distributions | | | 1,336,870 | | | | 18,057,420 | |
Shares reacquired | | | (18,805,478 | ) | | | (253,313,148 | ) |
| | | | | | | | |
Net increase (decrease) in shares outstanding before conversion | | | 17,225,597 | | | | 233,706,003 | |
Shares issued upon conversion from Class A and Class C | | | 522,280 | | | | 7,098,267 | |
Shares reacquired upon conversion into Class A | | | (123,688 | ) | | | (1,680,381 | ) |
| | | | | | | | |
Net increase (decrease) in shares outstanding | | | 17,624,189 | | | $ | 239,123,889 | |
| | | | | | | | |
Year ended October 31, 2011: | | | | | | | | |
Shares sold | | | 41,254,920 | | | $ | 552,972,287 | |
Shares issued in reinvestment of dividends and distributions | | | 629,594 | | | | 8,293,537 | |
Shares reacquired | | | (10,645,917 | ) | | | (137,792,366 | ) |
| | | | | | | | |
Net increase (decrease) in shares outstanding before conversion | | | 31,238,597 | | | | 423,473,458 | |
Shares issued upon conversion from Class A, Class C and Class L | | | 5,987,867 | | | | 79,832,887 | |
Shares reacquired upon conversion into Class A | | | (24,219 | ) | | | (301,330 | ) |
| | | | | | | | |
Net increase (decrease) in shares outstanding | | | 37,202,245 | | | $ | 503,005,015 | |
| | | | | | | | |
| * | Commencement of operations. |
| ** | As of April 13, 2012, the last conversion of Class M shares to Class A shares was completed. There are no Class M shares outstanding and Class M shares are no longer being offered for sale. As of August 24, 2012, the last conversion of Class L shares to Class A shares was completed. There are no Class L shares outstanding and Class L shares are no longer being offered at this time. |
6. Distributions and Tax Information
Distributions to shareholders, which are determined in accordance with federal income tax regulations and which may differ from generally accepted accounting principles, are recorded on the ex-dividend date. In order to present undistributed net investment income, accumulated net realized loss on investment and foreign currency transactions and paid-in capital in excess of par on the Statement of Assets and Liabilities that more closely represent their tax character, certain adjustments have been made to undistributed net investment income and accumulated net realized loss on investment and foreign currency transactions. For the year ended October 31, 2012, the adjustments were to decrease undistributed net investment income and decrease accumulated net realized loss on investment and foreign currency transactions by $766,707 due to differences in the treatment for book and tax purposes of certain transactions involving foreign securities and currencies and investment in partnerships. Net investment income, net realized gain (loss) on investment and foreign currency transactions and net assets were not affected by this change.
For the years ended October 31, 2012 and 2011, the tax character of dividends paid as reflected in the Statement of Changes in Net Assets were $84,965,377 and $51,909,509 of ordinary income, respectively.
| | | | |
| Prudential Jennison Equity Income Fund | | | 37 | |
Notes to Financial Statements
continued
As of October 31, 2012 the accumulated undistributed earnings on a tax basis was $17,448,694 of ordinary income. This differs from the amount shown on the Statement of Assets and Liabilities primarily due to cumulative timing differences between financial and tax reporting.
The United States federal income tax basis of the Fund’s investments and the net unrealized appreciation as of October 31, 2012 were as follows:
| | | | | | | | | | |
Tax Basis | | Appreciation | | Depreciation | | Net
Unrealized
Appreciation | | Other Cost
Basis
Adjustment | | Total Net
Unrealized
Appreciation |
| $2,969,942,777 | | $294,435,851 | | $(118,169,108) | | $176,266,743 | | $299,628 | | $176,566,371 |
The difference between book basis and tax basis is primarily attributable to deferred losses on wash sales, investment in partnerships and other cost basis differences between financial and tax reporting. Other cost basis adjustments are primarily attributable to appreciation (depreciation) of foreign currencies and options.
Under the Regulated Investment Company Modernization Act of 2010 (“the Act”), the Fund is permitted to carryforward capital losses incurred in the fiscal year ended October 31, 2012 (“post-enactment losses”) for an unlimited period. Post-enactment losses are required to be utilized before the utilization of losses incurred prior to the effective date of the Act. As a result of this ordering rule, capital loss carryforwards related to taxable years ending before October 31, 2012 (“pre-enactment losses”) may have an increased likelihood to expire unused. Additionally, post-enactment capital losses that are carried forward will retain their character as either short-term or long-term capital losses rather than being considered all short-term as under previous law. No capital gains distributions are expected to be paid to shareholders until net gains have been realized in excess of such losses. As of October 31, 2012, the pre and post-enactment losses were approximately:
| | | | |
Post-Enactment Losses: | | $ | 25,654,000 | |
| | | | |
Pre-Enactment Losses: | | | | |
Expiring 2016 | | $ | 16,679,000 | |
Expiring 2017 | | | 26,282,000 | |
Expiring 2019 | | | 20,428,000 | |
| | | | |
| | $ | 63,389,000 | |
| | | | |
| | |
| 38 | | Visit our website at www.prudentialfunds.com |
Management has analyzed the Fund’s tax positions taken on federal income tax returns for all open tax years and has concluded that no provision for income tax is required in the Fund’s financial statements for the current reporting period. The Fund’s federal and state income and federal excise tax returns for tax years for which the applicable statutes of limitations have not expired are subject to examination by the Internal Revenue Service and state departments of revenue.
7. Portfolio Securities
Purchases and sales of securities, other than U.S. government securities and short term obligations, during the year ended October 31, 2012, were $2,445,857,267 and $1,806,545,845, respectively.
Transactions in options written during the year ended October 31, 2012, were as follows:
| | | | | | | | |
| | | Notional
Amount
(000) | | | Premium
Received | |
Options outstanding at October 31, 2011 | | | — | | | $ | — | |
Written options | | | 110,000 | | | | 1,070,013 | |
Expired options | | | — | | | | — | |
Excercised options | | | (60,000 | ) | | | (463,537 | ) |
Closed options | | | — | | | | — | |
| | | | | | | | |
Options outstanding at October 31, 2012 | | | 50,000 | | | $ | 606,476 | |
| | | | | | | | |
8. Borrowings
The Fund, along with other affiliated registered investment companies (the “Funds”), is a party to a Syndicated Credit Agreement (“SCA”) with a group of banks. The purpose of the SCA is to provide an alternative source of temporary funding for capital share redemptions. The SCA provides for a commitment of $900 million for the period December 16, 2011 through November 14, 2012. The SCA has been renewed effective November 15, 2012 at substantially similar terms through November 14, 2013. The Funds pay an annualized commitment fee of ..08% of the unused portion of the SCA. Prior to December 16, 2011, the Funds had another Syndicated Credit Agreement of a $750 million commitment with an annualized commitment fee of .10% of the unused portion. Interest on any borrowings under the SCA is paid at contracted market rates. The commitment fee for the unused amount is accrued daily and paid quarterly.
| | | | |
| Prudential Jennison Equity Income Fund | | | 39 | |
Notes to Financial Statements
continued
The Fund utilized the SCA during the year ended October 31, 2012. The average daily balance for the one day the Fund had loans outstanding during the period was $8,000,000 borrowed at a weighted average interest rate of 1.47%. At October 31, 2012, the Fund did not have an outstanding loan amount.
Note 9. New Accounting Pronouncement
In December 2011, the Financial Accounting Standards Board (“FASB”) issued Accounting Standards Update (“ASU”) No. 2011-11 regarding “Disclosures about Offsetting Assets and Liabilities.” The amendments, which will be effective for annual reporting periods beginning on or after January 1, 2013 and interim periods within those annual periods, require an entity to disclose information about offsetting and related arrangements for assets and liabilities, financial instruments and derivatives that are either currently offset in accordance with current requirements or are subject to enforceable master netting arrangements or similar agreements. At this time, management is evaluating the implications of ASU No. 2011-11 and its impact on the financial statements has not yet been determined.
Note 10. Dividends to Shareholders
Subsequent to the fiscal year end, the Fund declared an ordinary income dividend on December 19, 2012 to shareholders of record on December 20, 2012. The ex-dividend date was December 21, 2012. The per share amount declared was as follows:
| | | | |
| | | Ordinary Income | |
Class A | | $ | 0.18549 | |
Class B | | $ | 0.15788 | |
Class C | | $ | 0.15788 | |
Class Q | | $ | 0.20017 | |
Class R | | $ | 0.17548 | |
Class X | | $ | 0.15788 | |
Class Z | | $ | 0.19554 | |
| | |
| 40 | | Visit our website at www.prudentialfunds.com |
Financial Highlights
| | | | | | | | | | | | | | | | | | | | |
| Class A Shares | |
| | | Year Ended October 31, | |
| | | 2012(b) | | | 2011(b) | | | 2010(b) | | | 2009(b) | | | 2008(b) | |
| Per Share Operating Performance: | | | | | | | | | | | | | | | | | | | | |
| Net Asset Value, Beginning Of Year | | | $12.98 | | | | $12.92 | | | | $10.86 | | | | $8.60 | | | | $19.47 | |
| Income from investment operations: | | | | | | | | | | | | | | | | | |
| Net investment income | | | .55 | | | | .52 | | | | .43 | | | | .44 | | | | .60 | |
| Net realized and unrealized gain (loss) on investments | | | .83 | | | | .02 | | | | 2.24 | | | | 1.93 | | | | (6.57 | ) |
| Total from investment operations | | | 1.38 | | | | .54 | | | | 2.67 | | | | 2.37 | | | | (5.97 | ) |
| Less Dividends and Distributions: | | | | | | | | | | | | | | | | | | | | |
| Dividends from net investment income | | | (.46 | ) | | | (.48 | ) | | | (.61 | ) | | | (.11 | ) | | | (.49 | ) |
| Distributions from net realized gains | | | - | | | | - | | | | - | | | | - | | | | (4.41 | ) |
| Total dividends and distributions | | | (.46 | ) | | | (.48 | ) | | | (.61 | ) | | | (.11 | ) | | | (4.90 | ) |
| Capital Contributions(d) | | | - | | | | - | | | | - | * | | | - | | | | - | |
| Net asset Value, end of year | | | $13.90 | | | | $12.98 | | | | $12.92 | | | | $10.86 | | | | $8.60 | |
| Total Return(a) | | | 10.77% | | | | 4.16% | | | | 25.19% | | | | 28.09% | | | | (39.46)% | |
| | | | | | | | | | | | | | | | | | | | |
| Ratios/Supplemental Data: | |
| Net assets, end of year (in millions) | | | $1,249.1 | | | | $935.0 | | | | $313.7 | | | | $75.3 | | | | $44.7 | |
| Ratios to average net assets(c): | | | | | | | | | | | | | | | | | | | | |
| Expenses after advisory fee waiver and expense reimbursement | | | 1.17% | | | | 1.22% | | | | 1.44% | | | | 1.40% | | | | 1.41% | |
| Expenses before advisory fee waiver and expense reimbursement | | | 1.17% | | | | 1.22% | | | | 1.45% | | | | 1.66% | | | | 1.50% | |
| Net investment income | | | 4.07% | | | | 3.88% | | | | 3.62% | | | | 4.79% | | | | 4.75% | |
| Portfolio turnover rate | | | 72% | | | | 70% | | | | 49% | | | | 63% | | | | 66% | |
(a) Total return does not consider the effects of sales load. Total return is calculated assuming a purchase of a share on the first day and a sale on the last day of each year reported and includes reinvestment of dividends and distributions. Total returns may reflect adjustments to conform with generally accepted accounting principles. Total return includes the effect of expense subsidies.
(b) Calculations are based on the average daily number of shares outstanding.
(c) Does not include expenses of the underlying portfolio in which the Fund invests.
(d) The Fund received payments related to a former affiliates and to an unaffiliated-third party’s settlement of regulatory proceedings involving allegations of improper trading in Fund shares during the fiscal year ended October 31, 2010. The Fund was not involved in the proceedings or in the calculation of the amount of settlement.
* Amount is less than $.005.
See Notes to Financial Statements.
| | | | |
| Prudential Jennison Equity Income Fund | | | 41 | |
Financial Highlights
continued
| | | | | | | | | | | | | | | | | | | | |
| Class B Shares | |
| | | Year Ended October 31, | |
| | | 2012(b) | | | 2011(b) | | | 2010(b) | | | 2009(b) | | | 2008(b) | |
| Per Share Operating Performance: | | | | | | | | | | | | | | | | | | | | |
| Net Asset Value, Beginning Of Year | | | $12.31 | | | | $12.27 | | | | $10.30 | | | | $8.22 | | | | $18.85 | |
| Income from investment operations: | | | | | | | | | | | | | | | | | | | | |
| Net investment income | | | .43 | | | | .39 | | | | .32 | | | | .36 | | | | .49 | |
| Net realized and unrealized gain (loss) on investments | | | .77 | | | | .04 | | | | 2.13 | | | | 1.82 | | | | (6.31 | ) |
| Total from investment operations | | | 1.20 | | | | .43 | | | | 2.45 | | | | 2.18 | | | | (5.82 | ) |
| Less Dividends and Distributions: | | | | | | | | | | | | | | | | | | | | |
| Dividends from net investment income | | | (.36 | ) | | | (.39 | ) | | | (.48 | ) | | | (.10 | ) | | | (.40 | ) |
| Distributions from net realized gains | | | - | | | | - | | | | - | | | | - | | | | (4.41 | ) |
| Total dividends and distributions | | | (.36 | ) | | | (.39 | ) | | | (.48 | ) | | | (.10 | ) | | | (4.81 | ) |
| Capital Contributions(d) | | | - | | | | - | | | | - | * | | | - | | | | - | |
| Net asset value, end of year | | | $13.15 | | | | $12.31 | | | | $12.27 | | | | $10.30 | | | | $8.22 | |
| Total Return(a) | | | 9.91% | | | | 3.45% | | | | 24.32% | | | | 27.03% | | | | (39.89)% | |
| |
| Ratios/Supplemental Data: | |
| Net assets, end of year (in millions) | | | $90.6 | | | | $58.8 | | | | $16.8 | | | | $4.6 | | | | $3.1 | |
| Ratios to average net assets(c): | | | | | | | | | | | | | | | | | | | | |
| Expenses after advisory fee waiver and expense reimbursement | | | 1.92% | | | | 1.97% | | | | 2.19% | | | | 2.15% | | | | 2.16% | |
| Expenses before advisory fee waiver and expense reimbursement | | | 1.92% | | | | 1.97% | | | | 2.20% | | | | 2.41% | | | | 2.24% | |
| Net investment income | | | 3.33% | | | | 3.07% | | | | 2.85% | | | | 4.11% | | | | 3.98% | |
| Portfolio turnover rate | | | 72% | | | | 70% | | | | 49% | | | | 63% | | | | 66% | |
(a) Total return does not consider the effects of sales load. Total return is calculated assuming a purchase of a share on the first day and a sale on the last day of each year reported and includes reinvestment of dividends and distributions. Total returns may reflect adjustments to conform with generally accepted accounting principles. Total return includes the effect of expense subsidies.
(b) Calculations are based on the average daily number of shares outstanding.
(c) Does not include expenses of the underlying portfolio in which the Fund invests.
(d) The Fund received payments related to a former affiliates and to an unaffiliated-third party’s settlement of regulatory proceedings involving allegations of improper trading in Fund shares during the fiscal year ended October 31, 2010. The Fund was not involved in the proceedings or in the calculation of the amount of settlement.
* Amount is less than $.005.
See Notes to Financial Statements.
| | |
| 42 | | Visit our website at www.prudentialfunds.com |
| | | | | | | | | | | | | | | | | | | | |
| Class C Shares | |
| | | Year Ended October 31, | |
| | | 2012(b) | | | 2011(b) | | | 2010(b) | | | 2009(b) | | | 2008(b) | |
| Per Share Operating Performance: | | | | | | | | | | | | | | | | | | | | |
| Net Asset Value, Beginning Of Year | | | $12.28 | | | | $12.25 | | | | $10.28 | | | | $8.20 | | | | $18.82 | |
| Income from investment operations: | | | | | | | | | | | | | | | | | | | | |
| Net investment income | | | .43 | | | | .39 | | | | .32 | | | | .35 | | | | .49 | |
| Net realized and unrealized gain (loss) on investments | | | .77 | | | | .03 | | | | 2.13 | | | | 1.83 | | | | (6.30 | ) |
| Total from investment operations | | | 1.20 | | | | .42 | | | | 2.45 | | | | 2.18 | | | | (5.81 | ) |
| Less Dividends and Distributions: | | | | | | | | | | | | | | | | | | | | |
| Dividends from net investment income | | | (.36 | ) | | | (.39 | ) | | | (.48 | ) | | | (.10 | ) | | | (.40 | ) |
| Distributions from net realized gains | | | - | | | | - | | | | - | | | | - | | | | (4.41 | ) |
| Total dividends and distributions | | | (.36 | ) | | | (.39 | ) | | | (.48 | ) | | | (.10 | ) | | | (4.81 | ) |
| Capital Contributions(d) | | | - | | | | - | | | | - | * | | | - | | | | - | |
| Net Asset Value, end of year | | | $13.12 | | | | $12.28 | | | | $12.25 | | | | $10.28 | | | | $8.20 | |
| Total Return(a) | | | 9.93% | | | | 3.37% | | | | 24.37% | | | | 27.09% | | | | (39.91)% | |
| |
| Ratios/Supplemental Data: | |
| Net assets, end of year (in millions) | | | $691.5 | | | | $499.1 | | | | $107.3 | | | | $27.3 | | | | $23.2 | |
| Ratios to average net assets(c): | | | | | | | | | | | | | | | | | | | | |
| Expenses after advisory fee waiver and expense reimbursement | | | 1.92% | | | | 1.97% | | | | 2.19% | | | | 2.15% | | | | 2.16% | |
| Expenses before advisory fee waiver and expense reimbursement | | | 1.92% | | | | 1.97% | | | | 2.20% | | | | 2.41% | | | | 2.25% | |
| Net investment income | | | 3.33% | | | | 3.08% | | | | 2.85% | | | | 4.13% | | | | 3.96% | |
| Portfolio turnover rate | | | 72% | | | | 70% | | | | 49% | | | | 63% | | | | 66% | |
(a) Total return does not consider the effects of sales load. Total return is calculated assuming a purchase of a share on the first day and a sale on the last day of each year reported and includes reinvestment of dividends and distributions. Total returns may reflect adjustments to conform with generally accepted accounting principles. Total return includes the effect of expense subsidies.
(b) Calculations are based on the average daily number of shares outstanding.
(c) Does not include expenses of the underlying portfolio in which the Fund invests.
(d) The Fund received payments related to a former affiliates and to an unaffiliated-third party’s settlement of regulatory proceedings involving allegations of improper trading in Fund shares during the fiscal year ended October 31, 2010. The Fund was not involved in the proceedings or in the calculation of the amount of settlement.
* Amount is less than $.005.
See Notes to Financial Statements.
| | | | |
| Prudential Jennison Equity Income Fund | | | 43 | |
Financial Highlights
continued
| | | | | | | | | | | | | | | | | | | | | | | | | | |
| Class L Shares | | | | | | | |
| | | Period
ended
August 24, | | | | | Year Ended October 31, | |
| | | 2012(b)(f) | | | | | 2011(b) | | | 2010(b) | | | 2009(b) | | | 2008(b) | | | 2007(b) | |
| Per Share Operating Performance: | | | | | | | | | | | | | | | | | | | | | | | | | | |
| Net Asset Value, Beginning Of Period | | | $12.88 | | | | | | $12.82 | | | | $10.77 | | | | $8.55 | | | | $19.38 | | | | $16.37 | |
| Income from investment operations: | | | | | | | | | | | | | | | | | | | | | | | | | | |
| Net investment income | | | .44 | | | | | | .51 | | | | .39 | | | | .42 | | | | .57 | | | | .61 | |
| Net realized and unrealized gain (loss) on investments | | | .76 | | | | | | - | * | | | 2.22 | | | | 1.91 | | | | (6.54 | ) | | | 2.99 | |
| Total from investment operations | | | 1.20 | | | | | | .51 | | | | 2.61 | | | | 2.33 | | | | (5.97 | ) | | | 3.60 | |
| Less Dividends and Distributions: | | | | | | | | | | | | | | | | | | | | | | | | | | |
| Dividends from net investment income | | | (.27 | ) | | | | | (.45 | ) | | | (.56 | ) | | | (.11 | ) | | | (.45 | ) | | | (.59 | ) |
| Distributions from net realized gains | | | - | | | | | | - | | | | - | | | | - | | | | (4.41 | ) | | | - | |
| Total dividends and distributions | | | (.27 | ) | | | | | (.45 | ) | | | (.56 | ) | | | (.11 | ) | | | (4.86 | ) | | | (.59 | ) |
| Capital Contributions(g) | | | - | | | | | | - | | | | - | * | | | - | | | | - | | | | - | |
| Net Asset Value, end of period | | | $13.81 | | | | | | $12.88 | | | | $12.82 | | | | $10.77 | | | | $8.55 | | | | $19.38 | |
| Total Return(a) | | | 9.51% | | | | | | 3.93% | | | | 24.84% | | | | 27.73% | | | | (39.63)% | | | | 22.43% | |
| |
| Ratios/Supplemental Data: | | | | |
| Net assets, end of period (in millions) | | | $16.7 | | | | | | $16.6 | | | | $17.9 | | | | $17.1 | | | | $17.0 | | | | $35.5 | |
| Ratios to average net assets(c): | | | | | | | | | | | | | | | | | | | | | | | | | | |
| Expenses after advisory fee waiver and expense reimbursement | | | 1.42% | (d) | | | | | 1.46% | | | | 1.69% | | | | 1.65% | | | | 1.66% | | | | 1.65% | |
| Expenses before advisory fee waiver and expense reimbursement | | | 1.42% | (d) | | | | | 1.46% | | | | 1.70% | | | | 1.91% | | | | 1.75% | | | | 1.76% | |
| Net investment income | | | 4.03% | (d) | | | | | 3.79% | | | | 3.31% | | | | 4.69% | | | | 4.45% | | | | 3.37% | |
| Portfolio turnover rate | | | 72% | (e) | | | | | 70% | | | | 49% | | | | 63% | | | | 66% | | | | 143% | |
(a) Total return does not consider the effects of sales load. Total return is calculated assuming a purchase of a share on the first day and a sale on the last day of each period reported and includes reinvestment of dividends and distributions. Total returns may reflect adjustments to conform with generally accepted accounting principles. Total return includes the effect of expense subsidies. Total returns for periods less than one full year are not annualized.
(b) Calculations are based on the average daily number of shares outstanding.
(c) Does not include expenses of the underlying portfolio in which the Fund invests.
(d) Annualized.
(e) Not annualized.
(f) End of operations.
(g) The Fund received payments related to a former affiliates and to an unaffiliated-third party’s settlement of regulatory proceedings involving allegations of improper trading in Fund shares during the fiscal year ended October 31, 2010. The Fund was not involved in the proceedings or in the calculation of the amount of settlement.
* Amount is less than $.005.
See Notes to Financial Statements.
| | |
| 44 | | Visit our website at www.prudentialfunds.com |
| | | | | | | | | | | | | | | | | | | | | | | | | | |
| Class M Shares | |
| | | Period
Ended
April 13, | | | | | Year Ended October 31, | |
| | | 2012(b)(f) | | | | | 2011(b) | | | 2010(b) | | | 2009(b) | | | 2008(b) | | | 2007(b) | |
| Per Share Operating Performance: | | | | | | | | | | | | | | | | | | | | | | | | | | |
| Net Asset Value, Beginning Of Period | | | $12.30 | | | | | | $12.26 | | | | $10.30 | | | | $8.22 | | | | $18.85 | | | | $15.89 | |
| Income from investment operations: | | | | | | | | | | | | | | | | | | | | | | | | | | |
| Net investment income | | | .18 | | | | | | .46 | | | | .31 | | | | .36 | | | | .49 | | | | .52 | |
| Net realized and unrealized gain (loss) on investments | | | .70 | | | | | | (.03 | ) | | | 2.13 | | | | 1.82 | | | | (6.31 | ) | | | 2.90 | |
| Total from investment operations | | | .88 | | | | | | .43 | | | | 2.44 | | | | 2.18 | | | | (5.82 | ) | | | 3.42 | |
| Less Dividends and Distributions: | | | | | | | | | | | | | | | | | | | | | | | | | | |
| Dividends from net investment income | | | (.14 | ) | | | | | (.39 | ) | | | (.48 | ) | | | (.10 | ) | | | (.40 | ) | | | (.46 | ) |
| Distributions from net realized gains | | | - | | | | | | - | | | | - | | | | - | | | | (4.41 | ) | | | - | |
| Total dividends and distributions | | | (.14 | ) | | | | | (.39 | ) | | | (.48 | ) | | | (.10 | ) | | | (4.81 | ) | | | (.46 | ) |
| Capital Contributions(g) | | | - | | | | | | - | | | | - | * | | | - | | | | - | | | | - | |
| Net asset value, end of period | | | $13.04 | | | | | | $12.30 | | | | $12.26 | | | | $10.30 | | | | $8.22 | | | | $18.85 | |
| Total Return(a) | | | 7.24% | | | | | | 3.45% | | | | 24.22% | | | | 27.03% | | | | (39.89)% | | | | 21.76% | |
| |
| Ratios/Supplemental Data: | |
| Net assets, end of period (in millions) | | | $.1 | | | | | | $1.3 | | | | $4.8 | | | | $12.1 | | | | $22.3 | | | | $80.9 | |
| Ratios to average net assets(c): | | | | | | | | | | | | | | | | | | | | | | | | | | |
| Expenses after advisory fee waiver and expense reimbursement | | | 1.91% | (d) | | | | | 1.95% | | | | 2.19% | | | | 2.15% | | | | 2.16% | | | | 2.15% | |
| Expenses before advisory fee waiver and expense reimbursement | | | 1.91% | (d) | | | | | 1.95% | | | | 2.20% | | | | 2.41% | | | | 2.25% | | | | 2.26% | |
| Net investment income | | | 2.97% | (d) | | | | | 3.58% | | | | 2.74% | | | | 4.29% | | | | 3.90% | | | | 2.79% | |
| Portfolio turnover rate | | | 72% | (e) | | | | | 70% | | | | 49% | | | | 63% | | | | 66% | | | | 143% | |
(a) Total return does not consider the effects of sales load. Total return is calculated assuming a purchase of a share on the first day and a sale on the last day of each period reported and includes reinvestment of dividends and distributions. Total returns may reflect adjustments to conform with generally accepted accounting principles. Total return includes the effect of expense subsidies. Total returns for periods less than one full year are not annualized.
(b) Calculations are based on the average daily number of shares outstanding.
(c) Does not include expenses of the underlying portfolio in which the Fund invests.
(d) Annualized.
(e) Not annualized.
(f) End of operations.
(g) The Fund received payments related to a former affiliates and to an unaffiliated-third party’s settlement of regulatory proceedings involving allegations of improper trading in Fund shares during the fiscal year ended October 31, 2010. The Fund was not involved in the proceedings or in the calculation of the amount of settlement.
* Amount is less than $.005.
See Notes to Financial Statements.
| | | | |
| Prudential Jennison Equity Income Fund | | | 45 | |
Financial Highlights
continued
| | | | | | | | | | |
| Class Q Shares | |
| | | Year Ended
October 31,
2012(b) | | | | | January 18,
2011(d)
through
October 31,
2011(b) | |
| Per Share Operating Performance: | | | | | | | | | | |
| Net Asset Value, Beginning Of Period | | | $12.99 | | | | | | $13.52 | |
| Income from investment operations: | | | | | | | | | | |
| Net investment income | | | .62 | | | | | | .29 | |
| Net realized and unrealized gain (loss) on investments | | | .80 | | | | | | (.43 | ) |
| Total from investment operations | | | 1.42 | | | | | | (.14 | ) |
| Less Dividends and Distributions: | | | | | | | | | | |
| Dividends from net investment income | | | (.51 | ) | | | | | (.39 | ) |
| Distributions from net realized gains | | | - | | | | | | - | |
| Total dividends and distributions | | | (.51 | ) | | | | | (.39 | ) |
| Net asset value, end of period | | | $13.90 | | | | | | $12.99 | |
| Total Return(a) | | | 11.09% | | | | | | (1.06)% | |
| |
| Ratios/Supplemental Data: | |
| Net assets, end of period (in millions) | | | $2.2 | | | | | | $1.0 | |
| Ratios to average net assets(c): | | | | | | | | | | |
| Expenses after advisory fee waiver and expense reimbursement | | | .81% | | | | | | .89% | (e) |
| Expenses before advisory fee waiver and expense reimbursement | | | .81% | | | | | | .89% | (e) |
| Net investment income | | | 4.57% | | | | | | 2.99% | (e) |
| Portfolio turnover rate | | | 72% | | | | | | 70% | (f) |
(a) Total return does not consider the effects of sales load. Total return is calculated assuming a purchase of a share on the first day and a sale on the last day of each period reported and includes reinvestment of dividends and distributions. Total returns may reflect adjustments to conform with generally accepted accounting principles. Total return includes the effect of expense subsidies. Total returns for periods less than one full year are not annualized.
(b) Calculations are based on the average daily number of shares outstanding.
(c) Does not include expenses of the underlying portfolio in which the Fund invests.
(d) Commencement of operations.
(e) Annualized.
(f) Not annualized.
See Notes to Financial Statements.
| | |
| 46 | | Visit our website at www.prudentialfunds.com |
| | | | | | | | | | |
| Class R Shares | |
| | | Year Ended
October 31,
2012(b) | | | | | January 18,
2011(d)
through
October 31,
2011(b) | |
| Per Share Operating Performance: | | | | | | | | | | |
| Net Asset Value, Beginning Of Period | | | $12.98 | | | | | | $13.52 | |
| Income from investment operations: | | | | | | | | | | |
| Net investment income | | | .52 | | | | | | .32 | |
| Net realized and unrealized gain (loss) on investments | | | .81 | | | | | | (.52 | ) |
| Total from investment operations | | | 1.33 | | | | | | (.20 | ) |
| Less Dividends and Distributions: | | | | | | | | | | |
| Dividends from net investment income | | | (.42 | ) | | | | | (.34 | ) |
| Distributions from net realized gains | | | - | | | | | | - | |
| Total dividends and distributions | | | (.42 | ) | | | | | (.34 | ) |
| Net asset value, end of period | | | $13.89 | | | | | | $12.98 | |
| Total Return(a) | | | 10.42% | | | | | | (1.50)% | |
| |
| Ratios/Supplemental Data: | | | | | | | | |
| Net assets, end of period (in millions) | | | $8.9 | | | | | | $3.0 | |
| Ratios to average net assets(c): | | | | | | | | | | |
| Expenses after advisory fee waiver and expense reimbursement | | | 1.42% | | | | | | 1.51% | (e) |
| Expenses before advisory fee waiver and expense reimbursement | | | 1.42% | | | | | | 1.51% | (e) |
| Net investment income | | | 3.83% | | | | | | 3.09% | (e) |
| Portfolio turnover rate | | | 72% | | | | | | 70% | (f) |
(a) Total return does not consider the effects of sales load. Total return is calculated assuming a purchase of a share on the first day and a sale on the last day of each period reported and includes reinvestment of dividends and distributions. Total returns may reflect adjustments to conform with generally accepted accounting principles. Total return includes the effect of expense subsidies. Total returns for periods less than one full year are not annualized.
(b) Calculations are based on the average daily number of shares outstanding.
(c) Does not include expenses of the underlying portfolio in which the Fund invests.
(d) Commencement of operations.
(e) Annualized.
(f) Not annualized.
See Notes to Financial Statements.
| | | | |
| Prudential Jennison Equity Income Fund | | | 47 | |
Financial Highlights
continued
| | | | | | | | | | | | | | | | | | | | |
| Class X Shares | |
| | | Year Ended October 31, | |
| | | 2012(b) | | | 2011(b) | | | 2010(b) | | | 2009(b) | | | 2008(b) | |
| Per Share Operating Performance: | | | | | | | | | | | | | | | | | | | | |
| Net Asset Value, Beginning Of Year | | | $12.27 | | | | $12.24 | | | | $10.28 | | | | $8.20 | | | | $18.81 | |
| Income from investment operations: | | | | | | | | | | | | | | | | | | | | |
| Net investment income | | | .41 | | | | .44 | | | | .31 | | | | .36 | | | | .51 | |
| Net realized and unrealized gain (loss) on investments | | | .79 | | | | (.02 | ) | | | 2.13 | | | | 1.82 | | | | (6.28 | ) |
| Total from investment operations | | | 1.20 | | | | .42 | | | | 2.44 | | | | 2.18 | | | | (5.77 | ) |
| Less Dividends and Distributions: | | | | | | | | | | | | | | | | | | | | |
| Dividends from net investment income | | | (.36 | ) | | | (.39 | ) | | | (.48 | ) | | | (.10 | ) | | | (.43 | ) |
| Distributions from net realized gains | | | - | | | | - | | | | - | | | | - | | | | (4.41 | ) |
| Total dividends and distributions | | | (.36 | ) | | | (.39 | ) | | | (.48 | ) | | | (.10 | ) | | | (4.84 | ) |
| Capital Contributions(d) | | | - | | | | - | | | | - | * | | | - | | | | - | |
| Net asset value, end of year | | | $13.11 | | | | $12.27 | | | | $12.24 | | | | $10.28 | | | | $8.20 | |
| Total Return(a) | | | 9.94% | | | | 3.37% | | | | 24.27% | | | | 27.09% | | | | (39.74)% | |
| |
| Ratios/Supplemental Data: | |
| Net assets, end of year (in millions) | | | $1.3 | | | | $2.7 | | | | $5.1 | | | | $8.6 | | | | $12.0 | |
| Ratios to average net assets(c): | | | | | | | | | | | | | | | | | | | | |
| Expenses after advisory fee waiver and expense reimbursement | | | 1.92% | | | | 1.95% | | | | 2.19% | | | | 2.15% | | | | 1.93% | |
| Expenses before advisory fee waiver and expense reimbursement | | | 1.92% | | | | 1.95% | | | | 2.20% | | | | 2.41% | | | | 2.02% | |
| Net investment income | | | 3.20% | | | | 3.42% | | | | 2.74% | | | | 4.24% | | | | 4.18% | |
| Portfolio turnover rate | | | 72% | | | | 70% | | | | 49% | | | | 63% | | | | 66% | |
(a) Total return does not consider the effects of sales load. Total return is calculated assuming a purchase of a share on the first day and a sale on the last day of each year reported and includes reinvestment of dividends and distributions. Total returns may reflect adjustments to conform with generally accepted accounting principles. Total return includes the effect of expense subsidies.
(b) Calculations are based on the average daily number of shares outstanding.
(c) Does not include expenses of the underlying portfolio in which the Fund invests.
(d) The Fund received payments related to a former affiliates and to an unaffiliated-third party’s settlement of regulatory proceedings involving allegations of improper trading in Fund shares during the fiscal year ended October 31, 2010. The Fund was not involved in the proceedings or in the calculation of the amount of settlement.
* Amount is less than $.005.
See Notes to Financial Statements.
| | |
| 48 | | Visit our website at www.prudentialfunds.com |
| | | | | | | | | | | | | | | | | | | | | | | | |
| Class Z Shares | |
| | | Year Ended
October 31, | | | | | Year Ended October 31, | | | | | August 22,
2008(d)
through
October 31, | |
| | | 2012(e) | | | | | 2011(e) | | | 2010(e) | | | 2009(e) | | | | | 2008(e) | |
| Per Share Operating Performance: | | | | | | | | | | | | | | | | | | | | | | | | |
| Net Asset Value, Beginning Of Period | | | $12.97 | | | | | | $12.91 | | | | $10.87 | | | | $8.60 | | | | | | $11.89 | |
| Income from investment operations: | | | | | | | | | | | | | | | | | | | | | | | | |
| Net investment income | | | .59 | | | | | | .53 | | | | .47 | | | | .27 | | | | | | .13 | |
| Net realized and unrealized gain (loss) on investments | | | .82 | | | | | | .04 | | | | 2.22 | | | | 2.11 | | | | | | (3.42 | ) |
| Total from investment operations | | | 1.41 | | | | | | .57 | | | | 2.69 | | | | 2.38 | | | | | | (3.29 | ) |
| Less Dividends and Distributions: | | | | | | | | | | | | | | | | | | | | | | | | |
| Dividends from net investment income | | | (.49 | ) | | | | | (.51 | ) | | | (.65 | ) | | | (.11 | ) | | | | | - | |
| Distributions from net realized gains | | | - | | | | | | - | | | | - | | | | - | | | | | | - | |
| Total dividends and distributions | | | (.49 | ) | | | | | (.51 | ) | | | (.65 | ) | | | (.11 | ) | | | | | - | |
| Capital Contributions(h) | | | - | | | | | | - | | | | - | * | | | - | | | | | | - | |
| Net asset value, end of period | | | $13.89 | | | | | | $12.97 | | | | $12.91 | | | | $10.87 | | | | | | $8.60 | |
| Total Return(a) | | | 11.06% | | | | | | 4.42% | | | | 25.45% | | | | 28.27% | | | | | | (27.67)% | |
| |
| Ratios/Supplemental Data: | |
| Net assets, end of period (in millions) | | | $837.3 | | | | | | $553.4 | | | | $70.4 | | | | $- | (c) | | | | | $- | (c) |
| Ratios to average net assets(f): | | | | | | | | | | | | | | | | | | | | | | | | |
| Expenses after advisory fee waiver and expense reimbursement | | | .92% | | | | | | .98% | | | | 1.19% | | | | 1.15% | | | | | | 1.03% | (b) |
| Expenses before advisory fee waiver and expense reimbursement | | | .92% | | | | | | .98% | | | | 1.20% | | | | 1.41% | | | | | | 1.03% | (b) |
| Net investment income | | | 4.33% | | | | | | 4.00% | | | | 3.90% | | | | 2.44% | | | | | | 6.92% | (b) |
| Portfolio turnover rate | | | 72% | | | | | | 70% | | | | 49% | | | | 63% | | | | | | 66% | (g) |
(a) Total return does not consider the effect of sales load. Total return is calculated assuming a purchase of a share on the first day and a sale on the last day of each period reported and includes reinvestment of dividends and distributions. Total returns may reflect adjustments to conform with generally accepted accounting principles. Total return includes the effect of expense subsidies. Total returns for periods less than one full year are not annualized.
(b) Annualized.
(c) Net assets were $724 and $92,360 on October 31, 2008 and October 31, 2009, respectively.
(d) Commencement of operations.
(e) Calculations are based on the average daily number of shares outstanding.
(f) Does not include expenses of the underlying portfolio in which the Fund invests.
(g) Not annualized.
(h) The Fund received payments related to a former affiliates and to an unaffiliated-third party’s settlement of regulatory proceedings involving allegations of improper trading in Fund shares during the fiscal year ended October 31, 2010. The Fund was not involved in the proceedings or in the calculation of the amount of settlement.
* Amount is less than $.005.
See Notes to Financial Statements.
| | | | |
| Prudential Jennison Equity Income Fund | | | 49 | |
Report of Independent Registered Public
Accounting Firm
The Board of Directors and Shareholders
Prudential Investment Portfolios, Inc. 10:
We have audited the accompanying statement of assets and liabilities of Prudential Jennison Equity Income Fund, a series of Prudential Investment Portfolios, Inc. 10 (hereafter referred to as the “Fund”), including the portfolio of investments, as of October 31, 2012, and the related statement of operations for the year then ended, the statement of changes in net assets for each of the years in the two-year period then ended and the financial highlights for each of the years in the five-year period then ended. These financial statements and financial highlights are the responsibility of the Fund’s management. Our responsibility is to express an opinion on these financial statements and financial highlights based on our audits.
We conducted our audits in accordance with the standards of the Public Company Accounting Oversight Board (United States). Those standards require that we plan and perform the audit to obtain reasonable assurance about whether the financial statements and financial highlights are free of material misstatement. An audit includes examining, on a test basis, evidence supporting the amounts and disclosures in the financial statements. Our procedures included confirmation of securities owned as of October 31, 2012, by correspondence with the custodian, transfer agent and brokers or by other appropriate auditing procedures when replies from brokers were not received. An audit also includes assessing the accounting principles used and significant estimates made by management, as well as evaluating the overall financial statement presentation. We believe that our audits provide a reasonable basis for our opinion.
In our opinion, the financial statements and financial highlights referred to above present fairly, in all material respects, the financial position of the Fund as of October 31, 2012, and the results of its operations for the year then ended, the changes in its net assets for each of the years in the two-year period then ended and the financial highlights for each of the years in the five-year period then ended, in conformity with U.S. generally accepted accounting principles.

New York, New York
December 21, 2012
| | |
| 50 | | Visit our website at www.prudentialfunds.com |
Tax Information
(Unaudited)
For the year ended October 31, 2012, the Fund reports the maximum amount allowable under Section 854 of the Internal Revenue Code but not less than the following percentages of the ordinary income distributions paid as 1) qualified dividend income (QDI); and 2) eligible for corporate dividends received deduction (DRD):
| | | | | | | | |
| | | QDI | | | DRD | |
| | |
Prudential Jennison Equity Income Fund | | | 93.08% | | | | 62.77% | |
In January 2013, you will be advised on IRS Form 1099-DIV or substitute 1099-DIV as to the federal tax status of distributions received by you in calendar year 2012.
| | | | |
| Prudential Jennison Equity Income Fund | | | 51 | |
INFORMATION ABOUT BOARD MEMBERS AND OFFICERS
(Unaudited)
Information about Board Members and Officers of the Fund is set forth below. Board Members who are not deemed to be “interested persons” of the Fund, as defined in the 1940 Act, are referred to as “Independent Board Members.” Board Members who are deemed to be “interested persons” of the Fund are referred to as “Interested Board Members.” The Board Members are responsible for the overall supervision of the operations of the Fund and perform the various duties imposed on the directors of investment companies by the 1940 Act. The Board in turn elects the Officers, who are responsible for administering the day-to-day operations of the Fund.
| | | | |
| Independent Board Members(1) |
Name, Address, Age Position(s) Portfolios Overseen | | Principal Occupation(s) During Past Five Years | | Other Directorships Held |
Kevin J. Bannon (60) Board Member Portfolios Overseen: 63 | | Managing Director (since April 2008) and Chief Investment Officer (since October 2008) of Highmount Capital LLC (registered investment adviser); formerly Executive Vice President and Chief Investment Officer (April 1993-August 2007) of Bank of New York Company; President (May 2003-May 2007) of BNY Hamilton Family of Mutual Funds. | | Director of Urstadt Biddle Properties (since September 2008). |
Linda W. Bynoe (60) Board Member Portfolios Overseen: 63 | | President and Chief Executive Officer (since March 1995) and formerly Chief Operating Officer (December 1989-February 1995) of Telemat Ltd. (management consulting); formerly Vice President (January 1985-June 1989) at Morgan Stanley & Co (broker-dealer). | | Director of Simon Property Group, Inc. (retail real estate) (May 2003-May 2012); Director of Anixter International, Inc. (communication products distributor) (since January 2006); Director of Northern Trust Corporation (financial services) (since April 2006); Trustee of Equity Residential (residential real estate) (since December 2009). |
Michael S. Hyland, CFA (67) Board Member Portfolios Overseen: 63 | | Independent Consultant (since February 2005); formerly Senior Managing Director (July 2001-February 2005) of Bear Stearns & Co, Inc.; Global Partner, INVESCO (1999-2001); Managing Director and President of Salomon Brothers Asset Management (1989-1999). | | None. |
Douglas H. McCorkindale (73) Board Member Portfolios Overseen: 63 | | Formerly Chairman (February 2001-June 2006), Chief Executive Officer (June 2000-July 2005), President (September 1997-July 2005) and Vice Chairman (March 1984-May 2000) of Gannett Co. Inc. (publishing and media). | | Director of Lockheed Martin Corp. (aerospace and defense) (since May 2001). |
Prudential Jennison Equity Income Fund
| | | | |
| Independent Board Members(1) |
Name, Address, Age Position(s) Portfolios Overseen | | Principal Occupation(s) During Past Five Years | | Other Directorships Held |
Stephen P. Munn (70) Board Member Portfolios Overseen: 63 | | Lead Director (since 2007) and formerly Chairman (1993-2007) of Carlisle Companies Incorporated (manufacturer of industrial products). | | Lead Director (since 2007) of Carlisle Companies Incorporated (manufacturer of industrial products). |
Richard A. Redeker (69) Board Member & Independent Chair Portfolios Overseen: 63 | | Retired Mutual Fund Senior Executive (44 years); Management Consultant; Independent Directors Council (organization of 2,800 Independent Mutual Fund Directors)-Executive Committee, Chair of Policy Steering Committee, Governing Council. | | None. |
Robin B. Smith (73) Board Member Portfolios Overseen: 63 | | Chairman of the Board (since January 2003) of Publishers Clearing House (direct marketing); Member of the Board of Directors of ADLPartner (marketing) (since December 2010); formerly Chairman and Chief Executive Officer (August 1996-January 2003) of Publishers Clearing House. | | Formerly Director of BellSouth Corporation (telecommunications) (1992-2006). |
Stephen G. Stoneburn (69) Board Member Portfolios Overseen: 63 | | Chairman, (since July 2011), President and Chief Executive Officer (since June 1996) of Quadrant Media Corp. (publishing company); formerly President (June 1995-June 1996) of Argus Integrated Media, Inc.; Senior Vice President and Managing Director (January 1993-1995) of Cowles Business Media; Senior Vice President of Fairchild Publications, Inc. (1975-1989). | | None. |
| | | | |
| Interested Board Members(1) |
Name, Address, Age Position(s) Portfolios Overseen | | Principal Occupation(s) During Past Five Years | | Other Directorships Held |
Stuart S. Parker (50) Board Member & President Portfolios Overseen: 63 | | President of Prudential Investments LLC (since January 2012); Executive Vice President of Jennison Associates LLC and Head of Retail Distribution of Prudential Investments LLC (June 2005 - December 2011). | | None. |
Visit our website at www.prudentialfunds.com
| | | | |
| Interested Board Members(1) |
Name, Address, Age Position(s) Portfolios Overseen | | Principal Occupation(s) During Past Five Years | | Other Directorships Held |
Scott E. Benjamin (39) Board Member & Vice President Portfolios Overseen: 63 | | Executive Vice President (since June 2009) of Prudential Investments LLC; Executive Vice President (June 2009-June 2012) and Vice President (since June 2012) of Prudential Investment Management Services LLC; Executive Vice President (since September 2009) of AST Investment Services, Inc.; Senior Vice President of Product Development and Marketing, Prudential Investments (since February 2006); Vice President of Product Development and Product Management, Prudential Investments (2003-2006). | | None. |
| (1) | The year in which each individual joined the Fund’s Board is as follows: |
Linda W. Bynoe, 2005; Douglas H. McCorkindale, 2003, Richard A. Redeker, 2003; Robin B. Smith, 2003; Stephen G. Stoneburn, 2003; Kevin J. Bannon, 2008; Michael S. Hyland, 2008; Stephen P. Munn, 2008; Stuart S. Parker, Board Member and President since 2012; Scott E. Benjamin, Board Member since 2010 and Vice President since 2009.
| | |
| Fund Officers(a)(1) |
Name, Address and Age Position with Fund | | Principal Occupation(s) During Past Five Years |
Judy A. Rice (64) Vice President | | Chairman of Prudential Investments LLC (since January 2012); President, Chief Executive Officer (May 2011-Present) and Executive Vice President (December 2008-May 2011) of Prudential Investment Management Services LLC; formerly President, Chief Executive Officer, Chief Operating Officer and Officer-In-Charge (February 2003-December 2011) of Prudential Investments LLC; formerly President, Chief Executive Officer and Officer-In-Charge (April 2003-December 2011) of Prudential Mutual Fund Services LLC (PMFS); formerly Member of the Board of Directors of Jennison Associates LLC (November 2010-December 2011); formerly Vice President (February 1999-April 2006) of Prudential Investment Management Services LLC; formerly President, COO, CEO and Manager of PIFM Holdco, LLC (April 2006-December 2011); formerly President, Chief Executive Officer, Chief Operating Officer and Officer-In-Charge (May 2003-June 2005) and Director (May 2003-March 2006) and Executive Vice President (June 2005-March 2006) of AST Investment Services, Inc.; Member of Board of Governors of the Investment Company Institute. |
Prudential Jennison Equity Income Fund
| | |
| Fund Officers(a)(1) |
Name, Address and Age Position with Fund | | Principal Occupation(s) During Past Five Years |
Raymond A. O’Hara (57) Chief Legal Officer | | Vice President and Corporate Counsel (since July 2010) of Prudential Insurance Company of America (Prudential); Vice President (March 2011-Present) of Pruco Life Insurance Company and Pruco Life Insurance Company of New Jersey; Vice President and Corporate Counsel (March 2011-Present) of Prudential Annuities Life Assurance Corporation; Chief Legal Officer of Prudential Investments LLC (since June 2012); Chief Legal Officer of PMFS (since June 2012) and Corporate Counsel of AST Investment Services, Inc. (since June 2012); formerly Assistant Vice President and Corporate Counsel (September 2008-July 2010) of The Hartford Financial Services Group, Inc.; formerly Associate (September 1980-December 1987) and Partner (January 1988– August 2008) of Blazzard & Hasenauer, P.C. (formerly, Blazzard, Grodd & Hasenauer, P.C.). |
Deborah A. Docs (54) Secretary | | Vice President and Corporate Counsel (since January 2001) of Prudential; Vice President (since December 1996) and Assistant Secretary (since March 1999) of Prudential Investments LLC; formerly Vice President and Assistant Secretary (May 2003-June 2005) of AST Investment Services, Inc. |
Jonathan D. Shain (54) Assistant Secretary | | Vice President and Corporate Counsel (since August 1998) of Prudential; Vice President and Assistant Secretary (since May 2001) of Prudential Investments LLC; Vice President and Assistant Secretary (since February 2001) of PMFS; formerly Vice President and Assistant Secretary (May 2003-June 2005) of AST Investment Services, Inc. |
Claudia DiGiacomo (38) Assistant Secretary | | Vice President and Corporate Counsel (since January 2005) of Prudential; Vice President and Assistant Secretary of Prudential Investments LLC (since December 2005); Associate at Sidley Austin Brown & Wood LLP (1999-2004). |
Andrew R. French (50) Assistant Secretary | | Vice President and Corporate Counsel (since February 2010) of Prudential; formerly Director and Corporate Counsel (2006-2010) of Prudential; Vice President and Assistant Secretary (since January 2007) of Prudential Investments LLC; Vice President and Assistant Secretary (since January 2007) of PMFS. |
Amanda S. Ryan (34) Assistant Secretary | | Director and Corporate Counsel (since March 2012) of Prudential; Director and Assistant Secretary (since June 2012) of Prudential Investments LLC; Associate at Ropes & Gray (2008-2012). |
Timothy J. Knierim (53) Chief Compliance Officer | | Chief Compliance Officer of Prudential Investment Management, Inc. (since July 2007); formerly Chief Risk Officer of Prudential Investment Management, Inc. and Prudential Investments LLC (2002-2007) and formerly Chief Ethics Officer of Prudential Investment Management, Inc. and Prudential Investments LLC (2006-2007). |
Valerie M. Simpson (54) Deputy Chief Compliance Officer | | Chief Compliance Officer (since April 2007) of Prudential Investments LLC and AST Investment Services, Inc.; formerly Vice President-Financial Reporting (June 1999-March 2006) for Prudential Life and Annuities Finance. |
Visit our website at www.prudentialfunds.com
| | |
| Fund Officers(a)(1) |
Name, Address and Age Position with Fund | | Principal Occupation(s) During Past Five Years |
Theresa C. Thompson (50) Deputy Chief Compliance Officer | | Vice President, Compliance, Prudential Investments LLC (since April 2004); and Director, Compliance, Prudential Investments LLC (2001-2004). |
Richard W. Kinville (44) Anti-Money Laundering Compliance Officer | | Vice President, Corporate Compliance, Anti-Money Laundering Unit (since January 2005) of Prudential; committee member of the American Council of Life Insurers Anti-Money Laundering and Critical Infrastructure Committee (since January 2007); formerly Investigator and Supervisor in the Special Investigations Unit for the New York Central Mutual Fire Insurance Company (August 1994-January 1999); Investigator in AXA Financial’s Internal Audit Department and Manager in AXA’s Anti-Money Laundering Office (January 1999-January 2005); first chair of the American Council of Life Insurers Anti-Money Laundering and Critical Infrastructure Committee (June 2007-December 2009). |
Grace C. Torres (53) Treasurer and Principal Financial and Accounting Officer | | Assistant Treasurer (since March 1999) and Senior Vice President (since September 1999) of Prudential Investments LLC; Assistant Treasurer (since May 2003) and Vice President (since June 2005) of AST Investment Services, Inc.; Senior Vice President and Assistant Treasurer (since May 2003) of Prudential Annuities Advisory Services, Inc.; formerly Senior Vice President (May 2003-June 2005) of AST Investment Services, Inc. |
M. Sadiq Peshimam (48) Assistant Treasurer | | Vice President (since 2005) of Prudential Investments LLC. |
Peter Parrella (54) Assistant Treasurer | | Vice President (since 2007) and Director (2004-2007) within Prudential Mutual Fund Administration; formerly Tax Manager at SSB Citi Fund Management LLC (1997-2004). |
(a) Excludes Mr. Parker and Mr. Benjamin, interested Board Members who also serve as President and Vice President, respectively.
(1) The year in which each individual became an Officer of the Fund is as follows:
Judy A. Rice, 2012; Raymond A. O’Hara, 2012; Deborah A. Docs, 2003; Jonathan D. Shain, 2003; Claudia DiGiacomo, 2005; Andrew R. French, 2006; Amanda S. Ryan, 2012; Timothy J. Knierim, 2007; Valerie M. Simpson, 2007; Theresa C. Thompson, 2008; Richard W. Kinville, 2011; Grace C. Torres, 2003; Peter Parrella, 2007; M. Sadiq Peshimam, 2006.
Explanatory Notes to Tables:
| n | Board Members are deemed to be “Interested,” as defined in the 1940 Act, by reason of their affiliation with Prudential Investments LLC and/or an affiliate of Prudential Investments LLC. |
| n | Unless otherwise noted, the address of all Board Members and Officers is c/o Prudential Investments LLC, Gateway Center Three, 100 Mulberry Street, Newark, New Jersey 07102-4077. |
| n | There is no set term of office for Board Members or Officers. The Board Members have adopted a retirement policy, which calls for the retirement of Board Members on December 31 of the year in which they reach the age of 75. |
| n | “Other Directorships Held” includes only directorships of companies required to register or file reports with the SEC under the 1934 Act (that is, “public companies”) or other investment companies registered under the 1940 Act. |
| n | “Portfolios Overseen” includes all investment companies managed by Prudential Investments LLC. The investment companies for which PI serves as manager include the Prudential Investments Mutual Funds, The Prudential Variable Contract Accounts, Target Mutual Funds, Prudential Short Duration High Yield Fund, Inc., The Prudential Series Fund, Prudential’s Gibraltar Fund, Inc. and the Advanced Series Trust. |
Prudential Jennison Equity Income Fund
Approval of Advisory Agreements
The Fund’s Board of Directors
The Board of Directors (the “Board”) of Prudential Jennison Equity Income Fund (the “Fund”)1 consists of ten individuals, eight of whom are not “interested persons” of the Fund, as defined in the Investment Company Act of 1940, as amended (the “1940 Act”) (the “Independent Directors”). The Board is responsible for the oversight of the Fund and its operations, and performs the various duties imposed on the directors of investment companies by the 1940 Act. The Independent Directors have retained independent legal counsel to assist them in connection with their duties. The Chair of the Board is an Independent Director. The Board has established three standing committees: the Audit Committee, the Nominating and Governance Committee, and the Investment Committee. Each committee is chaired by, and composed of, Independent Directors.
Annual Approval of the Fund’s Advisory Agreements
As required under the 1940 Act, the Board determines annually whether to renew the Fund’s management agreement with Prudential Investments LLC (“PI”) and the Fund’s subadvisory agreement with Jennison Associates LLC (“Jennison”). In considering the renewal of the agreements, the Board, including all of the Independent Directors, met on June 5-7, 2012 and approved the renewal of the agreements through July 31, 2013, after concluding that the renewal of the agreements was in the best interests of the Fund and its shareholders.
In advance of the meetings, the Board requested and received materials relating to the agreements, and had the opportunity to ask questions and request further information in connection with its consideration. Among other things, the Board considered comparative fee information from PI and Jennison. Also, the Board considered comparisons with other mutual funds in relevant Peer Universes and Peer Groups, as is further discussed below.
In approving the agreements, the Board, including the Independent Directors advised by independent legal counsel, considered the factors it deemed relevant, including the nature, quality and extent of services provided by PI and the subadviser, the performance of the Fund, the profitability of PI and its affiliates, expenses and fees, and the potential for economies of scale that may be shared with the Fund and its shareholders as the Fund’s assets grow. In their deliberations, the Directors did not identify any single factor which alone was responsible for the Board’s decision to approve the agreements with respect to the Fund. In connection with its deliberations, the Board considered information provided by PI throughout the year at regular Board
| 1 | Prudential Jennison Equity Income Fund is a series of Prudential Investment Portfolios, Inc. 10. |
Prudential Jennison Equity Income Fund
Approval of Advisory Agreements (continued)
meetings, presentations from portfolio managers and other information, as well as information furnished at or in advance of the meetings on June 5-7, 2012.
The Directors determined that the overall arrangements between the Fund and PI, which serves as the Fund’s investment manager pursuant to a management agreement, and between PI and Jennison, which serves as the Fund’s subadviser pursuant to the terms of a subadvisory agreement with PI, are in the best interests of the Fund and its shareholders in light of the services performed, fees charged and such other matters as the Directors considered relevant in the exercise of their business judgment.
The material factors and conclusions that formed the basis for the Directors’ reaching their determinations to approve the continuance of the agreements are separately discussed below.
Nature, Quality and Extent of Services
The Board received and considered information regarding the nature, quality and extent of services provided to the Fund by PI and Jennison. The Board considered the services provided by PI, including but not limited to the oversight of the subadviser for the Fund, as well as the provision of fund recordkeeping, compliance, and other services to the Fund. With respect to PI’s oversight of the subadviser, the Board noted that PI’s Strategic Investment Research Group (“SIRG”), which is a business unit of PI, is responsible for monitoring and reporting to PI’s senior management on the performance and operations of the subadviser. The Board also considered that PI pays the salaries of all of the officers and non-independent Directors of the Fund. The Board also considered the investment subadvisory services provided by Jennison, as well as adherence to the Fund’s investment restrictions and compliance with applicable Fund policies and procedures. The Board considered PI’s evaluation of the subadviser, as well as PI’s recommendation, based on its review of the subadviser, to renew the subadvisory agreement.
The Board reviewed the qualifications, backgrounds and responsibilities of PI’s senior management responsible for the oversight of the Fund and Jennison, and also reviewed the qualifications, backgrounds and responsibilities of the Jennison portfolio managers who are responsible for the day-to-day management of the Fund’s portfolio. The Board was provided with information pertaining to PI’s and Jennison’s organizational structure, senior management, investment operations, and other relevant information pertaining to PI and Jennison. The Board also noted that it received favorable compliance reports from the Fund’s Chief Compliance Officer (“CCO”) as to each of PI and Jennison. The Board noted that Jennison is affiliated with PI.
Visit our website at www.prudentialfunds.com
The Board concluded that it was satisfied with the nature, extent and quality of the investment management services provided by PI and the subadvisory services provided to the Fund by Jennison, and that there was a reasonable basis on which to conclude that the Fund benefits from the services provided by PI and Jennison under the management and subadvisory agreements.
Costs of Services and Profits Realized by PI
The Board was provided with information on the profitability of PI and its affiliates in serving as the Fund’s investment manager. The Board discussed with PI the methodology utilized in assembling the information regarding profitability and considered its reasonableness. The Board recognized that it is difficult to make comparisons of profitability from fund management contracts because comparative information is not generally publicly available and is affected by numerous factors, including the structure of the particular adviser, the types of funds it manages, its business mix, numerous assumptions regarding allocations and the adviser’s capital structure and cost of capital. The Board did not separately consider the profitability of the subadviser, an affiliate of PI, as its profitability was reflected in the profitability report for PI. Taking these factors into account, the Board concluded that the profitability of PI and its affiliates in relation to the services rendered was not unreasonable.
Economies of Scale
The Board noted that the management fee schedule for the Fund includes breakpoints, which have the effect of decreasing the fee rate as assets increase, and that at its current level of assets the Fund’s effective fee rate reflected some of those rate reductions. The Board received and discussed information concerning whether PI realizes economies of scale as the Fund’s assets grow beyond current levels. The Board took note that the Fund’s fee structure currently results in benefits to Fund shareholders whether or not PI realizes any economies of scale. The Board recognized the inherent limitations of any analysis of economies of scale, stemming largely from the Board’s understanding that most of PI’s costs are not specific to individual funds, but rather are incurred across a variety of products and services.
Other Benefits to PI and Jennison
The Board considered potential ancillary benefits that might be received by PI and Jennison and their affiliates as a result of their relationship with the Fund. The Board concluded that potential benefits to be derived by PI included fees received by affiliates of PI for serving as the Fund’s securities lending agent, transfer agency fees received by the Fund’s transfer agent (which is affiliated with PI), and benefits to the reputation as well as other intangible benefits resulting from PI’s association with the
Prudential Jennison Equity Income Fund
Approval of Advisory Agreements (continued)
Fund. The Board concluded that the potential benefits to be derived by Jennison included its ability to use soft dollar credits, as well as the potential benefits consistent with those generally resulting from an increase in assets under management, specifically, potential access to additional research resources and benefits to the reputation. The Board concluded that the benefits derived by PI and Jennison were consistent with the types of benefits generally derived by investment managers and subadvisers to mutual funds.
Performance of the Fund / Fees and Expenses
The Board considered certain additional specific factors and made related conclusions relating to the historical performance of the Fund for the one-, three- and five-year periods ended December 31, 2011.
The Board also considered the Fund’s actual management fee, as well as the Fund’s net total expense ratio, for the fiscal year ended October 31, 2011. The Board considered the management fee for the Fund as compared to the management fee charged by PI to other funds and the fee charged by other advisers to comparable mutual funds in a Peer Group. The actual management fee represents the fee rate actually paid by Fund shareholders and includes any fee waivers or reimbursements. The net total expense ratio for the Fund represents the actual expense ratio incurred by Fund shareholders.
The mutual funds included in the Peer Universe (the Lipper Equity Income Funds Performance Universe) and the Peer Group were objectively determined by Lipper Inc. (“Lipper”), an independent provider of mutual fund data. The comparisons placed the Fund in various quartiles, with the first quartile being the best 25% of the mutual funds (for performance, the best performing mutual funds and, for expenses, the lowest cost mutual funds).
The section below summarizes key factors considered by the Board and the Board’s conclusions regarding the Fund’s performance, fees and overall expenses. The table sets forth gross performance comparisons (which do not reflect the impact on performance of fund expenses, or any subsidies, expense caps or waivers that may be applicable) with the Peer Universe, actual management fees with the Peer Group (which reflect the impact of any subsidies or fee waivers), and net total expenses with the Peer Group, each of which were key factors considered by the Board.
| | | | | | | | |
| Performance | | 1 Year | | 3 Years | | 5 Years | | 10 Years |
| | | 4th Quartile | | 1st Quartile | | 1st Quartile | | N/A |
| Actual Management Fees: 4th Quartile |
| Net Total Expenses: 4th Quartile |
Visit our website at www.prudentialfunds.com
| | • | | The Board noted that the Fund outperformed its benchmark index over the three- and five-year periods, although it underperformed over the one-year period. |
| | • | | The Board accepted PI’s recommendation to reduce its effective management fee by adding fee breakpoints of .75% on assets between $1 billion and $2.5 billion, and .725% on assets over $2.5 billion. |
| | • | | The Board concluded that, in light of the Fund’s strong performance over longer time periods, it would be in the best interests of the Fund and its shareholders to renew the agreements. |
| | • | | The Board concluded that the management fees (including subadvisory fees) and total expenses were reasonable in light of the services provided. |
* * *
After full consideration of these factors, the Board concluded that approval of the agreements was in the best interests of the Fund and its shareholders.
Prudential Jennison Equity Income Fund
| | | | |
| n MAIL | | n TELEPHONE | | n WEBSITE |
Gateway Center Three 100 Mulberry Street Newark, NJ 07102 | | (800) 225-1852 | | www.prudentialfunds.com |
|
| PROXY VOTING |
| The Board of Directors of the Fund has delegated to the Fund’s investment subadviser the responsibility for voting any proxies and maintaining proxy recordkeeping with respect to the Fund. A description of these proxy voting policies and procedures is available without charge, upon request, by calling (800) 225-1852 or by visiting the Securities and Exchange Commission’s website at www.sec.gov. Information regarding how the Fund voted proxies relating to portfolio securities during the most recent 12-month period ended June 30 is available on the Fund’s website and on the Securities and Exchange Commission’s website. |
|
| DIRECTORS |
Kevin J. Bannon • Scott E. Benjamin • Linda W. Bynoe • Michael S. Hyland •
Douglas H. McCorkindale • Stephen P. Munn • Stuart S. Parker • Richard A. Redeker • Robin B. Smith • Stephen G. Stoneburn |
|
| OFFICERS |
| Stuart S. Parker, President • Judy A. Rice, Vice President • Scott E. Benjamin, Vice President • Grace C. Torres, Treasurer and Principal Financial and Accounting Officer • Raymond A. O’Hara, Chief Legal Officer • Deborah A. Docs, Secretary • Timothy J. Knierim, Chief Compliance Officer • Valerie M. Simpson, Deputy Chief Compliance Officer • Theresa C. Thompson, Deputy Chief Compliance Officer • Richard W. Kinville, Anti-Money Laundering Compliance Officer • Jonathan D. Shain, Assistant Secretary • Claudia DiGiacomo, Assistant Secretary • Amanda S. Ryan, Assistant Secretary • Andrew R. French, Assistant Secretary • M. Sadiq Peshimam, Assistant Treasurer • Peter Parrella, Assistant Treasurer |
| | | | |
| MANAGER | | Prudential Investments LLC | | Gateway Center Three
100 Mulberry Street
Newark, NJ 07102 |
|
| INVESTMENT SUBADVISER | | Jennison Associates LLC | | 466 Lexington Avenue
New York, NY 10017 |
|
| DISTRIBUTOR | | Prudential Investment
Management Services LLC | | Gateway Center Three
100 Mulberry Street
Newark, NJ 07102 |
|
| CUSTODIAN | | The Bank of New York Mellon | | One Wall Street
New York, NY 10286 |
|
| TRANSFER AGENT | | Prudential Mutual Fund
Services LLC | | PO Box 9658
Providence, RI 02940 |
|
| INDEPENDENT REGISTERED PUBLIC ACCOUNTING FIRM | | KPMG LLP | | 345 Park Avenue
New York, NY 10154 |
|
| FUND COUNSEL | | Willkie Farr & Gallagher LLP | | 787 Seventh Avenue
New York, NY 10019 |
|
| An investor should consider the investment objectives, risks, charges, and expenses of the Fund carefully before investing. The prospectus and summary prospectus contain this and other information about the Fund. An investor may obtain a prospectus and summary prospectus by visiting our website at www.prudentialfunds.com or by calling (800) 225-1852. The prospectus and summary prospectus should be read carefully before investing. |
|
| E-DELIVERY |
| To receive your mutual fund documents online, go to www.prudentialfunds.com/edelivery and enroll. Instead of receiving printed documents by mail, you will receive notification via email when new materials are available. You can cancel your enrollment or change your email address at any time by visiting the website address above. |
|
| SHAREHOLDER COMMUNICATIONS WITH DIRECTORS |
| Shareholders can communicate directly with the Board of Directors by writing to the Chair of the Board, Prudential Jennison Equity Income Fund, Prudential Investments, Attn: Board of Directors, 100 Mulberry Street, Gateway Center Three, Newark, NJ 07102. Shareholders can communicate directly with an individual Director by writing to the same address. Communications are not screened before being delivered to the addressee. |
|
| AVAILABILITY OF PORTFOLIO SCHEDULE |
| The Fund files its complete schedule of portfolio holdings with the Securities and Exchange Commission for the first and third quarters of each fiscal year on Form N-Q. The Fund’s Forms N-Q are available on the Commission’s website at www.sec.gov. The Fund’s Forms N-Q may also be reviewed and copied at the Commission’s Public Reference Room in Washington, D.C. Information on the operation and location of the Public Reference Room may be obtained by calling (202) 551-8090. The Fund’s schedule of portfolio holdings is also available on the Fund’s website as of the end of each month. |
|
| The Fund’s Statement of Additional Information contains additional information about the Fund’s Directors and is available without charge, upon request, by calling (800) 225-1852. |
Mutual Funds:
| | | | |
ARE NOT INSURED BY THE FDIC OR ANY
FEDERAL GOVERNMENT AGENCY | | MAY LOSE VALUE | | ARE NOT A DEPOSIT OF OR GUARANTEED BY ANY BANK OR ANY BANK AFFILIATE |

PRUDENTIAL JENNISON EQUITY INCOME FUND
| | | | | | | | | | | | | | | | |
| | | SHARE CLASS | | A | | B | | C | | Q | | R | | X | | Z |
| | NASDAQ | | SPQAX | | JEIBX | | AGOCX | | PJIQX | | PJERX | | AXGOX | | JDEZX |
| | CUSIP | | 74441L808 | | 74441L881 | | 74441L873 | | 74441L816 | | 74441L790 | | 74441L840 | | 74441L832 |
MF203E 0236604-00001-00

PRUDENTIAL INVESTMENTS»MUTUAL FUNDS
PRUDENTIAL MID-CAP VALUE FUND
ANNUAL REPORT · OCTOBER 31, 2012
Fund Type
Mid-Cap Stock
Objective
Capital growth
This report is not authorized for distribution to prospective investors unless preceded or accompanied by a current prospectus.
The views expressed in this report and information about the Fund’s portfolio holdings are for the period covered by this report and are subject to change thereafter.
Prudential Investments, Prudential, the Prudential logo, the Rock symbol, and Bring Your Challenges are service marks of Prudential Financial, Inc. and its related entities, registered in many jurisdictions worldwide.

December 14, 2012
Dear Shareholder:
We hope you find the annual report for the Prudential Mid-Cap Value Fund informative and useful. The report covers performance for the 12-month period that ended October 31, 2012.
We recognize that ongoing market volatility may make it a difficult time to be an investor. We continue to believe a prudent response to uncertainty is to maintain a diversified portfolio of funds consistent with your tolerance for risk, time horizon, and financial goals.
Your financial advisor can help you create a diversified investment plan that may include funds covering all the basic asset classes and that reflects your personal investor profile and risk tolerance. Keep in mind, however, that diversification and asset allocation strategies do not assure a profit or protect against loss in declining markets.
Prudential Investments® is dedicated to helping you solve your toughest investment challenges—whether it’s capital growth, reliable income, or protection from market volatility and other risks. We offer the expertise of Prudential Financial’s affiliated asset managers* that strive to be leaders in a broad range of funds to help you stay on course to the future you envision. They also manage money for major corporations and pension funds around the world, which means you benefit from the same expertise, innovation, and attention to risk demanded by today’s most sophisticated investors.
Thank you for choosing the Prudential Investments family of funds.
Sincerely,

Stuart S. Parker, President
Prudential Mid-Cap Value Fund
*Most of Prudential Investments’ equity funds are advised by Jennison Associates LLC, Quantitative Management Associates LLC (QMA), or Prudential Real Estate Investors. Prudential Investments’ fixed income and money market funds are advised by Prudential Investment Management, Inc. (PIM) through its Prudential Fixed Income unit. Jennison Associates, QMA, and PIM are registered investment advisers and Prudential Financial companies. Prudential Real Estate Investors is a unit of PIM.
| | | | |
| Prudential Mid-Cap Value Fund | | | 1 | |
Your Fund’s Performance
Performance data quoted represent past performance. Past performance does not guarantee future results. The investment return and principal value of an investment will fluctuate, so that an investor’s shares, when redeemed, may be worth more or less than their original cost. Current performance may be lower or higher than the past performance data quoted. An investor may obtain performance data as of the most recent month-end by visiting our website at www.prudentialfunds.com or by calling (800) 225-1852. Class A shares have a maximum initial sales charge of 5.50%. Gross operating expenses: Class A, 1.72%; Class B, 2.42%; Class C, 2.42%; Class Q, 1.15%; Class X, 2.42%; Class Z, 1.42%. Net operating expenses: Class A, 1.67%; Class B, 2.42%; Class C, 2.42%; Class Q, 1.15%; Class X, 1.67%; Class Z, 1.42%, after contractual reduction for Class A through 2/28/2014.
| | | | | | | | | | | | | | | | |
Cumulative Total Returns (Without Sales Charges) as of 10/31/12 | |
| | | One Year | | | Five Years | | | Ten Years | | | Since Inception | |
Class A | | | 11.16 | % | | | 11.93 | % | | | N/A | | | | 64.50% (4/12/2004) | |
Class B | | | 10.40 | | | | 8.00 | | | | N/A | | | | 54.41 (4/12/2004) | |
Class C | | | 10.43 | | | | 7.86 | | | | 123.18 | % | | | — | |
Class Q | | | 11.80 | | | | N/A | | | | N/A | | | | 7.56 (1/18/2011) | |
Class X | | | 11.20 | | | | 12.42 | | | | 136.60 | | | | — | |
Class Z | | | 11.51 | | | | 13.48 | | | | N/A | | | | 34.10 (11/29/2005) | |
Russell Midcap Value Index | | | 14.99 | | | | 8.69 | | | | 174.51 | | | | — | |
S&P MidCap 400 Stock Index | | | 12.11 | | | | 16.63 | | | | 164.39 | | | | — | |
Russell Midcap Index | | | 12.15 | | | | 8.82 | | | | 171.89 | | | | — | |
Lipper Mid-Cap Value Funds Average | | | 12.75 | | | | 5.01 | | | | 142.56 | | | | — | |
| | | | | | | | | | | | | | | | |
Average Annual Total Returns (With Sales Charges) as of 9/30/12 | |
| | | One Year | | | Five Years | | | Ten Years | | | Since Inception | |
Class A | | | 18.42 | % | | | 1.32 | % | | | N/A | | | | 5.38% (4/12/2004) | |
Class B | | | 19.37 | | | | 1.58 | | | | N/A | | | | 5.30 (4/12/2004) | |
Class C | | | 23.35 | | | | 1.70 | | | | 8.69 | % | | | — | |
Class Q | | | 25.92 | | | | N/A | | | | N/A | | | | 4.49 (1/18/2011) | |
Class X | | | 19.34 | | | | 2.10 | | | | 9.32 | | | | — | |
Class Z | | | 25.60 | | | | 2.75 | | | | N/A | | | | 4.41 (11/29/2005) | |
Russell Midcap Value Index | | | 29.28 | | | | 1.73 | | | | 10.96 | | | | — | |
S&P MidCap 400 Stock Index | | | 28.54 | | | | 3.83 | | | | 10.77 | | | | — | |
Russell Midcap Index | | | 28.03 | | | | 2.24 | | | | 11.18 | | | | — | |
Lipper Mid-Cap Value Funds Average | | | 28.01 | | | | 0.90 | | | | 9.56 | | | | — | |
| | |
| 2 | | Visit our website at www.prudentialfunds.com |
| | | | | | | | | | | | | | |
Average Annual Total Returns (With Sales Charges) as of 10/31/12 |
| | | One Year | | | Five Year | | | Ten Years | | | Since Inception |
Class A | | | 5.04 | % | | | 1.13 | % | | | N/A | | | 5.29% (4/12/2004) |
Class B | | | 5.40 | | | | 1.40 | | | | N/A | | | 5.21 (4/12/2004) |
Class C | | | 9.43 | | | | 1.52 | | | | 8.36 | % | | — |
Class Q | | | 11.80 | | | | N/A | | | | N/A | | | 4.16 (1/18/2011) |
Class X | | | 5.20 | | | | 1.92 | | | | 8.99 | | | — |
Class Z | | | 11.51 | | | | 2.56 | | | | N/A | | | 4.33 (11/29/2005) |
| | | | | | | | | | | | | | |
Average Annual Total Returns (Without Sales Charges) as of 10/31/12 |
| | | One Year | | | Five Years | | | Ten Years | | | Since Inception |
Class A | | | 11.16 | % | | | 2.28 | % | | | N/A | | | 5.99% (4/12/2004) |
Class B | | | 10.40 | | | | 1.55 | | | | N/A | | | 5.21 (4/12/2004) |
Class C | | | 10.43 | | | | 1.52 | | | | 8.36 | % | | — |
Class Q | | | 11.80 | | | | N/A | | | | N/A | | | 4.16 (1/18/2011) |
Class X | | | 11.20 | | | | 2.37 | | | | 8.99 | | | — |
Class Z | | | 11.51 | | | | 2.56 | | | | N/A | | | 4.33 (11/29/2005) |
Growth of a $10,000 Investment
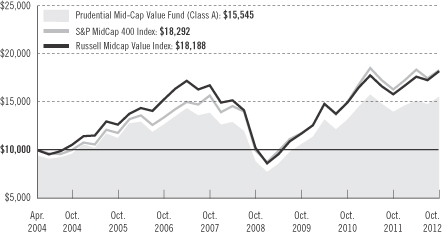
The graph compares a $10,000 investment in the Prudential Mid-Cap Value Fund (Class A shares) with a similar investment in the S&P MidCap 400 Index and Russell Midcap Value Index by portraying the initial account values at the commencement of operations for Class A shares (April 12, 2004) and the account values at the end of the current fiscal year (October 31, 2012) as measured on a quarterly basis. The Russell Midcap Value Index data is measured from the closest month-end to inception date and not from the Fund��s actual inception date. For
| | | | |
| Prudential Mid-Cap Value Fund | | | 3 | |
Your Fund’s Performance (continued)
purposes of the graph, and unless otherwise indicated, it has been assumed that (a) the maximum applicable front-end sales charge was deducted from the initial $10,000 investment in Class A shares; (b) all recurring fees (including management fees) were deducted; and (c) all dividends and distributions were reinvested. The line graph provides information for Class A shares only. As indicated in the tables above, performance for Class B, Class C, Class Q, Class X, and Class Z shares will vary due to the differing charges and expenses applicable to each share class (as indicated in the following paragraphs). Without waiver of fees and/or expense reimbursement, if any, the returns would have been lower.
Although Class X and Class C shares have 10 calendar years of returns, returns for Class A shares are displayed above because Class X shares are closed to new investors and displaying the returns for Class A shares is consistent with the annual reports and prospectuses issued by the other funds in the Prudential Investments fund family.
Total returns and the ending account values in the graph include changes in share price and reinvestment of dividends and capital gains distributions in a hypothetical investment for the periods shown. The Fund’s total returns do not reflect the deduction of income taxes on an individual’s investment. Taxes may reduce your actual investment returns on income or gains paid by the Fund or any gains you may realize if you sell your shares.
Source: Prudential Investments LLC and Lipper Inc.
Inception returns are provided for any share class with less than 10 calendar years of returns.
The average annual total returns take into account applicable sales charges. Class A shares are subject to a maximum front-end sales charge of 5.50% and a 12b-1 fee of 0.30% annually. All investors who purchase Class A shares in an amount of $1 million or more and sell those shares within 12 months of purchase are subject to a contingent deferred sales charge (CDSC) of 1%. The Class A CDSC is waived for purchases by certain retirement or benefit plans. Under certain circumstances, an exchange may be made from specified share classes of the Fund to one or more other share classes of the Fund. Class X shares are not offered to new purchasers and are available only through exchanges from the same share class of certain other Prudential Investments mutual funds. Class C shares are not subject to a front-end sales charge. Class B, Class C, and Class X shares are subject to a maximum CDSC of 5%, 1%, and 6%, respectively. Class B, Class C, and Class X shares are subject to a 12b-1 fee of 1%. Class Q shares and Class Z shares are not subject to a sales charge or a 12b-1 fee. The returns in the tables and graph reflect the share class structure in effect at the close of the fiscal period. The returns in the tables and graph do not reflect the deduction of taxes that a shareholder would pay on Fund distributions or following the redemption of Fund shares.
Benchmark Definitions
Russell Midcap Value Index
The Russell Midcap Value Index is an unmanaged index which measures the performance of those Russell Midcap companies with lower price-to-book ratios and lower forecasted growth values. The stocks are also members of the Russell 1000 Value Index. Russell Midcap Value Index Closest Month-End to Inception cumulative total returns as of 10/31/12 are 81.88% for Class A and Class B; 10.10% for Class Q; and 38.83% for Class Z. Russell Midcap Value Index Closest Month-End to Inception average annual total returns as of 9/30/12 are 7.28% for Class A and Class B; 5.88% for Class Q; and 4.90% for Class Z.
| | |
| 4 | | Visit our website at www.prudentialfunds.com |
Standard & Poor’s MidCap 400 Stock Index
The Standard & Poor’s MidCap 400 Stock Index (S&P MidCap 400 Index) is an unmanaged index of 400 domestic stocks chosen for market capitalization, liquidity, and industry group representation. It gives a broad look at how U.S. mid-cap stock prices have performed. S&P MidCap 400 Index Closest Month-End to Inception cumulative total returns as of 10/31/12 are 82.92% for Class A and Class B; 8.74% for Class Q; and 47.60% for Class Z. S&P MidCap 400 Index Closest Month-End to Inception average annual total returns as of 9/30/12 are 7.46% for Class A and Class B; 5.66% for Class Q; and 5.99% for Class Z.
Russell Midcap Index
The Russell Midcap Index is an unmanaged index which measures the performance of the 800 smallest companies in the Russell 1000 Index, which represent approximately 25% of the total market capitalization of the Russell 1000 Index. Russell Midcap Index Closest Month-End to Inception cumulative total returns as of 10/31/12 are 79.72% for Class A and Class B; 8.79% for Class Q; and 40.98% for Class Z. Russell Midcap Index Closest Month-End to Inception average annual total returns as of 9/30/12 are 7.27% for Class A and Class B; 5.83% for Class Q; and 5.31% for Class Z.
Lipper Mid-Cap Value Funds Average
Funds in the Lipper Mid-Cap Value Funds Average (Lipper Average), by portfolio practice, invest at least 75% of their equity assets in companies with market capitalizations (on a three-year weighted basis) less than 300% of the dollar-weighted median market capitalization of the middle 1,000 securities of the S&P SuperComposite 1500 Index. Mid-cap value funds typically have a below-average price-to-earnings ratio, price-to-book ratio, and three-year sales-per-share growth value compared with the companies in the S&P MidCap 400 Index. Lipper Average Closest Month-End to Inception cumulative total returns as of 10/31/12 are 60.52% for Class A and Class B; 5.43% for Class Q; and 30.09% for Class Z. Lipper Average Closest Month-End to Inception average annual total returns as of 9/30/12 are 5.59% for Class A and Class B; 3.26% for Class Q; and 3.79% for Class Z.
Investors cannot invest directly in an index or average. The returns for the Indexes would be lower if they included the effects of sales charges, operating expenses of a mutual fund, or taxes. Returns for the Lipper Average reflect the deduction of operating expenses, but not sales charges or taxes.
| | | | |
Five Largest Holdings expressed as a percentage of net assets as of 10/31/12 | | | | |
Valero Energy Corp., Oil, Gas & Consumable Fuels | | | 1.5 | % |
Fifth Third Bancorp, Commercial Banks | | | 1.4 | |
Marathon Petroleum Corp., Oil, Gas & Consumable Fuels | | | 1.3 | |
Humana, Inc., Healthcare Providers & Services | | | 1.3 | |
CIGNA Corp., Healthcare Providers & Services | | | 1.3 | |
| | | | |
| Prudential Mid-Cap Value Fund | | | 5 | |
Strategy and Performance Overview
How did the Fund perform?
Prudential Mid-Cap Value Fund’s Class A shares returned 11.16% for the 12-month reporting period ended October 31, 2012, underperforming the 14.99% gain of the benchmark, the Russell Midcap Value Index (the Index) and the 12.75% gain of the Lipper Mid-Cap Value Funds Average.
What were conditions like in the mid-cap segment of the U.S. stock market?
Along with the broader equity market, prices of stocks of medium-sized U.S. companies performed well during the period that began November 1, 2011 despite headwinds from slowing jobs growth, uncertainty surrounding the looming U.S. “fiscal” cliff, (expiring tax cuts and mandatory budget cuts) and the continuing euro zone debt crisis.
| | • | | During the first quarter of 2012, improving economic data that included a strong jobs market which created over 200,000 jobs for three months in a row (December, January, and February), combined with the Federal Reserve’s (the Fed) upgrade of the U.S. economic growth trajectory from modest to moderate, pushed market indexes to multi-year highs. Stock market performance in the first three months of 2012 ranked among the best quarterly returns since 1998. |
| | • | | Mid-cap value stocks enjoyed a strong rally in the first quarter but performance faded in the spring after worries surfaced over the European debt crisis and the strength of the global economy. Waning job numbers and the Fed’s failure to immediately act on them disappointed investors, until breakthroughs by European policymakers reenergized global financial markets on the last day of the quarter. The S&P 500 posted its largest single-day gain of the year, although stocks remained down for the quarter due to the plunge in May. The Index posted back-to-back negative returns in April and May. A volatile quarter aside, most broad market averages remained positive for the year. |
| | • | | In September, central banks around the world slashed target interest rates and the U.S. and Europe announced open-ended bond buying programs to prop up faltering economies. The Fed indicated that Quantitative Easing 3 (QE3) would remain in effect until employment improved. The program, as did two previous rounds of quantitative easing, favored equities and helped push investors into riskier assets, thereby lifting the stock markets, including mid-cap value stocks. |
| | • | | After reaching highs in early October, the U.S. stock market subsequently sold off for the remainder of the month, driven by uncertainty surrounding the outcome of the presidential election and its impact on the looming fiscal cliff, coupled with concerns about anemic economic growth. Then events were compounded when Hurricane Sandy, which left widespread flooding and |
| | |
| 6 | | Visit our website at www.prudentialfunds.com |
| | blackouts in lower Manhattan, shut down the stock market for two days. For the month, value stocks outperformed growth stocks across all market capitalizations, and mid-cap stocks overall suffered the least. |
| | • | | For the reporting period, mid-cap value stocks, as measured by the Index, slightly lagged the S&P 500 Index, as risk-averse investors continued to seek safety in larger companies. |
How did the stock market sectors perform?
| | • | | With the exception of information technology and energy, all sectors in the Index posted double-digit gains for the period. Consumer discretionary, financials, and consumer staples achieved the strongest gains. Industrials, materials, utilities, healthcare, and telecommunication services also delivered double-digit gains, although their returns fell short of the Index’s performance. |
| | • | | Energy finished with a moderate single-digit gain, while information technology, the true laggard, posted a modest loss. |
What aspects of sector allocation and stock selection contributed most to the Fund’s return?
| | • | | The primary contributor to the Fund’s performance was strong stock selection in the information technology, energy and financials sectors. |
| | • | | Within the technology sector, the timely sale of semiconductor manufacturer Micron Technology boosted Fund results. As the year progressed, it became apparent that Micron’s earnings losses would likely continue well into calendar year 2013. Earnings of semiconductor manufacturers have been penalized by continued softness in demand and excess capacity in certain product markets. Above-benchmark exposures to Seagate Technology and Western Digital, two of the largest manufacturers of hard disk drives, also boosted returns after the flooding in Thailand, which materially reduced the industry’s production capacity, boosted the earnings prospects of both companies. |
| | • | | Among energy stocks, independent petroleum refiners Tesoro Corporation and Valero Energy Corporation benefited from improving earnings and actions to increase shareholder value. Tesoro instituted a share repurchase program and reinstated its dividend, while Valero management announced plans to separate its retail business from its refining business. |
| | • | | The U.S. coal industry has experienced a “perfect storm” of negative factors, including ongoing production cuts necessitated by excess inventories, and declining demand for coal due to more restrictive environmental regulations. |
| | | | |
| Prudential Mid-Cap Value Fund | | | 7 | |
Strategy and Performance Overview (continued)
| | Avoiding the stocks of Alpha Natural Resources and Arch Coal also benefited the Fund’s results, as the shares of both companies plunged during the period. |
| | • | | Within the financial sector, Discover Financial Services was a standout performer. Discover’s strong earnings and share price performance were driven by growth in credit cards and student and personal loans, market share gains, and a continued high level of share repurchase activity. Allied World Assurance, a provider of specialty insurance and reinsurance, also helped performance. Allied’s earnings rebounded strongly from the prior year when the company’s earnings were halved by global catastrophe losses. |
What aspects of sector allocation and stock selection subtracted most from the Fund’s return?
| | • | | Primary detractors from the Fund’s performance were negative stock selection in industrials, consumer staples, and healthcare, along with an overweight to and poor stock selection in the telecommunication services sector. |
| | • | | The sell-off in the stocks of R.R. Donnelley, a provider of print and other communications solutions, and Pitney Bowes, a manufacturer of mailing supplies, penalized Fund performance. During the period, both companies were forced to reduce earnings prospects, largely due to the slowdown in the global economy. Additionally, investor concerns that both companies might cut their dividends weighed on stock performance. |
| | • | | In telecommunications, Fund results were hurt by not owning Sprint. Sprint has been unprofitable for several years as it struggles from a position as the third largest U.S. wireless telephone carrier. The company’s stock more than doubled near the end of the period when Softbank, a Japanese telecom company, decided to take a 70% stake in Sprint. In addition, an above-benchmark exposure to NII Holdings, whose stock plunged during the period, hindered performance. NII is a wireless carrier with significant exposure to the very competitive wireless markets in South America. Profitability took a significant hit as the rollout of the company’s new 3G technology is proving more costly and prolonged than expected. Even so, this rollout should improve the company’s competitive position going forward. |
| | • | | Within the consumer staples sector, declines in the stocks of retail grocers SUPERVALU and Safeway hurt performance. In early July, SUPERVALU announced that it would suspend its dividend, accelerate price discounting, and review its strategic alternatives. The market’s reaction was clear, as the stock’s price was halved. The challenging retail grocery business and a relatively heavy debt load penalized Safeway’s earnings during the period. |
| | |
| 8 | | Visit our website at www.prudentialfunds.com |
| | Overweighting Tyson Foods and Smithfield Foods, whose stocks were notable laggards among food stocks, also weighed on the Fund’s results. Earnings prospects for Tyson weakened during the period, due largely to poor demand and rising grain prices. Estimates for Smithfield’s earnings also fell during the year, with rising corn prices and soft hog prices the main drivers of the shortfall. |
| | • | | An overweighting in Humana, a managed care company focused on Medicare and Tricare, also hurt performance. Humana shares fell during the period as concerns mounted that the company had mispriced its Medicare Advantage product in both 2012 and 2013. A decline in the shares of Endo Pharmaceuticals, a manufacturer of specialty pharmaceuticals, also detracted from performance. Challenges to several of Endo’s key products from generics weighed on its stock for much of the period. |
| | | | |
| Prudential Mid-Cap Value Fund | | | 9 | |
Fees and Expenses (Unaudited)
As a shareholder of the Fund, you incur two types of costs: (1) transaction costs, including sales charges (loads) on purchase payments and redemptions, as applicable, and (2) ongoing costs, including management fees, distribution and/or service (12b-1) fees, and other Fund expenses, as applicable. This example is intended to help you understand your ongoing costs (in dollars) of investing in the Fund and to compare these costs with the ongoing costs of investing in other mutual funds.
The example is based on an investment of $1,000 invested on May 1, 2012, at the beginning of the period, and held through the six-month period ended October 31, 2012. The example is for illustrative purposes only; you should consult the Prospectus for information on initial and subsequent minimum investment requirements.
The Fund’s transfer agent may charge additional fees to holders of certain accounts that are not included in the expenses shown in the table on the following page. These fees apply to individual retirement accounts (IRAs) and Section 403(b) accounts. As of the close of the six-month period covered by the table, IRA fees included an annual maintenance fee of $15 per account (subject to a maximum annual maintenance fee of $25 for all accounts held by the same shareholder). Section 403(b) accounts are charged an annual $25 fiduciary maintenance fee. Some of the fees may vary in amount, or may be waived, based on your total account balance or the number of Prudential Investments funds, including the Fund, that you own. You should consider the additional fees that were charged to your Fund account over the six-month period when you estimate the total ongoing expenses paid over the period and the impact of these fees on your ending account value, as these additional expenses are not reflected in the information provided in the expense table. Additional fees have the effect of reducing investment returns.
Actual Expenses
The first line for each share class in the table on the following page provides information about actual account values and actual expenses. You may use the information on this line, together with the amount you invested, to estimate the expenses that you paid over the period. Simply divide your account value by $1,000 (for example, an $8,600 account value ÷ $1,000 = 8.6), then multiply the result by the number on the first line under the heading “Expenses Paid During the Six-Month Period” to estimate the expenses you paid on your account during this period.
Hypothetical Example for Comparison Purposes
The second line for each share class in the table on the following page provides information about hypothetical account values and hypothetical expenses based on the Fund’s actual expense ratio and an assumed rate of return of 5% per year before
| | |
| 10 | | Visit our website at www.prudentialfunds.com |
expenses, which is not the Fund’s actual return. The hypothetical account values and expenses may not be used to estimate the actual ending account balance or expenses you paid for the period. You may use this information to compare the ongoing costs of investing in the Fund and other funds. To do so, compare this 5% hypothetical example with the 5% hypothetical examples that appear in the shareholder reports of the other funds.
Please note that the expenses shown in the table are meant to highlight your ongoing costs only and do not reflect any transactional costs such as sales charges (loads). Therefore, the second line for each share class in the table is useful in comparing ongoing costs only and will not help you determine the relative total costs of owning different funds. In addition, if these transactional costs were included, your costs would have been higher.
| | | | | | | | | | | | | | | | | | |
Prudential Mid-Cap
Value Fund | | Beginning Account
Value
May 1, 2012 | | | Ending Account
Value
October 31, 2012 | | | Annualized
Expense Ratio
Based on the
Six-Month Period | | | Expenses Paid
During the
Six-Month Period* | |
| | | | | | | | | | | | | | | | | | |
| Class A | | Actual | | $ | 1,000.00 | | | $ | 1,026.20 | | | | 1.67 | % | | $ | 8.51 | |
| | | Hypothetical | | $ | 1,000.00 | | | $ | 1,016.74 | | | | 1.67 | % | | $ | 8.47 | |
| | | | | | | | | | | | | | | | | | |
| Class B | | Actual | | $ | 1,000.00 | | | $ | 1,023.00 | | | | 2.42 | % | | $ | 12.31 | |
| | | Hypothetical | | $ | 1,000.00 | | | $ | 1,012.97 | | | | 2.42 | % | | $ | 12.25 | |
| | | | | | | | | | | | | | | | | | |
| Class C | | Actual | | $ | 1,000.00 | | | $ | 1,023.10 | | | | 2.42 | % | | $ | 12.31 | |
| | | Hypothetical | | $ | 1,000.00 | | | $ | 1,012.97 | | | | 2.42 | % | | $ | 12.25 | |
| | | | | | | | | | | | | | | | | | |
| Class Q | | Actual | | $ | 1,000.00 | | | $ | 1,029.40 | | | | 1.17 | % | | $ | 5.97 | |
| | | Hypothetical | | $ | 1,000.00 | | | $ | 1,019.25 | | | | 1.17 | % | | $ | 5.94 | |
| | | | | | | | | | | | | | | | | | |
| Class X | | Actual | | $ | 1,000.00 | | | $ | 1,027.10 | | | | 1.67 | % | | $ | 8.51 | |
| | | Hypothetical | | $ | 1,000.00 | | | $ | 1,016.74 | | | | 1.67 | % | | $ | 8.47 | |
| | | | | | | | | | | | | | | | | | |
| Class Z | | Actual | | $ | 1,000.00 | | | $ | 1,028.10 | | | | 1.42 | % | | $ | 7.24 | |
| | | Hypothetical | | $ | 1,000.00 | | | $ | 1,018.00 | | | | 1.42 | % | | $ | 7.20 | |
*Fund expenses (net of fee waivers or subsidies, if any) for each share class are equal to the annualized expense ratio for each share class (provided in the table), multiplied by the average account value over the period, multiplied by the 184 days in the six-month period ended October 31, 2012, and divided by 366 days. Expenses presented in the table include the expenses of any underlying funds in which the Fund may invest.
| | | | |
| Prudential Mid-Cap Value Fund | | | 11 | |
Portfolio of Investments
as of October 31, 2012
| | | | | | |
| Shares | | Description | | Value (Note 2) | |
LONG-TERM INVESTMENTS 99.5% | |
COMMON STOCKS 98.4% | |
|
Aerospace & Defense 3.0% | |
| 11,600 | | Alliant Techsystems, Inc. | | $ | 664,564 | |
| 23,700 | | Huntington Ingalls Industries, Inc.* | | | 1,004,406 | |
| 17,800 | | L-3 Communications Holdings, Inc. | | | 1,313,640 | |
| 22,500 | | Textron, Inc. | | | 567,225 | |
| | | | | | |
| | | | | 3,549,835 | |
|
Airlines 0.8% | |
| 25,100 | | Delta Air Lines, Inc.* | | | 241,713 | |
| 52,700 | | Southwest Airlines Co. | | | 464,814 | |
| 12,000 | | United Continental Holdings, Inc.*(a) | | | 230,520 | |
| | | | | | |
| | | | | 937,047 | |
|
Auto Components 1.8% | |
| 9,200 | | Autoliv, Inc.(a) | | | 529,920 | |
| 13,600 | | Federal-Mogul Corp.* | | | 102,544 | |
| 10,400 | | Lear Corp. | | | 443,040 | |
| 23,200 | | TRW Automotive Holdings Corp.* | | | 1,079,032 | |
| | | | | | |
| | | | | 2,154,536 | |
|
Auto Parts & Equipment 0.5% | |
| 18,500 | | Delphi Automotive PLC (United Kingdom) | | | 581,640 | |
|
Beverages 1.5% | |
| 22,400 | | Constellation Brands, Inc. (Class A Stock)* | | | 791,616 | |
| 22,200 | | Molson Coors Brewing Co. (Class B Stock)(a) | | | 957,708 | |
| | | | | | |
| | | | | 1,749,324 | |
|
Capital Markets 1.4% | |
| 25,200 | | Ameriprise Financial, Inc.(a) | | | 1,470,924 | |
| 16,900 | | E*Trade Financial Corp.* | | | 141,284 | |
| 12,800 | | Janus Capital Group, Inc. | | | 108,800 | |
| | | | | | |
| | | | | 1,721,008 | |
|
Chemicals 1.3% | |
| 2,100 | | Celanese Corp. (Class A Stock) | | | 79,779 | |
| 7,000 | | CF Industries Holdings, Inc. | | | 1,436,330 | |
| 1,600 | | Eastman Chemical Co. | | | 94,784 | |
| | | | | | |
| | | | | 1,610,893 | |
See Notes to Financial Statements.
| | | | |
| Prudential Mid-Cap Value Fund | | | 13 | |
Portfolio of Investments
as of October 31, 2012 continued
| | | | | | |
| Shares | | Description | | Value (Note 2) | |
COMMON STOCKS (Continued) | |
|
Commercial Banks 6.2% | |
| 11,200 | | Bank of Hawaii Corp.(a) | | $ | 494,592 | |
| 3,700 | | BankUnited, Inc. | | | 87,727 | |
| 11,500 | | BOK Financial Corp. | | | 674,475 | |
| 16,900 | | Comerica, Inc. | | | 503,789 | |
| 19,632 | | Commerce Bancshares, Inc. | | | 747,587 | |
| 16,700 | | East West Bancorp, Inc. | | | 355,543 | |
| 114,300 | | Fifth Third Bancorp | | | 1,660,779 | |
| 2,200 | | First Citizens BancShares, Inc. (Class A Stock) | | | 371,250 | |
| 49,000 | | First Niagara Financial Group, Inc. | | | 405,720 | |
| 2,600 | | First Republic Bank | | | 89,310 | |
| 90,800 | | Huntington Bancshares, Inc. | | | 580,212 | |
| 141,100 | | KeyCorp | | | 1,188,062 | |
| 600 | | M&T Bank Corp. | | | 62,460 | |
| 9,100 | | SunTrust Banks, Inc. | | | 247,520 | |
| | | | | | |
| | | | | 7,469,026 | |
|
Commercial Services & Supplies 2.1% | |
| 14,100 | | Global Payments, Inc. | | | 602,775 | |
| 19,800 | | Lender Processing Services, Inc. | | | 477,378 | |
| 24,200 | | Pitney Bowes, Inc.(a) | | | 347,512 | |
| 26,100 | | Republic Services, Inc. | | | 739,935 | |
| 39,500 | | RR Donnelley & Sons Co.(a) | | | 395,790 | |
| | | | | | |
| | | | | 2,563,390 | |
|
Communications Equipment 0.9% | |
| 16,700 | | Brocade Communications Systems, Inc.* | | | 88,510 | |
| 9,300 | | EchoStar Corp. (Class A Stock)* | | | 295,368 | |
| 16,400 | | Harris Corp. | | | 750,792 | |
| | | | | | |
| | | | | 1,134,670 | |
|
Computers & Peripherals 1.4% | |
| 21,700 | | Lexmark International, Inc. (Class A Stock)(a) | | | 461,342 | |
| 15,900 | | Seagate Technology PLC (Ireland) | | | 434,388 | |
| 21,900 | | Western Digital Corp. | | | 749,637 | |
| | | | | | |
| | | | | 1,645,367 | |
|
Construction & Engineering 0.8% | |
| 7,100 | | KBR, Inc. | | | 197,806 | |
| 22,400 | | URS Corp. | | | 749,952 | |
| | | | | | |
| | | | | 947,758 | |
See Notes to Financial Statements.
| | |
| 14 | | Visit our website at www.prudentialfunds.com |
| | | | | | |
| Shares | | Description | | Value (Note 2) | |
COMMON STOCKS (Continued) | |
|
Consumer Finance 1.8% | |
| 22,500 | | Discover Financial Services | | $ | 922,500 | |
| 73,300 | | SLM Corp. | | | 1,288,614 | |
| | | | | | |
| | | | | 2,211,114 | |
|
Containers & Packaging 0.8% | |
| 6,800 | | Greif, Inc. (Class A Stock) | | | 285,328 | |
| 23,300 | | Owens-Illinois, Inc.* | | | 454,117 | |
| 2,900 | | Rock-Tenn Co. (Class A Stock) | | | 212,251 | |
| | | | | | |
| | | | | 951,696 | |
|
Diversified Consumer Services 0.8% | |
| 5,700 | | Apollo Group, Inc. (Class A Stock)*(a) | | | 114,456 | |
| 59,700 | | Service Corp. International | | | 838,188 | |
| | | | | | |
| | | | | 952,644 | |
|
Diversified Financial Services 1.1% | |
| 1,100 | | Interactive Brokers Group, Inc. (Class A Stock) | | | 15,675 | |
| 33,400 | | NASDAQ OMX Group, Inc. (The) | | | 795,254 | |
| 21,000 | | NYSE Euronext, Inc. | | | 519,960 | |
| | | | | | |
| | | | | 1,330,889 | |
|
Diversified Telecommunication Services 0.9% | |
| 17,991 | | CenturyLink, Inc. | | | 690,495 | |
| 91,600 | | Frontier Communications Corp.(a) | | | 432,352 | |
| | | | | | |
| | | | | 1,122,847 | |
|
Electric Utilities 5.4% | |
| 8,000 | | American Electric Power Co., Inc. | | | 355,520 | |
| 609 | | Duke Energy Corp. | | | 40,005 | |
| 31,300 | | Edison International | | | 1,469,222 | |
| 16,100 | | Entergy Corp. | | | 1,168,538 | |
| 4,300 | | Great Plains Energy, Inc. | | | 96,492 | |
| 31,200 | | NV Energy, Inc. | | | 593,112 | |
| 9,000 | | OGE Energy Corp. | | | 518,220 | |
| 14,500 | | Pinnacle West Capital Corp. | | | 768,065 | |
| 50,300 | | PPL Corp. | | | 1,487,874 | |
| | | | | | |
| | | | | 6,497,048 | |
See Notes to Financial Statements.
| | | | |
| Prudential Mid-Cap Value Fund | | | 15 | |
Portfolio of Investments
as of October 31, 2012 continued
| | | | | | |
| Shares | | Description | | Value (Note 2) | |
COMMON STOCKS (Continued) | |
|
Electronic Equipment, Instruments & Components 1.1% | |
| 4,300 | | Arrow Electronics, Inc.* | | $ | 151,489 | |
| 19,200 | | Avnet, Inc.* | | | 550,080 | |
| 9,600 | | Tech Data Corp.* | | | 425,376 | |
| 27,200 | | Vishay Intertechnology, Inc.* | | | 225,216 | |
| | | | | | |
| | | | | 1,352,161 | |
|
Energy Equipment & Services 3.3% | |
| 15,700 | | Atwood Oceanics, Inc.* | | | 750,460 | |
| 10,300 | | Diamond Offshore Drilling, Inc. | | | 713,172 | |
| 4,600 | | Helmerich & Payne, Inc. | | | 219,880 | |
| 71,600 | | Nabors Industries Ltd. (Bermuda)* | | | 965,884 | |
| 15,400 | | Patterson-UTI Energy, Inc.(a) | | | 249,172 | |
| 22,000 | | Superior Energy Services, Inc.* | | | 447,260 | |
| 16,900 | | Unit Corp.* | | | 681,915 | |
| | | | | | |
| | | | | 4,027,743 | |
|
Food & Staples Retailing 1.2% | |
| 22,600 | | Kroger Co. (The) | | | 569,972 | |
| 54,300 | | Safeway, Inc.(a) | | | 885,633 | |
| | | | | | |
| | | | | 1,455,605 | |
| |
Food Products 1.9% | | | | |
| 4,750 | | ConAgra Foods, Inc. | | | 132,240 | |
| 30,900 | | Dean Foods Co.* | | | 520,356 | |
| 4,200 | | Ingredion, Inc. | | | 258,132 | |
| 30,400 | | Smithfield Foods, Inc.* | | | 622,288 | |
| 43,600 | | Tyson Foods, Inc. (Class A Stock) | | | 732,916 | |
| | | | | | |
| | | | | 2,265,932 | |
| |
Gas Utilities 1.3% | | | | |
| 24,300 | | Atmos Energy Corp. | | | 874,071 | |
| 6,500 | | Questar Corp. | | | 131,560 | |
| 17,500 | | UGI Corp. | | | 565,075 | |
| | | | | | |
| | | | | 1,570,706 | |
| |
Healthcare Products 0.2% | | | | |
| 33,100 | | Boston Scientific Corp.* | | | 170,134 | |
| 1,700 | | Hill-Rom Holdings, Inc. | | | 47,753 | |
| | | | | | |
| | | | | 217,887 | |
See Notes to Financial Statements.
| | |
| 16 | | Visit our website at www.prudentialfunds.com |
| | | | | | |
| Shares | | Description | | Value (Note 2) | |
COMMON STOCKS (Continued) | |
| |
Healthcare Providers & Services 6.3% | | | | |
| 11,400 | | Aetna, Inc. | | $ | 498,180 | |
| 30,100 | | CIGNA Corp. | | | 1,535,100 | |
| 20,100 | | Community Health Systems, Inc.* | | | 551,142 | |
| 18,800 | | Coventry Health Care, Inc. | | | 820,432 | |
| 23,400 | | HCA Holdings, Inc. | | | 664,794 | |
| 20,800 | | Humana, Inc. | | | 1,544,816 | |
| 15,600 | | LifePoint Hospitals, Inc.* | | | 551,304 | |
| 17,900 | | Omnicare, Inc. | | | 618,087 | |
| 2,800 | | Quest Diagnostics, Inc. | | | 161,616 | |
| 14,600 | | Universal Health Services, Inc. (Class B Stock) | | | 604,294 | |
| | | | | | |
| | | | | 7,549,765 | |
| |
Hotels, Restaurants & Leisure 0.9% | | | | |
| 21,100 | | Royal Caribbean Cruises Ltd. (Liberia) | | | 710,437 | |
| 6,800 | | Wyndham Worldwide Corp. | | | 342,720 | |
| | | | | | |
| | | | | 1,053,157 | |
| |
Household Durables 1.8% | | | | |
| 3,200 | | Jarden Corp. | | | 159,360 | |
| 43,900 | | Newell Rubbermaid, Inc. | | | 906,096 | |
| 12,500 | | Tempur-Pedic International, Inc.*(a) | | | 330,500 | |
| 8,200 | | Whirlpool Corp. | | | 800,976 | |
| | | | | | |
| | | | | 2,196,932 | |
| |
Independent Power Producers & Energy Traders 0.8% | | | | |
| 97,000 | | AES Corp. (The) | | | 1,013,650 | |
| |
Insurance 9.3% | | | | |
| 14,700 | | Allied World Assurance Co. Holdings AG (Switzerland) | | | 1,180,410 | |
| 28,400 | | American Financial Group, Inc. | | | 1,101,920 | |
| 300 | | American National Insurance Co. | | | 21,918 | |
| 14,500 | | Aon PLC (United Kingdom) | | | 782,275 | |
| 27,500 | | Arch Capital Group Ltd. (Bermuda)* | | | 1,214,125 | |
| 21,600 | | AXIS Capital Holdings Ltd. (Bermuda) | | | 782,352 | |
| 13,600 | | CNA Financial Corp. | | | 399,568 | |
| 20,900 | | Fidelity National Financial, Inc. (Class A Stock) | | | 447,469 | |
| 13,000 | | HCC Insurance Holdings, Inc. | | | 463,320 | |
| 35,000 | | Lincoln National Corp. | | | 867,650 | |
| 35,800 | | Principal Financial Group, Inc.(a) | | | 985,932 | |
| 8,300 | | ProAssurance Corp. | | | 742,020 | |
See Notes to Financial Statements.
| | | | |
| Prudential Mid-Cap Value Fund | | | 17 | |
Portfolio of Investments
as of October 31, 2012 continued
| | | | | | |
| Shares | | Description | | Value (Note 2) | |
COMMON STOCKS (Continued) | |
| |
Insurance (cont’d.) | | | | |
| 25,200 | | Protective Life Corp. | | $ | 687,960 | |
| 16,200 | | Reinsurance Group of America, Inc. | | | 857,304 | |
| 500 | | RenaissanceRe Holdings Ltd. (Bermuda) | | | 40,680 | |
| 5,600 | | StanCorp Financial Group, Inc.(a) | | | 192,360 | |
| 22,600 | | Unum Group | | | 458,328 | |
| | | | | | |
| | | | | 11,225,591 | |
| |
Internet Services 0.3% | | | | |
| 5,650 | | Expedia, Inc. | | | 334,197 | |
| |
IT Services 1.9% | | | | |
| 22,400 | | Amdocs Ltd. (Guernsey) | | | 740,768 | |
| 27,000 | | Computer Sciences Corp. | | | 822,150 | |
| 11,800 | | DST Systems, Inc. | | | 673,072 | |
| | | | | | |
| | | | | 2,235,990 | |
| |
Machinery 2.1% | | | | |
| 14,300 | | AGCO Corp.* | | | 650,793 | |
| 16,700 | | Harsco Corp. | | | 333,833 | |
| 16,200 | | Oshkosh Corp.* | | | 485,676 | |
| 2,100 | | Parker Hannifin Corp. | | | 165,186 | |
| 27,700 | | Trinity Industries, Inc. | | | 866,456 | |
| | | | | | |
| | | | | 2,501,944 | |
| |
Media 1.6% | | | | |
| 29,400 | | DISH Network Corp. (Class A Stock) | | | 1,047,522 | |
| 48,600 | | Gannett Co., Inc. | | | 821,340 | |
| 3,752 | | Interpublic Group of Cos., Inc. (The) | | | 37,895 | |
| | | | | | |
| | | | | 1,906,757 | |
| |
Metals & Mining 0.3% | | | | |
| 5,600 | | Schnitzer Steel Industries, Inc. (Class A Stock) | | | 159,656 | |
| 16,700 | | Steel Dynamics, Inc. | | | 211,255 | |
| | | | | | |
| | | | | 370,911 | |
| |
Multi-Line Retail 1.7% | | | | |
| 8,100 | | Dillard’s, Inc. (Class A Stock) | | | 623,700 | |
| 2,700 | | Kohl’s Corp. | | | 143,856 | |
| 33,900 | | Macy’s, Inc. | | | 1,290,573 | |
| | | | | | |
| | | | | 2,058,129 | |
See Notes to Financial Statements.
| | |
| 18 | | Visit our website at www.prudentialfunds.com |
| | | | | | |
| Shares | | Description | | Value (Note 2) | |
COMMON STOCKS (Continued) | |
| |
Multi-Utilities 7.7% | | | | |
| 12,100 | | Alliant Energy Corp. | | $ | 540,870 | |
| 39,800 | | Ameren Corp. | | | 1,308,624 | |
| 47,100 | | CenterPoint Energy, Inc. | | | 1,020,657 | |
| 28,100 | | CMS Energy Corp. | | | 683,392 | |
| 5,200 | | Consolidated Edison, Inc. | | | 313,976 | |
| 23,000 | | DTE Energy Co. | | | 1,428,300 | |
| 25,700 | | MDU Resources Group, Inc. | | | 558,461 | |
| 22,700 | | NiSource, Inc. | | | 578,169 | |
| 4,300 | | SCANA Corp.(a) | | | 211,044 | |
| 13,000 | | Sempra Energy | | | 906,750 | |
| 11,100 | | TECO Energy, Inc. | | | 198,357 | |
| 4,500 | | Wisconsin Energy Corp. | | | 173,115 | |
| 46,200 | | Xcel Energy, Inc. | | | 1,305,150 | |
| | | | | | |
| | | | | 9,226,865 | |
| |
Office Electronics 0.9% | | | | |
| 168,700 | | Xerox Corp. | | | 1,086,428 | |
| |
Oil, Gas & Consumable Fuels 8.0% | | | | |
| 19,000 | | Chesapeake Energy Corp.(a) | | | 384,940 | |
| 16,700 | | Denbury Resources, Inc.* | | | 256,011 | |
| 15,500 | | Energen Corp. | | | 723,075 | |
| 24,000 | | HollyFrontier Corp. | | | 927,120 | |
| 28,800 | | Marathon Petroleum Corp. | | | 1,581,984 | |
| 23,200 | | Murphy Oil Corp. | | | 1,392,000 | |
| 6,600 | | Newfield Exploration Co.* | | | 178,992 | |
| 900 | | Noble Energy, Inc. | | | 85,509 | |
| 18,200 | | Plains Exploration & Production Co.* | | | 649,012 | |
| 5,100 | | QEP Resources, Inc. | | | 147,900 | |
| 2,000 | | Spectra Energy Corp. | | | 57,740 | |
| 35,400 | | Tesoro Corp. | | | 1,334,934 | |
| 60,000 | | Valero Energy Corp. | | | 1,746,000 | |
| 2,500 | | Whiting Petroleum Corp.* | | | 105,050 | |
| | | | | | |
| | | | | 9,570,267 | |
| |
Paper & Forest Products 1.7% | | | | |
| 8,600 | | Domtar Corp. | | | 685,850 | |
| 38,900 | | International Paper Co. | | | 1,393,787 | |
| | | | | | |
| | | | | 2,079,637 | |
See Notes to Financial Statements.
| | | | |
| Prudential Mid-Cap Value Fund | | | 19 | |
Portfolio of Investments
as of October 31, 2012 continued
| | | | | | |
| Shares | | Description | | Value (Note 2) | |
COMMON STOCKS (Continued) | |
|
Pharmaceuticals 1.3% | |
| 24,600 | | Endo Health Solutions, Inc.* | | $ | 705,036 | |
| 25,500 | | Forest Laboratories, Inc.* | | | 859,605 | |
| | | | | | |
| | | | | 1,564,641 | |
|
Real Estate Investment Trusts 5.6% | |
| 45,700 | | American Capital Agency Corp. | | | 1,509,014 | |
| 82,400 | | Annaly Capital Management, Inc.(a) | | | 1,329,936 | |
| 49,200 | | Brandywine Realty Trust(a) | | | 570,720 | |
| 2,900 | | CBL & Associates Properties, Inc. | | | 64,873 | |
| 54,500 | | Chimera Investment Corp. | | | 145,515 | |
| 40,000 | | CommonWealth REIT | | | 548,400 | |
| 14,400 | | Hatteras Financial Corp. | | | 392,688 | |
| 5,900 | | HCP, Inc. | | | 261,370 | |
| 32,400 | | Hospitality Properties Trust | | | 749,088 | |
| 29,800 | | Mack-Cali Realty Corp. | | | 774,502 | |
| 40,600 | | MFA Financial, Inc. | | | 331,702 | |
| | | | | | |
| | | | | 6,677,808 | |
|
Retail & Merchandising 0.1% | |
| 2,800 | | Nu Skin Enterprises, Inc. (Class A Stock) | | | 132,524 | |
|
Road & Rail 0.5% | |
| 12,700 | | Ryder System, Inc. | | | 573,024 | |
|
Semiconductors & Semiconductor Equipment 0.6% | |
| 20,200 | | Applied Materials, Inc. | | | 214,120 | |
| 4,500 | | KLA-Tencor Corp. | | | 209,340 | |
| 44,000 | | Marvell Technology Group Ltd. (Bermuda) | | | 347,160 | |
| | | | | | |
| | | | | 770,620 | |
|
Software 0.9% | |
| 26,700 | | CA, Inc. | | | 601,284 | |
| 25,000 | | Symantec Corp.* | | | 454,750 | |
| | | | | | |
| | | | | 1,056,034 | |
|
Specialty Retail 0.9% | |
| 33,100 | | GameStop Corp. (Class A Stock)(a) | | | 755,673 | |
| 30,200 | | Staples, Inc.(a) | | | 347,753 | |
| | | | | | |
| | | | | 1,103,426 | |
See Notes to Financial Statements.
| | |
| 20 | | Visit our website at www.prudentialfunds.com |
| | | | | | |
| Shares | | Description | | Value (Note 2) | |
COMMON STOCKS (Continued) | |
|
Thrifts & Mortgage Finance 0.5% | |
| 44,200 | | New York Community Bancorp, Inc.(a) | | $ | 612,612 | |
|
Water Utilities 0.3% | |
| 8,300 | | American Water Works Co., Inc. | | | 304,942 | |
|
Wireless Telecommunication Services 0.9% | |
| 33,900 | | MetroPCS Communications, Inc.* | | | 346,119 | |
| 22,283 | | Telephone & Data Systems, Inc. | | | 554,178 | |
| 6,000 | | United States Cellular Corp.* | | | 221,940 | |
| | | | | | |
| | | | | 1,122,237 | |
| | | | | | |
| | TOTAL COMMON STOCKS
(cost $105,063,898) | | | 118,348,854 | |
| | | | | | |
EXCHANGE TRADED FUND 1.1% | |
| 27,000 | | iShares Russell Midcap Value Index Fund(a)
(cost $1,194,991) | | | 1,316,790 | |
| | | | | | |
| | TOTAL LONG-TERM INVESTMENTS
(cost $106,258,889) | | | 119,665,644 | |
| | | | | | |
SHORT-TERM INVESTMENT 10.9% | | | | |
AFFILIATED MONEY MARKET MUTUAL FUND | |
| 13,151,491 | | Prudential Investment Portfolios 2 - Prudential Core Taxable
Money Market Fund
(cost $13,151,491; includes $11,986,952 of cash collateral
for securities on loan)(b)(c) | | | 13,151,491 | |
| | | | | | |
| | TOTAL INVESTMENTS 110.4%
(cost $119,410,380; Note 5) | | | 132,817,135 | |
| | Liabilities in excess of other assets (10.4%) | | | (12,479,805 | ) |
| | | | | | |
| | NET ASSETS 100.0% | | $ | 120,337,330 | |
| | | | | | |
The following abbreviations are used in the Portfolio descriptions:
REIT—Real Estate Investment Trust
NASDAQ—National Association for Securities Dealers
NYSE—New York Stock Exchange
| * | Non-income producing security. |
| (a) | All or a portion of security is on loan. The aggregate market value of such securities, including those sold and pending settlement, is $11,631,673; cash collateral of $11,986,952 (included with liabilities) was received with which the Portfolio purchased highly liquid short-term investments. |
| (b) | Represents security, or a portion thereof, purchased with cash collateral received for securities on loan. |
See Notes to Financial Statements.
| | | | |
| Prudential Mid-Cap Value Fund | | | 21 | |
Portfolio of Investments
as of October 31, 2012 continued
| (c) | Prudential Investments LLC, the manager of the Fund also serves as manager of the Prudential Investment Portfolios 2 - Prudential Core Taxable Money Market Fund. |
Various inputs are used in determining the value of the Portfolio’s investments. These inputs are summarized in the three broad levels listed below.
Level 1—quoted prices generally in active markets for identical securities.
Level 2—other significant observable inputs including, but not limited to, quoted prices for similar securities, interest rates and yield curves, prepayment speeds, foreign currency exchange rates, and amortized cost.
Level 3—significant unobservable inputs for securities valued in accordance with Board approved fair valuation procedures.
The following is a summary of the inputs used as of October 31, 2012 in valuing such portfolio securities:
| | | | | | | | | | | | |
| | | Level 1 | | | Level 2 | | | Level 3 | |
Investments in Securities | | | | | | | | | | | | |
Common Stocks | | $ | 118,348,854 | | | $ | — | | | $ | — | |
Exchanged Traded Fund | | | 1,316,790 | | | | — | | | | — | |
Affiliated Money Market Mutual Fund | | | 13,151,491 | | | | — | | | | — | |
| | | | | | | | | | | | |
Total | | $ | 132,817,135 | | | $ | — | | | $ | — | |
| | | | | | | | | | | | |
See Notes to Financial Statements.
| | |
| 22 | | Visit our website at www.prudentialfunds.com |
The industry classification of investments and liabilities in excess of other assets shown as a percentage of net assets as of October 31, 2012 were as follows:
| | | | |
Affiliated Money Market Mutual Fund (10.0% represents investments purchased with collateral from securities on loan) | | | 10.9 | % |
Insurance | | | 9.3 | |
Oil, Gas & Consumable Fuels | | | 8.0 | |
Multi-Utilities | | | 7.7 | |
Healthcare Providers & Services | | | 6.3 | |
Commercial Banks | | | 6.2 | |
Real Estate Investment Trusts | | | 5.6 | |
Electric Utilities | | | 5.4 | |
Energy Equipment & Services | | | 3.3 | |
Aerospace & Defense | | | 3.0 | |
Commercial Services & Supplies | | | 2.1 | |
Machinery | | | 2.1 | |
Food Products | | | 1.9 | |
IT Services | | | 1.9 | |
Consumer Finance | | | 1.8 | |
Household Durables | | | 1.8 | |
Auto Components | | | 1.8 | |
Paper & Forest Products | | | 1.7 | |
Multi-Line Retail | | | 1.7 | |
Media | | | 1.6 | |
Beverages | | | 1.5 | |
Capital Markets | | | 1.4 | |
Computers & Peripherals | | | 1.4 | |
Chemicals | | | 1.3 | |
Gas Utilities | | | 1.3 | |
Pharmaceuticals | | | 1.3 | |
Food & Staples Retailing | | | 1.2 | |
Electronic Equipment, Instruments & Components | | | 1.1 | |
Diversified Financial Services | | | 1.1 | % |
Exchange Traded Fund | | | 1.1 | |
Communications Equipment | | | 0.9 | |
Diversified Telecommunication Services | | | 0.9 | |
Wireless Telecommunication Services | | | 0.9 | |
Specialty Retail | | | 0.9 | |
Office Electronics | | | 0.9 | |
Software | | | 0.9 | |
Hotels, Restaurants & Leisure | | | 0.9 | |
Independent Power Producers & Energy Traders | | | 0.8 | |
Diversified Consumer Services | | | 0.8 | |
Containers & Packaging | | | 0.8 | |
Construction & Engineering | | | 0.8 | |
Airlines | | | 0.8 | |
Semiconductors & Semiconductor Equipment | | | 0.6 | |
Thrifts & Mortgage Finance | | | 0.5 | |
Auto Parts & Equipment | | | 0.5 | |
Road & Rail | | | 0.5 | |
Metals & Mining | | | 0.3 | |
Internet Services | | | 0.3 | |
Water Utilities | | | 0.3 | |
Healthcare Products | | | 0.2 | |
Retail & Merchandising | | | 0.1 | |
| | | | |
| | | 110.4 | |
Liabilities in excess of other assets | | | (10.4 | ) |
| | | | |
| | | 100.0 | % |
| | | | |
See Notes to Financial Statements.
| | | | |
| Prudential Mid-Cap Value Fund | | | 23 | |
Statement of Assets and Liabilities
as of October 31, 2012
| | | | |
Assets | | | | |
Investments at value, including securities on of loan of $11,631,673: | | | | |
Unaffiliated Investments (cost $106,258,889) | | $ | 119,665,644 | |
Affiliated Investments (cost $13,151,491) | | | 13,151,491 | |
Dividends receivable | | | 150,614 | |
Receivable for Fund shares sold | | | 24,508 | |
Prepaid expenses | | | 1,821 | |
| | | | |
Total assets | | | 132,994,078 | |
| | | | |
| |
Liabilities | | | | |
Payable to broker for collateral for securities on loan | | | 11,986,952 | |
Payable for Fund shares reacquired | | | 367,958 | |
Accrued expenses | | | 147,252 | |
Advisory fee payable | | | 93,372 | |
Distribution fee payable | | | 41,790 | |
Affiliated transfer agent fee payable | | | 18,814 | |
Deferred directors’ fee | | | 610 | |
| | | | |
Total liabilities | | | 12,656,748 | |
| | | | |
| |
Net Assets | | $ | 120,337,330 | |
| | | | |
| | | | | |
Net assets were comprised of: | | | | |
Common stock, at $.001 par value | | $ | 8,096 | |
Paid-in capital in excess of par | | | 106,913,784 | |
| | | | |
| | | 106,921,880 | |
Undistributed net investment income | | | 595,563 | |
Accumulated net realized loss on investment and transactions | | | (586,868 | ) |
Net unrealized appreciation on investments | | | 13,406,755 | |
| | | | |
Net assets, October 31, 2012 | | $ | 120,337,330 | |
| | | | |
See Notes to Financial Statements.
| | |
| 24 | | Visit our website at www.prudentialfunds.com |
| | | | |
Class A: | | | | |
Net asset value and redemption price per share
($79,133,070 ÷ 5,187,437 shares of common stock issued and outstanding) | | $ | 15.25 | |
Maximum sales charge (5.5% of offering price) | | | .89 | |
| | | | |
Maximum offering price to public | | $ | 16.14 | |
| | | | |
| |
Class B: | | | | |
Net asset value, offering price and redemption price per share
($2,475,632 ÷ 179,940 shares of common stock issued and outstanding) | | $ | 13.76 | |
| | | | |
| |
Class C: | | | | |
Net asset value, offering price and redemption price per share
($25,975,662 ÷ 1,893,634 shares of common stock issued and outstanding) | | $ | 13.72 | |
| | | | |
| |
Class Q: | | | | |
Net asset value, offering price and redemption price per share
($5,698,823 ÷ 370,373 shares of common stock issued and outstanding) | | $ | 15.39 | |
| | | | |
| |
Class X: | | | | |
Net asset value, offering price and redemption price per share
($961,573 ÷ 68,653 shares of common stock issued and outstanding) | | $ | 14.01 | |
| | | | |
| |
Class Z: | | | | |
Net asset value, offering price and redemption price per share
($6,092,570 ÷ 396,242 shares of common stock issued and outstanding) | | $ | 15.38 | |
| | | | |
See Notes to Financial Statements.
| | | | |
| Prudential Mid-Cap Value Fund | | | 25 | |
Statement of Operations
Year Ended October 31, 2012
| | | | |
Net Investment Income | | | | |
Investment Income | | | | |
Unaffiliated dividend income | | $ | 3,388,278 | |
Affiliated income from securities lending, net | | | 93,837 | |
Affiliated dividend income | | | 2,564 | |
| | | | |
Total income | | | 3,484,679 | |
| | | | |
| |
Expenses | | | | |
Advisory fee | | | 1,115,003 | |
Distribution fee—Class A | | | 176,083 | |
Distribution fee—Class B | | | 26,717 | |
Distribution fee—Class C | | | 265,912 | |
Distribution fee—Class L | | | 44,085 | |
Distribution fee—Class M | | | 532 | |
Distribution fee—Class X | | | 3,465 | |
Transfer agent’s fee and expenses (including affiliated expense of $103,000) (Note 3) | | | 305,000 | |
Registration fees | | | 134,000 | |
Custodian’s fees and expenses | | | 59,000 | |
Reports to shareholders | | | 42,000 | |
Legal fees and expenses | | | 23,000 | |
Audit fee | | | 22,000 | |
Directors’ fees | | | 13,000 | |
Insurance fees | | | 3,000 | |
Miscellaneous | | | 16,380 | |
| | | | |
Net expenses | | | 2,249,177 | |
| | | | |
Net investment income | | | 1,235,502 | |
| | | | |
| |
Realized And Unrealized Gain (Loss) On Investments | | | | |
Net realized gain on investment transactions | | | 5,141,335 | |
Net change in unrealized appreciation (depreciation) on investments | | | 6,962,162 | |
| | | | |
Net gain on investments | | | 12,103,497 | |
| | | | |
Net Increase In Net Assets Resulting From Operations | | $ | 13,338,999 | |
| | | | |
See Notes to Financial Statements.
| | |
| 26 | | Visit our website at www.prudentialfunds.com |
Statement of Changes in Net Assets
| | | | | | | | |
| | | Year Ended October 31, | |
| | | 2012 | | | 2011 | |
Increase (Decrease) In Net Assets | | | | | | | | |
Operations | | | | | | | | |
Net investment income | | $ | 1,235,502 | | | $ | 687,583 | |
Net realized gain on investment transactions | | | 5,141,335 | | | | 15,594,385 | |
Net change in unrealized appreciation (depreciation) on investments | | | 6,962,162 | | | | (7,936,946 | ) |
| | | | | | | | |
Net increase in net assets resulting from operations | | | 13,338,999 | | | | 8,345,022 | |
| | | | | | | | |
| | |
Dividends (Note 2) | | | | | | | | |
Dividends from net investment income | | | | | | | | |
Class A | | | (516,098 | ) | | | (326,017 | ) |
Class B | | | (3,638 | ) | | | — | |
Class C | | | (33,512 | ) | | | — | |
Class L | | | (57,080 | ) | | | (28,452 | ) |
Class M | | | (6,926 | ) | | | (18,606 | ) |
Class Q | | | (160,607 | ) | | | — | |
Class X | | | (15,116 | ) | | | (18,794 | ) |
Class Z | | | (52,182 | ) | | | (116,800 | ) |
| | | | | | | | |
Total dividends | | | (845,159 | ) | | | (508,669 | ) |
| | | | | | | | |
| | |
Fund share transactions (Net of share conversions) (Note 5) | | | | | | | | |
Net proceeds from shares sold | | | 6,527,418 | | | | 9,988,166 | |
Net asset value of shares issued in reinvestment of dividends | | | 814,146 | | | | 489,215 | |
Cost of shares redeemed | | | (29,311,244 | ) | | | (32,875,461 | ) |
| | | | | | | | |
Net decrease in net assets from Fund share transactions | | | (21,969,680 | ) | | | (22,398,080 | ) |
| | | | | | | | |
| | |
Capital Contributions | | | | | | | | |
Class M (Note 3) | | | — | | | | 404 | |
Class X (Note 3) | | | 52 | | | | 458 | |
| | | | | | | | |
| | | 52 | | | | 862 | |
| | | | | | | | |
Total decrease in net assets | | | (9,475,788 | ) | | | (14,560,865 | ) |
| | |
Net Assets | | | | | | | | |
Beginning of year | | | 129,813,118 | | | | 144,373,983 | |
| | | | | | | | |
End of year(a) | | $ | 120,337,330 | | | $ | 129,813,118 | |
| | | | | | | | |
(a) Includes undistributed net investment income of: | | $ | 595,563 | | | $ | 205,220 | |
| | | | | | | | |
See Notes to Financial Statements.
| | | | |
| Prudential Mid-Cap Value Fund | | | 27 | |
Notes to Financial Statements
1. Organization
Prudential Investment Portfolios, Inc. 10 (the “Company”) is an open-end management investment company, registered under the Investment Company Act of 1940, as amended, (“1940 Act”). The Company was organized on March 5, 1997, as a Maryland Corporation. The Company operates as a series company. At October 31, 2012, the Company consisted of two diversified investment portfolios (each a “Fund” and collectively the “Funds”). The information presented in these financial statements pertains to Prudential Mid-Cap Value Fund (the “Fund”). The investment objective of the Fund is capital growth by investing primarily in common stocks of medium capitalization companies.
2. Significant Accounting Policies
The following is a summary of significant accounting policies followed by the Fund in the preparation of the financial statements.
Securities Valuation: The Fund holds portfolio securities and other assets that are fair valued at the close of each day the New York Stock Exchange (“NYSE”) is open for trading. Fair value is the price that would be received to sell an asset or paid to transfer a liability in an orderly transaction between market participants on the measurement date. The Board of Trustees (the “Board”) has delegated fair valuation responsibilities to Prudential Investments LLC (“PI” or “Manager”) through the adoption of Valuation Procedures for valuation of the Fund’s securities. Under the current Valuation Procedures, a Valuation Committee is established and responsible for supervising the valuation of portfolio securities and other assets. The Valuation Procedures allow the Fund to utilize independent pricing vendor services, quotations from market makers and other valuation methods in events when market quotations are not readily available or not representative of the fair value of the securities. A record of the Valuation Committee’s actions is subject to review, approval and ratification by the Board at its next regularly scheduled quarterly meeting.
Various inputs are used in determining the value of the Fund’s investments, which are summarized in the three broad level hierarchies based on any observable inputs used as described in the table following the Portfolio of Investments. The valuation methodologies and significant inputs used in determining the fair value of securities
| | |
| 28 | | Visit our website at www.prudentialfunds.com |
and other assets classified as Level 1, Level 2 and Level 3 of the hierarchy are as follows:
Common stock, exchange-traded funds and financial derivative instruments (including futures contracts and certain options contracts on securities), that are traded on a national securities exchange are valued at the last sale price as of the close of trading on the applicable exchange. Securities traded via NASDAQ are valued at the NASDAQ official closing price. To the extent these securities are valued at the last sale price or NASDAQ official closing price, they are classified as Level 1 of the fair value hierarchy.
In the event there is no sale or official closing price on such day, these securities are valued at the mean between the last reported bid and asked prices, or at the last bid price in the absence of an asked price. These securities are classified as Level 2 of the fair value hierarchy as these inputs are considered as significant other observable inputs to the valuation.
For common stocks traded on foreign securities exchanges, certain valuation adjustments will be applied when events occur after the close of the security’s foreign market and before the Fund’s normal pricing time. These securities are valued using pricing vendor services that provide model prices derived using adjustment factors based on information such as local closing price, relevant general and sector indices, currency fluctuations, depositary receipts, and futures, as applicable. Securities valued using such model prices are classified as Level 2 of the fair value hierarchy as the adjustment factors are considered as significant other observable inputs to the valuation.
Investments in open-end, non-exchange-traded mutual funds are valued at their net asset values as of the close of the NYSE on the date of valuation. These securities are classified as Level 1 as they have the ability to be purchased or sold at their net asset values on the date of valuation.
Fixed income securities traded in the over-the-counter market, such as corporate bonds, municipal bonds, U.S. Government agencies issues and guaranteed obligations, U.S. Treasury obligations and sovereign issues are usually valued at prices provided by approved independent pricing vendors. The pricing vendors provide these prices usually after evaluating observable inputs including yield curves, credit rating, yield spreads, default rates, cash flows as well as broker/dealer quotations and reported trades. Securities valued using such vendor prices are classified as Level 2 of the fair value hierarchy.
| | | | |
| Prudential Mid-Cap Value Fund | | | 29 | |
Notes to Financial Statements
continued
Asset-backed and mortgage-related securities are usually valued by approved independent pricing vendors. The pricing vendors provide the prices using their internal pricing model with input from deal terms, tranche level attributes, yield curves, prepayment speeds, default rates, and broker/dealer quotes. Securities valued using such vendor prices are classified as Level 2 of the fair value hierarchy.
Short-term debt securities of sufficient credit quality, which mature in sixty days or less, are valued using amortized cost method, which approximates fair value. The amortized cost method involves valuing a security at its cost on the date of purchase and thereafter assuming a constant amortization to maturity of the difference between the principal amount due at maturity and cost. These securities are categorized as Level 2 of the fair value hierarchy.
Over-the-counter financial derivative instruments, such as option contracts, foreign currency contracts and swaps agreements, are usually valued using pricing vendor services, which derive the valuation based on underlying asset prices, indices, spreads, interest rates, exchange rates and other inputs. These instruments are categorized as Level 2 of the fair value hierarchy.
Securities and other assets that cannot be priced using the methods described above are valued with pricing methodologies approved by the Valuation Committee. In the event there are unobservable inputs used when determining such valuations, the securities will be classified as Level 3 of the fair value hierarchy.
When determining the fair value of securities, some of the factors influencing the valuation include: the nature of any restrictions on disposition of the securities; assessment of the general liquidity of the securities; the issuer’s financial condition and the markets in which it does business; the cost of the investment; the size of the holding and the capitalization of the issuer; the prices of any recent transactions or bids/offers for such securities or any comparable securities; any available analyst media or other reports or information deemed reliable by the investment adviser regarding the issuer or the markets or industry in which it operates. Using fair value to price securities may result in a value that is different from a security’s most recent closing price and from the price used by other mutual funds to calculate their net asset values.
Foreign Currency Translation: Fund securities and other assets and liabilities denominated in foreign currencies are translated each business day into U.S. dollars
| | |
| 30 | | Visit our website at www.prudentialfunds.com |
based on the current rates of exchange. Purchases and sales of Fund securities and income and expenses are translated into U.S. dollars on the respective dates of such transactions. Gains and losses resulting from changes in exchange rates applicable to long-term foreign securities are not reported separately from gains and losses arising from movements in securities prices. Net realized foreign exchange gains and losses include gains and losses from sales and maturities of foreign currency exchange contracts, gains and losses realized between the trade and settlement dates of foreign securities transactions, and the difference between the amount of net investment income accrued on foreign securities and the U.S. dollar amount actually received. Net unrealized foreign exchange gains and losses include gains and losses from changes in the value of assets and liabilities other than Fund securities, resulting from changes in exchange rates.
Securities Lending: The Fund may lend its portfolio securities to banks and broker-dealers. The loans are secured by collateral at least equal to the market value of the securities loaned. Collateral pledged by each borrower is invested in a highly liquid short-term money market fund and is marked to market daily, based on the previous day’s market value, such that the value of the collateral exceeds the value of the loaned securities. Loans are subject to termination at the option of the borrower or the Fund. Upon termination of the loan, the borrower will return to the Fund securities identical to the loaned securities. Should the borrower of the securities fail financially, the Fund has the right to repurchase the securities using the collateral in the open market. The Fund recognizes income, net of any rebate and securities lending agent fees, for lending its securities, and any interest on the investment of cash received as collateral. The Fund also continues to receive interest and dividends or amounts equivalent thereto, on the securities loaned and recognize any unrealized gain or loss in the market price of the securities loaned that may occur during the term of the loan.
Securities Transactions and Net Investment Income: Securities transactions are recorded on the trade date. Realized gains or losses from investment and currency transactions are calculated on the identified cost basis. Dividend income is recorded on the ex-dividend date. Interest income, including amortization of premium and accretion of discount on debt securities, as required, is recorded on the accrual basis. Expenses are recorded on an accrual basis which may require the use of certain estimates by management, that may differ from actual.
Net investment income or loss (other than distribution fees which are charged directly to the respective class) and unrealized and realized gains or losses are allocated daily to each class of shares based upon the relative proportion of adjusted net assets of each class at the beginning of the day.
| | | | |
| Prudential Mid-Cap Value Fund | | | 31 | |
Notes to Financial Statements
continued
Dividends and Distributions to Shareholders: Dividends and distributions to shareholders are recorded on the ex-dividend date. Dividends, if any, from net investment income are declared and paid at least annually. These dividends and distributions are determined in accordance with federal income tax regulations and may differ from accounting principles generally accepted in the United States of America.
Net realized gains from investment transactions, if any, are distributed at least annually. Permanent book/tax differences relating to income and gains are reclassified to paid-in capital when they arise.
Taxes: For federal income tax purposes, each Fund in the Company is treated as a separate tax paying entity. It is the Fund’s policy to continue to meet the requirements of the Internal Revenue Code applicable to regulated investment companies and to distribute all of its taxable net income and capital gains, if any, to shareholders. Therefore, no federal tax provision is required.
Withholding taxes on foreign dividends are recorded net of reclaimable amounts, at the time the related income is earned.
Estimates: The preparation of the financial statements requires management to make estimates and assumptions that affect the reported amounts and disclosures in the financial statements. Actual results could differ from those estimates.
3. Agreements
The Fund has entered into an investment management agreement with PI which provides that the Manager will furnish the Fund with investment advice and investment management and administrative services. The Manager has entered into a subadvisory agreement with Quantitative Management Associates LLC (“QMA”). The subadvisory agreement provides that QMA furnishes investment advisory services in connection with the management of the Fund. PI pays for the services of QMA, the cost of compensation of officers of the Fund, occupancy and certain clerical and bookkeeping costs of the Fund. The Fund bears all other costs and expenses.
The advisory fee paid to PI is computed daily and payable monthly at an annual rate of ..90% of the average daily net assets of the Fund up to $500 million, .85% of the
| | |
| 32 | | Visit our website at www.prudentialfunds.com |
next $500 million and .80% of the average daily net assets in excess of $1 billion. The effective management fee rate was .90% for the year ended October 31, 2012.
Certain officers and directors of the Fund are officers or directors of the Manager. The Fund pays no compensation directly to their officers or interested directors.
Prudential Investment Management Services LLC (“PIMS”) and Prudential Annuities Distributors, Inc. (“PAD”), both affiliates of the Manager and an indirect, wholly owned subsidiary of Prudential, serve as the distributors of the Fund. The Company has adopted a separate Distribution and Service plan (each a “Plan” and collectively the “Plans”) for Class A, B, C, L, M, Q, X and Z shares of each Fund in accordance with the requirements of Rule 12b-1 of the 1940 Act,. No distribution or service fees are paid to PIMS as distributor for Class Q or Class Z shares.
Under the Plans, the Fund compensates PIMS and PAD distribution and service fees at an annual rate up to .30%, 1.00%, 1.00%, .50%, 1.00% and 1.00% of the average daily net assets of the Class A, B, C, L, M and X shares, respectively. Through February 28, 2014, PIMS has contractually agreed to limit such fees to .25% of the average daily net assets of Class A shares.
Management has received the maximum allowable amount of sales charges for Class M and X in accordance with regulatory limits. As such, any contingent deferred sales charges received by the Manager are contributed back into the Fund and included in the Statement of Changes in Net Assets and Financial Highlights as a contribution to capital.
During the year ended October 31, 2008, management determined that Class M and Class X shareholders had been charged sales charges in excess of regulatory limits. The Manager has paid these classes for the overcharge which is reflected in the Financial Highlights for Class M for the years ended October 31, 2008 and 2007 and Class X for the year ended October 31, 2008.
During the year ended October 31, 2012, PIMS has advised the Fund, front-end sales charges (“FESC”) and contingent deferred sales charges (“CDSC”) were as follows:
| | | | | | |
Class A FESC | | Class A CDSC | | Class B CDSC | | Class C CDSC |
| $32,570 | | $366 | | $4,706 | | $922 |
| | | | |
| Prudential Mid-Cap Value Fund | | | 33 | |
Notes to Financial Statements
continued
4. Other Transactions with Affiliates
Prudential Mutual Fund Services LLC (“PMFS”), an affiliate of PI and an indirect, wholly-owned subsidiary of Prudential, serves as the Fund’s transfer agent. Transfer agent fees and expenses shown in the Statements of Operations include certain out-of pocket expenses paid to non-affiliates, where applicable.
The Fund invests in the Prudential Core Taxable Money Market Fund (the “Core Fund”), a portfolio of Prudential Investment Portfolios 2, registered under the 1940 Act, and managed by PI. Earnings from the Core Fund are disclosed on the Statement of Operations as affiliated dividend income.
Prudential Investment Management, Inc. (“PIM”), an indirect, wholly-owned subsidiary of Prudential, served as the Fund’s securities lending agent. For the year ended October 31, 2012, PIM has been compensated approximately $28,100 for these services.
5. Shares of Capital Stock
The Fund offers Class A, Class B, Class C, Class Q, Class X and Class Z shares. Class A shares are sold with a front-end sales charge of up to 5.50%. Purchases of $1 million or more are subject to a contingent deferred sales charge (“CDSC”) if shares are redeemed within 12 months of their purchase. Class B shares are sold with a CDSC which declines from 5% to zero depending upon the period of time the shares are held. Class B shares will automatically convert to Class A shares approximately seven years after purchase. Class C shares are sold with a CDSC of 1% on shares redeemed within the first 12 months of purchase. The last conversion of Class M and Class L shares to Class A shares was completed as of April 13, 2012 and August 24, 2012, respectively. There are no Class M and Class L shares outstanding and Class M and Class L shares are no longer being offered for sale. Class X shares are closed to new purchases. Class X shares will automatically convert to Class A shares approximately ten years after purchase. Class Q and Class Z shares are not subject to any sales or redemption charge and are offered exclusively for sale to a limited group of investors.
Under certain circumstances, an exchange may be made from specified share classes of the Fund to one or more other share classes of the Fund as presented in the table of transactions in shares of beneficial interest.
| | |
| 34 | | Visit our website at www.prudentialfunds.com |
The authorized capital stock of the Company is 5.5 billion shares, with a par value of $.001 per share. Of the Company’s authorized capital stock, 175 million authorized shares have been allocated to the Fund and divided into seven classes, designated Class A, Class B, Class C, Class M, Class Q, Class X and Class Z capital stock, each of which consists of 52 million, 10 million, 30 million, 2 million, 40 million, 1 million and 40 million authorized shares, respectively.
Transactions in shares of capital stock, during the year ended October 31, 2012, were as follows:
| | | | | | | | |
Class A | | Shares | | | Amount | |
Year ended October 31, 2012: | | | | | | | | |
Shares sold | | | 209,967 | | | $ | 3,047,766 | |
Shares issued in reinvestment of dividends and distributions | | | 37,694 | | | | 494,924 | |
Shares reacquired | | | (878,327 | ) | | | (12,751,665 | ) |
| | | | | | | | |
Net increase (decrease) in shares outstanding before conversion | | | (630,666 | ) | | | (9,208,975 | ) |
Shares issued upon conversion from Class B, Class L, Class M and Class X | | | 897,838 | | | | 13,340,802 | |
Shares reacquired upon conversion into Class Z | | | (2,187 | ) | | | (31,182 | ) |
| | | | | | | | |
Net increase (decrease) in shares outstanding | | | 264,985 | | | $ | 4,100,645 | |
| | | | | | | | |
Year ended October 31, 2011: | | | | | | | | |
Shares sold | | | 290,278 | | | $ | 4,197,030 | |
Shares issued in reinvestment of dividends and distributions | | | 23,751 | | | | 312,088 | |
Shares reacquired | | | (1,404,217 | ) | | | (19,651,476 | ) |
| | | | | | | | |
Net increase (decrease) in shares outstanding before conversion | | | (1,090,188 | ) | | | (15,142,358 | ) |
Shares issued upon conversion from Class B, Class M and Class X | | | 440,046 | | | | 6,200,949 | |
Shares reacquired upon conversion into Class Z | | | (41,496 | ) | | | (604,311 | ) |
| | | | | | | | |
Net increase (decrease) in shares outstanding | | | (691,638 | ) | | $ | (9,545,720 | ) |
| | | | | | | | |
Class B | | | | | | |
Year ended October 31, 2012: | | | | | | | | |
Shares sold | | | 39,324 | | | $ | 514,195 | |
Shares issued in reinvestment of dividends and distributions | | | 279 | | | | 3,323 | |
Shares reacquired | | | (33,778 | ) | | | (440,207 | ) |
| | | | | | | | |
Net increase (decrease) in shares outstanding before conversion | | | 5,825 | | | | 77,311 | |
Shares reacquired upon conversion into Class A | | | (63,230 | ) | | | (830,881 | ) |
| | | | | | | | |
Net increase (decrease) in shares outstanding | | | (57,405 | ) | | $ | (753,570 | ) |
| | | | | | | | |
Year ended October 31, 2011: | | | | | | | | |
Shares sold | | | 55,268 | | | $ | 723,351 | |
Shares reacquired | | | (68,301 | ) | | | (872,904 | ) |
| | | | | | | | |
Net increase (decrease) in shares outstanding before conversion | | | (13,033 | ) | | | (149,553 | ) |
Shares reacquired upon conversion into Class A | | | (94,292 | ) | | | (1,207,901 | ) |
| | | | | | | | |
Net increase (decrease) in shares outstanding | | | (107,325 | ) | | $ | (1,357,454 | ) |
| | | | | | | | |
| | | | |
| Prudential Mid-Cap Value Fund | | | 35 | |
Notes to Financial Statements
continued
| | | | | | | | |
Class C | | Shares | | | Amount | |
Year ended October 31, 2012: | | | | | | | | |
Shares sold | | | 61,639 | | | $ | 810,376 | |
Shares issued in reinvestment of dividends and distributions | | | 2,646 | | | | 31,466 | |
Shares reacquired | | | (363,982 | ) | | | (4,785,266 | ) |
| | | | | | | | |
Net increase (decrease) in shares outstanding before conversion | | | (299,697 | ) | | | (3,943,424 | ) |
Shares reacquired upon conversion into Class Z | | | (737 | ) | | | (10,090 | ) |
| | | | | | | | |
Net increase (decrease) in shares outstanding | | | (300,434 | ) | | $ | (3,953,514 | ) |
| | | | | | | | |
Year ended October 31, 2011: | | | | | | | | |
Shares sold | | | 80,138 | | | $ | 1,027,265 | |
Shares reacquired | | | (409,203 | ) | | | (5,238,736 | ) |
| | | | | | | | |
Net increase (decrease) in shares outstanding before conversion | | | (329,065 | ) | | | (4,211,471 | ) |
Shares reacquired upon conversion into Class Z | | | (3,092 | ) | | | (36,187 | ) |
| | | | | | | | |
Net increase (decrease) in shares outstanding | | | (332,157 | ) | | $ | (4,247,658 | ) |
| | | | | | | | |
Class L | | | | | | |
Period ended August 24, 2012**: | | | | | | | | |
Shares sold | | | 1,754 | | | $ | 24,745 | |
Shares issued in reinvestment of dividends and distributions | | | 4,053 | | | | 52,366 | |
Shares reacquired | | | (86,600 | ) | | | (1,223,833 | ) |
| | | | | | | | |
Net increase (decrease) in shares outstanding before conversion | | | (80,793 | ) | | | (1,146,722 | ) |
Shares reacquired upon conversion into Class A | | | (721,647 | ) | | | (10,611,751 | ) |
| | | | | | | | |
Net increase (decrease) in shares outstanding | | | (802,440 | ) | | $ | (11,758,473 | ) |
| | | | | | | | |
Year ended October 31, 2011: | | | | | | | | |
Shares sold | | | 2,104 | | | $ | 29,731 | |
Shares issued in reinvestment of dividends and distributions | | | 2,026 | | | | 26,190 | |
Shares reacquired | | | (123,155 | ) | | | (1,710,840 | ) |
| | | | | | | | |
Net increase (decrease) in shares outstanding | | | (119,025 | ) | | $ | (1,654,919 | ) |
| | | | | | | | |
Class M | | | | | | |
Period ended April 13, 2012**: | | | | | | | | |
Shares sold | | | — | | | $ | — | |
Shares issued in reinvestment of dividends and distributions | | | 526 | | | | 6,299 | |
Shares reacquired | | | (2,614 | ) | | | (33,062 | ) |
| | | | | | | | |
Net increase (decrease) in shares outstanding before conversion | | | (2,088 | ) | | | (26,763 | ) |
Shares reacquired upon conversion into Class A | | | (76,743 | ) | | | (1,000,953 | ) |
| | | | | | | | |
Net increase (decrease) in shares outstanding | | | (78,831 | ) | | $ | (1,027,716 | ) |
| | | | | | | | |
Year ended October 31, 2011: | | | | | | | | |
Shares sold | | | 1,863 | | | $ | 23,544 | |
Shares issued in reinvestment of dividends and distributions | | | 1,448 | | | | 17,371 | |
Shares reacquired | | | (20,792 | ) | | | (292,886 | ) |
| | | | | | | | |
Net increase (decrease) in shares outstanding before conversion | | | (17,481 | ) | | | (251,971 | ) |
Shares reacquired upon conversion into Class A | | | (236,407 | ) | | | (3,049,310 | ) |
| | | | | | | | |
Net increase (decrease) in shares outstanding | | | (253,888 | ) | | $ | (3,301,281 | ) |
| | | �� | | | | | |
| | |
| 36 | | Visit our website at www.prudentialfunds.com |
| | | | | | | | |
Class Q | | Shares | | | Amount | |
Year ended October 31, 2012: | | | | | | | | |
Shares sold | | | 5,663 | | | $ | 80,130 | |
Shares issued in reinvestment of dividends and distributions | | | 12,176 | | | | 160,607 | |
Shares reacquired | | | (555,054 | ) | | | (8,248,440 | ) |
| | | | | | | | |
Net increase (decrease) in shares outstanding | | | (537,215 | ) | | $ | (8,007,703 | ) |
| | | | | | | | |
Period January 18, 2011* through October 31, 2011: | | | | | | | | |
Shares sold | | | 41,920 | | | $ | 601,415 | |
Shares reacquired | | | (94,765 | ) | | | (1,400,000 | ) |
| | | | | | | | |
Net increase (decrease) in shares outstanding before conversion | | | (52,845 | ) | | | (798,585 | ) |
Shares issued upon conversion from Class Z | | | 960,433 | | | | 13,926,271 | |
| | | | | | | | |
Net increase (decrease) in shares outstanding | | | 907,588 | | | $ | 13,127,686 | |
| | | | | | | | |
Class X | | | | | | |
Year ended October 31, 2012: | | | | | | | | |
Shares sold | | | 1,391 | | | $ | 18,499 | |
Shares issued in reinvestment of dividends and distributions | | | 1,251 | | | | 15,092 | |
Shares reacquired | | | (14,866 | ) | | | (197,208 | ) |
| | | | | | | | |
Net increase (decrease) in shares outstanding before conversion | | | (12,224 | ) | | | (163,617 | ) |
Shares reacquired upon conversion into Class A | | | (67,164 | ) | | | (897,217 | ) |
| | | | | | | | |
Net increase (decrease) in shares outstanding | | | (79,388 | ) | | $ | (1,060,834 | ) |
| | | | | | | | |
Year ended October 31, 2011: | | | | | | | | |
Shares sold | | | 1,294 | | | $ | 17,524 | |
Shares issued in reinvestment of dividends and distributions | | | 1,551 | | | | 18,723 | |
Shares reacquired | | | (53,793 | ) | | | (719,031 | ) |
| | | | | | | | |
Net increase (decrease) in shares outstanding before conversion | | | (50,948 | ) | | | (682,784 | ) |
Shares reacquired upon conversion into Class A | | | (137,949 | ) | | | (1,786,509 | ) |
| | | | | | | | |
Net increase (decrease) in shares outstanding | | | (188,897 | ) | | $ | (2,469,293 | ) |
| | | | | | | | |
Class Z | | | | | | |
Year ended October 31, 2012: | | | | | | | | |
Shares sold | | | 139,251 | | | $ | 2,031,707 | |
Shares issued in reinvestment of dividends and distributions | | | 3,793 | | | | 50,069 | |
Shares reacquired | | | (111,388 | ) | | | (1,631,563 | ) |
| | | | | | | | |
Net increase (decrease) in shares outstanding before conversion | | | 31,656 | | | | 450,213 | |
Shares issued upon conversion from Class A and Class C | | | 2,828 | | | | 41,272 | |
| | | | | | | | |
Net increase (decrease) in shares outstanding | | | 34,484 | | | $ | 491,485 | |
| | | | | | | | |
Year ended October 31, 2011: | | | | | | | | |
Shares sold | | | 231,095 | | | $ | 3,368,306 | |
Shares issued in reinvestment of dividends and distributions | | | 8,694 | | | | 114,843 | |
Shares reacquired | | | (223,907 | ) | | | (2,989,588 | ) |
| | | | | | | | |
Net increase (decrease) in shares outstanding before conversion | | | 15,882 | | | | 493,561 | |
Shares issued upon conversion from Class A and Class C | | | 43,991 | | | | 640,497 | |
Shares reacquired upon conversion into Class A and Class Q | | | (972,300 | ) | | | (14,083,499 | ) |
| | | | | | | | |
Net increase (decrease) in shares outstanding | | | (912,427 | ) | | $ | (12,949,441 | ) |
| | | | | | | | |
| | | | |
| Prudential Mid-Cap Value Fund | | | 37 | |
Notes to Financial Statements
continued
| * | Commencement of operations. |
| ** | As of April 13, 2012, the last conversion of Class M shares to Class A shares was completed. There are no Class M shares outstanding and Class M shares are no longer being offered for sale. As of August 24, 2012, the last conversion of Class L shares to Class A shares was completed. There are no Class L shares outstanding and Class L shares are no longer being offered at this time. |
6. Tax Information
Distributions to shareholders, which are determined in accordance with federal income tax regulations, which may differ from generally accepted accounting principles, are recorded on the ex-dividend date.
For the years ended October 31, 2012 and 2011, the tax character of dividends paid as reflected in the Statement of Changes in Net Assets were $845,159 and $508,669 of ordinary income, respectively.
As of October 31, 2012, the accumulated undistributed earnings on a tax basis was $596,173 of ordinary income. This differs from the amount shown on the Statement of Assets and Liabilities primarily due to cumulative timing differences between financial and tax reporting.
The United States federal income tax basis of the Fund’s investments and the net unrealized appreciation as of October 31, 2012 were as follows:
| | | | | | |
Tax Basis | | Appreciation | | Depreciation | | Net
Unrealized
Appreciation |
| $119,560,809 | | $21,697,061 | | $(8,440,735) | | $13,256,326 |
The difference between book basis and tax basis was primarily attributable to deferred losses on wash sales.
Under the Regulated Investment Company Modernization Act of 2010 (”the Act”), the Fund is permitted to carryforward capital losses incurred in the fiscal year ended October 31, 2012 (”post-enactment losses”) for an unlimited period. Post-enactment losses are required to be utilized before the utilization of losses incurred prior to the effective date of the Act. As a result of this ordering rule, capital loss carryforwards related to taxable years ending before October 31, 2012 (“pre-enactment losses”) may
| | |
| 38 | | Visit our website at www.prudentialfunds.com |
have an increased likelihood to expire unused. The Fund utilized approximately $4,836,000 of its pre-enactment losses to offset net taxable gains realized in the fiscal year ended October 31, 2012. No capital gains distributions are expected to be paid to shareholders until net gains have been realized in excess of such losses. As of October 31, 2012, the pre and post-enactment losses were approximately:
| | | | |
Post-Enactment Losses: | | $ | 0 | |
| | | | |
Pre-Enactment Losses: | | | | |
Expiring 2017 | | $ | 436,000 | |
| | | | |
Management has analyzed the Fund’s tax positions taken on federal income tax returns for all open tax years and has concluded that no provision for income tax is required in the Fund’s financial statements for the current reporting period. The Fund’s federal and state income and federal excise tax returns for tax years for which the applicable statutes of limitations have not expired are subject to examination by the Internal Revenue Service and state departments of revenue.
7. Portfolio Securities
Purchases and sales of securities, other than U.S. government securities and short term obligations, during the year ended October 31, 2012, were $30,563,037 and $52,407,209, respectively.
8. Borrowings
The Fund, along with other affiliated registered investment companies (the “Funds”), is a party to a Syndicated Credit Agreement (“SCA”) with a group of banks. The purpose of the SCA is to provide an alternative source of temporary funding for capital share redemptions. The SCA provides for a commitment of $900 million for the period December 16, 2011 through November 14, 2012. The SCA has been renewed effective November 15, 2012 at substantially similar terms through November 14, 2013. The Funds pay an annualized commitment fee of .08% of the unused portion of the SCA. Prior to December 16, 2011, the Funds had another Syndicated Credit Agreement of a $750 million commitment with an annualized commitment fee of .10% of the unused portion. Interest on any borrowings under the SCA is paid at contracted market rates. The commitment fee for the unused amount is accrued daily and paid quarterly.
The Fund did not borrow any amounts pursuant to the SCA during the year ended October 31, 2012.
| | | | |
| Prudential Mid-Cap Value Fund | | | 39 | |
Notes to Financial Statements
continued
Note 9. New Accounting Pronouncement
In December 2011, the Financial Accounting Standards Board (“FASB”) issued Accounting Standards Update (“ASU”) No. 2011-11 regarding “Disclosures about Offsetting Assets and Liabilities.” The amendments, which will be effective for annual reporting periods beginning on or after January 1, 2013 and interim periods within those annual periods, require an entity to disclose information about offsetting and related arrangements for assets and liabilities, financial instruments and derivatives that are either currently offset in accordance with current requirements or are subject to enforceable master netting arrangements or similar agreements. At this time, management is evaluating the implications of ASU No. 2011-11 and its impact on the financial statements has not yet been determined.
Note 10. Dividends to Shareholders
Subsequent to the fiscal year end, the Fund declared ordinary income dividends on December 6, 2012 to shareholders of record on December 7, 2012. The ex-dividend date was December 10, 2012. The per share amounts declared were as follows:
| | | | |
| | | Ordinary Income | |
Class A | | $ | 0.18559 | |
Class B | | $ | 0.09256 | |
Class C | | $ | 0.09256 | |
Class Q | | $ | 0.26081 | |
Class X | | $ | 0.18559 | |
Class Z | | $ | 0.22214 | |
| | |
| 40 | | Visit our website at www.prudentialfunds.com |
Financial Highlights
| | | | | | | | | | | | | | | | | | | | |
| Class A Shares | |
| | | Year Ended October 31, | |
| | | 2012 | | | 2011 | | | 2010 | | | 2009 | | | 2008 | |
| Per Share Operating Performance(b): | | | | | | | | | | | | | | | | | | | | |
| Net Asset Value, Beginning Of Year | | | $13.83 | | | | $13.12 | | | | $10.65 | | | | $9.07 | | | | $18.38 | |
| Income (loss) from investment operations: | | | | | | | | | | | | | | | | | | | | |
| Net investment income | | | .17 | | | | .09 | | | | .08 | | | | .09 | | | | .15 | |
| Net realized and unrealized gain (loss) on investments | | | 1.36 | | | | .68 | | | | 2.48 | | | | 1.68 | | | | (5.65 | ) |
| Total from investment operations | | | 1.53 | | | | .77 | | | | 2.56 | | | | 1.77 | | | | (5.50 | ) |
| Less Dividends and Distributions: | | | | | | | | | | | | | | | | | | | | |
| Dividends from net investment income | | | (.11 | ) | | | (.06 | ) | | | (.09 | ) | | | (.19 | ) | | | (.06 | ) |
| Distributions from net realized gains | | | - | | | | - | | | | - | | | | - | | | | (3.75 | ) |
| Total dividends and distributions | | | (.11 | ) | | | (.06 | ) | | | (.09 | ) | | | (.19 | ) | | | (3.81 | ) |
| Capital Contributions(d) | | | - | | | | - | | | | - | * | | | - | | | | - | |
| Net asset value, end of year | | | $15.25 | | | | $13.83 | | | | $13.12 | | | | $10.65 | | | | $9.07 | |
| Total Return(a) | | | 11.16% | | | | 5.90% | | | | 24.14% | | | | 20.16% | | | | (36.25)% | |
| |
| Ratios/Supplemental Data: | |
| Net assets, end of year (in millions) | | | $79.1 | | | | $68.1 | | | | $73.6 | | | | $62.4 | | | | $36.1 | |
| Ratios to average net assets(c): | | | | | | | | | | | | | | | | | | | | |
| Expenses after advisory fee waiver and expense reimbursement | | | 1.67% | | | | 1.63% | | | | 1.61% | | | | 1.72% | | | | 1.53% | |
| Expenses before advisory fee waiver and expense reimbursement | | | 1.67% | | | | 1.63% | | | | 1.61% | | | | 1.72% | | | | 1.53% | |
| Net investment income | | | 1.16% | | | | .63% | | | | .65% | | | | .97% | | | | 1.18% | |
| Portfolio turnover rate | | | 25% | | | | 37% | | | | 26% | | | | 38% | | | | 37% | |
(a) Total return does not consider the effects of sales load. Total return is calculated assuming a purchase of a share on the first day and a sale on the last day of each year reported and includes reinvestment of dividends and distributions. Total returns may reflect adjustments to conform to generally accepted accounting principles. Total return includes the effect of expense subsidies.
(b) Calculated based on average shares outstanding during the year.
(c) Does not include expenses of the underlying portfolio in which the Fund invests.
(d) The Fund received payments related to a former affiliate’s settlement of regulatory proceedings involving allegations of improper trading in Fund shares during the fiscal year ended October 31, 2012. The Fund was not involved in the proceedings or in the calculation of the amount of settlement.
* Less than $.005.
See Notes to Financial Statements.
| | | | |
| Prudential Mid-Cap Value Fund | | | 41 | |
Financial Highlights
continued
| | | | | | | | | | | | | | | | | | | | |
| Class B Shares | |
| | | Year Ended October 31, | |
| | | 2012 | | | 2011 | | | 2010 | | | 2009 | | | 2008 | |
| Per Share Operating Performance(b): | | | | | | | | | | | | | | | | | | | | |
| Net Asset Value, Beginning Of Year | | | $12.48 | | | | $11.87 | | | | $9.66 | | | | $8.22 | | | | $17.07 | |
| Income (loss) from investment operations: | | | | | | | | | | | | | | | | | | | | |
| Net investment income (loss) | | | .05 | | | | (.02 | ) | | | (.01 | ) | | | .06 | | | | .05 | |
| Net realized and unrealized gain (loss) on investments | | | 1.25 | | | | .63 | | | | 2.25 | | | | 1.49 | | | | (5.15 | ) |
| Total from investment operations | | | 1.30 | | | | .61 | | | | 2.24 | | | | 1.55 | | | | (5.10 | ) |
| Less Dividends and Distributions: | | | | | | | | | | | | | | | | | | | | |
| Dividends from net investment income | | | (.02 | ) | | | - | | | | (.03 | ) | | | (.11 | ) | | | - | |
| Distributions from net realized gains | | | - | | | | - | | | | - | | | | - | | | | (3.75 | ) |
| Total dividends and distributions | | | (.02 | ) | | | - | | | | (.03 | ) | | | (.11 | ) | | | (3.75 | ) |
| Capital Contributions(d) | | | - | | | | - | | | | - | * | | | - | | | | - | |
| Net asset value, end of year | | | $13.76 | | | | $12.48 | | | | $11.87 | | | | $9.66 | | | | $8.22 | |
| Total Return(a) | | | 10.40% | | | | 5.14% | | | | 23.20% | | | | 19.29% | | | | (36.69)% | |
| |
| Ratios/Supplemental Data: | |
| Net assets, end of year (in millions) | | | $2.5 | | | | $3.0 | | | | $4.1 | | | | $4.2 | | | | $17.0 | |
| Ratios to average net assets(c): | | | | | | | | | | | | | | | | | | | | |
| Expenses after advisory fee waiver and expense reimbursement | | | 2.42% | | | | 2.38% | | | | 2.36% | | | | 2.47% | | | | 2.28% | |
| Expenses before advisory fee waiver and expense reimbursement | | | 2.42% | | | | 2.38% | | | | 2.36% | | | | 2.47% | | | | 2.28% | |
| Net investment income (loss) | | | .40% | | | | (.12)% | | | | (.08)% | | | | .84% | | | | .43% | |
| Portfolio turnover rate | | | 25% | | | | 37% | | | | 26% | | | | 38% | | | | 37% | |
(a) Total return does not consider the effects of sales load. Total return is calculated assuming a purchase of a share on the first day and a sale on the last day of each year reported and includes reinvestment of dividends and distributions. Total returns may reflect adjustments to conform to generally accepted accounting principles. Total return includes the effect of expense subsidies.
(b) Calculated based on average shares outstanding during the year.
(c) Does not include expenses of the underlying portfolio in which the Fund invests.
(d) The Fund received payments related to a former affiliate’s settlement of regulatory proceedings involving allegations of improper trading in Fund shares during the fiscal year ended October 31, 2012. The Fund was not involved in the proceedings or in the calculation of the amount of settlement.
* Less than $.005.
See Notes to Financial Statements.
| | |
| 42 | | Visit our website at www.prudentialfunds.com |
| | | | | | | | | | | | | | | | | | | | |
| Class C Shares | |
| | | Year Ended October 31, | |
| | | 2012 | | | 2011 | | | 2010 | | | 2009 | | | 2008 | |
| Per Share Operating Performance(b): | | | | | | | | | | | | | | | | | | | | |
| Net Asset Value, Beginning Of Year | | | $12.44 | | | | $11.84 | | | | $9.63 | | | | $8.20 | | | | $17.05 | |
| Income (loss) from investment operations: | | | | | | | | | | | | | | | | | | | | |
| Net investment income (loss) | | | .05 | | | | (.02 | ) | | | (.01 | ) | | | .03 | | | | .05 | |
| Net realized and unrealized gain (loss) on investments | | | 1.25 | | | | .62 | | | | 2.25 | | | | 1.51 | | | | (5.15 | ) |
| Total from investment operations | | | 1.30 | | | | .60 | | | | 2.24 | | | | 1.54 | | | | (5.10 | ) |
| Less Dividends and Distributions: | | | | | | | | | | | | | | | | | | | | |
| Dividends from net investment income | | | (.02 | ) | | | - | | | | (.03 | ) | | | (.11 | ) | | | - | |
| Distributions from net realized gains | | | - | | | | - | | | | - | | | | - | | | | (3.75 | ) |
| Total dividends and distributions | | | (.02 | ) | | | - | | | | (.03 | ) | | | (.11 | ) | | | (3.75 | ) |
| Capital Contributions(d) | | | - | | | | - | | | | - | * | | | - | | | | - | |
| Net asset value, end of year | | | $13.72 | | | | $12.44 | | | | $11.84 | | | | $9.63 | | | | $8.20 | |
| Total Return(a) | | | 10.43% | | | | 5.07% | | | | 23.27% | | | | 19.21% | | | | (36.74)% | |
| |
| Ratios/Supplemental Data: | |
| Net assets, end of year (in millions) | | | $26.0 | | | | $27.3 | | | | $29.9 | | | | $27.8 | | | | $28.8 | |
| Ratios to average net assets(c): | | | | | | | | | | | | | | | | | | | | |
| Expenses after advisory fee waiver and expense reimbursement | | | 2.42% | | | | 2.38% | | | | 2.36% | | | | 2.47% | | | | 2.28% | |
| Expenses before advisory fee waiver and expense reimbursement | | | 2.42% | | | | 2.38% | | | | 2.36% | | | | 2.47% | | | | 2.28% | |
| Net investment income (loss) | | | .40% | | | | (.12)% | | | | (.09)% | | | | .43% | | | | .42% | |
| Portfolio turnover rate | | | 25% | | | | 37% | | | | 26% | | | | 38% | | | | 37% | |
(a) Total return does not consider the effects of sales load. Total return is calculated assuming a purchase of a share on the first day and a sale on the last day of each year reported and includes reinvestment of dividends and distributions. Total returns may reflect adjustments to conform to generally accepted accounting principles. Total return includes the effect of expense subsidies.
(b) Calculated based on average shares outstanding during the year.
(c) Does not include expenses of the underlying portfolio in which the Fund invests.
(d) The Fund received payments related to a former affiliate’s settlement of regulatory proceedings involving allegations of improper trading in Fund shares during the fiscal year ended October 31, 2012. The Fund was not involved in the proceedings or in the calculation of the amount of settlement.
* Less than $.005.
See Notes to Financial Statements.
| | | | |
| Prudential Mid-Cap Value Fund | | | 43 | |
Financial Highlights
continued
| | | | | | | | | | | | | | | | | | | | | | | | | | |
| Class L Shares | |
| | | Period Ended
August 24, | | | | | Year Ended October 31, | |
| | | 2012(f) | | | | | 2011 | | | 2010 | | | 2009 | | | 2008 | | | 2007 | |
| Per Share Operating Performance(b): | | | | | | | | | | | | | | | | | | | | | | | | | | |
| Net Asset Value, Beginning Of Period | | | $13.58 | | | | | | $12.87 | | | | $10.46 | | | | $8.91 | | | | $18.12 | | | | $18.07 | |
| Income (loss) from investment operations: | | | | | | | | | | | | | | | | | | | | | | | | | | |
| Net investment income | | | .09 | | | | | | .05 | | | | .05 | | | | .08 | | | | .12 | | | | .01 | |
| Net realized and unrealized gain (loss) on investments | | | 1.08 | | | | | | .69 | | | | 2.42 | | | | 1.63 | | | | (5.56 | ) | | | 1.66 | |
| Total from investment operations | | | 1.17 | | | | | | .74 | | | | 2.47 | | | | 1.71 | | | | (5.44 | ) | | | 1.67 | |
| Less Dividends and Distributions: | | | | | | | | | | | | | | | | | | | | | | | | | | |
| Dividends from net investment income | | | (.07 | ) | | | | | (.03 | ) | | | (.06 | ) | | | (.16 | ) | | | (.02 | ) | | | - | |
| Distributions from net realized gains | | | - | | | | | | - | | | | - | | | | - | | | | (3.75 | ) | | | (1.62 | ) |
| Total dividends and distributions | | | (.07 | ) | | | | | (.03 | ) | | | (.06 | ) | | | (.16 | ) | | | (3.77 | ) | | | (1.62 | ) |
| Capital Contributions(g) | | | - | | | | | | - | | | | - | * | | | - | | | | - | | | | - | |
| Net asset value, end of period | | | $14.68 | | | | | | $13.58 | | | | $12.87 | | | | $10.46 | | | | $8.91 | | | | $18.12 | |
| Total Return(a) | | | 8.70% | | | | | | 5.77% | | | | 23.75% | | | | 19.75% | | | | (36.41)% | | | | 9.54% | |
| |
| Ratios/Supplemental Data: | |
| Net assets, end of period (in millions) | | | $10.6 | | | | | | $10.9 | | | | $11.9 | | | | $11.5 | | | | $12.5 | | | | $29.1 | |
| Ratios to average net assets(c): | | | | | | | | | | | | | | | | | | | | | | | | | | |
| Expenses after advisory fee waiver and expense reimbursement | | | 1.93% | (d) | | | | | 1.88% | | | | 1.86% | | | | 1.97% | | | | 1.78% | | | | 1.73% | |
| Expenses before advisory fee waiver and expense reimbursement | | | 1.93% | (d) | | | | | 1.88% | | | | 1.86% | | | | 1.97% | | | | 1.78% | | | | 1.73% | |
| Net investment income | | | .81% | (d) | | | | | .38% | | | | .41% | | | | .94% | | | | .93% | | | | .08% | |
| Portfolio turnover rate | | | 25% | (e) | | | | | 37% | | | | 26% | | | | 38% | | | | 37% | | | | 78% | |
(a) Total return does not consider the effects of sales load. Total return is calculated assuming a purchase of a share on the first day and a sale on the last day of each period reported and includes reinvestment of dividends and distributions. Total returns may reflect adjustments to conform to generally accepted accounting principles. Total return includes the effect of expense subsidies. Total returns for periods less than one full year are not annualized.
(b) Calculated based on average shares outstanding during the year.
(c) Does not include expenses of the underlying portfolio in which the Fund invests.
(d) Annualized.
(e) Not Annualized.
(f) End of operations.
(g) The Fund received payments related to a former affiliate’s settlement of regulatory proceedings involving allegations of improper trading in Fund shares during the fiscal year ended October 31, 2012. The Fund was not involved in the proceedings or in the calculation of the amount of settlement.
* Less than $.005.
See Notes to Financial Statements.
| | |
| 44 | | Visit our website at www.prudentialfunds.com |
| | | | | | | | | | | | | | | | | | | | | | | | | | |
| Class M Shares | |
| | | Period Ended
April 13, | | | | | Year Ended October 31, | |
| | | 2012(h) | | | | | 2011 | | | 2010 | | | 2009 | | | 2008 | | | 2007(e) | |
| Per Share Operating Performance(b): | | | | | | | | | | | | | | | | | | | | | | | | | | |
| Net Asset Value, Beginning Of Period | | | $12.63 | | | | | | $11.98 | | | | $9.73 | | | | $8.27 | | | | $17.06 | | | | $17.16 | |
| Income (loss) from investment operations: | | | | | | | | | | | | | | | | | | | | | | | | | | |
| Net investment income | | | .08 | | | | | | .09 | | | | .08 | | | | .11 | | | | .14 | | | | .02 | |
| Net realized and unrealized gain (loss) on investments | | | .70 | | | | | | .62 | | | | 2.25 | | | | 1.50 | | | | (5.10 | ) | | | 1.60 | |
| Total from investment operations | | | .78 | | | | | | .71 | | | | 2.33 | | | | 1.61 | | | | (4.96 | ) | | | 1.62 | |
| Less Dividends and Distributions: | | | | | | | | | | | | | | | | | | | | | | | | | | |
| Dividends from net investment income | | | (.11 | ) | | | | | (.06 | ) | | | (.09 | ) | | | (.18 | ) | | | - | | | | - | |
| Distributions from net realized gains | | | - | | | | | | - | | | | - | | | | - | | | | (3.84 | ) | | | (1.74 | ) |
| Total dividends and distributions | | | (.11 | ) | | | | | (.06 | ) | | | (.09 | ) | | | (.18 | ) | | | (3.84 | ) | | | (1.74 | ) |
| Capital Contributions (Note 3)(i) | | | - | | | | | | - | * | | | .01 | | | | .03 | | | | .01 | | | | .02 | |
| Net asset value, end of period | | | $13.30 | | | | | | $12.63 | | | | $11.98 | | | | $9.73 | | | | $8.27 | | | | $17.06 | |
| Total Return(a) | | | 6.23% | | | | | | 5.97% | | | | 24.19% | | | | 20.42% | | | | (35.54)% | | | | 9.92% | (c) |
| |
| Ratios/Supplemental Data: | |
| Net assets, end of period (in millions) | | | $.1 | | | | | | $1.0 | | | | $4.0 | | | | $9.5 | | | | $20.3 | | | | $69.7 | |
| Ratios to average net assets(d): | | | | | | | | | | | | | | | | | | | | | | | | | | |
| Expenses after advisory fee waiver and expense reimbursement | | | 1.64% | (f) | | | | | 1.63% | | | | 1.61% | | | | 1.72% | | | | 1.67% | | | | 1.69% | |
| Expenses before advisory fee waiver and expense reimbursement | | | 1.64% | (f) | | | | | 1.63% | | | | 1.61% | | | | 1.72% | | | | 1.67% | | | | 1.69% | |
| Net investment income | | | 1.30% | (f) | | | | | .66% | | | | .74% | | | | 1.39% | | | | 1.17% | | | | .11% | |
| Portfolio turnover rate | | | 25% | (g) | | | | | 37% | | | | 26% | | | | 38% | | | | 37% | | | | 78% | |
(a) Total return does not consider the effects of sales load. Total return is calculated assuming a purchase of a share on the first day and a sale on the last day of each period reported and includes reinvestment of dividends and distributions. Total returns may reflect adjustments to conform to generally accepted accounting principles. Total return includes the effect of expense subsidies. Total returns for periods less than one full year are not annualized.
(b) Calculated based on average shares outstanding during the period.
(c) Total return has been adjusted to reflect the manager payment for sales charges in excess of regulatory limits. If the manager had not adjusted the Fund, the total return would have been 8.95% for the year ended October 31, 2007.
(d) Does not include expenses of the underlying portfolio in which the Fund invests.
(e) Certain information has been adjusted to reflect a manager payment for sales charges incurred by shareholders in excess of regulatory limits. If the manager had not adjusted the Fund, the per share operating performance would reflect a net investment loss, net realized and unrealized gain on investments and distributions from net unrealized gains of $(.07), $1.56 and $(1.62), respectively. Furthermore, the annual expenses (both after and before fee waiver and expense reimbursement) and net investment income ratios would have been 2.23%, 2.23% and (.43)%, respectively and the ending net asset value would be $17.03 for the year ended October 31, 2007.
(f) Annualized.
(g) Not Annualized.
(h) End of operations.
(i) The Fund received payments related to a former affiliate’s settlement of regulatory proceedings involving allegations of improper trading in Fund shares during the fiscal year ended October 31, 2012. The Fund was not involved in the proceedings or in the calculation of the amount of settlement.
* Less than $.005.
See Notes to Financial Statements.
| | | | |
| Prudential Mid-Cap Value Fund | | | 45 | |
Financial Highlights
continued
| | | | | | | | | | |
| Class Q Shares | |
| | | Year Ended
October 31, | | | | | January 18,
2011(d)
through
October 31, | |
| | | 2012 | | | | | 2011 | |
| Per Share Operating Performance(b): | | | | | | | | | | |
| Net Asset Value, Beginning Of Period | | | $13.95 | | | | | | $14.50 | |
| Income (loss) from investment operations: | | | | | | | | | | |
| Net investment income | | | .24 | | | | | | .11 | |
| Net realized and unrealized gain (loss) on investments | | | 1.38 | | | | | | (.66 | ) |
| Total from investment operations | | | 1.62 | | | | | | (.55 | ) |
| Less Dividends and Distributions: | | | | | | | | | | |
| Dividends from net investment income | | | (.18 | ) | | | | | - | |
| Distributions from net realized gains | | | - | | | | | | - | |
| Total dividends and distributions | | | (.18 | ) | | | | | - | |
| Net asset value, end of period | | | $15.39 | | | | | | $13.95 | |
| Total Return(a) | | | 11.80% | | | | | | (3.79)% | |
| |
| Ratios/Supplemental Data: | |
| Net assets, end of period (in millions) | | | $5.7 | | | | | | $12.7 | |
| Ratios to average net assets(c): | | | | | | | | | | |
| Expenses after advisory fee waiver and expense reimbursement | | | 1.14% | | | | | | 1.13% | (e) |
| Expenses before advisory fee waiver and expense reimbursement | | | 1.14% | | | | | | 1.13% | (e) |
| Net investment income | | | 1.67% | | | | | | .99% | (e) |
| Portfolio turnover rate | | | 25% | | | | | | 37% | |
(a) Total return is calculated assuming a purchase of a share on the first day and a sale on the last day of each period reported and includes reinvestment of dividends and distributions. Total returns may reflect adjustments to conform to generally accepted accounting principles. Total return includes the effect of expense subsidies. Total returns for periods less than one full year are not annualized.
(b) Calculated based on average shares outstanding during the period.
(c) Does not include expenses of the underlying portfolio in which the Fund invests.
(d) Commencement of operations.
(e) Annualized.
See Notes to Financial Statements.
| | |
| 46 | | Visit our website at www.prudentialfunds.com |
| | | | | | | | | | | | | | | | | | | | |
| Class X Shares | |
| | | Year Ended October 31, | |
| | | 2012 | | | 2011 | | | 2010 | | | 2009 | | | 2008 | |
| Per Share Operating Performance(b): | | | | | | | | | | | | | | | | | | | | |
| Net Asset Value, Beginning Of Year | | | $12.70 | | | | $12.05 | | | | $9.79 | | | | $8.37 | | | | $17.29 | |
| Income (loss) from investment operations: | | | | | | | | | | | | | | | | | | | | |
| Net investment income | | | .15 | | | �� | .09 | | | | .08 | | | | .10 | | | | .15 | |
| Net realized and unrealized gain (loss) on investments | | | 1.27 | | | | .62 | | | | 2.26 | | | | 1.52 | | | | (5.21 | ) |
| Total from investment operations | | | 1.42 | | | | .71 | | | | 2.34 | | | | 1.62 | | | | (5.06 | ) |
| Less Dividends and Distributions: | | | | | | | | | | | | | | | | | | | | |
| Dividends from net investment income | | | (.11 | ) | | | (.06 | ) | | | (.09 | ) | | | (.21 | ) | | | (.11 | ) |
| Distributions from net realized gains | | | - | | | | - | | | | - | | | | - | | | | (3.75 | ) |
| Total dividends and distributions | | | (.11 | ) | | | (.06 | ) | | | (.09 | ) | | | (.21 | ) | | | (3.86 | ) |
| Capital Contributions (Note 3)(d) | | | - | * | | | - | * | | | .01 | | | | .01 | | | | - | * |
| Net asset value, end of year | | | $14.01 | | | | $12.70 | | | | $12.05 | | | | $9.79 | | | | $8.37 | |
| Total Return(a) | | | 11.28% | | | | 5.93% | | | | 24.15% | | | | 20.15% | | | | (36.07)% | |
| |
| Ratios/Supplemental Data: | |
| Net assets, end of year (in millions) | | | $1.0 | | | | $1.9 | | | | $4.1 | | | | $5.3 | | | | $6.9 | |
| Ratios to average net assets(c): | | | | | | | | | | | | | | | | | | | | |
| Expenses after advisory fee waiver and expense reimbursement | | | 1.67% | | | | 1.63% | | | | 1.61% | | | | 1.72% | | | | 1.48% | |
| Expenses before advisory fee waiver and expense reimbursement | | | 1.67% | | | | 1.63% | | | | 1.61% | | | | 1.72% | | | | 1.48% | |
| Net investment income | | | 1.13% | | | | .65% | | | | .69% | | | | 1.24% | | | | 1.23% | |
| Portfolio turnover rate | | | 25% | | | | 37% | | | | 26% | | | | 38% | | | | 37% | |
(a) Total return does not consider the effects of sales load. Total return is calculated assuming a purchase of a share on the first day and a sale on the last day of each year reported and includes reinvestment of dividends and distributions. Total returns may reflect adjustments to conform to generally accepted accounting principles. Total return includes the effect of expense subsidies.
(b) Calculated based on average shares outstanding during the year.
(c) Does not include expenses of the underlying portfolio in which the Fund invests.
(d) The Fund received payments related to a former affiliate’s settlement of regulatory proceedings involving allegations of improper trading in Fund shares during the fiscal year ended October 31, 2012. The Fund was not involved in the proceedings or in the calculation of the amount of settlement.
* Less than $.005.
See Notes to Financial Statements.
| | | | |
| Prudential Mid-Cap Value Fund | | | 47 | |
Financial Highlights
continued
| | | | | | | | | | | | | | | | | | | | |
| Class Z Shares | |
| | | Year Ended October 31, | |
| | | 2012 | | | 2011 | | | 2010 | | | 2009 | | | 2008 | |
| Per Share Operating Performance(b): | | | | | | | | | | | | | | | | | | | | |
| Net Asset Value, Beginning Of Year | | | $13.94 | | | | $13.21 | | | | $10.72 | | | | $9.14 | | | | $18.50 | |
| Income (loss) from investment operations: | | | | | | | | | | | | | | | | | | | | |
| Net investment income | | | .20 | | | | .15 | | | | .11 | | | | .11 | | | | .18 | |
| Net realized and unrealized gain (loss) on investments | | | 1.38 | | | | .67 | | | | 2.49 | | | | 1.69 | | | | (5.68 | ) |
| Total from investment operations | | | 1.58 | | | | .82 | | | | 2.60 | | | | 1.80 | | | | (5.50 | ) |
| Less Dividends and Distributions: | | | | | | | | | | | | | | | | | | | | |
| Dividends from net investment income | | | (.14 | ) | | | (.09 | ) | | | (.11 | ) | | | (.22 | ) | | | (.11 | ) |
| Distributions from net realized gains | | | - | | | | - | | | | - | | | | - | | | | (3.75 | ) |
| Total dividends and distributions | | | (.14 | ) | | | (.09 | ) | | | (.11 | ) | | | (.22 | ) | | | (3.86 | ) |
| Capital Contributions(d) | | | - | | | | - | | | | - | * | | | - | | | | - | |
| Net asset value, end of year | | | $15.38 | | | | $13.94 | | | | $13.21 | | | | $10.72 | | | | $9.14 | |
| Total Return(a) | | | 11.51% | | | | 6.26% | | | | 24.43% | | | | 20.41% | | | | (36.08)% | |
| |
| Ratios/Supplemental Data: | |
| Net assets, end of year (in millions) | | | $6.1 | | | | $5.0 | | | | $16.8 | | | | $16.2 | | | | $8.2 | |
| Ratios to average net assets(c): | | | | | | | | | | | | | | | | | | | | |
| Expenses after advisory fee waiver and expense reimbursement | | | 1.42% | | | | 1.38% | | | | 1.36% | | | | 1.47% | | | | 1.28% | |
| Expenses before advisory fee waiver and expense reimbursement | | | 1.42% | | | | 1.38% | | | | 1.36% | | | | 1.47% | | | | 1.28% | |
| Net investment income | | | 1.39% | | | | 1.07% | | | | .90% | | | | 1.18% | | | | 1.43% | |
| Portfolio turnover rate | | | 25% | | | | 37% | | | | 26% | | | | 38% | | | | 37% | |
(a) Total return is calculated assuming a purchase of a share on the first day and a sale on the last day of each year reported and includes reinvestment of dividends and distributions. Total returns may reflect adjustments to conform to generally accepted accounting principles. Total return includes the effect of expense subsidies.
(b) Calculated based on average shares outstanding during the year.
(c) Does not include expenses of the underlying portfolio in which the Fund invests.
(d) The Fund received payments related to a former affiliate’s settlement of regulatory proceedings involving allegations of improper trading in Fund shares during the fiscal year ended October 31, 2012. The Fund was not involved in the proceedings or in the calculation of the amount of settlement.
* Less than $.005.
See Notes to Financial Statements.
| | |
| 48 | | Visit our website at www.prudentialfunds.com |
Report of Independent Registered Public
Accounting Firm
The Board of Directors and Shareholders
Prudential Investment Portfolios, Inc. 10:
We have audited the accompanying statement of assets and liabilities of Prudential Mid Cap Value Fund, a series of Prudential Investment Portfolios, Inc. 10 (hereafter referred to as the “Fund”), including the portfolio of investments, as of October 31, 2012, and the related statement of operations for the year then ended, the statement of changes in net assets for each of the years in the two-year period then ended and the financial highlights for each of the years in the five-year period then ended. These financial statements and financial highlights are the responsibility of the Fund’s management. Our responsibility is to express an opinion on these financial statements and financial highlights based on our audits.
We conducted our audits in accordance with the standards of the Public Company Accounting Oversight Board (United States). Those standards require that we plan and perform the audit to obtain reasonable assurance about whether the financial statements and financial highlights are free of material misstatement. An audit includes examining, on a test basis, evidence supporting the amounts and disclosures in the financial statements. Our procedures included confirmation of securities owned as of October 31, 2012, by correspondence with the custodian, transfer agent and brokers or by other appropriate auditing procedures when replies from brokers were not received. An audit also includes assessing the accounting principles used and significant estimates made by management, as well as evaluating the overall financial statement presentation. We believe that our audits provide a reasonable basis for our opinion.
In our opinion, the financial statements and financial highlights referred to above present fairly, in all material respects, the financial position of the Fund as of October 31, 2012, and the results of its operations for the year then ended, the changes in its net assets for each of the years in the two-year period then ended and the financial highlights for each of the years in the five-year period then ended, in conformity with U.S. generally accepted accounting principles.

New York, New York
December 21, 2012
| | | | |
| Prudential Mid-Cap Value Fund | | | 49 | |
Tax Information
(Unaudited)
For the year ended October 31, 2012, the Fund reports, in accordance with Section 854 of the Internal Revenue Code, the following percentages of the ordinary income distributions paid as 1) qualified dividend income (QDI); and 2) eligible for corporate dividends received deduction (DRD):
| | | | | | | | |
| | | QDI | | | DRD | |
| | |
Prudential Mid-Cap Value Fund | | | 100% | | | | 100% | |
In January 2013, you will be advised on IRS Form 1099-DIV or substitute 1099-DIV as to the federal tax status of distributions received by you in calendar year 2012.
| | |
| 50 | | Visit our website at www.prudentialfunds.com |
INFORMATION ABOUT BOARD MEMBERS AND OFFICERS
(Unaudited)
Information about Board Members and Officers of the Fund is set forth below. Board Members who are not deemed to be “interested persons” of the Fund, as defined in the 1940 Act, are referred to as “Independent Board Members.” Board Members who are deemed to be “interested persons” of the Fund are referred to as “Interested Board Members.” The Board Members are responsible for the overall supervision of the operations of the Fund and perform the various duties imposed on the directors of investment companies by the 1940 Act. The Board in turn elects the Officers, who are responsible for administering the day-to-day operations of the Fund.
| | | | |
| Independent Board Members(1) |
Name, Address, Age Position(s) Portfolios Overseen | | Principal Occupation(s) During Past Five Years | | Other Directorships Held |
Kevin J. Bannon (60) Board Member Portfolios Overseen: 63 | | Managing Director (since April 2008) and Chief Investment Officer (since October 2008) of Highmount Capital LLC (registered investment adviser); formerly Executive Vice President and Chief Investment Officer (April 1993-August 2007) of Bank of New York Company; President (May 2003-May 2007) of BNY Hamilton Family of Mutual Funds. | | Director of Urstadt Biddle Properties (since September 2008). |
Linda W. Bynoe (60) Board Member Portfolios Overseen: 63 | | President and Chief Executive Officer (since March 1995) and formerly Chief Operating Officer (December 1989-February 1995) of Telemat Ltd. (management consulting); formerly Vice President (January 1985-June 1989) at Morgan Stanley & Co (broker-dealer). | | Director of Simon Property Group, Inc. (retail real estate) (May 2003-May 2012); Director of Anixter International, Inc. (communication products distributor) (since January 2006); Director of Northern Trust Corporation (financial services) (since April 2006); Trustee of Equity Residential (residential real estate) (since December 2009). |
Michael S. Hyland, CFA (67) Board Member Portfolios Overseen: 63 | | Independent Consultant (since February 2005); formerly Senior Managing Director (July 2001-February 2005) of Bear Stearns & Co, Inc.; Global Partner, INVESCO (1999-2001); Managing Director and President of Salomon Brothers Asset Management (1989-1999). | | None. |
Douglas H. McCorkindale (73) Board Member Portfolios Overseen: 63 | | Formerly Chairman (February 2001-June 2006), Chief Executive Officer (June 2000-July 2005), President (September 1997-July 2005) and Vice Chairman (March 1984-May 2000) of Gannett Co. Inc. (publishing and media). | | Director of Lockheed Martin Corp. (aerospace and defense) (since May 2001). |
Prudential Mid-Cap Value Fund
| | | | |
| Independent Board Members(1) |
Name, Address, Age Position(s) Portfolios Overseen | | Principal Occupation(s) During Past Five Years | | Other Directorships Held |
Stephen P. Munn (70) Board Member Portfolios Overseen: 63 | | Lead Director (since 2007) and formerly Chairman (1993-2007) of Carlisle Companies Incorporated (manufacturer of industrial products). | | Lead Director (since 2007) of Carlisle Companies Incorporated (manufacturer of industrial products). |
Richard A. Redeker (69) Board Member & Independent Chair Portfolios Overseen: 63 | | Retired Mutual Fund Senior Executive (44 years); Management Consultant; Independent Directors Council (organization of 2,800 Independent Mutual Fund Directors)-Executive Committee, Chair of Policy Steering Committee, Governing Council. | | None. |
Robin B. Smith (73) Board Member Portfolios Overseen: 63 | | Chairman of the Board (since January 2003) of Publishers Clearing House (direct marketing); Member of the Board of Directors of ADLPartner (marketing) (since December 2010); formerly Chairman and Chief Executive Officer (August 1996-January 2003) of Publishers Clearing House. | | Formerly Director of BellSouth Corporation (telecommunications) (1992-2006). |
Stephen G. Stoneburn (69) Board Member Portfolios Overseen: 63 | | Chairman, (since July 2011), President and Chief Executive Officer (since June 1996) of Quadrant Media Corp. (publishing company); formerly President (June 1995-June 1996) of Argus Integrated Media, Inc.; Senior Vice President and Managing Director (January 1993-1995) of Cowles Business Media; Senior Vice President of Fairchild Publications, Inc. (1975-1989). | | None. |
| | | | |
| Interested Board Members(1) |
Name, Address, Age Position(s) Portfolios Overseen | | Principal Occupation(s) During Past Five Years | | Other Directorships Held |
Stuart S. Parker (50) Board Member & President Portfolios Overseen: 63 | | President of Prudential Investments LLC (since January 2012); Executive Vice President of Jennison Associates LLC and Head of Retail Distribution of Prudential Investments LLC (June 2005 - December 2011). | | None. |
Visit our website at www.prudentialfunds.com
| | | | |
| Interested Board Members(1) |
Name, Address, Age Position(s) Portfolios Overseen | | Principal Occupation(s) During Past Five Years | | Other Directorships Held |
Scott E. Benjamin (39) Board Member & Vice President Portfolios Overseen: 63 | | Executive Vice President (since June 2009) of Prudential Investments LLC; Executive Vice President (June 2009-June 2012) and Vice President (since June 2012) of Prudential Investment Management Services LLC; Executive Vice President (since September 2009) of AST Investment Services, Inc.; Senior Vice President of Product Development and Marketing, Prudential Investments (since February 2006); Vice President of Product Development and Product Management, Prudential Investments (2003-2006). | | None. |
(1) The year in which each individual joined the Fund’s Board is as follows:
Linda W. Bynoe, 2005; Douglas H. McCorkindale, 2003, Richard A. Redeker, 2003; Robin B. Smith, 2003; Stephen G. Stoneburn, 2003; Kevin J. Bannon, 2008; Michael S. Hyland, 2008; Stephen P. Munn, 2008; Stuart S. Parker, Board Member and President since 2012; Scott E. Benjamin, Board Member since 2010 and Vice President since 2009.
| | |
| Fund Officers(a)(1) |
Name, Address and Age Position with Fund | | Principal Occupation(s) During Past Five Years |
Judy A. Rice (64) Vice President | | Chairman of Prudential Investments LLC (since January 2012); President, Chief Executive Officer (May 2011-Present) and Executive Vice President (December 2008-May 2011) of Prudential Investment Management Services LLC; formerly President, Chief Executive Officer, Chief Operating Officer and Officer-In-Charge (February 2003-December 2011) of Prudential Investments LLC; formerly President, Chief Executive Officer and Officer-In-Charge (April 2003-December 2011) of Prudential Mutual Fund Services LLC (PMFS); formerly Member of the Board of Directors of Jennison Associates LLC (November 2010-December 2011); formerly Vice President (February 1999-April 2006) of Prudential Investment Management Services LLC; formerly President, COO, CEO and Manager of PIFM Holdco, LLC (April 2006-December 2011); formerly President, Chief Executive Officer, Chief Operating Officer and Officer-In-Charge (May 2003-June 2005) and Director (May 2003-March 2006) and Executive Vice President (June 2005-March 2006) of AST Investment Services, Inc.; Member of Board of Governors of the Investment Company Institute. |
Prudential Mid-Cap Value Fund
| | |
| Fund Officers(a)(1) |
Name, Address and Age Position with Fund | | Principal Occupation(s) During Past Five Years |
Raymond A. O’Hara (57) Chief Legal Officer | | Vice President and Corporate Counsel (since July 2010) of Prudential Insurance Company of America (Prudential); Vice President (March 2011-Present) of Pruco Life Insurance Company and Pruco Life Insurance Company of New Jersey; Vice President and Corporate Counsel (March 2011-Present) of Prudential Annuities Life Assurance Corporation; Chief Legal Officer of Prudential Investments LLC (since June 2012); Chief Legal Officer of PMFS (since June 2012) and Corporate Counsel of AST Investment Services, Inc. (since June 2012); formerly Assistant Vice President and Corporate Counsel (September 2008-July 2010) of The Hartford Financial Services Group, Inc.; formerly Associate (September 1980-December 1987) and Partner (January 1988–August 2008) of Blazzard & Hasenauer, P.C. (formerly, Blazzard, Grodd & Hasenauer, P.C.). |
Deborah A. Docs (54) Secretary | | Vice President and Corporate Counsel (since January 2001) of Prudential; Vice President (since December 1996) and Assistant Secretary (since March 1999) of Prudential Investments LLC; formerly Vice President and Assistant Secretary (May 2003-June 2005) of AST Investment Services, Inc. |
Jonathan D. Shain (54) Assistant Secretary | | Vice President and Corporate Counsel (since August 1998) of Prudential; Vice President and Assistant Secretary (since May 2001) of Prudential Investments LLC; Vice President and Assistant Secretary (since February 2001) of PMFS; formerly Vice President and Assistant Secretary (May 2003-June 2005) of AST Investment Services, Inc. |
Claudia DiGiacomo (38) Assistant Secretary | | Vice President and Corporate Counsel (since January 2005) of Prudential; Vice President and Assistant Secretary of Prudential Investments LLC (since December 2005); Associate at Sidley Austin Brown & Wood LLP (1999-2004). |
Andrew R. French (50) Assistant Secretary | | Vice President and Corporate Counsel (since February 2010) of Prudential; formerly Director and Corporate Counsel (2006-2010) of Prudential; Vice President and Assistant Secretary (since January 2007) of Prudential Investments LLC; Vice President and Assistant Secretary (since January 2007) of PMFS. |
Amanda S. Ryan (34) Assistant Secretary | | Director and Corporate Counsel (since March 2012) of Prudential; Director and Assistant Secretary (since June 2012) of Prudential Investments LLC; Associate at Ropes & Gray (2008-2012). |
Timothy J. Knierim (53) Chief Compliance Officer | | Chief Compliance Officer of Prudential Investment Management, Inc. (since July 2007); formerly Chief Risk Officer of Prudential Investment Management, Inc. and Prudential Investments LLC (2002-2007) and formerly Chief Ethics Officer of Prudential Investment Management, Inc. and Prudential Investments LLC (2006-2007). |
Valerie M. Simpson (54) Deputy Chief Compliance Officer | | Chief Compliance Officer (since April 2007) of Prudential Investments LLC and AST Investment Services, Inc.; formerly Vice President-Financial Reporting (June 1999-March 2006) for Prudential Life and Annuities Finance. |
Visit our website at www.prudentialfunds.com
| | |
| Fund Officers(a)(1) |
Name, Address and Age Position with Fund | | Principal Occupation(s) During Past Five Years |
Theresa C. Thompson (50) Deputy Chief Compliance Officer | | Vice President, Compliance, Prudential Investments LLC (since April 2004); and Director, Compliance, Prudential Investments LLC (2001-2004). |
Richard W. Kinville (44) Anti-Money Laundering Compliance Officer | | Vice President, Corporate Compliance, Anti-Money Laundering Unit (since January 2005) of Prudential; committee member of the American Council of Life Insurers Anti-Money Laundering and Critical Infrastructure Committee (since January 2007); formerly Investigator and Supervisor in the Special Investigations Unit for the New York Central Mutual Fire Insurance Company (August 1994-January 1999); Investigator in AXA Financial’s Internal Audit Department and Manager in AXA’s Anti-Money Laundering Office (January 1999-January 2005); first chair of the American Council of Life Insurers Anti-Money Laundering and Critical Infrastructure Committee (June 2007-December 2009). |
Grace C. Torres (53) Treasurer and Principal Financial and Accounting Officer | | Assistant Treasurer (since March 1999) and Senior Vice President (since September 1999) of Prudential Investments LLC; Assistant Treasurer (since May 2003) and Vice President (since June 2005) of AST Investment Services, Inc.; Senior Vice President and Assistant Treasurer (since May 2003) of Prudential Annuities Advisory Services, Inc.; formerly Senior Vice President (May 2003-June 2005) of AST Investment Services, Inc. |
M. Sadiq Peshimam (48) Assistant Treasurer | | Vice President (since 2005) of Prudential Investments LLC. |
Peter Parrella (54) Assistant Treasurer | | Vice President (since 2007) and Director (2004-2007) within Prudential Mutual Fund Administration; formerly Tax Manager at SSB Citi Fund Management LLC (1997-2004). |
(a) Excludes Mr. Parker and Mr. Benjamin, interested Board Members who also serve as President and Vice President, respectively.
(1) The year in which each individual became an Officer of the Fund is as follows:
Judy A. Rice, 2012; Raymond A. O’Hara, 2012; Deborah A. Docs, 2003; Jonathan D. Shain, 2003; Claudia DiGiacomo, 2005; Andrew R. French, 2006; Amanda S. Ryan, 2012; Timothy J. Knierim, 2007; Valerie M. Simpson, 2007; Theresa C. Thompson, 2008; Richard W. Kinville, 2011; Grace C. Torres, 2003; Peter Parrella, 2007; M. Sadiq Peshimam, 2006.
Explanatory Notes to Tables:
| | n | Board Members are deemed to be “Interested,” as defined in the 1940 Act, by reason of their affiliation with Prudential Investments LLC and/or an affiliate of Prudential Investments LLC. |
| | n | Unless otherwise noted, the address of all Board Members and Officers is c/o Prudential Investments LLC, Gateway Center Three, 100 Mulberry Street, Newark, New Jersey 07102-4077. |
| | n | There is no set term of office for Board Members or Officers. The Board Members have adopted a retirement policy, which calls for the retirement of Board Members on December 31 of the year in which they reach the age of 75. |
| | n | “Other Directorships Held” includes only directorships of companies required to register or file reports with the SEC under the 1934 Act (that is, “public companies”) or other investment companies registered under the 1940 Act. |
| | n | “Portfolios Overseen” includes all investment companies managed by Prudential Investments LLC. The investment companies for which PI serves as manager include the Prudential Investments Mutual Funds, The Prudential Variable Contract Accounts, Target Mutual Funds, Prudential Short Duration High Yield Fund, Inc., The Prudential Series Fund, Prudential’s Gibraltar Fund, Inc. and the Advanced Series Trust. |
Prudential Mid-Cap Value Fund
Approval of Advisory Agreements
The Fund’s Board of Directors
The Board of Directors (the “Board”) of Prudential Mid Cap Value Fund (the “Fund”)1 consists of ten individuals, eight of whom are not “interested persons” of the Fund, as defined in the Investment Company Act of 1940, as amended (the “1940 Act”) (the “Independent Directors”). The Board is responsible for the oversight of the Fund and its operations, and performs the various duties imposed on the directors of investment companies by the 1940 Act. The Independent Directors have retained independent legal counsel to assist them in connection with their duties. The Chair of the Board is an Independent Director. The Board has established three standing committees: the Audit Committee, the Nominating and Governance Committee, and the Investment Committee. Each committee is chaired by, and composed of, Independent Directors.
Annual Approval of the Fund’s Advisory Agreements
As required under the 1940 Act, the Board determines annually whether to renew the Fund’s management agreement with Prudential Investments LLC (“PI”) and the Fund’s subadvisory agreement with Quantitative Management Associates LLC (“QMA”). In considering the renewal of the agreements, the Board, including all of the Independent Directors, met on June 5-7, 2012 and approved the renewal of the agreements through July 31, 2013, after concluding that the renewal of the agreements was in the best interests of the Fund and its shareholders.
In advance of the meetings, the Board requested and received materials relating to the agreements, and had the opportunity to ask questions and request further information in connection with its consideration. Among other things, the Board considered comparative fee information from PI and QMA. Also, the Board considered comparisons with other mutual funds in relevant Peer Universes and Peer Groups, as is further discussed below.
In approving the agreements, the Board, including the Independent Directors advised by independent legal counsel, considered the factors it deemed relevant, including the nature, quality and extent of services provided by PI and the subadviser, the performance of the Fund, the profitability of PI and its affiliates, expenses and fees, and the potential for economies of scale that may be shared with the Fund and its shareholders as the Fund’s assets grow. In their deliberations, the Directors did not identify any single factor which alone was responsible for the Board’s decision to approve the agreements with respect to the Fund. In connection with its deliberations, the Board considered information provided by PI throughout the year at regular Board meetings, presentations from portfolio managers and other information, as well as information furnished at or in advance of the meetings on June 5-7, 2012.
| 1 | Prudential Mid Cap Value Fund is a series of Prudential Investment Portfolios, Inc. 10 |
Prudential Mid-Cap Value Fund
Approval of Advisory Agreements (continued)
The Directors determined that the overall arrangements between the Fund and PI, which serves as the Fund’s investment manager pursuant to a management agreement, and between PI and QMA, which serves as the Fund’s subadviser pursuant to the terms of a subadvisory agreement with PI, are in the best interests of the Fund and its shareholders in light of the services performed, fees charged and such other matters as the Directors considered relevant in the exercise of their business judgment.
The material factors and conclusions that formed the basis for the Directors’ reaching their determinations to approve the continuance of the agreements are separately discussed below.
Nature, Quality and Extent of Services
The Board received and considered information regarding the nature, quality and extent of services provided to the Fund by PI and QMA. The Board considered the services provided by PI, including but not limited to the oversight of the subadviser for the Fund, as well as the provision of fund recordkeeping, compliance, and other services to the Fund. With respect to PI’s oversight of the subadviser, the Board noted that PI’s Strategic Investment Research Group (“SIRG”), which is a business unit of PI, is responsible for monitoring and reporting to PI’s senior management on the performance and operations of the subadviser. The Board also considered that PI pays the salaries of all of the officers and non-independent Directors of the Fund. The Board also considered the investment subadvisory services provided by QMA, as well as adherence to the Fund’s investment restrictions and compliance with applicable Fund policies and procedures. The Board considered PI’s evaluation of the subadviser, as well as PI’s recommendation, based on its review of the subadviser, to renew the subadvisory agreement.
The Board reviewed the qualifications, backgrounds and responsibilities of PI’s senior management responsible for the oversight of the Fund and QMA, and also reviewed the qualifications, backgrounds and responsibilities of the QMA portfolio managers who are responsible for the day-to-day management of the Fund’s portfolio. The Board was provided with information pertaining to PI’s and QMA’s organizational structure, senior management, investment operations, and other relevant information pertaining to PI and QMA. The Board also noted that it received favorable compliance reports from the Fund’s Chief Compliance Officer (“CCO”) as to each of PI and QMA. The Board noted that QMA is affiliated with PI.
The Board concluded that it was satisfied with the nature, extent and quality of the investment management services provided by PI and the subadvisory services provided to the Fund by QMA, and that there was a reasonable basis on which to
Visit our website at www.prudentialfunds.com
conclude that the Fund benefits from the services provided by PI and QMA under the management and subadvisory agreements.
Costs of Services and Profits Realized by PI
The Board was provided with information on the profitability of PI and its affiliates in serving as the Fund’s investment manager. The Board discussed with PI the methodology utilized in assembling the information regarding profitability and considered its reasonableness. The Board recognized that it is difficult to make comparisons of profitability from fund management contracts because comparative information is not generally publicly available and is affected by numerous factors, including the structure of the particular adviser, the types of funds it manages, its business mix, numerous assumptions regarding allocations and the adviser’s capital structure and cost of capital. The Board did not separately consider the profitability of the subadviser, an affiliate of PI, as its profitability was reflected in the profitability report for PI. Taking these factors into account, the Board concluded that the profitability of PI and its affiliates in relation to the services rendered was not unreasonable.
Economies of Scale
The Board received and discussed information concerning whether PI realizes economies of scale as the Fund’s assets grow beyond current levels. The Board noted that the management fee schedule for the Fund includes breakpoints, which have the effect of decreasing the fee rate as assets increase, but at the current level of assets, the Fund does not realize the effect of those rate reductions. The Board took note that the Fund’s fee structure would result in benefits to Fund shareholders when (and if) assets reach the levels at which the fee rate is reduced. These benefits will accrue whether or not PI is then realizing any economies of scale. The Board recognized the inherent limitations of any analysis of economies of scale, stemming largely from the Board’s understanding that most of PI’s costs are not specific to individual funds, but rather are incurred across a variety of products and services.
Other Benefits to PI and QMA
The Board considered potential ancillary benefits that might be received by PI and QMA and their affiliates as a result of their relationship with the Fund. The Board concluded that potential benefits to be derived by PI included fees received by affiliates of PI for serving as the Fund’s securities lending agent, transfer agency fees received by the Fund’s transfer agent (which is affiliated with PI), and benefits to its reputation as well as other intangible benefits resulting from PI’s association with the Fund. The Board concluded that the potential benefits to be derived by QMA included its ability to use soft dollar credits, as well as the potential benefits consistent
Prudential Mid-Cap Value Fund
Approval of Advisory Agreements (continued)
with those generally resulting from an increase in assets under management, specifically, potential access to additional research resources and benefits to its reputation. The Board concluded that the benefits derived by PI and QMA were consistent with the types of benefits generally derived by investment managers and subadvisers to mutual funds.
Performance of the Fund / Fees and Expenses
The Board considered certain additional specific factors and made related conclusions relating to the historical performance of the Fund for the one-, three- and five-year periods ended December 31, 2011.
The Board also considered the Fund’s actual management fee, as well as the Fund’s net total expense ratio, for the fiscal year ended October 31, 2011. The Board considered the management fee for the Fund as compared to the management fee charged by PI to other funds and the fee charged by other advisers to comparable mutual funds in a Peer Group. The actual management fee represents the fee rate actually paid by Fund shareholders and includes any fee waivers or reimbursements. The net total expense ratio for the Fund represents the actual expense ratio incurred by Fund shareholders.
The mutual funds included in the Peer Universe (the Lipper Mid-Cap Value Funds Performance Universe) and the Peer Group were objectively determined by Lipper Inc. (“Lipper”), an independent provider of mutual fund data. The comparisons placed the Fund in various quartiles, with the first quartile being the best 25% of the mutual funds (for performance, the best performing mutual funds and, for expenses, the lowest cost mutual funds).
The section below summarizes key factors considered by the Board and the Board’s conclusions regarding the Fund’s performance, fees and overall expenses. The table sets forth gross performance comparisons (which do not reflect the impact on performance of fund expenses, or any subsidies, expense caps or waivers that may be applicable) with the Peer Universe, actual management fees with the Peer Group (which reflect the impact of any subsidies or fee waivers), and net total expenses with the Peer Group, each of which were key factors considered by the Board.
| | | | | | | | |
| Performance | | 1 Year | | 3 Years | | 5 Years | | 10 Years |
| | | 1st Quartile | | 2nd Quartile | | 1st Quartile | | N/A |
| Actual Management Fees: 4th Quartile |
| Net Total Expenses: 4th Quartile |
Visit our website at www.prudentialfunds.com
| | • | | The Board noted that the Fund outperformed its benchmark index over all periods. |
| | • | | The Board concluded that, in light of the Fund’s strong performance, it would be in the best interests of the Fund and its shareholders to renew the agreements. |
| | • | | The Board considered that while the Fund’s actual management fees ranked in the fourth quartile, the Board also noted that its fees were only 8 basis points higher than the median. |
| | • | | The Board concluded that the management fees (including subadvisory fees) and total expenses were reasonable in light of the services provided. |
* * *
After full consideration of these factors, the Board concluded that approval of the agreements was in the best interests of the Fund and its shareholders.
Prudential Mid-Cap Value Fund
| | | | |
| n MAIL | | n TELEPHONE | | n WEBSITE |
Gateway Center Three 100 Mulberry Street Newark, NJ 07102 | | (800) 225-1852 | | www.prudentialfunds.com |
|
| PROXY VOTING |
| The Board of Directors of the Fund has delegated to the Fund’s investment subadviser the responsibility for voting any proxies and maintaining proxy recordkeeping with respect to the Fund. A description of these proxy voting policies and procedures is available without charge, upon request, by calling (800) 225-1852 or by visiting the Securities and Exchange Commission’s website at www.sec.gov. Information regarding how the Fund voted proxies relating to portfolio securities during the most recent 12-month period ended June 30 is available on the Fund’s website and on the Securities and Exchange Commission’s website. |
|
| DIRECTORS |
| Kevin J. Bannon • Scott E. Benjamin • Linda W. Bynoe • Michael S. Hyland • Douglas H. McCorkindale • Stephen P. Munn • Stuart S. Parker • Richard A. Redeker • Robin B. Smith • Stephen G. Stoneburn |
|
| OFFICERS |
| Stuart S. Parker, President • Judy A. Rice, Vice President • Scott E. Benjamin, Vice President • Grace C. Torres, Treasurer and Principal Financial and Accounting Officer • Raymond A. O’Hara, Chief Legal Officer • Deborah A. Docs, Secretary • Timothy J. Knierim, Chief Compliance Officer • Valerie M. Simpson, Deputy Chief Compliance Officer • Theresa C. Thompson, Deputy Chief Compliance Officer • Richard W. Kinville, Anti-Money Laundering Compliance Officer • Jonathan D. Shain, Assistant Secretary • Claudia DiGiacomo, Assistant Secretary • Amanda S. Ryan, Assistant Secretary • Andrew R. French, Assistant Secretary • M. Sadiq Peshimam, Assistant Treasurer • Peter Parrella, Assistant Treasurer |
| | | | |
| MANAGER | | Prudential Investments LLC | | Gateway Center Three
100 Mulberry Street
Newark, NJ 07102 |
|
| INVESTMENT SUBADVISER | | Quantitative Management
Associates LLC | | Gateway Center Two
100 Mulberry Street
Newark, NJ 07102 |
|
| DISTRIBUTORS | | Prudential Annuities
Distributors, Inc. | | One Corporate Drive
Shelton, CT 06484 |
|
| | Prudential Investment
Management Services LLC | | Gateway Center Three
100 Mulberry Street
Newark, NJ 07102 |
|
| CUSTODIAN | | The Bank of New York Mellon | | One Wall Street
New York, NY 10286 |
|
| TRANSFER AGENT | | Prudential Mutual Fund
Services LLC | | PO Box 9658
Providence, RI 02940 |
|
| INDEPENDENT REGISTERED PUBLIC ACCOUNTING FIRM | | KPMG LLP | | 345 Park Avenue
New York, NY 10154 |
|
| FUND COUNSEL | | Willkie Farr & Gallagher LLP | | 787 Seventh Avenue
New York, NY 10019 |
|
| An investor should consider the investment objectives, risks, charges, and expenses of the Fund carefully before investing. The prospectus and summary prospectus contain this and other information about the Fund. An investor may obtain a prospectus and summary prospectus by visiting our website at www.prudentialfunds.com or by calling (800) 225-1852. The prospectus and summary prospectus should be read carefully before investing. |
|
| E-DELIVERY |
| To receive your mutual fund documents online, go to www.prudentialfunds.com/edelivery and enroll. Instead of receiving printed documents by mail, you will receive notification via email when new materials are available. You can cancel your enrollment or change your email address at any time by visiting the website address above. |
|
| SHAREHOLDER COMMUNICATIONS WITH DIRECTORS |
| Shareholders can communicate directly with the Board of Directors by writing to the Chair of the Board, Prudential Mid-Cap Value Fund, Prudential Investments, Attn: Board of Directors, 100 Mulberry Street, Gateway Center Three, Newark, NJ 07102. Shareholders can communicate directly with an individual Director by writing to the same address. Communications are not screened before being delivered to the addressee. |
|
| AVAILABILITY OF PORTFOLIO SCHEDULE |
| The Fund files its complete schedule of portfolio holdings with the Securities and Exchange Commission for the first and third quarters of each fiscal year on Form N-Q. The Fund’s Forms N-Q are available on the Commission’s website at www.sec.gov. The Fund’s Forms N-Q may also be reviewed and copied at the Commission’s Public Reference Room in Washington, D.C. Information on the operation and location of the Public Reference Room may be obtained by calling (202) 551-8090. The Fund’s schedule of portfolio holdings is also available on the Fund’s website as of the end of each month. |
|
| The Fund’s Statement of Additional Information contains additional information about the Fund’s Directors and is available without charge, upon request, by calling (800) 225-1852. |
Mutual Funds:
| | | | |
ARE NOT INSURED BY THE FDIC OR ANY
FEDERAL GOVERNMENT AGENCY | | MAY LOSE VALUE | | ARE NOT A DEPOSIT OF OR GUARANTEED BY ANY BANK OR ANY BANK AFFILIATE |

PRUDENTIAL MID-CAP VALUE FUND
| | | | | | | | | | | | |
| SHARE CLASS | | A | | B | | C | | Q | | X | | Z |
| NASDAQ | | SPRAX | | SVUBX | | NCBVX | | PMVQX | | NBVZX | | SPVZX |
| CUSIP | | 74441L105 | | 74441L204 | | 74441L303 | | 74441L824 | | 74441L600 | | 74441L709 |
MF202E 0236603-00001-00
Item 2 – Code of Ethics — See Exhibit (a)
As of the end of the period covered by this report, the registrant has adopted a code of ethics (the “Section 406 Standards for Investment Companies – Ethical Standards for Principal Executive and Financial Officers”) that applies to the registrant’s Principal Executive Officer and Principal Financial Officer; the registrant’s Principal Financial Officer also serves as the Principal Accounting Officer.
The registrant hereby undertakes to provide any person, without charge, upon request, a copy of the code of ethics. To request a copy of the code of ethics, contact the registrant 800-225-1852, and ask for a copy of the Section 406 Standards for Investment Companies - Ethical Standards for Principal Executive and Financial Officers.
Item 3 – Audit Committee Financial Expert –
The registrant’s Board has determined that Mr. Stephen P. Munn, member of the Board’s Audit Committee is an “audit committee financial expert,” and that he is “independent,” for purposes of this Item.
Item 4 – Principal Accountant Fees and Services –
(a) Audit Fees
For the fiscal years ended October 31, 2012 and October 31, 2011, KPMG LLP (“KPMG”), the Registrant’s principal accountant, billed the Registrant $51,000 and $47,000, respectively, for professional services rendered for the audit of the Registrant’s annual financial statements or services that are normally provided in connection with statutory and regulatory filings.
(b) Audit-Related Fees
None.
(c) Tax Fees
During the fiscal year ended October 31, 2012, KPMG billed the Registrant $357 for professional services rendered in connection with agreed upon procedures performed related to the receipt of payments pursuant to certain fair fund settlement orders. Not applicable for the fiscal year ended October 31, 2011.
(d) All Other Fees
None.
(e) (1) Audit Committee Pre-Approval Policies and Procedures
THE PRUDENTIAL MUTUAL FUNDS
AUDIT COMMITTEE POLICY
on
Pre-Approval of Services Provided by the Independent Accountants
The Audit Committee of each Prudential Mutual Fund is charged with the responsibility to monitor the independence of the Fund’s independent accountants. As part of this responsibility, the Audit Committee must pre-approve any independent accounting firm’s engagement to render audit and/or permissible non-audit services, as required by law. In evaluating a proposed engagement of the independent accountants, the Audit Committee will assess the effect that the engagement might reasonably be expected to have on the accountant’s independence. The Committee’s evaluation will be based on:
| | • | | a review of the nature of the professional services expected to be provided, |
| | • | | a review of the safeguards put into place by the accounting firm to safeguard independence, and |
| | • | | periodic meetings with the accounting firm. |
Policy for Audit and Non-Audit Services Provided to the Funds
On an annual basis, the scope of audits for each Fund, audit fees and expenses, and audit-related and non-audit services (and fees proposed in respect thereof) proposed to be performed by the Fund’s independent accountants will be presented by the Treasurer and the independent accountants to the Audit Committee for review and, as appropriate, approval prior to the initiation of such services. Such presentation shall be accompanied by confirmation by both the Treasurer and the independent accountants that the proposed services will not adversely affect the independence of the independent accountants. Proposed services shall be described in sufficient detail to enable the Audit Committee to assess the appropriateness of such services and fees, and the compatibility of the provision of such services with the auditor’s independence. The Committee shall receive periodic reports on the progress of the audit and other services which are approved by the Committee or by the Committee Chair pursuant to authority delegated in this Policy.
The categories of services enumerated under “Audit Services”, “Audit-related Services”, and “Tax Services” are intended to provide guidance to the Treasurer and the independent accountants as to those categories of services which the Committee believes are generally consistent with the independence of the independent accountants and which the Committee (or the Committee Chair) would expect upon the presentation of specific proposals to pre-approve. The enumerated categories are not intended as an exclusive list of audit, audit-related or tax services, which the Committee (or the Committee Chair) would consider for pre-approval.
Audit Services
The following categories of audit services are considered to be consistent with the role of the Fund’s independent accountants:
| | • | | Annual Fund financial statement audits |
| | • | | Seed audits (related to new product filings, as required) |
| | • | | SEC and regulatory filings and consents |
Audit-related Services
The following categories of audit-related services are considered to be consistent with the role of the Fund’s independent accountants:
| | • | | Accounting consultations |
| | • | | Fund merger support services |
| | • | | Agreed Upon Procedure Reports |
| | • | | Other Internal Control Reports |
Individual audit-related services that fall within one of these categories and are not presented to the Audit Committee as part of the annual pre-approval process will be subject to pre-approval by the Committee Chair (or any other Committee member on whom this responsibility has been delegated) so long as the estimated fee for those services does not exceed $50,000.
Tax Services
The following categories of tax services are considered to be consistent with the role of the Fund’s independent accountants:
| | • | | Tax compliance services related to the filing or amendment of the following: |
| | • | | Federal, state and local income tax compliance; and, |
| | • | | Sales and use tax compliance |
| | • | | Timely RIC qualification reviews |
| | • | | Tax distribution analysis and planning |
| | • | | Tax authority examination services |
| | • | | Tax appeals support services |
| | • | | Accounting methods studies |
| | • | | Fund merger support services |
| | • | | Tax consulting services and related projects |
Individual tax services that fall within one of these categories and are not presented to the Audit Committee as part of the annual pre-approval process will be subject to pre-approval by the Committee Chair (or any other Committee member on whom this responsibility has been delegated) so long as the estimated fee for those services does not exceed $50,000.
Other Non-audit Services
Certain non-audit services that the independent accountants are legally permitted to render will be subject to pre-approval by the Committee or by one or more Committee members to whom the Committee has delegated this authority and who will report to the full Committee any pre-
approval decisions made pursuant to this Policy. Non-audit services presented for pre-approval pursuant to this paragraph will be accompanied by a confirmation from both the Treasurer and the independent accountants that the proposed services will not adversely affect the independence of the independent accountants.
Proscribed Services
The Fund’s independent accountants will not render services in the following categories of non-audit services:
| | • | | Bookkeeping or other services related to the accounting records or financial statements of the Fund |
| | • | | Financial information systems design and implementation |
| | • | | Appraisal or valuation services, fairness opinions, or contribution-in-kind reports |
| | • | | Internal audit outsourcing services |
| | • | | Management functions or human resources |
| | • | | Broker or dealer, investment adviser, or investment banking services |
| | • | | Legal services and expert services unrelated to the audit |
| | • | | Any other service that the Public Company Accounting Oversight Board determines, by regulation, is impermissible. |
Pre-approval of Non-Audit Services Provided to Other Entities Within the Prudential Fund Complex
Certain non-audit services provided to Prudential Investments LLC or any of its affiliates that also provide ongoing services to the Prudential Mutual Funds will be subject to pre-approval by the Audit Committee. The only non-audit services provided to these entities that will require pre-approval are those related directly to the operations and financial reporting of the Funds. Individual projects that are not presented to the Audit Committee as part of the annual pre-approval process will be subject to pre-approval by the Committee Chair (or any other Committee member on whom this responsibility has been delegated) so long as the estimated fee for those services does not exceed $50,000. Services presented for pre-approval pursuant to this paragraph will be accompanied by a confirmation from both the Treasurer and the independent accountants that the proposed services will not adversely affect the independence of the independent accountants.
Although the Audit Committee will not pre-approve all services provided to Prudential Investments LLC and its affiliates, the Committee will receive an annual report from the Fund’s independent accounting firm showing the aggregate fees for all services provided to Prudential Investments and its affiliates.
(e) (2) Percentage of services referred to in 4(b) – 4(d) that were approved by the audit committee –
One hundred percent of the services described in Item 4(c) was approved by the audit committee.
(f) Percentage of hours expended attributable to work performed by other than full time employees of principal accountant if greater than 50%.
The percentage of hours expended on the principal accountant’s engagement to audit the registrant’s financial statements for the most recent fiscal year that were attributed to work performed by persons other than the principal accountant’s full-time, permanent employees was 0%.
(g) Non-Audit Fees
Not applicable to Registrant for the fiscal years 2012 and 2011. The aggregate non-audit fees billed by KPMG for services rendered to the registrant’s investment adviser and any entity controlling, controlled by, or under common control with the investment adviser that provides ongoing services to the registrant for the fiscal years 2012 and 2011 was $0 and $0, respectively.
(h) Principal Accountant’s Independence
Not applicable as KPMG has not provided non-audit services to the registrant’s investment adviser and any entity controlling, controlled by, or under common control with the investment adviser that provides ongoing services to the registrant that were not pre-approved pursuant to Rule 2-01(c)(7)(ii) of Regulation S-X.
Item 5 – Audit Committee of Listed Registrants – Not applicable.
Item 6 – Schedule of Investments – The schedule is included as part of the report to shareholders filed under Item 1 of this Form.
Item 7 – Disclosure of Proxy Voting Policies and Procedures for Closed-End Management Investment Companies – Not applicable.
Item 8 – Portfolio Managers of Closed-End Management Investment Companies – Not applicable.
Item 9 – Purchases of Equity Securities by Closed-End Management Investment Company and Affiliated Purchasers – Not applicable.
Item 10 – Submission of Matters to a Vote of Security Holders – Not applicable.
Item 11 – Controls and Procedures
| | (a) | It is the conclusion of the registrant’s principal executive officer and principal financial officer that the effectiveness of the registrant’s current disclosure controls and procedures (such disclosure controls and procedures having been evaluated within 90 days of the date of this filing) provide reasonable assurance that the information required to be disclosed by the registrant has been recorded, processed, summarized and reported within the time period specified in the Commission’s rules and forms and that the information required to be disclosed by the registrant has been accumulated and communicated to the registrant’s principal executive officer and principal financial officer in order to allow timely decisions regarding required disclosure. |
| | (b) | There has been no significant change in the registrant’s internal control over financial reporting that occurred during the registrant’s most recent fiscal quarter of the period covered by this report that has materially affected, or is likely to materially affect, the registrant’s internal control over financial reporting. |
Item 12 – Exhibits
| | (a) | (1) Code of Ethics – Attached hereto as Exhibit EX-99.CODE-ETH |
(2) Certifications pursuant to Section 302 of the Sarbanes-Oxley Act – Attached hereto as Exhibit EX-99.CERT.
(3) Any written solicitation to purchase securities under Rule 23c-1. – Not applicable.
| | (b) | Certifications pursuant to Section 906 of the Sarbanes-Oxley Act – Attached hereto as Exhibit EX-99.906CERT. |
SIGNATURES
Pursuant to the requirements of the Securities Exchange Act of 1934 and the Investment Company Act of 1940, the registrant has duly caused this report to be signed on its behalf by the undersigned, thereunto duly authorized.
| | |
| Registrant: | | Prudential Investment Portfolios, Inc. 10 |
| |
| By: | | /s/ Deborah A. Docs |
| | Deborah A. Docs |
| | Secretary |
| |
| Date: | | December 20, 2012 |
Pursuant to the requirements of the Securities Exchange Act of 1934 and the Investment Company Act of 1940, this report has been signed below by the following persons on behalf of the registrant and in the capacities and on the dates indicated.
| | |
| By: | | /s/ Stuart S. Parker |
| | Stuart S. Parker |
| | President and Principal Executive Officer |
| |
| Date: | | December 20, 2012 |
| |
| By: | | /s/ Grace C. Torres |
| | Grace C. Torres |
| | Treasurer and Principal Financial Officer |
| |
| Date: | | December 20, 2012 |