UNITED STATES
SECURITIES AND EXCHANGE COMMISSION
Washington, D.C. 20549
FORM N-CSR
CERTIFIED SHAREHOLDER REPORT OF REGISTERED MANAGEMENT
INVESTMENT COMPANIES
| | |
| Investment Company Act file number: | | 811-08085 |
| |
| Exact name of registrant as specified in charter: | | Prudential Investment Portfolios, Inc. 10 |
| |
| Address of principal executive offices: | | Gateway Center 3, |
| | 100 Mulberry Street, |
| | Newark, New Jersey 07102 |
| |
| Name and address of agent for service: | | Deborah A. Docs |
| | Gateway Center 3, |
| | 100 Mulberry Street, |
| | Newark, New Jersey 07102 |
| |
| Registrant’s telephone number, including area code: | | 800-225-1852 |
| |
| Date of fiscal year end: | | 10/31/2014 |
| |
| Date of reporting period: | | 10/31/2014 |
Item 1 – Reports to Stockholders –

PRUDENTIAL INVESTMENTS»MUTUAL FUNDS
PRUDENTIAL JENNISON EQUITY INCOME FUND
ANNUAL REPORT · OCTOBER 31, 2014
Fund Type
Equity Income
Objective
Income and Capital Appreciation
This report is not authorized for distribution to prospective investors unless preceded or accompanied by a current prospectus.
The views expressed in this report and information about the Fund’s portfolio holdings are for the period covered by this report and are subject to change thereafter.
Mutual funds are distributed by Prudential Investment Management Services LLC. Jennison Associates is a registered investment adviser. Both are Prudential Financial companies. © 2014 Prudential Financial, Inc. and its related entities. Prudential Investments LLC, Prudential, Jennison Associates, Jennison, the Prudential logo, Bring Your Challenges, and the Rock symbol are service marks of Prudential Financial, Inc. and its related entities, registered in many jurisdictions worldwide.

December 15, 2014
Dear Shareholder:
We hope you find the annual report for the Prudential Jennison Equity Income Fund informative and useful. The report covers performance for the 12-month period that ended October 31, 2014.
Since market conditions change over time, we believe it is important to maintain a diversified portfolio of funds consistent with your tolerance for risk, time horizon, and financial goals.
Your financial advisor can help you create a diversified investment plan that may include funds covering all the basic asset classes and that reflects your personal investor profile and risk tolerance. Keep in mind, however, that diversification and asset allocation strategies do not assure a profit or protect against loss in declining markets.
Prudential Investments® is dedicated to helping you solve your toughest investment challenges—whether it’s capital growth, reliable income, or protection from market volatility and other risks. We offer the expertise of Prudential Financial’s affiliated asset managers* that strive to be leaders in a broad range of funds to help you stay on course to the future you envision. They also manage money for major corporations and pension funds around the world, which means you benefit from the same expertise, innovation, and attention to risk demanded by today’s most sophisticated investors.
Thank you for choosing the Prudential Investments family of funds.
Sincerely,

Stuart S. Parker, President
Prudential Jennison Equity Income Fund
*Most of Prudential Investments’ equity funds are advised by Jennison Associates LLC, Quantitative Management Associates LLC (QMA), or Prudential Real Estate Investors. Prudential Investments’ fixed income and money market funds are advised by Prudential Investment Management, Inc. (PIM) through its Prudential Fixed Income unit. Jennison Associates, QMA, and PIM are registered investment advisers and Prudential Financial companies. Prudential Real Estate Investors is a unit of PIM.
| | | | |
| Prudential Jennison Equity Income Fund | | | 1 | |
Your Fund’s Performance (Unaudited)
Performance data quoted represent past performance. Past performance does not guarantee future results. The investment return and principal value of an investment will fluctuate, so that an investor’s shares, when redeemed, may be worth more or less than their original cost. Current performance may be lower or higher than the past performance data quoted. An investor may obtain performance data as of the most recent month-end by visiting our website at www.prudentialfunds.com or by calling (800) 225-1852.
| | | | | | | | | | | | | | |
Cumulative Total Returns (Without Sales Charges) as of 10/31/14 |
| | | One Year | | | Five Years | | | Ten Years | | | Since Inception |
Class A | | | 15.30 | % | | | 108.40 | % | | | 153.86 | % | | — |
Class B | | | 14.52 | | | | 100.77 | | | | 135.24 | | | — |
Class C | | | 14.48 | | | | 100.77 | | | | 135.33 | | | — |
Class Q | | | 15.68 | | | | N/A | | | | N/A | | | 59.75% (1/18/11) |
Class R | | | 15.08 | | | | N/A | | | | N/A | | | 56.29 (1/18/11) |
Class Z | | | 15.58 | | | | 110.98 | | | | N/A | | | 95.74 (8/25/08) |
Lipper Equity Income Funds Index* | | | 13.67 | | | | 99.62 | | | | 106.64 | | | — |
S&P 500 Index | | | 17.24 | | | | 116.27 | | | | 119.89 | | | — |
Lipper Equity Income Funds Average | | | 12.58 | | | | 97.73 | | | | 115.08 | | | — |
| | | | | | | | | | | | | | |
Average Annual Total Returns (With Sales Charges) as of 9/30/14 |
| | | One Year | | | Five Years | | | Ten Years | | | Since Inception |
Class A | | | 12.54 | % | | | 13.90 | % | | | 9.14 | % | | — |
Class B | | | 13.12 | | | | 14.22 | | | | 8.92 | | | — |
Class C | | | 17.08 | | | | 14.33 | | | | 8.91 | | | — |
Class Q | | | 19.41 | | | | N/A | | | | N/A | | | 13.15% (1/18/11) |
Class R | | | 18.72 | | | | N/A | | | | N/A | | | 12.50 (1/18/11) |
Class Z | | | 19.39 | | | | 15.48 | | | | N/A | | | 11.44 (8/25/08) |
Lipper Equity Income Funds Index* | | | 16.10 | | | | 14.02 | | | | 7.44 | | | — |
S&P 500 Index | | | 19.70 | | | | 15.69 | | | | 8.10 | | | — |
Lipper Equity Income Funds Average | | | 15.02 | | | | 13.78 | | | | 7.83 | | | — |
*Returns for the Lipper Equity Income Funds Index reflect the expenses of the mutual funds included in the Index.
| | |
| 2 | | Visit our website at www.prudentialfunds.com |
| | | | | | | | | | | | | | |
Average Annual Total Returns (With Sales Charges) as of 10/31/14 |
| | | One Year | | | Five Years | | | Ten Years | | | Since Inception |
Class A | | | 8.95 | % | | | 14.52 | % | | | 9.14 | % | | — |
Class B | | | 9.52 | | | | 14.84 | | | | 8.93 | | | — |
Class C | | | 13.48 | | | | 14.96 | | | | 8.94 | | | — |
Class Q | | | 15.68 | | | | N/A | | | | N/A | | | 13.17% (1/18/11) |
Class R | | | 15.08 | | | | N/A | | | | N/A | | | 12.52 (1/18/11) |
Class Z | | | 15.58 | | | | 16.10 | | | | N/A | | | 11.47 (8/25/08) |
| | | | | | | | | | | | | | |
Average Annual Total Returns (Without Sales Charges) as of 10/31/14 |
| | | One Year | | | Five Years | | | Ten Years | | | Since Inception |
Class A | | | 15.30 | % | | | 15.82 | % | | | 9.76 | % | | — |
Class B | | | 14.52 | | | | 14.96 | | | | 8.93 | | | — |
Class C | | | 14.48 | | | | 14.96 | | | | 8.94 | | | — |
Class Q | | | 15.68 | | | | N/A | | | | N/A | | | 13.17% (1/18/11) |
Class R | | | 15.08 | | | | N/A | | | | N/A | | | 12.52 (1/18/11) |
Class Z | | | 15.58 | | | | 16.10 | | | | N/A | | | 11.47 (8/25/08) |
Growth of a $10,000 Investment
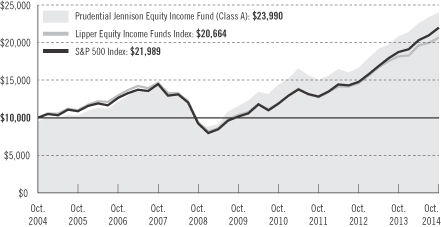
The graph compares a $10,000 investment in the Prudential Jennison Equity Income Fund (Class A shares) with a similar investment in the Lipper Equity Income Funds Index and the S&P 500 Index by portraying the initial account values at the beginning of the 10-year period for Class A shares (October 31, 2004) and the account values at the end of the current fiscal year (October 31, 2014) as measured on a quarterly basis. The data are measured from the closest month-end to inception date, and not from the Fund’s actual inception date. For purposes of the graph, and unless otherwise indicated, it has been assumed that (a) the maximum applicable
| | | | |
| Prudential Jennison Equity Income Fund | | | 3 | |
Your Fund’s Performance (continued)
front-end sales charge was deducted from the initial $10,000 investment in Class A shares; (b) all recurring fees (including management fees) were deducted; and (c) all dividends and distributions were reinvested. The line graph provides information for Class A shares only. As indicated in the tables above, performance for Class B, Class C, Class Q, Class R, and Class Z shares will vary due to the differing charges and expenses applicable to each share class (as indicated in the following paragraphs). Without waiver of fees and/or expense reimbursement, if any, the returns would have been lower.
Past performance does not predict future performance. Total returns and the ending account values in the graph include changes in share price and reinvestment of dividends and capital gains distributions in a hypothetical investment for the periods shown. The Fund’s total returns do not reflect the deduction of income taxes on an individual’s investment. Taxes may reduce your actual investment returns on income or gains paid by the Fund or any gains you may realize if you sell your shares.
Source: Prudential Investments LLC and Lipper Inc.
Inception returns are provided for any share class with less than 10 calendar years of returns.
The returns in the tables do not reflect the deduction of taxes that a shareholder would pay on Fund distributions or following the redemption of Fund shares. The average annual total returns take into account applicable sales charges, which are described for each share class in the table below.
| | | | | | | | | | | | |
| | Class A | | Class B* | | Class C | | Class Q | | Class R | | Class Z |
Maximum initial sales charge | | 5.50% of
the public
offering
price | | None | | None | | None | | None | | None |
Contingent deferred sales charge (CDSC) (as a percentage of the lower of original purchase price or net asset value at redemption) | | 1% on sales
of $1 million
or more
made within
12 months of
purchase | | 5% (Yr. 1)
4% (Yr. 2)
3% (Yr. 3)
2% (Yr. 4)
1% (Yr. 5)
1% (Yr. 6)
0% (Yr. 7) | | 1% on sales
made within
12 months
of purchase | | None | | None | | None |
Annual distribution and service (12b-1) fees (shown as a percentage of average daily net assets) | | .30% (.25%
currently) | | 1% | | 1% | | None | | .75%
(.50%
currently) | | None |
*Class B shares are closed to all purchase activity and no additional Class B shares may be purchased or acquired except by exchange from Class B shares of another Fund or through dividend or capital gains reinvestment.
| | |
| 4 | | Visit our website at www.prudentialfunds.com |
Benchmark Definitions
Lipper Equity Income Funds Index
Funds in the Lipper Equity Income Funds Index seek relatively high current income and growth of income by investing at least 65% of their portfolios in dividend-paying equity securities. These funds’ gross or net yields must be at least 125% of the average gross or net yield of the US diversified equity fund universe. Lipper Equity Income Funds Index Closest Month-End to Inception cumulative total returns as of 10/31/14 are 59.61% for Class Q and Class R and 69.01% for Class Z. Lipper Equity Income Funds Index Closest Month-End to Inception average annual total returns as of 9/30/14 are 13.02% for Class Q and Class R and 8.67% for Class Z.
S&P 500 Index
The S&P 500 Index is an unmanaged index of 500 stocks of large US public companies. It gives a broad look at how US stock prices have performed. S&P 500 Index Closest Month-End to Inception cumulative total returns as of 10/31/14 are 69.91% for Class Q and Class R and 80.00% for Class Z. S&P 500 Index Closest Month-End to Inception average annual total returns as of 9/30/14 are 14.80% for Class Q and Class R and 9.71% for Class Z.
Lipper Equity Income Funds Average
The Lipper Equity Income Funds Average (Lipper Average) represents returns based on an average return of all funds in the Lipper Equity Income Funds category for the periods noted. Funds in the Lipper Average seek relatively high current income and growth of income through investing 65% or more of their portfolios in dividend-paying equity securities. Lipper Average Closest Month-End to Inception cumulative total returns as of 10/31/14 are 56.47% for Class Q and Class R and 67.68% for Class Z. Lipper Average Closest Month-End to Inception average annual total returns as of 9/30/14 are 12.36% for Class Q and Class R and 8.47% for Class Z.
Investors cannot invest directly in an index or average. The returns for the Indexes would be lower if they included the effects of sales charges, operating expenses of a mutual fund, or taxes. Returns for the Lipper Average reflect the deduction of mutual fund operating expenses, but not sales charges or taxes. The Since Inception returns for the Indexes and the Lipper Average are measured from the closest month-end to inception date, and not from the Fund’s actual inception date.
| | | | |
Five Largest Holdings expressed as a percentage of net assets as of 10/31/14 | | | | |
Apple, Inc., Technology Hardware, Storage & Peripherals | | | 4.5 | % |
Frontier Communications Corp., Diversified Telecommunication Services | | | 3.2 | |
Bristol-Myers Squibb Co., Pharmaceuticals | | | 2.7 | |
Merck & Co., Inc., Pharmaceuticals | | | 2.5 | |
AbbVie, Inc., Pharmaceuticals | | | 2.2 | |
Holdings reflect only long-term investments and are subject to change.
| | | | |
| Prudential Jennison Equity Income Fund | | | 5 | |
Strategy and Performance Overview
How did the Fund perform?
The Prudential Jennison Equity Income Fund’s Class A shares returned 15.30% for the 12-month reporting period ended October 31, 2014, outperforming the 13.67% return of the Lipper Equity Income Funds Index and the 12.58% return of the Lipper Equity Income Funds Average, but underperforming the 17.24% return of the S&P 500 Index.
What was the market environment like for stocks during the period?
| | • | | The US equity markets’ double-digit advance in the 12 months ended October 31, 2014, reflected sustained improvement in the US economic outlook. Corporate profits remained strong, housing and employment indicators improved, and consumer confidence rose to post-recession highs. US gross domestic product (GDP) contracted in early 2014, largely because of severe winter weather, before quickly rebounding. |
| | • | | China’s expansion moderated as the country navigated a better balance between fixed investment and consumer-led growth. |
| | • | | A number of other key Emerging Market countries were hurt by a combination of slower growth, fiscal pressures, and weakening currencies. Later in the period, there were signs of improvement in a small but growing number of emerging market countries with stabilizing political, fiscal, and currency situations. |
| | • | | The Federal Reserve tapered its quantitative easing program, signaling confidence in the health of US economic activity and labor market conditions. |
Which holdings made the largest positive contributions to the Fund’s return?
The Fund’s leading contributors were diversified relatively well by sector. Oil and gas storage and transportation company Targa Resources topped the list. Other noteworthy contributors included Apple, Inc. from information technology and Frontier Communications from the telecommunication services sector. Canadian Pacific Railway from the industrial sector and Merck & Co., Inc., from the healthcare sector also helped performance during the period.
| | • | | Targa Resources enjoyed a steady upward trend. The shares suddenly spiked in mid-June on reports of a pending acquisition by Energy Transfer Equity. In October, heightened volatility in oil prices caused Targa’s shares to drop, but they have since rebounded. Jennison likes Targa for its fundamentals, and regards it as having one of the best natural gas liquids footprints along the Gulf Coast, as well as leading positions in the Permian and Bakken shale formations. Jennison continues to believe the company’s strong backlog of projects ($1.5+ billion of potential opportunities for 2015 and beyond) should support potential double-digit dividend growth. |
| | |
| 6 | | Visit our website at www.prudentialfunds.com |
| | • | | Apple shares moved up strongly in the second half of the year after announcing its largest acquisition in the company’s history, Beats Music and Beats Electronics, for $3 billion. The company’s revenues and earnings strength continues to reflect the expanding global acceptance of its platform, especially in China, where iPhone sales have surged after becoming available through China’s largest phone service provider. Jennison expects that product updates should sustain attractive revenue growth in the medium-term, and the company could benefit from the creation of new markets in Apple Pay and Apple Watch. |
| | • | | Canadian Pacific Railway benefited from strong rail volumes and accelerating revenue growth prospects. Jennison believes the company’s management, which has a record of improving operations and margins at underperforming railroads, is in the early stages of what should be a multiyear turnaround. It operates a transcontinental rail line from Vancouver to Montreal and south to Kansas City. Its 14,700 miles of track connect with all other major North American Class I rails and support a broad array of end markets, including industrial products, intermodal containers, coal, sulfur/fertilizers, automobiles, and forest products. |
Which holdings detracted most from the Fund’s return?
The major overall detractors came from the consumer discretionary sector, including positions in specialty retailer GameStop and toy maker Mattel. Information technology company Rackspace Hosting was another major detractor for the period, as were wireless telecommunication services provider Vodafone Group and Italian asset management company ANIMA.
| | • | | Rackspace Hosting, an internet software and services company that provides Web- and cloud-hosting services to more than 180,000 enterprise customers, had difficulties this year. This was largely related to changes in management, including the replacement of its CEO, and changes in its sales force structure as concerns mounted that its business was being commoditized. Given the company’s inability to transition its enterprise sales channel within the Fund’s investment timeframe, Jennison exited the position. |
| | • | | Shares of GameStop, a specialty retailer of video game consoles and software, were hurt in the beginning of the year following weakness around its holiday sales from 2013, causing investor anxiety about a potential secular decline in the business. The company has faced some headwinds, which include navigating the gaming console transition, the rapid rise of digitally distributed software, and increased pressure on its used products. Despite this, Jennison currently maintains a positive outlook on the company and feels the volatility |
| | | | |
| Prudential Jennison Equity Income Fund | | | 7 | |
Strategy and Performance Overview (continued)
| | and headwinds are somewhat overdone. Jennison believes management is focused and continues to aggressively return excess capital to shareholders through dividends and stock buybacks. |
| | • | | Mattel shares suffered during the period as the company struggled to work through an inventory build-up from 2013, which lasted well into 2014. The company had been reporting disappointing earnings for multiple quarters, with cyclical weakness among the majority of its core brands. Jennison has concerns that future results might be weaker for longer than Jennison anticipated. Also, Mattel’s tax position caused it to reclassify its dividends as a return of capital, which violated Jennison’s investment decision on Mattel as a steady dividend grower. Jennison closed the position in mid-February. |
Were there significant changes to the portfolio?
During the reporting period there were some changes to the portfolio. The Fund scaled back its positions in industrials in favor of sectors such as energy, with greater exposure to what Jennison believes is an opportunity within the “energy renaissance” occurring in the US. As such, the Fund increased its exposure to the energy sector, specifically in oil, gas, and consumable fuels companies.
The Fund added or exited individual positions based on company fundamentals and the stocks’ risk-reward characteristics. Significant positions established included Kinder Morgan, Williams Companies, Verizon, and consumer staples company Lorillard. Positions in Royal Philips NV and Vivendi SA were eliminated, while the Fund reduced its positions in General Electric, Siemens AG, and added to its position in Frontier Communications.
Did the Fund hold derivatives and did they affect performance?
| | • | | The Fund’s exposure to derivatives was minimal and included put and call equity options and structured notes. |
| | • | | These holdings had a minimal negative effect on performance as these holdings were in companies mostly within the energy sector, which broadly declined during October as volatility increased and oil prices fell significantly. |
| | |
| 8 | | Visit our website at www.prudentialfunds.com |
Comments on Largest Holdings
| 4.5% | Apple, Inc., Technology Hardware, Storage & Peripherals |
Apple is discussed in the positive contributors to performance section.
| 3.2% | Frontier Communications Corp., Diversified Telecommunication Services |
Frontier Communications benefited from what Jennison saw as continued good execution and improving fundamentals in the past year. As its promotional pricing has gained traction, the company has been able to sustain strong broadband momentum, a trend Jennison views as key to improving top-line growth. Its progress and continued revenue improvements helped to boost Jennison’s confidence in Frontier’s ability to maintain its above average dividend yield over the near to intermediate term.
| 2.7% | Bristol-Myers Squibb Company, Pharmaceuticals |
Bristol-Myers Squibb shares posted another solid quarter of results for 3Q2014. Jennison believes Bristol-Meyers will continue to benefit from product momentum, new product launches, pipeline data, and strong business development deals. Jennison also maintains its confidence in the company’s ability to sustain its healthy dividend yield over the long run.
| 2.5% | Merck & Co., Pharmaceuticals |
Merck management in the past has hinted the company is considering the sale or spin-off of some of its non-core assets, such as its animal health or consumer care businesses. Merck has an attractive dividend yield as well as a long history of returning value to its shareholders. Jennison sees a number of potentially positive catalysts for the stock in the year going forward.
| 2.2% | AbbVie, Inc., Pharmaceuticals |
Shares of AbbVie, Inc. increased as the company reported above consensus results for the most recent quarter (3Q2014) and increased their 2014 adjusted EPS guidance range. The research-based biopharmaceutical company, which formed in 2013 following its separation from Abbott Laboratories, also issued a $5 billion stock repurchase program and increased its quarterly cash dividend. Jennison believes the company is well positioned in its ability to sustain its healthy dividend over time.
| | | | |
| Prudential Jennison Equity Income Fund | | | 9 | |
Fees and Expenses (Unaudited)
As a shareholder of the Fund, you incur two types of costs: (1) transaction costs, including sales charges (loads) on purchase payments and redemptions, as applicable, and (2) ongoing costs, including management fees, distribution and/or service (12b-1) fees, and other Fund expenses, as applicable. This example is intended to help you understand your ongoing costs (in dollars) of investing in the Fund and to compare these costs with the ongoing costs of investing in other mutual funds.
The example is based on an investment of $1,000 invested on May 1, 2014, at the beginning of the period, and held through the six-month period ended October 31, 2014. The example is for illustrative purposes only; you should consult the Prospectus for information on initial and subsequent minimum investment requirements.
Actual Expenses
The first line for each share class in the table on the following page provides information about actual account values and actual expenses. You may use the information on this line, together with the amount you invested, to estimate the expenses that you paid over the period. Simply divide your account value by $1,000 (for example, an $8,600 account value ÷ $1,000 = 8.6), then multiply the result by the number on the first line under the heading “Expenses Paid During the Six-Month Period” to estimate the expenses you paid on your account during this period.
Hypothetical Example for Comparison Purposes
The second line for each share class in the table on the following page provides information about hypothetical account values and hypothetical expenses based on the Fund’s actual expense ratio and an assumed rate of return of 5% per year before expenses, which is not the Fund’s actual return. The hypothetical account values and expenses may not be used to estimate the actual ending account balance or expenses you paid for the period. You may use this information to compare the ongoing costs of investing in the Fund and other funds. To do so, compare this 5% hypothetical example with the 5% hypothetical examples that appear in the shareholder reports of the other funds.
The Fund’s transfer agent may charge additional fees to holders of certain accounts that are not included in the expenses shown in the table on the following page. These fees apply to individual retirement accounts (IRAs) and Section 403(b) accounts. As of the close of the six-month period covered by the table, IRA fees included an annual maintenance fee of $15 per account (subject to a maximum annual maintenance fee of $25 for all accounts held by the same shareholder). Section 403(b) accounts are charged an annual $25 fiduciary maintenance fee. Some of the fees may vary in amount, or may be waived, based on your total account balance or the number of
| | |
| 10 | | Visit our website at www.prudentialfunds.com |
Prudential Investments funds, including the Fund, that you own. You should consider the additional fees that were charged to your Fund account over the six-month period when you estimate the total ongoing expenses paid over the period and the impact of these fees on your ending account value, as these additional expenses are not reflected in the information provided in the expense table. Additional fees have the effect of reducing investment returns.
Please note that the expenses shown in the table are meant to highlight your ongoing costs only and do not reflect any transactional costs such as sales charges (loads). Therefore, the second line for each share class in the table is useful in comparing ongoing costs only and will not help you determine the relative total costs of owning different funds. In addition, if these transactional costs were included, your costs would have been higher.
| | | | | | | | | | | | | | | | | | |
Prudential
Jennison Equity
Income Fund | | Beginning Account
Value
May 1, 2014 | | | Ending Account
Value
October 31, 2014 | | | Annualized
Expense Ratio
Based on the
Six-Month Period | | | Expenses Paid
During the
Six-Month Period* | |
| | | | | | | | | | | | | | | | | | |
| Class A | | Actual | | $ | 1,000.00 | | | $ | 1,063.30 | | | | 1.14 | % | | $ | 5.93 | |
| | | Hypothetical | | $ | 1,000.00 | | | $ | 1,019.46 | | | | 1.14 | % | | $ | 5.80 | |
| | | | | | | | | | | | | | | | | | |
| Class B | | Actual | | $ | 1,000.00 | | | $ | 1,059.90 | | | | 1.89 | % | | $ | 9.81 | |
| | | Hypothetical | | $ | 1,000.00 | | | $ | 1,015.68 | | | | 1.89 | % | | $ | 9.60 | |
| | | | | | | | | | | | | | | | | | |
| Class C | | Actual | | $ | 1,000.00 | | | $ | 1,059.40 | | | | 1.89 | % | | $ | 9.81 | |
| | | Hypothetical | | $ | 1,000.00 | | | $ | 1,015.68 | | | | 1.89 | % | | $ | 9.60 | |
| | | | | | | | | | | | | | | | | | |
| Class Q | | Actual | | $ | 1,000.00 | | | $ | 1,065.00 | | | | 0.78 | % | | $ | 4.06 | |
| | | Hypothetical | | $ | 1,000.00 | | | $ | 1,021.27 | | | | 0.78 | % | | $ | 3.97 | |
| | | | | | | | | | | | | | | | | | |
| Class R | | Actual | | $ | 1,000.00 | | | $ | 1,062.00 | | | | 1.39 | % | | $ | 7.22 | |
| | | Hypothetical | | $ | 1,000.00 | | | $ | 1,018.20 | | | | 1.39 | % | | $ | 7.07 | |
| | | | | | | | | | | | | | | | | | |
| Class Z | | Actual | | $ | 1,000.00 | | | $ | 1,064.60 | | | | 0.89 | % | | $ | 4.63 | |
| | | Hypothetical | | $ | 1,000.00 | | | $ | 1,020.72 | | | | 0.89 | % | | $ | 4.53 | |
*Fund expenses (net of fee waivers or subsidies, if any) for each share class are equal to the annualized expense ratio for each share class (provided in the table), multiplied by the average account value over the period, multiplied by the 184 days in the six-month period ended October 31, 2014, and divided by 365 days in the Fund’s fiscal year ended October 31, 2014 (to reflect the six-month period). Expenses presented in the table include the expenses of any underlying portfolios in which the Fund may invest.
| | | | |
| Prudential Jennison Equity Income Fund | | | 11 | |
Fees and Expenses (continued)
The Fund’s annualized expense ratios for the year ended October 31, 2014, are as follows:
| | | | | | | | |
| Class | | Gross Operating Expenses | | | Net Operating Expenses | |
A | | | 1.18 | % | | | 1.13 | % |
B | | | 1.88 | | | | 1.88 | |
C | | | 1.88 | | | | 1.88 | |
Q | | | 0.78 | | | | 0.78 | |
R | | | 1.63 | | | | 1.38 | |
Z | | | 0.88 | | | | 0.88 | |
Net operating expenses shown above reflect any fee waivers and/or expense reimbursements. Additional information on Fund expenses and any fee waivers and/or expense reimbursements can be found in the “Financial Highlights” tables in this report and in the Notes to the Financial Statements in this report.
| | |
| 12 | | Visit our website at www.prudentialfunds.com |
Portfolio of Investments
as of October 31, 2014
| | | | | | | | |
| Description | | Shares | | | Value (Note 2) | |
LONG-TERM INVESTMENTS 99.0% | | | | | | | | |
| | |
COMMON STOCKS 90.1% | | | | | | | | |
| | |
Aerospace & Defense 1.2% | | | | | | | | |
Boeing Co. (The) | | | 495,651 | | | $ | 61,911,766 | |
| | |
Airlines 1.5% | | | | | | | | |
Air Canada (Canada) (Class A Stock)* | | | 3,186,835 | | | | 26,551,068 | |
Delta Air Lines, Inc. | | | 868,440 | | | | 34,937,341 | |
United Continental Holdings, Inc.* | | | 235,906 | | | | 12,458,196 | |
| | | | | | | | |
| | | | | | | 73,946,605 | |
| | |
Banks 6.1% | | | | | | | | |
Bank of America Corp. | | | 4,632,570 | | | | 79,494,901 | |
BankUnited, Inc. | | | 1,475,357 | | | | 44,113,174 | |
JPMorgan Chase & Co. | | | 1,236,531 | | | | 74,785,395 | |
Wells Fargo & Co. | | | 2,091,919 | | | | 111,059,980 | |
| | | | | | | | |
| | | | | | | 309,453,450 | |
| | |
Beverages 2.8% | | | | | | | | |
Britvic PLC (United Kingdom) | | | 6,992,725 | | | | 76,241,408 | |
Molson Coors Brewing Co. (Class B Stock) | | | 884,476 | | | | 65,787,325 | |
| | | | | | | | |
| | | | | | | 142,028,733 | |
| | |
Biotechnology 1.1% | | | | | | | | |
Celgene Corp.* | | | 502,188 | | | | 53,779,313 | |
| | |
Capital Markets 1.6% | | | | | | | | |
Anima Holding SpA (Italy)* | | | 3,257,001 | | | | 15,246,507 | |
Anima Holding SpA (Italy), 144A*(a) | | | 4,527,455 | | | | 21,193,691 | |
Azimut Holding SpA (Italy) | | | 1,879,092 | | | | 43,982,100 | |
| | | | | | | | |
| | | | | | | 80,422,298 | |
| | |
Chemicals 2.3% | | | | | | | | |
Air Products & Chemicals, Inc. | | | 254,297 | | | | 34,243,634 | |
Monsanto Co. | | | 126,449 | | | | 14,546,693 | |
Potash Corp. of Saskatchewan, Inc. (Canada) | | | 1,913,231 | | | | 65,375,103 | |
| | | | | | | | |
| | | | | | | 114,165,430 | |
See Notes to Financial Statements.
| | | | |
| Prudential Jennison Equity Income Fund | | | 13 | |
Portfolio of Investments
as of October 31, 2014 continued
| | | | | | | | |
| Description | | Shares | | | Value (Note 2) | |
COMMON STOCKS (Continued) | | | | | | | | |
| | |
Commercial Services & Supplies 0.5% | | | | | | | | |
Spotless Group Holdings Ltd. (Australia)* | | | 2,672,802 | | | $ | 4,522,357 | |
Spotless Group Holdings Ltd. (Australia), 144A*(a) | | | 10,779,817 | | | | 18,239,355 | |
| | | | | | | | |
| | | | | | | 22,761,712 | |
| | |
Communications Equipment 1.5% | | | | | | | | |
Cisco Systems, Inc. | | | 3,034,469 | | | | 74,253,456 | |
| | |
Diversified Financial Services | | | | | | | | |
Gateway Energy & Resource Holdings LLC, Private Placement, (original cost $2,000,000; purchased 12/14/07), 144A*(a)(b) | | | 100,000 | | | | 1,415,762 | |
| | |
Diversified Telecommunication Services 4.0% | | | | | | | | |
Frontier Communications Corp. | | | 24,678,442 | | | | 161,397,011 | |
Verizon Communications, Inc. | | | 798,818 | | | | 40,140,604 | |
| | | | | | | | |
| | | | | | | 201,537,615 | |
| | |
Electric Utilities 1.6% | | | | | | | | |
Alupar Investimento SA (Brazil) | | | 375,608 | | | | 2,757,298 | |
Alupar Investimento SA (Brazil), 144A(a) | | | 1,777,926 | | | | 13,051,566 | |
NRG Yield, Inc. (Class A Stock) | | | 1,337,699 | | | | 66,844,819 | |
| | | | | | | | |
| | | | | | | 82,653,683 | |
| | |
Food Products 2.1% | | | | | | | | |
Mondelez International, Inc. (Class A Stock) | | | 1,712,007 | | | | 60,365,367 | |
Pinnacle Foods, Inc. | | | 1,406,630 | | | | 47,544,094 | |
| | | | | | | | |
| | | | | | | 107,909,461 | |
| | |
Hotels, Restaurants & Leisure 3.6% | | | | | | | | |
Carnival Corp. | | | 1,191,829 | | | | 47,851,935 | |
Merlin Entertainments PLC (United Kingdom) | | | 1,507,457 | | | | 8,524,215 | |
Merlin Entertainments PLC (United Kingdom), 144A(a) | | | 4,500,000 | | | | 25,446,142 | |
Starbucks Corp. | | | 846,404 | | | | 63,954,286 | |
Wendy’s Co. (The) | | | 4,529,658 | | | | 36,327,857 | |
| | | | | | | | |
| | | | | | | 182,104,435 | |
| | |
Household Products 1.5% | | | | | | | | |
Procter & Gamble Co. (The) | | | 860,186 | | | | 75,068,432 | |
| | |
Independent Power & Renewable Electricity Producers 1.1% | | | | | | | | |
Abengoa Yield PLC (United Kingdom)* | | | 1,683,088 | | | | 54,700,360 | |
See Notes to Financial Statements.
| | | | | | | | |
| Description | | Shares | | | Value (Note 2) | |
COMMON STOCKS (Continued) | | | | | | | | |
| | |
Industrial Conglomerates 2.0% | | | | | | | | |
General Electric Co. | | | 1,350,923 | | | $ | 34,867,323 | |
Siemens AG (Germany), ADR(c) | | | 563,535 | | | | 63,532,936 | |
| | | | | | | | |
| | | | | | | 98,400,259 | |
| | |
Insurance 1.8% | | | | | | | | |
MetLife, Inc. | | | 1,667,229 | | | | 90,430,501 | |
| | |
Internet Software & Services 0.9% | | | | | | | | |
Yahoo!, Inc.* | | | 978,729 | | | | 45,070,470 | |
| | |
IT Services 2.1% | | | | | | | | |
Xerox Corp. | | | 8,160,624 | | | | 108,373,087 | |
| | |
Life Sciences Tools & Services 1.3% | | | | | | | | |
Thermo Fisher Scientific, Inc. | | | 553,735 | | | | 65,102,624 | |
| | |
Media 2.7% | | | | | | | | |
Cinemark Holdings, Inc. | | | 1,383,934 | | | | 48,880,549 | |
Lagardere SCA (France) | | | 271,510 | | | | 6,607,550 | |
Time Warner, Inc. | | | 992,166 | | | | 78,847,432 | |
| | | | | | | | |
| | | | | | | 134,335,531 | |
| | |
Metals & Mining 0.3% | | | | | | | | |
U.S. Silica Holdings, Inc. | | | 385,699 | | | | 17,317,885 | |
| | |
Multi-Utilities 1.0% | | | | | | | | |
Veolia Environnement SA (France) | | | 2,896,620 | | | | 48,109,377 | |
| | |
Oil, Gas & Consumable Fuels 12.3% | | | | | | | | |
Cheniere Energy Partners LP Holdings LLC | | | 2,662,589 | | | | 64,328,150 | |
EnLink Midstream LLC | | | 737,801 | | | | 27,962,658 | |
Kinder Morgan, Inc.(c) | | | 1,949,769 | | | | 75,456,060 | |
ONEOK, Inc. | | | 767,258 | | | | 45,222,187 | |
Pembina Pipeline Corp. (Canada) | | | 1,165,906 | | | | 48,315,145 | |
Phillips 66 | | | 671,367 | | | | 52,702,310 | |
Plains GP Holdings LP (Class A Stock)(c) | | | 1,070,605 | | | | 30,704,951 | |
SemGroup Corp. (Class A Stock) | | | 931,379 | | | | 71,483,338 | |
Targa Resources Corp. | | | 733,727 | | | | 94,379,304 | |
Western Refining, Inc. | | | 576,707 | | | | 26,292,072 | |
Williams Cos., Inc. (The) | | | 1,545,970 | | | | 85,816,795 | |
| | | | | | | | |
| | | | | | | 622,662,970 | |
See Notes to Financial Statements.
| | | | |
| Prudential Jennison Equity Income Fund | | | 15 | |
Portfolio of Investments
as of October 31, 2014 continued
| | | | | | | | |
| Description | | Shares | | | Value (Note 2) | |
COMMON STOCKS (Continued) | | | | | | | | |
| | |
Pharmaceuticals 9.1% | | | | | | | | |
AbbVie, Inc. | | | 1,780,337 | | | $ | 112,980,186 | |
Bristol-Myers Squibb Co. | | | 2,326,323 | | | | 135,368,735 | |
Merck & Co., Inc. | | | 2,172,520 | | | | 125,875,809 | |
Pfizer, Inc. | | | 1,022,727 | | | | 30,630,674 | |
Roche Holding AG (Switzerland) | | | 183,610 | | | | 54,183,611 | |
| | | | | | | | |
| | | | | | | 459,039,015 | |
| | |
Real Estate Investment Trusts (REITs) 4.6% | | | | | | | | |
Crown Castle International Corp. | | | 461,439 | | | | 36,047,615 | |
First Potomac Realty Trust | | | 1,997,515 | | | | 24,968,938 | |
Geo Group, Inc. (The) | | | 1,351,543 | | | | 53,980,627 | |
MFA Financial, Inc. | | | 9,522,064 | | | | 79,794,896 | |
Starwood Property Trust, Inc. | | | 1,667,260 | | | | 37,613,386 | |
| | | | | | | | |
| | | | | | | 232,405,462 | |
| | |
Road & Rail 3.3% | | | | | | | | |
Canadian Pacific Railway Ltd. (Canada) | | | 478,919 | | | | 99,461,898 | |
Union Pacific Corp. | | | 585,216 | | | | 68,148,403 | |
| | | | | | | | |
| | | | | | | 167,610,301 | |
| | |
Semiconductors & Semiconductor Equipment 0.9% | | | | | | | | |
Xilinx, Inc. | | | 1,053,638 | | | | 46,865,818 | |
| | |
Software 3.4% | | | | | | | | |
Activision Blizzard, Inc. | | | 3,184,239 | | | | 63,525,568 | |
Microsoft Corp. | | | 2,352,137 | | | | 110,432,832 | |
| | | | | | | | |
| | | | | | | 173,958,400 | |
| | |
Specialty Retail 2.9% | | | | | | | | |
GameStop Corp. (Class A Stock)(c) | | | 1,699,317 | | | | 72,662,795 | |
Home Depot, Inc. (The) | | | 780,544 | | | | 76,118,651 | |
| | | | | | | | |
| | | | | | | 148,781,446 | |
| | |
Technology Hardware, Storage & Peripherals 5.6% | | | | | | | | |
Apple, Inc. | | | 2,110,640 | | | | 227,949,120 | |
Diebold, Inc. | | | 1,587,678 | | | | 56,251,432 | |
| | | | | | | | |
| | | | | | | 284,200,552 | |
| | |
Tobacco 1.7% | | | | | | | | |
Lorillard, Inc. | | | 1,379,258 | | | | 84,824,367 | |
See Notes to Financial Statements.
| | | | | | | | | | | | | | |
| Description | | | | | | | Shares | | | Value (Note 2) | |
COMMON STOCKS (Continued) | | | | | | | | | | | | | | |
| | | |
Wireless Telecommunication Services 1.7% | | | | | | | | | | | | |
Vodafone Group PLC (United Kingdom), ADR | | | | | | | | | 2,561,464 | | | $ | 85,091,834 | |
| | | | | | | | | | | | | | |
TOTAL COMMON STOCKS
(cost $3,714,920,855) | | | | | | | | | | | | | 4,550,692,410 | |
| | | | | | | | | | | | | | |
| | | | |
PREFERRED STOCK 0.5% | | | | | | | | | | | | | | |
|
Independent Power & Renewable Electricity Producers | |
Dynegy, Inc. Series A, CVT, 5.375%(c)
(cost $24,230,448) | | | | | | | | | 241,991 | | | | 24,320,096 | |
| | | | | | | | | | | | | | |
| | | | |
| | | Interest
Rate | | Maturity
Date | | | Principal
Amount (000)# | | | | |
CONVERTIBLE BONDS 8.4% | | | | | | | | | | | | | | |
| | | | |
Airlines 2.1% | | | | | | | | | | | | | | |
United Continental Holdings, Inc., Sr. Unsec’d. Notes(a) | | 6.000% | | | 10/15/29 | | | | 9,122 | | | | 55,456,059 | |
WFC United Continental, Sr. Unsec’d. Notes, 144A(a) | | 7.730 | | | 05/05/15 | | | | 93,972 | | | | 49,805,160 | |
| | | | | | | | | | | | | | |
| | | | | | | | | | | | | 105,261,219 | |
|
Internet Software & Services 1.8% | |
JPM Yahoo, Inc., Sr. Unsec’d. Notes, 144A(a) | | 5.250 | | | 04/21/15 | | | | 217,875 | | | | 94,013,192 | |
| | | | |
Leisure Products 0.3% | | | | | | | | | | | | | | |
Callaway Golf Co., Notes(a) | | 3.750 | | | 08/15/19 | | | | 12,500 | | | | 14,367,187 | |
| | | | |
Oil, Gas & Consumable Fuels 2.0% | | | | | | | | | | | | | | |
BAC Cheniere Energy, Inc., Notes, 144A(a) | | 7.030 | | | 01/08/15 | | | | 546 | | | | 40,746,744 | |
BAC Concho Resources, Inc., Notes, 144A(a) | | 6.320 | | | 04/28/15 | | | | 30,951 | | | | 33,463,789 | |
WFC Noble Energy, Inc., Sr. Unsec’d. Notes, 144A(a) | | 2.430 | | | 02/27/15 | | | | 456 | | | | 26,182,542 | |
| | | | | | | | | | | | | | |
| | | | | | | | | | | | | 100,393,075 | |
See Notes to Financial Statements.
| | | | |
| Prudential Jennison Equity Income Fund | | | 17 | |
Portfolio of Investments
as of October 31, 2014 continued
| | | | | | | | | | | | | | |
| Description | | Interest
Rate | | Maturity
Date | | | Principal
Amount (000)# | | | Value (Note 2) | |
CONVERTIBLE BONDS (Continued) | | | | | | | | | | | | | | |
| | | | |
Pharmaceuticals 2.2% | | | | | | | | | | | | | | |
GS Biogen Idec, Inc., Sr. Unsec’d.Notes, 144A(a) | | 4.000% | | | 03/03/15 | | | | 187 | | | $ | 60,238,526 | |
GS Endo International PLC, Sr. Unsec’d., 144A(a) | | 4.000 | | | 03/16/15 | | | | 77,640 | | | | 51,347,214 | |
| | | | | | | | | | | | | | |
| | | | | | | | | | | | | 111,585,740 | |
| | | | | | | | | | | | | | |
TOTAL CONVERTIBLE BONDS
(cost $396,783,845) | | | | | | | | | | | | | 425,620,413 | |
| | | | | | | | | | | | | | |
TOTAL LONG-TERM INVESTMENTS
(cost $4,135,935,148) | | | | | | | | | | | | | 5,000,632,919 | |
| | | | | | | | | | | | | | |
| | | | |
| | | | | | | | Shares | | | | |
SHORT-TERM INVESTMENT 4.0% | | | | | | | | | | | | | | |
|
AFFILIATED MONEY MARKET MUTUAL FUND | |
Prudential Investment Portfolios 2 - Prudential Core Taxable Money Market Fund
(cost $201,571,943; includes $156,479,627 of cash collateral for securities on loan)(d)(e) | | | | | | | | | 201,571,943 | | | | 201,571,943 | |
| | | | | | | | | | | | | | |
TOTAL INVESTMENTS 103.0%
(cost $4,337,507,091; Note 6) | | | | | | | | | | | | | 5,202,204,862 | |
Liabilities in excess of other assets (3.0)% | | | | | | | | | | | | | (150,893,103 | ) |
| | | | | | | | | | | | | | |
NET ASSETS 100.0% | | | | | | | | | | | | $ | 5,051,311,759 | |
| | | | | | | | | | | | | | |
The following abbreviations are used in the portfolio descriptions:
144A—Security was purchased pursuant to Rule 144A under the Securities Act of 1933 and may not be resold subject to that rule except to qualified institutional buyers. Unless otherwise noted, 144A securities are deemed to be liquid.
ADR—American Depositary Receipt
CVT—Convertible Security
| # | Principal amount is shown in U.S. dollars unless otherwise stated. |
| * | Non-income producing security. |
| (a) | Indicates a security or securities that have been deemed illiquid. |
| (b) | Indicates a restricted security; the aggregate cost of the restricted securities is $2,000,000. The aggregate value, $1,415,762, is approximately 0.0% of net assets. |
| (c) | All or a portion of security is on loan. The aggregate market value of such securities, including those sold and pending settlement, is $155,096,152; cash collateral of $156,479,627 (included in liabilities) was received with which the Fund purchased highly liquid short-term investments. Securities on loan are subject to contractual netting arrangements. Cash collateral is less than 102% of the market value of securities loaned due to significant market increases on the last business day of the reporting period. Collateral was subsequently received on the following business day and the Fund remained in compliance. |
See Notes to Financial Statements.
| (d) | Represents security, or a portion thereof, purchased with cash collateral received for securities on loan. |
| (e) | Prudential Investments LLC, the manager of the Fund, also serves as manager of the Prudential Investment Portfolios 2 - Prudential Core Taxable Money Market Fund. |
Various inputs are used in determining the value of the Fund’s investments. These inputs are summarized in the three broad levels listed below.
Level 1—quoted prices generally in active markets for identical securities.
Level 2—quoted prices for similar securities, interest rates and yield curves, prepayment speeds, foreign currency exchange rates, and other significant observable inputs.
Level 3—significant unobservable inputs for securities valued in accordance with Board approved fair valuation procedures.
The following is a summary of the inputs used as of October 31, 2014 in valuing such portfolio securities:
| | | | | | | | | | | | |
| | | Level 1 | | | Level 2 | | | Level 3 | |
Investments in Securities | | | | | | | | | | | | |
Common Stocks | | | | | | | | | | | | |
Aerospace & Defense | | $ | 61,911,766 | | | $ | — | | | $ | — | |
Airlines | | | 73,946,605 | | | | — | | | | — | |
Banks | | | 309,453,450 | | | | — | | | | — | |
Beverages | | | 65,787,325 | | | | 76,241,408 | | | | — | |
Biotechnology | | | 53,779,313 | | | | — | | | | — | |
Capital Markets | | | — | | | | 80,422,298 | | | | — | |
Chemicals | | | 114,165,430 | | | | — | | | | — | |
Commercial Services & Supplies | | | — | | | | 22,761,712 | | | | — | |
Communications Equipment | | | 74,253,456 | | | | — | | | | — | |
Diversified Financial Services | | | — | | | | — | | | | 1,415,762 | |
Diversified Telecommunication Services | | | 201,537,615 | | | | — | | | | — | |
Electric Utilities | | | 69,602,117 | | | | 13,051,566 | | | | — | |
Food Products | | | 107,909,461 | | | | — | | | | — | |
Hotels, Restaurants & Leisure | | | 148,134,078 | | | | 33,970,357 | | | | — | |
Household Products | | | 75,068,432 | | | | — | | | | — | |
Independent Power & Renewable Electricity Producers | | | 54,700,360 | | | | — | | | | — | |
Industrial Conglomerates | | | 98,400,259 | | | | — | | | | — | |
Insurance | | | 90,430,501 | | | | — | | | | — | |
Internet Software & Services | | | 45,070,470 | | | | — | | | | — | |
IT Services | | | 108,373,087 | | | | — | | | | — | |
See Notes to Financial Statements.
| | | | |
| Prudential Jennison Equity Income Fund | | | 19 | |
Portfolio of Investments
as of October 31, 2014 continued
| | | | | | | | | | | | |
| | | Level 1 | | | Level 2 | | | Level 3 | |
Common Stocks (continued) | | | | | | | | | | | | |
Life Sciences Tools & Services | | $ | 65,102,624 | | | $ | — | | | $ | — | |
Media | | | 127,727,981 | | | | 6,607,550 | | | | — | |
Metals & Mining | | | 17,317,885 | | | | — | | | | — | |
Multi-Utilities | | | — | | | | 48,109,377 | | | | — | |
Oil, Gas & Consumable Fuels | | | 622,662,970 | | | | — | | | | — | |
Pharmaceuticals | | | 404,855,404 | | | | 54,183,611 | | | | — | |
Real Estate Investment Trusts (REITs) | | | 232,405,462 | | | | — | | | | — | |
Road & Rail | | | 167,610,301 | | | | — | | | | — | |
Semiconductors & Semiconductor Equipment | | | 46,865,818 | | | | — | | | | — | |
Software | | | 173,958,400 | | | | — | | | | — | |
Specialty Retail | | | 148,781,446 | | | | — | | | | — | |
Technology Hardware, Storage & Peripherals | | | 284,200,552 | | | | — | | | | — | |
Tobacco | | | 84,824,367 | | | | — | | | | — | |
Wireless Telecommunication Services | | | 85,091,834 | | | | — | | | | — | |
Preferred Stock | | | | | | | | | | | | |
Independent Power & Renewable Electricity Producers | | | 24,320,096 | | | | — | | | | — | |
Convertible Bonds | | | — | | | | 69,823,246 | | | | 355,797,167 | |
Affiliated Money Market Mutual Fund | | | 201,571,943 | | | | — | | | | — | |
| | | | | | | | | | | | |
Total | | $ | 4,439,820,808 | | | $ | 405,171,125 | | | $ | 357,212,929 | |
| | | | | | | | | | | | |
The following is a reconciliation of assets in which significant unobservable inputs (Level 3) were used in determining fair value:
| | | | | | | | |
| | | Common
Stocks | | | Convertible
Bonds | |
Balance as of 10/31/13 | | $ | — | | | $ | 226,557,064 | |
Accrued discount/premium | | | — | | | | — | |
Realized gain (loss) | | | — | | | | 31,157,659 | |
Change in unrealized appreciation (depreciation)* | | | (206,453 | ) | | | (4,564,301 | ) |
Purchases | | | — | | | | 354,984,614 | |
Sales | | | — | | | | (252,337,869 | ) |
Transfers into Level 3 | | | 1,622,215 | | | | — | |
Transfers out of Level 3 | | | — | | | | — | |
| | | | | | | | |
Balance as of 10/31/14 | | $ | 1,415,762 | | | $ | 355,797,167 | |
| | | | | | | | |
| * | Of which, $606,101 was included in Net Assets relating to securities held at the reporting period end. |
See Notes to Financial Statements.
Fair value of Level 2 investments at October 31, 2013 was $362,424,606, which was a result of valuing investments using third party vendor modeling tools. An amount of $79,732,930 was transferred from Level 1 into Level 2 at October 31, 2014 as a result of using quoted prices in active markets for such foreign securities.
It is the Portfolio’s policy to recognize transfers in and transfers out at the fair value as of the beginning of period. At the reporting period end, there was one Common Stock transferred into Level 3 as a result of using a discretionary adjustment rate based on an index return.
Level 3 securities as presented in the table above are being fair valued using pricing methodologies approved by the Valuation Committee, which contain unobservable inputs. Such methodologies include, but are not limited to, using prices provided by a single broker/dealer, the cost of the investment, and broker quotes adjusted for changes in yields of compariable U.S. Government and other securities using fixed income securities valuation model.
The valuation techniques and significant amounts of unobservable inputs used in the fair value measurement of the Fund’s Level 3 securities are outlined in the table below.
| | | | | | | | | | |
| | | Fair Value
October 31, 2014 | | | Valuation
Methodologies | | Unobservable
Input(s) | | Range
(Weighted
Average) |
Common Stocks | | $ | 1,415,762 | | | Market-to-market (Index) | | Discretionary adjustment rate | | –3.85% |
Convertible Bonds
Investments | | $ | 355,797,167 | | | Market approach | | Offered quote | | $43.15 - $321.79 ($105.79) |
See Notes to Financial Statements.
| | | | |
| Prudential Jennison Equity Income Fund | | | 21 | |
Portfolio of Investments
as of October 31, 2014 continued
The industry classification of investments and liabilities in excess of other assets shown as a percentage of net assets as of October 31, 2014 was as follows (Unaudited):
| | | | |
Oil, Gas & Consumable Fuels | | | 14.3 | % |
Pharmaceuticals | | | 11.3 | |
Banks | | | 6.1 | |
Technology Hardware, Storage & Peripherals | | | 5.6 | |
Real Estate Investment Trusts (REITs) | | | 4.6 | |
Affiliated Money Market Mutual Fund (including 3.1% of collateral for securities on loan) | | | 4.0 | |
Diversified Telecommunication Services | | | 4.0 | |
Airlines | | | 3.6 | |
Hotels, Restaurants & Leisure | | | 3.6 | |
Software | | | 3.4 | |
Road & Rail | | | 3.3 | |
Specialty Retail | | | 2.9 | |
Beverages | | | 2.8 | |
Internet Software & Services | | | 2.7 | |
Media | | | 2.7 | |
Chemicals | | | 2.3 | |
IT Services | | | 2.1 | |
Food Products | | | 2.1 | |
Industrial Conglomerates | | | 2.0 | |
Insurance | | | 1.8 | |
Wireless Telecommunication Services | | | 1.7 | % |
Tobacco | | | 1.7 | |
Electric Utilities | | | 1.6 | |
Capital Markets | | | 1.6 | |
Independent Power & Renewable Electricity Producers | | | 1.6 | |
Household Products | | | 1.5 | |
Communications Equipment | | | 1.5 | |
Life Sciences Tools & Services | | | 1.3 | |
Aerospace & Defense | | | 1.2 | |
Biotechnology | | | 1.1 | |
Multi-Utilities | | | 1.0 | |
Semiconductors & Semiconductor Equipment | | | 0.9 | |
Commercial Services & Supplies | | | 0.5 | |
Metals & Mining | | | 0.3 | |
Leisure Products | | | 0.3 | |
| | | | |
| | | 103.0 | |
Liabilities in excess of other assets | | | (3.0 | ) |
| | | | |
| | | 100.0 | % |
| | | | |
See Notes to Financial Statements.
PRUDENTIAL INVESTMENTS»MUTUAL FUNDS
FINANCIAL STATEMENTS
ANNUAL REPORT · OCTOBER 31, 2014
Prudential Jennison Equity Income Fund
Statement of Assets & Liabilities
as of October 31, 2014
| | | | |
Assets | | | | |
Investments at value, including securities on loan of $155,096,152: | | | | |
Unaffiliated investments (cost $4,135,935,148) | | $ | 5,000,632,919 | |
Affiliated investments (cost $201,571,943) | | | 201,571,943 | |
Receivable for investments sold | | | 70,257,035 | |
Receivable for Fund shares sold | | | 14,431,449 | |
Dividends and interest receivable | | | 6,200,015 | |
Tax reclaim receivable | | | 3,297,663 | |
Prepaid expenses | | | 48,572 | |
| | | | |
Total assets | | | 5,296,439,596 | |
| | | | |
| |
Liabilities | | | | |
Payable to broker for collateral for securities on loan | | | 156,479,627 | |
Payable for investments purchased | | | 73,286,234 | |
Payable for Fund shares reacquired | | | 9,664,703 | |
Management fee payable | | | 3,080,388 | |
Distribution fee payable | | | 1,567,963 | |
Accrued expenses and other liabilities | | | 941,919 | |
Affiliated transfer agent fee payable | | | 104,851 | |
Deferred directors’ fees | | | 2,152 | |
| | | | |
Total liabilities | | | 245,127,837 | |
| | | | |
| |
Net Assets | | $ | 5,051,311,759 | |
| | | | |
| | | | | |
Net assets were comprised of: | | | | |
Common stock, at $0.001 par value | | $ | 288,067 | |
Paid-in capital in excess of par | | | 3,989,463,226 | |
| | | | |
| | | 3,989,751,293 | |
Distributions in excess of net investment income | | | (919,184 | ) |
Accumulated net realized gain on investment and foreign currency transactions | | | 198,010,471 | |
Net unrealized appreciation on investments and foreign currencies | | | 864,469,179 | |
| | | | |
Net assets, October 31, 2014 | | $ | 5,051,311,759 | |
| | | | |
See Notes to Financial Statements.
| | | | |
Class A | | | | |
Net asset value and redemption price per share,
($1,751,798,703 ÷ 97,959,802 shares of common stock issued and outstanding) | | $ | 17.88 | |
Maximum sales charge (5.5% of offering price) | | | 1.04 | |
| | | | |
Maximum offering price to public | | $ | 18.92 | |
| | | | |
| |
Class B | | | | |
Net asset value, offering price and redemption price per share,
($173,731,228 ÷ 10,348,077 shares of common stock issued and outstanding) | | $ | 16.79 | |
| | | | |
| |
Class C | | | | |
Net asset value, offering price and redemption price per share,
($1,302,224,965 ÷ 77,748,138 shares of common stock issued and outstanding) | | $ | 16.75 | |
| | | | |
| |
Class Q | | | | |
Net asset value, offering price and redemption price per share,
($5,588,199 ÷ 312,270 shares of common stock issued and outstanding) | | $ | 17.90 | |
| | | | |
| |
Class R | | | | |
Net asset value, offering price and redemption price per share,
($40,311,389 ÷ 2,254,677 shares of common stock issued and outstanding) | | $ | 17.88 | |
| | | | |
| |
Class Z | | | | |
Net asset value, offering price and redemption price per share,
($1,777,657,275 ÷ 99,444,414 shares of common stock issued and outstanding) | | $ | 17.88 | |
| | | | |
See Notes to Financial Statements.
| | | | |
| Prudential Jennison Equity Income Fund | | | 25 | |
Statement of Operations
Year Ended October 31, 2014
| | | | |
Net Investment Income | | | | |
Income | | | | |
Unaffiliated dividend income (net of foreign withholding taxes of $4,015,782) | | $ | 224,434,600 | |
Interest income | | | 10,427,971 | |
Affiliated income from securities lending, net | | | 534,866 | |
Affiliated dividend income | | | 69,927 | |
| | | | |
Total income | | | 235,467,364 | |
| | | | |
| |
Expenses | | | | |
Management fee | | | 35,213,600 | |
Distribution fee—Class A | | | 5,421,912 | |
Distribution fee—Class B | | | 1,719,268 | |
Distribution fee—Class C | | | 11,957,006 | |
Distribution fee—Class R | | | 243,609 | |
Distribution fee—Class X | | | 1,081 | |
Transfer agent’s fees and expenses (including affiliated expense of $567,000) | | | 4,660,000 | |
Custodian’s fees and expenses | | | 479,000 | |
Reports to shareholders | | | 197,000 | |
Registration fees | | | 191,000 | |
Directors’ fees | | | 113,000 | |
Insurance fees | | | 51,000 | |
Legal fees and expenses | | | 42,000 | |
Audit fee | | | 26,000 | |
Interest expense | | | 1,047 | |
Miscellaneous | | | 172,557 | |
| | | | |
Total expenses | | | 60,489,080 | |
Less: Distribution fee waiver—Class A | | | (903,652 | ) |
Distribution fee waiver—Class R | | | (81,203 | ) |
| | | | |
Net expenses | | | 59,504,225 | |
| | | | |
Net investment income | | | 175,963,139 | |
| | | | |
| |
Realized and Unrealized Gain (Loss) on Investment and Foreign Currency Transactions | | | | |
Net realized gain (loss) on: | | | | |
Investment transactions | | | 211,249,686 | |
Foreign currency transactions | | | (113,656 | ) |
| | | | |
| | | 211,136,030 | |
| | | | |
Net change in unrealized appreciation (depreciation) on: | | | | |
Investments | | | 263,893,965 | |
Foreign currencies | | | (244,012 | ) |
| | | | |
| | | 263,649,953 | |
| | | | |
Net gain on investments | | | 474,785,983 | |
| | | | |
Net Increase In Net Assets Resulting From Operations | | $ | 650,749,122 | |
| | | | |
See Notes to Financial Statements.
Statement of Changes in Net Assets
| | | | | | | | |
| | | Year Ended October 31, | |
| | | 2014 | | | 2013 | |
Increase (Decrease) in Net Assets | | | | | | | | |
Operations | | | | | | | | |
Net investment income | | $ | 175,963,139 | | | $ | 86,240,008 | |
Net realized gain on investment and foreign currency transactions | | | 211,136,030 | | | | 303,488,538 | |
Net change in unrealized appreciation (depreciation) on investments | | | 263,649,953 | | | | 386,358,012 | |
| | | | | | | | |
Net increase in net assets resulting from operations | | | 650,749,122 | | | | 776,086,558 | |
| | | | | | | | |
| | |
Dividends and Distributions (Note 2) | | | | | | | | |
Dividends from net investment income: | | | | | | | | |
Class A | | | (73,909,591 | ) | | | (43,485,665 | ) |
Class B | | | (6,171,065 | ) | | | (2,823,988 | ) |
Class C | | | (42,727,307 | ) | | | (20,929,195 | ) |
Class Q | | | (131,499 | ) | | | (78,867 | ) |
Class R | | | (1,233,844 | ) | | | (385,089 | ) |
Class X | | | (1,943 | ) | | | (23,415 | ) |
Class Z | | | (60,866,615 | ) | | | (33,431,806 | ) |
| | | | | | | | |
| | | (185,041,864 | ) | | | (101,158,025 | ) |
| | | | | | | | |
Distributions from net realized gains: | | | | | | | | |
Class A | | | (75,598,648 | ) | | | — | |
Class B | | | (7,411,991 | ) | | | — | |
Class C | | | (50,122,234 | ) | | | — | |
Class Q | | | (127,029 | ) | | | — | |
Class R | | | (1,119,700 | ) | | | — | |
Class X | | | (13,494 | ) | | | — | |
Class Z | | | (55,212,077 | ) | | | — | |
| | | | | | | | |
| | | (189,605,173 | ) | | | — | |
| | | | | | | | |
| | |
Fund share transactions (Net of share conversions) (Note 5) | | | | | | | | |
Net proceeds from shares sold | | | 1,077,288,034 | | | | 1,254,342,637 | |
Net asset value of shares issued in reinvestment of dividends | | | 299,541,549 | | | | 77,643,037 | |
Net asset value of shares issued in merger (Note 9) | | | — | | | | 168,106,726 | |
Cost of shares reacquired | | | (845,558,799 | ) | | | (811,906,121 | ) |
| | | | | | | | |
Net increase in net assets from Fund share transactions | | | 531,270,784 | | | | 688,186,279 | |
| | | | | | | | |
Total increase | | | 807,372,869 | | | | 1,363,114,812 | |
| | |
Net Assets: | | | | | | | | |
Beginning of year | | | 4,243,938,890 | | | | 2,880,824,078 | |
| | | | | | | | |
End of year(a) | | $ | 5,051,311,759 | | | $ | 4,243,938,890 | |
| | | | | | | | |
(a) Includes undistributed net investment income of: | | $ | — | | | $ | 2,474,263 | |
| | | | | | | | |
See Notes to Financial Statements.
| | | | |
| Prudential Jennison Equity Income Fund | | | 27 | |
Notes to Financial Statements
1. Organization
Prudential Investment Portfolios, Inc. 10 (the “Company”) is an open-end management investment company, registered under the Investment Company Act of 1940, as amended, (“1940 Act”). The Company was organized on March 5, 1997, as a Maryland Corporation. The Company operates as a series company. At October 31, 2014, the Company consisted of two diversified investment portfolios (each a “Fund” and collectively the “Funds”). The information presented in these financial statements pertains to Prudential Jennison Equity Income Fund (the “Fund”). The investment objective of the Fund is income and capital appreciation.
2. Significant Accounting Policies
The following accounting policies conform to U.S. generally accepted accounting principles. The Fund consistently follows such policies in the preparation of its financial statements.
Securities Valuation: The Fund holds securities and other assets that are fair valued at the close of each day the New York Stock Exchange (“NYSE”) is open for trading. Fair value is the price that would be received to sell an asset or paid to transfer a liability in an orderly transaction between market participants on the measurement date. The Board of Trustees (the “Board”) has adopted Valuation Procedures for security valuation under which fair valuation responsibilities have been delegated to Prudential Investments LLC (“PI”). Under the current Valuation Procedures, the established Valuation Committee is responsible for supervising the valuation of portfolio securities and other assets. The Valuation Procedures permit the Fund to utilize independent pricing vendor services, quotations from market makers, and alternative valuation methods when market quotations are either not readily available or not deemed representative of fair value. A record of the Valuation Committee’s actions is subject to the Board’s review, approval, and ratification at its next regularly-scheduled quarterly meeting.
Various inputs determine how the Fund’s investments are valued, all of which are categorized according to the three broad levels (Level 1, 2, or 3) detailed in the table following the Portfolio of Investments.
Common and preferred stocks, exchange-traded funds, and derivative instruments such as futures or options that are traded on a national securities exchange are valued
at the last sale price as of the close of trading on the applicable exchange. Securities traded via NASDAQ are valued at the NASDAQ official closing price. To the extent these securities are valued at the last sale price or NASDAQ official closing price, they are classified as Level 1 in the fair value hierarchy except for exchange-traded and cleared swaps which are classified as Level 2 in the fair value hierarchy, as the prices marked at the official settle are not public.
In the event that no sale or official closing price on valuation date exists, these securities are generally valued at the mean between the last reported bid and ask prices, or at the last bid price in the absence of an ask price. These securities are classified as Level 2 in the fair value hierarchy, as the inputs are observable and considered to be significant to the valuation.
Common and preferred stocks, exchange-traded funds, and derivative instruments such as futures or options that are traded on a national securities exchange are valued at the last sale price as of the close of trading on the applicable exchange. Securities traded via NASDAQ are valued at the NASDAQ official closing price. To the extent these securities are valued at the last sale price or NASDAQ official closing price, they are classified as Level 1 in the fair value hierarchy.
Investments in open-end, non-exchange-traded mutual funds are valued at their net asset values as of the close of the NYSE on the date of valuation. These securities are classified as Level 1 in the fair value hierarchy since they may be purchased or sold at their net asset values on the date of valuation.
Fixed income securities traded in the over-the-counter market are generally valued at prices provided by approved independent pricing vendors. The pricing vendors provide these prices after evaluating observable inputs including, but not limited to yield curves, yield spreads, credit ratings, deal terms, tranche level attributes, default rates, cash flows, prepayment speeds, broker/dealer quotations, and reported trades. Securities valued using such vendor prices are classified as Level 2 in the fair value hierarchy.
Over-the-counter derivative instruments are generally valued using pricing vendor services, which derive the valuation based on inputs such as underlying asset prices, indices, spreads, interest rates, and exchange rates. These instruments are categorized as Level 2 in the fair value hierarchy.
Centrally cleared swaps listed or traded on a multilateral or trade facility platform, such as a registered exchange, are valued at the daily settlement price determined by the respective exchange. These securities are classified as Level 2 in the fair value hierarchy, as the prices marked at the official settle are not public.
| | | | |
| Prudential Jennison Equity Income Fund | | | 29 | |
Notes to Financial Statements
continued
Fund securities and other assets that cannot be priced according to the methods described above are valued based on pricing methodologies approved by the Board. In the event that significant unobservable inputs are used when determining such valuations, the securities will be classified as Level 3 in the fair value hierarchy.
When determining the fair value of securities, some of the factors influencing the valuation include: the nature of any restrictions on disposition of the securities; assessment of the general liquidity of the securities; the issuer’s financial condition and the markets in which it does business; the cost of the investment; the size of the holding and the capitalization of the issuer; the prices of any recent transactions or bids/offers for such securities or any comparable securities; any available analyst media or other reports or information deemed reliable by the investment adviser regarding the issuer or the markets or industry in which it operates. Using fair value to price securities may result in a value that is different from a security’s most recent closing price and from the price used by other mutual funds to calculate their net asset values.
Restricted and Illiquid Securities: Subject to the guidelines adopted by the Board, the Fund may invest up to 15% of its net assets in illiquid securities, including those which are restricted as to disposition under securities law (“restricted securities”). Restricted securities are valued pursuant to the valuation procedures noted above. Illiquid securities are those that, because of the absence of a readily available market or due to legal or contractual restrictions on resale, cannot be sold within seven days in the ordinary course of business at approximately the amount at which the Fund has valued the investment.
Therefore, the Fund may find it difficult to sell illiquid securities at the time considered most advantageous by its Subadviser and may incur expenses that would not be incurred in the sale of securities that were freely marketable. Certain securities that would otherwise be considered illiquid because of legal restrictions on resale to the general public may be traded among qualified institutional buyers under Rule 144A of the Securities Act of 1933. These Rule 144A securities, as well as commercial paper that is sold in private placements under Section 4(2) of the Securities Act, may be deemed liquid by the Fund’s Subadviser under the guidelines adopted by the Directors of the Fund. However, the liquidity of the Fund’s investments in Rule 144A securities could be impaired if trading does not develop or declines.
Foreign Currency Translation: The books and records of the Fund are maintained in U.S. dollars. Foreign currency amounts are translated into U.S. dollars on the following basis:
(i) market value of investment securities, other assets and liabilities—at the current rates of exchange.
(ii) purchases and sales of investment securities, income and expenses—at the rates of exchange prevailing on the respective dates of such transactions.
Although the net assets of the Fund are presented at the foreign exchange rates and market values at the close of the period, the Fund does not isolate that portion of the results of operations arising as a result of changes in the foreign exchange rates from the fluctuations arising from changes in the market prices of long-term portfolio securities held at the end of the period. Similarly, the Fund does not isolate the effect of changes in foreign exchange rates from the fluctuations arising from changes in the market prices of long-term portfolio securities sold during the period. Accordingly, realized foreign currency gains or losses are included in the reported net realized gains or losses on investment transactions.
Net realized gains or losses on foreign currency transactions represent net foreign exchange gains or losses from sales and maturities of short-term securities and forward currency contracts, disposition of foreign currencies, currency gains or losses realized between the trade and settlement dates on security transactions, and the difference between the amounts of dividends, interest and foreign withholding taxes recorded on the Fund’s books and the U.S. dollar equivalent amounts actually received or paid. Net unrealized currency gains or losses from valuing foreign currency denominated assets and liabilities (other than investments) at period end exchange rates are reflected as a component of net unrealized appreciation (depreciation) on foreign currencies.
Concentration of Risk: The ability of debt securities issuers (other than those issued or guaranteed by the U.S. Government) held by the Fund to meet its obligations may be affected by the economic or political developments in a specific industry, region or country. Foreign security and currency transactions may involve certain considerations and risks not typically associated with those of U.S. companies as a result of, among other factors, the possibility of political or economic instability or the level of governmental supervision and regulation of foreign securities markets.
Options: The Fund purchased and wrote options in order to hedge against adverse market movements or fluctuations in value caused by changes in prevailing interest rates or foreign currency exchange rates, with respect to securities which the Fund
| | | | |
| Prudential Jennison Equity Income Fund | | | 31 | |
Notes to Financial Statements
continued
currently owns or intends to purchase. The Fund’s principal reason for writing options is to realize, through receipt of premiums, a greater current return than would be realized on the underlying security alone. When the Fund purchases an option, it pays a premium and an amount equal to that premium is recorded as an asset. When the Fund writes an option, it receives a premium and an amount equal to that premium is recorded as a liability. The asset or liability is adjusted daily to reflect the current market value of the option. If an option expires unexercised, the Fund realizes a gain or loss to the extent of the premium received or paid. If an option is exercised, the premium received or paid is recorded as an adjustment to the proceeds from the sale or the cost of the purchase in determining whether the Fund has realized a gain or loss. The difference between the premium and the amount received or paid at the closing of a purchase or sale transaction is also treated as a realized gain or loss. Gain or loss on purchased options is included in net realized gain or loss on investment transactions. Gain or loss on written options is presented separately as net realized gain or loss on options written. The Fund, as writer of an option, may have no control over whether the underlying securities may be sold (called) or purchased (put). As a result, the Fund bears the market risk of an unfavorable change in the price of the security underlying the written option. The Fund, as purchaser of an over-the-counter option, bears the risk of the potential inability of the counterparties to meet the terms of their contracts. With exchange-traded options contracts, there is minimal counterparty credit risk to the Fund since the exchanges’ clearinghouse acts as counterparty to all exchange-traded options and guarantees the options contracts against default.
Master Netting Arrangements: The Fund is subject to various Master Agreements, or netting arrangements, with select counterparties. A master netting arrangement between the Fund and the counterparty permits the Fund to offset amounts payable by the Fund to the same counterparty against amounts to be received; and by the receipt of collateral from the counterparty by the Fund to cover the Fund’s exposure to the counterparty. However, there is no assurance that such mitigating factors are easily enforceable. The right to set-off exists when all the conditions are met such that each of the parties owes the other determinable amounts, the reporting party has the right to set-off the amount owed with the amount owed by the other party, the reporting party intends to set-off and the right of set-off is enforceable by law. During the reporting period, there were no instances where the right of set-off existed and management has not elected to offset.
The Fund is a party to ISDA (International Swaps and Derivatives Association, Inc.) Master Agreements with certain counterparties that govern over-the-counter derivative and foreign exchange contracts entered into from time to time. The Master Agreements may contain provisions regarding, among other things, the parties’ general obligations, representations, agreements, collateral requirements, events of default and early termination. With respect to certain counterparties, in accordance with the terms of the Master Agreements, collateral posted to the Fund is held in a segregated account by the Fund’s custodian and with respect to those amounts which can be sold or re-pledged, is presented in the Portfolio of Investments. Collateral pledged by the Fund is segregated by the Fund’s custodian and identified in the Portfolio of Investments. Collateral can be in the form of cash or debt securities issued by the U.S. Government or related agencies or other securities as agreed to by the Fund and the applicable counterparty. Collateral requirements are determined based on the Fund’s net position with each counterparty. Termination events applicable to the Fund may occur upon a decline in the Fund’s net assets below a specified threshold over a certain period of time. Termination events applicable to counterparties may occur upon a decline in the counterparty’s long-term and short term credit ratings below a specified level. In each case, upon occurrence, the other party may elect to terminate early and cause settlement of all derivative and foreign exchange contracts outstanding, including the payment of any losses and costs resulting from such early termination, as reasonably determined by the terminating party. Any decision by one or more of the Fund’s counterparties to elect early termination could impact the Fund’s future derivative activity.
In addition to each instrument’s primary underlying risk exposure (e.g. interest rate, credit, equity or foreign exchange, etc.), swap agreements involve, to varying degrees, elements of credit, market and documentation risk. Such risks involve the possibility that no liquid market for these agreements will exist, the counterparty to the agreement may default on its obligation to perform or disagree on the contractual terms of the agreement, and changes in net interest rates will be unfavorable. In connection with these agreements, securities in the portfolio may be identified or received as collateral from the counterparty in accordance with the terms of the respective swap agreements to provide or receive assets of value and to serve as recourse in the event of default or bankruptcy/insolvency of either party. Such over-the-counter derivative agreements include conditions which, when materialized, give the counterparty the right to cause an early termination of the transactions under those agreements. Any election by the counterparty for early termination of the contract(s) may impact the amounts reported on financial statements.
As of October 31, 2014, the Fund has not met conditions under such agreements which give the counterparty the right to call for an early termination.
| | | | |
| Prudential Jennison Equity Income Fund | | | 33 | |
Notes to Financial Statements
continued
Forward currency contracts, written options, short sales, swaps and financial futures contracts involve elements of both market and credit risk in excess of the amounts reflected on the Statement of Assets and Liabilities. Such risks may be mitigated by engaging in master netting arrangements.
Securities Lending: The Fund may lend its portfolio securities to banks and broker-dealers. The loans are secured by collateral at least equal to the market value of the securities loaned. Collateral pledged by each borrower is invested in a highly liquid short-term money market fund and is marked to market daily, based on the previous day’s market value, such that the value of the collateral exceeds the value of the loaned securities. Loans are subject to termination at the option of the borrower or the Fund. Upon termination of the loan, the borrower will return to the Fund securities identical to the loaned securities. Should the borrower of the securities fail financially, the Fund has the right to repurchase the securities using the collateral in the open market. The Fund recognizes income, net of any rebate and securities lending agent fees, for lending its securities, and any interest on the investment of cash received as collateral. The Fund also continues to receive interest and dividends or amounts equivalent thereto, on the securities loaned and recognizes any unrealized gain or loss in the market price of the securities loaned that may occur during the term of the loan.
Securities Transactions and Net Investment Income: Securities transactions are recorded on the trade date. Realized gains or losses from investment and currency transactions are calculated on the identified cost basis. Dividend income is recorded on the ex-dividend date. Interest income, including amortization of premium and accretion of discount on debt securities, as required, is recorded on an accrual basis. Expenses are recorded on an accrual basis, which may require the use of certain estimates by management that may differ from actual.
Net investment income or loss (other than distribution fees which are charged directly to the respective class and transfer agency fees specific to Class Q shares which are charged to that share class) and unrealized and realized gains or losses are allocated daily to each class of shares based upon the relative proportion of adjusted net assets of each class at the beginning of the day.
Dividends and Distributions to Shareholders: Dividends and distributions to shareholders are recorded on the ex-dividend date. Dividends, if any, from net investment income are declared and paid at least quarterly. These dividends and distributions are determined in
accordance with federal income tax regulations and may differ from accounting principles generally accepted in the United States of America.
Net realized gains from investment transactions, if any, are distributed at least annually. Permanent book/tax differences relating to income and gains are reclassified to paid-in capital when they arise.
Taxes: For federal income tax purposes, each Fund in the Company is treated as a separate tax paying entity. It is the Funds’ policy to continue to meet the requirements of the Internal Revenue Code applicable to regulated investment companies and to distribute all of its taxable net income and capital gains, if any, to shareholders. Therefore, no federal tax provision is required. Withholding taxes on foreign dividends are recorded net of reclaimable amounts, at the time the related income is earned.
Estimates: The preparation of the financial statements requires management to make estimates and assumptions that affect the reported amounts and disclosures in the financial statements. Actual results could differ from those estimates.
3. Agreements
The Fund has entered into investment management agreements with PI which provides that the Manager will furnish the Fund with investment advice and investment management and administrative services. The Manager has entered into a subadvisory agreement with Jennison Associates LLC.
Advisory Fee and Expense Limitations: The Manager receives a fee, accrued daily and paid monthly, based on an annual rate of the average net assets. The Manager pays the subadvisor a fee as compensation for advisory services provided to the Fund. The Manager has voluntarily agreed to waive expenses in accordance with limitation expense policies as noted in the table below. The Manager will reimburse the Fund for its operating expenses, exclusive of taxes, interest, brokerage commissions, distribution fees and extraordinary expenses, but inclusive of the advisory fee, which in the aggregate exceed specified percentages of the Fund’s average net assets while retaining their ability to be reimbursed for such fee waivers prior to the end of the fiscal year. The advisory fee and expense limitation are summarized as follows:
| | | | | | |
Advisory Fee
through June 30, 2014 | | Advisory Fee
at October 31, 2014 | | Effective Advisory Fee | | Expense
Limitation |
| .85% to $500 million | | .85% to $500 million; | | .75% | | 1.15% |
| .80% next $500 million | | .80% next $500 million; | | | | |
| .75% next $1.5 billion | | .75% next $1.5 billion; | | | | |
| .725% in excess of $2.5 billion | | .725% next $2.5 billion | | | | |
| | .70% next $2.5 billion | | | | |
| | .675% next $2.5 billion | | | | |
| | .65% in excess of $10 billion | | | | |
| | | | |
| Prudential Jennison Equity Income Fund | | | 35 | |
Notes to Financial Statements
continued
Such contractual fee waivers or reductions have been calculated prior to any fee reimbursements with respect to the expense limitations, and may be rescinded at any time and without notice to investors. All reimbursements by the Manager are reflected in the Statements of Operations.
Certain officers and directors of the Fund are officers or directors of the Manager. The Fund pays no compensation directly to its officers or interested directors.
The Fund has distribution agreements with Prudential Investment Management Services LLC (“PIMS”) and Prudential Annuities Distributors, Inc. (“PAD”). PIMS and PAD are both affiliates of PI and indirect, wholly-owned subsidiaries of Prudential. PIMS serves as the distributor of the Fund’s Class A, Class B, Class C, Class Q, Class R and Class Z shares. PIMS, together with PAD, serves as co-distributor of the Fund’s Class X shares.
The Company has adopted a separate Distribution and Service plan (each a “Plan” and collectively the “Plans”) for the Class A, Class B, Class C, Class R and Class X shares of the Fund in accordance with Rule 12b-1 of the 1940 Act. No distribution or service fees are paid to PIMS as distributor for the Fund’s Class Q or Class Z shares.
Under the Plans, the Fund compensates PIMS and PAD a distribution and service fee at an annual rate up to .30%, 1.00%, 1.00%, .75% and 1.00% of the average daily net assets of the Class A, B, C, R and X shares, respectively. Through February 29, 2016, PIMS has contractually agreed to limit such fees to .25% and .50% of the average daily net assets of the Class A shares and Class R shares, respectively.
During the year ended October 31, 2014, PIMS has advised the Fund, front-end sales charges (“FESC”) and gross contingent deferred sales charges (“CDSC”) were as follows:
| | | | | | |
Class A
FESC | | Class A
CDSC | | Class B
CDSC | | Class C
CDSC |
| $3,719,768 | | $37,242 | | $249,051 | | $66,232 |
4. Other Transactions with Affiliates
Prudential Mutual Fund Services LLC (“PMFS”), an affiliate of Prudential Investments LLC and an indirect, wholly-owned subsidiary of Prudential, serves as the Fund’s
transfer agent. Transfer agent fees and expenses shown in the Statements of Operations include certain out-of pocket expenses paid to non-affiliates, where applicable.
The Fund invests in the Prudential Core Taxable Money Market Fund (the “Core Fund”), a portfolio of the Prudential Investment Portfolios 2, registered under the 1940 Act, and managed by PI. Earnings from the Core Fund are disclosed on the Statement of Operations as affiliated dividend income.
Prudential Investment Management, Inc. (“PIM”), an indirect, wholly-owned subsidiary of Prudential, served as the Fund’s securities lending agent. For the year ended October 31, 2014, PIM has been compensated approximately $160,000 for these services.
5. Shares of Capital Stock
The Fund offers Class A, Class B, Class C, Class Q, Class R, Class X and Class Z shares. Class A shares are sold with a front-end sales charge of up to 5.50%. Purchases of $1 million or more are subject to a contingent deferred sales charge (“CDSC”) if shares are redeemed within 12 months of their purchase. Class B shares are sold with a CDSC which declines from 5% to zero depending upon the period of time the shares are held. Class B shares will automatically convert to Class A shares approximately seven years after purchase. Class B shares are closed to new purchases. Class C shares are sold with a CDSC of 1% on shares redeemed within the first 12 months of purchase. As of April 11, 2014, the last conversion of Class X to Class A shares was completed. There are no Class X shares outstanding and Class X shares are no longer being offered for sale. Class Q, Class R and Class Z shares are not subject to any sales or redemption charge and are offered exclusively for sale to a limited group of investors.
Under certain circumstances, an exchange may be made from specified share classes of the Fund to one or more other share classes of the Fund as presented in the table of transactions in shares of capital.
At October 31, 2014, Prudential through its affiliates owned 89 Class Q shares of the Fund.
Of the Company’s authorized capital stock, 725 million authorized shares have been allocated to the Fund and divided into eight classes, designated Class A, Class B, Class C, Class M, Class Q, Class R, Class X and Class Z capital stock, each of which consists of 253 million, 20 million, 150 million, 1 million, 75 million, 75 million, 1 million and 150 million authorized shares, respectively.
| | | | |
| Prudential Jennison Equity Income Fund | | | 37 | |
Notes to Financial Statements
continued
Transactions in shares of capital were as follows:
| | | | | | | | |
Class A | | Shares | | | Amount | |
Year ended October 31, 2014: | | | | | | | | |
Shares sold | | | 19,772,027 | | | $ | 341,304,043 | |
Shares issued in reinvestment of dividends and distributions | | | 7,719,746 | | | | 131,158,157 | |
Shares reacquired | | | (21,576,424 | ) | | | (371,588,004 | ) |
| | | | | | | | |
Net increase (decrease) in shares outstanding before conversion | | | 5,915,349 | | | | 100,874,196 | |
Shares issued upon conversion from Class B, Class C, Class X and Class Z | | | 549,238 | | | | 9,557,038 | |
Shares reacquired upon conversion into Class Z | | | (11,699,065 | ) | | | (207,405,353 | ) |
| | | | | | | | |
Net increase (decrease) in shares outstanding | | | (5,234,478 | ) | | $ | (96,974,119 | ) |
| | | | | | | | |
Year ended October 31, 2013: | | | | | | | | |
Shares sold | | | 28,325,470 | | | $ | 433,427,788 | |
Shares issued in merger | | | 7,610,532 | | | | 114,043,817 | |
Shares issued in reinvestment of dividends and distributions | | | 2,470,850 | | | | 36,541,259 | |
Shares reacquired | | | (25,026,307 | ) | | | (379,361,580 | ) |
| | | | | | | | |
Net increase (decrease) in shares outstanding before conversion | | | 13,380,545 | | | | 204,651,284 | |
Shares issued upon conversion from Class B, Class X and Class Z | | | 405,206 | | | | 6,168,718 | |
Shares reacquired upon conversion into Class Z | | | (483,118 | ) | | | (7,480,271 | ) |
| | | | | | | | |
Net increase (decrease) in shares outstanding | | | 13,302,633 | | | $ | 203,339,731 | |
| | | | | | | | |
Class B | | | | | | |
Year ended October 31, 2014: | | | | | | | | |
Shares sold | | | 1,398,222 | | | $ | 22,495,945 | |
Shares issued in reinvestment of dividends and distributions | | | 636,596 | | | | 10,163,772 | |
Shares reacquired | | | (1,333,393 | ) | | | (21,636,977 | ) |
| | | | | | | | |
Net increase (decrease) in shares outstanding before conversion | | | 701,425 | | | | 11,022,740 | |
Shares reacquired upon conversion into Class A | | | (370,147 | ) | | | (6,076,656 | ) |
| | | | | | | | |
Net increase (decrease) in shares outstanding | | | 331,278 | | | $ | 4,946,084 | |
| | | | | | | | |
Year ended October 31, 2013: | | | | | | | | |
Shares sold | | | 2,928,030 | | | $ | 42,560,655 | |
Shares issued in merger | | | 1,112,052 | | | | 15,752,745 | |
Shares issued in reinvestment of dividends and distributions | | | 137,354 | | | | 1,916,390 | |
Shares reacquired | | | (887,237 | ) | | | (12,758,306 | ) |
| | | | | | | | |
Net increase (decrease) in shares outstanding before conversion | | | 3,290,199 | | | | 47,471,484 | |
Shares reacquired upon conversion into Class A | | | (160,991 | ) | | | (2,346,248 | ) |
| | | | | | | | |
Net increase (decrease) in shares outstanding | | | 3,129,208 | | | $ | 45,125,236 | |
| | | | | | | | |
| | | | | | | | |
Class C | | Shares | | | Amount | |
Year ended October 31, 2014: | | | | | | | | |
Shares sold | | | 15,196,817 | | | $ | 246,065,986 | |
Shares issued in reinvestment of dividends and distributions | | | 4,487,201 | | | | 71,527,544 | |
Shares reacquired | | | (7,986,822 | ) | | | (129,283,777 | ) |
| | | | | | | | |
Net increase (decrease) in shares outstanding before conversion | | | 11,697,196 | | | | 188,309,753 | |
Shares reacquired upon conversion into Class A and Class Z | | | (1,175,887 | ) | | | (19,157,550 | ) |
| | | | | | | | |
Net increase (decrease) in shares outstanding | | | 10,521,309 | | | $ | 169,152,203 | |
| | | | | | | | |
Year ended October 31, 2013: | | | | | | | | |
Shares sold | | | 20,066,526 | | | $ | 291,143,523 | |
Shares issued in merger | | | 2,513,330 | | | | 35,553,074 | |
Shares issued in reinvestment of dividends and distributions | | | 1,082,292 | | | | 15,041,870 | |
Shares reacquired | | | (8,233,400 | ) | | | (118,003,465 | ) |
| | | | | | | | |
Net increase (decrease) in shares outstanding before conversion | | | 15,428,748 | | | | 223,735,002 | |
Shares reacquired upon conversion into Class Z | | | (912,358 | ) | | | (13,065,924 | ) |
| | | | | | | | |
Net increase (decrease) in shares outstanding | | | 14,516,390 | | | $ | 210,669,078 | |
| | | | | | | | |
Class Q | | | | | | |
Year ended October 31, 2014: | | | | | | | | |
Shares sold | | | 270,782 | | | $ | 4,708,044 | |
Shares issued in reinvestment of dividends and distributions | | | 15,239 | | | | 258,528 | |
Shares reacquired | | | (135,464 | ) | | | (2,315,030 | ) |
| | | | | | | | |
Net increase (decrease) in shares outstanding | | | 150,557 | | | $ | 2,651,542 | |
| | | | | | | | |
Year ended October 31, 2013: | | | | | | | | |
Shares sold | | | 72,650 | | | $ | 1,096,724 | |
Shares issued in reinvestment of dividends and distributions | | | 5,343 | | | | 78,867 | |
Shares reacquired | | | (74,070 | ) | | | (1,104,393 | ) |
| | | | | | | | |
Net increase (decrease) in shares outstanding | | | 3,923 | | | $ | 71,198 | |
| | | | | | | | |
Class R | | | | | | |
Year ended October 31, 2014: | | | | | | | | |
Shares sold | | | 1,157,507 | | | $ | 19,981,623 | |
Shares issued in reinvestment of dividends and distributions | | | 135,260 | | | | 2,303,085 | |
Shares reacquired | | | (370,628 | ) | | | (6,396,432 | ) |
| | | | | | | | |
Net increase (decrease) in shares outstanding | | | 922,139 | | | $ | 15,888,276 | |
| | | | | | | | |
Year ended October 31, 2013: | | | | | | | | |
Shares sold | | | 868,863 | | | $ | 13,429,543 | |
Shares issued in merger | | | 192 | | | | 2,880 | |
Shares issued in reinvestment of dividends and distributions | | | 24,623 | | | | 367,230 | |
Shares reacquired | | | (201,382 | ) | | | (3,095,665 | ) |
| | | | | | | | |
Net increase (decrease) in shares outstanding | | | 692,296 | | | $ | 10,703,988 | |
| | | | | | | | |
| | | | |
| Prudential Jennison Equity Income Fund | | | 39 | |
Notes to Financial Statements
continued
| | | | | | | | |
Class X | | Shares | | | Amount | |
Period ended April 11, 2014:* | | | | | | | | |
Shares issued in reinvestment of dividends and distributions | | | 970 | | | $ | 15,336 | |
Shares reacquired | | | (1,210 | ) | | | (19,279 | ) |
| | | | | | | | |
Net increase (decrease) in shares outstanding before conversion | | | (240 | ) | | | (3,943 | ) |
Shares reacquired upon conversion into Class A | | | (27,624 | ) | | | (441,185 | ) |
| | | | | | | | |
Net increase (decrease) in shares outstanding | | | (27,864 | ) | | $ | (445,128 | ) |
| | | | | | | | |
Year ended October 31, 2013: | | | | | | | | |
Shares sold | | | 1,800 | | | $ | 25,734 | |
Shares issued in merger | | | 6,216 | | | | 87,873 | |
Shares issued in reinvestment of dividends and distributions | | | 1,703 | | | | 23,233 | |
Shares reacquired | | | (5,705 | ) | | | (82,011 | ) |
| | | | | | | | |
Net increase (decrease) in shares outstanding before conversion | | | 4,014 | | | | 54,829 | |
Shares reacquired upon conversion into Class A | | | (72,036 | ) | | | (1,033,133 | ) |
| | | | | | | | |
Net increase (decrease) in shares outstanding | | | (68,022 | ) | | $ | (978,304 | ) |
| | | | | | | | |
Class Z | | | | | | |
Year ended October 31, 2014: | | | | | | | | |
Shares sold | | | 25,659,760 | | | $ | 442,732,393 | |
Shares issued in reinvestment of dividends and distributions | | | 4,943,646 | | | | 84,115,127 | |
Shares reacquired | | | (18,277,233 | ) | | | (314,319,300 | ) |
| | | | | | | | |
Net increase (decrease) in shares outstanding before conversion | | | 12,326,173 | | | | 212,528,220 | |
Shares issued upon conversion from Class A and Class C | | | 12,792,240 | | | | 226,286,080 | |
Shares reacquired upon conversion into Class A | | | (159,436 | ) | | | (2,762,374 | ) |
| | | | | | | | |
Net increase (decrease) in shares outstanding | | | 24,958,977 | | | $ | 436,051,926 | |
| | | | | | | | |
Year ended October 31, 2013: | | | | | | | | |
Shares sold | | | 30,752,301 | | | $ | 472,658,670 | |
Shares issued in merger | | | 177,971 | | | | 2,666,337 | |
Shares issued in reinvestment of dividends and distributions | | | 1,598,627 | | | | 23,674,188 | |
Shares reacquired | | | (19,481,771 | ) | | | (297,500,701 | ) |
| | | | | | | | |
Net increase (decrease) in shares outstanding before conversion | | | 13,047,128 | | | | 201,498,494 | |
Shares issued upon conversion from Class A and Class C | | | 1,343,373 | | | | 20,536,992 | |
Shares reacquired upon conversion into Class A | | | (184,844 | ) | | | (2,780,134 | ) |
| | | | | | | | |
Net increase (decrease) in shares outstanding | | | 14,205,657 | | | $ | 219,255,352 | |
| | | | | | | | |
6. Tax Information
Distributions to shareholders, which are determined in accordance with federal income tax regulations and which may differ from generally accepted accounting principles, are recorded on the ex-dividend date. In order to present distributions in excess of net investment income, accumulated net realized gain on investment and foreign currency transactions and paid-in capital in excess of par on the Statement of Assets and Liabilities that more closely represent their tax character, certain adjustments have been made to distributions in excess of net investment income and accumulated net realized gain on investment and foreign currency transactions. For the year ended October 31, 2014, the adjustments were to decrease distributions in excess of net investment income and decrease accumulated net realized gain on investment and foreign currency transactions by $5,685,278 due to differences in the treatment for book and tax purposes of certain transactions involving foreign currencies and partnership investments, book/tax differences in the treatment of distributions and other book to tax adjustments. Net investment income, net realized gain (loss) on investment and foreign currency transactions and net assets were not affected by this change.
For the year ended October 31, 2014, the tax character of dividends paid by the Fund was $185,041,864 of ordinary income and $189,605,173 of long-term capital gains. For the year ended October 31, 2013, the tax character of dividends paid as reflected in the Statement of Changes by the Fund was $101,158,025 of ordinary income.
As of October 31, 2014, the accumulated undistributed earnings on a tax basis were $20,742,233 of ordinary income and $183,725,044 of long-term capital gains. This differs from the amount shown on the Statement of Assets and Liabilities primarily due to cumulative timing differences between financial and tax reporting.
The United States federal income tax basis of the Fund’s investments and the net unrealized appreciation as of October 31, 2014 were as follows:
| | | | | | | | | | |
Tax Basis | | Appreciation | | Depreciation | | Net
Unrealized
Appreciation | | Other Cost
Basis
Adjustment | | Total Net
Unrealized
Appreciation |
| $4,344,880,929 | | $1,020,829,713 | | $(163,505,780) | | $857,323,933 | | $(228,592) | | $857,095,341 |
The difference between book basis and tax basis is primarily attributable to deferred losses on wash sales and investments in partnerships. Other cost basis adjustments are primarily attributable to appreciation (depreciation) of foreign currencies and options.
Management has analyzed the Fund’s tax positions taken on federal income tax returns for all open tax years and has concluded that no provision for income tax is required in the Fund’s financial statements for the current reporting period. The
| | | | |
| Prudential Jennison Equity Income Fund | | | 41 | |
Notes to Financial Statements
continued
Fund’s federal and state income and federal excise tax returns for tax years for which the applicable statutes of limitations have not expired are subject to examination by the Internal Revenue Service and state departments of revenue.
7. Portfolio Securities
Purchases and sales of securities, other than short term obligations, during the year ended October 31, 2014, were $2,817,858,758 and $2,652,578,970, respectively.
8. Borrowings
The Fund, along with other affiliated registered investment companies (the “Funds”), is a party to a Syndicated Credit Agreement (“SCA”) with a group of banks. The purpose of the SCA is to provide an alternative source of temporary funding for capital share redemptions. The SCA provides for a commitment of $900 million for the period October 9, 2014 through October 8, 2015. The Funds pay an annualized commitment fee of .075% of the unused portion of the SCA. Prior to October 9, 2014, the Funds had another SCA that provided a commitment of $900 million and the Funds paid an annualized commitment fee of .08% of the unused portion of the SCA. Interest on any borrowings under the SCA is paid at contracted market rates. The commitment fee for the unused amount is accrued daily and paid quarterly.
The Fund borrowed an average balance of $8,920,000 for 3 days at a weighted average interest rate of 1.41% pursuant to the SCA during the year ended October 31, 2014.
9. Reorganization
On December 4, 2012, the Board of Trustees of the Company approved an Agreement and Plan of Reorganization (the “Plan”) which provided for the transfer of all the assets of the following portfolio for shares of the acquiring portfolio and the assumption of the liabilities of the portfolio. Shareholders approved the Plan at a meeting on June 7, 2013 and the reorganization took place on June 21, 2013. The purpose of the transaction was to combine two funds with comparable investment objectives and policies.
The acquisition was accomplished by a tax-free exchange of the following shares on June 21, 2013:
| | | | | | | | | | | | | | | | |
| Merged Portfolio | | | Acquiring Portfolio | |
Target Growth Asset
Allocation Fund | | | Jennison Equity
Income Portfolio | |
Class | | Shares | | | Class | | | Shares | | | Value | |
| A | | | 8,584,038 | | | | A | | | | 7,610,532 | | | $ | 114,043,817 | |
| B | | | 1,293,742 | | | | B | | | | 1,112,052 | | | | 15,752,745 | |
| C | | | 2,917,774 | | | | C | | | | 2,513,330 | | | | 35,553,074 | |
| R | | | 218 | | | | R | | | | 192 | | | | 2,880 | |
| X | | | 7,101 | | | | X | | | | 6,216 | | | | 87,873 | |
| Z | | | 195,311 | | | | Z | | | | 177,971 | | | | 2,666,337 | |
For financial reporting purposes, assets received and shares issued by Jennison Equity Income Portfolio were recorded at fair value; however, the cost basis of the investments received from Target Growth Asset Allocation Fund was carried forward to reflect the tax-free status of the acquisition.
The net assets and net unrealized appreciation (depreciation) immediately before the acquisitions were as follows:
| | | | | | | | | | | | | | | | |
| Merged Portfolio | | | Acquiring Portfolio | |
Target Growth Asset
Allocation Fund | | | Jennison Equity
Income Portfolio | |
Class | | Net Assets | | | Unrealized
Appreciation | | | Class | | | Net Assets | |
| A | | $ | 114,043,817 | | | $ | 9,081,317 | | | | A | | | $ | 1,416,383,180 | |
| B | | | 15,752,745 | | | | 9,232,717 | | | | B | | | | 116,255,227 | |
| C | | | 35,553,074 | | | | 7,264,184 | | | | C | | | | 854,459,849 | |
| R | | | 2,880 | | | | 4,463 | | | | Q | | | | 2,194,387 | |
| X | | | 87,873 | | | | (360,578 | ) | | | R | | | | 16,001,929 | |
| Z | | | 2,666,337 | | | | 9,013,263 | | | | X | | | | 600,811 | |
| | | | | | | | | | | Z | | | | 1,058,696,322 | |
Assuming the acquisition had been completed on November 1, 2012, Jennison Equity Income Portfolio’s results of operations for the year ended October 31, 2013 were as follows:
| | | | |
Net investment income | | $ | 87,324,855 | (a) |
Net realized and unrealized | | $ | 710,167,851 | (b) |
| | | | |
Gain (loss) on investments | | $ | 797,492,706 | |
| | | | |
| (a) | $86,240,008, as reported in the Statement of Operations, plus $619,847 Net Investment Income from Merged Fund pre-merger, plus $465,000 of pro-forma eliminated expenses. |
| (b) | $689,846,550, as reported in the Statement of Operations, plus $20,321,301 Net Realized and Unrealized Gain (loss) on Investments from Merger Fund pre-merger. |
| | | | |
| Prudential Jennison Equity Income Fund | | | 43 | |
Notes to Financial Statements
continued
Because both Jennison Equity Income Portfolio and Target Growth Asset Allocation Fund sold and redeemed shares throughout the period, it is not practicable to provide pro-forma information on a per-share basis.
Because the combined investment portfolios have been managed as a single integrated portfolio since the acquisition was completed, it is also not practicable to separate the amounts of revenue and earnings of Target Growth Asset Allocation Fund that have been included in Jennison Equity Income Portfolio’s Statement of Operations since June 21, 2013.
10. Dividends and Distributions to Shareholders
Subsequent to the fiscal year end, the Fund declared ordinary income dividends and capital gains distributions on December 17, 2014 to shareholders of record on December 18, 2014. The ex-dividend date was December 19, 2014. The per share amounts declared were as follows:
| | | | | | | | | | | | |
| | | Ordinary
Income | | | Short-Term
Capital Gains | | | Long-Term
Capital Gains | |
Class A | | $ | 0.06802 | | | $ | 0.07122 | | | $ | 0.63041 | |
Class B | | $ | 0.03253 | | | $ | 0.07122 | | | $ | 0.63041 | |
Class C | | $ | 0.03253 | | | $ | 0.07122 | | | $ | 0.63041 | |
Class Q | | $ | 0.08729 | | | $ | 0.07122 | | | $ | 0.63041 | |
Class R | | $ | 0.05497 | | | $ | 0.07122 | | | $ | 0.63041 | |
Class Z | | $ | 0.08109 | | | $ | 0.07122 | | | $ | 0.63041 | |
Financial Highlights
| | | | | | | | | | | | | | | | | | | | |
| Class A Shares | |
| | | Year Ended October 31, | |
| | | 2014(b) | | | 2013(b) | | | 2012(b) | | | 2011(b) | | | 2010(b) | |
| Per Share Operating Performance: | | | | | | | | | | | | | | | | | | | | |
| Net Asset Value, Beginning of Year | | | $16.84 | | | | $13.90 | | | | $12.98 | | | | $12.92 | | | | $10.86 | |
| Income from investment operations: | | | | | | | | | | | | | | | | | | | | |
| Net investment income | | | .70 | | | | .40 | | | | .55 | | | | .52 | | | | .43 | |
| Net realized and unrealized gain on investments | | | 1.77 | | | | 3.01 | | | | .83 | | | | .02 | | | | 2.24 | |
| Total from investment operations | | | 2.47 | | | | 3.41 | | | | 1.38 | | | | .54 | | | | 2.67 | |
| Less Dividends and Distributions: | | | | | | | | | | | | | | | | | | | | |
| Dividends from net investment income | | | (.70 | ) | | | (.47 | ) | | | (.46 | ) | | | (.48 | ) | | | (.61 | ) |
| Distributions from net realized gains | | | (.73 | ) | | | - | | | | - | | | | - | | | | - | |
| Total dividends and distributions | | | (1.43 | ) | | | (.47 | ) | | | (.46 | ) | | | (.48 | ) | | | (.61 | ) |
| Capital Contributions(d) | | | - | | | | - | | | | - | | | | - | | | | - | * |
| Net Asset Value, end of year | | | $17.88 | | | | $16.84 | | | | $13.90 | | | | $12.98 | | | | $12.92 | |
| Total Return(a) | | | 15.36% | | | | 25.14% | | | | 10.77% | | | | 4.16% | | | | 25.19% | |
| |
| Ratios/Supplemental Data: | |
| Net assets, end of year (in millions) | | | $1,751.8 | | | | $1,738.3 | | | | $1,249.1 | | | | $935.0 | | | | $313.7 | |
| Average net assets (in millions) | | | $1,807.3 | | | | $1,458.7 | | | | $1,124.3 | | | | $731.3 | | | | $142.5 | |
| Ratios to average net assets(c): | | | | | | | | | | | | | | | | | | | | |
| Expenses After Advisory Fee Waiver and Expense Reimbursement | | | 1.13% | | | | 1.16% | | | | 1.17% | | | | 1.22% | | | | 1.44% | |
| Expenses Before Advisory Fee Waiver and Expense Reimbursement | | | 1.18% | | | | 1.21% | | | | 1.22% | | | | 1.27% | | | | 1.50% | |
| Net investment income | | | 4.04% | | | | 2.63% | | | | 4.07% | | | | 3.88% | | | | 3.62% | |
| Portfolio turnover rate | | | 57% | | | | 91% | | | | 72% | | | | 70% | | | | 49% | |
(a) Total return does not consider the effects of sales load. Total return is calculated assuming a purchase of a share on the first day and a sale on the last day of each year reported and includes reinvestment of dividends and distributions. Total returns may reflect adjustments to conform with generally accepted accounting principles.
(b) Calculations are based on the average daily number of shares outstanding.
(c) Does not include expenses of the underlying portfolio in which the Fund invests.
(d) The Fund received payments related to a former affiliates and to an unaffiliated-third party's settlement of regulatory proceedings involving allegations of improper trading in Fund shares during the fiscal year ended October 31, 2010. The fund was not involved in the proceedings or in the calculation of the amount of the settlement.
* Amount is less than $0.005.
See Notes to Financial Statements.
| | | | |
| Prudential Jennison Equity Income Fund | | | 45 | |
Financial Highlights
continued
| | | | | | | | | | | | | | | | | | | | |
| Class B Shares | | | |
| | | Year Ended October 31, | |
| | | 2014(b) | | | 2013(b) | | | 2012(b) | | | 2011(b) | | | 2010(b) | |
| Per Share Operating Performance: | | | | | | | | | | | | | | | | | | | | |
| Net Asset Value, Beginning of Year | | | $15.90 | | | | $13.15 | | | | $12.31 | | | | $12.27 | | | | $10.30 | |
| Income from investment operations: | | | | | | | | | | | | | | | | | | | | |
| Net investment income | | | .53 | | | | .25 | | | | .43 | | | | .39 | | | | .32 | |
| Net realized and unrealized gain on investments | | | 1.67 | | | | 2.87 | | | | .77 | | | | .04 | | | | 2.13 | |
| Total from investment operations | | | 2.20 | | | | 3.12 | | | | 1.20 | | | | .43 | | | | 2.45 | |
| Less Dividends and Distributions: | | | | | | | | | | | | | | | | | | | | |
| Dividends from net investment income | | | (.58 | ) | | | (.37 | ) | | | (.36 | ) | | | (.39 | ) | | | (.48 | ) |
| Distributions from net realized gains | | | (.73 | ) | | | - | | | | - | | | | - | | | | - | |
| Total dividends and distributions | | | (1.31 | ) | | | (.37 | ) | | | (.36 | ) | | | (.39 | ) | | | (.48 | ) |
| Capital Contributions(d) | | | - | | | | - | | | | - | | | | - | | | | - | * |
| Net Asset Value, end of year | | | $16.79 | | | | $15.90 | | | | $13.15 | | | | $12.31 | | | | $12.27 | |
| Total Return(a) | | | 14.52% | | | | 24.16% | | | | 9.91% | | | | 3.45% | | | | 24.32% | |
| | | | | | | | | | | | | | | | | | | | |
| Ratios/Supplemental Data: | | | | | | | | | | | | | | | |
| Net assets, end of year (in millions) | | | $173.7 | | | | $159.3 | | | | $90.6 | | | | $58.8 | | | | $16.8 | |
| Average net assets (in millions) | | | $171.9 | | | | $119.3 | | | | $76.5 | | | | $42.0 | | | | $8.2 | |
| Ratios to average net assets(c): | | | | | | | | | | | | | | | | | | | | |
| Expenses After Advisory Fee Waiver and Expense Reimbursement | | | 1.88% | | | | 1.91% | | | | 1.92% | | | | 1.97% | | | | 2.19% | |
| Expenses Before Advisory Fee Waiver and Expense Reimbursement | | | 1.88% | | | | 1.91% | | | | 1.92% | | | | 1.97% | | | | 2.20% | |
| Net investment income | | | 3.25% | | | | 1.81% | | | | 3.33% | | | | 3.07% | | | | 2.85% | |
| Portfolio turnover rate | | | 57% | | | | 91% | | | | 72% | | | | 70% | | | | 49% | |
(a) Total return does not consider the effects of sales load. Total return is calculated assuming a purchase of a share on the first day and a sale on the last day of each year reported and includes reinvestment of dividends and distributions. Total returns may reflect adjustments to conform with generally accepted accounting principles.
(b) Calculations are based on the average daily number of shares outstanding.
(c) Does not include expenses of the underlying portfolio in which the Fund invests.
(d) The Fund received payments related to a former affiliates and to an unaffiliated-third party's settlement of regulatory proceedings involving allegations of improper trading in Fund shares during the fiscal year ended October 31, 2010. The fund was not involved in the proceedings or in the calculation of the amount of the settlement.
* Amount is less than $0.005.
See Notes to Financial Statements.
| | | | | | | | | | | | | | | | | | | | |
| Class C Shares | | | | | | | | | | | | | | | |
| | | Year Ended October 31, | |
| | | 2014(b) | | | 2013(b) | | | 2012(b) | | | 2011(b) | | | 2010(b) | |
| Per Share Operating Performance: | | | | | | | | | | | | | | | | | | | | |
| Net Asset Value, Beginning of Year | | | $15.87 | | | | $13.12 | | | | $12.28 | | | | $12.25 | | | | $10.28 | |
| Income from investment operations: | | | | | | | | | | | | | | | | | | | | |
| Net investment income | | | .51 | | | | .27 | | | | .43 | | | | .39 | | | | .32 | |
| Net realized and unrealized gain on investments | | | 1.68 | | | | 2.85 | | | | .77 | | | | .03 | | | | 2.13 | |
| Total from investment operations | | | 2.19 | | | | 3.12 | | | | 1.20 | | | | .42 | | | | 2.45 | |
| Less Dividends and Distributions: | | | | | | | | | | | | | | | | | | | | |
| Dividends from net investment income | | | (.58 | ) | | | (.37 | ) | | | (.36 | ) | | | (.39 | ) | | | (.48 | ) |
| Distributions from net realized gains | | | (.73 | ) | | | - | | | | - | | | | - | | | | - | |
| Total dividends and distributions | | | (1.31 | ) | | | (.37 | ) | | | (.36 | ) | | | (.39 | ) | | | (.48 | ) |
| Capital Contributions(d) | | | - | | | | - | | | | - | | | | - | | | | - | * |
| Net Asset Value, end of year | | | $16.75 | | | | $15.87 | | | | $13.12 | | | | $12.28 | | | | $12.25 | |
| Total Return(a) | | | 14.48% | | | | 24.22% | | | | 9.93% | | | | 3.37% | | | | 24.37% | �� |
| | | | | | | | | | | | | | | | | | | | |
| Ratios/Supplemental Data: | | | | | | | | | | | | | | | |
| Net assets, end of year (in millions) | | | $1,302.2 | | | | $1,066.6 | | | | $691.5 | | | | $499.1 | | | | $107.3 | |
| Average net assets (in millions) | | | $1,195.7 | | | | $851.3 | | | | $615.1 | | | | $356.1 | | | | $49.1 | |
| Ratios to average net assets(c): | | | | | | | | | | | | | | | | | | | | |
| Expenses After Advisory Fee Waiver and Expense Reimbursement | | | 1.88% | | | | 1.91% | | | | 1.92% | | | | 1.97% | | | | 2.19% | |
| Expenses Before Advisory Fee Waiver and Expense Reimbursement | | | 1.88% | | | | 1.91% | | | | 1.92% | | | | 1.97% | | | | 2.20% | |
| Net investment income | | | 3.16% | | | | 1.87% | | | | 3.33% | | | | 3.08% | | | | 2.85% | |
| Portfolio turnover rate | | | 57% | | | | 91% | | | | 72% | | | | 70% | | | | 49% | |
(a) Total return does not consider the effects of sales load. Total return is calculated assuming a purchase of a share on the first day and a sale on the last day of each year reported and includes reinvestment of dividends and distributions. Total returns may reflect adjustments to conform with generally accepted accounting principles. Total returns for periods less than one full year are not annualized.
(b) Calculations are based on the average daily number of shares outstanding.
(c) Does not include expenses of the underlying portfolio in which the Fund invests.
(d) The Fund received payments related to a former affiliates and to an unaffiliated-third party's settlement of regulatory proceedings involving allegations of improper trading in Fund shares during the fiscal year ended October 31, 2010. The fund was not involved in the proceedings or in the calculation of the amount of the settlement.
* Amount is less than $0.005.
See Notes to Financial Statements.
| | | | |
| Prudential Jennison Equity Income Fund | | | 47 | |
Financial Highlights
continued
| | | | | | | | | | | | | | | | | | |
| Class Q Shares | | | |
| | | Year Ended October 31, | | | | | January 18,
2011(d)
through
October 31, | |
| | | 2014(b) | | | 2013(b) | | | 2012(b) | | | | | 2011(b) | |
| Per Share Operating Performance: | | | | | | | | | | | | | | | | | | |
| Net Asset Value, Beginning of Period | | | $16.85 | | | | $13.90 | | | | $12.99 | | | | | | $13.52 | |
| Income from investment operations: | | | | | | | | | | | | | | | | | | |
| Net investment income | | | .74 | | | | .46 | | | | .62 | | | | | | .29 | |
| Net realized and unrealized gain (loss) on investments | | | 1.80 | | | | 3.01 | | | | .80 | | | | | | (.43 | ) |
| Total from investment operations | | | 2.54 | | | | 3.47 | | | | 1.42 | | | | | | (.14 | ) |
| Less Dividends and Distributions: | | | | | | | | | | | | | | | | | | |
| Dividends from net investment income | | | (.76 | ) | | | (.52 | ) | | | (.51 | ) | | | | | (.39 | ) |
| Distributions from net realized gains | | | (.73 | ) | | | - | | | | - | | | | | | - | |
| Total dividends and distributions | | | (1.49 | ) | | | (.52 | ) | | | (.51 | ) | | | | | (.39 | ) |
| Net Asset Value, end of period | | | $17.90 | | | | $16.85 | | | | $13.90 | | | | | | $12.99 | |
| Total Return(a) | | | 15.81% | | | | 25.64% | | | | 11.09% | | | | | | (1.06)% | |
| | | | |
| Ratios/Supplemental Data: | | | | | | | | | | | | | | |
| Net assets, end of period (in millions) | | | $5.6 | | | | $2.7 | | | | $2.2 | | | | | | $1.0 | |
| Average net assets (in millions) | | | $2.8 | | | | $2.3 | | | | $1.7 | | | | | | $.2 | |
| Ratios to average net assets(c): | | | | | | | | | | | | | | | | | | |
| Expenses After Advisory Fee Waiver and Expense Reimbursement | | | .78% | | | | .81% | | | | .81% | | | | | | .89% | (e) |
| Expenses Before Advisory Fee Waiver and Expense Reimbursement | | | .78% | | | | .81% | | | | .81% | | | | | | .89% | (e) |
| Net investment income | | | 4.30% | | | | 3.00% | | | | 4.57% | | | | | | 2.99% | (e) |
| Portfolio turnover rate | | | 57% | | | | 91% | | | | 72% | | | | | | 70% | (f) |
(a) Total return is calculated assuming a purchase of a share on the first day and a sale on the last day of each period reported and includes reinvestment of dividends and distributions. Total returns may reflect adjustments to conform with generally accepted accounting principles. Total returns for periods less than one full year are not annualized.
(b) Calculations are based on the average daily number of shares outstanding.
(c) Does not include expenses of the underlying portfolio in which the Fund invests.
(d) Commencement of operations.
(e) Annualized.
(f) Not annualized.
See Notes to Financial Statements.
| | | | | | | | | | | | | | | | | | |
| Class R Shares | | | |
| | | Year Ended October 31, | | | | | January 18,
2011(d)
through
October 31, | |
| | | 2014(b) | | | 2013(b) | | | 2012(b) | | | | | 2011(b) | |
| Per Share Operating Performance: | | | | | | | | | | | | | | | | | | |
| Net Asset Value, Beginning of Period | | | $16.84 | | | | $13.89 | | | | $12.98 | | | | | | $13.52 | |
| Income from investment operations: | | | | | | | | | | | | | | | | | | |
| Net investment income | | | .59 | | | | .34 | | | | .52 | | | | | | .32 | |
| Net realized and unrealized gain (loss) on investments | | | 1.84 | | | | 3.05 | | | | .81 | | | | | | (.52 | ) |
| Total from investment operations | | | 2.43 | | | | 3.39 | | | | 1.33 | | | | | | (.20 | ) |
| Less Dividends and Distributions: | | | | | | | | | | | | | | | | | | |
| Dividends from net investment income | | | (.66 | ) | | | (.44 | ) | | | (.42 | ) | | | | | (.34 | ) |
| Distributions from net realized gains | | | (.73 | ) | | | - | | | | - | | | | | | - | |
| Total dividends and distributions | | | (1.39 | ) | | | (.44 | ) | | | (.42 | ) | | | | | (.34 | ) |
| Net Asset Value, end of period | | | $17.88 | | | | $16.84 | | | | $13.89 | | | | | | $12.98 | |
| Total Return(a) | | | 15.08% | | | | 24.86% | | | | 10.42% | | | | | | (1.50)% | |
| | | | |
| Ratios/Supplemental Data: | | | | | | | | | | | | | | |
| Net assets, end of period (in millions) | | | $40.3 | | | | $22.4 | | | | $8.9 | | | | | | $3.0 | |
| Average net assets (in millions) | | | $32.5 | | | | $14.7 | | | | $5.7 | | | | | | $1.5 | |
| Ratios to average net assets(c): | | | | | | | | | | | | | | | | | | |
| Expenses After Advisory Fee Waiver and Expense Reimbursement | | | 1.38% | | | | 1.41% | | | | 1.42% | | | | | | 1.51% | (e) |
| Expenses Before Advisory Fee Waiver and Expense Reimbursement | | | 1.63% | | | | 1.66% | | | | 1.67% | | | | | | 1.76% | (e) |
| Net investment income | | | 3.40% | | | | 2.25% | | | | 3.83% | | | | | | 3.09% | (e) |
| Portfolio turnover rate | | | 57% | | | | 91% | | | | 72% | | | | | | 70% | (f) |
(a) Total return is calculated assuming a purchase of a share on the first day and a sale on the last day of each period reported and includes reinvestment of dividends and distributions. Total returns may reflect adjustments to conform with generally accepted accounting principles. Total returns for periods less than one full year are not annualized.
(b) Calculations are based on the average daily number of shares outstanding.
(c) Does not include expenses of the underlying portfolio in which the Fund invests.
(d) Commencement of operations.
(e) Annualized.
(f) Not annualized.
See Notes to Financial Statements.
| | | | |
| Prudential Jennison Equity Income Fund | | | 49 | |
Financial Highlights
continued
| | | | | | | | | | | | | | | | | | | | | | |
| Class X Shares | |
| | | Period
Ended
April 11, | | | | | Year Ended October 31, | |
| | | 2014(b)(g) | | | | | 2013(b) | | | 2012(b) | | | 2011(b) | | | 2010(b) | |
| Per Share Operating Performance: | | | | | | | | | | | | | | | | | | | | | | |
| Net Asset Value, Beginning of Year | | | $15.86 | | | | | | $13.11 | | | | $12.27 | | | | $12.24 | | | | $10.28 | |
| Income from investment operations: | | | | | | | | | | | | | | | | | | | | | | |
| Net investment income | | | .31 | | | | | | .33 | | | | .41 | | | | .44 | | | | .31 | |
| Net realized and unrealized gain (loss) on investments | | | .38 | | | | | | 2.79 | | | | .79 | | | | (.02 | ) | | | 2.13 | |
| Total from investment operations | | | .69 | | | | | | 3.12 | | | | 1.20 | | | | .42 | | | | 2.44 | |
| Less Dividends and Distributions: | | | | | | | | | | | | | | | | | | | | | | |
| Dividends from net investment income | | | (.42 | ) | | | | | (.37 | ) | | | (.36 | ) | | | (.39 | ) | | | (.48 | ) |
| Distributions from net realized gains | | | (.73 | ) | | | | | - | | | | - | | | | - | | | | - | |
| Total dividends and distributions | | | (1.15 | ) | | | | | (.37 | ) | | | (.36 | ) | | | (.39 | ) | | | (.48 | ) |
| Capital Contributions(d) | | | - | | | | | | - | | | | - | | | | - | | | | - | * |
| Net Asset Value, end of year | | | $15.40 | | | | | | $15.86 | | | | $13.11 | | | | $12.27 | | | | $12.24 | |
| Total Return(a) | | | 4.28% | | | | | | 24.24% | | | | 9.94% | | | | 3.37% | | | | 24.27% | |
| |
| Ratios/Supplemental Data: | | | | | | | | | | | | | | | | | |
| Net assets, end of year (in millions) | | | $- | (h) | | | | | $0.4 | | | | $1.3 | | | | $2.7 | | | | $5.1 | |
| Average net assets (in millions) | | | $.2 | | | | | | $.8 | | | | $1.8 | | | | $3.8 | | | | $6.5 | |
| Ratios to average net assets(c): | | | | | | | | | | | | | | | | | | | | | | |
| Expenses After Advisory Fee Waiver and Expense Reimbursement | | | 1.88% | (e) | | | | | 1.91% | | | | 1.92% | | | | 1.95% | | | | 2.19% | |
| Expenses Before Advisory Fee Waiver and Expense Reimbursement | | | 1.88% | (e) | | | | | 1.91% | | | | 1.92% | | | | 1.95% | | | | 2.20% | |
| Net investment income | | | 4.24% | (e) | | | | | 2.16% | | | | 3.20% | | | | 3.42% | | | | 2.74% | |
| Portfolio turnover rate | | | 35% | (f) | | | | | 91% | | | | 72% | | | | 70% | | | | 49% | |
(a) Total return does not consider the effects of sales load. Total return is calculated assuming a purchase of a share on the first day and a sale on the last day of each period reported and includes reinvestment of dividends and distributions. Total returns may reflect adjustments to conform with generally accepted accounting principles.
(b) Calculations are based on the average daily number of shares outstanding.
(c) Does not include expenses of the underlying portfolio in which the Fund invests.
(d) The Fund received payments related to a former affiliates and to an unaffiliated-third party's settlement of regulatory proceedings involving allegations of improper trading in Fund shares during the fiscal year ended October 31, 2010. The fund was not involved in the proceedings or in the calculation of the amount of the settlement.
(e) Annualized.
(f) Not annualized.
(g) End of operations.
(h) Net assets were $49,627.
* Amount is less than $0.005.
See Notes to Financial Statements.
| | | | | | | | | | | | | | | | | | | | |
| Class Z Shares | |
| | | Year Ended October 31, | |
| | | 2014(b) | | | 2013(b) | | | 2012(b) | | | 2011(b) | | | 2010(b) | |
| Per Share Operating Performance: | | | | | | | | | | | | | | | | | | | | |
| Net Asset Value, Beginning of Year | | | $16.84 | | | | $13.89 | | | | $12.97 | | | | $12.91 | | | | $10.87 | |
| Income from investment operations: | | | | | | | | | | | | | | | | | | | | |
| Net investment income | | | .69 | | | | .43 | | | | .59 | | | | .53 | | | | .47 | |
| Net realized and unrealized gain on investments | | | 1.82 | | | | 3.03 | | | | .82 | | | | .04 | | | | 2.22 | |
| Total from investment operations | | | 2.51 | | | | 3.46 | | | | 1.41 | | | | .57 | | | | 2.69 | |
| Less Dividends and Distributions: | | | | | | | | | | | | | | | | | | | | |
| Dividends from net investment income | | | (.74 | ) | | | (.51 | ) | | | (.49 | ) | | | (.51 | ) | | | (.65 | ) |
| Distributions from net realized gains | | | (.73 | ) | | | - | | | | - | | | | - | | | | - | |
| Total dividends and distributions | | | (1.47 | ) | | | (.51 | ) | | | (.49 | ) | | | (.51 | ) | | | (.65 | ) |
| Capital Contributions(d) | | | - | | | | - | | | | - | | | | - | | | | - | * |
| Net Asset Value, end of year | | | $17.88 | | | | $16.84 | | | | $13.89 | | | | $12.97 | | | | $12.91 | |
| Total Return(a) | | | 15.65% | | | | 25.47% | | | | 11.06% | | | | 4.42% | | | | 25.45% | |
| |
| Ratios/Supplemental Data: | |
| Net assets, end of year (in millions) | | | $1,777.7 | | | | $1,254.1 | | | | $837.3 | | | | $553.4 | | | | $70.4 | |
| Average net assets (in millions) | | | $1,457.1 | | | | $1,023.2 | | | | $713.7 | | | | $348.9 | | | | $14.0 | |
| Ratios to average net assets(c): | | | | | | | | | | | | | | | | | | | | |
| Expenses After Advisory Fee Waiver and Expense Reimbursement | | | .88% | | | | .91% | | | | .92% | | | | .98% | | | | 1.19% | |
| Expenses Before Advisory Fee Waiver and Expense Reimbursement | | | .88% | | | | .91% | | | | .92% | | | | .98% | | | | 1.20% | |
| Net investment income | | | 4.00% | | | | 2.87% | | | | 4.33% | | | | 4.00% | | | | 3.90% | |
| Portfolio turnover rate | | | 57% | | | | 91% | | | | 72% | | | | 70% | | | | 49% | |
(a) Total return is calculated assuming a purchase of a share on the first day and a sale on the last day of each year reported and includes reinvestment of dividends and distributions. Total returns may reflect adjustments to conform with generally accepted accounting principles.
(b) Calculations are based on the average daily number of shares outstanding.
(c) Does not include expenses of the underlying portfolio in which the Fund invests.
(d) The Fund received payments related to a former affiliates and to an unaffiliated-third party's settlement of regulatory proceedings involving allegations of improper trading in Fund shares during the fiscal year ended October 31, 2010. The fund was not involved in the proceedings or in the calculation of the amount of the settlement.
* Amount is less than $0.005.
See Notes to Financial Statements.
| | | | |
| Prudential Jennison Equity Income Fund | | | 51 | |
Report of Independent Registered Public
Accounting Firm
The Board of Directors and Shareholders
Prudential Investment Portfolios, Inc. 10:
We have audited the accompanying statement of assets and liabilities of Prudential Jennison Equity Income Fund, a series of Prudential Investment Portfolios, Inc. 10, (hereafter referred to as the “Fund”), including the portfolio of investments, as of October 31, 2014, and the related statement of operations for the year then ended, the statements of changes in net assets for each of the years in the two-year period then ended and the financial highlights for each of the years in the five-year period then ended. These financial statements and financial highlights are the responsibility of the Fund’s management. Our responsibility is to express an opinion on these financial statements and financial highlights based on our audits.
We conducted our audits in accordance with the standards of the Public Company Accounting Oversight Board (United States). Those standards require that we plan and perform the audit to obtain reasonable assurance about whether the financial statements and financial highlights are free of material misstatement. An audit includes examining, on a test basis, evidence supporting the amounts and disclosures in the financial statements. Our procedures included confirmation of securities owned as of October 31, 2014, by correspondence with the custodian, transfer agent and brokers or by other appropriate auditing procedures when replies from brokers were not received. An audit also includes assessing the accounting principles used and significant estimates made by management, as well as evaluating the overall financial statement presentation. We believe that our audits provide a reasonable basis for our opinion.
In our opinion, the financial statements and financial highlights referred to above present fairly, in all material respects, the financial position of the Fund as of October 31, 2014, and the results of its operations for the year then ended, the changes in its net assets for each of the years in the two-year period then ended and the financial highlights for each of the years in the five-year period then ended, in conformity with U.S. generally accepted accounting principles.

New York, New York
December 17, 2014
Tax Information
(Unaudited)
We are advising you that during the fiscal year ended October 31, 2014, the Fund reports the maximum amount allowed per share, but not less than $.73 for Class A, B, C, Q, R, X, and Z shares as a capital gain distribution in accordance with Section 852(b)(3)(C) of the Internal Revenue Code.
For the year ended October 31, 2014, the Fund reports the maximum amount allowable under Section 854 of the Internal Revenue Code but not less than the following percentages of the ordinary income dividends paid as 1) qualified dividend income (QDI); and 2) eligible for corporate dividends received deduction (DRD):
| | | | | | | | |
| | | QDI | | | DRD | |
| | |
Prudential Jennison Equity Income Fund | | | 100.00% | | | | 39.47% | |
In January 2015, you will be advised on IRS Form 1099-DIV or substitute 1099-DIV as to the federal tax status of distributions received by you in calendar year 2014.
| | | | |
| Prudential Jennison Equity Income Fund | | | 53 | |
INFORMATION ABOUT BOARD MEMBERS AND OFFICERS
(Unaudited)
Information about Board Members and Officers of the Fund is set forth below. Board Members who are not deemed to be “interested persons” of the Fund, as defined in the 1940 Act, are referred to as “Independent Board Members.” Board Members who are deemed to be “interested persons” of the Fund are referred to as “Interested Board Members.” The Board Members are responsible for the overall supervision of the operations of the Fund and perform the various duties imposed on the directors of investment companies by the 1940 Act. The Board in turn elects the Officers, who are responsible for administering the day-to-day operations of the Fund.
| | | | |
| Independent Board Members(1) |
| | | |
Name, Address, Age Position(s) Portfolios Overseen | | Principal Occupation(s) During Past Five Years | | Other Directorships Held |
Ellen S. Alberding (56) Board Member Portfolios Overseen: 69 | | President and Board Member, The Joyce Foundation (charitable foundation) (since 2002); Vice Chair, City Colleges of Chicago (community college system) (since 2011); Trustee, Skills for America’s Future (national initiative to connect employers to community colleges) (since 2011); Trustee, National Park Foundation (charitable foundation for national park system) (since 2009); Trustee, Economic Club of Chicago (since 2009). | | None. |
Kevin J. Bannon (62) Board Member Portfolios Overseen: 70 | | Managing Director (since April 2008) and Chief Investment Officer (October 2008-November 2013) of Highmount Capital LLC (registered investment adviser); formerly Executive Vice President and Chief Investment Officer (April 1993-August 2007) of Bank of New York Company; President (May 2003-May 2007) of BNY Hamilton Family of Mutual Funds. | | Director of Urstadt Biddle Properties (equity real estate investment trust) (since September 2008). |
Linda W. Bynoe (62) Board Member Portfolios Overseen: 70 | | President and Chief Executive Officer (since March 1995) and formerly Chief Operating Officer (December 1989-February 1995) of Telemat Ltd. (management consulting); formerly Vice President (January 1985-June 1989) at Morgan Stanley & Co (broker-dealer). | | Director of Simon Property Group, Inc. (retail real estate) (May 2003-May 2012); Director of Anixter International, Inc. (communication products distributor) (since January 2006); Director of Northern Trust Corporation (financial services) (since April 2006); Trustee of Equity Residential (residential real estate) (since December 2009). |
Prudential Jennison Equity Income Fund
| | | | |
| Independent Board Members(1) |
| | | |
Name, Address, Age Position(s) Portfolios Overseen | | Principal Occupation(s) During Past Five Years | | Other Directorships Held |
Keith F. Hartstein (58) Board Member Portfolios Overseen: 70 | | Retired; Formerly President and Chief Executive Officer (2005-2012), Senior Vice President (2004-2005), Senior Vice President of Sales and Marketing (1997-2004), and various executive management positions (1990-1997), John Hancock Funds, LLC (asset management); Chairman, Investment Company Institute’s Sales Force Marketing Committee (2003-2008). | | None. |
Michael S. Hyland, CFA (69) Board Member Portfolios Overseen: 69 | | Retired (since February 2005); Formerly Senior Managing Director (July 2001-February 2005) of Bear Stearns & Co, Inc.; Global Partner, INVESCO (1999-2001); Managing Director and President of Salomon Brothers Asset Management (1989-1999). | | None. |
Douglas H. McCorkindale (75) Board Member Portfolios Overseen: 69 | | Retired; Formerly Chairman (February 2001-June 2006), Chief Executive Officer (June 2000-July 2005), President (September 1997-July 2005) and Vice Chairman (March 1984-May 2000) of Gannett Co. Inc. (publishing and media). | | Director of Lockheed Martin Corp. (aerospace and defense) (since May 2001). |
Stephen P. Munn (72) Board Member Portfolios Overseen: 70 | | Lead Director (since 2007) and formerly Chairman (1993-2007) of Carlisle Companies Incorporated (manufacturer of industrial products). | | Lead Director (since 2007) of Carlisle Companies Incorporated (manufacturer of industrial products). |
James E. Quinn (62) Board Member Portfolios Overseen: 69 | | Retired; Formerly President (2003-2012) and Director (2003-2008), and Vice Chairman and Director (1998-2003), Tiffany & Company (jewelry retailing); Director, Mutual of America Capital Management Corporation (asset management) (since 1996); Director, Hofstra University (since 2008); Vice Chairman, Museum of the City of New York (since 1994). | | Director of Deckers Outdoor Corporation (footwear manufacturer) (since 2011). |
Richard A. Redeker (71) Board Member & Independent Chair Portfolios Overseen: 70 | | Retired Mutual Fund Senior Executive (44 years); Management Consultant; Director, Mutual Fund Directors Forum (since 2014); Independent Directors Council (organization of 2,800 Independent Mutual Fund Directors)-Executive Committee, Chair of Policy Steering Committee, Governing Council. | | None. |
Visit our website at www.prudentialfunds.com
| | | | |
| Independent Board Members(1) |
| | | |
Name, Address, Age Position(s) Portfolios Overseen | | Principal Occupation(s) During Past Five Years | | Other Directorships Held |
Robin B. Smith (75) Board Member Portfolios Overseen:70 | | Chairman of the Board (since January 2003) of Publishers Clearing House (direct marketing); Member of the Board of Directors of ADLPartner (marketing) (since December 2010); formerly Chairman and Chief Executive Officer (August 1996-January 2003) of Publishers Clearing House. | | Formerly Director of BellSouth Corporation (telecommunications) (1992-2006). |
Stephen G. Stoneburn (71) Board Member Portfolios Overseen: 70 | | Chairman, (since July 2011), President and Chief Executive Officer (since June 1996) of Quadrant Media Corp. (publishing company); formerly President (June 1995-June 1996) of Argus Integrated Media, Inc.; Senior Vice President and Managing Director (January 1993-1995) of Cowles Business Media; Senior Vice President of Fairchild Publications, Inc. (1975-1989). | | None. |
| | | | |
| Interested Board Members(1) |
| | | |
Name, Address, Age Position(s) Portfolios Overseen | | Principal Occupation(s) During Past Five Years | | Other Directorships Held |
Stuart S. Parker (52) Board Member & President Portfolios Overseen: 64 | | President of Prudential Investments LLC (since January 2012); Executive Vice President of Prudential Investment Management Services LLC (since December 2012); Executive Vice President of Jennison Associates LLC and Head of Retail Distribution of Prudential Investments LLC (June 2005-December 2011). | | None. |
Scott E. Benjamin (41) Board Member & Vice President Portfolios Overseen: 70 | | Executive Vice President (since June 2009) of Prudential Investments LLC; Executive Vice President (June 2009-June 2012) and Vice President (since June 2012) of Prudential Investment Management Services LLC; Executive Vice President (since September 2009) of AST Investment Services, Inc.; Senior Vice President of Product Development and Marketing, Prudential Investments (since February 2006); Vice President of Product Development and Product Management, Prudential Investments (2003-2006). | | None. |
Prudential Jennison Equity Income Fund
| | | | |
| Interested Board Members(1) |
| | | |
Name, Address, Age Position(s) Portfolios Overseen | | Principal Occupation(s) During Past Five Years | | Other Directorships Held |
Grace C. Torres* (55) Board Member Portfolios Overseen: 65 | | Retired; Formerly Treasurer and Principal Financial and Accounting Officer of the Prudential Investments Funds, Target Funds, Advanced Series Trust, Prudential Variable Contract Accounts and The Prudential Series Fund (1998-June 2014); Assistant Treasurer (March 1999-June 2014) and Senior Vice President (September 1999-June 2014) of Prudential Investments LLC; Assistant Treasurer (May 2003-June 2014) and Vice President (June 2005-June 2014) of AST Investment Services, Inc.; Senior Vice President and Assistant Treasurer (May 2003-June 2014) of Prudential Annuities Advisory Services, Inc. | | None. |
* Note: Prior to her retirement in 2014, Ms. Torres was employed by Prudential Investments LLC. Due to her prior employment, she is considered to be an “interested person” under the 1940 Act. Ms. Torres is a non-management Interested Board Member.
(1) The year in which each individual joined the Fund’s Board is as follows:
Ellen S. Alberding, 2013; Linda W. Bynoe, 2005; Douglas H. McCorkindale, 2003, Richard A. Redeker, 2003; Robin B. Smith, 2003; Stephen G. Stoneburn, 2003; Kevin J. Bannon, 2008; Keith F. Hartstein, 2013; Michael S. Hyland, 2008; Stephen P. Munn, 2008; James E. Quinn, 2013; Stuart S. Parker, Board Member and President since 2012; Scott E. Benjamin, Board Member since 2010 and Vice President since 2009; Grace C. Torres, 2014.
| | | | |
| Fund Officers(a) |
| | | |
Name, Address and Age Position with Fund | | Principal Occupation(s) During Past Five Years | | Length of Service as Fund Officer |
Raymond A. O’Hara (59) Chief Legal Officer | | Vice President and Corporate Counsel (since July 2010) of Prudential Insurance Company of America (Prudential); Vice President (March 2011-Present) of Pruco Life Insurance Company and Pruco Life Insurance Company of New Jersey; Vice President and Corporate Counsel (March 2011-Present) of Prudential Annuities Life Assurance Corporation; Chief Legal Officer of Prudential Investments LLC (since June 2012); Chief Legal Officer of Prudential Mutual Fund Services LLC (since June 2012) and Corporate Counsel of AST Investment Services, Inc. (since June 2012); formerly Assistant Vice President and Corporate Counsel (September 2008-July 2010) of The Hartford Financial Services Group, Inc.; formerly Associate (September 1980-December 1987) and Partner (January 1988–August 2008) of Blazzard & Hasenauer, P.C. (formerly, Blazzard, Grodd & Hasenauer, P.C.). | | Since 2012 |
Visit our website at www.prudentialfunds.com
| | | | |
| Fund Officers(a) |
| | | |
Name, Address and Age Position with Fund | | Principal Occupation(s) During Past Five Years | | Length of Service as Fund Officer |
Chad A. Earnst (39) Chief Compliance Officer | | Chief Compliance Officer (September 2014-Present) of Prudential Investments LLC; Chief Compliance Officer (September 2014-Present) of the Prudential Investments Funds, Target Funds, Advanced Series Trust, The Prudential Series Fund, Prudential’s Gibraltar Fund, Inc., Prudential Global Short Duration High Yield Income Fund, Inc., Prudential Short Duration High Yield Fund, Inc. and Prudential Jennison MLP Income Fund, Inc.; formerly Assistant Director (March 2010-August 2014) of the Asset Management Unit, Division of Enforcement, US Securities & Exchange Commission; Assistant Regional Director (January 2010-August 2014), Branch Chief (June 2006–December 2009) and Senior Counsel (April 2003-May 2006) of the Miami Regional Office, Division of Enforcement, US Securities & Exchange Commission. | | Since 2014 |
Deborah A. Docs (56) Secretary | | Vice President and Corporate Counsel (since January 2001) of Prudential; Vice President (since December 1996) and Assistant Secretary (since March 1999) of Prudential Investments LLC; formerly Vice President and Assistant Secretary (May 2003-June 2005) of AST Investment Services, Inc. | | Since 2004 |
Jonathan D. Shain (56) Assistant Secretary | | Vice President and Corporate Counsel (since August 1998) of Prudential; Vice President and Assistant Secretary (since May 2001) of Prudential Investments LLC; Vice President and Assistant Secretary (since February 2001) of Prudential Mutual Fund Services LLC; formerly Vice President and Assistant Secretary (May 2003-June 2005) of AST Investment Services, Inc. | | Since 2005 |
Claudia DiGiacomo (40) Assistant Secretary | | Vice President and Corporate Counsel (since January 2005) of Prudential; Vice President and Assistant Secretary of Prudential Investments LLC (since December 2005); Associate at Sidley Austin Brown & Wood LLP (1999-2004). | | Since 2005 |
Andrew R. French (52) Assistant Secretary | | Vice President and Corporate Counsel (since February 2010) of Prudential; formerly Director and Corporate Counsel (2006-2010) of Prudential; Vice President and Assistant Secretary (since January 2007) of Prudential Investments LLC; Vice President and Assistant Secretary (since January 2007) of Prudential Mutual Fund Services LLC. | | Since 2006 |
Amanda S. Ryan (36) Assistant Secretary | | Director and Corporate Counsel (since March 2012) of Prudential; Director and Assistant Secretary (since June 2012) of Prudential Investments LLC; Associate at Ropes & Gray LLP (2008-2012). | | Since 2012 |
Theresa C. Thompson (52) Deputy Chief Compliance Officer | | Vice President, Compliance, Prudential Investments LLC (since April 2004); and Director, Compliance, Prudential Investments LLC (2001-2004). | | Since 2008 |
Prudential Jennison Equity Income Fund
| | | | |
| Fund Officers(a) |
| | | |
Name, Address and Age Position with Fund | | Principal Occupation(s) During Past Five Years | | Length of Service as Fund Officer |
Richard W. Kinville (46) Anti-Money Laundering Compliance Officer | | Vice President, Corporate Compliance, Anti-Money Laundering Unit (since January 2005) of Prudential; committee member of the American Council of Life Insurers Anti-Money Laundering and Critical Infrastructure Committee (since January 2007); formerly Investigator and Supervisor in the Special Investigations Unit for the New York Central Mutual Fire Insurance Company (August 1994-January 1999); Investigator in AXA Financial’s Internal Audit Department and Manager in AXA’s Anti-Money Laundering Office (January 1999-January 2005); first chair of the American Council of Life Insurers Anti-Money Laundering and Critical Infrastructure Committee (June 2007-December 2009). | | Since 2011 |
M. Sadiq Peshimam (50) Treasurer and Principal Financial and Accounting Officer | | Assistant Treasurer of funds in the Prudential Mutual Fund Complex (2006-2014); Vice President (since 2005) of Prudential Investments LLC. | | Since 2006 |
Peter Parrella (56) Assistant Treasurer | | Vice President (since 2007) and Director (2004-2007) within Prudential Mutual Fund Administration; formerly Tax Manager at SSB Citi Fund Management LLC (1997-2004). | | Since 2007 |
Lana Lomuti (47) Assistant Treasurer | | Vice President (since 2007) and Director (2005-2007), within Prudential Mutual Fund Administration; formerly Assistant Treasurer (December 2007-February 2014) of The Greater China Fund, Inc. | | Since 2014 |
Linda McMullin (53) Assistant Treasurer | | Vice President (since 2011) and Director (2008-2011) within Prudential Mutual Fund Administration. | | Since 2014 |
| (a) | Excludes Mr. Parker and Mr. Benjamin, interested Board Members who also serve as President and Vice President, respectively. |
Explanatory Notes to Tables:
| n | Board Members are deemed to be “Interested,” as defined in the 1940 Act, by reason of their affiliation with Prudential Investments LLC and/or an affiliate of Prudential Investments LLC. |
| n | Unless otherwise noted, the address of all Board Members and Officers is c/o Prudential Investments LLC, Gateway Center Three, 100 Mulberry Street, Newark, New Jersey 07102-4077. |
| n | There is no set term of office for Board Members or Officers. The Board Members have adopted a retirement policy, which calls for the retirement of Board Members on December 31 of the year in which they reach the age of 75. |
| n | “Other Directorships Held” includes only directorships of companies required to register or file reports with the SEC under the 1934 Act (that is, “public companies”) or other investment companies registered under the 1940 Act. |
| n | “Portfolios Overseen” includes all investment companies managed by Prudential Investments LLC. The investment companies for which Prudential Investments LLC serves as manager include the Prudential Investments Mutual Funds, The Prudential Variable Contract Accounts, Target Mutual Funds, Prudential Short Duration High Yield Fund, Inc., Prudential Global Short Duration High Yield Fund, Inc., The Prudential Series Fund, Prudential’s Gibraltar Fund, Inc. and the Advanced Series Trust. |
Visit our website at www.prudentialfunds.com
Approval of Advisory Agreements
The Fund’s Board of Directors
The Board of Directors (the “Board”) of Prudential Jennison Equity Income Fund (the “Fund”)1 consists of thirteen individuals, eleven of whom are not “interested persons” of the Fund, as defined in the Investment Company Act of 1940, as amended (the “1940 Act”) (the “Independent Directors”). The Board is responsible for the oversight of the Fund and its operations, and performs the various duties imposed on the directors of investment companies by the 1940 Act. The Independent Directors have retained independent legal counsel to assist them in connection with their duties. The Chair of the Board is an Independent Director. The Board has established three standing committees: the Audit Committee, the Nominating and Governance Committee, and the Investment Committee. Each committee is chaired by, and composed of, Independent Directors.
Annual Approval of the Fund’s Advisory Agreements
As required under the 1940 Act, the Board determines annually whether to renew the Fund’s management agreement with Prudential Investments LLC (“PI”) and the Fund’s subadvisory agreement with Jennison Associates LLC (“Jennison”). In considering the renewal of the agreements, the Board, including all of the Independent Directors, met on June 9-11, 2014 and approved the renewal of the agreements through July 31, 2015, after concluding that the renewal of the agreements was in the best interests of the Fund and its shareholders.2
In advance of the meetings, the Board requested and received materials relating to the agreements, and had the opportunity to ask questions and request further information in connection with its consideration. Among other things, the Board considered comparative fee information from PI and Jennison. Also, the Board considered comparisons with other mutual funds in relevant Peer Universes and Peer Groups, as is further discussed below.
In approving the agreements, the Board, including the Independent Directors advised by independent legal counsel, considered the factors it deemed relevant, including the nature, quality and extent of services provided by PI and the subadviser, the performance of the Fund, the profitability of PI and its affiliates, expenses and fees, and the potential for economies of scale that may be shared with the Fund and its shareholders as the Fund’s assets grow. In their deliberations, the Directors did not identify any single factor which alone was responsible for the Board’s decision to
| 1 | Prudential Jennison Equity Income Fund is a series of Prudential Investment Portfolios, Inc. 10. |
| 2 | Grace C. Torres was elected to the Board as of December 2014, and therefore did not participate in the consideration of these approvals. |
Prudential Jennison Equity Income Fund
Approval of Advisory Agreements (continued)
approve the agreements with respect to the Fund. In connection with its deliberations, the Board considered information provided by PI throughout the year at regular Board meetings, presentations from portfolio managers and other information, as well as information furnished at or in advance of the meetings on June 9-11, 2014.
The Directors determined that the overall arrangements between the Fund and PI, which serves as the Fund’s investment manager pursuant to a management agreement, and between PI and Jennison, which serves as the Fund’s subadviser pursuant to the terms of a subadvisory agreement with PI, are in the best interests of the Fund and its shareholders in light of the services performed, fees charged and such other matters as the Directors considered relevant in the exercise of their business judgment.
The material factors and conclusions that formed the basis for the Directors’ reaching their determinations to approve the continuance of the agreements are separately discussed below.
Nature, quality and extent of services
The Board received and considered information regarding the nature, quality and extent of services provided to the Fund by PI and Jennison. The Board considered the services provided by PI, including but not limited to the oversight of the subadviser for the Fund, as well as the provision of fund recordkeeping, compliance, and other services to the Fund. With respect to PI’s oversight of the subadviser, the Board noted that PI’s Strategic Investment Research Group (“SIRG”), which is a business unit of PI, is responsible for monitoring and reporting to PI’s senior management on the performance and operations of the subadviser. The Board also considered that PI pays the salaries of all of the officers and non-independent Directors of the Fund. The Board also considered the investment subadvisory services provided by Jennison, as well as adherence to the Fund’s investment restrictions and compliance with applicable Fund policies and procedures. The Board considered PI’s evaluation of the subadviser, as well as PI’s recommendation, based on its review of the subadviser, to renew the subadvisory agreement.
The Board considered the qualifications, backgrounds and responsibilities of PI’s senior management responsible for the oversight of the Fund and Jennison, and also considered the qualifications, backgrounds and responsibilities of the Jennison portfolio managers who are responsible for the day-to-day management of the Fund’s portfolio. The Board was provided with information pertaining to PI’s and Jennison’s organizational structure, senior management, investment operations, and other relevant information pertaining to PI and Jennison. The Board also noted that it received favorable compliance reports from the Fund’s Chief Compliance Officer
Visit our website at www.prudentialfunds.com
(“CCO”) as to each of PI and Jennison. The Board noted that Jennison is affiliated with PI.
The Board concluded that it was satisfied with the nature, extent and quality of the investment management services provided by PI and the subadvisory services provided to the Fund by Jennison, and that there was a reasonable basis on which to conclude that the Fund benefits from the services provided by PI and Jennison under the management and subadvisory agreements.
Costs of Services and Profits Realized by PI
The Board was provided with information on the profitability of PI and its affiliates in serving as the Fund’s investment manager. The Board discussed with PI the methodology utilized in assembling the information regarding profitability and considered its reasonableness. The Board recognized that it is difficult to make comparisons of profitability from fund management contracts because comparative information is not generally publicly available and is affected by numerous factors, including the structure of the particular adviser, the types of funds it manages, its business mix, numerous assumptions regarding allocations and the adviser’s capital structure and cost of capital. The Board separately considered information regarding the profitability of the subadviser, an affiliate of PI. Taking these factors into account, the Board concluded that the profitability of PI and its affiliates in relation to the services rendered was not unreasonable.
Economies of Scale
In 2013, PI and the Board retained an outside business consulting firm, in order to assist the Board in its consideration of the renewal of the management and subadvisory agreements, by reviewing management fee breakpoint usage and trends in management fees across the mutual fund industry. The consulting firm’s analysis and conclusions with respect to the Funds’ management fee structures were presented to the Board and PI at the December 3-5, 2013 meeting, and were discussed extensively by the Board and PI over the following two quarters.
The Board noted that the management fee schedule for the Fund includes breakpoints, which have the effect of decreasing the fee rate as assets increase, and that at its current level of assets the Fund’s effective fee rate reflected some of those rate reductions. The Board received and discussed information concerning whether PI realizes economies of scale as the Fund’s assets grow beyond current levels. The Board took note that the Fund’s fee structure currently results in benefits to Fund shareholders whether or not PI realizes any economies of scale. In light of the Fund’s current size and expense structure, the Board negotiated with PI to implement
Prudential Jennison Equity Income Fund
Approval of Advisory Agreements (continued)
additional breakpoints to the contractual management fee schedule. The Board recognized the inherent limitations of any analysis of economies of scale, stemming largely from the Board’s understanding that most of PI’s costs are not specific to individual funds, but rather are incurred across a variety of products and services.
Other Benefits to PI and Jennison
The Board considered potential ancillary benefits that might be received by PI and Jennison and their affiliates as a result of their relationship with the Fund. The Board concluded that potential benefits to be derived by PI included fees received by affiliates of PI for serving as the Fund’s securities lending agent, transfer agency fees received by the Fund’s transfer agent (which is affiliated with PI), and benefits to the reputation as well as other intangible benefits resulting from PI’s association with the Fund. The Board concluded that the potential benefits to be derived by Jennison included its ability to use soft dollar credits, as well as the potential benefits consistent with those generally resulting from an increase in assets under management, specifically, potential access to additional research resources and benefits to the reputation. The Board concluded that the benefits derived by PI and Jennison were consistent with the types of benefits generally derived by investment managers and subadvisers to mutual funds.
Performance of the Fund / Fees and Expenses
The Board considered certain additional specific factors and made related conclusions relating to the historical performance of the Fund for the one-, three- and five-year periods ended December 31, 2013.
The Board also considered the Fund’s actual management fee, as well as the Fund’s net total expense ratio, for the fiscal year ended October 31, 2013. The Board considered the management fee for the Fund as compared to the management fee charged by PI to other funds and the fee charged by other advisers to comparable mutual funds in a Peer Group. The actual management fee represents the fee rate actually paid by Fund shareholders and includes any fee waivers or reimbursements. The net total expense ratio for the Fund represents the actual expense ratio incurred by Fund shareholders.
The mutual funds included in the Peer Universe (the Lipper Equity Income Funds Performance Universe) and the Peer Group were objectively determined by Lipper Inc. (“Lipper”), an independent provider of mutual fund data. The comparisons placed the Fund in various quartiles, with the first quartile being the best 25% of the mutual funds (for performance, the best performing mutual funds and, for expenses, the lowest cost mutual funds).
Visit our website at www.prudentialfunds.com
The section below summarizes key factors considered by the Board and the Board’s conclusions regarding the Fund’s performance, fees and overall expenses. The table sets forth gross performance comparisons (which do not reflect the impact on performance of fund expenses, or any subsidies, expense caps or waivers that may be applicable) with the Peer Universe, actual management fees with the Peer Group (which reflect the impact of any subsidies or fee waivers), and net total expenses with the Peer Group, each of which were key factors considered by the Board.
| | | | | | | | |
| Performance | | 1 Year | | 3 Years | | 5 Years | | 10 Years |
| | | 2nd Quartile | | 3rd Quartile | | 1st Quartile | | N/A |
| Actual Management Fees: 4th Quartile |
| Net Total Expenses: 4th Quartile |
| | • | | The Board noted that the Fund outperformed its benchmark index over all periods. |
| | • | | The Board noted PI’s agreement to implement additional contractual management fee breakpoints of 0.70% on assets over $5 billion and up to $7.5 billion, 0.675% on assets over $7.5 billion and up to $10 billion, and 0.65% on assets over $10 billion. The breakpoints are in addition to the existing contractual management fee breakpoints of 0.85% on assets up to $500 million, 0.80% on assets over $500 million and up to $1 billion, 0.75% on assets over $1 billion and up to $2.5 billion, and 0.725% on assets over $2.5 billion and up to $5 billion. |
| | • | | The Board concluded that, in light of the Fund’s competitive performance against its benchmark index and Peer Universe, it would be in the best interests of the Fund and its shareholders to renew the agreements. |
| | • | | The Board concluded that the management fees (including subadvisory fees) and total expenses were reasonable in light of the services provided. |
* * *
After full consideration of these factors, the Board concluded that approval of the agreements was in the best interests of the Fund and its shareholders.
Prudential Jennison Equity Income Fund
| | | | |
| n MAIL | | n TELEPHONE | | n WEBSITE |
Gateway Center Three 100 Mulberry Street Newark, NJ 07102 | | (800) 225-1852 | | www.prudentialfunds.com |
|
| PROXY VOTING |
| The Board of Directors of the Fund has delegated to the Fund’s investment subadviser the responsibility for voting any proxies and maintaining proxy recordkeeping with respect to the Fund. A description of these proxy voting policies and procedures is available without charge, upon request, by calling (800) 225-1852 or by visiting the Securities and Exchange Commission’s website at www.sec.gov. Information regarding how the Fund voted proxies relating to portfolio securities during the most recent 12-month period ended June 30 is available on the Fund’s website and on the Securities and Exchange Commission’s website. |
|
| DIRECTORS |
Ellen S. Alberding • Kevin J. Bannon • Scott E. Benjamin • Linda W. Bynoe •
Keith F. Hartstein • Michael S. Hyland • Douglas H. McCorkindale • Stephen P. Munn •
Stuart S. Parker • James E. Quinn • Richard A. Redeker • Robin B. Smith •
Stephen G. Stoneburn • Grace C. Torres |
|
| OFFICERS |
| Stuart S. Parker, President • Scott E. Benjamin, Vice President • M. Sadiq Peshimam, Treasurer and Principal Financial and Accounting Officer • Raymond A. O’Hara, Chief Legal Officer • Deborah A. Docs, Secretary • Chad A. Earnst, Chief Compliance Officer • Theresa C. Thompson, Deputy Chief Compliance Officer • Richard W. Kinville, Anti-Money Laundering Compliance Officer • Jonathan D. Shain, Assistant Secretary • Claudia DiGiacomo, Assistant Secretary • Amanda S. Ryan, Assistant Secretary • Andrew R. French, Assistant Secretary • Peter Parrella, Assistant Treasurer • Lana Lomuti, Assistant Treasurer • Linda McMullin, Assistant Treasurer |
| | | | |
| MANAGER | | Prudential Investments LLC | | Gateway Center Three
100 Mulberry Street
Newark, NJ 07102 |
|
| INVESTMENT SUBADVISER | | Jennison Associates LLC | | 466 Lexington Avenue
New York, NY 10017 |
|
| DISTRIBUTOR | | Prudential Investment
Management Services LLC | | Gateway Center Three
100 Mulberry Street
Newark, NJ 07102 |
|
| CUSTODIAN | | The Bank of New York Mellon | | One Wall Street
New York, NY 10286 |
|
| TRANSFER AGENT | | Prudential Mutual Fund
Services LLC | | PO Box 9658
Providence, RI 02940 |
|
| INDEPENDENT REGISTERED PUBLIC ACCOUNTING FIRM | | KPMG LLP | | 345 Park Avenue
New York, NY 10154 |
|
| FUND COUNSEL | | Willkie Farr & Gallagher LLP | | 787 Seventh Avenue
New York, NY 10019 |
|
| An investor should consider the investment objectives, risks, charges, and expenses of the Fund carefully before investing. The prospectus and summary prospectus contain this and other information about the Fund. An investor may obtain a prospectus and summary prospectus by visiting our website at www.prudentialfunds.com or by calling (800) 225-1852. The prospectus and summary prospectus should be read carefully before investing. |
|
| E-DELIVERY |
| To receive your mutual fund documents online, go to www.prudentialfunds.com/edelivery and enroll. Instead of receiving printed documents by mail, you will receive notification via email when new materials are available. You can cancel your enrollment or change your email address at any time by visiting the website address above. |
|
| SHAREHOLDER COMMUNICATIONS WITH DIRECTORS |
| Shareholders can communicate directly with the Board of Directors by writing to the Chair of the Board, Prudential Jennison Equity Income Fund, Prudential Investments, Attn: Board of Directors, 100 Mulberry Street, Gateway Center Three, Newark, NJ 07102. Shareholders can communicate directly with an individual Director by writing to the same address. Communications are not screened before being delivered to the addressee. |
|
| AVAILABILITY OF PORTFOLIO SCHEDULE |
| The Fund files its complete schedule of portfolio holdings with the Securities and Exchange Commission for the first and third quarters of each fiscal year on Form N-Q. The Fund’s Forms N-Q are available on the Commission’s website at www.sec.gov. The Fund’s Forms N-Q may also be reviewed and copied at the Commission’s Public Reference Room in Washington, D.C. Information on the operation and location of the Public Reference Room may be obtained by calling 1-800-SEC-0330. The Fund’s schedule of portfolio holdings is also available on the Fund’s website as of the end of each month. |
|
| The Fund’s Statement of Additional Information contains additional information about the Fund’s Directors and is available without charge, upon request, by calling (800) 225-1852. |
Mutual Funds:
| | | | |
ARE NOT INSURED BY THE FDIC OR ANY
FEDERAL GOVERNMENT AGENCY | | MAY LOSE VALUE | | ARE NOT A DEPOSIT OF OR GUARANTEED BY ANY BANK OR ANY BANK AFFILIATE |

PRUDENTIAL JENNISON EQUITY INCOME FUND
| | | | | | | | | | | | |
| SHARE CLASS | | A | | B | | C | | Q | | R | | Z |
| NASDAQ | | SPQAX | | JEIBX | | AGOCX | | PJIQX | | PJERX | | JDEZX |
| CUSIP | | 74441L808 | | 74441L881 | | 74441L873 | | 74441L816 | | 74441L790 | | 74441L832 |
MF203E 0270914-00001-00

PRUDENTIAL INVESTMENTS»MUTUAL FUNDS
PRUDENTIAL MID-CAP VALUE FUND
ANNUAL REPORT · OCTOBER 31, 2014
Fund Type
Mid-Cap Stock
Objective
Capital growth
This report is not authorized for distribution to prospective investors unless preceded or accompanied by a current prospectus.
The views expressed in this report and information about the Fund’s portfolio holdings are for the period covered by this report and are subject to change thereafter.
Mutual funds are distributed by Prudential Investment Management Services LLC, a Prudential Financial company. Quantitative Management Associates, LLC (QMA) is a wholly owned subsidiary of Prudential Investment Management, Inc. (PIM). QMA and PIM are registered investment advisers and Prudential Financial companies. © 2014 Prudential Financial, Inc. and its related entities. Prudential Investments LLC, Prudential, the Prudential logo, Bring Your Challenges, and the Rock symbol are service marks of Prudential Financial, Inc. and its related entities, registered in many jurisdictions worldwide.

December 15, 2014
Dear Shareholder:
We hope you find the annual report for the Prudential Mid-Cap Value Fund informative and useful. The report covers performance for the 12-month period that ended October 31, 2014.
Since market conditions change over time, we believe it is important to maintain a diversified portfolio of funds consistent with your tolerance for risk, time horizon, and financial goals.
Your financial advisor can help you create a diversified investment plan that may include funds covering all the basic asset classes and that reflects your personal investor profile and risk tolerance. Keep in mind, however, that diversification and asset allocation strategies do not assure a profit or protect against loss in declining markets.
Prudential Investments® is dedicated to helping you solve your toughest investment challenges—whether it’s capital growth, reliable income, or protection from market volatility and other risks. We offer the expertise of Prudential Financial’s affiliated asset managers* that strive to be leaders in a broad range of funds to help you stay on course to the future you envision. They also manage money for major corporations and pension funds around the world, which means you benefit from the same expertise, innovation, and attention to risk demanded by today’s most sophisticated investors.
Thank you for choosing the Prudential Investments family of funds.
Sincerely,

Stuart S. Parker, President
Prudential Mid-Cap Value Fund
*Most of Prudential Investments’ equity funds are advised by Jennison Associates LLC, Quantitative Management Associates LLC (QMA), or Prudential Real Estate Investors. Prudential Investments’ fixed income and money market funds are advised by Prudential Investment Management, Inc. (PIM) through its Prudential Fixed Income unit. Jennison Associates, QMA, and PIM are registered investment advisers and Prudential Financial companies. Prudential Real Estate Investors is a unit of PIM.
| | | | |
| Prudential Mid-Cap Value Fund | | | 1 | |
Your Fund’s Performance (Unaudited)
Performance data quoted represent past performance. Past performance does not guarantee future results. The investment return and principal value of an investment will fluctuate, so that an investor’s shares, when redeemed, may be worth more or less than their original cost. Current performance may be lower or higher than the past performance data quoted. An investor may obtain performance data as of the most recent month-end by visiting our website at www.prudentialfunds.com or by calling (800) 225-1852.
| | | | | | | | | | | | | | |
Cumulative Total Returns (Without Sales Charges) as of 10/31/14 |
| | | One Year | | | Five Years | | | Ten Years | | | Since Inception |
Class A | | | 16.49 | % | | | 132.07 | % | | | 155.69 | % | | — |
Class B | | | 15.66 | | | | 123.75 | | | | 137.61 | | | — |
Class C | | | 15.66 | | | | 123.72 | | | | 137.22 | | | — |
Class Q | | | 16.87 | | | | N/A | | | | N/A | | | 72.12% (1/18/11) |
Class Z | | | 16.80 | | | | 135.23 | | | | N/A | | | 113.95 (11/28/05) |
Russell Midcap Value Index | | | 16.18 | | | | 140.54 | | | | 166.29 | | | — |
S&P MidCap 400 Stock Index | | | 11.65 | | | | 131.49 | | | | 171.44 | | | — |
Russell Midcap Index | | | 15.32 | | | | 138.31 | | | | 168.25 | | | — |
Lipper Mid-Cap Value Funds Average | | | 12.01 | | | | 118.83 | | | | 134.27 | | | — |
| | | | | | | | | | | | | | |
Average Annual Total Returns (With Sales Charges) as of 9/30/14 |
| | | One Year | | | Five Years | | | Ten Years | | | Since Inception |
Class A | | | 11.72 | % | | | 15.38 | % | | | 8.95 | % | | — |
Class B | | | 12.37 | | | | 15.74 | | | | 8.76 | | | — |
Class C | | | 16.30 | | | | 15.82 | | | | 8.74 | | | — |
Class Q | | | 18.61 | | | | N/A | | | | N/A | | | 14.83% (1/18/11) |
Class Z | | | 18.53 | | | | 17.01 | | | | N/A | | | 8.61 (11/28/05) |
Russell Midcap Value Index | | | 17.46 | | | | 17.24 | | | | 10.17 | | | — |
S&P MidCap 400 Stock Index | | | 11.82 | | | | 16.37 | | | | 10.29 | | | — |
Russell Midcap Index | | | 15.83 | | | | 17.19 | | | | 10.34 | | | — |
Lipper Mid-Cap Value Funds Average | | | 13.57 | | | | 15.39 | | | | 8.77 | | | — |
| | |
| 2 | | Visit our website at www.prudentialfunds.com |
| | | | | | | | | | | | | | |
Average Annual Total Returns (With Sales Charges) as of 10/31/14 |
| | | One Year | | | Five Years | | | Ten Years | | | Since Inception |
Class A | | | 10.08 | % | | | 17.01 | % | | | 9.22 | % | | — |
Class B | | | 10.66 | | | | 17.37 | | | | 9.04 | | | — |
Class C | | | 14.66 | | | | 17.47 | | | | 9.02 | | | — |
Class Q | | | 16.87 | | | | N/A | | | | N/A | | | 15.42% (1/18/11) |
Class Z | | | 16.80 | | | | 18.66 | | | | N/A | | | 8.90 (11/28/05) |
| | | | | | | | | | | | | | |
Average Annual Total Returns (Without Sales Charges) as of 10/31/14 |
| | | One Year | | | Five Years | | | Ten Years | | | Since Inception |
Class A | | | 16.49 | % | | | 18.34 | % | | | 9.84 | % | | — |
Class B | | | 15.66 | | | | 17.48 | | | | 9.04 | | | — |
Class C | | | 15.66 | | | | 17.47 | | | | 9.02 | | | — |
Class Q | | | 16.87 | | | | N/A | | | | N/A | | | 15.42% (1/18/11) |
Class Z | | | 16.80 | | | | 18.66 | | | | N/A | | | 8.90 (11/28/05) |
Growth of a $10,000 Investment
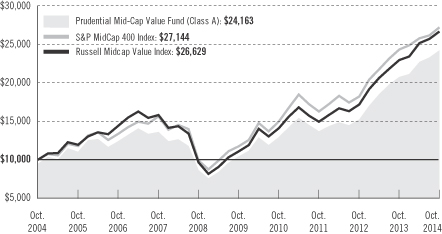
The graph compares a $10,000 investment in the Prudential Mid-Cap Value Fund (Class A shares) with a similar investment in the S&P MidCap 400 Index and Russell Midcap Value Index by portraying the initial account values at the beginning of the 10-year period for Class A shares (October 31, 2004) and the account values at the end of the current fiscal year (October 31, 2014) as measured on a quarterly basis. For purposes of the graph, and unless otherwise indicated, it has been assumed that (a) the maximum applicable front-end sales charge was deducted from the initial $10,000 investment in Class A shares; (b) all recurring fees (including management fees) were deducted; and (c) all dividends and distributions were reinvested. The line graph provides information for Class A shares only. As indicated in the tables above, performance for Class B, Class C, Class Q, and Class Z
| | | | |
| Prudential Mid-Cap Value Fund | | | 3 | |
Your Fund’s Performance (continued)
shares will vary due to the differing charges and expenses applicable to each share class (as indicated in the following paragraphs). Without waiver of fees and/or expense reimbursement, if any, the returns would have been lower.
Past performance does not predict future performance. Total returns and the ending account values in the graph include changes in share price and reinvestment of dividends and capital gains distributions in a hypothetical investment for the periods shown. The Fund’s total returns do not reflect the deduction of income taxes on an individual’s investment. Taxes may reduce your actual investment returns on income or gains paid by the Fund or any gains you may realize if you sell your shares.
Source: Prudential Investments LLC and Lipper Inc.
Inception returns are provided for any share class with less than 10 calendar years of returns.
The returns in the tables do not reflect the deduction of taxes that a shareholder would pay on Fund distributions or following the redemption of Fund shares. The average annual total returns take into account applicable sales charges, which are described for each share class in the table below.
| | | | | | | | | | |
| | Class A | | Class B* | | Class C | | Class Q | | Class Z |
Maximum initial sales charge | | 5.50% of
the public
offering
price | | None | | None | | None | | None |
Contingent deferred sales charge (CDSC) (as a percentage of the lower of original purchase price or net asset value at redemption) | | 1% on sales
of $1 million
or more
made within
12 months of
purchase | | 5% (Yr. 1)
4% (Yr. 2)
3% (Yr. 3)
2% (Yr. 4)
1% (Yr. 5)
1% (Yr. 6)
0% (Yr. 7) | | 1% on sales
made within
12 months
of purchase | | None | | None |
Annual distribution and service (12b-1) fees (shown as a percentage of average daily net assets) | | .30%
(.25%
currently) | | 1% | | 1% | | None | | None |
*Class B shares are closed to all purchase activity and no additional Class B shares may be purchased or acquired except by exchange from Class B shares of another Fund or through dividend or capital gains reinvestment.
| | |
| 4 | | Visit our website at www.prudentialfunds.com |
Benchmark Definitions
Russell Midcap Value Index
The Russell Midcap Value Index is an unmanaged index which measures the performance of those Russell Midcap companies with lower price-to-book ratios and lower forecasted growth values. The stocks included in the index are also members of the Russell 1000 Value Index. Russell Midcap Value Index Closest Month-End to Inception cumulative total returns as of 10/31/14 are 70.70% for Class Q; and 115.24% for Class Z. Russell Midcap Value Index Closest Month-End to Inception average annual total returns as of 9/30/14 are 14.64% for Class Q; and 8.65% for Class Z.
Standard & Poor’s MidCap 400 Stock Index
The Standard & Poor’s MidCap 400 Stock Index (S&P MidCap 400 Stock Index) is an unmanaged index of 400 domestic stocks chosen for market capitalization, liquidity, and industry group representation. It gives a broad look at how US mid-cap stock prices have performed. S&P MidCap 400 Index Closest Month-End to Inception cumulative total returns as of 10/31/14 are 62.06% for Class Q; and 119.97% for Class Z. S&P MidCap 400 Index Closest Month-End to Inception average annual total returns as of 9/30/14 are 12.99% for Class Q; and 8.90% for Class Z.
Russell Midcap Index
The Russell Midcap Index is an unmanaged index which measures the performance of the 800 smallest companies in the Russell 1000 Index, which represent approximately 25% of the total market capitalization of the Russell 1000 Index. Russell Midcap Index Closest Month-End to Inception cumulative total returns as of 10/31/14 are 67.84% for Class Q; and 117.51% for Class Z. Russell Midcap Index Closest Month-End to Inception average annual total returns as of 9/30/14 are 14.22% for Class Q; and 8.82% for Class Z.
Lipper Mid-Cap Value Funds Average
The Lipper Mid-Cap Value Funds Average (Lipper Average) represents returns based on the average return of all funds in the Lipper Mid-Cap Value Funds category for the periods noted. Funds in the Lipper Average by portfolio practice, invest at least 75% of their equity assets in companies with market capitalizations (on a three-year weighted basis) less than 300% of the dollar-weighted median market capitalization of the middle 1,000 securities of the S&P SuperComposite 1500 Index. Mid-cap value funds typically have a below-average price-to-earnings ratio, price-to-book ratio, and three-year sales-per-share growth value compared with the companies in the S&P MidCap 400 Index. Lipper Average Closest Month-End to Inception cumulative total returns as of 10/31/14 are 59.12% for Class Q; and 95.09% for Class Z. Lipper Average Closest Month-End to Inception average annual total returns as of 9/30/14 are 12.68% for Class Q; and 7.54% for Class Z.
Investors cannot invest directly in an index or average. The returns for the Indexes would be lower if they included the effects of sales charges, operating expenses of a mutual fund, or taxes. Returns for the Lipper Average reflect the deduction of operating expenses, but not sales charges or taxes.
| | | | |
| Prudential Mid-Cap Value Fund | | | 5 | |
Your Fund’s Performance (continued)
| | | | |
Five Largest Holdings expressed as a percentage of net assets as of 10/31/14 | | | | |
CIGNA Corp., Health Care Providers & Services | | | 1.6 | % |
HCA Holdings, Inc., Health Care Providers & Services | | | 1.4 | |
PPL Corp., Electric Utilities | | | 1.2 | |
Western Digital Corp., Technology Hardware, Storage & Peripherals | | | 1.2 | |
ConAgra Foods, Inc., Food Products | | | 1.2 | |
Holdings reflect only long-term investments and are subject to change.
| | |
| 6 | | Visit our website at www.prudentialfunds.com |
Strategy and Performance Overview
How did the Fund perform?
Prudential Mid-Cap Value Fund’s Class A shares gained 16.49% for the 12-month reporting period ended October 31, 2014, outperforming the 16.18% gain of the benchmark Russell Midcap Value Index (the Index), and outperforming the 12.01% gain of the Lipper Mid-Cap Value Funds Average.
What were conditions like in the mid-cap section of the US stock market?
| | • | | Along with the broader equity market, prices of medium-sized US companies performed well during the 12-month period that began November 1, 2013, benefiting from stronger economic growth and attractive corporate earnings. US stocks advanced despite significant investor concerns surrounding the state of the global economic recovery—the timing of the Federal Reserve’s (the Fed) first benchmark interest rate increase, slowing gross domestic product (GDP) growth in China, fears that the euro zone’s recovery was about to unravel, and the uncertain economic impact on Europe of the geopolitical tensions between Russia and Ukraine. |
| | • | | Mid-cap value stocks outperformed small-cap value stocks as measured by the Russell Midcap Value Index and the Russell 2000 Value, but trailed large-cap value stocks as measured by the Russell 1000 Indexes. Mid-cap value stocks also outperformed mid-cap growth stocks. |
| | • | | US equities began the reporting period by posting solid gains in November and December, capping off a banner year. Market volatility was modest, despite a partial government shutdown during October 2013. In December, amid stronger economic growth, the Fed announced it would begin tapering its bond-buying program in January 2014. Investors greeted the news with enthusiasm and stocks rallied. |
| | • | | US equities slogged through a harsh winter and economic headwinds to generate a small gain in the first quarter of 2014. Weaker manufacturing growth in China led to a steep sell-off in January. Stock prices rebounded to a record high the following month. However, prices again stumbled in March due to geopolitical tensions between Russia and Ukraine, concerns surrounding slowing US economic growth, driven by unusually bad winter weather, and suggestions by new Fed chair Janet Yellen that the Fed might begin to increase interest rates sooner than expected. |
| | • | | The stock market hit a new high the first week of the second quarter before falling back on continued geopolitical worries, largely about Ukraine, and uncertainty about corporate earnings. Positive sentiment in May led to a series of new market highs, which extended into June even as the Fed continued to |
| | | | |
| Prudential Mid-Cap Value Fund | | | 7 | |
Strategy and Performance Overview (continued)
| | taper. Later in the month, a militant insurgency in Iraq briefly slowed market momentum and put oil markets on edge. Although first-quarter US economic growth was revised downward to its worst contraction in five years, US equities posted modest gains for the period. |
| | • | | US equity performance was tepid in the third quarter. A positive sentiment prevailed, driven by solid fundamentals and robust economic growth. US stocks shrugged off intensifying geopolitical conflicts in the Middle East and Ukraine to hit yet another record high in August. Volatility picked up in September as investors again speculated about the Fed’s pace of interest rate increases. |
| | • | | Concerns about a global slowdown and the strengthening US dollar, which can potentially hurt exports of multinational companies, led to a sharp equity market pullback in mid-October. |
| | • | | Additionally, the Bank of Japan’s plan to boost its quantitative easing program by increasing the government pension fund’s allocation into equities and generally strong third-quarter US earnings reports, coupled with upbeat US economic news, helped push the S&P 500 to a record high October close. |
How did the stock market sectors perform?
| | • | | All sectors within the Index posted double-digit returns with the exception of energy, which was down 9.48%. Healthcare, telecommunication services, information technology, and consumer staples posted the strongest returns. |
Which stock market sectors and holdings contributed most to the Fund’s performance?
| | • | | The Fund’s superior security selection within industrials, especially among airline and machinery companies, along with favorable selection within the consumer discretionary and utility sectors, drove performance for the reporting period. |
| | • | | Within airlines, by far the top-performing industry within industrials, Southwest Airlines, which more than doubled in price during the period, Alaska Air Group, and United Continental Holdings were the top contributors. Good revenue growth and lower non-fuel costs drove the strong performance among airlines. |
| | • | | Among machinery companies, the Fund’s overweight in Trinity Industries, a manufacturer of railcars, and the timely sale of Oshkosh Corp., a manufacturer of specialty trucks and military vehicles, benefited performance. |
| | • | | Other industrials holdings that aided performance included AMERCO, the parent company of U-Haul, the do-it-yourself moving operator; United |
| | |
| 8 | | Visit our website at www.prudentialfunds.com |
| | Rentals, an equipment rental company to construction, industrial, and utility companies; and ADT, a leader in the home security market. Investors reacted favorably as ADT’s management stemmed the rate of attrition through stricter credit standards for new customers. |
| | • | | Within the consumer discretionary sector, the Fund’s underweight in poor-performing media companies, especially Liberty Media, helped performance, as did overweights in cruise operator Royal Caribbean, gas station and convenience store chain Murphy USA, and athletic shoe retailer Foot Locker. |
| | • | | In the utilities sector, a below-benchmark exposure to Consolidated Edison and above-benchmark exposures to Wisconsin Energy, UGI Corp., and MDU Resources contributed most to performance. |
Which stock market sectors and holdings detracted most from the Fund’s performance?
| | • | | Holdings in the financials, healthcare, and energy sectors detracted from the Fund’s relative performance during the period. |
| | • | | In financials, the Fund’s holdings among REITs (real estate investment trusts), especially overweights in Corrections Corp. and CBL & Associates, hurt performance, as did an above-benchmark exposure to bank stocks. The untimely sale of NASDAQ OMX Group also detracted from performance. |
| | • | | In healthcare, the Fund lacked exposure to Forest Laboratories, which was acquired by Actavis Plc at a substantial premium during the period. |
| | • | | Energy sector stocks suffered an absolute decline due to the fall in oil prices. Holdings in Denbury Resources, SM Energy, Southwestern Energy, and Unit Corp. were the largest detractors. |
| | | | |
| Prudential Mid-Cap Value Fund | | | 9 | |
Fees and Expenses (Unaudited)
As a shareholder of the Fund, you incur two types of costs: (1) transaction costs, including sales charges (loads) on purchase payments and redemptions, as applicable, and (2) ongoing costs, including management fees, distribution and/or service (12b-1) fees, and other Fund expenses, as applicable. This example is intended to help you understand your ongoing costs (in dollars) of investing in the Fund and to compare these costs with the ongoing costs of investing in other mutual funds.
The example is based on an investment of $1,000 invested on May 1, 2014, at the beginning of the period, and held through the six-month period ended October 31, 2014. The example is for illustrative purposes only; you should consult the Prospectus for information on initial and subsequent minimum investment requirements.
Actual Expenses
The first line for each share class in the table on the following page provides information about actual account values and actual expenses. You may use the information on this line, together with the amount you invested, to estimate the expenses that you paid over the period. Simply divide your account value by $1,000 (for example, an $8,600 account value ÷ $1,000 = 8.6), then multiply the result by the number on the first line under the heading “Expenses Paid During the Six-Month Period” to estimate the expenses you paid on your account during this period.
Hypothetical Example for Comparison Purposes
The second line for each share class in the table on the following page provides information about hypothetical account values and hypothetical expenses based on the Fund’s actual expense ratio and an assumed rate of return of 5% per year before expenses, which is not the Fund’s actual return. The hypothetical account values and expenses may not be used to estimate the actual ending account balance or expenses you paid for the period. You may use this information to compare the ongoing costs of investing in the Fund and other funds. To do so, compare this 5% hypothetical example with the 5% hypothetical examples that appear in the shareholder reports of the other funds.
The Fund’s transfer agent may charge additional fees to holders of certain accounts that are not included in the expenses shown in the table on the following page. These fees apply to individual retirement accounts (IRAs) and Section 403(b) accounts. As of the close of the six-month period covered by the table, IRA fees included an annual maintenance fee of $15 per account (subject to a maximum annual maintenance fee of $25 for all accounts held by the same shareholder). Section 403(b) accounts are charged an annual $25 fiduciary maintenance fee. Some of the fees may vary in amount, or may be waived, based on your total account balance or the number of
| | |
| 10 | | Visit our website at www.prudentialfunds.com |
Prudential Investments funds, including the Fund, that you own. You should consider the additional fees that were charged to your Fund account over the six-month period when you estimate the total ongoing expenses paid over the period and the impact of these fees on your ending account value, as these additional expenses are not reflected in the information provided in the expense table. Additional fees have the effect of reducing investment returns.
Please note that the expenses shown in the table are meant to highlight your ongoing costs only and do not reflect any transactional costs such as sales charges (loads). Therefore, the second line for each share class in the table is useful in comparing ongoing costs only and will not help you determine the relative total costs of owning different funds. In addition, if these transactional costs were included, your costs would have been higher.
| | | | | | | | | | | | | | | | | | |
Prudential
Mid-Cap
Value Fund | | Beginning Account
Value
May 1, 2014 | | | Ending Account
Value
October 31, 2014 | | | Annualized
Expense Ratio
Based on the
Six-Month Period | | | Expenses Paid
During the
Six-Month Period* | |
| | | | | | | | | | | | | | | | | | |
| Class A | | Actual | | $ | 1,000.00 | | | $ | 1,065.20 | | | | 1.24 | % | | $ | 6.45 | |
| | | Hypothetical | | $ | 1,000.00 | | | $ | 1,018.95 | | | | 1.24 | % | | $ | 6.31 | |
| | | | | | | | | | | | | | | | | | |
| Class B | | Actual | | $ | 1,000.00 | | | $ | 1,061.50 | | | | 1.99 | % | | $ | 10.34 | |
| | | Hypothetical | | $ | 1,000.00 | | | $ | 1,015.17 | | | | 1.99 | % | | $ | 10.11 | |
| | | | | | | | | | | | | | | | | | |
| Class C | | Actual | | $ | 1,000.00 | | | $ | 1,061.10 | | | | 1.99 | % | | $ | 10.34 | |
| | | Hypothetical | | $ | 1,000.00 | | | $ | 1,015.17 | | | | 1.99 | % | | $ | 10.11 | |
| | | | | | | | | | | | | | | | | | |
| Class Q | | Actual | | $ | 1,000.00 | | | $ | 1,066.70 | | | | 0.83 | % | | $ | 4.32 | |
| | | Hypothetical | | $ | 1,000.00 | | | $ | 1,021.02 | | | | 0.83 | % | | $ | 4.23 | |
| | | | | | | | | | | | | | | | | | |
| Class Z | | Actual | | $ | 1,000.00 | | | $ | 1,066.70 | | | | 0.99 | % | | $ | 5.16 | |
| | | Hypothetical | | $ | 1,000.00 | | | $ | 1,020.21 | | | | 0.99 | % | | $ | 5.04 | |
*Fund expenses (net of fee waivers or subsidies, if any) for each share class are equal to the annualized expense ratio for each share class (provided in the table), multiplied by the average account value over the period, multiplied by the 184 days in the six-month period ended October 31, 2014, and divided by 365 days in the Fund’s fiscal year ended October 31, 2014 (to reflect the six-month period). Expenses presented in the table include the expenses of any underlying portfolios in which the Fund may invest.
| | | | |
| Prudential Mid-Cap Value Fund | | | 11 | |
Fees and Expenses (continued)
The Fund’s annualized expense ratios for the year ended October 31, 2014, are as follows:
| | | | | | | | |
| Class | | Gross Operating Expenses | | | Net Operating Expenses | |
A | | | 1.42 | % | | | 1.22 | % |
B | | | 2.12 | | | | 1.97 | |
C | | | 2.12 | | | | 1.97 | |
Q | | | 0.97 | | | | 0.91 | |
Z | | | 1.11 | | | | 0.97 | |
Net operating expenses shown above reflect any fee waivers and/or expense reimbursements. Additional information on Fund expenses and any fee waivers and/or expense reimbursements can be found in the “Financial Highlights” tables in this report and in the Notes to the Financial Statements in this report.
| | |
| 12 | | Visit our website at www.prudentialfunds.com |
Portfolio of Investments
as of October 31, 2014
| | | | | | | | |
| Description | | Shares | | | Value (Note 2) | |
LONG-TERM INVESTMENTS 99.9% | | | | | | | | |
| | |
COMMON STOCKS 99.6% | | | | | | | | |
| | |
Aerospace & Defense 4.1% | | | | | | | | |
Alliant Techsystems, Inc. | | | 26,100 | | | $ | 3,052,656 | |
Huntington Ingalls Industries, Inc. | | | 32,200 | | | | 3,407,404 | |
L-3 Communications Holdings, Inc. | | | 42,800 | | | | 5,198,488 | |
Spirit Aerosystems Holdings, Inc. (Class A Stock)* | | | 83,800 | | | | 3,296,692 | |
Textron, Inc. | | | 121,400 | | | | 5,041,742 | |
| | | | | | | | |
| | | | | | | 19,996,982 | |
| | |
Airlines 2.1% | | | | | | | | |
Alaska Air Group, Inc. | | | 68,700 | | | | 3,656,901 | |
Southwest Airlines Co. | | | 96,900 | | | | 3,341,112 | |
United Continental Holdings, Inc.* | | | 58,900 | | | | 3,110,509 | |
| | | | | | | | |
| | | | | | | 10,108,522 | |
| | |
Auto Components 1.7% | | | | | | | | |
Lear Corp. | | | 41,600 | | | | 3,848,000 | |
TRW Automotive Holdings Corp.* | | | 45,100 | | | | 4,570,885 | |
| | | | | | | | |
| | | | | | | 8,418,885 | |
| | |
Banks 8.9% | | | | | | | | |
Associated Banc-Corp. | | | 127,900 | | | | 2,404,520 | |
Bank of Hawaii Corp. | | | 34,500 | | | | 2,019,975 | |
BankUnited, Inc. | | | 43,200 | | | | 1,291,680 | |
BOK Financial Corp. | | | 31,200 | | | | 2,139,072 | |
CIT Group, Inc. | | | 72,600 | | | | 3,552,318 | |
Comerica, Inc. | | | 68,600 | | | | 3,274,964 | |
Commerce Bancshares, Inc. | | | 39,210 | | | | 1,774,645 | |
East West Bancorp, Inc. | | | 75,900 | | | | 2,790,084 | |
Fifth Third Bancorp | | | 128,800 | | | | 2,574,712 | |
First Niagara Financial Group, Inc. | | | 164,600 | | | | 1,232,854 | |
First Republic Bank | | | 20,800 | | | | 1,059,344 | |
Fulton Financial Corp. | | | 192,300 | | | | 2,284,524 | |
Huntington Bancshares, Inc. | | | 322,700 | | | | 3,197,957 | |
KeyCorp. | | | 245,200 | | | | 3,236,640 | |
Regions Financial Corp. | | | 320,000 | | | | 3,177,600 | |
SunTrust Banks, Inc. | | | 121,900 | | | | 4,771,166 | |
TCF Financial Corp. | | | 144,900 | | | | 2,238,705 | |
| | | | | | | | |
| | | | | | | 43,020,760 | |
See Notes to Financial Statements.
| | | | |
| Prudential Mid-Cap Value Fund | | | 13 | |
Portfolio of Investments
as of October 31, 2014 continued
| | | | | | | | |
| Description | | Shares | | | Value (Note 2) | |
COMMON STOCKS (Continued) | | | | | | | | |
| | |
Capital Markets 0.3% | | | | | | | | |
Lazard Ltd. (Class A Stock) | | | 28,700 | | | $ | 1,412,327 | |
| | |
Chemicals 2.9% | | | | | | | | |
Celanese Corp. (Class A Stock) | | | 74,400 | | | | 4,369,512 | |
CF Industries Holdings, Inc. | | | 14,600 | | | | 3,796,000 | |
Eastman Chemical Co. | | | 39,100 | | | | 3,158,498 | |
Westlake Chemical Corp. | | | 37,500 | | | | 2,645,625 | |
| | | | | | | | |
| | | | | | | 13,969,635 | |
| | |
Commercial Services & Supplies 1.6% | | | | | | | | |
ADT Corp. (The) | | | 128,600 | | | | 4,609,024 | |
Pitney Bowes, Inc. | | | 133,200 | | | | 3,295,368 | |
| | | | | | | | |
| | | | | | | 7,904,392 | |
| | |
Communications Equipment 1.6% | | | | | | | | |
Brocade Communications Systems, Inc. | | | 391,300 | | | | 4,198,649 | |
Harris Corp. | | | 49,000 | | | | 3,410,400 | |
| | | | | | | | |
| | | | | | | 7,609,049 | |
| | |
Consumer Finance 0.3% | | | | | | | | |
Navient Corp. | | | 63,600 | | | | 1,258,008 | |
| | |
Containers & Packaging 2.0% | | | | | | | | |
Ball Corp. | | | 51,700 | | | | 3,331,031 | |
Crown Holdings, Inc.* | | | 74,600 | | | | 3,575,578 | |
Rock-Tenn Co. (Class A Stock) | | | 52,200 | | | | 2,670,030 | |
| | | | | | | | |
| | | | | | | 9,576,639 | |
| | |
Diversified Consumer Services 0.3% | | | | | | | | |
Apollo Education Group, Inc.* | | | 52,100 | | | | 1,493,186 | |
| | |
Diversified Financial Services 0.7% | | | | | | | | |
NASDAQ OMX Group, Inc. (The) | | | 75,600 | | | | 3,270,456 | |
| | |
Electric Utilities 5.4% | | | | | | | | |
Edison International | | | 88,700 | | | | 5,550,846 | |
Entergy Corp. | | | 49,800 | | | | 4,184,196 | |
Great Plains Energy, Inc. | | | 16,500 | | | | 444,345 | |
Pinnacle West Capital Corp. | | | 53,100 | | | | 3,264,057 | |
PPL Corp. | | | 170,500 | | | | 5,965,795 | |
See Notes to Financial Statements.
| | | | | | | | |
| Description | | Shares | | | Value (Note 2) | |
COMMON STOCKS (Continued) | | | | | | | | |
| | |
Electric Utilities (cont’d.) | | | | | | | | |
Westar Energy, Inc.(a) | | | 44,100 | | | $ | 1,667,421 | |
Xcel Energy, Inc. | | | 146,600 | | | | 4,906,702 | |
| | | | | | | | |
| | | | | | | 25,983,362 | |
| | |
Electronic Equipment, Instruments & Components 2.1% | | | | | | | | |
Arrow Electronics, Inc.* | | | 69,700 | | | | 3,963,142 | |
Jabil Circuit, Inc.(a) | | | 179,100 | | | | 3,752,145 | |
Vishay Intertechnology, Inc.(a) | | | 180,300 | | | | 2,435,853 | |
| | | | | | | | |
| | | | | | | 10,151,140 | |
| | |
Energy Equipment & Services 3.2% | | | | | | | | |
Helmerich & Payne, Inc. | | | 28,900 | | | | 2,509,098 | |
Nabors Industries Ltd. | | | 157,700 | | | | 2,814,945 | |
Oil States International, Inc.* | | | 56,000 | | | | 3,345,440 | |
Patterson-UTI Energy, Inc. | | | 70,000 | | | | 1,612,100 | |
Superior Energy Services, Inc. | | | 108,200 | | | | 2,721,230 | |
Unit Corp.* | | | 55,300 | | | | 2,677,626 | |
| | | | | | | | |
| | | | | | | 15,680,439 | |
| | |
Food & Staples Retailing 0.7% | | | | | | | | |
Kroger Co. (The) | | | 64,100 | | | | 3,571,011 | |
| | |
Food Products 4.0% | | | | | | | | |
Bunge Ltd. | | | 64,700 | | | | 5,735,655 | |
ConAgra Foods, Inc. | | | 167,100 | | | | 5,739,885 | |
Pilgrim’s Pride Corp.*(a) | | | 116,200 | | | | 3,301,242 | |
Pinnacle Foods, Inc. | | | 50,100 | | | | 1,693,380 | |
Tyson Foods, Inc. (Class A Stock)(a) | | | 64,600 | | | | 2,606,610 | |
| | | | | | | | |
| | | | | | | 19,076,772 | |
| | |
Gas Utilities 1.4% | | | | | | | | |
AGL Resources, Inc. | | | 56,700 | | | | 3,056,697 | |
UGI Corp. | | | 92,150 | | | | 3,473,133 | |
| | | | | | | | |
| | | | | | | 6,529,830 | |
| | |
Health Care Providers & Services 6.2% | | | | | | | | |
Aetna, Inc. | | | 17,700 | | | | 1,460,427 | |
CIGNA Corp. | | | 76,500 | | | | 7,617,105 | |
DaVita HealthCare Partners, Inc.* | | | 9,800 | | | | 765,086 | |
HCA Holdings, Inc.* | | | 94,900 | | | | 6,647,745 | |
See Notes to Financial Statements.
| | | | |
| Prudential Mid-Cap Value Fund | | | 15 | |
Portfolio of Investments
as of October 31, 2014 continued
| | | | | | | | |
| Description | | Shares | | | Value (Note 2) | |
COMMON STOCKS (Continued) | | | | | | | | |
| | |
Health Care Providers & Services (cont’d.) | | | | | | | | |
Health Net, Inc.* | | | 77,700 | | | $ | 3,691,527 | |
Humana, Inc. | | | 21,900 | | | | 3,040,815 | |
Laboratory Corp. of America Holdings* | | | 23,600 | | | | 2,579,244 | |
Universal Health Services, Inc. (Class B Stock) | | | 37,900 | | | | 3,930,609 | |
| | | | | | | | |
| | | | | | | 29,732,558 | |
| | |
Hotels, Restaurants & Leisure 0.7% | | | | | | | | |
Royal Caribbean Cruises Ltd. | | | 48,400 | | | | 3,289,748 | |
| | |
Household Durables 1.5% | | | | | | | | |
Newell Rubbermaid, Inc. | | | 34,200 | | | | 1,139,886 | |
PulteGroup, Inc. | | | 130,500 | | | | 2,504,295 | |
Whirlpool Corp. | | | 21,500 | | | | 3,699,075 | |
| | | | | | | | |
| | | | | | | 7,343,256 | |
| | |
Independent Power & Renewable Electricity Producers 0.7% | | | | | | | | |
AES Corp. (The) | | | 234,800 | | | | 3,303,636 | |
| | |
Insurance 9.6% | | | | | | | | |
Alleghany Corp.* | | | 6,700 | | | | 2,976,676 | |
Allied World Assurance Co. Holdings AG | | | 54,100 | | | | 2,055,800 | |
American Financial Group, Inc. | | | 42,400 | | | | 2,536,792 | |
Arch Capital Group Ltd.* | | | 52,500 | | | | 2,956,800 | |
Aspen Insurance Holdings Ltd. | | | 35,700 | | | | 1,557,591 | |
Axis Capital Holdings Ltd. | | | 53,700 | | | | 2,585,118 | |
Endurance Specialty Holdings Ltd. | | | 40,000 | | | | 2,318,000 | |
Hanover Insurance Group, Inc. (The) | | | 36,900 | | | | 2,470,086 | |
HCC Insurance Holdings, Inc. | | | 58,700 | | | | 3,063,553 | |
Loews Corp. | | | 93,400 | | | | 4,072,240 | |
Old Republic International Corp. | | | 124,400 | | | | 1,837,388 | |
PartnerRe Ltd. | | | 22,100 | | | | 2,556,749 | |
ProAssurance Corp. | | | 15,500 | | | | 725,090 | |
Progressive Corp. (The) | | | 161,500 | | | | 4,265,215 | |
Reinsurance Group of America, Inc. | | | 29,800 | | | | 2,510,650 | |
StanCorp Financial Group, Inc. | | | 15,300 | | | | 1,064,268 | |
Unum Group | | | 101,500 | | | | 3,396,190 | |
W.R. Berkley Corp. | | | 50,800 | | | | 2,618,232 | |
XL Group PLC (Ireland) | | | 17,100 | | | | 579,348 | |
| | | | | | | | |
| | | | | | | 46,145,786 | |
See Notes to Financial Statements.
| | | | | | | | |
| Description | | Shares | | | Value (Note 2) | |
COMMON STOCKS (Continued) | | | | | | | | |
| | |
IT Services 3.4% | | | | | | | | |
Booz Allen Hamilton Holding Corp. | | | 139,700 | | | $ | 3,681,095 | |
Computer Sciences Corp. | | | 67,400 | | | | 4,070,960 | |
DST Systems, Inc. | | | 32,500 | | | | 3,131,375 | |
Xerox Corp. | | | 401,000 | | | | 5,325,280 | |
| | | | | | | | |
| | | | | | | 16,208,710 | |
| | |
Machinery 2.3% | | | | | | | | |
Dover Corp. | | | 44,400 | | | | 3,527,136 | |
Lincoln Electric Holdings, Inc. | | | 32,500 | | | | 2,355,600 | |
Timken Co. (The) | | | 94,900 | | | | 4,079,751 | |
Trinity Industries, Inc. | | | 28,400 | | | | 1,014,164 | |
| | | | | | | | |
| | | | | | | 10,976,651 | |
| | |
Media 0.5% | | | | | | | | |
Gannett Co., Inc. | | | 74,000 | | | | 2,331,000 | |
Starz (Class A Stock)* | | | 8,900 | | | | 275,010 | |
| | | | | | | | |
| | | | | | | 2,606,010 | |
| | |
Metals & Mining 0.6% | | | | | | | | |
United States Steel Corp.(a) | | | 73,600 | | | | 2,946,944 | |
| | |
Multi-Utilities 5.0% | | | | | | | | |
Alliant Energy Corp. | | | 47,600 | | | | 2,946,916 | |
Ameren Corp. | | | 45,500 | | | | 1,926,470 | |
CMS Energy Corp. | | | 148,900 | | | | 4,864,563 | |
Consolidated Edison, Inc. | | | 86,600 | | | | 5,486,976 | |
Public Service Enterprise Group, Inc. | | | 121,900 | | | | 5,035,689 | |
SCANA Corp.(a) | | | 67,600 | | | | 3,710,564 | |
Sempra Energy | | | 1,000 | | | | 110,000 | |
| | | | | | | | |
| | | | | | | 24,081,178 | |
| | |
Multiline Retail 0.7% | | | | | | | | |
Big Lots, Inc. | | | 9,400 | | | | 429,110 | |
Macy’s, Inc. | | | 53,600 | | | | 3,099,152 | |
| | | | | | | | |
| | | | | | | 3,528,262 | |
| | |
Oil, Gas & Consumable Fuels 2.7% | | | | | | | | |
Chesapeake Energy Corp. | | | 116,100 | | | | 2,575,098 | |
Murphy Oil Corp. | | | 10,700 | | | | 571,273 | |
SM Energy Co. | | | 37,800 | | | | 2,128,140 | |
See Notes to Financial Statements.
| | | | |
| Prudential Mid-Cap Value Fund | | | 17 | |
Portfolio of Investments
as of October 31, 2014 continued
| | | | | | | | |
| Description | | Shares | | | Value (Note 2) | |
COMMON STOCKS (Continued) | | | | | | | | |
| | |
Oil, Gas & Consumable Fuels (cont’d.) | | | | | | | | |
Southwestern Energy Co.* | | | 74,300 | | | $ | 2,415,493 | |
Tesoro Corp. | | | 31,500 | | | | 2,249,415 | |
Whiting Petroleum Corp.* | | | 46,500 | | | | 2,847,660 | |
| | | | | | | | |
| | | | | | | 12,787,079 | |
| | |
Paper & Forest Products 0.3% | | | | | | | | |
International Paper Co. | | | 31,500 | | | | 1,594,530 | |
| | |
Real Estate Investment Trusts (REITs) 9.6% | | | | | | | | |
American Capital Agency Corp. | | | 80,300 | | | | 1,826,022 | |
Annaly Capital Management, Inc. | | | 228,000 | | | | 2,601,480 | |
Apartment Investment & Management Co. (Class A Stock) | | | 52,800 | | | | 1,889,712 | |
AvalonBay Communities, Inc. | | | 24,600 | | | | 3,833,664 | |
Boston Properties, Inc. | | | 11,500 | | | | 1,457,625 | |
Brandywine Realty Trust | | | 117,100 | | | | 1,806,853 | |
Chimera Investment Corp. | | | 526,600 | | | | 1,642,992 | |
Douglas Emmett, Inc. | | | 29,500 | | | | 829,835 | |
Equity Lifestyle Properties, Inc. | | | 37,200 | | | | 1,826,520 | |
General Growth Properties, Inc. | | | 80,700 | | | | 2,090,937 | |
HCP, Inc. | | | 56,300 | | | | 2,475,511 | |
Hospitality Properties Trust | | | 69,700 | | | | 2,063,817 | |
Host Hotels & Resorts, Inc. | | | 109,900 | | | | 2,561,769 | |
MFA Financial, Inc. | | | 179,700 | | | | 1,505,886 | |
Piedmont Office Realty Trust, Inc. (Class A Stock) | | | 111,200 | | | | 2,162,840 | |
Post Properties, Inc. | | | 37,800 | | | | 2,114,532 | |
Prologis, Inc. | | | 87,700 | | | | 3,652,705 | |
Rayonier, Inc. | | | 43,100 | | | | 1,442,557 | |
Senior Housing Properties Trust | | | 91,700 | | | | 2,071,503 | |
Starwood Property Trust, Inc. | | | 54,500 | | | | 1,229,520 | |
Taubman Centers, Inc. | | | 15,300 | | | | 1,163,565 | |
Ventas, Inc. | | | 44,600 | | | | 3,055,546 | |
Weyerhaeuser Co. | | | 32,500 | | | | 1,100,450 | |
| | | | | | | | |
| | | | | | | 46,405,841 | |
| | |
Real Estate Management & Development 0.2% | | | | | | | | |
Jones Lang LaSalle, Inc. | | | 7,500 | | | | 1,014,075 | |
| | |
Road & Rail 1.0% | | | | | | | | |
AMERCO | | | 9,700 | | | | 2,629,864 | |
Ryder System, Inc. | | | 22,400 | | | | 1,981,728 | |
| | | | | | | | |
| | | | | | | 4,611,592 | |
See Notes to Financial Statements.
| | | | | | | | |
| Description | | Shares | | | Value (Note 2) | |
COMMON STOCKS (Continued) | | | | | | | | |
| | |
Semiconductors & Semiconductor Equipment 0.6% | | | | | | | | |
Marvell Technology Group Ltd. | | | 201,300 | | | $ | 2,705,472 | |
Micron Technology, Inc.* | | | 10,900 | | | | 360,681 | |
| | | | | | | | |
| | | | | | | 3,066,153 | |
| | |
Software 2.6% | | | | | | | | |
CA, Inc. | | | 115,000 | | | | 3,341,900 | |
Symantec Corp. | | | 210,600 | | | | 5,227,092 | |
Synopsys, Inc.* | | | 100,100 | | | | 4,102,098 | |
| | | | | | | | |
| | | | | | | 12,671,090 | |
| | |
Specialty Retail 3.6% | | | | | | | | |
Best Buy Co., Inc. | | | 80,700 | | | | 2,755,098 | |
Dick’s Sporting Goods, Inc. | | | 64,300 | | | | 2,917,291 | |
DSW, Inc. (Class A Stock) | | | 67,700 | | | | 2,007,305 | |
Foot Locker, Inc. | | | 45,500 | | | | 2,548,455 | |
GameStop Corp. (Class A Stock) | | | 44,700 | | | | 1,911,372 | |
Murphy USA, Inc.* | | | 68,400 | | | | 3,919,320 | |
Penske Automotive Group, Inc. | | | 30,900 | | | | 1,397,916 | |
| | | | | | | | |
| | | | | | | 17,456,757 | |
| | |
Technology Hardware, Storage & Peripherals 2.6% | | | | | | | | |
Lexmark International, Inc. (Class A Stock)(a) | | | 52,400 | | | | 2,261,584 | |
NetApp, Inc. | | | 106,500 | | | | 4,558,200 | |
Western Digital Corp. | | | 59,500 | | | | 5,853,015 | |
| | | | | | | | |
| | | | | | | 12,672,799 | |
| | |
Thrifts & Mortgage Finance 0.3% | | | | | | | | |
Washington Federal, Inc. | | | 72,900 | | | | 1,591,407 | |
| | |
Trading Companies & Distributors 1.6% | | | | | | | | |
Air Lease Corp. | | | 53,400 | | | | 1,953,906 | |
GATX Corp.(a) | | | 32,700 | | | | 2,073,180 | |
United Rentals, Inc.*(a) | | | 32,700 | | | | 3,598,962 | |
| | | | | | | | |
| | | | | | | 7,626,048 | |
| | | | | | | | |
TOTAL COMMON STOCKS
(cost $429,226,015) | | | | | | | 480,691,505 | |
| | | | | | | | |
See Notes to Financial Statements.
| | | | |
| Prudential Mid-Cap Value Fund | | | 19 | |
Portfolio of Investments
as of October 31, 2014 continued
| | | | | | | | |
| Description | | Shares | | | Value (Note 2) | |
| | |
EXCHANGE TRADED FUND 0.3% | | | | | | | | |
iShares Russell Mid-Cap Value
(cost $1,027,321) | | | 18,500 | | | $ | 1,339,770 | |
| | | | | | | | |
TOTAL LONG-TERM INVESTMENTS
(cost $430,253,336) | | | | | | | 482,031,275 | |
| | | | | | | | |
| | |
SHORT-TERM INVESTMENT 5.2% | | | | | | | | |
| | |
AFFILIATED MONEY MARKET MUTUAL FUND | | | | | | | | |
Prudential Investment Portfolios 2 - Prudential Core Taxable Money Market Fund
(cost $25,018,016; includes $20,352,265 of cash collateral for securities on loan)(Note 4)(b)(c) | | | 25,018,016 | | | | 25,018,016 | |
| | | | | | | | |
TOTAL INVESTMENTS 105.1%
(cost $455,271,352; Note 5) | | | | | | | 507,049,291 | |
Liabilities in excess of other assets (5.1)% | | | | | | | (24,582,409 | ) |
| | | | | | | | |
NET ASSETS 100.0% | | | | | | $ | 482,466,882 | |
| | | | | | | | |
| * | Non-income producing security. |
| (a) | All or a portion of security is on loan. The aggregate market value of such securities, including those sold and pending settlement, is $20,331,041; cash collateral of $20,352,265 (included in liabilities) was received with which the Fund purchased highly liquid short-term investments. Securities on loan are subject to contractual netting arrangements. Cash collateral is less than 102% of the market value of securities loaned due to significant market increases on the last business day of the reporting period. Collateral was subsequently received on the following business day and the Fund remained in compliance. |
| (b) | Represents security, or a portion thereof, purchased with cash collateral received for securities on loan. |
| (c) | Prudential Investments LLC, the manager of the Fund, also serves as manager of the Prudential Investment Portfolios 2 - Prudential Core Taxable Money Market Fund. |
Various inputs are used in determining the value of the Fund’s investments. These inputs are summarized in the three broad levels listed below.
Level 1—quoted prices generally in active markets for identical securities.
Level 2—quoted prices for similar securities, interest rates and yield curves, prepayment speeds, foreign currency exchange rates, and other significant observable inputs.
Level 3—significant unobservable inputs for securities valued in accordance with Board approved fair valuation procedures.
See Notes to Financial Statements.
The following is a summary of the inputs used as of October 31, 2014 in valuing such portfolio securities:
| | | | | | | | | | | | |
| | | Level 1 | | | Level 2 | | | Level 3 | |
Investments in Securities | | | | | | | | | | | | |
Common Stocks: | | | | | | | | | | | | |
Aerospace & Defense | | $ | 19,996,982 | | | $ | — | | | $ | — | |
Airlines | | | 10,108,522 | | | | — | | | | — | |
Auto Components | | | 8,418,885 | | | | — | | | | — | |
Banks | | | 43,020,760 | | | | — | | | | — | |
Capital Markets | | | 1,412,327 | | | | — | | | | — | |
Chemicals | | | 13,969,635 | | | | — | | | | — | |
Commercial Services & Supplies | | | 7,904,392 | | | | — | | | | — | |
Communications Equipment | | | 7,609,049 | | | | — | | | | — | |
Consumer Finance | | | 1,258,008 | | | | — | | | | — | |
Containers & Packaging | | | 9,576,639 | | | | — | | | | — | |
Diversified Consumer Services | | | 1,493,186 | | | | — | | | | — | |
Diversified Financial Services | | | 3,270,456 | | | | — | | | | — | |
Electric Utilities | | | 25,983,362 | | | | — | | | | — | |
Electronic Equipment, Instruments & Components | | | 10,151,140 | | | | — | | | | — | |
Energy Equipment & Services | | | 15,680,439 | | | | — | | | | — | |
Food & Staples Retailing | | | 3,571,011 | | | | — | | | | — | |
Food Products | | | 19,076,772 | | | | — | | | | — | |
Gas Utilities | | | 6,529,830 | | | | — | | | | — | |
Health Care Providers & Services | | | 29,732,558 | | | | — | | | | — | |
Hotels, Restaurants & Leisure | | | 3,289,748 | | | | — | | | | — | |
Household Durables | | | 7,343,256 | | | | — | | | | — | |
Independent Power & Renewable Electricity Producers | | | 3,303,636 | | | | — | | | | — | |
Insurance | | | 46,145,786 | | | | — | | | | — | |
IT Services | | | 16,208,710 | | | | — | | | | — | |
Machinery | | | 10,976,651 | | | | — | | | | — | |
Media | | | 2,606,010 | | | | — | | | | — | |
Metals & Mining | | | 2,946,944 | | | | — | | | | — | |
Multi-Utilities | | | 24,081,178 | | | | — | | | | — | |
Multiline Retail | | | 3,528,262 | | | | — | | | | — | |
Oil, Gas & Consumable Fuels | | | 12,787,079 | | | | — | | | | — | |
Paper & Forest Products | | | 1,594,530 | | | | — | | | | — | |
Real Estate Investment Trusts (REITs) | | | 46,405,841 | | | | — | | | | — | |
Real Estate Management & Development | | | 1,014,075 | | | | — | | | | — | |
Road & Rail | | | 4,611,592 | | | | — | | | | — | |
Semiconductors & Semiconductor Equipment | | | 3,066,153 | | | | — | | | | — | |
Software | | | 12,671,090 | | | | — | | | | — | |
Specialty Retail | | | 17,456,757 | | | | — | | | | — | |
See Notes to Financial Statements.
| | | | |
| Prudential Mid-Cap Value Fund | | | 21 | |
Portfolio of Investments
as of October 31, 2014 continued
| | | | | | | | | | | | |
| | | Level 1 | | | Level 2 | | | Level 3 | |
Common Stocks (continued): | | | | | | | | | | | | |
Technology Hardware, Storage & Peripherals | | $ | 12,672,799 | | | $ | — | | | $ | — | |
Thrifts & Mortgage Finance | | | 1,591,407 | | | | — | | | | — | |
Trading Companies & Distributors | | | 7,626,048 | | | | — | | | | — | |
Exchange Traded Fund | | | 1,339,770 | | | | — | | | | — | |
Affiliated Money Market Mutual Fund | | | 25,018,016 | | | | — | | | | — | |
| | | | | | | | | | | | |
Total | | $ | 507,049,291 | | | $ | — | | | $ | — | |
| | | | | | | | | | | | |
The industry classification of investments and liabilities in excess of other assets shown as a percentage of net assets as of October 31, 2014 was as follows (Unaudited):
| | | | |
Real Estate Investment Trusts (REITs) | | | 9.6 | % |
Insurance | | | 9.6 | |
Banks | | | 8.9 | |
Health Care Providers & Services | | | 6.2 | |
Electric Utilities | | | 5.4 | |
Affiliated Money Market Mutual Fund (including 4.2% of collateral for securities on loan) | | | 5.2 | |
Multi-Utilities | | | 5.0 | |
Aerospace & Defense | | | 4.1 | |
Food Products | | | 4.0 | |
Specialty Retail | | | 3.6 | |
IT Services | | | 3.4 | |
Energy Equipment & Services | | | 3.2 | |
Chemicals | | | 2.9 | |
Oil, Gas & Consumable Fuels | | | 2.7 | |
Technology Hardware, Storage & Peripherals | | | 2.6 | |
Software | | | 2.6 | |
Machinery | | | 2.3 | |
Electronic Equipment, Instruments & Components | | | 2.1 | |
Airlines | | | 2.1 | |
Containers & Packaging | | | 2.0 | |
Auto Components | | | 1.7 | |
Commercial Services & Supplies | | | 1.6 | |
Trading Companies & Distributors | | | 1.6 | |
Communications Equipment | | | 1.6 | % |
Household Durables | | | 1.5 | |
Gas Utilities | | | 1.4 | |
Road & Rail | | | 1.0 | |
Food & Staples Retailing | | | 0.7 | |
Multiline Retail | | | 0.7 | |
Independent Power & Renewable Electricity Producers | | | 0.7 | |
Hotels, Restaurants & Leisure | | | 0.7 | |
Diversified Financial Services | | | 0.7 | |
Semiconductors & Semiconductor Equipment | | | 0.6 | |
Metals & Mining | | | 0.6 | |
Media | | | 0.5 | |
Paper & Forest Products | | | 0.3 | |
Thrifts & Mortgage Finance | | | 0.3 | |
Diversified Consumer Services | | | 0.3 | |
Capital Markets | | | 0.3 | |
Exchange Traded Fund | | | 0.3 | |
Consumer Finance | | | 0.3 | |
Real Estate Management & Development | | | 0.2 | |
| | | | |
| | | 105.1 | |
Liabilities in excess of other assets | | | (5.1 | ) |
| | | | |
| | | 100.0 | % |
| | | | |
See Notes to Financial Statements.
PRUDENTIAL INVESTMENTS»MUTUAL FUNDS
FINANCIAL STATEMENTS
ANNUAL REPORT · October 31, 2014
Prudential Mid-Cap Value Fund
Statement of Assets & Liabilities
as of October 31, 2014
| | | | |
Assets | | | | |
Investments at value, including securities on loan of $20,331,041: | | | | |
Unaffiliated investments (cost $430,253,336) | | $ | 482,031,275 | |
Affiliated investments (cost $25,018,016) | | | 25,018,016 | |
Receivable for Fund shares sold | | | 2,482,230 | |
Dividends and interest receivable | | | 306,618 | |
Prepaid expenses | | | 3,549 | |
| | | | |
Total assets | | | 509,841,688 | |
| | | | |
| |
Liabilities | | | | |
Payable to broker for collateral for securities on loan | | | 20,352,265 | |
Payable for Fund shares reacquired | | | 4,329,610 | |
Payable for investments purchased | | | 2,158,559 | |
Management fee payable | | | 269,816 | |
Accrued expenses and other liabilities | | | 149,123 | |
Distribution fee payable | | | 90,226 | |
Affiliated transfer agent fee payable | | | 24,836 | |
Deferred directors’ fees | | | 371 | |
| | | | |
Total liabilities | | | 27,374,806 | |
| | | | |
| |
Net Assets | | $ | 482,466,882 | |
| | | | |
| | | | | |
Net assets were comprised of: | | | | |
Common stock, at $0.001 par value | | $ | 22,635 | |
Paid-in capital in excess of par | | | 401,689,922 | |
| | | | |
| | | 401,712,557 | |
Undistributed net investment income | | | 1,637,109 | |
Accumulated net realized gain on investment transactions | | | 27,339,277 | |
Net unrealized appreciation on investments | | | 51,777,939 | |
| | | | |
Net assets, October 31, 2014 | | $ | 482,466,882 | |
| | | | |
See Notes to Financial Statements.
| | | | |
| |
Class A | | | | |
Net asset value and redemption price per share, ($218,956,755 ÷ 10,151,633 shares of common stock issued and outstanding) | | $ | 21.57 | |
Maximum sales charge (5.5% of offering price) | | | 1.25 | |
| | | | |
Maximum offering price to public | | $ | 22.82 | |
| | | | |
| |
Class B | | | | |
Net asset value, offering price and redemption price per share, ($7,959,515 ÷ 415,191 shares of common stock issued and outstanding) | | $ | 19.17 | |
| | | | |
| |
Class C | | | | |
Net asset value, offering price and redemption price per share, ($50,572,972 ÷ 2,647,318 shares of common stock issued and outstanding) | | $ | 19.10 | |
| | | | |
| |
Class Q | | | | |
Net asset value, offering price and redemption price per share, ($31,261,243 ÷ 1,437,268 shares of common stock issued and outstanding) | | $ | 21.75 | |
| | | | |
| |
Class Z | | | | |
Net asset value, offering price and redemption price per share, ($173,716,397 ÷ 7,983,360 shares of common stock issued and outstanding) | | $ | 21.76 | |
| | | | |
See Notes to Financial Statements.
| | | | |
| Prudential Mid-Cap Value Fund | | | 25 | |
Statement of Operations
Year Ended October 31, 2014
| | | | |
Net Investment Income | | | | |
Income | | | | |
Unaffiliated dividend income | | $ | 6,376,661 | |
Affiliated income from securities lending, net | | | 25,429 | |
Affiliated dividend income | | | 7,602 | |
Interest income | | | 12 | |
| | | | |
Total income | | | 6,409,704 | |
| | | | |
| |
Expenses | | | | |
Management fee | | | 2,739,015 | |
Distribution fee—Class A | | | 477,376 | |
Distribution fee—Class B | | | 71,628 | |
Distribution fee—Class C | | | 435,992 | |
Distribution fee—Class X | | | 165 | |
Transfer agent’s fees and expenses (including affiliated expenses of $102,200) | | | 443,000 | |
Registration fees | | | 100,000 | |
Custodian’s fees and expenses | | | 89,000 | |
Reports to shareholders | | | 35,000 | |
Audit fee | | | 22,000 | |
Legal fees and expenses | | | 22,000 | |
Directors’ fees | | | 19,000 | |
Insurance fees | | | 3,000 | |
Miscellaneous | | | 22,169 | |
| | | | |
Total expenses | | | 4,479,345 | |
Less: Management fee waiver and/or expense reimbursement | | | (430,940 | ) |
Distribution fee waiver—Class A | | | (79,563 | ) |
| | | | |
Net expenses | | | 3,968,842 | |
| | | | |
Net investment income | | | 2,440,862 | |
| | | | |
| |
Realized and Unrealized Gain on Investments | | | | |
Net realized gain on investment transactions | | | 27,595,582 | |
Net change in unrealized appreciation (depreciation) on investments | | | 15,962,593 | |
| | | | |
Net gain on investments | | | 43,558,175 | |
| | | | |
Net Increase In Net Assets Resulting From Operations | | $ | 45,999,037 | |
| | | | |
See Notes to Financial Statements.
Statement of Changes in Net Assets
| | | | | | | | |
| | | Year Ended October 31, | |
| | | 2014 | | | 2013 | |
Increase (Decrease) in Net Assets | | | | | | | | |
Operations | | | | | | | | |
Net investment income | | $ | 2,440,862 | | | $ | 1,676,003 | |
Net realized gain on investment transactions | | | 27,595,582 | | | | 20,689,267 | |
Net change in unrealized appreciation on investments | | | 15,962,593 | | | | 22,408,591 | |
| | | | | | | | |
Net increase in net assets resulting from operations | | | 45,999,037 | | | | 44,773,861 | |
| | | | | | | | |
| | |
Dividends and Distributions (Note 1) | | | | | | | | |
Dividends from net investment income: | | | | | | | | |
Class A | | | (930,285 | ) | | | (1,064,477 | ) |
Class B | | | (11,163 | ) | | | (20,813 | ) |
Class C | | | (72,665 | ) | | | (217,003 | ) |
Class Q | | | (235,800 | ) | | | (103,556 | ) |
Class X | | | (1,872 | ) | | | (13,204 | ) |
Class Z | | | (288,310 | ) | | | (93,311 | ) |
| | | | | | | | |
| | | (1,540,095 | ) | | | (1,512,364 | ) |
| | | | | | | | |
Distributions from net realized gains: | | | | | | | | |
Class A | | | (11,324,238 | ) | | | — | |
Class B | | | (596,390 | ) | | | — | |
Class C | | | (3,882,036 | ) | | | — | |
Class Q | | | (1,888,836 | ) | | | — | |
Class X | | | (22,785 | ) | | | — | |
Class Z | | | (2,667,279 | ) | | | — | |
| | | | | | | | |
| | | (20,381,564 | ) | | | — | |
| | | | | | | | |
| | |
Fund share transactions (Net of share conversions) (Note 6) | | | | | | | | |
Net proceeds from shares sold | | | 287,583,027 | | | | 72,676,529 | |
Net asset value of shares issued in reinvestment of dividends | | | 20,778,282 | | | | 1,460,123 | |
Cost of shares reacquired | | | (61,356,156 | ) | | | (26,351,128 | ) |
| | | | | | | | |
Net increase in net assets from Fund share transactions | | | 247,005,153 | | | | 47,785,524 | |
| | | | | | | | |
Total increase | | | 271,082,531 | | | | 91,047,021 | |
| | |
Net Assets: | | | | | | | | |
Beginning of year | | | 211,384,351 | | | | 120,337,330 | |
| | | | | | | | |
End of year(a) | | $ | 482,466,882 | | | $ | 211,384,351 | |
| | | | | | | | |
(a) Includes undistributed net investment income of: | | $ | 1,637,109 | | | $ | 759,202 | |
| | | | | | | | |
See Notes to Financial Statements.
| | | | |
| Prudential Mid-Cap Value Fund | | | 27 | |
Notes to Financial Statements
1. Organization
Prudential Investment Portfolios, Inc. 10 (the “Company”) is an open-end management investment company, registered under the Investment Company Act of 1940, as amended, (“1940 Act”). The Company was organized on March 5, 1997, as a Maryland Corporation. The Company operates as a series company. At October 31, 2014, the Company consisted of two diversified investment portfolios (each a “Fund” and collectively the “Funds”). The information presented in these financial statements pertains to Prudential Mid-Cap Value Fund (the “Fund”). The investment objective of the Fund is capital growth.
2. Significant Accounting Policies
The following accounting policies conform to U.S. generally accepted accounting principles. The Fund consistently follows such policies in the preparation of its financial statements.
Securities Valuation: The Fund holds securities and other assets that are fair valued at the close of each day the New York Stock Exchange (“NYSE”) is open for trading. Fair value is the price that would be received to sell an asset or paid to transfer a liability in an orderly transaction between market participants on the measurement date. The Board of Trustees (the “Board”) has adopted Valuation Procedures for security valuation under which fair valuation responsibilities have been delegated to Prudential Investments LLC (“PI”). Under the current Valuation Procedures, the established Valuation Committee is responsible for supervising the valuation of portfolio securities and other assets. The Valuation Procedures permit the Fund to utilize independent pricing vendor services, quotations from market makers, and alternative valuation methods when market quotations are either not readily available or not deemed representative of fair value. A record of the Valuation Committee’s actions is subject to the Board’s review, approval, and ratification at its next regularly-scheduled quarterly meeting.
Various inputs determine how the Fund’s investments are valued, all of which are categorized according to the three broad levels (Level 1, 2, or 3) detailed in the table following the Portfolio of Investments.
Common and preferred stocks, exchange-traded funds, and derivative instruments such as futures or options that are traded on a national securities exchange are valued at the last sale price as of the close of trading on the applicable exchange. Securities traded via NASDAQ are valued at the NASDAQ official closing price. To the extent these securities are valued at the last sale price or NASDAQ official closing price, they are classified as Level 1 in the fair value hierarchy except for exchange-traded and cleared swaps which are classified as Level 2 in the fair value hierarchy, as the prices marked at the official settle are not public.
In the event that no sale or official closing price on valuation date exists, these securities are generally valued at the mean between the last reported bid and ask prices, or at the last bid price in the absence of an ask price. These securities are classified as Level 2 in the fair value hierarchy, as the inputs are observable and considered to be significant to the valuation.
Common and preferred stocks, exchange-traded funds, and derivative instruments such as futures or options that are traded on a national securities exchange are valued at the last sale price as of the close of trading on the applicable exchange. Securities traded via NASDAQ are valued at the NASDAQ official closing price. To the extent these securities are valued at the last sale price or NASDAQ official closing price, they are classified as Level 1 in the fair value hierarchy.
Investments in open-end, non-exchange-traded mutual funds are valued at their net asset values as of the close of the NYSE on the date of valuation. These securities are classified as Level 1 in the fair value hierarchy since they may be purchased or sold at their net asset values on the date of valuation.
Fixed income securities traded in the over-the-counter market are generally valued at prices provided by approved independent pricing vendors. The pricing vendors provide these prices after evaluating observable inputs including, but not limited to yield curves, yield spreads, credit ratings, deal terms, tranche level attributes, default rates, cash flows, prepayment speeds, broker/dealer quotations, and reported trades. Securities valued using such vendor prices are classified as Level 2 in the fair value hierarchy.
Over-the-counter derivative instruments are generally valued using pricing vendor services, which derive the valuation based on inputs such as underlying asset prices, indices, spreads, interest rates, and exchange rates. These instruments are categorized as Level 2 in the fair value hierarchy.
Centrally cleared swaps listed or traded on a multilateral or trade facility platform, such as a registered exchange, are valued at the daily settlement price determined by
| | | | |
| Prudential Mid-Cap Value Fund | | | 29 | |
Notes to Financial Statements
continued
the respective exchange. These securities are classified as Level 2 in the fair value hierarchy, as the prices marked at the official settle are not public.
Fund securities and other assets that cannot be priced according to the methods described above are valued based on pricing methodologies approved by the Board. In the event that significant unobservable inputs are used when determining such valuations, the securities will be classified as Level 3 in the fair value hierarchy.
When determining the fair value of securities, some of the factors influencing the valuation include: the nature of any restrictions on disposition of the securities; assessment of the general liquidity of the securities; the issuer’s financial condition and the markets in which it does business; the cost of the investment; the size of the holding and the capitalization of the issuer; the prices of any recent transactions or bids/offers for such securities or any comparable securities; any available analyst media or other reports or information deemed reliable by the investment adviser regarding the issuer or the markets or industry in which it operates. Using fair value to price securities may result in a value that is different from a security’s most recent closing price and from the price used by other mutual funds to calculate their net asset values.
Foreign Currency Translation: The books and records of the Fund are maintained in U.S. dollars. Foreign currency amounts are translated into U.S. dollars on the following basis:
(i) market value of investment securities, other assets and liabilities—at the current rates of exchange.
(ii) purchases and sales of investment securities, income and expenses—at the rates of exchange prevailing on the respective dates of such transactions.
Although the net assets of the Fund are presented at the foreign exchange rates and market values at the close of the period, the Fund does not isolate that portion of the results of operations arising as a result of changes in the foreign exchange rates from the fluctuations arising from changes in the market prices of long-term portfolio securities held at the end of the period. Similarly, the Fund does not isolate the effect of changes in foreign exchange rates from the fluctuations arising from changes in the market prices of long-term portfolio securities sold during the period. Accordingly, realized foreign currency gains or losses are included in the reported net realized gains or losses on investment transactions.
Net realized gains or losses on foreign currency transactions represent net foreign exchange gains or losses from sales and maturities of short-term securities and forward currency contracts, disposition of foreign currencies, currency gains or losses realized between the trade and settlement dates on security transactions, and the difference between the amounts of dividends, interest and foreign withholding taxes recorded on the Fund’s books and the U.S. dollar equivalent amounts actually received or paid. Net unrealized currency gains or losses from valuing foreign currency denominated assets and liabilities (other than investments) at period end exchange rates are reflected as a component of net unrealized appreciation (depreciation) on foreign currencies.
Securities Lending: The Fund may lend its portfolio securities to banks and broker-dealers. The loans are secured by collateral at least equal to the market value of the securities loaned. Collateral pledged by each borrower is invested in a highly liquid short-term money market fund and is marked to market daily, based on the previous day’s market value, such that the value of the collateral exceeds the value of the loaned securities. Loans are subject to termination at the option of the borrower or the Fund. Upon termination of the loan, the borrower will return to the Fund securities identical to the loaned securities. Should the borrower of the securities fail financially, the Fund has the right to repurchase the securities using the collateral in the open market. The Fund recognizes income, net of any rebate and securities lending agent fees, for lending its securities, and any interest on the investment of cash received as collateral. The Fund also continues to receive interest and dividends or amounts equivalent thereto, on the securities loaned and recognizes any unrealized gain or loss in the market price of the securities loaned that may occur during the term of the loan.
Securities Transactions and Net Investment Income: Securities transactions are recorded on the trade date. Realized gains or losses from investment and currency transactions are calculated on the identified cost basis. Dividend income is recorded on the ex-dividend date. Interest income, including amortization of premium and accretion of discount on debt securities, as required, is recorded on an accrual basis. Expenses are recorded on an accrual basis, which may require the use of certain estimates by management that may differ from actual.
Net investment income or loss (other than distribution fees which are charged directly to the respective class and transfer agency fees specific to Class Q shares which are charged to that share class) and unrealized and realized gains or losses are allocated daily to each class of shares based upon the relative proportion of adjusted net assets of each class at the beginning of the day.
| | | | |
| Prudential Mid-Cap Value Fund | | | 31 | |
Notes to Financial Statements
continued
Dividends and Distributions to Shareholders: Dividends and distributions to shareholders are recorded on the ex-dividend date. Dividends, if any, from net investment income are declared and paid at least annually. These dividends and distributions are determined in accordance with federal income tax regulations and may differ from accounting principles generally accepted in the United States of America. Net realized gains from investment transactions, if any, are distributed at least annually. Permanent book/tax differences relating to income and gains are reclassified to paid-in capital when they arise.
Taxes: For federal income tax purposes, each Fund in the Company is treated as a separate tax paying entity. It is the Fund’s policy to continue to meet the requirements of the Internal Revenue Code applicable to regulated investment companies and to distribute all of its taxable net income and capital gains, if any, to shareholders. Therefore, no federal tax provision is required. Withholding taxes on foreign dividends are recorded net of reclaimable amounts, at the time the related income is earned.
Estimates: The preparation of the financial statements requires management to make estimates and assumptions that affect the reported amounts and disclosures in the financial statements. Actual results could differ from those estimates.
3. Agreements
The Fund has entered into an investment management agreement with PI which provides that the Manager will furnish the Fund with investment advice and investment management and administrative services. The Manager has entered into a subadvisory agreement with Quantitative Management Associates LLC (“QMA”), a wholly-owned subsidiary of Prudential Investment Management, Inc. The subadvisory agreement provides that QMA furnishes investment advisory services in connection with the management of the Fund. PI pays for the services of QMA, the cost of compensation of officers of the Fund, occupancy and certain clerical and bookkeeping costs of the Fund. The Fund bears all other costs and expenses.
Effective as of July 1, 2014, the advisory fee paid to PI is accrued daily and payable monthly at an annual rate of .825% of the average daily net assets of the Fund up to $1 billion and .80% of the average daily net assets in excess of $1 billion.
Through June 30, 2014, the advisory fee paid to PI was accrued daily and payable monthly at an annual rate of .90% of the average daily net assets of the Fund up to
$500 million, .85% of the next $500 million and .80% of the average daily net assets in excess of $1 billion. The effective management fee rate was .73% for the year ended October 31, 2014.
Certain officers and directors of the Fund are officers or directors of the Manager. The Fund pays no compensation directly to their officers or interested directors.
Prudential Investment Management Services LLC (“PIMS”) and Prudential Annuities Distributors, Inc. (“PAD”), both affiliates of the Manager and an indirect, wholly owned subsidiary of Prudential Financial, Inc. (“Prudential”), serve as the distributors of the Fund. The Company has adopted a separate Distribution and Service plan (each a “Plan” and collectively the “Plans”) for Class A, B, C, and X shares of each Fund in accordance with the requirements of Rule 12b-1 of the 1940 Act. No distribution or service fees are paid to PIMS as distributor for Class Q or Class Z shares.
Under the Plans, the Fund compensates PIMS and PAD distribution and service fees at an annual rate up to .30%, 1.00%, 1.00%, and 1.00% of the average daily net assets of the Class A, B, C, and X shares, respectively. Through February 29, 2016, PIMS has contractually agreed to limit such fees to .25% of the average daily net assets of Class A shares.
Management has received the maximum allowable amount of sales charges for Class X in accordance with regulatory limits. As such, any contingent deferred sales charges received by the Manager are contributed back into the Fund and included in the Statement of Changes in Net Assets and Financial Highlights as a contribution to capital.
Effective as of July 1, 2014, PI has agreed to reimburse Fund expenses and/or waive its investment management fee so that the Fund’s annual operating expenses do not exceed 0.80% (exclusive of 12b-1 fees, transfer agent fees and certain other expenses) of the Fund’s average net assets through February 29, 2016. Through June 30, 2014, PI had agreed to reimburse Fund expenses and/or waive its investment management fee so that the Fund’s annual operating expenses would not exceed 0.98% (exclusive of 12b-1 fees and certain other expenses) of the Fund’s average net assets.
During the year ended October 31, 2014, PIMS has advised the Fund, front-end sales charges (“FESC”) and contingent deferred sales charges (“CDSC”) were as follows:
| | | | | | |
Class A
FESC | | Class A
CDSC | | Class B
CDSC | | Class C
CDSC |
| $350,825 | | $1,586 | | $7,162 | | $4,316 |
| | | | |
| Prudential Mid-Cap Value Fund | | | 33 | |
Notes to Financial Statements
continued
4. Other Transactions with Affiliates
Prudential Mutual Fund Services LLC (“PMFS”), an affiliate of PI and an indirect, wholly-owned subsidiary of Prudential, serves as the Fund’s transfer agent. Transfer agent fees and expenses shown in the Statements of Operations include certain out-of pocket expenses paid to non-affiliates, where applicable.
The Fund invests in the Prudential Core Taxable Money Market Fund (the “Core Fund”), a portfolio of Prudential Investment Portfolios 2, registered under the 1940 Act, and managed by PI. Earnings from the Core Fund are disclosed on the Statement of Operations as affiliated dividend income.
Prudential Investment Management, Inc. (“PIM”), an indirect, wholly-owned subsidiary of Prudential, served as the Fund’s securities lending agent. For the year ended October 31, 2014, PIM has been compensated $7,676 for these services.
5. Shares of Capital Stock
The Fund offers Class A, Class B, Class C, Class Q, Class X and Class Z shares. Class A shares are sold with a front-end sales charge of up to 5.50%. Purchases of $1 million or more are subject to a contingent deferred sales charge (“CDSC”) if shares are redeemed within 12 months of their purchase. Class B shares are sold with a CDSC which declines from 5% to zero depending upon the period of time the shares are held. Class B shares will automatically convert to Class A shares approximately seven years after purchase. Class C shares are sold with a CDSC of 1% on shares redeemed within the first 12 months of purchase. As of April 11, 2014, the last conversion of Class X to Class A shares was completed. There are no Class X shares outstanding and Class X shares are no longer being offered for sale. Class Q and Class Z shares are not subject to any sales or redemption charge and are offered exclusively for sale to a limited group of investors.
Under certain circumstances, an exchange may be made from specified share classes of the Fund to one or more other share classes of the Fund as presented in the table of transactions in shares of capital.
The authorized capital stock of the Company is 5.5 billion shares, with a par value of $.001 per share. Of the Company’s authorized capital stock, 175 million authorized shares have been allocated to the Fund and divided into seven classes, designated
Class A, Class B, Class C, Class M, Class Q, Class X and Class Z capital stock, each of which consists of 52 million, 10 million, 30 million, 2 million, 40 million, 1 million and 40 million authorized shares, respectively.
Transactions in shares of capital stock were as follows:
| | | | | | | | |
Class A | | Shares | | | Amount | |
Year ended October 31, 2014: | | | | | | | | |
Shares sold | | | 5,515,084 | | | $ | 113,996,684 | |
Shares issued in reinvestment of dividends and distributions | | | 620,148 | | | | 11,646,379 | |
Shares reacquired | | | (1,451,043 | ) | | | (29,587,168 | ) |
| | | | | | | | |
Net increase (decrease) in shares outstanding before conversion | | | 4,684,189 | | | | 96,055,895 | |
Shares issued upon conversion from Class B, Class X and Class Z | | | 53,397 | | | | 1,057,019 | |
Shares reacquired upon conversion into Class Z | | | (455,399 | ) | | | (9,365,859 | ) |
| | | | | | | | |
Net increase (decrease) in shares outstanding | | | 4,282,187 | | | $ | 87,747,055 | |
| | | | | | | | |
Year ended October 31, 2013: | | | | | | | | |
Shares sold | | | 1,557,559 | | | $ | 29,373,540 | |
Shares issued in reinvestment of dividends and distributions | | | 66,535 | | | | 1,028,123 | |
Shares reacquired | | | (1,000,984 | ) | | | (17,650,681 | ) |
| | | | | | | | |
Net increase (decrease) in shares outstanding before conversion | | | 623,110 | | | | 12,750,982 | |
Shares issued upon conversion from Class B, Class L, Class M and Class X | | | 78,173 | | | | 1,388,735 | |
Shares reacquired upon conversion into Class Z | | | (19,274 | ) | | | (322,973 | ) |
| | | | | | | | |
Net increase (decrease) in shares outstanding | | | 682,009 | | | $ | 13,816,744 | |
| | | | | | | | |
Class B | | | | | | |
Year ended October 31, 2014: | | | | | | | | |
Shares sold | | | 173,537 | | | $ | 3,078,776 | |
Shares issued in reinvestment of dividends and distributions | | | 33,067 | | | | 555,865 | |
Shares reacquired | | | (49,840 | ) | | | (894,286 | ) |
| | | | | | | | |
Net increase (decrease) in shares outstanding before conversion | | | 156,764 | | | | 2,740,355 | |
Shares reacquired upon conversion into Class A | | | (34,597 | ) | | | (615,176 | ) |
| | | | | | | | |
Net increase (decrease) in shares outstanding | | | 122,167 | | | $ | 2,125,179 | |
| | | | | | | | |
Year ended October 31, 2013: | | | | | | | | |
Shares sold | | | 181,530 | | | $ | 3,104,412 | |
Shares issued in reinvestment of dividends and distributions | | | 1,318 | | | | 18,441 | |
Shares reacquired | | | (32,715 | ) | | | (534,735 | ) |
| | | | | | | | |
Net increase (decrease) in shares outstanding before conversion | | | 150,133 | | | | 2,588,118 | |
Shares reacquired upon conversion into Class A | | | (37,049 | ) | | | (601,073 | ) |
| | | | | | | | |
Net increase (decrease) in shares outstanding | | | 113,084 | | | $ | 1,987,045 | |
| | | | | | | | |
| | | | |
| Prudential Mid-Cap Value Fund | | | 35 | |
Notes to Financial Statements
continued
| | | | | | | | |
Class C | | Shares | | | Amount | |
Year ended October 31, 2014: | | | | | | | | |
Shares sold | | | 684,333 | | | $ | 12,402,531 | |
Shares issued in reinvestment of dividends and distributions | | | 218,057 | | | | 3,652,459 | |
Shares reacquired | | | (283,068 | ) | | | (5,114,033 | ) |
| | | | | | | | |
Net increase (decrease) in shares outstanding before conversion | | | 619,322 | | | | 10,940,957 | |
Shares reacquired upon conversion into Class Z | | | (11,602 | ) | | | (213,666 | ) |
| | | | | | | | |
Net increase (decrease) in shares outstanding | | | 607,720 | | | $ | 10,727,291 | |
| | | | | | | | |
Year ended October 31, 2013: | | | | | | | | |
Shares sold | | | 406,193 | | | $ | 6,892,724 | |
Shares issued in reinvestment of dividends and distributions | | | 14,905 | | | | 207,893 | |
Shares reacquired | | | (262,382 | ) | | | (4,185,833 | ) |
| | | | | | | | |
Net increase (decrease) in shares outstanding before conversion | | | 158,716 | | | | 2,914,784 | |
Shares reacquired upon conversion into Class Z | | | (12,752 | ) | | | (196,712 | ) |
| | | | | | | | |
Net increase (decrease) in shares outstanding | | | 145,964 | | | $ | 2,718,072 | |
| | | | | | | | |
Class Q | | | | | | |
Year ended October 31, 2014: | | | | | | | | |
Shares sold | | | 441,913 | | | $ | 9,327,598 | |
Shares issued in reinvestment of dividends and distributions | | | 112,474 | | | | 2,124,636 | |
Shares reacquired | | | (120,583 | ) | | | (2,481,797 | ) |
| | | | | | | | |
Net increase (decrease) in shares outstanding | | | 433,804 | | | $ | 8,970,437 | |
| | | | | | | | |
Year ended October 31, 2013: | | | | | | | | |
Shares sold | | | 705,264 | | | $ | 13,987,357 | |
Shares issued in reinvestment of dividends and distributions | | | 6,669 | | | | 103,556 | |
Shares reacquired | | | (78,842 | ) | | | (1,397,487 | ) |
| | | | | | | | |
Net increase (decrease) in shares outstanding | | | 633,091 | | | $ | 12,693,426 | |
| | | | | | | | |
| | | | | | | | |
Class X | | Shares | | | Amount | |
Period ended April 11, 2014:* | | | | | | | | |
Shares sold | | | 207 | | | $ | 3,657 | |
Shares issued in reinvestment of dividends and distributions | | | 1,414 | | | | 24,118 | |
Shares reacquired | | | (524 | ) | | | (9,619 | ) |
| | | | | | | | |
Net increase (decrease) in shares outstanding before conversion | | | 1,097 | | | | 18,156 | |
Shares reacquired upon conversion into Class A | | | (16,541 | ) | | | (294,328 | ) |
| | | | | | | | |
Net increase (decrease) in shares outstanding | | | (15,444 | ) | | $ | (276,172 | ) |
| | | | | | | | |
Year ended October 31, 2013: | | | | | | | | |
Shares sold | | | 917 | | | $ | 14,023 | |
Shares issued in reinvestment of dividends and distributions | | | 926 | | | | 13,124 | |
Shares reacquired | | | (6,662 | ) | | | (104,737 | ) |
| | | | | | | | |
Net increase (decrease) in shares outstanding before conversion | | | (4,819 | ) | | | (77,590 | ) |
Shares reacquired upon conversion into Class A | | | (48,390 | ) | | | (781,133 | ) |
| | | | | | | | |
Net increase (decrease) in shares outstanding | | | (53,209 | ) | | $ | (858,723 | ) |
| | | | | | | | |
Class Z | | | | | | |
Year ended October 31, 2014: | | | | | | | | |
Shares sold | | | 7,197,377 | | | $ | 148,773,781 | |
Shares issued in reinvestment of dividends and distributions | | | 146,738 | | | | 2,774,825 | |
Shares reacquired | | | (1,121,307 | ) | | | (23,269,253 | ) |
| | | | | | | | |
Net increase (decrease) in shares outstanding before conversion | | | 6,222,808 | | | | 128,279,353 | |
Shares issued upon conversion from Class A and Class C | | | 461,944 | | | | 9,579,525 | |
Shares reacquired upon conversion into Class A | | | (7,395 | ) | | | (147,515 | ) |
| | | | | | | | |
Net increase (decrease) in shares outstanding | | | 6,677,357 | | | $ | 137,711,363 | |
| | | | | | | | |
Year ended October 31, 2013: | | | | | | | | |
Shares sold | | | 1,009,334 | | | $ | 19,304,473 | |
Shares issued in reinvestment of dividends and distributions | | | 5,721 | | | | 88,986 | |
Shares reacquired | | | (135,526 | ) | | | (2,477,655 | ) |
| | | | | | | | |
Net increase (decrease) in shares outstanding before conversion | | | 879,529 | | | | 16,915,804 | |
Shares issued upon conversion from Class A and Class C | | | 30,559 | | | | 519,685 | |
Shares reacquired upon conversion into Class A | | | (327 | ) | | | (6,529 | ) |
| | | | | | | | |
Net increase (decrease) in shares outstanding | | | 909,761 | | | $ | 17,428,960 | |
| | | | | | | | |
| * | As of April 11, 2014, the last conversion of Class X shares to Class A shares was completed. There are no Class X shares outstanding and Class X shares are no longer being offered for sale. |
| | | | |
| Prudential Mid-Cap Value Fund | | | 37 | |
Notes to Financial Statements
continued
6. Tax Information
Distributions to shareholders, which are determined in accordance with federal income tax regulations and which may differ from generally accepted accounting principles, are recorded on the ex-dividend date. In order to present undistributed net investment income, accumulated net realized gain on investment transactions and paid-in capital in excess of par on the Statement of Assets and Liabilities that more closely represent their tax character, certain adjustments have been made to undistributed net investment income and accumulated net realized gain on investment transactions. For the year ended October 31, 2014, the adjustments were to decrease undistributed net investment income and increase accumulated net realized gain on investment transactions by $22,860 due to differences in the treatment for book and tax purposes of certain transactions involving partnership investments. Net investment income, net realized gain on investment transactions and net assets were not affected by this change.
For the year ended October 31, 2014, the tax character of dividends paid by the Fund were $5,845,922 of ordinary income and $16,075,737 of long-term capital gains. For the year ended October 31, 2013, the tax character of dividends paid by the Fund was $1,512,364 of ordinary income.
As of October 31, 2014, the accumulated undistributed earnings on a tax basis was $14,306,165 of ordinary income and $15,077,313 of long-term capital gains. This differs from the amount shown on the Statement of Assets and Liabilities primarily due to cumulative timing differences between financial and tax reporting.
The United States federal income tax basis of the Fund’s investments and the net unrealized appreciation as of October 31, 2014 were as follows:
| | | | | | |
Tax Basis | | Appreciation | | Depreciation | | Net
Unrealized
Appreciation |
| $455,678,073 | | $58,082,877 | | $(6,711,659) | | $51,371,218 |
The difference between book basis and tax basis was primarily attributable to deferred losses on wash sales and investments in partnerships.
Management has analyzed the Fund’s tax positions taken on federal income tax returns for all open tax years and has concluded that no provision for income tax is required in the Fund’s financial statements for the current reporting period. The Fund’s federal and state income and federal excise tax returns for tax years for which the applicable statutes of limitations have not expired are subject to examination by the Internal Revenue Service and state departments of revenue.
7. Portfolio Securities
Purchases and sales of securities, other than short term obligations, during the year ended October 31, 2014, were $502,941,981 and $274,194,493, respectively.
8. Borrowings
The Fund, along with other affiliated registered investment companies (the “Funds”), is a party to a Syndicated Credit Agreement (“SCA”) with a group of banks. The purpose of the SCA is to provide an alternative source of temporary funding for capital share redemptions. The SCA provides for a commitment of $900 million for the period October 9, 2014 through October 8, 2015. The Funds pay an annualized commitment fee of .075% of the unused portion of the SCA. Prior to October 9, 2014, the Funds had another SCA that provided a commitment of $900 million and the Funds paid an annualized commitment fee of .08% of the unused portion of the SCA. Interest on any borrowings under the SCA is paid at contracted market rates. The commitment fee for the unused amount is accrued daily and paid quarterly.
The Fund did not utilize the SCA during the year ended October 31, 2014.
9. Dividends and Distributions to Shareholders
Subsequent to the fiscal year end, the Fund declared ordinary income dividends and capital gains distributions on December 12, 2014 to shareholders of record on December 15, 2014. The ex-dividend date was December 16, 2014. The per share amounts declared were as follows:
| | | | | | |
| | | Ordinary
Income | | Short-Term
Capital Gains | | Long-Term
Capital Gains |
| Class A | | $0.12322 | | $0.52784 | | $0.62815 |
| Class B | | — | | $0.52784 | | $0.62815 |
| Class C | | — | | $0.52784 | | $0.62815 |
| Class Q | | $0.20452 | | $0.52784 | | $0.62815 |
| Class Z | | $0.17491 | | $0.52784 | | $0.62815 |
| | | | |
| Prudential Mid-Cap Value Fund | | | 39 | |
Financial Highlights
| | | | | | | | | | | | | | | | | | | | |
| Class A Shares | |
| | | Year Ended October 31, | |
| | | 2014 | | | 2013 | | | 2012 | | | 2011 | | | 2010 | |
| Per Share Operating Performance(b): | | | | | | | | | | | | | | | | | | | | |
| Net Asset Value, Beginning of Year | | | $20.51 | | | | $15.25 | | | | $13.83 | | | | $13.12 | | | | $10.65 | |
| Income (loss) from investment operations: | | | | | | | | | | | | | | | | | | | | |
| Net investment income | | | .17 | | | | .23 | | | | .17 | | | | .09 | | | | .08 | |
| Net realized and unrealized gain on investments | | | 2.92 | | | | 5.24 | | | | 1.36 | | | | .68 | | | | 2.48 | |
| Total from investment operations | | | 3.09 | | | | 5.47 | | | | 1.53 | | | | .77 | | | | 2.56 | |
| Less Dividends and Distributions: | | | | | | | | | | | | | | | | | | | | |
| Dividends from net investment income | | | (.15 | ) | | | (.21 | ) | | | (.11 | ) | | | (.06 | ) | | | (.09 | ) |
| Distributions from net realized gains | | | (1.88 | ) | | | - | | | | - | | | | - | | | | - | |
| Total dividends and distributions | | | (2.03 | ) | | | (.21 | ) | | | (.11 | ) | | | (.06 | ) | | | (.09 | ) |
| Capital Contributions(d) | | | - | | | | - | | | | - | | | | - | | | | - | * |
| Net asset value, end of year | | | $21.57 | | | | $20.51 | | | | $15.25 | | | | $13.83 | | | | $13.12 | |
| Total Return(a) | | | 16.54% | | | | 36.32% | | | | 11.16% | | | | 5.90% | | | | 24.14% | |
| |
| Ratios/Supplemental Data: | | | | | | | | | | | | | | | |
| Net assets, end of year (in millions) | | | $219.0 | | | | $120.4 | | | | $79.1 | | | | $68.1 | | | | $73.6 | |
| Average net assets (in millions) | | | $159.1 | | | | $94.2 | | | | $70.4 | | | | $73.4 | | | | $69.8 | |
| Ratios to average net assets(c): | | | | | | | | | | | | | | | | | | | | |
| Expenses After Waivers and/or Expense Reimbursement | | | 1.22% | | | | 1.40% | | | | 1.67% | | | | 1.63% | | | | 1.61% | |
| Expenses Before Waivers and/or Expense Reimbursement | | | 1.42% | | | | 1.52% | | | | 1.67% | | | | 1.63% | | | | 1.61% | |
| Net investment income | | | .81% | | | | 1.27% | | | | 1.16% | | | | .63% | | | | .65% | |
| Portfolio turnover rate | | | 87% | | | | 83% | | | | 25% | | | | 37% | | | | 26% | |
(a) Total return does not consider the effects of sales load. Total return is calculated assuming a purchase of a share on the first day and a sale on the last day of each year reported and includes reinvestment of dividends and distributions. Total returns may reflect adjustments to conform with generally accepted accounting principles.
(b) Calculated based on average shares outstanding during the year.
(c) Does not include expenses of the underlying portfolio in which the Fund invests.
(d) The Fund received payments related to a former affiliates and to an unaffiliated-third party’s settlement of regulatory proceedings involving allegations of improper trading in Fund shares during the fiscal year ended October 31, 2010. The fund was not involved in the proceedings or in the calculation of the amount of the settlement.
* Less than $0.005.
See Notes to Financial Statements.
| | | | | | | | | | | | | | | | | | | | |
| Class B Shares | | | |
| | | Year Ended October 31, | |
| | | 2014 | | | 2013 | | | 2012 | | | 2011 | | | 2010 | |
| Per Share Operating Performance(b): | | | | | | | | | | | | | | | | | | | | |
| Net Asset Value, Beginning of Year | | | $18.46 | | | | $13.76 | | | | $12.48 | | | | $11.87 | | | | $9.66 | |
| Income (loss) from investment operations: | | | | | | | | | | | | | | | | | | | | |
| Net investment income (loss) | | | .02 | | | | .08 | | | | .05 | | | | (.02 | ) | | | (.01 | ) |
| Net realized and unrealized gain on investments | | | 2.61 | | | | 4.74 | | | | 1.25 | | | | .63 | | | | 2.25 | |
| Total from investment operations | | | 2.63 | | | | 4.82 | | | | 1.30 | | | | .61 | | | | 2.24 | |
| Less Dividends and Distributions: | | | | | | | | | | | | | | | | | | | | |
| Dividends from net investment income | | | (.04 | ) | | | (.12 | ) | | | (.02 | ) | | | - | | | | (.03 | ) |
| Distributions from net realized gains | | | (1.88 | ) | | | - | | | | - | | | | - | | | | - | |
| Total dividends and distributions | | | (1.92 | ) | | | (.12 | ) | | | (.02 | ) | | | - | | | | (.03 | ) |
| Capital Contributions(d) | | | - | | | | - | | | | - | | | | - | | | | - | * |
| Net asset value, end of year | | | $19.17 | | | | $18.46 | | | | $13.76 | | | | $12.48 | | | | $11.87 | |
| Total Return(a) | | | 15.66% | | | | 35.28% | | | | 10.40% | | | | 5.14% | | | | 23.20% | |
| |
| Ratios/Supplemental Data: | | | | | | | | | | | | | | | |
| Net assets, end of year (in millions) | | | $8.0 | | | | $5.4 | | | | $2.5 | | | | $3.0 | | | | $4.1 | |
| Average net assets (in millions) | | | $7.2 | | | | $3.3 | | | | $2.7 | | | | $3.9 | | | | $4.2 | |
| Ratios to average net assets(c): | | | | | | | | | | | | | | | | | | | | |
| Expenses After Waivers and/or Expense Reimbursement | | | 1.97% | | | | 2.15% | | | | 2.42% | | | | 2.38% | | | | 2.36% | |
| Expenses Before Waivers and/or Expense Reimbursement | | | 2.12% | | | | 2.28% | | | | 2.42% | | | | 2.38% | | | | 2.36% | |
| Net investment income (loss) | | | .08% | | | | .48% | | | | .40% | | | | (.12)% | | | | (.08)% | |
| Portfolio turnover rate | | | 87% | | | | 83% | | | | 25% | | | | 37% | | | | 26% | |
(a) Total return does not consider the effects of sales load. Total return is calculated assuming a purchase of a share on the first day and a sale on the last day of each year reported and includes reinvestment of dividends and distributions. Total returns may reflect adjustments to conform with generally accepted accounting principles.
(b) Calculated based on average shares outstanding during the year.
(c) Does not include expenses of the underlying portfolio in which the Fund invests.
(d) The Fund received payments related to a former affiliates and to an unaffiliated-third party’s settlement of regulatory proceedings involving allegations of improper trading in Fund shares during the fiscal year ended October 31, 2010. The fund was not involved in the proceedings or in the calculation of the amount of the settlement.
* Less than $0.005.
See Notes to Financial Statements.
| | | | |
| Prudential Mid-Cap Value Fund | | | 41 | |
Financial Highlights
continued
| | | | | | | | | | | | | | | | | | | | |
| Class C Shares | | | |
| | | Year Ended October 31, | |
| | | 2014 | | | 2013 | | | 2012 | | | 2011 | | | 2010 | |
| Per Share Operating Performance(b): | | | | | | | | | | | | | | | | | | | | |
| Net Asset Value, Beginning of Year | | | $18.40 | | | | $13.72 | | | | $12.44 | | | | $11.84 | | | | $9.63 | |
| Income (loss) from investment operations: | | | | | | | | | | | | | | | | | | | | |
| Net investment income (loss) | | | .02 | | | | .08 | | | | .05 | | | | (.02 | ) | | | (.01 | ) |
| Net realized and unrealized gain on investments | | | 2.60 | | | | 4.72 | | | | 1.25 | | | | .62 | | | | 2.25 | |
| Total from investment operations | | | 2.62 | | | | 4.80 | | | | 1.30 | | | | .60 | | | | 2.24 | |
| Less Dividends and Distributions: | | | | | | | | | | | | | | | | | | | | |
| Dividends from net investment income | | | (.04 | ) | | | (.12 | ) | | | (.02 | ) | | | - | | | | (.03 | ) |
| Distributions from net realized gains | | | (1.88 | ) | | | - | | | | - | | | | - | | | | - | |
| Total dividends and distributions | | | (1.92 | ) | | | (.12 | ) | | | (.02 | ) | | | - | | | | (.03 | ) |
| Capital Contributions(d) | | | - | | | | - | | | | - | | | | - | | | | - | * |
| Net asset value, end of year | | | $19.10 | | | | $18.40 | | | | $13.72 | | | | $12.44 | | | | $11.84 | |
| Total Return(a) | | | 15.66% | | | | 35.24% | | | | 10.43% | | | | 5.07% | | | | 23.27% | |
| |
| Ratios/Supplemental Data: | | | | | | | | | | | | | | | |
| Net assets, end of year (in millions) | | | $50.6 | | | | $37.5 | | | | $26.0 | | | | $27.3 | | | | $29.9 | |
| Average net assets (in millions) | | | $43.6 | | | | $30.6 | | | | $26.6 | | | | $30.7 | | | | $29.5 | |
| Ratios to average net assets(c): | | | | | | | | | | | | | | | | | | | | |
| Expenses After Waivers and/or Expense Reimbursement | | | 1.97% | | | | 2.15% | | | | 2.42% | | | | 2.38% | | | | 2.36% | |
| Expenses Before Waivers and/or Expense Reimbursement | | | 2.12% | | | | 2.27% | | | | 2.42% | | | | 2.38% | | | | 2.36% | |
| Net investment income (loss) | | | .08% | | | | .53% | | | | .40% | | | | (.12)% | | | | (.09)% | |
| Portfolio turnover rate | | | 87% | | | | 83% | | | | 25% | | | | 37% | | | | 26% | |
(a) Total return does not consider the effects of sales load. Total return is calculated assuming a purchase of a share on the first day and a sale on the last day of each year reported and includes reinvestment of dividends and distributions. Total returns may reflect adjustments to conform with generally accepted accounting principles.
(b) Calculated based on average shares outstanding during the year.
(c) Does not include expenses of the underlying portfolio in which the Fund invests.
(d) The Fund received payments related to a former affiliates and to an unaffiliated-third party’s settlement of regulatory proceedings involving allegations of improper trading in Fund shares during the fiscal year ended October 31, 2010. The fund was not involved in the proceedings or in the calculation of the amount of the settlement.
* Less than $0.005.
See Notes to Financial Statements.
| | | | | | | | | | | | | | | | | | |
| Class Q Shares | | | |
| | | Year Ended October 31, | | | | | January 18,
2011(d)
through
October 31, | |
| | | 2014 | | | 2013 | | | 2012 | | | | | 2011 | |
| Per Share Operating Performance(b): | | | | | | | | | | | | | | | | | | |
| Net Asset Value, Beginning of Period | | | $20.69 | | | | $15.39 | | | | $13.95 | | | | | | $14.50 | |
| Income (loss) from investment operations: | | | | | | | | | | | | | | | | | | |
| Net investment income | | | .23 | | | | .31 | | | | .24 | | | | | | .11 | |
| Net realized and unrealized gain (loss) on investments | | | 2.94 | | | | 5.28 | | | | 1.38 | | | | | | (.66 | ) |
| Total from investment operations | | | 3.17 | | | | 5.59 | | | | 1.62 | | | | | | (.55 | ) |
| Less Dividends and Distributions: | | | | | | | | | | | | | | | | | | |
| Dividends from net investment income | | | (.23 | ) | | | (.29 | ) | | | (.18 | ) | | | | | - | |
| Distributions from net realized gains | | | (1.88 | ) | | | - | | | | - | | | | | | - | |
| Total dividends and distributions | | | (2.11 | ) | | | (.29 | ) | | | (.18 | ) | | | | | - | |
| Capital Contributions | | | - | | | | - | | | | - | | | | | | - | |
| Net asset value, end of period | | | $21.75 | | | | $20.69 | | | | $15.39 | | | | | | $13.95 | |
| Total Return(a) | | | 16.87% | | | | 36.91% | | | | 11.80% | | | | | | (3.79)% | |
| |
| Ratios/Supplemental Data: | | | | | | | | | | | | | | |
| Net assets, end of period (in millions) | | | $31.3 | | | | $20.8 | | | | $5.7 | | | | | | $12.7 | |
| Average net assets (in millions) | | | $23.2 | | | | $7.5 | | | | $8.1 | | | | | | $13.4 | |
| Ratios to average net assets(c): | | | | | | | | | | | | | | | | | | |
| Expenses After Waivers and/or Expense Reimbursement | | | .91% | | | | .96% | | | | 1.14% | | | | | | 1.13% | (e) |
| Expenses Before Waivers and/or Expense Reimbursement | | | .97% | | | | 1.10% | | | | 1.14% | | | | | | 1.13% | (e) |
| Net investment income | | | 1.14% | | | | 1.67% | | | | 1.67% | | | | | | .99% | (e) |
| Portfolio turnover rate | | | 87% | | | | 83% | | | | 25% | | | | | | 37% | (f) |
(a) Total return is calculated assuming a purchase of a share on the first day and a sale on the last day of each period reported and includes reinvestment of dividends and distributions. Total returns may reflect adjustments to conform with generally accepted accounting principles. Total returns for periods less than one full year are not annualized.
(b) Calculated based on average shares outstanding during the period.
(c) Does not include expenses of the underlying portfolio in which the Fund invests.
(d) Commencement of operations.
(e) Annualized.
(f) Not annualized.
See Notes to Financial Statements.
| | | | |
| Prudential Mid-Cap Value Fund | | | 43 | |
Financial Highlights
continued
| | | | | | | | | | | | | | | | | | | | | | | | | | |
| Class X Shares | | | | | | |
| | | Period
Ended
April 11, | | | | | Year Ended October 31, | |
| | | 2014(h) | | | | | 2013 | | | 2012 | | | 2011 | | | 2010 | | | 2009 | |
| Per Share Operating Performance(b): | | | | | | | | | | | | | | | | | | | | | | | | | | |
| Net Asset Value, Beginning of Period | | | $18.81 | | | | | | $14.01 | | | | $12.70 | | | | $12.05 | | | | $9.79 | | | | $8.37 | |
| Income (loss) from investment operations: | | | | | | | | | | | | | | | | | | | | | | | | | | |
| Net investment income | | | .09 | | | | | | .23 | | | | .15 | | | | .09 | | | | .08 | | | | .10 | |
| Net realized and unrealized gain on investments | | | .95 | | | | | | 4.78 | | | | 1.27 | | | | .62 | | | | 2.26 | | | | 1.52 | |
| Total from investment operations | | | 1.04 | | | | | | 5.01 | | | | 1.42 | | | | .71 | | | | 2.34 | | | | 1.62 | |
| Less Dividends and Distributions: | | | | | | | | | | | | | | | | | | | | | | | | | | |
| Dividends from net investment income | | | (.15 | ) | | | | | (.21 | ) | | | (.11 | ) | | | (.06 | ) | | | (.09 | ) | | | (.21 | ) |
| Distributions from net realized gains | | | (1.88 | ) | | | | | - | | | | - | | | | - | | | | - | | | | - | |
| Total dividends and distributions | | | (2.03 | ) | | | | | (.21 | ) | | | (.11 | ) | | | (.06 | ) | | | (.09 | ) | | | (.21 | ) |
| Capital Contributions(c)(e) | | | - | | | | | | - | | | | - | * | | | - | * | | | .01 | | | | .01 | |
| Net asset value, end of period | | | $17.82 | | | | | | $18.81 | | | | $14.01 | | | | $12.70 | | | | $12.05 | | | | $9.79 | |
| Total Return(a) | | | 6.02% | | | | | | 36.26% | | | | 11.28% | | | | 5.93% | | | | 24.15% | | | | 20.15% | |
| |
| Ratios/Supplemental Data: | | | | | | | | | | | | | | | | | | | | |
| Net assets, end of period (in millions) | | | $- | | | | | | $0.3 | | | | $1.0 | | | | $1.9 | | | | $4.1 | | | | $5.3 | |
| Average net assets (in millions) | | | $0.1 | | | | | | $0.6 | | | | $1.4 | | | | $3.0 | | | | $4.7 | | | | $5.4 | |
| Ratios to average net assets(d): | | | | | | | | | | | | | | | | | | | | | | | | | | |
| Expenses After Waivers and/or Expense Reimbursement | | | 1.25% | (f) | | | | | 1.48% | | | | 1.67% | | | | 1.63% | | | | 1.61% | | | | 1.72% | |
| Expenses Before Waivers and/or Expense Reimbursement | | | 1.40% | (f) | | | | | 1.54% | | | | 1.67% | | | | 1.63% | | | | 1.61% | | | | 1.72% | |
| Net investment income | | | 1.08% | (f) | | | | | 1.48% | | | | 1.13% | | | | .65% | | | | .69% | | | | 1.24% | |
| Portfolio turnover rate | | | 46% | (g) | | | | | 83% | | | | 25% | | | | 37% | | | | 26% | | | | 38% | |
(a) Total return does not consider the effects of sales load. Total return is calculated assuming a purchase of a share on the first day and a sale on the last day of each period reported and includes reinvestment of dividends and distributions. Total returns may reflect adjustments to conform with generally accepted accounting principles. Total returns for periods less than one full year are not annualized.
(b) Calculated based on average shares outstanding during the period.
(c) Certain information has been adjusted to reflect a manager payment for sales charges incurred by shareholders in excess of regulatory limits. Total Return has not been adjusted to reflect the manager payment for sales charges in excess of regulatory limits.
| (d) | Does not include expenses of the underlying portfolio in which the Fund invests. |
(e) The Fund received payments related to a former affiliates and to an unaffiliated-third party’s settlement of regulatory proceedings involving allegations of improper trading in Fund shares during the fiscal year ended October 31, 2010. The fund was not involved in the proceedings or in the calculation of the amount of the settlement.
(f) Annualized.
(g) Not annualized.
(h) End of operations.
* Less than $0.005.
See Notes to Financial Statements.
| | | | | | | | | | | | | | | | | | | | |
| Class Z Shares | | | |
| | | Year Ended October 31, | |
| | | 2014 | | | 2013 | | | 2012 | | | 2011 | | | 2010 | |
| Per Share Operating Performance(b): | | | | | | | | | | | | | | | | | | | | |
| Net Asset Value, Beginning of Year | | | $20.68 | | | | $15.38 | | | | $13.94 | | | | $13.21 | | | | $10.72 | |
| Income (loss) from investment operations: | | | | | | | | | | | | | | | | | | | | |
| Net investment income | | | .21 | | | | .25 | | | | .20 | | | | .15 | | | | .11 | |
| Net realized and unrealized gain on investments | | | 2.95 | | | | 5.30 | | | | 1.38 | | | | .67 | | | | 2.49 | |
| Total from investment operations | | | 3.16 | | | | 5.55 | | | | 1.58 | | | | .82 | | | | 2.60 | |
| Less Dividends and Distributions: | | | | | | | | | | | | | | | | | | | | |
| Dividends from net investment income | | | (.20 | ) | | | (.25 | ) | | | (.14 | ) | | | (.09 | ) | | | (.11 | ) |
| Distributions from net realized gains | | | (1.88 | ) | | | - | | | | - | | | | - | | | | - | |
| Total dividends and distributions | | | (2.08 | ) | | | (.25 | ) | | | (.14 | ) | | | (.09 | ) | | | (.11 | ) |
| Capital Contributions(d) | | | - | | | | - | | | | - | | | | - | | | | - | * |
| Net asset value, end of year | | | $21.76 | | | | $20.68 | | | | $15.38 | | | | $13.94 | | | | $13.21 | |
| Total Return(a) | | | 16.80% | | | | 36.60% | | | | 11.51% | | | | 6.26% | | | | 24.43% | |
| |
| Ratios/Supplemental Data: | | | | | | | | | | | | | | | |
| Net assets, end of year (in millions) | | | $173.7 | | | | $27.0 | | | | $6.1 | | | | $5.0 | | | | $16.8 | |
| Average net assets (in millions) | | | $82.8 | | | | $12.3 | | | | $5.7 | | | | $7.8 | | | | $17.0 | |
| Ratios to average net assets(c): | | | | | | | | | | | | | | | | | | | | |
| Expenses After Waivers and/or Expense Reimbursement | | | .97% | | | | 1.10% | | | | 1.42% | | | | 1.38% | | | | 1.36% | |
| Expenses Before Waivers and/or Expense Reimbursement | | | 1.11% | | | | 1.26% | | | | 1.42% | | | | 1.38% | | | | 1.36% | |
| Net investment income | | | 1.02% | | | | 1.36% | | | | 1.39% | | | | 1.07% | | | | .90% | |
| Portfolio turnover rate | | | 87% | | | | 83% | | | | 25% | | | | 37% | | | | 26% | |
(a) Total return is calculated assuming a purchase of a share on the first day and a sale on the last day of each year reported and includes reinvestment of dividends and distributions. Total returns may reflect adjustments to conform with generally accepted accounting principles.
(b) Calculated based on average shares outstanding during the year.
(c) Does not include expenses of the underlying portfolio in which the Fund invests.
(d) The Fund received payments related to a former affiliates and to an unaffiliated-third party’s settlement of regulatory proceedings involving allegations of improper trading in Fund shares during the fiscal year ended October 31, 2010. The fund was not involved in the proceedings or in the calculation of the amount of the settlement.
* Less than $0.005.
See Notes to Financial Statements.
| | | | |
| Prudential Mid-Cap Value Fund | | | 45 | |
Report of Independent Registered Public
Accounting Firm
The Board of Directors and Shareholders
Prudential Investment Portfolios, Inc. 10:
We have audited the accompanying statement of assets and liabilities of Prudential Mid Cap Value Fund, a series of Prudential Investment Portfolios, Inc. 10, (hereafter referred to as the “Fund”), including the portfolio of investments, as of October 31, 2014, and the related statement of operations for the year then ended, the statements of changes in net assets for each of the years in the two-year period then ended and the financial highlights for each of the years in the five-year period then ended. These financial statements and financial highlights are the responsibility of the Fund’s management. Our responsibility is to express an opinion on these financial statements and financial highlights based on our audits.
We conducted our audits in accordance with the standards of the Public Company Accounting Oversight Board (United States). Those standards require that we plan and perform the audit to obtain reasonable assurance about whether the financial statements and financial highlights are free of material misstatement. An audit includes examining, on a test basis, evidence supporting the amounts and disclosures in the financial statements. Our procedures included confirmation of securities owned as of October 31, 2014, by correspondence with the custodian, transfer agent and brokers or by other appropriate auditing procedures when replies from brokers were not received. An audit also includes assessing the accounting principles used and significant estimates made by management, as well as evaluating the overall financial statement presentation. We believe that our audits provide a reasonable basis for our opinion.
In our opinion, the financial statements and financial highlights referred to above present fairly, in all material respects, the financial position of the Fund as of October 31, 2014, and the results of its operations for the year then ended, the changes in its net assets for each of the years in the two-year period then ended and the financial highlights for each of the years in the five-year period then ended, in conformity with U.S. generally accepted accounting principles.

New York, New York
December 16, 2014
Tax Information
(Unaudited)
We are advising you that during the fiscal year ended October 31, 2014, the Series reported the maximum amount allowed per share, but not less than $1.48 for Class A, B, C, Q, X, and Z shares as a capital gain distribution in accordance with Section 852(b)(3)(C) of the Internal Revenue Code.
For the year ended October 31, 2014, the Fund reports the maximum amount allowable under Section 854 of the Internal Revenue Code, but not less than, the following percentages of the ordinary income dividends paid as 1) qualified dividend income (QDI); and 2) eligible for corporate dividends received deduction (DRD):
| | | | | | | | |
| | | QDI | | | DRD | |
Prudential Mid-Cap Value Fund | | | 46.02% | | | | 45.31% | |
In January 2015, you will be advised on IRS Form 1099-DIV or substitute 1099-DIV as to the federal tax status of dividends and distributions received by you in calendar year 2014.
| | | | |
| Prudential Mid-Cap Value Fund | | | 47 | |
INFORMATION ABOUT BOARD MEMBERS AND OFFICERS
(Unaudited)
Information about Board Members and Officers of the Fund is set forth below. Board Members who are not deemed to be “interested persons” of the Fund, as defined in the 1940 Act, are referred to as “Independent Board Members.” Board Members who are deemed to be “interested persons” of the Fund are referred to as “Interested Board Members.” The Board Members are responsible for the overall supervision of the operations of the Fund and perform the various duties imposed on the directors of investment companies by the 1940 Act. The Board in turn elects the Officers, who are responsible for administering the day-to-day operations of the Fund.
| | | | |
| Independent Board Members(1) |
| | | |
Name, Address, Age Position(s) Portfolios Overseen | | Principal Occupation(s) During Past Five Years | | Other Directorships Held |
Ellen S. Alberding (56) Board Member Portfolios Overseen: 69 | | President and Board Member, The Joyce Foundation (charitable foundation) (since 2002); Vice Chair, City Colleges of Chicago (community college system) (since 2011); Trustee, Skills for America’s Future (national initiative to connect employers to community colleges) (since 2011); Trustee, National Park Foundation (charitable foundation for national park system) (since 2009); Trustee, Economic Club of Chicago (since 2009). | | None. |
Kevin J. Bannon (62) Board Member Portfolios Overseen: 70 | | Managing Director (since April 2008) and Chief Investment Officer (October 2008-November 2013) of Highmount Capital LLC (registered investment adviser); formerly Executive Vice President and Chief Investment Officer (April 1993-August 2007) of Bank of New York Company; President (May 2003-May 2007) of BNY Hamilton Family of Mutual Funds. | | Director of Urstadt Biddle Properties (equity real estate investment trust) (since September 2008). |
Linda W. Bynoe (62) Board Member Portfolios Overseen: 70 | | President and Chief Executive Officer (since March 1995) and formerly Chief Operating Officer (December 1989-February 1995) of Telemat Ltd. (management consulting); formerly Vice President (January 1985-June 1989) at Morgan Stanley & Co (broker-dealer). | | Director of Simon Property Group, Inc. (retail real estate) (May 2003-May 2012); Director of Anixter International, Inc. (communication products distributor) (since January 2006); Director of Northern Trust Corporation (financial services) (since April 2006); Trustee of Equity Residential (residential real estate) (since December 2009). |
Prudential Mid-Cap Value Fund
| | | | |
| Independent Board Members(1) |
| | | |
Name, Address, Age Position(s) Portfolios Overseen | | Principal Occupation(s) During Past Five Years | | Other Directorships Held |
Keith F. Hartstein (58) Board Member Portfolios Overseen: 70 | | Retired; Formerly President and Chief Executive Officer (2005-2012), Senior Vice President (2004-2005), Senior Vice President of Sales and Marketing (1997-2004), and various executive management positions (1990-1997), John Hancock Funds, LLC (asset management); Chairman, Investment Company Institute’s Sales Force Marketing Committee (2003-2008). | | None. |
Michael S. Hyland, CFA (69) Board Member Portfolios Overseen: 69 | | Retired (since February 2005); Formerly Senior Managing Director (July 2001-February 2005) of Bear Stearns & Co, Inc.; Global Partner, INVESCO (1999-2001); Managing Director and President of Salomon Brothers Asset Management (1989-1999). | | None. |
Douglas H. McCorkindale (75) Board Member Portfolios Overseen: 69 | | Retired; Formerly Chairman (February 2001-June 2006), Chief Executive Officer (June 2000-July 2005), President (September 1997-July 2005) and Vice Chairman (March 1984-May 2000) of Gannett Co. Inc. (publishing and media). | | Director of Lockheed Martin Corp. (aerospace and defense) (since May 2001). |
Stephen P. Munn (72) Board Member Portfolios Overseen: 70 | | Lead Director (since 2007) and formerly Chairman (1993-2007) of Carlisle Companies Incorporated (manufacturer of industrial products). | | Lead Director (since 2007) of Carlisle Companies Incorporated (manufacturer of industrial products). |
James E. Quinn (62) Board Member Portfolios Overseen: 69 | | Retired; Formerly President (2003-2012) and Director (2003-2008), and Vice Chairman and Director (1998-2003), Tiffany & Company (jewelry retailing); Director, Mutual of America Capital Management Corporation (asset management) (since 1996); Director, Hofstra University (since 2008); Vice Chairman, Museum of the City of New York (since 1994). | | Director of Deckers Outdoor Corporation (footwear manufacturer) (since 2011). |
Richard A. Redeker (71) Board Member & Independent Chair Portfolios Overseen: 70 | | Retired Mutual Fund Senior Executive (44 years); Management Consultant; Director, Mutual Fund Directors Forum (since 2014); Independent Directors Council (organization of 2,800 Independent Mutual Fund Directors)-Executive Committee, Chair of Policy Steering Committee, Governing Council. | | None. |
Visit our website at www.prudentialfunds.com
| | | | |
| Independent Board Members(1) |
| | | |
Name, Address, Age Position(s) Portfolios Overseen | | Principal Occupation(s) During Past Five Years | | Other Directorships Held |
Robin B. Smith (75) Board Member Portfolios Overseen:70 | | Chairman of the Board (since January 2003) of Publishers Clearing House (direct marketing); Member of the Board of Directors of ADLPartner (marketing) (since December 2010); formerly Chairman and Chief Executive Officer (August 1996-January 2003) of Publishers Clearing House. | | Formerly Director of BellSouth Corporation (telecommunications) (1992-2006). |
Stephen G. Stoneburn (71) Board Member Portfolios Overseen: 70 | | Chairman, (since July 2011), President and Chief Executive Officer (since June 1996) of Quadrant Media Corp. (publishing company); formerly President (June 1995-June 1996) of Argus Integrated Media, Inc.; Senior Vice President and Managing Director (January 1993-1995) of Cowles Business Media; Senior Vice President of Fairchild Publications, Inc. (1975-1989). | | None. |
| | | | |
| Interested Board Members(1) |
| | | |
Name, Address, Age Position(s) Portfolios Overseen | | Principal Occupation(s) During Past Five Years | | Other Directorships Held |
Stuart S. Parker (52) Board Member & President Portfolios Overseen: 64 | | President of Prudential Investments LLC (since January 2012); Executive Vice President of Prudential Investment Management Services LLC (since December 2012); Executive Vice President of Jennison Associates LLC and Head of Retail Distribution of Prudential Investments LLC (June 2005-December 2011). | | None. |
Scott E. Benjamin (41) Board Member & Vice President Portfolios Overseen: 70 | | Executive Vice President (since June 2009) of Prudential Investments LLC; Executive Vice President (June 2009-June 2012) and Vice President (since June 2012) of Prudential Investment Management Services LLC; Executive Vice President (since September 2009) of AST Investment Services, Inc.; Senior Vice President of Product Development and Marketing, Prudential Investments (since February 2006); Vice President of Product Development and Product Management, Prudential Investments (2003-2006). | | None. |
Prudential Mid-Cap Value Fund
| | | | |
| Interested Board Members(1) |
| | | |
Name, Address, Age Position(s) Portfolios Overseen | | Principal Occupation(s) During Past Five Years | | Other Directorships Held |
Grace C. Torres* (55) Board Member Portfolios Overseen: 65 | | Retired; Formerly Treasurer and Principal Financial and Accounting Officer of the Prudential Investments Funds, Target Funds, Advanced Series Trust, Prudential Variable Contract Accounts and The Prudential Series Fund (1998-June 2014); Assistant Treasurer (March 1999-June 2014) and Senior Vice President (September 1999-June 2014) of Prudential Investments LLC; Assistant Treasurer (May 2003-June 2014) and Vice President (June 2005-June 2014) of AST Investment Services, Inc.; Senior Vice President and Assistant Treasurer (May 2003-June 2014) of Prudential Annuities Advisory Services, Inc. | | None. |
* Note: Prior to her retirement in 2014, Ms. Torres was employed by Prudential Investments LLC. Due to her prior employment, she is considered to be an “interested person” under the 1940 Act. Ms. Torres is a non-management Interested Board Member.
(1) The year in which each individual joined the Funds’ Board is as follows:
Ellen S. Alberding, 2013; Linda W. Bynoe, 2005; Douglas H. McCorkindale, 2003, Richard A. Redeker, 2003; Robin B. Smith, 2003; Stephen G. Stoneburn, 2003; Kevin J. Bannon, 2008; Keith F. Hartstein, 2013; Michael S. Hyland, 2008; Stephen P. Munn, 2008; James E. Quinn, 2013; Stuart S. Parker, Board Member and President since 2012; Scott E. Benjamin, Board Member since 2010 and Vice President since 2009; Grace C. Torres, 2014.
| | | | |
| Fund Officers(a) |
| | | |
Name, Address and Age Position with Fund | | Principal Occupation(s) During Past Five Years | | Length of Service as Fund Officer |
Raymond A. O’Hara (59) Chief Legal Officer | | Vice President and Corporate Counsel (since July 2010) of Prudential Insurance Company of America (Prudential); Vice President (March 2011-Present) of Pruco Life Insurance Company and Pruco Life Insurance Company of New Jersey; Vice President and Corporate Counsel (March 2011-Present) of Prudential Annuities Life Assurance Corporation; Chief Legal Officer of Prudential Investments LLC (since June 2012); Chief Legal Officer of Prudential Mutual Fund Services LLC (since June 2012) and Corporate Counsel of AST Investment Services, Inc. (since June 2012); formerly Assistant Vice President and Corporate Counsel (September 2008-July 2010) of The Hartford Financial Services Group, Inc.; formerly Associate (September 1980-December 1987) and Partner (January 1988–August 2008) of Blazzard & Hasenauer, P.C. (formerly, Blazzard, Grodd & Hasenauer, P.C.). | | Since 2012 |
Visit our website at www.prudentialfunds.com
| | | | |
| Fund Officers(a) |
| | | |
Name, Address and Age Position with Fund | | Principal Occupation(s) During Past Five Years | | Length of Service as Fund Officer |
Chad A. Earnst (39) Chief Compliance Officer | | Chief Compliance Officer (September 2014-Present) of Prudential Investments LLC; Chief Compliance Officer (September 2014-Present) of the Prudential Investments Funds, Target Funds, Advanced Series Trust, The Prudential Series Fund, Prudential’s Gibraltar Fund, Inc., Prudential Global Short Duration High Yield Income Fund, Inc., Prudential Short Duration High Yield Fund, Inc. and Prudential Jennison MLP Income Fund, Inc.; formerly Assistant Director (March 2010-August 2014) of the Asset Management Unit, Division of Enforcement, US Securities & Exchange Commission; Assistant Regional Director (January 2010-August 2014), Branch Chief (June 2006–December 2009) and Senior Counsel (April 2003-May 2006) of the Miami Regional Office, Division of Enforcement, US Securities & Exchange Commission. | | Since 2014 |
Deborah A. Docs (56) Secretary | | Vice President and Corporate Counsel (since January 2001) of Prudential; Vice President (since December 1996) and Assistant Secretary (since March 1999) of Prudential Investments LLC; formerly Vice President and Assistant Secretary (May 2003-June 2005) of AST Investment Services, Inc. | | Since 2004 |
Jonathan D. Shain (56) Assistant Secretary | | Vice President and Corporate Counsel (since August 1998) of Prudential; Vice President and Assistant Secretary (since May 2001) of Prudential Investments LLC; Vice President and Assistant Secretary (since February 2001) of Prudential Mutual Fund Services LLC; formerly Vice President and Assistant Secretary (May 2003-June 2005) of AST Investment Services, Inc. | | Since 2005 |
Claudia DiGiacomo (40) Assistant Secretary | | Vice President and Corporate Counsel (since January 2005) of Prudential; Vice President and Assistant Secretary of Prudential Investments LLC (since December 2005); Associate at Sidley Austin Brown & Wood LLP (1999-2004). | | Since 2005 |
Andrew R. French (52) Assistant Secretary | | Vice President and Corporate Counsel (since February 2010) of Prudential; formerly Director and Corporate Counsel (2006-2010) of Prudential; Vice President and Assistant Secretary (since January 2007) of Prudential Investments LLC; Vice President and Assistant Secretary (since January 2007) of Prudential Mutual Fund Services LLC. | | Since 2006 |
Amanda S. Ryan (36) Assistant Secretary | | Director and Corporate Counsel (since March 2012) of Prudential; Director and Assistant Secretary (since June 2012) of Prudential Investments LLC; Associate at Ropes & Gray LLP (2008-2012). | | Since 2012 |
Theresa C. Thompson (52) Deputy Chief Compliance Officer | | Vice President, Compliance, Prudential Investments LLC (since April 2004); and Director, Compliance, Prudential Investments LLC (2001-2004). | | Since 2008 |
Prudential Mid-Cap Value Fund
| | | | |
| Fund Officers(a) |
| | | |
Name, Address and Age Position with Fund | | Principal Occupation(s) During Past Five Years | | Length of Service as Fund Officer |
Richard W. Kinville (46) Anti-Money Laundering Compliance Officer | | Vice President, Corporate Compliance, Anti-Money Laundering Unit (since January 2005) of Prudential; committee member of the American Council of Life Insurers Anti-Money Laundering and Critical Infrastructure Committee (since January 2007); formerly Investigator and Supervisor in the Special Investigations Unit for the New York Central Mutual Fire Insurance Company (August 1994-January 1999); Investigator in AXA Financial’s Internal Audit Department and Manager in AXA’s Anti-Money Laundering Office (January 1999-January 2005); first chair of the American Council of Life Insurers Anti-Money Laundering and Critical Infrastructure Committee (June 2007-December 2009). | | Since 2011 |
M. Sadiq Peshimam (50) Treasurer and Principal Financial and Accounting Officer | | Assistant Treasurer of funds in the Prudential Mutual Fund Complex (2006-2014); Vice President (since 2005) of Prudential Investments LLC. | | Since 2006 |
Peter Parrella (56) Assistant Treasurer | | Vice President (since 2007) and Director (2004-2007) within Prudential Mutual Fund Administration; formerly Tax Manager at SSB Citi Fund Management LLC (1997-2004). | | Since 2007 |
Lana Lomuti (47) Assistant Treasurer | | Vice President (since 2007) and Director (2005-2007), within Prudential Mutual Fund Administration; formerly Assistant Treasurer (December 2007-February 2014) of The Greater China Fund, Inc. | | Since 2014 |
Linda McMullin (53) Assistant Treasurer | | Vice President (since 2011) and Director (2008-2011) within Prudential Mutual Fund Administration. | | Since 2014 |
| (a) | Excludes Mr. Parker and Mr. Benjamin, interested Board Members who also serve as President and Vice President, respectively. |
Explanatory Notes to Tables:
| n | Board Members are deemed to be “Interested,” as defined in the 1940 Act, by reason of their affiliation with Prudential Investments LLC and/or an affiliate of Prudential Investments LLC. |
| n | Unless otherwise noted, the address of all Board Members and Officers is c/o Prudential Investments LLC, Gateway Center Three, 100 Mulberry Street, Newark, New Jersey 07102-4077. |
| n | There is no set term of office for Board Members or Officers. The Board Members have adopted a retirement policy, which calls for the retirement of Board Members on December 31 of the year in which they reach the age of 75. |
| n | “Other Directorships Held” includes only directorships of companies required to register or file reports with the SEC under the 1934 Act (that is, “public companies”) or other investment companies registered under the 1940 Act. |
| n | “Portfolios Overseen” includes all investment companies managed by Prudential Investments LLC. The investment companies for which Prudential Investments LLC serves as manager include the Prudential Investments Mutual Funds, The Prudential Variable Contract Accounts, Target Mutual Funds, Prudential Short Duration High Yield Fund, Inc., Prudential Global Short Duration High Yield Fund, Inc., The Prudential Series Fund, Prudential’s Gibraltar Fund, Inc. and the Advanced Series Trust. |
Visit our website at www.prudentialfunds.com
Approval of Advisory Agreements
The Fund’s Board of Directors
The Board of Directors (the “Board”) of Prudential Mid-Cap Value Fund (the “Fund”)1 consists of thirteen individuals, eleven of whom are not “interested persons” of the Fund, as defined in the Investment Company Act of 1940, as amended (the “1940 Act”) (the “Independent Directors”). The Board is responsible for the oversight of the Fund and its operations, and performs the various duties imposed on the directors of investment companies by the 1940 Act. The Independent Directors have retained independent legal counsel to assist them in connection with their duties. The Chair of the Board is an Independent Director. The Board has established three standing committees: the Audit Committee, the Nominating and Governance Committee, and the Investment Committee. Each committee is chaired by, and composed of, Independent Directors.
Annual Approval of the Fund’s Advisory Agreements
As required under the 1940 Act, the Board determines annually whether to renew the Fund’s management agreement with Prudential Investments LLC (“PI”) and the Fund’s subadvisory agreement with Quantitative Management Associates LLC (“QMA”). In considering the renewal of the agreements, the Board, including all of the Independent Directors, met on June 9-11, 2014 and approved the renewal of the agreements through July 31, 2015, after concluding that the renewal of the agreements was in the best interests of the Fund and its shareholders.2
In advance of the meetings, the Board requested and received materials relating to the agreements, and had the opportunity to ask questions and request further information in connection with its consideration. Among other things, the Board considered comparative fee information from PI and QMA. Also, the Board considered comparisons with other mutual funds in relevant Peer Universes and Peer Groups, as is further discussed below.
In approving the agreements, the Board, including the Independent Directors advised by independent legal counsel, considered the factors it deemed relevant, including the nature, quality and extent of services provided by PI and the subadviser, the performance of the Fund, the profitability of PI and its affiliates, expenses and fees, and the potential for economies of scale that may be shared with the Fund and its shareholders as the Fund’s assets grow. In their deliberations, the Directors did not identify any single factor which alone was responsible for the Board’s decision to
| 1 | Prudential Mid-Cap Value Fund is a series of Prudential Investment Portfolios, Inc. 10. |
| 2 | Grace C. Torres was elected to the Board as of December 2014, and therefore did not participate in the consideration of these approvals. |
Prudential Mid-Cap Value Fund
Approval of Advisory Agreements (continued)
approve the agreements with respect to the Fund. In connection with its deliberations, the Board considered information provided by PI throughout the year at regular Board meetings, presentations from portfolio managers and other information, as well as information furnished at or in advance of the meetings on June 9-11, 2014.
The Directors determined that the overall arrangements between the Fund and PI, which serves as the Fund’s investment manager pursuant to a management agreement, and between PI and QMA, which serves as the Fund’s subadviser pursuant to the terms of a subadvisory agreement with PI, are in the best interests of the Fund and its shareholders in light of the services performed, fees charged and such other matters as the Directors considered relevant in the exercise of their business judgment.
The material factors and conclusions that formed the basis for the Directors’ reaching their determinations to approve the continuance of the agreements are separately discussed below.
Nature, Quality and Extent of Services
The Board received and considered information regarding the nature, quality and extent of services provided to the Fund by PI and QMA. The Board considered the services provided by PI, including but not limited to the oversight of the subadviser for the Fund, as well as the provision of fund recordkeeping, compliance, and other services to the Fund. With respect to PI’s oversight of the subadviser, the Board noted that PI’s Strategic Investment Research Group (“SIRG”), which is a business unit of PI, is responsible for monitoring and reporting to PI’s senior management on the performance and operations of the subadviser. The Board also considered that PI pays the salaries of all of the officers and non-independent Directors of the Fund. The Board also considered the investment subadvisory services provided by QMA, as well as adherence to the Fund’s investment restrictions and compliance with applicable Fund policies and procedures. The Board considered PI’s evaluation of the subadviser, as well as PI’s recommendation, based on its review of the subadviser, to renew the subadvisory agreement.
The Board considered the qualifications, backgrounds and responsibilities of PI’s senior management responsible for the oversight of the Fund and QMA, and also considered the qualifications, backgrounds and responsibilities of the QMA portfolio managers who are responsible for the day-to-day management of the Fund’s portfolio. The Board was provided with information pertaining to PI’s and QMA’s organizational structure, senior management, investment operations, and other relevant information pertaining to PI and QMA. The Board also noted that it received
Visit our website at www.prudentialfunds.com
favorable compliance reports from the Fund’s Chief Compliance Officer (“CCO”) as to each of PI and QMA. The Board noted that QMA is affiliated with PI.
The Board concluded that it was satisfied with the nature, extent and quality of the investment management services provided by PI and the subadvisory services provided to the Fund by QMA, and that there was a reasonable basis on which to conclude that the Fund benefits from the services provided by PI and QMA under the management and subadvisory agreements.
Costs of Services and Profits Realized by PI
The Board was provided with information on the profitability of PI and its affiliates in serving as the Fund’s investment manager. The Board discussed with PI the methodology utilized in assembling the information regarding profitability and considered its reasonableness. The Board recognized that it is difficult to make comparisons of profitability from fund management contracts because comparative information is not generally publicly available and is affected by numerous factors, including the structure of the particular adviser, the types of funds it manages, its business mix, numerous assumptions regarding allocations and the adviser’s capital structure and cost of capital. The Board separately considered information regarding the profitability of the subadviser, an affiliate of PI. Taking these factors into account, the Board concluded that the profitability of PI and its affiliates in relation to the services rendered was not unreasonable.
Economies of Scale
In 2013, PI and the Board retained an outside business consulting firm, in order to assist the Board in its consideration of the renewal of the management and subadvisory agreements, by reviewing management fee breakpoint usage and trends in management fees across the mutual fund industry. The consulting firm’s analysis and conclusions with respect to the Funds’ management fee structures were presented to the Board and PI at the December 3-5, 2013 meeting, and were discussed extensively by the Board and PI over the following two quarters.
The Board received and discussed information concerning whether PI realizes economies of scale as the Fund’s assets grow beyond current levels. The Board noted that the management fee schedule for the Fund includes breakpoints, which have the effect of decreasing the fee rate as assets increase, but at the current level of assets, the Fund does not realize the effect of those rate reductions. The Board took note that the Fund’s fee structure would result in benefits to Fund shareholders when (and if) assets reach the levels at which the fee rate is reduced. These benefits will accrue whether or not PI is then realizing any economies of scale. The Board recognized the
Prudential Mid-Cap Value Fund
Approval of Advisory Agreements (continued)
inherent limitations of any analysis of economies of scale, stemming largely from the Board’s understanding that most of PI’s costs are not specific to individual funds, but rather are incurred across a variety of products and services.
Other Benefits to PI and QMA
The Board considered potential ancillary benefits that might be received by PI and QMA and their affiliates as a result of their relationship with the Fund. The Board concluded that potential benefits to be derived by PI included fees received by affiliates of PI for serving as the Fund’s securities lending agent, transfer agency fees received by the Fund’s transfer agent (which is affiliated with PI), and benefits to its reputation as well as other intangible benefits resulting from PI’s association with the Fund. The Board concluded that the potential benefits to be derived by QMA included its ability to use soft dollar credits, as well as the potential benefits consistent with those generally resulting from an increase in assets under management, specifically, potential access to additional research resources and benefits to its reputation. The Board concluded that the benefits derived by PI and QMA were consistent with the types of benefits generally derived by investment managers and subadvisers to mutual funds.
Performance of the Fund / Fees and Expenses
The Board considered certain additional specific factors and made related conclusions relating to the historical performance of the Fund for the one-, three- and five-year periods ended December 31, 2013.
The Board also considered the Fund’s actual management fee, as well as the Fund’s net total expense ratio, for the fiscal year ended October 31, 2013. The Board considered the management fee for the Fund as compared to the management fee charged by PI to other funds and the fee charged by other advisers to comparable mutual funds in a Peer Group. The actual management fee represents the fee rate actually paid by Fund shareholders and includes any fee waivers or reimbursements. The net total expense ratio for the Fund represents the actual expense ratio incurred by Fund shareholders.
The mutual funds included in the Peer Universe (the Lipper Mid-Cap Value Funds Performance Universe) and the Peer Group were objectively determined by Lipper Inc. (“Lipper”), an independent provider of mutual fund data. The comparisons placed the Fund in various quartiles, with the first quartile being the best 25% of the mutual funds (for performance, the best performing mutual funds and, for expenses, the lowest cost mutual funds).
Visit our website at www.prudentialfunds.com
The section below summarizes key factors considered by the Board and the Board’s conclusions regarding the Fund’s performance, fees and overall expenses. The table sets forth gross performance comparisons (which do not reflect the impact on performance of fund expenses, or any subsidies, expense caps or waivers that may be applicable) with the Peer Universe, actual management fees with the Peer Group (which reflect the impact of any subsidies or fee waivers), and net total expenses with the Peer Group, each of which were key factors considered by the Board.
| | | | | | | | |
| Performance | | 1 Year | | 3 Years | | 5 Years | | 10 Years |
| | | 1st Quartile | | 1st Quartile | | 2nd Quartile | | N/A |
| Actual Management Fees: 3rd Quartile |
| Net Total Expenses: 4th Quartile |
| | • | | The Board noted that the Fund outperformed its benchmark index over all periods. |
| | • | | The Board noted PI’s decision to implement an expense cap in May 2013, which would have resulted in a second quartile ranking for net total expenses if it had been in effect during the most recent fiscal year. |
| | • | | The Board and PI agreed to enhance the Fund’s existing expense cap of 0.98% (exclusive of 12b-1 fees and certain other fees) so that the Fund’s total operating expenses do not exceed 0.80% (exclusive of 12b-1 fees and certain other fees) through February 28, 2015. |
| | • | | The Board and PI agreed to reduce the existing contractual management fee schedule of 0.90% on assets up to $500 million, 0.85% on assets from $500 million to $1 billion and 0.80% on assets over $1 billion with the following new schedule: 0.825% on assets up to $1 billion, and 0.800% on assets over $1 billion. |
| | • | | The Board concluded that, in light of the Fund’s competitive performance, it would be in the best interests of the Fund and its shareholders to renew the agreements. |
| | • | | The Board concluded that the management fees (including subadvisory fees) and total expenses were reasonable in light of the services provided. |
* * *
After full consideration of these factors, the Board concluded that approval of the agreements was in the best interests of the Fund and its shareholders.
Prudential Mid-Cap Value Fund
| | | | |
| n MAIL | | n TELEPHONE | | n WEBSITE |
Gateway Center Three 100 Mulberry Street Newark, NJ 07102 | | (800) 225-1852 | | www.prudentialfunds.com |
|
| PROXY VOTING |
| The Board of Directors of the Fund has delegated to the Fund’s investment subadviser the responsibility for voting any proxies and maintaining proxy recordkeeping with respect to the Fund. A description of these proxy voting policies and procedures is available without charge, upon request, by calling (800) 225-1852 or by visiting the Securities and Exchange Commission’s website at www.sec.gov. Information regarding how the Fund voted proxies relating to portfolio securities during the most recent 12-month period ended June 30 is available on the Fund’s website and on the Securities and Exchange Commission’s website. |
|
| DIRECTORS |
| Ellen S. Alberding • Kevin J. Bannon • Scott E. Benjamin • Linda W. Bynoe • Keith F. Hartstein • Michael S. Hyland • Douglas H. McCorkindale • Stephen P. Munn • Stuart S. Parker • James E. Quinn • Richard A. Redeker • Robin B. Smith • Stephen G. Stoneburn • Grace C. Torres |
|
| OFFICERS |
| Stuart S. Parker, President • Scott E. Benjamin, Vice President • M. Sadiq Peshimam, Treasurer and Principal Financial and Accounting Officer • Raymond A. O’Hara, Chief Legal Officer • Deborah A. Docs, Secretary • Chad A. Earnst, Chief Compliance Officer • Theresa C. Thompson, Deputy Chief Compliance Officer • Richard W. Kinville, Anti-Money Laundering Compliance Officer • Jonathan D. Shain, Assistant Secretary • Claudia DiGiacomo, Assistant Secretary • Amanda S. Ryan, Assistant Secretary • Andrew R. French, Assistant Secretary • Peter Parrella, Assistant Treasurer • Lana Lomuti, Assistant Treasurer • Linda McMullin, Assistant Treasurer |
| | | | |
| MANAGER | | Prudential Investments LLC | | Gateway Center Three
100 Mulberry Street
Newark, NJ 07102 |
|
| INVESTMENT SUBADVISER | | Quantitative Management
Associates LLC | | Gateway Center Two
100 Mulberry Street
Newark, NJ 07102 |
|
| DISTRIBUTOR | | Prudential Investment
Management Services LLC | | Gateway Center Three
100 Mulberry Street
Newark, NJ 07102 |
|
| CUSTODIAN | | The Bank of New York Mellon | | One Wall Street
New York, NY 10286 |
|
| TRANSFER AGENT | | Prudential Mutual Fund
Services LLC | | PO Box 9658
Providence, RI 02940 |
|
| INDEPENDENT REGISTERED PUBLIC ACCOUNTING FIRM | | KPMG LLP | | 345 Park Avenue
New York, NY 10154 |
|
| FUND COUNSEL | | Willkie Farr & Gallagher LLP | | 787 Seventh Avenue
New York, NY 10019 |
|
| An investor should consider the investment objectives, risks, charges, and expenses of the Fund carefully before investing. The prospectus and summary prospectus contain this and other information about the Fund. An investor may obtain a prospectus and summary prospectus by visiting our website at www.prudentialfunds.com or by calling (800) 225-1852. The prospectus and summary prospectus should be read carefully before investing. |
|
| E-DELIVERY |
| To receive your mutual fund documents online, go to www.prudentialfunds.com/edelivery and enroll. Instead of receiving printed documents by mail, you will receive notification via email when new materials are available. You can cancel your enrollment or change your email address at any time by visiting the website address above. |
|
| SHAREHOLDER COMMUNICATIONS WITH DIRECTORS |
| Shareholders can communicate directly with the Board of Directors by writing to the Chair of the Board, Prudential Mid-Cap Value Fund, Prudential Investments, Attn: Board of Directors, 100 Mulberry Street, Gateway Center Three, Newark, NJ 07102. Shareholders can communicate directly with an individual Director by writing to the same address. Communications are not screened before being delivered to the addressee. |
|
| AVAILABILITY OF PORTFOLIO SCHEDULE |
| The Fund files its complete schedule of portfolio holdings with the Securities and Exchange Commission for the first and third quarters of each fiscal year on Form N-Q. The Fund’s Forms N-Q are available on the Commission’s website at www.sec.gov. The Fund’s Forms N-Q may also be reviewed and copied at the Commission’s Public Reference Room in Washington, D.C. Information on the operation and location of the Public Reference Room may be obtained by calling 1-800-SEC-0330. The Fund’s schedule of portfolio holdings is also available on the Fund’s website as of the end of each month. |
|
| The Fund’s Statement of Additional Information contains additional information about the Fund’s Directors and is available without charge, upon request, by calling (800) 225-1852. |
Mutual Funds:
| | | | |
ARE NOT INSURED BY THE FDIC OR ANY
FEDERAL GOVERNMENT AGENCY | | MAY LOSE VALUE | | ARE NOT A DEPOSIT OF OR GUARANTEED BY ANY BANK OR ANY BANK AFFILIATE |

PRUDENTIAL MID-CAP VALUE FUND
| | | | | | | | | | |
| SHARE CLASS | | A | | B | | C | | Q | | Z |
| NASDAQ | | SPRAX | | SVUBX | | NCBVX | | PMVQX | | SPVZX |
| CUSIP | | 74441L105 | | 74441L204 | | 74441L303 | | 74441L824 | | 74441L709 |
MF202E 0270913-00001-00
Item 2 – Code of Ethics — See Exhibit (a)
As of the end of the period covered by this report, the registrant has adopted a code of ethics (the “Section 406 Standards for Investment Companies – Ethical Standards for Principal Executive and Financial Officers”) that applies to the registrant’s Principal Executive Officer and Principal Financial Officer; the registrant’s Principal Financial Officer also serves as the Principal Accounting Officer.
The registrant hereby undertakes to provide any person, without charge, upon request, a copy of the code of ethics. To request a copy of the code of ethics, contact the registrant 800-225-1852, and ask for a copy of the Section 406 Standards for Investment Companies - Ethical Standards for Principal Executive and Financial Officers.
Item 3 – Audit Committee Financial Expert –
The registrant’s Board has determined that Mr. Stephen P. Munn, member of the Board’s Audit Committee is an “audit committee financial expert,” and that he is “independent,” for purposes of this Item.
Item 4 – Principal Accountant Fees and Services –
(a) Audit Fees
For the fiscal years ended October 31, 2014 and October 31, 2013, KPMG LLP (“KPMG”), the Registrant’s principal accountant, billed the Registrant $47,940 and $57,000, respectively, for professional services rendered for the audit of the Registrant’s annual financial statements or services that are normally provided in connection with statutory and regulatory filings.
(b) Audit-Related Fees
None.
(c) Tax Fees
None.
(d) All Other Fees
None.
(e) (1) Audit Committee Pre-Approval Policies and Procedures
THE PRUDENTIAL MUTUAL FUNDS
AUDIT COMMITTEE POLICY
on
Pre-Approval of Services Provided by the Independent Accountants
The Audit Committee of each Prudential Mutual Fund is charged with the responsibility to monitor the independence of the Fund’s independent accountants. As part of this responsibility, the Audit Committee must pre-approve any independent accounting firm’s engagement to render audit and/or permissible non-audit services, as required by law. In evaluating a proposed engagement of the independent accountants, the Audit Committee will assess the effect that the engagement might reasonably be expected to have on the accountant’s independence. The Committee’s evaluation will be based on:
| | • | | a review of the nature of the professional services expected to be provided, |
| | • | | a review of the safeguards put into place by the accounting firm to safeguard independence, and |
| | • | | periodic meetings with the accounting firm. |
Policy for Audit and Non-Audit Services Provided to the Funds
On an annual basis, the scope of audits for each Fund, audit fees and expenses, and audit-related and non-audit services (and fees proposed in respect thereof) proposed to be performed by the Fund’s independent accountants will be presented by the Treasurer and the independent accountants to the Audit Committee for review and, as appropriate, approval prior to the initiation of such services. Such presentation shall be accompanied by confirmation by both the Treasurer and the independent accountants that the proposed services will not adversely affect the independence of the independent accountants. Proposed services shall be described in sufficient detail to enable the Audit Committee to assess the appropriateness of such services and fees, and the compatibility of the provision of such services with the auditor’s independence. The Committee shall receive periodic reports on the progress of the audit and other services which are approved by the Committee or by the Committee Chair pursuant to authority delegated in this Policy.
The categories of services enumerated under “Audit Services”, “Audit-related Services”, and “Tax Services” are intended to provide guidance to the Treasurer and the independent accountants as to those categories of services which the Committee believes are generally consistent with the independence of the independent accountants and which the Committee (or the Committee Chair) would expect upon the presentation of specific proposals to pre-approve. The enumerated categories are not intended as an exclusive list of audit, audit-related or tax services, which the Committee (or the Committee Chair) would consider for pre-approval.
Audit Services
The following categories of audit services are considered to be consistent with the role of the Fund’s independent accountants:
| | Ø | Annual Fund financial statement audits |
| | Ø | Seed audits (related to new product filings, as required) |
| | Ø | SEC and regulatory filings and consents |
Audit-related Services
The following categories of audit-related services are considered to be consistent with the role of the Fund’s independent accountants:
| | Ø | Accounting consultations |
| | Ø | Fund merger support services |
| | Ø | Agreed Upon Procedure Reports |
| | Ø | Other Internal Control Reports |
Individual audit-related services that fall within one of these categories and are not presented to the Audit Committee as part of the annual pre-approval process will be subject to pre-approval by the Committee Chair (or any other Committee member on whom this responsibility has been delegated) so long as the estimated fee for those services does not exceed $50,000.
Tax Services
The following categories of tax services are considered to be consistent with the role of the Fund’s independent accountants:
| | Ø | Tax compliance services related to the filing or amendment of the following: |
| | ¡ | Federal, state and local income tax compliance; and, |
| | ¡ | Sales and use tax compliance |
| | Ø | Timely RIC qualification reviews |
| | Ø | Tax distribution analysis and planning |
| | Ø | Tax authority examination services |
| | Ø | Tax appeals support services |
| | Ø | Accounting methods studies |
| | Ø | Fund merger support services |
| | Ø | Tax consulting services and related projects |
Individual tax services that fall within one of these categories and are not presented to the Audit Committee as part of the annual pre-approval process will be subject to pre-approval by the Committee Chair (or any other Committee member on whom this responsibility has been delegated) so long as the estimated fee for those services does not exceed $50,000.
Other Non-audit Services
Certain non-audit services that the independent accountants are legally permitted to render will be subject to pre-approval by the Committee or by one or more Committee members to whom the Committee has delegated this authority and who will report to the full Committee any pre-approval decisions made pursuant to this Policy. Non-audit services presented for pre-approval pursuant to this paragraph will be accompanied by a confirmation from both the Treasurer and the independent accountants that the proposed services will not adversely affect the independence of the independent accountants.
Proscribed Services
The Fund’s independent accountants will not render services in the following categories of non-audit services:
| | Ø | Bookkeeping or other services related to the accounting records or financial statements of the Fund |
| | Ø | Financial information systems design and implementation |
| | Ø | Appraisal or valuation services, fairness opinions, or contribution-in-kind reports |
| | Ø | Internal audit outsourcing services |
| | Ø | Management functions or human resources |
| | Ø | Broker or dealer, investment adviser, or investment banking services |
| | Ø | Legal services and expert services unrelated to the audit |
| | Ø | Any other service that the Public Company Accounting Oversight Board determines, by regulation, is impermissible. |
Pre-approval of Non-Audit Services Provided to Other Entities Within the Prudential Fund Complex
Certain non-audit services provided to Prudential Investments LLC or any of its affiliates that also provide ongoing services to the Prudential Mutual Funds will be subject to pre-approval by the Audit Committee. The only non-audit services provided to these entities that will require pre-approval are those related directly to the operations and financial reporting of the Funds. Individual projects that are not presented to the Audit Committee as part of the annual pre-approval process will be subject to pre-approval by the Committee Chair (or any other Committee member on whom this responsibility has been delegated) so long as the estimated fee for those services does not exceed $50,000. Services presented for pre-approval pursuant to this paragraph will be accompanied by a confirmation from both the Treasurer and the independent accountants that the proposed services will not adversely affect the independence of the independent accountants.
Although the Audit Committee will not pre-approve all services provided to Prudential Investments LLC and its affiliates, the Committee will receive an annual report from the Fund’s independent accounting firm showing the aggregate fees for all services provided to Prudential Investments and its affiliates.
| (e) | (2) Percentage of services referred to in 4(b) – 4(d) that were approved by the audit committee – |
Not applicable.
(f) Percentage of hours expended attributable to work performed by other than full time employees of principal accountant if greater than 50%.
The percentage of hours expended on the principal accountant’s engagement to audit the registrant’s financial statements for the most recent fiscal year that were attributed to work performed by persons other than the principal accountant’s full-time, permanent employees was 0%.
(g) Non-Audit Fees
Not applicable to Registrant for the fiscal years 2014 and 2013. The aggregate non-audit fees billed by KPMG for services rendered to the registrant’s investment adviser and any entity controlling, controlled by, or under common control with the investment adviser that provides ongoing services to the registrant for the fiscal years 2014 and 2013 was $0 and $0, respectively.
(h) Principal Accountant’s Independence
Not applicable as KPMG has not provided non-audit services to the registrant’s investment adviser and any entity controlling, controlled by, or under common control with the investment adviser that provides ongoing services to the registrant that were not pre-approved pursuant to Rule 2-01(c)(7)(ii) of Regulation S-X.
| | | | |
| Item 5 | | – | | Audit Committee of Listed Registrants – Not applicable. |
| | |
| Item 6 | | – | | Schedule of Investments – The schedule is included as part of the report to shareholders filed under Item 1 of this Form. |
| | |
| Item 7 | | – | | Disclosure of Proxy Voting Policies and Procedures for Closed-End Management Investment Companies – Not applicable. |
| | |
| Item 8 | | – | | Portfolio Managers of Closed-End Management Investment Companies – Not applicable. |
| | |
| Item 9 | | – | | Purchases of Equity Securities by Closed-End Management Investment Company and Affiliated Purchasers – Not applicable. |
| | |
| Item 10 | | – | | Submission of Matters to a Vote of Security Holders – Not applicable. |
| | |
| Item 11 | | – | | Controls and Procedures |
| | (a) | It is the conclusion of the registrant’s principal executive officer and principal financial officer that the effectiveness of the registrant’s current disclosure controls and procedures (such disclosure controls and procedures having been evaluated within 90 days of the date of this filing) provide reasonable assurance that the information required to be disclosed by the registrant has been recorded, processed, summarized and reported within the time period specified in the Commission’s rules and forms and that the information required to be disclosed by the registrant has been accumulated and communicated to the registrant’s principal executive officer and principal financial officer in order to allow timely decisions regarding required disclosure. |
| | (b) | There has been no significant change in the registrant’s internal control over financial reporting that occurred during the registrant’s most recent fiscal quarter of the period covered by this report that has materially affected, or is likely to materially affect, the registrant’s internal control over financial reporting. |
| | | | |
| Item 12 | | – | | Exhibits |
| | |
| | (a) | | (1) Code of Ethics – Attached hereto as Exhibit EX-99.CODE-ETH |
| | |
| | | | (2) Certifications pursuant to Section 302 of the Sarbanes-Oxley Act – Attached hereto as Exhibit EX-99.CERT. |
| | |
| | | | (3) Any written solicitation to purchase securities under Rule 23c-1. – Not applicable. |
| | |
| | (b) | | Certifications pursuant to Section 906 of the Sarbanes-Oxley Act – Attached hereto as Exhibit
EX-99.906CERT. |
SIGNATURES
Pursuant to the requirements of the Securities Exchange Act of 1934 and the Investment Company Act of 1940, the registrant has duly caused this report to be signed on its behalf by the undersigned, thereunto duly authorized.
| | | | |
Registrant: | | Prudential Investment Portfolios, Inc. 10 | | |
| | |
By: | | /s/ Deborah A. Docs | | |
| | Deborah A. Docs | | |
| | Secretary | | |
| | |
Date: | | December 18, 2014 | | |
|
Pursuant to the requirements of the Securities Exchange Act of 1934 and the Investment Company Act of 1940, this report has been signed below by the following persons on behalf of the registrant and in the capacities and on the dates indicated. |
| | |
By: | | /s/ Stuart S. Parker | | |
| | Stuart S. Parker | | |
| | President and Principal Executive Officer | | |
| | |
Date: | | December 18, 2014 | | |
| | |
By: | | /s/ M. Sadiq Peshimam | | |
| | M. Sadiq Peshimam | | |
| | Treasurer and Principal Financial and Accounting Officer | | |
| | |
Date: | | December 18, 2014 | | |