UNITED STATES
SECURITIES AND EXCHANGE COMMISSION
WASHINGTON, D.C. 20549
Form 10-K
(Mark One)
| x | ANNUAL REPORT PURSUANT TO SECTION 13 OR 15(d) OF THE SECURITIES EXCHANGE ACT OF 1934 |
For the fiscal year ended December 31, 2006
OR
| ¨ | TRANSITION REPORT PURSUANT TO SECTION 13 or 15(d) OF THE SECURITIES EXCHANGE ACT OF 1934 |
For the transition period from to
Commission File Number: 000-22283
VIRGINIA FINANCIAL GROUP, INC.
(Exact name of registrant as specified in its charter)
| VIRGINIA | 54-1829288 | |
(State or other jurisdiction of incorporation or organization) | (I.R.S. Employer Identification No.) |
102 S. Main Street, Culpeper, Virginia 22701
(Address of principal executive offices, including zip code)
(540) 829-1633
(Registrant’s telephone number, including area code)
Securities registered pursuant to Section 12(b) of the Act:
Securities registered pursuant to section 12 (g) of the Act:
None
(Title of Class)
Indicate by check mark if the registrant is a well-known seasoned issuer, as defined in Rule 405 of the Securities Act. Yes ¨ No x
Indicate by check mark if the registrant is not required to file reports pursuant to Section 13 or Section 15(d) of the Exchange Act. Yes ¨ No x
Indicate by check mark whether the registrant (1) has filed all reports required to be filed by Section 13 or 15 (d) of the Securities Exchange Act of 1934 during the preceding 12 months (or for such shorter period that the registrant was required to file such reports), and (2) has been subject to such filing requirements for the past 90 days. Yes x No ¨
Indicate by check mark if disclosure of delinquent filers pursuant to Item 405 of Regulation S-K is not contained herein, and will not be contained, to the best of the registrant’s knowledge, in the definitive proxy or information statements incorporated by reference in Part III of this Form 10-K or any amendment to this Form 10-K.
Indicate by check mark whether the registrant is a large accelerated filer, an accelerated filer, or a non-accelerated file. See definition of “accelerated filer and large accelerated filer” in Rule 12b-2 of the Exchange Act.
Large accelerated filer ¨ Accelerated Filer x Non-accelerated filer ¨
Indicate by check mark whether the registrant is a shell company (as defined in Rule 12b-2 of the Act). ¨ Yes x No
The aggregate market value of the voting and non-voting stock held by non-affiliates of the registrant as of June 30, 2006 was $295,080,616.
There were 10,791,669 shares of common stock outstanding as of March 2, 2007.
Documents Incorporated by Reference:
Portions of Portions of the Proxy Statement for the Company’s Annual Meeting of Shareholders to be held on May 14, 2007 are incorporated by reference in Part III of this report.
VIRGINIA FINANCIAL GROUP, INC.
FORM 10-K
TABLE OF CONTENTS
| Page | ||||
| PART I | ||||
| Item 1. | Business | 1 | ||
| Item 1A. | Risk Factors | 4 | ||
| Item 1B. | Unresolved Staff Comments | 7 | ||
| Item 2. | Properties | 7 | ||
| Item 3. | Legal Proceedings | 8 | ||
| Item 4. | Submission of Matters to a Vote of Security Holders | 8 | ||
| PART II | ||||
| Item 5. | Market for Registrant’s Common Equity, Related Stockholder Matters and Issuer Purchases of Equity Securities | 10 | ||
| Item 6. | Selected Financial Data | 12 | ||
| Item 7. | Management’s Discussion and Analysis of Financial Condition and Results of Operations | 13 | ||
| Item 7A. | Quantitative and Qualitative Disclosures About Market Risk | 30 | ||
| Item 8. | Financial Statements and Supplementary Data | 32 | ||
| Item 9. | Changes in and Disagreements With Accountants on Accounting and Financial Disclosure | 77 | ||
| Item 9A. | Controls and Procedures | 77 | ||
| Item 9B. | Other Information | 79 | ||
| PART III | ||||
| Item 10. | Directors and Executive Officers of the Registrant | 79 | ||
| Item 11. | Executive Compensation | 79 | ||
| Item 12. | Security Ownership of Certain Beneficial Owners and Management and Related Stockholder Matters | 80 | ||
| Item 13. | Certain Relationships and Related Transactions | 80 | ||
| Item 14. | Principal Accountant Fees and Services | 80 | ||
| PART IV | ||||
| Item 15. | Exhibits and Financial Statement Schedules | 81 | ||
| Signatures | 83 | |||
PART I
| Item 1. | BUSINESS |
GENERAL
Virginia Financial Group, Inc. (VFG or the Company) is a bank holding company incorporated under the laws of the Commonwealth of Virginia. Currently, VFG is one of the largest independent bank holding companies headquartered in the Commonwealth of Virginia with total assets of approximately $1.6 billion. VFG’s trust affiliate, Virginia Commonwealth Trust Company, manages fee and commission based assets of approximately $597 million. Affiliates of the Company include: Planters Bank & Trust Company of Virginia—in Staunton, Second Bank & Trust—in Culpeper, Virginia Heartland Bank—in Fredericksburg, Virginia Commonwealth Trust Company—in Culpeper and VFG Limited Liability Trust. VFG, through its affiliates, also owns a 70% interest in VFG Title, LLC. VFG combined its Virginia Heartland Bank (Fredericksburg) into its Second Bank & Trust (Culpeper) affiliate on February 16, 2007. The two banks were geographically contiguous, shared increasingly similar market dynamics and offered the opportunity to create efficiencies and management depth. The organization has a network of forty branches serving a contiguous market throughout central, south central and southwest Virginia. Virginia Commonwealth Trust Corporation has offices in Culpeper, Fredericksburg, Harrisonburg and Staunton.
VFG’s affiliate banks are community-oriented and offer services customarily provided by full-service banks, including individual and commercial demand and time deposit accounts, commercial and consumer loans, residential mortgages, credit card services and deposit services. VFG’s affiliate banks offer internet banking access for banking services, and online bill payment for both consumers and commercial customers. Lending is focused on individuals and small and middle-market businesses in the local market of VFG’s affiliate banks. VFG’s trust affiliate provides a variety of wealth management and personal trust services including estate administration, employee benefit plan administration and planning specifically addressing the investment and financial management needs of its customers. Utilizing a “super-community” banking strategy, each affiliate is run autonomously, with the holding company providing common services such as corporate finance, information technology, marketing, human resources, compliance, audit and loan review.
EMPLOYEES
At December 31, 2006, VFG had 580 full time equivalent employees. No employees are represented by any collective bargaining unit. VFG considers relations with its employees to be good.
COMPETITION
VFG and its affiliates incur strong competition in each of its primary markets from large regional and national financial institutions, savings and loans, credit unions and other community banking organizations. In addition, consumer finance companies, asset managers and mortgage companies all provide competition. Out-of-state bank holding companies are providing increased competition through merger with and acquisition of Virginia banks.
VFG’s deposit market share at June 30, 2006 represented 1% of the total banking deposits in the Commonwealth of Virginia. Competition for deposits is influenced by rates paid, customer loyalty factors, product offerings and convenience of branch network.
The competition in the industry has also increased as a result of the passage of the Gramm-Leach-Bliley Act of 1999 (the “Act”), which drew new lines between the types of activities that are financial in nature and permitted for banking organizations, and those activities that are commercial in nature and not permitted. The Act imposes Community Reinvestment requirements on financial service organizations that seek to qualify for the expanded powers to engage in broader financial activities and affiliations with financial companies that are permitted.
The Act created a new form of financial organization called a financial holding company that may own banks, insurance companies and securities firms. A financial holding company is authorized to engage in any activity that is
1
financial in nature, incidental to an activity that is financial in nature, or is a complimentary activity. These activities may include insurance, securities transactions, and traditional banking related activities. The Act establishes a consultative and cooperative procedure between the Federal Reserve and the Secretary of the Treasury for purposes of determination as to the scope of activities permitted by the Act. VFG is not a financial holding company.
No material part of the business of the affiliate banks is dependent upon a single or a few customers and the loss of one or more customers would not have a materially adverse effect upon the business of the banks. Management is not aware of any indications that the business of the banks or material portion thereof is, or may be, seasonal.
REGULATION, SUPERVISION AND GOVERNMENT POLICY
Bank Holding Company
VFG is registered as a bank holding company under the Federal Bank Holding Corporation Act of 1956, as amended, and is subject to supervision and regulation by the Board of Governors of the Federal Reserve System (the “Federal Reserve Board”) and State Corporation Commission (“SCC”). As a bank holding company, VFG is required to furnish to the Federal Reserve Board an annual report of its operations at the end of each fiscal year and to furnish such additional information as the Federal Reserve Board may require pursuant to the Bank Holding Corporation Act. The Federal Reserve Board and SCC also may conduct examinations of VFG and its affiliates.
A bank holding company must satisfy special criteria to qualify for the expanded powers authorized by the Act, including the maintenance of a well-capitalized and well-managed status for all affiliate banks and a satisfactory community reinvestment rating.
Capital Requirements
The Company is subject to various regulatory capital requirements administered by the federal banking agencies. Failure to meet minimum capital requirements can initiate certain mandatory or possibly additional discretionary actions by regulators that, if undertaken, could have a direct material effect on the Company’s financial statements. Under capital adequacy guidelines and the regulatory framework for prompt corrective action, the Company must meet specific capital guidelines that involve quantitative measures of the Company’s assets, liabilities, and certain off-balance-sheet items as calculated under regulatory accounting practices. The Company’s capital amounts and classifications are also subject to qualitative judgments by the regulators about components, risk weightings, and other factors.
Quantitative measures established by regulation to ensure capital adequacy require the Company to maintain minimum amounts and ratios of total and Tier 1 capital (as defined in the regulations) to risk-weighted assets, and of Tier 1 capital to average assets. Management believes, as of December 31, 2006, that the Company and its affiliate banks meet all capital adequacy requirements to which it is subject.
As of December 31, 2006, the most recent notification from the Federal Reserve Bank of Richmond categorized the Company’s subsidiary banks as “well capitalized” under the regulatory framework for prompt corrective action under the Federal Deposit Insurance Act of 1991 (FDICIA). To be categorized as “well capitalized,” the Company must maintain minimum total risk-based, Tier 1 risk-based, and Tier 1 leverage ratios. There are no conditions or events since notification that management believes have changed the Company’s category.
Dividends
VFG is a separate operating entity from its affiliates, and thus has liquidity needs that are funded primarily from the income of its affiliates. The parent company’s cash outflows consist of dividends to shareholders and unallocated corporate expenses. The main sources of funding for the parent Company are the management fees and dividends it receives from its banking and trust affiliates. Under the current supervisory regulation, prior approval from such agencies is required if the community bank pays cash dividends that exceed certain levels as defined. During 2006, the
2
banking affiliates and the non-bank subsidiary paid $13.0 million in management fees to the Company, and $12.5 million in dividends were paid to the Company. As of January 1, 2007, the aggregate amount of additional unrestricted funds, which could be transferred from the banking affiliates to VFG without prior regulatory approval totaled $42.1 million or 27.9% of the consolidated net assets.
Sarbanes-Oxley Act of 2002
The Sarbanes-Oxley Act of 2002 (Sarbanes-Oxley), which was signed into law in July, 2002, impacts all companies with securities registered under the Securities Exchange Act of 1934, including the Company. Sarbanes-Oxley created new requirements in the areas of corporate governance and financial disclosure including, among other things, (i) increased responsibility for the Chief Executive Officers and Chief Financial Officers with respect to the content of filings with the SEC; (ii) enhanced requirements for audit committees, including independence and disclosure of expertise; (iii) enhanced requirements for auditor independence and the types of non-audit services that auditors can provide; (iv) accelerated filing requirements for SEC reports; (v) increased disclosure and reporting obligations for companies, their directors and executive officers; and (vi) new and increased civil and criminal penalties for violations of securities laws. Certifications of the Chief Executive Officer and Chief Financial Officer can be found in the “Exhibits” section of this document. Management’s “Statement of Management’s Responsibility” can be found in Item 9A of this report.
BANK REGULATION
Each of VFG’s affiliate banks are subject to supervision and regulation by the Federal Reserve Board and the SCC. The various laws and regulations administered by the regulatory agencies affect corporate practices, including business practices related to payment and charging of interest, documentation and disclosures, and affect the ability to open and close offices or purchase other affiliates.
USA Patriot Act.VFG’s affiliate banks are subject to the requirements of the USA Patriot Act, which provides for the facilitation of information sharing among governmental entities and financial institutions for the purpose of combating terrorism and money laundering. The Act places a significantly increased reporting responsibility and regulatory oversight on financial institutions to share information with the federal government concerning activities that may involve money laundering or terrorist activities. The USA Patriot Act is considered a significant banking law in terms of information disclosure regarding certain customer transactions. Certain provisions of the USA Patriot Act impose the obligation to establish anti-money laundering programs, including the development of a customer identification program, and the screening of all customers against any government lists of known or suspected terrorists. The Company is in compliance with both the requirements of the Act.
Insurance of Accounts.VFG’s affiliate banks have deposits which are insured by the Federal Deposit Insurance Corporation (FDIC), and the banks are subject to insurance premium assessments by the FDIC. The FDIC has developed a risk-based assessment system, under which the assessment rate for an insured depository institution varies according to its level of risk. An institution’s risk category is based upon whether the institution is well capitalized, adequately capitalized or undercapitalized and the institution’s “supervisory subgroups”: Subgroup A, B or C. Subgroup A institutions are financially sound institutions with a few minor weaknesses; Subgroup B institutions are institutions that demonstrate weaknesses which, if not corrected, could result in significant deterioration; and Subgroup C institutions are institutions for which there is a substantial probability that the FDIC will suffer a loss in connection with the institution unless effective action is taken to correct the areas of weakness. Based on its capital and supervisory subgroups, each DIF member institution is assigned an annual FDIC assessment rate per $100 of insured deposits varying between 0.05% per annum (for well capitalized Subgroup A institutions) and 0.43% per annum (for undercapitalized Subgroup C institutions). All of VFG’s subsidiary bank’s Subgroup for 2006 was A. Each of VFG’s affiliate banks expect to receive a one-time assessment credit to offset the cost of expected higher deposit insurance premiums for 2007.
Community Reinvestment Act.VFG’s affiliate banks are subject to the requirements of the Community Reinvestment Act of 1977 (CRA). The CRA imposes on financial institutions an affirmative and ongoing obligation to meet the needs of the local communities, including low and moderate income neighborhoods. If any of our bank affiliates receives a rating from the Federal Reserve of less than satisfactory under the CRA, restrictions on our operating activities would be imposed. Our bank’s currently meet the CRA requirements.
3
Privacy Legislation.Several new regulations issued by federal banking agencies also provide new protections against the transfer and use of customer information by financial institutions. A financial institution must provide to its customers information regarding its polices and procedures with respect to the handling of customers personal information. Each institution must conduct an internal risk assessment of its ability to protect customer information. These privacy provisions generally prohibit a financial institution from providing a customer’s personal financial information to unaffiliated parties without prior notice and approval from the customer.
Basel Committee.On February 28, 2007, the federal banking agencies released for comment the new Basel Capital Accord (“Basel II”), which proposes establishment of a new framework of capital adequacy for banking organizations; the Committee published the text of the framework on July 26, 2004. Despite the release of the Basel II framework, it is not clear at this time whether and in what manner the new accord will be adopted by bank regulators with respect to banking organizations that they supervise and regulate. Although the Committee’s stated intent is that Basel II will not change the amount of overall capital in the global banking system, adoption of the proposed new accord could require individual banking organizations, including the Company, to increase the minimum level of capital held. The Company will continue to closely monitor regulatory action on this matter and assess the potential impact to the Company.
Consumer Laws and Regulations. VFG’s affiliate banks are also subject to certain consumer laws and regulations that are designed to protect consumers in transactions with banks. While the list set forth herein is not exhaustive, these laws and regulations include the Truth in Lending Act, the Truth in Savings Act, the Electronic Funds Transfer Act, the Expedited Funds Availability Act, the Equal Credit Opportunity Act, Real Estate Settlement Procedures (RESPA), Home Mortgage Disclosure Act (HMDA), the Fair Credit Reporting Act and the Fair Housing Act, among others. These laws and regulations mandate certain disclosure requirements and regulate the manner in which financial institutions transact business with customers. VFG’s affiliate banks must comply with the applicable provisions of these consumer protection laws and regulations as part of its ongoing customer relations.
ACCESS TO FILINGS
The Company files annual reports on Form 10-K, quarterly reports on Form 10-Q, current reports on Form 8-K and other filings with the Securities and Exchange Commission (“SEC”). The public may read and copy any documents the Company files at the SEC’s Public Reference Room at 100 F Street, N.E., Washington, D.C. 20549. The public may obtain information on the operation of the Public Reference Room by calling the SEC at 1-800-SEC-0330. The Company’s SEC filings can also be obtained on the SEC’s website on the internet at http://www.sec.gov. Also, annual reports on Form 10-K and quarterly reports on Form 10-Q are posted on the Company’s website at http://www.vfgi.net as soon as reasonably practical after filing electronically with the SEC.
| Item 1A. | RISK FACTORS |
This section highlights specific risks that could affect our business and us. Although we have tried to discuss key factors, please be aware that other risks may prove to be important in the future. New risks may emerge at any time and we cannot predict such risks or estimate the extent to which they may affect our financial performance. In addition to the factors discussed elsewhere in this report, among the other factors that could cause actual results to differ materially are the following:
Our profitability depends on interest rates generally.
Our profitability depends in substantial part on our net interest margin, which is the difference between the rates we receive on loans and investments and the rates we pay for deposits and other sources of funds. Our net interest margin depends on many factors that are partly or completely outside of our control, including competition, federal economic, monetary and fiscal policies, and economic conditions generally. Changes in interest rates will affect our operating performance and financial condition. We try to minimize our exposure to interest rate risk, but we are unable to completely eliminate this risk.
4
Our profitability depends significantly on local economic conditions.
Our success depends primarily on the general economic conditions of the markets in which we operate. Unlike larger banks that are more geographically diversified, we provide banking and financial services to customers primarily in Northern, Central and Western Virginia. The local economic conditions in these areas have a significant impact on our business, real estate and construction loans, the ability of the borrowers to repay these loans and the value of the collateral securing these loans. A significant decline in general economic conditions, caused by inflation, recession, acts of terrorism, an outbreak of hostilities or other international or domestic calamities, unemployment or other factors beyond our control, could impact these local economic conditions and could negatively affect the financial results of our banking operations.
Our affiliate banks’ ability to pay dividends is subject to regulatory limitations which, to the extent VFG requires such dividends in the future, may affect our ability to pay obligations and dividends.
VFG is a separate legal entity from the affiliate banks and independent trust company, and thus does not have significant revenue sources of its own. We currently depend on the affiliate banks’ cash and liquidity as well as dividends from our subsidiaries to pay our operating expenses and dividends to shareholders. No assurance can be made that in the future the affiliate banks will have the capacity to pay the necessary dividends and that VFG will not require dividends from the affiliate banks to satisfy VFG’s obligations. The availability of dividends from our affiliate banks is limited by various statutes and regulations. It is possible, depending upon the financial condition of VFG and other factors, that the Federal Reserve could assert that payment of dividends or other payments by the affiliate banks are an unsafe or unsound practice. In the event the affiliate banks are unable to pay dividends sufficient to satisfy the Company’s obligations and the affiliate banks are unable to pay dividends to the Company, VFG may not be able to service its obligations as they become due, or pay dividends on the Company’s common stock. Consequently, the inability to receive dividends from the affiliate banks could adversely affect our financial condition, results of operations and cash flows.
Our profitability may suffer because of rapid and unpredictable changes in the highly regulated environment in which we operate.
We are subject to extensive supervision by several governmental regulatory agencies at the federal and state levels. Recently enacted, proposed and future banking legislation and regulations have had, will continue to have, or may have a significant impact on the financial services industry. These regulations, which are intended to protect depositors and not our shareholders, and the interpretation and application of them by federal and state regulators, are beyond our control, may change rapidly and unpredictably and can be expected to influence our earnings and growth. Our success depends on our continued ability to maintain compliance with these regulations. Some of these regulations may increase our costs and thus place other financial institutions that are not subject to similar regulation in stronger, more favorable competitive positions.
If our allowance for loan losses becomes inadequate, our results of operations may be adversely affected.
We maintain an allowance for loan losses that we believe is adequate to absorb estimated incurred losses inherent in our loan portfolio. Through a periodic review and consideration of the loan portfolio, management determines the amount of the allowance for loan losses by considering current general market conditions, credit quality of the loan portfolio and performance of our customers relative to their financial obligations with us. The amount of future losses is susceptible to changes in economic, operating and other conditions, including changes in interest rates that may be beyond our control and these losses may cause our loan loss provision to vary widely from recent levels. Although we believe the allowance for loan losses is adequate to absorb probable incurred losses in our loan portfolio, it is an estimate subject to revision as losses are confirmed. Higher levels of loan losses in the future could have a material adverse impact on our financial performance. Federal and state regulators, as an integral part of their supervisory function, periodically review our allowance for loan losses. These regulatory agencies may require us to increase our
5
provision for loan losses or to recognize further loan charge offs based upon their judgments, which may be different from ours. Any increase in the allowance for loan losses required by these regulatory agencies could have a negative effect on our financial condition and results of operations.
Our concentration in loans secured by real estate may increase our loan losses, which would negatively affect our financial results.
We offer a variety of secured loans, including commercial lines of credit, commercial term loans, real estate, construction, home equity, consumer and other loans. Many of our loans are secured by real estate (both residential and commercial) in our market area. At December 31, 2006, approximately 47% and 41% of our $1.22 billion loans receivable portfolio were secured by commercial and residential real estate, respectively. A major change in the real estate market, such as deterioration in the value of this collateral, or in the local or national economy, could adversely affect our customers’ ability to pay these loans, which in turn could impact us. Risk of loan defaults and foreclosures are unavoidable in the banking industry, and we try to limit our exposure to this risk by monitoring our extensions of credit carefully. We cannot fully eliminate credit risk, and as a result credit losses may occur in the future.
Our future success is dependent on our ability to compete effectively in the highly competitive banking industry.
We face vigorous competition from other banks and other financial institutions, including savings and loan associations, savings banks, finance companies and credit unions for deposits, loans and other financial services in our market area. Many competitors offer products and services which we do not and many have substantially greater resources, name recognition and market presence that benefit them in attracting business. In addition, larger competitors may be able to price loans and deposits more aggressively than we do. Some of the financial services organizations with which we compete are not subject to the same degree of regulation as is imposed on bank holding companies and federally insured state-chartered banks, national banks and federal savings institutions. As a result, these nonbank competitors have certain advantages over us in accessing funding and in providing various services. The differences in resources and regulations may make it harder for us to compete profitably, reduce the rates that we can earn on loans and investments, increase the rates we must offer on deposits and other funds, and adversely affect our overall financial condition and earnings.
We depend on the services of our key personnel, and a loss of any of those personnel may disrupt our operations and result in reduced revenues.
Our success depends upon the continued service of our senior management team and upon our ability to attract and retain qualified financial services personnel. Competition for qualified employees is intense. In our experience, it can take a significant period of time to identify and hire personnel with the combination of skills and attributes required in carrying out our strategy. If we lose the services of our key personnel, or are unable to attract additional qualified personnel, our business, financial condition, results of operations and cash flows could be materially adversely affected.
We may identify a material weakness or a significant deficiency in our internal control over financial reporting that may adversely affect our ability to properly account for non-routine transactions.
As we have grown and expanded, we have acquired and added, and expect to continue to acquire and add, businesses and other activities that complement our core retail and commercial banking functions. Such acquisitions or additions frequently involve complex operational and financial reporting issues that can influence management’s internal control system. While we make every effort to thoroughly understand any new activity or acquired entity’s business processes, our planning for proper integration into our Company can give no assurance that we will not encounter operational and financial reporting difficulties impacting our controls over the Company.
If we need additional capital in the future to continue our growth, we may not be able to obtain it on terms that are favorable. This could negatively affect our performance and the value of our common stock.
Our business strategy calls for continued growth. We anticipate that we will be able to support this growth through the generation of additional deposits at new branch locations as well as investment opportunities. However, we may need
6
to raise additional capital in the future to support our continued growth and to maintain our capital levels. Our ability to raise capital through the sale of additional securities will depend primarily upon our financial condition and the condition of financial markets at that time. We may not be able to obtain additional capital in the amounts or on terms satisfactory to us. Our growth may be constrained if we are unable to raise additional capital as needed.
Because our mortgage banking revenue is sensitive to changes in economic conditions, decreased economic activity, a slowdown in the housing market or higher interest rates may reduce our profits.
Maintaining a high level of fees from this operation depends primarily on our ability to continue to originate mortgage loans. Production levels are sensitive to changes in economic conditions and can suffer from decreased economic activity, a slowdown in the housing market or higher interest rates. Generally, any sustained period of decreased economic activity or higher interest rates could adversely affect our mortgage originations and, consequently, reduce our income from mortgage banking activities. As a result, these conditions may adversely affect our net income.
| Item 1B. | UNRESOLVED STAFF COMMENTS |
None.
| Item 2. | PROPERTIES |
The Company’s headquarters is located at 102 S. Main Street in Culpeper, Virginia, and also maintains executive offices at 1807 Seminole Trail, Charlottesville, Virginia. The Company’s subsidiary banks operate forty branch locations. They own thirty-four branches and lease the remaining six. Two additional locations are owned by our bank affiliates to facilitate operations and loan production. Additional information regarding lease commitments can be found in Note 19 of the 2006 Consolidated Financial Statements.
7
As of December 31, 2006 the offices (including executive offices) of our subsidiaries were as follows:
Subsidiary | Location of Executive Office | Executive Office Owned/Leased | Location of Offices (including executive office) | |||
| Second Bank & Trust | 102 South Main Street Culpeper Virginia | Owned | 15 banking offices in Culpeper, Madision, Orange, Locust Grove, Albemarle, Spotsylvania, Caroline and Stafford Counties, Virginia; Charlottesville, Fredericksburg, and Bowling Green Cities, Virginia | |||
| 4700 Harrison Road Fredericksburg, Virginia | Leased | |||||
| Planters Bank & Trust Company of Virginia | 24 South Augusta Street Staunton, Virginia | Owned | 25 banking offices in Augusta, Rockbridge, Franklin, Prince Prince Edward, and Bedford Counties, Virginia; Grottoes, Woodstock, Rocky Mount, and Farmville Towns, Virginia; Waynesboro, Harrisonburg, Lynchburg, Buena Vista, Staunton, and Covington Cities, Virginia | |||
| Virginia Commonwealth Trust Company | 102 South Main Street Culpeper, Virginia | Owned | 5 trust offices in Albemarle, and Culpeper, Counties, Virginia; Fredericksburg, Staunton and Harrisonburg Cities, Virginia | |||
All of the Company’s properties are in good operating condition and are adequate for the Company’s present needs.
| Item 3. | LEGAL PROCEEDINGS |
There are no material proceedings to which the Company or any of our subsidiaries are a party or by which, to the Company’s knowledge, we, or any subsidiaries, are threatened. All legal proceedings presently pending or threatened against the Company or our subsidiaries involve routine litigation incidental to the business of the Company or the subsidiary involved and are not material in respect to the amount in controversy.
| Item 4. | SUBMISSION OF MATTERS TO A VOTE OF SECURITY HOLDERS |
No matters were submitted during the fourth quarter of the fiscal year covered by this report to a vote of security holders of the Company through a solicitation of proxies or otherwise.
8
EXECUTIVE OFFICERS OF REGISTRANT
The executive officers of the Company are appointed each year at the organizational meeting of the Board of Directors, which follows the annual meeting of the shareholders, and at other Board of Directors meetings as appropriate. Each of the executive officers has been employed by the Company in the position or positions indicated in the list and pertinent notes below. Messrs. Barham and Farrar have been employed by the Company as executive officers for more than five years.
Name | Age | Current Position | ||
| O.R. Barham, Jr. | 56 | Mr. Barham has been President and Chief Executive Officer of the Company since 2002. Mr. Barham served as a director of the Company since 1996. Prior to January 2002, he served as President and Chief Executive Officer of Virginia Commonwealth Financial Corporation and its predecessor, Second National Financial Corporation. | ||
| Jeffrey W. Farrar | 46 | Mr. Farrar has been Executive Vice President and Chief Financial Officer of the Company since January 18, 2002. Mr. Farrar served as Executive Vice President and Chief Financial Officer of Virginia Commonwealth Financial Corporation and its predecessor, Second National Financial Corporation, since 1996. | ||
| Litz Van Dyke | 43 | Mr. Van Dyke is Executive Vice President and Chief Operating Officer of the Company. Mr. Van Dyke joined the Company in September 2004, and previously served in a similar capacity for FNB Corporation of Christiansburg, Virginia. | ||
| Richard L. Saunders | 53 | Mr. Saunders is Chief Credit Officer of the Company. Mr. Saunders joined the Company in May 2004 and previously served in a similar capacity for Guaranty Bank of Charlottesville, Virginia. | ||
| James T. Huerth | 45 | Mr. Huerth has been President & CEO of Planters Bank & Trust Company of Virginia since January 2005. Mr. Huerth served as an Area Commercial Executive for Branch Banking & Trust (BB&T) in Georgia’s northern market prior to joining the Company. |
9
PART II
| Item 5. | MARKET FOR REGISTRANT’S COMMON EQUITY, RELATED STOCKHOLDER MATTERS AND ISSUER PURCHASES OF EQUITY SECURITIES |
The Company’s stock trades on the NASDAQ Global Select Market, and currently trades under the trading symbolVFGI. As of March 1, 2007, there were approximately 5,100 shareholders of record and the closing price of the Company’s common stock was $24.10. There were no repurchases of stock conducted during 2006. Listed below are the high and low prices for the common stock, as reported by NASDAQ, and dividends paid for each quarter in the two year period ended December 31, 2006. VFG anticipates the same level of dividend payment in the future. On September 6, 2006 the Company paid a three-for-two stock split in the form of a 50% stock dividend. The per share amounts below and throughout this document have been restated to reflect the three-for-two stock split for all periods presented.
| Sales Price | Dividends Per Share | |||||||||||||||||
| 2006 | 2005 | 2006 | 2005 | |||||||||||||||
| High | Low | High | Low | |||||||||||||||
1st Quarter | $ | 27.97 | $ | 23.70 | $ | 25.53 | $ | 21.01 | $ | 0.15 | $ | 0.13 | ||||||
2nd Quarter | 29.67 | 24.87 | 24.33 | 21.20 | 0.15 | 0.14 | ||||||||||||
3rd Quarter | 29.45 | 25.05 | 25.00 | 21.71 | 0.15 | 0.14 | ||||||||||||
4th Quarter | 28.94 | 26.17 | 26.20 | 22.13 | 0.16 | 0.15 | ||||||||||||
10
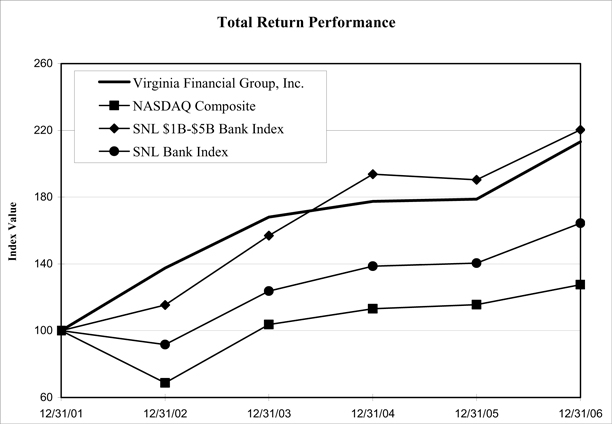
STOCK PERFORMANCE GRAPH
The following graph compares the Company’s annual percentage change in cumulative total return on common stock over the past five years with the cumulative total return of companies comprising the NASDAQ Composite Index, the SNL $1-$5 Billion Bank Index and SNL Composite Bank Index. The SNL indexes are indexes are published by SNL Financial, LC. The Bank indexes are, in the opinion of management, a more relevant standard by which to compare performance, whereas the peer groups are more similar in terms of size and business profiles.
This presentation assumes that $100 was invested in shares of the relevant issuers on December 31, 2001, and that dividend received were immediately invested in additional shares. The graph plots the value of the intial investment at one-year intervals for the fiscal years shown.
| Period Ending | ||||||||||||
Index | 12/31/01 | 12/31/02 | 12/31/03 | 12/31/04 | 12/31/05 | 12/31/06 | ||||||
Virginia Financial Group, Inc. | 100.00 | 137.53 | 168.07 | 177.51 | 178.79 | 213.14 | ||||||
NASDAQ Composite | 100.00 | 68.76 | 103.67 | 113.16 | 115.57 | 127.58 | ||||||
SNL $1B-$5B Bank Index | 100.00 | 115.44 | 156.98 | 193.74 | 190.43 | 220.36 | ||||||
SNL Bank Index | 100.00 | 91.69 | 123.69 | 138.61 | 140.50 | 164.35 | ||||||
On January 22, 2002, the Company’s common stock began trading on the NASDAQ National Market , and currently trades on the NASDAQ Global Select Market under the trading symbol VFGI.
There can be no assurance that the Company’s stock performance in the future will continue with the same or similar trends depicted in the graph above.
11
| Item 6. | SELECTED FINANCIAL DATA |
The following is selected financial data for the Company for the last five years.
| Years Ended December 31, | ||||||||||||||||||||
(In thousands, except per share data) | 2006 | 2005 | 2004 | 2003 | 2002 | |||||||||||||||
Statement of Operations Data: | ||||||||||||||||||||
Interest Income | $ | 95,627 | $ | 80,706 | $ | 70,402 | $ | 62,827 | $ | 63,723 | ||||||||||
Interest Expense | 35,482 | 23,861 | 19,628 | 19,357 | 23,101 | |||||||||||||||
Net Interest Income | 60,145 | 56,845 | 50,774 | 43,470 | 40,622 | |||||||||||||||
Provision for Loan Losses | 750 | 2,012 | 2,534 | 1,290 | 1,602 | |||||||||||||||
Total Noninterest Income | 15,485 | 15,443 | 14,544 | 15,227 | 12,721 | |||||||||||||||
Total Noninterest Expense | 46,918 | 43,702 | 41,016 | 38,866 | 35,030 | |||||||||||||||
Net Income | 19,497 | 18,216 | 15,203 | 13,492 | 12,335 | |||||||||||||||
Performance Ratios: | ||||||||||||||||||||
Return on Average Assets | 1.24 | % | 1.23 | % | 1.07 | % | 1.13 | % | 1.15 | % | ||||||||||
Return on Average Equity | 13.57 | % | 13.86 | % | 12.40 | % | 11.47 | % | 11.09 | % | ||||||||||
Net Interest Margin | 4.25 | % | 4.29 | % | 4.04 | % | 4.15 | % | 4.29 | % | ||||||||||
Efficiency Ratio (1) | 60.54 | % | 59.32 | % | 61.12 | % | 64.42 | % | 63.08 | % | ||||||||||
Per Share Data: | ||||||||||||||||||||
Net Income—Basic | $ | 1.81 | $ | 1.69 | $ | 1.42 | $ | 1.26 | $ | 1.13 | ||||||||||
Net Income—Diluted | 1.80 | 1.68 | 1.41 | 1.25 | 1.13 | |||||||||||||||
Cash Dividends | 0.61 | 0.56 | 0.52 | 0.50 | 0.48 | |||||||||||||||
Book Value | 13.97 | 12.66 | 11.83 | 11.17 | 10.63 | |||||||||||||||
Market Price Per Share | 27.99 | 24.02 | 24.44 | 23.68 | 19.87 | |||||||||||||||
Cash Dividend Payout Ratio | 34.03 | % | 33.07 | % | 36.76 | % | 39.81 | % | 42.65 | % | ||||||||||
Balance Sheet Data: | ||||||||||||||||||||
Assets | $ | 1,625,989 | $ | 1,505,184 | $ | 1,449,608 | $ | 1,387,211 | $ | 1,114,905 | ||||||||||
Loans | 1,217,632 | 1,143,076 | 1,061,575 | 922,689 | 700,979 | |||||||||||||||
Investment securities | 264,141 | 241,032 | 286,856 | 360,041 | 295,628 | |||||||||||||||
Deposits | 1,318,281 | 1,255,509 | 1,257,164 | 1,210,774 | 959,822 | |||||||||||||||
Total borrowings | 144,812 | 101,831 | 56,649 | 48,821 | 32,415 | |||||||||||||||
Stockholders’ Equity | 150,652 | 136,105 | 127,089 | 119,830 | 114,371 | |||||||||||||||
Capital Ratios: | ||||||||||||||||||||
Tier 1 Capital (to Average Assets) | 9.65 | % | 9.32 | % | 8.77 | % | 7.03 | % | 9.63 | % | ||||||||||
Total Capital (to Risk Weighted Assets) | 12.44 | % | 12.18 | % | 12.37 | % | 10.57 | % | 14.30 | % | ||||||||||
Asset Quality Ratios: | ||||||||||||||||||||
Total allowance for loan losses to total loans outstanding | 1.19 | % | 1.19 | % | 1.10 | % | 1.06 | % | 1.31 | % | ||||||||||
Non-performing assets to year-end loans and other property owned | 0.25 | % | 0.16 | % | 0.38 | % | 0.80 | % | 1.15 | % | ||||||||||
| (1) | Computed by dividing non-interest expense by the sum of net interest income and non-interest income, net of gains or losses on securities, fixed assets and foreclosed assets. This is a non-GAAP financial measure, which we believe provides investors with important information regarding our operational efficiency. Comparison of our efficiency ratio with those of other companies may not be possible, because other companies may calculate the efficiency ratio differently. |
12
| Item 7. | MANAGEMENT’S DISCUSSION AND ANALYSIS OF FINANCIAL CONDITION AND RESULTS OF OPERATIONS |
VIRGINIA FINANCIAL GROUP, INC.
Management’s Discussion and Analysis of Financial Condition and Results of Operations
The following discussion provides management’s analysis of the consolidated financial results of operations, financial condition, liquidity and capital resources of Virginia Financial Group, Inc. and its affiliates (VFG). This discussion and analysis should be read in conjunction with the audited financial statements and footnotes appearing elsewhere in this report.
CAUTIONARY STATEMENT REGARDING FORWARD-LOOKING STATEMENTS
In addition to historical information, Management’s Discussion and Analysis contains forward-looking statements. The forward-looking statements are subject to certain risks and uncertainties, which could cause actual results to differ materially from historical results, or those anticipated. When we use words such as “believes”, “expects”, “anticipates” or similar expressions, we are making forward-looking statements. Readers are cautioned not to place undue reliance on these forward-looking statements, which reflect management’s analysis only as of the date thereof. VFG wishes to caution the reader that factors, such as those listed below, in some cases have affected and could affect VFG’s actual results, causing actual results to differ materially from those in any forward looking statement. These factors include:
| • | Expected cost savings from VFG’s acquisitions and dispositions, |
| • | Competitive pressure in the banking industry or in VFG’s markets may increase significantly, |
| • | Changes in the interest rate environment may reduce margins, |
| • | General economic conditions, either nationally or regionally, may be less favorable than expected, resulting in, among other things, credit quality deterioration and reduced mortgage banking revenue, |
| • | Changes may occur in banking legislation and regulation, |
| • | Our concentration in loans secured by real estate could increase our loan losses, |
| • | Turnover in key personnel would disrupt our operations, |
| • | We may identify a material weakness or a significant deficiency in our internal control over financial reporting that may adversely affect our ability too properly account for non-routine transactions, |
| • | We may need additional capital in the future to continue our growth and may not be able to obtain it on terms that are favorable, |
| • | Changes may occur in general business conditions, and |
| • | Changes may occur in the securities markets. |
EXECUTIVE OVERVIEW
VFG’s earnings per diluted share grew 7.1% in 2006 versus 2005. Net revenue was $75.6 million for the year ended December 31, 2006 as compared to $72.3 million in 2005. VFG earned $19.5 million or $1.80 per diluted share, an increase of 7.0% over 2005 earnings of $18.2 million or $1.68 per diluted share. VFG generated approximately $22.3 million in cash flow from operating activities in 2006. It paid dividends to stockholders of $6.6 million, invested $10.8 million in capital expenditures and borrowed approximately $25 million in long term debt, net.
Despite adding four full-service financial centers, additional key management positions and an environment fostering margin compression during the year, VFG still managed to grow earnings a respectable 7% over 2005. Asset quality has remained strong despite soft real estate markets throughout many of the regions serviced by the Company. Net interest margin remained acceptable despite an inverted yield curve and competitive pressures encountered during the year. Continuing improvement in noninterest income related to retail banking, trust and brokerage services was observed, but must improve to counter the impact of anticipated net interest margin contraction in 2007.
VFG’s focus for 2007 will include loan portfolio diversification, standardization of loan and deposit pricing metrics, concentration on the current forty branch network for retail delivery optimization in a changing competitive landscape and improvement of revenue diversification through increased contribution of noninterest revenue streams. We will
13
likely slow de novo branch activity as we focus on the maturation of six branches opened during the past eighteen months. Another significant initiative will be aggressive focus on demand deposit penetration in our markets via a direct marketing program. All of our strategic efforts are intended to grow and diversify our revenue streams, support sustained profitability and better serve the customer.
NON-GAAP FINANCIAL MEASURES
This report refers to the efficiency ratio, which is computed by dividing noninterest expense by the sum of net interest income and noninterest income, net of gains or losses on securities, fixed assets and foreclosed assets. The efficiency ratio is not a recognized reporting measure under Accounting Principles Generally Accepted in the United States (USGAAP). We believe this measure provides investors with important information regarding our operational efficiency. Management believes such financial information is meaningful to the reader in understanding operating performance, but cautions that such information not be viewed as a substitute for USGAAP. VFG, in referring to its net income, is referring to income under Accounting Principles Generally Accepted in the United States. Comparison of our efficiency ratio with those of other companies may not be possible, because other companies may calculate the efficiency ratio differently.
CRITICAL ACCOUNTING POLICIES
General
The Company’s financial statements are prepared in accordance with accounting principles generally accepted in the United States (GAAP). The financial information contained within our statements is, to a significant extent, financial information that is based on measures and estimates of the financial effects of transactions and events that have already occurred. A variety of factors could affect the ultimate value that is obtained either when earning income, recognizing an expense, recovering an asset or relieving a liability. In addition, USGAAP itself may change from one previously acceptable method to another method. Although the economics of our transactions would be the same, the timing of events that would impact our transactions could change.
Allowance for Loan Losses
We use historical loss factors as one factor in determining the inherent loss that may be present in our loan portfolio. Actual losses could differ significantly from the historical factors that we use. The Company’s affiliate banks conduct an analysis of the loan portfolio on a regular basis. This analysis is used in assessing the sufficiency of the allowance for loan losses and in the determination of the necessary provision for loan losses. The review process generally begins with lenders identifying problem loans to be reviewed on an individual basis for impairment. When a loan has been identified as impaired, a specific reserve may be established based on the bank’s calculation of the loss embedded in the individual loan. In addition to impairment testing, the banks have an eight point grading system for each non-homogeneous loan in the portfolio. The loans meeting the criteria for impairment are segregated from performing loans within the portfolio. Loans are then grouped by loan type and, in the case of commercial loans, by risk rating. Each loan type is assigned an allowance factor based on historical loss experience, economic conditions, and overall portfolio quality including delinquency rates. This evaluation is inherently subjective as it requires estimates that are susceptible to significant revision as more information becomes available.
A loan is considered impaired when, based on current information and events, it is probable that the bank will be unable to collect the scheduled payments of principal or interest when due according to the contractual terms of the loan agreement. Factors considered by management in determining impairment include payment status, collateral value, and the probability of collecting scheduled principal and interest payments when due. Loans that experience insignificant payment delays and payment shortfalls generally are not classified as impaired. Management determines the significance of payment delays and payment shortfalls on a case-by-case basis, taking into consideration all of the circumstances surrounding the loan and the borrower, including the length of the delay, the reasons for the delay, the borrower’s prior payment record, and the amount of the shortfall in relation to the principal and interest owed. Impairment is measured on a loan-by-loan basis for commercial and construction loans by either the present value of expected future cash flows discounted at the loan’s effective interest rate, the loan’s obtainable market price, or the fair value of the collateral if the loan is collateral dependent. Larger groups of smaller balance homogeneous loans are collectively evaluated for impairment. Accordingly, the Company does not separately identify individual consumer and residential loans for impairment disclosures, unless such loans are subject to a restructuring agreement.
14
Goodwill
Goodwill is subject to impairment testing at least annually to determine whether write-downs of the recorded balances are necessary. In this testing, the Company employs general industry practices in accordance with USGAAP. A fair value is determined for each reporting unit using various market valuation methodologies. If the fair values of the reporting units exceed their book values, no write-down of recorded goodwill is necessary. If the fair value of a reporting unit is less, an expense may be required on the Company’s books to write down the related goodwill to the proper carrying value. The Company tests for impairment of goodwill in September each year, and again at any quarter-end if any material events occur during a quarter that may affect goodwill. Through its annual analysis as of September 30, 2006, the Company has not identified any impairment of its goodwill. No events occurred during the fourth quarter 2006 necessitating a re-test of goodwill impairment. No assurance can be given that future goodwill impairment tests will not result in a charge to earnings.
Income Taxes
Deferred income tax assets and liabilities are determined using the liability (or balance sheet) method. Under this method, the net deferred tax asset or liability is determined based on the tax effects of the temporary differences between the book and tax bases of the various balance sheet assets and liabilities and gives current recognition to changes in tax rates and laws.
Stock-Based Compensation
The Company has a stock-based employee compensation plan under which nonqualified stock options may be granted periodically to certain employees. The Company’s stock options typically have an exercise price equal to at least the fair value of the stock on the date of grant, and vest based on continued service with the Company for a specified period, generally five years. The Company adopted SFAS 123R effective January 1, 2006 using the modified prospective method and as such, results for prior periods have not been restated. Prior to January 1, 2006, the value of restricted stock awards was expensed by the Company over the restriction period, and no compensation expense was recognized for stock option grants as all such grants had an exercise price not less than fair market value on the date of grant.
SFAS 123R also requires that new awards to employees eligible for retirement prior to the award becoming fully vested be recognized as compensation cost over the period through the date that the employee first becomes eligible to retire and is no longer required to provide service to earn the award.
RESULTS OF OPERATIONS
NET INTEREST INCOME
The primary source of VFG’s traditional banking revenue is net interest income, which represents the difference between interest income on earning assets and interest expense on liabilities used to fund those assets. Earning assets include loans, securities, and federal funds sold. Interest bearing liabilities include deposits and borrowings. To compare the tax-exempt yields to taxable yields, amounts are adjusted to pretax equivalents based on a 35% federal corporate income tax rate.
Net interest income is affected by changes in interest rates, volume of interest bearing assets and liabilities, and the composition of those assets and liabilities. The “interest rate spread” and “net interest margin” are two common statistics related to changes in net interest income. The interest rate spread represents the difference between the yields earned on interest earning assets and the rates paid for interest bearing liabilities. The net interest margin is defined as the percentage of net interest income to average earning assets. Earning assets obtained through noninterest bearing sources of funds such as regular demand deposits and stockholders’ equity result in a net interest margin that is higher than the interest rate spread.
15
2006 Compared to 2005
Tax equivalent net interest income in 2006 was $62.1 million, an increase of $3.7 million or 6.3% compared to $58.5 million in 2005. Improvements in the growth and mix of average earning assets were primary contributors to this growth and outpaced the margin compression for the year. Average interest earning assets increased $95.9 million or 7.0% to $1.46 billion, while average loans increased $75.2 or 6.8% to $1.19 billion.
The average interest rate spread was 3.66% in 2006, down eighteen basis points from 3.84% in 2005. The net interest margin was 4.25% in 2006, down four basis points from 4.29% in 2005. The slight decrease in the Company’s net interest margin was a result of several factors, including a modestly liability sensitive position in a rising rate environment, additional wholesale funding costs and a more aggressive pricing of deposits with durations of nine months or less to minimize exposure to a potential downward cycle in short term rates, offset partially by the aforementioned changes in asset mix. The yield on average loans increased seventy-one basis points in 2006, reflecting the increase in short term rates during the year, while the yield on investment securities increased thirty-seven basis points for the period. Interest expense as a percentage of average earning assets increased to 2.44%, up sixty-nine basis points from 1.75% in 2005, reflecting a seventy-three basis point increase in average cost of retail deposits to 2.76%, and an eighty-three basis point increase in average total funding cost to 3.03%.
2005 Compared to 2004
Tax equivalent net interest income in 2005 was $58.5 million, an increase of $5.9 million or 11.2% compared to $52.6 million in 2004. Improvements in the growth and mix of average earning assets, coupled with net interest margin expansion, were primary contributors to this growth. Average interest earning assets increased $62.7 million or 4.8% to $1.36 billion, while average loans increased $121.3 or 12.2% to $1.11 billion.
The average interest rate spread was 3.84% in 2005, up thirteen basis points from 3.71% in 2004. The net interest margin was 4.29% in 2005, up twenty-five basis points from 4.04% in 2004. The increase in the Company’s net interest margin was a result of several factors, including changes in asset mix, a modestly asset sensitive position in a rising rate environment, offset partially by additional wholesale funding costs. The yield on average loans receivable increased forty-eight basis points in 2005, reflecting the increase in short term rates during the year, while the yield on investment securities increased nine basis points for the period. Interest expense as a percentage of average earning assets increased to 1.75%, up twenty-four basis points from 1.51% in 2004, reflecting a twenty-five basis point increase in average cost of retail deposits to 2.03%, and an increase in average total funding cost to 2.20%.
16
The following table presents net interest income on a fully taxable equivalent basis, interest rate spread and net interest margin for the years ending December 31, 2006, 2005 and 2004.
| 2006 | 2005 | 2004 | ||||||||||||||||||||||||||||
Dollars in thousands | Average Balance | Income/ Expense | Average Rate | Average Balance | Income/ Expense | Average Rate | Average Balance | Income/ Expense | Average Rate | |||||||||||||||||||||
ASSETS | ||||||||||||||||||||||||||||||
Loans receivable, net (1) (2) | $ | 1,188,388 | $ | 84,159 | 7.08 | % | $ | 1,113,206 | $ | 70,908 | 6.37 | % | $ | 991,911 | $ | 58,463 | 5.89 | % | ||||||||||||
Investment securities | ||||||||||||||||||||||||||||||
Taxable | 165,083 | 7,210 | 4.37 | % | 173,668 | 6,844 | 3.94 | % | 233,429 | 9,160 | 3.92 | % | ||||||||||||||||||
Tax exempt (2) | 85,020 | 5,247 | 6.17 | % | 63,029 | 4,069 | 6.46 | % | 66,610 | 4,403 | 6.61 | % | ||||||||||||||||||
Total investments | 250,103 | 12,457 | 4.98 | % | 236,697 | 10,913 | 4.61 | % | 300,039 | 13,563 | 4.52 | % | ||||||||||||||||||
Interest bearing deposits | 2,681 | 74 | 2.76 | % | 1,256 | 41 | 3.26 | % | 416 | 4 | 0.96 | % | ||||||||||||||||||
Federal funds sold | 18,805 | 930 | 4.95 | % | 12,968 | 464 | 3.58 | % | 9,044 | 152 | 1.68 | % | ||||||||||||||||||
Total interest earning assets | 1,459,977 | 97,620 | 6.69 | % | 1,364,127 | 82,326 | 6.04 | % | 1,301,410 | 72,182 | 5.55 | % | ||||||||||||||||||
Allowance for loan losses | (14,118 | ) | (12,644 | ) | (10,776 | ) | ||||||||||||||||||||||||
Total nonearning assets | 124,919 | 126,235 | 132,570 | |||||||||||||||||||||||||||
Total assets | $ | 1,570,778 | $ | 1,477,718 | $ | 1,423,204 | ||||||||||||||||||||||||
LIABLILITIES AND STOCKHOLDERS EQUITY |
| |||||||||||||||||||||||||||||
Interest-bearing deposits | ||||||||||||||||||||||||||||||
Interest checking | $ | 170,204 | $ | 765 | 0.45 | % | $ | 192,987 | $ | 807 | 0.42 | % | $ | 195,131 | $ | 950 | 0.49 | % | ||||||||||||
Money market | 170,892 | 3,734 | 2.19 | % | 176,606 | 2,325 | 1.32 | % | 176,386 | 1,649 | 0.94 | % | ||||||||||||||||||
Savings | 108,659 | 853 | 0.79 | % | 131,420 | 880 | 0.67 | % | 140,925 | 948 | 0.67 | % | ||||||||||||||||||
Time deposits: | ||||||||||||||||||||||||||||||
Less than $100,000 | 393,897 | 15,099 | 3.83 | % | 364,645 | 11,473 | 3.15 | % | 370,746 | 10,233 | 2.76 | % | ||||||||||||||||||
$100,000 and more | 189,353 | 8,045 | 4.25 | % | 137,197 | 4,923 | 3.59 | % | 121,135 | 4,079 | 3.37 | % | ||||||||||||||||||
Total interest-bearing deposits | 1,033,005 | 28,496 | 2.76 | % | 1,002,855 | 20,408 | 2.03 | % | 1,004,323 | 17,859 | 1.78 | % | ||||||||||||||||||
Federal funds purchased & repurchase agreements | 4,738 | 219 | 4.62 | % | 21,189 | 568 | 2.68 | % | 23,801 | 238 | 1.00 | % | ||||||||||||||||||
Federal Home Loan Bank advances | 61,612 | 2,834 | 4.60 | % | 33,056 | 1,351 | 4.09 | % | 12,960 | 801 | 6.18 | % | ||||||||||||||||||
Subordinated debt | 20,619 | 1,636 | 7.93 | % | 20,619 | 1,260 | 6.11 | % | 16,281 | 683 | 4.20 | % | ||||||||||||||||||
Commercial paper | 50,530 | 2,275 | 4.50 | % | 7,724 | 255 | 3.30 | % | ||||||||||||||||||||||
Other borrowings | 363 | 22 | 6.06 | % | 947 | 19 | 2.01 | % | 10,277 | 47 | 0.46 | % | ||||||||||||||||||
Total interest-bearing liabilities | 1,170,867 | 35,482 | 3.03 | % | 1,086,390 | 23,861 | 2.20 | % | 1,067,642 | 19,628 | 1.84 | % | ||||||||||||||||||
Demand deposits | 239,332 | 249,938 | 224,877 | |||||||||||||||||||||||||||
Other liabilities | 16,857 | 9,953 | 8,035 | |||||||||||||||||||||||||||
Total liabilities | 1,427,056 | 1,346,281 | 1,300,554 | |||||||||||||||||||||||||||
Stockholders’ equity | 143,722 | 131,437 | 122,650 | |||||||||||||||||||||||||||
Total liabilities and stockholders’ equity | $ | 1,570,778 | $ | 1,477,718 | $ | 1,423,204 | ||||||||||||||||||||||||
Net interest income (tax equivalent) (3) | $ | 62,138 | $ | 58,465 | $ | 52,554 | ||||||||||||||||||||||||
Average interest rate spread | 3.66 | % | 3.84 | % | 3.71 | % | ||||||||||||||||||||||||
Interest expense as a percent of average earning assets | 2.43 | % | 1.75 | % | 1.51 | % | ||||||||||||||||||||||||
Net interest margin | 4.25 | % | 4.29 | % | 4.04 | % | ||||||||||||||||||||||||
| (1) | Includes nonaccrual loans |
| (2) | Income and yields are reported on a taxable equivalent basis using a 35% tax rate. |
| (3) | The tax equivalent interest adjustments included in the yields presented above were $2.0, million, $1.6 million and $1.8 million for each of the three years ended December 31, 2006. |
17
The next table analyzes the changes in net interest income on a fully taxable equivalent basis for the periods broken down by their rate and volume components. The change in interest due to both rate and volume has been allocated proportionately to change due to volume versus change due to rate.
| Years Ended December 31, | ||||||||||||||||||||||||
2006 vs. 2005 Increase (Decrease) Due to changes in: | 2005 vs. 2004 Increase (Decrease) Due to changes in: | |||||||||||||||||||||||
(Dollars in thousands) | Volume | Rate | Total | Volume | Rate | Total | ||||||||||||||||||
Interest Income: | ||||||||||||||||||||||||
Loans | $ | 5,015 | $ | 8,236 | $ | 13,251 | $ | 7,451 | $ | 4,994 | $ | 12,445 | ||||||||||||
Securities, taxable | (355 | ) | 721 | 366 | (2,362 | ) | 46 | (2,316 | ) | |||||||||||||||
Securities, tax-exempt | 1,368 | (190 | ) | 1,178 | (236 | ) | (98 | ) | (334 | ) | ||||||||||||||
Interest-bearing deposits | 40 | (7 | ) | 33 | 17 | 20 | 37 | |||||||||||||||||
Federal funds sold | 252 | 214 | 466 | 86 | 226 | 312 | ||||||||||||||||||
Total Interest Earning Assets | $ | 6,320 | $ | 8,974 | $ | 15,294 | $ | 4,956 | $ | 5,188 | $ | 10,144 | ||||||||||||
Interest Expense: | ||||||||||||||||||||||||
Time and savings deposits: | ||||||||||||||||||||||||
Interest checking | $ | (97 | ) | $ | 55 | $ | (42 | ) | $ | (8 | ) | $ | (135 | ) | $ | (143 | ) | |||||||
Money market | (65 | ) | 1,474 | 1,409 | 2 | 674 | 676 | |||||||||||||||||
Savings | (171 | ) | 144 | (27 | ) | (68 | ) | — | (68 | ) | ||||||||||||||
Time deposits | ||||||||||||||||||||||||
Less than $100,000 | 1,001 | 2,625 | 3,626 | (185 | ) | 1,425 | 1,240 | |||||||||||||||||
$100,000 and more | 2,104 | 1,018 | 3,122 | 566 | 278 | 844 | ||||||||||||||||||
Total time and savings deposits | 2,772 | 5,316 | 8,088 | 307 | 2,242 | 2,549 | ||||||||||||||||||
Federal funds and repurchase agreements | (606 | ) | 257 | (349 | ) | (29 | ) | 359 | 330 | |||||||||||||||
Federal Home Loan Bank advances | 1,296 | 187 | 1,483 | 874 | (324 | ) | 550 | |||||||||||||||||
Subordinated debt | — | 376 | 376 | 215 | 362 | 577 | ||||||||||||||||||
Commercial paper | 1,896 | 124 | 2,020 | 255 | — | 255 | ||||||||||||||||||
Other borrowings | (17 | ) | 20 | 3 | (73 | ) | 45 | (28 | ) | |||||||||||||||
Total Interest Bearing Liabilities | 5,341 | 6,280 | 11,621 | 1,549 | 2,684 | 4,233 | ||||||||||||||||||
Net Interest Income | $ | 979 | $ | 2,694 | $ | 3,673 | $ | 3,407 | $ | 2,504 | $ | 5,911 | ||||||||||||
18
NONINTEREST INCOME
2006 Compared to 2005
Noninterest income increased to $15.5 million in 2006, an increase of $42 thousand or .3% compared to 2005. The 2006 results include a loss of $196 thousand on sale of securities available for sale. Included in the 2005 results were net gains on sales of securities available for sale of $296 thousand and a net gain of $421 thousand in connection with the sale of two branches located in Tazewell County. Retail banking fees increased to $7.0 million, an increase of $28 thousand or .4% from 2005. Increases in fees associated with new account generation and debit card activity were offset by decreases in the volume of overdrafts.
Gains on sales of mortgage loans from mortgage banking activities decreased to $2.9 million, a decrease of $222 thousand or 7.2%. Due to the higher mortgage rates and a cooling of real estate markets during 2006, the Company experienced a decline in mortgage originations in both purchase money and refinance mortgages when compared to the robust levels noted during 2005. VFG originated $134.1 million and sold $138.6 million of secondary mortgage loans during 2006, compared to $176.5 million originated and $176.1 million sold in 2005.
Commissions and fees from fiduciary and brokerage activities associated with our trust and wealth management activities increased to $3.9 million for 2006, an increase of $187 thousand or 5.1% over 2005. At December 31, 2006, VFG’s trust affiliate had assets under management and brokerage assets of $597 million, compared to $511 million at December 31, 2005.
Other operating income increased to $1.7 million in 2006 an increase of $587 thousand or 55.1% compared to 2005. The largest contributors to this increase were a $489 thousand in commission revenue generated by Virginia Financial Title Agency (VFTA) which opened during 2006 and $231 thousand of income related to bank owned life insurance (BOLI) offset by minor decreases in commissions from the sale of other banking products. Income produced by VFTA is aggregated into the income generated by our subsidiary banks and is considered an operating entity, but not a separate reporting entity or segment.
2005 Compared to 2004
Noninterest income increased to $15.4 million in 2005, an increase of $899 thousand or 6.2% compared to 2004. Retail banking fees decreased to $7.0 million, a decrease of $568 thousand or 7.6% from 2004. Decreased fees associated with overdraft charges accounted for most of this decrease.
Gains on sales of mortgage loans from mortgage banking activities increased to $3.1 million, an increase of $627 thousand or 25.4%. The Company experienced higher levels of mortgage originations in both purchase money and refinance mortgages during 2005. VFG originated $176.5 million and sold $176.1 million of secondary mortgage loans during 2005, compared to $148.2 million originated and $150.1 million sold in 2004.
Commissions and fees from fiduciary and brokerage activities associated with our trust and wealth management activities increased to $3.7 million for 2005, an increase of $210 thousand or 6.1% over 2004. At December 31, 2005, VFG’s trust affiliate had assets under management and brokerage assets of $511 million, compared to $515 million at December 31, 2004.
The Company realized a gain of $421 thousand during 2005 in conjunction with the sale of two branches located in Tazewell County, Virginia. The Company also realized a gain on sale of securities during 2005 of $296 thousand.
Other operating income amounted to $1.1 million in 2005, essentially flat with 2004.
19
NONINTEREST EXPENSE
The following table presents the components of noninterest expense and the variance or percentage change:
| 2006 vs. 2005 | 2005 vs. 2004 | |||||||||||||||||
In thousands) | 2006 | 2005 | % | 2005 | 2004 | % | ||||||||||||
Compensation and employee benefits | $ | 26,607 | $ | 25,284 | 5.2 | % | $ | 25,284 | $ | 22,669 | 11.5 | % | ||||||
Net occupancy expense | 3,147 | 2,888 | 9.0 | % | 2,888 | 2,721 | 6.1 | % | ||||||||||
Supplies and equipment expenses | 4,141 | 4,056 | 2.1 | % | 4,056 | 4,333 | -6.4 | % | ||||||||||
Amortization—intangible assets | 578 | 643 | -10.1 | % | 643 | 694 | -7.3 | % | ||||||||||
Marketing | 1,214 | 887 | 36.9 | % | 887 | 636 | 39.5 | % | ||||||||||
State franchise taxes | 973 | 870 | 11.8 | % | 870 | 599 | 45.2 | % | ||||||||||
Data processing | 1,389 | 1,389 | 0.0 | % | 1,389 | 1,464 | -5.1 | % | ||||||||||
Professional fees | 823 | 804 | 2.4 | % | 804 | 922 | -12.8 | % | ||||||||||
Telecommunications | 1,006 | 1,017 | -1.1 | % | 1,017 | 1,055 | -3.6 | % | ||||||||||
Other operating expense | 7,040 | 5,864 | 20.1 | % | 5,864 | 5,923 | -1.0 | % | ||||||||||
| $ | 46,918 | $ | 43,702 | 7.4 | % | $ | 43,702 | $ | 41,016 | 6.5 | % | |||||||
Noninterest expenses increased to $46.9 million in 2006, an increase of $3.2 million or 7.4% over 2005. This increase was mainly attributable to the following factors:
| • | Additional operating, compensation and occupancy costs arising from the opening of four additional full-service branches. |
| • | Compensation and benefits associated with merit increases and additional costs associated with employee benefit costs, particularly health and welfare plans. |
| • | Costs associated with marketing and branding initiatives. |
| • | Expenses related to strategic initiatives within our secondary mortgage division. |
| • | Increase in bank franchise taxes associated with increased capital levels coupled with decreased qualifying securities deductions. |
Noninterest expenses increased to $43.7 million in 2005, an increase of $2.7 million or 6.5% over 2004. This increase was mainly attributable to the following factors:
| • | Compensation and benefits associated with merit increases and additional costs associated with employee benefit costs, particularly health and welfare plans. |
| • | Compensation and benefits associated with a $1.7 million increase in incentive accruals. |
| • | Costs associated with marketing and branding initiatives. |
| • | General decreases in operational costs (data processing, professional fees, telecommunications) associated with improved operating efficiency and sale of Tazewell branches. |
| • | Increase in bank franchise taxes associated with increased capital levels coupled with decreased qualifying securities deductions. |
INCOME TAXES
For the year ended December 31, 2006, income taxes were $8.5 million, resulting in an effective tax rate of 30.2% compared to $8.4 million or 31.4% in 2005 and $6.6 million or 30.2% in 2004. The decrease in the effective tax rate for 2006 as compared to 2005 can be attributed to the tax free income generated by the investment in bank owned life insurance and investments in tax credits. The decrease in the effective tax rate for 2005 as compared to 2004 can be attributed to a higher proportion of earnings from tax-exempt assets, such as obligations of states and political subdivisions during those years.
20
ASSET QUALITY
The allowance for loan losses represents an estimate, in management’s judgment, of the amount needed to absorb losses incurred through the reporting date on existing loans in the portfolio. The following table represents VFG’s activity in its allowance for loan losses:
| December 31, | ||||||||||||||||||||
(In thousands) | 2006 | 2005 | 2004 | 2003 | 2002 | |||||||||||||||
Allowance for loan losses, January 1 | $ | 13,581 | $ | 11,706 | $ | 9,743 | $ | 9,180 | $ | 8,266 | ||||||||||
Loans Charged Off: | ||||||||||||||||||||
Real estate—construction | — | — | 48 | — | 6 | |||||||||||||||
Real estate—mortgage | 30 | 55 | 82 | 180 | 200 | |||||||||||||||
Non-farm, Non-residential | — | 38 | 30 | — | — | |||||||||||||||
Commercial, financial and agricultural | 88 | 41 | 124 | 191 | 330 | |||||||||||||||
Consumer loans | 284 | 318 | 518 | 585 | 427 | |||||||||||||||
All other loans | — | — | — | — | — | |||||||||||||||
Total Loans Charged Off | 402 | 452 | 802 | 956 | 963 | |||||||||||||||
Recoveries | ||||||||||||||||||||
Real estate—construction | — | 48 | — | — | — | |||||||||||||||
Real estate—mortgage | 24 | 4 | 4 | 1 | 89 | |||||||||||||||
Non-farm, Non-residential | — | 23 | — | — | — | |||||||||||||||
Commercial, financial and agricultural | 83 | 50 | 83 | 11 | 14 | |||||||||||||||
Consumer loans | 464 | 190 | 144 | 217 | 172 | |||||||||||||||
All other loans | — | — | — | — | — | |||||||||||||||
Total Recoveries | 571 | 315 | 231 | 229 | 275 | |||||||||||||||
Net (Recoveries) Charge-offs | (169 | ) | 137 | 571 | 727 | 688 | ||||||||||||||
Provision for Loan Losses | 750 | 2,012 | 2,534 | 1,290 | 1,602 | |||||||||||||||
Allowance for loan losses, December 31 | $ | 14,500 | $ | 13,581 | $ | 11,706 | $ | 9,743 | $ | 9,180 | ||||||||||
Ratio of allowance for loan losses to total loans outstanding at end of year | 1.19 | % | 1.19 | % | 1.10 | % | 1.06 | % | 1.31 | % | ||||||||||
Ratio of net charge offs (recoveries) to average loans outstanding during the year | (0.01 | )% | 0.01 | % | 0.06 | % | 0.09 | % | 0.10 | % | ||||||||||
The balance of the allowance for loan losses was $14.5 million as of December 31, 2006, compared to $13.6 million and $11.7 million as of December 31, 2005 and 2004, respectively. The allowance for loan losses was 1.19% of outstanding loans as of both December 31, 2006, and 2005 and 1.10% as of December 31, 2004. The allowance as a percentage of loans during 2006 and 2005 remained consistent and increased when compared to 2004 due to the following:
| • | An increase in commercial real estate concentration over the last several years. Including multifamily, nonresidential and junior liens, commercial real estate loans which remained stable in 2006 and grew $85.7 million in 2005, representing growth of and 16.9%. |
| • | A real estate market that remains soft.Commercial real estate activity experienced a significant decline in our markets during the second half of 2006. The number of building permits issued, median home sales prices, new homes in inventory, number of days on market, housing affordability and new mortgage originations indicate that a general cyclical decline in the residential real estate market is occurring as well. |
| • | The growing popularity of non-traditional mortgage products. While the Company’s affiliate banks do not originate non-traditional mortgages within their own portfolios, we do have the risk associated with borrowers who have them. The allowance analysis has considered this and other factors in the determination of soft factors. |
21
Net (recoveries) charge-offs were ($169 thousand) during 2006, compared to $137 thousand during 2005 and $571 thousand during 2004. The percentage of net (recoveries) charge-offs to average loans was (0.01%) for 2006, 0.01% for 2005, and 0.06% for 2004, reflecting a slightly improved level of (recovery) charge-off experience.
The following table summarizes the allocation of the allowance for loan losses by loan type:
| December 31, | ||||||||||||||||||||
(In thousands) | 2006 | 2005 | 2004 | 2003 | 2002 | |||||||||||||||
Allocation of allowance for possible loan losses, end of year | ||||||||||||||||||||
Real estate—construction | $ | 2,426 | $ | 923 | $ | 684 | $ | 567 | $ | 319 | ||||||||||
Real estate—mortgage | 7,519 | 6,498 | 7,702 | 5,425 | 4,759 | |||||||||||||||
Commercial, financial and agricultural | 3,435 | 3,314 | 982 | 408 | 2,603 | |||||||||||||||
Consumer Loans | 595 | 930 | 839 | 639 | 710 | |||||||||||||||
All Other Loans | 17 | 53 | 51 | 50 | 47 | |||||||||||||||
Unallocated | 508 | 1,863 | 1,448 | 2,654 | 742 | |||||||||||||||
Off balance sheet items | — | — | — | — | — | |||||||||||||||
Total allowance for loan losses | $ | 14,500 | $ | 13,581 | $ | 11,706 | $ | 9,743 | $ | 9,180 | ||||||||||
Ratio of loans to total year-end loans | ||||||||||||||||||||
Real estate—construction | 16.30 | % | 10.15 | % | 11.02 | % | 10.22 | % | 8.13 | % | ||||||||||
Real estate—mortgage | 71.82 | % | 79.13 | % | 76.44 | % | 75.63 | % | 73.61 | % | ||||||||||
Commercial, financial and agricultural | 8.61 | % | 6.84 | % | 8.03 | % | 8.24 | % | 9.14 | % | ||||||||||
Consumer Loans | 2.71 | % | 3.58 | % | 4.18 | % | 5.43 | % | 7.80 | % | ||||||||||
All Other Loans | 0.56 | % | 0.31 | % | 0.32 | % | 0.47 | % | 1.32 | % | ||||||||||
| 100.00 | % | 100.00 | % | 100.00 | % | 100.00 | % | 100.00 | % | |||||||||||
The increase in the allocation to the real estate – construction category mirrors the growth noted in this category of the loan portfolio during 2006. It now represents 16.3% of total loans compared to 10.2% of total loans in 2005. The largest allowance allocation is to the real estate-mortgage loan portfolio, which represents approximately 51.9% of the allowance balance at December 31, 2006. The increase in 2004 was primarily the result of commercial real estate loan growth, which normally carries a higher risk rating and allowance allocation than 1-4 family mortgages. The real estate – mortgage category represented 76.4% of total loans outstanding at year end, of which approximately 55% represented a non-homogeneous portfolio consisting of loans collateralized by commercial real estate.
The following table presents information concerning the aggregate amount of non-performing assets:
| December 31, | ||||||||||||||||||||
(In thousands) | 2006 | 2005 | 2004 | 2003 | 2002 | |||||||||||||||
Non-accrual loans | ||||||||||||||||||||
Real Estate Construction | $ | 60 | $ | — | $ | — | $ | 132 | $ | 42 | ||||||||||
Real Estate Mortgage | 1,934 | 1,203 | 2,289 | 2,276 | 853 | |||||||||||||||
Commercial, Financial and Agricultural | 544 | 288 | 59 | 84 | 19 | |||||||||||||||
Consumer Loans | 461 | 113 | 204 | 185 | 26 | |||||||||||||||
Unallocated | — | — | — | — | — | |||||||||||||||
Off balance sheet items | — | — | — | — | — | |||||||||||||||
Troubled debt restructurings | — | 154 | 1,451 | 4,525 | 6,547 | |||||||||||||||
Other property owned | 38 | 75 | 5 | 136 | 577 | |||||||||||||||
Total non-performing assets | $ | 3,037 | $ | 1,833 | $ | 4,008 | $ | 7,338 | $ | 8,064 | ||||||||||
Loans past due 90 days accruing interest | $ | — | $ | — | $ | — | $ | 25 | $ | 104 | ||||||||||
Nonperforming assets to total assets | 0.19 | % | 0.12 | % | 0.28 | % | 0.53 | % | 0.72 | % | ||||||||||
Non-performing assets to year-end loans and other property owned | 0.25 | % | 0.16 | % | 0.38 | % | 0.80 | % | 1.15 | % | ||||||||||
22
If interest on nonaccrual loans and troubled debt restructurings had been accrued, such income would have approximated $181 thousand, $91 thousand $118, $108 thousand and $37 thousand for each of the five years ended December 31, 2006, respectively.
Non-performing assets consist of VFG’s non-accrual loans, troubled-debt restructurings, and other property owned. Loans are generally placed on non-accrual status when the collection of principal and interest is ninety days or more past due, or earlier, if collection is uncertain based on an evaluation of the net realizable value of the collateral and the financial strength of the borrower. For those loans which are carried on non-accrual status, interest is recognized on a cash basis. At December 31, 2006, total non-performing assets totaled $3.0 million, an increase of $1.2 million from 2005. For 2005, total nonperforming assets were $1.8 million, a decrease of $2.2 million from 2004. The increase in 2006 is attributed to sever al small relationships that are well collateralized. The decrease in 2005 is attributable to a reduction in restructured loans of $1.3 million. All remaining restructured loans are performing as agreed and, in the opinion of management, are adequately reserved. Non-accrual loans consist of predominately all single-family mortgage loans that are well collateralized.
FINANCIAL CONDITION
Investment Securities
The following table summarizes the carrying values of investment securities:
(Dollars in thousands) | 2006 | 2005 | 2004 | |||||||||||||||
| Available for Sale | Held to Maturity | Available for Sale | Held to Maturity | Available for Sale | Held to Maturity | |||||||||||||
U. S. Treasury | $ | — | $ | — | $ | 2,505 | $ | — | $ | 7,196 | $ | — | ||||||
U. S. Government agencies | 110,078 | — | 85,017 | — | 116,938 | — | ||||||||||||
State and municipals | 98,135 | 3,328 | 81,836 | 4,287 | 71,816 | 5,849 | ||||||||||||
Corporate bonds | 2,506 | — | 6,062 | — | 9,317 | — | ||||||||||||
Collateralized mortgage obligations | 1,183 | — | 3,270 | — | 4,459 | — | ||||||||||||
Mortgage backed securities | 45,345 | — | 55,821 | — | 68,880 | — | ||||||||||||
Equity securities | 3,511 | — | 1,659 | — | 1,565 | — | ||||||||||||
Other | 55 | — | 575 | — | 836 | — | ||||||||||||
Total investment securities | $ | 260,813 | $ | 3,328 | $ | 236,745 | $ | 4,287 | $ | 281,007 | $ | 5,849 | ||||||
23
The following table shows the maturities of available for sale debt and equity securities at amortized cost and market value as of December 31, 2006 and approximate weighted average yields of such securities. Yields on state and political subdivision securities are shown on a tax equivalent basis, assuming a 35% federal income tax rate. VFG attempts to maintain diversity in its portfolio, maintain durations that are consistent with its asset/liability management and hold a significant allocation of securities in states and political subdivisions that provide tax benefits.
(Dollars in thousands) | Book Value | Market Value | Weighted Average Maturity | Weighted Average TE Yield | |||||||
Federal Agencies | |||||||||||
Within one year | $ | 54,375 | $ | 54,177 | .45 years | 4.67 | % | ||||
After one year to five years | 56,537 | 55,901 | 2.48 years | 4.29 | % | ||||||
Total | 110,912 | 110,078 | 1.49 years | 4.48 | % | ||||||
Collateralized Mortgage Obligations | |||||||||||
After ten years | $ | 1,210 | $ | 1,183 | 23.32 years | 3.98 | % | ||||
Total | 1,210 | 1,183 | 23.32 years | 3.98 | % | ||||||
Mortgage Backed Securities | |||||||||||
After one year to five years | $ | 9,003 | $ | 8,791 | 3.35 years | 4.09 | % | ||||
After five years to ten years | 32,121 | 31,241 | 6.80 years | 4.16 | % | ||||||
After ten years | 5,283 | 5,313 | 19.92 years | 5.64 | % | ||||||
Total | 46,407 | 45,345 | 7.62 years | 4.32 | % | ||||||
State and Municipals | |||||||||||
Within one year | $ | 3,315 | $ | 3,310 | .52 years | 5.57 | % | ||||
After one year to five years | 39,651 | 39,950 | 3.26 years | 6.01 | % | ||||||
After five years to ten years | 42,249 | 42,361 | 7.31 years | 5.68 | % | ||||||
After ten years | 12,190 | 12,514 | 12.48 years | 6.54 | % | ||||||
Total | 97,405 | 98,135 | 6.08 years | 5.92 | % | ||||||
Corporate Bonds | |||||||||||
Within one year | $ | 1,003 | $ | 1,004 | .29 years | 6.16 | % | ||||
After one year to five years | 1,500 | 1,502 | 2.07 years | 5.27 | % | ||||||
Total | 2,503 | 2,506 | 1.36 years | 5.62 | % | ||||||
Total Fixed Income Securities | |||||||||||
Within one year | $ | 58,693 | $ | 58,491 | .46 years | 4.75 | % | ||||
After one year to five years | 106,691 | 106,144 | 2.84 years | 4.93 | % | ||||||
After five years to ten years | 74,370 | 73,602 | 7.09 years | 5.02 | % | ||||||
After ten years | 18,683 | 19,010 | 15.28 years | 6.12 | % | ||||||
Total | 258,437 | 257,247 | 4.42 years | 5.00 | % | ||||||
Equity Securities | 2,929 | 3,511 | |||||||||
Other Securities | 55 | 55 | |||||||||
Total Securities | $ | 261,421 | $ | 260,813 | |||||||
There is no issuer of securities in which the aggregate book value of that issuer, other than securities of the U.S. Treasury and U.S. Government agencies, exceeds 10% of stockholders’ equity.
Loan Portfolio
At December 31, 2006, loans, net of unearned income and the allowance for loan losses, totaled $1.20 billion, an increase of $73.6 million or 6.5% from $1.13 billion in 2005. The commercial real estate portfolio, which is a component of the real estate – mortgage portfolio, amounted to $577.2 million at December 31, 2006 and represents 47.4% of the total portfolio. At December 31, 2006, off balance sheet unused loan commitments and standby letters of credit amounted to $386.2 million, compared to $413.9 million at December 31, 2005. These commitments may be secured or unsecured. On December 31, 2006, VFG had no concentration of loans to any one industry in excess of 10% of its loan portfolio.
24
The following table summarizes the loan receivable portfolio by loan type:
| December 31, | ||||||||||||||||||||
(In thousands) | 2006 | 2005 | 2004 | 2003 | 2002 | |||||||||||||||
Real estate—construction | $ | 198,400 | $ | 115,944 | $ | 116,888 | $ | 94,372 | $ | 57,032 | ||||||||||
Real estate—mortgage | 873,911 | 904,115 | 811,197 | 698,107 | 516,512 | |||||||||||||||
Commercial, financial and agricultural | 104,709 | 78,110 | 85,256 | 76,075 | 64,146 | |||||||||||||||
Consumer loans | 33,030 | 40,876 | 44,379 | 50,163 | 54,738 | |||||||||||||||
All other loans | 6,768 | 3,486 | 3,448 | 4,353 | 9,233 | |||||||||||||||
Total loans before deduction of unearned income | 1,216,818 | 1,142,531 | 1,061,168 | 923,070 | 701,661 | |||||||||||||||
Plus: Deferred Costs (Fees) | 814 | 545 | 407 | (381 | ) | (682 | ) | |||||||||||||
Total loans before allowance for loan losses | 1,217,632 | 1,143,076 | 1,061,575 | 922,689 | 700,979 | |||||||||||||||
Less: allowance for loan losses | (14,500 | ) | (13,581 | ) | (11,706 | ) | (9,743 | ) | (9,180 | ) | ||||||||||
Net loans | $ | 1,203,132 | $ | 1,129,495 | $ | 1,049,869 | $ | 912,946 | $ | 691,799 | ||||||||||
The following tables set forth the contractual maturity of the loan portfolio as of December 31, 2006:
(In thousands) | One year or less | After one but less than five years | After five years | Total | ||||||||
Real estate—construction | $ | 124,549 | $ | 50,151 | $ | 23,700 | $ | 198,400 | ||||
Real estate—mortgage | 113,419 | 176,979 | 583,513 | 873,911 | ||||||||
Commercial, financial and agricultural | 59,075 | 30,128 | 15,506 | 104,709 | ||||||||
Consumer loans | 5,458 | 19,963 | 7,609 | 33,030 | ||||||||
All other loans | 152 | 381 | 6,235 | 6,768 | ||||||||
Total loans (1) | $ | 302,653 | $ | 277,602 | $ | 636,563 | $ | 1,216,818 | ||||
(1) Excluding loans held for sale and before deduction of unearned income. | ||||||||||||
For maturities over one year: | ||||||||||||
Fixed rates | $ | 256,714 | $ | 283,586 | $ | 540,300 | ||||||
Variable rates | 20,888 | 352,977 | 373,865 | |||||||||
Total | $ | 277,602 | $ | 636,563 | $ | 914,165 | ||||||
Deposits
Deposits at December 31, 2006 amounted to $1.32 billion, an increase of $62.8 million or 5.0% from $1.26 billion in 2005. For 2006, demand and savings deposits decreased by $31.2 million, and time deposits increased $94.0 million, with $12.8 million of the increase coming from brokered CD deposits. For 2005, demand and savings deposits decreased by $22.8 million, while time deposits increased $21.2 million. The overall cost of deposit funds increased to 2.76% in 2006, compared to 2.03% in 2005 and 1.78% in 2004, reflecting higher rate environments in both 2006 and 2005.
25
The following table illustrates average outstanding deposits and rates paid:
| 2006 | 2005 | 2004 | ||||||||||||||||
(In thousands) | Amount | Rate | Amount | Rate | Amount | Rate | ||||||||||||
Noninterest bearing demand deposits | $ | 239,332 | — | $ | 249,938 | — | $ | 224,877 | — | |||||||||
Interest-bearing deposits: | ||||||||||||||||||
Interest checking | 170,204 | 0.45 | % | 192,987 | 0.42 | % | 195,131 | 0.49 | % | |||||||||
Money market | 170,892 | 2.19 | % | 176,606 | 1.32 | % | 176,386 | 0.94 | % | |||||||||
Savings | 108,659 | 0.79 | % | 131,420 | 0.67 | % | 140,925 | 0.67 | % | |||||||||
Time deposits: | ||||||||||||||||||
Less than $100,000 | 393,897 | 3.83 | % | 364,645 | 3.15 | % | 370,746 | 2.76 | % | |||||||||
$100,000 and more | 189,353 | 4.25 | % | 137,197 | 3.59 | % | 121,135 | 3.37 | % | |||||||||
Total interest-bearing deposits | 1,033,005 | 2.76 | % | 1,002,855 | 2.03 | % | 1,004,323 | 1.78 | % | |||||||||
Total average deposits | $ | 1,272,337 | $ | 1,252,793 | $ | 1,229,200 | ||||||||||||
Maturities of time deposits of $100,000 and over:
(In thousands) | |||
At December 31, 2006 | |||
Within three months | $ | 31,184 | |
Three to six months | 36,277 | ||
Six to twelve months | 87,539 | ||
Over twelve months | 49,580 | ||
| $ | 204,580 | ||
Borrowings
In 2006 the Company concentrated on promoting the commercial paper product to large commercial customers and consequently reduced securities sold under agreements to repurchase by $15.9 million from December 31, 2005, to December 31, 2006. The increase in commercial paper of $34.2 million or 139.5%, during 2006 not only eliminated the reliance on securities sold under agreements to repurchase, but in combination with a $25 million net increase in Federal Home Loan Bank borrowings, also provided a funding source for balance sheet growth throughout the current year.
The following table shows certain information regarding the Company’s commercial paper:
| At or for the year ending December 31, | ||||||||
| 2006 | 2005 | |||||||
Commercial paper: | ||||||||
Average balance outstanding | $ | 50,530 | $ | 7,724 | ||||
Maximum amount outstanding at any month-end during the period | 68,784 | 24,480 | ||||||
Balance outstanding at end of period | 58,632 | 24,480 | ||||||
Average interest rate during the period | 4.50 | % | 3.30 | % | ||||
Weighted average interest rate at end of period | 4.82 | % | 3.39 | % | ||||
26
Capital Adequacy
The management of capital in a regulated financial services industry must properly balance return on equity to stockholders while maintaining sufficient capital levels and related risk-based capital ratios to satisfy regulatory requirements. Additionally, capital management must also consider acquisition opportunities that may exist, and the resulting accounting treatment. VFG’s capital management strategies have been developed to provide attractive rates of returns to stockholders, while maintaining its “well-capitalized” position at each of the banking subsidiaries.
The primary source of additional capital to VFG is earnings retention, which represents net income less dividends declared. During 2006 VFG retained $12.9 million, or 66.0% of its net income. Stockholders’ equity increased by $14.5 million, reflecting comprehensive income of $1.3 million related primarily to unrealized gains on securities available-for-sale during the period.
VFG and its banking affiliates are subject to various regulatory capital requirements administered by the federal banking agencies. Failure to meet minimum capital requirements can initiate certain mandatory and possibly additional discretionary actions by regulators that, if undertaken, could have a direct material effect on VFG and the affiliate banks’ financial statements. Under capital adequacy guidelines and the regulatory framework for prompt corrective action under FDICIA, VFG and its banking affiliates must meet specific capital guidelines that involve quantitative measures of their assets, liabilities and certain off-balance sheet items as calculated under regulatory accounting practices. The capital amounts and reclassifications are also subject to qualitative judgments by the regulators about components, risk weightings, and other factors.
Quantitative measures established by regulation to ensure capital adequacy require VFG and its banking affiliates to maintain minimum amounts and ratios of total and Tier 1 capital to average assets. As of December 31, 2006, and 2005 VFG and the subsidiary banks met all minimum capital adequacy requirements to which they are subject and are categorized as “well capitalized.” There are no conditions or events since the notification that management believes have changed the subsidiary banks’ category.
LIQUIDITY
Liquidity is identified as the ability to generate or acquire sufficient amounts of cash when needed and at a reasonable cost to accommodate withdrawals, payments of debt, and increased loan demand. These events may occur daily or at other short-term intervals in the normal operation of the business. Experience helps management predict time cycles in the amount of cash required. In assessing liquidity, management gives consideration to relevant factors including stability of deposits, quality of assets, economic conditions in the market served, concentrations of business and industry, competition, and VFG’s overall financial condition. VFG’s bank affiliates have available a combined $247 million line of credit with the Federal Home Loan Bank of Atlanta, unused lines of credit totaling $92.4 million with nonaffiliated banks and access to the Federal Reserve discount window to support liquidity as conditions dictate.
The liquidity of the parent Company also represents an important aspect of liquidity management. The parent Company’s cash outflows consist of overhead associated with corporate expenses, executive management, finance, marketing, loan and deposit operations, information technology, human resources, audit, compliance and credit administration functions. It also includes outflows associated with dividends to shareholders. The main sources of funding for the parent Company are the management fees and dividends it receives from its banking and trust subsidiaries, nonrated commercial paper issued by the Company, a working line of credit with a correspondent bank, and availability of the trust preferred security market as deemed necessary. During 2006, the banking subsidiaries and the non-bank subsidiary paid $13.0 million in management fees and transferred $12.5 million dividends to VFG. As of January 1, 2007, the aggregate amount of additional unrestricted funds, which could be transferred from the banking subsidiaries to the VFG without prior regulatory approval totaled $42.1 million or 27.9% of the consolidated net assets. The parent Company generated approximately $8.5 million in cash flow from operating activities in 2006. It paid dividends to stockholders of $6.6 million, invested $600 thousand in fixed assets and borrowed $34.2 million under its commercial paper program which it invested in short term investment instruments.
27
Contractual Obligations
The impact of our contractual obligations as of December 31, 2006 on liquidity and cash flow in future periods is as follows:
Contractual Obligations | Total | Payments Due by Period | |||||||||||||
(In thousands) | One year or less | 1-3 years | 3-5 years | More than 5 years | |||||||||||
Certificates of Deposit | $ | 614,796 | $ | 428,845 | $ | 143,791 | $ | 42,122 | $ | 38 | |||||
Subordinated Debt | 20,619 | — | — | — | 20,619 | ||||||||||
FHLB Borrowings | 65,000 | 10,000 | 25,000 | �� | 10,000 | 20,000 | |||||||||
Operating Leases | 3,407 | 606 | 880 | 371 | 1,550 | ||||||||||
Total | $ | 703,822 | $ | 439,451 | $ | 169,671 | $ | 52,493 | $ | 42,207 | |||||
Other Commitments | Total | Commitment Expiration by Period | |||||||||||||
(In thousands) | One year or less | 1-3 years | 3-5 years | More than 5 years | |||||||||||
Commitments to extend credit | $ | 370,575 | $ | 227,321 | $ | 35,671 | $ | 12,135 | $ | 95,448 | |||||
Standby letters of credit | 15,635 | 12,906 | 2,729 | — | — | ||||||||||
Mortgage loans sold with potential recourse | 50,648 | 50,648 | — | — | — | ||||||||||
| $ | 436,858 | $ | 290,875 | $ | 38,400 | $ | 12,135 | $ | 95,448 | ||||||
In the judgment of management, VFG maintains the ability to generate sufficient amounts of cash to cover normal requirements and any additional needs which may arise, within realistic limitations.
Off-Balance Sheet Arrangements
As of December 31, 2006, the Company has not participated in any material unconsolidated entities or financial partnerships, such as entities often referred to as structured finance or special purpose entities. VFG does have significant commitments to fund loans in the ordinary course of business.
At December 31, 2006 and 2005 the following financial instruments were outstanding whose contract amounts represent credit risk:
| 2006 | 2005 | |||||
Commitments to extend credit | $ | 370,575 | $ | 397,341 | ||
Standby letters of credit | 15,634 | 16,602 | ||||
Mortgage loans sold with potential recourse | 50,648 | 53,776 | ||||
Commitments to extend credit are agreements to lend to a customer as long as there is no violation of any condition established in the contract. Commitments generally have fixed expiration dates or other termination clauses and may require payment of a fee. The commitments for equity lines of credit may expire without being drawn upon. Therefore, the total commitment amounts do not necessarily represent future cash requirements. The amount of collateral obtained, if it is deemed necessary by the Company, is based on management’s credit evaluation of the customer.
Unfunded commitments under commercial lines of credit, revolving credit lines and overdraft protection agreements are commitments for possible future extensions of credit to existing customers. These lines of credit are usually uncollateralized and do not always contain a specified maturity date and may not be drawn upon to the total extent to which the Company is committed.
28
Standby letters of credit are conditional commitments issued by the Company to guarantee the performance of a customer to a third party. The credit risk involved in issuing letters of credit is essentially the same as that involved in extending loan facilities to customers. The Company generally holds collateral supporting those commitments, if deemed necessary. The Company, through its banking subsidiaries, originates loans for sale to secondary market investors subject to contractually specified and limited recourse provisions. In 2006, the Company originated $134 million and sold $139 million to investors, compared to $177 million originated and $176 million sold in 2005. Most contracts with investors contain certain recourse language which may vary from 90 days up to twelve months. The Company may have an obligation to repurchase a loan if the mortgagor has defaulted early in the loan term. Mortgages subject to recourse are collateralized by single family residences, have loan-to-value ratios of 80% or less, or have private mortgage insurance or are insured or guaranteed by an agency of the United States government. At December 31, 2006, the Company had locked-rate commitments to originate mortgage loans amounting to approximately $10.8 million and loans held for sale of $7.6 million. The Company has entered into commitments, on a best-effort basis to sell loans of approximately $18.4 million. Risks arise from the possible inability of counterparties to meet the terms of their contracts. The Company does not expect any counterparty to fail to meet its obligations.
RECENT ACCOUNTING PRONOUNCEMENTS
In February 2006, FASB Issued Statement No. 155 (SFAS 155), “Accounting for Certain Hybrid Financial Instruments” which is effective for fiscal years beginning after September 15, 2006. This Statement amends FASB Statements No. 133, Accounting for Derivative Instruments and Hedging Activities, and No. 140, Accounting for Transfers and Servicing of Financial Assets and Extinguishments of Liabilities. This Statement resolves issues addressed in Statement 133 Implementation Issue No. D1, “Application of Statement 133 to Beneficial Interests in Securitized Financial Assets.”
The Company does not expect the adoption of Statement 155 at the beginning of 2007 to have a material impact on the consolidated financial statements.
In March 2006, the Financial Accounting Standards Board issued Statement of Financial Accounting Standard No. 156, “Accounting for Servicing of Financial Assets an amendment of FASB Statement 140” (Statement 156). Statement 156 amends Statement 140 with respect to separately recognized servicing assets and liabilities. Statement 156 requires an entity to recognize a servicing asset or liability each time it undertakes an obligation to service a financial asset by entering into a servicing contract and requires all servicing assets and liabilities to be initially measured at fair value, if practicable. Statement 156 also permits entities to subsequently measure servicing assets and liabilities using an amortization method or fair value measurement method. Under the amortization method, servicing assets and liabilities are amortized in proportion to and over the estimated period of servicing. Under the fair value measurement method, servicing assets are measured at fair value at each reporting date and changes in fair value are reported in net income for the period the change occurs.
Adoption of Statement 156 is required as of the beginning of fiscal years beginning subsequent to September 15, 2006. Earlier adoption is permitted as of the beginning of an entity’s fiscal year, provided the entity has not yet issued financial statements, including interim financial statements. The Company does not expect the adoption of Statement 156 at the beginning of 2007 to have a material impact on the consolidated financial statements.
In June 2006, the Financial Accounting Standards Board issued FASB Interpretation No. 48 “Accounting for Uncertainty in Income Taxes an interpretation of FASB Statement No. 109 (as amended)” (FIN 48). FIN 48 clarifies the accounting for uncertainty in income taxes recognized in an enterprise’s financial statements in accordance with FASB Statement No. 109, “Accounting for Income Taxes”. The Interpretation prescribes a recognition threshold and measurement attribute for the financial statement recognition and measurement of a tax position taken or expected to be taken in a tax return. FIN 48 also provides guidance on derecognition, classification, interest and penalties, accounting in interim periods, disclosure, and transition.
Because the Company is not aware of any material uncertain tax positions, it does not expect the adoption of FIN 48 to have a material impact on the consolidated financial statements.
29
In September 2006, FASB Issued Statement No. 157 (SFAS 157), “Fair Value Measurements” which is effective for fiscal years beginning after November 15, 2007 and for interim periods within those years. This statement defines fair value, establishes a framework for measuring fair value and expands the related disclosure requirements. The adoption of SFAS 157 is not expected to have a material impact on the Company’s consolidated financial statements.
In September 2006, the Securities and Exchange Commission issued Staff Accounting Bulletin No. 108 (SAB 108), which provides guidance on the consideration of the effects of prior year misstatements in quantifying current year misstatements for the purpose of a materiality assessment. The techniques most commonly used in practice to accumulate and quantify misstatements are generally referred to as the “rollover” and “iron curtain” approaches.
Because the Company is not aware of any material misstatement, it does not expect the adoption of SAB 108 to have a material impact on the consolidated financial statements.
| Item 7A. | QUANTITATIVE AND QUALITATIVE DISCLOSURE ABOUT MARKET RISK |
INTEREST RATE SENSITIVITY
Financial institutions can be exposed to several market risks that may impact the value or future earnings capacity of an organization. These risks involve interest rate risk, foreign currency exchange risk, commodity price risk and equity market price risk. VFG’s primary market risk is interest rate risk. Interest rate risk is inherent because as a financial institution, VFG derives a significant amount of its operating revenue from “purchasing” funds (customer deposits and borrowings) at various terms and rates. These funds are then invested into earning assets (loans, investments, etc.) at various terms and rates. This risk is further discussed below.
Equity market risk is not a significant risk to VFG as equity investments on a cost basis comprise less than 1% of corporate assets. VFG does not have any exposure to foreign currency exchange risk or commodity price risk.
Interest rate risk is the exposure to fluctuations in VFG’s future earnings (earnings at risk) and value (economic value at risk) resulting from changes in interest rates. This exposure results from differences between the amounts of interest earning assets and interest bearing liabilities that reprice within a specified time period as a result of scheduled maturities and repayment and contractual interest rate changes.
The primary objective of VFG’s asset/liability management process is to maximize current and future net interest income within acceptable levels of interest rate risk while satisfying liquidity and capital requirements. Management recognizes that a certain amount of interest rate risk is inherent and appropriate. Thus the goal of interest rate risk management is to maintain a balance between risk and reward such that net interest income is maximized while risk is maintained at a level tolerable to the board of directors.
The Company assumes interest rate risk (the risk that general interest rate levels will change) as a result of its normal operations. As a result, the fair values of the Company’s financial instruments will change when interest rate levels change and that change may be either favorable or unfavorable to the Company. Management attempts to match maturities of assets and liabilities to the extent believed necessary to minimize interest rate risk. However, borrowers with fixed rate obligations are less likely to prepay in a rising rate environment and more likely to prepay in a falling rate environment. Conversely, depositors who are receiving fixed rates are more likely to withdraw funds before maturity in a rising rate environment and less likely to do so in a falling rate environment. Management monitors rates and maturities of assets and liabilities and attempts to minimize interest rate risk by adjusting terms of new loans and deposits and by investing in securities with terms that mitigate the Company’s overall interest rate risk.
The Company enters into commitments to originate loans whereby the interest rate on the loan is determined prior to funding (rate lock commitments). Rate lock commitments on mortgage loans that are intended to be sold are considered to be derivatives. Time elapsing between issuance of a loan commitment and closing and sale of the loan generally ranges from 30 to 120 days. The Company protects itself from changes in interest rates through the use of best efforts forward delivery contracts, whereby the Company commits to sell a loan at the time the borrower commits to an interest rate with the intent that the buyer has assumed interest rate risk on the loan. As a result, the Company is not exposed to losses nor will it realize significant gains related to its rate lock commitments due to changes in interest rates.
30
Management endeavors to control the exposures to changes in interest rates by understanding, reviewing and making decisions based on its risk position. The corporate asset/liability committee is responsible for these decisions. VFG primarily uses the securities portfolios and FHLB advances to manage its interest rate risk position. Additionally, pricing, promotion and product development activities are directed in an effort to emphasize the loan and deposit term or repricing characteristics that best meet current interest rate risk objectives. At present, VFG does not use off-balance sheet instruments to hedge against interest rate risk. The committee operates under management policies defining guidelines and limits on the level of risk. These policies are approved by the Boards of Directors of the Company and bank subsidiaries. VFG uses simulation analysis to assess earnings at risk and Economic Value of Equity analysis to assess value at risk. These methods allow management to regularly monitor both the direction and magnitude of VFG’s interest rate risk exposure. These modeling techniques involve assumptions and estimates that inherently cannot be measured with complete precision. Key assumptions in the analyses include maturity and repricing characteristics of both assets and liabilities, prepayments on amortizing assets, other imbedded options, non-maturity deposit sensitivity and loan and deposit pricing. These assumptions are inherently uncertain due to the timing, magnitude and frequency of rate changes and changes in market conditions and management strategies, among other factors. However, the analyses are useful in quantifying risk and provide a relative gauge of VFG’s interest rate risk position over time.
Earnings at Risk
Simulation analysis evaluates the effect of upward and downward changes in market interest rates on future net interest income. The analysis involves changing the interest rates used in determining net interest income over the next twelve months. The resulting percentage change in net interest income in various rate scenarios is an indication of VFG’s shorter-term interest rate risk. The analysis utilizes a “static” balance sheet approach. The measurement date balance sheet composition (or mix) is maintained over the simulation time period with maturing and repayment dollars being rolled back into like instruments for new terms at current market rates. Additional assumptions are applied to modify volumes and pricing under the various rate scenarios. These include prepayment assumptions on mortgage assets, the sensitivity of non-maturity deposit rates, and other factors deemed significant.
The simulation analysis results are presented in the table below. These results, as of December 31, 2006, indicate that VFG would expect net interest income to decrease over the next twelve months by 1.1% assuming an immediate upward shift in market interest rates of 200 basis points and to decrease by 3.8% if rates shifted downward in the same manner. This profile reflects a moderate interest rate risk position and is well within the guidelines set by policy.
1-Year Net Interest Income Simulation (In Thousands) | |||||||
-200 bp shock | $ | (2,168 | ) | -3.76 | % | ||
+200 bp shock | $ | (606 | ) | -1.05 | % |
Economic Value of Equity
The Economic Value of Equity (EVE) analysis provides information on the risk inherent in the balance sheet that might not be taken into account in the simulation analysis due to the shorter time horizon used in that analysis. The EVE of the balance sheet is defined as the discounted present value of expected asset cash flows minus the discounted present value of expected liability cash flows. The analysis involves changing the interest rates used in determining the expected cash flows and in discounting the cash flows. The resulting percentage change in EVE in various rate scenarios is an indication of the longer term repricing risk and options embedded in the balance sheet.
The EVE analysis results are presented in the table below. These results as of December 31, 2006 indicate that the EVE would increase 0.6% assuming an immediate upward shift in market interest rates of 200 basis points and decrease 8.0% if rates shifted downward in the same manner. The risk position of VFG is within the guidelines set by policy.
Static Economic Value of Equity Change (In Thousands) | |||||||
-200 bp shock | $ | (17,565 | ) | -8.02 | % | ||
+200 bp shock | $ | 1,362 | 0.62 | % |
31


REPORT OF INDEPENDENT REGISTERED PUBLIC ACCOUNTING FIRM
The Shareholders and Directors of
Virginia Financial Group, Inc. and subsidiaries
We have audited the accompanying consolidated balance sheet of Virginia Financial Group, Inc. (a Virginia Corporation) and subsidiaries as of December 31, 2006 and the related consolidated statements of income, changes in stockholders’ equity and comprehensive income, and cash flows for the year ended December 31, 2006. These financial statements are the responsibility of the Company’s management. Our responsibility is to express an opinion on these financial statements based on our audit.
We conducted our audit in accordance with the standards of the Public Company Accounting Oversight Board (United States). Those standards require that we plan and perform the audit to obtain reasonable assurance about whether the financial statements are free of material misstatement. An audit includes examining, on a test basis, evidence supporting the amounts and disclosures in the financial statements. An audit also includes assessing the accounting principles used and significant estimates made by management, as well as evaluating the overall financial statement presentation. We believe that our audit provides a reasonable basis for our opinion.
In our opinion, the consolidated financial statements referred to above present fairly, in all material respects, the financial position of Virginia Financial Group at December 31, 2006 and the results of its operations and its cash flows for the year ended December 31, 2006, in conformity with accounting principles generally accepted in the United States of America.
As discussed in Note 13, to the financial statements, the Company adopted Financial Accounting Standards Board Statement No. 123(R) on January 1, 2006,Share-Based Payments(SFAS 123R) in 2006. Also, as discussed in Note 14, to the consolidated financial statements, the Company adopted Financial Accounting Standards Board Statement No. 158,Employer’s Accounting for Defined Benefit Pension and Other Postretirement Plans, An amendment of FASB Statements No. 87, 88, 106 and 132(R)at December 31, 2006.
We have also audited, in accordance with the standards of the Public Company Accounting Oversight Board (United States), the effectiveness of Virginia Financial Group’s internal control over financial reporting as of December 31, 2006, based on criteria established inInternal Control—Integrated Frameworkissued by the Committee of Sponsoring Organizations of the Treadway Commission (COSO), and our report dated March 2, 2007 expressed an unqualified opinion on management’s assessment of the effectiveness of the Company’s internal control over financial reporting and an unqualified opinion on the effectiveness of the Company’s internal control over financial reporting.

GRANT THORNTON LLP
Raleigh, North Carolina
March 2, 2007

To the Shareholders and Directors
Virginia Financial Group, Inc. and Affiliates
Culpeper, Virginia
We have audited the accompanying consolidated balance sheets of Virginia Financial Group, Inc. and subsidiaries as of December 31, 2005 and 2004, and the related consolidated statements of income, changes in stockholders’ equity, and cash flows for each of the years in the three-year period ended December 31, 2005. We also have audited management’s assessment, included in the accompanying Management’s Report on Internal Control Over Financial Reporting appearing under Item 9A, that Virginia Financial Group, Inc. and subsidiaries maintained effective internal control over financial reporting as of December 31, 2005, based on criteria established inInternal Control— Integrated Framework issued by the Committee of Sponsoring Organizations of the Treadway Commission (COSO). Virginia Financial Group, Inc. and subsidiaries’ management is responsible for these financial statements, for maintaining effective internal control over financial reporting, and for its assessment of the effectiveness of internal control over financial reporting. Our responsibility is to express an opinion on these financial statements, an opinion on management’s assessment, and an opinion on the effectiveness of Virginia Financial Group, Inc. and subsidiaries’ internal control over financial reporting based on our audits.
We conducted our audits in accordance with the standards of the Public Company Accounting Oversight Board (United States). Those standards require that we plan and perform the audits to obtain reasonable assurance about whether the financial statements are free of material misstatement and whether effective internal control over financial reporting was maintained in all material respects. Our audit of financial statements included examining, on a test basis, evidence supporting the amounts and disclosures in the financial statements, assessing the accounting principles used and significant estimates made by management, and evaluating the overall financial statement presentation. Our audit of internal control over financial reporting included obtaining an understanding of internal control over financial reporting, evaluating management’s assessment, testing and evaluating the design and operating effectiveness of internal control, and performing such other procedures as we considered necessary in the circumstances. We believe that our audits provide a reasonable basis for our opinions.
A company’s internal control over financial reporting is a process designed to provide reasonable assurance regarding the reliability of financial reporting and the preparation of financial statements for external purposes in accordance with generally accepted accounting principles. A company’s internal control over financial reporting includes those policies and procedures that (1) pertain to the maintenance of records that, in reasonable detail, accurately and fairly reflect the transactions and dispositions of the assets of the company; (2) provide reasonable assurance that transactions are recorded as necessary to permit preparation of financial statements in accordance with generally accepted accounting principles, and that receipts and expenditures of the company are being made only in accordance with authorizations of management and directors of the company; and (3) provide reasonable assurance regarding prevention or timely detection of unauthorized acquisition, use, or disposition of the company’s assets that could have a material effect on the financial statements.
Because of its inherent limitations, internal control over financial reporting may not prevent or detect misstatements. Also, projections of any evaluation of effectiveness to future periods are subject to the risk that controls may become inadequate because of changes in conditions, or that the degree of compliance with the policies or procedures may deteriorate.
In our opinion, the consolidated financial statements referred to above present fairly, in all material respects, the financial position of Virginia Financial Group, Inc. and subsidiaries as of December 31, 2005 and 2004, and the results of their operations and their cash flows for each of the years in the three-year period ended December 31, 2005 in conformity with accounting principles generally accepted in the United States of America. Also in our opinion, management’s assessment that Virginia Financial Group, Inc. and subsidiaries maintained effective internal control over financial reporting as of December 31, 2005, is fairly stated, in all material respects, based on criteria established inInternal Control—Integrated Framework issued by the Committee of Sponsoring Organizations of the Treadway Commission (COSO). Furthermore, in our opinion, Virginia Financial Group, Inc. and subsidiaries maintained, in all material respects, effective internal control over financial reporting as of December 31, 2005, based on criteria established inInternal Control—Integrated Framework issued by the Committee of Sponsoring Organizations of the Treadway Commission (COSO).

Yount, Hyde & Barbour, P.C.
Winchester, Virginia
February 16, 2006
33
VIRGINIA FINANCIAL GROUP, INC. AND SUBSIDIARIES
Consolidated Balance Sheets
December 31, 2006 and 2005
(Dollars in Thousands)
| 2006 | 2005 | |||||||
Assets | ||||||||
Cash and due from banks | $ | 48,747 | $ | 33,681 | ||||
Federal funds sold | 8,590 | 9,103 | ||||||
Interest-bearing deposits in banks | 298 | 5,232 | ||||||
Cash and cash equivalents | 57,635 | 48,016 | ||||||
Investment securities (fair value: 2006, $264,152; 2005, $ 241,139) | 264,141 | 241,032 | ||||||
Mortgage loans held for sale | 7,640 | 9,223 | ||||||
Loans receivable, net of allowance for loan losses, 2006, $14,500; 2005, $ 13,581) | 1,203,132 | 1,129,495 | ||||||
Premises and equipment, net | 35,853 | 33,675 | ||||||
Accrued interest receivable | 8,197 | 6,583 | ||||||
Deferred income tax asset | 5,446 | 5,944 | ||||||
Core deposit intangibles, net | 3,871 | 4,449 | ||||||
Goodwill | 13,896 | 13,896 | ||||||
Bank owned life insurance | 10,231 | — | ||||||
Other assets | 15,947 | 12,871 | ||||||
Total assets | $ | 1,625,989 | $ | 1,505,184 | ||||
Liabilities | ||||||||
Deposits: | ||||||||
Noninterest-bearing | $ | 239,672 | $ | 249,775 | ||||
Interest-bearing | 1,078,609 | 1,005,734 | ||||||
Total deposits | 1,318,281 | 1,255,509 | ||||||
Federal funds purchased and securities sold under agreements to repurchase | — | 15,890 | ||||||
Federal Home Loan Bank advances | 65,000 | 40,000 | ||||||
Subordinated debt | 20,619 | 20,619 | ||||||
Commercial paper | 58,632 | 24,480 | ||||||
Other borrowings | 561 | 842 | ||||||
Accrued interest payable | 4,274 | 2,515 | ||||||
Other liabilities | 7,970 | 9,224 | ||||||
Total liabilities | 1,475,337 | 1,369,079 | ||||||
Stockholders' Equity | ||||||||
Preferred stock; no par value; 5,000,000 shares authorized; no shares issued and outstanding; | — | — | ||||||
Common stock; $ 1 par value; 25,000,000 shares authorized; 2006: 10,784,303 shares issued and outstanding; 2005: 10,759,101 shares issued and outstanding; | 10,784 | 10,759 | ||||||
Additional paid-in capital | 33,970 | 33,298 | ||||||
Retained earnings | 106,924 | 94,061 | ||||||
Accumulated other comprehensive loss, net | (1,026 | ) | (2,013 | ) | ||||
Total stockholders' equity | 150,652 | 136,105 | ||||||
Total liabilities and stockholders' equity | $ | 1,625,989 | $ | 1,505,184 | ||||
The accompanying notes are an integral part of these consolidated financial statements.
34
VIRGINIA FINANCIAL GROUP, INC. AND SUBSIDIARIES
Consolidated Statements of Income
For the Three Years Ended December 31, 2006
(Dollars in Thousands, except per share data)
| 2006 | 2005 | 2004 | ||||||||||
Interest Income | ||||||||||||
Loans, including fees | $ | 84,003 | $ | 70,712 | $ | 58,232 | ||||||
Federal funds sold and deposits in other banks | 1,004 | 505 | 156 | |||||||||
Investment securities | ||||||||||||
Taxable | 6,724 | 6,447 | 8,770 | |||||||||
Tax-exempt | 3,410 | 2,645 | 2,854 | |||||||||
Dividends | 486 | 397 | 390 | |||||||||
Total interest income | 95,627 | 80,706 | 70,402 | |||||||||
Interest Expense | ||||||||||||
Deposits | 28,496 | 20,408 | 17,859 | |||||||||
Federal funds repurchased and securities sold under agreements to repurchase | 219 | 568 | 238 | |||||||||
Federal Home Loan Bank advances | 2,834 | 1,351 | 801 | |||||||||
Subordinated debt | 1,636 | 1,260 | 683 | |||||||||
Commerical paper | 2,275 | 255 | — | |||||||||
Other borrowings | 22 | 19 | 47 | |||||||||
Total interest expense | 35,482 | 23,861 | 19,628 | |||||||||
Net interest income | 60,145 | 56,845 | 50,774 | |||||||||
Provision for loan losses | 750 | 2,012 | 2,534 | |||||||||
Net interest income after provision for loan losses | 59,395 | 54,833 | 48,240 | |||||||||
Noninterest Income | ||||||||||||
Retail banking fees | 6,982 | 6,954 | 7,522 | |||||||||
Commissions and fees from fiduciary activities | 3,108 | 2,954 | 2,804 | |||||||||
Brokerage fee income | 756 | 723 | 663 | |||||||||
Gains (losses) on sale of premises and equipment | 274 | (61 | ) | 6 | ||||||||
Gains (losses) on securities available for sale | (196 | ) | 296 | 3 | ||||||||
Gains (losses) on sale of foreclosed assets | 40 | — | (20 | ) | ||||||||
Gain on sale of branches | — | 421 | — | |||||||||
Mortgage banking-related fees | 2,869 | 3,091 | 2,464 | |||||||||
Income from bank owned life insurance | 231 | — | — | |||||||||
Other operating income | 1,421 | 1,065 | 1,102 | |||||||||
Total noninterest income | $ | 15,485 | $ | 15,443 | $ | 14,544 | ||||||
The accompanying notes are an integral part of these consolidated financial statements.
35
VIRGINIA FINANCIAL GROUP, INC. AND SUBSIDIARIES
Consolidated Statements of Income (continued)
For the Three Years Ended December 31, 2006
(Dollars in Thousands, except per share data)
| 2006 | 2005 | 2004 | |||||||
Non-interest Expense | |||||||||
Compensation and employee benefits | $ | 26,607 | $ | 25,284 | $ | 22,669 | |||
Net occupancy | 3,147 | 2,888 | 2,721 | ||||||
Supplies and equipment | 4,141 | 4,056 | 4,333 | ||||||
Amortization-intangible assets | 578 | 643 | 694 | ||||||
Marketing | 1,214 | 887 | 636 | ||||||
State franchise taxes | 973 | 870 | 599 | ||||||
Data processing | 1,389 | 1,389 | 1,464 | ||||||
Professional fees | 823 | 804 | 922 | ||||||
Telecommunications | 1,006 | 1,017 | 1,055 | ||||||
Other operating expenses | 7,040 | 5,864 | 5,923 | ||||||
Total noninterest expense | $ | 46,918 | $ | 43,702 | $ | 41,016 | |||
Income before income taxes | $ | 27,962 | $ | 26,574 | $ | 21,768 | |||
Income tax expense | 8,465 | 8,358 | 6,565 | ||||||
Net income | $ | 19,497 | $ | 18,216 | $ | 15,203 | |||
Earnings per share, basic | $ | 1.81 | $ | 1.69 | $ | 1.42 | |||
Earnings per share, diluted | $ | 1.80 | $ | 1.68 | $ | 1.41 | |||
The accompanying notes are an integral part of these consolidated financial statements.
36
VIRGINIA FINANCIAL GROUP, INC. AND SUBSIDIARIES
Consolidated Statements of Changes in Stockholders’ Equity
For the Three Years Ended December 31, 2006
(Dollars in Thousands)
| Common Stock | Additional Paid-In Capital | Retained Earnings | Accumulated Other Compre- hensive Income (Loss) | Compre- hensive Income | Total | |||||||||||||||||
Balance, December 31, 2003 | $ | 10,729 | $ | 32,613 | $ | 72,255 | $ | 4,233 | $ | 119,830 | ||||||||||||
Comprehensive income: | ||||||||||||||||||||||
Net income | 15,203 | $ | 15,203 | 15,203 | ||||||||||||||||||
Other comprehensive loss, net of tax: | ||||||||||||||||||||||
Unrealized holding losses arising during the period (net of tax of $1,217) | — | — | — | — | (2,261 | ) | — | |||||||||||||||
Reclassification adjustment (net of tax, $1) | — | — | — | — | (2 | ) | — | |||||||||||||||
Minimum pension liability adjustment (net of tax of $178) | — | — | — | — | (331 | ) | — | |||||||||||||||
Other comprehensive loss | — | — | — | (2,594 | ) | (2,594 | ) | (2,594 | ) | |||||||||||||
Total comprehensive income | — | — | — | — | $ | 12,609 | — | |||||||||||||||
Cash dividends ($.52 per share) | — | — | (5,589 | ) | — | (5,589 | ) | |||||||||||||||
Stock-based compensation expense (10,287 shares) | 10 | 191 | — | — | 201 | |||||||||||||||||
Exercise of stock options (2,634 shares) | 3 | 35 | — | — | 38 | |||||||||||||||||
Balance, December 31, 2004 | $ | 10,742 | $ | 32,839 | $ | 81,869 | $ | 1,639 | $ | 127,089 | ||||||||||||
Comprehensive income: | ||||||||||||||||||||||
Net income | 18,216 | $ | 18,216 | 18,216 | ||||||||||||||||||
Other comprehensive loss, net of tax: | ||||||||||||||||||||||
Unrealized holding losses arising during the period (net of tax of $1,816) | — | — | — | — | (3,373 | ) | — | |||||||||||||||
Reclassification adjustment (net of tax, $104) | — | — | — | — | (192 | ) | — | |||||||||||||||
Minimum pension liability adjustment (net of tax of $47) | — | — | — | — | (87 | ) | — | |||||||||||||||
Other comprehensive loss | — | — | — | (3,652 | ) | (3,652 | ) | (3,652 | ) | |||||||||||||
Total comprehensive income | — | — | — | — | $ | 14,564 | — | |||||||||||||||
Cash dividends ($.56 per share) | — | — | (6,024 | ) | — | (6,024 | ) | |||||||||||||||
Stock-based compensation expense (6,352 shares) | 6 | 326 | — | — | 332 | |||||||||||||||||
Exercise of stock options (10,500 shares) | 11 | 133 | — | — | 144 | |||||||||||||||||
Balance, December 31, 2005 | $ | 10,759 | $ | 33,298 | $ | 94,061 | $ | (2,013 | ) | $ | 136,105 | |||||||||||
Comprehensive income: | ||||||||||||||||||||||
Net income | 19,497 | $ | 19,497 | 19,497 | ||||||||||||||||||
Other comprehensive income, net of tax: | ||||||||||||||||||||||
Unrealized holding gains arising during the period (net of tax of $714) | — | — | — | — | 1,326 | — | ||||||||||||||||
Reclassification adjustment (net of tax, $69) | — | — | — | — | (127 | ) | — | |||||||||||||||
Other comprehensive income | — | — | — | 1,199 | 1,199 | 1,199 | ||||||||||||||||
Total comprehensive income | — | — | ��� | — | $ | 20,696 | — | |||||||||||||||
Adjustment to initially apply FASB | (212 | ) | (212 | ) | ||||||||||||||||||
Cash dividends ($.61 per share) | — | — | (6,634 | ) | — | (6,634 | ) | |||||||||||||||
Stock-based compensation expense (9,979 shares) | 10 | 410 | — | — | 420 | |||||||||||||||||
Exercise of stock options (15,223 shares) | 15 | 262 | — | — | 277 | |||||||||||||||||
Balance, December 31, 2006 | $ | 10,784 | $ | 33,970 | $ | 106,924 | $ | (1,026 | ) | $ | 150,652 | |||||||||||
The accompanying notes are an integral part of these consolidated financial statements.
37
VIRGINIA FINANCIAL GROUP, INC. AND SUBSIDIARIES
Consolidated Statements of Cash Flows
For the Three Years Ended December 31, 2006
(Dollars in Thousands)
| 2006 | 2005 | 2004 | ||||||||||
Cash Flows from Operating Activities | ||||||||||||
Net income | $ | 19,497 | $ | 18,216 | $ | 15,203 | ||||||
Adjustments to reconcile net income to net cash provided by operating activities: | ||||||||||||
Depreciation | 2,856 | 2,965 | 3,066 | |||||||||
Amortization of intangible assets | 578 | 643 | 694 | |||||||||
Provision for loan losses | 750 | 2,012 | 2,534 | |||||||||
Impairment of foreclosed assets | — | 15 | 61 | |||||||||
Deferred tax benefit | (34 | ) | (851 | ) | (918 | ) | ||||||
Employee benefit plan expense | 264 | 265 | 212 | |||||||||
Stock-based compensation expense | 420 | 332 | 201 | |||||||||
(Gain) loss on foreclosed assets | (40 | ) | — | 20 | ||||||||
(Gain) loss on sale of premises and equipment | (274 | ) | 61 | (6 | ) | |||||||
Loss (gain) on sale of securities available for sale | 196 | (296 | ) | (3 | ) | |||||||
Gain on sale of mortgage loans | (2,869 | ) | (3,091 | ) | (2,464 | ) | ||||||
Gain on sale of branches | — | (421 | ) | — | ||||||||
Proceeds from sale of mortgage loans | 138,568 | 176,088 | 150,094 | |||||||||
Origination of mortgage loans for sale | (134,116 | ) | (176,505 | ) | (148,171 | ) | ||||||
Amortization of securities premiums and accretion of discounts, net | 12 | 525 | 719 | |||||||||
Income on bank owned life insurance | (231 | ) | — | — | ||||||||
Changes in assets and liabilities: | ||||||||||||
(Increase) decrease in accrued interest receivable | (1,614 | ) | (899 | ) | 198 | |||||||
(Increase) decrease in other assets | (1,623 | ) | 587 | 226 | ||||||||
Increase (decrease) in accrued interest payable | 1,759 | 434 | (103 | ) | ||||||||
(Decrease) increase in other liabilities | (1,844 | ) | 2,421 | (611 | ) | |||||||
Net cash provided by operating activities | $ | 22,255 | $ | 22,501 | $ | 20,952 | ||||||
Cash Flows from Investing Activities | ||||||||||||
Proceeds from maturities and principal payments of securities available for sale | $ | 60,826 | $ | 83,056 | $ | 86,361 | ||||||
Proceeds from sales and calls of securities available for sale | 30,684 | 4,116 | 36,536 | |||||||||
Purchase of securities available for sale | (114,472 | ) | (49,056 | ) | (54,954 | ) | ||||||
Net increase in loans | (74,510 | ) | (90,729 | ) | (140,713 | ) | ||||||
Proceeds from sale of premises and equipment | 6,000 | 46 | 3 | |||||||||
Purchase of premises and equipment | (10,760 | ) | (9,200 | ) | (3,616 | ) | ||||||
Proceeds from sale of foreclosed assets | 200 | 50 | 906 | |||||||||
Purchase of Bank Owned Life Insurance | (10,000 | ) | — | |||||||||
Cash paid in branch sales, net | — | (11,742 | ) | — | ||||||||
Net cash used in investing activities | $ | (112,032 | ) | $ | (73,459 | ) | $ | (75,477 | ) | |||
The accompanying notes are an integral part of these consolidated financial statements.
38
VIRGINIA FINANCIAL GROUP, INC. AND SUBSIDIARIES
Consolidated Statements of Cash Flows (continued)
For the Three Years Ended December 31, 2006
(Dollars in Thousands)
| 2006 | 2005 | 2004 | ||||||||||
Cash Flows from Financing Activities | ||||||||||||
Net (decrease) increase in demand, money market and savings deposits | $ | (31,243 | ) | $ | (8,374 | ) | $ | 31,005 | ||||
Net increase in certificates of deposit | 94,015 | 28,720 | 15,385 | |||||||||
Net decrease in federal funds purchased and securities sold under agreements to repurchase | (15,890 | ) | (5,265 | ) | (12,000 | ) | ||||||
Issuance of subordinated debt | — | — | 20,619 | |||||||||
Proceeds from Federal Home Loan Bank advances | 81,000 | 35,000 | 5,000 | |||||||||
Principal payments on Federal Home Loan Bank advances | (56,000 | ) | (9,060 | ) | (80 | ) | ||||||
Net increase in commercial paper | 34,152 | 24,780 | — | |||||||||
Net decrease in other borrowings | (281 | ) | (273 | ) | (5,711 | ) | ||||||
Proceeds from exercise of stock options | 277 | 144 | 38 | |||||||||
Cash dividends paid | (6,634 | ) | (6,024 | ) | (5,589 | ) | ||||||
Net cash provided by financing activities | $ | 99,396 | $ | 59,648 | $ | 48,667 | ||||||
Increase (decrease) in cash and cash equivalents | $ | 9,619 | $ | 8,690 | $ | (5,858 | ) | |||||
Cash and Cash Equivalents | ||||||||||||
Beginning | 48,016 | 39,326 | 45,178 | |||||||||
Ending | $ | 57,635 | $ | 48,016 | $ | 39,320 | ||||||
Supplemental Disclosures of Cash Flow Information | ||||||||||||
Cash payments for: | ||||||||||||
Interest | $ | 33,723 | $ | 24,256 | $ | 19,731 | ||||||
Income taxes | $ | 8,914 | $ | 9,151 | $ | 7,525 | ||||||
Supplemental Schedule of Noncash Investing Activities | ||||||||||||
Foreclosed assets acquired in settlement of loans | $ | 123 | $ | 135 | $ | 39 | ||||||
Unrealized gain (loss) on securities available for sale | $ | 1,845 | $ | (5,485 | ) | $ | (3,481 | ) | ||||
Stock based compensation expense | $ | 420 | $ | 332 | $ | 201 | ||||||
Minimum pension liability adjustment | $ | 211 | $ | (134 | ) | $ | (509 | ) | ||||
Adjustment to initially apply FASB Statement No. 158 | $ | (537 | ) | $ | — | $ | — | |||||
Details of Disposition of branches | ||||||||||||
Fair value of assets sold | $ | — | $ | (9,643 | ) | $ | — | |||||
Fair value of liabilities transferred | — | 22,040 | — | |||||||||
Write-off of core deposit intangibles | — | (465 | ) | — | ||||||||
Write-off of goodwill | — | (138 | ) | — | ||||||||
Write-off of loan premium | — | (115 | ) | — | ||||||||
Transactions costs | — | (165 | ) | — | ||||||||
Cash paid | $ | — | $ | 11,514 | $ | — | ||||||
Less cash transferred | — | 228 | — | |||||||||
Net cash paid for sale | $ | — | $ | 11,742 | $ | — | ||||||
The accompanying notes are an integral part of these consolidated financial statements.
39
VIRGINIA FINANCIAL GROUP, INC. AND SUBSIDIARIES
Notes to Consolidated Financial Statements
(Dollars in Thousands, except share data)
Note 1. Significant Accounting Policies
Nature of Operations and Consolidation
Virginia Financial Group, Inc. (the “Company”) is a Virginia multi-bank holding Company headquartered in Culpeper, Virginia. The Company owns Second Bank & Trust and its subsidiary, Second Service Company; Virginia Heartland Bank and its subsidiary, Virginia Heartland Service Corporation; Planters Bank & Trust Company of Virginia and its subsidiary, Planters Insurance Agency, Inc.; Virginia Commonwealth Trust Company and VFG Limited Liability Trust. VFG, through its affiliates, also owns a 70% interest in VFG Title, LLC. The consolidated statements include the accounts of the Company and its wholly-owned subsidiaries. All significant inter-company accounts have been eliminated. FASB Interpretation No. 46 (R) requires that the Company no longer eliminate through consolidation the equity investment in VFG Limited Liability Trust by the parent company, Virginia Financial Group, Inc., which approximated $619,000 at December 31, 2006. The subordinated debt to the trust is reflected as a liability on the Company’s balance sheet.
VFG combined Virginia Heartland Bank (Fredericksburg) into its Second Bank & Trust (Culpeper) affiliate on February 16, 2007. The two banks are geographically contiguous, share increasingly similar market dynamics and offer the opportunity to create efficiencies and management depth.
The Company, through its member banks, provides a full array of banking services through forty-one retail offices in Central and Southwest Virginia. Among such services are those traditionally offered by banks including commercial and consumer demand and time deposit accounts, mortgage, commercial and consumer loans. The Company also provides a network of automated transaction locations, phone banking and a transactional internet banking product. Virginia Commonwealth Trust Company provides comprehensive wealth management, financial and estate-planning services through each of it’s community banks.
Risks and Uncertainties
In its normal course of business, the Company encounters two significant types of risk: economic and regulatory. There are three main components of economic risk: interest rate risk, credit risk and market risk. The Company is subject to interest rate risk to the degree that its interest-bearing liabilities mature or reprice more rapidly or on a different basis than its interest-earning assets. Credit risk is the risk of default on the Company’s loan portfolio that results from the borrowers’ inability or unwillingness to make contractually required payments. Market risk reflects changes in the value of collateral underlying loans receivable, securities and the valuation of real estate held by the Company.
The determination of the allowance for loan losses and the valuation of real estate are based on estimates that are particularly susceptible to significant changes in the economic environment and market conditions. Management believes that, as of December 31, 2006, the allowance for loan losses and the valuation of real estate are adequate based on information currently available. A worsening or protracted economic decline or substantial increase in interest rates would increase the likelihood of losses due to credit and market risks and could create the need for substantial increases in the allowance for loan losses.
The Company is subject to the regulations of various regulatory agencies, which can change significantly from year to year. In addition, the Company undergoes periodic examinations by regulatory agencies, which may subject it to further changes based on the regulators’ judgments about information available to them at the time of their examinations.
40
VIRGINIA FINANCIAL GROUP, INC. AND SUBSIDIARIES
Notes to Consolidated Financial Statements
(Dollars in Thousands, except share data)
Basis of Presentation
The accounting and reporting policies of the Company conform to accounting principles generally accepted in the United States of America and to accepted practices within the banking industry. The following is a description of the more significant of those policies and practices.
Cash and Cash Equivalents
For purposes of the consolidated statements of cash flows, cash and cash equivalents include cash on hand, amounts due from banks, and federal funds sold. Generally, federal funds are purchased and sold for one day periods.
Use of Estimates
In preparing consolidated financial statements in conformity with accounting principles generally accepted in the United States of America, management is required to make estimates and assumptions that affect the reported amounts of assets and liabilities and disclosure of contingent assets and liabilities as of the date of the balance sheet and reported amounts of revenues and expenses during the reporting period. Actual results could differ from those estimates. Material estimates that are particularly susceptible to significant change in the near term relate to the determination of the allowance for loan losses, the valuation of foreclosed real estate and deferred tax assets.
Investment Securities
Debt securities that management has the positive intent and ability to hold to maturity are classified as “held to maturity” and recorded at amortized cost. Securities not classified as held to maturity, including equity securities with readily determinable fair values, are classified as “available for sale” and recorded at fair value, with unrealized gains and losses excluded from earnings and reported in other comprehensive income. The initial classification of securities is determined at the date of purchase.
Purchase premiums and discounts are recognized in interest income using the interest method over the terms of the securities. Declines in the fair value of held to maturity and available for sale securities below their cost that are deemed to be other than temporary are reflected in earnings as realized losses. In estimating other-than-temporary impairment losses, management considers (1) the length of time and the extent to which the fair value has been less than cost, (2) the financial condition and near term prospects of the issuer, and (3) the intent and ability of the Company to retain its investment in the issuer for a period of time sufficient to allow for any anticipated increase in fair value. Gains and losses on the sale of securities are recorded on the trade date and are determined using the specific identification method.
The Company, through its banking subsidiaries, is a member of the Federal Reserve Bank and the Federal Home Loan Bank and is required to hold stock in each institution. These equity securities are restricted from trading and are recorded in other assets at a cost of $8.1 million and $6.6 million at December 31, 2006 and 2005, respectively. These are considered cost basis securities.
Loans
The Company, through its banking subsidiaries, grants mortgage, commercial and consumer loans to customers. A substantial portion of the loan portfolio is represented by mortgage loans. The ability of the Company’s debtors to honor their contracts is dependent upon the real estate and general economic conditions in the Company’s market area.
41
VIRGINIA FINANCIAL GROUP, INC. AND SUBSIDIARIES
Notes to Consolidated Financial Statements
(Dollars in Thousands, except share data)
Loans that management has the intent and ability to hold for the foreseeable future or until maturity or pay-off generally are reported at their outstanding unpaid principal balances adjusted for charge-offs, the allowance for loan losses and any deferred fees or costs on originated loans. Interest income is accrued on the unpaid principal balance. Loan origination fees, net of certain direct origination costs, are deferred and recognized as an adjustment of the related loan yield using the interest method. These amounts are generally being amortized over the contractual life of the loan.
The accrual of interest on mortgage and commercial loans is discontinued at the time the loan is 90 days delinquent unless the credit is well-secured and in process of collection. Installment loans and other personal loans are typically charged off no later than 180 days past due. In all cases, loans are placed on nonaccrual or charged-off at an earlier date if collection of principal or interest is considered doubtful.
All interest accrued but not collected for loans that are placed on nonaccrual or charged-off is reversed against interest income. The interest on these loans is accounted for on the cash-basis or cost-recovery method, until qualifying for return to accrual. Loans are returned to accrual status when all the principal and interest amounts contractually due are brought current and future payments are reasonably assured.
Allowance for Loan Losses
The allowance for loan losses is established as losses are estimated to have occurred through a provision for loan losses charged to earnings. Loan balances are charged against the allowance when management believes the uncollectibility of a loan balance is confirmed. Subsequent recoveries, if any, are credited to the allowance.
The Company’s affiliate Banks conduct an analysis of the loan portfolio on a regular basis. This analysis is used in assessing the sufficiency of the allowance for loan losses and in the determination of the necessary provision for loan losses. The review process generally begins with lenders identifying problem loans to be reviewed on an individual basis for impairment. When a loan has been identified as impaired, then a specific reserve may be established based on the Banks’ calculation of the loss embedded in the individual loan. In addition to impairment testing, the Banks have an eight point grading system for each non-homogeneous loan in the portfolio. The loans meeting the criteria for impairment are segregated from performing loans within the portfolio. Loans are then grouped by loan type and, in the case of commercial loans, by risk rating. Each loan type is assigned an allowance factor based on historical loss experience, economic conditions, and the overall portfolio quality including delinquency rates. An unallocated component is maintained to cover uncertainties that could affect management’s estimate of probable losses, reflecting the imprecision inherent in the underlying assumptions used in these methodologies. The total of specific reserves required for impaired classified loans, calculated reserves by loan category and the unallocated reserve are then compared to the recorded allowance for loan losses. This is the methodology used to determine the sufficiency of the allowance for loan losses and the amount of the provision for loan losses.
A loan is considered impaired when, based on current information and events, it is probable that the Company will be unable to collect the scheduled payments of principal or interest when due according to the contractual terms of the loan agreement. Factors considered by management in determining impairment include payment status, collateral value, and the probability of collecting scheduled principal and interest payments when due. Loans that experience insignificant payment delays and payment shortfalls generally are not classified as impaired. Management determines the significance of payment delays and payment shortfalls on a case-by-case basis, taking into consideration all of the circumstances surrounding the loan and the borrower, including the length of the delay, the reasons for the delay, the borrower’s prior payment record, and the amount of the shortfall in relation to the principal and interest owed. Impairment is measured on a loan-by-loan basis for commercial and construction loans by either the present value of expected future cash flows discounted at the loan’s effective interest rate, the loan’s obtainable market price, or the fair value of the collateral if the loan is collateral dependent.
42
VIRGINIA FINANCIAL GROUP, INC. AND SUBSIDIARIES
Notes to Consolidated Financial Statements
(Dollars in Thousands, except share data)
Larger groups of smaller balance homogeneous loans are collectively evaluated for impairment. Accordingly, the Company does not separately identify individual consumer and residential loans for impairment disclosures, unless such loans are subject to a restructuring agreement.
Loans Held For Sale
Loans originated and intended for sale in the secondary market are carried at the lower of aggregate cost or fair value, as determined by aggregate outstanding commitments from investors or current investor yield requirements. Net unrealized losses are recognized through a valuation allowance by charges to income.
Mortgage loans held for sale are generally sold with the mortgage servicing rights released by the Company. Gains or losses on sales of mortgage loans are recognized based on the difference between the selling price and the carrying value of the related mortgage loans sold.
The Company accounts for the transfer of financial assets in accordance with SFAS No. 140 “Accounting for Transfers and Servicing of Financial Assets and Extinguishments of Liabilities”. The standard is based on consistent application of a financial-components approach that recognizes the financial and servicing assets it controls and the liabilities it has incurred, derecognizes financial assets when control has been surrendered and derecognizes liabilities when extinguished. The standard provides consistent guidelines for distinguishing transfers of financial assets from transfers that are secured borrowings
The Company enters into commitments to originate loans whereby the interest rate on the loan is determined prior to funding (rate lock commitments). Rate lock commitments on mortgage loans that are intended to be sold are considered to be derivatives. Time elapsing between issuance of a loan commitment and closing and sale of the loan generally ranges from 30 to 120 days. The Company protects itself from changes in interest rates through the use of best efforts forward delivery contracts, whereby the Company commits to sell a loan at the time the borrower commits to an interest rate with the intent that the buyer has assumed interest rate risk on the loan. As a result, the Company is not exposed to losses nor will it realize significant gains related to its rate lock commitments due to changes in interest rates.
The market value of rate lock commitments and best efforts contracts is not readily ascertainable with precision because rate lock commitments and best efforts contracts are not actively traded in stand-alone markets. The Company determines the fair value of rate lock commitments and best efforts contracts by measuring the change in the value of the underlying asset while taking into consideration the probability that the rate lock commitments will close. Due to high correlation between rate lock commitments and best efforts contracts, no significant gains or losses have occurred on the rate lock commitments.
Premises and Equipment
Land is carried at cost. Premises and equipment are stated at cost less accumulated depreciation and amortization. Premises and equipment are depreciated over their estimated useful lives ranging from three years to thirty-nine years; leasehold improvements are amortized over the lives of the respective leases or the estimated useful life of the leasehold improvement, whichever is less. Software is amortized over three years. Depreciation and amortization are recorded on the straight-line method.
43
VIRGINIA FINANCIAL GROUP, INC. AND SUBSIDIARIES
Notes to Consolidated Financial Statements
(Dollars in Thousands, except share data)
The Company accounts for impairment of long lived assets in accordance with SFAS No. 144 “Accounting for the Impairment of Disposal of Long-Lived Assets”. The standard requires recognition and measurement for the impairment of long lived assets to be held and used or to be disposed of by sale. The Company had no impaired long lived assets at December 31, 2006 and 2005.
Bank Owned Life Insurance (BOLI)
The Company has purchased bank owned life insurance. BOLI involves the purchasing of life insurance by the Company on a chosen group of employees. The proceeds are used to help defray employee benefit costs. The Company is the owner and beneficiary of the policies. The Company originally invested $10.0 million in BOLI in 2006. BOLI is recorded on the consolidated balance sheets at its cash surrender value and changes in the cash surrender value are recorded in noninterest income. BOLI income is tax-exempt.
Goodwill and Intangible Assets
Goodwill and identified intangible assets with indefinite lives are not subject to amortization. They are subject to an annual assessment for impairment, or more often if events or circumstances indicate there may be impairment. This test involves assigning tangible assets and liabilities, identified intangible assets and goodwill to reporting units and comparing the fair value of each reporting unit to its carrying amount. If the fair value is less than the carrying amount, a further test is required to measure impairment. Based on the results of these tests, the Company concluded that none of its recorded goodwill was impaired.
Additionally, acquired intangible assets (such as core deposit intangibles) are separately recognized and amortized over their useful life if the benefit of the asset can be sold, transferred, licensed, rented, or exchanged. Intangible assets associated with branch acquisition transactions continue to be amortized over the estimated useful life of the deposits. The cost of purchased deposit relationships and other intangible assets, based on independent valuation, are being amortized over their estimated lives not to exceed fifteen years. Amortization expense charged to operations was $578 thousand in 2006, $643 thousand in 2005 and $694 thousand in 2004.
Income Taxes
Deferred income tax assets and liabilities are determined using the liability (or balance sheet) method. Under this method, the net deferred tax asset or liability is determined based on the tax effects of the temporary differences between the book and tax bases of the various balance sheet assets and liabilities and gives current recognition to changes in tax rates and laws.
Retirement Plans
The Company has a noncontributory, defined benefit pension plan covering certain of its employees meeting certain age and service requirements. The plan has not been offered to new employees after June, 2002. The Company’s funding policy is to make the maximum contribution permitted by the Employee Retirement Income Security Act. In 2006, the Company adopted Statement No. 158, (“SFAS No. 158”) “Employer’s Accounting for Defined Benefit Pension and Other Postretirement Plans – An amendment of FASB Statements No. 87, 88, 106, and 132(R)”. The new standard requires an employer to recognize the overfunded or underfunded status of a defined benefit postretirement plan as an asset or liability in its statement of financial position and to recognize through comprehensive income changes in that funded status in the year in which the changes occur. The liability recognized in the current year’s balance sheet was $401 thousand and is included in other liabilities in the accompanying consolidated balance sheets.
44
VIRGINIA FINANCIAL GROUP, INC. AND SUBSIDIARIES
Notes to Consolidated Financial Statements
(Dollars in Thousands, except share data)
The Company also has a contribution retirement plan which covers the majority of its full-time salaried employees for all years presented. Contributions are at the discretion of the Board of Directors.
Stock-Based Compensation
The Company has a stock-based employee compensation plan under which nonqualified stock options may be granted periodically to certain employees. The Company’s stock options typically have an exercise price equal to at least the fair value of the stock on the date of grant, and vest based on continued service with the Company for a specified period, generally five years. The Company adopted SFAS 123R effective January 1, 2006 using the modified prospective method and as such, results for prior periods have not been restated. Prior to January 1, 2006, the value of restricted stock awards was expensed by the Company over the restriction period, and no compensation expense was recognized for stock option grants as all such grants had an exercise price not less than fair market value on the date of grant.
SFAS 123R also requires that new awards to employees eligible for retirement prior to the award becoming fully vested be recognized as compensation cost over the period through the date that the employee first becomes eligible to retire and is no longer required to provide service to earn the award.
During 2005 and 2004, the Company applied the intrinsic value method prescribed in APB Opinion 25,Accounting for Stock Issued to Employees, and related interpretations. No stock-based employee compensation cost is reflected in results of operations, as all options granted under the plan had an exercise price equal to the market value of the underlying common stock on the date of the grant. The following table illustrates the effect on net income and earnings per share if the Company had applied the fair value recognition provisions of FASB Statement No. 123,Accounting for Stock-Based Compensation, to stock-based compensation.
| 2005 | 2004 | |||||||
Net income, as reported | $ | 18,216 | $ | 15,203 | ||||
Additional expense had the Corporation adopted SFAS No. 123 | (220 | ) | (73 | ) | ||||
Pro forma net income | $ | 17,996 | $ | 15,130 | ||||
Earnings per share: | ||||||||
Basic—as reported | $ | 1.69 | $ | 1.42 | ||||
Basic—pro forma | $ | 1.68 | $ | 1.41 | ||||
Diluted—as reported | $ | 1.68 | $ | 1.41 | ||||
Diluted—pro forma | $ | 1.66 | $ | 1.40 | ||||
45
VIRGINIA FINANCIAL GROUP, INC. AND SUBSIDIARIES
Notes to Consolidated Financial Statements
(Dollars in Thousands, except share data)
The fair value of each option grant is estimated on the date of the grant using the Black-Scholes option-pricing model with the following weighted average assumptions:
| Year Ended December 31 | |||||||||
| 2006 | 2005 | 2004 | |||||||
Dividend yield | 2.4 | % | 2.4 | % | 2.4 | % | |||
Expected life | 6.5 yrs | 10 yrs | 10 yrs | ||||||
Expected volatility | 28.1 | % | 26.6 | % | 30.4 | % | |||
Risk-free interest rate | 4.6 | % | 4.2 | % | 4.4 | % | |||
Earnings Per Share
Basic earnings per share represent income available to common stockholders divided by the weighted-average number of common shares outstanding during the period. Diluted earnings per share reflects additional common shares that would have been outstanding if dilutive potential common stock had been issued, as well as any adjustment to income that would result from the assumed issuance. Potential common shares that may be issued by the Company relate solely to outstanding stock options and restricted stock and are determined using the treasury method.
Dividend Reinvestment Plan
The Company has in effect a Dividend Reinvestment Plan, which provides an automatic conversion of dividends into common stock for enrolled stockholders. It is based on the stock’s fair market value on each dividend record date, and allows for voluntary contributions to purchase stock.
Trust Assets and Revenue
Securities and other property held by the Virginia Commonwealth Trust Company in a fiduciary or agency capacity are not assets of the Company and are not included in the accompanying consolidated financial statements. Operating revenues and expenses of the Trust Company are included under their respective captions in the accompanying consolidated financial statements of income and are recorded on the accrual basis.
Foreclosed Assets
Real estate acquired through, or in lieu of, foreclosure are held for sale and are initially recorded at fair value at the date of foreclosure, establishing a new cost basis. Subsequent to foreclosure, valuations are periodically performed by management and the assets are carried at the lower of the carrying amount or fair value less cost to sell. Revenues and expenses from operations and changes in the valuation are included in other operating expenses.
Advertising
The Company follows the policy of charging the costs of advertising to expense as incurred. Advertising expense of $1.2 million, $887 thousand, and $636 thousand were incurred in 2006, 2005 and 2004, respectively.
46
VIRGINIA FINANCIAL GROUP, INC. AND SUBSIDIARIES
Notes to Consolidated Financial Statements
(Dollars in Thousands, except share data)
Segment Information
SFAS No. 131, “Disclosures about Segments of an Enterprise and Related Information” establishes standards for the way public business enterprises report information about operating segments in annual financial statements and requires that those enterprises report selected information about operating segments in interim financial reports issued to shareholders. It also establishes standards for related disclosure about products and services, geographic areas, and major customers. Operating segments are components of an enterprise about which separate financial information is available that is evaluated regularly by the chief operating decision maker in deciding how to allocate resources and assess performance. The statement also requires that public enterprises report a measure of segment profit or loss, certain specific revenue and expense items and segment assets. It also requires that information be reported about revenues derived from the enterprises’ products or services, or about the countries in which the enterprises earn revenues and hold assets, and about major customers, regardless of whether the information is used in making operating decisions.
Management has determined that the Company has one reportable segment, “Community Banking.” All of the Company’s activities are interrelated, and each activity is dependent and assessed based on how each of the activities of the Company supports the others. For example, commercial lending is dependent upon the ability of the Company to fund itself with retail deposits and other borrowings and to manage interest rate and credit risk. This situation is also similar for consumer and residential mortgage lending. Accordingly, all significant operating decisions are based upon analysis of the Company as one operating segment or unit.
The Company has also identified several operating segments. These operating segments within the Company’s operations do not have similar characteristics to the community banking operations and do not meet the quantitative thresholds requiring separate disclosure. These nonreportable segments include Virginia Commonwealth Trust Company, our mortgage division, a title company, and the parent.
Reclassifications
Certain reclassifications have been made to prior period balances to conform to the current year presentation.
Recent Accounting Pronouncements
In February 2006, FASB Issued Statement No. 155 (SFAS 155), “Accounting for Certain Hybrid Financial Instruments” which is effective for fiscal years beginning after September 15, 2006. This Statement amends FASB Statements No. 133, Accounting for Derivative Instruments and Hedging Activities, and No. 140, Accounting for Transfers and Servicing of Financial Assets and Extinguishments of Liabilities. This Statement resolves issues addressed in Statement 133 Implementation Issue No. D1, “Application of Statement 133 to Beneficial Interests in Securitized Financial Assets .”
The Company does not expect the adoption of Statement 155 at the beginning of 2007 to have a material impact on the consolidated financial statements.
In March 2006, the Financial Accounting Standards Board issued Statement of Financial Accounting Standard No. 156, “Accounting for Servicing of Financial Assets an amendment of FASB Statement 140” (Statement 156). Statement 156 amends Statement 140 with respect to separately recognized servicing assets and liabilities. Statement 156 requires an entity to recognize a servicing asset or liability each time it undertakes an obligation to service a financial asset by entering into a servicing contract and requires all servicing assets and liabilities to be initially measured at fair value, if practicable. Statement 156 also permits entities to subsequently measure servicing assets and liabilities using an amortization method or fair value measurement method. Under the amortization method, servicing
47
VIRGINIA FINANCIAL GROUP, INC. AND SUBSIDIARIES
Notes to Consolidated Financial Statements
(Dollars in Thousands, except share data)
assets and liabilities are amortized in proportion to and over the estimated period of servicing. Under the fair value measurement method, servicing assets are measured at fair value at each reporting date and changes in fair value are reported in net income for the period the change occurs.
Adoption of Statement 156 is required as of the beginning of fiscal years beginning subsequent to September 15, 2006. Earlier adoption is permitted as of the beginning of an entity’s fiscal year, provided the entity has not yet issued financial statements, including interim financial statements. The Company does not expect the adoption of Statement 156 at the beginning of 2007 to have a material impact on the consolidated financial statements.
In June 2006, the Financial Accounting Standards Board issued FASB Interpretation No. 48 “Accounting for Uncertainty in Income Taxes an interpretation of FASB Statement No. 109 (as amended)” (FIN 48). FIN 48 clarifies the accounting for uncertainty in income taxes recognized in an enterprise’s financial statements in accordance with FASB Statement No. 109, “Accounting for Income Taxes”. The Interpretation prescribes a recognition threshold and measurement attribute for the financial statement recognition and measurement of a tax position taken or expected to be taken in a tax return. FIN 48 also provides guidance on derecognition, classification, interest and penalties, accounting in interim periods, disclosure, and transition.
Because the Company is not aware of any material uncertain tax positions, it does not expect the adoption of FIN 48 to have a material impact on the consolidated financial statements.
In September 2006, FASB Issued Statement No. 157 (SFAS 157), “Fair Value Measurements” which is effective for fiscal years beginning after November 15, 2007 and for interim periods within those years. This statement defines fair value, establishes a framework for measuring fair value and expands the related disclosure requirements. The adoption of SFAS 157 is not expected to have a material impact on the Company’s consolidated financial statements.
In September 2006, the Securities and Exchange Commission issued Staff Accounting Bulletin No. 108 (SAB 108), which provides guidance on the consideration of the effects of prior year misstatements in quantifying current year misstatements for the purpose of a materiality assessment. The techniques most commonly used in practice to accumulate and quantify misstatements are generally referred to as the “rollover” and “iron curtain” approaches.
Because the Company is not aware of any material misstatement, it does not expect the adoption of SAB 108 to have a material impact on the consolidated financial statements.
48
VIRGINIA FINANCIAL GROUP, INC. AND SUBSIDIARIES
Notes to Consolidated Financial Statements
(Dollars in Thousands, except share data)
Note 2. Disposition of Branches
On February 16, 2005, the Company through its subsidiary, Planters Bank & Trust Company of Virginia, sold two branches located in Tazewell County, Virginia to the Bank of Tazewell County, an affiliate of National Bankshares, Inc. headquartered in Blacksburg, Virginia.
The sale included the assumption of certain deposit accounts and purchase of selected loans, fixed assets and real estate as follows:
Premium received on deposits transferred | $ | 1,304 | |
Liabilities transferred (at fair value): | |||
Deposit accounts | $ | 22,001 | |
Other liabilities | 39 | ||
Total liabilities transferred | $ | 22,040 | |
Assets sold (at fair value): | |||
Cash | $ | 228 | |
Loans | 8,844 | ||
Real estate and personal property | 311 | ||
Other assets | 32 | ||
Total assets sold | 9,415 | ||
Net liabilities transferred | $ | 11,321 | |
Premium received on deposits transferred | $ | 1,304 | |
Less: Write-off of core deposit intangibles | 465 | ||
Write-off of goodwill | 138 | ||
Write-off of loan premium | 115 | ||
Transaction costs | 165 | ||
Net Gain on Sale | $ | 421 | |
Note 3. Restrictions on Cash
To comply with Federal Reserve Regulations, the subsidiary banks are required to maintain certain average reserve balances. The daily average reserve requirement was $400 thousand for both December 31, 2006 and 2005.
49
VIRGINIA FINANCIAL GROUP, INC. AND SUBSIDIARIES
Notes to Consolidated Financial Statements
(Dollars in Thousands, except share data)
Note 4. Investment Securities
The amortized cost and fair value of the securities being held to maturity, with gross unrealized gains and losses, as of December 31, 2006 and 2005, are as follows:
| 2006 | ||||||||||||
| Amortized Cost | Gross Unrealized Gains | Gross Unrealized (Losses) | Fair Value | |||||||||
State and municipal | $ | 3,328 | $ | 11 | $ | — | $ | 3,339 | ||||
2005 | ||||||||||||
| Amortized Cost | Gross Unrealized Gains | Gross Unrealized (Losses) | Fair Value | |||||||||
State and municipal | $ | 4,287 | $ | 107 | $ | — | $ | 4,394 | ||||
The amortized cost and fair value of the securities being held to maturity as of December 31, 2006, by contractual maturity, are shown below. Expected maturities may differ from contractual maturities because issuers may have the right to call or prepay obligations without any penalties.
| 2006 | ||||||
| Amortized Cost | Fair Value | |||||
Due in one year or less | $ | 678 | $ | 680 | ||
Due after one year through five years | 2,650 | 2,659 | ||||
Total | $ | 3,328 | $ | 3,339 | ||
50
VIRGINIA FINANCIAL GROUP, INC. AND SUBSIDIARIES
Notes to Consolidated Financial Statements
(Dollars in Thousands, except share data)
Amortized cost and fair value of securities available for sale, with gross unrealized gains and losses as of December 31, 2006 and 2005 are as follows:
| 2006 | |||||||||||||
| Amortized Cost | Gross Unrealized Gains | Gross Unrealized (Losses) | Fair Value | ||||||||||
U. S. Treasury | $ | — | $ | — | $ | — | $ | — | |||||
U. S. Government agencies | 110,912 | 77 | (911 | ) | 110,078 | ||||||||
State and municipals | 97,405 | 1,146 | (416 | ) | 98,135 | ||||||||
Corporate bonds | 2,503 | 10 | (7 | ) | 2,506 | ||||||||
Collateralized mortgage obligations | 1,210 | — | (27 | ) | 1,183 | ||||||||
Mortgage backed securities | 46,407 | 37 | (1,099 | ) | 45,345 | ||||||||
Equity securities | 2,929 | 631 | (49 | ) | 3,511 | ||||||||
Other | 55 | — | — | 55 | |||||||||
Total | $ | 261,421 | $ | 1,901 | $ | (2,509 | ) | $ | 260,813 | ||||
| 2005 | |||||||||||||
| Amortized Cost | Gross Unrealized Gains | Gross Unrealized (Losses) | Fair Value | ||||||||||
U. S. Treasury | $ | 2,498 | $ | 7 | $ | — | $ | 2,505 | |||||
U. S. Government agencies | 87,534 | 31 | (2,548 | ) | 85,017 | ||||||||
State and municipals | 80,627 | 1,561 | (352 | ) | 81,836 | ||||||||
Corporate bonds | 6,022 | 45 | (5 | ) | 6,062 | ||||||||
Collateralized mortgage obligations | 3,314 | 3 | (47 | ) | 3,270 | ||||||||
Mortgage backed securities | 57,233 | 99 | (1,511 | ) | 55,821 | ||||||||
Equity securities | 1,396 | 342 | (79 | ) | 1,659 | ||||||||
Other | 575 | — | — | 575 | |||||||||
Total | $ | 239,199 | $ | 2,088 | $ | (4,542 | ) | $ | 236,745 | ||||
The book value of securities pledged to secure deposits and for other purposes amounted to $66.4 million and $59.9 million at December 31, 2006 and 2005, respectively.
51
VIRGINIA FINANCIAL GROUP, INC. AND SUBSIDIARIES
Notes to Consolidated Financial Statements
(Dollars in Thousands, except share data)
The amortized cost and fair value of the securities available for sale as of December 31, 2006, by contractual maturity, are shown below. Expected maturities may differ from contractual maturities because issuers may have the right to call or prepay obligations without any penalties.
| 2006 | ||||||
| Amortized Cost | Fair Value | |||||
Due in one year or less | $ | 58,693 | $ | 58,491 | ||
Due after one year through five years | 97,688 | 97,353 | ||||
Due after five years through ten years | 42,249 | 42,361 | ||||
Due after ten years | 13,400 | 13,697 | ||||
Equity securities | 2,929 | 3,511 | ||||
Mortgage-backed securities | 46,407 | 45,345 | ||||
Other | 55 | 55 | ||||
Total | $ | 261,421 | $ | 260,813 | ||
Proceeds from sales and calls of securities available for sale were $30.7 million, $4.1 million, and $36.5 million for the years ended December 31, 2006, 2005 and 2004, respectively. Gross gains of $33 thousand, $319 thousand, and $235 thousand and gross losses of $232 thousand, $23 thousand, and $232 thousand were realized on these sales during 2006, 2005 and 2004, respectively. The tax provision (benefit) applicable to these net realized gains (losses) amounted to $(68) thousand, $104 thousand, and $1 thousand, respectively. There were no sales of securities held to maturity during 2006, 2005 or 2004.
52
VIRGINIA FINANCIAL GROUP, INC. AND SUBSIDIARIES
Notes to Consolidated Financial Statements
(Dollars in Thousands, except share data)
Information pertaining to securities with gross unrealized losses at December 31, 2006, and 2005 aggregated by investment category and length of time that individual securities have been in a continuous loss position follows.
Description of Securities | Less than 12 months Fair Value | Unrealized Loss | 12 months or more Fair Value | Unrealized Loss | Total Fair Value | Unrealized Loss | ||||||||||||
| 2006 | ||||||||||||||||||
U.S. Government Agencies | $ | 44,882 | $ | 106 | $ | 31,711 | $ | 805 | $ | 76,593 | $ | 911 | ||||||
Mortgage backed securities | 3,666 | 13 | 35,258 | 1,086 | 38,924 | 1,099 | ||||||||||||
State and municipals | 30,292 | 182 | 20,429 | 234 | 50,721 | 416 | ||||||||||||
Corporate bonds | — | — | 490 | 7 | 490 | 7 | ||||||||||||
Collateralized mortgage obligations | — | — | 1,183 | 27 | 1,183 | 27 | ||||||||||||
Subtotal debt securities | 78,840 | 301 | 89,071 | 2,159 | 167,911 | 2,460 | ||||||||||||
Equity securities | — | — | 544 | 49 | 544 | 49 | ||||||||||||
Total temporarily impaired securities | $ | 78,840 | $ | 301 | $ | 89,615 | $ | 2,208 | $ | 168,455 | $ | 2,509 | ||||||
| 2005 | ||||||||||||||||||
U.S. Government Agencies | $ | 19,309 | $ | 192 | $ | 43,699 | $ | 2,356 | $ | 63,008 | $ | 2,548 | ||||||
Mortgage backed securities | 16,313 | 402 | 32,971 | 1,109 | 49,284 | 1,511 | ||||||||||||
State and municipals | 24,923 | 246 | 3,764 | 106 | 28,687 | 352 | ||||||||||||
Corporate bonds | 991 | 5 | — | — | 991 | 5 | ||||||||||||
Collateralized mortgage obligations | 2,910 | 47 | — | — | 2,910 | 47 | ||||||||||||
Subtotal debt securities | 64,446 | 892 | 80,434 | 3,571 | 144,880 | 4,463 | ||||||||||||
Equity securities | — | — | 514 | 79 | 514 | 79 | ||||||||||||
Total temporarily impaired securities | $ | 64,446 | $ | 892 | $ | 80,948 | $ | 3,650 | $ | 145,394 | $ | 4,542 | ||||||
There are a total of 172 securities that have unrealized losses as of December 31, 2006, 32 U.S. Agency securities, 39 U.S. Agency MBS securities, 97 municipal securities, one CMO, one corporate security and two preferred stock securities. There were a total of 129 securities that had unrealized losses as of December 31, 2005, 30 U.S. Treasuries or agency securities, 35 U.S. Agency MBS securities, 60 municipal securities, two CMO, one corporate security and one preferred stock security. The debt securities are obligations of entities that are excellent credit risks. The impairment as noted is the result of interest rate market conditions and does not reflect on the ability of the issuers to repay the debt obligations. The preferred stock category represents ownership in preferred stock of the Federal Home Loan Mortgage Corporation (Freddie Mac). Freddie Mac’s credit rating did not change during 2006 or 2005 as measured by Moody’s and S&P. The impairment is the result of interest rate market conditions and there is a high probability of full recovery of investment. The fixed income nature of this investment causes significant movement in value in relation to the fixed income market. However, there is no change in the dividend stream or credit quality as a result. The Company maintains the ability and intent to hold such securities for the foreseeable future.
53
VIRGINIA FINANCIAL GROUP, INC. AND SUBSIDIARIES
Notes to Consolidated Financial Statements
(Dollars in Thousands, except share data)
Note 5. Loans
A summary of the balances of loans follows:
| December 31, | ||||||||
| 2006 | 2005 | |||||||
Real estate loans: | ||||||||
Construction and land development | $ | 198,400 | $ | 115,944 | ||||
Farmland | 20,269 | 10,119 | ||||||
1-4 family residential | 276,488 | 300,600 | ||||||
Multifamily, nonresidential and junior liens | 577,154 | 593,396 | ||||||
Loans to farmers (except those secured by real estate) | 1,624 | 1,897 | ||||||
Commercial and industrial loans (except those secured by real estate) | 103,085 | 76,213 | ||||||
Consumer installment loans | 32,528 | 38,678 | ||||||
Deposit overdrafts | 502 | 2,198 | ||||||
All other loans | 6,768 | 3,486 | ||||||
Total loans | $ | 1,216,818 | $ | 1,142,531 | ||||
Net deferred loan costs | 814 | 545 | ||||||
Allowance for loan losses | (14,500 | ) | (13,581 | ) | ||||
Net loans | $ | 1,203,132 | $ | 1,129,495 | ||||
Note 6. Allowance for Loan Losses
Changes in the allowance for loan losses for the years ended December 31, 2006, 2005 and 2004 were as follows:
| 2006 | 2005 | 2004 | ||||||||||
Balance, beginning | $ | 13,581 | $ | 11,706 | $ | 9,743 | ||||||
Provisions for loan losses | 750 | 2,012 | 2,534 | |||||||||
Loans charged off | (402 | ) | (452 | ) | (802 | ) | ||||||
Recoveries | 571 | 315 | 231 | |||||||||
Net recoveries (charge-offs) | 169 | (137 | ) | (571 | ) | |||||||
Balance, ending | $ | 14,500 | $ | 13,581 | $ | 11,706 | ||||||
54
VIRGINIA FINANCIAL GROUP, INC. AND SUBSIDIARIES
Notes to Consolidated Financial Statements
(Dollars in Thousands, except share data)
Information about impaired loans as of and for the years ended December 31, 2006, 2005 and 2004, is as follows:
| 2006 | 2005 | 2004 | |||||||
Impaired loans for which an allowance has been provided | $ | 2,950 | $ | 1,710 | $ | 3,410 | |||
Impaired loans for which no allowance has been provided | 6,098 | 3,705 | 4,905 | ||||||
Total impaired loans | $ | 9,048 | $ | 5,415 | $ | 8,315 | |||
Allowance provided for impaired loans, included in the allowance for loan losses | $ | 750 | $ | 684 | $ | 1,166 | |||
Average balance in impaired loans | $ | 9,269 | $ | 5,670 | $ | 9,379 | |||
Interest income recognized on impaired loans | $ | 511 | $ | 347 | $ | 574 | |||
Interest income recognized on a cash basis on impaired loans | $ | 501 | $ | 339 | $ | 594 | |||
Because the Company does not separately identify individual consumer and residential loans for impairment disclosures, unless such loans are subject to a restructuring agreement some nonaccrual loans are not reviewed for impairment. Nonaccrual loans excluded from the impaired loan disclosure under FASB 114 amounted to $1.6 million, $953 thousand, and $1.4 million at December 31, 2006, 2005 and 2004, respectively. If interest on these loans had been accrued, such income would have approximated $181 thousand, $91 thousand and $118 thousand for each of the three years ended December 31, 2006, respectively.
There were no loans past due greater than 90 days and still accruing interest for each of the three years ended December 31, 2006.
Note 7. Goodwill and Core Deposit Intangibles
At December 31, 2006 and 2005 goodwill totaled $13.9 million. The gross carrying amounts and accumulated amortization of core deposit intangibles as of December 31, 2006 and 2005 are as follows:
| December 31, 2006 | December 31, 2005 | |||||||||||||
| Gross Carrying Amount | Accumulated Amortization | Gross Carrying Amount | Accumulated Amortization | |||||||||||
Core deposit intangibles | $ | 6,642 | $ | (2,855 | ) | $ | 6,642 | $ | (2,193 | ) | ||||
55
VIRGINIA FINANCIAL GROUP, INC. AND SUBSIDIARIES
Notes to Consolidated Financial Statements
(Dollars in Thousands, except share data)
The following table sets forth the actual and estimated pre-tax amortization expense of core deposit intangibles:
Amortization Expense for the Year Ended December 31: | |||
2006 | $ | 577 | |
Estimated Amortization Expense for the Year Ended December 31: | |||
2007 | $ | 642 | |
2008 | 642 | ||
2009 | 642 | ||
2010 | 642 | ||
2011 | 642 | ||
Note 8. Premises and Equipment
A summary of the cost and accumulated depreciation and amortization of bank premises, equipment and software follows:
| Estimated Useful Lives | 2006 | 2005 | ||||||
Land | Indefinite | $ | 8,315 | $ | 12,041 | |||
Buildings and leasehold improvements | Lease term - 39 years | 24,961 | 22,263 | |||||
Furniture, equipment and software | 3 - 7 years | 27,268 | 25,683 | |||||
Construction in progress | (1) | 4,341 | 943 | |||||
| $ | 64,885 | $ | 60,930 | |||||
Less accumulated depreciation and amortization | 29,032 | 27,255 | ||||||
| $ | 35,853 | $ | 33,675 | |||||
| (1) | Construction in progress is not depreciated until placed in service. |
Depreciation and amortization expense amounted to $2.9 million in 2006, $3.0 million in 2005, and $3.1 million in 2004.
Note 9. Deposits
The aggregate amount of time deposits in denominations of $100,000 or more at December 31, 2006 and 2005 was $204.6 million and $157.9 million, respectively.
At December 31, 2006, the scheduled maturities of time deposits were as follows:
2007 | $ | 428,845 | |
2008 | 106,957 | ||
2009 | 36,834 | ||
2010 | 34,017 | ||
2011 | 8,105 | ||
There after | 38 | ||
| $ | 614,796 | ||
Brokered certificates of deposit totaled $12.8 million at December 31, 2006. There were no brokered certificates of deposit held at December 31, 2005.
56
VIRGINIA FINANCIAL GROUP, INC. AND SUBSIDIARIES
Notes to Consolidated Financial Statements
(Dollars in Thousands, except share data)
Note 10. Federal Home Loan Bank Advances
The Company has advances outstanding with the Federal Home Loan Bank of Atlanta of $65 million at December 31, 2006 maturing through 2016. At December 31, 2006 and 2005, the interest rates on this debt ranged from 3.91% to 6.69% and from 1.96% to 6.69%, respectively. The weighted average interest rate at December 31, 2006 and 2005 was 4.79% and 4.15%, respectively. The average balance outstanding during 2006 and 2005 was $61.6 million and $32.8 million, respectively. The advance structures employed by the Company include $25 million in convertible credits, $20 million in PRIME-based credits, $15 million in expanded/fixed rate credits and $5 million in adjustable rate credits. Each structure requires either quarterly interest payments, or monthly interest payments. The convertible advances include one that is callable in the event that three-month LIBOR reaches 8.5%, and three that are callable quarterly.
The banking subsidiaries have available a combined $247 million line of credit with the Federal Home Loan Bank of Atlanta. Advances on the line are secured by a blanket lien on the loan portfolios of Second Bank & Trust, Virginia Heartland Bank and Planters Bank & Trust Company of Virginia. The blanket lien covers 1 to 4 family dwelling loans, multifamily loans, home equity loans, and commercial real estate loans. As of December 31, 2006, loans pledged as collateral totaled $522 million and consisted of 1 to 4 family, multifamily, home equity and commercial real estate loans.
The contractual maturities of the advances are as follows:
| 2006 | |||
Due in 2007 | $ | 10,000 | |
Due in 2008 | 25,000 | ||
Due in 2010 | 10,000 | ||
Due in 2016 | 20,000 | ||
Total | $ | 65,000 | |
Note 11. Subordinated Debt
During the first quarter of 2004, VFG Limited Liability Trust, a wholly-owned subsidiary of the Company, was formed for the purpose of issuing redeemable Capital Securities (commonly referred to as Subordinated debt). On March 18, 2004, $20 million of Subordinated debt was issued through a private transaction. The Trust issued $619 thousand in common equity to the Company. The securities have a LIBOR-indexed floating rate of interest which adjusts, and is payable, quarterly. The interest rate at December 31, 2006 was 8.10%. The securities may be redeemed at par beginning in June, 2009 and each quarterly anniversary of such date until the securities mature on June 17, 2034. The principal asset of the Trust is $20.6 million of the Virginia Financial Group’s junior subordinated debt securities with the like maturities and like interest rates to the Capital Securities.
The Subordinated debt may be included in Tier 1 capital of the Company for regulatory capital adequacy determination purposes up to 25% of Tier I capital after its inclusion. The portion of the Subordinated debt not considered as Tier I capital may be included in Tier II capital.
The obligations of the Company with respect to the issuance of the capital securities constitute a full and unconditional guarantee by the Company of the Trust’s obligations with respect to the capital securities.
Subject to certain exceptions and limitations, the Company may elect from time to time to defer interest payments on the junior subordinated debt securities, which would result in a deferral of distribution payments on the related capital securities.
57
VIRGINIA FINANCIAL GROUP, INC. AND SUBSIDIARIES
Notes to Consolidated Financial Statements
(Dollars in Thousands, except share data)
Note 12. Commercial Paper and Other Borrowings
The Company has a line of credit agreement with a correspondent bank for general working capital needs. The $15 million line is unsecured, calls for variable interest payments and is payable on demand. There were no balances outstanding at December 31, 2006 and 2005, respectively.
Federal funds purchased generally mature within one to four days from the transaction date. There were no balances outstanding at December 31, 2006 and 2005, respectively.
Securities sold under agreements to repurchase, which are classified as secured borrowings, generally mature within one to four days from the transaction date. Securities sold under agreements to repurchase are reflected at the amount of cash received in connection with the transaction. Additional collateral may be required based on the fair value of the underlying securities. The balance outstanding at December 31, 2006 and 2005 was none and $15.9 million, respectively.
The average balance outstanding of other borrowings did not exceed 30 percent of stockholder’s equity during the year ended December 31, 2006.
One of the Company’s subsidiary bank’s has an agreement with the Federal Reserve Bank of Richmond where the bank can borrow funds deposited by its customers. This agreement calls for variable interest and is payable on demand. U.S. Government securities are pledged as collateral. The targeted threshold maximum amount available under this agreement is $6.0 million. The balance outstanding at December 31, 2006 and 2005 was $561.0 thousand and $841.8 thousand, respectively.
The Company, through its subsidiary banks, has uncollateralized, unused lines of credit totaling $92.4 million with nonaffiliated banks at December 31, 2006.
In 2005 the Company initiated a commercial paper program whereby customers of the affiliate banks can invest in unrated commercial paper of VFG. Terms include a daily maturity and floating rate of interest.
The following table shows certain information regarding the Company’s commercial paper:
| At or for the year ending December 31, | ||||||||
| 2006 | 2005 | |||||||
Commercial paper: | ||||||||
Average balance outstanding | $ | 50,530 | $ | 7,724 | ||||
Maximum amount outstanding at any month-end during the period | 68,784 | 24,480 | ||||||
Balance outstanding at end of period | 58,632 | 24,480 | ||||||
Average interest rate during the period | 4.50 | % | 3.30 | % | ||||
Weighted average interest rate at end of period | 4.82 | % | 3.39 | % | ||||
58
VIRGINIA FINANCIAL GROUP, INC. AND SUBSIDIARIES
Notes to Consolidated Financial Statements
(Dollars in Thousands, except share data)
Note 13. Stock-Based Compensation
Under the Company’s incentive stock option plan, the Company may grant options to purchase common stock to its directors, officers and employees of up to 750,000 newly issued shares of the Company’s common stock. The plan requires that options be granted at an exercise price equal to at least 100% of the fair market value of the common stock on the date of the grant. Such options vest over a five-year period and will expire in no more than ten years after the date of grant. The Company adopted SFAS 123R effective January 1, 2006 using the modified prospective method and as such, results for prior periods have not been restated. Prior to January 1, 2006, the value of restricted stock awards was expensed by the Company over the restriction period, and no compensation expense was recognized for stock option grants as all such grants had an exercise price not less than fair market value on the date of grant.
Effective January 1, 2006, the Company has adopted FASB Statement No. 123 (R), “Share-Based Payment”. Statement 123 (R) requires that compensation cost relating to share-based payment transactions be recognized in financial statements. The cost is measured based on the fair value of the equity or liability instruments issued.
Statement 123 (R) covers a wide range of share-based compensation arrangements including share options, restricted share plans, performance-based awards, share appreciation rights, and employee share purchase plans.
Statement 123 (R) replaces FASB Statement No. 123, “Accounting for Stock-Based Compensation” and supersedes APB Opinion No. 25, “Accounting For Stock Issued to Employees”. Statement 123, established as preferable a fair-value-based method of accounting for share-based payment transactions with employees. However, that Statement permitted entities the option of continuing to apply the guidance in Opinion 25, as long as the footnotes to financial statements disclosed what net income would have been had the preferable fair-value-based method been used.
Because the Company adopted Statement 123 (R) using the modified prospective transition method, prior periods have not been restated. Under this method, the Company is required to record compensation expense for all awards granted after the date of adoption and for the unvested portion of previously granted awards that remain outstanding as of the beginning of the period of adoption. The Company measured share-based compensation cost using the Black-Scholes option pricing model for stock option grants prior to January 1, 2006 and anticipates using this pricing mode for future grants. Forfeitures did not affect the calculated expense based upon historical activities of option grantees.
At December 31, 2006, the Company has one stock-based employee compensation plan. Share-based compensation of $420 thousand in the aggregate was recognized for the year ended December 31, 2006, which related to the unvested portion of options to acquire shares of Company common stock and restricted shares granted prior to January 1, 2006. Reported net income, adjusting for share-based compensation that would have been recognized in the adoption of Statement 123 (R) did not change the way that the Company has accounted for stock awards in prior periods and therefore no such change is reflected in the pro forma table below. The Company expenses the fair value of stock awards determined at the grant date on a straight-line basis over the vesting period of the award.
59
VIRGINIA FINANCIAL GROUP, INC. AND SUBSIDIARIES
Notes to Consolidated Financial Statements
(Dollars in Thousands, except share data)
For the year ended December 31, 2006 the Company recognized $210 thousand in compensation expense related to the vesting of stock options. A summary of the stock option plan at December 31, 2006, 2005 and 2004 and changes during the years ended on those dates is as follows:
| 2006 | 2005 | 2004 | |||||||||||||||||||
Number of Shares | Weighted Average Exercise Price | Number of Shares | Weighted Average Exercise Price | Number of Shares | Weighted Average Exercise Price | ||||||||||||||||
Outstanding at beginning of year | 149,150 | $ | 17.41 | 128,443 | $ | 14.73 | 118,518 | $ | 13.55 | ||||||||||||
Granted | 66,646 | 27.05 | 31,180 | 27.33 | 16,876 | 22.99 | |||||||||||||||
Forfeited | (4,457 | ) | 22.81 | — | — | (3,000 | ) | 21.25 | |||||||||||||
Expired | (1,200 | ) | 21.33 | — | — | — | — | ||||||||||||||
Exercised | (16,523 | ) | 10.63 | (10,473 | ) | 13.77 | (3,951 | ) | 9.73 | ||||||||||||
Outstanding at end of year | 193,616 | $ | 21.17 | 149,150 | $ | 17.41 | 128,443 | $ | 14.73 | ||||||||||||
Exercisable at end of year | 103,272 | 105,822 | 85,271 | ||||||||||||||||||
Weighted-average fair value per option of options granted during the year | $ | 7.48 | $ | 7.47 | $ | 8.09 | |||||||||||||||
The aggregate intrinsic value of the options outstanding as of December 31, 2006 was $1.4 million. The aggregate intrinsic value represents the total pre-tax intrinsic value (the difference between the Company’s closing stock price on the last trading day of the year ended December 31, 2006 and the exercise price, multiplied by the number of options outstanding). The aggregate intrinsic value of the options currently exercisable as of December 31, 2006 was $1.2 million. The weighted average remaining contractual life is 5.3 years for exercisable options at December 31, 2006.
As of December 31, 2006, there was $552 thousand of total unrecognized compensation expense related to nonvested options, respectively, which will be recognized over a weighted-average period of approximately 3.9 years.
The following table summarizes nonvested restricted shares outstanding as of December 31, 2006 and the related activity during the year:
Nonvested Shares | Number of Shares | Weighted-Average Fair Value | Total Intrinsic Value | |||||
Nonvested at January 1, 2006 | 26,644 | $ | 22.66 | $ | 640 | |||
Granted | 13,180 | 25.81 | — | |||||
Vested | 7,612 | 22.82 | 197 | |||||
Forfeited | 2,154 | 22.25 | — | |||||
Nonvested at December 31, 2006 | 30,058 | $ | 24.03 | $ | 841 | |||
The actual tax benefit realized for the tax deductions from option exercises under the Plan for the twelve months ended December 31, 2006 was $33 thousand. The impact of these cash receipts is included in financing activities in the accompanying consolidated statements of cash flows.
60
VIRGINIA FINANCIAL GROUP, INC. AND SUBSIDIARIES
Notes to Consolidated Financial Statements
(Dollars in Thousands, except share data)
The incentive stock option plan also allows for the issuance of restricted share awards. Restricted stock awards are independent of option grants and are generally subject to forfeiture if employment terminates prior to the release of the restrictions, generally three to five years from the date of grant. Restricted stock has dividend rights equal to the cumulative cash dividend accrued during the restriction period, which are paid upon expiration of the restriction and issuance of the shares. Restricted shares do not have the voting rights of common stock until the restriction expires and the shares are issued. The Company expenses the cost of the restricted stock awards, determined to be the fair value of the shares at the date of grant, ratably over the period of the restriction. Compensation expense associated with such awards amounted to $210 thousand, $332 thousand and $201 thousand for each of the three years ended December 31, 2006, respectively. The Company had 30,058 shares of restricted stock awarded and nonvested at December 31, 2006 with a total unrecognized compensation expense of $553 thousand, which will be recognized over a weighted-average period of approximately 1.9 years.
Note 14. Employee Benefit Plans
The Company and its banking subsidiaries maintain several tax qualified and non-qualified employee benefit plans for employees, which are described below.
The Company has a noncontributory pension plan which conforms to the Employee Retirement Income Security Act of 1974 (ERISA). The amount of benefits payable under the plan is determined by an employee’s period of credited service. The amount of normal retirement benefit will be determined based on a Pension Equity Credit formula. The employee receives credits based on their age and years of service. The plan provides for early retirement for participants with five years of service and the attainment of age 55. A participant who terminates employment with 2 or more years of service will be entitled to a benefit. The benefits are payable in single or joint/survivor annuities as well as a lump sum payment upon retirement or separation of service.
The Company adopted SFAS 158 effective as of the year ending December 31, 2006 regarding the recognition of the funded status of the benefit plan. The new standard requires an employer to recognize the overfunded or underfunded status of a defined benefit postretirement plan (other than a multiemployer plan) as an asset or liability in its statement of financial position and to recognize changes in that funded status in the year in which the changes occur through comprehensive income of a business entity. The standard also requires an employer to measure plan assets and benefit obligations as of the date of the employer’s fiscal year-end statement of financial position for fiscal years ending after December 15, 2008, and shall not be applied retrospectively.
The incremental effect of applying SFAS No. 158 on individual line items in the Consolidated Balance Sheets is as follows (In Thousands):
| Before Application of Statement 158 | Adjustments | After Application of Statement 158 | ||||||||||
Prepaid for pension benefits | $ | 129 | $ | (129 | ) | $ | — | |||||
Deferred income taxes | 151 | 188 | 339 | |||||||||
Intangible asset | 7 | (7 | ) | — | ||||||||
Total assets | 1,625,937 | 52 | 1,625,989 | |||||||||
Other liabilities | — | 401 | 401 | |||||||||
Total liabilities | 1,474,936 | 401 | 1,475,337 | |||||||||
Accumulated other comprehensive income | (677 | ) | (349 | ) | (1,026 | ) | ||||||
Total stockholders’ equity | 151,001 | (349 | ) | 150,652 | ||||||||
61
VIRGINIA FINANCIAL GROUP, INC. AND SUBSIDIARIES
Notes to Consolidated Financial Statements
(Dollars in Thousands, except share data)
Utilizing a measurement date of October 1, 2006 for the 2006 plan year, information about the plan follows:
| 2006 | 2005 | |||||||
Change in Benefit Obligation | ||||||||
Benefit obligation, beginning | $ | 4,389 | $ | 4,407 | ||||
Service cost | 170 | 179 | ||||||
Interest cost | 245 | 260 | ||||||
Actuarial (gain) loss | (259 | ) | 69 | |||||
Benefits paid | (174 | ) | (526 | ) | ||||
Benefit obligation, ending | $ | 4,371 | $ | 4,389 | ||||
Change in Plan Assets | ||||||||
Fair value of plan assets, beginning | $ | 2,992 | $ | 3,199 | ||||
Actual return on plan assets | 265 | 222 | ||||||
Employer contributions | 887 | 97 | ||||||
Benefits paid | (174 | ) | (526 | ) | ||||
Fair value of plan assets, ending | $ | 3,970 | $ | 2,992 | ||||
Funded status | $ | (401 | ) | $ | (1,397 | ) | ||
Unrecognized net actuarial gain | 963 | 1,304 | ||||||
Unrecognized prior service cost | 6 | 39 | ||||||
(Accrued liability) prepaid benefit cost included in balance sheet | $ | 568 | $ | (54 | ) | |||
Accumulated benefit obligation | $ | 3,689 | $ | 3,674 | ||||
Amount Recognized in Consolidated Balance Sheets | ||||||||
Prepaid benefit cost | $ | — | $ | (54 | ) | |||
Funded status liability | (401 | ) | — | |||||
Accrued benefit liability | — | (682 | ) | |||||
Deferred tax asset | 339 | 225 | ||||||
Intangible asset | — | 39 | ||||||
Accumulated other comprehensive income, net | 630 | 418 | ||||||
Net amount recognized | $ | 568 | $ | (54 | ) | |||
Information for pension plans with an accumulated benefit obligation in excess of plan assets | ||||||||
Projected benefit obligation | $ | 4,371 | $ | 4,389 | ||||
Accumulated benefit obligation | 3,689 | 3,674 | ||||||
Fair value of plan assets | 3,970 | 2,992 | ||||||
Increase in minimum liability included in other comprehensive income | — | 102 | ||||||
Components of Net Periodic Benefit Cost | 2006 | 2005 | 2004 | |||||||||
Service cost | $ | 170 | $ | 178 | $ | 196 | ||||||
Interest cost | 245 | 260 | 270 | |||||||||
Expected return on plan assets | (249 | ) | (266 | ) | (304 | ) | ||||||
Amortization of prior service cost | 32 | 32 | 32 | |||||||||
Amortization of net obligation at transition | — | — | — | |||||||||
Recognized net actuarial gain | 66 | 61 | 18 | |||||||||
Net periodic benefit cost | $ | 264 | $ | 265 | $ | 212 | ||||||
62
VIRGINIA FINANCIAL GROUP, INC. AND SUBSIDIARIES
Notes to Consolidated Financial Statements
(Dollars in Thousands, except share data)
Amounts recognized in other comprehensive income during the year ended December 31, 2006 are as follows:
Net actuarial loss | $ | 626 | |
Net obligation at transition | — | ||
Prior service cost | 4 | ||
Accumulated other comprehensive income | $ | 630 | |
Weighted-Average Assumptions for Benefit Obligation as of October 1,
| 2006 | 2005 | |||||
Discount Rate | 6.00 | % | 5.75 | % | ||
Expected Return on Plan Assets | 8.50 | % | 8.50 | % | ||
Rate of Compensation Increase | 4.00 | % | 4.00 | % |
Weighted-Average Assumptions for Net Periodic Benefit as of October 1,
| 2006 | 2005 | |||||
Discount Rate | 5.75 | % | 6.00 | % | ||
Expected Return on Plan Assets | 8.50 | % | 8.50 | % | ||
Rate of Compensation Increase | 4.00 | % | 4.00 | % |
The Company selects the expected long-term rate-of-return-on-assets assumption in consultation with their investment advisors and actuary. This rate is intended to reflect the average rate of earnings expected to be earned on the funds invested or to be invested to provide plan benefits. Historical performance is reviewed—especially with respect to real rates of return (net of inflation)—for the major asset classes held or anticipated to be held by the trust, and for the trust itself. Undue weight is not given to recent experience—that may not continue over the measurement period—with higher significance placed on current forecasts of future long-term economic conditions.
Because assets are held in a qualified trust, anticipated returns are not reduced for taxes. Further—solely for this purpose—the plan is assumed to continue in force and not terminate during the period during which assets are invested. However, consideration is given to the potential impact of current and future investment policy, cash flow into and out of the trust, and expenses (both investment and non-investment) typically paid from plan assets (to the extent such expenses are not explicitly estimated within periodic cost).
The plan’s weighted average asset allocations at December 31, 2006, and December 31, 2005, by asset category are as follows:
| Plan Assets at December 31 | ||||||
Asset Category | 2006 | 2005 | ||||
Money Markets and Equivalents | 20.7 | % | 10.6 | % | ||
Equity Securities | 69.4 | % | 82.7 | % | ||
Debt Securities | 9.9 | % | 6.7 | % | ||
Total | 100.0 | % | 100.0 | % | ||
63
VIRGINIA FINANCIAL GROUP, INC. AND SUBSIDIARIES
Notes to Consolidated Financial Statements
(Dollars in Thousands, except share data)
The investment policy and strategies for the plan assets can best be described as a capital growth and with current cash income strategy. The target allocation for equities is 75% of the total portfolio through the use of large and mid capitalization companies. The remaining asset allocation is to fixed income investments and money market funds. The portfolio is diversified by limiting the holding in any one equity issue to no more than 5% of total equities and one industry to no more than 25%. All fixed income investments are rated as investment grade with the majority of the assets in corporate issues. The assets are managed by the Company’s wholly-owned trust Corporation, Virginia Commonwealth Trust Corporation. The portfolio does not include any position in Virginia Financial Group, Inc.
The Company anticipates that the contribution level for 2007 will remain at a comparable level to that realized in 2006.
Estimated future benefit payments, which reflect expected future service, as appropriate, are as follows:
2007 | $ | 260 | |
2008 | 254 | ||
2009 | 281 | ||
2010 | 284 | ||
2011 | 394 | ||
2012-2016 | 2,788 | ||
| $ | 4,261 | ||
The estimated components of net periodic pension cost for fiscal year ended December 31, 2007 are as follows:
Service cost | $ | 177 | ||
Interest cost | 255 | |||
Expected return on plan assets | (292 | ) | ||
Amortization of Unrecognized: | ||||
Net obligation at transition | — | |||
Prior service cost | 32 | |||
Net loss | 41 | |||
Net periodic benefit cost | $ | 213 | ||
Defined Contribution Plans
The Company has a contribution retirement plan covering certain employees. Contributions amounted to $887 thousand, $625 thousand, and $682 thousand for the three years ended December 31, 2006, respectively.
The Company has a 401 (k) Savings Plan eligible to all employees with matching contributions equal to 100% of the first 3% and 50% of the next 2% of salary reduction contributions made by the employee. The Company contributed a matching contribution of $631 thousand, $600 thousand, and $599 thousand for the three years ended December 31, 2006, respectively.
Directors’ Deferred Plan
The Company has a non-qualified Directors Deferred Compensation Plan. This plan allows for the deferral of pre-tax income associated with payment of director fees. Directors may elect to defer all or a portion of their annual directors fees. Monthly board fees are contributed directly to a trust with various investment options, and are held until such time the director is entitled to receive a distribution.
64
VIRGINIA FINANCIAL GROUP, INC. AND SUBSIDIARIES
Notes to Consolidated Financial Statements
(Dollars in Thousands, except share data)
Deferred Compensation Plan
The Company also has a non-qualified Executive Deferred Compensation Plan for key employees. Pursuant to the plan, the President and any other employees selected by the Board of Directors may defer receipt of a certain amount of pre-tax income and cash incentive compensation for a period of no less than three years or until retirement, subject to termination of employment or certain other events, including an imminent change in control. The Board may make contributions at its discretion. The balance in this plan is recorded in both other assets and other liabilities on the Company’s consolidated balance sheet. The deferred compensation charged to expense totaled $50 thousand, $48 thousand, and $22 thousand for the three years ended December 31, 2006, respectively.
Bonus Plan
The Company has an incentive bonus plan under which employees receive compensation directly related to affiliate and Company profitability and budget performance. Compensation under the plan is calculated under pre-determined guidelines set by the Board of Directors. The balance in this plan is recorded in other liabilities on the Company’s consolidated balance sheet. The amount charged to operations was $1.3 million, $2.3 million, and $520 thousand for the three years ended December 31, 2006, respectively.
Supplemental Retirement Plan
The Company has supplemental retirements agreements with former executive officers of banks previously acquired, which provide benefits payable over fifteen years. The present value of the estimated liability under the agreements is being accrued using a discount rate of 10% and 7.5%, respectively, ratably over the remaining years to the date of eligibility for benefits. The deferred compensation expense charged to expense totaled $97 thousand, $64 thousand, and $49 thousand for the three years ended December 31, 2006, respectively.
Note 15. Income Taxes
The components of the net deferred tax asset, included in the Consolidated Balance Sheets, are as follows:
| December 31, | ||||||
| 2006 | 2005 | |||||
Deferred tax assets: | ||||||
Allowance for loan losses | $ | 5,075 | $ | 4,753 | ||
Nonaccrual loan interest | 28 | 137 | ||||
Deferred compensation | 1,320 | 1,138 | ||||
Securities available for sale | 213 | 859 | ||||
Pension liability | 339 | 225 | ||||
Core deposit intangible | 221 | 174 | ||||
Accrued stock compensation | 184 | — | ||||
Other | — | 124 | ||||
| $ | 7,380 | $ | 7,410 | |||
Deferred tax liabilities: | ||||||
Accrued pension asset | $ | 199 | $ | — | ||
Premises and equipment | 547 | 576 | ||||
FHLB stock dividend | 59 | 59 | ||||
Goodwill | 1,054 | 730 | ||||
Other | 75 | 101 | ||||
| $ | 1,934 | $ | 1,466 | |||
Net deferred tax asset | $ | 5,446 | $ | 5,944 | ||
65
VIRGINIA FINANCIAL GROUP, INC. AND SUBSIDIARIES
Notes to Consolidated Financial Statements
(Dollars in Thousands, except share data)
Income tax expense charged to operations for the years ended December 31, 2006, 2005 and 2004 consists of the following:
| 2006 | 2005 | 2004 | ||||||||||
Current tax expense | $ | 8,499 | $ | 9,209 | $ | 7,483 | ||||||
Deferred tax (benefit) | (34 | ) | (851 | ) | (918 | ) | ||||||
| $ | 8,465 | $ | 8,358 | $ | 6,565 | |||||||
Income tax expense differs from the amount of income tax determined by applying the U.S. federal income tax rate to pretax income due to the following:
| 2006 | 2005 | 2004 | |||||||||||||||||||
| Amount | Rate | Amount | Rate | Amount | Rate | ||||||||||||||||
Computed “expected” tax expense | $ | 9,818 | 35.0 | % | $ | 9,301 | 35.0 | % | $ | 7,619 | 35.0 | % | |||||||||
Increase (decrease) in income taxes resulting from: | |||||||||||||||||||||
Tax-exempt interest income, net | (1,131 | ) | -4.0 | % | (949 | ) | -3.6 | % | (1,066 | ) | -4.9 | % | |||||||||
Other | (222 | ) | — | 6 | — | 12 | — | ||||||||||||||
| $ | 8,465 | 30.2 | % | $ | 8,358 | 31.4 | % | $ | 6,565 | 30.1 | % | ||||||||||
Note 16. Related Party Transactions
In the ordinary course of business, the Banks grant loans to principal officers, directors and affiliates of the Company.
Aggregate loan transactions with related parties were as follows:
| 2006 | 2005 | |||||||
Beginning balance | $ | 22,530 | $ | 27,685 | ||||
New loans | 34,836 | 28,556 | ||||||
Repayments | (38,711 | ) | (33,711 | ) | ||||
Ending balance | $ | 18,655 | $ | 22,530 | ||||
Total related party deposits held at the VFG bank affiliates were $13.7 million and $7.9 million at December 31, 2006 and 2005, respectively.
66
VIRGINIA FINANCIAL GROUP, INC. AND SUBSIDIARIES
Notes to Consolidated Financial Statements
(Dollars in Thousands, except share data)
Note 17. Earnings Per Share
The following shows the weighted average number of shares used in computing earnings per share and the effect on weighted average number of shares of diluted potential common stock. Potential dilutive common stock had no effect on income available to common stockholders.
| 2006 | 2005 | 2004 | |||||||||||||
| Weighted Average Shares | Per Share Amount | Weighted Average Shares | Per Share Amount | Weighted Average Shares | Per Share Amount | ||||||||||
Basic earnings per share | 10,770,969 | $ | 1.81 | 10,752,041 | $ | 1.69 | 10,737,861 | $ | 1.42 | ||||||
Effect of dilutive securities: | |||||||||||||||
Restricted stock | 32,110 | — | 28,284 | — | 18,362 | — | |||||||||
Stock options | 40,277 | .01 | 43,615 | .01 | 46,403 | .01 | |||||||||
Diluted earnings per share | 10,843,356 | $ | 1.80 | 10,823,940 | $ | 1.68 | 10,802,626 | $ | 1.41 | ||||||
Stock options representing 95,376, 21,348 and 9,425 shares at December 31, 2006, 2005 and 2004, respectively, were not included in the calculation of earnings per share as their effect would have been anti-dilutive.
Note 18. Stock Split and Par Value Change
On September 6, 2006, the Company paid a three-for-two stock split in the form of a 50% stock dividend. Shareholders of record at the close of business on August 14, 2006 received one additional share of the Company’s common stock for every two shares held on that date. On August 24, 2006, the Company’s Articles of Incorporation were amended to decrease the par value of the Company’s common stock from $5 per share to $1 per share. All references in the accompanying consolidated financial statements and notes thereto to the number of common shares and per share amounts for all periods presented have been restated to reflect the three-for-two stock split.
Note 19. Commitments and Contingent Liabilities
The Company has noncancellable leases covering certain premises and equipment.
Total rent expense applicable to operating leases was $596 thousand, $569 thousand and $553 thousand for 2006, 2005 and 2004, respectively, and was included in occupancy expense.
The following is a schedule by year of future minimum lease requirements required under the long-term noncancellable lease agreements:
2007 | $ | 606 | |
2008 | 517 | ||
2009 | 363 | ||
2010 | 211 | ||
2011 | 160 | ||
Thereafter | 1,550 | ||
Total | $ | 3,407 | |
67
VIRGINIA FINANCIAL GROUP, INC. AND SUBSIDIARIES
Notes to Consolidated Financial Statements
(Dollars in Thousands, except share data)
There are no material proceedings to which the Company or any of our subsidiaries are a party or by which, to the Company’s knowledge, we, or any subsidiaries, are threatened. All legal proceedings presently pending or threatened against the Company or our subsidiaries involve routine litigation incidental to the business of the Company or the subsidiary involved and are not material in respect to the amount in controversy.
In the normal course of business there are outstanding various commitments and contingent liabilities, which are not reflected in the accompanying financial statements. Management does not anticipate any material losses as a result of these transactions.
See Note 21 with respect to financial instruments with off-balance sheet risk.
Note 20. Restrictions on Transfers to Parent
Federal and state banking regulations place certain restrictions on dividends paid and loans or advances made by the subsidiary banks to the Company. The total amount of dividends which may be paid at any date is generally limited to a portion of retained earnings as defined.
During 2006, the banking subsidiaries and the non-bank subsidiaries paid $12.5 million in dividends to the Company. As of January 1, 2007, the aggregate amount of additional unrestricted funds, which could be transferred from the banking subsidiaries to the Parent Company without prior regulatory approval totaled $42.1 million or 27.9% of the consolidated net assets.
In addition, dividends paid by the subsidiary banks to the Company would be prohibited if the effect thereof would cause the subsidiary banks’ capital to be reduced below applicable minimum capital requirements.
Note 21. Financial Instruments with Off-Balance-Sheet Risk
The Company, through its banking subsidiaries, is party to credit related financial instruments with off-balance-sheet risk in the normal course of business to meet the financing needs of its customers. These financial instruments include commitments to extend credit and standby letters of credit. These instruments involve, to varying degrees, elements of credit risk and interest rate risk in excess of the amount recognized in the balance sheet. The contract amount of those instruments reflects the extent of involvement the Company has in particular classes of financial instruments.
The Company’s exposure to credit loss in the event of nonperformance by the other party to the financial instrument for commitments to extend credit and standby letters of credit is represented by the contractual amount of those instruments. The Company uses the same credit policies in making commitments and conditional obligations as it does for on-balance-sheet instruments.
At December 31, 2006 and 2005 the following financial instruments were outstanding whose contract amounts represent credit risk:
| 2006 | 2005 | |||||
Commitments to extend credit | $ | 370,575 | $ | 397,341 | ||
Standby letters of credit | 15,634 | 16,602 | ||||
Mortgage loans sold with potential recourse | 50,648 | 53,776 | ||||
Commitments to extend credit are agreements to lend to a customer as long as there is no violation of any condition established in the contract. Commitments generally have fixed expiration dates or other termination clauses and may require payment of a fee. The commitments for equity lines of credit may expire without being drawn upon. Therefore, the total commitment amounts do not necessarily represent future cash requirements. The amount of collateral obtained, if it is deemed necessary by the Company, is based on management’s credit evaluation of the customer.
68
VIRGINIA FINANCIAL GROUP, INC. AND SUBSIDIARIES
Notes to Consolidated Financial Statements
(Dollars in Thousands, except share data)
Unfunded commitments under commercial lines of credit, revolving credit lines and overdraft protection agreements are commitments for possible future extensions of credit to existing customers. These lines of credit are usually uncollateralized and do not always contain a specified maturity date and may not be drawn upon to the total extent to which the Company is committed.
Standby letters of credit are conditional commitments issued by the Company to guarantee the performance of a customer to a third party. The credit risk involved in issuing letters of credit is essentially the same as that involved in extending loan facilities to customers. The Company generally holds collateral supporting those commitments, if deemed necessary. The Company, through its banking subsidiaries, originates loans for sale to secondary market investors subject to contractually specified and limited recourse provisions. In 2006, the Company originated $134 million and sold $139 million to investors, compared to $177 million originated and $176 million sold in 2005. Most contracts with investors contain certain recourse language which may vary from 90 days up to twelve months. The Company may have an obligation to repurchase a loan if the mortgagor has defaulted early in the loan term. Mortgages subject to recourse are collateralized by single family residences, have loan-to-value ratios of 80% or less, or have private mortgage insurance or are insured or guaranteed by an agency of the United States government. At December 31, 2006, the Company had locked-rate commitments to originate mortgage loans amounting to approximately $10.8 million and loans held for sale of $7.6 million. The Company has entered into commitments, on a best-effort basis to sell loans of approximately $18.4 million. Risks arise from the possible inability of counterparties to meet the terms of their contracts. The Company does not expect any counterparty to fail to meet its obligations.
The Company maintains cash accounts in other commercial banks. The amount on deposit at December 31, 2006 exceeded the insurance limits of the Federal Deposit Insurance Corporation by $242 thousand.
Note 22. Fair Value of Financial Instruments and Interest Rate Risk
The fair value of a financial instrument is the current amount that would be exchanged between willing parties, other than in a forced liquidation. Fair value is best determined based upon quoted market prices. However, in many instances, there are no quoted market prices for the Company’s various financial instruments. In cases where quoted market prices are not available, fair values are based on estimates using present value or other valuation techniques.
Those techniques are significantly affected by the assumptions used, including the discount rate and estimates of future cash flows. Accordingly, the fair value estimates may not be realized in an immediate settlement of the instrument. Accordingly, the aggregate fair value amounts presented may not necessarily represent the underlying fair value of the Company.
The following methods and assumptions were used to estimate the fair value of each class of financial instruments for which it is practicable to estimate that value:
Cash and Short-Term Investments
For those short-term instruments, the carrying amount is a reasonable estimate of fair value.
Investment Securities
For securities and marketable equity securities held for investment purposes, fair values are based on quoted market prices or dealer quotes. For other securities held as investments, fair value equals quoted market price, if available. If a quoted market price is not available, fair value is estimated using quoted market prices for similar securities. Restricted stock is carried at cost.
Loans Held for Sale
Loans originated or intended for sale in the secondary market are carried at the lower of cost or estimated fair value in the aggregate. Net unrealized losses, if any, are recognized through a valuation allowance by charges to income.
69
VIRGINIA FINANCIAL GROUP, INC. AND SUBSIDIARIES
Notes to Consolidated Financial Statements
(Dollars in Thousands, except share data)
Loans
For variable-rate loans that re-price frequently and with no significant changes in credit risk, fair values are based on carrying values. The fair values for other loans were estimated using discounted cash flow analyses, using interest rates currently being offered.
Deposit Liabilities
The fair value of demand deposits, savings accounts, and certain money market deposits is the amount payable on demand at the reporting date. The fair value of fixed-maturity certificates of deposit is estimated using the rates currently offered for deposits of similar remaining maturities.
Short-Term Borrowings
The carrying amounts of federal funds purchased, borrowings under repurchase agreements, and other short-term borrowings maturing within 90 days approximate their fair values. Fair values of other short-term borrowings are estimated using discounted cash flow analyses on the Company’s current incremental borrowing rates for similar types of borrowing arrangements.
Commercial Paper / Other Borrowings
The carrying amounts of commercial paper and other borrowings maturing within 90 days approximate their fair values. Fair values of commercial paper and other borrowings are estimated using discounted cash flow analyses on the Company’s current incremental borrowing rates for similar types of borrowing arrangements.
Federal Home Loan Bank Advances
The fair values of the Company’s Federal Home Loan Bank advances are estimated using discounted cash flow analyses based on the Company’s current incremental borrowing rates for similar types of borrowing arrangements.
Subordinated Debt
The values of the Company’s subordinated debt is variable rate instruments that reprice frequently, therefore, carrying value is assumed to approximate fair value.
Accrued Interest
The carrying amounts of accrued interest approximate fair value.
Off-Balance-Sheet Financial Instruments
The fair value of commitments to extend credit is estimated using the fees currently charged to enter into similar agreements, taking into account the remaining terms of the agreements and the present creditworthiness of the counterparties. For fixed-rate loan commitments, fair value also considers the difference between current levels of interest rates and the committed rates.
The fair value of stand-by letters of credit is based on fees currently charged for similar agreements or on the estimated cost to terminate them or otherwise settle the obligations with the counterparties at the reporting date.
At December 31, 2006, and 2005, the fair value of loan commitments and stand-by letters of credit was immaterial.
70
VIRGINIA FINANCIAL GROUP, INC. AND SUBSIDIARIES
Notes to Consolidated Financial Statements
(Dollars in Thousands, except share data)
The estimated fair values of the Company’s financial instruments are as follows:
| 2006 | 2005 | |||||||||||
| Carrying Amount | Fair Value | Carrying Amount | Fair Value | |||||||||
Financial assets: | ||||||||||||
Cash and short-term investments | $ | 57,635 | $ | 57,635 | $ | 48,016 | $ | 48,016 | ||||
Securities | 264,141 | 264,152 | 241,032 | 241,139 | ||||||||
Loans held for sale | 7,640 | 7,640 | 9,223 | 9,223 | ||||||||
Loans, net | 1,203,132 | 1,187,290 | 1,129,495 | 1,117,476 | ||||||||
Interest receivable | 8,197 | 8,197 | 6,583 | 6,583 | ||||||||
Financial liabilities: | ||||||||||||
Deposits | $ | 1,318,281 | $ | 1,312,005 | $ | 1,255,509 | $ | 1,248,327 | ||||
Federal funds purchased and securities sold under agreements to repurchase | — | — | 15,890 | 15,890 | ||||||||
Federal Home Loan Bank advances | 65,000 | 65,065 | 40,000 | 39,878 | ||||||||
Trust preferred capital notes | 20,619 | 20,615 | 20,619 | 20,619 | ||||||||
Other borrowings | 59,193 | 59,193 | 25,322 | 25,322 | ||||||||
Interest payable | 4,274 | 4,274 | 2,515 | 2,515 | ||||||||
Note 23. Regulatory Matters
The Company (on a consolidated basis) and the subsidiary banks are subject to various regulatory capital requirements administered by the federal banking agencies. Failure to meet minimum capital requirements can initiate certain mandatory and possibly additional discretionary actions by regulators that, if undertaken, could have a direct material effect on the Company’s and subsidiary banks’ financial statements. Under capital adequacy guidelines and the regulatory framework for prompt corrective action under FDICIA, the Company and the subsidiary banks must meet specific capital guidelines that involve quantitative measures of their assets, liabilities, and certain off-balance-sheet items as calculated under regulatory accounting practices. The capital amounts and classification are also subject to qualitative judgments by the regulators about components, risk weightings, and other factors. Prompt corrective action provisions are not applicable to bank holding companies.
Quantitative measures established by regulation to ensure capital adequacy require the Company and the subsidiary banks to maintain minimum amounts and ratios (set forth in the table below) of total and Tier 1 capital (as defined in the regulations) to risk-weighted assets (as defined), and of Tier 1 capital (as defined) to average assets (as defined). Management believes, as of December 31, 2006 and 2005, that the Company and subsidiary banks met all capital adequacy requirements to which they are subject.
As of December 31, 2006, the most recent notification from the Federal Reserve Bank and the Federal Deposit Insurance Corporation categorized the subsidiary banks as well capitalized under the regulatory framework for prompt corrective action. To be categorized as well capitalized, the institutions must maintain minimum total risk-based, Tier 1 risk-based, and Tier 1 leverage ratios as set forth in the following tables. There are no conditions or events since the notification that management believes have changed the institutions’ category.
71
VIRGINIA FINANCIAL GROUP, INC. AND SUBSIDIARIES
Notes to Consolidated Financial Statements
(Dollars in Thousands, except share data)
| Actual | Minimum Capital Requirement | Minimum To Be Well Capitalized Under Prompt Corrective Action Provisions | ||||||||||||||||
| Amount | Ratio | Amount | Ratio | Amount | Ratio | |||||||||||||
As of December 31, 2006: | ||||||||||||||||||
Total Capital (to Risk Weighted Assets): | ||||||||||||||||||
Consolidated | $ | 168,419 | 12.44 | % | $ | 108,289 | 8.00 | % | N/A | N/A | ||||||||
Second Bank & Trust | $ | 47,330 | 14.48 | % | $ | 26,155 | 8.00 | % | $ | 32,694 | 10.00 | % | ||||||
Virginia Heartland Bank | $ | 28,693 | 11.65 | % | $ | 19,709 | 8.00 | % | $ | 24,636 | 10.00 | % | ||||||
Planters Bank & Trust | $ | 88,171 | 11.50 | % | $ | 61,310 | 8.00 | % | $ | 76,638 | 10.00 | % | ||||||
Tier 1 Capital (to Risk Weighted Assets): | ||||||||||||||||||
Consolidated | $ | 153,658 | 11.35 | % | $ | 54,145 | 4.00 | % | N/A | N/A | ||||||||
Second Bank & Trust | $ | 44,235 | 13.53 | % | $ | 13,078 | 4.00 | % | $ | 19,616 | 6.00 | % | ||||||
Virginia Heartland Bank | $ | 26,107 | 10.60 | % | $ | 9,854 | 4.00 | % | $ | 14,782 | 6.00 | % | ||||||
Planters Bank & Trust | $ | 79,353 | 10.35 | % | $ | 30,655 | 4.00 | % | $ | 45,983 | 6.00 | % | ||||||
Tier 1 Capital (to Average Assets): | ||||||||||||||||||
Consolidated | $ | 153,658 | 9.65 | % | $ | 63,694 | 4.00 | % | N/A | N/A | ||||||||
Second Bank & Trust | $ | 44,235 | 10.25 | % | $ | 17,259 | 4.00 | % | $ | 21,574 | 5.00 | % | ||||||
Virginia Heartland Bank | $ | 26,107 | 8.95 | % | $ | 11,662 | 4.00 | % | $ | 14,577 | 5.00 | % | ||||||
Planters Bank & Trust | $ | 79,353 | 9.44 | % | $ | 33,638 | 4.00 | % | $ | 42,048 | 5.00 | % | ||||||
As of December 31, 2005: | ||||||||||||||||||
Total Capital (to Risk Weighted Assets): | ||||||||||||||||||
Consolidated | $ | 153,227 | 12.18 | % | $ | 100,633 | 8.00 | % | N/A | N/A | ||||||||
Second Bank & Trust | $ | 45,217 | 12.56 | % | $ | 28,795 | 8.00 | % | $ | 35,994 | 10.00 | % | ||||||
Virginia Heartland Bank | $ | 26,032 | 10.98 | % | $ | 18,975 | 8.00 | % | $ | 23,719 | 10.00 | % | ||||||
Planters Bank & Trust | $ | 75,869 | 11.50 | % | $ | 52,756 | 8.00 | % | $ | 65,945 | 10.00 | % | ||||||
Tier 1 Capital (to Risk Weighted Assets): | ||||||||||||||||||
Consolidated | $ | 139,528 | 11.09 | % | $ | 50,316 | 4.00 | % | N/A | N/A | ||||||||
Second Bank & Trust | $ | 41,300 | 11.47 | % | $ | 14,398 | 4.00 | % | $ | 21,596 | 6.00 | % | ||||||
Virginia Heartland Bank | $ | 23,559 | 9.93 | % | $ | 9,488 | 4.00 | % | $ | 14,231 | 6.00 | % | ||||||
Planters Bank & Trust | $ | 68,678 | 10.41 | % | $ | 26,378 | 4.00 | % | $ | 39,567 | 6.00 | % | ||||||
Tier 1 Capital (to Average Assets): | ||||||||||||||||||
Consolidated | $ | 139,528 | 9.32 | % | $ | 59,893 | 4.00 | % | N/A | N/A | ||||||||
Second Bank & Trust | $ | 41,300 | 9.00 | % | $ | 18,364 | 4.00 | % | $ | 23,005 | 5.00 | % | ||||||
Virginia Heartland Bank | $ | 23,559 | 8.49 | % | $ | 11,100 | 4.00 | % | $ | 13,875 | 5.00 | % | ||||||
Planters Bank & Trust | $ | 68,978 | 8.96 | % | $ | 30,644 | 4.00 | % | $ | 38,305 | 5.00 | % | ||||||
72
VIRGINIA FINANCIAL GROUP, INC. AND SUBSIDIARIES
Notes to Consolidated Financial Statements
(Dollars in Thousands)
Note 24. Parent Company Only Financial Statements
VIRGINIA FINANCIAL GROUP, INC.
(Parent Company Only)
Balance Sheets
December 31, 2006 and 2005
| 2006 | 2005 | |||||||
Assets | ||||||||
Cash and due from banks | $ | 12,500 | $ | 21,791 | ||||
Securities available for sale | 42,173 | 7,174 | ||||||
Investment in subsidiaries | 167,575 | 151,043 | ||||||
Premises and equipment, net | 1,663 | 1,997 | ||||||
Income taxes receivable | 311 | 22 | ||||||
Accrued interest receivable | 533 | 30 | ||||||
Bank owned life insurance | 3,730 | — | ||||||
Deferred income tax asset | 575 | 555 | ||||||
Other assets | 5,116 | 3,583 | ||||||
Total assets | $ | 234,176 | $ | 186,195 | ||||
Liabilities | ||||||||
Subordinated debt | $ | 20,619 | $ | 20,619 | ||||
Commercial paper | 58,632 | 24,480 | ||||||
Other liabilities | 4,273 | 4,991 | ||||||
Total liabilities | $ | 83,524 | $ | 50,090 | ||||
Stockholders’ Equity | ||||||||
Preferred stock | $ | — | $ | — | ||||
Common | 10,784 | 10,759 | ||||||
Additional paid-in capital | 33,970 | 33,298 | ||||||
Retained earnings | 106,924 | 94,061 | ||||||
Accumulated other comprehensive loss, net | (1,026 | ) | (2,013 | ) | ||||
Total stockholders’ equity | $ | 150,652 | $ | 136,105 | ||||
Total liabilities and stockholders’ equity | $ | 234,176 | $ | 186,195 | ||||
73
VIRGINIA FINANCIAL GROUP, INC. AND SUBSIDIARIES
Notes to Consolidated Financial Statements
(Dollars in Thousands)
VIRGINIA FINANCIAL GROUP, INC.
(Parent Company Only)
Statements of Income
Years Ended December 31, 2006, 2005 and 2004
| 2006 | 2005 | 2004 | |||||||||
Income | |||||||||||
Dividends from subsidiaries | $ | 12,500 | $ | 2,750 | $ | — | |||||
Interest on investments | |||||||||||
Taxable | 2,099 | 421 | 112 | ||||||||
Nontaxable | 33 | 12 | — | ||||||||
Dividends | 30 | 18 | 30 | ||||||||
Management fee income | 13,016 | 9,461 | 7,520 | ||||||||
(Loss) gain on sale of securities | (18 | ) | 296 | (232 | ) | ||||||
Miscellaneous income | 219 | 145 | 111 | ||||||||
Total income | $ | 27,879 | $ | 13,103 | $ | 7,541 | |||||
Expenses | |||||||||||
Compensation and employee benefits | $ | 9,127 | $ | 6,893 | $ | 4,881 | |||||
Supplies and equipment | 1,544 | 1,441 | 1,724 | ||||||||
Professional fees | 585 | 604 | 643 | ||||||||
Director fees | 265 | 257 | 275 | ||||||||
Interest | 3,911 | 1,516 | 723 | ||||||||
Other operating expenses | 2,419 | 1,906 | 1,551 | ||||||||
Total expenses | $ | 17,851 | $ | 12,617 | $ | 9,797 | |||||
Income (loss) before income tax benefit and undistributed equity in subsidiaries | $ | 10,028 | $ | 486 | $ | (2,256 | ) | ||||
Income tax benefit | 917 | 776 | 885 | ||||||||
Income (loss) before undistributed equity in subsidiaries | $ | 10,945 | $ | 1,262 | $ | (1,371 | ) | ||||
Undistributed equity in subsidiaries | 8,552 | 16,954 | 16,574 | ||||||||
Net income | $ | 19,497 | $ | 18,216 | $ | 15,203 | |||||
74
VIRGINIA FINANCIAL GROUP, INC. AND SUBSIDIARIES
Notes to Consolidated Financial Statements
(Dollars in Thousands)
VIRGINIA FINANCIAL GROUP, INC.
(Parent Company Only)
Statements of Cash Flows
Years Ended December 31, 2006, 2005 and 2004
| 2006 | 2005 | 2004 | ||||||||||
Cash Flows from Operating Activities | ||||||||||||
Net | $ | 19,497 | $ | 18,216 | $ | 15,203 | ||||||
Adjustments to reconcile net income to net cash provided by operating activities: | ||||||||||||
Depreciation | 854 | 986 | 1,084 | |||||||||
Deferred tax benefit | (24 | ) | (139 | ) | (71 | ) | ||||||
Employee benefit plan expense | 80 | 80 | 39 | |||||||||
Stock-based compensation expense | 420 | 332 | 201 | |||||||||
(Gain) loss on sale of securities available for sale | — | (296 | ) | 232 | ||||||||
Amortization of security premiums and accretion of discounts, net | (278 | ) | (36 | ) | (57 | ) | ||||||
Undistributed earnings of subsidiaries | (8,552 | ) | (16,954 | ) | (16,574 | ) | ||||||
Income on bank owned life insurance | (85 | ) | — | — | ||||||||
(Increase) decrease in taxes receivable | (289 | ) | 68 | 116 | ||||||||
Increase in accrued interest receivable | �� | (503 | ) | (6 | ) | (24 | ) | |||||
Increase in other assets | (1,535 | ) | (463 | ) | (85 | ) | ||||||
(Decrease) increase in other liabilities | (1,124 | ) | 1,100 | 168 | ||||||||
Net cash provided by operating activities | $ | 8,461 | $ | 2,888 | $ | 232 | ||||||
Cash Flows from Investing Activities | ||||||||||||
Proceeds from sales of securities available for sale | $ | — | $ | 1,582 | $ | 1,323 | ||||||
Proceeds from maturities and principal payments of securities available for | 15,000 | — | — | |||||||||
Purchase of securities available for sale | (49,382 | ) | (976 | ) | (7,237 | ) | ||||||
Purchase of premises and equipment | (594 | ) | (1,043 | ) | (376 | ) | ||||||
Proceeds from sale of premises and equipment | 74 | — | — | |||||||||
Proceeds from sale foreclosed assets | — | — | 534 | |||||||||
Purchase of foreclosed assets | — | — | (547 | ) | ||||||||
Purchase of bank owned life insurance | (3,645 | ) | — | — | ||||||||
Capital contributed to subsidiary | (7,000 | ) | — | (3,000 | ) | |||||||
Net cash used in investing activities | $ | (45,547 | ) | $ | (437 | ) | $ | (9,303 | ) | |||
Cash Flows from Financing Activities | ||||||||||||
Net increase in commercial paper | $ | 34,152 | $ | 24,480 | $ | — | ||||||
Net decrease in other borrowings | — | — | (6,500 | ) | ||||||||
Issuance of subordinated debt | — | — | 20,619 | |||||||||
Proceeds from exercise of stock options | 277 | 144 | 38 | |||||||||
Cash dividends paid | (6,634 | ) | (6,024 | ) | (5,589 | ) | ||||||
Net cash provided by financing activities | $ | 27,795 | $ | 18,600 | $ | 8,568 | ||||||
(Decrease) increase in cash and cash equivalents | $ | (9,291 | ) | $ | 21,051 | $ | (503 | ) | ||||
Cash and Cash Equivalents | ||||||||||||
Beginning | 21,791 | 740 | 1,243 | |||||||||
Ending | $ | 12,500 | $ | 21,791 | $ | 740 | ||||||
75
VIRGINIA FINANCIAL GROUP, INC. AND SUBSIDIARIES
Notes to Consolidated Financial Statements
(Dollars in Thousands)
Note 25. Unaudited Interim Financial Information
The results of operations for each of the quarters during the two years ended December 31, 2006 and 2005 are summarized below:
2006 Quarter Ended | ||||||||||||
| March 31, | June 30, | September 30, | December 31, | |||||||||
Interest income | $ | 22,173 | $ | 23,464 | $ | 24,751 | $ | 25,239 | ||||
Interest expense | 7,308 | 8,222 | 9,582 | 10,370 | ||||||||
Net interest income | 14,865 | 15,242 | 15,169 | 14,869 | ||||||||
Provision for loan losses | 510 | 100 | — | 140 | ||||||||
Total net interest income after provision | 14,355 | 15,142 | 15,169 | 14,729 | ||||||||
Non interest income | 3,726 | 3,879 | 3,898 | 3,982 | ||||||||
Non interest expense | 11,647 | 11,455 | 11,759 | 12,057 | ||||||||
Income before income taxes | 6,434 | 7,566 | 7,308 | 6,654 | ||||||||
Provision for income taxes | 1,971 | 2,326 | 2,239 | 1,929 | ||||||||
Net income | 4,463 | 5,240 | 5,069 | 4,725 | ||||||||
Net income per share | ||||||||||||
basic | 0.41 | 0.49 | 0.47 | 0.44 | ||||||||
diluted | 0.41 | 0.48 | 0.47 | 0.44 | ||||||||
2005 Quarter Ended | ||||||||||||
| March 31, | June 30, | September 30, | December 31, | |||||||||
Interest income | $ | 18,584 | $ | 19,505 | $ | 20,697 | $ | 21,920 | ||||
Interest expense | 5,398 | 5,718 | 6,040 | 6,705 | ||||||||
Net interest income | 13,186 | 13,787 | 14,657 | 15,215 | ||||||||
Provision for loan losses | 546 | 546 | 503 | 417 | ||||||||
Total net interest income after provision | 12,640 | 13,241 | 14,154 | 14,798 | ||||||||
Non interest income | 3,694 | 4,085 | 3,870 | 3,794 | ||||||||
Non interest expense | 10,534 | 10,801 | 11,094 | 11,273 | ||||||||
Income before income taxes | 5,800 | 6,525 | 6,930 | 7,319 | ||||||||
Provision for income taxes | 1,787 | 2,054 | 2,211 | 2,306 | ||||||||
Net income | 4,013 | 4,471 | 4,719 | 5,013 | ||||||||
Net income per share | ||||||||||||
basic | 0.37 | 0.42 | 0.44 | 0.47 | ||||||||
diluted | 0.37 | 0.41 | 0.43 | 0.46 | ||||||||
76
| Item 9. | CHANGES IN AND DISAGREEMENTS WITH ACCOUNTANTS ON ACCOUNTING AND FINANCIAL DISCLOSURE |
Not applicable.
| Item 9A. | CONTROLS AND PROCEDURES |
Disclosure Controls and Procedures.The Company, under the supervision and with the participation of the Company’s management, including the Company’s Chief Executive Officer and the Chief Financial Officer, has evaluated the effectiveness of the Company’s disclosure controls and procedures as of the end of the period covered by this report. Based on that evaluation, the Chief Executive Officer and the Chief Financial Officer have concluded that as of December 31, 2006 the Company’s disclosure controls and procedures were effective to ensure that information required to be disclosed by the Company in reports that it files or submits under the Securities Exchange Act of 1934 is recorded, processed, summarized and reported within the time periods specified in Securities and Exchange Commission rules and regulations and that such information is accumulated and communicated to the Company’s’ management, including the Company’s Chief Executive Officer and Chief Financial Officer, as appropriate to allow timely decisions regarding required disclosure. Because of the inherent limitations in all control systems, no evaluation of controls can provide absolute assurance that the Company’s disclosure controls and procedures will detect or uncover every situation involving the failure of persons within the Company or its subsidiary to disclose material information otherwise required to be set forth in the Company’s periodic reports.
Management’s Report on Internal Control over Financial Reporting.Management of the Company is responsible for establishing and maintaining adequate internal control over financial reporting as defined in Rule 13a-15(f) under the Securities Exchange Act of 1934. The Company’s internal control over financial reporting is designed to provide reasonable assurance to the Company’s management and board of directors regarding the reliability of financial reporting and the preparation of financial statements for external purposes in accordance with generally accepted accounting principals.
Because of its inherent limitations, internal control over financial reporting may not prevent or detect misstatements. Therefore, even those systems determined to be effective can provide only reasonable assurance with respect to financial statement preparation and presentation.
Management assessed the effectiveness of the Company’s internal control over financial reporting as of December 31, 2006. In making this assessment, management used the criteria set forth by the Committee of Sponsoring Organizations of the Treadway Commission (“COSO”) inInternal Control – Integrated Framework. Based on our assessment, we believe that, as of December 31, 2006, the Company’s internal control over financial reporting was effective based on those criteria.
Management’s assessment of the effectiveness of internal control over financial reporting as of December 31, 2006 has been audited by Grant Thornton, L.L.P., the independent registered public accounting firm who also audited the Company’s consolidated financial statements included in this Annual Report on Form 10-K. Grant Thornton, LLP’s attestation report on management’s assessment of the Company’s internal control over financial reporting follows this report.
77
REPORT OF INDEPENDENT REGISTERED PUBLIC ACCOUNTING FIRM
The Shareholders and Directors of
Virginia Financial Group, Inc. and subsidiaries
We have audited management’s assessment, included in the accompanying Management’s Report on Internal Control Over Financial Reporting, that Virginia Financial Group, Inc. (a Virginia Corporation) and subsidiaries maintained effective internal control over financial reporting as of December 31, 2006, based on criteria established inInternal Control—Integrated Frameworkissued by the Committee of Sponsoring Organizations of the Treadway Commission (COSO). Virginia Financial Group’s management is responsible for maintaining effective internal control over financial reporting and for its assessment of the effectiveness of internal control over financial reporting. Our responsibility is to express an opinion on management’s assessment and an opinion on the effectiveness of the company’s internal control over financial reporting based on our audit.
We conducted our audit in accordance with the standards of the Public Company Accounting Oversight Board (United States). Those standards require that we plan and perform the audit to obtain reasonable assurance about whether effective internal control over financial reporting was maintained in all material respects. Our audit included obtaining an understanding of internal control over financial reporting, evaluating management’s assessment, testing and evaluating the design and operating effectiveness of internal control, and performing such other procedures as we considered necessary in the circumstances. We believe that our audit provides a reasonable basis for our opinions.
A company’s internal control over financial reporting is a process designed to provide reasonable assurance regarding the reliability of financial reporting and the preparation of financial statements for external purposes in accordance with generally accepted accounting principles. A company’s internal control over financial reporting includes those policies and procedures that (1) pertain to the maintenance of records that, in reasonable detail, accurately and fairly reflect the transactions and dispositions of the assets of the company; (2) provide reasonable assurance that transactions are recorded as necessary to permit preparation of financial statements in accordance with generally accepted accounting principles, and that receipts and expenditures of the company are being made only in accordance with authorizations of management and directors of the company; and (3) provide reasonable assurance regarding prevention or timely detection of unauthorized acquisition, use, or disposition of the company’s assets that could have a material effect on the financial statements.
Because of its inherent limitations, internal control over financial reporting may not prevent or detect misstatements. Also, projections of any evaluation of effectiveness to future periods are subject to the risk that controls may become inadequate because of changes in conditions, or that the degree of compliance with the policies or procedures may deteriorate.
In our opinion, management’s assessment that Virginia Financial Group, Inc. maintained effective internal control over financial reporting as of December 31, 2006, is fairly stated, in all material respects, based on criteria established inInternal Control—Integrated Frameworkissued by the Committee of Sponsoring Organizations of the Treadway Commission (COSO). Also in our opinion, Virginia Financial Group, Inc. maintained, in all material respects, effective internal control over financial reporting as of December 31, 2006, based on criteria established inInternal Control—Integrated Framework,issued by the Committee of Sponsoring Organizations of the Treadway Commission (COSO).
We also have audited, in accordance with the standards of the Public Company Accounting Oversight Board (United States), the consolidated balance sheet of Virginia Financial Group, Inc. and its subsidiaries as of December 31, 2006, and the related consolidated statements of income, shareholders’ equity, and cash flows for the year ended December 31, 2006 and our report dated March 2,2007 expressed an unqualified opinion on those financial statements.
GRANT THORNTON LLP
Raleigh, North Carolina
March 2,2007
Changes in Internal Control Over Financial Reporting.
There has been no change in VFG’s internal control over financial reporting during the fiscal quarter ended December 31, 2006 that has materially affected, or is reasonably likely to materially affect, VFG’s internal control over financial reporting.
| Item 9B. | OTHER INFORMATION |
Not applicable.
PART III
| Item 10. | DIRECTORS AND EXECUTIVE OFFICERS OF THE REGISTRANT |
The information with respect to the directors of the Company is contained in the Company’s 2007 Proxy Statement under the caption, “Election of Directors”, and is incorporated herein by reference. The information regarding the Section 16(a) reporting requirements of the directors and executive officers is contained in the 2007 Proxy Statement under the caption, “Section 16(a) Beneficial Ownership Reporting Compliance,” and is incorporated herein by reference. The information concerning executive officers of the Company is included in Part 1 of this Form 10-K under the caption, “Executive Officers of the Registrant.” Information with respect to the Company’s Audit and Compliance Committee and its audit committee financial expert are contained in the Company’s 2007 Proxy Statement under the caption “Corporate Governance and Board Matters,” and is incorporated herein by reference.
VFG has adopted a code of ethics for its principal executive officer and chief financial officer as well as a Directors Code of Professional Conduct for its directors. These documents can be found under corporate “Governance Documents” atwww.vfgi.net. Stockholders may request a free printed copy of each from:
Virginia Financial Group, Inc.
Attention: Investor Relations
102 S. Main Street
Culpeper, Virginia 22701
Audit and Compliance Committee Financial Expert
The Board of Directors has determined that Jan S. Hoover, Vice Chairperson of the Audit and Compliance Committee, is a financial expert and is independent under the rules of the Exchange Act and NASDAQ Stock Market, Inc. as currently in effect.
| Item 11. | EXECUTIVE COMPENSATION |
Information regarding executive and director compensation is set forth under the caption “Executive Compensation” in the 2007 Proxy Statement, and is incorporated herein by reference.
79
| Item 12. | SECURITY OWNERSHIP OF CERTAIN BENEFICIAL OWNERS AND MANAGEMENT AND RELATED STOCKHOLDER MATTERS |
Information regarding security interest of certain beneficial owners and management is set forth under the caption “Security Ownership of Certain Beneficial Owners and Management” in the Proxy Statement, and is incorporated herein by reference. The information in the 2007 Proxy Statement under the caption “Securities Authorized for Issuance under Equity Compensation Plans” is incorporated herein by reference.
| Item 13. | CERTAIN RELATIONSHIPS AND RELATED TRANSACTIONS |
Information regarding certain relationships and related transactions is set forth under “Certain Relationships and Related Transactions” in the 2007 Proxy Statement, and is incorporated herein by reference.
| Item 14. | PRINCIPAL ACCOUNTANT FEES AND SERVICES |
Information regarding principal auditor fees and services is set forth under “Principal Accountant Fees and Services” in the 2007 Proxy Statement, and is incorporated herein by reference.
80
PART IV
| Item 15. | EXHIBITS AND FINANCIAL STATEMENT SCHEDULES |
The following documents are filed as part of this report:
(a)(1) Financial Statements
The financial statements are filed as part of this report under Item 8 – “Financial Statements and Supplemental Data.”
(b)(2) Financial Statement Schedules
All schedules are omitted since they are not required, are not applicable, or the required information is shown in the consolidated financial statements or notes thereto.
(a)(3) Exhibits
The following exhibits are either filed as part of this Report or are incorporated herein by reference:
| Exhibit No. 3.1 | Articles of Incorporation. | |
| Exhibit No. 3.2 | Bylaws, incorporated by reference to Exhibit 3.2 to Form 8-K filed on January 30, 2002. | |
| Exhibit No. 10.3* | Virginia Financial Group, Inc. Stock Incentive Plan, dated January 18, 2002, incorporated by reference to Exhibit 99.0 to Form S-8 filed on February 26, 2002. | |
| Exhibit No. 10.4* | Employment Agreement dated March 7, 2005 between Virginia Financial Group, Inc. and O. R. Barham, Jr.,incorporated by reference to Exhibit 10.4 to Form 10K filed on March 15, 2005. | |
| Exhibit No. 10.5* | Employment Agreement dated March 7, 2005 between Virginia Financial Group, Inc. and Jeffrey W. Farrar, incorporated by reference to Exhibit 10.5 to Form 10K filed on March 15, 2005. | |
| Exhibit No. 10.6* | Employment Agreement, dated June 30, 2005, between Virginia Financial Group, Inc. and Litz H. Van Dyke, incorporated by reference to Exhibit 10.1 to Form 8-K filed on July 1, 2005. | |
| Exhibit No. 10.7* | Employment Agreement, dated January 1, 2007, between Virginia Financial Group, Inc. and James T. Huerth. | |
| Exhibit No. 10.8* | Employment Agreement, dated January 1, 2007, between Virginia Financial Group, Inc. and Richard L. Saunders. | |
| Exhibit No. 10.9* | Non-Qualified Directors Deferred Compensation Plan, incorporated by reference to Exhibit 10.7 to Form 10K filed on March 14, 2006. | |
81
| Exhibit No. 10.10* | Non-Qualified Executive Deferred Compensation Plan, incorporated by reference to Exhibit 10.8 to Form 10K filed on March 14, 2006. | |
| Exhibit No. 10.11 | Virginia Financial Group, Inc. Executive Incentive Plan dated March 1, 2005, incorporated by reference to Exhibit 10.11 to Form 10K filed on March 15, 2005. | |
| Exhibit No. 10.12 | Schedule of Virginia Financial Group, Inc. Non-Employee Directors’ Annual Compensation | |
| Exhibit No. 10.13 | Schedule of 2007 Base Salaries for Named Executive Officers of Virginia Financial Group, Inc. | |
| Exhibit No. 11 | Computation of per share earnings, incorporated by reference to note 1 of the consolidated financial statements incorporated by reference herein. | |
| Exhibit No. 21 | Subsidiaries of Registrant. | |
| Exhibit No. 23.1 | Consent of Independent Auditors. | |
| Exhibit No. 23.2 | Consent of Independent Auditors. | |
| Exhibit No. 31.1 | Certification of Chief Executive Officer pursuant to Rule 13a-14(a) of the Securities Exchange Act of 1934, as amended. | |
| Exhibit No. 31.2 | Certification of Chief Financial Officer pursuant to Rule 13a-14(a) of the Securities Exchange Act of 1934, as amended. | |
| Exhibit No. 32 | Certification of Chief Executive Officer and Chief Financial Officer pursuant to 18 U.S.C. 1350, as adopted pursuant to Section 906 of the Sarbanes-Oxley Act of 2002. | |
| * | Denotes management contract. |
82
Signatures
Pursuant to the requirements of Section 13 or 15(d) of the Securities Exchange Act of 1934, the registrant has duly caused this report to be signed on its behalf by the undersigned thereunto duly authorized.
| Virginia Financial Group, Inc. | Virginia Financial Group, Inc. | |||
| Culpeper, Virginia | Culpeper, Virginia | |||
/s/ O.R. Barham, Jr. | /s/ Jeffrey W. Farrar | |||
| O.R. Barham, Jr. | Jeffrey W. Farrar | |||
| President and Chief Executive Officer | Executive Vice President and Principal Accounting Officer | |||
| Date: March 14, 2007 | Date: March 14, 2007 | |||
Signature | Capacity | Date | ||
/s/ Taylor E. Gore | Chairman of the | March 14, 2007 | ||
| Taylor E. Gore | Board of Directors | |||
/s/ Lee S. Baker | Director | March 14, 2007 | ||
| Lee S. Baker | ||||
/s/ Fred D. Bowers | Director | March 14, 2007 | ||
| Fred D. Bowers | ||||
/s/ E. Page Butler | Director | March 14, 2007 | ||
| E. Page Butler | ||||
/s/ Gregory L. Fisher | Director | March 14, 2007 | ||
| Gregory L. Fisher | ||||
/s/ Christopher M. Hallberg | Director | March 14, 2007 | ||
| Christopher M. Hallberg | ||||
/s/ Jan S. Hoover | Director | March 14, 2007 | ||
| Jan S. Hoover | ||||
/s/ Martin F. Lightsey | Director | March 14, 2007 | ||
| Martin F. Lightsey | ||||
/s/ P. William Moore, Jr. | Director | March 14, 2007 | ||
| P. William Moore, Jr. | ||||
/s/ H. Wayne Parrish | Director | March 14, 2007 | ||
| H. Wayne Parrish | ||||
/s/ Thomas F. Williams, Jr. | Director | March 14, 2007 | ||
| Thomas F. Williams, Jr. | ||||
83