UNITED STATES
SECURITIES AND EXCHANGE COMMISSION
Washington, D.C. 20549
FORM N-CSR
CERTIFIED SHAREHOLDER REPORT OF REGISTERED
MANAGEMENT INVESTMENT COMPANIES
Investment Company Act file number: 811-08189
|
| J.P. Morgan Fleming Mutual Fund Group, Inc. |
(Exact name of registrant as specified in charter)
|
245 Park Avenue New York, NY 10167 |
(Address of principal executive offices) (Zip code)
|
Frank J. Nasta 270 Park Avenue New York, NY 10017 |
(Name and Address of Agent for Service)
Registrant’s telephone number, including area code: (800) 480-4111
Date of fiscal year end: June 30
Date of reporting period: July 1, 2010 through December 31, 2010
Form N-CSR is to be used by management investment companies to file reports with the Commission not later than 10 days after the transmission to stockholders of any report that is required to be transmitted to stockholders under Rule 30e-1 under the Investment Company Act of 1940 (17 CFR 270.30e-1). The Commission may use the information provided on Form N-CSR in its regulatory, disclosure review, inspection, and policymaking roles.
A registrant is required to disclose the information specified by Form N-CSR, and the Commission will make this information public. A registrant is not required to respond to the collection of information contained in Form N-CSR unless the Form displays a currently valid Office of Management and Budget (“OMB”) control number. Please direct comments concerning the accuracy of the information collection burden estimate and any suggestions for reducing the burden to Secretary, Securities and Exchange Commission, 450 Fifth Street, NW, Washington, DC 20549-0609. The OMB has reviewed this collection of information under the clearance requirements of 44 U.S.C. Section 3507.
ITEM 1. REPORTS TO STOCKHOLDERS.
The following is a copy of the report transmitted to shareholders pursuant to Rule 30e-1 under the Investment Company Act of 1940 (17 CFR 270.30e-1).
Semi-Annual Report
J.P. Morgan Mid Cap/Multi-Cap Funds
December 31, 2010 (Unaudited)
JPMorgan Growth Advantage Fund
JPMorgan Mid Cap Core Fund
JPMorgan Mid Cap Equity Fund
JPMorgan Mid Cap Growth Fund
JPMorgan Mid Cap Value Fund
JPMorgan Multi-Cap Market Neutral Fund
JPMorgan Value Advantage Fund

CONTENTS
Investments in a Fund are not bank deposits or obligations of, or guaranteed or endorsed by, any bank and are not insured or guaranteed by the FDIC, the Federal Reserve Board or any other government agency. You could lose money if you sell when the Fund’s share price is lower than when you invested.
Past performance is no guarantee for future performance. The general market views expressed in this report are opinions based on conditions through the end of the reporting period and are subject to change without notice based on market and other conditions. These views are not intended to predict the future performance of a Fund or the securities markets. References to specific securities and their issuers are for illustrative purposes only and are not intended to be, and should not be interpreted as, recommendations to purchase or sell such securities. Such views are not meant as investment advice and may not be relied on as an indication of trading intent on behalf of any Fund.
Prospective investors should refer to the Funds’ prospectus for a discussion of the Funds’ investment objective, strategies and risks. Call J.P. Morgan Funds Service Center at 1-800-480-4111 for a prospectus containing more complete information about a Fund including management fees and other expenses. Please read it carefully before investing.
CEO’S LETTER
JANUARY 20, 2011 (Unaudited)
Dear Shareholder:
It’s only natural for investors to try to ring in the new year with some degree of optimism. Last year, for example, as we slowly emerged from the global financial crisis, we welcomed some encouraging signs that a modest economic recovery was beginning. Today, although the economy can hardly be described as robust, we continue to see signs of improvement.
| | |
 | | “Today, although the economy can hardly be described as robust, we continue to see signs of improvement.” |
Despite volatility, equities turn in double-digit performance
Last summer, investors’ optimism in the markets was tempered by a wave of both discouraging U.S. economic data and sovereign debt issues in Europe, which led to a market correction in the middle of 2010. After experiencing a period of volatility towards the end of the summer, however, the markets finished the year strongly and posted a second year of double digit returns. Investors were encouraged by improved economic expectations and job growth, as well as the combination of the Federal Reserve’s (the “Fed”) launch of quantitative easing (QE2) and Congress’ extension of the Bush-era tax cuts. As of the six-month reporting period ended December 31, 2010, the S&P 500 had reached a level of 1,258, an increase of 23.3% from six months prior.
Small caps and growth stocks outpace other style categories
Small cap stocks led the style categories over the past six months (the Russell 2000 Index returned 29.4%, compared to 28.1% and 24.0% as measured by the Russell Mid Cap Index and Russell 1000 Index, respectively). Overall, growth stocks fared better than value in the small cap, mid cap and large cap space. The Russell 1000 Growth Index returned 26.4% for the six-month reporting period, compared to 21.7% for the Russell 1000 Value Index. With regard to mid cap stocks, the Russell Midcap Growth Index returned 30.7%, while the Russell Midcap Value Index returned 25.9%. In the small cap segment, the Russell 2000 Growth Index outpaced the Russell 2000 Value Index, with a return of 32.1%, compared to 26.6%, as of the end of the six-month reporting period.
Treasuries move higher, pushing yields to historic lows
As investors continued to move into the relative safety of fixed income, yields trended lower, often to historical levels, for most of 2010. Yet, as the year drew to a close, investors began to seek out riskier assets, prompting yields to increase sharply. As of the end of the six-month period ended December 31, 2010, the yields on the benchmark 10-year U.S. Treasury bond rose, from 3.0% to 3.3%. Yields on the 30-year U.S Treasury bond rose from 3.9% to 4.3% as of the end of the period, and the two-year U.S. Treasury note remained flat at 0.6%.
In this environment, the Barclays Capital U.S. Aggregate Bond Index returned 1.2%, while the Barclays Capital High Yield Index returned 10.2%, and the Barclays Capital Emerging Markets Index returned 6.8% for the six-month period ended December 31, 2010.
The pace of recovery
Despite last year’s stock market gains, the economy continues to send mixed signals about the recovery. On the one hand, we are encouraged that gross domestic product (GDP) continues to grow and that corporate earnings continue to exceed estimates. On the other hand, we are discouraged by the fact the economy continues to be restrained by state and local government cutbacks, sluggish job growth, and a hibernating home building industry. Against this backdrop, it makes sense for investors to maintain a balanced approach, as while some aspects of the economy appear to be improving, other aspects continue to struggle, and as of this writing, remain quite unpredictable.
On behalf of everyone at J.P. Morgan Asset Management, thank you for your continued confidence. We look forward to managing your investment needs for years to come. Should you have any questions, please visit www.jpmorganfunds.com or contact the J.P. Morgan Funds Service Center at 1-800-480-4111.
Sincerely yours,

George C.W. Gatch
CEO-Investment Management Americas
J.P. Morgan Asset Management
| | | | | | | | |
| | | |
| DECEMBER 31, 2010 | | J.P. MORGAN MID CAP/MULTI-CAP FUNDS | | | | | 1 | |
J.P. Morgan Mid Cap/Multi-Cap Funds
MARKET OVERVIEW
SIX MONTHS ENDED DECEMBER 31, 2010 (Unaudited)
Stocks in most of the world’s capital markets rallied during the six months ended December 31, 2010. In the United States, investor sentiment was supported by strong corporate earnings, better-than-expected economic data, returning merger and acquisition activity and accommodative policies from the U.S. Federal Reserve. Investors were also encouraged by the U.S. government’s two-year extension of the Bush era tax cuts, emergency unemployment benefits and a payroll tax cut.
U.S. stocks, as measured by the S&P 500 Index, returned 23.27% for the six months ended December 31, 2010. Among U.S. stocks, small- and mid-cap stocks outperformed large-cap stocks, while growth stocks outperformed value stocks across all asset classes during the reporting period. The Russell Midcap Index, which is comprised of U.S. mid-cap stocks, returned 28.12% for the six months ended December 31, 2010, while the Russell Midcap Growth Index and the Russell Midcap Value Index returned 30.71% and 25.86%, respectively.
| | | | | | |
| | | |
| 2 | | | | J.P. MORGAN MID CAP/MULTI-CAP FUNDS | | DECEMBER 31, 2010 |
JPMorgan Growth Advantage Fund
FUND COMMENTARY
SIX MONTHS ENDED DECEMBER 31, 2010 (Unaudited)
| | | | |
| REPORTING PERIOD RETURN: | | | |
| Fund (Class A Shares, without a sales charge)* | | | 28.99% | |
| Russell 3000 Growth Index | | | 26.83% | |
| |
| Net Assets as of 12/31/2010 (In Thousands) | | $ | 798,440 | |
INVESTMENT OBJECTIVE**
The JPMorgan Growth Advantage Fund (the “Fund”) seeks to provide long-term capital growth.
WHAT WERE THE MAIN DRIVERS OF THE FUND’S PERFORMANCE?
The Fund (Class A Shares, without a sales charge) outperformed the Russell 3000 Growth Index (the “Benchmark”) for the six months ended December 31, 2010. The Fund’s stock selection in the consumer discretionary and producer durables sectors contributed to relative performance. The Fund’s stock selection in the technology sector and stock selection and overweight in the financial services sector detracted from relative performance.
The Fund’s individual contributors to relative performance included Cummins Inc., Amazon.com, Inc. and Valeant Pharmaceuticals International Inc. Cummins Inc., a provider of components for truck engines, reported strong earnings driven mainly by robust demand for new trucks in emerging markets. Meanwhile, demand in North America continued to recover from very depressed levels as trucking companies replaced their aging truck fleets. Amazon.com, Inc., an online retailer, reported better-than-expected profit, as the company continued to grow its revenue and gain market share despite the challenging environment for retail spending. Shares of Valeant Pharmaceuticals International Inc. rose after the specialty pharmaceutical company completed its merger with Biovail
Corp. and reported a positive outlook for 2011, suggesting that the integration of the two companies was proceeding faster than investors had initially anticipated.
Individual detractors from the Fund’s relative performance included Thoratec Corp., a manufacturer of mechanical circulatory support products used by patients with heart failure. The stock declined following an announcement that a competitor’s experimental heart pump showed favorable results in trials, raising concerns that Thoratec Corp. could lose market share. The Fund’s underweight positions in Exxon Mobil Corp. and International Business Machines Corp. also detracted from relative performance as both of these stocks were strong performers in the Benchmark.
HOW WAS THE FUND POSITIONED?
The Fund’s portfolio managers utilized a bottom-up approach to stock selection, rigorously researching individual companies across market capitalizations in an effort to construct portfolios of stocks that have strong fundamentals. The Fund’s portfolio managers preferred to invest in high quality companies with durable franchises that, in their view, possessed the ability to generate strong future earnings growth.
As a result of this bottom-up stock selection process, the Fund’s largest overweight versus the Benchmark was in the financial services sector, while the Fund’s largest underweight versus the Benchmark was in the consumer staples sector.
| | | | | | | | |
| | | |
| DECEMBER 31, 2010 | | J.P. MORGAN MID CAP/MULTI-CAP FUNDS | | | | | 3 | |
JPMorgan Growth Advantage Fund
FUND COMMENTARY
SIX MONTHS ENDED DECEMBER 31, 2010 (Unaudited) (continued)
| | | | | | | | |
| TOP TEN EQUITY HOLDINGS OF THE PORTFOLIO*** | |
| | 1. | | | Apple, Inc. | | | 6.6 | % |
| | 2. | | | Amazon.com, Inc. | | | 3.4 | |
| | 3. | | | Concho Resources, Inc. | | | 1.9 | |
| | 4. | | | Valeant Pharmaceuticals International, Inc. | | | 1.9 | |
| | 5. | | | Cummins, Inc. | | | 1.8 | |
| | 6. | | | Schlumberger Ltd. | | | 1.8 | |
| | 7. | | | Lamar Advertising Co., Class A | | | 1.7 | |
| | 8. | | | Freeport-McMoRan Copper & Gold, Inc. | | | 1.6 | |
| | 9. | | | Agilent Technologies, Inc. | | | 1.6 | |
| | 10. | | | UnitedHealth Group, Inc. | | | 1.6 | |
| | | | |
PORTFOLIO COMPOSITION BY SECTOR*** | |
| Information Technology | | | 30.6 | % |
| Consumer Discretionary | | | 18.9 | |
| Health Care | | | 13.5 | |
| Industrials | | | 12.7 | |
| Financials | | | 9.7 | |
| Energy | | | 7.0 | |
| Materials | | | 4.2 | |
| Consumer Staples | | | 1.2 | |
| Short-Term Investment | | | 2.2 | |
| * | | The return shown is based on net asset value calculated for shareholder transactions and may differ from the return shown in the financial highlights, which reflects adjustments made to the net asset value in accordance with accounting principles generally accepted in the United States of America. |
| ** | | The advisor seeks to achieve the Fund’s objective. There can be no guarantee it will be achieved. |
| *** | | Percentages indicated are based upon total investments (excluding Investments of Cash Collateral for Securities on Loan) as of December 31, 2010. The Fund’s composition is subject to change. |
| | | | | | |
| | | |
| 4 | | | | J.P. MORGAN MID CAP/MULTI-CAP FUNDS | | DECEMBER 31, 2010 |
| | | | | | | | | | | | | | | | | | | | |
AVERAGE ANNUAL TOTAL RETURNS AS OF DECEMBER 31, 2010 | |
| | | | | |
| | | INCEPTION DATE
OF CLASS | | | 6 MONTH* | | | 1 YEAR | | | 5 YEAR | | | 10 YEAR | |
CLASS A SHARES | | | 10/29/99 | | | | | | | | | | | | | | | | | |
Without Sales Charge | | | | | | | 28.99 | % | | | 21.11 | % | | | 6.55 | % | | | 2.14 | % |
With Sales Charge** | | | | | | | 22.30 | | | | 14.74 | | | | 5.41 | | | | 1.59 | |
CLASS B SHARES | | | 10/29/99 | | | | | | | | | | | | | | | | | |
Without CDSC | | | | | | | 28.73 | | | | 20.51 | | | | 5.93 | | | | 1.59 | |
With CDSC*** | | | | | | | 23.73 | | | | 15.51 | | | | 5.61 | | | | 1.59 | |
CLASS C SHARES | | | 5/1/06 | | | | | | | | | | | | | | | | | |
Without CDSC | | | | | | | 28.53 | | | | 20.33 | | | | 5.93 | | | | 1.49 | |
With CDSC**** | | | | | | | 27.53 | | | | 19.33 | | | | 5.93 | | | | 1.49 | |
CLASS R5 SHARES | | | 1/8/09 | | | | 29.20 | | | | 21.57 | | | | 6.86 | | | | 2.29 | |
SELECT CLASS SHARES | | | 5/1/06 | | | | 29.14 | | | | 21.32 | | | | 6.79 | | | | 2.25 | |
| ** | | Sales Charge for Class A Shares is 5.25%. |
| *** | | Assumes 5% CDSC (contingent deferred sales charge) for the one year period, 2% CDSC for the five year period and 0% CDSC thereafter. |
| **** | | Assumes a 1% CDSC for the one year period and 0% CDSC thereafter. |
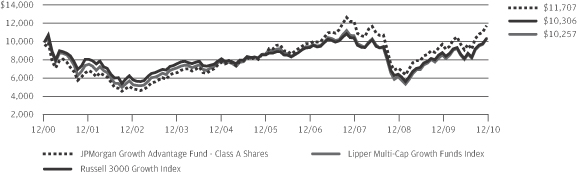
TEN YEAR PERFORMANCE (12/31/00 TO 12/31/10)
Source: Lipper, Inc. The performance quoted is past performance and is not a guarantee of future results. Mutual funds are subject to certain market risks. Investment returns and principal value of an investment will fluctuate so that an investor’s shares, when redeemed, may be worth more or less than their original cost. Current performance may be higher or lower than the performance data shown. For up-to-date month-end performance information please call 1-800-480-4111.
As of August 17, 2005, the Fund changed its name, investment objective, certain investment policies and benchmark. Prior to that time, the Fund operated as JPMorgan Mid Cap Growth Fund. Although past performance is not necessarily an indication of how the Fund will perform in the future, in view of these changes, the Fund’s performance record prior to August 17, 2005 might be less pertinent for investors considering whether to purchase shares of the Fund. The performance for the Class A and Class B Shares before March 23, 2001 is based on the performance of the Class A and Class B Shares of the Fund’s predecessor, H&Q IPO & Emerging Company Fund, a series of Hambrecht & Quist Fund Trust, which transferred all of its assets and liabilities to the Fund pursuant to a reorganization on that date. The predecessor’s investment program was identical to that of the Fund prior to December 3, 2001. The predecessor’s Class A and Class B expenses were substantially similar to those of Class A and Class B of the Fund. Returns for the Class C Shares prior to their inception date are based on the performance of Class B Shares, whose expenses are substantially similar to those of Class C Shares. Returns for the
Select Class Shares prior to their inception date are based on the performance of Class A Shares. During this period, the actual returns of Select Class Shares would have been different because Select Class Shares have different expenses than Class A Shares. Returns for Class R5 Shares prior to its inception date are based on the performance of Select Class Shares from May 1, 2006 to June 30, 2009 and Class A Shares prior to May 1, 2006. The actual returns of Class R5 Shares would have been different than those shown because Class R5 Shares have different expenses than Select Class and Class A Shares.
The graph illustrates comparative performance for $10,000 invested in Class A Shares of the JPMorgan Growth Advantage Fund, the Russell 3000 Growth Index and the Lipper Multi-Cap Growth Funds Index from December 31, 2000 to December 31, 2010. The performance of the Fund assumes reinvestment of all dividends and capital gains, if any, and includes a sales charge. The performance of the Russell 3000 Growth Index does not reflect the deduction of expenses or a sales charge associated with a mutual fund and has been adjusted to reflect reinvestment of all dividends and capital gains of the securities included in the benchmark. The performance of the Lipper Multi-Cap Growth Funds Index includes expenses associated with a mutual fund, such as investment management fees. These expenses are not identical to the expenses charged by the Fund. The Russell 3000 Growth Index is an unmanaged index which measures the performance of those Russell 3000 Index companies (largest 3000 U.S. companies) with higher price-to-book ratios and higher forecasted growth values. The Lipper Multi-Cap Growth Funds Index is an index based on total
| | | | | | | | |
| | | |
| DECEMBER 31, 2010 | | J.P. MORGAN MID CAP/MULTI-CAP FUNDS | | | | | 5 | |
JPMorgan Growth Advantage Fund
FUND COMMENTARY
SIX MONTHS ENDED DECEMBER 31, 2010 (Unaudited) (continued)
returns of certain mutual funds within the Fund’s designated category as determined by Lipper, Inc. Investors cannot invest directly in an index.
Class A Shares have a $1,000 minimum initial investment and carry a 5.25% sales charge.
Performance may reflect the waiver of the Fund’s fees and reimbursement of expenses for certain periods since the inception date. Without these waivers and reimbursements performance would have been lower. Also, performance shown in this section does not reflect the deduction of taxes that a shareholder would pay on Fund distributions or redemption of Fund shares.
Because Class B Shares automatically convert to Class A Shares after 8 years, the 10 year annual average total return shown above for Class B reflects Class A performance for the period after conversion.
The returns shown are based on net asset values calculated for shareholder transactions and may differ from the return shown in the financial highlights, which reflect adjustments made to the net asset values in accordance with accounting principles generally accepted in the United States of America.
| | | | | | |
| | | |
| 6 | | | | J.P. MORGAN MID CAP/MULTI-CAP FUNDS | | DECEMBER 31, 2010 |
JPMorgan Mid Cap Core Fund
FUND COMMENTARY
FOR THE PERIOD NOVEMBER 30, 2010 (FUND INCEPTION DATE) THROUGH DECEMBER 31, 2010
(Unaudited)
| | | | |
| REPORTING PERIOD RETURN: | | | |
| Fund (Select Class Shares)* | | | 5.91% | |
| Russell Midcap Index | | | 6.92% | |
| |
| Net Assets as of 12/31/2010 (In Thousands) | | | $3,228 | |
INVESTMENT OBJECTIVE**
The JPMorgan Mid Cap Core Fund (the “Fund”) seeks long-term capital appreciation.
WHAT WERE THE MAIN DRIVERS OF THE FUND’S PERFORMANCE?
The Fund (Select Class Shares) underperformed the Russell Midcap Index for the period November 30, 2010 through December 31, 2010. The Fund’s stock selection in the utilities, health care and materials and processing sectors detracted from relative performance. The Fund’s stock selection in the financial services, producer durables and consumer staples sectors contributed to relative performance.
HOW WAS THE FUND POSITIONED?
The Fund’s portfolio managers employed a bottom-up approach to stock selection, constructing a portfolio based on company fundamentals, quantitative screening and proprietary fundamental analysis. The Fund’s portfolio managers invested in companies that, in their view, had leading competitive advantages, predictable and durable business models, sustainable free cash flow generation and management teams committed to increasing intrinsic value.
| | | | | | | | |
| TOP TEN EQUITY HOLDINGS OF THE PORTFOLIO*** | |
| | 1. | | | Devon Energy Corp. | | | 2.8 | % |
| | 2. | | | Jarden Corp. | | | 2.8 | |
| | 3. | | | Silgan Holdings, Inc. | | | 2.7 | |
| | 4. | | | Iberiabank Corp. | | | 2.2 | |
| | 5. | | | Walgreen Co. | | | 2.2 | |
| | 6. | | | Calamos Asset Management, Inc., Class A | | | 2.0 | |
| | 7. | | | ProAssurance Corp. | | | 2.0 | |
| | 8. | | | Chubb Corp. | | | 2.0 | |
| | 9. | | | Joy Global, Inc. | | | 1.9 | |
| | 10. | | | Coventry Health Care, Inc. | | | 1.8 | |
| | | | |
PORTFOLIO COMPOSITION BY SECTOR*** | |
| Financials | | | 20.0 | % |
| Consumer Discretionary | | | 18.5 | |
| Industrials | | | 13.4 | |
| Energy | | | 10.7 | |
| Health Care | | | 10.4 | |
| Materials | | | 8.7 | |
| Information Technology | | | 7.1 | |
| Utilities | | | 6.5 | |
| Consumer Staples | | | 3.8 | |
| Short-Term Investment | | | 0.9 | |
| * | | The return shown is based on net asset value calculated for shareholder transactions any may differ from the return shown in the financial highlights, which reflects adjustments made to the net asset value in accordance with accounting principles generally accepted in the United States of America. |
| ** | | The advisor seeks to achieve the Fund’s objective. There can be no guarantee it will be achieved. |
| *** | | Percentages indicated are based upon total investments as of December 31, 2010. The Fund’s composition is subject to change. |
| | | | | | | | |
| | | |
| DECEMBER 31, 2010 | | J.P. MORGAN MID CAP/MULTI-CAP FUNDS | | | | | 7 | |
JPMorgan Mid Cap Core Fund
FUND COMMENTARY
FOR THE PERIOD NOVEMBER 30, 2010 (FUND INCEPTION DATE) THROUGH DECEMBER 31, 2010
(Unaudited) (continued)
| | | | | | | | |
AVERAGE ANNUAL TOTAL RETURNS AS OF DECEMBER 31, 2010 | |
| | |
| | | INCEPTION DATE
OF CLASS | | | SINCE
INCEPTION | |
CLASS A SHARES | | | 11/30/10 | | | | | |
Without Sales Charge | | | | | | | 5.90 | % |
With Sales Charge* | | | | | | | 0.35 | |
CLASS C SHARES | | | 11/30/10 | | | | | |
Without CDSC | | | | | | | 5.80 | |
With CDSC** | | | | | | | 4.80 | |
CLASS R2 SHARES | | | 11/30/10 | | | | 5.87 | |
CLASS R5 SHARES | | | 11/30/10 | | | | 5.92 | |
SELECT CLASS SHARES | | | 11/30/10 | | | | 5.91 | |
| * | | Sales Charge for Class A Shares is 5.25%. |
| ** | | Assumes a 1% CDSC (contingent deferred sales charge) for the period. |
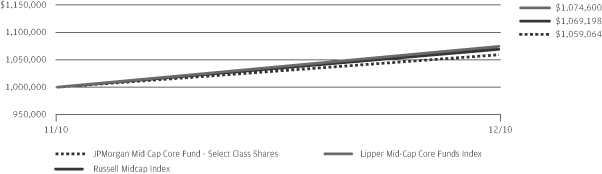
LIFE OF FUND PERFORMANCE (11/30/2010-12/31/2010)
Source: Lipper, Inc. The performance quoted is past performance and is not a guarantee of future results. Mutual funds are subject to certain market risks. Investment returns and principal value of an investment will fluctuate so that an investor’s shares, when redeemed, may be worth or less than their original cost. Current performance may be higher or lower than the performance data shown. For up-to-data, month-end performance information please call 1-800-480-4111.
The fund commenced operations on November 30, 2010.
The graph illustrates comparative performance for $1,000,000 invested in Select Class Shares of the JPMorgan Mid Cap Core Fund, the Russell Midcap Index and the Lipper Mid-Cap Core Funds Index from November 30, 2010 to December 31, 2010. The performance of the Fund assumes reinvestment of all dividends and capital gains, if any. The performance of the Russell Midcap Index does not reflect the deduction of expenses or a sales charge associated with a mutual fund and has been adjusted to reflect reinvestment of all dividends and capital gains of the securities included in the benchmark. The performance of the Lipper Mid-Cap Core Funds Index includes expenses associated with a mutual fund, such as investment management fees. These expenses are not
identical to the expense charged by the Fund. The Russell Midcap Index is an unmanaged index which measures the performance of the 800 smallest companies in the Russell 1000 Index. The Lipper Mid-Cap Core Funds Index is an index based on total returns of certain mutual funds within the Fund’s designated category as determined by Lipper, Inc. Investors cannot invest directly in an Index.
Select Class Shares have a $1,000,000 minimum initial investment and carry no sales charge.
Performance may reflect the waiver of the Fund’ fees and reimbursement of expenses for certain periods since the inception date. Without these waivers and reimbursements performance would have been lower. Also, performance shown in this section does not reflect the deduction of taxes that a shareholder would pay on Fund distributions or redemption of Fund shares.
The returns shown are based on net asset values calculated for shareholder transactions and differ from the returns shown in the financial highlights, which reflect adjustments made to the net asset values in accordance with accounting principles generally accepted in the United States of America.
| | | | | | |
| | | |
| 8 | | | | J.P. MORGAN MID CAP/MULTI-CAP FUNDS | | DECEMBER 31, 2010 |
JPMorgan Mid Cap Equity Fund
FUND COMMENTARY
SIX MONTHS ENDED DECEMBER 31, 2010 (Unaudited)
| | | | |
| REPORTING PERIOD RETURN: | | | |
| Fund (Select Class Shares)* | | | 27.29% | |
| Russell Midcap Index | | | 28.12% | |
| |
| Net Assets as of 12/31/2010 (In Thousands) | | $ | 453,503 | |
INVESTMENT OBJECTIVE**
The JPMorgan Mid Cap Equity Fund (the “Fund”) seeks long-term capital growth.
WHAT WERE THE MAIN DRIVERS OF THE FUND’S PERFORMANCE?
The Fund (Select Class Shares) underperformed the Russell Midcap Index for the six months ended December 31, 2010. The Fund’s stock selection in the materials and health care sectors detracted from relative performance, while the Fund’s stock selection in the information technology sector as well as an overweight and stock selection in the consumer discretionary sector contributed to relative performance.
Individual detractors from the Fund’s relative performance included Lincare Holdings, Inc., Wilmington Trust Corp. and Thoratec Corp. Shares of Lincare Holdings, Inc., a provider of oxygen and other respiratory therapy services, declined on concerns surrounding lower Medicare reimbursement rates for oxygen services. Wilmington Trust Corp. is a regional bank that had suffered credit losses on loans related to construction activity. The stock declined during the reporting period as credit losses accelerated in other areas of the company’s loan portfolio. Subsequently, the Fund exited its position in Wilmington Trust Corp. Thoratec Corp. is a manufacturer of mechanical circulatory support products used by patients with heart failure. The stock declined following an announcement that a competitor’s experimental heart pump showed favorable results in trials, raising concerns that Thoratec Corp. could lose market share.
The Fund’s individual contributors to relative performance included Cummins Inc., Tyco Electronics Ltd. and Valeant Pharmaceuticals International Inc. Cummins Inc., a provider of components for truck engines, reported strong earnings driven mainly by robust demand for new trucks in emerging markets. Meanwhile, demand in North America continued to recover from very depressed levels as trucking companies replaced their aging truck fleets. Tyco Electronics Ltd. provides electronic instruments and controls. The company’s restructuring efforts left it well positioned to benefit as demand recovered in its end markets during the reporting period. In addition, investors reacted favorably to Tyco Electronics Ltd.’s acquisition of ADC Telecommunications, Inc. Shares of Valeant Pharmaceuticals International Inc. rose after the specialty pharmaceutical company completed its merger with Biovail Corp. and reported a positive outlook for 2011, suggesting that the integration of the two companies was proceeding faster than investors had initially anticipated.
HOW WAS THE FUND POSITIONED?
The Fund’s portfolio managers employed a bottom-up approach to stock selection, constructing a portfolio based on company fundamentals, quantitative screening and proprietary fundamental analysis. The Fund’s portfolio managers sought to identify dominant franchises with predictable business models deemed capable of achieving sustained growth, as well as undervalued companies with the potential to grow their intrinsic value per share.
| | | | | | | | |
| | | |
| DECEMBER 31, 2010 | | J.P. MORGAN MID CAP/MULTI-CAP FUNDS | | | | | 9 | |
JPMorgan Mid Cap Equity Fund
FUND COMMENTARY
SIX MONTHS ENDED DECEMBER 31, 2010 (Unaudited) (continued)
| | | | | | | | |
| TOP TEN EQUITY HOLDINGS OF THE PORTFOLIO*** | |
| | 1. | | | Tyco Electronics Ltd., (Switzerland) | | | 1.7 | % |
| | 2. | | | Lincare Holdings, Inc. | | | 1.3 | |
| | 3. | | | Sherwin-Williams Co. (The) | | | 1.3 | |
| | 4. | | | Cummins, Inc. | | | 1.3 | |
| | 5. | | | T. Rowe Price Group, Inc. | | | 1.2 | |
| | 6. | | | Amphenol Corp., Class A | | | 1.2 | |
| | 7. | | | Newfield Exploration Co. | | | 1.1 | |
| | 8. | | | Carlisle Cos., Inc. | | | 1.0 | |
| | 9. | | | NetApp, Inc. | | | 1.0 | |
| | 10. | | | Gap, Inc. (The) | | | 1.0 | |
| | | | |
PORTFOLIO COMPOSITION BY SECTOR*** | |
| Consumer Discretionary | | | 17.9 | % |
| Financials | | | 16.7 | |
| Information Technology | | | 15.8 | |
| Industrials | | | 13.9 | |
| Health Care | | | 9.6 | |
| Energy | | | 7.3 | |
| Utilities | | | 5.2 | |
| Materials | | | 5.0 | |
| Consumer Staples | | | 3.0 | |
| Telecommunication Services | | | 1.6 | |
| Short-Term Investment | | | 4.0 | |
| * | | The return shown is based on net asset value calculated for shareholder transactions and may differ from the return shown in the financial highlights, which reflects adjustments made to the net asset value in accordance with accounting principles generally accepted in the United States of America. |
| ** | | The advisor seeks to achieve the Fund’s objective. There can be no guarantee it will be achieved. |
| *** | | Percentages indicated are based upon total investments (excluding Investments of Cash Collateral for Securities on Loan) as of December 31, 2010. The Fund’s composition is subject to change. |
| | | | | | |
| | | |
| 10 | | | | J.P. MORGAN MID CAP/MULTI-CAP FUNDS | | DECEMBER 31, 2010 |
| | | | | | | | | | | | | | | | | | | | |
AVERAGE ANNUAL TOTAL RETURNS AS OF DECEMBER 31, 2010 | |
| | | | | |
| | | INCEPTION DATE
OF CLASS | | | 6 MONTH* | | | 1 YEAR | | | 5 YEAR | | | 10 YEAR | |
CLASS A SHARES | | | 11/2/09 | | | | | | | | | | | | | | | | | |
Without Sales Charge | | | | | | | 27.10 | % | | | 23.63 | % | | | 5.04 | % | | | 6.29 | % |
With Sales Charge** | | | | | | | 20.43 | | | | 17.13 | | | | 3.92 | | | | 5.72 | |
CLASS C SHARES | | | 11/2/09 | | | | | | | | | | | | | | | | | |
Without CDSC | | | | | | | 26.79 | | | | 23.03 | | | | 4.92 | | | | 6.23 | |
With CDSC*** | | | | | | | 25.79 | | | | 22.03 | | | | 4.92 | | | | 6.23 | |
SELECT CLASS SHARES | | | 1/1/97 | | | | 27.29 | | | | 24.02 | | | | 5.12 | | | | 6.33 | |
| ** | | Sales Charge for Class A Shares is 5.25%. |
| *** | | Assumes a 1% CDSC (contingent deferred sales charge) for the one year period and 0% CDSC thereafter. |
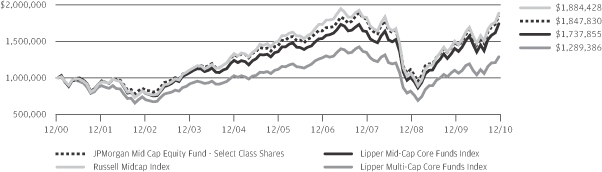
TEN YEAR PERFORMANCE (12/31/00 TO 12/31/10)
Source: Lipper, Inc. The performance quoted is past performance and is not a guarantee of future results. Mutual funds are subject to certain market risks. Investment returns and principal value of an investment will fluctuate so that an investor’s shares, when redeemed, may be worth more or less than their original cost. Current performance may be higher or lower than the performance data shown. For up-to-date month-end performance information please call 1-800-480-4111.
Returns for Class A and Class C Shares prior to their inception date were based on the performance of Select Class Shares. The actual returns of Class A and Class C Shares would have been lower than those shown because Class A and Class C Shares have higher expenses than Select Class Shares.
The graph illustrates comparative performance for $1,000,000 invested in the Select Class Shares of JPMorgan Mid Cap Equity Fund, the Russell Midcap Index, the Lipper Mid-Cap Core Funds Index and the Lipper Multi-Cap Core Funds Index from December 31, 2000 to December 31, 2010. The performance of the Fund assumes reinvestment of all dividends and capital gains, if any. The performance of the Russell Midcap Index does not reflect the deduction of expenses or a sales charge associated with a mutual fund and has been adjusted to reflect reinvestment of all dividends and capital gains of the securities included in the benchmark. The performance of the Lipper Mid-Cap
Core Funds Index and the Lipper Multi-Cap Core Funds Index includes expenses associated with a mutual fund, such as investment management fees. These expenses are not identical to the expenses charged by the Fund. The Russell Midcap Index is an unmanaged index which measures the performance of the 800 smallest companies in the Russell 1000 Index. The Lipper Mid-Cap Core Funds Index and the Lipper Multi-Cap Core Funds Index is an index based on total returns of certain mutual funds within the Fund’s designated category as determined by Lipper, Inc. Investors cannot invest directly in an Index.
Select Class Shares have a $1,000,000 minimum initial investment and carry no sales charge.
Performance may reflect the waiver of the Fund’s fees and reimbursement of expenses for certain periods since the inception date. Without these waivers and reimbursements performance would have been lower. Also, performance shown in this section does not reflect the deduction of taxes that a shareholder would pay on Fund distributions or redemption of Fund shares.
The return shown is based on net asset value calculated for shareholder transactions and may differ from the return shown in the financial highlights, which reflect adjustments made to the net asset value in accordance with accounting principles generally accepted in the United States of America.
| | | | | | | | |
| | | |
| DECEMBER 31, 2010 | | J.P. MORGAN MID CAP/MULTI-CAP FUNDS | | | | | 11 | |
JPMorgan Mid Cap Growth Fund
FUND COMMENTARY
SIX MONTHS ENDED DECEMBER 31, 2010 (Unaudited)
| | | | |
| REPORTING PERIOD RETURN: | | | |
| Fund (Select Class Shares)* | | | 31.67% | |
| Russell Midcap Growth Index | | | 30.71% | |
| |
| Net Assets as of 12/31/2010 (In Thousands) | | $ | 1,639,165 | |
INVESTMENT OBJECTIVE**
The JPMorgan Mid Cap Growth Fund (the “Fund”) seeks growth of capital and secondarily, current income by investing primarily in equity securities.
WHAT WERE THE MAIN DRIVERS OF THE FUND’S PERFORMANCE?
The Fund (Select Class Shares) outperformed the Russell Midcap Growth Index (the “Benchmark”) for the six months ended December 31, 2010. The Fund’s producer durables and consumer discretionary holdings contributed to relative performance, while the Fund’s technology and materials and processing holdings detracted from relative performance.
The Fund’s individual contributors to relative performance included Cummins Inc., Lamar Advertising Co. and Valeant Pharmaceuticals International Inc. Cummins Inc., a provider of components for truck engines, reported strong earnings driven mainly by robust demand for new trucks in emerging markets. Meanwhile, demand in North America continued to recover from very depressed levels as trucking companies replaced their aging truck fleets. Shares of Lamar Advertising Co., an outdoor advertising company, benefited as spending on advertising showed signs of recovery. Shares of Valeant Pharmaceuticals International Inc. rose after the specialty pharmaceutical company completed its merger with Biovail Corp. and reported a positive outlook for 2011, suggesting that the integration of
the two companies was proceeding faster than investors had initially anticipated.
Individual detractors from the Fund’s relative performance included Thoratec Corp., a manufacturer of mechanical circulatory support products used by patients with heart failure. The stock declined following an announcement that a competitor’s experimental heart pump showed favorable results in trials, raising concerns that Thoratec Corp. could lose market share. The Fund’s underweight positions in Coca-Cola Enterprises Inc. and CF Industries Holdings, Inc. also detracted from relative performance as both of these stocks were strong performers in the Benchmark.
HOW WAS THE FUND POSITIONED?
The Fund’s portfolio managers utilized a bottom-up approach to stock selection, rigorously researching individual companies in an effort to construct a portfolio of stocks that have strong fundamentals. The Fund’s portfolio managers preferred to invest in high quality companies with durable franchises that, in their view, possessed the ability to generate strong future earnings growth.
As a result of this bottom-up stock selection process, the Fund’s largest overweights versus the Benchmark were in the technology and financial services sectors and the Fund’s largest underweights versus the Benchmark were in the consumer staples and consumer discretionary sectors.
| | | | | | |
| | | |
| 12 | | | | J.P. MORGAN MID CAP/MULTI-CAP FUNDS | | DECEMBER 31, 2010 |
| | | | | | | | |
| TOP TEN EQUITY HOLDINGS OF THE PORTFOLIO*** | |
| | 1. | | | Cummins, Inc. | | | 2.6 | % |
| | 2. | | | NetApp, Inc. | | | 2.0 | |
| | 3. | | | Valeant Pharmaceuticals International, Inc., (Canada) | | | 1.9 | |
| | 4. | | | Concho Resources, Inc. | | | 1.9 | |
| | 5. | | | Agilent Technologies, Inc. | | | 1.8 | |
| | 6. | | | Lamar Advertising Co., Class A | | | 1.7 | |
| | 7. | | | W.W. Grainger, Inc. | | | 1.7 | |
| | 8. | | | Tyco Electronics Ltd., (Switzerland) | | | 1.6 | |
| | 9. | | | Harley-Davidson, Inc. | | | 1.5 | |
| | 10. | | | Sherwin-Williams Co. (The) | | | 1.5 | |
| | | | |
PORTFOLIO COMPOSITION BY SECTOR*** | |
| Information Technology | | | 26.7 | % |
| Industrials | | | 19.3 | |
| Consumer Discretionary | | | 18.0 | |
| Health Care | | | 13.4 | |
| Financials | | | 9.9 | |
| Energy | | | 6.2 | |
| Materials | | | 3.5 | |
| Others (each less than 1.0%) | | | 1.4 | |
| Short-Term Investment | | | 1.6 | |
| * | | The return shown is based on net asset value calculated for shareholder transactions and may differ from the return shown in the financial highlights, which reflects adjustments made to the net asset value in accordance with accounting principles generally accepted in the United States of America. |
| ** | | The advisor seeks to achieve the Fund’s objective. There can be no guarantee it will be achieved. |
| *** | | Percentages indicated are based upon total investments (excluding Investments of Cash Collateral for Securities on Loan) as of December 31, 2010. The Fund’s composition is subject to change. |
| | | | | | | | |
| | | |
| DECEMBER 31, 2010 | | J.P. MORGAN MID CAP/MULTI-CAP FUNDS | | | | | 13 | |
JPMorgan Mid Cap Growth Fund
FUND COMMENTARY
SIX MONTHS ENDED DECEMBER 31, 2010 (Unaudited) (continued)
| | | | | | | | | | | | | | | | | | | | |
AVERAGE ANNUAL TOTAL RETURNS AS OF DECEMBER 31, 2010 | |
| | | | | |
| | | INCEPTION DATE
OF CLASS | | | 6 MONTH* | | | 1 YEAR | | | 5 YEAR | | | 10 YEAR | |
CLASS A SHARES | | | 2/18/92 | | | | | | | | | | | | | | | | | |
Without Sales Charge | | | | | | | 31.52 | % | | | 25.09 | % | | | 5.39 | % | | | 3.80 | % |
With Sales Charge** | | | | | | | 24.58 | | | | 18.53 | | | | 4.26 | | | | 3.25 | |
CLASS B SHARES | | | 1/14/94 | | | | | | | | | | | | | | | | | |
Without CDSC | | | | | | | 31.11 | | | | 24.45 | | | | 4.76 | | | | 3.23 | |
With CDSC*** | | | | | | | 26.11 | | | | 19.45 | | | | 4.42 | | | | 3.23 | |
CLASS C SHARES | | | 11/4/97 | | | | | | | | | | | | | | | | | |
Without CDSC | | | | | | | 31.11 | | | | 24.44 | | | | 4.76 | | | | 3.11 | |
With CDSC**** | | | | | | | 30.11 | | | | 23.44 | | | | 4.76 | | | | 3.11 | |
CLASS R2 SHARES | | | 6/19/09 | | | | 31.38 | | | | 24.90 | | | | 5.22 | | | | 3.61 | |
SELECT CLASS SHARES | | | 3/2/89 | | | | 31.67 | | | | 25.49 | | | | 5.68 | | | | 4.07 | |
| ** | | Sales Charge for Class A Shares is 5.25%. |
| *** | | Assumes 5% CDSC (contingent deferred sales charge) for the one year period, 2% CDSC for the five year period and 0% CDSC thereafter. |
| **** | | Assumes a 1% CDSC for the one year period and 0% CDSC thereafter. |
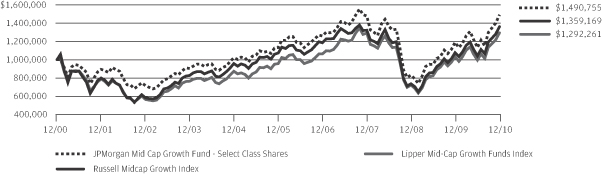
TEN YEAR PERFORMANCE (12/31/00 TO 12/31/10)
Source: Lipper, Inc. The performance quoted is past performance and is not a guarantee of future results. Mutual funds are subject to certain market risks. Investment returns and principal value of an investment will fluctuate so that an investor’s shares, when redeemed, may be worth more or less than their original cost. Current performance may be higher or lower than the performance data shown. For up-to-date month-end performance information please call 1-800-480-4111.
Returns for the Class R2 Shares prior to its inception date are based on the performance of Select Class Shares. Prior performance for Class R2 Shares has been adjusted to reflect the differences in expenses and sales charges between classes.
The graph illustrates comparative performance for $1,000,000 invested in Select Class Shares of the JPMorgan Mid Cap Growth Fund, the Russell Midcap Growth Index and the Lipper Mid-Cap Growth Funds Index from December 31, 2000 to December 31, 2010. The performance of the Fund assumes reinvestment of all dividends and capital gains, if any, and does not include a sales charge. The performance of the Russell Midcap Growth Index does not reflect the deduction of expenses or a sales charge associated with a mutual fund and has been adjusted to reflect reinvestment of all dividends and capital gains of the securities included in the benchmark. The performance of the Lipper Mid-Cap Growth Funds Index includes expenses associated with a mutual fund, such as investment management fees. These expenses are not identical to the
expenses charged by the Fund. The Russell Midcap Growth Index is an unmanaged index which measures the performance of those Russell Midcap companies with higher price-to-book ratios and higher forecasted growth values. The Lipper Mid-Cap Growth Funds Index is an index based on total returns of certain mutual funds within the Fund’s designated category as determined by Lipper, Inc. Investors cannot invest directly in an index.
Select Class Shares have a $1,000,000 minimum initial investment and carry no sales charge.
Performance may reflect the waiver of the Fund’s fees and reimbursement of expenses for certain periods since the inception date. Without these waivers and reimbursements performance would have been lower. Also, performance shown in this section does not reflect the deduction of taxes that a shareholder would pay on Fund distributions or redemption of Fund shares.
Because Class B Shares automatically convert to Class A Shares after 8 years, the 10 year average annual total return shown above for Class B reflects Class A performance for the period after conversion.
The returns shown are based on net asset values calculated for shareholder transactions and may differ from the return shown in the financial highlights, which reflect adjustments made to the net asset values in accordance with accounting principles generally accepted in the United States of America.
| | | | | | |
| | | |
| 14 | | | | J.P. MORGAN MID CAP/MULTI-CAP FUNDS | | DECEMBER 31, 2010 |
JPMorgan Mid Cap Value Fund
FUND COMMENTARY
SIX MONTHS ENDED DECEMBER 31, 2010 (Unaudited)
| | | | |
| REPORTING PERIOD RETURN: | | | |
| Fund (Institutional Class Shares)* | | | 23.60% | |
| Russell Midcap Value Index | | | 25.86% | |
| |
| Net Assets as of 12/31/2010 (In Thousands) | | $ | 6,323,039 | |
INVESTMENT OBJECTIVE**
The JPMorgan Mid Cap Value Fund (the “Fund”) seeks growth from capital appreciation.
WHAT WERE THE MAIN DRIVERS OF THE FUND’S PERFORMANCE?
The Fund (Institutional Class Shares) underperformed the Russell Midcap Value Index (the “Benchmark”) for the six months ended December 31, 2010. The Fund’s relative underperformance versus the Benchmark was primarily driven by negative stock selection in the health care and financials sectors. The Fund’s stock selection in the information technology sector as well as an underweight and stock selection in the utilities sector contributed to relative performance.
Individual detractors from the Fund’s relative performance included Lincare Holdings, Inc., Wilmington Trust Corp. and TCF Financial Corp. Shares of Lincare Holdings, Inc., a provider of oxygen and other respiratory therapy services, declined on concerns surrounding lower Medicare reimbursement rates for oxygen services. Shares of Wilmington Trust Corp. declined as the regional bank’s credit losses accelerated across its loan portfolio. Subsequently, the Fund exited its position in Wilmington Trust Corp. Shares of Minnesota-based bank TCF Financial Corp. declined due to concerns about federal legislation that would limit the fees that banks can charge retailers on debit-card transactions.
Individual contributors to relative performance included Williams Cos., Inc., Fortune Brands, Inc. and Tyco Electronics Ltd.
Williams Cos., Inc., is an integrated energy company. Investors reacted favorably to the company’s leadership succession plan following the announcement that the current chief executive officer would retire at the end of 2010. This announcement increased investor expectations that the company would unlock shareholder value by separating its operating segments. Meanwhile, investors were encouraged by the announcement that Fortune Brands, Inc.’s board of directors approved a separation of the company’s three consumer businesses – distilled spirits, home and security and golf products. Tyco Electronics Ltd. provides electronic instruments and controls. The company’s restructuring efforts left it well positioned to benefit as demand recovered in its end markets during the reporting period. In addition, investors reacted favorably to Tyco Electronics Ltd.’s acquisition of ADC Telecommunications, Inc.
HOW WAS THE FUND POSITIONED?
The Fund’s portfolio managers utilized a bottom-up approach to stock selection and sought to identify durable franchises possessing the ability to generate sustainable levels of free cash flow. The Fund’s portfolio managers believed that these types of companies should perform relatively well in what they view as a slow but sustainable economic recovery in the United States. The Fund’s largest overweight continued to be in the consumer discretionary sector. The Fund’s portfolio managers sought to own retailers with strong brands and business models that produce recurring revenue, believing that these factors, coupled with lower levels of capital spending, should contribute to their sustainable generation of free cash flow.
| | | | | | | | |
| | | |
| DECEMBER 31, 2010 | | J.P. MORGAN MID CAP/MULTI-CAP FUNDS | | | | | 15 | |
JPMorgan Mid Cap Value Fund
FUND COMMENTARY
SIX MONTHS ENDED DECEMBER 31, 2010 (Unaudited) (continued)
| | | | | | | | |
| TOP TEN EQUITY HOLDINGS OF THE PORTFOLIO*** | |
| | 1. | | | Gap, Inc. (The) | | | 2.0 | % |
| | 2. | | | Loews Corp. | | | 1.9 | |
| | 3. | | | Republic Services, Inc. | | | 1.8 | |
| | 4. | | | Tyco Electronics Ltd., (Switzerland) | | | 1.8 | |
| | 5. | | | Energen Corp. | | | 1.6 | |
| | 6. | | | Becton, Dickinson & Co. | | | 1.6 | |
| | 7. | | | Williams Cos., Inc. (The) | | | 1.6 | |
| | 8. | | | CMS Energy Corp. | | | 1.6 | |
| | 9. | | | Devon Energy Corp. | | | 1.6 | |
| | 10. | | | Ball Corp. | | | 1.5 | |
| | | | |
PORTFOLIO COMPOSITION BY SECTOR*** | |
| Financials | | | 23.9 | % |
| Consumer Discretionary | | | 18.4 | |
| Utilities | | | 10.4 | |
| Industrials | | | 8.8 | |
| Energy | | | 8.6 | |
| Materials | | | 6.6 | |
| Health Care | | | 6.0 | |
| Consumer Staples | | | 5.5 | |
| Information Technology | | | 5.4 | |
| Telecommunication Services | | | 2.5 | |
| Short-Term Investment | | | 3.9 | |
| * | | The return shown is based on net asset value calculated for shareholder transactions and may differ from the return shown in the financial highlights, which reflects adjustments made to the net asset value in accordance with accounting principles generally accepted in the United States of America. |
| ** | | The advisor seeks to achieve the Fund’s objective. There can be no guarantee it will be achieved. |
| *** | | Percentages indicated are based upon total investments (excluding Investments of Cash Collateral for Securities on Loan) as of December 31, 2010. The Fund’s composition is subject to change. |
| | | | | | |
| | | |
| 16 | | | | J.P. MORGAN MID CAP/MULTI-CAP FUNDS | | DECEMBER 31, 2010 |
| | | | | | | | | | | | | | | | | | | | |
AVERAGE ANNUAL TOTAL RETURNS AS OF DECEMBER 31, 2010 | |
| | | | | |
| | | INCEPTION DATE
OF CLASS | | | 6 MONTH* | | | 1 YEAR | | | 5 YEAR | | | 10 YEAR | |
CLASS A SHARES | | | 4/30/01 | | | | | | | | | | | | | | | | | |
Without Sales Charge | | | | | | | 23.27 | % | | | 22.82 | % | | | 4.31 | % | | | 8.99 | % |
With Sales Charge** | | | | | | | 16.79 | | | | 16.38 | | | | 3.19 | | | | 8.40 | |
CLASS B SHARES | | | 4/30/01 | | | | | | | | | | | | | | | | | |
Without CDSC | | | | | | | 23.00 | | | | 22.13 | | | | 3.79 | | | | 8.48 | |
With CDSC*** | | | | | | | 18.00 | | | | 17.13 | | | | 3.44 | | | | 8.48 | |
CLASS C SHARES | | | 4/30/01 | | | | | | | | | | | | | | | | | |
Without CDSC | | | | | | | 22.96 | | | | 22.17 | | | | 3.79 | | | | 8.40 | |
With CDSC**** | | | | | | | 21.96 | | | | 21.17 | | | | 3.79 | | | | 8.40 | |
CLASS R2 SHARES | | | 11/3/08 | | | | 23.14 | | | | 22.48 | | | | 4.20 | | | | 8.93 | |
INSTITUTIONAL CLASS SHARES | | | 11/13/97 | | | | 23.60 | | | | 23.34 | | | | 4.82 | | | | 9.52 | |
SELECT CLASS SHARES | | | 10/31/01 | | | | 23.45 | | | | 23.12 | | | | 4.57 | | | | 9.27 | |
| ** | | Sales Charge for Class A Shares is 5.25%. |
| *** | | Assumes 5% CDSC (contingent deferred sales charge) for the one year period, 2% CDSC for the five year period and 0% CDSC thereafter. |
| **** | | Assumes a 1% CDSC for the one year period and 0% CDSC thereafter. |
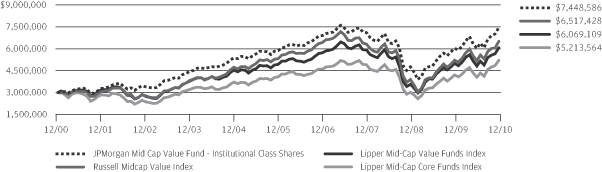
TEN YEAR PERFORMANCE (12/31/00 TO 12/31/10)
Source: Lipper, Inc. The performance quoted is past performance and is not a guarantee of future results. Mutual funds are subject to certain market risks. Investment returns and principal value of an investment will fluctuate so that an investor’s shares, when redeemed, may be worth more or less than their original cost. Current performance may be higher or lower than the performance data shown. For up-to-date month-end performance information please call 1-800-480-4111.
Returns for the Class A, Class B, Class C and Select Class Shares prior to their inception dates are based on the performance of Institutional Class Shares. During these periods, the actual returns of Class A, Class B, Class C and Select Class Shares would have been lower than shown because Class A, Class B, Class C and Select Class Shares have higher expenses than Institutional Class Shares. Returns for Class R2 Shares prior to its inception date are based on the performance of Class A Shares from April 30, 2001 to December 31, 2008 and Institutional Class Shares prior to April 30, 2001. The actual returns of Class R2 Shares would have been lower than those shown because Class R2 Shares have higher expenses than Class A and Institutional Class Shares.
The graph illustrates comparative performance for $3,000,000 invested in Institutional Class Shares of the JPMorgan Mid Cap Value Fund, the Russell Mid-cap Value Index, the Lipper Mid-Cap Core Funds Index and the Lipper
Mid-Cap Value Funds Index from December 31, 2000 to December 31, 2010. The performance of the Fund assumes reinvestment of all dividends and capital gains, if any, and does not include a sales charge. The performance of the Russell Midcap Value Index does not reflect the deduction of expenses or a sales charge associated with a mutual fund and has been adjusted to reflect reinvestment of all dividends and capital gains of the securities included in the benchmark. The performance of the Lipper Mid-Cap Core Funds Index and the Lipper Mid-Cap Value Funds Index includes expenses associated with a mutual fund, such as investment management fees. These expenses are not identical to the expenses charged by the Fund. The Russell Midcap Value Index is an unmanaged index which measures the performance of those Russell Midcap companies with lower price-to-book ratios and lower forecasted growth values. The Lipper Mid-Cap Core Funds Index and the Lipper Mid-Cap Value Funds Index are indexes based on total returns of certain groups of mutual funds as determined by Lipper, Inc. The Fund’s Lipper Index changed to the Lipper Mid-Cap Core Funds Index because Lipper recategorized the Fund. Investors cannot invest directly in an index.
Institutional Class Shares have a $3,000,000 minimum initial investment and carry no sales charge.
| | | | | | | | |
| | | |
| DECEMBER 31, 2010 | | J.P. MORGAN MID CAP/MULTI-CAP FUNDS | | | | | 17 | |
JPMorgan Mid Cap Value Fund
FUND COMMENTARY
SIX MONTHS ENDED DECEMBER 31, 2010 (Unaudited) (continued)
Performance may reflect the waiver of the Fund’s fees and reimbursement of expenses for certain periods since the inception date. Without these waivers and reimbursements performance would have been lower. Also, performance shown in this section does not reflect the deduction of taxes that a shareholder would pay on Fund distributions or redemption of Fund shares.
Because Class B Shares automatically convert to Class A Shares after 8 years, the 10 year average annual total return shown above for Class B reflects Class A performance for the period after conversion.
The returns shown are based on net asset values calculated for shareholder transactions and may differ from the return shown in the financial highlights, which reflect adjustments made to the net asset values in accordance with accounting principles generally accepted in the United States of America.
| | | | | | |
| | | |
| 18 | | | | J.P. MORGAN MID CAP/MULTI-CAP FUNDS | | DECEMBER 31, 2010 |
JPMorgan Multi-Cap Market Neutral Fund
FUND COMMENTARY
SIX MONTHS ENDED DECEMBER 31, 2010 (Unaudited)
| | | | |
| REPORTING PERIOD RETURN: | | | |
| Fund (Select Class Shares)* | | | -1.23% | |
| BofA Merrill Lynch 3-Month U.S. Treasury Bill Index | | | 0.08% | |
| |
| Net Assets as of 12/31/2010 (In Thousands) | | $ | 580,414 | |
INVESTMENT OBJECTIVE**
The JPMorgan Multi-Cap Market Neutral Fund (the “Fund”) seeks long-term capital preservation and growth by using strategies designed to produce returns which have no correlation with general domestic market performance.
WHAT WERE THE MAIN DRIVERS OF THE FUND’S PERFORMANCE?
The Fund (Select Class Shares) underperformed the BofA Merrill Lynch 3-Month U.S. Treasury Bill Index for the six months ended December 31, 2010.
The Fund categorizes its universe of stocks into five supersectors. Of the Fund’s five supersector categories, stock selection in the consumer, financial and health care sectors produced negative returns during the reporting period and detracted the most from performance. Positive stock selection in the industrial and technology sectors helped somewhat offset these losses. Overall, the Fund’s short positions detracted from the Fund’s performance, while the Fund’s long positions contributed to the Fund’s performance.
Within these supersectors, the Fund’s portfolio managers employed a quantitative bottom-up approach to their stock selection process, focusing on both valuation and fundamentals.
The Fund’s valuation stock selection model seeks to determine how a stock is priced relative to its intrinsic value by considering valuation factors such as a company’s cash flow and price-to-book values. The valuation stock selection model was slightly negative during the reporting period as investors paid less attention to cash flow in comparison to other metrics.
The Fund’s fundamentals stock selection model attempts to identify how healthy a company’s short-term operating trends are judged to be, using metrics such as stock price momentum and earnings momentum. The approach benefited as investors began to show signs of a renewed focus on company fundamentals.
HOW WAS THE FUND POSITIONED?
The Fund’s portfolio managers ranked stocks within a universe of approximately 1,300 large-cap, mid-cap and high-end small-cap stocks. The Fund owned more than 350 long and short positions during the reporting period and was sector-neutral. The Fund’s portfolio managers sought to go long on inexpensive stocks with improving fundamentals and short on expensive stocks with deteriorating fundamentals. They continued to use strategies designed to produce returns that have no correlation with general domestic market performance.
| | | | | | | | |
| | | |
| DECEMBER 31, 2010 | | J.P. MORGAN MID CAP/MULTI-CAP FUNDS | | | | | 19 | |
JPMorgan Multi-Cap Market Neutral Fund
FUND COMMENTARY
SIX MONTHS ENDED DECEMBER 31, 2010 (Unaudited) (continued)
| | | | | | | | |
| TOP TEN EQUITY LONG HOLDINGS OF THE PORTFOLIO*** | |
| | 1. | | | Cliffs Natural Resources, Inc. | | | 0.5 | % |
| | 2. | | | Freeport-McMoRan Copper & Gold, Inc. | | | 0.5 | |
| | 3. | | | Jo-Ann Stores, Inc. | | | 0.5 | |
| | 4. | | | Concho Resources, Inc. | | | 0.5 | |
| | 5. | | | Walter Energy, Inc. | | | 0.5 | |
| | 6. | | | InterDigital, Inc. | | | 0.5 | |
| | 7. | | | Dana Holding Corp. | | | 0.4 | |
| | 8. | | | Williams-Sonoma, Inc. | | | 0.4 | |
| | 9. | | | Eastman Chemical Co. | | | 0.4 | |
| | 10. | | | Corn Products International, Inc. | | | 0.4 | |
| | | | | | | | |
| TOP TEN EQUITY SHORT HOLDINGS OF THE PORTFOLIO**** | |
| | 1. | | | Edwards Lifesciences Corp. | | | 0.5 | % |
| | 2. | | | SandRidge Energy, Inc. | | | 0.5 | |
| | 3. | | | USG Corp. | | | 0.5 | |
| | 4. | | | Ciena Corp. | | | 0.5 | |
| | 5. | | | Janus Capital Group, Inc. | | | 0.5 | |
| | 6. | | | Brookdale Senior Living, Inc. | | | 0.5 | |
| | 7. | | | EQT Corp. | | | 0.5 | |
| | 8. | | | Terex Corp. | | | 0.5 | |
| | 9. | | | Consol Energy, Inc. | | | 0.5 | |
| | 10. | | | Spectra Energy Corp. | | | 0.5 | |
| | | | |
PORTFOLIO COMPOSITION BY SECTOR LONG POSITIONS*** | |
| Consumer Discretionary | | | 19.1 | % |
| Information Technology | | | 15.9 | |
| Financials | | | 11.2 | |
| Industrials | | | 10.6 | |
| Health Care | | | 10.5 | |
| Energy | | | 7.5 | |
| Materials | | | 7.5 | |
| Utilities | | | 5.6 | |
| Consumer Staples | | | 4.1 | |
| Telecommunication Services | | | 0.5 | |
| Short-Term Investment | | | 7.5 | |
| | | | |
PORTFOLIO COMPOSITION BY SECTOR SHORT POSITIONS**** | |
| Information Technology | | | 17.6 | % |
| Industrials | | | 15.8 | |
| Financials | | | 12.8 | |
| Health Care | | | 11.5 | |
| Energy | | | 11.1 | |
| Consumer Discretionary | | | 10.1 | |
| Materials | | | 8.1 | |
| Consumer Staples | | | 6.7 | |
| Utilities | | | 5.2 | |
| Telecommunication Services | | | 1.1 | |
| * | | The return shown is based on net asset value calculated for shareholder transactions and may differ from the return shown in the financial highlights, which reflects adjustments made to the net asset value in accordance with accounting principles generally accepted in the United States of America. |
| ** | | The advisor seeks to achieve the Fund’s objective. There can be no guarantee it will be achieved. |
| *** | | Percentages indicated are based upon total long investments as of December 31, 2010. The Fund’s composition is subject to change. |
| **** | | Percentages indicated are based upon total short investments as of December 31, 2010. The Fund’s composition is subject to change. |
| | | | | | |
| | | |
| 20 | | | | J.P. MORGAN MID CAP/MULTI-CAP FUNDS | | DECEMBER 31, 2010 |
| | | | | | | | | | | | | | | | | | | | |
AVERAGE ANNUAL TOTAL RETURNS AS OF DECEMBER 31, 2010 | |
| | | | | |
| | | INCEPTION DATE
OF CLASS | | | 6 MONTH* | | | 1 YEAR | | | 5 YEAR | | | SINCE
INCEPTION | |
CLASS A SHARES | | | 5/23/03 | | | | | | | | | | | | | | | | | |
Without Sales Charge | | | | | | | (1.34 | )% | | | (4.58 | )% | | | (0.27 | )% | | | 1.30 | % |
With Sales Charge** | | | | | | | (6.54 | ) | | | (9.62 | ) | | | (1.33 | ) | | | 0.59 | |
CLASS B SHARES | | | 5/23/03 | | | | | | | | | | | | | | | | | |
Without CDSC | | | | | | | (1.69 | ) | | | (5.31 | ) | | | (1.02 | ) | | | 0.54 | |
With CDSC*** | | | | | | | (6.69 | ) | | | (10.31 | ) | | | (1.44 | ) | | | 0.54 | |
CLASS C SHARES | | | 5/23/03 | | | | | | | | | | | | | | | | | |
Without CDSC | | | | | | | (1.80 | ) | | | (5.30 | ) | | | (1.02 | ) | | | 0.54 | |
With CDSC**** | | | | | | | (2.80 | ) | | | (6.30 | ) | | | (1.02 | ) | | | 0.54 | |
SELECT CLASS SHARES | | | 5/23/03 | | | | (1.23 | ) | | | (4.35 | ) | | | (0.01 | ) | | | 1.55 | |
| ** | | Sales Charge for Class A Shares is 5.25%. |
| *** | | Assumes 5% CDSC (contingent deferred sales charge) for the one year period, 2% CDSC for the five year period and 0% CDSC thereafter. |
| **** | | Assumes a 1% CDSC for the one year period and 0% CDSC thereafter. |
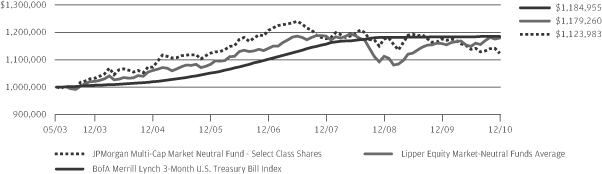
LIFE OF FUND PERFORMANCE (5/23/03 TO 12/31/10)
Source: Lipper, Inc. The performance quoted is past performance and is not a guarantee of future results. Mutual funds are subject to certain market risks. Investment returns and principal value of an investment will fluctuate so that an investor’s shares, when redeemed, may be worth more or less than their original cost. Current performance may be higher or lower than the performance data shown. For up-to-date month-end performance information please call 1-800-480-4111.
The Fund commenced operations on May 23, 2003.
The graph illustrates comparative performance for $1,000,000 invested in Select Class Shares of the JPMorgan Multi-Cap Market Neutral Fund, the BofA Merrill Lynch 3-Month U.S. Treasury Bill Index and the Lipper Equity Market-Neutral Funds Average from May 23, 2003 to December 31, 2010. The performance of the Fund assumes reinvestment of all dividends and capital gains, if any, and does not include a sales charge. The performance of the indices reflects an initial investment at the end of the month following the Fund’s inception. The performance of the BofA Merrill Lynch 3-Month U.S. Treasury Bill Index does not reflect the deduction of expenses or a sales charge associated with a mutual fund and has been adjusted to reflect reinvestment of all dividends and capital gains of the securities included in the benchmark. The performance of the Lipper Equity Market-Neutral Funds Average includes expenses
associated with a mutual fund, such as investment management fees. These expenses are not identical to the expenses charged by the Fund. The BofA Merrill Lynch 3-Month U.S. Treasury Bill Index is comprised of a single issue purchased at the beginning of the month and held for a full month. Each month the index is rebalanced and the issue selected is the outstanding Treasury Bill that matures closest to, but not beyond 3 months from the rebalancing date. The Lipper Equity Market-Neutral Funds Average is an index based on total returns of certain mutual funds within the Fund’s designated category as determined by Lipper, Inc. Investors cannot invest directly in an index.
Select Class Shares have a $1,000,000 minimum initial investment and carry no sales charge.
Performance may reflect the waiver of the Fund’s fees and reimbursement of expenses for certain periods since the inception date. Without these waivers and reimbursements performance would have been lower. Also, performance shown in this section does not reflect the deduction of taxes that a shareholder would pay on Fund distributions or redemption of Fund shares.
The returns shown are based on net asset values calculated for shareholder transactions and may differ from the return shown in the financial highlights, which reflect adjustments made to the net assets value in accordance with accounting principles generally accepted in the United States of America.
| | | | | | | | |
| | | |
| DECEMBER 31, 2010 | | J.P. MORGAN MID CAP/MULTI-CAP FUNDS | | | | | 21 | |
JPMorgan Value Advantage Fund
FUND COMMENTARY
SIX MONTHS ENDED DECEMBER 31, 2010 (Unaudited)
| | | | |
| REPORTING PERIOD RETURN: | | | |
| Fund (Institutional Class Shares)* | | | 20.88% | |
| Russell 3000 Value Index | | | 22.12% | |
| |
| Net Assets as of 12/31/2010 (In Thousands) | | $ | 816,152 | |
INVESTMENT OBJECTIVE**
The JPMorgan Value Advantage Fund (the “Fund”) seeks to provide long-term total return from a combination of income and capital gains.
WHAT WERE THE MAIN DRIVERS OF THE FUND’S PERFORMANCE?
The Fund (Institutional Class Shares) underperformed the Russell 3000 Value Index (the “Benchmark”) for the six months ended December 31, 2010. The Fund’s relative underperformance versus the Benchmark was driven primarily by the Fund’s stock selection in the energy sector, as well as an underweight and stock selection in the materials sector. The Fund’s underweight and stock selection the consumer staples sector and stock selection in the financials sector contributed to relative performance.
Individual detractors from the Fund’s relative performance included Wilmington Trust Corp., United Community Banks, Inc. and Lincare Holdings, Inc. Shares of Wilmington Trust Corp. declined as the regional bank’s credit losses accelerated across its loan portfolio. Regional bank United Community Banks, Inc. also suffered continuing credit losses in its loan portfolio. Subsequently, the Fund exited its positions in United Community Banks, Inc. and Wilmington Trust Corp. Shares of Lincare Holdings, Inc., a provider of oxygen and other respiratory therapy services, declined on concerns surrounding lower Medicare reimbursement rates for oxygen services.
Individual contributors to relative performance included Devon Energy Corp., Wells Fargo & Co. and Exxon Mobil Corp. Shares of Devon Energy Corp., an oil and gas operations company, benefited from the sale of its international and offshore assets, including those in the Gulf of Mexico that it sold shortly before the oil spill. Devon Energy Corp. also announced plans to buy back its stock. Shares of financial services provider Wells Fargo & Co. benefited from investor expectations that the company’s strong earnings power would allow it to return excess capital to shareholders. Exxon Mobil Corp. reported strong operating results and benefited from the increasing price of oil and gasoline.
HOW WAS THE FUND POSITIONED?
The Fund’s portfolio managers utilized a bottom-up approach to stock selection and sought to identify durable franchises possessing the ability to generate significant levels of free cash flow. Bottom-up fundamental research led the Fund’s portfolio managers to several larger-cap stocks with significant excess cash reserves and strong balance sheets. In their view, these stocks appeared to be trading at more attractive levels than many of the cyclical stocks in the industrials and materials sectors, both sectors in which the Fund was underweight.
The Fund’s largest overweight was in the consumer discretionary sector. The Fund’s portfolio managers attempted to own retailers with strong brands and recurring revenue business models. They believed that these factors coupled with lower levels of capital spending should contribute to the generation of free cash flow.
| | | | | | |
| | | |
| 22 | | | | J.P. MORGAN MID CAP/MULTI-CAP FUNDS | | DECEMBER 31, 2010 |
| | | | | | | | |
| TOP TEN EQUITY HOLDINGS OF THE PORTFOLIO*** | |
| | 1. | | | Wells Fargo & Co. | | | 3.7 | % |
| | 2. | | | Loews Corp. | | | 3.4 | |
| | 3. | | | Devon Energy Corp. | | | 3.1 | |
| | 4. | | | Exxon Mobil Corp. | | | 2.5 | |
| | 5. | | | Gap, Inc. (The) | | | 2.2 | |
| | 6. | | | AT&T, Inc. | | | 2.0 | |
| | 7. | | | Teekay Corp., (Canada) | | | 2.0 | |
| | 8. | | | Merck & Co., Inc. | | | 1.8 | |
| | 9. | | | Oneok, Inc. | | | 1.8 | |
| | 10. | | | Johnson & Johnson | | | 1.6 | |
| | | | |
PORTFOLIO COMPOSITION BY SECTOR*** | |
| Financials | | | 31.3 | % |
| Consumer Discretionary | | | 14.1 | |
| Energy | | | 11.8 | |
| Health Care | | | 10.2 | |
| Utilities | | | 7.0 | |
| Consumer Staples | | | 6.1 | |
| Telecommunication Services | | | 3.8 | |
| Industrials | | | 3.6 | |
| Information Technology | | | 3.2 | |
| Materials | | | 2.3 | |
| Investment Company | | | 1.0 | |
| Short-Term Investment | | | 5.6 | |
| * | | The return shown is based on net asset value calculated for share- holder transactions and may differ from the return shown in the financial highlights, which reflects adjustments made to the net asset value in accordance with accounting principles generally accepted in the United States of America. |
| ** | | The advisor seeks to achieve the Fund’s objective. There can be no guarantee it will be achieved. |
| *** | | Percentages indicated are based upon total investments as of December 31, 2010. The Fund’s composition is subject to change. |
| | | | | | | | |
| | | |
| DECEMBER 31, 2010 | | J.P. MORGAN MID CAP/MULTI-CAP FUNDS | | | | | 23 | |
JPMorgan Value Advantage Fund
FUND COMMENTARY
SIX MONTHS ENDED DECEMBER 31, 2010 (Unaudited) (continued)
| | | | | | | | | | | | | | | | | | | | |
AVERAGE ANNUAL TOTAL RETURNS AS OF DECEMBER 31, 2010 | |
| | | | | |
| | | INCEPTION DATE
OF CLASS | | | 6 MONTH* | | | 1 YEAR | | | 5 YEAR | | | SINCE
INCEPTION | |
CLASS A SHARES | | | 2/28/05 | | | | | | | | | | | | | | | | | |
Without Sales Charge | | | | | | | 20.61 | % | | | 20.22 | % | | | 5.54 | % | | | 6.02 | % |
With Sales Charge** | | | | | | | 14.31 | | | | 13.88 | | | | 4.41 | | | | 5.05 | |
CLASS C SHARES | | | 2/28/05 | | | | | | | | | | | | | | | | | |
Without CDSC | | | | | | | 20.33 | | | | 19.62 | | | | 5.01 | | | | 5.50 | |
With CDSC*** | | | | | | | 19.33 | | | | 18.62 | | | | 5.01 | | | | 5.50 | |
INSTITUTIONAL CLASS SHARES | | | 2/28/05 | | | | 20.88 | | | | 20.72 | | | | 6.08 | | | | 6.46 | |
SELECT CLASS SHARES | | | 2/28/05 | | | | 20.71 | | | | 20.48 | | | | 5.80 | | | | 6.29 | |
| ** | | Sales Charge for Class A Shares is 5.25%. |
| *** | | Assumes a 1% CDSC (contingent deferred sales charge) for the one year period and 0% CDSC thereafter. |
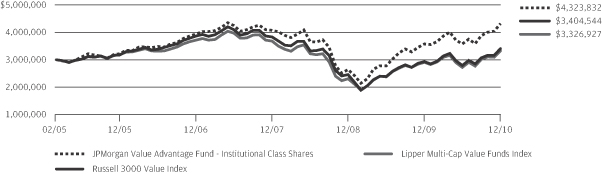
LIFE OF FUND PERFORMANCE (2/28/05 TO 12/31/10)
Source: Lipper, Inc. The performance quoted is past performance and is not a guarantee of future results. Mutual funds are subject to certain market risks. Investment returns and principal value of an investment will fluctuate so that an investor’s shares, when redeemed, may be worth more or less than their original cost. Current performance may be higher or lower than the performance data shown. For up-to-date month-end performance information please call 1-800-480-4111.
The Fund commenced operations on February 28, 2005.
The graph illustrates comparative performance for $3,000,000 invested in Institutional Class Shares of the JPMorgan Value Advantage Fund, the Russell 3000 Value Index and the Lipper Multi-Cap Value Funds Index from February 28, 2005 to December 31, 2010. The performance of the Fund assumes reinvestment of all dividends and capital gains, if any, and does not include a sales charge. The performance of the Russell 3000 Value Index does not reflect the deduction of expenses or a sales charge associated with a mutual fund and has been adjusted to reflect reinvestment of all dividends and capital gains of the securities included in the benchmark. The performance of the Lipper Multi-Cap Value Funds Index includes expenses associated with a mutual fund,
such as investment management fees. These expenses are not identical to the expenses charged by the Fund. The Russell 3000 Value Index is an unmanaged index which measures the performance of those Russell 3000 companies (largest 3000 U.S. companies) with lower price-to-book ratios and lower forecasted growth values. The Lipper Multi-Cap Value Funds Index is an index based on total returns of certain mutual funds within the Fund’s designated category as determined by Lipper, Inc. Investors cannot invest directly in an index.
Institutional Class Shares have a $3,000,000 minimum initial investment and carry no sales charge.
Performance may reflect the waiver of the Fund’s fees and reimbursement of expenses for certain periods since the inception date. Without these waivers and reimbursements performance would have been lower. Also, performance shown in this section does not reflect the deduction of taxes that a shareholder would pay on Fund distributions or redemption of Fund shares.
The returns shown are based on net asset values calculated for shareholder transactions and may differ from the return shown in the financial highlights, which reflect adjustments made to the net asset values in accordance with accounting principles generally accepted in the United States of America.
| | | | | | |
| | | |
| 24 | | | | J.P. MORGAN MID CAP/MULTI-CAP FUNDS | | DECEMBER 31, 2010 |
JPMorgan Growth Advantage Fund
SCHEDULE OF PORTFOLIO INVESTMENTS
AS OF DECEMBER 31, 2010 (Unaudited)
(Amounts in thousands)
| | | | | | | | |
| SHARES | | | SECURITY DESCRIPTION | | VALUE($) | |
| | | | | | | | |
| Common Stocks — 96.7% | | | | |
| | | | Consumer Discretionary — 18.7% | | | | |
| | | | Auto Components — 2.5% | | | | |
| | 251 | | | Gentex Corp. | | | 7,422 | |
| | 322 | | | Johnson Controls, Inc. | | | 12,297 | |
| | | | | | | | |
| | | | | | | 19,719 | |
| | | | | | | | |
| | | | Automobiles — 1.3% | | | | |
| | 310 | | | Harley-Davidson, Inc. (c) | | | 10,744 | |
| | | | | | | | |
| | | | Diversified Consumer Services — 1.4% | | | | |
| | 149 | | | American Public Education, Inc. (a) | | | 5,556 | |
| | 127 | | | Sotheby’s (c) | | | 5,724 | |
| | | | | | | | |
| | | | | | | 11,280 | |
| | | | | | | | |
| | | | Hotels, Restaurants & Leisure — 1.9% | | | | |
| | 174 | | | Cheesecake Factory, Inc. (The) (a) (c) | | | 5,344 | |
| | 183 | | | Gaylord Entertainment Co. (a) | | | 6,563 | |
| | 184 | | | International Game Technology | | | 3,261 | |
| | | | | | | | |
| | | | | | | 15,168 | |
| | | | | | | | |
| | | | Household Durables — 1.0% | | | | |
| | 171 | | | Harman International Industries, Inc. (a) | | | 7,908 | |
| | | | | | | | |
| | | | Internet & Catalog Retail — 3.8% | | | | |
| | 149 | | | Amazon.com, Inc. (a) | | | 26,802 | |
| | 18 | | | NetFlix, Inc. (a) | | | 3,233 | |
| | | | | | | | |
| | | | | | | 30,035 | |
| | | | | | | | |
| | | | Media — 4.0% | | | | |
| | 336 | | | Lamar Advertising Co., Class A (a) | | | 13,394 | |
| | 181 | | | Scripps Networks Interactive, Inc., Class A | | | 9,383 | |
| | 246 | | | Walt Disney Co. (The) | | | 9,216 | |
| | | | | | | | |
| | | | | | | 31,993 | |
| | | | | | | | |
| | | | Specialty Retail — 1.9% | | | | |
| | 230 | | | Dick’s Sporting Goods, Inc. (a) (c) | | | 8,610 | |
| | 373 | | | OfficeMax, Inc. (a) | | | 6,598 | |
| | | | | | | | |
| | | | | | | 15,208 | |
| | | | | | | | |
| | | | Textiles, Apparel & Luxury Goods — 0.9% | | | | |
| | 131 | | | Coach, Inc. | | | 7,240 | |
| | | | | | | | |
| | | | Total Consumer Discretionary | | | 149,295 | |
| | | | | | | | |
| | | | Consumer Staples — 1.2% | | | | |
| | | | Beverages — 1.2% | | | | |
| | 147 | | | Coca-Cola Co. (The) | | | 9,675 | |
| | | | | | | | |
| | | | Energy — 6.9% | | | | |
| | | | Energy Equipment & Services — 2.8% | | | | |
| | 172 | | | Cameron International Corp. (a) | | | 8,730 | |
| | 166 | | | Schlumberger Ltd. | | | 13,886 | |
| | | | | | | | |
| | | | | | | 22,616 | |
| | | | | | | | |
| | | | | | | | |
| SHARES | | | SECURITY DESCRIPTION | | VALUE($) | |
| | | | | | | | |
| | | | | | | | |
| | | | Oil, Gas & Consumable Fuels — 4.1% | | | | |
| | 69 | | | Apache Corp. | | | 8,191 | |
| | 175 | | | Concho Resources, Inc. (a) | | | 15,368 | |
| | 229 | | | Forest Oil Corp. (a) | | | 8,684 | |
| | | | | | | | |
| | | | | | | 32,243 | |
| | | | | | | | |
| | | | Total Energy | | | 54,859 | |
| | | | | | | | |
| | | | Financials — 9.6% | | | | |
| | | | Capital Markets — 3.4% | | | | |
| | 191 | | | Lazard Ltd., (Bermuda), Class A | | | 7,543 | |
| | 68 | | | LPL Investment Holdings, Inc. (a) | | | 2,484 | |
| | 467 | | | Och-Ziff Capital Management Group LLC, Class A | | | 7,271 | |
| | 153 | | | T. Rowe Price Group, Inc. | | | 9,862 | |
| | | | | | | | |
| | | | | | | 27,160 | |
| | | | | | | | |
| | | | Commercial Banks — 2.0% | | | | |
| | 295 | | | U.S. Bancorp | | | 7,954 | |
| | 258 | | | Wells Fargo & Co. | | | 7,995 | |
| | | | | | | | |
| | | | | | | 15,949 | |
| | | | | | | | |
| | | | Consumer Finance — 1.4% | | | | |
| | 249 | | | American Express Co. | | | 10,674 | |
| | | | | | | | |
| | | | Diversified Financial Services — 1.0% | | | | |
| | 26 | | | CME Group, Inc. | | | 8,237 | |
| | | | | | | | |
| | | | Insurance — 1.8% | | | | |
| | 130 | | | ACE Ltd., (Switzerland) | | | 8,092 | |
| | 141 | | | AON Corp. | | | 6,489 | |
| | | | | | | | |
| | | | | | | 14,581 | |
| | | | | | | | |
| | | | Total Financials | | | 76,601 | |
| | | | | | | | |
| | | | Health Care — 13.4% | | | | |
| | | | Biotechnology — 2.1% | | | | |
| | 64 | | | Alexion Pharmaceuticals, Inc. (a) (c) | | | 5,179 | |
| | 67 | | | Biogen Idec, Inc. (a) | | | 4,486 | |
| | 124 | | | Celgene Corp. (a) | | | 7,339 | |
| | | | | | | | |
| | | | | | | 17,004 | |
| | | | | | | | |
| | | | Health Care Equipment & Supplies — 1.8% | | | | |
| | 164 | | | Sirona Dental Systems, Inc. (a) | | | 6,856 | |
| | 257 | | | Thoratec Corp. (a) | | | 7,270 | |
| | | | | | | | |
| | | | | | | 14,126 | |
| | | | | | | | |
| | | | Health Care Providers & Services — 6.0% | | | | |
| | 98 | | | DaVita, Inc. (a) | | | 6,824 | |
| | 222 | | | Emeritus Corp. (a) (c) | | | 4,370 | |
| | 212 | | | Express Scripts, Inc. (a) | | | 11,432 | |
| | 142 | | | Healthspring, Inc. (a) | | | 3,775 | |
| | 341 | | | Lincare Holdings, Inc. | | | 9,161 | |
| | 345 | | | UnitedHealth Group, Inc. | | | 12,447 | |
| | | | | | | | |
| | | | | | | 48,009 | |
| | | | | | | | |
SEE NOTES TO FINANCIAL STATEMENTS.
| | | | | | | | |
| | | |
| DECEMBER 31, 2010 | | J.P. MORGAN MID CAP/MULTI-CAP FUNDS | | | | | 25 | |
JPMorgan Growth Advantage Fund
SCHEDULE OF PORTFOLIO INVESTMENTS
AS OF DECEMBER 31, 2010 (Unaudited) (continued)
(Amounts in thousands)
| | | | | | | | |
| SHARES | | | SECURITY DESCRIPTION | | VALUE($) | |
| | | | | | | | |
| Common Stocks — Continued | | | | |
| | | | Life Sciences Tools & Services — 1.6% | | | | |
| | 301 | | | Agilent Technologies, Inc. (a) | | | 12,458 | |
| | | | | | | | |
| | | | Pharmaceuticals — 1.9% | | | | |
| | 542 | | | Valeant Pharmaceuticals International, Inc.,
(Canada) (c) | | | 15,336 | |
| | | | | | | | |
| | | | Total Health Care | | | 106,933 | |
| | | | | | | | |
| | | | Industrials — 12.5% | | | | |
| | | | Aerospace & Defense — 2.6% | | | | |
| | 92 | | | Goodrich Corp. | | | 8,058 | |
| | 112 | | | HEICO Corp. (c) | | | 5,697 | |
| | 53 | | | Precision Castparts Corp. | | | 7,413 | |
| | | | | | | | |
| | | | | | | 21,168 | |
| | | | | | | | |
| | | | Airlines — 0.8% | | | | |
| | 495 | | | Delta Air Lines, Inc. (a) | | | 6,241 | |
| | | | | | | | |
| | | | Electrical Equipment — 1.2% | | | | |
| | 133 | | | Rockwell Automation, Inc. | | | 9,537 | |
| | | | | | | | |
| | | | Machinery — 4.0% | | | | |
| | 129 | | | Cummins, Inc. | | | 14,202 | |
| | 130 | | | Deere & Co. | | | 10,755 | |
| | 130 | | | Wabtec Corp. (c) | | | 6,892 | |
| | | | | | | | |
| | | | | | | 31,849 | |
| | | | | | | | |
| | | | Road & Rail — 2.5% | | | | |
| | 462 | | | Avis Budget Group, Inc. (a) (c) | | | 7,182 | |
| | 125 | | | J.B. Hunt Transport Services, Inc. | | | 5,097 | |
| | 248 | | | Old Dominion Freight Line, Inc. (a) | | | 7,921 | |
| | | | | | | | |
| | | | | | | 20,200 | |
| | | | | | | | |
| | | | Trading Companies & Distributors — 1.4% | | | | |
| | 79 | | | W.W. Grainger, Inc. (c) | | | 10,952 | |
| | | | | | | | |
| | | | Total Industrials | | | 99,947 | |
| | | | | | | | |
| | | | Information Technology — 30.3% | | | | |
| | | | Communications Equipment — 3.2% | | | | |
| | 215 | | | Juniper Networks, Inc. (a) | | | 7,942 | |
| | 244 | | | QUALCOMM, Inc. | | | 12,061 | |
| | 158 | | | Riverbed Technology, Inc. (a) | | | 5,539 | |
| | | | | | | | |
| | | | | | | 25,542 | |
| | | | | | | | |
| | | | Computers & Peripherals — 8.5% | | | | |
| | 163 | | | Apple, Inc. (a) | | | 52,496 | |
| | 227 | | | EMC Corp. (a) | | | 5,187 | |
| | 191 | | | NetApp, Inc. (a) (c) | | | 10,514 | |
| | | | | | | | |
| | | | | | | 68,197 | |
| | | | | | | | |
| | | | | | | | |
| SHARES | | | SECURITY DESCRIPTION | | VALUE($) | |
| | | | | | | | |
| | | | | | | | |
| | | | Electronic Equipment, Instruments & Components — 2.6% | |
| | 197 | | | Amphenol Corp., Class A | | | 10,376 | |
| | 303 | | | Tyco Electronics Ltd., (Switzerland) | | | 10,716 | |
| | | | | | | | |
| | | | | | | 21,092 | |
| | | | | | | | |
| | | | Internet Software & Services — 1.6% | | | | |
| | 21 | | | Google, Inc., Class A (a) | | | 12,414 | |
| | | | | | | | |
| | | | IT Services — 3.9% | | | | |
| | 304 | | | CGI Group, Inc., (Canada), Class A (a) | | | 5,250 | |
| | 153 | | | Cognizant Technology Solutions Corp., Class A (a) | | | 11,199 | |
| | 145 | | | FleetCor Technologies, Inc. (a) | | | 4,474 | |
| | 44 | | | MasterCard, Inc., Class A | | | 9,861 | |
| | | | | | | | |
| | | | | | | 30,784 | |
| | | | | | | | |
| | | | Office Electronics — 0.8% | | | | |
| | 175 | | | Zebra Technologies Corp., Class A (a) | | | 6,656 | |
| | | | | | | | |
| | | | Semiconductors & Semiconductor Equipment — 3.2% | |
| | 225 | | | Broadcom Corp., Class A | | | 9,799 | |
| | 164 | | | Lam Research Corp. (a) | | | 8,487 | |
| | 386 | | | Marvell Technology Group Ltd., (Bermuda) (a) | | | 7,158 | |
| | | | | | | | |
| | | | | | | 25,444 | |
| | | | | | | | |
| | | | Software — 6.5% | | | | |
| | 99 | | | Autodesk, Inc. (a) | | | 3,770 | |
| | 72 | | | Citrix Systems, Inc. (a) | | | 4,898 | |
| | 106 | | | Concur Technologies, Inc. (a) | | | 5,526 | |
| | 184 | | | MICROS Systems, Inc. (a) | | | 8,048 | |
| | 251 | | | Microsoft Corp. | | | 7,019 | |
| | 393 | | | Oracle Corp. | | | 12,292 | |
| | 43 | | | Salesforce.com, Inc. (a) | | | 5,689 | |
| | 166 | | | Taleo Corp., Class A (a) | | | 4,598 | |
| | | | | | | | |
| | | | | | | 51,840 | |
| | | | | | | | |
| | | | Total Information Technology | | | 241,969 | |
| | | | | | | | |
| | | | Materials — 4.1% | | | | |
| | | | Chemicals — 1.3% | | | | |
| | 127 | | | Sherwin-Williams Co. (The) | | | 10,594 | |
| | | | | | | | |
| | | | Containers & Packaging — 1.2% | | | | |
| | 85 | | | Bemis Co., Inc. | | | 2,782 | |
| | 111 | | | Greif, Inc., Class A | | | 6,896 | |
| | | | | | | | |
| | | | | | | 9,678 | |
| | | | | | | | |
| | | | Metals & Mining — 1.6% | | | | |
| | 106 | | | Freeport-McMoRan Copper & Gold, Inc. | | | 12,705 | |
| | | | | | | | |
| | | | Total Materials | | | 32,977 | |
| | | | | | | | |
| | | | Total Common Stocks
(Cost $561,659) | | | 772,256 | |
| | | | | | | | |
SEE NOTES TO FINANCIAL STATEMENTS.
| | | | | | |
| | | |
| 26 | | | | J.P. MORGAN MID CAP/MULTI-CAP FUNDS | | DECEMBER 31, 2010 |
| | | | | | | | |
| SHARES | | | SECURITY DESCRIPTION | | VALUE($) | |
| | | | | | | | |
| Short-Term Investment — 2.2% | | | | |
| | | | Investment Company — 2.2% | | | | |
| | 17,590 | | | JPMorgan Prime Money Market Fund, Institutional Class Shares, 0.100% (b) (l) (m)
(Cost $17,590) | | | 17,590 | |
| | | | | | | | |
| Investment of Cash Collateral for Securities on Loan — 7.2% | | | | |
| | | | Investment Company — 7.2% | | | | |
| | 57,248 | | | JPMorgan Prime Money Market Fund, Capital Shares, 0.130% (b) (l)
(Cost $57,248) | | | 57,248 | |
| | | | | | | | |
| | | | Total Investments — 106.1%
(Cost $636,497) | | | 847,094 | |
| | | | Liabilities in Excess of
Other Assets — (6.1)% | | | (48,654 | ) |
| | | | | | | | |
| | | | NET ASSETS — 100.0% | | $ | 798,440 | |
| | | | | | | | |
Percentages indicated are based on net assets.
SEE NOTES TO FINANCIAL STATEMENTS.
| | | | | | | | |
| | | |
| DECEMBER 31, 2010 | | J.P. MORGAN MID CAP/MULTI-CAP FUNDS | | | | | 27 | |
JPMorgan Mid Cap Core Fund
SCHEDULE OF PORTFOLIO INVESTMENTS
AS OF DECEMBER 31, 2010 (Unaudited)
(Amounts in thousands)
| | | | | | | | |
| SHARES | | | SECURITY DESCRIPTION | | VALUE($) | |
| | | | | | | | |
| Common Stocks — 96.4% | | | | |
| | | | Consumer Discretionary — 18.0% | | | | |
| | | | Automobiles — 1.3% | | | | |
| | 1 | | | Harley-Davidson, Inc. | | | 42 | |
| | | | | | | | |
| | | | Distributors — 1.2% | | | | |
| | 1 | | | Genuine Parts Co. | | | 40 | |
| | | | | | | | |
| | | | Hotels, Restaurants & Leisure — 3.1% | | | | |
| | 2 | | | Brinker International, Inc. | | | 49 | |
| | 1 | | | Penn National Gaming, Inc. (a) | | | 51 | |
| | | | | | | | |
| | | | | | | 100 | |
| | | | | | | | |
| | | | Household Durables — 5.3% | | | | |
| | 3 | | | Jarden Corp. | | | 89 | |
| | 2 | | | Newell Rubbermaid, Inc. | | | 40 | |
| | 2 | | | Toll Brothers, Inc. (a) | | | 39 | |
| | | | | | | | |
| | | | | | | 168 | |
| | | | | | | | |
| | | | Media — 1.2% | | | | |
| | 1 | | | Morningstar, Inc. | | | 40 | |
| | | | | | | | |
| | | | Multiline Retail — 1.6% | | | | |
| | 1 | | | Nordstrom, Inc. | | | 53 | |
| | | | | | | | |
| | | | Specialty Retail — 4.3% | | | | |
| | 3 | | | Chico’s FAS, Inc. | | | 39 | |
| | 1 | | | Dick’s Sporting Goods, Inc. (a) | | | 49 | |
| | 1 | | | Williams-Sonoma, Inc. | | | 49 | |
| | | | | | | | |
| | | | | | | 137 | |
| | | | | | | | |
| | | | Total Consumer Discretionary | | | 580 | |
| | | | | | | | |
| | | | Consumer Staples — 3.7% | | | | |
| | | | Beverages — 1.6% | | | | |
| | 1 | | | Hansen Natural Corp. (a) | | | 52 | |
| | | | | | | | |
| | | | Food & Staples Retailing — 2.1% | | | | |
| | 2 | | | Walgreen Co. | | | 68 | |
| | | | | | | | |
| | | | Total Consumer Staples | | | 120 | |
| | | | | | | | |
| | | | Energy — 10.4% | | | | |
| | | | Energy Equipment & Services — 4.3% | | | | |
| | 2 | | | Exterran Holdings, Inc. (a) | | | 44 | |
| | 2 | | �� | Patterson-UTI Energy, Inc. | | | 45 | |
| | 1 | | | Tidewater, Inc. | | | 51 | |
| | | | | | | | |
| | | | | | | 140 | |
| | | | | | | | |
| | | | Oil, Gas & Consumable Fuels — 6.1% | | | | |
| | 1 | | | Cimarex Energy Co. | | | 54 | |
| | 1 | | | Concho Resources, Inc. (a) | | | 53 | |
| | 1 | | | Devon Energy Corp. | | | 89 | |
| | | | | | | | |
| | | | | | | 196 | |
| | | | | | | | |
| | | | Total Energy | | | 336 | |
| | | | | | | | |
| | | | | | | | |
| SHARES | | | SECURITY DESCRIPTION | | VALUE($) | |
| | | | | | | | |
| | | | | | | | |
| | | | Financials — 19.5% | | | | |
| | | | Capital Markets — 6.5% | | | | |
| | 5 | | | Calamos Asset Management, Inc., Class A | | | 64 | |
| | 2 | | | Eaton Vance Corp. | | | 48 | |
| | — | (h) | | Greenhill & Co., Inc. | | | 40 | |
| | 3 | | | TD AMERITRADE Holding Corp. | | | 56 | |
| | | | | | | | |
| | | | | | | 208 | |
| | | | | | | | |
| | | | Commercial Banks — 4.8% | | | | |
| | 2 | | | Associated Banc-Corp. | | | 35 | |
| | 1 | | | Iberiabank Corp. | | | 70 | |
| | 4 | | | Umpqua Holdings Corp. | | | 51 | |
| | | | | | | | |
| | | | | | | 156 | |
| | | | | | | | |
| | | | Insurance — 4.0% | | | | |
| | 1 | | | Chubb Corp. | | | 64 | |
| | 1 | | | ProAssurance Corp. (a) | | | 64 | |
| | | | | | | | |
| | | | | | | 128 | |
| | | | | | | | |
| | | | Real Estate Investment Trusts (REITs) — 2.6% | | | | |
| | 1 | | | Mid-America Apartment Communities, Inc. | | | 47 | |
| | 1 | | | National Retail Properties, Inc. | | | 38 | |
| | | | | | | | |
| | | | | | | 85 | |
| | | | | | | | |
| | | | Thrifts & Mortgage Finance — 1.6% | | | | |
| | 4 | | | First Niagara Financial Group, Inc. | | | 51 | |
| | | | | | | | |
| | | | Total Financials | | | 628 | |
| | | | | | | | |
| | | | Health Care — 10.1% | | | | |
| | | | Health Care Equipment & Supplies — 1.5% | | | | |
| | 1 | | | IDEXX Laboratories, Inc. (a) | | | 47 | |
| | | | | | | | |
| | | | Health Care Providers & Services — 8.6% | | | | |
| | 2 | | | Coventry Health Care, Inc. (a) | | | 58 | |
| | 1 | | | Laboratory Corp. of America Holdings (a) | | | 47 | |
| | — | (h) | | McKesson Corp. | | | 32 | |
| | 1 | | | Patterson Cos., Inc. | | | 39 | |
| | 2 | | | UnitedHealth Group, Inc. | | | 56 | |
| | 2 | | | VCA Antech, Inc. (a) | | | 47 | |
| | | | | | | | |
| | | | | | | 279 | |
| | | | | | | | |
| | | | Total Health Care | | | 326 | |
| | | | | | | | |
| | | | Industrials — 13.0% | | | | |
| | | | Aerospace & Defense — 2.7% | | | | |
| | — | (h) | | Goodrich Corp. | | | 41 | |
| | 1 | | | TransDigm Group, Inc. (a) | | | 46 | |
| | | | | | | | |
| | | | | | | 87 | |
| | | | | | | | |
| | | | Commercial Services & Supplies — 2.7% | | | | |
| | 3 | | | KAR Auction Services, Inc. (a) | | | 44 | |
| | 2 | | | Waste Connections, Inc. | | | 43 | |
| | | | | | | | |
| | | | | | | 87 | |
| | | | | | | | |
SEE NOTES TO FINANCIAL STATEMENTS.
| | | | | | |
| | | |
| 28 | | | | J.P. MORGAN MID CAP/MULTI-CAP FUNDS | | DECEMBER 31, 2010 |
| | | | | | | | |
| SHARES | | | SECURITY DESCRIPTION | | VALUE($) | |
| | | | | | | | |
| Common Stocks — Continued | | | | |
| | | | Electrical Equipment — 1.2% | | | | |
| | 1 | | | Regal-Beloit Corp. | | | 40 | |
| | | | | | | | |
| | | | Machinery — 6.4% | | | | |
| | 1 | | | Dover Corp. | | | 56 | |
| | 1 | | | Eaton Corp. | | | 52 | |
| | 1 | | | Joy Global, Inc. | | | 59 | |
| | 1 | | | Toro Co. (The) | | | 40 | |
| | | | | | | | |
| | | | | | | 207 | |
| | | | | | | | |
| | | | Total Industrials | | | 421 | |
| | | | | | | | |
| | | | Information Technology — 6.9% | | | | |
| | | | Computers & Peripherals — 1.5% | |
| | 1 | | | NetApp, Inc. (a) | | | 48 | |
| | | | | | | | |
| | | | Electronic Equipment, Instruments & Components — 1.5% | |
| | 1 | | | Anixter International, Inc. | | | 50 | |
| | | | | | | | |
| | | | Semiconductors & Semiconductor Equipment — 2.5% | |
| | 1 | | | Linear Technology Corp. | | | 45 | |
| | 2 | | | Marvell Technology Group Ltd., (Bermuda) (a) | | | 36 | |
| | | | | | | | |
| | | | | | | 81 | |
| | | | | | | | |
| | | | Software — 1.4% | |
| | 1 | | | MICROS Systems, Inc. (a) | | | 45 | |
| | | | | | | | |
| | | | Total Information Technology | | | 224 | |
| | | | | | | | |
| | | | Materials — 8.4% | |
| | | | Chemicals — 2.5% | |
| | — | (h) | | Lubrizol Corp. | | | 35 | |
| | 1 | | | Scotts Miracle-Gro Co. (The), Class A | | | 45 | |
| | | | | | | | |
| | | | | | | 80 | |
| | | | | | | | |
| | | | Containers & Packaging — 4.3% | |
| | 2 | | | Crown Holdings, Inc. (a) | | | 56 | |
| | 2 | | | Silgan Holdings, Inc. | | | 84 | |
| | | | | | | | |
| | | | | | | 140 | |
| | | | | | | | |
| | | | | | | | |
| SHARES | | | SECURITY DESCRIPTION | | VALUE($) | |
| | | | | | | | |
| | | | | | | | |
| | | | Metals & Mining — 1.6% | |
| | 1 | | | Reliance Steel & Aluminum Co. | | | 52 | |
| | | | | | | | |
| | | | Total Materials | | | 272 | |
| | | | | | | | |
| | | | Utilities — 6.4% | |
| | | | Electric Utilities — 1.3% | |
| | 1 | | | Southern Co. | | | 42 | |
| | | | | | | | |
| | | | Gas Utilities — 1.2% | |
| | 1 | | | Northwest Natural Gas Co. | | | 39 | |
| | | | | | | | |
| | | | Multi-Utilities — 3.9% | |
| | 2 | | | CMS Energy Corp. | | | 40 | |
| | 1 | | | NorthWestern Corp. | | | 40 | |
| | 1 | | | Wisconsin Energy Corp. | | | 44 | |
| | | | | | | | |
| | | | | | | 124 | |
| | | | | | | | |
| | | | Total Utilities | | | 205 | |
| | | | | | | | |
| | | | Total Common Stocks
(Cost $2,943) | | | 3,112 | |
| | | | | | | | |
| Short-Term Investment — 0.8% | |
| | | | Investment Company — 0.8% | |
| | 27 | | | JPMorgan Prime Money Market Fund, Institutional Class Shares, 0.100% (b) (l) (m)
(Cost $27) | | | 27 | |
| | | | | | | | |
| | | | Total Investments — 97.2%
(Cost $2,970) | | | 3,139 | |
| | | | Other Assets in Excess of
Liabilities — 2.8% | | | 89 | |
| | | | | | | | |
| | | | NET ASSETS — 100.0% | | $ | 3,228 | |
| | | | | | | | |
Percentages indicated are based on net assets.
SEE NOTES TO FINANCIAL STATEMENTS.
| | | | | | | | |
| | | |
| DECEMBER 31, 2010 | | J.P. MORGAN MID CAP/MULTI-CAP FUNDS | | | | | 29 | |
JPMorgan Mid Cap Equity Fund
SCHEDULE OF PORTFOLIO INVESTMENTS
AS OF DECEMBER 31, 2010 (Unaudited)
(Amounts in thousands)
| | | | | | | | |
| SHARES | | | SECURITY DESCRIPTION | | VALUE($) | |
| | | | | | | | |
| Common Stocks — 95.4% | |
| | | | Consumer Discretionary — 17.8% | |
| | | | Auto Components — 0.6% | |
| | 93 | | | Gentex Corp. (c) | | | 2,761 | |
| | | | | | | | |
| | | | Automobiles — 0.8% | |
| | 99 | | | Harley-Davidson, Inc. (c) | | | 3,415 | |
| | | | | | | | |
| | | | Distributors — 0.5% | |
| | 41 | | | Genuine Parts Co. | | | 2,094 | |
| | | | | | | | |
| | | | Diversified Consumer Services — 0.8% | |
| | 84 | | | Education Management Corp. (a) | | | 1,525 | |
| | 51 | | | Sotheby’s (c) | | | 2,291 | |
| | | | | | | | |
| | | | | | | 3,816 | |
| | | | | | | | |
| | | | Hotels, Restaurants & Leisure — 2.9% | |
| | 48 | | | Cheesecake Factory, Inc. (The) (a) (c) | | | 1,463 | |
| | 34 | | | Darden Restaurants, Inc. | | | 1,582 | |
| | 63 | | | International Game Technology | | | 1,119 | |
| | 44 | | | Marriott International, Inc., Class A | | | 1,811 | |
| | 121 | | | MGM Resorts International (a) | | | 1,792 | |
| | 12 | | | Panera Bread Co., Class A (a) | | | 1,245 | |
| | 42 | | | Starwood Hotels & Resorts Worldwide, Inc. (c) | | | 2,528 | |
| | 33 | | | Yum! Brands, Inc. | | | 1,624 | |
| | | | | | | | |
| | | | | | | 13,164 | |
| | | | | | | | |
| | | | Household Durables — 1.5% | |
| | 49 | | | Fortune Brands, Inc. | | | 2,922 | |
| | 53 | | | Harman International Industries, Inc. (a) | | | 2,459 | |
| | 43 | | | Jarden Corp. | | | 1,324 | |
| | | | | | | | |
| | | | | | | 6,705 | |
| | | | | | | | |
| | | | Internet & Catalog Retail — 1.1% | |
| | 69 | | | Expedia, Inc. | | | 1,739 | |
| | 7 | | | NetFlix, Inc. (a) | | | 1,247 | |
| | 5 | | | priceline.com, Inc. (a) | | | 2,038 | |
| | | | | | | | |
| | | | | | | 5,024 | |
| | | | | | | | |
| | | | Media — 3.5% | |
| | 30 | | | Cablevision Systems Corp., Class A | | | 1,025 | |
| | 94 | | | CBS Corp., Class B | | | 1,785 | |
| | 78 | | | Clear Channel Outdoor Holdings, Inc., Class A (a) | | | 1,090 | |
| | 104 | | | DISH Network Corp., Class A (a) | | | 2,053 | |
| | 120 | | | Gannett Co., Inc. | | | 1,805 | |
| | 96 | | | Lamar Advertising Co., Class A (a) (c) | | | 3,805 | |
| | 26 | | | Omnicom Group, Inc. | | | 1,168 | |
| | 49 | | | Scripps Networks Interactive, Inc., Class A | | | 2,556 | |
| | 2 | | | Washington Post Co. (The), Class B | | | 815 | |
| | | | | | | | |
| | | | | | | 16,102 | |
| | | | | | | | |
| | | | Multiline Retail — 0.5% | |
| | 88 | | | Macy’s, Inc. | | | 2,224 | |
| | | | | | | | |
| | | | | | | | |
| SHARES | | | SECURITY DESCRIPTION | | VALUE($) | |
| | | | | | | | |
| | | | | | | | |
| | | | Specialty Retail — 4.1% | |
| | 7 | | | AutoZone, Inc. (a) | | | 1,799 | |
| | 53 | | | Bed Bath & Beyond, Inc. (a) | | | 2,590 | |
| | 67 | | | Dick’s Sporting Goods, Inc. (a) (c) | | | 2,501 | |
| | 200 | | | Gap, Inc. (The) | | | 4,426 | |
| | 113 | | | OfficeMax, Inc. (a) | | | 1,995 | |
| | 50 | | | Staples, Inc. | | | 1,132 | |
| | 32 | | | Tiffany & Co. | | | 2,018 | |
| | 53 | | | TJX Cos., Inc. | | | 2,348 | |
| | | | | | | | |
| | | | | | | 18,809 | |
| | | | | | | | |
| | | | Textiles, Apparel & Luxury Goods — 1.5% | |
| | 57 | | | Coach, Inc. | | | 3,136 | |
| | 28 | | | Phillips-Van Heusen Corp. | | | 1,764 | |
| | 16 | | | Polo Ralph Lauren Corp. | | | 1,753 | |
| | | | | | | | |
| | | | | | | 6,653 | |
| | | | | | | | |
| | | | Total Consumer Discretionary | | | 80,767 | |
| | | | | | | | |
| | | | Consumer Staples — 3.0% | |
| | | | Beverages — 0.5% | |
| | 26 | | | Brown-Forman Corp., Class B | | | 1,809 | |
| | 18 | | | Dr. Pepper Snapple Group, Inc. | | | 640 | |
| | | | | | | | |
| | | | | | | 2,449 | |
| | | | | | | | |
| | | | Food & Staples Retailing — 0.6% | |
| | 123 | | | Safeway, Inc. | | | 2,755 | |
| | | | | | | | |
| | | | Food Products — 1.4% | |
| | 36 | | | Green Mountain Coffee Roasters, Inc. (a) | | | 1,176 | |
| | 50 | | | JM Smucker Co. (The) | | | 3,250 | |
| | 29 | | | Ralcorp Holdings, Inc. (a) | | | 1,905 | |
| | | | | | | | |
| | | | | | | 6,331 | |
| | | | | | | | |
| | | | Household Products — 0.3% | |
| | 19 | | | Energizer Holdings, Inc. (a) | | | 1,356 | |
| | | | | | | | |
| | | | Tobacco — 0.2% | |
| | 8 | | | Lorillard, Inc. | | | 681 | |
| | | | | | | | |
| | | | Total Consumer Staples | | | 13,572 | |
| | | | | | | | |
| | | | Energy — 7.3% | |
| | | | Energy Equipment & Services — 1.1% | |
| | 58 | | | Cameron International Corp. (a) | | | 2,934 | |
| | 19 | | | CARBO Ceramics, Inc. (c) | | | 1,926 | |
| | | | | | | | |
| | | | | | | 4,860 | |
| | | | | | | | |
| | | | Oil, Gas & Consumable Fuels — 6.2% | |
| | 48 | | | Concho Resources, Inc. (a) | | | 4,173 | |
| | 102 | | | CVR Energy, Inc. (a) | | | 1,550 | |
| | 45 | | | Devon Energy Corp. | | | 3,517 | |
| | 144 | | | El Paso Corp. | | | 1,986 | |
SEE NOTES TO FINANCIAL STATEMENTS.
| | | | | | |
| | | |
| 30 | | | | J.P. MORGAN MID CAP/MULTI-CAP FUNDS | | DECEMBER 31, 2010 |
| | | | | | | | |
| SHARES | | | SECURITY DESCRIPTION | | VALUE($) | |
| | | | | | | | |
| Common Stocks — Continued | | | | |
| | | | Oil, Gas & Consumable Fuels — Continued | |
| | 59 | | | EQT Corp. | | | 2,663 | |
| | 64 | | | Forest Oil Corp. (a) | | | 2,429 | |
| | 22 | | | Kinder Morgan Management LLC (a) | | | 1,479 | |
| | 66 | | | Newfield Exploration Co. (a) | | | 4,781 | |
| | 62 | | | Teekay Corp., (Canada) | | | 2,044 | |
| | 145 | | | Williams Cos., Inc. (The) | | | 3,577 | |
| | | | | | | | |
| | | | | | | 28,199 | |
| | | | | | | | |
| | | | Total Energy | | | 33,059 | |
| | | | | | | | |
| | | | Financials — 16.6% | |
| | | | Capital Markets — 4.2% | |
| | 40 | | | Ameriprise Financial, Inc. | | | 2,319 | |
| | 115 | | | Invesco Ltd. | | | 2,760 | |
| | 58 | | | Lazard Ltd., (Bermuda), Class A | | | 2,283 | |
| | 31 | | | LPL Investment Holdings, Inc. (a) | | | 1,124 | |
| | 28 | | | Northern Trust Corp. | | | 1,563 | |
| | 91 | | | Och-Ziff Capital Management Group LLC, Class A (c) | | | 1,413 | |
| | 86 | | | T. Rowe Price Group, Inc. | | | 5,579 | |
| | 102 | | | TD AMERITRADE Holding Corp. | | | 1,930 | |
| | | | | | | | |
| | | | | | | 18,971 | |
| | | | | | | | |
| | | | Commercial Banks — 3.7% | |
| | 68 | | | BancorpSouth, Inc. | | | 1,080 | |
| | 36 | | | BB&T Corp. | | | 954 | |
| | 38 | | | BOK Financial Corp. (c) | | | 2,008 | |
| | 21 | | | City National Corp. | | | 1,307 | |
| | 47 | | | Comerica, Inc. | | | 1,985 | |
| | 21 | | | Cullen/Frost Bankers, Inc. | | | 1,277 | |
| | 122 | | | Fifth Third Bancorp | | | 1,784 | |
| | 29 | | | M&T Bank Corp. | | | 2,533 | |
| | 68 | | | SunTrust Banks, Inc. | | | 2,001 | |
| | 37 | | | TCF Financial Corp. | | | 549 | |
| | 52 | | | Zions Bancorp | | | 1,258 | |
| | | | | | | | |
| | | | | | | 16,736 | |
| | | | | | | | |
| | | | Diversified Financial Services — 0.4% | |
| | 49 | | | MSCI, Inc., Class A (a) | | | 1,897 | |
| | | | | | | | |
| | | | Insurance — 5.9% | |
| | 81 | | | AON Corp. | | | 3,739 | |
| | 9 | | | Arch Capital Group Ltd., (Bermuda) (a) | | | 784 | |
| | 84 | | | Cincinnati Financial Corp. | | | 2,673 | |
| | 47 | | | HCC Insurance Holdings, Inc. | | | 1,354 | |
| | 108 | | | Loews Corp. | | | 4,214 | |
| | 213 | | | Old Republic International Corp. | | | 2,909 | |
| | 82 | | | OneBeacon Insurance Group Ltd., Class A | | | 1,242 | |
| | 54 | | | Principal Financial Group, Inc. | | | 1,752 | |
| | | | | | | | |
| SHARES | | | SECURITY DESCRIPTION | | VALUE($) | |
| | | | | | | | |
| | | | | | | | |
| | | | Insurance — Continued | |
| | 22 | | | Symetra Financial Corp. | | | 295 | |
| | 58 | | | Transatlantic Holdings, Inc. | | | 2,999 | |
| | 100 | | | W.R. Berkley Corp. | | | 2,724 | |
| | 85 | | | XL Group plc, (Ireland) | | | 1,857 | |
| | | | | | | | |
| | | | | | | 26,542 | |
| | | | | | | | |
| | | | Real Estate Investment Trusts (REITs) — 1.6% | |
| | 33 | | | HCP, Inc. | | | 1,207 | |
| | 56 | | | Kimco Realty Corp. | | | 1,010 | |
| | 8 | | | Public Storage | | | 842 | |
| | 50 | | | Regency Centers Corp. | | | 2,116 | |
| | 26 | | | Vornado Realty Trust | | | 2,146 | |
| | | | | | | | |
| | | | | | | 7,321 | |
| | | | | | | | |
| | | | Real Estate Management & Development — 0.4% | |
| | 110 | | | Brookfield Properties Corp. | | | 1,933 | |
| | | | | | | | |
| | | | Thrifts & Mortgage Finance — 0.4% | |
| | 8 | | | Capitol Federal Financial, Inc. | | | 90 | |
| | 131 | | | People’s United Financial, Inc. | | | 1,835 | |
| | | | | | | | |
| | | | | | | 1,925 | |
| | | | | | | | |
| | | | Total Financials | | | 75,325 | |
| | | | | | | | |
| | | | Health Care — 9.5% | |
| | | | Biotechnology — 0.5% | |
| | 26 | | | Alexion Pharmaceuticals, Inc. (a) (c) | | | 2,086 | |
| | | | | | | | |
| | | | Health Care Equipment & Supplies — 1.7% | |
| | 43 | | | Becton, Dickinson & Co. | | | 3,634 | |
| | 48 | | | Sirona Dental Systems, Inc. (a) | | | 1,997 | |
| | 78 | | | Thoratec Corp. (a) | | | 2,195 | |
| | | | | | | | |
| | | | | | | 7,826 | |
| | | | | | | | |
| | | | Health Care Providers & Services — 4.8% | |
| | 32 | | | AmerisourceBergen Corp. | | | 1,102 | |
| | 102 | | | Brookdale Senior Living, Inc. (a) | | | 2,177 | |
| | 36 | | | Community Health Systems, Inc. (a) | | | 1,338 | |
| | 160 | | | Coventry Health Care, Inc. (a) | | | 4,220 | |
| | 39 | | | DaVita, Inc. (a) | | | 2,738 | |
| | 60 | | | Humana, Inc. (a) | | | 3,282 | |
| | 223 | | | Lincare Holdings, Inc. | | | 5,994 | |
| | 39 | | | VCA Antech, Inc. (a) | | | 909 | |
| | | | | | | | |
| | | | | | | 21,760 | |
| | | | | | | | |
| | | | Health Care Technology — 0.4% | |
| | 17 | | | Cerner Corp. (a) (c) | | | 1,594 | |
| | | | | | | | |
| | | | Life Sciences Tools & Services — 1.2% | |
| | 97 | | | Agilent Technologies, Inc. (a) | | | 4,019 | |
| | 26 | | | Illumina, Inc. (a) (c) | | | 1,626 | |
| | | | | | | | |
| | | | | | | 5,645 | |
| | | | | | | | |
SEE NOTES TO FINANCIAL STATEMENTS.
| | | | | | | | |
| | | |
| DECEMBER 31, 2010 | | J.P. MORGAN MID CAP/MULTI-CAP FUNDS | | | | | 31 | |
JPMorgan Mid Cap Equity Fund
SCHEDULE OF PORTFOLIO INVESTMENTS
AS OF DECEMBER 31, 2010 (Unaudited) (continued)
(Amounts in thousands)
| | | | | | | | |
| SHARES | | | SECURITY DESCRIPTION | | VALUE($) | |
| | | | | | | | |
| Common Stocks — Continued | | | | |
| | | | Pharmaceuticals — 0.9% | |
| | 152 | | | Valeant Pharmaceuticals International, Inc.,
(Canada) (c) | | | 4,286 | |
| | | | | | | | |
| | | | Total Health Care | | | 43,197 | |
| | | | | | | | |
| | | | Industrials — 13.8% | | | | |
| | | | Aerospace & Defense — 1.9% | |
| | 23 | | | Alliant Techsystems, Inc. (a) | | | 1,682 | |
| | 34 | | | Goodrich Corp. | | | 2,950 | |
| | 26 | | | L-3 Communications Holdings, Inc. | | | 1,805 | |
| | 15 | | | Precision Castparts Corp. | | | 2,084 | |
| | | | | | | | |
| | | | | | | 8,521 | |
| | | | | | | | |
| | | | Airlines — 0.6% | |
| | 210 | | | Delta Air Lines, Inc. (a) | | | 2,650 | |
| | | | | | | | |
| | | | Building Products — 0.4% | |
| | 38 | | | Lennox International, Inc. | | | 1,792 | |
| | | | | | | | |
| | | | Commercial Services & Supplies — 1.4% | |
| | 135 | | | Republic Services, Inc. | | | 4,025 | |
| | 31 | | | Stericycle, Inc. (a) (c) | | | 2,473 | |
| | | | | | | | |
| | | | | | | 6,498 | |
| | | | | | | | |
| | | | Electrical Equipment — 3.0% | | | | |
| | 41 | | | AMETEK, Inc. | | | 1,602 | |
| | 31 | | | Cooper Industries plc | | | 1,795 | |
| | 40 | | | Hubbell, Inc., Class B | | | 2,429 | |
| | 11 | | | Regal-Beloit Corp. | | | 721 | |
| | 40 | | | Rockwell Automation, Inc. | | | 2,876 | |
| | 53 | | | Roper Industries, Inc. (c) | | | 4,030 | |
| | | | | | | | |
| | | | | | | 13,453 | |
| | | | | | | | |
| | | | Industrial Conglomerates — 1.0% | | | | |
| | 114 | | | Carlisle Cos., Inc. | | | 4,546 | |
| | | | | | | | |
| | | | Machinery — 3.1% | | | | |
| | 29 | | | AGCO Corp. (a) | | | 1,484 | |
| | 51 | | | Cummins, Inc. | | | 5,635 | |
| | 46 | | | Snap-On, Inc. | | | 2,575 | |
| | 26 | | | WABCO Holdings, Inc. (a) | | | 1,571 | |
| | 49 | | | Wabtec Corp. | | | 2,611 | |
| | | | | | | | |
| | | | | | | 13,876 | |
| | | | | | | | |
| | | | Professional Services — 0.8% | | | | |
| | 21 | | | IHS, Inc., Class A (a) | | | 1,664 | |
| | 66 | | | Robert Half International, Inc. (c) | | | 2,019 | |
| | | | | | | | |
| | | | | | | 3,683 | |
| | | | | | | | |
| | | | Road & Rail — 0.8% | | | | |
| | 141 | | | Avis Budget Group, Inc. (a) (c) | | | 2,194 | |
| | 34 | | | J.B. Hunt Transport Services, Inc. | | | 1,404 | |
| | | | | | | | |
| | | | | | | 3,598 | |
| | | | | | | | |
| | | | | | | | |
| SHARES | | | SECURITY DESCRIPTION | | VALUE($) | |
| | | | | | | | |
| | | | | | | | |
| | | | Trading Companies & Distributors — 0.8% | | | | |
| | 27 | | | W.W. Grainger, Inc. (c) | | | 3,784 | |
| | | | | | | | |
| | | | Total Industrials | | | 62,401 | |
| | | | | | | | |
| | | | Information Technology — 15.7% | | | | |
| | | | Communications Equipment — 1.6% | | | | |
| | 24 | | | F5 Networks, Inc. (a) | | | 3,072 | |
| | 70 | | | Juniper Networks, Inc. (a) | | | 2,584 | |
| | 46 | | | Riverbed Technology, Inc. (a) | | | 1,600 | |
| | | | | | | | |
| | | | | | | 7,256 | |
| | | | | | | | |
| | | | Computers & Peripherals — 1.0% | | | | |
| | 81 | | | NetApp, Inc. (a) (c) | | | 4,430 | |
| | | | | | | | |
| | | | Electronic Equipment, Instruments & Components — 3.2% | |
| | 101 | | | Amphenol Corp., Class A | | | 5,306 | |
| | 53 | | | Arrow Electronics, Inc. (a) | | | 1,815 | |
| | 210 | | | Tyco Electronics Ltd., (Switzerland) | | | 7,438 | |
| | | | | | | | |
| | | | | | | 14,559 | |
| | | | | | | | |
| | | | Internet Software & Services — 0.3% | | | | |
| | 16 | | | Equinix, Inc. (a) | | | 1,292 | |
| | | | | | | | |
| | | | IT Services — 3.3% | | | | |
| | 26 | | | Alliance Data Systems Corp. (a) (c) | | | 1,825 | |
| | 49 | | | Amdocs Ltd., (United Kingdom) (a) | | | 1,353 | |
| | 95 | | | CGI Group, Inc., (Canada), Class A (a) | | | 1,645 | |
| | 37 | | | Cognizant Technology Solutions Corp., Class A (a) | | | 2,719 | |
| | 40 | | | FleetCor Technologies, Inc. (a) | | | 1,246 | |
| | 76 | | | Jack Henry & Associates, Inc. | | | 2,213 | |
| | 9 | | | MasterCard, Inc., Class A | | | 1,916 | |
| | 101 | | | Western Union Co. (The) | | | 1,870 | |
| | | | | | | | |
| | | | | | | 14,787 | |
| | | | | | | | |
| | | | Office Electronics — 0.4% | | | | |
| | 49 | | | Zebra Technologies Corp., Class A (a) | | | 1,858 | |
| | | | | | | | |
| | | | Semiconductors & Semiconductor Equipment — 2.6% | |
| | 55 | | | Broadcom Corp., Class A | | | 2,387 | |
| | 29 | | | Cree, Inc. (a) | | | 1,898 | |
| | 166 | | | Marvell Technology Group Ltd., (Bermuda) (a) | | | 3,073 | |
| | 65 | | | Microchip Technology, Inc. (c) | | | 2,237 | |
| | 63 | | | Varian Semiconductor Equipment Associates, Inc. (a) | | | 2,337 | |
| | | | | | | | |
| | | | | | | 11,932 | |
| | | | | | | | |
| | | | Software — 3.3% | | | | |
| | 44 | | | Autodesk, Inc. (a) | | | 1,685 | |
| | 24 | | | Citrix Systems, Inc. (a) | | | 1,608 | |
| | 28 | | | Concur Technologies, Inc. (a) | | | 1,475 | |
| | 74 | | | MICROS Systems, Inc. (a) | | | 3,250 | |
SEE NOTES TO FINANCIAL STATEMENTS.
| | | | | | |
| | | |
| 32 | | | | J.P. MORGAN MID CAP/MULTI-CAP FUNDS | | DECEMBER 31, 2010 |
| | | | | | | | |
| SHARES | | | SECURITY DESCRIPTION | | VALUE($) | |
| | | | | | | | |
| Common Stocks — Continued | | | | |
| | | | Software — Continued | | | | |
| | 48 | | | Red Hat, Inc. (a) | | | 2,191 | |
| | 20 | | | Salesforce.com, Inc. (a) | | | 2,613 | |
| | 82 | | | Synopsys, Inc. (a) | | | 2,201 | |
| | | | | | | | |
| | | | | | | 15,023 | |
| | | | | | | | |
| | | | Total Information Technology | | | 71,137 | |
| | | | | | | | |
| | | | Materials — 4.9% | | | | |
| | | | Chemicals — 3.0% | | | | |
| | 49 | | | Albemarle Corp. | | | 2,713 | |
| | 32 | | | PPG Industries, Inc. | | | 2,715 | |
| | 71 | | | Sherwin-Williams Co. (The) | | | 5,963 | |
| | 35 | | | Sigma-Aldrich Corp. | | | 2,330 | |
| | | | | | | | |
| | | | | | | 13,721 | |
| | | | | | | | |
| | | | Containers & Packaging — 1.9% | | | | |
| | 49 | | | Ball Corp. | | | 3,314 | |
| | 62 | | | Bemis Co., Inc. | | | 2,015 | |
| | 36 | | | Greif, Inc., Class A | | | 2,241 | |
| | 21 | | | Rock-Tenn Co., Class A | | | 1,106 | |
| | | | | | | | |
| | | | | | | 8,676 | |
| | | | | | | | |
| | | | Total Materials | | | 22,397 | |
| | | | | | | | |
| | | | Telecommunication Services — 1.6% | | | | |
| | | | Diversified Telecommunication Services — 1.2% | |
| | 51 | | | CenturyLink, Inc. | | | 2,350 | |
| | 117 | | | tw telecom, inc. (a) (c) | | | 1,999 | |
| | 66 | | | Windstream Corp. | | | 922 | |
| | | | | | | | |
| | | | | | | 5,271 | |
| | | | | | | | |
| | | | Wireless Telecommunication Services — 0.4% | | | | |
| | 65 | | | Telephone & Data Systems, Inc. | | | 2,046 | |
| | | | | | | | |
| | | | Total Telecommunication Services | | | 7,317 | |
| | | | | | | | |
| | | | Utilities — 5.2% | | | | |
| | | | Electric Utilities — 0.8% | | | | |
| | 24 | | | Northeast Utilities | | | 759 | |
| | 105 | | | Westar Energy, Inc. | | | 2,637 | |
| | | | | | | | |
| | | | | | | 3,396 | |
| | | | | | | | |
| | | | | | | | |
| SHARES | | | SECURITY DESCRIPTION | | VALUE($) | |
| | | | | | | | |
| | | | | |
| | | | Gas Utilities — 1.4% | | | | |
| | 75 | | | Energen Corp. | | | 3,634 | |
| | 50 | | | Oneok, Inc. | | | 2,762 | |
| | | | | | | | |
| | | | | | | 6,396 | |
| | | | | | | | |
| | | | Multi-Utilities — 2.8% | | | | |
| | 191 | | | CMS Energy Corp. | | | 3,551 | |
| | 51 | | | NSTAR | | | 2,143 | |
| | 22 | | | Sempra Energy | | | 1,134 | |
| | 45 | | | Wisconsin Energy Corp. | | | 2,660 | |
| | 131 | | | Xcel Energy, Inc. | | | 3,073 | |
| | | | | | | | |
| | | | | | | 12,561 | |
| | | | | | | | |
| | | | Water Utilities — 0.2% | | | | |
| | 40 | | | American Water Works Co., Inc. | | | 1,011 | |
| | | | | | | | |
| | | | Total Utilities | | | 23,364 | |
| | | | | | | | |
| | | | Total Common Stocks
(Cost $314,313) | | | 432,536 | |
| | | | | | | | |
| Short-Term Investment — 3.9% | |
| | | | Investment Company — 3.9% | | | | |
| | 17,912 | | | JPMorgan Prime Money Market Fund, Institutional Class Shares, 0.100% (b) (l) (m)
(Cost $17,912) | | | 17,912 | |
| | | | | | | | |
| Investments of Cash Collateral for Securities on Loan — 7.0% | |
| | | | Investment Company —7.0% | | | | |
| | 31,684 | | | JPMorgan Prime Money Market Fund, Capital Shares, 0.130% (b) (l)
(Cost $31,684) | | | 31,684 | |
| | | | | | | | |
| | | | Total Investments — 106.3%
(Cost $363,909) | | | 482,132 | |
| | | | Liabilities in Excess of
Other Assets — (6.3)% | | | (28,629 | ) |
| | | | | | | | |
| | | | NET ASSETS — 100.0% | | $ | 453,503 | |
| | | | | | | | |
Percentages indicated are based on net assets.
SEE NOTES TO FINANCIAL STATEMENTS.
| | | | | | | | |
| | | |
| DECEMBER 31, 2010 | | J.P. MORGAN MID CAP/MULTI-CAP FUNDS | | | | | 33 | |
JPMorgan Mid Cap Growth Fund
SCHEDULE OF PORTFOLIO INVESTMENTS
AS OF DECEMBER 31, 2010 (Unaudited)
(Amounts in thousands)
| | | | | | | | |
| SHARES | | | SECURITY DESCRIPTION | | VALUE($) | |
| | | | | | | | |
| Common Stocks — 98.2% | |
| | | | Consumer Discretionary — 18.0% | | | | |
| | | | Auto Components — 1.3% | | | | |
| | 692 | | | Gentex Corp. | | | 20,469 | |
| | | | | | | | |
| | | | Automobiles — 1.6% | | | | |
| | 730 | | | Harley-Davidson, Inc. | | | 25,292 | |
| | | | | | | | |
| | | | Diversified Consumer Services — 1.7% | | | | |
| | 625 | | | Education Management Corp. (a) | | | 11,312 | |
| | 377 | | | Sotheby’s | | | 16,943 | |
| | | | | | | | |
| | | | | | | 28,255 | |
| | | | | | | | |
| | | | Hotels, Restaurants & Leisure — 3.7% | | | | |
| | 353 | | | Cheesecake Factory, Inc. (The) (a) | | | 10,811 | |
| | 474 | | | International Game Technology | | | 8,376 | |
| | 895 | | | MGM Resorts International (a) (c) | | | 13,294 | |
| | 91 | | | Panera Bread Co., Class A (a) | | | 9,240 | |
| | 308 | | | Starwood Hotels & Resorts Worldwide, Inc. | | | 18,726 | |
| | | | | | | | |
| | | | | | | 60,447 | |
| | | | | | | | |
| | | | Household Durables — 1.1% | | | | |
| | 399 | | | Harman International Industries, Inc. (a) | | | 18,455 | |
| | | | | | | | |
| | | | Internet & Catalog Retail — 1.5% | | | | |
| | 53 | | | NetFlix, Inc. (a) (c) | | | 9,314 | |
| | 38 | | | priceline.com, Inc. (a) | | | 15,103 | |
| | | | | | | | |
| | | | | | | 24,417 | |
| | | | | | | | |
| | | | Media — 2.9% | | | | |
| | 707 | | | Lamar Advertising Co., Class A (a) | | | 28,179 | |
| | 367 | | | Scripps Networks Interactive, Inc., Class A | | | 18,966 | |
| | | | | | | | |
| | | | | | | 47,145 | |
| | | | | | | | |
| | | | Specialty Retail — 2.0% | | | | |
| | 494 | | | Dick’s Sporting Goods, Inc. (a) | | | 18,521 | |
| | 835 | | | OfficeMax, Inc. (a) | | | 14,780 | |
| | | | | | | | |
| | | | | | | 33,301 | |
| | | | | | | | |
| | | | Textiles, Apparel & Luxury Goods — 2.2% | | | | |
| | 420 | | | Coach, Inc. | | | 23,219 | |
| | 117 | | | Polo Ralph Lauren Corp. | | | 12,989 | |
| | | | | | | | |
| | | | | | | 36,208 | |
| | | | | | | | |
| | | | Total Consumer Discretionary | | | 293,989 | |
| | | | | | | | |
| | | | Consumer Staples — 0.5% | | | | |
| | | | Food Products — 0.5% | | | | |
| | 266 | | | Green Mountain Coffee Roasters, Inc. (a) (c) | | | 8,741 | |
| | | | | | | | |
| | | | Energy — 6.2% | | | | |
| | | | Energy Equipment & Services — 2.2% | | | | |
| | 428 | | | Cameron International Corp. (a) | | | 21,700 | |
| | 138 | | | CARBO Ceramics, Inc. | | | 14,289 | |
| | | | | | | | |
| | | | | | | 35,989 | |
| | | | | | | | |
| | | | | | | | |
| SHARES | | | SECURITY DESCRIPTION | | VALUE($) | |
| | | | | | | | |
| | |
| | | | Oil, Gas & Consumable Fuels — 4.0% | | | | |
| | 352 | | | Concho Resources, Inc. (a) | | | 30,878 | |
| | 474 | | | Forest Oil Corp. (a) | | | 17,981 | |
| | 225 | | | Newfield Exploration Co. (a) | | | 16,210 | |
| | | | | | | | |
| | | | | | | 65,069 | |
| | | | | | | | |
| | | | Total Energy | | | 101,058 | |
| | | | | | | | |
| | | | Financials — 9.8% | | | | |
| | | | Capital Markets — 5.7% | | | | |
| | 850 | | | Invesco Ltd. | | | 20,439 | |
| | 433 | | | Lazard Ltd., (Bermuda), Class A | | | 17,111 | |
| | 141 | | | LPL Investment Holdings, Inc. (a) | | | 5,139 | |
| | 743 | | | Och-Ziff Capital Management Group LLC, Class A | | | 11,583 | |
| | 379 | | | T. Rowe Price Group, Inc. | | | 24,464 | |
| | 753 | | | TD AMERITRADE Holding Corp. | | | 14,304 | |
| | | | | | | | |
| | | | | | | 93,040 | |
| | | | | | | | |
| | | | Commercial Banks — 1.8% | | | | |
| | 282 | | | BOK Financial Corp. | | | 15,075 | |
| | 349 | | | Comerica, Inc. | | | 14,741 | |
| | | | | | | | |
| | | | | | | 29,816 | |
| | | | | | | | |
| | | | Diversified Financial Services — 0.8% | | | | |
| | 361 | | | MSCI, Inc., Class A (a) | | | 14,053 | |
| | | | | | | | |
| | | | Insurance — 1.5% | | | | |
| | 310 | | | AON Corp. | | | 14,245 | |
| | 347 | | | HCC Insurance Holdings, Inc. | | | 10,042 | |
| | | | | | | | |
| | | | | | | 24,287 | |
| | | | | | | | |
| | | | Total Financials | | | 161,196 | |
| | | | | | | | |
| | | | Health Care — 13.4% | | | | |
| | | | Biotechnology — 0.9% | | | | |
| | 192 | | | Alexion Pharmaceuticals, Inc. (a) | | | 15,466 | |
| | | | | | | | |
| | | | Health Care Equipment & Supplies — 1.9% | | | | |
| | 354 | | | Sirona Dental Systems, Inc. (a) | | | 14,798 | |
| | 575 | | | Thoratec Corp. (a) | | | 16,284 | |
| | | | | | | | |
| | | | | | | 31,082 | |
| | | | | | | | |
| | | | Health Care Providers & Services — 5.4% | | | | |
| | 754 | | | Brookdale Senior Living, Inc. (a) | | | 16,133 | |
| | 730 | | | Coventry Health Care, Inc. (a) | | | 19,272 | |
| | 291 | | | DaVita, Inc. (a) | | | 20,225 | |
| | 218 | | | Humana, Inc. (a) | | | 11,918 | |
| | 758 | | | Lincare Holdings, Inc. | | | 20,329 | |
| | | | | | | | |
| | | | | | | 87,877 | |
| | | | | | | | |
| | | | Health Care Technology — 0.7% | | | | |
| | 125 | | | Cerner Corp. (a) | | | 11,804 | |
| | | | | | | | |
SEE NOTES TO FINANCIAL STATEMENTS.
| | | | | | |
| | | |
| 34 | | | | J.P. MORGAN MID CAP/MULTI-CAP FUNDS | | DECEMBER 31, 2010 |
| | | | | | | | |
| SHARES | | | SECURITY DESCRIPTION | | VALUE($) | |
| | | | | | | | |
| Common Stocks — Continued | |
| | | | Life Sciences Tools & Services — 2.6% | | | | |
| | 719 | | | Agilent Technologies, Inc. (a) | | | 29,800 | |
| | 191 | | | Illumina, Inc. (a) | | | 12,073 | |
| | | | | | | | |
| | | | | | | 41,873 | |
| | | | | | | | |
| | | | Pharmaceuticals — 1.9% | | | | |
| | 1,121 | | | Valeant Pharmaceuticals International, Inc., (Canada) | | | 31,724 | |
| | | | | | | | |
| | | | Total Health Care | | | 219,826 | |
| | | | | | | | |
| | | | Industrials — 19.2% | | | | |
| | | | Aerospace & Defense — 2.3% | | | | |
| | 248 | | | Goodrich Corp. | | | 21,815 | |
| | 111 | | | Precision Castparts Corp. | | | 15,501 | |
| | | | | | | | |
| | | | | | | 37,316 | |
| | | | | | | | |
| | | | Airlines — 1.2% | | | | |
| | 1,557 | | | Delta Air Lines, Inc. (a) | | | 19,619 | |
| | | | | | | | |
| | | | Building Products — 0.8% | | | | |
| | 280 | | | Lennox International, Inc. | | | 13,237 | |
| | | | | | | | |
| | | | Commercial Services & Supplies — 1.1% | | | | |
| | 227 | | | Stericycle, Inc. (a) | | | 18,342 | |
| | | | | | | | |
| | | | Electrical Equipment — 3.3% | | | | |
| | 299 | | | Hubbell, Inc., Class B | | | 17,991 | |
| | 297 | | | Rockwell Automation, Inc. | | | 21,298 | |
| | 188 | | | Roper Industries, Inc. | | | 14,364 | |
| | | | | | | | |
| | | | | | | 53,653 | |
| | | | | | | | |
| | | | Industrial Conglomerates — 1.1% | | | | |
| | 471 | | | Carlisle Cos., Inc. | | | 18,726 | |
| | | | | | | | |
| | | | Machinery — 4.4% | | | | |
| | 220 | | | AGCO Corp. (a) | | | 11,140 | |
| | 379 | | | Cummins, Inc. | | | 41,732 | |
| | 366 | | | Wabtec Corp. | | | 19,338 | |
| | | | | | | | |
| | | | | | | 72,210 | |
| | | | | | | | |
| | | | Professional Services — 1.7% | | | | |
| | 154 | | | IHS, Inc., Class A (a) | | | 12,372 | |
| | 489 | | | Robert Half International, Inc. | | | 14,968 | |
| | | | | | | | |
| | | | | | | 27,340 | |
| | | | | | | | |
| | | | Road & Rail — 1.6% | | | | |
| | 1,044 | | | Avis Budget Group, Inc. (a) | | | 16,238 | |
| | 259 | | | J.B. Hunt Transport Services, Inc. | | | 10,570 | |
| | | | | | | | |
| | | | | | | 26,808 | |
| | | | | | | | |
| | | | Trading Companies & Distributors — 1.7% | | | | |
| | 202 | | | W.W. Grainger, Inc. | | | 27,953 | |
| | | | | | | | |
| | | | Total Industrials | | | 315,204 | |
| | | | | | | | |
| | | | | | | | |
| SHARES | | | SECURITY DESCRIPTION | | VALUE($) | |
| | | | | | | | |
| | |
| | | | Information Technology — 26.7% | | | | |
| | | | Communications Equipment — 3.3% | | | | |
| | 175 | | | F5 Networks, Inc. (a) | | | 22,726 | |
| | 518 | | | Juniper Networks, Inc. (a) | | | 19,128 | |
| | 338 | | | Riverbed Technology, Inc. (a) | | | 11,877 | |
| | | | | | | | |
| | | | | | | 53,731 | |
| | | | | | | | |
| | | | Computers & Peripherals — 2.0% | | | | |
| | 597 | | | NetApp, Inc. (a) | | | 32,789 | |
| | | | | | | | |
| | | | Electronic Equipment, Instruments & Components — 3.1% | |
| | 467 | | | Amphenol Corp., Class A | | | 24,647 | |
| | 721 | | | Tyco Electronics Ltd., (Switzerland) | | | 25,523 | |
| | | | | | | | |
| | | | | | | 50,170 | |
| | | | | | | | |
| | | | Internet Software & Services — 0.6% | | | | |
| | 118 | | | Equinix, Inc. (a) | | | 9,589 | |
| | | | | | | | |
| | | | IT Services — 5.7% | | | | |
| | 193 | | | Alliance Data Systems Corp. (a) (c) | | | 13,730 | |
| | 366 | | | Amdocs Ltd., (United Kingdom) (a) | | | 10,063 | |
| | 707 | | | CGI Group, Inc., (Canada), Class A (a) | | | 12,200 | |
| | 274 | | | Cognizant Technology Solutions Corp., Class A (a) | | | 20,111 | |
| | 299 | | | FleetCor Technologies, Inc. (a) | | | 9,251 | |
| | 63 | | | MasterCard, Inc., Class A | | | 14,159 | |
| | 747 | | | Western Union Co. (The) | | | 13,870 | |
| | | | | | | | |
| | | | | | | 93,384 | |
| | | | | | | | |
| | | | Office Electronics — 0.8% | | | | |
| | 363 | | | Zebra Technologies Corp., Class A (a) | | | 13,775 | |
| | | | | | | | |
| | | | Semiconductors & Semiconductor Equipment — 5.4% | |
| | 406 | | | Broadcom Corp., Class A | | | 17,703 | |
| | 213 | | | Cree, Inc. (a) | | | 14,047 | |
| | 1,226 | | | Marvell Technology Group Ltd., (Bermuda) (a) | | | 22,748 | |
| | 485 | | | Microchip Technology, Inc. (c) | | | 16,592 | |
| | 476 | | | Varian Semiconductor Equipment Associates, Inc. (a) | | | 17,605 | |
| | | | | | | | |
| | | | | | | 88,695 | |
| | | | | | | | |
| | | | Software — 5.8% | | | | |
| | 327 | | | Autodesk, Inc. (a) | | | 12,491 | |
| | 174 | | | Citrix Systems, Inc. (a) | | | 11,917 | |
| | 211 | | | Concur Technologies, Inc. (a) | | | 10,931 | |
| | 549 | | | MICROS Systems, Inc. (a) | | | 24,075 | |
| | 361 | | | Red Hat, Inc. (a) | | | 16,457 | |
| | 147 | | | Salesforce.com, Inc. (a) | | | 19,431 | |
| | | | | | | | |
| | | | | | | 95,302 | |
| | | | | | | | |
| | | | Total Information Technology | | | 437,435 | |
| | | | | | | | |
SEE NOTES TO FINANCIAL STATEMENTS.
| | | | | | | | |
| | | |
| DECEMBER 31, 2010 | | J.P. MORGAN MID CAP/MULTI-CAP FUNDS | | | | | 35 | |
JPMorgan Mid Cap Growth Fund
SCHEDULE OF PORTFOLIO INVESTMENTS
AS OF DECEMBER 31, 2010 (Unaudited) (continued)
(Amounts in thousands)
| | | | | | | | |
| SHARES | | | SECURITY DESCRIPTION | | VALUE($) | |
| | | | | | | | |
| Common Stocks — Continued | |
| | | | Materials — 3.5% | | | | |
| | | | Chemicals — 1.6% | | | | |
| | 301 | | | Sherwin-Williams Co. (The) | | | 25,201 | |
| | | | | | | | |
| | | | Containers & Packaging — 1.9% | | | | |
| | 457 | | | Bemis Co., Inc. | | | 14,929 | |
| | 268 | | | Greif, Inc., Class A | | | 16,595 | |
| | | | | | | | |
| | | | | | | 31,524 | |
| | | | | | | | |
| | | | Total Materials | | | 56,725 | |
| | | | | | | | |
| | | | Telecommunication Services — 0.9% | | | | |
| | | | Diversified Telecommunication Services — 0.9% | |
| | 887 | | | tw telecom, inc. (a) | | | 15,131 | |
| | | | | | | | |
| | | | Total Common Stocks
(Cost $1,140,644) | | | 1,609,305 | |
| | | | | | | | |
| | | | | | | | |
| SHARES | | | SECURITY DESCRIPTION | | VALUE($) | |
| | | | | | | | |
| Short-Term Investment — 1.6% | | | | |
| | | | Investment Company — 1.6% | | | | |
| | 26,596 | | | JPMorgan Liquid Assets Money Market Fund, Institutional Class Shares,
0.110% (b) (l) (m)
(Cost $26,596) | | | 26,596 | |
| | | | | | | | |
| Investments of Cash Collateral for Securities on Loan — 2.8% | |
| | | | Investment Company — 2.8% | | | | |
| | 46,631 | | | JPMorgan Prime Money Market Fund, Capital Shares, 0.130% (b) (l)
(Cost $46,631) | | | 46,631 | |
| | | | | | | | |
| | | | Total Investments — 102.6%
(Cost $1,213,871) | | | 1,682,532 | |
| | | | Liabilities in Excess of
Other Assets — (2.6)% | | | (43,367 | ) |
| | | | | | | | |
| | | | NET ASSETS — 100.0% | | $ | 1,639,165 | |
| | | | | | | | |
Percentages indicated are based on net assets.
SEE NOTES TO FINANCIAL STATEMENTS.
| | | | | | |
| | | |
| 36 | | | | J.P. MORGAN MID CAP/MULTI-CAP FUNDS | | DECEMBER 31, 2010 |
JPMorgan Mid Cap Value Fund
SCHEDULE OF PORTFOLIO INVESTMENTS
AS OF DECEMBER 31, 2010 (Unaudited)
(Amounts in thousands)
| | | | | | | | |
| SHARES | | | SECURITY DESCRIPTION | | VALUE ($) | |
| | | | | | | | |
| Common Stocks — 96.0% | | | | |
| | | | Consumer Discretionary — 18.4% | | | | |
| | | | Distributors — 0.9% | | | | |
| | 1,142 | | | Genuine Parts Co. | | | 58,610 | |
| | | | | | | | |
| | | | Hotels, Restaurants & Leisure — 2.2% | | | | |
| | 954 | | | Darden Restaurants, Inc. | | | 44,311 | |
| | 1,221 | | | Marriott International, Inc., Class A | | | 50,733 | |
| | 936 | | | Yum! Brands, Inc. | | | 45,901 | |
| | | | | | | | |
| | | | | | | 140,945 | |
| | | | | | | | |
| | | | Household Durables — 1.9% | | | | |
| | 1,360 | | | Fortune Brands, Inc. | | | 81,952 | |
| | 1,200 | | | Jarden Corp. | | | 37,036 | |
| | | | | | | | |
| | | | | | | 118,988 | |
| | | | | | | | |
| | | | Internet & Catalog Retail — 0.8% | | | | |
| | 1,941 | | | Expedia, Inc. | | | 48,694 | |
| | | | | | | | |
| | | | Media — 4.4% | | | | |
| | 876 | | | Cablevision Systems Corp., Class A | | | 29,640 | |
| | 2,627 | | | CBS Corp., Class B | | | 50,048 | |
| | 2,308 | | | Clear Channel Outdoor Holdings, Inc., Class A (a) | | | 32,405 | |
| | 2,924 | | | DISH Network Corp., Class A (a) | | | 57,484 | |
| | 3,624 | | | Gannett Co., Inc. | | | 54,688 | |
| | 712 | | | Omnicom Group, Inc. | | | 32,587 | |
| | 50 | | | Washington Post Co. (The), Class B (c) | | | 21,984 | |
| | | | | | | | |
| | | | | | | 278,836 | |
| | | | | | | | |
| | | | Multiline Retail — 1.0% | | | | |
| | 2,464 | | | Macy’s, Inc. | | | 62,342 | |
| | | | | | | | |
| | | | Specialty Retail — 6.4% | | | | |
| | 185 | | | AutoZone, Inc. (a) | | | 50,369 | |
| | 1,479 | | | Bed Bath & Beyond, Inc. (a) | | | 72,683 | |
| | 5,614 | | | Gap, Inc. (The) | | | 124,303 | |
| | 1,390 | | | Staples, Inc. | | | 31,644 | |
| | 918 | | | Tiffany & Co. | | | 57,135 | |
| | 1,482 | | | TJX Cos., Inc. | | | 65,782 | |
| | | | | | | | |
| | | | | | | 401,916 | |
| | | | | | | | |
| | | | Textiles, Apparel & Luxury Goods — 0.8% | | | | |
| | 807 | | | Phillips-Van Heusen Corp. | | | 50,843 | |
| | | | | | | | |
| | | | Total Consumer Discretionary | | | 1,161,174 | |
| | | | | | | | |
| | | | Consumer Staples — 5.5% | | | | |
| | | | Beverages — 1.1% | | | | |
| | 748 | | | Brown-Forman Corp., Class B | | | 52,095 | |
| | 505 | | | Dr. Pepper Snapple Group, Inc. | | | 17,756 | |
| | | | | | | | |
| | | | | | | 69,851 | |
| | | | | | | | |
| | | | Food & Staples Retailing — 1.2% | | | | |
| | 3,435 | | | Safeway, Inc. | | | 77,258 | |
| | | | | | | | |
| | | | | | | | |
| SHARES | | | SECURITY DESCRIPTION | | VALUE ($) | |
| | | | | | | | |
| | | | | |
| | | | Food Products — 2.3% | | | | |
| | 1,402 | | | JM Smucker Co. (The) | | | 92,061 | |
| | 821 | | | Ralcorp Holdings, Inc. (a) | | | 53,380 | |
| | | | | | | | |
| | | | | | | 145,441 | |
| | | | | | | | |
| | | | Household Products — 0.6% | | | | |
| | 521 | | | Energizer Holdings, Inc. (a) | | | 37,995 | |
| | | | | | | | |
| | | | Tobacco — 0.3% | | | | |
| | 230 | | | Lorillard, Inc. | | | 18,898 | |
| | | | | | | | |
| | | | Total Consumer Staples | | | 349,443 | |
| | | | | | | | |
| | | | Energy — 8.6% | | | | |
| | | | Oil, Gas & Consumable Fuels — 8.6% | | | | |
| | 2,801 | | | CVR Energy, Inc. (a) | | | 42,518 | |
| | 1,256 | | | Devon Energy Corp. | | | 98,604 | |
| | 4,044 | | | El Paso Corp. | | | 55,639 | |
| | 1,666 | | | EQT Corp. | | | 74,721 | |
| | 607 | | | Kinder Morgan Management LLC (a) | | | 40,581 | |
| | 1,009 | | | Newfield Exploration Co. (a) | | | 72,723 | |
| | 1,732 | | | Teekay Corp., (Canada) | | | 57,296 | |
| | 4,092 | | | Williams Cos., Inc. (The) | | | 101,142 | |
| | | | | | | | |
| | | | Total Energy | | | 543,224 | |
| | | | | | | | |
| | | | Financials — 23.9% | | | | |
| | | | Capital Markets — 2.9% | | | | |
| | 1,130 | | | Ameriprise Financial, Inc. | | | 65,054 | |
| | 348 | | | LPL Investment Holdings, Inc. (a) | | | 12,646 | |
| | 790 | | | Northern Trust Corp. | | | 43,752 | |
| | 985 | | | T. Rowe Price Group, Inc. | | | 63,603 | |
| | | | | | | | |
| | | | | | | 185,055 | |
| | | | | | | | |
| | | | Commercial Banks — 5.7% | | | | |
| | 1,926 | | | BancorpSouth, Inc. (c) | | | 30,712 | |
| | 1,012 | | | BB&T Corp. | | | 26,616 | |
| | 597 | | | City National Corp. | | | 36,601 | |
| | 583 | | | Cullen/Frost Bankers, Inc. | | | 35,627 | |
| | 3,402 | | | Fifth Third Bancorp | | | 49,937 | |
| | 815 | | | M&T Bank Corp. | | | 70,906 | |
| | 1,899 | | | SunTrust Banks, Inc. | | | 56,025 | |
| | 1,051 | | | TCF Financial Corp. (c) | | | 15,559 | |
| | 1,450 | | | Zions Bancorp | | | 35,141 | |
| | | | | | | | |
| | | | | | | 357,124 | |
| | | | | | | | |
| | | | Insurance — 10.3% | | | | |
| | 1,102 | | | AON Corp. | | | 50,721 | |
| | 247 | | | Arch Capital Group Ltd., (Bermuda) (a) | | | 21,784 | |
| | 2,392 | | | Cincinnati Financial Corp. | | | 75,814 | |
| | 3,040 | | | Loews Corp. | | | 118,271 | |
| | 5,989 | | | Old Republic International Corp. | | | 81,625 | |
| | 2,246 | | | OneBeacon Insurance Group Ltd., Class A | | | 34,050 | |
SEE NOTES TO FINANCIAL STATEMENTS.
| | | | | | | | |
| | | |
| DECEMBER 31, 2010 | | J.P. MORGAN MID CAP/MULTI-CAP FUNDS | | | | | 37 | |
JPMorgan Mid Cap Value Fund
SCHEDULE OF PORTFOLIO INVESTMENTS
AS OF DECEMBER 31, 2010 (Unaudited) (continued)
(Amounts in thousands)
| | | | | | | | |
| SHARES | | | SECURITY DESCRIPTION | | VALUE ($) | |
| | | | | | | | |
| Common Stocks — Continued | | | | |
| | | | Insurance — Continued | | | | |
| | 1,523 | | | Principal Financial Group, Inc. | | | 49,585 | |
| | 603 | | | Symetra Financial Corp. | | | 8,266 | |
| | 1,631 | | | Transatlantic Holdings, Inc. | | | 84,208 | |
| | 2,790 | | | W.R. Berkley Corp. | | | 76,401 | |
| | 2,385 | | | XL Group plc, (Ireland) | | | 52,041 | |
| | | | | | | | |
| | | | | | | 652,766 | |
| | | | | | | | |
| | | | Real Estate Investment Trusts (REITs) — 3.2% | |
| | 917 | | | HCP, Inc. | | | 33,744 | |
| | 1,562 | | | Kimco Realty Corp. | | | 28,173 | |
| | 237 | | | Public Storage | | | 23,990 | |
| | 1,403 | | | Regency Centers Corp. | | | 59,267 | |
| | 721 | | | Vornado Realty Trust | | | 60,043 | |
| | | | | | | | |
| | | | | | | 205,217 | |
| | | | | | | | |
| | | | Real Estate Management & Development — 0.9% | |
| | 3,089 | | | Brookfield Properties Corp. (c) | | | 54,146 | |
| | | | | | | | |
| | | | Thrifts & Mortgage Finance — 0.9% | | | | |
| | 214 | | | Capitol Federal Financial, Inc. | | | 2,543 | |
| | 3,705 | | | People’s United Financial, Inc. | | | 51,911 | |
| | | | | | | | |
| | | | | | | 54,454 | |
| | | | | | | | |
| | | | Total Financials | | | 1,508,762 | |
| | | | | | | | |
| | | | Health Care — 6.0% | | | | |
| | | | Health Care Equipment & Supplies — 1.6% | | | | |
| | 1,208 | | | Becton, Dickinson & Co. | | | 102,117 | |
| | | | | | | | |
| | | | Health Care Providers & Services — 4.4% | | | | |
| | 901 | | | AmerisourceBergen Corp. | | | 30,732 | |
| | 1,014 | | | Community Health Systems, Inc. (a) | | | 37,909 | |
| | 1,736 | | | Coventry Health Care, Inc. (a) | | | 45,838 | |
| | 857 | | | Humana, Inc. (a) | | | 46,885 | |
| | 3,396 | | | Lincare Holdings, Inc. | | | 91,127 | |
| | 1,128 | | | VCA Antech, Inc. (a) | | | 26,262 | |
| | | | | | | | |
| | | | | | | 278,753 | |
| | | | | | | | |
| | | | Total Health Care | | | 380,870 | |
| | | | | | | | |
| | | | Industrials — 8.8% | | | | |
| | | | Aerospace & Defense — 1.6% | | | | |
| | 634 | | | Alliant Techsystems, Inc. (a) | | | 47,162 | |
| | 717 | | | L-3 Communications Holdings, Inc. | | | 50,527 | |
| | | | | | | | |
| | | | | | | 97,689 | |
| | | | | | | | |
| | | | Commercial Services & Supplies — 1.8% | | | | |
| | 3,785 | | | Republic Services, Inc. | | | 113,031 | |
| | | | | | | | |
| | | | Electrical Equipment — 2.7% | | | | |
| | 1,142 | | | AMETEK, Inc. | | | 44,838 | |
| | 863 | | | Cooper Industries plc | | | 50,316 | |
| | | | | | | | |
| SHARES | | | SECURITY DESCRIPTION | | VALUE ($) | |
| | | | | | | | |
| | | | | |
| | | | Electrical Equipment — Continued | | | | |
| | 300 | | | Regal-Beloit Corp. | | | 20,055 | |
| | 754 | | | Roper Industries, Inc. | | | 57,665 | |
| | | | | | | | |
| | | | | | | 172,874 | |
| | | | | | | | |
| | | | Industrial Conglomerates — 0.9% | | | | |
| | 1,420 | | | Carlisle Cos., Inc. | | | 56,420 | |
| | | | | | | | |
| | | | Machinery — 1.8% | | | | |
| | 1,277 | | | Snap-On, Inc. | | | 72,258 | |
| | 707 | | | WABCO Holdings, Inc. (a) | | | 43,078 | |
| | | | | | | | |
| | | | | | | 115,336 | |
| | | | | | | | |
| | | | Total Industrials | | | 555,350 | |
| | | | | | | | |
| | | | Information Technology — 5.4% | | | | |
| | | | Electronic Equipment, Instruments & Components — 3.4% | |
| | 1,048 | | | Amphenol Corp., Class A | | | 55,313 | |
| | 1,484 | | | Arrow Electronics, Inc. (a) | | | 50,820 | |
| | 3,167 | | | Tyco Electronics Ltd., (Switzerland) | | | 112,098 | |
| | | | | | | | |
| | | | | | | 218,231 | |
| | | | | | | | |
| | | | IT Services — 1.0% | | | | |
| | 2,128 | | | Jack Henry & Associates, Inc. | | | 62,037 | |
| | | | | | | | |
| | | | Software — 1.0% | | | | |
| | 2,294 | | | Synopsys, Inc. (a) | | | 61,721 | |
| | | | | | | | |
| | | | Total Information Technology | | | 341,989 | |
| | | | | | | | |
| | | | Materials — 6.5% | | | | |
| | | | Chemicals — 4.6% | | | | |
| | 1,363 | | | Albemarle Corp. | | | 76,047 | |
| | 905 | | | PPG Industries, Inc. | | | 76,050 | |
| | 867 | | | Sherwin-Williams Co. (The) | | | 72,604 | |
| | 982 | | | Sigma-Aldrich Corp. | | | 65,335 | |
| | | | | | | | |
| | | | | | | 290,036 | |
| | | | | | | | |
| | | | Containers & Packaging — 1.9% | | | | |
| | 1,367 | | | Ball Corp. | | | 92,995 | |
| | 572 | | | Rock-Tenn Co., Class A | | | 30,854 | |
| | | | | | | | |
| | | | | | | 123,849 | |
| | | | | | | | |
| | | | Total Materials | | | 413,885 | |
| | | | | | | | |
| | | | Telecommunication Services — 2.5% | | | | |
| | | | Diversified Telecommunication Services — 1.5% | |
| | 1,426 | | | CenturyLink, Inc. | | | 65,829 | |
| | 1,846 | | | Windstream Corp. | | | 25,736 | |
| | | | | | | | |
| | | | | | | 91,565 | |
| | | | | | | | |
| | | | Wireless Telecommunication Services — 1.0% | |
| | 2,053 | | | Telephone & Data Systems, Inc. | | | 64,725 | |
| | | | | | | | |
| | | | Total Telecommunication Services | | | 156,290 | |
| | | | | | | | |
SEE NOTES TO FINANCIAL STATEMENTS.
| | | | | | |
| | | |
| 38 | | | | J.P. MORGAN MID CAP/MULTI-CAP FUNDS | | DECEMBER 31, 2010 |
| | | | | | | | |
| SHARES | | | SECURITY DESCRIPTION | | VALUE ($) | |
| | | | | | | | |
| Common Stocks — Continued | | | | |
| | | | Utilities — 10.4% | | | | |
| | | | Electric Utilities — 1.5% | | | | |
| | 663 | | | Northeast Utilities | | | 21,136 | |
| | 2,938 | | | Westar Energy, Inc. | | | 73,930 | |
| | | | | | | | |
| | | | | | | 95,066 | |
| | | | | | | | |
| | | | Gas Utilities — 2.9% | | | | |
| | 2,141 | | | Energen Corp. | | | 103,344 | |
| | 1,398 | | | Oneok, Inc. | | | 77,524 | |
| | | | | | | | |
| | | | | | | 180,868 | |
| | | | | | | | |
| | | | Multi-Utilities — 5.6% | | | | |
| | 5,358 | | | CMS Energy Corp. | | | 99,652 | |
| | 1,424 | | | NSTAR | | | 60,091 | |
| | 601 | | | Sempra Energy | | | 31,556 | |
| | 1,268 | | | Wisconsin Energy Corp. | | | 74,658 | |
| | 3,661 | | | Xcel Energy, Inc. | | | 86,212 | |
| | | | | | | | |
| | | | | | | 352,169 | |
| | | | | | | | |
| | | | Water Utilities — 0.4% | | | | |
| | 1,115 | | | American Water Works Co., Inc. | | | 28,208 | |
| | | | | | | | |
| | | | Total Utilities | | | 656,311 | |
| | | | | | | | |
| | | | Total Common Stocks
(Cost $4,711,925) | | | 6,067,298 | |
| | | | | | | | |
| | | | | | | | |
| SHARES | | | SECURITY DESCRIPTION | | VALUE ($) | |
| | | | | | | | |
| Short-Term Investment — 3.9% | |
| | | | Investment Company — 3.9% | | | | |
| | 248,101 | | | JPMorgan Prime Money Market Fund, Institutional Class Shares, 0.100% (b) (l) (m)
(Cost $248,101) | | | 248,101 | |
| | | | | | | | |
| Investment of Cash Collateral for Securities on Loan — 0.9% | |
| | | | Investment Company — 0.9% | | | | |
| | 60,214 | | | JPMorgan Prime Money Market Fund, Capital Shares, 0.130% (b) (l)
(Cost $60,214) | | | 60,214 | |
| | | | | | | | |
| | | | Total Investments — 100.8%
(Cost $5,020,240) | | | 6,375,613 | |
| | | | Liabilities in Excess of
Other Assets — (0.8)% | | | (52,574 | ) |
| | | | | | | | |
| | | | NET ASSETS — 100.0% | | $ | 6,323,039 | |
| | | | | | | | |
Percentages indicated are based on net assets.
SEE NOTES TO FINANCIAL STATEMENTS.
| | | | | | | | |
| | | |
| DECEMBER 31, 2010 | | J.P. MORGAN MID CAP/MULTI-CAP FUNDS | | | | | 39 | |
JPMorgan Multi-Cap Market Neutral Fund
SCHEDULE OF PORTFOLIO INVESTMENTS
AS OF DECEMBER 31, 2010 (Unaudited)
(Amounts in thousands)
| | | | | | | | |
| SHARES | | | SECURITY DESCRIPTION | | VALUE($) | |
| | | | | | | | |
| Long Positions — 99.6% (j) | |
| | | | Common Stocks — 92.1% | |
| | | | Consumer Discretionary — 19.1% | |
| | | | Auto Components — 2.1% | |
| | 27 | | | Autoliv, Inc., (Sweden) | | | 2,107 | |
| | 19 | | | BorgWarner, Inc. (a) | | | 1,394 | |
| | 91 | | | Cooper Tire & Rubber Co. | | | 2,147 | |
| | 147 | | | Dana Holding Corp. (a) | | | 2,534 | |
| | 32 | | | Tenneco, Inc. (a) | | | 1,321 | |
| | 45 | | | TRW Automotive Holdings Corp. (a) | | | 2,361 | |
| | | | | | | | |
| | | | | | | 11,864 | |
| | | | | | | | |
| | | | Automobiles — 0.4% | |
| | 127 | | | Ford Motor Co. (a) | | | 2,133 | |
| | 10 | | | Harley-Davidson, Inc. | | | 345 | |
| | | | | | | | |
| | | | | | | 2,478 | |
| | | | | | | | |
| | | | Diversified Consumer Services — 2.3% | |
| | 55 | | | Apollo Group, Inc., Class A (a) | | | 2,187 | |
| | 28 | | | Career Education Corp. (a) | | | 587 | |
| | 33 | | | Coinstar, Inc. (a) | | | 1,848 | |
| | 31 | | | DeVry, Inc. | | | 1,495 | |
| | 94 | | | H&R Block, Inc. | | | 1,123 | |
| | 33 | | | ITT Educational Services, Inc. (a) | | | 2,124 | |
| | 54 | | | Sotheby’s | | | 2,415 | |
| | 2 | | | Strayer Education, Inc. | | | 366 | |
| | 24 | | | Weight Watchers International, Inc. | | | 901 | |
| | | | | | | | |
| | | | | | | 13,046 | |
| | | | | | | | |
| | | | Hotels, Restaurants & Leisure — 2.3% | |
| | 100 | | | Brinker International, Inc. | | | 2,095 | |
| | 36 | | | Cracker Barrel Old Country Store, Inc. | | | 1,945 | |
| | 41 | | | Las Vegas Sands Corp. (a) | | | 1,894 | |
| | 26 | | | Penn National Gaming, Inc. (a) | | | 903 | |
| | 30 | | | Royal Caribbean Cruises Ltd. (a) | | | 1,407 | |
| | 42 | | | Starbucks Corp. | | | 1,349 | |
| | 7 | | | Starwood Hotels & Resorts Worldwide, Inc. | | | 434 | |
| | 68 | | | Wyndham Worldwide Corp. | | | 2,040 | |
| | 15 | | | Wynn Resorts Ltd. | | | 1,515 | |
| | | | | | | | |
| | | | | | | 13,582 | |
| | | | | | | | |
| | | | Household Durables — 1.0% | |
| | 150 | | | D.R. Horton, Inc. | | | 1,784 | |
| | 9 | | | Harman International Industries, Inc. (a) | | | 399 | |
| | 28 | | | Jarden Corp. | | | 863 | |
| | 51 | | | Tempur-Pedic International, Inc. (a) | | | 2,024 | |
| | 10 | | | Whirlpool Corp. | | | 930 | |
| | | | | | | | |
| | | | | | | 6,000 | |
| | | | | | | | |
| | | | | | | | |
| SHARES | | | SECURITY DESCRIPTION | | VALUE($) | |
| | | | | | | | |
| | | | | | | | |
| | | | Internet & Catalog Retail — 1.2% | |
| | 13 | | | Amazon.com, Inc. (a) | | | 2,318 | |
| | 76 | | | Expedia, Inc. | | | 1,916 | |
| | 12 | | | NetFlix, Inc. (a) | | | 2,139 | |
| | 2 | | | priceline.com, Inc. (a) | | | 738 | |
| | | | | | | | |
| | | | | | | 7,111 | |
| | | | | | | | |
| | | | Leisure Equipment & Products — 0.9% | |
| | 79 | | | Brunswick Corp. | | | 1,479 | |
| | 308 | | | Eastman Kodak Co. (a) | | | 1,652 | |
| | 29 | | | Polaris Industries, Inc. | | | 2,226 | |
| | | | | | | | |
| | | | | | | 5,357 | |
| | | | | | | | |
| | | | Media — 2.5% | |
| | 124 | | | CBS Corp., Class B | | | 2,357 | |
| | 14 | | | DISH Network Corp., Class A (a) | | | 277 | |
| | 63 | | | Gannett Co., Inc. | | | 954 | |
| | 61 | | | Liberty Global, Inc., Class A (a) | | | 2,166 | |
| | 7 | | | Liberty Media Corp. - Capital, Class A (a) | | | 409 | |
| | 29 | | | Liberty Media Corp. - Starz, Class A (a) | | | 1,915 | |
| | 46 | | | McGraw-Hill Cos., Inc. (The) | | | 1,676 | |
| | 26 | | | News Corp., Class A | | | 378 | |
| | 50 | | | Regal Entertainment Group, Class A | | | 589 | |
| | 62 | | | Valassis Communications, Inc. (a) | | | 1,997 | |
| | 54 | | | Virgin Media, Inc. | | | 1,464 | |
| | | | | | | | |
| | | | | | | 14,182 | |
| | | | | | | | |
| | | | Multiline Retail — 0.5% | |
| | 21 | | | Dollar Tree, Inc. (a) | | | 1,161 | |
| | 64 | | | Macy’s, Inc. | | | 1,612 | |
| | | | | | | | |
| | | | | | | 2,773 | |
| | | | | | | | |
| | | | Specialty Retail — 3.8% | |
| | 29 | | | Advance Auto Parts, Inc. | | | 1,946 | |
| | 70 | | | Aeropostale, Inc. (a) | | | 1,728 | |
| | 32 | | | AnnTaylor Stores Corp. (a) | | | 872 | |
| | 3 | | | AutoZone, Inc. (a) | | | 944 | |
| | 16 | | | Best Buy Co., Inc. | | | 562 | |
| | 83 | | | Cabela’s, Inc. (a) | | | 1,801 | |
| | 75 | | | Foot Locker, Inc. | | | 1,467 | |
| | 60 | | | GameStop Corp., Class A (a) | | | 1,373 | |
| | 46 | | | Jo-Ann Stores, Inc. (a) | | | 2,772 | |
| | 51 | | | Limited Brands, Inc. | | | 1,558 | |
| | 16 | | | Men’s Wearhouse, Inc. (The) | | | 408 | |
| | 113 | | | Pier 1 Imports, Inc. (a) | | | 1,184 | |
| | 40 | | | RadioShack Corp. | | | 736 | |
| | 33 | | | Ross Stores, Inc. | | | 2,103 | |
| | 6 | | | TJX Cos., Inc. | | | 280 | |
| | 71 | | | Williams-Sonoma, Inc. | | | 2,518 | |
| | | | | | | | |
| | | | | | | 22,252 | |
| | | | | | | | |
SEE NOTES TO FINANCIAL STATEMENTS.
| | | | | | |
| | | |
| 40 | | | | J.P. MORGAN MID CAP/MULTI-CAP FUNDS | | DECEMBER 31, 2010 |
| | | | | | | | |
| SHARES | | | SECURITY DESCRIPTION | | VALUE($) | |
| | | | | | | | |
| Long Positions — Continued | |
| | | | Textiles, Apparel & Luxury Goods — 2.1% | |
| | 28 | | | Coach, Inc. | | | 1,561 | |
| | 31 | | | Deckers Outdoor Corp. (a) | | | 2,439 | |
| | 23 | | | Fossil, Inc. (a) | | | 1,644 | |
| | 90 | | | Iconix Brand Group, Inc. (a) | | | 1,744 | |
| | 26 | | | V.F. Corp. | | | 2,261 | |
| | 42 | | | Warnaco Group, Inc. (The) (a) | | | 2,323 | |
| | | | | | | | |
| | | | | | | 11,972 | |
| | | | | | | | |
| | | | Total Consumer Discretionary | | | 110,617 | |
| | | | | | | | |
| | | | Consumer Staples — 4.1% | |
| | | | Beverages — 0.8% | |
| | 40 | | | Coca-Cola Enterprises, Inc. | | | 1,005 | |
| | 92 | | | Constellation Brands, Inc., Class A (a) | | | 2,040 | |
| | 54 | | | Dr. Pepper Snapple Group, Inc. | | | 1,901 | |
| | | | | | | | |
| | | | | | | 4,946 | |
| | | | | | | | |
| | | | Food & Staples Retailing — 0.4% | | | | |
| | 50 | | | Casey’s General Stores, Inc. | | | 2,136 | |
| | | | | | | | |
| | | | Food Products — 1.5% | | | | |
| | 7 | | | ConAgra Foods, Inc. | | | 160 | |
| | 54 | | | Corn Products International, Inc. | | | 2,492 | |
| | 66 | | | Dean Foods Co. (a) | | | 584 | |
| | 20 | | | Hormel Foods Corp. | | | 1,047 | |
| | 98 | | | Smithfield Foods, Inc. (a) | | | 2,019 | |
| | 130 | | | Tyson Foods, Inc., Class A | | | 2,241 | |
| | | | | | | | |
| | | | | | | 8,543 | |
| | | | | | | | |
| | | | Household Products — 0.2% | | | | |
| | 18 | | | Energizer Holdings, Inc. (a) | | | 1,312 | |
| | | | | | | | |
| | | | Personal Products — 0.6% | | | | |
| | 27 | | | Herbalife Ltd., (Cayman Islands) | | | 1,869 | |
| | 54 | | | Nu Skin Enterprises, Inc., Class A | | | 1,624 | |
| | | | | | | | |
| | | | | | | 3,493 | |
| | | | | | | | |
| | | | Tobacco — 0.6% | | | | |
| | 42 | | | Altria Group, Inc. | | | 1,044 | |
| | 23 | | | Lorillard, Inc. | | | 1,870 | |
| | 19 | | | Reynolds American, Inc. | | | 608 | |
| | | | | | | | |
| | | | | | | 3,522 | |
| | | | | | | | |
| | | | Total Consumer Staples | | | 23,952 | |
| | | | | | | | |
| | | | Energy — 7.5% | | | | |
| | | | Energy Equipment & Services — 2.7% | |
| | 63 | | | Atwood Oceanics, Inc. (a) | | | 2,345 | |
| | 74 | | | Complete Production Services, Inc. (a) | | | 2,176 | |
| | 17 | | | Diamond Offshore Drilling, Inc. | | | 1,165 | |
| | 28 | | | Halliburton Co. | | | 1,129 | |
| | | | | | | | |
| SHARES | | | SECURITY DESCRIPTION | | VALUE($) | |
| | | | | | | | |
| | | | | | | | |
| | | | Energy Equipment & Services — Continued | |
| | 64 | | | Helix Energy Solutions Group, Inc. (a) | | | 779 | |
| | 80 | | | McDermott International, Inc. (a) | | | 1,647 | |
| | 19 | | | Nabors Industries Ltd., (Bermuda) (a) | | | 438 | |
| | 13 | | | National Oilwell Varco, Inc. | | | 906 | |
| | 23 | | | Oil States International, Inc. (a) | | | 1,482 | |
| | 56 | | | Patterson-UTI Energy, Inc. | | | 1,215 | |
| | 91 | | | RPC, Inc. | | | 1,657 | |
| | 9 | | | Transocean Ltd., (Switzerland) (a) | | | 651 | |
| | | | | | | | |
| | | | | | | 15,590 | |
| | | | | | | | |
| | | | Oil, Gas & Consumable Fuels — 4.8% | |
| | 19 | | | Apache Corp. | | | 2,219 | |
| | 42 | | | Arch Coal, Inc. | | | 1,466 | |
| | 89 | | | Chesapeake Energy Corp. | | | 2,295 | |
| | 3 | | | Chevron Corp. | | | 272 | |
| | 21 | | | Cimarex Energy Co. | | | 1,850 | |
| | 31 | | | Concho Resources, Inc. (a) | | | 2,734 | |
| | 31 | | | Devon Energy Corp. | | | 2,411 | |
| | 41 | | | Forest Oil Corp. (a) | | | 1,547 | |
| | 12 | | | Frontier Oil Corp. (a) | | | 223 | |
| | 34 | | | Frontline Ltd., (Bermuda) | | | 868 | |
| | 35 | | | Holly Corp. | | | 1,414 | |
| | 10 | | | Marathon Oil Corp. | | | 376 | |
| | 30 | | | Newfield Exploration Co. (a) | | | 2,174 | |
| | 12 | | | Noble Energy, Inc. | | | 1,074 | |
| | 13 | | | Occidental Petroleum Corp. | | | 1,304 | |
| | 31 | | | Peabody Energy Corp. | | | 2,010 | |
| | 7 | | | Sunoco, Inc. | | | 294 | |
| | 9 | | | Valero Energy Corp. | | | 212 | |
| | 58 | | | W&T Offshore, Inc. | | | 1,034 | |
| | 16 | | | Whiting Petroleum Corp. (a) | | | 1,910 | |
| | | | | | | | |
| | | | | | | 27,687 | |
| | | | | | | | |
| | | | Total Energy | | | 43,277 | |
| | | | | | | | |
| | | | Financials — 11.2% | | | | |
| | | | Capital Markets — 1.1% | | | | |
| | 89 | | | American Capital Ltd. (a) | | | 672 | |
| | 40 | | | Ameriprise Financial, Inc. | | | 2,295 | |
| | 81 | | | Ares Capital Corp. | | | 1,327 | |
| | 31 | | | Bank of New York Mellon Corp. (The) | | | 933 | |
| | 29 | | | State Street Corp. | | | 1,326 | |
| | | | | | | | |
| | | | | | | 6,553 | |
| | | | | | | | |
| | | | Commercial Banks — 2.7% | | | | |
| | 43 | | | Bank of Hawaii Corp. | | | 2,047 | |
| | 23 | | | Cullen/Frost Bankers, Inc. | | | 1,432 | |
| | 105 | | | East West Bancorp, Inc. | | | 2,062 | |
SEE NOTES TO FINANCIAL STATEMENTS.
| | | | | | | | |
| | | |
| DECEMBER 31, 2010 | | J.P. MORGAN MID CAP/MULTI-CAP FUNDS | | | | | 41 | |
JPMorgan Multi-Cap Market Neutral Fund
SCHEDULE OF PORTFOLIO INVESTMENTS
AS OF DECEMBER 31, 2010 (Unaudited) (continued)
(Amounts in thousands)
| | | | | | | | |
| SHARES | | | SECURITY DESCRIPTION | | VALUE($) | |
| | | | | | | | |
| Long Positions — Continued | |
| | | | Commercial Banks — Continued | | | | |
| | 169 | | | KeyCorp | | | 1,494 | |
| | 19 | | | M&T Bank Corp. | | | 1,636 | |
| | 36 | | | PNC Financial Services Group, Inc. | | | 2,212 | |
| | 7 | | | Prosperity Bancshares, Inc. | | | 292 | |
| | 40 | | | Signature Bank (a) | | | 1,984 | |
| | 40 | | | TCF Financial Corp. | | | 597 | |
| | 23 | | | U.S. Bancorp | | | 626 | |
| | 41 | | | Wells Fargo & Co. | | | 1,286 | |
| | | | | | | | |
| | | | | | | 15,668 | |
| | | | | | | | |
| | | | Consumer Finance — 0.8% | | | | |
| | 50 | | | Capital One Financial Corp. | | | 2,139 | |
| | 175 | | | SLM Corp. (a) | | | 2,199 | |
| | | | | | | | |
| | | | | | | 4,338 | |
| | | | | | | | |
| | | | Insurance — 6.1% | | | | |
| | 31 | | | ACE Ltd., (Switzerland) | | | 1,959 | |
| | 42 | | | Aflac, Inc. | | | 2,344 | |
| | 37 | | | Allied World Assurance Co. Holdings Ltd., (Switzerland) | | | 2,175 | |
| | 22 | | | Arch Capital Group Ltd., (Bermuda) (a) | | | 1,922 | |
| | 56 | | | Assurant, Inc. | | | 2,172 | |
| | 115 | | | Assured Guaranty Ltd., (Bermuda) | | | 2,031 | |
| | 29 | | | Chubb Corp. | | | 1,753 | |
| | 179 | | | CNO Financial Group, Inc. (a) | | | 1,211 | |
| | 45 | | | Endurance Specialty Holdings Ltd., (Bermuda) | | | 2,095 | |
| | 3 | | | Everest Re Group Ltd., (Bermuda) | | | 270 | |
| | 72 | | | Hartford Financial Services Group, Inc. | | | 1,895 | |
| | 42 | | | MBIA, Inc. (a) | | | 498 | |
| | 103 | | | Montpelier Re Holdings Ltd., (Bermuda) | | | 2,051 | |
| | 51 | | | Platinum Underwriters Holdings Ltd., (Bermuda) | | | 2,305 | |
| | 74 | | | Protective Life Corp. | | | 1,979 | |
| | 36 | | | Prudential Financial, Inc. | | | 2,126 | |
| | 5 | | | RenaissanceRe Holdings Ltd., (Bermuda) | | | 287 | |
| | 38 | | | StanCorp Financial Group, Inc. | | | 1,716 | |
| | 32 | | | Torchmark Corp. | | | 1,928 | |
| | 35 | | | Travelers Cos., Inc. (The) | | | 1,927 | |
| | 24 | | | W.R. Berkley Corp. | | | 663 | |
| | | | | | | | |
| | | | | | | 35,307 | |
| | | | | | | | |
| | | | Real Estate Investment Trusts (REITs) — 0.5% | | | | |
| | 22 | | | Douglas Emmett, Inc. (m) | | | 365 | |
| | 51 | | | Duke Realty Corp. | | | 636 | |
| | 7 | | | Equity Residential | | | 363 | |
| | 2 | | | Essex Property Trust, Inc. | | | 208 | |
| | 10 | | | Liberty Property Trust | | | 314 | |
| | 5 | | | Taubman Centers, Inc. | | | 252 | |
| | | | | | | | |
| SHARES | | | SECURITY DESCRIPTION | | VALUE($) | |
| | | | | | | | |
| | | | | | | | |
| | | | Real Estate Investment Trusts (REITs) — Continued | |
| | 9 | | | Vornado Realty Trust | | | 745 | |
| | | | | | | | |
| | | | | | | 2,883 | |
| | | | | | | | |
| | | | Total Financials | | | 64,749 | |
| | | | | | | | |
| | | | Health Care — 10.4% | | | | |
| | | | Biotechnology — 1.7% | | | | |
| | 11 | | | Amgen, Inc. (a) | | | 582 | |
| | 44 | | | Amylin Pharmaceuticals, Inc. (a) | | | 646 | |
| | 30 | | | Biogen Idec, Inc. (a) | | | 1,987 | |
| | 35 | | | Cephalon, Inc. (a) | | | 2,151 | |
| | 36 | | | Cubist Pharmaceuticals, Inc. (a) | | | 771 | |
| | 45 | | | Incyte Corp., Ltd. (a) | | | 743 | |
| | 35 | | | United Therapeutics Corp. (a) | | | 2,193 | |
| | 21 | | | Vertex Pharmaceuticals, Inc. (a) | | | 732 | |
| | | | | | | | |
| | | | | | | 9,805 | |
| | | | | | | | |
| | | | Health Care Equipment & Supplies — 1.2% | | | | |
| | 97 | | | Align Technology, Inc. (a) | | | 1,899 | |
| | 35 | | | Cooper Cos., Inc. (The) | | | 1,989 | |
| | 12 | | | Hill-Rom Holdings, Inc. | | | 458 | |
| | 16 | | | Hologic, Inc. (a) | | | 304 | |
| | 13 | | | St. Jude Medical, Inc. (a) | | | 547 | |
| | 44 | | | Thoratec Corp. (a) | | | 1,251 | |
| | 5 | | | Zimmer Holdings, Inc. (a) | | | 287 | |
| | | | | | | | |
| | | | | | | 6,735 | |
| | | | | | | | |
| | | | Health Care Providers & Services — 4.2% | | | | |
| | 46 | | | AMERIGROUP Corp. (a) | | | 2,000 | |
| | 57 | | | AmerisourceBergen Corp. | | | 1,929 | |
| | 63 | | | Cardinal Health, Inc. | | | 2,423 | |
| | 60 | | | CIGNA Corp. | | | 2,198 | |
| | 58 | | | Community Health Systems, Inc. (a) | | | 2,178 | |
| | 40 | | | Express Scripts, Inc. (a) | | | 2,136 | |
| | 81 | | | Health Management Associates, Inc., Class A (a) | | | 768 | |
| | 46 | | | Healthsouth Corp. (a) | | | 961 | |
| | 36 | | | Healthspring, Inc. (a) | | | 965 | |
| | 38 | | | Humana, Inc. (a) | | | 2,106 | |
| | 21 | | | Laboratory Corp. of America Holdings (a) | | | 1,823 | |
| | 17 | | | LifePoint Hospitals, Inc. (a) | | | 623 | |
| | 77 | | | Lincare Holdings, Inc. | | | 2,071 | |
| | 4 | | | McKesson Corp. | | | 289 | |
| | 36 | | | Medco Health Solutions, Inc. (a) | | | 2,232 | |
| | | | | | | | |
| | | | | | | 24,702 | |
| | | | | | | | |
| | | | Life Sciences Tools & Services — 0.5% | | | | |
| | 4 | | | Bio-Rad Laboratories, Inc., Class A (a) | | | 450 | |
| | 22 | | | Illumina, Inc. (a) | | | 1,406 | |
| | 54 | | | Parexel International Corp. (a) | | | 1,150 | |
| | | | | | | | |
| | | | | | | 3,006 | |
| | | | | | | | |
SEE NOTES TO FINANCIAL STATEMENTS.
| | | | | | |
| | | |
| 42 | | | | J.P. MORGAN MID CAP/MULTI-CAP FUNDS | | DECEMBER 31, 2010 |
| | | | | | | | |
| SHARES | | | SECURITY DESCRIPTION | | VALUE($) | |
| | | | | | | | |
| Long Positions — Continued | |
| | | | Pharmaceuticals — 2.8% | | | | |
| | 62 | | | Bristol-Myers Squibb Co. | | | 1,652 | |
| | 58 | | | Eli Lilly & Co. | | | 2,023 | |
| | 61 | | | Endo Pharmaceuticals Holdings, Inc. (a) | | | 2,196 | |
| | 67 | | | Forest Laboratories, Inc. (a) | | | 2,138 | |
| | 100 | | | Impax Laboratories, Inc. (a) | | | 2,015 | |
| | 55 | | | Medicis Pharmaceutical Corp., Class A | | | 1,486 | |
| | 90 | | | Nektar Therapeutics (a) | | | 1,161 | |
| | 22 | | | Par Pharmaceutical Cos., Inc. (a) | | | 847 | |
| | 67 | | | ViroPharma, Inc. (a) | | | 1,168 | |
| | 77 | | | Warner Chilcott plc, (Ireland), Class A | | | 1,744 | |
| | | | | | | | |
| | | | | | | 16,430 | |
| | | | | | | | |
| | | | Total Health Care | | | 60,678 | |
| | | | | | | | |
| | | | Industrials — 10.6% | | | | |
| | | | Aerospace & Defense — 1.5% | | | | |
| | 6 | | | Esterline Technologies Corp. (a) | | | 412 | |
| | 26 | | | General Dynamics Corp. | | | 1,810 | |
| | 10 | | | Honeywell International, Inc. | | | 532 | |
| | 14 | | | L-3 Communications Holdings, Inc. | | | 1,013 | |
| | 12 | | | Lockheed Martin Corp. | | | 846 | |
| | 33 | | | Northrop Grumman Corp. | | | 2,157 | |
| | 37 | | | Raytheon Co. | | | 1,697 | |
| | | | | | | | |
| | | | | | | 8,467 | |
| | | | | | | | |
| | | | Air Freight & Logistics — 0.7% | | | | |
| | 39 | | | Atlas Air Worldwide Holdings, Inc. (a) | | | 2,198 | |
| | 24 | | | United Parcel Service, Inc., Class B | | | 1,767 | |
| | | | | | | | |
| | | | | | | 3,965 | |
| | | | | | | | |
| | | | Airlines — 0.8% | | | | |
| | 45 | | | Delta Air Lines, Inc. (a) | | | 572 | |
| | 179 | | | U.S. Airways Group, Inc. (a) | | | 1,787 | |
| | 85 | | | United Continental Holdings, Inc. (a) | | | 2,020 | |
| | | | | | | | |
| | | | | | | 4,379 | |
| | | | | | | | |
| | | | Commercial Services & Supplies — 0.4% | | | | |
| | 23 | | | Clean Harbors, Inc. (a) | | | 1,926 | |
| | 36 | | | R.R. Donnelley & Sons Co. | | | 635 | |
| | | | | | | | |
| | | | | | | 2,561 | |
| | | | | | | | |
| | | | Construction & Engineering — 1.0% | | | | |
| | 70 | | | KBR, Inc. | | | 2,122 | |
| | 56 | | | MasTec, Inc. (a) | | | 817 | |
| | 26 | | | Shaw Group, Inc. (The) (a) | | | 874 | |
| | 42 | | | URS Corp. (a) | | | 1,750 | |
| | | | | | | | |
| | | | | | | 5,563 | |
| | | | | | | | |
| | | | | | | | |
| SHARES | | | SECURITY DESCRIPTION | | VALUE($) | |
| | | | | | | | |
| | | | | | | | |
| | | | Electrical Equipment — 0.7% | | | | |
| | 19 | | | AMETEK, Inc. | | | 732 | |
| | 88 | | | GrafTech International Ltd. (a) | | | 1,754 | |
| | 37 | | | Thomas & Betts Corp. (a) | | | 1,769 | |
| | | | | | | | |
| | | | | | | 4,255 | |
| | | | | | | | |
| | | | Industrial Conglomerates — 0.7% | | | | |
| | 115 | | | General Electric Co. | | | 2,096 | |
| | 81 | | | Textron, Inc. | | | 1,924 | |
| | | | | | | | |
| | | | | | | 4,020 | |
| | | | | | | | |
| | | | Machinery — 3.6% | | | | |
| | 31 | | | AGCO Corp. (a) | | | 1,564 | |
| | 59 | | | ArvinMeritor, Inc. (a) | | | 1,210 | |
| | 22 | | | Caterpillar, Inc. | | | 2,020 | |
| | 13 | | | CNH Global N.V., (Netherlands) (a) | | | 624 | |
| | 16 | | | Cummins, Inc. | | | 1,728 | |
| | 19 | | | Deere & Co. | | | 1,551 | |
| | 16 | | | Dover Corp. | | | 919 | |
| | 6 | | | Eaton Corp. | | | 562 | |
| | 54 | | | Kennametal, Inc. | | | 2,114 | |
| | 35 | | | Navistar International Corp. (a) | | | 2,031 | |
| | 68 | | | Oshkosh Corp. (a) | | | 2,387 | |
| | 22 | | | Parker Hannifin Corp. | | | 1,890 | |
| | 44 | | | Timken Co. | | | 2,119 | |
| | | | | | | | |
| | | | | | | 20,719 | |
| | | | | | | | |
| | | | Marine — 0.3% | | | | |
| | 50 | | | Alexander & Baldwin, Inc. | | | 1,994 | |
| | | | | | | | |
| | | | Road & Rail — 0.3% | | | | |
| | 32 | | | Norfolk Southern Corp. | | | 2,015 | |
| | | | | | | | |
| | | | Trading Companies & Distributors — 0.6% | | | | |
| | 57 | | | Applied Industrial Technologies, Inc. | | | 1,836 | |
| | 68 | | | United Rentals, Inc. (a) | | | 1,552 | |
| | | | | | | | |
| | | | | | | 3,388 | |
| | | | | | | | |
| | | | Total Industrials | | | 61,326 | |
| | | | | | | | |
| | | | Information Technology — 15.8% | | | | |
| | | | Communications Equipment — 3.2% | | | | |
| | 15 | | | Acme Packet, Inc. (a) | | | 812 | |
| | 83 | | | Arris Group, Inc. (a) | | | 932 | |
| | 14 | | | F5 Networks, Inc. (a) | | | 1,841 | |
| | 43 | | | Harris Corp. | | | 1,969 | |
| | 65 | | | InterDigital, Inc. (a) | | | 2,707 | |
| | 143 | | | JDS Uniphase Corp. (a) | | | 2,074 | |
| | 246 | | | Motorola, Inc. (a) | | | 2,231 | |
| | 60 | | | Plantronics, Inc. | | | 2,242 | |
SEE NOTES TO FINANCIAL STATEMENTS.
| | | | | | | | |
| | | |
| DECEMBER 31, 2010 | | J.P. MORGAN MID CAP/MULTI-CAP FUNDS | | | | | 43 | |
JPMorgan Multi-Cap Market Neutral Fund
SCHEDULE OF PORTFOLIO INVESTMENTS
AS OF DECEMBER 31, 2010 (Unaudited) (continued)
(Amounts in thousands)
| | | | | | | | |
| SHARES | | | SECURITY DESCRIPTION | | VALUE($) | |
| | | | | | | | |
| Long Positions — Continued | |
| | | | Communications Equipment — Continued | | | | |
| | 58 | | | Riverbed Technology, Inc. (a) | | | 2,028 | |
| | 244 | | | Tellabs, Inc. | | | 1,658 | |
| | | | | | | | |
| | | | | | | 18,494 | |
| | | | | | | | |
| | | | Computers & Peripherals — 1.1% | | | | |
| | 102 | | | Dell, Inc. (a) | | | 1,380 | |
| | 37 | | | Diebold, Inc. | | | 1,192 | |
| | 56 | | | Lexmark International, Inc., Class A (a) | | | 1,953 | |
| | 41 | | | SanDisk Corp. (a) | | | 2,058 | |
| | | | | | | | |
| | | | | | | 6,583 | |
| | | | | | | | |
| | | | Electronic Equipment, Instruments & Components — 2.4% | |
| | 35 | | | Anixter International, Inc. | | | 2,092 | |
| | 62 | | | Arrow Electronics, Inc. (a) | | | 2,123 | |
| | 58 | | | Avnet, Inc. (a) | | | 1,901 | |
| | 18 | | | Corning, Inc. | | | 339 | |
| | 27 | | | Itron, Inc. (a) | | | 1,517 | |
| | 142 | | | Power-One, Inc. (a) | | | 1,448 | |
| | 11 | | | SYNNEX Corp. (a) | | | 354 | |
| | 25 | | | Tech Data Corp. (a) | | | 1,113 | |
| | 24 | | | Tyco Electronics Ltd., (Switzerland) | | | 853 | |
| | 145 | | | Vishay Intertechnology, Inc. (a) | | | 2,129 | |
| | | | | | | | |
| | | | | | | 13,869 | |
| | | | | | | | |
| | | | Internet Software & Services — 0.9% | | | | |
| | 11 | | | GSI Commerce, Inc. (a) | | | 254 | |
| | 67 | | | IAC/InterActiveCorp. (a) | | | 1,912 | |
| | 19 | | | Sohu.com, Inc., (China) (a) | | | 1,230 | |
| | 58 | | | VeriSign, Inc. | | | 1,899 | |
| | | | | | | | |
| | | | | | | 5,295 | |
| | | | | | | | |
| | | | IT Services — 2.3% | | | | |
| | 44 | | | Accenture plc, (Ireland), Class A | | | 2,149 | |
| | 35 | | | Alliance Data Systems Corp. (a) | | | 2,456 | |
| | 34 | | | Amdocs Ltd., (United Kingdom) (a) | | | 948 | |
| | 88 | | | Broadridge Financial Solutions, Inc. | | | 1,940 | |
| | 28 | | | CACI International, Inc., Class A (a) | | | 1,493 | |
| | 18 | | | Computer Sciences Corp. | | | 913 | |
| | 38 | | | iGate Corp. | | | 745 | |
| | 25 | | | Lender Processing Services, Inc. | | | 742 | |
| | 52 | | | VeriFone Systems, Inc. (a) | | | 1,997 | |
| | | | | | | | |
| | | | | | | 13,383 | |
| | | | | | | | |
| | | | Semiconductors & Semiconductor Equipment — 4.1% | |
| | 262 | | | Advanced Micro Devices, Inc. (a) | | | 2,142 | |
| | 5 | | | Altera Corp. | | | 182 | |
| | 87 | | | Applied Materials, Inc. | | | 1,226 | |
| | 104 | | | Fairchild Semiconductor International, Inc. (a) | | | 1,624 | |
| | 161 | | | GT Solar International, Inc. (a) | | | 1,467 | |
| | | | | | | | |
| SHARES | | | SECURITY DESCRIPTION | | VALUE($) | |
| | | | | | | | |
| | | | | | | | |
| | | | Semiconductors & Semiconductor Equipment — Continued | |
| | 56 | | | KLA-Tencor Corp. | | | 2,177 | |
| | 39 | | | Lam Research Corp. (a) | | | 2,012 | |
| | 264 | | | Micron Technology, Inc. (a) | | | 2,121 | |
| | 134 | | | National Semiconductor Corp. | | | 1,845 | |
| | 68 | | | Novellus Systems, Inc. (a) | | | 2,194 | |
| | 96 | | | ON Semiconductor Corp. (a) | | | 952 | |
| | 216 | | | RF Micro Devices, Inc. (a) | | | 1,585 | |
| | 168 | | | Teradyne, Inc. (a) | | | 2,355 | |
| | 51 | | | Veeco Instruments, Inc. (a) | | | 2,202 | |
| | | | | | | | |
| | | | | | | 24,084 | |
| | | | | | | | |
| | | | Software — 1.8% | | | | |
| | 155 | | | Activision Blizzard, Inc. | | | 1,932 | |
| | 34 | | | BMC Software, Inc. (a) | | | 1,595 | |
| | 40 | | | CA, Inc. | | | 975 | |
| | 45 | | | Cadence Design Systems, Inc. (a) | | | 374 | |
| | 83 | | | Microsoft Corp. | | | 2,308 | |
| | 69 | | | Oracle Corp. | | | 2,153 | |
| | 17 | | | Quest Software, Inc. (a) | | | 485 | |
| | 8 | | | Rovi Corp. (a) | | | 471 | |
| | | | | | | | |
| | | | | | | 10,293 | |
| | | | | | | | |
| | | | Total Information Technology | | | 92,001 | |
| | | | | | | | |
| | | | Materials — 7.4% | | | | |
| | | | Chemicals — 3.9% | | | | |
| | 38 | | | Albemarle Corp. | | | 2,114 | |
| | 46 | | | Cabot Corp. | | | 1,722 | |
| | 44 | | | Celanese Corp., Class A | | | 1,822 | |
| | 40 | | | Cytec Industries, Inc. | | | 2,106 | |
| | 41 | | | E.l. du Pont de Nemours & Co. | | | 2,023 | |
| | 30 | | | Eastman Chemical Co. | | | 2,492 | |
| | 82 | | | Ferro Corp. (a) | | | 1,199 | |
| | 21 | | | Lubrizol Corp. | | | 2,202 | |
| | 35 | | | Nalco Holding Co. | | | 1,125 | |
| | 25 | | | OM Group, Inc. (a) | | | 953 | |
| | 75 | | | PolyOne Corp. (a) | | | 936 | |
| | 59 | | | Rockwood Holdings, Inc. (a) | | | 2,321 | |
| | 82 | | | Solutia, Inc. (a) | | | 1,886 | |
| | | | | | | | |
| | | | | | | 22,901 | |
| | | | | | | | |
| | | | Containers & Packaging — 0.8% | | | | |
| | 18 | | | Ball Corp. | | | 1,227 | |
| | 9 | | | Crown Holdings, Inc. (a) | | | 309 | |
| | 38 | | | Rock-Tenn Co., Class A | | | 2,047 | |
| | 36 | | | Sealed Air Corp. | | | 918 | |
| | | | | | | | |
| | | | | | | 4,501 | |
| | | | | | | | |
SEE NOTES TO FINANCIAL STATEMENTS.
| | | | | | |
| | | |
| 44 | | | | J.P. MORGAN MID CAP/MULTI-CAP FUNDS | | DECEMBER 31, 2010 |
| | | | | | | | |
| SHARES | | | SECURITY DESCRIPTION | | VALUE($) | |
| | | | | | | | |
| Long Positions — Continued | |
| | | | Metals & Mining — 2.3% | | | | |
| | 43 | | | Alcoa, Inc. | | | 663 | |
| | 37 | | | Cliffs Natural Resources, Inc. | | | 2,860 | |
| | 24 | | | Freeport-McMoRan Copper & Gold, Inc. | | | 2,835 | |
| | 11 | | | Newmont Mining Corp. | | | 659 | |
| | 5 | | | Reliance Steel & Aluminum Co. | | | 265 | |
| | 98 | | | Thompson Creek Metals Co., Inc., (Canada) (a) | | | 1,443 | |
| | 89 | | | Titanium Metals Corp. (a) | | | 1,532 | |
| | 21 | | | Walter Energy, Inc. | | | 2,717 | |
| | 23 | | | Worthington Industries, Inc. | | | 417 | |
| | | | | | | | |
| | | | | | | 13,391 | |
| | | | | | | | |
| | | | Paper & Forest Products — 0.4% | | | | |
| | 29 | | | Domtar Corp., (Canada) | | | 2,235 | |
| | | | | | | | |
| | | | Total Materials | | | 43,028 | |
| | | | | | | | |
| | | | Telecommunication Services — 0.4% | |
| | | | Diversified Telecommunication Services — 0.4% | |
| | 20 | | | AT&T, Inc. | | | 576 | |
| | 54 | | | Verizon Communications, Inc. | | | 1,943 | |
| | | | | | | | |
| | | | Total Telecommunication Services | | | 2,519 | |
| | | | | | | | |
| | | | Utilities — 5.6% | | | | |
| | | | Electric Utilities — 2.4% | | | | |
| | 27 | | | Cleco Corp. | | | 835 | |
| | 80 | | | DPL, Inc. | | | 2,068 | |
| | 87 | | | Duke Energy Corp. | | | 1,550 | |
| | 5 | | | Edison International | | | 192 | |
| | 32 | | | El Paso Electric Co. (a) | | | 872 | |
| | 27 | | | Entergy Corp. | | | 1,939 | |
| | 32 | | | Exelon Corp. | | | 1,316 | |
| | 33 | | | Great Plains Energy, Inc. | | | 640 | |
| | 14 | | | ITC Holdings Corp. | | | 873 | |
| | 128 | | | PNM Resources, Inc. | | | 1,671 | |
| | 80 | | | Portland General Electric Co. | | | 1,730 | |
| | 11 | | | UniSource Energy Corp. | | | 389 | |
| | | | | | | | |
| | | | | | | 14,075 | |
| | | | | | | | |
| | | | Gas Utilities — 1.3% | | | | |
| | 41 | | | Atmos Energy Corp. | | | 1,266 | |
| | 27 | | | Oneok, Inc. | | | 1,500 | |
| | 111 | | | Questar Corp. | | | 1,937 | |
| | 14 | | | South Jersey Industries, Inc. | | | 729 | |
| | 24 | | | Southwest Gas Corp. | | | 891 | |
| | 44 | | | UGI Corp. | | | 1,382 | |
| | | | | | | | |
| | | | | | | 7,705 | |
| | | | | | | | |
| | | | | | | | |
| SHARES | | | SECURITY DESCRIPTION | | VALUE($) | |
| | | | | | | | |
| | | | | | | | |
| | | | Independent Power Producers & Energy Traders — 0.9% | |
| | 77 | | | AES Corp. (The) (a) | | | 940 | |
| | 66 | | | Constellation Energy Group, Inc. | | | 2,029 | |
| | 100 | | | NRG Energy, Inc. (a) | | | 1,952 | |
| | | | | | | | |
| | | | | | | 4,921 | |
| | | | | | | | |
| | | | Multi-Utilities — 0.7% | | | | |
| | 67 | | | Ameren Corp. | | | 1,902 | |
| | 107 | | | CMS Energy Corp. | | | 1,998 | |
| | 21 | | | NiSource, Inc. | | | 366 | |
| | | | | | | | |
| | | | | | | 4,266 | |
| | | | | | | | |
| | | | Water Utilities — 0.3% | | | | |
| | 55 | | | American Water Works Co., Inc. | | | 1,385 | |
| | | | | | | | |
| | | | Total Utilities | | | 32,352 | |
| | | | | | | | |
| | | | Total Common Stocks
(Cost $427,535) | | | 534,499 | |
| | | | | | | | |
| | | | Short-Term Investment — 7.5% | | | | |
| | | | Investment Companies — 7.5% | | | | |
| | 43,490 | | | JPMorgan Liquid Assets Money Market Fund, Institutional Class Shares, 0.110% (b) (l)
(Cost $43,490) | | | 43,490 | |
| | | | | | | | |
| | | | Total Investments — 99.6%
(Cost $471,025) | | | 577,989 | |
| | | | Other Assets in Excess of
Liabilities — 0.4% | | | 2,425 | |
| | | | | | | | |
| | | | NET ASSETS — 100.0% | | $ | 580,414 | |
| | | | | | | | |
| Short Positions — 93.3% | |
| | | | Common Stocks — 93.3% | | | | |
| | | | Consumer Discretionary — 9.4% | | | | |
| | | | Auto Components — 0.2% | | | | |
| | 34 | | | Gentex Corp. | | | 1,005 | |
| | | | | | | | |
| | | | Distributors — 0.0% (g) | | | | |
| | 8 | | | LKQ Corp. (a) | | | 189 | |
| | | | | | | | |
| | | | Diversified Consumer Services — 0.2% | |
| | 85 | | | Regis Corp. | | | 1,411 | |
| | | | | | | | |
| | | | Hotels, Restaurants & Leisure — 2.0% | |
| | 9 | | | Bally Technologies, Inc. (a) | | | 382 | |
| | 3 | | | Chipotle Mexican Grill, Inc. (a) | | | 706 | |
| | 2 | | | Choice Hotels International, Inc. | | | 73 | |
| | 54 | | | Gaylord Entertainment Co. (a) | | | 1,943 | |
| | 60 | | | Jack in the Box, Inc. (a) | | | 1,278 | |
| | 146 | | | MGM Resorts International (a) | | | 2,170 | |
| | 32 | | | Orient-Express Hotels Ltd., (Bermuda), Class A (a) | | | 415 | |
| | 23 | | | Vail Resorts, Inc. (a) | | | 1,180 | |
SEE NOTES TO FINANCIAL STATEMENTS.
| | | | | | | | |
| | | |
| DECEMBER 31, 2010 | | J.P. MORGAN MID CAP/MULTI-CAP FUNDS | | | | | 45 | |
JPMorgan Multi-Cap Market Neutral Fund
SCHEDULE OF PORTFOLIO INVESTMENTS
AS OF DECEMBER 31, 2010 (Unaudited) (continued)
(Amounts in thousands)
| | | | | | | | |
| SHARES | | | SECURITY DESCRIPTION | | VALUE($) | |
| | | | | | | | |
| Short Positions — Continued | |
| | | | Hotels, Restaurants & Leisure — Continued | |
| | 336 | | | Wendy’s/Arby’s Group, Inc., Class A | | | 1,551 | |
| | 44 | | | WMS Industries, Inc. (a) | | | 1,994 | |
| | 4 | | | Yum! Brands, Inc. | | | 176 | |
| | | | | | | | |
| | | | | | | 11,868 | |
| | | | | | | | |
| | | | Household Durables — 1.4% | | | | |
| | 96 | | | Lennar Corp., Class A | | | 1,801 | |
| | 71 | | | MDC Holdings, Inc. | | | 2,044 | |
| | 2 | | | NVR, Inc. (a) | | | 1,652 | |
| | 162 | | | Pulte Group, Inc. (a) | | | 1,218 | |
| | 25 | | | Stanley Black & Decker, Inc. | | | 1,655 | |
| | | | | | | | |
| | | | | | | 8,370 | |
| | | | | | | | |
| | | | Internet & Catalog Retail — 0.1% | | | | |
| | 13 | | | HSN, Inc. (a) | | | 398 | |
| | | | | | | | |
| | | | Media — 1.6% | | | | |
| | 65 | | | DreamWorks Animation SKG, Inc., Class A (a) | | | 1,909 | |
| | 72 | | | Live Nation Entertainment, Inc. (a) | | | 821 | |
| | 91 | | | New York Times Co. (The), Class A (a) | | | 888 | |
| | 23 | | | Scripps Networks Interactive, Inc., Class A | | | 1,188 | |
| | 45 | | | Thomson Reuters Corp. | | | 1,687 | |
| | 40 | | | Viacom, Inc., Class B | | | 1,601 | |
| | 34 | | | Walt Disney Co. (The) | | | 1,275 | |
| | | | | | | | |
| | | | | | | 9,369 | |
| | | | | | | | |
| | | | Multiline Retail — 0.6% | | | | |
| | 81 | | | 99 Cents Only Stores (a) | | | 1,287 | |
| | 54 | | | J.C. Penney Co., Inc. | | | 1,741 | |
| | 7 | | | Kohl’s Corp. (a) | | | 388 | |
| | | | | | | | |
| | | | | | | 3,416 | |
| | | | | | | | |
| | | | Specialty Retail — 2.5% | | | | |
| | 81 | | | Aaron’s, Inc. | | | 1,649 | |
| | 3 | | | Abercrombie & Fitch Co., Class A | | | 200 | |
| | 67 | | | CarMax, Inc. (a) | | | 2,144 | |
| | 49 | | | Chico’s FAS, Inc. | | | 594 | |
| | 20 | | | Children’s Place Retail Stores, Inc. (The) (a) | | | 1,005 | |
| | 27 | | | Dick’s Sporting Goods, Inc. (a) | | | 1,004 | |
| | 22 | | | Home Depot, Inc. | | | 769 | |
| | 70 | | | Lowe’s Cos., Inc. | | | 1,758 | |
| | 293 | | | Office Depot, Inc. (a) | | | 1,585 | |
| | 83 | | | Penske Automotive Group, Inc. (a) | | | 1,439 | |
| | 92 | | | Staples, Inc. | | | 2,084 | |
| | | | | | | | |
| | | | | | | 14,231 | |
| | | | | | | | |
| | | | Textiles, Apparel & Luxury Goods — 0.8% | |
| | 19 | | | Columbia Sportswear Co. | | | 1,132 | |
| | 24 | | | Jones Group, Inc. (The) | | | 379 | |
| | | | | | | | |
| SHARES | | | SECURITY DESCRIPTION | | VALUE($) | |
| | | | | | | | |
| | | | | | | | |
| | | | Textiles, Apparel & Luxury Goods — Continued | |
| | 30 | | | Phillips-Van Heusen Corp. | | | 1,893 | |
| | 19 | | | Under Armour, Inc., Class A (a) | | | 1,064 | |
| | | | | | | | |
| | | | | | | 4,468 | |
| | | | | | | | |
| | | | Total Consumer Discretionary | | | 54,725 | |
| | | | | | | | |
| | | | Consumer Staples — 6.3% | | | | |
| | | | Beverages — 0.7% | | | | |
| | 26 | | | Brown-Forman Corp., Class B | | | 1,823 | |
| | 55 | | | Central European Distribution Corp. (a) | | | 1,254 | |
| | 12 | | | Coca-Cola Co. (The) | | | 799 | |
| | | | | | | | |
| | | | | | | 3,876 | |
| | | | | | | | |
| | | | Food & Staples Retailing — 1.9% | | | | |
| | 48 | | | BJ’s Wholesale Club, Inc. (a) | | | 2,278 | |
| | 18 | | | Costco Wholesale Corp. | | | 1,331 | |
| | 64 | | | CVS Caremark Corp. | | | 2,226 | |
| | 170 | | | SUPERVALU, Inc. | | | 1,638 | |
| | 36 | | | United Natural Foods, Inc. (a) | | | 1,339 | |
| | 29 | | | Walgreen Co. | | | 1,137 | |
| | 26 | | | Whole Foods Market, Inc. (a) | | | 1,296 | |
| | | | | | | | |
| | | | | | | 11,245 | |
| | | | | | | | |
| | | | Food Products — 2.7% | | | | |
| | 13 | | | Archer-Daniels-Midland Co. | | | 377 | |
| | 37 | | | Bunge Ltd. | | | 2,445 | |
| | 22 | | | Diamond Foods, Inc. | | | 1,191 | |
| | 39 | | | Flowers Foods, Inc. | | | 1,054 | |
| | 58 | | | Green Mountain Coffee Roasters, Inc. (a) | | | 1,909 | |
| | 27 | | | Hain Celestial Group, Inc. (The) (a) | | | 736 | |
| | 30 | | | Kellogg Co. | | | 1,510 | |
| | 67 | | | Kraft Foods, Inc., Class A | | | 2,121 | |
| | 26 | | | McCormick & Co., Inc. (Non-Voting) | | | 1,195 | |
| | 37 | | | Mead Johnson Nutrition Co. | | | 2,277 | |
| | 6 | | | Ralcorp Holdings, Inc. (a) | | | 397 | |
| | 17 | | | Sanderson Farms, Inc. | | | 678 | |
| | | | | | | | |
| | | | | | | 15,890 | |
| | | | | | | | |
| | | | Household Products — 0.6% | | | | |
| | 8 | | | Church & Dwight Co., Inc. | | | 521 | |
| | 30 | | | Clorox Co. | | | 1,906 | |
| | 18 | | | Kimberly-Clark Corp. | | | 1,111 | |
| | | | | | | | |
| | | | | | | 3,538 | |
| | | | | | | | |
| | | | Personal Products — 0.2% | | | | |
| | 32 | | | Avon Products, Inc. | | | 922 | |
| | | | | | | | |
| | | | Tobacco — 0.2% | | | | |
| | 23 | | | Universal Corp. | | | 927 | |
| | | | | | | | |
| | | | Total Consumer Staples | | | 36,398 | |
| | | | | | | | |
SEE NOTES TO FINANCIAL STATEMENTS
| | | | | | |
| | | |
| 46 | | | | J.P. MORGAN MID CAP/MULTI-CAP FUNDS | | DECEMBER 31, 2010 |
| | | | | | | | |
| SHARES | | | SECURITY DESCRIPTION | | VALUE($) | |
| | | | | | | | |
| Short Positions — Continued | |
| | | | Energy — 10.4% | | | | |
| | | | Energy Equipment & Services — 2.8% | | | | |
| | 15 | | | Baker Hughes, Inc. | | | 839 | |
| | 12 | | | Cameron International Corp. (a) | | | 598 | |
| | 2 | | | CARBO Ceramics, Inc. | | | 192 | |
| | 72 | | | Exterran Holdings, Inc. (a) | | | 1,713 | |
| | 16 | | | FMC Technologies, Inc. (a) | | | 1,389 | |
| | 139 | | | ION Geophysical Corp. (a) | | | 1,175 | |
| | 182 | | | Key Energy Services, Inc. (a) | | | 2,365 | |
| | 64 | | | Pride International, Inc. (a) | | | 2,121 | |
| | 26 | | | Schlumberger Ltd. | | | 2,179 | |
| | 40 | | | Tidewater, Inc. | | | 2,161 | |
| | 70 | | | Weatherford International Ltd., (Switzerland) (a) | | | 1,599 | |
| | | | | | | | |
| | | | | | | 16,331 | |
| | | | | | | | |
| | | | Oil, Gas & Consumable Fuels — 7.6% | | | | |
| | 8 | | | Alpha Natural Resources, Inc. (a) | | | 504 | |
| | 58 | | | Cabot Oil & Gas Corp. | | | 2,189 | |
| | 86 | | | Cobalt International Energy, Inc. (a) | | | 1,054 | |
| | 82 | | | Comstock Resources, Inc. (a) | | | 2,019 | |
| | 52 | | | Consol Energy, Inc. | | | 2,522 | |
| | 34 | | | Continental Resources, Inc. (a) | | | 2,010 | |
| | 85 | | | Denbury Resources, Inc. (a) | | | 1,624 | |
| | 21 | | | EOG Resources, Inc. | | | 1,903 | |
| | 57 | | | EQT Corp. | | | 2,551 | |
| | 13 | | | Exxon Mobil Corp. | | | 959 | |
| | 5 | | | Hess Corp. | | | 378 | |
| | 42 | | | Massey Energy Co. | | | 2,233 | |
| | 111 | | | McMoRan Exploration Co. (a) | | | 1,900 | |
| | 25 | | | Murphy Oil Corp. | | | 1,877 | |
| | 30 | | | Nordic American Tanker Shipping, (Bermuda) | | | 771 | |
| | 57 | | | Overseas Shipholding Group, Inc. | | | 2,011 | |
| | 83 | | | Patriot Coal Corp. (a) | | | 1,610 | |
| | 65 | | | Plains Exploration & Production Co. (a) | | | 2,081 | |
| | 47 | | | Range Resources Corp. | | | 2,098 | |
| | 395 | | | SandRidge Energy, Inc. (a) | | | 2,889 | |
| | 43 | | | Southwestern Energy Co. (a) | | | 1,612 | |
| | 98 | | | Spectra Energy Corp. | | | 2,457 | |
| | 68 | | | Teekay Corp., (Canada) | | | 2,235 | |
| | 93 | | | Tesoro Corp. (a) | | | 1,729 | |
| | 31 | | | Williams Cos., Inc. (The) | | | 777 | |
| | | | | | | | |
| | | | | | | 43,993 | |
| | | | | | | | |
| | | | Total Energy | | | 60,324 | |
| | | | | | | | |
| | | | | | | | |
| SHARES | | | SECURITY DESCRIPTION | | VALUE ($) | |
| | | | | | | | |
| | |
| | | | Financials — 11.9% | | | | |
| | | | Capital Markets — 3.9% | | | | |
| | 105 | | | Apollo Investment Corp. | | | 1,163 | |
| | 124 | | | Charles Schwab Corp. (The) | | | 2,127 | |
| | 118 | | | E*Trade Financial Corp. (a) | | | 1,882 | |
| | 28 | | | Greenhill & Co., Inc. | | | 2,305 | |
| | 11 | | | Invesco Ltd. | | | 270 | |
| | 205 | | | Janus Capital Group, Inc. | | | 2,662 | |
| | 81 | | | Jefferies Group, Inc. | | | 2,150 | |
| | 103 | | | Knight Capital Group, Inc., Class A (a) | | | 1,424 | |
| | 179 | | | MF Global Holdings Ltd. (a) | | | 1,493 | |
| | 36 | | | Morgan Stanley | | | 978 | |
| | 80 | | | SEI Investments Co. | | | 1,896 | |
| | 39 | | | Stifel Financial Corp. (a) | | | 2,403 | |
| | 95 | | | TD AMERITRADE Holding Corp. | | | 1,803 | |
| | | | | | | | |
| | | | | | | 22,556 | |
| | | | | | | | |
| | | | Commercial Banks — 3.4% | | | | |
| | 139 | | | Associated Banc-Corp. | | | 2,107 | |
| | 110 | | | BancorpSouth, Inc. | | | 1,760 | |
| | 43 | | | Comerica, Inc. | | | 1,798 | |
| | 85 | | | First Horizon National Corp. (a) | | | 1,003 | |
| | 31 | | | Iberiabank Corp. | | | 1,809 | |
| | 338 | | | Marshall & Ilsley Corp. | | | 2,342 | |
| | 3 | | | Popular, Inc. (a) | | | 9 | |
| | 243 | | | Regions Financial Corp. | | | 1,698 | |
| | 12 | | | SunTrust Banks, Inc. | | | 368 | |
| | 86 | | | Susquehanna Bancshares, Inc. | | | 828 | |
| | 895 | | | Synovus Financial Corp. | | | 2,363 | |
| | 135 | | | Umpqua Holdings Corp. | | | 1,641 | |
| | 79 | | | Zions Bancorp | | | 1,907 | |
| | | | | | | | |
| | | | | | | 19,633 | |
| | | | | | | | |
| | | | Diversified Financial Services — 0.5% | | | | |
| | 122 | | | Citigroup, Inc. (a) | | | 579 | |
| | 4 | | | CME Group, Inc. | | | 1,257 | |
| | 22 | | | MSCI, Inc., Class A (a) | | | 860 | |
| | | | | | | | |
| | | | | | | 2,696 | |
| | | | | | | | |
| | | | Insurance — 1.9% | | | | |
| | 35 | | | Alterra Capital Holdings Ltd., (Bermuda) | | | 754 | |
| | 57 | | | Cincinnati Financial Corp. | | | 1,807 | |
| | 44 | | | CNA Financial Corp. (a) | | | 1,187 | |
| | 37 | | | First American Financial Corp. | | | 550 | |
| | 149 | | | Genworth Financial, Inc., Class A (a) | | | 1,953 | |
| | 5 | | | Markel Corp. (a) | | | 1,860 | |
| | 37 | | | Marsh & McLennan Cos., Inc. | | | 1,022 | |
| | 159 | | | Old Republic International Corp. | | | 2,164 | |
| | | | | | | | |
| | | | | | | 11,297 | |
| | | | | | | | |
SEE NOTES TO FINANCIAL STATEMENTS
| | | | | | | | |
| | | |
| DECEMBER 31, 2010 | | J.P. MORGAN MID CAP/MULTI-CAP FUNDS | | | | | 47 | |
JPMorgan Multi-Cap Market Neutral Fund
SCHEDULE OF PORTFOLIO INVESTMENTS
AS OF DECEMBER 31, 2010 (Unaudited) (continued)
(Amounts in thousands)
| | | | | | | | |
| SHARES | | | SECURITY DESCRIPTION | | VALUE($) | |
| | | | | | | | |
| Short Positions — Continued | |
| | | | Real Estate Investment Trusts (REITs) — 0.8% | | | | |
| | 15 | | | BRE Properties, Inc. | | | 643 | |
| | 37 | | | Colonial Properties Trust | | | 663 | |
| | 108 | | | DCT Industrial Trust, Inc. | | | 572 | |
| | 48 | | | Developers Diversified Realty Corp. | | | 673 | |
| | 41 | | | Equity One, Inc. | | | 744 | |
| | 85 | | | Weyerhaeuser Co. | | | 1,616 | |
| | | | | | | | |
| | | | | | | 4,911 | |
| | | | | | | | |
| | | | Thrifts & Mortgage Finance — 1.4% | | | | |
| | 101 | | | Hudson City Bancorp, Inc. | | | 1,289 | |
| | 134 | | | MGIC Investment Corp. (a) | | | 1,366 | |
| | 115 | | | NewAlliance Bancshares, Inc. | | | 1,728 | |
| | 149 | | | People’s United Financial, Inc. | | | 2,085 | |
| | 98 | | | Washington Federal, Inc. | | | 1,666 | |
| | | | | | | | |
| | | | | | | 8,134 | |
| | | | | | | | |
| | | | Total Financials | | | 69,227 | |
| | | | | | | | |
| | | | Health Care — 10.7% | | | | |
| | | | Biotechnology — 1.1% | | | | |
| | 26 | | | Acorda Therapeutics, Inc. (a) | | | 713 | |
| | 11 | | | Alexion Pharmaceuticals, Inc. (a) | | | 899 | |
| | 26 | | | Dendreon Corp. (a) | | | 918 | |
| | 40 | | | Gilead Sciences, Inc. (a) | | | 1,435 | |
| | 37 | | | Myriad Genetics, Inc. (a) | | | 842 | |
| | 6 | | | Onyx Pharmaceuticals, Inc. (a) | | | 204 | |
| | 19 | | | Pharmasset, Inc. (a) | | | 815 | |
| | 20 | | | Theravance, Inc. (a) | | | 508 | |
| | | | | | | | |
| | | | | | | 6,334 | |
| | | | | | | | |
| | | | Health Care Equipment & Supplies — 3.4% | | | | |
| | 65 | | | Alere, Inc. (a) | | | 2,362 | |
| | 7 | | | Becton, Dickinson & Co. | | | 580 | |
| | 169 | | | Boston Scientific Corp. (a) | | | 1,280 | |
| | 60 | | | DENTSPLY International, Inc. | | | 2,036 | |
| | 36 | | | Edwards Lifesciences Corp. (a) | | | 2,895 | |
| | 28 | | | Haemonetics Corp. (a) | | | 1,790 | |
| | 19 | | | IDEXX Laboratories, Inc. (a) | | | 1,333 | |
| | 46 | | | Immucor, Inc. (a) | | | 916 | |
| | 65 | | | Masimo Corp. | | | 1,887 | |
| | 37 | | | Medtronic, Inc. | | | 1,368 | |
| | 38 | | | NxStage Medical, Inc. (a) | | | 952 | |
| | 23 | | | ResMed, Inc. (a) | | | 805 | |
| | 39 | | | West Pharmaceutical Services, Inc. | | | 1,609 | |
| | | | | | | | |
| | | | | | | 19,813 | |
| | | | | | | | |
| | | | Health Care Providers & Services — 3.2% | | | | |
| | 121 | | | Brookdale Senior Living, Inc. (a) | | | 2,597 | |
| | 74 | | | Centene Corp. (a) | | | 1,872 | |
| | | | | | | | |
| SHARES | | | SECURITY DESCRIPTION | | VALUE($) | |
| | | | | | | | |
| | |
| | | | Health Care Providers & Services — Continued | | | | |
| | 52 | | | Coventry Health Care, Inc. (a) | | | 1,368 | |
| | 12 | | | HMS Holdings Corp. (a) | | | 773 | |
| | 16 | | | Mednax, Inc. (a) | | | 1,085 | |
| | 5 | | | Owens & Minor, Inc. | | | 137 | |
| | 17 | | | Patterson Cos., Inc. | | | 535 | |
| | 91 | | | PSS World Medical, Inc. (a) | | | 2,061 | |
| | 208 | | | Tenet Healthcare Corp. (a) | | | 1,394 | |
| | 30 | | | Universal Health Services, Inc., Class B | | | 1,298 | |
| | 76 | | | VCA Antech, Inc. (a) | | | 1,762 | |
| | 71 | | | WellCare Health Plans, Inc. (a) | | | 2,154 | |
| | 26 | | | WellPoint, Inc. (a) | | | 1,478 | |
| | | | | | | | |
| | | | | | | 18,514 | |
| | | | | | | | |
| | | | Health Care Technology — 0.6% | | | | |
| | 77 | | | MedAssets, Inc. (a) | | | 1,562 | |
| | 30 | | | Quality Systems, Inc. | | | 2,063 | |
| | | | | | | | |
| | | | | | | 3,625 | |
| | | | | | | | |
| | | | Life Sciences Tools & Services — 1.0% | | | | |
| | 32 | | | Covance, Inc. (a) | | | 1,654 | |
| | 5 | | | Mettler-Toledo International, Inc., (Switzerland) (a) | | | 797 | |
| | 39 | | | Thermo Fisher Scientific, Inc. (a) | | | 2,133 | |
| | 18 | | | Waters Corp. (a) | | | 1,403 | |
| | | | | | | | |
| | | | | | | 5,987 | |
| | | | | | | | |
| | | | Pharmaceuticals — 1.4% | | | | |
| | 82 | | | Auxilium Pharmaceuticals, Inc. (a) | | | 1,739 | |
| | 32 | | | Hospira, Inc. (a) | | | 1,769 | |
| | 57 | | | Merck & Co., Inc. | | | 2,057 | |
| | 45 | | | Watson Pharmaceuticals, Inc. (a) | | | 2,339 | |
| | | | | | | | |
| | | | | | | 7,904 | |
| | | | | | | | |
| | | | Total Health Care | | | 62,177 | |
| | | | | | | | |
| | | | Industrials — 14.8% | | | | |
| | | | Aerospace & Defense — 1.8% | | | | |
| | 50 | | | DigitalGlobe, Inc. (a) | | | 1,598 | |
| | 24 | | | Goodrich Corp. | | | 2,113 | |
| | 89 | | | Hexcel Corp. (a) | | | 1,615 | |
| | 17 | | | Precision Castparts Corp. | | | 2,388 | |
| | 12 | | | Rockwell Collins, Inc. | | | 696 | |
| | 100 | | | Spirit Aerosystems Holdings, Inc., Class A (a) | | | 2,090 | |
| | | | | | | | |
| | | | | | | 10,500 | |
| | | | | | | | |
| | | | Air Freight & Logistics — 0.4% | | | | |
| | 25 | | | C.H. Robinson Worldwide, Inc. | | | 2,031 | |
| | | | | | | | |
| | | | Airlines — 0.4% | | | | |
| | 288 | | | AMR Corp. (a) | | | 2,243 | |
| | | | | | | | |
SEE NOTES TO FINANCIAL STATEMENTS
| | | | | | |
| | | |
| 48 | | | | J.P. MORGAN MID CAP/MULTI-CAP FUNDS | | DECEMBER 31, 2010 |
| | | | | | | | |
| SHARES | | | SECURITY DESCRIPTION | | VALUE($) | |
| | | | | | | | |
| Short Positions — Continued | |
| | | | Building Products — 1.2% | | | | |
| | 40 | | | Lennox International, Inc. | | | 1,885 | |
| | 69 | | | Masco Corp. | | | 871 | |
| | 55 | | | Owens Corning (a) | | | 1,703 | |
| | 165 | | | USG Corp. (a) | | | 2,770 | |
| | | | | | | | |
| | | | | | | 7,229 | |
| | | | | | | | |
| | | | Commercial Services & Supplies — 2.2% | | | | |
| | 45 | | | Copart, Inc. (a) | | | 1,689 | |
| | 44 | | | Corrections Corp. of America (a) | | | 1,107 | |
| | 53 | | | GEO Group, Inc. (The) (a) | | | 1,319 | |
| | 35 | | | Herman Miller, Inc. | | | 896 | |
| | 25 | | | HNI Corp. | | | 774 | |
| | 66 | | | Republic Services, Inc. | | | 1,957 | |
| | 23 | | | Stericycle, Inc. (a) | | | 1,846 | |
| | 58 | | | Waste Connections, Inc. | | | 1,597 | |
| | 49 | | | Waste Management, Inc. | | | 1,794 | |
| | | | | | | | |
| | | | | | | 12,979 | |
| | | | | | | | |
| | | | Construction & Engineering — 1.7% | | | | |
| | 39 | | | Aecom Technology Corp. (a) | | | 1,102 | |
| | 35 | | | Fluor Corp. | | | 2,348 | |
| | 50 | | | Foster Wheeler AG, (Switzerland) (a) | | | 1,719 | |
| | 53 | | | Jacobs Engineering Group, Inc. (a) | | | 2,411 | |
| | 106 | | | Quanta Services, Inc. (a) | | | 2,102 | |
| | | | | | | | |
| | | | | | | 9,682 | |
| | | | | | | | |
| | | | Electrical Equipment — 1.0% | | | | |
| | 30 | | | Acuity Brands, Inc. | | | 1,724 | |
| | 23 | | | American Superconductor Corp. (a) | | | 656 | |
| | 25 | | | Cooper Industries plc | | | 1,463 | |
| | 22 | | | Polypore International, Inc. (a) | | | 888 | |
| | 6 | | | Regal-Beloit Corp. | | | 380 | |
| | 11 | | | Roper Industries, Inc. | | | 825 | |
| | | | | | | | |
| | | | | | | 5,936 | |
| | | | | | | | |
| | | | Machinery — 3.2% | | | | |
| | 18 | | | Flowserve Corp. | | | 2,161 | |
| | 72 | | | Harsco Corp. | | | 2,050 | |
| | 16 | | | Ingersoll-Rand plc, (Ireland) | | | 773 | |
| | 9 | | | Kaydon Corp. | | | 384 | |
| | 21 | | | Lincoln Electric Holdings, Inc. | | | 1,353 | |
| | 160 | | | Manitowoc Co., Inc. (The) | | | 2,096 | |
| | 16 | | | PACCAR, Inc. | | | 916 | |
| | 82 | | | Terex Corp. (a) | | | 2,536 | |
| | 77 | | | Trinity Industries, Inc. | | | 2,048 | |
| | 23 | | | Valmont Industries, Inc. | | | 2,081 | |
| | 35 | | | Wabtec Corp. | | | 1,863 | |
| | | | | | | | |
| | | | | | | 18,261 | |
| | | | | | | | |
| | | | | | | | |
| SHARES | | | SECURITY DESCRIPTION | | VALUE($) | |
| | | | | | | | |
| | |
| | | | Marine — 0.0% (g) | | | | |
| | 1 | | | Kirby Corp. (a) | | | 25 | |
| | | | | | | | |
| | | | Professional Services — 1.6% | | | | |
| | 22 | | | Dun & Bradstreet Corp. | | | 1,818 | |
| | 42 | | | FTI Consulting, Inc. (a) | | | 1,577 | |
| | 21 | | | Manpower, Inc. | | | 1,297 | |
| | 61 | | | Robert Half International, Inc. | | | 1,852 | |
| | 39 | | | Towers Watson & Co., Class A | | | 2,014 | |
| | 25 | | | Verisk Analytics, Inc., Class A (a) | | | 850 | |
| | | | | | | | |
| | | | | | | 9,408 | |
| | | | | | | | |
| | | | Road & Rail — 0.9% | | | | |
| | 69 | | | Avis Budget Group, Inc. (a) | | | 1,070 | |
| | 166 | | | Hertz Global Holdings, Inc. (a) | | | 2,411 | |
| | 85 | | | Knight Transportation, Inc. | | | 1,618 | |
| | | | | | | | |
| | | | | | | 5,099 | |
| | | | | | | | |
| | | | Trading Companies & Distributors — 0.4% | | | | |
| | 41 | | | Fastenal Co. | | | 2,438 | |
| | | | | | | | |
| | | | Total Industrials | | | 85,831 | |
| | | | | | | | |
| | | | Information Technology — 16.4% | | | | |
| | | | Communications Equipment — 1.8% | | | | |
| | 108 | | | Aruba Networks, Inc. (a) | | | 2,250 | |
| | 389 | | | Brocade Communications Systems, Inc. (a) | | | 2,060 | |
| | 130 | | | Ciena Corp. (a) | | | 2,745 | |
| | 9 | | | Juniper Networks, Inc. (a) | | | 347 | |
| | 25 | | | QUALCOMM, Inc. | | | 1,234 | |
| | 45 | | | ViaSat, Inc. (a) | | | 2,005 | |
| | | | | | | | |
| | | | | | | 10,641 | |
| | | | | | | | |
| | | | Computers & Peripherals — 0.8% | | | | |
| | 1 | | | Apple, Inc. (a) | | | 192 | |
| | 99 | | | EMC Corp. (a) | | | 2,266 | |
| | 3 | | | NetApp, Inc. (a) | | | 170 | |
| | 74 | | | Seagate Technology plc, (Ireland) (a) | | | 1,113 | |
| | 32 | | | Western Digital Corp. (a) | | | 1,078 | |
| | | | | | | | |
| | | | | | | 4,819 | |
| | | | | | | | |
| | | | Electronic Equipment, Instruments & Components — 1.3% | |
| | 15 | | | Amphenol Corp., Class A | | | 779 | |
| | 66 | | | FLIR Systems, Inc. (a) | | | 1,961 | |
| | 83 | | | Ingram Micro, Inc., Class A (a) | | | 1,591 | |
| | 37 | | | L-1 Identity Solutions, Inc. (a) | | | 437 | |
| | 60 | | | Molex, Inc. | | | 1,355 | |
| | 39 | | | Plexus Corp. (a) | | | 1,196 | |
| | | | | | | | |
| | | | | | | 7,319 | |
| | | | | | | | |
SEE NOTES TO FINANCIAL STATEMENTS
| | | | | | | | |
| | | |
| DECEMBER 31, 2010 | | J.P. MORGAN MID CAP/MULTI-CAP FUNDS | | | | | 49 | |
JPMorgan Multi-Cap Market Neutral Fund
SCHEDULE OF PORTFOLIO INVESTMENTS
AS OF DECEMBER 31, 2010 (Unaudited) (continued)
(Amounts in thousands)
| | | | | | | | |
| SHARES | | | SECURITY DESCRIPTION | | VALUE($) | |
| | | | | | | | |
| Short Positions — Continued | |
| | | | Internet Software & Services — 1.9% | | | | |
| | 29 | | | Digital River, Inc. (a) | | | 1,001 | |
| | 79 | | | eBay, Inc. (a) | | | 2,189 | |
| | 22 | | | Equinix, Inc. (a) | | | 1,792 | |
| | 41 | | | SAVVIS, Inc. (a) | | | 1,050 | |
| | 37 | | | VistaPrint N.V., (Netherlands) (a) | | | 1,690 | |
| | 27 | | | WebMD Health Corp. (a) | | | 1,393 | |
| | 113 | | | Yahoo!, Inc. (a) | | | 1,880 | |
| | | | | | | | |
| | | | | | | 10,995 | |
| | | | | | | | |
| | | | IT Services — 2.4% | | | | |
| | 39 | | | Automatic Data Processing, Inc. | | | 1,825 | |
| | 88 | | | CoreLogic, Inc. | | | 1,624 | |
| | 74 | | | Fidelity National Information Services, Inc. | | | 2,030 | |
| | 14 | | | Gartner, Inc. (a) | | | 464 | |
| | 39 | | | Global Payments, Inc. | | | 1,815 | |
| | 11 | | | International Business Machines Corp. | | | 1,573 | |
| | 79 | | | Paychex, Inc. | | | 2,451 | |
| | 15 | | | Sapient Corp. | | | 185 | |
| | 71 | | | Total System Services, Inc. | | | 1,092 | |
| | 2 | | | Visa, Inc., Class A | | | 169 | |
| | 14 | | | Wright Express Corp. (a) | | | 638 | |
| | | | | | | | |
| | | | | | | 13,866 | |
| | | | | | | | |
| | | | Semiconductors & Semiconductor Equipment — 4.0% | |
| | 27 | | | Atheros Communications, Inc. (a) | | | 954 | |
| | 36 | | | Atmel Corp. (a) | | | 446 | |
| | 40 | | | Broadcom Corp., Class A | | | 1,735 | |
| | 28 | | | Cavium Networks, Inc. (a) | | | 1,047 | |
| | 31 | | | Cree, Inc. (a) | | | 2,055 | |
| | 18 | | | Hittite Microwave Corp. (a) | | | 1,086 | |
| | 59 | | | Linear Technology Corp. | | | 2,027 | |
| | 180 | | | MEMC Electronic Materials, Inc. (a) | | | 2,025 | |
| | 43 | | | NetLogic Microsystems, Inc. (a) | | | 1,362 | |
| | 138 | | | NVIDIA Corp. (a) | | | 2,128 | |
| | 193 | | | PMC-Sierra, Inc. (a) | | | 1,662 | |
| | 27 | | | Power Integrations, Inc. | | | 1,066 | |
| | 61 | | | Semtech Corp. (a) | | | 1,389 | |
| | 37 | | | Silicon Laboratories, Inc. (a) | | | 1,697 | |
| | 81 | | | Skyworks Solutions, Inc. (a) | | | 2,311 | |
| | | | | | | | |
| | | | | | | 22,990 | |
| | | | | | | | |
| | | | Software — 4.2% | |
| | 44 | | | Ariba, Inc. (a) | | | 1,033 | |
| | 79 | | | AsiaInfo-Linkage, Inc., (China) (a) | | | 1,309 | |
| | 42 | | | Blackboard, Inc. (a) | | | 1,723 | |
| | 189 | | | Compuware Corp. (a) | | | 2,204 | |
| | 45 | | | Concur Technologies, Inc. (a) | | | 2,321 | |
| | | | | | | | |
| SHARES | | | SECURITY DESCRIPTION | | VALUE($) | |
| | | | | | | | |
| | |
| | | | Software — Continued | |
| | 24 | | | Fortinet, Inc. (a) | | | 778 | |
| | 46 | | | Informatica Corp. (a) | | | 2,045 | |
| | 65 | | | JDA Software Group, Inc. (a) | | | 1,829 | |
| | 35 | | | NetSuite, Inc. (a) | | | 873 | |
| | 27 | | | Pegasystems, Inc. | | | 973 | |
| | 44 | | | Red Hat, Inc. (a) | | | 2,006 | |
| | 3 | | | Salesforce.com, Inc. (a) | | | 384 | |
| | 93 | | | SolarWinds, Inc. (a) | | | 1,789 | |
| | 72 | | | SuccessFactors, Inc. (a) | | | 2,075 | |
| | 73 | | | Synopsys, Inc. (a) | | | 1,976 | |
| | 18 | | | Taleo Corp., Class A (a) | | | 507 | |
| | 9 | | | VMware, Inc., Class A (a) | | | 827 | |
| | | | | | | | |
| | | | | | | 24,652 | |
| | | | | | | | |
| | | | Total Information Technology | | | 95,282 | |
| | | | | | | | |
| | | | Materials — 7.5% | |
| | | | Chemicals — 2.8% | |
| | 21 | | | Air Products & Chemicals, Inc. | | | 1,909 | |
| | 17 | | | CF Industries Holdings, Inc. | | | 2,294 | |
| | 23 | | | Dow Chemical Co. (The) | | | 798 | |
| | 37 | | | Ecolab, Inc. | | | 1,853 | |
| | 12 | | | FMC Corp. | | | 956 | |
| | 51 | | | H.B. Fuller Co. | | | 1,042 | |
| | 8 | | | Intrepid Potash, Inc. (a) | | | 297 | |
| | 35 | | | Monsanto Co. | | | 2,456 | |
| | 27 | | | Mosaic Co. (The) | | | 2,060 | |
| | 12 | | | Praxair, Inc. | | | 1,110 | |
| | 50 | | | RPM International, Inc. | | | 1,096 | |
| | 5 | | | Sherwin-Williams Co. (The) | | | 404 | |
| | | | | | | | |
| | | | | | | 16,275 | |
| | | | | | | | |
| | | | Construction Materials — 1.2% | |
| | 64 | | | Eagle Materials, Inc. | | | 1,822 | |
| | 25 | | | Martin Marietta Materials, Inc. | | | 2,300 | |
| | 18 | | | Texas Industries, Inc. | | | 847 | |
| | 49 | | | Vulcan Materials Co. | | | 2,160 | |
| | | | | | | | |
| | | | | | | 7,129 | |
| | | | | | | | |
| | | | Containers & Packaging — 1.0% | |
| | 30 | | | Aptargroup, Inc. | | | 1,446 | |
| | 33 | | | Bemis Co., Inc. | | | 1,069 | |
| | 51 | | | Owens-Illinois, Inc. (a) | | | 1,574 | |
| | 7 | | | Packaging Corp. of America | | | 185 | |
| | 45 | | | Silgan Holdings, Inc. | | | 1,629 | |
| | | | | | | | |
| | | | | | | 5,903 | |
| | | | | | | | |
SEE NOTES TO FINANCIAL STATEMENTS
| | | | | | |
| | | |
| 50 | | | | J.P. MORGAN MID CAP/MULTI-CAP FUNDS | | DECEMBER 31, 2010 |
| | | | | | | | |
| SHARES | | | SECURITY DESCRIPTION | | VALUE($) | |
| | | | | | | | |
| Short Positions — Continued | |
| | | | Metals & Mining — 2.1% | |
| | 139 | | | AK Steel Holding Corp. | | | 2,270 | |
| | 43 | | | Allegheny Technologies, Inc. | | | 2,393 | |
| | 1 | | | Coeur d’Alene Mines Corp. (a) | | | 31 | |
| | 19 | | | Compass Minerals International, Inc. | | | 1,708 | |
| | 28 | | | Nucor Corp. | | | 1,210 | |
| | 45 | | | Royal Gold, Inc. | | | 2,438 | |
| | 36 | | | United States Steel Corp. | | | 2,129 | |
| | | | | | | | |
| | | | | | | 12,179 | |
| | | | | | | | |
| | | | Paper & Forest Products — 0.4% | |
| | 77 | | | Louisiana-Pacific Corp. (a) | | | 729 | |
| | 24 | | | Schweitzer-Mauduit International, Inc. | | | 1,538 | |
| | | | | | | | |
| | | | | | | 2,267 | |
| | | | | | | | |
| | | | Total Materials | | | 43,753 | |
| | | | | | | | |
| | | | Telecommunication Services — 1.0% | |
| | | | Diversified Telecommunication Services — 0.7% | |
| | 30 | | | AboveNet, Inc. | | | 1,772 | |
| | 13 | | | CenturyLink, Inc. | | | 577 | |
| | 154 | | | Frontier Communications Corp. | | | 1,498 | |
| | | | | | | | |
| | | | | | | 3,847 | |
| | | | | | | | |
| | | | Wireless Telecommunication Services — 0.3% | |
| | 36 | | | American Tower Corp., Class A (a) | | | 1,863 | |
| | | | | | | | |
| | | | Total Telecommunication Services | | | 5,710 | |
| | | | | | | | |
| | | | Utilities — 4.9% | |
| | | | Electric Utilities — 2.1% | |
| | 9 | | | American Electric Power Co., Inc. | | | 335 | |
| | 17 | | | Hawaiian Electric Industries, Inc. | | | 377 | |
| | 40 | | | IDACORP, Inc. | | | 1,474 | |
| | 36 | | | NextEra Energy, Inc. | | | 1,864 | |
| | 77 | | | Northeast Utilities | | | 2,453 | |
| | 78 | | | NV Energy, Inc. | | | 1,098 | |
| | 44 | | | Progress Energy, Inc. | | | 1,904 | |
| | 49 | | | Southern Co. | | | 1,866 | |
| | 36 | | | UIL Holdings Corp. | | | 1,087 | |
| | | | | | | | |
| | | | | | | 12,458 | |
| | | | | | | | |
| | | | | | | | |
| SHARES | | | SECURITY DESCRIPTION | | VALUE($) | |
| | | | | | | | |
| | |
| | | | Gas Utilities — 0.8% | | | | |
| | 29 | | | National Fuel Gas Co. | | | 1,903 | |
| | 24 | | | Northwest Natural Gas Co. | | | 1,097 | |
| | 43 | | | WGL Holdings, Inc. | | | 1,533 | |
| | | | | | | | |
| | | | | | | 4,533 | |
| | | | | | | | |
| | | | Independent Power Producers & Energy Traders — 0.5% | |
| | 117 | | | Calpine Corp. (a) | | | 1,556 | |
| | 217 | | | GenOn Energy, Inc. (a) | | | 826 | |
| | 17 | | | Ormat Technologies, Inc. | | | 514 | |
| | | | | | | | |
| | | | | | | 2,896 | |
| | | | | | | | |
| | | | Multi-Utilities — 1.5% | | | | |
| | 12 | | | Avista Corp. | | | 274 | |
| | 40 | | | Consolidated Edison, Inc. | | | 1,979 | |
| | 40 | | | Dominion Resources, Inc. | | | 1,708 | |
| | 67 | | | MDU Resources Group, Inc. | | | 1,353 | |
| | 39 | | | PG&E Corp. | | | 1,863 | |
| | 26 | | | SCANA Corp. | | | 1,046 | |
| | 7 | | | Vectren Corp. | | | 173 | |
| | | | | | | | |
| | | | | | | 8,396 | |
| | | | | | | | |
| | | | Total Utilities | | | 28,283 | |
| | | | | | | | |
| | | | Total Common Stocks
(Cost $496,235) | | | 541,710 | |
| | | | | | | | |
NUMBER OF
RIGHTS | | | | | | |
| Right — 0.0% (g) | | | | |
| | | | Health Care — 0.0% (g) | | | | |
| | 1 | | | Fresenius Kabi Pharmaceuticals Holding, Inc., (Germany), expiring 06/30/11 (a)
(Cost $—) | | | — | (h) |
| | | | | | | | |
| | | | Total Short Positions
(Proceeds $496,235) | | | 541,710 | |
| | | | | | | | |
Percentages indicated are based on net assets.
SEE NOTES TO FINANCIAL STATEMENTS.
| | | | | | | | |
| | | |
| DECEMBER 31, 2010 | | J.P. MORGAN MID CAP/MULTI-CAP FUNDS | | | | | 51 | |
JPMorgan Value Advantage Fund
SCHEDULE OF PORTFOLIO INVESTMENTS
AS OF DECEMBER 31, 2010 (Unaudited)
(Amounts in thousands)
| | | | | | | | |
| SHARES | | | SECURITY DESCRIPTION | | VALUE($) | |
| | | | | | | | |
| Common Stocks — 94.0% | |
| | | | Consumer Discretionary — 14.2% | | | | |
| | | | Distributors — 1.1% | | | | |
| | 169 | | | Genuine Parts Co. | | | 8,676 | |
| | | | | | | | |
| | | | Hotels, Restaurants & Leisure — 0.3% | | | | |
| | 221 | | | Monarch Casino & Resort, Inc. (a) | | | 2,767 | |
| | | | | | | | |
| | | | Household Durables — 0.8% | | | | |
| | 104 | | | Fortune Brands, Inc. | | | 6,290 | |
| | | | | | | | |
| | | | Internet & Catalog Retail — 0.9% | | | | |
| | 302 | | | Expedia, Inc. | | | 7,570 | |
| | | | | | | | |
| | | | Media — 4.2% | | | | |
| | 259 | | | AH Belo Corp., Class A (a) | | | 2,252 | |
| | 350 | | | Belo Corp., Class A (a) | | | 2,475 | |
| | 111 | | | Cablevision Systems Corp., Class A | | | 3,739 | |
| | 221 | | | Clear Channel Outdoor Holdings, Inc., Class A (a) | | | 3,097 | |
| | 203 | | | DISH Network Corp., Class A (a) | | | 3,995 | |
| | 275 | | | Entercom Communications Corp., Class A (a) | | | 3,182 | |
| | 425 | | | Gannett Co., Inc. | | | 6,412 | |
| | 480 | | | LIN TV Corp., Class A (a) | | | 2,544 | |
| | 108 | | | Time Warner, Inc. | | | 3,462 | |
| | 7 | | | Washington Post Co. (The), Class B | | | 3,208 | |
| | | | | | | | |
| | | | | | | 34,366 | |
| | | | | | | | |
| | | | Multiline Retail — 1.5% | | | | |
| | 167 | | | Sears Holdings Corp. (a) | | | 12,309 | |
| | | | | | | | |
| | | | Specialty Retail — 5.4% | | | | |
| | 26 | | | AutoZone, Inc. (a) | | | 6,951 | |
| | 157 | | | Bed Bath & Beyond, Inc. (a) | | | 7,736 | |
| | 798 | | | Gap, Inc. (The) | | | 17,674 | |
| | 186 | | | Home Depot, Inc. | | | 6,518 | |
| | 124 | | | TJX Cos., Inc. | | | 5,518 | |
| | | | | | | | |
| | | | | | | 44,397 | |
| | | | | | | | |
| | | | Total Consumer Discretionary | | | 116,375 | |
| | | | | | | | |
| | | | Consumer Staples — 6.1% | | | | |
| | | | Beverages — 0.8% | | | | |
| | 88 | | | Diageo plc, (United Kingdom), ADR | | | 6,526 | |
| | | | | | | | |
| | | | Food & Staples Retailing — 2.3% | | | | |
| | 267 | | | Walgreen Co. | | | 10,398 | |
| | 157 | | | Wal-Mart Stores, Inc. | | | 8,451 | |
| | | | | | | | |
| | | | | | | 18,849 | |
| | | | | | | | |
| | | | Food Products — 1.3% | | | | |
| | 159 | | | JM Smucker Co. (The) | | | 10,465 | |
| | | | | | | | |
| | | | Household Products — 1.1% | | | | |
| | 141 | | | Procter & Gamble Co. (The) | | | 9,045 | |
| | | | | | | | |
| | | | | | | | |
| SHARES | | | SECURITY DESCRIPTION | | VALUE($) | |
| | | | | | | | |
| | |
| | | | Tobacco — 0.6% | | | | |
| | 200 | | | Altria Group, Inc. | | | 4,924 | |
| | | | | | | | |
| | | | Total Consumer Staples | | | 49,809 | |
| | | | | | | | |
| | | | Energy — 11.9% | | | | |
| | | | Oil, Gas & Consumable Fuels — 11.9% | | | | |
| | 327 | | | Devon Energy Corp. | | | 25,657 | |
| | 441 | | | El Paso Corp. | | | 6,072 | |
| | 196 | | | Energy Transfer Equity LP | | | 7,658 | |
| | 286 | | | Exxon Mobil Corp. | | | 20,898 | |
| | 59 | | | Kinder Morgan Management LLC (a) | | | 3,965 | |
| | 208 | | | NuStar GP Holdings LLC | | | 7,542 | |
| | 498 | | | Teekay Corp., (Canada) | | | 16,477 | |
| | 351 | | | Williams Cos., Inc. (The) | | | 8,669 | |
| | | | | | | | |
| | | | Total Energy | | | 96,938 | |
| | | | | | | | |
| | | | Financials — 31.5% | | | | |
| | | | Capital Markets — 2.4% | | | | |
| | 107 | | | Ameriprise Financial, Inc. | | | 6,163 | |
| | 473 | | | Charles Schwab Corp. (The) | | | 8,100 | |
| | 176 | | | W.P. Carey & Co. LLC | | | 5,507 | |
| | | | | | | | |
| | | | | | | 19,770 | |
| | | | | | | | |
| | | | Commercial Banks — 6.3% | | | | |
| | 88 | | | M&T Bank Corp. | | | 7,669 | |
| | 155 | | | SunTrust Banks, Inc. | | | 4,583 | |
| | 321 | | | U.S. Bancorp | | | 8,644 | |
| | 983 | | | Wells Fargo & Co. | | | 30,466 | |
| | | | | | | | |
| | | | | | | 51,362 | |
| | | | | | | | |
| | | | Consumer Finance — 1.1% | | | | |
| | 211 | | | Capital One Financial Corp. | | | 8,989 | |
| | | | | | | | |
| | | | Diversified Financial Services — 2.3% | | | | |
| | 542 | | | Bank of America Corp. | | | 7,225 | |
| | 2,484 | | | Citigroup, Inc. (a) | | | 11,748 | |
| | | | | | | | |
| | | | | | | 18,973 | |
| | | | | | | | |
| | | | Insurance — 12.5% | | | | |
| | 122 | | | AON Corp. | | | 5,595 | |
| | — | (h) | | Berkshire Hathaway, Inc., Class A (a) | | | 6,023 | |
| | 182 | | | Cincinnati Financial Corp. | | | 5,771 | |
| | 328 | | | Fortegra Financial Corp. (a) | | | 3,629 | |
| | 236 | | | Genworth Financial, Inc., Class A (a) | | | 3,096 | |
| | 728 | | | Loews Corp. | | | 28,342 | |
| | 184 | | | MetLife, Inc. | | | 8,190 | |
| | 387 | | | Old Republic International Corp. | | | 5,273 | |
| | 163 | | | OneBeacon Insurance Group Ltd., Class A | | | 2,478 | |
| | 139 | | | ProAssurance Corp. (a) | | | 8,423 | |
| | 72 | | | Prudential Financial, Inc. | | | 4,198 | |
SEE NOTES TO FINANCIAL STATEMENTS.
| | | | | | |
| | | |
| 52 | | | | J.P. MORGAN MID CAP/MULTI-CAP FUNDS | | DECEMBER 31, 2010 |
| | | | | | | | |
| SHARES | | | SECURITY DESCRIPTION | | VALUE($) | |
| | | | | | | | |
| Common Stocks — Continued | |
| | | | Insurance — Continued | | | | |
| | 186 | | | Symetra Financial Corp. | | | 2,541 | |
| | 189 | | | Transatlantic Holdings, Inc. | | | 9,730 | |
| | 321 | | | W.R. Berkley Corp. | | | 8,792 | |
| | | | | | | | |
| | | | | | | 102,081 | |
| | | | | | | | |
| | | | Real Estate Investment Trusts (REITs) — 4.8% | | | | |
| | 203 | | | Agree Realty Corp. | | | 5,324 | |
| | 349 | | | Annaly Capital Management, Inc. | | | 6,247 | |
| | 569 | | | Cousins Properties, Inc. | | | 4,749 | |
| | 291 | | | Excel Trust, Inc. | | | 3,515 | |
| | 146 | | | Getty Realty Corp. | | | 4,564 | |
| | 95 | | | National Health Investors, Inc. | | | 4,279 | |
| | 110 | | | Regency Centers Corp. | | | 4,651 | |
| | 247 | | | Starwood Property Trust, Inc. | | | 5,303 | |
| | | | | | | | |
| | | | | | | 38,632 | |
| | | | | | | | |
| | | | Real Estate Management & Development — 1.4% | |
| | 236 | | | Brookfield Asset Management, Inc., (Canada), Class A | | | 7,860 | |
| | 100 | | | Brookfield Properties Corp. | | | 1,760 | |
| | 78 | | | St. Joe Co. (The) (a) | | | 1,700 | |
| | | | | | | | |
| | | | | | | 11,320 | |
| | | | | | | | |
| | | | Thrifts & Mortgage Finance — 0.7% | | | | |
| | 54 | | | Capitol Federal Financial, Inc. | | | 638 | |
| | 372 | | | People’s United Financial, Inc. | | | 5,208 | |
| | | | | | | | |
| | | | | | | 5,846 | |
| | | | | | | | |
| | | | Total Financials | | | 256,973 | |
| | | | | | | | |
| | | | Health Care — 10.3% | | | | |
| | | | Health Care Equipment & Supplies — 1.5% | | | | |
| | 145 | | | Becton, Dickinson & Co. | | | 12,247 | |
| | | | | | | | |
| | | | Health Care Providers & Services — 3.8% | | | | |
| | 234 | | | AmerisourceBergen Corp. | | | 7,974 | |
| | 91 | | | Humana, Inc. (a) | | | 4,954 | |
| | 319 | | | Lincare Holdings, Inc. | | | 8,557 | |
| | 198 | | | National Healthcare Corp. | | | 9,144 | |
| | | | | | | | |
| | | | | | | 30,629 | |
| | | | | | | | |
| | | | Pharmaceuticals — 5.0% | | | | |
| | 229 | | | Bristol-Myers Squibb Co. | | | 6,067 | |
| | 214 | | | Johnson & Johnson | | | 13,224 | |
| | 407 | | | Merck & Co., Inc. | | | 14,679 | |
| | 399 | | | Pfizer, Inc. | | | 6,986 | |
| | | | | | | | |
| | | | | | | 40,956 | |
| | | | | | | | |
| | | | Total Health Care | | | 83,832 | |
| | | | | | | | |
| | | | | | | | |
| SHARES | | | SECURITY DESCRIPTION | | VALUE($) | |
| | | | | | | | |
| | |
| | | | Industrials — 3.6% | | | | |
| | | | Aerospace & Defense — 0.5% | | | | |
| | 58 | | | Alliant Techsystems, Inc. (a) | | | 4,317 | |
| | | | | | | | |
| | | | Commercial Services & Supplies — 0.5% | | | | |
| | 137 | | | Republic Services, Inc. | | | 4,103 | |
| | | | | | | | |
| | | | Industrial Conglomerates — 1.2% | | | | |
| | 236 | | | Carlisle Cos., Inc. | | | 9,383 | |
| | | | | | | | |
| | | | Machinery — 1.0% | | | | |
| | 159 | | | Illinois Tool Works, Inc. | | | 8,469 | |
| | | | | | | | |
| | | | Trading Companies & Distributors — 0.4% | | | | |
| | 94 | | | GATX Corp. | | | 3,323 | |
| | | | | | | | |
| | | | Total Industrials | | | 29,595 | |
| | | | | | | | |
| | | | Information Technology — 3.2% | | | | |
| | | | Communications Equipment — 0.5% | | | | |
| | 83 | | | QUALCOMM, Inc. | | | 4,098 | |
| | | | | | | | |
| | | | Electronic Equipment, Instruments & Components — 1.0% | |
| | 220 | | | Tyco Electronics Ltd., (Switzerland) | | | 7,777 | |
| | | | | | | | |
| | | | Software — 1.7% | | | | |
| | 356 | | | Microsoft Corp. | | | 9,948 | |
| | 156 | | | Synopsys, Inc. (a) | | | 4,187 | |
| | | | | | | | |
| | | | | | | 14,135 | |
| | | | | | | | |
| | | | Total Information Technology | | | 26,010 | |
| | | | | | | | |
| | | | Materials — 2.4% | | | | |
| | | | Chemicals — 1.0% | |
| | 149 | | | Albemarle Corp. | | | 8,289 | |
| | | | | | | | |
| | | | Construction Materials — 0.5% | |
| | 42 | | | Martin Marietta Materials, Inc. | | | 3,828 | |
| | | | | | | | |
| | | | Containers & Packaging — 0.9% | |
| | 133 | | | Rock-Tenn Co., Class A | | | 7,170 | |
| | | | | | | | |
| | | | Total Materials | | | 19,287 | |
| | | | | | | | |
| | | | Telecommunication Services — 3.8% | | | | |
| | | | Diversified Telecommunication Services — 2.6% | |
| | 572 | | | AT&T, Inc. | | | 16,811 | |
| | 93 | | | CenturyLink, Inc. | | | 4,303 | |
| | | | | | | | |
| | | | | | | 21,114 | |
| | | | | | | | |
| | | | Wireless Telecommunication Services — 1.2% | |
| | 196 | | | Telephone & Data Systems, Inc. | | | 6,182 | |
| | 143 | | | Vodafone Group plc, (United Kingdom), ADR | | | 3,767 | |
| | | | | | | | |
| | | | | | | 9,949 | |
| | | | | | | | |
| | | | Total Telecommunication Services | | | 31,063 | |
| | | | | | | | |
SEE NOTES TO FINANCIAL STATEMENTS.
| | | | | | | | |
| | | |
| DECEMBER 31, 2010 | | J.P. MORGAN MID CAP/MULTI-CAP FUNDS | | | | | 53 | |
JPMorgan Value Advantage Fund
SCHEDULE OF PORTFOLIO INVESTMENTS
AS OF DECEMBER 31, 2010 (Unaudited) (continued)
(Amounts in thousands)
| | | | | | | | |
| SHARES | | | SECURITY DESCRIPTION | | VALUE($) | |
| | | | | | | | |
| Common Stocks — Continued | |
| | | | Utilities — 7.0% | | | | |
| | | | Electric Utilities — 2.8% | |
| | 162 | | | American Electric Power Co., Inc. | | | 5,836 | |
| | 158 | | | NextEra Energy, Inc. | | | 8,219 | |
| | 232 | | | Southern Co. | | | 8,885 | |
| | | | | | | | |
| | | | | | | 22,940 | |
| | | | | | | | |
| | | | Gas Utilities — 2.6% | |
| | 140 | | | Energen Corp. | | | 6,776 | |
| | 260 | | | Oneok, Inc. | | | 14,405 | |
| | | | | | | | |
| | | | | | | 21,181 | |
| | | | | | | | |
| | | | Multi-Utilities — 1.6% | |
| | 154 | | | PG&E Corp. | | | 7,348 | |
| | 110 | | | Sempra Energy | | | 5,768 | |
| | | | | | | | |
| | | | | | | 13,116 | |
| | | | | | | | |
| | | | Total Utilities | | | 57,237 | |
| | | | | | | | |
| | | | Total Common Stocks
(Cost $631,431) | | | 767,119 | |
| | | | | | | | |
| | | | | | | | |
| SHARES | | | SECURITY DESCRIPTION | | VALUE($) | |
| | | | | | | | |
| Investment Company — 1.0% | | | | |
| | 506 | | | Cohen & Steers Infrastructure Fund, Inc. (Cost $7,683) | | | 8,299 | |
| | | | | | | | |
| Short-Term Investment — 5.7% | |
| | | | Investment Company — 5.7% | |
| | 46,536 | | | JPMorgan Prime Money Market Fund, Institutional Class Shares,
0.100% (b) (l) (m)
(Cost $46,536) | | | 46,536 | |
| | | | | | | | |
| | | | Total Investments — 100.7%
(Cost $685,650) | | | 821,954 | |
| | | | Liabilities in Excess of
Other Assets — (0.7)% | | | (5,802 | ) |
| | | | | | | | |
| | | | NET ASSETS — 100.0% | | $ | 816,152 | |
| | | | | | | | |
Percentages indicated are based on net assets.
SEE NOTES TO FINANCIAL STATEMENTS.
| | | | | | |
| | | |
| 54 | | | | J.P. MORGAN MID CAP/MULTI-CAP FUNDS | | DECEMBER 31, 2010 |
J.P. Morgan Mid Cap/Multi-Cap Funds
NOTES TO SCHEDULES OF PORTFOLIO INVESTMENTS
AS OF DECEMBER 31, 2010 (Unaudited)
| | |
| ADR | | — American Depository Receipt |
| |
| (a) | | — Non-income producing security. |
| (b) | | — Investment in affiliate. Money market fund registered under the Investment Company Act of 1940, as amended, and advised by J.P. Morgan Investment Management Inc. |
| (c) | | — Security, or a portion of the security, has been delivered to a counterparty as part of a security lending transaction. |
| (g) | | — Amount rounds to less than 0.1%. |
| (h) | | — Amount rounds to less than one thousand (shares or dollars). |
| | |
| (j) | | — All or a portion of these securities are segregated for short sales. |
| (l) | | — The rate shown is the current yield as of December 31, 2010. |
| (m) | | — All or a portion of this security is reserved and/or pledged with the custodian for current or potential holdings of futures, swaps, options, TBAs, when-issued securities, delayed delivery securities, reverse repurchase agreements, and forward foreign currency contracts. |
SEE NOTES TO FINANCIAL STATEMENTS.
| | | | | | | | |
| | | |
| DECEMBER 31, 2010 | | J.P. MORGAN MID CAP/MULTI-CAP FUNDS | | | | | 55 | |
STATEMENTS OF ASSETS AND LIABILITIES
AS OF DECEMBER 31, 2010 (Unaudited)
(Amounts in thousands, except per share amounts)
| | | | | | | | | | | | | | | | |
| | | Growth
Advantage
Fund | | | Mid Cap
Core
Fund | | | Mid Cap
Equity
Fund | | | Mid Cap
Growth
Fund | |
ASSETS: | | | | | | | | | | | | | | | | |
Investments in non-affiliates, at value | | $ | 772,256 | | | $ | 3,112 | | | $ | 432,536 | | | $ | 1,609,305 | |
Investments in affiliates, at value | | | 74,838 | | | | 27 | | | | 49,596 | | | | 73,227 | |
| | | | | | | | | | | | | | | | |
Total investment securities, at value | | | 847,094 | | | | 3,139 | | | | 482,132 | | | | 1,682,532 | |
Receivables: | | | | | | | | | | | | | | | | |
Investment securities sold | | | 1,652 | | | | — | | | | 1,179 | | | | 7,567 | |
Fund shares sold | | | 8,655 | | | | — | | | | 2,545 | | | | 2,382 | |
Interest and dividends | | | 402 | | | | 2 | | | | 351 | | | | 549 | |
Securities lending income | | | 3 | | | | — | | | | 2 | | | | 11 | |
Due from Advisor | | | — | | | | 23 | | | | — | | | | — | |
Prepaid expenses and other assets | | | 2 | | | | 74 | | | | 1 | | | | 3 | |
| | | | | | | | | | | | | | | | |
Total Assets | | | 857,808 | | | | 3,238 | | | | 486,210 | | | | 1,693,044 | |
| | | | | | | | | | | | | | | | |
| | | | |
LIABILITIES: | | | | | | | | | | | | | | | | |
Payables: | | | | | | | | | | | | | | | | |
Investment securities purchased | | | 936 | | | | — | | | | 452 | | | | 2,866 | |
Collateral for securities lending program | | | 57,248 | | | | — | | | | 31,684 | | | | 46,631 | |
Fund shares redeemed | | | 386 | | | | — | | | | 328 | | | | 2,002 | |
Accrued liabilities: | | | | | | | | | | | | | | | | |
Investment advisory fees | | | 422 | | | | — | | | | 141 | | | | 893 | |
Administration fees | | | 59 | | | | — | | | | 21 | | | | 69 | |
Shareholder servicing fees | | | 131 | | | | 1 | | | | — | (a) | | | 172 | |
Distribution fees | | | 43 | | | | — | (a) | | | 1 | | | | 173 | |
Custodian and accounting fees | | | 18 | | | | 2 | | | | 16 | | | | 37 | |
Trustees’ and Chief Compliance Officer’s fees | | | — | | | | — | (a) | | | — | | | | — | |
Audit fees | | | 25 | | | | 4 | | | | 25 | | | | 33 | |
Printing and mailing fees | | | 55 | | | | 3 | | | | 16 | | | | 209 | |
Other | | | 45 | | | | — | | | | 23 | | | | 794 | |
| | | | | | | | | | | | | | | | |
Total Liabilities | | | 59,368 | | | | 10 | | | | 32,707 | | | | 53,879 | |
| | | | | | | | | | | | | | | | |
Net Assets | | $ | 798,440 | | | $ | 3,228 | | | $ | 453,503 | | | $ | 1,639,165 | |
| | | | | | | | | | | | | | | | |
SEE NOTES TO FINANCIAL STATEMENTS.
| | | | | | |
| | | |
| 56 | | | | J.P. MORGAN MID CAP/MULTI-CAP FUNDS | | DECEMBER 31, 2010 |
| | | | | | | | | | | | | | | | |
| | | Growth
Advantage
Fund | | | Mid Cap
Core
Fund | | | Mid Cap
Equity
Fund | | | Mid Cap
Growth
Fund | |
NET ASSETS: | | | | | | | | | | | | | | | | |
Paid in capital | | $ | 675,231 | | | $ | 3,052 | | | $ | 382,963 | | | $ | 1,334,670 | |
Accumulated undistributed (distributions in excess of) net investment income | | | (660 | ) | | | — | (a) | | | 673 | | | | (1,266 | ) |
Accumulated net realized gains (losses) | | | (86,728 | ) | | | 7 | | | | (48,356 | ) | | | (162,900 | ) |
Net unrealized appreciation (depreciation) | | | 210,597 | | | | 169 | | | | 118,223 | | | | 468,661 | |
| | | | | | | | | | | | | | | | |
Total Net Assets | | $ | 798,440 | | | $ | 3,228 | | | $ | 453,503 | | | $ | 1,639,165 | |
| | | | | | | | | | | | | | | | |
| | | | |
NET ASSETS: | | | | | | | | | | | | | | | | |
Class A | | $ | 151,726 | | | $ | 84 | | | $ | 2,014 | | | $ | 668,713 | |
Class B | | | 3,262 | | | | — | | | | — | | | | 22,221 | |
Class C | | | 16,527 | | | | 53 | | | | 260 | | | | 27,441 | |
Class R2 | | | — | | | | 53 | | | | — | | | | 83 | |
Class R5 | | | 132,551 | | | | 53 | | | | — | | | | — | |
Select Class | | | 494,374 | | | | 2,985 | | | | 451,229 | | | | 920,707 | |
| | | | | | | | | | | | | | | | |
Total | | $ | 798,440 | | | $ | 3,228 | | | $ | 453,503 | | | $ | 1,639,165 | |
| | | | | | | | | | | | | | | | |
| | | | |
Outstanding units of beneficial interest (shares) ($0.0001 par value; unlimited number of shares authorized): | | | | | | | | | | | | | | | | |
Class A | | | 17,408 | | | | 5 | | | | 69 | | | | 31,121 | |
Class B | | | 402 | | | | — | | | | — | | | | 1,314 | |
Class C | | | 2,037 | | | | 3 | | | | 9 | | | | 1,421 | |
Class R2 | | | — | | | | 3 | | | | — | | | | 4 | |
Class R5 | | | 14,971 | | | | 3 | | | | — | | | | — | |
Select Class | | | 56,063 | | | | 188 | | | | 15,457 | | | | 40,044 | |
| | | | |
Net Asset Value: | | | | | | | | | | | | | | | | |
Class A — Redemption price per share | | $ | 8.72 | | | $ | 15.88 | | | $ | 29.14 | | | $ | 21.49 | |
Class B — Offering price per share (b) | | | 8.11 | | | | — | | | | — | | | | 16.91 | |
Class C — Offering price per share (b) | | | 8.11 | | | | 15.88 | | | | 29.06 | | | | 19.31 | |
Class R2 — Offering and redemption price per share | | | — | | | | 15.88 | | | | — | | | | 22.83 | |
Class R5 — Offering and redemption price per share | | | 8.85 | | | | 15.88 | | | | — | | | | — | |
Select Class — Offering and redemption price per share | | | 8.82 | | | | 15.88 | | | | 29.19 | | | | 22.99 | |
Class A maximum sales charge | | | 5.25 | % | | | 5.25 | % | | | 5.25 | % | | | 5.25 | % |
Class A maximum public offering price per share
[net asset value per share/(100% — maximum sales charge)] | | $ | 9.20 | | | $ | 16.76 | | | $ | 30.75 | | | $ | 22.68 | |
| | | | | | | | | | | | | | | | |
| | | | |
Cost of investments in non-affiliates | | $ | 561,659 | | | $ | 2,943 | | | $ | 314,313 | | | $ | 1,140,644 | |
Cost of investments in affiliates | | | 74,838 | | | | 27 | | | | 49,596 | | | | 73,227 | |
Value of securities on loan | | | 55,855 | | | | — | | | | 30,914 | | | | 45,275 | |
| (a) | Amount rounds to less than $1,000. |
| (b) | Redemption price for Class B and Class C Shares varies based upon length of time the shares are held. |
SEE NOTES TO FINANCIAL STATEMENTS.
| | | | | | | | |
| | | |
| DECEMBER 31, 2010 | | J.P. MORGAN MID CAP/MULTI-CAP FUNDS | | | | | 57 | |
STATEMENTS OF ASSETS AND LIABILITIES
AS OF DECEMBER 31, 2010 (Unaudited) (continued)
(Amounts in thousands, except per share amounts)
| | | | | | | | | | | | |
| | | Mid Cap
Value
Fund | | | Multi-Cap
Market
Neutral Fund | | | Value
Advantage
Fund | |
ASSETS: | | | | | | | | | | | | |
Investments in non-affiliates, at value | | $ | 6,067,298 | | | $ | 534,499 | | | $ | 775,418 | |
Investments in affiliates, at value | | | 308,315 | | | | 43,490 | | | | 46,536 | |
| | | | | | | | | | | | |
Total investment securities, at value | | | 6,375,613 | | | | 577,989 | | | | 821,954 | |
Cash | | | — | | | | 98 | | | | — | |
Deposits at broker for securities sold short | | | — | | | | 543,439 | | | | — | |
Receivables: | | | | | | | | | | | | |
Investment securities sold | | | 4,721 | | | | 1,222 | | | | — | |
Fund shares sold | | | 13,815 | | | | 449 | | | | 6,682 | |
Interest and dividends | | | 7,781 | | | | 309 | | | | 1,431 | |
Securities lending income | | | 44 | | | | — | | | | — | |
| | | | | | | | | | | | |
Total Assets | | | 6,401,974 | | | | 1,123,506 | | | | 830,067 | |
| | | | | | | | | | | | |
| | | |
LIABILITIES: | | | | | | | | | | | | |
Payables: | | | | | | | | | | | | |
Securities sold short, at value | | | — | | | | 541,710 | | | | — | |
Dividends for securities sold short | | | — | | | | 406 | | | | — | |
Investment securities purchased | | | 2,154 | | | | — | | | | 12,124 | |
Interest expense for securities sold short | | | — | | | | 7 | | | | — | |
Collateral for securities lending program | | | 60,214 | | | | — | | | | — | |
Fund shares redeemed | | | 10,358 | | | | 237 | | | | 902 | |
Accrued liabilities: | | | | | | | | | | | | |
Investment advisory fees | | | 3,110 | | | | 517 | | | | 424 | |
Administration fees | | | 89 | | | | 35 | | | | 12 | |
Shareholder servicing fees | | | 766 | | | | 8 | | | | 115 | |
Distribution fees | | | 713 | | | | 43 | | | | 123 | |
Custodian and accounting fees | | | 118 | | | | 20 | | | | 17 | |
Trustees’ and Chief Compliance Officer’s fees | | | 1 | | | | 5 | | | | 3 | |
Other | | | 1,412 | | | | 104 | | | | 195 | |
| | | | | | | | | | | | |
Total Liabilities | | | 78,935 | | | | 543,092 | | | | 13,915 | |
| | | | | | | | | | | | |
Net Assets | | $ | 6,323,039 | | | $ | 580,414 | | | $ | 816,152 | |
| | | | | | | | | | | | |
SEE NOTES TO FINANCIAL STATEMENTS.
| | | | | | |
| | | |
| 58 | | | | J.P. MORGAN MID CAP/MULTI-CAP FUNDS | | DECEMBER 31, 2010 |
| | | | | | | | | | | | |
| | | Mid Cap
Value
Fund | | | Multi-Cap
Market
Neutral
Fund | | | Value
Advantage
Fund | |
NET ASSETS: | | | | | | | | | | | | |
Paid in capital | | $ | 5,541,800 | | | $ | 644,536 | | | $ | 756,324 | |
Accumulated undistributed (distributions in excess of) net investment income | | | 34,134 | | | | (4,875 | ) | | | (1,029 | ) |
Accumulated net realized gains (losses) | | | (608,268 | ) | | | (120,736 | ) | | | (75,447 | ) |
Net unrealized appreciation (depreciation) | | | 1,355,373 | | | | 61,489 | | | | 136,304 | |
| | | | | | | | | | | | |
Total Net Assets | | $ | 6,323,039 | | | $ | 580,414 | | | $ | 816,152 | |
| | | | | | | | | | | | |
| | | |
Net Assets: | | | | | | | | | | | | |
Class A | | $ | 2,000,247 | | | $ | 88,914 | | | $ | 212,939 | |
Class B | | | 103,330 | | | | 5,680 | | | | — | |
Class C | | | 360,224 | | | | 30,174 | | | | 128,297 | |
Class R2 | | | 3,507 | | | | — | | | | — | |
Institutional Class | | | 2,528,410 | | | | — | | | | 257,665 | |
Select Class | | | 1,327,321 | | | | 455,646 | | | | 217,251 | |
| | | | | | | | | | | | |
Total | | $ | 6,323,039 | | | $ | 580,414 | | | $ | 816,152 | |
| | | | | | | | | | | | |
| | | |
Outstanding units of beneficial interest (shares) ($0.0001 par value; unlimited number of shares authorized): | | | | | | | | | | | | |
Class A | | | 86,477 | | | | 9,281 | | | | 11,706 | |
Class B | | | 4,578 | | | | 612 | | | | — | |
Class C | | | 15,939 | | | | 3,246 | | | | 7,057 | |
Class R2 | | | 154 | | | | — | | | | — | |
Institutional Class | | | 107,705 | | | | — | | | | 14,169 | |
Select Class | | | 56,961 | | | | 47,119 | | | | 11,930 | |
| | | |
Net Asset Value: | | | | | | | | | | | | |
Class A — Redemption price per share | | $ | 23.13 | | | $ | 9.58 | | | $ | 18.19 | |
Class B — Offering price per share (a) | | | 22.57 | | | | 9.28 | | | | — | |
Class C — Offering price per share (a) | | | 22.60 | | | | 9.30 | | | | 18.18 | |
Class R2 — Offering and redemption price per share | | | 22.70 | | | | — | | | | — | |
Institutional Class — Offering and redemption price per share | | | 23.48 | | | | — | | | | 18.18 | |
Select Class — Offering and redemption price per share | | | 23.30 | | | | 9.67 | | | | 18.21 | |
Class A maximum sales charge | | | 5.25 | % | | | 5.25 | % | | | 5.25 | % |
Class A maximum public offering price per share
[net asset value per share/(100% — maximum sales charge)] | | $ | 24.41 | | | $ | 10.11 | | | $ | 19.20 | |
| | | | | | | | | | | | |
| | | |
Cost of investments in non-affiliates | | $ | 4,711,925 | | | $ | 427,535 | | | $ | 639,114 | |
Cost of investments in affiliates | | | 308,315 | | | | 43,490 | | | | 46,536 | |
Value of securities on loan | | | 58,621 | | | | — | | | | — | |
Proceeds from securities sold short | | | — | | | | 496,235 | | | | — | |
| (a) | Redemption price for Class B and Class C Shares varies based upon length of time the shares are held. |
SEE NOTES TO FINANCIAL STATEMENTS.
| | | | | | | | |
| | | |
| DECEMBER 31, 2010 | | J.P. MORGAN MID CAP/MULTI-CAP FUNDS | | | | | 59 | |
STATEMENTS OF OPERATIONS
FOR THE PERIOD ENDED DECEMBER 31, 2010 (Unaudited)
(Amounts in thousands)
| | | | | | | | | | | | | | | | |
| | | Growth
Advantage
Fund | | | Mid Cap
Core
Fund (b) | | | Mid Cap
Equity
Fund | | | Mid Cap
Growth
Fund | |
INVESTMENT INCOME: | | | | | | | | | | | | | | | | |
Dividend income from non-affiliates | | $ | 3,447 | | | $ | 4 | | | $ | 2,942 | | | $ | 6,432 | |
Interest income from affiliates | | | — | (a) | | | — | (a) | | | — | | | | — | |
Dividend income from affiliates | | | 5 | | | | — | (a) | | | 8 | | | | 19 | |
Income from securities lending (net) | | | 143 | | | | — | | | | 49 | | | | 239 | |
| | | | | | | | | | | | | | | | |
Total investment income | | | 3,595 | | | | 4 | | | | 2,999 | | | | 6,690 | |
| | | | | | | | | | | | | | | | |
| | | | |
EXPENSES: | | | | | | | | | | | | | | | | |
Investment advisory fees | | | 2,555 | | | | 2 | | | | 1,224 | | | | 4,781 | |
Administration fees | | | 360 | | | | — | (a) | | | 172 | | | | 673 | |
Distribution fees: | | | | | | | | | | | | | | | | |
Class A | | | 155 | | | | — | (a) | | | 2 | | | | 767 | |
Class B | | | 12 | | | | — | | | | — | | | | 80 | |
Class C | | | 54 | | | | — | (a) | | | — | (a) | | | 95 | |
Class R2 | | | — | | | | — | (a) | | | — | | | | — | (a) |
Shareholder servicing fees: | | | | | | | | | | | | | | | | |
Class A | | | 155 | | | | — | (a) | | | 2 | | | | 767 | |
Class B | | | 4 | | | | — | | | | — | | | | 27 | |
Class C | | | 18 | | | | — | (a) | | | — | (a) | | | 32 | |
Class R2 | | | — | | | | — | (a) | | | — | | | | — | (a) |
Class R5 | | | 26 | | | | — | (a) | | | — | | | | — | |
Select Class | | | 676 | | | | 1 | | | | 468 | | | | 1,013 | |
Custodian and accounting fees | | | 29 | | | | 2 | | | | 16 | | | | 46 | |
Interest expense to affiliates | | | 1 | | | | — | | | | — | | | | — | |
Professional fees | | | 24 | | | | 16 | | | | 21 | | | | 26 | |
Trustees’ and Chief Compliance Officer’s fees | | | 3 | | | | — | (a) | | | 2 | | | | 9 | |
Printing and mailing costs | | | 32 | | | | 3 | | | | 6 | | | | 69 | |
Registration and filing fees | | | 38 | | | | 3 | | | | 65 | | | | 137 | |
Transfer agent fees | | | 110 | | | | 1 | | | | 241 | | | | 817 | |
Other | | | 28 | | | | — | (a) | | | 7 | | | | 17 | |
| | | | | | | | | | | | | | | | |
Total expenses | | | 4,280 | | | | 28 | | | | 2,226 | | | | 9,356 | |
| | | | | | | | | | | | | | | | |
Less amounts waived | | | (38 | ) | | | (2 | ) | | | (545 | ) | | | (1,482 | ) |
Less earnings credits | | | — | (a) | | | — | (a) | | | — | (a) | | | — | (a) |
Less expense reimbursements | | | — | | | | (23 | ) | | | — | | | | — | |
| | | | | | | | | | | | | | | | |
Net expenses | | | 4,242 | | | | 3 | | | | 1,681 | | | | 7,874 | |
| | | | | | | | | | | | | | | | |
Net investment income (loss) | | | (647 | ) | | | 1 | | | | 1,318 | | | | (1,184 | ) |
| | | | | | | | | | | | | | | | |
REALIZED/UNREALIZED GAINS (LOSSES): | | | | | | | | | | | | | | | | |
Net realized gain (loss) on transactions from investments in non-affiliates | | | 48,546 | | | | 7 | | | | 1,207 | | | | 84,539 | |
Change in net unrealized appreciation (depreciation) of investments in non-affiliates | | | 148,947 | | | | 169 | | | | 86,952 | | | | 316,166 | |
| | | | | | | | | | | | | | | | |
Net realized/unrealized gains (losses) | | | 197,493 | | | | 176 | | | | 88,159 | | | | 400,705 | |
| | | | | | | | | | | | | | | | |
Change in net assets resulting from operations | | $ | 196,846 | | | $ | 177 | | | $ | 89,477 | | | $ | 399,521 | |
| | | | | | | | | | | | | | | | |
| (a) | Amount rounds to less than $1,000. |
| (b) | Commencement of operations was November 30, 2010. |
SEE NOTES TO FINANCIAL STATEMENTS.
| | | | | | |
| | | |
| 60 | | | | J.P. MORGAN MID CAP/MULTI-CAP FUNDS | | DECEMBER 31, 2010 |
| | | | | | | | | | | | |
| | | Mid Cap
Value
Fund | | | Multi-Cap
Market
Neutral
Fund | | | Value
Advantage
Fund | |
INVESTMENT INCOME: | | | | | | | | | | | | |
Interest income from non-affiliates | | $ | — | | | $ | 105 | | | $ | — | |
Dividend income from non-affiliates | | | 63,179 | | | | 3,945 | | | | 7,883 | |
Interest income from affiliates | | | — | | | | — | (a) | | | — | |
Dividend income from affiliates | | | 94 | | | | 35 | | | | 18 | |
Income from securities lending (net) | | | 219 | | | | — | | | | — | |
| | | | | | | | | | | | |
Total investment income | | | 63,492 | | | | 4,085 | | | | 7,901 | |
| | | | | | | | | | | | |
| | | |
EXPENSES: | | | | | | | | | | | | |
Investment advisory fees | | | 18,350 | | | | 3,555 | | | | 1,943 | |
Administration fees | | | 2,582 | | | | 260 | | | | 273 | |
Distribution fees: | | | | | | | | | | | | |
Class A | | | 2,318 | | | | 118 | | | | 219 | |
Class B | | | 377 | | | | 26 | | | | — | |
Class C | | | 1,255 | | | | 132 | | | | 441 | |
Class R2 | | | 6 | | | | — | | | | — | |
Shareholder servicing fees: | | | | | | | | | | | | |
Class A | | | 2,318 | | | | 118 | | | | 219 | |
Class B | | | 126 | | | | 9 | | | | — | |
Class C | | | 419 | | | | 44 | | | | 147 | |
Class R2 | | | 3 | | | | — | | | | — | |
Institutional Class | | | 1,079 | | | | — | | | | 98 | |
Select Class | | | 1,494 | | | | 541 | | | | 136 | |
Custodian and accounting fees | | | 169 | | | | 27 | | | | 25 | |
Professional fees | | | 57 | | | | 27 | | | | 29 | |
Trustees’ and Chief Compliance Officer’s fees | | | 31 | | | | — | (a) | | | 3 | |
Printing and mailing costs | | | 383 | | | | 37 | | | | 23 | |
Registration and filing fees | | | 141 | | | | 30 | | | | 34 | |
Transfer agent fees | | | 3,301 | | | | 175 | | | | 173 | |
Other | | | 111 | | | | 7 | | | | 9 | |
Dividend expense on securities sold short | | | — | | | | 4,790 | | | | — | |
Interest expense on securities sold short | | | — | | | | 290 | | | | — | |
| | | | | | | | | | | | |
Total expenses | | | 34,520 | | | | 10,186 | | | | 3,772 | |
| | | | | | | | | | | | |
Less amounts waived | | | (5,358 | ) | | | (1,263 | ) | | | (392 | ) |
Less earnings credits | | | — | (a) | | | — | (a) | | | — | (a) |
| | | | | | | | | | | | |
Net expenses | | | 29,162 | | | | 8,923 | | | | 3,380 | |
| | | | | | | | | | | | |
Net investment income (loss) | | | 34,330 | | | | (4,838 | ) | | | 4,521 | |
| | | | | | | | | | | | |
| | | |
REALIZED/UNREALIZED GAINS (LOSSES): | | | | | | | | | | | | |
Net realized gain (loss) on transactions from: | | | | | | | | | | | | |
Investments in non-affiliates | | | 46,452 | | | | 40,628 | | | | 15,348 | |
Securities sold short | | | — | | | | (29,993 | ) | | | — | |
| | | | | | | | | | | | |
Net realized gain (loss) | | | 46,452 | | | | 10,635 | | | | 15,348 | |
| | | | | | | | | | | | |
Change in net unrealized appreciation (depreciation) of: | | | | | | | | | | | | |
Investments in non-affiliates | | | 1,099,738 | | | | 90,930 | | | | 94,772 | |
Securities sold short | | | — | | | | (104,042 | ) | | | — | |
| | | | | | | | | | | | |
Change in net unrealized appreciation (depreciation) | | | 1,099,738 | | | | (13,112 | ) | | | 94,772 | |
| | | | | | | | | | | | |
Net realized/unrealized gains (losses) | | | 1,146,190 | | | | (2,477 | ) | | | 110,120 | |
| | | | | | | | | | | | |
Change in net assets resulting from operations | | $ | 1,180,520 | | | $ | (7,315 | ) | | $ | 114,641 | |
| | | | | | | | | | | | |
| (a) | Amount rounds to less than $1,000. |
SEE NOTES TO FINANCIAL STATEMENTS.
| | | | | | | | |
| | | |
| DECEMBER 31, 2010 | | J.P. MORGAN MID CAP/MULTI-CAP FUNDS | | | | | 61 | |
STATEMENTS OF CHANGES IN NET ASSETS
FOR THE PERIODS INDICATED
(Amounts in thousands)
| | | | | | | | | | | | |
| | | Growth Advantage Fund | | | Mid Cap Core Fund | |
| | | Six Months
Ended
12/31/2010
(Unaudited) | | | Year Ended
6/30/2010 | | | Period Ended
12/31/2010 (a)
(Unaudited) | |
CHANGE IN NET ASSETS RESULTING FROM OPERATIONS: | | | | | | | | | | | | |
Net investment income (loss) | | $ | (647 | ) | | $ | (1,459 | ) | | $ | 1 | |
Net realized gain (loss) | | | 48,546 | | | | 52,894 | | | | 7 | |
Change in net unrealized appreciation (depreciation) | | | 148,947 | | | | 38,819 | | | | 169 | |
| | | | | | | | | | | | |
Change in net assets resulting from operations | | | 196,846 | | | | 90,254 | | | | 177 | |
| | | | | | | | | | | | |
| | | |
DISTRIBUTIONS TO SHAREHOLDERS: | | | | | | | | | | | | |
Class R5 | | | | | | | | | | | | |
From net investment income | | | — | | | | — | | | | — | (b) |
Select Class | | | | | | | | | | | | |
From net investment income | | | — | | | | — | | | | (1 | ) |
| | | | | | | | | | | | |
Total distributions to shareholders | | | — | | | | — | | | | (1 | ) |
| | | | | | | | | | | | |
| | | |
CAPITAL TRANSACTIONS: | | | | | | | | | | | | |
Change in net assets from capital transactions | | | (197,531 | ) | | | 136,769 | | | | 3,052 | |
| | | | | | | | | | | | |
| | | |
NET ASSETS: | | | | | | | | | | | | |
Change in net assets | | | (685 | ) | | | 227,023 | | | | 3,228 | |
Beginning of period | | | 799,125 | | | | 572,102 | | | | — | |
| | | | | | | | | | | | |
End of period | | $ | 798,440 | | | $ | 799,125 | | | $ | 3,228 | |
| | | | | | | | | | | | |
Accumulated undistributed (distributions in excess of) net investment income | | $ | (660 | ) | | $ | (13 | ) | | $ | — | (b) |
| | | | | | | | | | | | |
| (a) | Commencement of operations was November 30, 2010. |
| (b) | Amount rounds to less than $1,000. |
SEE NOTES TO FINANCIAL STATEMENTS.
| | | | | | |
| | | |
| 62 | | | | J.P. MORGAN MID CAP/MULTI-CAP FUNDS | | DECEMBER 31, 2010 |
| | | | | | | | | | | | | | | | |
| | | Mid Cap Equity Fund | | | Mid Cap Growth Fund | |
| | | Six Months
Ended
12/31/2010
(Unaudited) | | | Year Ended
6/30/2010 | | | Six Months
Ended
12/31/2010
(Unaudited) | | | Year Ended
6/30/2010 | |
CHANGE IN NET ASSETS RESULTING FROM OPERATIONS: | | | | | | | | | | | | | | | | |
Net investment income (loss) | | $ | 1,318 | | | $ | 1,933 | | | $ | (1,184 | ) | | $ | (5,412 | ) |
Net realized gain (loss) | | | 1,207 | | | | 9,383 | | | | 84,539 | | | | 107,222 | |
Change in net unrealized appreciation (depreciation) | | | 86,952 | | | | 26,548 | | | | 316,166 | | | | 131,041 | |
| | | | | | | | | | | | | | | | |
Change in net assets resulting from operations | | | 89,477 | | | | 37,864 | | | | 399,521 | | | | 232,851 | |
| | | | | | | | | | | | | | | | |
| | | | |
DISTRIBUTIONS TO SHAREHOLDERS: | | | | | | | | | | | | | | | | |
Class A | | | | | | | | | | | | | | | | |
From net investment income | | | (1 | ) | | | (1 | ) | | | — | | | | — | |
Class C | | | | | | | | | | | | | | | | |
From net investment income | | | — | | | | — | (a) | | | — | | | | — | |
Select Class | | | | | | | | | | | | | | | | |
From net investment income | | | (454 | ) | | | (1,929 | ) | | | — | | | | — | |
| | | | | | | | | | | | | | | | |
Total distributions to shareholders | | | (455 | ) | | | (1,930 | ) | | | — | | | | — | |
| | | | | | | | | | | | | | | | |
| | | | |
CAPITAL TRANSACTIONS: | | | | | | | | | | | | | | | | |
Change in net assets from capital transactions | | | (100,456 | ) | | | 233,218 | | | | (50,598 | ) | | | (149,860 | ) |
| | | | | | | | | | | | | | | | |
| | | | |
NET ASSETS: | | | | | | | | | | | | | | | | |
Change in net assets | | | (11,434 | ) | | | 269,152 | | | | 348,923 | | | | 82,991 | |
Beginning of period | | | 464,937 | | | | 195,785 | | | | 1,290,242 | | | | 1,207,251 | |
| | | | | | | | | | | | | | | | |
End of period | | $ | 453,503 | | | $ | 464,937 | | | $ | 1,639,165 | | | $ | 1,290,242 | |
| | | | | | | | | | | | | | | | |
Accumulated undistributed (distributions in excess of) net investment income | | $ | 673 | | | $ | (190 | ) | | $ | (1,266 | ) | | $ | (82 | ) |
| | | | | | | | | | | | | | | | |
| (a) | Amount rounds to less than $1,000. |
SEE NOTES TO FINANCIAL STATEMENTS.
| | | | | | | | |
| | | |
| DECEMBER 31, 2010 | | J.P. MORGAN MID CAP/MULTI-CAP FUNDS | | | | | 63 | |
STATEMENTS OF CHANGES IN NET ASSETS
FOR THE PERIODS INDICATED (continued)
(Amounts in thousands)
| | | | | | | | | | | | | | | | |
| | | Mid Cap Value Fund | | | Multi-Cap Market Neutral Fund | |
| | | Six Months
Ended
12/31/2010
(Unaudited) | | | Year Ended
6/30/2010 | | | Six Months
Ended
12/31/2010
(Unaudited) | | | Year Ended
6/30/2010 | |
CHANGE IN NET ASSETS RESULTING FROM OPERATIONS: | | | | | | | | | | | | | | | | |
Net investment income (loss) | | $ | 34,330 | | | $ | 62,503 | | | $ | (4,838 | ) | | $ | (9,582 | ) |
Net realized gain (loss) | | | 46,452 | | | | 23,325 | | | | 10,635 | | | | 43,479 | |
Change in net unrealized appreciation (depreciation) | | | 1,099,738 | | | | 936,527 | | | | (13,112 | ) | | | (63,292 | ) |
| | | | | | | | | | | | | | | | |
Change in net assets resulting from operations | | | 1,180,520 | | | | 1,022,355 | | | | (7,315 | ) | | | (29,395 | ) |
| | | | | | | | | | | | | | | | |
| | | | |
DISTRIBUTIONS TO SHAREHOLDERS: | | | | | | | | | | | | | | | | |
Class A | | | | | | | | | | | | | | | | |
From net investment income | | | (15,422 | ) | | | — | | | | — | | | | — | |
Class B | | | | | | | | | | | | | | | | |
From net investment income | | | (167 | ) | | | — | | | | — | | | | — | |
Class C | | | | | | | | | | | | | | | | |
From net investment income | | | (1,171 | ) | | | — | | | | — | | | | — | |
Class R2 | | | | | | | | | | | | | | | | |
From net investment income | | | (36 | ) | | | — | | | | — | | | | — | |
Institutional Class | | | | | | | | | | | | | | | | |
From net investment income | | | (29,944 | ) | | | (1,669 | ) | | | — | | | | — | |
Select Class | | | | | | | | | | | | | | | | |
From net investment income | | | (13,423 | ) | | | (279 | ) | | | — | | | | — | |
| | | | | | | | | | | | | | | | |
Total distributions to shareholders | | | (60,163 | ) | | | (1,948 | ) | | | — | | | | — | |
| | | | | | | | | | | | | | | | |
| | | | |
CAPITAL TRANSACTIONS: | | | | | | | | | | | | | | | | |
Change in net assets from capital transactions | | | 113,952 | | | | (131,054 | ) | | | 12,182 | | | | (65,653 | ) |
| | | | | | | | | | | | | | | | |
| | | | |
NET ASSETS: | | | | | | | | | | | | | | | | |
Change in net assets | | | 1,234,309 | | | | 889,353 | | | | 4,867 | | | | (95,048 | ) |
Beginning of period | | | 5,088,730 | | | | 4,199,377 | | | | 575,547 | | | | 670,595 | |
| | | | | | | | | | | | | | | | |
End of period | | $ | 6,323,039 | | | $ | 5,088,730 | | | $ | 580,414 | | | $ | 575,547 | |
| | | | | | | | | | | | | | | | |
Accumulated undistributed (distributions in excess of) net investment income | | $ | 34,134 | | | $ | 59,967 | | | $ | (4,875 | ) | | $ | (37 | ) |
| | | | | | | | | | | | | | | | |
SEE NOTES TO FINANCIAL STATEMENTS.
| | | | | | |
| | | |
| 64 | | | | J.P. MORGAN MID CAP/MULTI-CAP FUNDS | | DECEMBER 31, 2010 |
| | | | | | | | |
| | | Value Advantage Fund | |
| | | Six Months
Ended
12/31/2010
(Unaudited) | | | Year Ended
6/30/2010 | |
CHANGE IN NET ASSETS RESULTING FROM OPERATIONS: | | | | | | | | |
Net investment income (loss) | | $ | 4,521 | | | $ | 6,916 | |
Net realized gain (loss) | | | 15,348 | | | | (10,567 | ) |
Change in net unrealized appreciation (depreciation) | | | 94,772 | | | | 96,114 | |
| | | | | | | | |
Change in net assets resulting from operations | | | 114,641 | | | | 92,463 | |
| | | | | | | | |
| | |
DISTRIBUTIONS TO SHAREHOLDERS: | | | | | | | | |
Class A | | | | | | | | |
From net investment income | | | (1,878 | ) | | | (1,905 | ) |
Class C | | | | | | | | |
From net investment income | | | (513 | ) | | | (889 | ) |
Institutional Class | | | | | | | | |
From net investment income | | | (3,215 | ) | | | (1,840 | ) |
Select Class | | | | | | | | |
From net investment income | | | (2,578 | ) | | | (995 | ) |
| | | | | | | | |
Total distributions to shareholders | | | (8,184 | ) | | | (5,629 | ) |
| | | | | | | | |
| | |
CAPITAL TRANSACTIONS: | | | | | | | | |
Change in net assets from capital transactions | | | 223,709 | | | | 66,865 | |
| | | | | | | | |
| | |
NET ASSETS: | | | | | | | | |
Change in net assets | | | 330,166 | | | | 153,699 | |
Beginning of period | | | 485,986 | | | | 332,287 | |
| | | | | | | | |
End of period | | $ | 816,152 | | | $ | 485,986 | |
| | | | | | | | |
Accumulated undistributed (distributions in excess of) net investment income | | $ | (1,029 | ) | | $ | 2,634 | |
| | | | | | | | |
SEE NOTES TO FINANCIAL STATEMENTS.
| | | | | | | | |
| | | |
| DECEMBER 31, 2010 | | J.P. MORGAN MID CAP/MULTI-CAP FUNDS | | | | | 65 | |
STATEMENTS OF CHANGES IN NET ASSETS
FOR THE PERIODS INDICATED (continued)
(Amounts in thousands)
| | | | | | | | | | | | |
| | | Growth Advantage Fund | | | Mid Cap Core Fund | |
| | | Six Months
Ended
12/31/2010
(Unaudited) | | | Year Ended
6/30/2010 | | | Period Ended
12/31/2010 (a)
(Unaudited) | |
CAPITAL TRANSACTIONS: | | | | | | | | | | | | |
Class A | | | | | | | | | | | | |
Proceeds from shares issued | | $ | 37,855 | | | $ | 55,364 | | | $ | 81 | |
Dividends and distributions reinvested | | | — | | | | — | | | | — | (b) |
Cost of shares redeemed | | | (19,043 | ) | | | (36,207 | ) | | | — | |
| | | | | | | | | | | | |
Change in net assets from Class A capital transactions | | $ | 18,812 | | | $ | 19,157 | | | $ | 81 | |
| | | | | | | | | | | | |
Class B | | | | | | | | | | | | |
Proceeds from shares issued | | $ | 67 | | | $ | 520 | | | $ | — | |
Cost of shares redeemed | | | (677 | ) | | | (1,277 | ) | | | — | |
| | | | | | | | | | | | |
Change in net assets from Class B capital transactions | | $ | (610 | ) | | $ | (757 | ) | | $ | — | |
| | | | | | | | | | | | |
Class C | | | | | | | | | | | | |
Proceeds from shares issued | | $ | 2,451 | | | $ | 5,617 | | | $ | 50 | |
Cost of shares redeemed | | | (2,306 | ) | | | (3,392 | ) | | | — | |
| | | | | | | | | | | | |
Change in net assets from Class C capital transactions | | $ | 145 | | | $ | 2,225 | | | $ | 50 | |
| | | | | | | | | | | | |
Class R2 | | | | | | | | | | | | |
Proceeds from shares issued | | $ | — | | | $ | — | | | $ | 50 | |
| | | | | | | | | | | | |
Change in net assets from Class R2 capital transactions | | $ | — | | | $ | — | | | $ | 50 | |
| | | | | | | | | | | | |
Class R5 | | | | | | | | | | | | |
Proceeds from shares issued | | $ | 29,627 | | | $ | 27,290 | | | $ | 50 | |
Dividends and distributions reinvested | | | — | | | | — | | | | — | (b) |
Cost of shares redeemed | | | (209 | ) | | | (3,562 | ) | | | — | |
| | | | | | | | | | | | |
Change in net assets from Class R5 capital transactions | | $ | 29,418 | | | $ | 23,728 | | | $ | 50 | |
| | | | | | | | | | | | |
Select Class | | | | | | | | | | | | |
Proceeds from shares issued | | $ | 68,875 | | | $ | 324,548 | | | $ | 2,820 | |
Dividends and distributions reinvested | | | — | | | | — | | | | 1 | |
Cost of shares redeemed | | | (314,171 | ) | | | (232,132 | ) | | | — | |
| | | | | | | | | | | | |
Change in net assets from Select Class capital transactions | | $ | (245,296 | ) | | $ | 92,416 | | | $ | 2,821 | |
| | | | | | | | | | | | |
Total change in net assets from capital transactions | | $ | (197,531 | ) | | $ | 136,769 | | | $ | 3,052 | |
| | | | | | | | | | | | |
SEE NOTES TO FINANCIAL STATEMENTS.
| | | | | | |
| | | |
| 66 | | | | J.P. MORGAN MID CAP/MULTI-CAP FUNDS | | DECEMBER 31, 2010 |
| | | | | | | | | | | | |
| | | Growth Advantage Fund | | | Mid Cap Core Fund | |
| | | Six Months
Ended
12/31/2010
(Unaudited) | | | Year Ended
6/30/2010 | | | Period Ended
12/31/2010 (a)
(Unaudited) | |
SHARE TRANSACTIONS: | | | | | | | | | | | | |
Class A | | | | | | | | | | | | |
Issued | | | 4,834 | | | | 7,959 | | | | 5 | |
Reinvested | | | — | | | | — | | | | — | (b) |
Redeemed | | | (2,483 | ) | | | (5,122 | ) | | | — | |
| | | | | | | | | | | | |
Change in Class A Shares | | | 2,351 | | | | 2,837 | | | | 5 | |
| | | | | | | | | | | | |
Class B | | | | | | | | | | | | |
Issued | | | 8 | | | | 83 | | | | — | |
Redeemed | | | (93 | ) | | | (196 | ) | | | — | |
| | | | | | | | | | | | |
Change in Class B Shares | | | (85 | ) | | | (113 | ) | | | — | |
| | | | | | | | | | | | |
Class C | | | | | | | | | | | | |
Issued | | | 327 | | | | 868 | | | | 3 | |
Redeemed | | | (320 | ) | | | (524 | ) | | | — | |
| | | | | | | | | | | | |
Change in Class C Shares | | | 7 | | | | 344 | | | | 3 | |
| | | | | | | | | | | | |
Class R2 | | | | | | | | | | | | |
Issued | | | — | | | | — | | | | 3 | |
| | | | | | | | | | | | |
Change in Class R2 Shares | | | — | | | | — | | | | 3 | |
| | | | | | | | | | | | |
Class R5 | | | | | | | | | | | | |
Issued | | | 3,799 | | | | 3,874 | | | | 3 | |
Reinvested | | | — | | | | — | | | | — | (b) |
Redeemed | | | (27 | ) | | | (480 | ) | | | — | |
| | | | | | | | | | | | |
Change in Class R5 Shares | | | 3,772 | | | | 3,394 | | | | 3 | |
| | | | | | | | | | | | |
Select Class | | | | | | | | | | | | |
Issued | | | 8,616 | | | | 46,815 | | | | 188 | |
Reinvested | | | — | | | | — | | | | — | (b) |
Redeemed | | | (41,030 | ) | | | (32,808 | ) | | | — | |
| | | | | | | | | | | | |
Change in Select Class Shares | | | (32,414 | ) | | | 14,007 | | | | 188 | |
| | | | | | | | | | | | |
| (a) | Commencement of operations was November 30, 2010. |
| (b) | Amount rounds to less than 1,000 (shares or dollars). |
SEE NOTES TO FINANCIAL STATEMENTS.
| | | | | | | | |
| | | |
| DECEMBER 31, 2010 | | J.P. MORGAN MID CAP/MULTI-CAP FUNDS | | | | | 67 | |
STATEMENTS OF CHANGES IN NET ASSETS
FOR THE PERIODS INDICATED (continued)
(Amounts in thousands)
| | | | | | | | | | | | | | | | |
| | | Mid Cap Equity Fund | | | Mid Cap Growth Fund | |
| | | Six Months Ended
12/31/2010
(Unaudited) | | | Year
Ended
6/30/2010 | | | Six Months Ended
12/31/2010
(Unaudited) | | | Year Ended
6/30/2010 | |
CAPITAL TRANSACTIONS: | | | | | | | | | | | | | | | | |
Class A (b) | | | | | | | | | | | | | | | | |
Proceeds from shares issued | | $ | 830 | | | $ | 1,597 | | | $ | 29,284 | | | $ | 103,096 | |
Dividends and distributions reinvested | | | 1 | | | | 1 | | | | — | | | | — | |
Cost of shares redeemed | | | (622 | ) | | | (95 | ) | | | (86,463 | ) | | | (167,798 | ) |
| | | | | | | | | | | | | | | | |
Change in net assets from Class A capital transactions | | $ | 209 | | | $ | 1,503 | | | $ | (57,179 | ) | | $ | (64,702 | ) |
| | | | | | | | | | | | | | | | |
Class B | | | | | | | | | | | | | | | | |
Proceeds from shares issued | | $ | — | | | $ | — | | | $ | 439 | | | $ | 1,165 | |
Cost of shares redeemed | | | — | | | | — | | | | (4,842 | ) | | | (16,165 | ) |
| | | | | | | | | | | | | | | | |
Change in net assets from Class B capital transactions | | $ | — | | | $ | — | | | $ | (4,403 | ) | | $ | (15,000 | ) |
| | | | | | | | | | | | | | | | |
Class C (b) | | | | | | | | | | | | | | | | |
Proceeds from shares issued | | $ | 178 | | | $ | 66 | | | $ | 1,250 | | | $ | 2,193 | |
Dividends and distributions reinvested | | | — | | | | — | (a) | | | — | | | | — | |
Cost of shares redeemed | | | (13 | ) | | | (3 | ) | | | (4,007 | ) | | | (9,337 | ) |
| | | | | | | | | | | | | | | | |
Change in net assets from Class C capital transactions | | $ | 165 | | | $ | 63 | | | $ | (2,757 | ) | | $ | (7,144 | ) |
| | | | | | | | | | | | | | | | |
Class R2 | | | | | | | | | | | | | | | | |
Proceeds from shares issued | | $ | — | | | $ | — | | | $ | — | | | $ | — | (a) |
Cost of shares redeemed | | | — | | | | — | | | | — | | | | (32 | ) |
| | | | | | | | | | | | | | | | |
Change in net assets from Class R2 capital transactions | | $ | — | | | $ | — | | | $ | — | | | $ | (32 | ) |
| | | | | | | | | | | | | | | | |
Select Class | | | | | | | | | | | | | | | | |
Proceeds from shares issued | | $ | 101,165 | | | $ | 316,115 | | | $ | 122,168 | | | $ | 155,494 | |
Dividends and distributions reinvested | | | 101 | | | | 305 | | | | — | | | | — | |
Cost of shares redeemed | | | (202,096 | ) | | | (84,768 | ) | | | (108,427 | ) | | | (218,476 | ) |
| | | | | | | | | | | | | | | | |
Change in net assets from Select Class capital transactions | | $ | (100,830 | ) | | $ | 231,652 | | | $ | 13,741 | | | $ | (62,982 | ) |
| | | | | | | | | | | | | | | | |
Total change in net assets from capital transactions | | $ | (100,456 | ) | | $ | 233,218 | | | $ | (50,598 | ) | | $ | (149,860 | ) |
| | | | | | | | | | | | | | | | |
| | | | |
SHARE TRANSACTIONS: | | | | | | | | | | | | | | | | |
Class A (b) | | | | | | | | | | | | | | | | |
Issued | | | 32 | | | | 65 | | | | 1,545 | | | | 6,323 | |
Reinvested | | | — | (a) | | | — | (a) | | | — | | | | — | |
Redeemed | | | (24 | ) | | | (4 | ) | | | (4,680 | ) | | | (10,091 | ) |
| | | | | | | | | | | | | | | | |
Change in Class A Shares | | | 8 | | | | 61 | | | | (3,135 | ) | | | (3,768 | ) |
| | | | | | | | | | | | | | | | |
Class B | | | | | | | | | | | | | | | | |
Issued | | | — | | | | — | | | | 28 | | | | 93 | |
Reinvested | | | — | | | | — | | | | — | | | | — | |
Redeemed | | | — | | | | — | | | | (334 | ) | | | (1,235 | ) |
| | | | | | | | | | | | | | | | |
Change in Class B Shares | | | — | | | | — | | | | (306 | ) | | | (1,142 | ) |
| | | | | | | | | | | | | | | | |
Class C (b) | | | | | | | | | | | | | | | | |
Issued | | | 7 | | | | 3 | | | | 70 | | | | 146 | |
Reinvested | | | — | | | | — | (a) | | | — | | | | — | (a) |
Redeemed | | | (1 | ) | | | — | (a) | | | (237 | ) | | | (627 | ) |
| | | | | | | | | | | | | | | | |
Change in Class C Shares | | | 6 | | | | 3 | | | | (167 | ) | | | (481 | ) |
| | | | | | | | | | | | | | | | |
Class R2 | | | | | | | | | | | | | | | | |
Issued | | | — | | | | — | | | | — | | | | — | (a) |
Redeemed | | | — | | | | — | | | | — | | | | (2 | ) |
| | | | | | | | | | | | | | | | |
Change in Class R2 Shares | | | — | | | | — | | | | — | | | | (2 | ) |
| | | | | | | | | | | | | | | | |
Select Class | | | | | | | | | | | | | | | | |
Issued | | | 3,862 | | | | 13,451 | | | | 6,189 | | | | 8,781 | |
Reinvested | | | 4 | | | | 13 | | | | — | | | | — | |
Redeemed | | | (8,589 | ) | | | (3,604 | ) | | | (5,412 | ) | | | (12,859 | ) |
| | | | | | | | | | | | | | | | |
Change in Select Class Shares | | | (4,723 | ) | | | 9,860 | | | | 777 | | | | (4,078 | ) |
| | | | | | | | | | | | | | | | |
| (a) | Amount rounds to less than 1,000 (shares or dollars). |
| (b) | Commencement of offering of class of shares effective November 2, 2009 for Mid Cap Equity Fund. |
SEE NOTES TO FINANCIAL STATEMENTS.
| | | | | | |
| | | |
| 68 | | | | J.P. MORGAN MID CAP/MULTI-CAP FUNDS | | DECEMBER 31, 2010 |
| | | | | | | | | | | | | | | | |
| | | Mid Cap Value Fund | | | Multi-Cap Market Neutral Fund | |
| | | Six Months
Ended
12/31/2010
(Unaudited) | | | Year Ended
6/30/2010 | | | Six Months
Ended
12/31/2010
(Unaudited) | | | Year Ended
6/30/2010 | |
CAPITAL TRANSACTIONS: | | | | | | | | | | | | | | | | |
Class A | | | | | | | | | | | | | | | | |
Proceeds from shares issued | | $ | 148,873 | | | $ | 286,766 | | | $ | 15,738 | | | $ | 64,504 | |
Dividends and distributions reinvested | | | 14,615 | | | | — | | | | — | | | | — | |
Cost of shares redeemed | | | (239,025 | ) | | | (562,984 | ) | | | (20,163 | ) | | | (33,398 | ) |
| | | | | | | | | | | | | | | | |
Change in net assets from Class A capital transactions | | $ | (75,537 | ) | | $ | (276,218 | ) | | $ | (4,425 | ) | | $ | 31,106 | |
| | | | | | | | | | | | | | | | |
Class B | | | | | | | | | | | | | | | | |
Proceeds from shares issued | | $ | 372 | | | $ | 1,155 | | | $ | 21 | | | $ | 84 | |
Dividends and distributions reinvested | | | 148 | | | | — | | | | — | | | | — | |
Cost of shares redeemed | | | (14,640 | ) | | | (37,583 | ) | | | (2,086 | ) | | | (4,436 | ) |
| | | | | | | | | | | | | | | | |
Change in net assets from Class B capital transactions | | $ | (14,120 | ) | | $ | (36,428 | ) | | $ | (2,065 | ) | | $ | (4,352 | ) |
| | | | | | | | | | | | | | | | |
Class C | | | | | | | | | | | | | | | | |
Proceeds from shares issued | | $ | 14,967 | | | $ | 24,188 | | | $ | 762 | | | $ | 4,139 | |
Dividends and distributions reinvested | | | 873 | | | | — | | | | — | | | | — | |
Cost of shares redeemed | | | (32,741 | ) | | | (83,767 | ) | | | (9,650 | ) | | | (23,169 | ) |
| | | | | | | | | | | | | | | | |
Change in net assets from Class C capital transactions | | $ | (16,901 | ) | | $ | (59,579 | ) | | $ | (8,888 | ) | | $ | (19,030 | ) |
| | | | | | | | | | | | | | | | |
Class R2 | | | | | | | | | | | | | | | | |
Proceeds from shares issued | | $ | 1,772 | | | $ | 2,331 | | | $ | — | | | $ | — | |
Dividends and distributions reinvested | | | 28 | | | | — | | | | — | | | | — | |
Cost of shares redeemed | | | (178 | ) | | | (1,209 | ) | | | — | | | | — | |
| | | | | | | | | | | | | | | | |
Change in net assets from Class R2 capital transactions | | $ | 1,622 | | | $ | 1,122 | | | $ | — | | | $ | — | |
| | | | | | | | | | | | | | | | |
Institutional Class | | | | | | | | | | | | | | | | |
Proceeds from shares issued | | $ | 391,977 | | | $ | 527,453 | | | $ | — | | | $ | — | |
Dividends and distributions reinvested | | | 22,919 | | | | 1,318 | | | | — | | | | — | |
Cost of shares redeemed | | | (224,573 | ) | | | (435,724 | ) | | | — | | | | — | |
Redemptions in-kind (See Note 9) | | | — | | | | 47,173 | | | | — | | | | — | |
| | | | | | | | | | | | | | | | |
Change in net assets from Institutional Class capital transactions | | $ | 190,323 | | | $ | 140,220 | | | $ | — | | | $ | — | |
| | | | | | | | | | | | | | | | |
Select Class | | | | | | | | | | | | | | | | |
Proceeds from shares issued | | $ | 187,301 | | | $ | 468,382 | | | $ | 78,196 | | | $ | 153,988 | |
Dividends and distributions reinvested | | | 9,285 | | | | 167 | | | | — | | | | — | |
Cost of shares redeemed | | | (168,021 | ) | | | (368,720 | ) | | | (50,636 | ) | | | (227,365 | ) |
| | | | | | | | | | | | | | | | |
Change in net assets from Select Class capital transactions | | $ | 28,565 | | | $ | 99,829 | | | $ | 27,560 | | | $ | (73,377 | ) |
| | | | | | | | | | | | | | | | |
Total change in net assets from capital transactions | | $ | 113,952 | | | $ | (131,054 | ) | | $ | 12,182 | | | $ | (65,653 | ) |
| | | | | | | | | | | | | | | | |
SEE NOTES TO FINANCIAL STATEMENTS.
| | | | | | | | |
| | | |
| DECEMBER 31, 2010 | | J.P. MORGAN MID CAP/MULTI-CAP FUNDS | | | | | 69 | |
STATEMENTS OF CHANGES IN NET ASSETS
FOR THE PERIODS INDICATED (continued)
(Amounts in thousands)
| | | | | | | | | | | | | | | | |
| | | Mid Cap Value Fund | | | Multi-Cap Market Neutral Fund | |
| | | Six Months
Ended
12/31/2010
(Unaudited) | | | Year Ended
6/30/2010 | | | Six Months
Ended
12/31/2010
(Unaudited) | | | Year Ended
6/30/2010 | |
SHARE TRANSACTIONS: | | | | | | | | | | | | | | | | |
Class A | | | | | | | | | | | | | | | | |
Issued | | | 7,041 | | | | 15,310 | | | | 1,623 | | | | 6,429 | |
Reinvested | | | 636 | | | | — | | | | — | | | | — | |
Redeemed | | | (11,416 | ) | | | (30,094 | ) | | | (2,080 | ) | | | (3,339 | ) |
| | | | | | | | | | | | | | | | |
Change in Class A Shares | | | (3,739 | ) | | | (14,784 | ) | | | (457 | ) | | | 3,090 | |
| | | | | | | | | | | | | | | | |
Class B | | | | | | | | | | | | | | | | |
Issued | | | 18 | | | | 66 | | | | 2 | | | | 8 | |
Reinvested | | | 7 | | | | — | | | | — | | | | — | |
Redeemed | | | (722 | ) | | | (2,050 | ) | | | (221 | ) | | | (453 | ) |
| | | | | | | | | | | | | | | | |
Change in Class B Shares | | | (697 | ) | | | (1,984 | ) | | | (219 | ) | | | (445 | ) |
| | | | | | | | | | | | | | | | |
Class C | | | | | | | | | | | | | | | | |
Issued | | | 720 | | | | 1,313 | | | | 81 | | | | 423 | |
Reinvested | | | 39 | | | | — | (a) | | | — | | | | — | |
Redeemed | | | (1,608 | ) | | | (4,607 | ) | | | (1,024 | ) | | | (2,368 | ) |
| | | | | | | | | | | | | | | | |
Change in Class C Shares | | | (849 | ) | | | (3,294 | ) | | | (943 | ) | | | (1,945 | ) |
| | | | | | | | | | | | | | | | |
Class R2 | | | | | | | | | | | | | | | | |
Issued | | | 85 | | | | 121 | | | | — | | | | — | |
Reinvested | | | 1 | | | | — | | | | — | | | | — | |
Redeemed | | | (9 | ) | | | (64 | ) | | | — | | | | — | |
| | | | | | | | | | | | | | | | |
Change in Class R2 Shares | | | 77 | | | | 57 | | | | — | | | | — | |
| | | | | | | | | | | | | | | | |
Institutional Class | | | | | | | | | | | | | | | | |
Issued | | | 17,786 | | | | 27,515 | | | | — | | | | — | |
Reinvested | | | 984 | | | | 69 | | | | — | | | | — | |
Redeemed | | | (10,630 | ) | | | (22,644 | ) | | | — | | | | — | |
Redemptions in-kind (See Note 9) | | | — | | | | 2,355 | | | | — | | | | — | |
| | | | | | | | | | | | | | | | |
Change in Institutional Class Shares | | | 8,140 | | | | 7,295 | | | | — | | | | — | |
| | | | | | | | | | | | | | | | |
Select Class | | | | | | | | | | | | | | | | |
Issued | | | 8,799 | | | | 25,058 | | | | 8,009 | | | | 15,269 | |
Reinvested | | | 401 | | | | 9 | | | | — | | | | — | |
Redeemed | | | (7,893 | ) | | | (19,421 | ) | | | (5,182 | ) | | | (22,446 | ) |
| | | | | | | | | | | | | | | | |
Change in Select Class Shares | | | 1,307 | | | | 5,646 | | | | 2,827 | | | | (7,177 | ) |
| | | | | | | | | | | | | | | | |
| (a) | Amount rounds to less than 1,000. |
SEE NOTES TO FINANCIAL STATEMENTS.
| | | | | | |
| | | |
| 70 | | | | J.P. MORGAN MID CAP/MULTI-CAP FUNDS | | DECEMBER 31, 2010 |
| | | | | | | | |
| | | Value Advantage Fund | |
| | | Six Months
Ended
12/31/2010
(Unaudited) | | | Year
Ended
6/30/2010 | |
CAPITAL TRANSACTIONS: | | | | | | | | |
Class A | | | | | | | | |
Proceeds from shares issued | | $ | 59,561 | | | $ | 72,764 | |
Dividends and distributions reinvested | | | 1,727 | | | | 1,731 | |
Cost of shares redeemed | | | (29,400 | ) | | | (67,947 | ) |
| | | | | | | | |
Change in net assets from Class A capital transactions | | $ | 31,888 | | | $ | 6,548 | |
| | | | | | | | |
Class C | | | | | | | | |
Proceeds from shares issued | | $ | 10,964 | | | $ | 17,785 | |
Dividends and distributions reinvested | | | 413 | | | | 717 | |
Cost of shares redeemed | | | (12,387 | ) | | | (33,293 | ) |
| | | | | | | | |
Change in net assets from Class C capital transactions | | $ | (1,010 | ) | | $ | (14,791 | ) |
| | | | | | | | |
Institutional Class | | | | | | | | |
Proceeds from shares issued | | $ | 70,015 | | | $ | 76,158 | |
Dividends and distributions reinvested | | | 2,906 | | | | 1,753 | |
Cost of shares redeemed | | | (6,317 | ) | | | (9,427 | ) |
| | | | | | | | |
Change in net assets from Institutional Class capital transactions | | $ | 66,604 | | | $ | 68,484 | |
| | | | | | | | |
Select Class | | | | | | | | |
Proceeds from shares issued | | $ | 136,689 | | | $ | 28,225 | |
Dividends and distributions reinvested | | | 1,855 | | | | 411 | |
Cost of shares redeemed | | | (12,317 | ) | | | (22,012 | ) |
| | | | | | | | |
Change in net assets from Select Class capital transactions | | $ | 126,227 | | | $ | 6,624 | |
| | | | | | | | |
Total change in net assets from capital transactions | | $ | 223,709 | | | $ | 66,865 | |
| | | | | | | | |
SHARE TRANSACTIONS: | | | | | | | | |
Class A | | | | | | | | |
Issued | | | 3,536 | | | | 4,748 | |
Reinvested | | | 96 | | | | 114 | |
Redeemed | | | (1,786 | ) | | | (4,392 | ) |
| | | | | | | | |
Change in Class A Shares | | | 1,846 | | | | 470 | |
| | | | | | | | |
Class C | | | | | | | | |
Issued | | | 656 | | | | 1,153 | |
Reinvested | | | 23 | | | | 47 | |
Redeemed | | | (750 | ) | | | (2,236 | ) |
| | | | | | | | |
Change in Class C Shares | | | (71 | ) | | | (1,036 | ) |
| | | | | | | | |
Institutional Class | | | | | | | | |
Issued | | | 4,102 | | | | 4,877 | |
Reinvested | | | 162 | | | | 115 | |
Redeemed | | | (366 | ) | | | (619 | ) |
| | | | | | | | |
Change in Institutional Class Shares | | | 3,898 | | | | 4,373 | |
| | | | | | | | |
Select Class | | | | | | | | |
Issued | | | 7,896 | | | | 1,827 | |
Reinvested | | | 103 | | | | 27 | |
Redeemed | | | (733 | ) | | | (1,427 | ) |
| | | | | | | | |
Change in Select Class Shares | | | 7,266 | | | | 427 | |
| | | | | | | | |
SEE NOTES TO FINANCIAL STATEMENTS.
| | | | | | | | |
| | | |
| DECEMBER 31, 2010 | | J.P. MORGAN MID CAP/MULTI-CAP FUNDS | | | | | 71 | |
FINANCIAL HIGHLIGHTS
FOR THE PERIODS INDICATED
| | | | | | | | | | | | | | | | | | | | | | | | |
| | | Per share operating performance | |
| | | | | | Investment operations | | | | |
| | | Net asset
value,
beginning
of period | | | Net
investment
income
(loss) | | | Net realized
and unrealized gains (losses) on
investments | | | Total from
investment
operations | | | Net asset
value, end of
period | | | Total return
(excludes
sales charge)
(b)(c) | |
Growth Advantage Fund | | | | | | | | | | | | | | | | | | | | | | | | |
Class A | | | | | | | | | | | | | | | | | | | | | | | | |
Six Months Ended December 31, 2010 (Unaudited) | | $ | 6.76 | | | $ | (0.01 | )(e) | | $ | 1.97 | | | $ | 1.96 | | | $ | 8.72 | | | | 28.99 | % |
Year Ended June 30, 2010 | | | 5.88 | | | | (0.03 | )(e) | | | 0.91 | | | | 0.88 | | | | 6.76 | | | | 14.97 | |
Year Ended June 30, 2009 | | | 8.14 | | | | (0.03 | )(e) | | | (2.23 | ) | | | (2.26 | ) | | | 5.88 | | | | (27.76 | ) |
Year Ended June 30, 2008 | | | 8.18 | | | | (0.05 | )(e) | | | 0.01 | | | | (0.04 | ) | | | 8.14 | | | | (0.49 | ) |
Year Ended June 30, 2007 | | | 6.63 | | | | (0.05 | )(e) | | | 1.60 | | | | 1.55 | | | | 8.18 | | | | 23.38 | |
January 1, 2006 through June 30, 2006(g) | | | 6.35 | | | | (0.01 | )(e) | | | 0.29 | | | | 0.28 | | | | 6.63 | | | | 4.41 | |
Year Ended December 31, 2005 | | | 5.74 | | | | (0.05 | )(e) | | | 0.66 | | | | 0.61 | | | | 6.35 | | | | 10.63 | |
| | | | | | |
Class B | | | | | | | | | | | | | | | | | | | | | | | | |
Six Months Ended December 31, 2010 (Unaudited) | | | 6.31 | | | | (0.03 | )(e) | | | 1.83 | | | | 1.80 | | | | 8.11 | | | | 28.53 | |
Year Ended June 30, 2010 | | | 5.51 | | | | (0.06 | )(e) | | | 0.86 | | | | 0.80 | | | | 6.31 | | | | 14.52 | |
Year Ended June 30, 2009 | | | 7.67 | | | | (0.06 | )(e) | | | (2.10 | ) | | | (2.16 | ) | | | 5.51 | | | | (28.16 | ) |
Year Ended June 30, 2008 | | | 7.76 | | | | (0.09 | )(e) | | | — | (h) | | | (0.09 | ) | | | 7.67 | | | | (1.16 | ) |
Year Ended June 30, 2007 | | | 6.33 | | | | (0.10 | )(e) | | | 1.53 | | | | 1.43 | | | | 7.76 | | | | 22.59 | |
January 1, 2006 through June 30, 2006 (g) | | | 6.08 | | | | (0.03 | )(e) | | | 0.28 | | | | 0.25 | | | | 6.33 | | | | 4.11 | |
Year Ended December 31, 2005 | | | 5.54 | | | | (0.09 | )(e) | | | 0.63 | | | | 0.54 | | | | 6.08 | | | | 9.75 | |
| | | | | | |
Class C | | | | | | | | | | | | | | | | | | | | | | | | |
Six Months Ended December 31, 2010 (Unaudited) | | | 6.31 | | | | (0.03 | )(e) | | | 1.83 | | | | 1.80 | | | | 8.11 | | | | 28.53 | |
Year Ended June 30, 2010 | | | 5.52 | | | | (0.06 | )(e) | | | 0.85 | | | | 0.79 | | | | 6.31 | | | | 14.31 | |
Year Ended June 30, 2009 | | | 7.68 | | | | (0.06 | )(e) | | | (2.10 | ) | | | (2.16 | ) | | | 5.52 | | | | (28.13 | ) |
Year Ended June 30, 2008 | | | 7.76 | | | | (0.09 | )(e) | | | 0.01 | | | | (0.08 | ) | | | 7.68 | | | | (1.03 | ) |
Year Ended June 30, 2007 | | | 6.34 | | | | (0.11 | )(e) | | | 1.53 | | | | 1.42 | | | | 7.76 | | | | 22.40 | |
May 1, 2006 (i) through June 30, 2006 (g) | | | 6.80 | | | | (0.04 | )(e) | | | (0.42 | ) | | | (0.46 | ) | | | 6.34 | | | | (6.76 | ) |
| | | | | | |
Class R5 | | | | | | | | | | | | | | | | | | | | | | | | |
Six Months Ended December 31, 2010 (Unaudited) | | | 6.86 | | | | — | (e)(h) | | | 1.99 | | | | 1.99 | | | | 8.85 | | | | 29.01 | |
Year Ended June 30, 2010 | | | 5.93 | | | | — | (e)(h) | | | 0.93 | | | | 0.93 | | | | 6.86 | | | | 15.68 | |
January 8, 2009(i) through June 30, 2009 | | | 5.37 | | | | — | (e)(h) | | | 0.56 | | | | 0.56 | | | | 5.93 | | | | 10.43 | |
| | | | | | |
Select Class | | | | | | | | | | | | | | | | | | | | | | | | |
Six Months Ended December 31, 2010 (Unaudited) | | | 6.83 | | | | (0.01 | )(e) | | | 2.00 | | | | 1.99 | | | | 8.82 | | | | 29.14 | |
Year Ended June 30, 2010 | | | 5.93 | | | | (0.01 | )(e) | | | 0.91 | | | | 0.90 | | | | 6.83 | | | | 15.18 | |
Year Ended June 30, 2009 | | | 8.18 | | | | (0.01 | )(e) | | | (2.24 | ) | | | (2.25 | ) | | | 5.93 | | | | (27.51 | ) |
Year Ended June 30, 2008 | | | 8.20 | | | | (0.03 | )(e) | | | 0.01 | | | | (0.02 | ) | | | 8.18 | | | | (0.24 | ) |
Year Ended June 30, 2007 | | | 6.64 | | | | (0.04 | )(e) | | | 1.60 | | | | 1.56 | | | | 8.20 | | | | 23.49 | |
May 1, 2006 (i) through June 30, 2006 (g) | | | 7.11 | | | | (0.01 | )(e) | | | (0.46 | ) | | | (0.47 | ) | | | 6.64 | | | | (6.61 | ) |
| (a) | Annualized for periods less than one year. |
| (b) | Not annualized for periods less than one year. |
| (c) | Includes adjustments in accordance with accounting principles generally accepted in the United States of America and as such, the net asset value for financial reporting purposes and the returns based upon those net asset values may differ from the net asset value and returns for shareholder transactions. |
| (d) | Includes earnings credits and interest expense, each of which is less than 0.01%, if applicable or unless otherwise noted. |
| (e) | Calculated based upon average shares outstanding. |
| (f) | Includes interest expense of 0.01%. |
| (g) | The Fund changed its fiscal year end from December 31 to June 30. |
| (h) | Amount rounds to less than $0.01. |
| (i) | Commencement of offering of class of shares. |
SEE NOTES TO FINANCIAL STATEMENTS.
| | | | | | |
| | | |
| 72 | | | | J.P. MORGAN MID CAP/MULTI-CAP FUNDS | | DECEMBER 31, 2010 |
| | | | | | | | | | | | | | | | | | |
| | | | Ratios/Supplemental data | |
| | | | Ratios to average net assets(a) | | | | |
Net assets,
end of
period
(000’s) | | | Net
expenses (d) | | | Net
investment income
(loss) | | | Expenses
without waivers,
reimbursements and
earnings credits | | | Portfolio
turnover
rate (b) | |
| | | | | | | | | | | | | | | | | | |
| | | | | | | | | | | | | | | | | | |
$ |
151,726 |
| | | 1.26 | % | | | (0.32 | )% | | | 1.31 | % | | | 46 | % |
| | 101,814 | | | | 1.31 | | | | (0.41 | ) | | | 1.31 | | | | 102 | |
| | 71,841 | | | | 1.35 | | | | (0.48 | ) | | | 1.42 | | | | 119 | |
| | 70,546 | | | | 1.34 | | | | (0.58 | ) | | | 1.47 | | | | 118 | |
| | 49,782 | | | | 1.36 | (f) | | | (0.71 | ) | | | 1.66 | | | | 159 | |
| | 71,538 | | | | 1.35 | | | | (0.37 | ) | | | 1.90 | | | | 81 | |
| | 54,737 | | | | 1.35 | | | | (0.81 | ) | | | 1.75 | | | | 140 | |
| | | | |
| | | | | | | | | | | | | | | | | | |
|
3,262 |
| | | 1.76 | | | | (0.84 | ) | | | 1.80 | | | | 46 | |
| | 3,070 | | | | 1.81 | | | | (0.91 | ) | | | 1.81 | | | | 102 | |
| | 3,304 | | | | 1.87 | | | | (1.02 | ) | | | 1.92 | | | | 119 | |
| | 4,340 | | | | 1.91 | | | | (1.16 | ) | | | 1.94 | | | | 118 | |
| | 1,501 | | | | 2.06 | (f) | | | (1.43 | ) | | | 2.17 | | | | 159 | |
| | 1,230 | | | | 2.05 | | | | (1.02 | ) | | | 2.40 | | | | 81 | |
| | 1,359 | | | | 2.05 | | | | (1.51 | ) | | | 2.24 | | | | 140 | |
| | | | |
| | | | | | | | | | | | | | | | | | |
|
16,527 |
| | | 1.76 | | | | (0.83 | ) | | | 1.80 | | | | 46 | |
| | 12,811 | | | | 1.81 | | | | (0.91 | ) | | | 1.81 | | | | 102 | |
| | 9,300 | | | | 1.87 | | | | (1.02 | ) | | | 1.91 | | | | 119 | |
| | 14,499 | | | | 1.88 | | | | (1.16 | ) | | | 1.89 | | | | 118 | |
| | 251 | | | | 2.07 | (f) | | | (1.49 | ) | | | 2.18 | | | | 159 | |
| | 14 | | | | 2.05 | | | | (1.32 | ) | | | 2.37 | | | | 81 | |
| | | | |
| | | | | | | | | | | | | | | | | | |
|
132,551 |
| | | 0.85 | | | | 0.10 | | | | 0.86 | | | | 46 | |
| | 76,767 | | | | 0.86 | | | | 0.05 | | | | 0.86 | | | | 102 | |
| | 46,312 | | | | 0.90 | | | | (0.08 | ) | | | 1.06 | | | | 119 | |
| | | | |
| | | | | | | | | | | | | | | | | | |
|
494,374 |
| | | 1.05 | | | | (0.16 | ) | | | 1.06 | | | | 46 | |
| | 604,663 | | | | 1.06 | | | | (0.16 | ) | | | 1.06 | | | | 102 | |
| | 441,345 | | | | 1.10 | | | | (0.24 | ) | | | 1.17 | | | | 119 | |
| | 399,777 | | | | 1.09 | | | | (0.41 | ) | | | 1.12 | | | | 118 | |
| | 10,985 | | | | 1.11 | (f) | | | (0.50 | ) | | | 1.45 | | | | 159 | |
| | 14 | | | | 1.10 | | | | (0.37 | ) | | | 1.61 | | | | 81 | |
SEE NOTES TO FINANCIAL STATEMENTS.
| | | | | | | | |
| | | |
| DECEMBER 31, 2010 | | J.P. MORGAN MID CAP/MULTI-CAP FUNDS | | | | | 73 | |
FINANCIAL HIGHLIGHTS
FOR THE PERIODS INDICATED
| | | | | | | | | | | | | | | | | | | | | | | | | | | | |
| | | Per share operating performance | |
| | | | | | Investment operations | | | Distributions | | | | | | | |
| | | Net asset
value,
beginning
of period | | | Net
investment
income
(loss) | | | Net realized
and unrealized
gains
(losses) on
investments | | | Total from
investment
operations | | | Net
investment
income | | | Net asset
value,
end of
period | | | Total return
(excludes
sales charge) (b)(c) | |
| | | | | | | |
Mid Cap Core Fund | | | | | | | | | | | | | | | | | | | | | | | | | | | | |
Class A | | | | | | | | | | | | | | | | | | | | | | | | | | | | |
November 30, 2010(e) through December 31, 2010 (Unaudited) | | $ | 15.00 | | | $ | — | (f) | | $ | 0.88 | | | $ | 0.88 | | | $ | — | (g) | | $ | 15.88 | | | | 5.90 | % |
| | | | | | | |
Class C | | | | | | | | | | | | | | | | | | | | | | | | | | | | |
November 30, 2010(e) through December 31, 2010 (Unaudited) | | | 15.00 | | | | — | (f) | | | 0.88 | | | | 0.88 | | | | — | | | | 15.88 | | | | 5.87 | |
| | | | | | | |
Class R2 | | | | | | | | | | | | | | | | | | | | | | | | | | | | |
November 30, 2010(e) through December 31, 2010 (Unaudited) | | | 15.00 | | | | — | (f) | | | 0.88 | | | | 0.88 | | | | — | | | | 15.88 | | | | 5.87 | |
| | | | | | | |
Class R5 | | | | | | | | | | | | | | | | | | | | | | | | | | | | |
November 30, 2010(e) through December 31, 2010 (Unaudited) | | | 15.00 | | | | 0.01 | (f) | | | 0.88 | | | | 0.89 | | | | (0.01 | ) | | | 15.88 | | | | 5.92 | |
| | | | | | | |
Select Class | | | | | | | | | | | | | | | | | | | | | | | | | | | | |
November 30, 2010(e) through December 31, 2010 (Unaudited) | | | 15.00 | | | | 0.01 | (f) | | | 0.88 | | | | 0.89 | | | | (0.01 | ) | | | 15.88 | | | | 5.91 | |
| (a) | Annualized for periods less than one year. |
| (b) | Not annualized for periods less than one year. |
| (c) | Includes adjustments in accordance with accounting principles generally accepted in the United States of America and as such, the net asset value for financial reporting purposes and the returns based upon those net asset values may differ from the net asset value and returns for shareholder transactions. |
| (d) | Includes earnings credits and interest expense, each of which is less than 0.01%, if applicable or unless otherwise noted. |
| (e) | Commencement of operations. |
| (f) | Calculated based upon average shares outstanding. |
| (g) | Amount rounds to less than $0.01. |
| (h) | Ratios are disproportionate between classes due to the size of net assets and fixed expenses. |
SEE NOTES TO FINANCIAL STATEMENTS.
| | | | | | |
| | | |
| 74 | | | | J.P. MORGAN MID CAP/MULTI-CAP FUNDS | | DECEMBER 31, 2010 |
| | | | | | | | | | | | | | | | | | |
| | | | Ratios/Supplemental data | |
| | | | Ratios to average net assets (a) | |
Net assets,
end of
period
(000’s) | | | Net
expenses (d) | | | Net
investment
income
(loss) | | | Expenses
without waivers,
reimbursements and
earnings credits | | | Portfolio
turnover
rate (b) | |
| | | | |
| | | | | | | | | | | | | | | | | | |
| | | | | | | | | | | | | | | | | | |
$ |
84 |
| | | 1.25 | % | | | 0.16 | % | | | 9.67 | %(h) | | | 3 | % |
| | | | |
| | | | | | | | | | | | | | | | | | |
|
53 |
| | | 1.75 | | | | (0.32 | ) | | | 10.99 | (h) | | | 3 | % |
| | | | |
| | | | | | | | | | | | | | | | | | |
|
53 |
| | | 1.50 | | | | (0.07 | ) | | | 10.74 | (h) | | | 3 | % |
| | | | |
| | | | | | | | | | | | | | | | | | |
|
53 |
| | | 0.80 | | | | 0.63 | | | | 10.04 | (h) | | | 3 | % |
| | | | |
| | | | | | | | | | | | | | | | | | |
| 2,985 | | | | 1.00 | | | | 0.43 | | | | 10.23 | (h) | | | 3 | % |
SEE NOTES TO FINANCIAL STATEMENTS.
| | | | | | | | |
| | | |
| DECEMBER 31, 2010 | | J.P. MORGAN MID CAP/MULTI-CAP FUNDS | | | | | 75 | |
FINANCIAL HIGHLIGHTS
FOR THE PERIODS INDICATED
| | | | | | | | | | | | | | | | | | | | | | | | | | | | |
| | | Per share operating performance | |
| | | | | | Investment operations | | | Distributions | |
| | | Net asset
value,
beginning
of period | | | Net
investment
income
(loss) | | | Net realized
and unrealized
gains
(losses) on
investments | | | Total from
investment
operations | | | Net
investment
income | | | Net
realized
gain | | | Total
distributions | |
| | | | | | | |
Mid Cap Equity Fund | | | | | | | | | | | | | | | | | | | | | | | | | | | | |
Class A | | | | | | | | | | | | | | | | | | | | | | | | | | | | |
Six Months Ended December 31, 2010 (Unaudited) | | $ | 22.95 | | | $ | 0.05 | (h) | | $ | 6.16 | | | $ | 6.21 | | | $ | (0.02 | ) | | $ | — | | | $ | (0.02 | ) |
November 2, 2009 (e) through June 30, 2010 | | | 21.55 | | | | 0.05 | | | | 1.41 | | | | 1.46 | | | | (0.06 | ) | | | — | | | | (0.06 | ) |
| | | | | | | |
Class C | | | | | | | | | | | | | | | | | | | | | | | | | | | | |
Six Months Ended December 31, 2010 (Unaudited) | | | 22.93 | | | | (0.02 | )(h) | | | 6.15 | | | | 6.13 | | | | — | | | | — | | | | — | |
November 2, 2009 (e) through June 30, 2010 | | | 21.55 | | | | (0.03 | ) | | | 1.41 | | | | 1.38 | | | | — | (f) | | | — | | | | — | (f) |
| | | | | | | |
Select Class | | | | | | | | | | | | | | | | | | | | | | | | | | | | |
Six Months Ended December 31, 2010 (Unaudited) | | | 22.97 | | | | 0.09 | (h) | | | 6.16 | | | | 6.25 | | | | (0.03 | ) | | | — | | | | (0.03 | ) |
Year Ended June 30, 2010 | | | 18.97 | | | | 0.12 | | | | 4.00 | | | | 4.12 | | | | (0.12 | ) | | | — | | | | (0.12 | ) |
Year Ended June 30, 2009 | | | 28.63 | | | | 0.18 | | | | (8.37 | ) | | | (8.19 | ) | | | (0.17 | ) | | | (1.30 | ) | | | (1.47 | ) |
Year Ended June 30, 2008 | | | 37.93 | | | | 0.11 | | | | (2.80 | ) | | | (2.69 | ) | | | (0.11 | ) | | | (6.50 | ) | | | (6.61 | ) |
Year Ended June 30, 2007 | | | 34.51 | | | | 0.12 | | | | 6.13 | | | | 6.25 | | | | (0.10 | ) | | | (2.73 | ) | | | (2.83 | ) |
January 1, 2006 through June 30, 2006 (g) | | | 32.87 | | | | 0.14 | (h) | | | 1.64 | | | | 1.78 | | | | (0.14 | ) | | | — | | | | (0.14 | ) |
Year Ended December 31, 2005 | | | 33.30 | | | | 0.10 | (h) | | | 3.09 | | | | 3.19 | | | | (0.09 | ) | | | (3.53 | ) | | | (3.62 | ) |
| (a) | Annualized for periods less than one year. |
| (b) | Not annualized for periods less than one year. |
| (c) | Includes adjustments in accordance with accounting principles generally accepted in the United States of America and as such, the net asset value for financial reporting purposes and the returns based upon those net asset values may differ from the net asset value and returns for shareholder transactions. |
| (d) | Includes earnings credits and interest expense, each of which is less than 0.01%, if applicable or unless otherwise noted. |
| (e) | Commencement of offering of class of shares. |
| (f) | Amount rounds to less than $0.01. |
| (g) | The Fund changed its fiscal year end from December 31 to June 30. |
| (h) | Calculated based upon average shares outstanding. |
SEE NOTES TO FINANCIAL STATEMENTS.
| | | | | | |
| | | |
| 76 | | | | J.P. MORGAN MID CAP/MULTI-CAP FUNDS | | DECEMBER 31, 2010 |
| | | | | | | | | | | | | | | | | | | | | | | | | | |
| | | | Ratios/Supplemental data | |
| | | | | | | | | | Ratios to average net assets (a) | | | | |
Net asset
value,
end of
period | | | Total return
(excludes
sales charge) (b)(c) | | | Net assets,
end of
period
(000’s) | | | Net
expenses (d) | | | Net
investment
income
(loss) | | | Expenses without
waivers,
reimbursements and
earnings credits | | | Portfolio
turnover
rate (b) | |
| | | | | | |
| | | | | | | | | | | | | | | | | | | | | | | | | | |
| | | | | | | | | | | | | | | | | | | | | | | | | | |
|
$29.14 |
| | | 27.05 | % | | | $2,014 | | | | 1.24 | % | | | 0.35 | % | | | 1.43 | % | | | 39 | % |
|
22.95 |
| | | 6.77 | | | | 1,394 | | | | 1.24 | | | | 0.30 | | | | 1.44 | | | | 56 | |
| | | | | | |
| | | | | | | | | | | | | | | | | | | | | | | | | | |
| 29.06 | | | | 26.73 | | | | 260 | | | | 1.74 | | | | (0.14 | ) | | | 1.93 | | | | 39 | |
| 22.93 | | | | 6.40 | | | | 65 | | | | 1.74 | | | | (0.23 | ) | | | 1.92 | | | | 56 | |
| | | | | | |
| | | | | | | | | | | | | | | | | | | | | | | | | | |
|
29.19 |
| | | 27.24 | | | | 451,229 | | | | 0.89 | | | | 0.70 | | | | 1.18 | | | | 39 | |
| | 22.97 | | | | 21.72 | | | | 463,478 | | | | 0.89 | | | | 0.55 | | | | 1.17 | | | | 56 | |
| | 18.97 | | | | (28.02 | ) | | | 195,785 | | | | 0.90 | | | | 0.94 | | | | 1.20 | | | | 107 | |
| | 28.63 | | | | (8.19 | ) | | | 189,589 | | | | 0.91 | | | | 0.32 | | | | 1.12 | | | | 79 | |
| | 37.93 | | | | 18.97 | | | | 284,546 | | | | 0.90 | | | | 0.35 | | | | 1.09 | | | | 82 | |
|
34.51 |
| | | 5.42 | | | | 298,104 | | | | 0.90 | | | | 0.85 | | | | 1.08 | | | | 41 | |
| | 32.87 | | | | 9.61 | | | | 268,582 | | | | 0.90 | | | | 0.29 | | | | 1.08 | | | | 99 | |
SEE NOTES TO FINANCIAL STATEMENTS.
| | | | | | | | |
| | | |
| DECEMBER 31, 2010 | | J.P. MORGAN MID CAP/MULTI-CAP FUNDS | | | | | 77 | |
FINANCIAL HIGHLIGHTS
FOR THE PERIODS INDICATED
| | | | | | | | | | | | | | | | | | | | |
| | | Per share operating performance | |
| | | | | | Investment operations | | | Distributions | |
| | | Net asset
value,
beginning
of period | | | Net
investment
income
(loss) | | | Net realized
and unrealized
gains
(losses) on
investments | | | Total from
investment
operations | | | Net realized
gain | |
Mid Cap Growth Fund | | | | | | | | | | | | | | | | | | | | |
Class A | | | | | | | | | | | | | | | | | | | | |
Six Months Ended December 31, 2010 (Unaudited) | | $ | 16.35 | | | $ | (0.03 | )(e) | | $ | 5.17 | | | $ | 5.14 | | | $ | — | |
Year Ended June 30, 2010 | | | 13.68 | | | | (0.09 | )(e) | | | 2.76 | | | | 2.67 | | | | — | |
Year Ended June 30, 2009 | | | 20.46 | | | | (0.07 | )(e) | | | (6.33 | )f) | | | (6.40 | ) | | | (0.38 | ) |
Year Ended June 30, 2008 | | | 24.89 | | | | (0.17 | )(e) | | | (0.45 | ) | | | (0.62 | ) | | | (3.81 | ) |
Year Ended June 30, 2007 | | | 24.85 | | | | (0.18 | )(e) | | | 4.41 | | | | 4.23 | | | | (4.19 | ) |
Year Ended June 30, 2006 | | | 23.99 | | | | (0.10 | ) | | | 2.97 | | | | 2.87 | | | | (2.01 | ) |
| | | | | |
Class B | | | | | | | | | | | | | | | | | | | | |
Six Months Ended December 31, 2010 (Unaudited) | | | 12.90 | | | | (0.06 | )(e) | | | 4.07 | | | | 4.01 | | | | — | |
Year Ended June 30, 2010 | | | 10.85 | | | | (0.14 | )(e) | | | 2.19 | | | | 2.05 | | | | — | |
Year Ended June 30, 2009 | | | 16.45 | | | | (0.13 | )(e) | | | (5.09 | )(f) | | | (5.22 | ) | | | (0.38 | ) |
Year Ended June 30, 2008 | | | 20.88 | | | | (0.26 | )(e) | | | (0.36 | ) | | | (0.62 | ) | | | (3.81 | ) |
Year Ended June 30, 2007 | | | 21.59 | | | | (0.28 | )(e) | | | 3.76 | | | | 3.48 | | | | (4.19 | ) |
Year Ended June 30, 2006 | | | 21.21 | | | | (0.70 | ) | | | 3.09 | | | | 2.39 | | | | (2.01 | ) |
| | | | | |
Class C | | | | | | | | | | | | | | | | | | | | |
Six Months Ended December 31, 2010 (Unaudited) | | | 14.73 | | | | (0.07 | )(e) | | | 4.65 | | | | 4.58 | | | | — | |
Year Ended June 30, 2010 | | | 12.39 | | | | (0.16 | )(e) | | | 2.50 | | | | 2.34 | | | | — | |
Year Ended June 30, 2009 | | | 18.70 | | | | (0.15 | )(e) | | | (5.78 | )(f) | | | (5.93 | ) | | | (0.38 | ) |
Year Ended June 30, 2008 | | | 23.21 | | | | (0.29 | )(e) | | | (0.41 | ) | | | (0.70 | ) | | | (3.81 | ) |
Year Ended June 30, 2007 | | | 23.57 | | | | (0.31 | )(e) | | | 4.14 | | | | 3.83 | | | | (4.19 | ) |
Year Ended June 30, 2006 | | | 22.98 | | | | (0.43 | ) | | | 3.03 | | | | 2.60 | | | | (2.01 | ) |
| | | | | |
Class R2 | | | | | | | | | | | | | | | | | | | | |
Six Months Ended December 31, 2010 (Unaudited) | | | 17.38 | | | | (0.05 | )(e) | | | 5.50 | | | | 5.45 | | | | — | |
Year Ended June 30, 2010 | | | 14.56 | | | | (0.12 | )(e) | | | 2.94 | | | | 2.82 | | | | — | |
June 19, 2009 (h) through June 30, 2009 | | | 14.56 | | | | — | (e)(i) | | | — | (i) | | | — | (i) | | | — | |
| | | | | |
Select Class | | | | | | | | | | | | | | | | | | | | |
Six Months Ended December 31, 2010 (Unaudited) | | | 17.47 | | | | — | (e)(i) | | | 5.52 | | | | 5.52 | | | | — | |
Year Ended June 30, 2010 | | | 14.57 | | | | (0.04 | )(e) | | | 2.94 | | | | 2.90 | | | | — | |
Year Ended June 30, 2009 | | | 21.68 | | | | (0.03 | )(e) | | | (6.70 | )(f) | | | (6.73 | ) | | | (0.38 | ) |
Year Ended June 30, 2008 | | | 26.10 | | | | (0.12 | )(e) | | | (0.49 | ) | | | (0.61 | ) | | | (3.81 | ) |
Year Ended June 30, 2007 | | | 25.81 | | | | (0.12 | )(e) | | | 4.60 | | | | 4.48 | | | | (4.19 | ) |
Year Ended June 30, 2006 | | | 24.78 | | | | 0.10 | | | | 2.94 | | | | 3.04 | | | | (2.01 | ) |
| (a) | Annualized for periods less than one year. |
| (b) | Not annualized for periods less than one year. |
| (c) | Includes adjustments in accordance with accounting principles generally accepted in the United States of America and as such, the net asset value for financial reporting purposes and the returns based upon those net asset values may differ from the net asset value and returns for shareholder transactions. |
| (d) | Includes earnings credits and interest expense, each of which is less than 0.01%, if applicable or unless otherwise noted. |
| (e) | Calculated based upon average shares outstanding. |
| (f) | An affiliate of JPMorgan Chase & Co. reimbursed the Fund for losses incurred from an operational error. There was no impact to the total return and the net realized and unrealized gains (losses) on investments per share and the total return. |
| (g) | Includes a gain incurred resulting from a payment by affiliate. The effect was less than 0.01% on total return. |
| (h) | Commencement of offering of class of shares. |
| (i) | Amount rounds to less than $0.01. |
| (j) | Amount rounds to less than 0.01%. |
SEE NOTES TO FINANCIAL STATEMENTS.
| | | | | | |
| | | |
| 78 | | | | J.P. MORGAN MID CAP/MULTI-CAP FUNDS | | DECEMBER 31, 2010 |
| | | | | | | | | | | | | | | | | | | | | | | | | | | | | | |
| | | | Ratios/Supplemental data | |
| | | | | | | | | | | | | Ratios to average net assets (a) | | | | |
| | | | Net asset
value,
end of
period | | | Total return
(excludes
sales charge) (b)(c) | | | Net assets,
end of
period
(000’s) | | | Net
expenses (d) | | | Net
investment
income
(loss) | | |
Expenses
without waivers,
reimbursements and
earnings credits | | | Portfolio
turnover
rate (b) | |
| | | | | | | | | | | | | | | | | | | | | | | | | | | | | | |
| | | | | | | | | | | | | | | | | | | | | | | | | | | | | | |
| | | | $ | 21.49 | | | | 31.44 | % | | $ | 668,713 | | | | 1.22 | % | | | (0.32 | )% | | | 1.39 | % | | | 39 | % |
| | | | | 16.35 | | | | 19.52 | | | | 560,054 | | | | 1.24 | | | | (0.53 | ) | | | 1.42 | | | | 82 | |
| | | | | 13.68 | | | | (30.97 | )(f) | | | 520,201 | | | | 1.24 | | | | (0.48 | ) | | | 1.56 | | | | 96 | |
| | | | | 20.46 | | | | (3.22 | )(g) | | | 384,225 | | | | 1.24 | | | | (0.75 | ) | | | 1.39 | | | | 95 | |
| | | | | 24.89 | | | | 18.65 | | | | 480,084 | | | | 1.24 | | | | (0.73 | ) | | | 1.36 | | | | 119 | |
| | | | | 24.85 | | | | 12.20 | | | | 451,565 | | | | 1.24 | | | | (0.42 | ) | | | 1.41 | | | | 112 | |
| | | | | | | |
| | | | | | | | | | | | | | | | | | | | | | | | | | | | | | |
| | | | | 16.91 | | | | 31.09 | | | | 22,221 | | | | 1.75 | | | | (0.85 | ) | | | 1.89 | | | | 39 | |
| | | | | 12.90 | | | | 18.89 | | | | 20,893 | | | | 1.77 | | | | (1.07 | ) | | | 1.92 | | | | 82 | |
| | | | | 10.85 | | | | (31.35 | )(f) | | | 29,963 | | | | 1.88 | | | | (1.14 | ) | | | 2.03 | | | | 96 | |
| | | | | 16.45 | | | | (3.90 | )(g) | | | 69,186 | | | | 1.88 | | | | (1.38 | ) | | | 1.89 | | | | 95 | |
| | | | | 20.88 | | | | 17.93 | | | | 123,779 | | | | 1.86 | | | | (1.35 | ) | | | 1.86 | | | | 119 | |
| | | | | 21.59 | | | | 11.51 | | | | 155,268 | | | | 1.89 | | | | (1.07 | ) | | | 1.91 | | | | 112 | |
| | | | | | | |
| | | | | | | | | | | | | | | | | | | | | | | | | | | | | | |
| | | | | 19.31 | | | | 31.09 | | | | 27,441 | | | | 1.75 | | | | (0.85 | ) | | | 1.89 | | | | 39 | |
| | | | | 14.73 | | | | 18.89 | | | | 23,389 | | | | 1.77 | | | | (1.06 | ) | | | 1.92 | | | | 82 | |
| | | | | 12.39 | | | | (31.38 | )(f) | | | 25,624 | | | | 1.88 | | | | (1.13 | ) | | | 2.04 | | | | 96 | |
| | | | | 18.70 | | | | (3.85 | )(g) | | | 27,785 | | | | 1.88 | | | | (1.38 | ) | | | 1.89 | | | | 95 | |
| | | | | 23.21 | | | | 17.90 | | | | 38,805 | | | | 1.86 | | | | (1.35 | ) | | | 1.86 | | | | 119 | |
| | | | | 23.57 | | | | 11.53 | | | | 42,448 | | | | 1.89 | | | | (1.07 | ) | | | 1.91 | | | | 112 | |
| | | | | | | |
| | | | | | | | | | | | | | | | | | | | | | | | | | | | | | |
| | | | | 22.83 | | | | 31.36 | | | | 83 | | | | 1.38 | | | | (0.47 | ) | | | 1.64 | | | | 39 | |
| | | | | 17.38 | | | | 19.37 | | | | 63 | | | | 1.40 | | | | (0.69 | ) | | | 1.67 | | | | 82 | |
| | | | | 14.56 | | | | 0.00 | | | | 83 | | | | 1.22 | | | | (0.31 | ) | | | 1.94 | | | | 96 | |
| | | | | | | |
| | | | | | | | | | | | | | | | | | | | | | | | | | | | | | |
| | | | | 22.99 | | | | 31.60 | | | | 920,707 | | | | 0.91 | | | | (0.00 | )(j) | | | 1.14 | | | | 39 | |
| | | | | 17.47 | | | | 19.90 | | | | 685,843 | | | | 0.93 | | | | (0.22 | ) | | | 1.17 | | | | 82 | |
| | | | | 14.57 | | | | (30.74 | )(f) | | | 631,380 | | | | 0.98 | | | | (0.23 | ) | | | 1.30 | | | | 96 | |
| | | | | 21.68 | | | | (3.02 | )(g) | | | 539,292 | | | | 0.99 | | | | (0.49 | ) | | | 1.13 | | | | 95 | |
| | | | | 26.10 | | | | 18.95 | | | | 740,208 | | | | 0.99 | | | | (0.48 | ) | | | 1.11 | | | | 119 | |
| | | | | 25.81 | | | | 12.51 | | | | 769,574 | | | | 0.99 | | | | (0.19 | ) | | | 1.16 | | | | 112 | |
SEE NOTES TO FINANCIAL STATEMENTS.
| | | | | | | | |
| | | |
| DECEMBER 31, 2010 | | J.P. MORGAN MID CAP/MULTI-CAP FUNDS | | | | | 79 | |
FINANCIAL HIGHLIGHTS
FOR THE PERIODS INDICATED
| | | | | | | | | | | | | | | | | | | | | | | | | | | | |
| | | Per share operating performance | | | | | | | |
| | | | | | Investment operations | | | Distributions | |
| | | Net asset
value,
beginning
of period | | | Net
investment
income
(loss) | | | Net realized
and unrealized
gains
(losses) on
investments | | | Total from
investment
operations | | | Net
investment
income | | | Net
realized
gain | | | Total
distributions | |
Mid Cap Value Fund | | | | | | | | | | | | | | | | | | | | | | | | | | | | |
Class A | | | | | | | | | | | | | | | | | | | | | | | | | | | | |
Six Months Ended December 31, 2010 (Unaudited) | | $ | 18.91 | | | $ | 0.11 | (e) | | $ | 4.29 | | | $ | 4.40 | | | $ | (0.18 | ) | | $ | — | | | $ | (0.18 | ) |
Year Ended June 30, 2010 | | | 15.24 | | | | 0.19 | (e) | | | 3.48 | | | | 3.67 | | | | — | | | | — | | | | — | |
Year Ended June 30, 2009 | | | 21.91 | | | | 0.28 | (e) | | | (5.92 | ) | | | (5.64 | ) | | | (0.34 | ) | | | (0.69 | ) | | | (1.03 | ) |
Year Ended June 30, 2008 | | | 27.71 | | | | 0.16 | | | | (3.78 | ) | | | (3.62 | ) | | | (0.12 | ) | | | (2.06 | ) | | | (2.18 | ) |
Year Ended June 30, 2007 | | | 24.73 | | | | 0.17 | | | | 4.21 | | | | 4.38 | | | | (0.25 | ) | | | (1.15 | ) | | | (1.40 | ) |
January 1, 2006 through June 30, 2006(f) | | | 23.28 | | | | 0.14 | | | | 1.31 | | | | 1.45 | | | | — | | | | — | | | | — | |
Year Ended December 31, 2005 | | | 22.05 | | | | 0.12 | (e) | | | 1.84 | | | | 1.96 | | | | (0.12 | ) | | | (0.61 | ) | | | (0.73 | ) |
| | | | | | | |
Class B | | | | | | | | | | | | | | | | | | | | | | | | | | | | |
Six Months Ended December 31, 2010 (Unaudited) | | | 18.38 | | | | 0.05 | (e) | | | 4.18 | | | | 4.23 | | | | (0.04 | ) | | | — | | | | (0.04 | ) |
Year Ended June 30, 2010 | | | 14.89 | | | | 0.10 | (e) | | | 3.39 | | | | 3.49 | | | | — | | | | — | | | | — | |
Year Ended June 30, 2009 | | | 21.39 | | | | 0.20 | (e) | | | (5.79 | ) | | | (5.59 | ) | | | (0.22 | ) | | | (0.69 | ) | | | (0.91 | ) |
Year Ended June 30, 2008 | | | 27.11 | | | | 0.03 | | | | (3.69 | ) | | | (3.66 | ) | | | — | | | | (2.06 | ) | | | (2.06 | ) |
Year Ended June 30, 2007 | | | 24.21 | | | | 0.05 | | | | 4.12 | | | | 4.17 | | | | (0.12 | ) | | | (1.15 | ) | | | (1.27 | ) |
January 1, 2006 through June 30, 2006(f) | | | 22.86 | | | | 0.08 | | | | 1.27 | | | | 1.35 | | | | — | | | | — | | | | — | |
Year Ended December 31, 2005 | | | 21.66 | | | | — | (e)(g) | | | 1.81 | | | | 1.81 | | | | — | | | | (0.61 | ) | | | (0.61 | ) |
| | | | | | | |
Class C | | | | | | | | | | | | | | | | | | | | | | | | | | | | |
Six Months Ended December 31, 2010 (Unaudited) | | | 18.44 | | | | 0.05 | (e) | | | 4.18 | | | | 4.23 | | | | (0.07 | ) | | | — | | | | (0.07 | ) |
Year Ended June 30, 2010 | | | 14.94 | | | | 0.10 | (e) | | | 3.40 | | | | 3.50 | | | | — | | | | — | | | | — | |
Year Ended June 30, 2009 | | | 21.45 | | | | 0.20 | (e) | | | (5.80 | ) | | | (5.60 | ) | | | (0.22 | ) | | | (0.69 | ) | | | (0.91 | ) |
Year Ended June 30, 2008 | | | 27.17 | | | | 0.04 | | | | (3.70 | ) | | | (3.66 | ) | | | — | | | | (2.06 | ) | | | (2.06 | ) |
Year Ended June 30, 2007 | | | 24.26 | | | | 0.05 | | | | 4.13 | | | | 4.18 | | | | (0.12 | ) | | | (1.15 | ) | | | (1.27 | ) |
January 1, 2006 through June 30, 2006 (f) | | | 22.90 | | | | 0.08 | | | | 1.28 | | | | 1.36 | | | | — | | | | — | | | | — | |
Year Ended December 31, 2005 | | | 21.70 | | | | — | (e)(g) | | | 1.81 | | | | 1.81 | | | | — | (g) | | | (0.61 | ) | | | (0.61 | ) |
| | | | | | | |
Class R2 | | | | | | | | | | | | | | | | | | | | | | | | | | | | |
Six Months Ended December 31, 2010 (Unaudited) | | | 18.63 | | | | 0.08 | (e) | | | 4.23 | | | | 4.31 | | | | (0.24 | ) | | | — | | | | (0.24 | ) |
Year Ended June 30, 2010 | | | 15.06 | | | | 0.15 | (e) | | | 3.42 | | | | 3.57 | | | | — | | | | — | | | | — | |
November 3, 2008 (h) through June 30, 2009 | | | 16.34 | | | | 0.20 | (e) | | | (0.30 | ) | | | (0.10 | ) | | | (0.49 | ) | | | (0.69 | ) | | | (1.18 | ) |
| | | | | | | |
Institutional Class | | | | | | | | | | | | | | | | | | | | | | | | | | | | |
Six Months Ended December 31, 2010 (Unaudited) | | | 19.22 | | | | 0.16 | (e) | | | 4.38 | | | | 4.54 | | | | (0.28 | ) | | | — | | | | (0.28 | ) |
Year Ended June 30, 2010 | | | 15.43 | | | | 0.29 | (e) | | | 3.52 | | | | 3.81 | | | | (0.02 | ) | | | — | | | | (0.02 | ) |
Year Ended June 30, 2009 | | | 22.31 | | | | 0.38 | (e) | | | (6.06 | ) | | | (5.68 | ) | | | (0.51 | ) | | | (0.69 | ) | | | (1.20 | ) |
Year Ended June 30, 2008 | | | 28.17 | | | | 0.31 | | | | (3.85 | ) | | | (3.54 | ) | | | (0.26 | ) | | | (2.06 | ) | | | (2.32 | ) |
Year Ended June 30, 2007 | | | 25.10 | | | | 0.30 | | | | 4.29 | | | | 4.59 | | | | (0.37 | ) | | | (1.15 | ) | | | (1.52 | ) |
January 1, 2006 through June 30, 2006 (f) | | | 23.58 | | | | 0.20 | | | | 1.32 | | | | 1.52 | | | | — | | | | — | | | | — | |
Year Ended December 31, 2005 | | | 22.30 | | | | 0.24 | (e) | | | 1.86 | | | | 2.10 | | | | (0.21 | ) | | | (0.61 | ) | | | (0.82 | ) |
| | | | | | | |
Select Class | | | | | | | | | | | | | | | | | | | | | | | | | | | | |
Six Months Ended December 31, 2010 (Unaudited) | | | 19.07 | | | | 0.14 | (e) | | | 4.33 | | | | 4.47 | | | | (0.24 | ) | | | — | | | | (0.24 | ) |
Year Ended June 30, 2010 | | | 15.34 | | | | 0.24 | (e) | | | 3.49 | | | | 3.73 | | | | — | (g) | | | — | | | | — | (g) |
Year Ended June 30, 2009 | | | 22.14 | | | | 0.34 | (e) | | | (6.01 | ) | | | (5.67 | ) | | | (0.44 | ) | | | (0.69 | ) | | | (1.13 | ) |
Year Ended June 30, 2008 | | | 27.96 | | | | 0.27 | | | | (3.85 | ) | | | (3.58 | ) | | | (0.18 | ) | | | (2.06 | ) | | | (2.24 | ) |
Year Ended June 30, 2007 | | | 24.93 | | | | 0.27 | | | | 4.22 | | | | 4.49 | | | | (0.31 | ) | | | (1.15 | ) | | | (1.46 | ) |
January 1, 2006 through June 30, 2006 (f) | | | 23.44 | | | | 0.17 | | | | 1.32 | | | | 1.49 | | | | — | | | | — | | | | — | |
Year Ended December 31, 2005 | | | 22.18 | | | | 0.18 | (e) | | | 1.85 | | | | 2.03 | | | | (0.16 | ) | | | (0.61 | ) | | | (0.77 | ) |
| (a) | Annualized for periods less than one year. |
| (b) | Not annualized for periods less than one year. |
| (c) | Includes adjustments in accordance with accounting principles generally accepted in the United States of America and as such, the net asset value for financial reporting purposes and the returns based upon those net asset values may differ from the net asset value and returns for shareholder transactions. |
| (d) | Includes earnings credits and interest expense, each of which is less than 0.01%, if applicable or unless otherwise noted. |
| (e) | Calculated based upon average shares outstanding. |
| (f) | The Fund changed its fiscal year end from December 31 to June 30. |
| (g) | Amount rounds to less than $0.01. |
| (h) | Commencement of offering of class of shares. |
SEE NOTES TO FINANCIAL STATEMENTS.
| | | | | | |
| | | |
| 80 | | | | J.P. MORGAN MID CAP/MULTI-CAP FUNDS | | DECEMBER 31, 2010 |
| | | | | | | | | | | | | | | | | | | | | | | | | | |
| | | | Ratios/Supplemental data | |
| | | | | | | | | | Ratios to average net assets (a) | | | | |
Net asset
value,
end of
period | | | Total return
(excludes
sales charge) (b)(c) | | | Net assets,
end of
period
(000’s) | | | Net
expenses(d) | | | Net
investment income
(loss) | | | Expenses
without waivers,
reimbursements
and earnings
credits | | | Portfolio
turnover
rate (b) | |
| | | | | | | | | | | | | | | | | | | | | | | | | | |
| | | | | | | | | | | | | | | | | | | | | | | | | | |
| $ | 23.13 | | | | 23.27 | % | | $ | 2,000,247 | | | | 1.23 | % | | | 1.01 | % | | | 1.39 | % | | | 19 | % |
| | 18.91 | | | | 24.08 | | | | 1,705,572 | | | | 1.23 | | | | 1.04 | | | | 1.40 | | | | 34 | |
| | 15.24 | | | | (25.49 | ) | | | 1,600,044 | | | | 1.25 | | | | 1.71 | | | | 1.42 | | | | 47 | |
| | 21.91 | | | | (13.70 | ) | | | 2,661,377 | | | | 1.25 | | | | 0.66 | | | | 1.42 | | | | 31 | |
| | 27.71 | | | | 18.21 | | | | 3,822,632 | | | | 1.25 | | | | 0.71 | | | | 1.35 | | | | 45 | |
| | 24.73 | | | | 6.23 | | | | 3,001,515 | | | | 1.25 | | | | 1.15 | | | | 1.39 | | | | 20 | |
| | 23.28 | | | | 8.87 | | | | 2,822,767 | | | | 1.25 | | | | 0.54 | | | | 1.39 | | | | 45 | |
| | | | | | |
| | | | | | | | | | | | | | | | | | | | | | | | | | |
| | 22.57 | | | | 23.00 | | | | 103,330 | | | | 1.74 | | | | 0.50 | | | | 1.89 | | | | 19 | |
| | 18.38 | | | | 23.44 | | | | 96,966 | | | | 1.74 | | | | 0.53 | | | | 1.90 | | | | 34 | |
| | 14.89 | | | | (25.89 | ) | | | 108,114 | | | | 1.75 | | | | 1.21 | | | | 1.92 | | | | 47 | |
| | 21.39 | | | | (14.14 | ) | | | 163,091 | | | | 1.75 | | | | 0.15 | | | | 1.92 | | | | 31 | |
| | 27.11 | | | | 17.65 | | | | 237,745 | | | | 1.75 | | | | 0.20 | | | | 1.85 | | | | 45 | |
| | 24.21 | | | | 5.91 | | | | 229,998 | | | | 1.75 | | | | 0.64 | | | | 1.89 | | | | 20 | |
| | 22.86 | | | | 8.36 | | | | 233,396 | | | | 1.77 | | | | (0.01 | ) | | | 1.89 | | | | 45 | |
| | | | | | |
| | | | | | | | | | | | | | | | | | | | | | | | | | |
| | 22.60 | | | | 22.96 | | | | 360,224 | | | | 1.74 | | | | 0.50 | | | | 1.89 | | | | 19 | |
| | 18.44 | | | | 23.43 | | | | 309,513 | | | | 1.74 | | | | 0.53 | | | | 1.90 | | | | 34 | |
| | 14.94 | | | | (25.88 | ) | | | 299,956 | | | | 1.75 | | | | 1.20 | | | | 1.92 | | | | 47 | |
| | 21.45 | | | | (14.11 | ) | | | 523,722 | | | | 1.75 | | | | 0.14 | | | | 1.92 | | | | 31 | |
| | 27.17 | | �� | | 17.64 | | | | 818,261 | | | | 1.75 | | | | 0.20 | | | | 1.85 | | | | 45 | |
| | 24.26 | | | | 5.94 | | | | 790,689 | | | | 1.75 | | | | 0.64 | | | | 1.89 | | | | 20 | |
| | 22.90 | | | | 8.34 | | | | 822,366 | | | | 1.76 | | | | 0.01 | | | | 1.89 | | | | 45 | |
| | | | | | |
| | | | | | | | | | | | | | | | | | | | | | | | | | |
| | 22.70 | | | | 23.14 | | | | 3,507 | | | | 1.49 | | | | 0.75 | | | | 1.64 | | | | 19 | |
| | 18.63 | | | | 23.71 | | | | 1,441 | | | | 1.49 | | | | 0.77 | | | | 1.65 | | | | 34 | |
| | 15.06 | | | | (0.24 | ) | | | 294 | | | | 1.50 | | | | 2.12 | | | | 1.69 | | | | 47 | |
| | | | | | |
| | | | | | | | | | | | | | | | | | | | | | | | | | |
| | 23.48 | | | | 23.65 | | | | 2,528,410 | | | | 0.74 | | | | 1.50 | | | | 0.99 | | | | 19 | |
| | 19.22 | | | | 24.68 | | | | 1,913,930 | | | | 0.74 | | | | 1.52 | | | | 1.00 | | | | 34 | |
| | 15.43 | | | | (25.15 | ) | | | 1,424,004 | | | | 0.75 | | | | 2.26 | | | | 1.02 | | | | 47 | |
| | 22.31 | | | | (13.25 | ) | | | 1,777,057 | | | | 0.75 | | | | 1.16 | | | | 1.02 | | | | 31 | |
| | 28.17 | | | | 18.82 | | | | 2,566,230 | | | | 0.75 | | | | 1.21 | | | | 0.95 | | | | 45 | |
| | 25.10 | | | | 6.45 | | | | 2,009,351 | | | | 0.75 | | | | 1.65 | | | | 0.99 | | | | 20 | |
| | 23.58 | | | | 9.42 | | | | 1,915,393 | | | | 0.75 | | | | 1.02 | | | | 0.98 | | | | 45 | |
| | | | | | |
| | | | | | | | | | | | | | | | | | | | | | | | | | |
| | 23.30 | | | | 23.45 | | | | 1,327,321 | | | | 0.98 | | | | 1.27 | | | | 1.14 | | | | 19 | |
| | 19.07 | | | | 24.35 | | | | 1,061,308 | | | | 0.98 | | | | 1.29 | | | | 1.15 | | | | 34 | |
| | 15.34 | | | | (25.31 | ) | | | 766,965 | | | | 1.00 | | | | 2.09 | | | | 1.18 | | | | 47 | |
| | 22.14 | | | | (13.46 | ) | | | 721,777 | | | | 1.00 | | | | 0.90 | | | | 1.16 | | | | 31 | |
| | 27.96 | | | | 18.49 | | | | 1,183,839 | | | | 1.00 | | | | 0.95 | | | | 1.10 | | | | 45 | |
| | 24.93 | | | | 6.36 | | | | 1,255,960 | | | | 1.00 | | | | 1.40 | | | | 1.14 | | | | 20 | |
| | 23.44 | | | | 9.16 | | | | 1,222,881 | | | | 1.00 | | | | 0.80 | | | | 1.13 | | | | 45 | |
SEE NOTES TO FINANCIAL STATEMENTS.
| | | | | | | | |
| | | |
| DECEMBER 31, 2010 | | J.P. MORGAN MID CAP/MULTI-CAP FUNDS | | | | | 81 | |
FINANCIAL HIGHLIGHTS
FOR THE PERIODS INDICATED
| | | | | | | | | | | | | | | | | | | | | | | | | | | | | | | | | | | | |
| | | Per share operating performance | |
| | | | | | Investment operations | | | Distributions | | | | |
| | | Net asset
value,
beginning
of period | | | Net
investment
income
(loss) | | |
Net realized
and
unrealized gains
(losses) on
investments
| | | Total from
investment
operations | | | Net
investment
income | | | Net
realized
gain | | | Return
of
capital | | | Total
distributions | | | Redemption
fees | |
Multi-Cap Market Neutral Fund | | | | | | | | | | | | | | | | | | | | | | | | | | | | | | | | | | | | |
Class A | | | | | | | | | | | | | | | | | | | | | | | | | | | | | | | | | | | | |
Six Months Ended December 31, 2010 (Unaudited) | | $ | 9.71 | | | $ | (0.09 | )(f) | | $ | (0.04 | ) | | $ | (0.13 | ) | | $ | — | | | $ | — | | | $ | — | | | $ | — | | | $ | — | |
Year Ended June 30, 2010 | | | 10.21 | | | | (0.17 | )(f) | | | (0.33 | ) | | | (0.50 | ) | | | — | | | | — | | | | — | | | | — | | | | — | |
Year Ended June 30, 2009 | | | 10.23 | | | | (0.08 | )(f) | | | 0.06 | | | | (0.02 | ) | | | — | | | | — | | | | — | | | | — | | | | — | |
Year Ended June 30, 2008 | | | 11.24 | | | | 0.28 | (f) | | | (0.74 | ) | | | (0.46 | ) | | | (0.54 | ) | | | — | | | | (0.01 | ) | | | (0.55 | ) | | | — | |
Year Ended June 30, 2007 | | | 10.98 | | | | 0.37 | | | | 0.20 | | | | 0.57 | | | | (0.31 | ) | | | — | | | | — | | | | (0.31 | ) | | | — | |
Year Ended June 30, 2006 | | | 10.93 | | | | 0.26 | | | | 0.28 | | | | 0.54 | | | | (0.17 | ) | | | (0.32 | ) | | | — | | | | (0.49 | ) | | | — | (g) |
| | | | | | | | | |
Class B | | | | | | | | | | | | | | | | | | | | | | | | | | | | | | | | | | | | |
Six Months Ended December 31, 2010 (Unaudited) | | | 9.44 | | | | (0.13 | )(f) | | | (0.03 | ) | | | (0.16 | ) | | | — | | | | — | | | | — | | | | — | | | | — | |
Year Ended June 30, 2010 | | | 10.01 | | | | (0.23 | )(f) | | | (0.34 | ) | | | (0.57 | ) | | | — | | | | — | | | | — | | | | — | | | | — | |
Year Ended June 30, 2009 | | | 10.10 | | | | (0.15 | )(f) | | | 0.06 | | | | (0.09 | ) | | | — | | | | — | | | | — | | | | — | | | | — | |
Year Ended June 30, 2008 | | | 11.07 | | | | 0.17 | (f) | | | (0.70 | ) | | | (0.53 | ) | | | (0.43 | ) | | | — | | | | (0.01 | ) | | | (0.44 | ) | | | — | |
Year Ended June 30, 2007 | | | 10.80 | | | | 0.29 | | | | 0.20 | | | | 0.49 | | | | (0.22 | ) | | | — | | | | — | | | | (0.22 | ) | | | — | |
Year Ended June 30, 2006 | | | 10.76 | | | | 0.17 | | | | 0.28 | | | | 0.45 | | | | (0.09 | ) | | | (0.32 | ) | | | — | | | | (0.41 | ) | | | — | (g) |
| | | | | | | | | |
Class C | | | | | | | | | | | | | | | | | | | | | | | | | | | | | | | | | | | | |
Six Months Ended December 31, 2010 (Unaudited) | | | 9.46 | | | | (0.12 | )(f) | | | (0.04 | ) | | | (0.16 | ) | | | — | | | | — | | | | — | | | | — | | | | — | |
Year Ended June 30, 2010 | | | 10.02 | | | | (0.23 | )(f) | | | (0.33 | ) | | | (0.56 | ) | | | — | | | | — | | | | — | | | | — | | | | — | |
Year Ended June 30, 2009 | | | 10.12 | | | | (0.15 | )(f) | | | 0.05 | | | | (0.10 | ) | | | — | | | | — | | | | — | | | | — | | | | — | |
Year Ended June 30, 2008 | | | 11.07 | | | | 0.19 | (f) | | | (0.71 | ) | | | (0.52 | ) | | | (0.42 | ) | | | — | | | | (0.01 | ) | | | (0.43 | ) | | | — | |
Year Ended June 30, 2007 | | | 10.80 | | | | 0.29 | | | | 0.20 | | | | 0.49 | | | | (0.22 | ) | | | — | | | | — | | | | (0.22 | ) | | | — | |
Year Ended June 30, 2006 | | | 10.77 | | | | 0.17 | | | | 0.27 | | | | 0.44 | | | | (0.09 | ) | | | (0.32 | ) | | | — | | | | (0.41 | ) | | | — | (g) |
| | | | | | | | | |
Select Class | | | | | | | | | | | | | | | | | | | | | | | | | | | | | | | | | | | | |
Six Months Ended December 31, 2010 (Unaudited) | | | 9.79 | | | | (0.08 | )(f) | | | (0.04 | ) | | | (0.12 | ) | | | — | | | | — | | | | — | | | | — | | | | — | |
Year Ended June 30, 2010 | | | 10.27 | | | | (0.14 | )(f) | | | (0.34 | ) | | | (0.48 | ) | | | — | | | | — | | | | — | | | | — | | | | — | |
Year Ended June 30, 2009 | | | 10.27 | | | | (0.05 | )(f) | | | 0.05 | | | | — | (g) | | | — | | | | — | | | | — | | | | — | | | | — | |
Year Ended June 30, 2008 | | | 11.31 | | | | 0.30 | (f) | | | (0.73 | ) | | | (0.43 | ) | | | (0.60 | ) | | | — | | | | (0.01 | ) | | | (0.61 | ) | | | — | |
Year Ended June 30, 2007 | | | 11.04 | | | | 0.36 | | | | 0.25 | | | | 0.61 | | | | (0.34 | ) | | | — | | | | — | | | | (0.34 | ) | | | — | |
Year Ended June 30, 2006 | | | 10.99 | | | | 0.24 | | | | 0.32 | | | | 0.56 | | | | (0.19 | ) | | | (0.32 | ) | | | — | | | | (0.51 | ) | | | — | (g) |
| (a) | Annualized for periods less than one year. |
| (b) | Not annualized for periods less than one year. |
| (c) | Includes adjustments in accordance with accounting principles generally accepted in the United States of America and as such, the net asset value for financial reporting purposes and the returns based upon those net asset values may differ from the net asset value and returns for shareholder transactions. |
| (d) | Includes earnings credits and interest expense, each of which is less than 0.01%, if applicable or unless otherwise noted. |
| (e) | The Fund commenced on June 30, 2009 presenting portfolio turnover in two ways, one including short sales and the other excluding short sales. For periods prior to June 30, 2009, the Fund’s portfolio turnover calculation excluded short sales. |
| (f) | Calculated based upon average shares outstanding. |
| (g) | Amount rounds to less than $0.01. |
SEE NOTES TO FINANCIAL STATEMENTS.
| | | | | | |
| | | |
| 82 | | | | J.P. MORGAN MID CAP/MULTI-CAP FUNDS | | DECEMBER 31, 2010 |
| | | | | | | | | | | | | | | | | | | | | | | | | | | | | | | | | | | | | | |
| | | | Ratios/Supplemental data | |
| | | | Ratios to average net assets(a) | | | | | | | |
Net asset
value,
end of
period | | | Total return
(excludes
sales charge) (b)(c) | | | Net assets,
end of
period
(000’s) | | | Net
expenses
(including
dividend and
interest
expense for
securities
sold
short)(d) | | | Net
expenses
(excluding
dividend and
interest
expense for
securities
sold
short)(d) | | | Net
investment income
(loss) | | | Expenses
without waivers,
reimbursements and
earnings credits
(including dividend
and interest
expense for
securities sold
short) | | | Expenses
without waivers,
reimbursements and
earnings credits
(excluding dividend
and interest
expense for
securities sold
short) | | | Portfolio
turnover rate
(excluding
short sales)
(b)(e) | | | Portfolio
turnover rate
(including
short sales)
(b)(e) | |
| | | | | | | | | | | | | | | | | | | | | | | | | | | | | | | | | | | | | | |
| | | | | | | | | | | | | | | | | | | | | | | | | | | | | | | | | | | | | | |
$ |
9.58 |
| | | (1.34 | )% | | $ | 88,914 | | | | 3.27 | % | | | 1.49 | % | | | (1.83 | )% | | | 3.73 | % | | | 1.95 | % | | | 78 | % | | | 177 | % |
| | 9.71 | | | | (4.90 | ) | | | 94,549 | | | | 2.94 | | | | 1.49 | | | | (1.65 | ) | | | 3.39 | | | | 1.94 | | | | 146 | | | | 348 | |
| | 10.21 | | | | (0.20 | ) | | | 67,884 | | | | 2.84 | | | | 1.50 | | | | (0.79 | ) | | | 3.29 | | | | 1.95 | | | | 175 | | | | 350 | |
| | 10.23 | | | | (4.00 | ) | | | 77,838 | | | | 2.52 | | | | 1.51 | | | | 2.62 | | | | 2.94 | | | | 1.93 | | | | 116 | | | | — | |
| | 11.24 | | | | 5.27 | | | | 204,059 | | | | 2.69 | | | | 1.50 | | | | 3.32 | | | | 3.10 | | | | 1.91 | | | | 96 | | | | — | |
| | 10.98 | | | | 5.14 | | | | 190,855 | | | | 2.60 | | | | 1.50 | | | | 2.38 | | | | 3.02 | | | | 1.92 | | | | 121 | | | | — | |
| | | | | | | | | |
| | | | | | | | | | | | | | | | | | | | | | | | | | | | | | | | | | | | | | |
|
9.28 |
| | | (1.69 | ) | | | 5,680 | | | | 4.06 | | | | 2.24 | | | | (2.65 | ) | | | 4.27 | | | | 2.45 | | | | 78 | | | | 177 | % |
| | 9.44 | | | | (5.69 | ) | | | 7,849 | | | | 3.69 | | | | 2.24 | | | | (2.39 | ) | | | 3.89 | | | | 2.44 | | | | 146 | | | | 348 | |
| | 10.01 | | | | (0.89 | ) | | | 12,766 | | | | 3.59 | | | | 2.25 | | | | (1.55 | ) | | | 3.79 | | | | 2.45 | | | | 175 | | | | 350 | |
| | 10.10 | | | | (4.77 | ) | | | 16,402 | | | | 3.28 | | | | 2.26 | | | | 1.66 | | | | 3.45 | | | | 2.43 | | | | 116 | | | | — | |
| | 11.07 | | | | 4.56 | | | | 24,974 | | | | 3.44 | | | | 2.25 | | | | 2.60 | | | | 3.60 | | | | 2.41 | | | | 96 | | | | — | |
| | 10.80 | | | | 4.33 | | | | 28,129 | | | | 3.35 | | | | 2.25 | | | | 1.63 | | | | 3.52 | | | | 2.42 | | | | 121 | | | | — | |
| | | | | | | | | |
| | | | | | | | | | | | | | | | | | | | | | | | | | | | | | | | | | | | | | |
|
9.30 |
| | | (1.69 | ) | | | 30,174 | | | | 4.04 | | | | 2.24 | | | | (2.63 | ) | | | 4.26 | | | | 2.45 | | | | 78 | | | | 177 | % |
| | 9.46 | | | | (5.59 | ) | | | 39,610 | | | | 3.70 | | | | 2.24 | | | | (2.39 | ) | | | 3.89 | | | | 2.44 | | | | 146 | | | | 348 | |
| | 10.02 | | | | (0.99 | ) | | | 61,467 | | | | 3.59 | | | | 2.25 | | | | (1.54 | ) | | | 3.79 | | | | 2.45 | | | | 175 | | | | 350 | |
| | 10.12 | | | | (4.71 | ) | | | 90,603 | | | | 3.28 | | | | 2.26 | | | | 1.79 | | | | 3.45 | | | | 2.43 | | | | 116 | | | | — | |
| | 11.07 | | | | 4.56 | | | | 187,546 | | | | 3.44 | | | | 2.25 | | | | 2.60 | | | | 3.60 | | | | 2.41 | | | | 96 | | | | — | |
| | 10.80 | | | | 4.25 | | | | 200,403 | | | | 3.35 | | | | 2.25 | | | | 1.61 | | | | 3.52 | | | | 2.42 | | | | 121 | | | | — | |
| | | | | | | | | |
| | | | | | | | | | | | | | | | | | | | | | | | | | | | | | | | | | | | | | |
| 9.67 | | | | (1.23 | ) | | | 455,646 | | | | 3.02 | | | | 1.24 | | | | (1.58 | ) | | | 3.48 | | | | 1.70 | | | | 78 | | | | 177 | % |
| | 9.79 | | | | (4.67 | ) | | | 433,539 | | | | 2.70 | | | | 1.24 | | | | (1.39 | ) | | | 3.15 | | | | 1.69 | | | | 146 | | | | 348 | |
| | 10.27 | | | | 0.00 | | | | 528,478 | | | | 2.59 | | | | 1.25 | | | | (0.45 | ) | | | 3.04 | | | | 1.70 | | | | 175 | | | | 350 | |
| | 10.27 | | | | (3.73 | ) | | | 933,631 | | | | 2.27 | | | | 1.25 | | | | 2.79 | | | | 2.69 | | | | 1.67 | | | | 116 | | | | — | |
| | 11.31 | | | | 5.59 | | | | 1,852,145 | | | | 2.44 | | | | 1.25 | | | | 3.55 | | | | 2.85 | | | | 1.66 | | | | 96 | | | | — | |
| | 11.04 | | | | 5.36 | | | | 1,457,434 | | | | 2.35 | | | | 1.25 | | | | 2.71 | | | | 2.77 | | | | 1.67 | | | | 121 | | | | — | |
SEE NOTES TO FINANCIAL STATEMENTS.
| | | | | | | | |
| | | |
| DECEMBER 31, 2010 | | J.P. MORGAN MID CAP/MULTI-CAP FUNDS | | | | | 83 | |
FINANCIAL HIGHLIGHTS
FOR THE PERIODS INDICATED
| | | | | | | | | | | | | | | | | | | | | | | | | | | | |
| | | Per share operating performance | |
| | | | | | Investment operations | | | Distributions | |
| | | Net asset
value,
beginning
of period | | | Net
investment
income
(loss) | | | Net realized
and unrealized
gains
(losses) on
investments | | | Total from
investment
operations | | | Net
investment
income | | | Net
realized
gain | | | Total
distributions | |
| | | | | | | |
Value Advantage Fund | | | | | | | | | | | | | | | | | | | | | | | | | | | | |
Class A | | | | | | | | | | | | | | | | | | | | | | | | | | | | |
Six Months Ended December 31, 2010 (Unaudited) | | $ | 15.22 | | | $ | 0.12 | (e) | | $ | 3.02 | | | $ | 3.14 | | | $ | (0.17 | ) | | $ | — | | | $ | (0.17 | ) |
Year Ended June 30, 2010 | | | 12.01 | | | | 0.23 | (e) | | | 3.17 | | | | 3.40 | | | | (0.19 | ) | | | — | | | | (0.19 | ) |
Year Ended June 30, 2009 | | | 16.38 | | | | 0.30 | (e) | | | (4.40 | ) | | | (4.10 | ) | | | (0.20 | ) | | | (0.07 | ) | | | (0.27 | ) |
Year Ended June 30, 2008 | | | 20.45 | | | | 0.35 | | | | (3.19 | ) | | | (2.84 | ) | | | (0.24 | ) | | | (0.99 | ) | | | (1.23 | ) |
Year Ended June 30, 2007 | | | 17.17 | | | | 0.26 | (e) | | | 3.42 | | | | 3.68 | | | | (0.12 | ) | | | (0.28 | ) | | | (0.40 | ) |
January 1, 2006 through June 30, 2006(f) | | | 15.88 | | | | 0.10 | (e) | | | 1.19 | | | | 1.29 | | | | — | | | | — | | | | — | |
February 28, 2005 (g) through December 31, 2005 | | | 15.00 | | | | 0.13 | (e) | | | 0.99 | | | | 1.12 | | | | (0.06 | ) | | | (0.18 | ) | | | (0.24 | ) |
| | | | | | | |
Class C | | | | | | | | | | | | | | | | | | | | | | | | | | | | |
Six Months Ended December 31, 2010 (Unaudited) | | | 15.17 | | | | 0.07 | (e) | | | 3.01 | | | | 3.08 | | | | (0.07 | ) | | | — | | | | (0.07 | ) |
Year Ended June 30, 2010 | | | 11.97 | | | | 0.15 | (e) | | | 3.17 | | | | 3.32 | | | | (0.12 | ) | | | — | | | | (0.12 | ) |
Year Ended June 30, 2009 | | | 16.25 | | | | 0.23 | (e) | | | (4.34 | ) | | | (4.11 | ) | | | (0.10 | ) | | | (0.07 | ) | | | (0.17 | ) |
Year Ended June 30, 2008 | | | 20.31 | | | | 0.26 | | | | (3.18 | ) | | | (2.92 | ) | | | (0.15 | ) | | | (0.99 | ) | | | (1.14 | ) |
Year Ended June 30, 2007 | | | 17.10 | | | | 0.17 | (e) | | | 3.38 | | | | 3.55 | | | | (0.06 | ) | | | (0.28 | ) | | | (0.34 | ) |
January 1, 2006 through June 30, 2006(f) | | | 15.85 | | | | 0.05 | (e) | | | 1.20 | | | | 1.25 | | | | — | | | | — | | | | — | |
February 28, 2005 (g) through December 31, 2005 | | | 15.00 | | | | 0.06 | (e) | | | 1.00 | | | | 1.06 | | | | (0.03 | ) | | | (0.18 | ) | | | (0.21 | ) |
| | | | | | | |
Institutional Class | | | | | | | | | | | | | | | | | | | | | | | | | | | | |
Six Months Ended December 31, 2010 (Unaudited) | | | 15.24 | | | | 0.16 | (e) | | | 3.02 | | | | 3.18 | | | | (0.24 | ) | | | — | | | | (0.24 | ) |
Year Ended June 30, 2010 | | | 12.01 | | | | 0.31 | (e) | | | 3.18 | | | | 3.49 | | | | (0.26 | ) | | | — | | | | (0.26 | ) |
Year Ended June 30, 2009 | | | 16.40 | | | | 0.37 | (e) | | | (4.42 | ) | | | (4.05 | ) | | | (0.27 | ) | | | (0.07 | ) | | | (0.34 | ) |
Year Ended June 30, 2008 | | | 20.47 | | | | 0.44 | | | | (3.19 | ) | | | (2.75 | ) | | | (0.33 | ) | | | (0.99 | ) | | | (1.32 | ) |
Year Ended June 30, 2007 | | | 17.16 | | | | 0.39 | (e) | | | 3.38 | | | | 3.77 | | | | (0.18 | ) | | | (0.28 | ) | | | (0.46 | ) |
January 1, 2006 through June 30, 2006(f) | | | 15.83 | | | | 0.25 | (e) | | | 1.08 | | | | 1.33 | | | | — | | | | — | | | | — | |
February 28, 2005 (g) through December 31, 2005 | | | 15.00 | | | | 0.11 | (e) | | | 0.99 | | | | 1.10 | | | | (0.09 | ) | | | (0.18 | ) | | | (0.27 | ) |
| | | | | | | |
Select Class | | | | | | | | | | | | | | | | | | | | | | | | | | | | |
Six Months Ended December 31, 2010 (Unaudited) | | | 15.27 | | | | 0.14 | (e) | | | 3.02 | | | | 3.16 | | | | (0.22 | ) | | | — | | | | (0.22 | ) |
Year Ended June 30, 2010 | | | 12.04 | | | | 0.27 | (e) | | | 3.19 | | | | 3.46 | | | | (0.23 | ) | | | — | | | | (0.23 | ) |
Year Ended June 30, 2009 | | | 16.44 | | | | 0.34 | (e) | | | (4.42 | ) | | | (4.08 | ) | | | (0.25 | ) | | | (0.07 | ) | | | (0.32 | ) |
Year Ended June 30, 2008 | | | 20.52 | | | | 0.37 | | | | (3.17 | ) | | | (2.80 | ) | | | (0.29 | ) | | | (0.99 | ) | | | (1.28 | ) |
Year Ended June 30, 2007 | | | 17.22 | | | | 0.31 | (e) | | | 3.43 | | | | 3.74 | | | | (0.16 | ) | | | (0.28 | ) | | | (0.44 | ) |
January 1, 2006 through June 30, 2006(f) | | | 15.91 | | | | 0.12 | (e) | | | 1.19 | | | | 1.31 | | | | — | | | | — | | | | — | |
February 28, 2005 (g) through December 31, 2005 | | | 15.00 | | | | 0.15 | (e) | | | 1.01 | | | | 1.16 | | | | (0.07 | ) | | | (0.18 | ) | | | (0.25 | ) |
| (a) | Annualized for periods less than one year. |
| (b) | Not annualized for periods less than one year. |
| (c) | Includes adjustments in accordance with accounting principles generally accepted in the United States of America and as such, the net asset value for financial reporting purposes and the returns based upon those net asset values may differ from the net asset value and returns for shareholder transactions. |
| (d) | Includes earnings credits and interest expense, each of which is less than 0.01%, if applicable or unless otherwise noted. |
| (e) | Calculated based upon average shares outstanding. |
| (f) | The Fund changed its fiscal year end from December 31 to June 30. |
| (g) | Commencement of operations. |
SEE NOTES TO FINANCIAL STATEMENTS.
| | | | | | |
| | | |
| 84 | | | | J.P. MORGAN MID CAP/MULTI-CAP FUNDS | | DECEMBER 31, 2010 |
| | | | | | | | | | | | | | | | | | | | | | | | | | |
| | | | Ratios/Supplemental data | |
| | | | | | | | | | Ratios to average net assets (a) | | | | |
Net asset
value,
end of
period | | | Total return
(excludes
sales charge) (b)(c) | | | Net assets,
end of
period
(000’s) | | | Net
expenses (d) | | | Net
investment
income
(loss) | | | Expenses
without waivers,
reimbursements and
earnings credits | | | Portfolio
turnover
rate (b) | |
| | | | | | |
| | | | | | | | | | | | | | | | | | | | | | | | | | |
| | | | | | | | | | | | | | | | | | | | | | | | | | |
$ |
18.19 |
| | | 20.61 | % | | $ | 212,939 | | | | 1.24 | % | | | 1.39 | % | | | 1.34 | % | | | 15 | % |
| | 15.22 | | | | 28.35 | | | | 150,081 | | | | 1.24 | | | | 1.52 | | | | 1.38 | | | | 45 | |
| | 12.01 | | | | (24.82 | ) | | | 112,739 | | | | 1.25 | | | | 2.45 | | | | 1.50 | | | | 70 | |
| | 16.38 | | | | (14.42 | ) | | | 152,696 | | | | 1.25 | | | | 1.87 | | | | 1.43 | | | | 103 | |
| | 20.45 | | | | 21.58 | | | | 201,151 | | | | 1.25 | | | | 1.36 | | | | 1.41 | | | | 77 | |
| | 17.17 | | | | 8.12 | | | | 77,691 | | | | 1.25 | | | | 1.16 | | | | 1.67 | | | | 55 | |
|
15.88 |
| | | 7.46 | | | | 45,163 | | | | 1.25 | | | | 1.02 | | | | 1.82 | | | | 90 | |
| | | | | | |
| | | | | | | | | | | | | | | | | | | | | | | | | | |
|
18.18 |
| | | 20.33 | | | | 128,297 | | | | 1.74 | | | | 0.89 | | | | 1.84 | | | | 15 | |
| | 15.17 | | | | 27.72 | | | | 108,165 | | | | 1.74 | | | | 1.01 | | | | 1.88 | | | | 45 | |
| | 11.97 | | | | (25.19 | ) | | | 97,723 | | | | 1.75 | | | | 1.86 | | | | 1.99 | | | | 70 | |
| | 16.25 | | | | (14.86 | ) | | | 182,093 | | | | 1.75 | | | | 1.36 | | | | 1.93 | | | | 103 | |
| | 20.31 | | | | 20.93 | | | | 247,794 | | | | 1.75 | | | | 0.87 | | | | 1.91 | | | | 77 | |
| | 17.10 | | | | 7.89 | | | | 83,777 | | | | 1.75 | | | | 0.64 | | | | 2.17 | | | | 55 | |
|
15.85 |
| | | 7.03 | | | | 55,875 | | | | 1.75 | | | | 0.47 | | | | 2.39 | | | | 90 | |
| | | | | | |
| | | | | | | | | | | | | | | | | | | | | | | | | | |
|
18.18 |
| | | 20.88 | | | | 257,665 | | | | 0.74 | | | | 1.90 | | | | 0.94 | | | | 15 | |
| | 15.24 | | | | 29.03 | | | | 156,531 | | | | 0.74 | | | | 2.04 | | | | 0.98 | | | | 45 | |
| | 12.01 | | | | (24.41 | ) | | | 70,825 | | | | 0.75 | | | | 3.11 | | | | 1.15 | | | | 70 | |
| | 16.40 | | | | (13.97 | ) | | | 19,872 | | | | 0.75 | | | | 2.37 | | | | 1.03 | | | | 103 | |
| | 20.47 | | | | 22.16 | | | | 24,710 | | | | 0.75 | | | | 1.97 | | | | 1.00 | | | | 77 | |
| | 17.16 | | | | 8.40 | | | | 773 | | | | 0.75 | | | | 3.03 | | | | 1.25 | | | | 55 | |
|
15.83 |
| | | 7.32 | | | | 20 | | | | 0.75 | | | | 0.87 | | | | 3.01 | | | | 90 | |
| | | | | | |
| | | | | | | | | | | | | | | | | | | | | | | | | | |
|
18.21 |
| | | 20.71 | | | | 217,251 | | | | 0.99 | | | | 1.68 | | | | 1.09 | | | | 15 | |
| | 15.27 | | | | 28.70 | | | | 71,209 | | | | 0.99 | | | | 1.77 | | | | 1.13 | | | | 45 | |
| | 12.04 | | | | (24.62 | ) | | | 51,000 | | | | 1.00 | | | | 2.75 | | | | 1.25 | | | | 70 | |
| | 16.44 | | | | (14.19 | ) | | | 49,262 | | | | 1.00 | | | | 2.18 | | | | 1.18 | | | | 103 | |
| | 20.52 | | | | 21.89 | | | | 36,884 | | | | 1.00 | | | | 1.62 | | | | 1.16 | | | | 77 | |
| | 17.22 | | | | 8.23 | | | | 5,275 | | | | 1.00 | | | | 1.42 | | | | 1.42 | | | | 55 | |
|
15.91 |
| | | 7.71 | | | | 3,107 | | | | 1.00 | | | | 1.14 | | | | 1.87 | | | | 90 | |
SEE NOTES TO FINANCIAL STATEMENTS.
| | | | | | | | |
| | | |
| DECEMBER 31, 2010 | | J.P. MORGAN MID CAP/MULTI-CAP FUNDS | | | | | 85 | |
NOTES TO FINANCIAL STATEMENTS
AS OF DECEMBER 31, 2010 (Unaudited)
1. Organization
JPMorgan Trust I (“JPM I”) and JPMorgan Trust II (“JPM II”) were formed on November 12, 2004, as Delaware statutory trusts, pursuant to Declarations of Trusts dated November 5, 2004 and are registered under the Investment Company Act of 1940, as amended (the “1940 Act”), as open-end management investment companies.
J.P. Morgan Mutual Fund Investment Trust (“JPMMFIT”), an open-end management investment company, was organized as a Massachusetts business trust on September 23, 1997.
J.P. Morgan Fleming Mutual Fund Group, Inc. (“JPMFMFG”), an open-end management investment company, was organized as a Maryland corporation on August 19, 1997.
The following are 7 separate funds of the Trusts (collectively, the “Funds”) covered by this report:
| | | | | | |
| | | Classes Offered | | Trust | | Diversified/Non-Diversified |
| Growth Advantage Fund | | Class A, Class B, Class C, Class R5 and Select Class | | JPMM FIT | | Diversified |
| Mid Cap Core Fund | | Class A, Class C, Class R2, Class R5 and Select Class | | JPM I | | Diversified |
| Mid Cap Equity Fund | | Class A, Class C, and Select Class | | JPM I | | Diversified |
| Mid Cap Growth Fund | | Class A, Class B, Class C, Class R2, and Select Class | | JPM II | | Diversified |
| Mid Cap Value Fund | | Class A, Class B, Class C, Class R2, Institutional Class and Select Class | | JPMFMFG | | Diversified |
| Multi-Cap Market Neutral Fund | | Class A, Class B, Class C, and Select Class | | JPM II | | Diversified |
| Value Advantage Fund | | Class A, Class C, Institutional Class and Select Class | | JPM I | | Diversified |
Class A and Class C Shares commenced operations on November 2, 2009 for the Mid Cap Equity Fund.
The Mid Cap Core Fund commenced operations on November 30, 2010.
Effective November 1, 2009, Class B Shares of the Growth Advantage Fund, Mid Cap Growth Fund, Mid Cap Value Fund and Multi-Cap Market Neutral Fund may not be purchased or acquired by new or existing shareholders, except through exchanges from Class B of another J.P. Morgan Fund and dividend reinvestments. Shareholders who have invested in Class B Shares prior to November 1, 2009 may continue to hold their Class B shares until they automatically convert to Class A Shares.
Class A Shares generally provide for a front-end sales charge while Class B and Class C Shares provide for a contingent deferred sales charge (“CDSC”). Class B Shares automatically convert to Class A Shares after eight years. No sales charges are assessed with respect to the Class R2, Class R5, Select Class and Institutional Class Shares. All classes of shares have equal rights as to earnings, assets and voting privileges except that each class may bear different distribution and shareholder servicing fees and each class has exclusive voting rights with respect to its distribution plan and shareholder servicing agreements. Certain Class A Shares, for which front-end sales charges have been waived, may be subject to a CDSC as described in the Funds’ prospectus.
2. Significant Accounting Policies
The following is a summary of significant accounting policies followed by the Trusts in the preparation of their financial statements. The policies are in accordance with accounting principles generally accepted in the United States of America. The preparation of financial statements requires management to make estimates and assumptions that affect the reported amounts of assets and liabilities at the date of the financial statements and the reported amounts of income and expenses for the period. Actual results could differ from those estimates.
A. Valuation of Investments — Equity securities listed on a North American, Central American, South American or Caribbean securities exchange shall generally be valued at the last sale price on the exchange on which the security is principally traded that is reported before the time when the net assets of the Funds are valued. The value of securities listed on The NASDAQ Stock Market LLC shall generally be the NASDAQ Official Closing Price. Fixed income securities (other than certain short-term investments maturing in less than 61 days) are valued each day based on readily available market quotations received from third party broker-dealers of comparable securities or independent or affiliated pricing services approved by the Board of Trustees. Such pricing services and broker-dealers will generally provide bid-side quotations. Generally, short-term investments of sufficient credit quality maturing in less than 61 days are valued at amortized cost, which approximates market value. Certain investments of the Funds may, depending upon market conditions, trade in relatively thin markets and/or in markets that experience significant volatility. As a result of these conditions, the prices used by the Funds to value securities may differ from the value that would be realized if these securities were sold, and the differences could be material. Futures and options shall generally be valued on the basis of available market quotations. Swaps and other derivatives are valued daily, primarily using independent or affiliated pricing services approved by the Board of Trustees. If valuations are not available from such services or values received are deemed not representative of market value, values will be obtained from a third party broker-dealer or counterparty. Investments in other open-end investment companies are valued at such investment company’s current day closing net asset value per share.
Securities or other assets for which market quotations are not readily available or for which market quotations do not represent the value at the time of pricing (including certain illiquid securities) are fair valued in accordance with procedures established by and under the supervision and responsibility of the Board of Trustees. It is possible that the estimated values may differ significantly from the values that would have been used had a ready market for the investments existed, and such differences could be material. Trading in securities on most foreign exchanges and
| | | | | | |
| | | |
| 86 | | | | J.P. MORGAN MID CAP/MULTI-CAP FUNDS | | DECEMBER 31, 2010 |
over-the-counter markets is normally completed before the close of the domestic market and may also take place on days when the domestic market is closed. In accordance with procedures adopted by the Board of Trustees, the Funds apply fair value pricing on equity securities on a daily basis except for North American, Central American, South American and Caribbean equity securities held in their portfolios by utilizing the quotations of an independent pricing service, unless a Fund’s advisor determines that use of another valuation methodology is appropriate. The pricing service uses statistical analyses and quantitative models to adjust local market prices using factors such as subsequent movement and changes in the prices of indices, securities and exchange rates in other markets, in determining fair value as of the time a Fund calculates its net asset values.
Valuations reflected in this report are as of the report date. As a result, changes in valuation due to market events and/or issuer related events after the report date and prior to issuance of the report are not reflected herein.
The various inputs that are used in determining the fair value of the Funds’ investments are summarized into the three broad levels listed below:
| Ÿ | | Level 1 — quoted prices in active markets for identical securities |
| Ÿ | | Level 2 — other significant observable inputs (including quoted prices for similar securities, interest rates, prepayment speeds, credit risk, etc.) |
| Ÿ | | Level 3 — significant unobservable inputs (including the Funds’ own assumptions in determining the fair value of investments) |
A financial instrument’s level within the fair value hierarchy is based on the lowest level of any input both individually and in aggregate that is significant to the fair value measurement. The inputs or methodology used for valuing securities are not necessarily an indication of the risk associated with investing in those securities.
The following tables represent each valuation input by sector as presented on the Schedules of Portfolio Investments (“SOIs”) (amounts in thousands):
Growth Advantage Fund
| | | | | | | | | | | | | | | | |
| | | Level 1
Quoted prices | | | Level 2
Other significant
observable inputs | | | Level 3 Significant
unobservable inputs | | | Total | |
Total Investments in Securities # | | $ | 847,094 | | | $ | — | | | $ | — | | | $ | 847,094 | |
| | | | | | | | | | | | | | | | |
| | | | |
Mid Cap Core Fund | | | | | | | | | | | | | | | | |
| | | Level 1
Quoted prices | | | Level 2
Other significant
observable inputs | | | Level 3 Significant
unobservable inputs | | | Total | |
Total Investments in Securities # | | $ | 3,139 | | | $ | — | | | $ | — | | | $ | 3,139 | |
| | | | | | | | | | | | | | | | |
| | | | |
Mid Cap Equity Fund | | | | | | | | | | | | | | | | |
| | | Level 1
Quoted prices | | | Level 2
Other significant
observable inputs | | | Level 3 Significant
unobservable inputs | | | Total | |
Total Investments in Securities # | | $ | 482,132 | | | $ | — | | | $ | — | | | $ | 482,132 | |
| | | | | | | | | | | | | | | | |
| | | | |
Mid Cap Growth Fund | | | | | | | | | | | | | | | | |
| | | Level 1
Quoted prices | | | Level 2
Other significant
observable inputs | | | Level 3 Significant
unobservable inputs | | | Total | |
Total Investments in Securities # | | $ | 1,682,532 | | | $ | — | | | $ | — | | | $ | 1,682,532 | |
| | | | | | | | | | | | | | | | |
| | | | |
Mid Cap Value Fund | | | | | | | | | | | | | | | | |
| | | Level 1
Quoted prices | | | Level 2
Other significant
observable inputs | | | Level 3 Significant
unobservable inputs | | | Total | |
Total Investments in Securities # | | $ | 6,375,613 | | | $ | — | | | $ | — | | | $ | 6,375,613 | |
| | | | | | | | | | | | | | | | |
| | | | |
Multi-Cap Market Neutral Fund | | | | | | | | | | | | | | | | |
| | | Level 1
Quoted prices | | | Level 2
Other significant
observable inputs | | | Level 3 Significant
unobservable inputs | | | Total | |
Total Investments in Securities # | | $ | 577,989 | | | $ | — | | | $ | — | | | $ | 577,989 | |
| | | | | | | | | | | | | | | | |
Liabilities in Securities Sold Short # | | $ | 541,710 | | | $ | — | | | $ | — | | | $ | 541,710 | |
| | | | | | | | | | | | | | | | |
| | | | | | | | |
| | | |
| DECEMBER 31, 2010 | | J.P. MORGAN MID CAP/MULTI-CAP FUNDS | | | | | 87 | |
NOTES TO FINANCIAL STATEMENTS
AS OF DECEMBER 31, 2010 (Unaudited) (continued)
Value Advantage Fund
| | | | | | | | | | | | | | | | |
| | | Level 1
Quoted prices | | | Level 2
Other significant
observable inputs | | | Level 3 Significant
unobservable inputs | | | Total | |
Total Investments in Securities ## | | $ | 815,428 | | | $ | 6,526 | | | $ | — | | | $ | 821,954 | |
| | | | | | | | | | | | | | | | |
| # | All portfolio holdings designated as Level 1 are disclosed individually in the SOI. Please refer to the SOI for industry specifics of the portfolio holdings. |
| ## | Portfolio holdings designated as Level 1 and Level 2 are disclosed individually in the SOI. Level 2 consists of an ADR. Please refer to the SOI for industry specifics of the portfolio holdings. |
There were no transfers between Levels 1 and 2 during the period ended December 31, 2010.
B. Short Sales — The Multi-Cap Market Neutral Fund engages in short sales as part of its normal investment activities. In a short sale, the Fund sells securities it does not own. In order to deliver securities to the purchaser, the Fund borrows securities from a broker. To close out a short position, the Fund must purchase the same securities at the current market price and deliver them to the broker.
The Fund is required to pledge cash or securities to the broker as collateral for the securities sold short. Collateral requirements are calculated daily based on the current market value of the short positions. Cash collateral deposited with the broker is recorded as an asset on the Statements of Assets and Liabilities. Securities segregated as collateral are denoted in the SOI. The Fund may receive or pay the net of the following amounts: (i) a portion of the income from the investment of cash collateral (ii) the broker’s fee on the borrowed securities (calculated daily based upon the market value of each borrowed security and a variable rate that is dependent on availability of the security) and (iii) a financing charge for the difference in the market value of the short position and cash collateral deposited with the broker. The net income or fee amount is included as interest income or interest expense on securities sold short, respectively, in the Statements of Operations.
The Fund is obligated to pay the broker dividends declared on short positions when a position is open on record date. Dividends on short positions are recorded on the Statements of Operations as dividend expense on ex-dividend date.
Liabilities for securities sold short are reported at market value on the Statements of Assets and Liabilities and the change in market value is recorded as unrealized gain or loss on the Statements of Operations. Short sale transactions may result in unlimited losses as the short position loses value and the securities’ price increases. There is no upward limit on the price a borrowed security could attain. The Fund is also subject to risk of loss if the broker were to fail to perform its obligations under the contractual terms.
The Fund will record a realized loss if the price of the security increases between the date of the short sale and the date on which the Fund replaces the borrowed security. The Fund will record a realized gain if the price of the security declines between those dates.
As of December 31, 2010, the Fund had outstanding short sales as listed on its SOI.
C. Securities Lending — Each Fund (except Mid Cap Core Fund, Multi-Cap Market Neutral Fund and Value Advantage Fund) may lend securities to brokers approved by J.P. Morgan Investment Management Inc. (“JPMIM” or the “Advisor”) in order to generate additional income. Goldman Sachs Bank USA (“GS Bank”) serves as lending agent for the Growth Advantage Fund and Mid Cap Equity Fund. JPMorgan Chase Bank, N.A. (“JPMCB”) serves as lending agent for Mid Cap Growth Fund and Mid Cap Value Fund. Securities loaned are collateralized by cash, which is invested in Capital Shares of the JPMorgan Prime Money Market Fund. Upon termination of a loan, the Funds are required to return to the borrower the posted cash collateral. Loans are subject to termination by the Funds or the borrower at any time.
Securities lending income is comprised of income earned on cash collateral investments (“Collateral Investments”), net of a rebate received from or paid to borrowers for use of cash collateral and lending agent fees. This amount is recorded as Income from securities lending (net) on the Statements of Operations. The Funds also receive payments from the borrower during the period of the loan, equivalent to dividends and interest earned on the securities loaned, which are recorded as Dividend or Interest income, respectively, on the Statements of Operations.
For the period ended December 31, 2010, the Funds earned the following amounts from the investment of cash collateral, prior to rebates or fees, from an investment in an affiliated fund as described below (amounts in thousands).
| | | | |
Growth Advantage Fund | | $ | 99 | |
Mid Cap Equity Fund | | | 40 | |
Mid Cap Growth Fund | | | 45 | |
Mid Cap Value Fund | | | 66 | |
Under the securities lending agreement with GS Bank, at the inception of a loan, securities are exchanged for cash collateral equal to at least 102% of the value of loaned U.S. securities plus accrued interest. The securities lending agreement with GS Bank requires that the loaned securities be marked to market on a daily basis and additional cash collateral is requested from borrowers when the cash received from borrowers becomes less than 102% of the value of loaned securities. Under the securities lending agreement with JPMCB, at the inception of a loan, securities are exchanged for cash collateral equal to at least 102% of the value of loaned U.S. dollar-denominated securities, plus accrued interest, and 105% of the value of
| | | | | | |
| | | |
| 88 | | | | J.P. MORGAN MID CAP/MULTI-CAP FUNDS | | DECEMBER 31, 2010 |
loaned non-dollar-denominated securities, plus accrued interest. The securities lending agreement with JPMCB requires that the loaned securities be marked to market on a daily basis and additional cash collateral is requested from borrowers when the cash received from borrowers becomes less than 102% and 105% of the value of loaned U.S. dollar denominated and non-dollar denominated securities, respectively, subject to certain de minimis guidelines.
The value of the cash collateral received is recorded as a liability on the Statements of Assets and Liabilities and details of Collateral Investments are disclosed in the SOI. At December 31, 2010, the value of outstanding securities on loan and the value of Collateral Investments were as follows (amount in thousands):
| | | | | | | | | | | | |
| | | Value of
Securities
on Loan | | | Cash Collateral
Posted by
Borrower | | | Total Value
of Collateral
Investments | |
Growth Advantage Fund | | $ | 55,855 | | | $ | 57,248 | | | $ | 57,248 | |
Mid Cap Equity Fund | | | 30,914 | | | | 31,684 | | | | 31,684 | |
Mid Cap Growth Fund | | | 45,275 | | | | 46,631 | | | | 46,631 | |
Mid Cap Value Fund | | | 58,621 | | | | 60,214 | | | | 60,214 | |
The Funds bear the risk of loss associated with the Collateral Investments and are not entitled to additional collateral from the borrower to cover any such losses. To the extent that the value of the Collateral Investments decline below the amount owed to a borrower, a Fund may incur losses that exceed the amount it earned on lending the security. Upon termination of a loan, a Fund may use leverage (borrow money) to repay the borrower for cash collateral posted, if the Advisor does not believe that it is prudent to sell the Collateral Investments to fund the payment of this liability.
Securities lending also involves counterparty risks, including the risk that the loaned securities may not be returned in a timely manner or at all. Subject to certain conditions, GS Bank and JPMCB each have agreed to indemnify the Funds from losses resulting from a borrower’s failure to return a loaned security.
JPMIM waived fees associated with the Funds’ investment in JPMorgan Prime Money Market Fund as follows (amounts in thousands).
| | | | |
Growth Advantage Fund | | $ | 51 | |
Mid Cap Equity Fund | | | 21 | |
Mid Cap Growth Fund | | | 24 | |
Mid Cap Value Fund | | | 36 | |
These amounts offset the administration fees and shareholder servicing fees incurred by JPMorgan Prime Money Market Fund related to the Funds’ investment in such fund. A portion of the waiver is voluntary.
Under the Securities Lending Agreement, JPMCB is entitled to a fee paid monthly in arrears equal to: (i) 0.03% of the average dollar value of the loans of U.S. dollar-denominated securities outstanding during a given month; and (ii) 0.09% of the average dollar value of loans of non-dollar-denominated securities outstanding during a given month.
The Funds incurred lending agent fees to JPMCB as follows for the period ended December 31, 2010 (amounts in thousands):
| | | | |
| | | Lending
Agent Fees
Incurred | |
Mid Cap Growth Fund | | $ | 8 | |
Mid Cap Value Fund | | | 12 | |
D. Offering and Organization Costs — Offering costs (Registration and filing fees) paid in connection with the offering of shares of the Mid Cap Core Fund are amortized on a straight line basis over 12 months from the date the Fund commenced operations. Costs paid in connection with the organization of the Fund were recorded as an expense at the time they commenced operations and are included as part of Professional fees on the Statements of Operations.
E. Security Transactions and Investment Income — Investment transactions are accounted for on the trade date (the date the order to buy or sell is executed). Securities gains and losses are calculated on a specifically identified cost basis. Interest income is determined on the basis of coupon interest accrued using the effective interest method adjusted for amortization of premiums and accretion of discounts. Dividend income and expense on securities sold short less foreign taxes withheld, if any, are recorded on the ex-dividend date or when a Fund first learns of the dividend.
The Funds record distributions received in excess of income from underlying investments as a reduction of cost of investments and/or realized gain. Such amounts are based on estimates if actual amounts are not available and actual amounts of income, realized gain and return of capital may differ from the estimated amounts. The Funds adjust the estimated amounts of components of distributions (and consequently their net investment income) as necessary once the issuers provide information about the actual composition of the distributions.
| | | | | | | | |
| | | |
| DECEMBER 31, 2010 | | J.P. MORGAN MID CAP/MULTI-CAP FUNDS | | | | | 89 | |
NOTES TO FINANCIAL STATEMENTS
AS OF DECEMBER 31, 2010 (Unaudited) (continued)
F. Allocation of Income and Expenses — In calculating the net asset value per share of each class, investment income, realized and unrealized gains and losses and expenses other than class specific expenses are allocated daily to each class of shares based upon the proportion of net assets of each class at the beginning of each day. Expenses directly attributable to a fund are charged directly to that fund while the expenses attributable to more than one fund of the Trusts are allocated among the respective funds. Each class of shares bears its pro-rata portion of expenses attributable to its Fund, except that each class separately bears expenses related specifically to that class, such as distribution and shareholder servicing fees.
G. Federal Income Taxes — Each Fund is treated as a separate taxable entity for Federal income tax purposes. Each Fund’s policy is to comply with the provisions of the Internal Revenue Code of 1986, as amended (the “Code”), applicable to regulated investment companies and to distribute to shareholders all of its distributable net investment income and net realized gain on investments. Accordingly, no provision for Federal income tax is necessary. The Funds are not aware of any tax positions for which it is reasonably possible that the total amounts of unrecognized tax benefits or losses will significantly change in the next twelve months. However, the Funds’ conclusions may be subject to future review based on changes in, or the interpretation of, the accounting standards or tax laws and regulations. Each of the Funds’ Federal tax returns for the prior three fiscal years remains subject to examination by the Internal Revenue Service.
H. Dividends and Distributions to Shareholders — Dividends from net investment income are generally declared and paid annually, except for the Mid Cap Equity, Mid Cap Growth and Multi-Cap Market Neutral Funds, which are declared and paid quarterly. Dividends are declared separately for each class. No class has preferential dividend rights; differences in per share rates are due to differences in separate class expenses. Net realized capital gains, if any, are distributed by each Fund at least annually. The amount of dividends and distributions from net investment income and net realized capital gains is determined in accordance with Federal income tax regulations, which may differ from accounting principles generally accepted in the United States of America. To the extent these “book/tax” differences are permanent in nature (i.e., that they result from other than timing of recognition — “temporary differences”), such amounts are reclassified within the capital accounts based on their Federal tax-basis treatment.
3. Fees and Other Transactions with Affiliates
A. Investment Advisory Fee — Pursuant to the Investment Advisory Agreement, JPMIM acts as the investment advisor to the Funds. JPMIM is a wholly-owned subsidiary of JPMorgan Asset Management Holdings Inc., which is a wholly-owned subsidiary of JPMorgan Chase & Co. (“JPMorgan”). JPMIM supervises the investments of each respective Fund and for such services is paid a fee. The fee is accrued daily and paid monthly based on each Fund’s respective average daily net assets. The annual fee rate for each Fund is as follows:
| | | | |
Growth Advantage Fund | | | 0.65 | % |
Mid Cap Core Fund | | | 0.65 | |
Mid Cap Equity Fund | | | 0.65 | |
Mid Cap Growth Fund | | | 0.65 | |
Mid Cap Value Fund | | | 0.65 | |
Multi-Cap Market Neutral Fund | | | 1.25 | |
Value Advantage Fund | | | 0.65 | |
The Advisor waived Investment Advisory fees and/or reimbursed expenses as outlined in Note 3.F.
B. Administration Fee — Pursuant to an Administration Agreement, JPMorgan Funds Management, Inc. (the “Administrator”), an indirect, wholly-owned subsidiary of JPMorgan, provides certain administration services to the Funds. In consideration of these services, the Administrator receives a fee computed daily and paid monthly at the annual rate of 0.15% of the first $25 billion of the average daily net assets of all funds in the J.P. Morgan Funds Complex (excluding certain funds of funds and money market funds) and 0.075% of the average daily net assets in excess of $25 billion of all such funds. For the period ended December 31, 2010, the annualized effective rate was 0.09% of each Fund’s average daily net assets.
The Administrator waived Administration fees as outlined in Note 3.F.
J.P. Morgan Investor Services, Co. (“JPMIS”), an indirect, wholly-owned subsidiary of JPMorgan, serves as the Funds’ Sub-administrator (the “Sub-administrator”). For its services as Sub-administrator, JPMIS receives a portion of the fees payable to the Administrator.
C. Distribution Fees — Pursuant to a Distribution Agreement, JPMorgan Distribution Services, Inc. (“the Distributor”), a wholly-owned subsidiary of JPMorgan, serves as the Trusts’ exclusive underwriter and promotes and arranges for the sale of each Fund’s shares.
The Board of Trustees has adopted a Distribution Plan (the “Distribution Plan”) for Class A, Class B, Class C and Class R2 Shares of the Funds in accordance with Rule 12b-1 under the 1940 Act. The Distribution Plan provides that each Fund shall pay distribution fees, including payments to the Distributor, at annual rates of the average daily net assets as shown in the table below:
| | | | | | | | | | | | | | | | |
| | | Class A | | | Class B | | | Class C | | | Class R2 | |
Growth Advantage Fund | | | 0.25 | % | | | 0.75 | % | | | 0.75 | % | | | n/a | |
Mid Cap Core Fund | | | 0.25 | | | | n/a | | | | 0.75 | | | | 0.50 | % |
Mid Cap Equity Fund | | | 0.25 | | | | n/a | | | | 0.75 | | | | n/a | |
Mid Cap Growth Fund | | | 0.25 | | | | 0.75 | | | | 0.75 | | | | 0.50 | |
Mid Cap Value Fund | | | 0.25 | | | | 0.75 | | | | 0.75 | | | | 0.50 | |
Multi-Cap Market Neutral Fund | | | 0.25 | | | | 0.75 | | | | 0.75 | | | | n/a | |
Value Advantage Fund | | | 0.25 | | | | n/a | | | | 0.75 | | | | n/a | |
| | | | | | |
| | | |
| 90 | | | | J.P. MORGAN MID CAP/MULTI-CAP FUNDS | | DECEMBER 31, 2010 |
In addition, the Distributor is entitled to receive the front-end sales charges from purchases of Class A Shares and the CDSC from redemptions of Class B and Class C Shares and certain Class A Shares for which front-end sales charges have been waived. For the period ended December 31, 2010, the Distributor retained the following amounts (in thousands):
| | | | | | | | |
| | | Front-End
Sales Charge | | | CDSC | |
Growth Advantage Fund | | $ | 7 | | | $ | 7 | |
Mid Cap Equity Fund | | | 1 | | | | — | (a) |
Mid Cap Growth Fund | | | 5 | | | | 8 | |
Mid Cap Value Fund | | | 29 | | | | 28 | |
Multi-Cap Market Neutral Fund | | | 1 | | | | 5 | |
Value Advantage Fund | | | 13 | | | | 3 | |
| (a) | Amount rounds to less than $1,000. |
D. Shareholder Servicing Fees — The Trusts, on behalf of the Funds, have entered into Shareholder Servicing Agreements with the Distributor under which the Distributor provides certain support services to the shareholders. For performing these services, the Distributor receives a fee that is computed daily and paid monthly equal to a percentage of the average daily net assets as shown in the table below:
| | | | | | | | | | | | | | | | | | | | | | | | | | | | |
| | | Class A | | | Class B | | | Class C | | | Class R2 | | | Class R5 | | | Institutional
Class | | | Select
Class | |
Growth Advantage Fund | | | 0.25 | % | | | 0.25 | % | | | 0.25 | % | | | n/a | | | | 0.05 | % | | | n/a | | | | 0.25 | % |
Mid Cap Core Fund | | | 0.25 | | | | n/a | | | | 0.25 | | | | 0.25 | % | | | 0.05 | | | | n/a | | | | 0.25 | |
Mid Cap Equity Fund | | | 0.25 | | | | n/a | | | | 0.25 | | | | n/a | | | | n/a | | | | n/a | | | | 0.25 | |
Mid Cap Growth Fund | | | 0.25 | | | | 0.25 | | | | 0.25 | | | | 0.25 | | | | n/a | | | | n/a | | | | 0.25 | |
Mid Cap Value Fund | | | 0.25 | | | | 0.25 | | | | 0.25 | | | | 0.25 | | | | n/a | | | | 0.10 | % | | | 0.25 | |
Multi-Cap Market Neutral Fund | | | 0.25 | | | | 0.25 | | | | 0.25 | | | | n/a | | | | n/a | | | | n/a | | | | 0.25 | |
Value Advantage Fund | | | 0.25 | | | | n/a | | | | 0.25 | | | | n/a | | | | n/a | | | | 0.10 | | | | 0.25 | |
The Distributor has entered into shareholder services contracts with affiliated and unaffiliated financial intermediaries who provide shareholder services and other related services to their clients or customers who invest in the Funds under which the Distributor will pay all or a portion of such fees earned to financial intermediaries for performing such services.
The Distributor waived Shareholder Servicing fees as outlined in Note 3.F.
E. Custodian and Accounting Fees — JPMCB provides portfolio custody and accounting services for the Funds. The amounts paid directly to JPMCB by the Funds for custody and accounting services are included in Custodian and accounting fees in the Statements of Operations. The custodian fees may be reduced by credits earned by each Fund, based on uninvested cash balances held by the custodian. Such earnings credits are presented separately in the Statements of Operations.
Interest expense, if any, paid to the custodian related to cash overdrafts is included in Interest expense to affiliates in the Statements of Operations.
F. Waivers and Reimbursements — The Advisor, Administrator and Distributor have contractually agreed to waive fees and/or reimburse the Funds to the extent that total annual operating expenses (excluding acquired fund fees and expenses, dividend and interest expense related to short sales, interest, taxes, extraordinary expenses and expenses related to the Board of Trustees’ deferred compensation plan) exceed the percentages of the Funds’ respective average daily net assets as shown in the table below:
| | | | | | | | | | | | | | | | | | | | | | | | | | | | |
| | | Class A | | | Class B | | | Class C | | | Class R2 | | | Class R5 | | | Institutional
Class | | | Select
Class | |
Growth Advantage Fund | | | 1.25 | % | | | 1.75 | % | | | 1.75 | % | | | n/a | | | | 0.90 | % | | | n/a | | | | 1.10 | % |
Mid Cap Core Fund | | | 1.25 | | | | n/a | | | | 1.75 | | | | 1.50 | % | | | 0.80 | | | | n/a | | | | 1.00 | |
Mid Cap Equity Fund | | | 1.25 | | | | n/a | | | | 1.75 | | | | n/a | | | | n/a | | | | n/a | | | | 0.90 | |
Mid Cap Growth Fund | | | 1.24 | | | | 1.77 | | | | 1.77 | | | | 1.40 | | | | n/a | | | | n/a | | | | 0.93 | |
Mid Cap Value Fund | | | 1.24 | | | | 1.75 | | | | 1.75 | | | | 1.50 | | | | n/a | | | | 0.75 | % | | | 0.99 | |
Multi-Cap Market Neutral Fund | | | 1.75 | | | | 2.50 | | | | 2.50 | | | | n/a | | | | n/a | | | | n/a | | | | 1.50 | |
Value Advantage Fund | | | 1.25 | | | | n/a | | | | 1.75 | | | | n/a | | | | n/a | | | | 0.75 | | | | 1.00 | |
The contractual expense limitation agreements were in effect for the period ended December 31, 2010. The contractual expense limitation percentages in the table above are in place until at least October 31, 2011. In addition, the Funds’ service providers have voluntarily waived fees during the period ended December 31, 2010. However, the Funds’ service providers are under no obligation to do so and may discontinue such voluntary waivers at any time.
| | | | | | | | |
| | | |
| DECEMBER 31, 2010 | | J.P. MORGAN MID CAP/MULTI-CAP FUNDS | | | | | 91 | |
NOTES TO FINANCIAL STATEMENTS
AS OF DECEMBER 31, 2010 (Unaudited) (continued)
Prior to September 1, 2010, the contractual expense limitations for Class A, Class B and Class C Shares of the Growth Advantage Fund were 1.35%, 2.05% and 2.05% respectively.
Prior to November 1, 2010, the contractual expense limitation for Select Class Shares of the Mid Cap Equity Fund was 1.00%.
For the period ended December 31, 2010, the Funds’ service providers waived fees and/or reimbursed expenses for each of the Funds as follows (amounts in thousands). None of these parties expects the Funds to repay any such waived fees and reimbursed expenses in future years.
| | | | | | | | | | | | | | | | | | | | |
| | | Contractual Waivers | | | | |
| | | Investment
Advisory | | | Administration | | | Shareholder
Servicing | | | Total | | | Reimbursements | |
Growth Advantage Fund | | $ | — | | | $ | — | | | $ | 30 | | | $ | 30 | | | $ | — | |
Mid Cap Core Fund | | | 2 | | | | — | | | | — | | | | 2 | | | | 23 | |
Mid Cap Equity Fund | | | — | | | | 43 | | | | 402 | | | | 445 | | | | — | |
Mid Cap Growth Fund | | | — | | | | 310 | | | | 1,153 | | | | 1,463 | | | | — | |
Mid Cap Value Fund | | | 1,456 | | | | 2,530 | | | | 1,232 | | | | 5,218 | | | | — | |
Multi-Cap Market Neutral Fund | | | — | | | | — | | | | 522 | | | | 522 | | | | — | |
Value Advantage Fund | | | 8 | | | | 262 | | | | 98 | | | | 368 | | | | — | |
| | | | | | | | | | | | | | | | |
| | | Voluntary Waivers | |
| | | Investment
Advisory | | | Administration | | | Shareholder
Servicing | | | Total | |
Mid Cap Equity Fund | | $ | — | | | $ | 34 | | | $ | 54 | | | $ | 88 | |
Multi-Cap Market Neutral Fund | | | 466 | | | | 99 | | | | 136 | | | | 701 | |
Additionally, the Funds may invest in one or more money market funds advised by the Advisor or its affiliates. The Advisors, Administrator and the Distributor as shareholder servicing agent waive an amount sufficient to offset the respective fees each charges to the affiliated money market fund on the Funds’ investment in such affiliated money market fund. A portion of the waiver is voluntary.
The amounts of waivers resulting from investments in the money market funds for the period ended December 31, 2010 were as follows (excluding the waiver disclosed in Note 2.C. regarding cash collateral for securities lending invested in the JPMorgan Prime Money Market Fund) (amounts in thousands):
| | | | |
Growth Advantage Fund | | $ | 8 | |
Mid Cap Equity Fund | | | 12 | |
Mid Cap Growth Fund | | | 19 | |
Mid Cap Value Fund | | | 140 | |
Multi-Cap Market Neutral Fund | | | 40 | |
Value Advantage Fund | | | 24 | |
G. Other — Certain officers of the Trusts are affiliated with the Advisor, the Administrator and the Distributor. Such officers, with the exception of the Chief Compliance Officer, receive no compensation from the Funds for serving in their respective roles.
The Board of Trustees appointed a Chief Compliance Officer to the Funds in accordance with federal securities regulations. Each Fund, along with other affiliated funds, makes reimbursement payments, on a pro-rata basis, to the Administrator for a portion of the fees associated with the Office of the Chief Compliance Officer. Such fees are included in Trustees’ and Chief Compliance Officer’s fees in the Statements of Operations.
The Trusts adopted a Trustee Deferred Compensation Plan (the “Plan”) which allows the Independent Trustees to defer the receipt of all or a portion of compensation related to performance of their duties as a Trustee. The deferred fees are invested in various J.P. Morgan Funds until distribution in accordance with the Plan.
During the period ended December 31, 2010, certain Funds may have purchased securities from an underwriting syndicate in which the principal underwriter or members of the syndicate are affiliated with Advisors.
The Funds may use related party broker/dealers. For the period ended December 31, 2010, the Funds did not incur any brokerage commissions with brokers/dealers affiliated with the Advisors.
The Securities and Exchange Commission (“SEC”) has granted an exemptive order permitting the Funds to engage in principal transactions with J.P. Morgan Securities, Inc., an affiliated broker, involving taxable money market instruments subject to certain conditions.
| | | | | | |
| | | |
| 92 | | | | J.P. MORGAN MID CAP/MULTI-CAP FUNDS | | DECEMBER 31, 2010 |
4. Investment Transactions
During the period ended December 31, 2010, purchases and sales of investments (excluding short-term investments) were as follows (amounts in thousands):
| | | | | | | | | | | | | | | | |
| | | Purchases
(excluding U.S.
Government) | | | Sales
(excluding U.S.
Government) | | | Securities
Sold Short | | | Covers on
Securities
Sold Short | |
Growth Advantage Fund | | $ | 351,202 | | | $ | 575,343 | | | $ | — | | | $ | — | |
Mid Cap Core Fund | | | 3,021 | | | | 85 | | | | — | | | | — | |
Mid Cap Equity Fund | | | 148,300 | | | | 243,559 | | | | — | | | | — | |
Mid Cap Growth Fund | | | 550,644 | | | | 608,196 | | | | — | | | | — | |
Mid Cap Value Fund | | | 999,541 | | | | 1,082,854 | | | | — | | | | — | |
Multi-Cap Market Neutral Fund | | | 404,258 | | | | 488,399 | | | | 433,049 | | | | 514,130 | |
Value Advantage Fund | | | 278,756 | | | | 83,655 | | | | — | | | | — | |
During the period ended December 31, 2010, there were no purchases or sales of U.S. Government securities.
5. Federal Income Tax Matters
For Federal income tax purposes, the cost and unrealized appreciation (depreciation) in value of the investment securities at December 31, 2010, were as follows (amounts in thousands):
| | | | | | | | | | | | | | | | |
| | | Aggregate
Cost | | | Gross
Unrealized
Appreciation | | | Gross
Unrealized
Depreciation | | | Net
Unrealized
Appreciation
(Depreciation) | |
Growth Advantage Fund | | $ | 636,497 | | | $ | 212,164 | | | $ | 1,567 | | | $ | 210,597 | |
Mid Cap Core Fund | | | 2,970 | | | | 176 | | | | 7 | | | | 169 | |
Mid Cap Equity Fund | | | 363,909 | | | | 119,396 | | | | 1,173 | | | | 118,223 | |
Mid Cap Growth Fund | | | 1,213,871 | | | | 479,594 | | | | 10,933 | | | | 468,661 | |
Mid Cap Value Fund | | | 5,020,240 | | | | 1,424,957 | | | | 69,584 | | | | 1,355,373 | |
Multi-Cap Market Neutral Fund | | | 471,025 | | | | 110,966 | | | | 4,002 | | | | 106,964 | |
Value Advantage Fund | | | 685,650 | | | | 137,073 | | | | 769 | | | | 136,304 | |
6. Borrowings
The Funds rely upon an exemptive order (“Order”) permitting the establishment and operation of an Interfund Lending Facility (“Facility”). The Facility allows the Funds to directly lend and borrow money to or from any other fund relying upon the Order at rates beneficial to both the borrowing and lending funds. Advances under the Facility are taken primarily for temporary or emergency purposes, including the meeting of redemption requests that otherwise might require the untimely disposition of securities, and are subject to each Fund’s borrowing restrictions. The Interfund Loan Rate is determined, as specified in the Order, by averaging the current repurchase agreement rate and the current bank loan rate. The Order was granted to JPM II and may be relied upon by the Funds because they are investment companies in the same “group of investment companies” (as defined in Section 12(d)(1)(G) of the 1940 Act).
In addition, the Trusts and JPMCB have entered into a financing arrangement. Under this arrangement, JPMCB provides an unsecured, uncommitted credit facility in the aggregate amount of $100 million to certain of the J.P. Morgan Funds including the Funds. Advances under the arrangement are taken primarily for temporary or emergency purposes, including the meeting of redemption requests that otherwise might require the untimely disposition of securities, and are subject to each Fund’s borrowing restrictions. Interest on borrowings is payable at a rate determined by JPMCB at the time of borrowing. This agreement has been extended until November 15, 2011.
The Funds had no borrowings outstanding from another fund or from the unsecured, uncommitted credit facility at December 31, 2010. Average borrowings from the Facility for the period ended December 31, 2010, were as follows (amounts in thousands):
| | | | | | | | | | | | |
| | | Average Borrowings | | | Number of Days Used | | | Interest
Paid | |
Growth Advantage Fund | | $ | 13,659 | | | | 3 | | | $ | — | (a) |
| (a) | Amount rounds to less than $1,000. |
Interest expense paid, if any, as a result of borrowings from another fund or from the unsecured, uncommitted credit facility is included in Interest expense to affiliates in the Statements of Operations.
7. Risks, Concentrations and Indemnifications
In the normal course of business, the Funds enter into contracts that contain a variety of representations which provide general indemnifications. Each Fund’s maximum exposure under these arrangements is unknown, as this would involve future claims that may be made against each Fund that have not yet occurred. However, based on experience, the Funds expect the risk of loss to be remote.
| | | | | | | | |
| | | |
| DECEMBER 31, 2010 | | J.P. MORGAN MID CAP/MULTI-CAP FUNDS | | | | | 93 | |
NOTES TO FINANCIAL STATEMENTS
AS OF DECEMBER 31, 2010 (Unaudited) (continued)
One or more affiliates of the Advisor have investment discretion with respect to their clients’ holdings in the Funds, which collectively represent a significant portion of the Funds’ assets for Growth Advantage Fund and Mid Cap Equity Fund. Additionally, the Advisor owns a significant portion of the outstanding shares of Mid Cap Core Fund.
In addition, the JPMorgan SmartRetirement Funds and J.P. Morgan Investor Funds, which are affiliated funds of funds, own, in the aggregate more than 10% of the net assets of the Funds as follows:
| | | | | | | | |
| | | J.P. Morgan
Investor Funds | | | JPMorgan
SmartRetirement
Fund | |
Growth Advantage Fund | | | N/A | | | | 15.9 | % |
Multi-Cap Market Neutral Fund | | | 72.3 | % | | | N/A | |
Value Advantage Fund | | | N/A | | | | 15.4 | |
Significant shareholder transactions, if any, may impact the Funds’ performance.
As of December 31, 2010, the Multi-Cap Market Neutral Fund pledged substantially all of its assets for securities sold short to Credit Suisse Group, who also held 100% of the Multi-Cap Market Neutral Fund’s cash proceeds for securities sold short.
8. Legal Matters
Prior to becoming an affiliate of JPMorgan, on June 29, 2004, Banc One Investment Advisors Corporation (“BOIA”) subsequently known as JPMorgan Investment Advisors Inc. (“JPMIA”), entered into agreements with the SEC (the “SEC Order”) and the New York Attorney General (“NYAG settlement”) in resolution of investigations into market timing of certain One Group mutual funds advised by BOIA. JPMIA was investment advisor to certain of the Funds until January 1, 2010. Effective January 1, 2010, JPMIA transferred its investment advisory business to JPMIM and JPMIM became investment advisor to such Funds. Under the terms of the SEC Order and the NYAG settlement, BOIA agreed to pay disgorgement of $10 million and a civil money penalty of $40 million for a total payment of $50 million, which has been distributed to certain current and former shareholders of certain funds. Pursuant to the NYAG settment, BOIA reduced its management fee for certain funds in the aggregate amount of approximately $8 million annually (based on assets under management as of June 30, 2004) over a five year period from September 27, 2004 through September 27, 2009.
In addition to the matters involving the SEC and NYAG, various lawsuits were filed by private plaintiffs in connection with these circumstances in various state and federal courts. These actions were transferred to the United States District Court for the District of Maryland. The plaintiffs filed consolidated amended complaints, naming as defendants, BOIA, Bank One Corporation and JPMorgan, One Group Services Company (the former distributor of One Group Mutual Funds), certain officers of One Group Mutual Funds and BOIA, and certain current and former Trustees.
As of June 14, 2006, all claims against One Group Mutual Funds and current and former trustees were dismissed by the United States District Court in Maryland. Certain claims against BOIA and its affiliates were also dismissed. On October 25, 2010, the court approved a settlement resolving all remaining claims in the litigation in Maryland.
The Funds will be reimbursed for all costs associated with these matters to ensure that they incur no expense as it relates to the matters described above. A portion of these reimbursements may be from related parties.
As noted above, the NYAG settlement required BOIA to establish reduced “net management fee rates” for certain Funds (“Reduced Rate Funds”). “Net Management Fee Rates” means the percentage fee rates specified in contracts between BOIA and its affiliates and the Reduced Rate Funds, less waivers and reimbursements by BOIA and its affiliates, in effect as of June 30, 2004. The settlement agreement required that the reduced Net Management Fee Rates must result in a reduction of $8 million annually based upon assets under management as of June 30, 2004, for a total reduction over five years of $40 million from that which would have been paid by the Reduced Rate Funds on the Net Management Fee Rates as of June 30, 2004. To the extent that BOIA and its affiliates have agreed as part of the settlement with the NYAG to waive or reimburse expenses of a Fund in connection with the settlement with the NYAG, those reduced Net Management Fee Rates were referred to as “Reduced Rates.” The Reduced Rates were implemented on September 27, 2004 and remained in place through September 27, 2009. Thus, the Reduced Rates are no longer in effect.
9. Transfers-In-Kind
Pursuant to procedures approved by the Board of Trustees, on May 24, 2010, certain shareholders of the Mid Cap Value Fund redeemed Institutional Class Shares and the Fund paid the redemption proceeds primarily by means of a redemption in-kind of the Fund’s portfolio securities.
| | | | | | | | | | | | |
| | | Value
(000’s) | | | Realized
Gains/(Losses)
(000’s) | | | Type | |
Institutional Class | | $ | 47,174 | | | $ | (7,817 | ) | | | Redemption-In-Kind | |
| | | | | | |
| | | |
| 94 | | | | J.P. MORGAN MID CAP/MULTI-CAP FUNDS | | DECEMBER 31, 2010 |
SCHEDULE OF SHAREHOLDER EXPENSES
(Unaudited)
Hypothetical $1,000
As a shareholder of the Funds, you incur two types of costs: (1) transaction costs, including sales charges (loads) on purchase payments and redemption fees and (2) ongoing costs, including investment advisory, administration fees, distribution fees and other Fund expenses. The examples below are intended to help you understand your ongoing costs (in dollars) of investing in the Funds and to compare these costs with the ongoing costs of investing in other mutual funds. The examples assume that you had a $1,000 investment in the Class at the beginning of the reporting period, July 1, 2010, and continued to hold your shares at the end of the reporting period, December 31, 2010.
Actual Expenses
For each Class of each Fund in the table below, the first line provides information about actual account values and actual expenses. You may use the information in this line, together with the amount you invested, to estimate the expenses that you paid over the period. Simply divide your account value by $1,000 (for example, an $8,600 account value divided by $1,000 = 8.6), then multiply the result by the number in the first line of each Class under the heading entitled “Expenses Paid During” to estimate the expenses you paid on your account during this period.
Hypothetical Example for Comparison Purposes
The second line of each Class in the table below provides information about hypothetical account values and hypothetical expenses based on the Class’ actual expense ratio and an assumed rate of return of 5% per year before expenses, which is not the Class’ actual return. The hypothetical account values and expenses may not be used to estimate the actual ending account balance or expenses you paid for the period. You may use this information to compare the ongoing costs of investing in the Class of the Fund and other funds. To do so, compare this 5% hypothetical example with the 5% hypothetical examples that appear in the shareholder reports of the other funds. Please note that the expenses shown in the table are meant to highlight your ongoing costs only and do not reflect any transaction costs, such as sales charges (loads) or redemption fees. Therefore, the second line for each Class in the table is useful in comparing ongoing costs only, and will not help you determine the relative total costs of owning different funds. In addition, if these transaction costs were included, your costs would have been higher. The examples also assume all dividends and distributions have been reinvested.
| | | | | | | | | | | | | | | | |
| | | Beginning
Account Value,
July 1, 2010 | | | Ending
Account Value,
December 31, 2010 | | | Expenses
Paid During
July 1, 2010
to December 31, 2010 | | | Annualized
Expense
Ratio | |
Growth Advantage Fund | | | | | | | | | | | | | | | | |
Class A | | | | | | | | | | | | | | | | |
Actual* | | $ | 1,000.00 | | | $ | 1,289.90 | | | $ | 7.27 | | | | 1.26 | % |
Hypothetical* | | | 1,000.00 | | | | 1,018.85 | | | | 6.41 | | | | 1.26 | |
Class B | | | | | | | | | | | | | | | | |
Actual* | | | 1,000.00 | | | | 1,285.30 | | | | 10.14 | | | | 1.76 | |
Hypothetical* | | | 1,000.00 | | | | 1,016.33 | | | | 8.94 | | | | 1.76 | |
Class C | | | | | | | | | | | | | | | | |
Actual* | | | 1,000.00 | | | | 1,285.30 | | | | 10.14 | | | | 1.76 | |
Hypothetical* | | | 1,000.00 | | | | 1,016.33 | | | | 8.94 | | | | 1.76 | |
Class R5 | | | | | | | | | | | | | | | | |
Actual* | | | 1,000.00 | | | | 1,290.10 | | | | 4.91 | | | | 0.85 | |
Hypothetical* | | | 1,000.00 | | | | 1,020.92 | | | | 4.33 | | | | 0.85 | |
Select Class | | | | | | | | | | | | | | | | |
Actual* | | | 1,000.00 | | | | 1,291.40 | | | | 6.06 | | | | 1.05 | |
Hypothetical* | | | 1,000.00 | | | | 1,019.91 | | | | 5.35 | | | | 1.05 | |
| | | | |
Mid Cap Core Fund | | | | | | | | | | | | | | | | |
Class A | | | | | | | | | | | | | | | | |
Actual** | | | 1,000.00 | | | | 1,059.00 | | | | 1.13 | | | | 1.25 | |
Hypothetical* | | | 1,000.00 | | | | 1,003.18 | | | | 1.06 | | | | 1.25 | |
Class C | | | | | | | | | | | | | | | | |
Actual** | | | 1,000.00 | | | | 1,058.70 | | | | 1.58 | | | | 1.75 | |
Hypothetical* | | | 1,000.00 | | | | 1,002.76 | | | | 1.49 | | | | 1.75 | |
Class R2 | | | | | | | | | | | | | | | | |
Actual** | | | 1,000.00 | | | | 1,058.70 | | | | 1.35 | | | | 1.50 | |
Hypothetical* | | | 1,000.00 | | | | 1,002.97 | | | | 1.28 | | | | 1.50 | |
| | | | | | | | |
| | | |
| DECEMBER 31, 2010 | | J.P. MORGAN MID CAP/MULTI-CAP FUNDS | | | | | 95 | |
SCHEDULE OF SHAREHOLDER EXPENSES
(Unaudited) (continued)
Hypothetical $1,000
| | | | | | | | | | | | | | | | |
| | | Beginning
Account Value,
July 1, 2010 | | | Ending
Account Value,
December 31, 2010 | | | Expenses
Paid During
July 1, 2010
to December 31, 2010 | | | Annualized
Expense
Ratio | |
Mid Cap Core Fund (continued) | | | | | | | | | | | | | | | | |
Class R5 | | | | | | | | | | | | | | | | |
Actual** | | $ | 1,000.00 | | | $ | 1,059.20 | | | $ | 0.72 | | | | 0.80 | % |
Hypothetical* | | | 1,000.00 | | | | 1,003.57 | | | | 0.68 | | | | 0.80 | |
Select Class | | | | | | | | | | | | | | | | |
Actual** | | | 1,000.00 | | | | 1,059.10 | | | | 0.90 | | | | 1.00 | |
Hypothetical* | | | 1,000.00 | | | | 1,003.40 | | | | 0.85 | | | | 1.00 | |
| | | | |
Mid Cap Equity Fund | | | | | | | | | | | | | | | | |
Class A | | | | | | | | | | | | | | | | |
Actual* | | | 1,000.00 | | | | 1,270.50 | | | | 7.10 | | | | 1.24 | |
Hypothetical* | | | 1,000.00 | | | | 1,018.95 | | | | 6.31 | | | | 1.24 | |
Class C | | | | | | | | | | | | | | | | |
Actual* | | | 1,000.00 | | | | 1,267.30 | | | | 9.94 | | | | 1.74 | |
Hypothetical* | | | 1,000.00 | | | | 1,016.43 | | | | 8.84 | | | | 1.74 | |
Select Class | | | | | | | | | | | | | | | | |
Actual* | | | 1,000.00 | | | | 1,272.40 | | | | 5.10 | | | | 0.89 | |
Hypothetical* | | | 1,000.00 | | | | 1,020.72 | | | | 4.53 | | | | 0.89 | |
| | | | |
Mid Cap Growth Fund | | | | | | | | | | | | | | | | |
Class A | | | | | | | | | | | | | | | | |
Actual* | | | 1,000.00 | | | | 1,314.40 | | | | 7.12 | | | | 1.22 | |
Hypothetical* | | | 1,000.00 | | | | 1,019.06 | | | | 6.21 | | | | 1.22 | |
Class B | | | | | | | | | | | | | | | | |
Actual* | | | 1,000.00 | | | | 1,310.90 | | | | 10.19 | | | | 1.75 | |
Hypothetical* | | | 1,000.00 | | | | 1,016.38 | | | | 8.89 | | | | 1.75 | |
Class C | | | | | | | | | | | | | | | | |
Actual* | | | 1,000.00 | | | | 1,310.90 | | | | 10.19 | | | | 1.75 | |
Hypothetical* | | | 1,000.00 | | | | 1,016.38 | | | | 8.89 | | | | 1.75 | |
Class R2 | | | | | | | | | | | | | | | | |
Actual* | | | 1,000.00 | | | | 1,313.60 | | | | 8.05 | | | | 1.38 | |
Hypothetical* | | | 1,000.00 | | | | 1,018.25 | | | | 7.02 | | | | 1.38 | |
Select Class | | | | | | | | | | | | | | | | |
Actual* | | | 1,000.00 | | | | 1,316.00 | | | | 5.31 | | | | 0.91 | |
Hypothetical* | | | 1,000.00 | | | | 1,020.62 | | | | 4.63 | | | | 0.91 | |
| | | | |
Mid Cap Value Fund | | | | | | | | | | | | | | | | |
Class A | | | | | | | | | | | | | | | | |
Actual* | | | 1,000.00 | | | | 1,232.70 | | | | 6.92 | | | | 1.23 | |
Hypothetical* | | | 1,000.00 | | | | 1,019.00 | | | | 6.26 | | | | 1.23 | |
Class B | | | | | | | | | | | | | | | | |
Actual* | | | 1,000.00 | | | | 1,230.00 | | | | 9.78 | | | | 1.74 | |
Hypothetical* | | | 1,000.00 | | | | 1,016.43 | | | | 8.84 | | | | 1.74 | |
Class C | | | | | | | | | | | | | | | | |
Actual* | | | 1,000.00 | | | | 1,229.60 | | | | 9.78 | | | | 1.74 | |
Hypothetical* | | | 1,000.00 | | | | 1,016.43 | | | | 8.84 | | | | 1.74 | |
Class R2 | | | | | | | | | | | | | | | | |
Actual* | | | 1,000.00 | | | | 1,231.40 | | | | 8.38 | | | | 1.49 | |
Hypothetical* | | | 1,000.00 | | | | 1,017.69 | | | | 7.58 | | | | 1.49 | |
Institutional Class | | | | | | | | | | | | | | | | |
Actual* | | | 1,000.00 | | | | 1,236.50 | | | | 4.17 | | | | 0.74 | |
Hypothetical* | | | 1,000.00 | | | | 1,021.48 | | | | 3.77 | | | | 0.74 | |
Select Class | | | | | | | | | | | | | | | | |
Actual* | | | 1,000.00 | | | | 1,234.50 | | | | 5.52 | | | | 0.98 | |
Hypothetical* | | | 1,000.00 | | | | 1,020.27 | | | | 4.99 | | | | 0.98 | |
| | | | | | |
| | | |
| 96 | | | | J.P. MORGAN MID CAP/MULTI-CAP FUNDS | | DECEMBER 31, 2010 |
| | | | | | | | | | | | | | | | |
| | | Beginning
Account Value,
July 1, 2010 | | | Ending
Account Value,
December 31, 2010 | | | Expenses
Paid During
July 1, 2010
to December 31, 2010 | | | Annualized
Expense
Ratio | |
Multi-Cap Market Neutral Fund | | | | | | | | | | | | | | | | |
Class A | | | | | | | | | | | | | | | | |
Actual* | | $ | 1,000.00 | | | $ | 986.60 | | | $ | 16.37 | | | | 3.27 | % |
Hypothetical* | | | 1,000.00 | | | | 1,008.72 | | | | 16.56 | | | | 3.27 | |
Class B | | | | | | | | | | | | | | | | |
Actual* | | | 1,000.00 | | | | 983.10 | | | | 20.29 | | | | 4.06 | |
Hypothetical* | | | 1,000.00 | | | | 1,004.74 | | | | 20.52 | | | | 4.06 | |
Class C | | | | | | | | | | | | | | | | |
Actual* | | | 1,000.00 | | | | 983.10 | | | | 20.19 | | | | 4.04 | |
Hypothetical* | | | 1,000.00 | | | | 1,004.84 | | | | 20.42 | | | | 4.04 | |
Select Class | | | | | | | | | | | | | | | | |
Actual* | | | 1,000.00 | | | | 987.70 | | | | 15.13 | | | | 3.02 | |
Hypothetical* | | | 1,000.00 | | | | 1,009.98 | | | | 15.30 | | | | 3.02 | |
| | | | |
Value Advantage Fund | | | | | | | | | | | | | | | | |
Class A | | | | | | | | | | | | | | | | |
Actual* | | | 1,000.00 | | | | 1,206.10 | | | | 6.90 | | | | 1.24 | |
Hypothetical* | | | 1,000.00 | | | | 1,018.95 | | | | 6.31 | | | | 1.24 | |
Class C | | | | | | | | | | | | | | | | |
Actual* | | | 1,000.00 | | | | 1,203.30 | | | | 9.66 | | | | 1.74 | |
Hypothetical* | | | 1,000.00 | | | | 1,016.43 | | | | 8.84 | | | | 1.74 | |
Institutional Class | | | | | | | | | | | | | | | | |
Actual* | | | 1,000.00 | | | | 1,208.80 | | | | 4.12 | | | | 0.74 | |
Hypothetical* | | | 1,000.00 | | | | 1,021.48 | | | | 3.77 | | | | 0.74 | |
Select Class | | | | | | | | | | | | | | | | |
Actual* | | | 1,000.00 | | | | 1,207.10 | | | | 5.51 | | | | 0.99 | |
Hypothetical* | | | 1,000.00 | | | | 1,020.21 | | | | 5.04 | | | | 0.99 | |
| * | Expenses are equal to the Funds’ annualized expense ratio, multiplied by the average account value over the period, multiplied by 184/365 to reflect the one-half year period). |
| ** | Expenses are equal to the Fund's annualized expense ratio, multiplied by the average account value over the period, multiplied by 32/365 to reflect the actual period). The Mid Cap Core Fund commenced operations on November 30, 2010. |
| | | | | | | | |
| | | |
| DECEMBER 31, 2010 | | J.P. MORGAN MID CAP/MULTI-CAP FUNDS | | | | | 97 | |
BOARD APPROVAL OF INVESTMENT ADVISORY AGREEMENTS
(Unaudited)
JPMorgan Growth Advantage Fund, JPMorgan Mid Cap Equity Fund, JPMorgan Mid Cap Growth Fund, JPMorgan Mid Cap Value Fund, JPMorgan Multi-Cap Market Neutral Fund, JPMorgan Value Advantage Fund
The Board of Trustees meets regularly throughout the year and considers factors that are relevant to its annual consideration of investment advisory agreements at each meeting. The Board of Trustees has established various standing committees, composed of Trustees with diverse backgrounds, to which the Board of Trustees has assigned specific subject matter responsibilities to further enhance the effectiveness of the Board’s oversight and decision making. The Board of Trustees and its investment subcommittees (money market and alternative products, equity, and fixed income) also meet as needed for the specific purpose of considering advisory contract annual renewals. The Board of Trustees held meetings in person in June and August 2010, at which the Trustees considered the continuation of each of the investment advisory agreements for the Funds whose semi-annual report is contained herein (each an “Advisory Agreement” and collectively, the “Advisory Agreements”). At the June meeting, the Board’s investment subcommittees met to review and consider performance, expense and related information for the J.P. Morgan Funds. Each investment subcommittee reported to the full Board, which then considered the investment subcommittee’s preliminary findings. At the August meeting, the Trustees continued their review and consideration. The Trustees, including a majority of the Trustees who are not “interested persons” (as defined in the 1940 Act) of any party to the Advisory Agreements or any of their affiliates, approved the continuation of each Advisory Agreement on August 18, 2010.
JPMorgan Investment Advisors Inc. (“JPMIA”) served as the investment adviser to certain Funds until January 1, 2010, when its investment advisory business was transferred to the Advisor, who became the investment adviser for the Funds. The appointment of the Advisor did not change the Funds’ portfolio management team or investment strategies, the investment advisory fees charged to the Funds or the terms of the Funds’ investment advisory agreements (other than the name of the investment adviser).
The Trustees, as part of their review of the investment advisory arrangements for the Funds, considered and reviewed performance and other information received from the Advisor (including applicable information relating to JPMIA prior to January 1, 2010), on a regular basis over the course of the year, as well as information specifically prepared for their annual review. This information includes the Funds’ performance compared to the performance of the Funds’ peers and benchmarks and analyses by the Advisor of the Funds’ performance. In addition, the Trustees have engaged an independent consultant to report on the performance of each of the Funds at each of the Trustees’ regular meetings. The Advisor also periodically provides comparative information regarding the Funds’
expense ratios and those of the peer groups. In addition, in preparation for the June and August meetings, the Trustees requested and received and evaluated extensive materials from the Advisor, including, with respect to certain Funds, performance and expense information compiled by Lipper Inc. (“Lipper”), an independent provider of investment company data. The Trustees also have engaged an independent consultant to provide additional analyses of the performance of Funds with greater than two years of performance history in connection with the review of the investment advisory arrangements. Prior to voting, the Trustees reviewed the proposed approval of the Advisory Agreement with representatives of the Advisor and with counsels to the Trust and independent Trustees and received a memorandum from independent counsel to the Trustees discussing the legal standards for their consideration of the proposed approval. The Trustees also discussed the proposed approvals in executive sessions with counsels to the Trust and independent Trustees at which no representatives of the Advisor were present. Set forth below is a summary of the material factors evaluated by the Trustees in determining whether to approve each Advisory Agreement.
In their deliberations, there was a comprehensive consideration of the information received by the Trustees. Each Trustee attributed different weights to the various factors and no factor alone was considered determinative. From year to year, the Trustees consider and place emphasis on relevant information in light of changing circumstances in market and economic conditions. The Trustees determined that the compensation to be received by the Advisor from each Fund under the applicable Advisory Agreement was fair and reasonable and that the continuance of the investment advisory contract was in the best interests of each Fund and its shareholders.
The factors summarized below were considered and discussed by the Trustees in reaching their conclusions:
Nature, Extent and Quality of Services Provided by the Advisor
The Trustees received and considered information regarding the nature, extent and quality of the services provided to each Fund under the Advisory Agreement. The Trustees took into account information furnished throughout the year at Trustee meetings, as well as the materials furnished specifically in connection with this annual review process. The Trustees considered the background and experience of the Advisor’s senior management and the expertise of, and the amount of attention given to each Fund by, investment personnel of the Advisor. In addition, the Trustees reviewed the qualifications, backgrounds and responsibilities of the portfolio management team primarily responsible for the day-to-day management of each Fund and the infrastructure supporting the team. The Trustees also considered information provided by the Advisor and JPMorgan Distribution Services, Inc. (“JPMDS”) about the structure and distribution strategy of each Fund. The Trustees also reviewed
| | | | | | |
| | | |
| 98 | | | | J.P. MORGAN MID CAP/MULTI-CAP FUNDS | | DECEMBER 31, 2010 |
information relating to enhancements to the Advisor’s risk governance model in light of recent market turbulence and reports showing that the Advisor has consistently complied with the investment policies and restrictions of each of the Funds. The quality of the administrative services provided by JPMorgan Funds Management, Inc. (“JPMFM”), an affiliate of the Advisor, was also considered.
The Board of Trustees also considered its knowledge of the nature and quality of the services provided by the Advisor to the Funds gained from their experience as Trustees of the Funds. In addition, they considered the overall reputation and capabilities of the Advisor and its affiliates, the commitment of the Advisor to provide high quality service to the Funds, their overall confidence in the Advisor’s integrity and the Advisor’s responsiveness to concerns raised by them, including the Advisor’s willingness to consider and implement organizational and operational changes designed to improve investment results and the services provided to each Fund.
Based on these considerations and other factors, the Trustees concluded that they were satisfied with the nature, extent and quality of the investment advisory services provided to the Funds by the Advisor.
Costs of Services Provided and Profitability to the Advisor and its Affiliates
The Trustees received and considered information regarding the profitability to the Advisor and its affiliates in providing services to each of the Funds. The Trustees reviewed and discussed this data. The Trustees recognized that this data is not audited and represents the Advisor’s determination of its and its affiliates revenues from the contractual services provided to the Funds, less expenses of providing such services. Expenses include direct and indirect costs and are calculated using an allocation methodology developed by the Advisor. The Trustees also recognized that it is difficult to make comparisons of profitability from fund investment advisory contracts because comparative information is not generally publicly available and is affected by numerous factors, including the structure of the particular adviser, the types of funds it manages, its business mix, numerous assumptions regarding allocations and the fact that publicly-traded fund managers’ operating profits and net income are net of distribution and marketing expenses. Based on their review, the Trustees concluded that the profitability to the Advisor of each of the Advisory Agreements was not unreasonable in light of the services and benefits provided to each Fund.
Fall-Out Benefits
The Trustees reviewed information regarding potential “fallout” or ancillary benefits received by the Advisor and its affiliates as a result of their relationship with the Funds. The Board also considered the Advisor’s use of third-party soft dollar arrangements with respect to securities transactions in U.S equity securities.
The Trustees also considered that JPMFM and JPMDS, affiliates of the Advisor, earn fees from the Funds for providing administrative and shareholder services. These fees were shown separately in the profitability analysis presented to the Trustees. The Trustees also considered the payments of Rule 12b-1 fees to JPMDS, which also acts as the Funds’ distributor and that these fees are in turn generally paid to financial intermediaries that sell the Funds, including financial intermediaries that are affiliates of the Advisor. The Trustees also considered the fees paid to JPMorgan Chase Bank, NA (“JPMCB”) for custody and fund accounting, securities lending, and other related services.
Economies of Scale
The Trustees noted that the proposed investment advisory fee schedule for each Fund does not contain breakpoints. The Trustees considered whether it would be appropriate to add advisory fee breakpoints and the Trustees concluded that the current fee structure was reasonable in light of the fee waivers and expense limitations that the Advisor has in place that serve to limit the overall net expense ratio at competitive levels. The Trustees also recognized that the fee schedule for the administrative services provided by JPMFM does include a fee breakpoint, which is tied to the overall level of money market assets or non-money market fund assets excluding funds-of-funds, as applicable, advised by the Advisor, and that the Funds would benefit from that breakpoint. The Trustees concluded that shareholders benefited from the lower expense ratios which resulted from these factors.
Independent Written Evaluation of the Funds’ Senior/Chief Compliance Officer
The Trustees noted that, upon their direction, the Senior Officer for the Mid Cap Growth Fund, Mid Cap Value Fund and Multi-Cap Market Neutral Fund had prepared an independent written evaluation in order to assist the Trustees in determining the reasonableness of the proposed management fees. In determining whether to continue the Advisory Agreements, the Trustees considered the Senior Officer’s report.
The Trustees noted that, upon their direction, the Chief Compliance Officer for the Growth Advantage Fund, Mid Cap Equity Fund, and Value Advantage Fund had prepared an independent written evaluation in order to assist the Trustees in determining the reasonableness of the proposed management fees. The Trustees considered the written evaluation in determining whether to continue the Advisory Agreements.
Fees Relative to Advisor’s Other Clients
The Trustees received and considered information about the nature and extent of investment advisory services and fee rates offered to other clients of the Advisor for investment management styles substantially similar to that of each Fund. The Trustees also considered the complexity of investment
| | | | | | | | |
| | | |
| DECEMBER 31, 2010 | | J.P. MORGAN MID CAP/MULTI-CAP FUNDS | | | | | 99 | |
BOARD APPROVAL OF INVESTMENT ADVISORY AGREEMENTS
(Unaudited) (continued)
management for the Funds relative to the Advisor’s other clients and the differences in the nature and extent of the services provided to the different clients. The Trustees concluded that the fee rates charged to each Fund in comparison to those charged to the Advisor’s other clients were reasonable.
Investment Performance
The Trustees received and considered absolute and/or relative performance for Funds which had at least one full year of performance at the time of the review in a report prepared by Lipper. The Trustees considered the total return performance information, which included the ranking of those Funds which had at least one full year of performance at the time of the review within a performance universe made up of funds with the same Lipper investment classification and objective (the “Universe Group”) by total return for applicable one-, three- and five-year periods. The Trustees reviewed a description of Lipper’s methodology for selecting mutual funds in each Fund’s Universe Group. The Lipper materials provided to the Trustees highlighted information with respect to certain representative classes to assist the Trustees in their review. As part of this review, the Trustees also reviewed each Fund’s performance against its benchmark and considered the performance information provided for the Funds at regular Board meetings by the Advisor and the independent consultant and also considered the special analysis by the independent consultant. The Lipper performance data noted by the Trustees as part of their review and the determinations made by the Trustees with respect to each Fund’s performance for certain representative classes are summarized below:
The Trustees noted that the Growth Advantage Fund’s performance were in the third, second and first quintiles for Class A shares for the one-, three-, and five-year periods ended December 31, 2009, respectively and that the performance for the Select Class shares were in the third and second quintiles for the one- and three-year periods ended December 31, 2009, respectively. The Trustees also noted that the independent consultant indicated that the Fund’s overall performance was attractive. The Trustees discussed the performance and investment strategy of the Fund with the Advisor and, based upon this discussion and other factors, concluded that the performance was reasonable.
The Trustees noted that the Mid Cap Equity Fund’s performance was in the third, third and second quintiles for Select Class shares for the one-, three-, and five-year periods ended December 31, 2009, respectively, and that the independent consultant indicated that overall performance was attractive. The Trustees discussed the performance and investment strategy of the Fund with the Advisor and, based upon this discussion and other factors, concluded that the performance was reasonable.
The Trustees noted that the Mid Cap Growth Fund’s performance was in the third, second and second quintiles for Class A
shares and in the second quintile for the Select Class shares for each of the one-, three-, and five-year periods ended December 31, 2009, respectively, and that the independent consultant indicated that overall performance was attractive. The Trustees discussed the performance and investment strategy of the Fund with the Advisor and, based upon this discussion and other factors, concluded that the performance was reasonable.
The Trustees noted that the Mid Cap Value Fund’s performance was in the fifth, third and third quintiles for both Class A and Select Class shares for the one-, three-, and five-year periods ended December 31, 2009, respectively, and that the independent consultant indicated that the overall performance was satisfactory. The Trustees discussed the performance and investment strategy of the Fund with the Advisor and, based upon this discussion and other factors, concluded that the performance was reasonable. However, they requested that the Fund’s Advisor provide additional Fund performance information to be reviewed with members of the equity subcommittee at each of their regular meetings over the course of the next year.
The Trustees noted that the Multi-Cap Market Neutral Fund’s performance was in the third, fourth and third quintiles for both Class A and Select Class shares for the one-, three-, and five-year periods ended December 31, 2009, respectively, and that the independent consultant indicated that the overall performance needed enhancement. The Trustees discussed the performance and investment strategy of the Fund with the Advisor and, based upon this discussion and other factors, concluded that the performance was reasonable.
The Trustees noted that the Value Advantage Fund’s performance was in the first quintile for both Class A and Select Class shares for the one- and three-year periods ended December 31, 2009, respectively, and that the independent consultant indicated that overall performance was attractive. The Trustees discussed the performance and investment strategy of the Fund with the Advisor and, based upon this discussion and other factors, concluded that the performance was reasonable.
Advisory Fees and Expense Ratios
The Trustees considered the contractual advisory fee rate paid by each Fund to the Advisor and compared that rate to the information prepared by Lipper concerning management fee rates paid by other funds in the same Lipper category as each Fund. The Trustees recognized that Lipper reported each Fund’s management fee rate as the combined contractual advisory fee and the administration fee rates. The Trustees also reviewed information about other expenses and the expense ratios for each Fund. The Trustees considered the fee waiver and/or expense reimbursement arrangements currently in place for each Fund and considered the net advisory fee rate after taking into account any waivers and/or reimbursements. The Trustees recognized that it is difficult to make comparisons
| | | | | | |
| | | |
| 100 | | | | J.P. MORGAN MID CAP/MULTI-CAP FUNDS | | DECEMBER 31, 2010 |
of advisory fees because there are variations in the services that are included in the fees paid by other funds. The Trustees’ determination as a result of the review of each Fund’s advisory fees and expense ratios for certain representative classes are summarized below:
The Trustees noted that the Growth Advantage Fund’s net advisory fee for Class A and Select Class shares was in the third and fourth quintiles, respectively, and that the actual total expenses for Class A and Select shares were in the third quintile of their Universe Group. After considering the factors identified above, in light of the information, the Trustees concluded that the advisory fees were reasonable.
The Trustees noted that the Mid Cap Equity Fund’s net advisory fee and actual total expenses for the Select Class shares was in the second quintile of its respective Universe Group. After considering the factors identified above, in light of the information, the Trustees concluded that the advisory fees were reasonable.
The Trustees noted that the Mid Cap Growth Fund’s net advisory fee for Class A and Select Class shares was in the second quintile and that the actual total expenses for both Class A and Select Class shares were in the first and second quintiles, respectively, of their respective Universe Group. After considering the factors identified above, in light of the information, the Trustees concluded that the advisory fees were reasonable.
The Trustees noted that the Mid Cap Value Fund’s net advisory fee for Class A and Select Class shares was in the first quintile and that the actual total expenses for Class A and Select shares were in the second and third quintiles, respectively, of their respective Universe Group. After considering the factors identified above, in light of the information, the Trustees concluded that the advisory fees were reasonable.
The Trustees noted that the Multi-Cap Market Neutral Fund’s net advisory fee for Class A and Select Class shares was in the third and fourth quintiles, respectively, and that the actual total expenses for Class A and Select Class shares were in the second quintile of their respective Universe Group. After considering the factors identified above, in light of the information, the Trustees concluded that the advisory fees were reasonable.
The Trustees noted that the Value Advantage Fund’s net advisory fee for Class A and Select Class shares was in the first quintile and that the actual total expenses for Class A and Select Class shares were in the third quintile of their respective Universe Group. After considering the factors identified above, in light of the information, the Trustees concluded that the advisory fees were reasonable.
JPMorgan Mid Cap Core Fund
The Board of Trustees meets regularly throughout the year and considers factors that are relevant to its annual consideration of investment advisory agreements at each meeting. The Board of Trustees has established various standing committees,
composed of Trustees with diverse backgrounds, to which the Board of Trustees has assigned specific subject matter responsibilities to further enhance the effectiveness of the Board’s oversight and decision making. The Board of Trustees and its investment subcommittees (money market and alternative products, equity, and fixed income) also meet as needed for the specific purpose of considering approvals of initial advisory agreement for new funds. At their November 2010 in person meeting, the Trustees, including a majority of the Trustees who are not “interested persons” (as defined in the 1940 Act) of any party to the initial advisory agreement or any of their affiliates (“Independent Trustees”), approved the initial investment advisory agreement (the “New Advisory Agreement”) for the Mid Cap Core Fund (the “Fund”).
In connection with the approval of the New Advisory Agreement, the Trustees reviewed written materials prepared by the Advisor and received oral presentations from Advisor personnel. Prior to voting, the Trustees reviewed the proposed approval of the New Advisory Agreement with representatives of the Advisor and with counsels to the Trust and independent Trustees and received a memorandum from independent counsel to the Trustees discussing the legal standards for their consideration of the proposed approval. The Trustees also discussed the proposed approval in an executive session with counsels to the Trust and independent Trustees at which no representatives of the Advisor were present. Set forth below is a summary of the material factors evaluated by the Trustees in determining whether to approve the New Advisory Agreement.
In their deliberations, there was a comprehensive consideration of the information received by the Trustees. Each Trustee attributed different weights to the various factors and no factor alone was considered determinative. The Trustees determined that the proposed compensation to be received by the Advisor from the Fund under the New Advisory Agreement was fair and reasonable and that the initial approval of the New Advisory Agreement was in the best interests of the Fund and its potential shareholders.
The factors summarized below were considered and discussed by the Trustees in reaching their conclusions:
Nature, Extent and Quality of Services Provided by the Advisor
In connection with the approval of the New Advisory Agreement, the Trustees considered the materials furnished specifically in connection with this approval item, as well as other relevant information furnished throughout the year. The Trustees considered the background and experience of the Advisor’s senior management and investment personnel, as well as the qualifications, backgrounds and responsibilities of the portfolio management team primarily responsible for the day-to-day management of the Fund. The Trustees also considered the investment strategy and investment process for the Fund, and the infrastructure supporting the portfolio management team.
| | | | | | | | |
| | | |
| DECEMBER 31, 2010 | | J.P. MORGAN MID CAP/MULTI-CAP FUNDS | | | | | 101 | |
BOARD APPROVAL OF INVESTMENT ADVISORY AGREEMENTS
(Unaudited) (continued)
In addition, the Trustees considered information about the structure and distribution strategy of the Fund, how it fits within the J.P. Morgan Funds lineup, and how it will be positioned against identified peers.
The Board of Trustees also considered its knowledge of the nature and quality of the services provided by the Advisor to the J.P. Morgan Funds gained from their experience as Trustees of the J.P. Morgan Funds. In addition, they considered the overall reputation and capabilities of the Advisor and its affiliates, the commitment of the Advisor to provide high quality service to the J.P. Morgan Funds, their overall confidence in the Advisor’s integrity and the Advisor’s responsiveness to concerns raised by them, including the Advisor’s willingness to consider and implement organizational and operational changes designed to improve investment results and the services provided to the J.P. Morgan Funds.
Based on these considerations and other factors, the Trustees concluded that they were satisfied with the nature, extent and quality of the investment advisory services to be provided to the Mid Cap Core Fund by the Advisor.
Fall-Out Benefits
The Trustees reviewed information regarding potential “fallout” or ancillary benefits received by the Advisor and its affiliates as a result of their relationship with the J.P. Morgan Funds. The Board considered that the Advisor will use third-party soft dollar arrangements with respect to securities transactions it executes for the Fund.
The Trustees also considered that JPMFM and JPMDS, affiliates of the Advisor, will earn fees from the Fund for providing administrative and shareholder services. The Trustees also considered the payments of Rule 12b-1 fees to JPMDS, which also acts as the Funds’ distributor and that these fees are in turn generally paid to financial intermediaries that sell the Funds, including financial intermediaries that are affiliates of the Advisor. The Trustees also considered the fees paid to JPMorgan Chase Bank, NA (“JPMCB”) for custody and fund accounting and other related services.
Economies of Scale
The Trustees noted that the proposed investment advisory fee schedule for the Fund does not contain breakpoints. The Trustees considered whether it would be appropriate to add
advisory fee breakpoints and the Trustees concluded that the current fee structure was reasonable in light of the fee waivers and expense limitations that the Advisor has in place that serve to limit the overall net expense ratio at competitive levels. The Trustees also recognized that the fee schedule for the administrative services provided by JPMFM does include a fee breakpoint, which is tied to the overall level of money market assets or non-money market fund assets excluding funds-of-funds, as applicable, advised by the Advisor, and that the Fund would benefit from that breakpoint. With regard to the New Advisory Agreement, the Trustees found that, with the adoption of a voluntary fee waiver and contractual cap on total expenses, shareholders would benefit from expected economies of scale.
Investment Performance
The Trustees considered the Fund’s investment strategy and process, portfolio management team and competitive positioning against identified peer funds, and concluded that the prospects for competitive future performance were acceptable.
Advisory Fees and Expense Ratios
The Trustees considered the contractual advisory fee rate that will be paid by the Fund to the Advisor and compared that rate to the information prepared by Lipper concerning management fee rates paid by other funds in the same Lipper category as the Fund. The Trustees recognized that Lipper reported the Fund’s management fee rate as the combined contractual advisory fee and the administration fee rates. The Trustees also reviewed information about other expenses and the expense ratios for the Fund. The Trustees considered the fee waiver and/or expense reimbursement arrangements proposed for the Fund and considered the net advisory fee rate after taking into account any waivers and/or reimbursements. The Trustees recognized that it is difficult to make comparisons of advisory fees because there are variations in the services that are included in the fees paid by other funds. The Trustees’ determination as a result of the review of the Fund’s advisory fees and expense ratios for certain representative classes are summarized below:
The Trustees noted that the Fund’s estimated net advisory fees and total expenses, which were considered on a class by class basis, were in line with identified peer funds. After considering the factors identified above, in light of the information, the Trustees concluded that the advisory fees were reasonable.
| | | | | | |
| | | |
| 102 | | | | J.P. MORGAN MID CAP/MULTI-CAP FUNDS | | DECEMBER 31, 2010 |
J.P. Morgan Funds are distributed by JPMorgan Distribution Services, Inc., which is an affiliate of JPMorgan Chase & Co. Affiliates of JPMorgan Chase & Co. receive fees for providing various services to the funds.
Contact JPMorgan Distribution Services, Inc. at 1-800-480-4111 for a fund prospectus. You can also visit us at www.jpmorganfunds.com. Investors should carefully consider the investment objectives and risk as well as charges and expenses of the mutual fund before investing. The prospectus contains this and other information about the mutual fund. Read the prospectus carefully before investing.
Investors may obtain information about the Securities Investor Protection Corporation (SIPC), including the SIPC brochure by visiting www.sipc.org or by calling SIPC at 202-371-8300.
Each Fund files a complete schedule of its fund holdings for the first and third quarters of its fiscal year with the SEC on Form N-Q. The Funds’ Forms N-Q are available on the SEC’s website at http://www.sec.gov and may be reviewed and copied at the SEC’s Public Reference Room in Washington, DC. Information on the operation of the SEC’s Public Reference Room may be obtained by calling 1-800-SEC-0330. Shareholders may request the Form N-Q without charge by calling 1-800-480-4111 or by visiting the J.P. Morgan Funds’ website at www.jpmorganfunds.com.
A description of each Fund’s policies and procedures with respect to the disclosure of each Fund’s holdings is available in the prospectus and Statement of Additional Information.
A copy of proxy policies and procedures is available without charge upon request by calling 1-800-480-4111 and a description of such policies and procedures is on the SEC’s website at www.sec.gov. The Trustees have delegated the authority to vote proxies for securities owned by the Funds to the Advisor. A copy of the Funds’ voting record for the most recent 12-month period ended June 30 is available on the SEC’s website at www.sec.gov or at the Funds’ website at www.jpmorganfunds.com no later than August 31 of each year. The Funds’ proxy voting record will include, among other things, a brief description of the matter voted on for each fund security, and will state how each vote was cast, for example, for or against the proposal.


J.P. Morgan Asset Management is the marketing name for the asset management business of JPMorgan Chase & Co. Those businesses include, but are not limited to, J.P. Morgan Investment Management Inc., Security Capital Research & Management Incorporated and J.P. Morgan Alternative Asset Management, Inc.
| | | | |
 | | © JPMorgan Chase & Co., 2010 All rights reserved. December 2010. | | SAN-MC-1210 |
ITEM 2. CODE OF ETHICS.
Disclose whether, as of the end of the period covered by the report, the registrant has adopted a code of ethics that applies to the registrant’s principal executive officer, principal financial officer, principal accounting officer or controller, or persons performing similar functions, regardless of whether these individuals are employed by the registrant or a third party. If the registrant has not adopted such a code of ethics, explain why it has not done so.
The registrant must briefly describe the nature of any amendment, during the period covered by the report, to a provision of its code of ethics that applies to the registrant’s principal executive officer, principal financial officer, principal accounting officer or controller, or persons performing similar functions, regardless of whether these individuals are employed by the registrant or a third party, and that relates to any element of the code of ethics definition enumerated in paragraph (b) of this Item. The registrant must file a copy of any such amendment as an exhibit pursuant to Item 12(a)(1), unless the registrant has elected to satisfy paragraph (f) of this Item by positing its code of ethics on its website pursuant to paragraph (f)(2) of this Item, or by undertaking to provide its code of ethics to any person without charge, upon request, pursuant to paragraph (f)(3) of this Item.
If the registrant has, during the period covered by the report, granted a waiver, including an implicit waiver, from a provision of the code of ethics that applies to the registrant’s principal executive officer, principal financial officer, principal accounting officer or controller, or persons performing similar functions, regardless of whether these individuals are employed by the registrant or third party, that relates to one or more items set forth in paragraph (b) of this Item, the registrant must briefly describe the nature of the waiver, the name of the person to whom the waiver was granted, and the date of the waiver.
Not applicable to a semi-annual report.
ITEM 3. AUDIT COMMITTEE FINANCIAL EXPERT.
(a) (1) Disclose that the registrant’s board of directors has determined that the registrant either:
(i) Has at least one audit committee financial expert serving on its audit committee; or
(ii) Does not have an audit committee financial expert serving on its audit committee.
(2) If the registrant provides the disclosure required by paragraph (a)(1)(i) of this Item, it must disclose the name of the audit committee financial expert and whether that person is “independent.” In order to be considered “independent” for purposes of this Item, a member of an audit committee may not, other than in his or her capacity as a member of the audit committee, the board of directors, or any other board committee:
(i) Accept directly or indirectly any consulting, advisory, or other compensatory fee from the issuer; or
(ii) Be an “interested person” of the investment company as defined in Section 2(a)(19) of the Act (15 U.S.C. 80a-2(a)(19)).
(3) If the registrant provides the disclosure required by paragraph (a)(1)(ii) of this Item, it must explain why it does not have an audit committee financial expert.
Not applicable to a semi-annual report.
ITEM 4. PRINCIPAL ACCOUNTANT FEES AND SERVICES.
(a) Disclose, under the caption Audit Fees, the aggregate fees billed for each of the last two fiscal years for professional services rendered by the principal accountant for the audit of the registrant’s annual financial statements or services that are normally provided by the accountant in connection with statutory and regulatory filings or engagements for those fiscal years.
(b) Disclose, under the caption Audit-Related Fees, the aggregate fees billed in each of the last two fiscal years for assurance and related services by the principal accountant that are reasonably related to the performance of the audit of the registrant’s financial statements and are not reported under paragraph (a) of this Item. Registrants shall describe the nature of the services comprising the fees disclosed under this category.
(c) Disclose, under the caption Tax Fees, the aggregate fees billed in each of the last two fiscal years for professional services rendered by the principal accountant for tax compliance, tax advice, and tax planning. Registrants shall describe the nature of the services comprising the fees disclosed under this category.
(d) Disclose, under the caption All Other Fees, the aggregate fees billed in each of the last two fiscal years for products and services provided by the principal accountant, other than the services reported in paragraphs (a) through (c) of this Item. Registrants shall describe the nature of the services comprising the fees disclosed under this category.
(e) (1) Disclose the audit committee’s pre-approval policies and procedures described in paragraph (c)(7) of Rule 2-01 of Regulation S-X.
(2) Disclose the percentage of services described in each of paragraphs (b) through (d) of this Item that were approved by the audit committee pursuant to paragraph (c)(7)(i)(C) of Rule 2-01 of Regulation S-X.
(f) If greater than 50 percent, disclose the percentage of hours expended on the principal accountant’s engagement to audit the registrant’s financial statements for the most recent fiscal year that were attributed to work performed by persons other than the principal accountant’s full-time, permanent employees.
(g) Disclose the aggregate non-audit fees billed by the registrant’s accountant for services rendered to the registrant, and rendered to the registrant’s investment adviser (not including any sub-adviser whose role is primarily portfolio management and is subcontracted with or overseen by another investment adviser), and any entity controlling, controlled by, or under common control with the adviser that provides ongoing services to the registrant for each of the last two fiscal years of the registrant.
(h) Disclose whether the registrant’s audit committee of the board of directors has considered whether the provision of non-audit services that were rendered to the registrant’s investment adviser (not including any subadviser whose role is primarily portfolio management and is subcontracted with or overseen by another investment adviser), and any entity controlling, controlled by, or under common control with the investment adviser that provides ongoing services to the registrant that were not pre-approved pursuant to paragraph (c)(7)(ii) of Rule 2-01 of Regulation S-X is compatible with maintaining the principal accountant’s independence.
Not applicable to a semi-annual report.
ITEM 5. AUDIT COMMITTEE OF LISTED REGISTRANTS.
(a) If the registrant is a listed issuer as defined in Rule 10A-3 under the Exchange Act (17CFR 240.10A-3), state whether or not the registrant has a separately-designated standing audit committee established in accordance with Section 3(a)(58)(A) of the Exchange Act (15 U.S.C. 78c(a)(58)(A)). If the registrant has such a committee, however designated, identify each committee member. If the entire board of directors is acting as the registrant’s audit committee as specified in Section 3(a)(58)(B) of the Exchange Act (15 U.S.C. 78c(a)(58)(B)), so state.
(b) If applicable, provide the disclosure required by Rule 10A-3(d) under the Exchange Act (17CFR 240.10A-3(d)) regarding an exemption from the listing standards for all audit committees.
Not applicable to a semi-annual report.
ITEM 6. SCHEDULE OF INVESTMENTS.
File Schedule I – Investments in securities of unaffiliated issuers as of the close of the reporting period as set forth in Section 210.12-12 of Regulation S-X, unless the schedule is included as part of the report to shareholders filed under Item 1 of this Form.
Included in Item 1.
ITEM 7. DISCLOSURE OF PROXY VOTING POLICIES AND PROCEDURES FOR CLOSED-END MANAGEMENT INVESTMENT COMPANIES.
A closed-end management investment company that is filing an annual report on this Form N-CSR must, unless it invests exclusively in non-voting securities, describe the policies and procedures that it uses to determine how to vote proxies relating to portfolio securities, including the procedures that the company uses when a vote presents a conflict between the interests of its shareholders, on the one hand, and those of the company’s investment adviser; principal underwriter; or any affiliated person (as defined in Section 2(a)(3) of the Investment Company Act of 1940 (15 U.S.C. 80a-2(a)(3)) and the rules thereunder) of the company, its investment adviser, or its principal underwriter, on the other. Include any policies and procedures of the company’s investment adviser, or any other third party, that the company uses, or that are used on the company’s behalf, to determine how to vote proxies relating to portfolio securities.
Not applicable.
ITEM 8. PORTFOLIO MANAGERS OF CLOSED-END MANAGEMENT INVESTMENT COMPANIES.
Not applicable.
ITEM 9. PURCHASE OF EQUITY SECURITIES BY CLOSED-END MANAGEMENT INVESTMENT COMPANY AND AFFILIATED PURCHASERS.
(a) If the registrant is a closed-end management investment company, provide the information specified in paragraph (b) of this Item with respect to any purchase made by or on behalf of the registrant or any “affiliated purchaser,” as defined in Rule 10b-18(a)(3) under the Exchange Act (17 CFR 240.10b-18(a)(3)), of shares or other units of any class of the registrant’s equity securities that is registered by the registrant pursuant to Section 12 of the Exchange Act (15 U.S.C. 781).
Not applicable.
ITEM 10. SUBMISSION OF MATTERS TO A VOTE OF SECURITY HOLDERS.
Describe any material changes to the procedures by which shareholders may recommend nominees to the registrant’s board of directors, where those changes were implemented after the registrant last provided disclosure in response to the requirements of Item 7(d)(2)(ii)(G) of Schedule 14A (17 CFR 240.14a-101), or this Item.
No material changes to report.
ITEM 11. CONTROLS AND PROCEDURES.
(a) Disclose the conclusions of the registrant’s principal executive and principal financial officers, or persons performing similar functions, regarding the effectiveness of the registrant’s disclosure controls and procedures (as defined in Rule 30a-3(c) under the Act (17 CFR 270.30a-3(c))) as of a date within 90 days of the filing date of the report that includes the disclosure required by this paragraph, based on the evaluation of these controls and procedures required by Rule 30a-3(b) under the Act (17 CFR 270.30a-3(b)) and Rules 13a-15(b) or 15d-15(b) under the Exchange Act (17 CFR 240.13a-15(b) or 240.15d-15(b)).
The Registrant’s principal executive and principal financial officers have concluded, based on their evaluation of the Registrant’s disclosure controls and procedures as of a date within 90 days of the filing date of this report, that the Registrant’s disclosure controls and procedures are reasonably designed to ensure that information required to be disclosed by the Registrant on Form N-CSR is recorded, processed, summarized and reported within the required time periods and that information required to be disclosed by the Registrant in the reports that it files or submits on Form N-CSR
is accumulated and communicated to the Registrant’s management, including its principal executive and principal financial officers, as appropriate to allow timely decisions regarding required disclosure.
(b) Disclose any change in the registrant’s internal control over financial reporting (as defined in Rule 30a-3(d) under the Act (17 CFR 270.30a-3(d)) that occurred during the registrant’s second fiscal quarter of the period covered by this report that has materially affected, or is reasonably likely to materially affect, the registrant’s internal control over financial reporting.
There were no changes in the Registrant’s internal control over financial reporting that occurred during the last fiscal quarter covered by this report that have materially affected, or are reasonably likely to materially affect, the Registrant’s internal control over financial reporting.
ITEM 12. EXHIBITS.
| (a) | File the exhibits listed below as part of this Form. Letter or number the exhibits in the sequence indicated. |
(a)(1) Any code of ethics, or amendment thereto, that is the subject of the disclosure required by Item 2, to the extent that the registrant intends to satisfy the Item 2 requirements through filing of an exhibit.
Not applicable.
(a)(2) A separate certification for each principal executive officer and principal financial officer of the registrant as required by Rule 30a-2(a) under the Act (17 CFR 270.30a-2).
Certifications pursuant to Rule 30a-2(a) under the Investment Company Act of 1940 are attached hereto.
(a)(3) Any written solicitation to purchase securities under Rule 23c-1 under the Act (17 CFR 270.23c-1) sent or given during the period covered by the report by or on behalf of the registrant to 10 or more persons.
Not applicable.
(b) A separate or combined certification for each principal executive officer and principal officer of the registrant as required by Rule 30a-2(b) under the Act of 1940.
Certifications pursuant to Rule 30a-2(b) under the Investment Company Act of 1940 are attached hereto.
SIGNATURES
Pursuant to the requirements of the Securities Exchange Act of 1934 and the Investment Company Act of 1940, the registrant has duly caused this report to be signed on its behalf by the undersigned, thereunto duly authorized.
| | |
| J.P. Morgan Fleming Mutual Fund Group, Inc. |
| |
| By: | | /s/ |
| | Patricia A. Maleski |
| | President and Principal Executive Officer |
| | March 9, 2011 |
Pursuant to the requirements of the Securities Exchange Act of 1934 and the Investment Company Act of 1940, this report has been signed below by the following persons on behalf of the registrant and in the capacities and on the dates indicated.
| | |
| By: | | /s/ |
| | Patricia A. Maleski |
| | President and Principal Executive Officer |
| | March 9, 2011 |
| | |
| By: | | /s/ |
| | Joy C. Dowd |
| | Treasurer and Principal Financial Officer |
| | March 9, 2011 |