UNITED STATES
SECURITIES AND EXCHANGE COMMISSION
Washington, D.C. 20549
FORM N-CSR
CERTIFIED SHAREHOLDER REPORT OF REGISTERED
MANAGEMENT INVESTMENT COMPANIES
Investment Company Act file number: 811-08189
J.P. Morgan Fleming Mutual Fund Group, Inc.
(Exact name of registrant as specified in charter)
270 Park Avenue
New York, NY 10017
(Address of principal executive offices) (Zip code)
Frank J. Nasta
270 Park Avenue
New York, NY 10017
(Name and Address of Agent for Service)
Registrant’s telephone number, including area code: (800) 480-4111
Date of fiscal year end: June 30
Date of reporting period: July 1, 2012 through December 31, 2012
Form N-CSR is to be used by management investment companies to file reports with the Commission not later than 10 days after the transmission to stockholders of any report that is required to be transmitted to stockholders under Rule 30e-1 under the Investment Company Act of 1940 (17 CFR 270.30e-1). The Commission may use the information provided on Form N-CSR in its regulatory, disclosure review, inspection, and policymaking roles.
A registrant is required to disclose the information specified by Form N-CSR, and the Commission will make this information public. A registrant is not required to respond to the collection of information contained in Form N-CSR unless the Form displays a currently valid Office of Management and Budget (“OMB”) control number. Please direct comments concerning the accuracy of the information collection burden estimate and any suggestions for reducing the burden to Secretary, Securities and Exchange Commission, 450 Fifth Street, NW, Washington, DC 20549-0609. The OMB has reviewed this collection of information under the clearance requirements of 44 U.S.C. Section 3507.
ITEM 1. REPORTS TO STOCKHOLDERS.
The following is a copy of the report transmitted to shareholders pursuant to Rule 30e-1 under the Investment Company Act of 1940 (17 CFR 270.30e-1).
Semi-Annual Report
J.P. Morgan Mid Cap/Multi-Cap Funds
December 31, 2012 (Unaudited)
JPMorgan Growth Advantage Fund
JPMorgan Mid Cap Core Fund
JPMorgan Mid Cap Equity Fund
JPMorgan Mid Cap Growth Fund
JPMorgan Mid Cap Value Fund
JPMorgan Multi-Cap Market Neutral Fund
JPMorgan Value Advantage Fund

CONTENTS
Investments in a Fund are not bank deposits or obligations of, or guaranteed or endorsed by, any bank and are not insured or guaranteed by the FDIC, the Federal Reserve Board or any other government agency. You could lose money if you sell when the Fund’s share price is lower than when you invested.
Past performance is no guarantee for future performance. The general market views expressed in this report are opinions based on market and other conditions through the end of the reporting period and are subject to change without notice. These views are not intended to predict the future performance of a Fund or the securities markets. References to specific securities and their issuers are for illustrative purposes only and are not intended to be, and should not be interpreted as, recommendations to purchase or sell such securities. Such views are not meant as investment advice and may not be relied on as an indication of trading intent on behalf of any Fund.
Prospective investors should refer to the Funds’ prospectus for a discussion of the Funds’ investment objectives, strategies and risks. Call J.P. Morgan Funds Service Center at 1-800-480-4111 for a prospectus containing more complete information about a Fund, including management fees and other expenses. Please read it carefully before investing.
CEO’S LETTER
JANUARY 23, 2013 (Unaudited)
Dear Shareholder:
Despite periods of volatility, equity markets in most parts of the world rallied during the six months ended December 31, 2012. Improving U.S. economic data, particularly in the housing market, and accommodative policies from central banks around the world helped support investors’ appetite for risk. Stock markets carried their positive momentum into 2013 as investors reacted positively to the “fiscal cliff” bill and recent industry fund flows into equity strategies suggest that many investors are becoming more optimistic.
| | |
 | | “Stock markets carried their positive momentum into 2013 as investors reacted positively to the “fiscal cliff” bill and recent industry fund flows into equity strategies suggest that many investors are becoming more optimistic.” |
However, many of the catalysts for uncertainty in 2012 are likely to continue in 2013. The upcoming debate about the debt ceiling and budget resolutions is likely to create additional political gridlock in Washington. Europe’s debt crisis still looms, tensions in the Middle East continue and economic growth remains tepid. Accordingly, central banks around the world have indicated their continued commitment to accommodative policies.
U.S. treasury yields remain low
Yields for U.S. Treasury securities remained at historically low levels throughout the six-month period. The yield for 10-year U.S. Treasury securities ended December 2012 at 1.8%, while the yields for 2- and 30-year U.S. Treasury securities finished the reporting period at 0.3% and 3.0%, respectively. As the low interest rate environment persists, an increasing amount of fixed income investors are turning to asset classes like high yield bonds and emerging market debt in search of higher yielding securities. Higher demand for these securities as well as strong fundamentals led to positive returns for high yield bonds and emerging market debt during the six months ended December 31, 2012.
International stocks outperform
Stock returns across market capitalizations, countries and investment styles varied during the reporting period. While the debt crisis in Europe impacted equities in all corners of the world, it had the most significant impact on international stocks, which rose and fell with investors’ changing perception about the viability of corrective actions taken by the European Central Bank (“ECB”). Investors’ positive reaction to the ECB’s plan to purchase 1-3 year bonds issued by the governments of troubled European countries calmed markets and helped international stocks outperform U.S. stocks. Emerging markets stocks, weighed down by concerns about a “hard landing” in China for much of the reporting period, also received a boost from the ECB’s announcement and outperformed U.S. equities during the six months ended December 31, 2012.
Investment implications for the U.S. debt and deficit negotiations
On January 1, 2013, the U.S. Senate and House of Representatives approved a “fiscal cliff” package. Equities moved higher in the wake of this deal, but markets could become volatile as the remaining issues come into focus over the coming months. Negotiations surrounding the debt ceiling are ongoing, while the issue of long-term entitlement spending remains. Given these unresolved issues, an appropriately balanced mix of stocks, bonds, as well as alternatives, should help cushion portfolios if markets become volatile.
On behalf of everyone at J.P. Morgan Asset Management, thank you for your continued support. We look forward to managing your investment needs for years to come. Should you have any questions, please visit www.jpmorganfunds.com or contact the J.P. Morgan Funds Service Center at 1-800-480-4111.
Sincerely yours,

George C.W. Gatch
CEO, Global Funds Management
J.P. Morgan Asset Management
| | | | | | | | |
| | | |
| DECEMBER 31, 2012 | | J.P. MORGAN MID CAP/MULTI-CAP FUNDS | | | | | 1 | |
J.P. Morgan Mid Cap/Multi-Cap Funds
MARKET OVERVIEW
SIX MONTHS ENDED DECEMBER 31, 2012 (Unaudited)
Accommodative policies from the U.S. Federal Reserve and improving economic data helped U.S. equity markets rally during the reporting period. In September, the U.S. Federal Reserve announced another asset purchase plan, indicating that it would buy $40 billion of agency mortgage-backed securities per month on an open-ended basis. Meanwhile, the U.S. housing and labor markets showed signs of recovery, as housing starts and nonfarm payrolls were better than investors had expected. Uncertainty surrounding the “fiscal cliff” stalled the equity rally, but U.S. stocks across most market capitalizations and investment styles finished the reporting period with gains. The S&P 500 Index returned 5.95% for the six months ended December 31, 2012. U.S. mid-cap stocks outperformed the broader U.S. stock market, as the Russell Midcap Index returned 8.62%. U.S. mid-cap value stocks outperformed U.S. mid-cap growth stocks during the reporting period.
| | | | | | |
| | | |
| 2 | | | | J.P. MORGAN MID CAP/MULTI-CAP FUNDS | | DECEMBER 31, 2012 |
JPMorgan Growth Advantage Fund
FUND COMMENTARY
SIX MONTHS ENDED DECEMBER 31, 2012 (Unaudited)
| | | | |
| REPORTING PERIOD RETURN: | | | |
| Fund (Class A Shares, without a sales charge)* | | | 4.65% | |
| Russell 3000 Growth Index | | | 4.75% | |
| |
| Net Assets as of 12/31/2012 (In Thousands) | | $ | 1,478,823 | |
INVESTMENT OBJECTIVE**
The JPMorgan Growth Advantage Fund (the “Fund”) seeks to provide long-term capital growth.
WHAT WERE THE MAIN DRIVERS OF THE FUND’S PERFORMANCE?
The Fund (Class A Shares, without a sales charge) underperformed the Russell 3000 Growth Index (the “Benchmark”) for the six months ended December 31, 2012. The Fund’s stock selection in the energy and consumer discretionary sectors was the main detractor from relative performance. The Fund’s overweight versus the Benchmark in the financial services sector and underweight versus the Benchmark in the consumer staples sector contributed to relative performance.
Individual detractors from relative performance included the Fund’s overweight positions versus the Benchmark in ServiceSource International, Inc. and International Game Technology. Shares of ServiceSource International, Inc. declined after the computer services company’s outlook for its fourth-quarter earnings was lower than investors had expected. Shares of International Game Technology, which provides electronic gaming equipment and systems products for casinos, declined after reporting weak third-quarter earnings as a result of higher expenses and declining gambling volumes.
Individual contributors to relative performance included the Fund’s positions in Royal Caribbean Cruises Ltd. and Valeant Pharmaceuticals International, Inc. Shares of Royal Caribbean Cruises Ltd. benefited from the company’s strong earnings. Shares of Valeant Pharmaceuticals International, Inc. increased after investors reacted positively to the company’s announced acquisition of Medicis Pharmaceuticals.
HOW WAS THE FUND POSITIONED?
The Fund’s portfolio managers utilized a bottom-up approach to stock selection, researching individual companies across market capitalizations in an effort to construct portfolios of stocks that have strong fundamentals. The Fund’s portfolio managers sought to invest in high quality companies with
durable franchises that, in their view, possessed the ability to generate strong future earnings growth.
As a result of this bottom-up stock selection process, the Fund’s largest overweight versus the Benchmark was in the financial services sector, while the Fund’s largest underweight versus the Benchmark was in the consumer staples sector.
| | | | | | | | |
| TOP TEN EQUITY HOLDINGS OF THE PORTFOLIO*** | |
| | 1. | | | Apple, Inc. | | | 7.8 | % |
| | 2. | | | Google, Inc., Class A | | | 3.9 | |
| | 3. | | | Biogen Idec, Inc. | | | 2.2 | |
| | 4. | | | Sherwin-Williams Co. (The) | | | 2.1 | |
| | 5. | | | Home Depot, Inc. (The) | | | 2.0 | |
| | 6. | | | Amazon.com, Inc. | | | 1.9 | |
| | 7. | | | Visa, Inc., Class A | | | 1.8 | |
| | 8. | | | QUALCOMM, Inc. | | | 1.8 | |
| | 9. | | | eBay, Inc. | | | 1.8 | |
| | 10. | | | Carlisle Cos., Inc. | | | 1.7 | |
| | | | |
PORTFOLIO COMPOSITION BY SECTOR*** | |
| Information Technology | | | 36.0 | % |
| Industrials | | | 16.4 | |
| Consumer Discretionary | | | 15.7 | |
| Health Care | | | 13.9 | |
| Financials | | | 8.1 | |
| Energy | | | 4.5 | |
| Materials | | | 4.2 | |
| Consumer Staples | | | 1.1 | |
| Short-Term Investment | | | 0.1 | |
| * | | The return shown is based on net asset values calculated for shareholder transactions and may differ from the return shown in the financial highlights, which reflects adjustments made to the net asset values in accordance with accounting principles generally accepted in the United States of America. |
| ** | | The advisor seeks to achieve the Fund’s objective. There can be no guarantee it will be achieved. |
| *** | | Percentages indicated are based upon total investments as of December 31, 2012. The Fund’s portfolio composition is subject to change. |
| | | | | | | | |
| | | |
| DECEMBER 31, 2012 | | J.P. MORGAN MID CAP/MULTI-CAP FUNDS | | | | | 3 | |
JPMorgan Growth Advantage Fund
FUND COMMENTARY
SIX MONTHS ENDED DECEMBER 31, 2012 (Unaudited) (continued)
| | | | | | | | | | | | | | | | | | | | |
AVERAGE ANNUAL TOTAL RETURNS AS OF DECEMBER 31, 2012 | |
| | | | | |
| | | INCEPTION DATE
OF CLASS | | | 6 MONTH* | | | 1 YEAR | | | 5 YEAR | | | 10 YEAR | |
CLASS A SHARES | | | 10/29/99 | | | | | | | | | | | | | | | | | |
Without Sales Charge | | | | | | | 4.65 | % | | | 15.88 | % | | | 1.81 | % | | | 10.77 | % |
With Sales Charge** | | | | | | | (0.88 | ) | | | 9.86 | | | | 0.72 | | | | 10.17 | |
CLASS B SHARES | | | 10/29/99 | | | | | | | | | | | | | | | | | |
Without CDSC | | | | | | | 4.37 | | | | 15.29 | | | | 1.28 | | | | 10.23 | |
With CDSC*** | | | | | | | (0.63 | ) | | | 10.29 | | | | 0.89 | | | | 10.23 | |
CLASS C SHARES | | | 5/1/06 | | | | | | | | | | | | | | | | | |
Without CDSC | | | | | | | 4.36 | | | | 15.27 | | | | 1.28 | | | | 10.12 | |
With CDSC**** | | | | | | | 3.36 | | | | 14.27 | | | | 1.28 | | | | 10.12 | |
CLASS R5 SHARES | | | 1/8/09 | | | | 4.95 | | | | 16.36 | | | | 2.20 | | | | 11.04 | |
SELECT CLASS SHARES | | | 5/1/06 | | | | 4.75 | | | | 16.08 | | | | 2.04 | | | | 10.95 | |
| ** | | Sales Charge for Class A Shares is 5.25%. |
| *** | | Assumes a 5% CDSC (contingent deferred sales charge) for the one year period, 2% CDSC for the five year period and 0% CDSC thereafter. |
| **** | | Assumes a 1% CDSC for the one year period and 0% CDSC thereafter. |
TEN YEAR PERFORMANCE (12/31/02 TO 12/31/12)
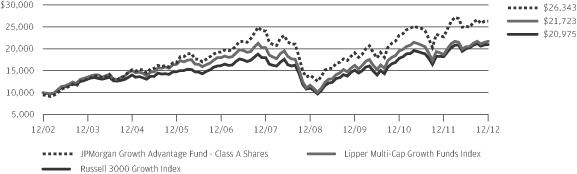
The performance quoted is past performance and is not a guarantee of future results. Mutual funds are subject to certain market risks. Investment returns and principal value of an investment will fluctuate so that an investor’s shares, when redeemed, may be worth more or less than their original cost. Current performance may be higher or lower than the performance data shown. For up-to-date month-end performance information please call 1-800-480-4111.
As of August 17, 2005, the Fund changed its name, investment objective, certain investment policies and benchmark. Prior to that time, the Fund operated as JPMorgan Mid Cap Growth Fund. Although past performance is not necessarily an indication of how the Fund will perform in the future, in view of these changes, the Fund’s performance record prior to August 17, 2005 might be less pertinent for investors considering whether to purchase shares of the Fund. Returns for the Class C Shares prior to its inception date are based on the performance of Class B Shares, whose expenses are substantially similar to those of Class C Shares. Returns for the Select Class Shares prior to its inception date are based on the performance of Class A Shares. During this period, the actual returns of Select Class Shares would have been different than those shown because Select Class Shares have different expenses than Class A Shares. Returns for Class R5 Shares prior to its inception date are based on the performance of Select Class Shares from May 1, 2006 to January 8, 2009 and Class A Shares prior to May 1, 2006. The actual returns of Class R5 Shares
would have been different than those shown because Class R5 Shares have different expenses than Select Class and Class A Shares.
The graph illustrates comparative performance for $10,000 invested in Class A Shares of the JPMorgan Growth Advantage Fund, the Russell 3000 Growth Index and the Lipper Multi-Cap Growth Funds Index from December 31, 2002 to December 31, 2012. The performance of the Fund assumes reinvestment of all dividends and capital gain distributions, if any, and includes a sales charge. The performance of the Russell 3000 Growth Index does not reflect the deduction of expenses or a sales charge associated with a mutual fund and has been adjusted to reflect reinvestment of all dividends and capital gain distributions of the securities included in the benchmark. The performance of the Lipper Multi-Cap Growth Funds Index includes expenses associated with a mutual fund, such as investment management fees. These expenses are not identical to the expenses incurred by the Fund. The Russell 3000 Growth Index is an unmanaged index which measures the performance of those Russell 3000 Index companies (largest 3000 U.S. companies) with higher price-to-book ratios and higher forecasted growth values. The Lipper Multi-Cap Growth Funds Index is an index based on total returns of certain mutual funds within the Fund’s designated category as determined by Lipper, Inc. Investors cannot invest directly in an index.
Class A Shares have a $1,000 minimum initial investment and carry a 5.25% sales charge.
| | | | | | |
| | | |
| 4 | | | | J.P. MORGAN MID CAP/MULTI-CAP FUNDS | | DECEMBER 31, 2012 |
Fund performance may reflect the waiver of the Fund’s fees and reimbursement of expenses for certain periods since the inception date. Without these waivers and reimbursements, performance would have been lower. Also, performance shown in this section does not reflect the deduction of taxes that a shareholder would pay on Fund distributions or redemption of Fund shares.
Because Class B Shares automatically convert to Class A Shares after 8 years, the 10 year annual average total return shown above for Class B reflects Class A performance for the period after conversion.
The returns shown are based on net asset values calculated for shareholder transactions and may differ from the returns shown in the financial highlights, which reflect adjustments made to the net asset values in accordance with accounting principles generally accepted in the United States of America.
| | | | | | | | |
| | | |
| DECEMBER 31, 2012 | | J.P. MORGAN MID CAP/MULTI-CAP FUNDS | | | | | 5 | |
JPMorgan Mid Cap Core Fund
FUND COMMENTARY
SIX MONTHS ENDED DECEMBER 31, 2012 (Unaudited)
| | | | |
| REPORTING PERIOD RETURN: | |
| Fund (Select Class Shares)* | | | 6.15% | |
| Russell Midcap Index | | | 8.62% | |
| |
| Net Assets as of 12/31/2012 (In Thousands) | | $ | 762,269 | |
INVESTMENT OBJECTIVE**
The JPMorgan Mid Cap Core Fund (the “Fund”) seeks long-term capital appreciation.
WHAT WERE THE MAIN DRIVERS OF THE FUND’S PERFORMANCE?
The Fund (Select Class Shares) underperformed the Russell Midcap Index (the “Benchmark”) for the six months ended December 31, 2012. The Fund’s stock selection in the energy and technology sectors detracted from relative performance. The Fund’s underweight versus the Benchmark in the consumer staples sector and stock selection in the financial services sector contributed to relative performance.
Individual detractors from relative performance included the Fund’s positions in Marvell Technology Group Ltd., Devon Energy Corp. and Citrix Systems, Inc. Shares of Marvell Technology Group Ltd., which manufactures chips used in data-storage applications, declined on concerns about the company’s patent litigation. Shares of Devon Energy Corp. declined after the oil and natural gas producer reported disappointing earnings. Shares of Citrix Systems, Inc. declined after the software and programming company lowered its expectations for its fiscal 2012 net revenue.
Individual contributors to relative performance included the Fund’s positions in Jarden Corp., Coventry Health Care, Inc. and Patterson-UTI Energy, Inc. Shares of Jarden Corp. benefited from the consumer products company’s increasing sales. Shares of Coventry Health Care, Inc. increased after Aetna entered into an agreement to acquire the insurance company. Shares of Patterson-UTI Energy, Inc., an oil well services and equipment company, benefited from investors’ improving outlook about the company’s position in the natural gas market.
HOW WAS THE FUND POSITIONED?
The Fund’s portfolio managers employed a bottom-up approach to stock selection, constructing a portfolio based on company fundamentals, quantitative screening and proprietary fundamental analysis. The Fund’s portfolio managers invested
in companies that, in their view, had leading competitive advantages, predictable and durable business models, sustainable free cash flow generation and management teams committed to increasing intrinsic value.
| | | | | | | | |
| TOP TEN EQUITY HOLDINGS OF THE PORTFOLIO*** | |
| | 1. | | | Waste Connections, Inc. | | | 3.8 | % |
| | 2. | | | Devon Energy Corp. | | | 3.1 | |
| | 3. | | | Chubb Corp. (The) | | | 2.9 | |
| | 4. | | | Silgan Holdings, Inc. | | | 2.7 | |
| | 5. | | | Patterson-UTI Energy, Inc. | | | 2.6 | |
| | 6. | | | Reliance Steel & Aluminum Co. | | | 2.4 | |
| | 7. | | | Cimarex Energy Co. | | | 2.4 | |
| | 8. | | | UnitedHealth Group, Inc. | | | 2.3 | |
| | 9. | | | Crown Holdings, Inc. | | | 2.3 | |
| | 10. | | | TD Ameritrade Holding Corp. | | | 2.3 | |
| | | | |
PORTFOLIO COMPOSITIONS BY SECTOR*** | |
| Financials | | | 22.3 | % |
| Industrials | | | 17.7 | |
| Consumer Discretionary | | | 16.9 | |
| Information Technology | | | 10.4 | |
| Energy | | | 9.7 | |
| Materials | | | 9.4 | |
| Utilities | | | 6.1 | |
| Health Care | | | 5.6 | |
| Short-Term Investment | | | 1.9 | |
| * | | The return shown is based on net asset values calculated for shareholder transactions and may differ from the return shown in the financial highlights, which reflects adjustments made to the net asset values in accordance with accounting principles generally accepted in the United States of America. |
| ** | | The advisor seeks to achieve the Fund’s objective. There can be no guarantee it will be achieved. |
| *** | | Percentages indicated are based upon total investments as of December 31, 2012. The Fund’s portfolio composition is subject to change. |
| | | | | | |
| | | |
| 6 | | | | J.P. MORGAN MID CAP/MULTI-CAP FUNDS | | DECEMBER 31, 2012 |
| | | | | | | | | | | | | | | | |
AVERAGE ANNUAL TOTAL RETURNS AS OF DECEMBER 31, 2012 | |
| | | | |
| | | INCEPTION DATE
OF CLASS | | | 6 MONTH* | | | 1 YEAR | | | SINCE
INCEPTION | |
CLASS A SHARES | | | 11/30/10 | | | | | | | | | | | | | |
Without Sales Charge | | | | | | | 5.97 | % | | | 13.16 | % | | | 9.71 | % |
With Sales Charge** | | | | | | | 0.41 | | | | 7.22 | | | | 6.91 | |
CLASS C SHARES | | | 11/30/10 | | | | | | | | | | | | | |
Without CDSC | | | | | | | 5.68 | | | | 12.56 | | | | 9.16 | |
With CDSC*** | | | | | | | 4.68 | | | | 11.56 | | | | 9.16 | |
CLASS R2 SHARES | | | 11/30/10 | | | | 5.88 | | | | 12.88 | | | | 9.44 | |
CLASS R5 SHARES | | | 11/30/10 | | | | 6.22 | | | | 13.75 | | | | 10.22 | |
CLASS R6 SHARES | | | 1/31/11 | | | | 6.21 | | | | 13.74 | | | | 10.24 | |
SELECT CLASS SHARES | | | 11/30/10 | | | | 6.15 | | | | 13.48 | | | | 10.00 | |
| ** | | Sales Charge for Class A Shares is 5.25%. |
| *** | | Assumes a 1% CDSC (contingent deferred sales charge) for the one year period and 0% CDSC thereafter. |
LIFE OF FUND PERFORMANCE (11/30/10 TO 12/31/12)
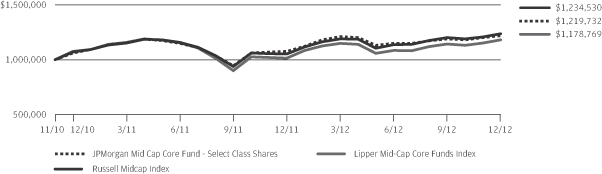
The performance quoted is past performance and is not a guarantee of future results. Mutual funds are subject to certain market risks. Investment returns and principal value of an investment will fluctuate so that an investor’s shares, when redeemed, may be worth more or less than their original cost. Current performance may be higher or lower than the performance data shown. For up-to-data, month-end performance information please call 1-800-480-4111.
The fund commenced operations on November 30, 2010.
Returns for Class R6 Shares prior to its inception date are based on the performance of Class R5 Shares. The actual returns of Class R6 Shares would have been different than those shown because Class R6 Shares have different expenses than Class R5 Shares.
The graph illustrates comparative performance for $1,000,000 invested in Select Class Shares of the JPMorgan Mid Cap Core Fund, the Russell Midcap Index and the Lipper Mid-Cap Core Funds Index from November 30, 2010 to December 31, 2012. The performance of the Fund assumes reinvestment of all dividends and capital gain distributions, if any, and does not include a sales charge. The performance of the Russell Midcap Index does not reflect the deduction of expenses or a sales charge associated with a mutual fund and has been adjusted to reflect
reinvestment of all dividends and capital gain distributions of the securities included in the benchmark. The performance of the Lipper Mid-Cap Core Funds Index includes expenses associated with a mutual fund, such as investment management fees. These expenses are not identical to the expenses incurred by the Fund. The Russell Midcap Index is an unmanaged index which measures the performance of the 800 smallest companies in the Russell 1000 Index. The Lipper Mid-Cap Core Funds Index is an index based on total returns of certain mutual funds within the Fund’s designated category as determined by Lipper, Inc. Investors cannot invest directly in an index.
Select Class Shares have a $1,000,000 minimum initial investment.
Fund performance may reflect the waiver of the Fund’s fees and reimbursement of expenses for certain periods since the inception date. Without these waivers and reimbursements, performance would have been lower. Also, performance shown in this section does not reflect the deduction of taxes that a shareholder would pay on Fund distributions or redemption of Fund shares.
The returns shown are based on net asset values calculated for shareholder transactions and differ from the returns shown in the financial highlights, which reflect adjustments made to the net asset values in accordance with accounting principles generally accepted in the United States of America.
| | | | | | | | |
| | | |
| DECEMBER 31, 2012 | | J.P. MORGAN MID CAP/MULTI-CAP FUNDS | | | | | 7 | |
JPMorgan Mid Cap Equity Fund
FUND COMMENTARY
SIX MONTHS ENDED DECEMBER 31, 2012 (Unaudited)
| | | | |
| REPORTING PERIOD RETURN: | |
| Fund (Select Class Shares)* | | | 8.09% | |
| Russell Midcap Index | | | 8.62% | |
| |
| Net Assets as of 12/31/2012 (In Thousands) | | $ | 928,913 | |
INVESTMENT OBJECTIVE**
The JPMorgan Mid Cap Equity Fund (the “Fund”) seeks long-term capital growth.
WHAT WERE THE MAIN DRIVERS OF THE FUND’S PERFORMANCE?
The Fund (Select Class Shares) underperformed the Russell Midcap Index (the “Benchmark”) for the six months ended December 31, 2012. The Fund’s stock selection and underweight versus the Benchmark in the energy sector and stock selection in the utilities sector were the main detractors from relative performance. The Fund’s stock selection in the financial services and health care sectors contributed to relative performance.
Individual detractors from relative performance included the Fund’s overweight positions versus the Benchmark in International Game Technology and Citrix Systems, Inc. Shares of International Game Technology, which provides electronic gaming equipment and systems products for casinos, declined after reporting weak third-quarter earnings as a result of higher expenses and declining gambling volumes. Shares of Citrix Systems, Inc. declined after the software and programming company lowered its expectations for its fiscal 2012 net revenue. The Fund’s underweight position versus the Benchmark in Sprint Nextel Corp. also detracted from relative performance. The stock rose following the announcement that the Japanese telecommunications company SoftBank offered to buy a stake in Sprint Nextel Corp.
Individual contributors to relative performance included the Fund’s positions in FleetCor Technologies, Inc., Sherwin-Williams Co. and Valeant Pharmaceuticals International, Inc. Shares of FleetCor Technologies, Inc. increased after the business services company raised its expectations for its fiscal 2012 revenues. Shares of paint retailer Sherwin-Williams Co. benefited from the company’s strong earnings and revenue growth during the reporting period. Shares of Valeant Pharmaceuticals International, Inc. increased after investors reacted positively to the company’s announced acquisition of Medicis Pharmaceuticals.
HOW WAS THE FUND POSITIONED?
The Fund’s portfolio managers employed a bottom-up approach to stock selection, constructing a portfolio based on company fundamentals, quantitative screening and proprietary
fundamental analysis. The Fund’s portfolio managers sought to identify dominant franchises with predictable business models deemed capable of achieving, in their view, sustained growth, as well as undervalued companies with the potential to grow their intrinsic value per share.
| | | | | | | | |
| TOP TEN EQUITY HOLDINGS OF THE PORTFOLIO** | |
| | 1. | | | Sherwin-Williams Co. (The) | | | 1.6 | % |
| | 2. | | | MSC Industrial Direct Co., Inc., Class A | | | 1.4 | |
| | 3. | | | Carlisle Cos., Inc. | | | 1.3 | |
| | 4. | | | Marriott International, Inc., Class A | | | 1.3 | |
| | 5. | | | T. Rowe Price Group, Inc. | | | 1.3 | |
| | 6. | | | Amphenol Corp., Class A | | | 1.3 | |
| | 7. | | | M&T Bank Corp. | | | 1.3 | |
| | 8. | | | Alliance Data Systems Corp. | | | 1.1 | |
| | 9. | | | Xilinx, Inc. | | | 1.0 | |
| | 10. | | | PetSmart, Inc. | | | 1.0 | |
| | | | |
PORTFOLIO COMPOSITIONS BY SECTOR*** | |
| Consumer Discretionary | | | 20.4 | % |
| Financials | | | 17.3 | |
| Information Technology | | | 14.5 | |
| Industrials | | | 13.7 | |
| Health Care | | | 9.4 | |
| Materials | | | 6.8 | |
| Energy | | | 5.8 | |
| Utilities | | | 4.4 | |
| Consumer Staples | | | 4.2 | |
| Telecommunication Services | | | 0.2 | |
| Short-Term Investment | | | 3.3 | |
| * | | The return shown is based on net asset values calculated for shareholder transactions and may differ from the return shown in the financial highlights, which reflects adjustments made to the net asset values in accordance with accounting principles generally accepted in the United States of America. |
| ** | | The advisor seeks to achieve the Fund’s objective. There can be no guarantee it will be achieved. |
| *** | | Percentages indicated are based upon total investments (excluding Investments of Cash Collateral for Securities on Loan) as of December 31, 2012. The Fund’s portfolio composition is subject to change. |
| | | | | | |
| | | |
| 8 | | | | J.P. MORGAN MID CAP/MULTI-CAP FUNDS | | DECEMBER 31, 2012 |
| | | | | | | | | | | | | | | | | | | | |
AVERAGE ANNUAL TOTAL RETURNS AS OF DECEMBER 31, 2012 | |
| | | | | |
| | | INCEPTION DATE
OF CLASS | | | 6 MONTH* | | | 1 YEAR | | | 5 YEAR | | | 10 YEAR | |
CLASS A SHARES | | | 11/2/09 | | | | | | | | | | | | | | | | | |
Without Sales Charge | | | | | | | 7.91 | % | | | 17.67 | % | | | 3.26 | % | | | 9.81 | % |
With Sales Charge** | | | | | | | 2.23 | | | | 11.48 | | | | 2.15 | | | | 9.22 | |
CLASS C SHARES | | | 11/2/09 | | | | | | | | | | | | | | | | | |
Without CDSC | | | | | | | 7.64 | | | | 17.07 | | | | 2.93 | | | | 9.63 | |
With CDSC*** | | | | | | | 6.64 | | | | 16.07 | | | | 2.93 | | | | 9.63 | |
SELECT CLASS SHARES | | | 1/1/97 | | | | 8.09 | | | | 18.10 | | | | 3.48 | | | | 9.93 | |
| ** | | Sales Charge for Class A Shares is 5.25%. |
| *** | | Assumes a 1% CDSC (contingent deferred sales charge) for the one year period and 0% CDSC thereafter. |
TEN YEAR PERFORMANCE (12/31/02 TO 12/31/12)
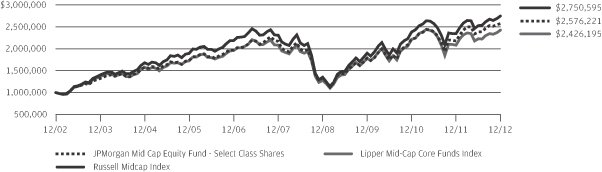
The performance quoted is past performance and is not a guarantee of future results. Mutual funds are subject to certain market risks. Investment returns and principal value of an investment will fluctuate so that an investor’s shares, when redeemed, may be worth more or less than their original cost. Current performance may be higher or lower than the performance data shown. For up-to-date month-end performance information please call 1-800-480-4111.
Returns for Class A and Class C Shares prior to their inception date are based on the performance of Select Class Shares. The actual returns of Class A and Class C Shares would have been lower than those shown because Class A and Class C Shares have higher expenses than Select Class Shares.
The graph illustrates comparative performance for $1,000,000 invested in the Select Class Shares of JPMorgan Mid Cap Equity Fund, the Russell Midcap Index and the Lipper Mid-Cap Core Funds Index from December 31, 2002 to December 31, 2012. The performance of the Fund assumes reinvestment of all dividends and capital gain distributions, if any, and does not include a sales charge. The performance of the Russell Midcap Index does not reflect the deduction of expenses or a sales charge associated with a mutual fund and has been adjusted to reflect reinvestment of all dividends and capital gain
distributions of the securities included in the benchmark. The performance of the Lipper Mid-Cap Core Funds Index includes expenses associated with a mutual fund, such as investment management fees. These expenses are not identical to the expenses incurred by the Fund. The Russell Midcap Index is an unmanaged index which measures the performance of the 800 smallest companies in the Russell 1000 Index. The Lipper Mid-Cap Core Funds Index is an index based on total returns of certain mutual funds as determined by Lipper, Inc. Investors cannot invest directly in an index.
Select Class Shares have a $1,000,000 minimum initial investment.
Fund performance may reflect the waiver of the Fund’s fees and reimbursement of expenses for certain periods since the inception date. Without these waivers and reimbursements, performance would have been lower. Also, performance shown in this section does not reflect the deduction of taxes that a shareholder would pay on Fund distributions or redemption of Fund shares.
The returns shown are based on net asset values calculated for shareholder transactions and may differ from the returns shown in the financial highlights, which reflect adjustments made to the net asset values in accordance with accounting principles generally accepted in the United States of America.
| | | | | | | | |
| | | |
| DECEMBER 31, 2012 | | J.P. MORGAN MID CAP/MULTI-CAP FUNDS | | | | | 9 | |
JPMorgan Mid Cap Growth Fund
FUND COMMENTARY
SIX MONTHS ENDED DECEMBER 31, 2012 (Unaudited)
| | | | |
| REPORTING PERIOD RETURN: | |
| Fund (Select Class Shares)* | | | 7.34% | |
| Russell Midcap Growth Index | | | 7.13% | |
| |
| Net Assets as of 12/31/2012 (In Thousands) | | $ | 1,385,700 | |
INVESTMENT OBJECTIVE**
The JPMorgan Mid Cap Growth Fund (the “Fund”) seeks growth of capital and secondarily, current income by investing primarily in equity securities.
WHAT WERE THE MAIN DRIVERS OF THE FUND’S PERFORMANCE?
The Fund (Select Class Shares) outperformed the Russell Midcap Growth Index (the “Benchmark”) for the six months ended December 31, 2012. The Fund’s stock selection in the financial services and health care sectors was the main contributor to relative performance. The Fund’s stock selection in the technology and energy sectors detracted from relative performance.
Individual contributors to relative performance included the Fund’s overweight positions versus the Benchmark in FleetCor Technologies, Inc. and Royal Caribbean Cruises Ltd. Shares of FleetCor Technologies, Inc. increased after the business services company raised its expectations for its fiscal 2012 revenues. Shares of Royal Caribbean Cruises Ltd. benefited from the company’s strong earnings.
Individual detractors from relative performance included the Fund’s overweight positions versus the Benchmark in International Game Technology and Citrix Systems, Inc. Shares of International Game Technology, which provides electronic gaming equipment and systems products for casinos, declined after reporting weak third-quarter earnings as a result of higher expenses and declining gambling volumes. Shares of Citrix Systems, Inc. declined after the software and programming company lowered its expectations for its fiscal 2012 net revenue.
HOW WAS THE FUND POSITIONED?
The Fund’s portfolio managers utilized a bottom-up approach to stock selection, researching individual companies in an effort to construct a portfolio of stocks that have strong fundamentals. The Fund’s portfolio managers sought to invest in high quality companies with durable franchises that, in their view, possessed the ability to generate strong future earnings growth.
As a result of this bottom-up stock selection process, the Fund’s largest overweight versus the Benchmark was in the financial services sector and the Fund’s largest underweight versus the Benchmark was in the consumer discretionary sector.
| | | | | | | | |
| TOP TEN EQUITY HOLDINGS OF THE PORTFOLIO*** | |
| | 1. | | | Sherwin-Williams Co. (The) | | | 2.4 | % |
| | 2. | | | Alliance Data Systems Corp. | | | 2.2 | |
| | 3. | | | Concho Resources, Inc. | | | 1.8 | |
| | 4. | | | MSC Industrial Direct Co., Inc., Class A | | | 1.8 | |
| | 5. | | | PPG Industries, Inc. | | | 1.7 | |
| | 6. | | | Carlisle Cos., Inc. | | | 1.7 | |
| | 7. | | | Pall Corp. | | | 1.6 | |
| | 8. | | | J.B. Hunt Transport Services, Inc. | | | 1.6 | |
| | 9. | | | Moody’s Corp. | | | 1.6 | |
| | 10. | | | Agilent Technologies, Inc. | | | 1.6 | |
| | | | |
PORTFOLIO COMPOSITIONS BY SECTOR*** | |
| Information Technology | | | 22.3 | % |
| Consumer Discretionary | | | 20.7 | |
| Industrials | | | 17.8 | |
| Health Care | | | 15.1 | |
| Financials | | | 8.8 | |
| Materials | | | 6.3 | |
| Energy | | | 5.2 | |
| Consumer Staples | | | 2.8 | |
| Short-Term Investment | | | 1.0 | |
| * | | The return shown is based on net asset values calculated for shareholder transactions and may differ from the return shown in the financial highlights, which reflects adjustments made to the net asset values in accordance with accounting principles generally accepted in the United States of America. |
| ** | | The advisor seeks to achieve the Fund’s objective. There can be no guarantee it will be achieved. |
| *** | | Percentages indicated are based upon total investments as of December 31, 2012. The Fund’s portfolio composition is subject to change. |
| | | | | | |
| | | |
| 10 | | | | J.P. MORGAN MID CAP/MULTI-CAP FUNDS | | DECEMBER 31, 2012 |
| | | | | | | | | | | | | | | | | | | | |
AVERAGE ANNUAL TOTAL RETURNS AS OF DECEMBER 31, 2012 | |
| | | | | |
| | | INCEPTION DATE
OF CLASS | | | 6 MONTH* | | | 1 YEAR | | | 5 YEAR | | | 10 YEAR | |
CLASS A SHARES | | | 2/18/92 | | | | | | | | | | | | | | | | | |
Without Sales Charge | | | | | | | 7.18 | % | | | 15.59 | % | | | 1.70 | % | | | 8.32 | % |
With Sales Charge** | | | | | | | 1.57 | | | | 9.54 | | | | 0.60 | | | | 7.74 | |
CLASS B SHARES | | | 1/14/94 | | | | | | | | | | | | | | | | | |
Without CDSC | | | | | | | 6.86 | | | | 15.04 | | | | 1.14 | | | | 7.76 | |
With CDSC*** | | | | | | | 1.86 | | | | 10.04 | | | | 0.76 | | | | 7.76 | |
CLASS C SHARES | | | 11/4/97 | | | | | | | | | | | | | | | | | |
Without CDSC | | | | | | | 6.89 | | | | 14.99 | | | | 1.14 | | | | 7.65 | |
With CDSC**** | | | | | | | 5.89 | | | | 13.99 | | | | 1.14 | | | | 7.65 | |
CLASS R2 SHARES | | | 6/19/09 | | | | 7.07 | | | | 15.44 | | | | 1.54 | | | | 8.14 | |
CLASS R5 SHARES | | | 11/1/11 | | | | 7.43 | | | | 16.15 | | | | 2.04 | | | | 8.64 | |
CLASS R6 SHARES | | | 11/1/11 | | | | 7.42 | | | | 16.20 | | | | 2.05 | | | | 8.64 | |
SELECT CLASS SHARES | | | 3/2/89 | | | | 7.34 | | | | 15.95 | | | | 2.00 | | | | 8.62 | |
| ** | | Sales Charge for Class A Shares is 5.25%. |
| *** | | Assumes a 5% CDSC (contingent deferred sales charge) for the one year period, 2% CDSC for the five year period and 0% CDSC thereafter. |
| **** | | Assumes a 1% CDSC for the one year period and 0% CDSC thereafter. |
TEN YEAR PERFORMANCE (12/31/02 TO 12/31/12)
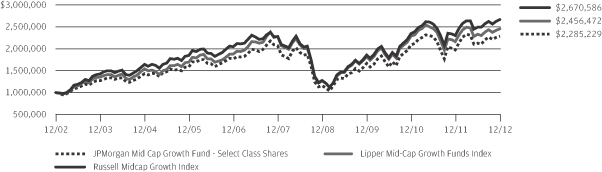
The performance quoted is past performance and is not a guarantee of future results. Mutual funds are subject to certain market risks. Investment returns and principal value of an investment will fluctuate so that an investor’s shares, when redeemed, may be worth more or less than their original cost. Current performance may be higher or lower than the performance data shown. For up-to-date month-end performance information please call 1-800-480-4111.
Returns for the Class R2, Class R5 and Class R6 Shares prior to their inception dates are based on the performance of Select Class Shares. Prior performance for Class R2 Shares has been adjusted to reflect the differences in expenses between classes. The actual returns of Class R5 and Class R6 Shares would have been different than those shown because Class R5 and Class R6 Shares have different expenses than Select Class Shares.
The graph illustrates comparative performance for $1,000,000 invested in Select Class Shares of the JPMorgan Mid Cap Growth Fund, the Russell Midcap Growth Index and the Lipper Mid-Cap Growth Funds Index from December 31, 2002 to December 31, 2012. The performance of the Fund assumes reinvestment of all dividends and capital gain distributions, if any, and does not include a sales charge. The performance of the Russell Midcap Growth Index does not reflect the deduction of expenses or a sales charge associated with a mutual fund and has been adjusted to reflect reinvestment of all dividends and capital gain distributions of the securities included in the benchmark. The performance of the
Lipper Mid-Cap Growth Funds Index includes expenses associated with a mutual fund, such as investment management fees. These expenses are not identical to the expenses incurred by the Fund. The Russell Midcap Growth Index is an unmanaged index which measures the performance of those Russell Midcap companies with higher price-to-book ratios and higher forecasted growth values. The Lipper Mid-Cap Growth Funds Index is an index based on total returns of certain mutual funds as determined by Lipper, Inc. Investors cannot invest directly in an index.
Select Class Shares have a $1,000,000 minimum initial investment.
Fund performance may reflect the waiver of the Fund’s fees and reimbursement of expenses for certain periods since the inception date. Without these waivers and reimbursements, performance would have been lower. Also, performance shown in this section does not reflect the deduction of taxes that a shareholder would pay on Fund distributions or redemption of Fund shares.
Because Class B Shares automatically convert to Class A Shares after 8 years, the 10 year average annual total return shown above for Class B reflects Class A performance for the period after conversion.
The returns shown are based on net asset values calculated for shareholder transactions and may differ from the returns shown in the financial highlights, which reflect adjustments made to the net asset values in accordance with accounting principles generally accepted in the United States of America.
| | | | | | | | |
| | | |
| DECEMBER 31, 2012 | | J.P. MORGAN MID CAP/MULTI-CAP FUNDS | | | | | 11 | |
JPMorgan Mid Cap Value Fund
FUND COMMENTARY
SIX MONTHS ENDED DECEMBER 31, 2012 (Unaudited)
| | | | |
| Reporting Period Return: | |
| |
| Fund (Institutional Class Shares)* | | | 9.04% | |
| Russell Midcap Value Index | | | 9.95% | |
| |
| Net Assets as of 12/31/2012 (In Thousands) | | $ | 9,827,663 | |
INVESTMENT OBJECTIVE**
The JPMorgan Mid Cap Value Fund (the “Fund”) seeks growth from capital appreciation.
WHAT WERE THE MAIN DRIVERS OF THE FUND’S PERFORMANCE?
The Fund (Institutional Class Shares) underperformed the Russell Midcap Value Index (the “Benchmark”) for the six months ended December 31, 2012. The Fund’s relative underperformance versus the Benchmark was primarily driven by stock selection in the consumer discretionary sector. The Fund’s stock selection and an underweight versus the Benchmark in the energy sector also detracted from relative performance. The Fund’s stock selection in the financials and information technology sectors contributed to relative performance.
Individual detractors from the Fund’s relative performance included the Fund’s overweight positions in Bed Bath & Beyond Inc. and Devon Energy Corp. Shares of Bed Bath & Beyond Inc. declined after the retail company’s expectations for its fourth-quarter 2012 and fiscal 2012 earnings disappointed investors. Shares of oil and gas operations company Devon Energy Corp. declined after the company announced a larger-than-expected decline in its third-quarter revenue. The Fund’s underweight position in Sprint Nextel Corp. also detracted from relative performance. The telecommunication services stock outperformed its sector peers.
Individual contributors to relative performance included the Fund’s overweight positions versus the Benchmark in PVH Corp., DISH Network Corp. and Lincare Holdings Inc. Shares of PVH Corp., which manufactures and sells apparel and accessories, increased as investors reacted positively to the company’s announced acquisition of The Warnaco Group, Inc. Shares of DISH Network Corp., a television provider, gained after the company reached settlements in several of its outstanding contract disputes. Lincare Holdings Inc. provides medical equipment and supplies. Linde AG acquired the company at a premium, which benefited the stock.
HOW WAS THE FUND POSITIONED?
The Fund’s portfolio managers utilized a bottom-up approach to stock selection and sought to identify durable franchises possessing the ability to generate, in their view, sustainable levels of free cash flow. The Fund’s portfolio managers believed
that these types of companies should perform relatively well in what they view as a slow but sustainable economic recovery in the United States. The Fund’s largest overweight continued to be in the consumer discretionary sector. The Fund’s portfolio managers sought to own retailers with strong brands and business models that produce recurring revenue, believing that these factors, coupled with lower levels of capital spending, should contribute to their sustainable generation of free cash flow.
| | | | | | |
TOP TEN EQUITY HOLDINGS OF THE PORTFOLIO*** | |
| 1. | | Loews Corp. | | | 1.7 | % |
| 2. | | Ball Corp. | | | 1.6 | |
| 3. | | Ameriprise Financial, Inc. | | | 1.6 | |
| 4. | | Energen Corp. | | | 1.5 | |
| 5. | | Marsh & McLennan Cos., Inc. | | | 1.5 | |
| 6. | | Analog Devices, Inc. | | | 1.4 | |
| 7. | | Kohl’s Corp. | | | 1.4 | |
| 8. | | M&T Bank Corp. | | | 1.3 | |
| 9. | | Amphenol Corp., Class A | | | 1.3 | |
| 10. | | AutoZone, Inc. | | | 1.3 | |
| | | | | | |
| | PORTFOLIO COMPOSITION BY SECTOR*** | |
| | Financials | | | 25.8 | % |
| | Consumer Discretionary | | | 20.1 | |
| | Industrials | | | 9.8 | |
| | Utilities | | | 8.7 | |
| | Materials | | | 7.4 | |
| | Information Technology | | | 7.0 | |
| | Energy | | | 6.3 | |
| | Consumer Staples | | | 5.5 | |
| | Health Care | | | 3.9 | |
| | Telecommunication Services | | | 0.4 | |
| | Short-Term Investment | | | 5.1 | |
| * | | The return shown is based on net asset values calculated for shareholder transactions and may differ from the return shown in the financial highlights, which reflects adjustments made to the net asset values in accordance with accounting principles generally accepted in the United States of America. |
| ** | | The advisor seeks to achieve the Fund’s objective. There can be no guarantee it will be achieved. |
| *** | | Percentages indicated are based upon total investments (excluding Investments of Cash Collateral for Securities on Loan) as of December 31, 2012. The Fund’s portfolio composition is subject to change. |
| | | | | | |
| | | |
| 12 | | | | J.P. MORGAN MID CAP/MULTI-CAP FUNDS | | DECEMBER 31, 2012 |
| | | | | | | | | | | | | | | | | | | | |
AVERAGE ANNUAL TOTAL RETURNS AS OF DECEMBER 31, 2012 | |
| | | | | |
| | | INCEPTION DATE
OF CLASS | | | 6 MONTH* | | | 1 YEAR | | | 5 YEAR | | | 10 YEAR | |
| | | | | | | | | | | | | | | | | | | | |
CLASS A SHARES | | | 4/30/01 | | | | | | | | | | | | | | | | | |
Without Sales Charge | | | | | | | 8.75 | % | | | 19.86 | % | | | 4.77 | % | | | 9.90 | % |
With Sales Charge** | | | | | | | 3.04 | | | | 13.55 | | | | 3.65 | | | | 9.31 | |
CLASS B SHARES | | | 4/30/01 | | | | | | | | | | | | | | | | | |
Without CDSC | | | | | | | 8.47 | | | | 19.28 | | | | 4.24 | | | | 9.42 | |
With CDSC*** | | | | | | | 3.47 | | | | 14.28 | | | | 3.90 | | | | 9.42 | |
CLASS C SHARES | | | 4/30/01 | | | | | | | | | | | | | | | | | |
Without CDSC | | | | | | | 8.49 | | | | 19.26 | | | | 4.25 | | | | 9.31 | |
With CDSC**** | | | | | | | 7.49 | | | | 18.26 | | | | 4.25 | | | | 9.31 | |
CLASS R2 SHARES | | | 11/3/08 | | | | 8.60 | | | | 19.57 | | | | 4.55 | | | | 9.78 | |
INSTITUTIONAL CLASS SHARES | | | 11/13/97 | | | | 9.04 | | | | 20.48 | | | | 5.30 | | | | 10.44 | |
SELECT CLASS SHARES | | | 10/31/01 | | | | 8.91 | | | | 20.19 | | | | 5.04 | | | | 10.18 | |
| ** | | Sales Charge for Class A Shares is 5.25%. |
| *** | | Assumes a 5% CDSC (contingent deferred sales charge) for the one year period, 2% CDSC for the five year period and 0% CDSC thereafter. |
| **** | | Assumes a 1% CDSC for the one year period and 0% CDSC thereafter. |
TEN YEAR PERFORMANCE (12/31/02 TO 12/31/12)
The performance quoted is past performance and is not a guarantee of future results. Mutual funds are subject to certain market risks. Investment returns and principal value of an investment will fluctuate so that an investor’s shares, when redeemed, may be worth more or less than their original cost. Current performance may be higher or lower than the performance data shown. For up-to-date month-end performance information please call 1-800-480-4111.
Returns for Class R2 Shares prior to its inception date are based on the performance of Class A Shares. The actual returns of Class R2 Shares would have been lower than those shown because Class R2 Shares have higher expenses than Class A Shares.
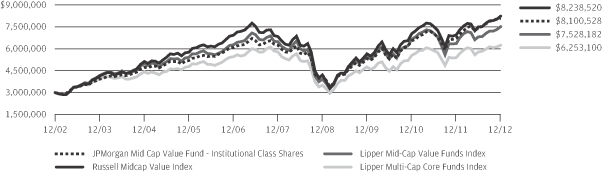
The graph illustrates comparative performance for $3,000,000 invested in Institutional Class Shares of the JPMorgan Mid Cap Value Fund, the Russell Midcap Value Index, the Lipper Mid-Cap Value Funds Index and the Lipper Multi-Cap Core Funds Index from December 31, 2002 to December 31, 2012. The performance of the Fund assumes reinvestment of all dividends and capital gain distributions, if any, and does not include a sales charge. The performance of the Russell Midcap Value Index does not reflect the deduction of expenses or
a sales charge associated with a mutual fund and has been adjusted to reflect reinvestment of all dividends and capital gain distributions of the securities included in the benchmark. The performance of the Lipper Mid-Cap Value Funds Index and the Lipper Multi-Cap Core Funds Index includes expenses associated with a mutual fund, such as investment management fees. These expenses are not identical to the expenses incurred by the Fund. The Russell Midcap Value Index is an unmanaged index which measures the performance of those Russell Midcap companies with lower price-to-book ratios and lower forecasted growth values. The Lipper Mid-Cap Value Funds Index and the Lipper Multi-Cap Core Funds Index are indexes based on total returns of certain groups of mutual funds as determined by Lipper, Inc. Investors cannot invest directly in an index.
Institutional Class Shares have a $3,000,000 minimum initial investment.
Fund performance may reflect the waiver of the Fund’s fees and reimbursement of expenses for certain periods since the inception date. Without these waivers and reimbursements, performance would have been lower. Also, performance shown in this section does not reflect the deduction of taxes that a shareholder would pay on Fund distributions or redemption of Fund shares.
| | | | | | | | |
| | | |
| DECEMBER 31, 2012 | | J.P. MORGAN MID CAP/MULTI-CAP FUNDS | | | | | 13 | |
JPMorgan Mid Cap Value Fund
FUND COMMENTARY
SIX MONTHS ENDED DECEMBER 31, 2012 (Unaudited) (continued)
Because Class B Shares automatically convert to Class A Shares after 8 years, the 10 year average annual total return shown above for Class B reflects Class A performance for the period after conversion.
The returns shown are based on net asset values calculated for shareholder transactions and may differ from the returns shown in the financial highlights, which reflect adjustments made to the net asset values in accordance with accounting principles generally accepted in the United States of America.
| | | | | | |
| | | |
| 14 | | | | J.P. MORGAN MID CAP/MULTI-CAP FUNDS | | DECEMBER 31, 2012 |
JPMorgan Multi-Cap Market Neutral Fund
FUND COMMENTARY
SIX MONTHS ENDED DECEMBER 31, 2012 (Unaudited)
| | | | |
| REPORTING PERIOD RETURN: | |
| Fund (Select Class Shares)* | | | -1.43% | |
| BofA Merrill Lynch 3-Month U.S. Treasury Bill Index | | | 0.07% | |
| |
| Net Assets as of 12/31/2012 (In Thousands) | | $ | 490,178 | |
INVESTMENT OBJECTIVE**
The JPMorgan Multi-Cap Market Neutral Fund (the “Fund”) seeks long-term capital preservation and growth by using strategies designed to produce returns which have no correlation with general domestic market performance.
WHAT WERE THE MAIN DRIVERS OF THE FUND’S PERFORMANCE?
The Fund (Select Class Shares) underperformed the BofA Merrill Lynch 3-Month U.S. Treasury Bill Index for the six months ended December 31, 2012.
The Fund’s portfolio managers employed a quantitative bottom-up approach for their stock selection process, focusing on both valuation and fundamentals. The valuation stock selection model seeks to determine how a stock is priced relative to what the Fund’s portfolio managers believe is its intrinsic value by considering valuation factors such as a company’s cash flow and price-to-book values. The fundamentals stock selection model attempts to identify how healthy a company’s short-term operating trends are by using metrics such as stock price momentum and earnings momentum.
During the reporting period, the Fund’s stock selection process produced a negative return for the Fund. The Fund’s quantitative bottom-up stock selection process resulted in negative returns in the consumer and technology sectors and positive returns in the financial, healthcare and industrial sectors.
HOW WAS THE FUND POSITIONED?
The Fund’s portfolio managers ranked stocks within a universe of approximately 1,300 large-cap, mid-cap and small-cap stocks. The Fund’s portfolio managers sought to go long on
what they perceived to be inexpensive stocks with improving fundamentals and short on expensive stocks with deteriorating fundamentals. They continued to use strategies designed to produce returns that are intended to have no correlation with general domestic market performance.
| | | | | | | | |
| TOP TEN LONG POSITIONS OF THE PORTFOLIO*** | |
| | 1. | | | Eagle Materials, Inc. | | | 0.5 | % |
| | 2. | | | CMS Energy Corp. | | | 0.5 | |
| | 3. | | | Portland General Electric Co. | | | 0.4 | |
| | 4. | | | Omnicare, Inc. | | | 0.4 | |
| | 5. | | | Helix Energy Solutions Group, Inc. | | | 0.4 | |
| | 6. | | | Lockheed Martin Corp. | | | 0.4 | |
| | 7. | | | Jarden Corp. | | | 0.4 | |
| | 8. | | | Chicago Bridge & Iron Co. N.V., (Netherlands) | | | 0.4 | |
| | 9. | | | Textron, Inc | | | 0.4 | |
| | 10. | | | ResMed, Inc. | | | 0.4 | |
| | | | | | | | |
| TOP TEN SHORT POSITIONS OF THE PORTFOLIO**** | |
| | 1. | | | Gulfport Energy Corp. | | | 0.5 | % |
| | 2. | | | Acme Packet, Inc. | | | 0.5 | |
| | 3. | | | Genesee & Wyoming, Inc., Class A | | | 0.5 | |
| | 4. | | | JDS Uniphase Corp. | | | 0.4 | |
| | 5. | | | Precision Castparts Corp. | | | 0.4 | |
| | 6. | | | Signet Jewelers Ltd., (Bermuda) | | | 0.4 | |
| | 7. | | | Liberty Media Corp. - Liberty Capital, Class A | | | 0.4 | |
| | 8. | | | Brookdale Senior Living, Inc. | | | 0.4 | |
| | 9. | | | Haemonetics Corp. | | | 0.4 | |
| | 10. | | | Johnson Controls, Inc. | | | 0.4 | |
| | | | | | | | |
| | | |
| DECEMBER 31, 2012 | | J.P. MORGAN MID CAP/MULTI-CAP FUNDS | | | | | 15 | |
JPMorgan Multi-Cap Market Neutral Fund
FUND COMMENTARY
SIX MONTHS ENDED DECEMBER 31, 2012 (Unaudited) (continued)
| | | | |
LONG POSITION PORTFOLIO COMPOSITION BY SECTOR*** | |
| Consumer Discretionary | | | 15.9 | % |
| Information Technology | | | 14.9 | |
| Financials | | | 12.4 | |
| Industrials | | | 11.9 | |
| Health Care | | | 8.2 | |
| Energy | | | 6.6 | |
| Materials | | | 5.7 | |
| Consumer Staples | | | 5.7 | |
| Utilities | | | 4.5 | |
| Telecommunication Services | | | 0.6 | |
| Short-Term Investment | | | 13.6 | |
| | | | |
SHORT POSITION PORTFOLIO COMPOSITION BY SECTOR**** | |
| Consumer Discretionary | | | 16.3 | % |
| Information Technology | | | 15.7 | |
| Industrials | | | 15.5 | |
| Financials | | | 13.4 | |
| Health Care | | | 10.5 | |
| Energy | | | 9.7 | |
| Materials | | | 6.9 | |
| Consumer Staples | | | 5.5 | |
| Utilities | | | 5.1 | |
| Telecommunication Services | | | 1.4 | |
| * | | The return shown is based on net asset values calculated for shareholder transactions and may differ from the return shown in the financial highlights, which reflects adjustments made to the net asset values in accordance with accounting principles generally accepted in the United States of America. |
| ** | | The advisor seeks to achieve the Fund’s objective. There can be no guarantee it will be achieved. |
| *** | | Percentages indicated are based upon total long investments as of December 31, 2012. The Fund’s portfolio composition is subject to change. |
| **** | | Percentages indicated are based upon total short investments as of December 31, 2012. The Fund’s portfolio composition is subject to change. |
| | | | | | |
| | | |
| 16 | | | | J.P. MORGAN MID CAP/MULTI-CAP FUNDS | | DECEMBER 31, 2012 |
| | | | | | | | | | | | | | | | | | | | |
AVERAGE ANNUAL TOTAL RETURNS AS OF DECEMBER 31, 2012 | |
| | | | | |
| | | INCEPTION DATE
OF CLASS | | | 6 MONTH* | | | 1 YEAR | | | 5 YEAR | | | SINCE
INCEPTION | |
| | | | | | | | | | | | | | | | | | | | |
CLASS A SHARES | | | 5/23/03 | | | | | | | | | | | | | | | | | |
Without Sales Charge | | | | | | | (1.55 | )% | | | 0.00 | % | | | (1.14 | )% | | | 0.98 | % |
With Sales Charge** | | | | | | | (6.74 | ) | | | (5.26 | ) | | | (2.19 | ) | | | 0.42 | |
CLASS B SHARES | | | 5/23/03 | | | | | | | | | | | | | | | | | |
Without CDSC | | | | | | | (1.83 | ) | | | (0.76 | ) | | | (1.87 | ) | | | 0.36 | |
With CDSC*** | | | | | | | (6.83 | ) | | | (5.76 | ) | | | (2.31 | ) | | | 0.36 | |
CLASS C SHARES | | | 5/23/03 | | | | | | | | | | | | | | | | | |
Without CDSC | | | | | | | (1.94 | ) | | | (0.76 | ) | | | (1.89 | ) | | | 0.23 | |
With CDSC**** | | | | | | | (2.94 | ) | | | (1.76 | ) | | | (1.89 | ) | | | 0.23 | |
SELECT CLASS SHARES | | | 5/23/03 | | | | (1.43 | ) | | | 0.21 | | | | (0.90 | ) | | | 1.23 | |
| ** | | Sales Charge for Class A Shares is 5.25%. |
| *** | | Assumes a 5% CDSC (contingent deferred sales charge) for the one year period, 2% CDSC for the five year period and 0% CDSC thereafter. |
| **** | | Assumes a 1% CDSC for the one year period and 0% CDSC thereafter. |
LIFE OF FUND PERFORMANCE (5/23/03 TO 12/31/12)
The performance quoted is past performance and is not a guarantee of future results. Mutual funds are subject to certain market risks. Investment returns and principal value of an investment will fluctuate so that an investor’s shares, when redeemed, may be worth more or less than their original cost. Current performance may be higher or lower than the performance data shown. For up-to-date month-end performance information please call 1-800-480-4111.
The Fund commenced operations on May 23, 2003.
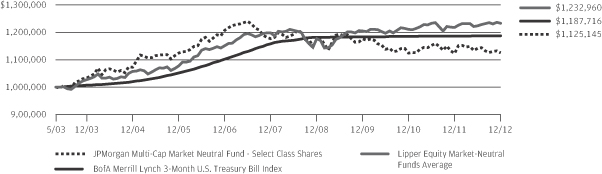
The graph illustrates comparative performance for $1,000,000 invested in Select Class Shares of the JPMorgan Multi-Cap Market Neutral Fund, the BofA Merrill Lynch 3-Month U.S. Treasury Bill Index and the Lipper Equity Market-Neutral Funds Average from May 23, 2003 to December 31, 2012. The performance of the Fund assumes reinvestment of all dividends and capital gain distributions, if any, and does not include a sales charge. The performance of the indices reflects an initial investment at the end of the month following the Fund’s inception. The performance of the BofA Merrill Lynch 3-Month U.S. Treasury Bill Index does not reflect the deduction of expenses or a sales charge associated with a mutual fund and has been adjusted to reflect reinvestment of all dividends and capital gain distributions of the securities included in the benchmark. The performance of the Lipper Equity Market-Neutral Funds Average includes expenses associated with a mutual fund, such as investment management fees. These expenses are not identical to the expenses incurred
by the Fund. The BofA Merrill Lynch 3-Month U.S. Treasury Bill Index is comprised of a single issue purchased at the beginning of the month and held for a full month. Each month the index is rebalanced and the issue selected is the outstanding Treasury Bill that matures closest to, but not beyond, 3 months from the rebalancing date. Investors cannot invest directly in an index. The Lipper Equity Market-Neutral Funds Average is an average based on the total returns of all mutual funds within the Fund’s designated category as determined by Lipper, Inc.
Select Class Shares have a $1,000,000 minimum initial investment.
Fund performance may reflect the waiver of the Fund’s fees and reimbursement of expenses for certain periods since the inception date. Without these waivers and reimbursements, performance would have been lower. Also, performance shown in this section does not reflect the deduction of taxes that a shareholder would pay on Fund distributions or redemption of Fund shares.
Because the Class B Shares automatically convert to Class A Shares after eight years, the since inception average annual total return shown above for Class B reflects Class A performance for the period after conversion.
The returns shown are based on net asset values calculated for shareholder transactions and may differ from the returns shown in the financial highlights, which reflect adjustments made to the net asset values in accordance with accounting principles generally accepted in the United States of America.
| | | | | | | | |
| | | |
| DECEMBER 31, 2012 | | J.P. MORGAN MID CAP/MULTI-CAP FUNDS | | | | | 17 | |
JPMorgan Value Advantage Fund
FUND COMMENTARY
SIX MONTHS ENDED DECEMBER 31, 2012 (Unaudited)
| | | | |
| REPORTING PERIOD RETURN: | |
| Fund (Institutional Class Shares)* | | | 8.09% | |
| Russell 3000 Value Index | | | 8.20% | |
| |
| Net Assets as of 12/31/2012 (In Thousands) | | | $2,101,241 | |
INVESTMENT OBJECTIVE**
The JPMorgan Value Advantage Fund (the “Fund”) seeks to provide long-term total return from a combination of income and capital gains.
WHAT WERE THE MAIN DRIVERS OF THE FUND’S PERFORMANCE?
The Fund (Institutional Class Shares) underperformed the Russell 3000 Value Index (the “Benchmark”) for the six months ended December 31, 2012. The Fund’s relative underperformance versus the Benchmark was driven primarily by the Fund’s stock selection in the consumer discretionary sector. The Fund’s stock selection and overweight versus the Benchmark in the financials sector contributed to relative performance.
Individual detractors from the Fund’s relative performance included the Fund’s overweight positions versus the Benchmark in Devon Energy Corp. and Microsoft Corp. Shares of oil and gas operations company Devon Energy Corp. declined after the company announced a larger-than-expected decline in its third-quarter revenue. Shares of Microsoft Corp. declined after the software company reported disappointing third-quarter results. The Fund’s underweight position in Goldman Sachs Group, Inc. also detracted from relative performance as the financial services stock outperformed its sector peers.
Individual contributors to relative performance included the Fund’s overweight positions versus the Benchmark in Rock-Tenn Co., Ameriprise Financial, Inc. and Lincare Holdings Inc. Rock-Tenn Co. is a containers and packaging company, while Ameriprise Financial, Inc. is an investment services company. Both stocks increased as investors reacted positively to each company’s announcement that it would start paying a quarterly dividend. Lincare Holdings Inc. provides medical equipment and supplies. Linde AG acquired the company at a premium, which benefited the stock.
HOW WAS THE FUND POSITIONED?
The Fund’s portfolio managers utilized a bottom-up approach to stock selection and sought to identify durable franchises possessing the ability to generate, in their view, significant levels of free cash flow. As a result of bottom-up fundamental research, the Fund was overweight versus the Benchmark in
the consumer discretionary sector, where the Fund’s portfolio managers sought to own retailers with strong and recognizable brands, a loyal customer base, recurring revenue streams and lower capital expenditure levels. The Fund was also overweight versus the Benchmark in the financials sector.
| | | | | | | | |
| TOP TEN EQUITY HOLDINGS OF THE PORTFOLIO*** | |
| | 1. | | | Exxon Mobil Corp. | | | 3.7 | % |
| | 2. | | | Wells Fargo & Co. | | | 3.3 | |
| | 3. | | | Pfizer, Inc. | | | 2.5 | |
| | 4. | | | Loews Corp. | | | 2.2 | |
| | 5. | | | AT&T, Inc. | | | 2.2 | |
| | 6. | | | American International Group, Inc. | | | 2.0 | |
| | 7. | | | Bank of America Corp. | | | 1.9 | |
| | 8. | | | Devon Energy Corp. | | | 1.9 | |
| | 9. | | | Johnson & Johnson | | | 1.8 | |
| | 10. | | | Procter & Gamble Co. (The) | | | 1.7 | |
| | | | |
PORTFOLIO COMPOSITIONS BY SECTOR**** | |
| Financials | | | 34.7 | % |
| Consumer Discretionary | | | 13.0 | |
| Energy | | | 11.4 | |
| Health Care | | | 9.5 | |
| Utilities | | | 6.2 | |
| Industrials | | | 5.6 | |
| Consumer Staples | | | 4.5 | |
| Information Technology | | | 3.9 | |
| Materials | | | 3.9 | |
| Telecommunication Services | | | 2.4 | |
| Investment Company | | | 0.3 | |
| Short-term Investment | | | 4.6 | |
| * | | The return shown is based on net asset values calculated for shareholder transactions and may differ from the return shown in the financial highlights, which reflects adjustments made to the net asset values in accordance with accounting principles generally accepted in the United States of America. |
| ** | | The advisor seeks to achieve the Fund’s objective. There can be no guarantee it will be achieved. |
| *** | | Percentages indicated are based upon total investments as of December 31, 2012. The Fund’s portfolio composition is subject to change. |
| | | | | | |
| | | |
| 18 | | | | J.P. MORGAN MID CAP/MULTI-CAP FUNDS | | DECEMBER 31, 2012 |
| | | | | | | | | | | | | | | | | | | | |
AVERAGE ANNUAL TOTAL RETURNS AS OF DECEMBER 31, 2012 | |
| | | | | |
| | | INCEPTION DATE
OF CLASS | | | 6 MONTH* | | | 1 YEAR | | | 5 YEAR | | | SINCE
INCEPTION | |
CLASS A SHARES | | | 2/28/05 | | | | | | | | | | | | | | | | | |
Without Sales Charge | | | | | | | 7.83 | % | | | 18.32 | % | | | 4.52 | % | | | 6.87 | % |
With Sales Charge** | | | | | | | 2.15 | | | | 12.10 | | | | 3.40 | | | | 6.14 | |
CLASS C SHARES | | | 2/28/05 | | | | | | | | | | | | | | | | | |
Without CDSC | | | | | | | 7.56 | | | | 17.73 | | | | 4.01 | | | | 6.34 | |
With CDSC*** | | | | | | | 6.56 | | | | 16.73 | | | | 4.01 | | | | 6.34 | |
INSTITUTIONAL CLASS SHARES | | | 2/28/05 | | | | 8.09 | | | | 18.92 | | | | 5.06 | | | | 7.34 | |
SELECT CLASS SHARES | | | 2/28/05 | | | | 7.94 | | | | 18.61 | | | | 4.79 | | | | 7.14 | |
| ** | | Sales Charge for Class A Shares is 5.25%. |
| *** | | Assumes a 1% CDSC (contingent deferred sales charge) for the one year period and 0% CDSC thereafter. |
LIFE OF FUND PERFORMANCE (2/28/05 TO 12/31/12)
The performance quoted is past performance and is not a guarantee of future results. Mutual funds are subject to certain market risks. Investment returns and principal value of an investment will fluctuate so that an investor’s shares, when redeemed, may be worth more or less than their original cost. Current performance may be higher or lower than the performance data shown. For up-to-date month-end performance information please call 1-800-480-4111.
The Fund commenced operations on February 28, 2005.
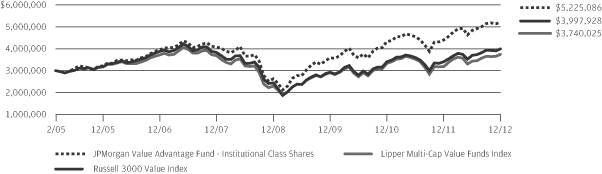
The graph illustrates comparative performance for $3,000,000 invested in Institutional Class Shares of the JPMorgan Value Advantage Fund, the Russell 3000 Value Index and the Lipper Multi-Cap Value Funds Index from February 28, 2005 to December 31, 2012. The performance of the Fund assumes reinvestment of all dividends and capital gain distributions, if any, and does not include a sales charge. The performance of the Russell 3000 Value Index does not reflect the deduction of expenses or a sales charge associated with a mutual fund and has been adjusted to reflect reinvestment of all dividends and capital gain distributions of the securities included in the benchmark. The performance of the Lipper Multi-Cap Value Funds Index includes expenses associated with a mutual fund, such as investment management fees. These
expenses are not identical to the expenses incurred by the Fund. The Russell 3000 Value Index is an unmanaged index which measures the performance of those Russell 3000 companies (largest 3000 U.S. companies) with lower price-to-book ratios and lower forecasted growth values. The Lipper Multi-Cap Value Funds Index is an index based on total returns of certain mutual funds within the Fund’s designated category as determined by Lipper, Inc. Investors cannot invest directly in an index.
Institutional Class Shares have a $3,000,000 minimum initial investment.
Fund performance may reflect the waiver of the Fund’s fees and reimbursement of expenses for certain periods since the inception date. Without these waivers and reimbursements, performance would have been lower. Also, performance shown in this section does not reflect the deduction of taxes that a shareholder would pay on Fund distributions or redemption of Fund shares.
The returns shown are based on net asset values calculated for shareholder transactions and may differ from the returns shown in the financial highlights, which reflect adjustments made to the net asset values in accordance with accounting principles generally accepted in the United States of America.
| | | | | | | | |
| | | |
| DECEMBER 31, 2012 | | J.P. MORGAN MID CAP/MULTI-CAP FUNDS | | | | | 19 | |
JPMorgan Growth Advantage Fund
SCHEDULE OF PORTFOLIO INVESTMENTS
AS OF DECEMBER 31, 2012 (Unaudited)
(Amounts in thousands)
| | | | | | | | |
| SHARES | | | SECURITY DESCRIPTION | | VALUE($) | |
| Common Stocks — 99.8% | |
| | | | Consumer Discretionary — 15.6% | |
| | | | Automobiles — 1.6% | |
| | 271 | | | Harley-Davidson, Inc. | | | 13,250 | |
| | 322 | | | Tesla Motors, Inc. (a) | | | 10,903 | |
| | | | | | | | |
| | | | | | | 24,153 | |
| | | | | | | | |
| | | | Hotels, Restaurants & Leisure — 2.4% | |
| | 533 | | | Apollo Global Management LLC, Class A | | | 9,261 | |
| | 331 | | | Las Vegas Sands Corp. | | | 15,260 | |
| | 342 | | | Royal Caribbean Cruises Ltd. | | | 11,625 | |
| | | | | | | | |
| | | | | | | 36,146 | |
| | | | | | | | |
| | | | Internet & Catalog Retail — 2.7% | |
| | 113 | | | Amazon.com, Inc. (a) | | | 28,379 | |
| | 18 | | | priceline.com, Inc. (a) | | | 11,306 | |
| | | | | | | | |
| | | | | | | 39,685 | |
| | | | | | | | |
| | | | Media — 2.9% | |
| | 450 | | | DIRECTV (a) | | | 22,577 | |
| | 397 | | | Walt Disney Co. (The) | | | 19,742 | |
| | | | | | | | |
| | | | | | | 42,319 | |
| | | | | | | | |
| | | | Specialty Retail — 3.0% | |
| | 478 | | | Home Depot, Inc. (The) | | | 29,564 | |
| | 219 | | | PetSmart, Inc. | | | 14,973 | |
| | | | | | | | |
| | | | | | | 44,537 | |
| | | | | | | | |
| | | | Textiles, Apparel & Luxury Goods — 3.0% | |
| | 369 | | | Michael Kors Holdings Ltd., (Hong Kong) (a) | | | 18,851 | |
| | 96 | | | V.F. Corp. | | | 14,508 | |
| | 273 | | | Wolverine World Wide, Inc. | | | 11,167 | |
| | | | | | | | |
| | | | | | | 44,526 | |
| | | | | | | | |
| | | | Total Consumer Discretionary | | | 231,366 | |
| | | | | | | | |
| | | | Consumer Staples — 1.1% | |
| | | | Food Products — 0.8% | |
| | 695 | | | Dean Foods Co. (a) | | | 11,471 | |
| | | | | | | | |
| | | | Personal Products — 0.3% | |
| | 134 | | | Herbalife Ltd., (Cayman Islands) | | | 4,427 | |
| | | | | | | | |
| | | | Total Consumer Staples | | | 15,898 | |
| | | | | | | | |
| | | | Energy — 4.5% | |
| | | | Energy Equipment & Services — 2.1% | |
| | 217 | | | Dril-Quip, Inc. (a) | | | 15,815 | |
| | 273 | | | Oceaneering International, Inc. | | | 14,701 | |
| | | | | | | | |
| | | | | | | 30,516 | |
| | | | | | | | |
| | | | Oil, Gas & Consumable Fuels — 2.4% | |
| | 300 | | | Concho Resources, Inc. (a) | | | 24,152 | |
| | | | | | | | |
| SHARES | | | SECURITY DESCRIPTION | | VALUE($) | |
| | | | | | | | |
| | | | Oil, Gas & Consumable Fuels — Continued | |
| | 178 | | | Range Resources Corp. | | | 11,184 | |
| | | | | | | | |
| | | | | | | 35,336 | |
| | | | | | | | |
| | | | Total Energy | | | 65,852 | |
| | | | | | | | |
| | | | Financials — 8.1% | |
| | | | Capital Markets — 1.0% | |
| | 223 | | | T. Rowe Price Group, Inc. | | | 14,491 | |
| | | | | | | | |
| | | | Commercial Banks — 3.4% | |
| | 185 | | | M&T Bank Corp. | | | 18,207 | |
| | 493 | | | U.S. Bancorp | | | 15,734 | |
| | 489 | | | Wells Fargo & Co. | | | 16,704 | |
| | | | | | | | |
| | | | | | | 50,645 | |
| | | | | | | | |
| | | | Diversified Financial Services — 1.3% | |
| | 387 | | | Moody's Corp. | | | 19,469 | |
| | | | | | | | |
| | | | Insurance — 2.4% | |
| | 295 | | | ACE Ltd., (Switzerland) | | | 23,501 | |
| | 403 | | | Amtrust Financial Services, Inc. | | | 11,571 | |
| | | | | | | | |
| | | | | | | 35,072 | |
| | | | | | | | |
| | | | Total Financials | | | 119,677 | |
| | | | | | | | |
| | | | Health Care — 13.9% | |
| | | | Biotechnology — 6.2% | |
| | 632 | | | Aegerion Pharmaceuticals, Inc. (a) | | | 16,039 | |
| | 221 | | | Biogen Idec, Inc. (a) | | | 32,473 | |
| | 297 | | | Gilead Sciences, Inc. (a) | | | 21,800 | |
| | 145 | | | Onyx Pharmaceuticals, Inc. (a) | | | 10,974 | |
| | 59 | | | Regeneron Pharmaceuticals, Inc. (a) | | | 10,059 | |
| | | | | | | | |
| | | | | | | 91,345 | |
| | | | | | | | |
| | | | Health Care Providers & Services — 2.8% | |
| | 465 | | | Acadia Healthcare Co., Inc. (a) | | | 10,844 | |
| | 140 | | | Humana, Inc. | | | 9,601 | |
| | 400 | | | UnitedHealth Group, Inc. | | | 21,691 | |
| | | | | | | | |
| | | | | | | 42,136 | |
| | | | | | | | |
| | | | Life Sciences Tools & Services — 1.1% | |
| | 389 | | | Agilent Technologies, Inc. | | | 15,917 | |
| | | | | | | | |
| | | | Pharmaceuticals — 3.8% | |
| | 220 | | | Allergan, Inc. | | | 20,135 | |
| | 314 | | | Valeant Pharmaceuticals International, Inc., (Canada) (a) | | | 18,768 | |
| | 198 | | | Watson Pharmaceuticals, Inc. (a) | | | 17,062 | |
| | | | | | | | |
| | | | | | | 55,965 | |
| | | | | | | | |
| | | | Total Health Care | | | 205,363 | |
| | | | | | | | |
| | | | Industrials — 16.4% | |
| | | | Aerospace & Defense — 1.4% | |
| | 108 | | | Precision Castparts Corp. | | | 20,495 | |
| | | | | | | | |
SEE NOTES TO FINANCIAL STATEMENTS.
| | | | | | |
| | | |
| 20 | | | | J.P. MORGAN MID CAP/MULTI-CAP FUNDS | | DECEMBER 31, 2012 |
| | | | | | | | |
| SHARES | | | SECURITY DESCRIPTION | | VALUE($) | |
| Common Stocks — Continued | |
| | | | Building Products — 1.0% | |
| | 520 | | | Fortune Brands Home & Security, Inc. (a) | | | 15,188 | |
| | | | | | | | |
| | | | Construction & Engineering — 1.0% | |
| | 258 | | | Fluor Corp. | | | 15,167 | |
| | | | | | | | |
| | | | Electrical Equipment — 2.5% | |
| | 189 | | | Acuity Brands, Inc. | | | 12,781 | |
| | 344 | | | Generac Holdings, Inc. | | | 11,785 | |
| | 153 | | | Rockwell Automation, Inc. | | | 12,842 | |
| | | | | | | | |
| | | | | | | 37,408 | |
| | | | | | | | |
| | | | Industrial Conglomerates — 1.7% | |
| | 438 | | | Carlisle Cos., Inc. | | | 25,731 | |
| | | | | | | | |
| | | | Machinery — 1.5% | |
| | 372 | | | Pall Corp. | | | 22,417 | |
| | | | | | | | |
| | | | Road & Rail — 3.7% | |
| | 179 | | | Canadian Pacific Railway Ltd., (Canada) | | | 18,210 | |
| | 373 | | | J.B. Hunt Transport Services, Inc. | | | 22,278 | |
| | 396 | | | Old Dominion Freight Line, Inc. (a) | | | 13,560 | |
| | | | | | | | |
| | | | | | | 54,048 | |
| | | | | | | | |
| | | | Trading Companies & Distributors — 3.6% | |
| | 420 | | | Air Lease Corp. (a) | | | 9,024 | |
| | 310 | | | MSC Industrial Direct Co., Inc., Class A | | | 23,360 | |
| | 444 | | | Rush Enterprises, Inc., Class A (a) | | | 9,177 | |
| | 147 | | | Watsco, Inc. | | | 11,040 | |
| | | | | | | | |
| | | | | | | 52,601 | |
| | | | | | | | |
| | | | Total Industrials | | | 243,055 | |
| | | | | | | | |
| | | | Information Technology — 36.0% | |
| | | | Communications Equipment — 3.9% | |
| | 524 | | | Aruba Networks, Inc. (a) | | | 10,875 | |
| | 152 | | | F5 Networks, Inc. (a) | | | 14,777 | |
| | 115 | | | Palo Alto Networks, Inc. (a) | | | 6,149 | |
| | 423 | | | QUALCOMM, Inc. | | | 26,234 | |
| | | | | | | | |
| | | | | | | 58,035 | |
| | | | | | | | |
| | | | Computers & Peripherals — 9.5% | |
| | 216 | | | Apple, Inc. | | | 114,895 | |
| | 694 | | | EMC Corp. (a) | | | 17,563 | |
| | 323 | | | Fusion-io, Inc. (a) | | | 7,409 | |
| | | | | | | | |
| | | | | | | 139,867 | |
| | | | | | | | |
| | | | Internet Software & Services — 8.9% | |
| | 435 | | | Dealertrack Technologies, Inc. (a) | | | 12,487 | |
| | 508 | | | eBay, Inc. (a) | | | 25,939 | |
| | 81 | | | Google, Inc., Class A (a) | | | 57,530 | |
| | 73 | | | LinkedIn Corp., Class A (a) | | | 8,336 | |
| | | | | | | | |
| SHARES | | | SECURITY DESCRIPTION | | VALUE($) | |
| | | | | | | | |
| | | | Internet Software & Services — Continued | |
| | 293 | | | OpenTable, Inc. (a) | | | 14,284 | |
| | 181 | | | Rackspace Hosting, Inc. (a) | | | 13,435 | |
| | | | | | | | |
| | | | | | | 132,011 | |
| | | | | | | | |
| | | | IT Services — 5.7% | |
| | 129 | | | Alliance Data Systems Corp. (a) | | | 18,703 | |
| | 297 | | | FleetCor Technologies, Inc. (a) | | | 15,924 | |
| | 46 | | | MasterCard, Inc., Class A | | | 22,697 | |
| | 179 | | | Visa, Inc., Class A | | | 27,163 | |
| | | | | | | | |
| | | | | | | 84,487 | |
| | | | | | | | |
| | | | Semiconductors & Semiconductor Equipment — 2.9% | |
| | 167 | | | ASML Holding N.V., (Netherlands) | | | 10,768 | |
| | 563 | | | Avago Technologies Ltd., (Singapore) | | | 17,822 | |
| | 408 | | | Broadcom Corp., Class A (a) | | | 13,546 | |
| | | | | | | | |
| | | | | | | 42,136 | |
| | | | | | | | |
| | | | Software — 5.1% | |
| | 380 | | | Infoblox, Inc. (a) | | | 6,832 | |
| | 617 | | | Nuance Communications, Inc. (a) | | | 13,767 | |
| | 198 | | | Red Hat, Inc. (a) | | | 10,470 | |
| | 87 | | | Salesforce.com, Inc. (a) | | | 14,641 | |
| | 174 | | | SolarWinds, Inc. (a) | | | 9,105 | |
| | 261 | | | Splunk, Inc. (a) | | | 7,563 | |
| | 378 | | | TIBCO Software, Inc. (a) | | | 8,313 | |
| | 92 | | | Workday, Inc., Class A (a) | | | 5,009 | |
| | | | | | | | |
| | | | | | | 75,700 | |
| | | | | | | | |
| | | | Total Information Technology | | | 532,236 | |
| | | | | | | | |
| | | | Materials — 4.2% | |
| | | | Chemicals — 4.2% | |
| | 276 | | | FMC Corp. | | | 16,152 | |
| | 105 | | | PPG Industries, Inc. | | | 14,225 | |
| | 202 | | | Sherwin-Williams Co. (The) | | | 31,087 | |
| | | | | | | | |
| | | | Total Materials | | | 61,464 | |
| | | | | | | | |
| | | | Total Common Stocks
(Cost $1,195,983) | | | 1,474,911 | |
| | | | | | | | |
| Short-Term Investment — 0.1% | |
| | | | Investment Company — 0.1% | |
| | 1,981 | | | JPMorgan Prime Money Market Fund, Institutional Class Shares,
0.080% (b) (l) (m)
(Cost $1,981) | | | 1,981 | |
| | | | | | | | |
| | | | Total Investments — 99.9%
(Cost $1,197,964) | | | 1,476,892 | |
| | | | Other Assets in Excess of
Liabilities — 0.1% | | | 1,931 | |
| | | | | | | | |
| | | | NET ASSETS — 100.0% | | $ | 1,478,823 | |
| | | | | | | | |
Percentages indicated are based on net assets.
SEE NOTES TO FINANCIAL STATEMENTS.
| | | | | | | | |
| | | |
| DECEMBER 31, 2012 | | J.P. MORGAN MID CAP/MULTI-CAP FUNDS | | | | | 21 | |
JP Morgan Mid Cap Core Fund
SCHEDULE OF PORTFOLIO INVESTMENTS
AS OF DECEMBER 31, 2012 (Unaudited)
(Amounts in thousands)
| | | | | | | | |
| SHARES | | | SECURITY DESCRIPTION | | VALUE($) | |
| | | | | | | | |
| Common Stocks — 97.9% | |
| | | | Consumer Discretionary — 16.8% | |
| | | | Auto Components — 1.6% | |
| | 614 | | | Allison Transmission Holdings, Inc. | | | 12,538 | |
| | | | | | | | |
| | | | Automobiles — 2.1% | |
| | 332 | | | Harley-Davidson, Inc. | | | 16,212 | |
| | | | | | | | |
| | | | Distributors — 1.4% | |
| | 164 | | | Genuine Parts Co. | | | 10,417 | |
| | | | | | | | |
| | | | Hotels, Restaurants & Leisure — 3.9% | |
| | 382 | | | Brinker International, Inc. | | | 11,850 | |
| | 73 | | | Cracker Barrel Old Country Store, Inc. | | | 4,710 | |
| | 264 | | | Penn National Gaming, Inc. (a) | | | 12,988 | |
| | | | | | | | |
| | | | | | | 29,548 | |
| | | | | | | | |
| | | | Household Durables — 1.9% | |
| | 281 | | | Jarden Corp. (a) | | | 14,540 | |
| | | | | | | | |
| | | | Multiline Retail — 1.6% | |
| | 231 | | | Nordstrom, Inc. | | | 12,367 | |
| | | | | | | | |
| | | | Specialty Retail — 2.9% | |
| | 760 | | | American Eagle Outfitters, Inc. | | | 15,586 | |
| | 215 | | | Gap, Inc. (The) | | | 6,680 | |
| | | | | | | | |
| | | | | | | 22,266 | |
| | | | | | | | |
| | | | Textiles, Apparel & Luxury Goods — 1.4% | |
| | 257 | | | Deckers Outdoor Corp. (a) | | | 10,329 | |
| | | | | | | | |
| | | | Total Consumer Discretionary | | | 128,217 | |
| | | | | | | | |
| | | | Energy — 9.7% | |
| | | | Energy Equipment & Services — 4.2% | |
| | 1,045 | | | Patterson-UTI Energy, Inc. | | | 19,463 | |
| | 284 | | | Tidewater, Inc. | | | 12,685 | |
| | | | | | | | |
| | | | | | | 32,148 | |
| | | | | | | | |
| | | | Oil, Gas & Consumable Fuels — 5.5% | |
| | 321 | | | Cimarex Energy Co. | | | 18,505 | |
| | 448 | | | Devon Energy Corp. | | | 23,298 | |
| | | | | | | | |
| | | | | | | 41,803 | |
| | | | | | | | |
| | | | Total Energy | | | 73,951 | |
| | | | | | | | |
| | | | Financials — 22.3% | |
| | | | Capital Markets — 7.7% | |
| | 41 | | | BlackRock, Inc. | | | 8,475 | |
| | 110 | | | Franklin Resources, Inc. | | | 13,865 | |
| | 99 | | | Greenhill & Co., Inc. | | | 5,162 | |
| | 450 | | | HFF, Inc., Class A | | | 6,699 | |
| | 825 | | | Janus Capital Group, Inc. | | | 7,033 | |
| | 1,023 | | | TD Ameritrade Holding Corp. | | | 17,198 | |
| | | | | | | | |
| | | | | | | 58,432 | |
| | | | | | | | |
| | | | | | | | |
| SHARES | | | SECURITY DESCRIPTION | | VALUE($) | |
| | | | | | | | |
| | | | Commercial Banks — 5.5% | | | | |
| | 997 | | | Associated Banc-Corp. | | | 13,077 | |
| | 487 | | | First Republic Bank | | | 15,969 | |
| | 308 | | | SunTrust Banks, Inc. | | | 8,735 | |
| | 333 | | | Umpqua Holdings Corp. | | | 3,920 | |
| | | | | | | | |
| | | | | | | 41,701 | |
| | | | | | | | |
| | | | Insurance — 4.6% | |
| | 288 | | | Chubb Corp. (The) | | | 21,703 | |
| | 318 | | | ProAssurance Corp. | | | 13,436 | |
| | | | | | | | |
| | | | | | | 35,139 | |
| | | | | | | | |
| | | | Real Estate Investment Trusts (REITs) — 4.5% | |
| | 174 | | | Mid-America Apartment Communities, Inc. | | | 11,252 | |
| | 231 | | | National Retail Properties, Inc. | | | 7,219 | |
| | 828 | | | RLJ Lodging Trust | | | 16,044 | |
| | | | | | | | |
| | | | | | | 34,515 | |
| | | | | | | | |
| | | | Total Financials | | | 169,787 | |
| | | | | | | | |
| | | | Health Care — 5.6% | |
| | | | Health Care Equipment & Supplies — 1.0% | |
| | 78 | | | IDEXX Laboratories, Inc. (a) | | | 7,283 | |
| | | | | | | | |
| | | | Health Care Providers & Services — 4.6% | |
| | 85 | | | Cigna Corp. | | | 4,544 | |
| | 149 | | | Laboratory Corp. of America Holdings (a) | | | 12,936 | |
| | 328 | | | UnitedHealth Group, Inc. | | | 17,811 | |
| | | | | | | | |
| | | | | | | 35,291 | |
| | | | | | | | |
| | | | Total Health Care | | | 42,574 | |
| | | | | | | | |
| | | | Industrials — 17.7% | |
| | | | Aerospace & Defense — 1.2% | |
| | 68 | | | TransDigm Group, Inc. | | | 9,215 | |
| | | | | | | | |
| | | | Commercial Services & Supplies — 5.4% | |
| | 548 | | | Herman Miller, Inc. | | | 11,741 | |
| | 859 | | | Waste Connections, Inc. | | | 29,018 | |
| | | | | | | | |
| | | | | | | 40,759 | |
| | | | | | | | |
| | | | Electrical Equipment — 1.1% | |
| | 118 | | | Regal-Beloit Corp. | | | 8,298 | |
| | | | | | | | |
| | | | Machinery — 7.1% | |
| | 122 | | | Cummins, Inc. | | | 13,251 | |
| | 264 | | | Joy Global, Inc. | | | 16,812 | |
| | 652 | | | Rexnord Corp. (a) | | | 13,894 | |
| | 242 | | | Toro Co. (The) | | | 10,404 | |
| | | | | | | | |
| | | | | | | 54,361 | |
| | | | | | | | |
| | | | Road & Rail — 1.5% | |
| | 184 | | | Norfolk Southern Corp. | | | 11,376 | |
| | | | | | | | |
SEE NOTES TO FINANCIAL STATEMENTS.
| | | | | | |
| | | |
| 22 | | | | J.P. MORGAN MID CAP/MULTI-CAP FUNDS | | DECEMBER 31, 2012 |
| | | | | | | | |
| SHARES | | | SECURITY DESCRIPTION | | VALUE($) | |
| | | | | | | | |
| Common Stocks — Continued | |
| | | | Trading Companies & Distributors — 1.4% | |
| | 53 | | | W.W. Grainger, Inc. | | | 10,645 | |
| | | | | | | | |
| | | | Total Industrials | | | 134,654 | |
| | | | | | | | |
| | | | Information Technology — 10.4% | |
| | | | Computers & Peripherals — 1.4% | |
| | 309 | | | NetApp, Inc. (a) | | | 10,355 | |
| | | | | | | | |
| | | | Electronic Equipment, Instruments & Components — 2.2% | |
| | 266 | | | Anixter International, Inc. | | | 17,035 | |
| | | | | | | | |
| | | | Semiconductors & Semiconductor Equipment — 3.0% | |
| | 653 | | | Freescale Semiconductor Ltd. (a) | | | 7,192 | |
| | 455 | | | Linear Technology Corp. | | | 15,608 | |
| | | | | | | | |
| | | | | | | 22,800 | |
| | | | | | | | |
| | | | Software — 3.8% | |
| | 155 | | | Citrix Systems, Inc. (a) | | | 10,218 | |
| | 299 | | | MICROS Systems, Inc. (a) | | | 12,689 | |
| | 68 | | | Solera Holdings, Inc. | | | 3,624 | |
| | 87 | | | Splunk, Inc. (a) | | | 2,530 | |
| | | | | | | | |
| | | | | | | 29,061 | |
| | | | | | | | |
| | | | Total Information Technology | | | 79,251 | |
| | | | | | | | |
| | | | Materials — 9.3% | |
| | | | Chemicals — 1.9% | |
| | 124 | | | Airgas, Inc. | | | 11,343 | |
| | 70 | | | Scotts Miracle-Gro Co. (The), Class A | | | 3,082 | |
| | | | | | | | |
| | | | | | | 14,425 | |
| | | | | | | | |
| | | | Containers & Packaging — 5.0% | |
| | 473 | | | Crown Holdings, Inc. (a) | | | 17,417 | |
| | 502 | | | Silgan Holdings, Inc. | | | 20,885 | |
| | | | | | | | |
| | | | | | | 38,302 | |
| | | | | | | | |
| | | | | | | | |
| SHARES | | | SECURITY DESCRIPTION | | VALUE($) | |
| | | | | | | | |
| | | | | | | | |
| | | | Metals & Mining — 2.4% | |
| | 299 | | | Reliance Steel & Aluminum Co. | | | 18,545 | |
| | | | | | | | |
| | | | Total Materials | | | 71,272 | |
| | | | | | | | |
| | | | Utilities — 6.1% | |
| | | | Electric Utilities — 1.0% | |
| | 167 | | | Southern Co. (The) | | | 7,168 | |
| | | | | | | | |
| | | | Multi-Utilities — 5.1% | |
| | 689 | | | CMS Energy Corp. | | | 16,803 | |
| | 208 | | | NorthWestern Corp. | | | 7,221 | |
| | 145 | | | PG&E Corp. | | | 5,814 | |
| | 253 | | | Wisconsin Energy Corp. | | | 9,330 | |
| | | | | | | | |
| | | | | | | 39,168 | |
| | | | | | | | |
| | | | Total Utilities | | | 46,336 | |
| | | | | | | | |
| | | | Total Common Stocks
(Cost $706,155) | | | 746,042 | |
| | | | | | | | |
| | | | | | | | |
| Short-Term Investment — 1.9% | |
| | | | Investment Company — 1.9% | |
| | 14,817 | | | JPMorgan Prime Money Market Fund, Institutional Class Shares,
0.080% (b) (l) (m)
(Cost $14,817) | | | 14,817 | |
| | | | | | | | |
| | | | Total Investments — 99.8%
(Cost $720,972) | | | 760,859 | |
| | | | Other Assets in Excess of
Liabilities — 0.2% | | | 1,410 | |
| | | | | | | | |
| | | | NET ASSETS — 100.0% | | $ | 762,269 | |
| | | | | | | | |
Percentages indicated are based on net assets.
SEE NOTES TO FINANCIAL STATEMENTS.
| | | | | | | | |
| | | |
| DECEMBER 31, 2012 | | J.P. MORGAN MID CAP/MULTI-CAP FUNDS | | | | | 23 | |
JPMorgan Mid Cap Equity Fund
SCHEDULE OF PORTFOLIO INVESTMENTS
AS OF DECEMBER 31, 2012 (Unaudited)
(Amounts in thousands)
| | | | | | | | |
| SHARES | | | SECURITY DESCRIPTION | | VALUE($) | |
| | | | | | | | |
| Common Stocks — 96.5% | | | | |
| | | | Consumer Discretionary — 20.4% | | | | |
| | | | Auto Components — 0.3% | | | | |
| | 159 | | | Allison Transmission Holdings, Inc. | | | 3,237 | |
| | | | | | | | |
| | | | Automobiles — 1.0% | | | | |
| | 117 | | | Harley-Davidson, Inc. | | | 5,714 | |
| | 108 | | | Tesla Motors, Inc. (a) | | | 3,645 | |
| | | | | | | | |
| | | | | | | 9,359 | |
| | | | | | | | |
| | | | Distributors — 0.5% | | | | |
| | 75 | | | Genuine Parts Co. | | | 4,800 | |
| | | | | | | | |
| | | | Hotels, Restaurants & Leisure — 3.4% | | | | |
| | 62 | | | Darden Restaurants, Inc. | | | 2,781 | |
| | 329 | | | Marriott International, Inc., Class A | | | 12,279 | |
| | 22 | | | Panera Bread Co., Class A (a) | | | 3,462 | |
| | 118 | | | Penn National Gaming, Inc. (a) | | | 5,785 | |
| | 106 | | | Royal Caribbean Cruises Ltd. | | | 3,587 | |
| | 58 | | | Yum! Brands, Inc. | | | 3,873 | |
| | | | | | | | |
| | | | | | | 31,767 | |
| | | | | | | | |
| | | | Household Durables — 1.1% | | | | |
| | 28 | | | Jarden Corp. (a) | | | 1,463 | |
| | 62 | | | Mohawk Industries, Inc. (a) | | | 5,576 | |
| | 99 | | | Toll Brothers, Inc. (a) | | | 3,207 | |
| | | | | | | | |
| | | | | | | 10,246 | |
| | | | | | | | |
| | | | Internet & Catalog Retail — 1.1% | | | | |
| | 126 | | | Expedia, Inc. | | | 7,772 | |
| | 54 | | | TripAdvisor, Inc. (a) | | | 2,278 | |
| | | | | | | | |
| | | | | | | 10,050 | |
| | | | | | | | |
| | | | Media — 2.6% | | | | |
| | 22 | | | AMC Networks, Inc., Class A (a) | | | 1,082 | |
| | 79 | | | Cablevision Systems Corp., Class A | | | 1,178 | |
| | 103 | | | CBS Corp. (Non-Voting), Class B | | | 3,924 | |
| | 130 | | | Clear Channel Outdoor Holdings, Inc., Class A | | | 913 | |
| | 71 | | | Discovery Communications, Inc., Class A (a) | | | 4,482 | |
| | 147 | | | DISH Network Corp., Class A | | | 5,344 | |
| | 76 | | | Gannett Co., Inc. | | | 1,365 | |
| | 105 | | | Madison Square Garden Co. (The), Class A (a) | | | 4,639 | |
| | 2 | | | Washington Post Co. (The), Class B | | | 823 | |
| | | | | | | | |
| | | | | | | 23,750 | |
| | | | | | | | |
| | | | Multiline Retail — 1.2% | | | | |
| | 79 | | | Family Dollar Stores, Inc. | | | 5,004 | |
| | 152 | | | Kohl's Corp. | | | 6,551 | |
| | | | | | | | |
| | | | | | | 11,555 | |
| | | | | | | | |
| | | | Specialty Retail — 6.9% | | | | |
| | 17 | | | AutoZone, Inc. (a) | | | 5,940 | |
| | 149 | | | Bed Bath & Beyond, Inc. (a) | | | 8,327 | |
| | | | | | | | |
SHARES | | | SECURITY DESCRIPTION | | VALUE($) | |
| | | | | | | | |
| | | | | | | | |
| | | | Specialty Retail — Continued | | | | |
| | 228 | | | Gap, Inc. (The) | | | 7,079 | |
| | 102 | | | GNC Holdings, Inc., Class A | | | 3,405 | |
| | 74 | | | O'Reilly Automotive, Inc. (a) | | | 6,572 | |
| | 138 | | | PetSmart, Inc. | | | 9,421 | |
| | 129 | | | Sally Beauty Holdings, Inc. (a) | | | 3,031 | |
| | 63 | | | Tiffany & Co. | | | 3,596 | |
| | 100 | | | TJX Cos., Inc. | | | 4,249 | |
| | 171 | | | Urban Outfitters, Inc. (a) | | | 6,738 | |
| | 120 | | | Williams-Sonoma, Inc. | | | 5,261 | |
| | | | | | | | |
| | | | | | | 63,619 | |
| | | | | | | | |
| | | | Textiles, Apparel & Luxury Goods — 2.3% | | | | |
| | 133 | | | Michael Kors Holdings Ltd., (Hong Kong) (a) | | | 6,777 | |
| | 44 | | | PVH Corp. | | | 4,889 | |
| | 62 | | | V.F. Corp. | | | 9,416 | |
| | | | | | | | |
| | | | | | | 21,082 | |
| | | | | | | | |
| | | | Total Consumer Discretionary | | | 189,465 | |
| | | | | | | | |
| | | | Consumer Staples — 4.2% | | | | |
| | | | Beverages — 1.7% | | | | |
| | 86 | | | Beam, Inc. | | | 5,281 | |
| | 36 | | | Brown-Forman Corp., Class B | | | 2,263 | |
| | 91 | | | Dr. Pepper Snapple Group, Inc. | | | 4,036 | |
| | 78 | | | Monster Beverage Corp. (a) | | | 4,119 | |
| | | | | | | | |
| | | | | | | 15,699 | |
| | | | | | | | |
| | | | Food Products — 1.8% | | | | |
| | 56 | | | Hershey Co. (The) | | | 4,075 | |
| | 19 | | | JM Smucker Co. (The) | | | 1,665 | |
| | 58 | | | Mead Johnson Nutrition Co. | | | 3,842 | |
| | 42 | | | Ralcorp Holdings, Inc. (a) | | | 3,780 | |
| | 198 | | | WhiteWave Foods Co., Class A (a) | | | 3,075 | |
| | | | | | | | |
| | | | | | | 16,437 | |
| | | | | | | | |
| | | | Household Products — 0.5% | | | | |
| | 62 | | | Energizer Holdings, Inc. | | | 4,941 | |
| | | | | | | | |
| | | | Personal Products — 0.2% | | | | |
| | 57 | | | Herbalife Ltd., (Cayman Islands) | | | 1,865 | |
| | | | | | | | |
| | | | Total Consumer Staples | | | 38,942 | |
| | | | | | | | |
| | | | Energy — 5.7% | | | | |
| | | | Energy Equipment & Services — 0.9% | | | | |
| | 87 | | | Cameron International Corp. (a) | | | 4,886 | |
| | 63 | | | Oceaneering International, Inc. | | | 3,389 | |
| | | | | | | | |
| | | | | | | 8,275 | |
| | | | | | | | |
| | | | Oil, Gas & Consumable Fuels — 4.8% | | | | |
| | 104 | | | Concho Resources, Inc. (a) | | | 8,386 | |
| | 79 | | | Devon Energy Corp. | | | 4,120 | |
SEE NOTES TO FINANCIAL STATEMENTS.
| | | | | | |
| | | |
| 24 | | | | J.P. MORGAN MID CAP/MULTI-CAP FUNDS | | DECEMBER 31, 2012 |
| | | | | | | | |
| SHARES | | | SECURITY DESCRIPTION | | VALUE($) | |
| | | | | | | | |
| Common Stocks — Continued | | | | |
| | | | Oil, Gas & Consumable Fuels — Continued | | | | |
| | 165 | | | Energen Corp. | | | 7,457 | |
| | 85 | | | EQT Corp. | | | 5,009 | |
| | 140 | | | Laredo Petroleum Holdings, Inc. (a) | | | 2,539 | |
| | 78 | | | Marathon Petroleum Corp. | | | 4,882 | |
| | 55 | | | PBF Energy, Inc. (a) | | | 1,604 | |
| | 113 | | | QEP Resources, Inc. | | | 3,419 | |
| | 74 | | | Range Resources Corp. | | | 4,675 | |
| | 90 | | | Williams Cos., Inc. (The) | | | 2,946 | |
| | | | | | | | |
| | | | | | | 45,037 | |
| | | | | | | | |
| | | | Total Energy | | | 53,312 | |
| | | | | | | | |
| | | | Financials — 17.3% | | | | |
| | | | Capital Markets — 4.4% | | | | |
| | 120 | | | Ameriprise Financial, Inc. | | | 7,507 | |
| | 266 | | | Blackstone Group LP (The) | | | 4,150 | |
| | 329 | | | Charles Schwab Corp. (The) | | | 4,723 | |
| | 184 | | | Invesco Ltd. | | | 4,802 | |
| | 125 | | | Lazard Ltd., (Bermuda), Class A | | | 3,739 | |
| | 79 | | | Northern Trust Corp. | | | 3,978 | |
| | 183 | | | T. Rowe Price Group, Inc. | | | 11,924 | |
| | | | | | | | |
| | | | | | | 40,823 | |
| | | | | | | | |
| | | | Commercial Banks — 4.1% | | | | |
| | 63 | | | City National Corp. | | | 3,132 | |
| | 41 | | | Cullen/Frost Bankers, Inc. | | | 2,234 | |
| | 372 | | | Fifth Third Bancorp | | | 5,651 | |
| | 56 | | | First Republic Bank | | | 1,829 | |
| | 284 | | | Huntington Bancshares, Inc. | | | 1,815 | |
| | 118 | | | M&T Bank Corp. | | | 11,619 | |
| | 64 | | | Signature Bank (a) | | | 4,552 | |
| | 166 | | | SunTrust Banks, Inc. | | | 4,699 | |
| | 122 | | | Zions Bancorp | | | 2,603 | |
| | | | | | | | |
| | | | | | | 38,134 | |
| | | | | | | | |
| | | | Diversified Financial Services — 0.8% | | | | |
| | 142 | | | Moody's Corp. | | | 7,125 | |
| | | | | | | | |
| | | | Insurance — 5.3% | | | | |
| | 16 | | | Alleghany Corp. (a) | | | 5,316 | |
| | 118 | | | Axis Capital Holdings Ltd., (Bermuda) | | | 4,095 | |
| | 56 | | | Chubb Corp. (The) | | | 4,201 | |
| | 137 | | | Hartford Financial Services Group, Inc. | | | 3,081 | |
| | 194 | | | Loews Corp. | | | 7,897 | |
| | 207 | | | Marsh & McLennan Cos., Inc. | | | 7,120 | |
| | 262 | | | Old Republic International Corp. | | | 2,785 | |
| | 116 | | | OneBeacon Insurance Group Ltd., Class A | | | 1,607 | |
| | 169 | | | Unum Group | | | 3,524 | |
| | | | | | | | |
| SHARES | | | SECURITY DESCRIPTION | | VALUE($) | |
| | | | | |
| | | | Insurance — Continued | | | | |
| | | | | | | | |
| | 129 | | | W.R. Berkley Corp. | | | 4,869 | |
| | 204 | | | XL Group plc, (Ireland) | | | 5,105 | |
| | | | | | | | |
| | | | | | | 49,600 | |
| | | | | | | | |
| | | | Real Estate Investment Trusts (REITs) — 1.8% | |
| | 108 | | | Annaly Capital Management, Inc. | | | 1,518 | |
| | 78 | | | HCP, Inc. | | | 3,538 | |
| | 107 | | | Prologis, Inc. | | | 3,897 | |
| | 86 | | | Regency Centers Corp. | | | 4,070 | |
| | 46 | | | Vornado Realty Trust | | | 3,723 | |
| | | | | | | | |
| | | | | | | 16,746 | |
| | | | | | | | |
| | | | Real Estate Management & Development — 0.4% | |
| | 203 | | | Brookfield Office Properties, Inc. | | | 3,446 | |
| | | | | | | | |
| | | | Thrifts & Mortgage Finance — 0.5% | | | | |
| | 122 | | | Capitol Federal Financial, Inc. | | | 1,429 | |
| | 282 | | | People's United Financial, Inc. | | | 3,404 | |
| | | | | | | | |
| | | | | | | 4,833 | |
| | | | | | | | |
| | | | Total Financials | | | 160,707 | |
| | | | | | | | |
| | | | Health Care — 9.3% | | | | |
| | | | Biotechnology — 1.5% | | | | |
| | 36 | | | Alexion Pharmaceuticals, Inc. (a) | | | 3,358 | |
| | 50 | | | Onyx Pharmaceuticals, Inc. (a) | | | 3,784 | |
| | 23 | | | Regeneron Pharmaceuticals, Inc. (a) | | | 3,952 | |
| | 74 | | | Vertex Pharmaceuticals, Inc. (a) | | | 3,108 | |
| | | | | | | | |
| | | | | | | 14,202 | |
| | | | | | | | |
| | | | Health Care Equipment & Supplies — 1.1% | | | | |
| | 44 | | | CareFusion Corp. (a) | | | 1,243 | |
| | 64 | | | Sirona Dental Systems, Inc. (a) | | | 4,132 | |
| | 131 | | | Thoratec Corp. (a) | | | 4,896 | |
| | | | | | | | |
| | | | | | | 10,271 | |
| | | | | | | | |
| | | | Health Care Providers & Services — 3.6% | | | | |
| | 114 | | | AmerisourceBergen Corp. | | | 4,907 | |
| | 211 | | | Brookdale Senior Living, Inc. (a) | | | 5,340 | |
| | 103 | | | Cigna Corp. | | | 5,489 | |
| | 36 | | | DaVita HealthCare Partners, Inc. (a) | | | 3,924 | |
| | 90 | | | Health Net, Inc. (a) | | | 2,175 | |
| | 36 | | | Henry Schein, Inc. (a) | | | 2,863 | |
| | 123 | | | Humana, Inc. | | | 8,463 | |
| | | | | | | | |
| | | | | | | 33,161 | |
| | | | | | | | |
| | | | Life Sciences Tools & Services — 1.5% | | | | |
| | 174 | | | Agilent Technologies, Inc. | | | 7,128 | |
| | 214 | | | Bruker Corp. (a) | | | 3,266 | |
SEE NOTES TO FINANCIAL STATEMENTS.
| | | | | | | | |
| | | |
| DECEMBER 31, 2012 | | J.P. MORGAN MID CAP/MULTI-CAP FUNDS | | | | | 25 | |
JPMorgan Mid Cap Equity Fund
SCHEDULE OF PORTFOLIO INVESTMENTS
AS OF DECEMBER 31, 2012 (Unaudited) (continued)
(Amounts in thousands)
| | | | | | | | |
| SHARES | | | SECURITY DESCRIPTION | | VALUE($) | |
| | | | | | | | |
| Common Stocks — Continued | | | | |
| | | | Life Sciences Tools & Services — Continued | | | | |
| | 64 | | | Illumina, Inc. (a) | | | 3,584 | |
| | | | | | | | |
| | | | | | | 13,978 | |
| | | | | | | | |
| | | | Pharmaceuticals — 1.6% | | | | |
| | 33 | | | Perrigo Co. | | | 3,423 | |
| | 94 | | | Valeant Pharmaceuticals International, Inc., (Canada) (a) | | | 5,606 | |
| | 72 | | | Watson Pharmaceuticals, Inc. (a) | | | 6,166 | |
| | | | | | | | |
| | | | | | | 15,195 | |
| | | | | | | | |
| | | | Total Health Care | | | 86,807 | |
| | | | | | | | |
| | | | Industrials — 13.7% | | | | |
| | | | Aerospace & Defense — 0.8% | | | | |
| | 45 | | | Alliant Techsystems, Inc. | | | 2,808 | |
| | 30 | | | TransDigm Group, Inc. | | | 4,145 | |
| | | | | | | | |
| | | | | | | 6,953 | |
| | | | | | | | |
| | | | Building Products — 1.2% | | | | |
| | 62 | | | Armstrong World Industries, Inc. | | | 3,166 | |
| | 278 | | | Fortune Brands Home & Security, Inc. (a) | | | 8,115 | |
| | | | | | | | |
| | | | | | | 11,281 | |
| | | | | | | | |
| | | | Commercial Services & Supplies — 1.2% | | | | |
| | 173 | | | Republic Services, Inc. | | | 5,063 | |
| | 67 | | | Stericycle, Inc. (a) | | | 6,226 | |
| | | | | | | | |
| | | | | | | 11,289 | |
| | | | | | | | |
| | | | Construction & Engineering — 0.6% | | | | |
| | 96 | | | Fluor Corp. | | | 5,651 | |
| | | | | | | | |
| | | | Electrical Equipment — 2.2% | | | | |
| | 56 | | | Acuity Brands, Inc. | | | 3,813 | |
| | 126 | | | AMETEK, Inc. | | | 4,744 | |
| | 72 | | | Generac Holdings, Inc. | | | 2,453 | |
| | 70 | | | Regal-Beloit Corp. | | | 4,941 | |
| | 58 | | | Rockwell Automation, Inc. | | | 4,830 | |
| | | | | | | | |
| | | | | | | 20,781 | |
| | | | | | | | |
| | | | Industrial Conglomerates — 1.3% | | | | |
| | 210 | | | Carlisle Cos., Inc. | | | 12,354 | |
| | | | | | | | |
| | | | Machinery — 2.5% | | | | |
| | 90 | | | IDEX Corp. | | | 4,180 | |
| | 122 | | | Pall Corp. | | | 7,340 | |
| | 153 | | | Rexnord Corp. (a) | | | 3,262 | |
| | 53 | | | Snap-on, Inc. | | | 4,171 | |
| | 43 | | | Wabtec Corp. | | | 3,744 | |
| | | | | | | | |
| | | | | | | 22,697 | |
| | | | | | | | |
| | | | | | | | |
| SHARES | | | SECURITY DESCRIPTION | | VALUE($) | |
| | | | | | | | |
| | | | | | | | |
| | | | Professional Services — 0.8% | | | | |
| | 72 | | | Equifax, Inc. | | | 3,880 | |
| | 121 | | | Nielsen Holdings N.V. (a) | | | 3,695 | |
| | | | | | | | |
| | | | | | | 7,575 | |
| | | | | | | | |
| | | | Road & Rail — 1.4% | | | | |
| | 54 | | | Canadian Pacific Railway Ltd., (Canada) | | | 5,437 | |
| | 123 | | | J.B. Hunt Transport Services, Inc. | | | 7,338 | |
| | | | | | | | |
| | | | | | | 12,775 | |
| | | | | | | | |
| | | | Trading Companies & Distributors — 1.7% | | | | |
| | 131 | | | Air Lease Corp. (a) | | | 2,810 | |
| | 173 | | | MSC Industrial Direct Co., Inc., Class A | | | 13,044 | |
| | | | | | | | |
| | | | | | | 15,854 | |
| | | | | | | | |
| | | | Total Industrials | | | 127,210 | |
| | | | | | | | |
| | | | Information Technology — 14.5% | | | | |
| | | | Communications Equipment — 1.2% | | | | |
| | 152 | | | Aruba Networks, Inc. (a) | | | 3,152 | |
| | 59 | | | F5 Networks, Inc. (a) | | | 5,722 | |
| | 35 | | | Palo Alto Networks, Inc. (a) | | | 1,847 | |
| | | | | | | | |
| | | | | | | 10,721 | |
| | | | | | | | |
| | | | Computers & Peripherals — 0.3% | | | | |
| | 121 | | | Fusion-io, Inc. (a) | | | 2,765 | |
| | | | | | | | |
| | | | Electronic Equipment, Instruments & Components — 1.8% | |
| | 181 | | | Amphenol Corp., Class A | | | 11,742 | |
| | 138 | | | Arrow Electronics, Inc. (a) | | | 5,256 | |
| | | | | | | | |
| | | | | | | 16,998 | |
| | | | | | | | |
| | | | Internet Software & Services — 1.4% | | | | |
| | 33 | | | LinkedIn Corp., Class A (a) | | | 3,766 | |
| | 87 | | | OpenTable, Inc. (a) | | | 4,246 | |
| | 64 | | | Rackspace Hosting, Inc. (a) | | | 4,738 | |
| | | | | | | | |
| | | | | | | 12,750 | |
| | | | | | | | |
| | | | IT Services — 2.8% | | | | |
| | 70 | | | Alliance Data Systems Corp. (a) | | | 10,133 | |
| | 117 | | | CoreLogic, Inc. (a) | | | 3,152 | |
| | 126 | | | FleetCor Technologies, Inc. (a) | | | 6,749 | |
| | 145 | | | Jack Henry & Associates, Inc. | | | 5,712 | |
| | | | | | | | |
| | | | | | | 25,746 | |
| | | | | | | | |
| | | | Semiconductors & Semiconductor Equipment — 3.4% | |
| | 155 | | | Analog Devices, Inc. | | | 6,512 | |
| | 212 | | | Avago Technologies Ltd., (Singapore) | | | 6,725 | |
| | 109 | | | KLA-Tencor Corp. | | | 5,182 | |
| | 117 | | | Microchip Technology, Inc. (c) | | | 3,813 | |
| | 264 | | | Xilinx, Inc. | | | 9,494 | |
| | | | | | | | |
| | | | | | | 31,726 | |
| | | | | | | | |
SEE NOTES TO FINANCIAL STATEMENTS.
| | | | | | |
| | | |
| 26 | | | | J.P. MORGAN MID CAP/MULTI-CAP FUNDS | | DECEMBER 31, 2012 |
| | | | | | | | |
| SHARES | | | SECURITY DESCRIPTION | | VALUE($) | |
| | | | | | | | |
| Common Stocks — Continued | |
| | | | Software — 3.6% | |
| | 59 | | | Citrix Systems, Inc. (a) | | | 3,892 | |
| | 39 | | | FactSet Research Systems, Inc. | | | 3,399 | |
| | 145 | | | Fortinet, Inc. (a) | | | 3,047 | |
| | 227 | | | Nuance Communications, Inc. (a) | | | 5,067 | |
| | 80 | | | Red Hat, Inc. (a) | | | 4,237 | |
| | 62 | | | SolarWinds, Inc. (a) | | | 3,268 | |
| | 73 | | | Splunk, Inc. (a) | | | 2,118 | |
| | 129 | | | Synopsys, Inc. (a) | | | 4,121 | |
| | 131 | | | TIBCO Software, Inc. (a) | | | 2,879 | |
| | 28 | | | Workday, Inc., Class A (a) | | | 1,510 | |
| | | | | | | | |
| | | | | | | 33,538 | |
| | | | | | | | |
| | | | Total Information Technology | | | 134,244 | |
| | | | | | | | |
| | | | Materials — 6.8% | |
| | | | Chemicals — 5.1% | |
| | 58 | | | Airgas, Inc. | | | 5,266 | |
| | 76 | | | Albemarle Corp. | | | 4,728 | |
| | 104 | | | FMC Corp. | | | 6,074 | |
| | 59 | | | PPG Industries, Inc. | | | 7,972 | |
| | 95 | | | Sherwin-Williams Co. (The) | | | 14,618 | |
| | 64 | | | Sigma-Aldrich Corp. | | | 4,744 | |
| | 60 | | | W.R. Grace & Co. (a) | | | 4,027 | |
| | | | | | | | |
| | | | | | | 47,429 | |
| | | | | | | | |
| | | | Containers & Packaging — 1.7% | |
| | 164 | | | Ball Corp. | | | 7,349 | |
| | 57 | | | Rock-Tenn Co., Class A | | | 4,002 | |
| | 112 | | | Silgan Holdings, Inc. | | | 4,657 | |
| | | | | | | | |
| | | | | | | 16,008 | |
| | | | | | | | |
| | | | Total Materials | | | 63,437 | |
| | | | | | | | |
| | | | Telecommunication Services — 0.2% | |
| | | | Wireless Telecommunication Services — 0.2% | |
| | 76 | | | Telephone & Data Systems, Inc. | | | 1,672 | |
| | | | | | | | |
| | | | Utilities — 4.4% | |
| | | | Electric Utilities — 1.5% | |
| | 256 | | | NV Energy, Inc. | | | 4,647 | |
| | | | | | | | |
| SHARES | | | SECURITY DESCRIPTION | | VALUE($) | |
| | | | | | | | |
| | | | Electric Utilities — Continued | | | | |
| | 162 | | | Westar Energy, Inc. | | | 4,649 | |
| | 187 | | | Xcel Energy, Inc. | | | 4,985 | |
| | | | | | | | |
| | | | | | | 14,281 | |
| | | | | | | | |
| | | | Gas Utilities — 0.4% | | | | |
| | 54 | | | ONEOK, Inc. | | | 2,304 | |
| | 59 | | | Questar Corp. | | | 1,158 | |
| | | | | | | | |
| | | | | | | 3,462 | |
| | | | | | | | |
| | | | Multi-Utilities — 2.5% | | | | |
| | 212 | | | CenterPoint Energy, Inc. | | | 4,081 | |
| | 207 | | | CMS Energy Corp. | | | 5,050 | |
| | 193 | | | NiSource, Inc. | | | 4,798 | |
| | 71 | | | Sempra Energy | | | 5,012 | |
| | 111 | | | Wisconsin Energy Corp. | | | 4,090 | |
| | | | | | | | |
| | | | | | | 23,031 | |
| | | | | | | | |
| | | | Total Utilities | | | 40,774 | |
| | | | | | | | |
| | | | Total Common Stocks
(Cost $723,340) | | | 896,570 | |
| | | | | | | | |
| Short-Term Investment — 3.3% | |
| | | | Investment Company — 3.3% | |
| | 30,318 | | | JPMorgan Prime Money Market Fund, Institutional Class Shares, 0.080% (b) (l) (m) (Cost $30,318) | | | 30,318 | |
| | | | | | | | |
| Investment of Cash Collateral for Securities on Loan — 0.1% | |
| | | | Investment Company — 0.1% | |
| | 1,056 | | | JPMorgan Prime Money Market Fund, Capital Shares, 0.110% (b) (l)
(Cost $1,056) | | | 1,056 | |
| | | | | | | | |
| | | | Total Investments — 99.9%
(Cost $754,714) | | | 927,944 | |
| | | | Other Assets in Excess of
Liabilities — 0.1% | | | 969 | |
| | | | | | | | |
| | | | NET ASSETS — 100.0% | | $ | 928,913 | |
| | | | | | | | |
Percentages indicated are based on net assets.
SEE NOTES TO FINANCIAL STATEMENTS.
| | | | | | | | |
| | | |
| DECEMBER 31, 2012 | | J.P. MORGAN MID CAP/MULTI-CAP FUNDS | | | | | 27 | |
JPMorgan Mid Cap Growth Fund
SCHEDULE OF PORTFOLIO INVESTMENTS
AS OF DECEMBER 31, 2012 (Unaudited)
(Amounts in thousands)
| | | | | | | | |
| SHARES | | | SECURITY DESCRIPTION | | VALUE($) | |
| | | | | | | | |
| Common Stocks — 98.6% | |
| | | | Consumer Discretionary — 20.6% | |
| | | | Auto Components — 0.7% | |
| | 479 | | | Allison Transmission Holdings, Inc. | | | 9,773 | |
| | | | | | | | |
| | | | Automobiles — 2.0% | |
| | 352 | | | Harley-Davidson, Inc. | | | 17,182 | |
| | 320 | | | Tesla Motors, Inc. (a) | | | 10,838 | |
| | | | | | | | |
| | | | | | | 28,020 | |
| | | | | | | | |
| | | | Hotels, Restaurants & Leisure — 4.3% | |
| | 571 | | | Marriott International, Inc., Class A | | | 21,292 | |
| | 65 | | | Panera Bread Co., Class A (a) | | | 10,261 | |
| | 353 | | | Penn National Gaming, Inc. (a) | | | 17,316 | |
| | 319 | | | Royal Caribbean Cruises Ltd. | | | 10,832 | |
| | | | | | | | |
| | | | | | | 59,701 | |
| | | | | | | | |
| | | | Household Durables — 0.7% | |
| | 299 | | | Toll Brothers, Inc. (a) | | | 9,670 | |
| | | | | | | | |
| | | | Internet & Catalog Retail — 0.9% | | | | |
| | 204 | | | Expedia, Inc. | | | 12,536 | |
| | | | | | | | |
| | | | Media — 2.0% | |
| | 213 | | | Discovery Communications, Inc., Class A (a) | | | 13,515 | |
| | 311 | | | Madison Square Garden Co. (The), Class A (a) | | | 13,780 | |
| | | | | | | | |
| | | | | | | 27,295 | |
| | | | | | | | |
| | | | Specialty Retail — 7.1% | |
| | 161 | | | Bed Bath & Beyond, Inc. (a) | | | 8,979 | |
| | 298 | | | Gap, Inc. (The) | | | 9,259 | |
| | 308 | | | GNC Holdings, Inc., Class A | | | 10,244 | |
| | 220 | | | O'Reilly Automotive, Inc. (a) | | | 19,699 | |
| | 307 | | | PetSmart, Inc. | | | 20,967 | |
| | 388 | | | Sally Beauty Holdings, Inc. (a) | | | 9,138 | |
| | 508 | | | Urban Outfitters, Inc. (a) | | | 20,011 | |
| | | | | | | | |
| | | | | | | 98,297 | |
| | | | | | | | |
| | | | Textiles, Apparel & Luxury Goods — 2.9% | |
| | 394 | | | Michael Kors Holdings Ltd., (Hong Kong) (a) | | | 20,116 | |
| | 133 | | | V.F. Corp. | | | 20,109 | |
| | | | | | | | |
| | | | | | | 40,225 | |
| | | | | | | | |
| | | | Total Consumer Discretionary | | | 285,517 | |
| | | | | | | | |
| | | | Consumer Staples — 2.8% | |
| | | | Beverages — 0.9% | |
| | 231 | | | Monster Beverage Corp. (a) | | | 12,231 | |
| | | | | | | | |
| | | | Food Products — 1.5% | |
| | 174 | | | Mead Johnson Nutrition Co. | | | 11,491 | |
| | 603 | | | WhiteWave Foods Co., Class A (a) | | | 9,371 | |
| | | | | | | | |
| | | | | | | 20,862 | |
| | | | | | | | |
| | | | | | | | |
| SHARES | | | SECURITY DESCRIPTION | | VALUE($) | |
| | | | | | | | |
| | | | | | | | |
| | | | Personal Products — 0.4% | |
| | 173 | | | Herbalife Ltd., (Cayman Islands) | | | 5,685 | |
| | | | | | | | |
| | | | Total Consumer Staples | | | 38,778 | |
| | | | | | | | |
| | | | Energy — 5.2% | |
| | | | Energy Equipment & Services — 1.8% | |
| | 260 | | | Cameron International Corp. (a) | | | 14,706 | |
| | 190 | | | Oceaneering International, Inc. | | | 10,193 | |
| | | | | | | | |
| | | | | | | 24,899 | |
| | | | | | | | |
| | | | Oil, Gas & Consumable Fuels — 3.4% | |
| | 310 | | | Concho Resources, Inc. (a) | | | 24,933 | |
| | 424 | | | Laredo Petroleum Holdings, Inc. (a) | | | 7,691 | |
| | 228 | | | Range Resources Corp. | | | 14,294 | |
| | | | | | | | |
| | | | | | | 46,918 | |
| | | | | | | | |
| | | | Total Energy | | | 71,817 | |
| | | | | | | | |
| | | | Financials — 8.8% | |
| | | | Capital Markets — 3.3% | |
| | 813 | | | Blackstone Group LP (The) | | | 12,675 | |
| | 380 | | | Lazard Ltd., (Bermuda), Class A | | | 11,348 | |
| | 329 | | | T. Rowe Price Group, Inc. | | | 21,411 | |
| | | | | | | | |
| | | | | | | 45,434 | |
| | | | | | | | |
| | | | Commercial Banks — 2.2% | |
| | 166 | | | M&T Bank Corp. | | | 16,376 | |
| | 192 | | | Signature Bank (a) | | | 13,726 | |
| | | | | | | | |
| | | | | | | 30,102 | |
| | | | | | | | |
| | | | Diversified Financial Services — 1.6% | |
| | 430 | | | Moody's Corp. | | | 21,659 | |
| | | | | | | | |
| | | | Insurance — 0.9% | |
| | 361 | | | Axis Capital Holdings Ltd., (Bermuda) | | | 12,505 | |
| | | | | | | | |
| | | | Real Estate Investment Trusts (REITs) — 0.8% | |
| | 319 | | | Prologis, Inc. | | | 11,651 | |
| | | | | | | | |
| | | | Total Financials | | | 121,351 | |
| | | | | | | | |
| | | | Health Care — 15.0% | |
| | | | Biotechnology — 3.1% | |
| | 108 | | | Alexion Pharmaceuticals, Inc. (a) | | | 10,103 | |
| | 150 | | | Onyx Pharmaceuticals, Inc. (a) | | | 11,352 | |
| | 70 | | | Regeneron Pharmaceuticals, Inc. (a) | | | 11,975 | |
| | 226 | | | Vertex Pharmaceuticals, Inc. (a) | | | 9,487 | |
| | | | | | | | |
| | | | | | | 42,917 | |
| | | | | | | | |
| | | | Health Care Equipment & Supplies — 2.0% | |
| | 196 | | | Sirona Dental Systems, Inc. (a) | | | 12,621 | |
| | 399 | | | Thoratec Corp. (a) | | | 14,967 | |
| | | | | | | | |
| | | | | | | 27,588 | |
| | | | | | | | |
SEE NOTES TO FINANCIAL STATEMENTS.
| | | | | | |
| | | |
| 28 | | | | J.P. MORGAN MID CAP/MULTI-CAP FUNDS | | DECEMBER 31, 2012 |
| | | | | | | | |
| SHARES | | | SECURITY DESCRIPTION | | VALUE($) | |
| | | | | | | | |
| Common Stocks — Continued | |
| | | | Health Care Providers & Services — 3.5% | |
| | 640 | | | Brookdale Senior Living, Inc. (a) | | | 16,197 | |
| | 107 | | | DaVita HealthCare Partners, Inc. (a) | | | 11,815 | |
| | 270 | | | Health Net, Inc. (a) | | | 6,571 | |
| | 214 | | | Humana, Inc. | | | 14,709 | |
| | | | | | | | |
| | | | | | | 49,292 | |
| | | | | | | | |
| | | | Life Sciences Tools & Services — 3.1% | |
| | 525 | | | Agilent Technologies, Inc. | | | 21,479 | |
| | 652 | | | Bruker Corp. (a) | | | 9,961 | |
| | 197 | | | Illumina, Inc. (a) | | | 10,940 | |
| | | | | | | | |
| | | | | | | 42,380 | |
| | | | | | | | |
| | | | Pharmaceuticals — 3.3% | |
| | 99 | | | Perrigo Co. | | | 10,330 | |
| | 282 | | | Valeant Pharmaceuticals International, Inc., (Canada) (a) | | | 16,879 | |
| | 220 | | | Watson Pharmaceuticals, Inc. (a) | | | 18,946 | |
| | | | | | | | |
| | | | | | | 46,155 | |
| | | | | | | | |
| | | | Total Health Care | | | 208,332 | |
| | | | | | | | |
| | | | Industrials — 17.7% | |
| | | | Aerospace & Defense — 0.9% | |
| | 91 | | | TransDigm Group, Inc. | | | 12,341 | |
| | | | | | | | |
| | | | Building Products — 1.7% | | | | |
| | 189 | | | Armstrong World Industries, Inc. | | | 9,583 | |
| | 474 | | | Fortune Brands Home & Security, Inc. (a) | | | 13,862 | |
| | | | | | | | |
| | | | | | | 23,445 | |
| | | | | | | | |
| | | | Commercial Services & Supplies — 1.4% | |
| | 204 | | | Stericycle, Inc. (a) | | | 19,052 | |
| | | | | | | | |
| | | | Construction & Engineering — 1.2% | |
| | 291 | | | Fluor Corp. | | | 17,064 | |
| | | | | | | | |
| | | | Electrical Equipment — 2.4% | |
| | 172 | | | Acuity Brands, Inc. | | | 11,670 | |
| | 217 | | | Generac Holdings, Inc. | | | 7,442 | |
| | 173 | | | Rockwell Automation, Inc. | | | 14,530 | |
| | | | | | | | |
| | | | | | | 33,642 | |
| | | | | | | | |
| | | | Industrial Conglomerates — 1.7% | |
| | 398 | | | Carlisle Cos., Inc. | | | 23,381 | |
| | | | | | | | |
| | | | Machinery — 2.4% | |
| | 369 | | | Pall Corp. | | | 22,218 | |
| | 129 | | | Wabtec Corp. | | | 11,311 | |
| | | | | | | | |
| | | | | | | 33,529 | |
| | | | | | | | |
| | | | Professional Services — 0.8% | |
| | 369 | | | Nielsen Holdings N.V. (a) | | | 11,278 | |
| | | | | | | | |
| | | | | | | | |
| SHARES | | | SECURITY DESCRIPTION | | VALUE($) | |
| | | | | | | | |
| | | | | | | | |
| | | | Road & Rail — 2.8% | |
| | 161 | | | Canadian Pacific Railway Ltd., (Canada) | | | 16,371 | |
| | 370 | | | J.B. Hunt Transport Services, Inc. | | | 22,099 | |
| | | | | | | | |
| | | | | | | 38,470 | |
| | | | | | | | |
| | | | Trading Companies & Distributors — 2.4% | |
| | 388 | | | Air Lease Corp. (a) | | | 8,344 | |
| | 327 | | | MSC Industrial Direct Co., Inc., Class A | | | 24,664 | |
| | | | | | | | |
| | | | | | | 33,008 | |
| | | | | | | | |
| | | | Total Industrials | | | 245,210 | |
| | | | | | | | |
| | | | Information Technology — 22.2% | |
| | | | Communications Equipment — 2.3% | |
| | 457 | | | Aruba Networks, Inc. (a) | | | 9,487 | |
| | 177 | | | F5 Networks, Inc. (a) | | | 17,225 | |
| | 103 | | | Palo Alto Networks, Inc. (a) | | | 5,518 | |
| | | | | | | | |
| | | | | | | 32,230 | |
| | | | | | | | |
| | | | Computers & Peripherals — 0.6% | |
| | 357 | | | Fusion-io, Inc. (a) | | | 8,181 | |
| | | | | | | | |
| | | | Electronic Equipment, Instruments & Components — 1.2% | |
| | 265 | | | Amphenol Corp., Class A | | | 17,158 | |
| | | | | | | | |
| | | | Internet Software & Services — 2.8% | |
| | 98 | | | LinkedIn Corp., Class A (a) | | | 11,298 | |
| | 259 | | | OpenTable, Inc. (a) | | | 12,659 | |
| | 195 | | | Rackspace Hosting, Inc. (a) | | | 14,468 | |
| | | | | | | | |
| | | | | | | 38,425 | |
| | | | | | | | |
| | | | IT Services — 4.4% | |
| | 212 | | | Alliance Data Systems Corp. (a) | | | 30,646 | |
| | 352 | | | CoreLogic, Inc. (a) | | | 9,468 | |
| | 379 | | | FleetCor Technologies, Inc. (a) | | | 20,344 | |
| | | | | | | | |
| | | | | | | 60,458 | |
| | | | | | | | |
| | | | Semiconductors & Semiconductor Equipment — 4.5% | |
| | 650 | | | Avago Technologies Ltd., (Singapore) | | | 20,576 | |
| | 328 | | | KLA-Tencor Corp. | | | 15,670 | |
| | 351 | | | Microchip Technology, Inc. | | | 11,426 | |
| | 428 | | | Xilinx, Inc. | | | 15,347 | |
| | | | | | | | |
| | | | | | | 63,019 | |
| | | | | | | | |
| | | | Software — 6.4% | |
| | 177 | | | Citrix Systems, Inc. (a) | | | 11,651 | |
| | 116 | | | FactSet Research Systems, Inc. | | | 10,171 | |
| | 441 | | | Fortinet, Inc. (a) | | | 9,294 | |
| | 694 | | | Nuance Communications, Inc. (a) | | | 15,486 | |
| | 238 | | | Red Hat, Inc. (a) | | | 12,606 | |
| | 187 | | | SolarWinds, Inc. (a) | | | 9,813 | |
| | 222 | | | Splunk, Inc. (a) | | | 6,451 | |
SEE NOTES TO FINANCIAL STATEMENTS.
| | | | | | | | |
| | | |
| DECEMBER 31, 2012 | | J.P. MORGAN MID CAP/MULTI-CAP FUNDS | | | | | 29 | |
JPMorgan Mid Cap Growth Fund
SCHEDULE OF PORTFOLIO INVESTMENTS
AS OF DECEMBER 31, 2012 (Unaudited) (continued)
(Amounts in thousands)
| | | | | | | | |
| SHARES | | | SECURITY DESCRIPTION | | VALUE($) | |
| | | | | | | | |
| Common Stocks — Continued | |
| | | | Software — Continued | |
| | 395 | | | TIBCO Software, Inc. (a) | | | 8,696 | |
| | 83 | | | Workday, Inc., Class A (a) | | | 4,513 | |
| | | | | | | | |
| | | | | | | 88,681 | |
| | | | | | | | |
| | | | Total Information Technology | | | 308,152 | |
| | | | | | | | |
| | | | Materials — 6.3% | | | | |
| | | | Chemicals — 6.3% | | | | |
| | 312 | | | FMC Corp. | | | 18,276 | |
| | 177 | | | PPG Industries, Inc. | | | 23,984 | |
| | 214 | | | Sherwin-Williams Co. (The) | | | 32,856 | |
| | 183 | | | W.R. Grace & Co. (a) | | | 12,296 | |
| | | | | | | | |
| | | | Total Materials | | | 87,412 | |
| | | | | | | | |
| | | | Total Common Stocks
(Cost $1,086,855) | | | 1,366,569 | |
| | | | | | | | |
| | | | | | | | |
| SHARES | | | SECURITY DESCRIPTION | | VALUE($) | |
| | | | | | | | |
| Short-Term Investment — 1.0% | |
| | | | Investment Company — 1.0% | | | | |
| | 13,350 | | | JPMorgan Liquid Assets Money Market Fund, Institutional Class Shares,
0.100% (b) (l) (m)
(Cost $13,350) | | | 13,350 | |
| | | | | | | | |
| | | | Total Investments — 99.6%
(Cost $1,100,205) | | | 1,379,919 | |
| | | | Other Assets in Excess of
Liabilities — 0.4% | | | 5,781 | |
| | | | | | | | |
| | | | NET ASSETS — 100.0% | | $ | 1,385,700 | |
| | | | | | | | |
Percentages indicated are based on net assets.
SEE NOTES TO FINANCIAL STATEMENTS.
| | | | | | |
| | | |
| 30 | | | | J.P. MORGAN MID CAP/MULTI-CAP FUNDS | | DECEMBER 31, 2012 |
JPMorgan Mid Cap Value Fund
SCHEDULE OF PORTFOLIO INVESTMENTS
AS OF DECEMBER 31, 2012 (Unaudited)
(Amounts in thousands)
| | | | | | | | |
| SHARES | | | SECURITY DESCRIPTION | | VALUE($) | |
| | | | | | | | |
| | | | | | | | |
| Common Stocks — 95.9% | | | | |
| | | | Consumer Discretionary — 20.3% | | | | |
| | | | Distributors — 1.0% | | | | |
| | 1,591 | | | Genuine Parts Co. | | | 101,138 | |
| | | | | | | | |
| | | | Hotels, Restaurants & Leisure — 2.6% | | | | |
| | 1,305 | | | Darden Restaurants, Inc. | | | 58,820 | |
| | 2,956 | | | Marriott International, Inc., Class A | | | 110,182 | |
| | 1,264 | | | Yum! Brands, Inc. | | | 83,929 | |
| | | | | | | | |
| | | | | | | 252,931 | |
| | | | | | | | |
| | | | Household Durables — 1.5% | | | | |
| | 574 | | | Jarden Corp. (a) | | | 29,682 | |
| | 1,265 | | | Mohawk Industries, Inc. (a) | | | 114,421 | |
| | | | | | | | |
| | | | | | | 144,103 | |
| | | | | | | | |
| | | | Internet & Catalog Retail — 1.3% | | | | |
| | 1,214 | | | Expedia, Inc. | | | 74,596 | |
| | 1,154 | | | TripAdvisor, Inc. (a) | | | 48,438 | |
| | | | | | | | |
| | | | | | | 123,034 | |
| | | | | | | | |
| | | | Media — 3.1% | | | | |
| | 454 | | | AMC Networks, Inc., Class A (a) | | | 22,480 | |
| | 1,635 | | | Cablevision Systems Corp., Class A | | | 24,427 | |
| | 2,219 | | | CBS Corp. (Non-Voting), Class B | | | 84,422 | |
| | 2,612 | | | Clear Channel Outdoor Holdings, Inc.,
Class A (a) | | | 18,339 | |
| | 3,159 | | | DISH Network Corp., Class A | | | 114,996 | |
| | 1,574 | | | Gannett Co., Inc. | | | 28,355 | |
| | 42 | | | Washington Post Co. (The), Class B (c) | | | 15,408 | |
| | | | | | | | |
| | | | | | | 308,427 | |
| | | | | | | | |
| | | | Multiline Retail — 2.5% | | | | |
| | 1,691 | | | Family Dollar Stores, Inc. | | | 107,220 | |
| | 3,196 | | | Kohl's Corp. | | | 137,348 | |
| | | | | | | | |
| | | | | | | 244,568 | |
| | | | | | | | |
| | | | Specialty Retail — 6.7% | | | | |
| | 357 | | | AutoZone, Inc. (a) | | | 126,441 | |
| | 2,051 | | | Bed Bath & Beyond, Inc. (a) | | | 114,688 | |
| | 2,732 | | | Gap, Inc. (The) | | | 84,786 | |
| | 752 | | | PetSmart, Inc. | | | 51,364 | |
| | 1,323 | | | Tiffany & Co. | | | 75,888 | |
| | 2,129 | | | TJX Cos., Inc. | | | 90,375 | |
| | 2,570 | | | Williams-Sonoma, Inc. | | | 112,502 | |
| | | | | | | | |
| | | | | | | 656,044 | |
| | | | | | | | |
| | | | Textiles, Apparel & Luxury Goods — 1.6% | | | | |
| | 936 | | | PVH Corp. | | | 103,893 | |
| | 373 | | | V.F. Corp. | | | 56,274 | |
| | | | | | | | |
| | | | | | | 160,167 | |
| | | | | | | | |
| | | | Total Consumer Discretionary | | | 1,990,412 | |
| | | | | | | | |
| | | | | | | | |
| SHARES | | | SECURITY DESCRIPTION | | VALUE($) | |
| | | | | | | | |
| | | | | | | | |
| | | | | | | | |
| | | | | | | | |
| | | | Consumer Staples — 5.6% | | | | |
| | | | Beverages — 2.5% | | | | |
| | 1,841 | | | Beam, Inc. | | | 112,455 | |
| | 762 | | | Brown-Forman Corp., Class B | | | 48,212 | |
| | 1,927 | | | Dr. Pepper Snapple Group, Inc. | | | 85,124 | |
| | | | | | | | |
| | | | | | | 245,791 | |
| | | | | | | | |
| | | | Food Products — 2.0% | | | | |
| | 1,190 | | | Hershey Co. (The) | | | 85,955 | |
| | 402 | | | JM Smucker Co. (The) | | | 34,672 | |
| | 880 | | | Ralcorp Holdings, Inc. (a) | | | 78,859 | |
| | | | | | | | |
| | | | | | | 199,486 | |
| | | | | | | | |
| | | | Household Products — 1.1% | | | | |
| | 1,302 | | | Energizer Holdings, Inc. | | | 104,101 | |
| | | | | | | | |
| | | | Total Consumer Staples | | | 549,378 | |
| | | | | | | | |
| | | | Energy — 6.4% | | | | |
| | | | Oil, Gas & Consumable Fuels — 6.4% | | | | |
| | 1,669 | | | Devon Energy Corp. | | | 86,876 | |
| | 3,403 | | | Energen Corp. | | | 153,443 | |
| | 1,784 | | | EQT Corp. | | | 105,230 | |
| | 1,653 | | | Marathon Petroleum Corp. | | | 104,110 | |
| | 1,152 | | | PBF Energy, Inc. (a) | | | 33,451 | |
| | 2,385 | | | QEP Resources, Inc. | | | 72,202 | |
| | 2,102 | | | Williams Cos., Inc. (The) | | | 68,812 | |
| | | | | | | | |
| | | | Total Energy | | | 624,124 | |
| | | | | | | | |
| | | | Financials — 26.1% | | | | |
| | | | Capital Markets — 5.7% | | | | |
| | 2,458 | | | Ameriprise Financial, Inc. | | | 153,915 | |
| | 7,451 | | | Charles Schwab Corp. (The) | | | 107,000 | |
| | 3,996 | | | Invesco Ltd. | | | 104,258 | |
| | 1,735 | | | Northern Trust Corp. | | | 87,019 | |
| | 1,636 | | | T. Rowe Price Group, Inc. | | | 106,559 | |
| | | | | | | | |
| | | | | | | 558,751 | |
| | | | | | | | |
| | | | Commercial Banks — 6.1% | | | | |
| | 1,300 | | | City National Corp. | | | 64,379 | |
| | 834 | | | Cullen/Frost Bankers, Inc. | | | 45,269 | |
| | 8,240 | | | Fifth Third Bancorp | | | 125,172 | |
| | 1,198 | | | First Republic Bank | | | 39,280 | |
| | 5,837 | | | Huntington Bancshares, Inc. | | | 37,301 | |
| | 1,351 | | | M&T Bank Corp. | | | 133,074 | |
| | 3,402 | | | SunTrust Banks, Inc. | | | 96,444 | |
| | 2,497 | | | Zions Bancorp | | | 53,440 | |
| | | | | | | | |
| | | | | | | 594,359 | |
| | | | | | | | |
| | | | Insurance — 9.7% | | | | |
| | 325 | | | Alleghany Corp. (a) | | | 109,096 | |
SEE NOTES TO FINANCIAL STATEMENTS.
| | | | | | | | |
| | | |
| DECEMBER 31, 2012 | | J.P. MORGAN MID CAP/MULTI-CAP FUNDS | | | | | 31 | |
JPMorgan Mid Cap Value Fund
SCHEDULE OF PORTFOLIO INVESTMENTS
AS OF DECEMBER 31, 2012 (Unaudited) (continued)
(Amounts in thousands)
| | | | | | | | |
| SHARES | | | SECURITY DESCRIPTION | | VALUE($) | |
| | | | | | | | |
| | | | | | | | |
| Common Stocks — Continued | | | | |
| | | | Insurance — Continued | | | | |
| | 1,176 | | | Chubb Corp. (The) | | | 88,582 | |
| | 2,902 | | | Hartford Financial Services Group, Inc. | | | 65,110 | |
| | 4,193 | | | Loews Corp. | | | 170,864 | |
| | 4,345 | | | Marsh & McLennan Cos., Inc. | | | 149,777 | |
| | 5,370 | | | Old Republic International Corp. | | | 57,190 | |
| | 2,227 | | | OneBeacon Insurance Group Ltd., Class A | | | 30,955 | |
| | 3,714 | | | Unum Group | | | 77,334 | |
| | 2,619 | | | W.R. Berkley Corp. | | | 98,824 | |
| | 4,291 | | | XL Group plc, (Ireland) | | | 107,544 | |
| | | | | | | | |
| | | | | | | 955,276 | |
| | | | | | | | |
| | | | Real Estate Investment Trusts (REITs) — 2.9% | |
| | 2,572 | | | Annaly Capital Management, Inc. | | | 36,116 | |
| | 1,653 | | | HCP, Inc. | | | 74,683 | |
| | 1,822 | | | Regency Centers Corp. | | | 85,850 | |
| | 1,033 | | | Vornado Realty Trust | | | 82,683 | |
| | | | | | | | |
| | | | | | | 279,332 | |
| | | | | | | | |
| | | | Real Estate Management & Development — 0.7% | |
| | 4,277 | | | Brookfield Office Properties, Inc. | | | 72,760 | |
| | | | | | | | |
| | | | Thrifts & Mortgage Finance — 1.0% | | | | |
| | 2,512 | | | Capitol Federal Financial, Inc. | | | 29,370 | |
| | 5,936 | | | People's United Financial, Inc. | | | 71,766 | |
| | | | | | | | |
| | | | | | | 101,136 | |
| | | | | | | | |
| | | | Total Financials | | | 2,561,614 | |
| | | | | | | | |
| | | | Health Care — 3.9% | | | | |
| | | | Health Care Equipment & Supplies — 0.3% | | | | |
| | 946 | | | CareFusion Corp. (a) | | | 27,042 | |
| | | | | | | | |
| | | | Health Care Providers & Services — 3.6% | | | | |
| | 2,394 | | | AmerisourceBergen Corp. | | | 103,381 | |
| | 2,162 | | | Cigna Corp. | | | 115,575 | |
| | 813 | | | Henry Schein, Inc. (a) | | | 65,391 | |
| | 1,094 | | | Humana, Inc. | | | 75,091 | |
| | | | | | | | |
| | | | | | | 359,438 | |
| | | | | | | | |
| | | | Total Health Care | | | 386,480 | |
| | | | | | | | |
| | | | Industrials — 9.9% | | | | |
| | | | Aerospace & Defense — 0.6% | | | | |
| | 958 | | | Alliant Techsystems, Inc. | | | 59,367 | |
| | | | | | | | |
| | | | Building Products — 0.7% | | | | |
| | 2,519 | | | Fortune Brands Home & Security, Inc. (a) | | | 73,615 | |
| | | | | | | | |
| | | | Commercial Services & Supplies — 1.1% | | | | |
| | 3,594 | | | Republic Services, Inc. | | | 105,425 | |
| | | | | | | | |
| | | | Electrical Equipment — 2.1% | | | | |
| | 2,661 | | | AMETEK, Inc. | | | 99,962 | |
| | | | | | | | |
| SHARES | | | SECURITY DESCRIPTION | | VALUE($) | |
| | | | | | | | |
| | | | | | | | |
| | | | | | | | |
| | | | Electrical Equipment — Continued | | | | |
| | 1,477 | | | Regal-Beloit Corp. | | | 104,110 | |
| | | | | | | | |
| | | | | | | 204,072 | |
| | | | | | | | |
| | | | Industrial Conglomerates — 1.0% | | | | |
| | 1,642 | | | Carlisle Cos., Inc. | | | 96,492 | |
| | | | | | | | |
| | | | Machinery — 2.5% | | | | |
| | 1,923 | | | IDEX Corp. | | | 89,478 | |
| | 3,237 | | | Rexnord Corp. (a) | | | 68,953 | |
| | 1,125 | | | Snap-on, Inc. | | | 88,895 | |
| | | | | | | | |
| | | | | | | 247,326 | |
| | | | | | | | |
| | | | Professional Services — 0.8% | | | | |
| | 1,513 | | | Equifax, Inc. | | | 81,877 | |
| | | | | | | | |
| | | | Trading Companies & Distributors — 1.1% | | | | |
| | 1,424 | | | MSC Industrial Direct Co., Inc., Class A | | | 107,378 | |
| | | | | | | | |
| | | | Total Industrials | | | 975,552 | |
| | | | | | | | |
| | | | Information Technology — 7.0% | | | | |
| | | | Electronic Equipment, Instruments & Components — 2.5% | |
| | 2,037 | | | Amphenol Corp., Class A | | | 131,791 | |
| | 3,033 | | | Arrow Electronics, Inc. (a) | | | 115,495 | |
| | | | | | | | |
| | | | | | | 247,286 | |
| | | | | | | | |
| | | | IT Services — 1.2% | | | | |
| | 3,063 | | | Jack Henry & Associates, Inc. | | | 120,253 | |
| | | | | | | | |
| | | | Semiconductors & Semiconductor Equipment — 2.4% | |
| | 3,308 | | | Analog Devices, Inc. | | | 139,126 | |
| | 2,766 | | | Xilinx, Inc. | | | 99,313 | |
| | | | | | | | |
| | | | | | | 238,439 | |
| | | | | | | | |
| | | | Software — 0.9% | | | | |
| | 2,730 | | | Synopsys, Inc. (a) | | | 86,921 | |
| | | | | | | | |
| | | | Total Information Technology | | | 692,899 | |
| | | | | | | | |
| | | | Materials — 7.5% | | | | |
| | | | Chemicals — 4.0% | | | | |
| | 1,233 | | | Airgas, Inc. | | | 112,561 | |
| | 1,698 | | | Albemarle Corp. | | | 105,452 | |
| | 510 | | | Sherwin-Williams Co. (The) | | | 78,431 | |
| | 1,359 | | | Sigma-Aldrich Corp. | | | 99,980 | |
| | | | | | | | |
| | | | | | | 396,424 | |
| | | | | | | | |
| | | | Containers & Packaging — 3.5% | | | | |
| | 3,454 | | | Ball Corp. | | | 154,578 | |
| | 1,286 | | | Rock-Tenn Co., Class A | | | 89,915 | |
| | 2,339 | | | Silgan Holdings, Inc. | | | 97,273 | |
| | | | | | | | |
| | | | | | | 341,766 | |
| | | | | | | | |
| | | | Total Materials | | | 738,190 | |
| | | | | | | | |
SEE NOTES TO FINANCIAL STATEMENTS.
| | | | | | |
| | | |
| 32 | | | | J.P. MORGAN MID CAP/MULTI-CAP FUNDS | | DECEMBER 31, 2012 |
| | | | | | | | |
| SHARES | | | SECURITY DESCRIPTION | | VALUE($) | |
| | | | | | | | |
| | | | | | | | |
| Common Stocks — Continued | | | | |
| | | | Telecommunication Services — 0.4% | | | | |
| | | | Wireless Telecommunication Services — 0.4% | |
| | 1,685 | | | Telephone & Data Systems, Inc. | | | 37,301 | |
| | | | | | | | |
| | | | Utilities — 8.8% | | | | |
| | | | Electric Utilities — 3.0% | | | | |
| | 5,399 | | | NV Energy, Inc. | | | 97,932 | |
| | 3,423 | | | Westar Energy, Inc. | | | 97,980 | |
| | 3,926 | | | Xcel Energy, Inc. | | | 104,856 | |
| | | | | | | | |
| | | | | | | 300,768 | |
| | | | | | | | |
| | | | Gas Utilities — 0.8% | | | | |
| | 1,171 | | | ONEOK, Inc. | | | 50,074 | |
| | 1,268 | | | Questar Corp. | | | 25,052 | |
| | | | | | | | |
| | | | | | | 75,126 | |
| | | | | | | | |
| | | | Multi-Utilities — 5.0% | | | | |
| | 4,707 | | | CenterPoint Energy, Inc. | | | 90,618 | |
| | 4,364 | | | CMS Energy Corp. | | | 106,389 | |
| | 4,049 | | | NiSource, Inc. | | | 100,789 | |
| | 1,484 | | | Sempra Energy | | | 105,284 | |
| | 2,341 | | | Wisconsin Energy Corp. | | | 86,250 | |
| | | | | | | | |
| | | | | | | 489,330 | |
| | | | | | | | |
| | | | Total Utilities | | | 865,224 | |
| | | | | | | | |
| | | | Total Common Stocks
(Cost $7,320,401) | | | 9,421,174 | |
| | | | | | | | |
| | | | | | | | |
| SHARES | | | SECURITY DESCRIPTION | | VALUE($) | |
| Short-Term Investment — 5.1% | | | | |
| | | | Investment Company — 5.1% | | | | |
| | 502,110 | | | JPMorgan Prime Money Market Fund,
Institutional Class Shares,
0.080% (b) (l) (m)
(Cost $502,110) | | | 502,110 | |
| | | | | | | | |
| Investment of Cash Collateral for Securities on Loan — 0.0% (g) | |
| | | | Investment Company — 0.0% (g) | | | | |
| | 3,656 | | | JPMorgan Prime Money Market Fund,
Capital Shares, 0.110% (b) (l)
(Cost $3,656) | | | 3,656 | |
| | | | | | | | |
| | | | Total Investments — 101.0%
(Cost $7,826,167) | | | 9,926,940 | |
| | | | Liabilities in Excess of
Other Assets — (1.0)% | | | (99,277 | ) |
| | | | | | | | |
| | | | NET ASSETS — 100.0% | | $ | 9,827,663 | |
| | | | | | | | |
Percentages indicated are based on net assets.
SEE NOTES TO FINANCIAL STATEMENTS.
| | | | | | | | |
| | | |
| DECEMBER 31, 2012 | | J.P. MORGAN MID CAP/MULTI-CAP FUNDS | | | | | 33 | |
JPMorgan Multi-Cap Market Neutral Fund
SCHEDULE OF PORTFOLIO INVESTMENTS
AS OF DECEMBER 31, 2012 (Unaudited)
(Amounts in thousands)
| | | | | | | | |
| SHARES | | | SECURITY DESCRIPTION | | VALUE($) | |
| | | | | | | | |
| Long Positions — 101.3% (j) | |
| Common Stocks — 87.5% | |
| | | | Consumer Discretionary — 16.1% | |
| | | | Auto Components — 1.5% | | | | |
| | 63 | | | Cooper Tire & Rubber Co. | | | 1,599 | |
| | 103 | | | Dana Holding Corp. | | | 1,606 | |
| | 33 | | | Goodyear Tire & Rubber Co. (The) (a) | | | 457 | |
| | 34 | | | Lear Corp. | | | 1,604 | |
| | 36 | | | Tenneco, Inc. (a) | | | 1,280 | |
| | 18 | | | TRW Automotive Holdings Corp. (a) | | | 991 | |
| | | | | | | | |
| | | | | | | 7,537 | |
| | | | | | | | |
| | | | Automobiles — 1.0% | |
| | 113 | | | Ford Motor Co. | | | 1,463 | |
| | 63 | | | General Motors Co. (a) | | | 1,824 | |
| | 40 | | | Thor Industries, Inc. | | | 1,499 | |
| | | | | | | | |
| | | | | | | 4,786 | |
| | | | | | | | |
| | | | Diversified Consumer Services — 0.8% | |
| | 38 | | | Apollo Group, Inc., Class A (a) | | | 794 | |
| | 30 | | | Coinstar, Inc. (a) | | | 1,541 | |
| | 13 | | | H&R Block, Inc. | | | 250 | |
| | 24 | | | Weight Watchers International, Inc. | | | 1,260 | |
| | | | | | | | |
| | | | | | | 3,845 | |
| | | | | | | | |
| | | | Hotels, Restaurants & Leisure — 2.2% | |
| | 24 | | | Bally Technologies, Inc. (a) | | | 1,073 | |
| | 63 | | | Brinker International, Inc. | | | 1,953 | |
| | 22 | | | Cracker Barrel Old Country Store, Inc. | | | 1,382 | |
| | 71 | | | International Game Technology | | | 1,012 | |
| | 36 | | | Marriott International, Inc., Class A | | | 1,359 | |
| | 29 | | | Marriott Vacations Worldwide Corp. (a) | | | 1,224 | |
| | 16 | | | MGM Resorts International (a) | | | 186 | |
| | 61 | | | Texas Roadhouse, Inc. | | | 1,026 | |
| | 25 | | | Wyndham Worldwide Corp. | | | 1,312 | |
| | 1 | | | Wynn Resorts Ltd. | | | 163 | |
| | | | | | | | |
| | | | | | | 10,690 | |
| | | | | | | | |
| | | | Household Durables — 1.8% | |
| | 24 | | | D.R. Horton, Inc. | | | 485 | |
| | 26 | | | Garmin Ltd., (Switzerland) | | | 1,054 | |
| | 40 | | | Jarden Corp. (a) | | | 2,043 | |
| | 29 | | | MDC Holdings, Inc. | | | 1,056 | |
| | 48 | | | Newell Rubbermaid, Inc. | | | 1,062 | |
| | 105 | | | PulteGroup, Inc. (a) | | | 1,903 | |
| | 17 | | | Tempur-Pedic International, Inc. (a) | | | 546 | |
| | 6 | | | Whirlpool Corp. | | | 570 | |
| | | | | | | | |
| | | | | | | 8,719 | |
| | | | | | | | |
| | | | | | | | |
| SHARES | | | SECURITY DESCRIPTION | | VALUE($) | |
| | | | | | | | |
| | | | | | | | |
| | | | | | | | |
| | | | Internet & Catalog Retail — 0.8% | |
| | 26 | | | Expedia, Inc. | | | 1,590 | |
| | 48 | | | HomeAway, Inc. (a) | | | 1,053 | |
| | 67 | | | Liberty Interactive Corp., Series A, (a) | | | 1,310 | |
| | | | | | | | |
| | | | | | | 3,953 | |
| | | | | | | | |
| | | | Leisure Equipment & Products — 0.3% | |
| | 5 | | | Polaris Industries, Inc. | | | 441 | |
| | 25 | | | Sturm Ruger & Co., Inc. | | | 1,140 | |
| | | | | | | | |
| | | | | | | 1,581 | |
| | | | | | | | |
| | | | Media — 2.3% | |
| | 26 | | | AMC Networks, Inc., Class A (a) | | | 1,266 | |
| | 47 | | | Comcast Corp., Class A | | | 1,746 | |
| | 26 | | | DISH Network Corp., Class A | | | 953 | |
| | 51 | | | Gannett Co., Inc. | | | 924 | |
| | 36 | | | Lions Gate Entertainment Corp. (a) | | | 583 | |
| | 26 | | | Madison Square Garden Co. (The), Class A (a) | | | 1,160 | |
| | 21 | | | News Corp., Class A | | | 548 | |
| | 26 | | | Omnicom Group, Inc. | | | 1,285 | |
| | 22 | | | Scripps Networks Interactive, Inc., Class A | | | 1,291 | |
| | 52 | | | Valassis Communications, Inc. | | | 1,330 | |
| | | | | | | | |
| | | | | | | 11,086 | |
| | | | | | | | |
| | | | Multiline Retail — 0.1% | |
| | 14 | | | Macy's, Inc. | | | 547 | |
| | | | | | | | |
| | | | Specialty Retail — 4.3% | | | | |
| | 58 | | | American Eagle Outfitters, Inc. | | | 1,187 | |
| | 34 | | | ANN, Inc. (a) | | | 1,142 | |
| | 33 | | | Ascena Retail Group, Inc. (a) | | | 602 | |
| | 32 | | | AutoNation, Inc. (a) | | | 1,277 | |
| | 37 | | | Buckle, Inc. (The) | | | 1,664 | |
| | 43 | | | Chico's FAS, Inc. | | | 789 | |
| | 47 | | | Foot Locker, Inc. | | | 1,507 | |
| | 45 | | | Francesca's Holdings Corp. (a) | | | 1,174 | |
| | 55 | | | GameStop Corp., Class A | | | 1,378 | |
| | 37 | | | Gap, Inc. (The) | | | 1,163 | |
| | 17 | | | Genesco, Inc. (a) | | | 917 | |
| | 32 | | | GNC Holdings, Inc., Class A | | | 1,078 | |
| | 18 | | | Home Depot, Inc. (The) | | | 1,105 | |
| | 13 | | | O'Reilly Automotive, Inc. (a) | | | 1,165 | |
| | 39 | | | Penske Automotive Group, Inc. | | | 1,174 | |
| | 3 | | | PetSmart, Inc. | | | 206 | |
| | 13 | | | Ross Stores, Inc. | | | 685 | |
| | 43 | | | Select Comfort Corp. (a) | | | 1,119 | |
| | 66 | | | Staples, Inc. | | | 758 | |
SEE NOTES TO FINANCIAL STATEMENTS.
| | | | | | |
| | | |
| 34 | | | | J.P. MORGAN MID CAP/MULTI-CAP FUNDS | | DECEMBER 31, 2012 |
| | | | | | | | |
| SHARES | | | SECURITY DESCRIPTION | | VALUE($) | |
| | | | | | | | |
| Long Positions — Continued | |
| Common Stocks — Continued | |
| | | | Specialty Retail — Continued | |
| | 30 | | | TJX Cos., Inc. | | | 1,264 | |
| | | | | | | | |
| | | | | | | 21,354 | |
| | | | | | | | |
| | | | Textiles, Apparel & Luxury Goods — 1.0% | |
| | 27 | | | Carter's, Inc. (a) | | | 1,489 | |
| | 11 | | | Coach, Inc. | | | 632 | |
| | 33 | | | Hanesbrands, Inc. (a) | | | 1,174 | |
| | 96 | | | Jones Group, Inc. (The) | | | 1,064 | |
| | 22 | | | Vera Bradley, Inc. (a) | | | 561 | |
| | | | | | | | |
| | | | | | | 4,920 | |
| | | | | | | | |
| | | | Total Consumer Discretionary | | | 79,018 | |
| | | | | | | | |
| | | | Consumer Staples — 5.7% | |
| | | | Beverages — 0.6% | | | | |
| | 46 | | | Constellation Brands, Inc., Class A (a) | | | 1,621 | |
| | 35 | | | Molson Coors Brewing Co., Class B | | | 1,500 | |
| | | | | | | | |
| | | | | | | 3,121 | |
| | | | | | | | |
| | | | Food & Staples Retailing — 1.2% | |
| | 35 | | | CVS Caremark Corp. | | | 1,714 | |
| | 52 | | | Kroger Co. (The) | | | 1,356 | |
| | 1,035 | | | Rite Aid Corp. (a) | | | 1,408 | |
| | 80 | | | Safeway, Inc. | | | 1,440 | |
| | | | | | | | |
| | | | | | | 5,918 | |
| | | | | | | | |
| | | | Food Products — 2.3% | |
| | 36 | | | Archer-Daniels-Midland Co. | | | 974 | |
| | 98 | | | Dean Foods Co. (a) | | | 1,613 | |
| | 41 | | | Fresh Del Monte Produce, Inc. | | | 1,067 | |
| | 24 | | | Green Mountain Coffee Roasters, Inc. (a) | | | 1,009 | |
| | 18 | | | Ingredion, Inc. | | | 1,183 | |
| | 14 | | | JM Smucker Co. (The) | | | 1,240 | |
| | 22 | | | Sanderson Farms, Inc. | | | 1,066 | |
| | 83 | | | Smithfield Foods, Inc. (a) | | | 1,789 | |
| | 76 | | | Tyson Foods, Inc., Class A | | | 1,474 | |
| | | | | | | | |
| | | | | | | 11,415 | |
| | | | | | | | |
| | | | Household Products — 0.5% | |
| | 16 | | | Energizer Holdings, Inc. | | | 1,248 | |
| | 22 | | | Spectrum Brands Holdings, Inc. | | | 970 | |
| | | | | | | | |
| | | | | | | 2,218 | |
| | | | | | | | |
| | | | Personal Products — 0.5% | |
| | 31 | | | Herbalife Ltd., (Cayman Islands) | | | 1,027 | |
| | 33 | | | Nu Skin Enterprises, Inc., Class A | | | 1,240 | |
| | | | | | | | |
| | | | | | | 2,267 | |
| | | | | | | | |
| | | | | | | | |
| SHARES | | | SECURITY DESCRIPTION | | VALUE($) | |
| | | | | | | | |
| | | | | | | | |
| | | | | | | | |
| | | | Tobacco — 0.6% | |
| | 34 | | | Altria Group, Inc. | | | 1,083 | |
| | 8 | | | Lorillard, Inc. | | | 918 | |
| | 23 | | | Universal Corp. | | | 1,150 | |
| | | | | | | | |
| | | | | | | 3,151 | |
| | | | | | | | |
| | | | Total Consumer Staples | | | 28,090 | |
| | | | | | | | |
| | | | Energy — 6.7% | |
| | | | Energy Equipment & Services — 3.2% | |
| | 8 | | | Bristow Group, Inc. | | | 435 | |
| | 65 | | | C&J Energy Services, Inc. (a) | | | 1,402 | |
| | 25 | | | Ensco plc, (United Kingdom), Class A | | | 1,477 | |
| | 102 | | | Helix Energy Solutions Group, Inc. (a) | | | 2,101 | |
| | 108 | | | McDermott International, Inc. (a) | | | 1,192 | |
| | 65 | | | Nabors Industries Ltd., (Bermuda) (a) | | | 946 | |
| | 17 | | | Oil States International, Inc. (a) | | | 1,228 | |
| | 19 | | | Rowan Cos. plc, Class A (a) | | | 610 | |
| | 99 | | | RPC, Inc. | | | 1,216 | |
| | 62 | | | Superior Energy Services, Inc. (a) | | | 1,279 | |
| | 22 | | | Tidewater, Inc. | | | 977 | |
| | 24 | | | Transocean Ltd., (Switzerland) | | | 1,056 | |
| | 31 | | | Unit Corp. (a) | | | 1,401 | |
| | 58 | | | Weatherford International Ltd., (Switzerland) (a) | | | 646 | |
| | | | | | | | |
| | | | | | | 15,966 | |
| | | | | | | | |
| | | | Oil, Gas & Consumable Fuels — 3.5% | |
| | 12 | | | Cabot Oil & Gas Corp. | | | 576 | |
| | 4 | | | Chevron Corp. | | | 457 | |
| | 25 | | | ConocoPhillips | | | 1,433 | |
| | 44 | | | Delek U.S. Holdings, Inc. | | | 1,118 | |
| | 40 | | | Energy XXI Bermuda Ltd., (Bermuda) | | | 1,273 | |
| | 27 | | | HollyFrontier Corp. | | | 1,269 | |
| | 10 | | | Noble Energy, Inc. | | | 1,009 | |
| | 32 | | | Oasis Petroleum, Inc. (a) | | | 1,012 | |
| | 31 | | | Phillips 66 | | | 1,665 | |
| | 19 | | | Plains Exploration & Production Co. (a) | | | 889 | |
| | 25 | | | Rosetta Resources, Inc. (a) | | | 1,129 | |
| | 32 | | | Southwestern Energy Co. (a) | | | 1,074 | |
| | 48 | | | Stone Energy Corp. (a) | | | 977 | |
| | 20 | | | Tesoro Corp. | | | 863 | |
| | 18 | | | Valero Energy Corp. | | | 625 | |
| | 60 | | | Western Refining, Inc. | | | 1,686 | |
| | | | | | | | |
| | | | | | | 17,055 | |
| | | | | | | | |
| | | | Total Energy | | | 33,021 | |
| | | | | | | | |
SEE NOTES TO FINANCIAL STATEMENTS.
| | | | | | | | |
| | | |
| DECEMBER 31, 2012 | | J.P. MORGAN MID CAP/MULTI-CAP FUNDS | | | | | 35 | |
JPMorgan Multi-Cap Market Neutral Fund
SCHEDULE OF PORTFOLIO INVESTMENTS
AS OF DECEMBER 31, 2012 (Unaudited) (continued)
(Amounts in thousands)
| | | | | | | | |
| SHARES | | | SECURITY DESCRIPTION | | VALUE($) | |
| | | | | | | | |
| Long Positions — Continued | |
| Common Stocks — Continued | |
| | | | Financials — 12.6% | |
| | | | Capital Markets — 1.4% | |
| | 9 | | | Ameriprise Financial, Inc. | | | 589 | |
| | 73 | | | Ares Capital Corp. | | | 1,277 | |
| | 54 | | | Bank of New York Mellon Corp. (The) | | | 1,398 | |
| | 40 | | | Federated Investors, Inc., Class B | | | 799 | |
| | 9 | | | Goldman Sachs Group, Inc. (The) | | | 1,193 | |
| | 117 | | | Prospect Capital Corp. | | | 1,277 | |
| | 12 | | | State Street Corp. | | | 545 | |
| | | | | | | | |
| | | | | | | 7,078 | |
| | | | | | | | |
| | | | Commercial Banks — 2.7% | |
| | 69 | | | BancorpSouth, Inc. | | | 1,001 | |
| | 14 | | | BB&T Corp. | | | 414 | |
| | 67 | | | East West Bancorp, Inc. | | | 1,431 | |
| | 69 | | | Fifth Third Bancorp | | | 1,051 | |
| | 25 | | | First Republic Bank | | | 831 | |
| | 242 | | | Huntington Bancshares, Inc. | | | 1,543 | |
| | 61 | | | KeyCorp | | | 513 | |
| | 92 | | | Regions Financial Corp. | | | 659 | |
| | 35 | | | SunTrust Banks, Inc. | | | 993 | |
| | 27 | | | Texas Capital Bancshares, Inc. (a) | | | 1,212 | |
| | 57 | | | U.S. Bancorp | | | 1,810 | |
| | 45 | | | Wells Fargo & Co. | | | 1,554 | |
| | | | | | | | |
| | | | | | | 13,012 | |
| | | | | | | | |
| | | | Consumer Finance — 0.8% | |
| | 31 | | | Discover Financial Services | | | 1,208 | |
| | 42 | | | Ezcorp, Inc., Class A (a) | | | 835 | |
| | 97 | | | SLM Corp. | | | 1,661 | |
| | | | | | | | |
| | | | | | | 3,704 | |
| | | | | | | | |
| | | | Diversified Financial Services — 0.9% | |
| | 31 | | | CBOE Holdings, Inc. | | | 907 | |
| | 36 | | | Citigroup, Inc. | | | 1,424 | |
| | 15 | | | Moody's Corp. | | | 750 | |
| | 59 | | | PHH Corp. (a) | | | 1,349 | |
| | | | | | | | |
| | | | | | | 4,430 | |
| | | | | | | | |
| | | | Insurance — 5.9% | |
| | 32 | | | Aflac, Inc. | | | 1,712 | |
| | 18 | | | Allied World Assurance Co. Holdings AG, (Switzerland) | | | 1,381 | |
| | 42 | | | Allstate Corp. (The) | | | 1,693 | |
| | 23 | | | American International Group, Inc. (a) | | | 816 | |
| | 36 | | | Aspen Insurance Holdings Ltd., (Bermuda) | | | 1,153 | |
| | 44 | | | Assurant, Inc. | | | 1,523 | |
| | 88 | | | Assured Guaranty Ltd., (Bermuda) | | | 1,258 | |
| | | | | | | | |
| SHARES | | | SECURITY DESCRIPTION | | VALUE($) | |
| | | | | | | | |
| | | | | | | | |
| | | | | | | | |
| | | | Insurance — Continued | | | | |
| | 3 | | | CNA Financial Corp. | | | 89 | |
| | 10 | | | Everest Re Group Ltd., (Bermuda) | | | 1,139 | |
| | 42 | | | Fidelity National Financial, Inc., Class A | | | 982 | |
| | 45 | | | First American Financial Corp. | | | 1,088 | |
| | 70 | | | Genworth Financial, Inc., Class A (a) | | | 523 | |
| | 83 | | | Hartford Financial Services Group, Inc. | | | 1,852 | |
| | 11 | | | HCC Insurance Holdings, Inc. | | | 425 | |
| | 72 | | | Lincoln National Corp. | | | 1,874 | |
| | 34 | | | MetLife, Inc. | | | 1,106 | |
| | 52 | | | Montpelier Re Holdings Ltd., (Bermuda) | | | 1,197 | |
| | 18 | | | PartnerRe Ltd., (Bermuda) | | | 1,460 | |
| | 26 | | | Platinum Underwriters Holdings Ltd., (Bermuda) | | | 1,175 | |
| | 15 | | | Primerica, Inc. | | | 461 | |
| | 65 | | | Protective Life Corp. | | | 1,856 | |
| | 10 | | | Prudential Financial, Inc. | | | 555 | |
| | 7 | | | Reinsurance Group of America, Inc. | | | 391 | |
| | 15 | | | RenaissanceRe Holdings Ltd., (Bermuda) | | | 1,215 | |
| | 9 | | | Torchmark Corp. | | | 481 | |
| | 16 | | | Travelers Cos., Inc. (The) | | | 1,168 | |
| | 14 | | | Unum Group | | | 292 | |
| | | | | | | | |
| | | | | | | 28,865 | |
| | | | | | | | |
| | | | Real Estate Investment Trusts (REITs) — 0.6% | |
| | 20 | | | Corporate Office Properties Trust | | | 490 | |
| | 29 | | | General Growth Properties, Inc. | | | 585 | |
| | 15 | | | Highwoods Properties, Inc. | | | 505 | |
| | 6 | | | Mid-America Apartment Communities, Inc. | | | 403 | |
| | 9 | | | Post Properties, Inc. | | | 449 | |
| | 3 | | | SL Green Realty Corp. | | | 226 | |
| | 18 | | | Weingarten Realty Investors | | | 481 | |
| | | | | | | | |
| | | | | | | 3,139 | |
| | | | | | | | |
| | | | Thrifts & Mortgage Finance — 0.3% | | | | |
| | 45 | | | Ocwen Financial Corp. (a) | | | 1,558 | |
| | | | | | | | |
| | | | Total Financials | | | 61,786 | |
| | | | | | | | |
| | | | Health Care — 8.3% | | | | |
| | | | Biotechnology — 1.2% | | | | |
| | 15 | | | Amgen, Inc. | | | 1,271 | |
| | 17 | | | Cubist Pharmaceuticals, Inc. (a) | | | 700 | |
| | 7 | | | Gilead Sciences, Inc. (a) | | | 543 | |
| | 64 | | | Isis Pharmaceuticals, Inc. (a) | | | 671 | |
| | 6 | | | Onyx Pharmaceuticals, Inc. (a) | | | 470 | |
| | 35 | | | United Therapeutics Corp. (a) | | | 1,858 | |
| | 14 | | | Vertex Pharmaceuticals, Inc. (a) | | | 591 | |
| | | | | | | | |
| | | | | | | 6,104 | |
| | | | | | | | |
SEE NOTES TO FINANCIAL STATEMENTS.
| | | | | | |
| | | |
| 36 | | | | J.P. MORGAN MID CAP/MULTI-CAP FUNDS | | DECEMBER 31, 2012 |
| | | | | | | | |
| SHARES | | | SECURITY DESCRIPTION | | VALUE($) | |
| | | | | | | | |
| Long Positions — Continued | |
| Common Stocks — Continued | |
| | | | Health Care Equipment & Supplies — 1.7% | | | | |
| | 4 | | | Abbott Laboratories | | | 238 | |
| | 51 | | | Alere, Inc. (a) | | | 937 | |
| | 8 | | | Becton, Dickinson & Co. | | | 594 | |
| | 93 | | | Boston Scientific Corp. (a) | | | 534 | |
| | 19 | | | CareFusion Corp. (a) | | | 544 | |
| | 12 | | | Cyberonics, Inc. (a) | | | 642 | |
| | 9 | | | Integra LifeSciences Holdings Corp. (a) | | | 341 | |
| | 23 | | | Medtronic, Inc. | | | 953 | |
| | 48 | | | ResMed, Inc. | | | 1,999 | |
| | 28 | | | St. Jude Medical, Inc. | | | 1,012 | |
| | 11 | | | Thoratec Corp. (a) | | | 426 | |
| | | | | | | | |
| | | | | | | 8,220 | |
| | | | | | | | |
| | | | Health Care Providers & Services — 3.2% | |
| | 34 | | | Aetna, Inc. | | | 1,554 | |
| | 29 | | | Air Methods Corp. | | | 1,075 | |
| | 20 | | | AmerisourceBergen Corp. | | | 848 | |
| | 23 | | | Centene Corp. (a) | | | 960 | |
| | 33 | | | Cigna Corp. | | | 1,759 | |
| | 34 | | | Community Health Systems, Inc. | | | 1,037 | |
| | 48 | | | HCA Holdings, Inc. | | | 1,447 | |
| | 43 | | | HealthSouth Corp. (a) | | | 900 | |
| | 7 | | | Humana, Inc. | | | 447 | |
| | 35 | | | Molina Healthcare, Inc. (a) | | | 948 | |
| | 59 | | | Omnicare, Inc. | | | 2,112 | |
| | 22 | | | UnitedHealth Group, Inc. | | | 1,214 | |
| | 19 | | | WellPoint, Inc. | | | 1,170 | |
| | | | | | | | |
| | | | | | | 15,471 | |
| | | | | | | | |
| | | | Life Sciences Tools & Services — 0.4% | |
| | 28 | | | Charles River Laboratories International, Inc. (a) | | | 1,055 | |
| | 34 | | | PAREXEL International Corp. (a) | | | 994 | |
| | | | | | | | |
| | | | | | | 2,049 | |
| | | | | | | | |
| | | | Pharmaceuticals — 1.8% | |
| | 44 | | | Endo Health Solutions, Inc. (a) | | | 1,151 | |
| | 56 | | | Impax Laboratories, Inc. (a) | | | 1,141 | |
| | 43 | | | Mylan, Inc. (a) | | | 1,194 | |
| | 48 | | | Questcor Pharmaceuticals, Inc. | | | 1,279 | |
| | 25 | | | Salix Pharmaceuticals Ltd. (a) | | | 1,002 | |
| | 108 | | | Warner Chilcott plc, (Ireland), Class A | | | 1,298 | |
| | 21 | | | Watson Pharmaceuticals, Inc. (a) | | | 1,806 | |
| | | | | | | | |
| | | | | | | 8,871 | |
| | | | | | | | |
| | | | Total Health Care | | | 40,715 | |
| | | | | | | | |
| | | | | | | | |
| SHARES | | | SECURITY DESCRIPTION | | VALUE($) | |
| | | | | | | | |
| | | | | | | | |
| | | | Industrials — 12.0% | | | | |
| | | | Aerospace & Defense — 3.4% | |
| | 26 | | | Alliant Techsystems, Inc. | | | 1,618 | |
| | 19 | | | Boeing Co. (The) | | | 1,445 | |
| | 18 | | | Esterline Technologies Corp. (a) | | | 1,151 | |
| | 17 | | | General Dynamics Corp. | | | 1,171 | |
| | 27 | | | Huntington Ingalls Industries, Inc. | | | 1,157 | |
| | 23 | | | L-3 Communications Holdings, Inc. | | | 1,759 | |
| | 22 | | | Lockheed Martin Corp. | | | 2,048 | |
| | 17 | | | Northrop Grumman Corp. | | | 1,128 | |
| | 22 | | | Raytheon Co. | | | 1,274 | |
| | 81 | | | Textron, Inc. | | | 2,016 | |
| | 13 | | | TransDigm Group, Inc. | | | 1,716 | |
| | | | | | | | |
| | | | | | | 16,483 | |
| | | | | | | | |
| | | | Air Freight & Logistics — 0.3% | |
| | 25 | | | Atlas Air Worldwide Holdings, Inc. (a) | | | 1,102 | |
| | 3 | | | United Parcel Service, Inc., Class B | | | 223 | |
| | | | | | | | |
| | | | | | | 1,325 | |
| | | | | | | | |
| | | | Airlines — 0.7% | |
| | 7 | | | Alaska Air Group, Inc. (a) | | | 284 | |
| | 122 | | | Delta Air Lines, Inc. (a) | | | 1,451 | |
| | 2 | | | Spirit Airlines, Inc. (a) | | | 38 | |
| | 130 | | | U.S. Airways Group, Inc. (a) | | | 1,752 | |
| | | | | | | | |
| | | | | | | 3,525 | |
| | | | | | | | |
| | | | Commercial Services & Supplies — 0.9% | |
| | 44 | | | Avery Dennison Corp. | | | 1,527 | |
| | 24 | | | Copart, Inc. (a) | | | 711 | |
| | 99 | | | Pitney Bowes, Inc. | | | 1,058 | |
| | 125 | | | R.R. Donnelley & Sons Co. | | | 1,122 | |
| | | | | | | | |
| | | | | | | 4,418 | |
| | | | | | | | |
| | | | Construction & Engineering — 1.8% | |
| | 71 | | | AECOM Technology Corp. (a) | | | 1,689 | |
| | 44 | | | Chicago Bridge & Iron Co. N.V., (Netherlands) | | | 2,017 | |
| | 36 | | | EMCOR Group, Inc. | | | 1,254 | |
| | 20 | | | Fluor Corp. | | | 1,183 | |
| | 42 | | | MasTec, Inc. (a) | | | 1,051 | |
| | 44 | | | URS Corp. | | | 1,717 | |
| | | | | | | | |
| | | | | | | 8,911 | |
| | | | | | | | |
| | | | Electrical Equipment — 0.7% | |
| | 17 | | | Belden, Inc. | | | 751 | |
| | 13 | | | Brady Corp., Class A | | | 442 | |
| | 36 | | | EnerSys, Inc. (a) | | | 1,365 | |
| | 33 | | | General Cable Corp. (a) | | | 1,015 | |
| | | | | | | | |
| | | | | | | 3,573 | |
| | | | | | | | |
SEE NOTES TO FINANCIAL STATEMENTS.
| | | | | | | | |
| | | |
| DECEMBER 31, 2012 | | J.P. MORGAN MID CAP/MULTI-CAP FUNDS | | | | | 37 | |
JPMorgan Multi-Cap Market Neutral Fund
SCHEDULE OF PORTFOLIO INVESTMENTS
AS OF DECEMBER 31, 2012 (Unaudited) (continued)
(Amounts in thousands)
| | | | | | | | |
| SHARES | | | SECURITY DESCRIPTION | | VALUE($) | |
| | | | | | | | |
| Long Positions — Continued | |
| Common Stocks — Continued | |
| | | | Industrial Conglomerates — 0.2% | |
| | 53 | | | General Electric Co. | | | 1,113 | |
| | | | | | | | |
| | | | Machinery — 1.8% | |
| | 37 | | | Actuant Corp., Class A | | | 1,037 | |
| | 27 | | | AGCO Corp. (a) | | | 1,326 | |
| | 9 | | | Middleby Corp. (a) | | | 1,119 | |
| | 69 | | | Terex Corp. (a) | | | 1,942 | |
| | 67 | | | Titan International, Inc. | | | 1,463 | |
| | 9 | | | Toro Co. (The) | | | 372 | |
| | 43 | | | Trinity Industries, Inc. | | | 1,525 | |
| | | | | | | | |
| | | | | | | 8,784 | |
| | | | | | | | |
| | | | Professional Services — 0.2% | |
| | 25 | | | Corporate Executive Board Co. (The) | | | 1,166 | |
| | | | | | | | |
| | | | Road & Rail — 1.5% | |
| | 68 | | | Avis Budget Group, Inc. (a) | | | 1,356 | |
| | 46 | | | Con-way, Inc. | | | 1,271 | |
| | 15 | | | CSX Corp. | | | 300 | |
| | 42 | | | Hertz Global Holdings, Inc. (a) | | | 682 | |
| | 8 | | | J.B. Hunt Transport Services, Inc. | | | 506 | |
| | 20 | | | Landstar System, Inc. | | | 1,035 | |
| | 17 | | | Old Dominion Freight Line, Inc. (a) | | | 585 | |
| | 12 | | | Union Pacific Corp. | | | 1,519 | |
| | | | | | | | |
| | | | | | | 7,254 | |
| | | | | | | | |
| | | | Trading Companies & Distributors — 0.5% | |
| | 37 | | | TAL International Group, Inc. | | | 1,341 | |
| | 22 | | | United Rentals, Inc. (a) | | | 1,010 | |
| | | | | | | | |
| | | | | | | 2,351 | |
| | | | | | | | |
| | | | Total Industrials | | | 58,903 | |
| | | | | | | | |
| | | | Information Technology — 15.1% | | | | |
| | | | Communications Equipment — 1.4% | |
| | 88 | | | Arris Group, Inc. (a) | | | 1,314 | |
| | 76 | | | Ciena Corp. (a) | | | 1,197 | |
| | 87 | | | Cisco Systems, Inc. | | | 1,712 | |
| | 34 | | | Harris Corp. | | | 1,648 | |
| | 30 | | | Plantronics, Inc. | | | 1,105 | |
| | | | | | | | |
| | | | | | | 6,976 | |
| | | | | | | | |
| | | | Computers & Peripherals — 1.4% | |
| | 3 | | | Apple, Inc. | | | 1,525 | |
| | 21 | | | Diebold, Inc. | | | 639 | |
| | 48 | | | Fusion-io, Inc. (a) | | | 1,108 | |
| | 34 | | | Lexmark International, Inc., Class A | | | 781 | |
| | 45 | | | Seagate Technology plc, (Ireland) | | | 1,370 | |
| | 35 | | | Western Digital Corp. | | | 1,488 | |
| | | | | | | | |
| | | | | | | 6,911 | |
| | | | | | | | |
| | | | | | | | |
| SHARES | | | SECURITY DESCRIPTION | | VALUE($) | |
| | | | | | | | |
| | | | | | | | |
| | | | | | | | |
| | | | Electronic Equipment, Instruments & Components — 1.4% | |
| | 43 | | | Corning, Inc. | | | 543 | |
| | 259 | | | Flextronics International Ltd., | | | | |
| | | | (Singapore) (a) | | | 1,612 | |
| | 68 | | | Ingram Micro, Inc., Class A (a) | | | 1,149 | |
| | 77 | | | Jabil Circuit, Inc. | | | 1,488 | |
| | 16 | | | OSI Systems, Inc. (a) | | | 1,030 | |
| | 32 | | | SYNNEX Corp. (a) | | | 1,113 | |
| | | | | | | | |
| | | | | | | 6,935 | |
| | | | | | | | |
| | | | Internet Software & Services — 1.4% | |
| | 16 | | | Akamai Technologies, Inc. (a) | | | 664 | |
| | 7 | | | Equinix, Inc. (a) | | | 1,392 | |
| | 2 | | | Google, Inc., Class A (a) | | | 1,170 | |
| | 37 | | | IAC/InterActiveCorp. | | | 1,733 | |
| | 4 | | | LinkedIn Corp., Class A (a) | | | 451 | |
| | 33 | | | Sohu.com, Inc., (China) (a) | | | 1,555 | |
| | 8 | | | ValueClick, Inc. (a) | | | 162 | |
| | | | | | | | |
| | | | | | | 7,127 | |
| | | | | | | | |
| | | | IT Services — 4.0% | |
| | 24 | | | Accenture plc, (Ireland), Class A | | | 1,595 | |
| | 12 | | | Alliance Data Systems Corp. (a) | | | 1,670 | |
| | 10 | | | Amdocs Ltd. | | | 356 | |
| | 48 | | | Broadridge Financial Solutions, Inc. | | | 1,103 | |
| | 29 | | | CACI International, Inc., Class A (a) | | | 1,601 | |
| | 28 | | | Computer Sciences Corp. | | | 1,128 | |
| | 73 | | | Convergys Corp. | | | 1,197 | |
| | 34 | | | Fidelity National Information Services, Inc. | | | 1,188 | |
| | 31 | | | Gartner, Inc. (a) | | | 1,411 | |
| | 27 | | | Global Payments, Inc. | | | 1,205 | |
| | 21 | | | Heartland Payment Systems, Inc. | | | 616 | |
| | 5 | | | International Business Machines Corp. | | | 864 | |
| | 58 | | | Lender Processing Services, Inc. | | | 1,416 | |
| | 37 | | | NeuStar, Inc., Class A (a) | | | 1,570 | |
| | 131 | | | SAIC, Inc. | | | 1,487 | |
| | 74 | | | Western Union Co. (The) | | | 1,008 | |
| | | | | | | | |
| | | | | | | 19,415 | |
| | | | | | | | |
| | | | Office Electronics — 0.2% | |
| | 119 | | | Xerox Corp. | | | 813 | |
| | | | | | | | |
| | | | Semiconductors & Semiconductor Equipment — 2.6% | |
| | 68 | | | Applied Materials, Inc. | | | 783 | |
| | 13 | | | Cree, Inc. (a) | | | 454 | |
| | 126 | | | Cypress Semiconductor Corp. (a) | | | 1,368 | |
| | 120 | | | Entegris, Inc. (a) | | | 1,103 | |
SEE NOTES TO FINANCIAL STATEMENTS.
| | | | | | |
| | | |
| 38 | | | | J.P. MORGAN MID CAP/MULTI-CAP FUNDS | | DECEMBER 31, 2012 |
| | | | | | | | |
| SHARES | | | SECURITY DESCRIPTION | | VALUE($) | |
| | | | | | | | |
| Long Positions — Continued | |
| Common Stocks — Continued | |
| | | | Semiconductors & Semiconductor Equipment — Continued | |
| | 57 | | | Intel Corp. | | | 1,172 | |
| | 28 | | | KLA-Tencor Corp. | | | 1,349 | |
| | 144 | | | LSI Corp. (a) | | | 1,021 | |
| | 139 | | | Marvell Technology Group Ltd., (Bermuda) | | | 1,006 | |
| | 240 | | | Micron Technology, Inc. (a) | | | 1,525 | |
| | 103 | | | NVIDIA Corp. | | | 1,271 | |
| | 94 | | | Teradyne, Inc. (a) | | | 1,581 | |
| | | | | | | | |
| | | | | | | 12,633 | |
| | | | | | | | |
| | | | Software — 2.7% | |
| | 62 | | | Activision Blizzard, Inc. | | | 659 | |
| | 20 | | | BMC Software, Inc. (a) | | | 778 | |
| | 71 | | | CA, Inc. | | | 1,567 | |
| | 134 | | | Cadence Design Systems, Inc. (a) | | | 1,809 | |
| | 60 | | | Electronic Arts, Inc. (a) | | | 875 | |
| | 26 | | | Fair Isaac Corp. | | | 1,082 | |
| | 55 | | | Microsoft Corp. | | | 1,478 | |
| | 30 | | | Oracle Corp. | | | 993 | |
| | 51 | | | Rovi Corp. (a) | | | 787 | |
| | 101 | | | Symantec Corp. (a) | | | 1,901 | |
| | 13 | | | Synopsys, Inc. (a) | | | 405 | |
| | 19 | | | Tyler Technologies, Inc. (a) | | | 937 | |
| | | | | | | | |
| | | | | | | 13,271 | |
| | | | | | | | |
| | | | Total Information Technology | | | 74,081 | |
| | | | | | | | |
| | | | Materials — 5.8% | | | | |
| | | | Chemicals — 2.1% | |
| | 26 | | | Cabot Corp. | | | 1,052 | |
| | 10 | | | CF Industries Holdings, Inc. | | | 1,933 | |
| | 14 | | | Cytec Industries, Inc. | | | 976 | |
| | 37 | | | H.B. Fuller Co. | | | 1,279 | |
| | 105 | | | Huntsman Corp. | | | 1,669 | |
| | 5 | | | NewMarket Corp. | | | 1,330 | |
| | 6 | | | Sherwin-Williams Co. (The) | | | 898 | |
| | 16 | | | Valspar Corp. | | | 970 | |
| | | | | | | | |
| | | | | | | 10,107 | |
| | | | | | | | |
| | | | Construction Materials — 0.5% | |
| | 42 | | | Eagle Materials, Inc. | | | 2,474 | |
| | | | | | | | |
| | | | Containers & Packaging — 0.8% | |
| | 26 | | | Ball Corp. | | | 1,155 | |
| | 10 | | | Bemis Co., Inc. | | | 342 | |
| | 27 | | | Greif, Inc., Class A | | | 1,221 | |
| | 54 | | | Owens-Illinois, Inc. (a) | | | 1,143 | |
| | | | | | | | |
| | | | | | | 3,861 | |
| | | | | | | | |
| | | | | | | | |
| SHARES | | | SECURITY DESCRIPTION | | VALUE($) | |
| | | | | | | | |
| | | | | | | | |
| | | | | | | | |
| | | | Metals & Mining — 2.1% | |
| | 31 | | | Freeport-McMoRan Copper & Gold, Inc. | | | 1,046 | |
| | 19 | | | Kaiser Aluminum Corp. | | | 1,161 | |
| | 30 | | | Newmont Mining Corp. | | | 1,385 | |
| | 20 | | | Reliance Steel & Aluminum Co. | | | 1,248 | |
| | 33 | | | Southern Copper Corp. | | | 1,268 | |
| | 87 | | | Steel Dynamics, Inc. | | | 1,193 | |
| | 27 | | | SunCoke Energy, Inc. (a) | | | 423 | |
| | 53 | | | United States Steel Corp. | | | 1,270 | |
| | 52 | | | Worthington Industries, Inc. | | | 1,353 | |
| | | | | | | | |
| | | | | | | 10,347 | |
| | | | | | | | |
| | | | Paper & Forest Products — 0.3% | |
| | 2 | | | Domtar Corp., (Canada) | | | 204 | |
| | 32 | | | Schweitzer-Mauduit International, Inc. | | | 1,231 | |
| | | | | | | | |
| | | | | | | 1,435 | |
| | | | | | | | |
| | | | Total Materials | | | 28,224 | |
| | | | | | | | |
| | | | Telecommunication Services — 0.6% | |
| | | | Diversified Telecommunication Services — 0.2% | |
| | 236 | | | Frontier Communications Corp. | | | 1,012 | |
| | 3 | | | Verizon Communications, Inc. | | | 138 | |
| | | | | | | | |
| | | | | | | 1,150 | |
| | | | | | | | |
| | | | Wireless Telecommunication Services — 0.4% | |
| | 67 | | | MetroPCS Communications, Inc. (a) | | | 664 | |
| | 14 | | | SBA Communications Corp., Class A (a) | | | 1,020 | |
| | | | | | | | |
| | | | | | | 1,684 | |
| | | | | | | | |
| | | | Total Telecommunication Services | | | 2,834 | |
| | | | | | | | |
| | | | Utilities — 4.6% | |
| | | | Electric Utilities — 1.6% | |
| | 24 | | | Entergy Corp. | | | 1,557 | |
| | 39 | | | Hawaiian Electric Industries, Inc. | | | 971 | |
| | 10 | | | IDACORP, Inc. | | | 426 | |
| | 78 | | | NV Energy, Inc. | | | 1,409 | |
| | 78 | | | Portland General Electric Co. | | | 2,136 | |
| | 34 | | | PPL Corp. | | | 963 | |
| | 20 | | | Xcel Energy, Inc. | | | 546 | |
| | | | | | | | |
| | | | | | | 8,008 | |
| | | | | | | | |
| | | | Gas Utilities — 0.8% | |
| | 29 | | | AGL Resources, Inc. | | | 1,157 | |
| | 7 | | | ONEOK, Inc. | | | 307 | |
| | 55 | | | Questar Corp. | | | 1,090 | |
| | 39 | | | UGI Corp. | | | 1,263 | |
| | | | | | | | |
| | | | | | | 3,817 | |
| | | | | | | | |
SEE NOTES TO FINANCIAL STATEMENTS.
| | | | | | | | |
| | | |
| DECEMBER 31, 2012 | | J.P. MORGAN MID CAP/MULTI-CAP FUNDS | | | | | 39 | |
JPMorgan Multi-Cap Market Neutral Fund
SCHEDULE OF PORTFOLIO INVESTMENTS
AS OF DECEMBER 31, 2012 (Unaudited) (continued)
(Amounts in thousands)
| | | | | | | | |
| SHARES | | | SECURITY DESCRIPTION | | VALUE($) | |
| | | | | | | | |
| | | | | | | | |
| Long Positions — Continued | | | | |
| Common Stocks — Continued | |
| | | | Independent Power Producers & Energy Traders — 0.3% | |
| | 133 | | | AES Corp. (The) | | | 1,421 | |
| | | | | | | | |
| | | | Multi-Utilities — 1.4% | | | | |
| | 18 | | | Ameren Corp. | | | 553 | |
| | 27 | | | Black Hills Corp. | | | 994 | |
| | 95 | | | CMS Energy Corp. | | | 2,319 | |
| | 10 | | | DTE Energy Co. | | | 578 | |
| | 33 | | | PG&E Corp. | | | 1,317 | |
| | 33 | | | Vectren Corp. | | | 978 | |
| | | | | | | | |
| | | | | | | 6,739 | |
| | | | | | | | |
| | | | Water Utilities — 0.5% | | | | |
| | 38 | | | American Water Works Co., Inc. | | | 1,429 | |
| | 39 | | | Aqua America, Inc. | | | 994 | |
| | | | | | | | |
| | | | | | | 2,423 | |
| | | | | | | | |
| | | | Total Utilities | | | 22,408 | |
| | | | | | | | |
| | | | Total Common Stocks
(Cost $381,656) | | | 429,080 | |
| | | | | | | | |
| Short-Term Investment — 13.8% | |
| | | | Investment Company — 13.8% | | | | |
| | 67,497 | | | JPMorgan Liquid Assets Money Market Fund,
Institutional Class Shares,
0.100% (b) (l)
(Cost $67,497) | | | 67,497 | |
| | | | | | | | |
| | | | Total Investments — 101.3%
(Cost $449,153) | | | 496,577 | |
| | | | Liabilities in Excess of
Other Assets — (1.3)% | | | (6,399 | ) |
| | | | | | | | |
| | | | NET ASSETS — 100.0% | | $ | 490,178 | |
| | | | | | | | |
| Short Positions — 88.5% | |
| Common Stocks — 88.5% | |
| | | | Consumer Discretionary — 14.4% | | | | |
| | | | Auto Components — 1.3% | | | | |
| | 19 | | | BorgWarner, Inc. (a) | | | 1,345 | |
| | 90 | | | Gentex Corp. | | | 1,691 | |
| | 60 | | | Johnson Controls, Inc. | | | 1,854 | |
| | 25 | | | Visteon Corp. (a) | | | 1,335 | |
| | | | | | | | |
| | | | | | | 6,225 | |
| | | | | | | | |
| | | | Automobiles — 0.3% | | | | |
| | 27 | | | Harley-Davidson, Inc. | | | 1,303 | |
| | | | | | | | |
| | | | Distributors — 0.1% | | | | |
| | 25 | | | LKQ Corp. (a) | | | 525 | |
| | | | | | | | |
| | | | | | | | |
| | | | Diversified Consumer Services — 0.8% | | | | |
| | 38 | | | DeVry, Inc. | | | 912 | |
| | | | | | | | |
| SHARES | | | SECURITY DESCRIPTION | | VALUE($) | |
| | | | | | | | |
| | | | | | | | |
| | | | | | | | |
| | | | Diversified Consumer Services — Continued | | | | |
| | 78 | | | Regis Corp. | | | 1,312 | |
| | 48 | | | Sotheby's | | | 1,604 | |
| | | | | | | | |
| | | | | | | 3,828 | |
| | | | | | | | |
| | | | Hotels, Restaurants & Leisure — 2.8% | | | | |
| | 36 | | | BJ's Restaurants, Inc. (a) | | | 1,199 | |
| | 44 | | | Carnival Corp. | | | 1,601 | |
| | 5 | | | Chipotle Mexican Grill, Inc. (a) | | | 1,478 | |
| | 21 | | | Hyatt Hotels Corp., Class A (a) | | | 810 | |
| | 31 | | | Jack in the Box, Inc. (a) | | | 883 | |
| | 20 | | | Las Vegas Sands Corp. | | | 923 | |
| | 13 | | | McDonald's Corp. | | | 1,107 | |
| | 37 | | | Royal Caribbean Cruises Ltd. | | | 1,252 | |
| | 25 | | | Starbucks Corp. | | | 1,350 | |
| | 25 | | | Vail Resorts, Inc. | | | 1,376 | |
| | 134 | | | Wendy's Co. (The) | | | 629 | |
| | 64 | | | WMS Industries, Inc. (a) | | | 1,125 | |
| | | | | | | | |
| | | | | | | 13,733 | |
| | | | | | | | |
| | | | Household Durables — 1.2% | | | | |
| | 87 | | | KB Home | | | 1,376 | |
| | 39 | | | Meritage Homes Corp. (a) | | | 1,440 | |
| | 15 | | | Mohawk Industries, Inc. (a) | | | 1,326 | |
| | 2 | | | NVR, Inc. (a) | | | 1,638 | |
| | | | | | | | |
| | | | | | | 5,780 | |
| | | | | | | | |
| | | | Internet & Catalog Retail — 0.3% | | | | |
| | 33 | | | TripAdvisor, Inc. (a) | | | 1,376 | |
| | | | | | | | |
| | | | Leisure Equipment & Products — 0.2% | | | | |
| | 35 | | | Mattel, Inc. | | | 1,285 | |
| | | | | | | | |
| | | | Media — 2.4% | | | | |
| | 14 | | | Discovery Communications, Inc., Class A (a) | | | 903 | |
| | 61 | | | DreamWorks Animation SKG, Inc., Class A (a) | | | 1,006 | |
| | 80 | | | Interpublic Group of Cos., Inc. (The) | | | 878 | |
| | 13 | | | John Wiley & Sons, Inc., Class A | | | 509 | |
| | 30 | | | Lamar Advertising Co., Class A (a) | | | 1,143 | |
| | 18 | | | Liberty Global, Inc., Class A (a) | | | 1,127 | |
| | 17 | | | Liberty Media Corp. - Liberty Capital, Class A (a) | | | 1,926 | |
| | 83 | | | Live Nation Entertainment, Inc. (a) | | | 771 | |
| | 95 | | | New York Times Co. (The), Class A (a) | | | 812 | |
| | 165 | | | Pandora Media, Inc. (a) | | | 1,514 | |
| | | | | | | | |
| | 509 | | | Sirius XM Radio, Inc. | | | 1,471 | |
| | | | | | | | |
| | | | | | | 12,060 | |
| | | | | | | | |
SEE NOTES TO FINANCIAL STATEMENTS.
| | | | | | |
| | | |
| 40 | | | | J.P. MORGAN MID CAP/MULTI-CAP FUNDS | | DECEMBER 31, 2012 |
| | | | | | | | |
| SHARES | | | SECURITY DESCRIPTION | | VALUE($) | |
| | | | | | | | |
| Short Positions — Continued | | | | |
| Common Stocks — Continued | |
| | | | Multiline Retail — 0.3% | | | | |
| | 1 | | | Family Dollar Stores, Inc. | | | 66 | |
| | 71 | | | J.C. Penney Co., Inc. | | | 1,409 | |
| | | | | | | | |
| | | | | | | 1,475 | |
| | | | | | | | |
| | | | Specialty Retail — 3.1% | | | | |
| | 14 | | | Advance Auto Parts, Inc. | | | 982 | |
| | 39 | | | CarMax, Inc. (a) | | | 1,463 | |
| | 19 | | | DSW, Inc., Class A | | | 1,262 | |
| | 11 | | | Group 1 Automotive, Inc. | | | 672 | |
| | 28 | | | Jos. A. Bank Clothiers, Inc. (a) | | | 1,179 | |
| | 42 | | | Men's Wearhouse, Inc. (The) | | | 1,307 | |
| | 41 | | | Monro Muffler Brake, Inc. | | | 1,418 | |
| | 27 | | | Sally Beauty Holdings, Inc. (a) | | | 635 | |
| | 36 | | | Signet Jewelers Ltd., (Bermuda) | | | 1,931 | |
| | 27 | | | Tiffany & Co. | | | 1,566 | |
| | 17 | | | Tractor Supply Co. | | | 1,474 | |
| | 13 | | | Ulta Salon Cosmetics & Fragrance, Inc. | | | 1,296 | |
| | | | | | | | |
| | | | | | | 15,185 | |
| | | | | | | | |
| | | | Textiles, Apparel & Luxury Goods — 1.6% | | | | |
| | 23 | | | Columbia Sportswear Co. | | | 1,248 | |
| | 106 | | | Fifth & Pacific Cos., Inc. (a) | | | 1,320 | |
| | 27 | | | NIKE, Inc., Class B | | | 1,400 | |
| | 8 | | | Ralph Lauren Corp. | | | 1,269 | |
| | 23 | | | Under Armour, Inc., Class A (a) | | | 1,100 | |
| | 41 | | | Wolverine World Wide, Inc. | | | 1,674 | |
| | | | | | | | |
| | | | | | | 8,011 | |
| | | | | | | | |
| | | | Total Consumer Discretionary | | | 70,786 | |
| | | | | | | | |
| | | | Consumer Staples — 4.9% | | | | |
| | | | Beverages — 0.8% | | | | |
| | 24 | | | Brown-Forman Corp., Class B | | | 1,541 | |
| | 28 | | | Coca-Cola Co. (The) | | | 1,005 | |
| | 25 | | | Monster Beverage Corp. (a) | | | 1,313 | |
| | | | | | | | |
| | | | | | | 3,859 | |
| | | | | | | | |
| | | | Food & Staples Retailing — 0.9% | | | | |
| | 15 | | | Pricesmart, Inc. | | | 1,187 | |
| | 33 | | | United Natural Foods, Inc. (a) | | | 1,752 | |
| | 13 | | | Whole Foods Market, Inc. | | | 1,158 | |
| | | | | | | | |
| | | | | | | 4,097 | |
| | | | | | | | |
| | | | Food Products — 2.3% | | | | |
| | 15 | | | B&G Foods, Inc. | | | 433 | |
| | 88 | | | Darling International, Inc. (a) | | | 1,411 | |
| | 89 | | | Dole Food Co., Inc. (a) | | | 1,021 | |
| | 78 | | | Flowers Foods, Inc. | | | 1,813 | |
| | | | | | | | |
| SHARES | | | SECURITY DESCRIPTION | | VALUE($) | |
| | | | | | | | |
| | | | | | | | |
| | | | | | | | |
| | | | | | | | |
| | | | Food Products — Continued | | | | |
| | 16 | | | Hershey Co. (The) | | | 1,162 | |
| | 31 | | | Hormel Foods Corp. | | | 976 | |
| | 5 | | | Kraft Foods Group, Inc. | | | 217 | |
| | 26 | | | McCormick & Co., Inc. (Non-Voting) | | | 1,629 | |
| | 21 | | | Mead Johnson Nutrition Co. | | | 1,372 | |
| | 8 | | | Mondelez International, Inc., Class A | | | 209 | |
| | 23 | | | TreeHouse Foods, Inc. (a) | | | 1,198 | |
| | | | | | | | |
| | | | | | | 11,441 | |
| | | | | | | | |
| | | | Household Products — 0.4% | | | | |
| | 15 | | | Clorox Co. (The) | | | 1,094 | |
| | 11 | | | Procter & Gamble Co. (The) | | | 743 | |
| | | | | | | | |
| | | | | | | 1,837 | |
| | | | | | | | |
| | | | Personal Products — 0.5% | | | | |
| | 26 | | | Elizabeth Arden, Inc. (a) | | | 1,166 | |
| | 24 | | | Estee Lauder Cos., Inc. (The), Class A | | | 1,453 | |
| | | | | | | | |
| | | | | | | 2,619 | |
| | | | | | | | |
| | | | Total Consumer Staples | | | 23,853 | |
| | | | | | | | |
| | | | Energy — 8.6% | | | | |
| | | | Energy Equipment & Services — 2.4% | | | | |
| | 36 | | | Baker Hughes, Inc. | | | 1,450 | |
| | 3 | | | Core Laboratories N.V., (Netherlands) | | | 274 | |
| | 24 | | | Dresser-Rand Group, Inc. (a) | | | 1,370 | |
| | 23 | | | Dril-Quip, Inc. (a) | | | 1,702 | |
| | 25 | | | Exterran Holdings, Inc. (a) | | | 537 | |
| | 31 | | | FMC Technologies, Inc. (a) | | | 1,309 | |
| | 42 | | | Forum Energy Technologies, Inc. (a) | | | 1,034 | |
| | 194 | | | Key Energy Services, Inc. (a) | | | 1,345 | |
| | 26 | | | Lufkin Industries, Inc. | | | 1,503 | |
| | 44 | | | Noble Corp., (Switzerland) | | | 1,532 | |
| | | | | | | | |
| | | | | | | 12,056 | |
| | | | | | | | |
| | | | Oil, Gas & Consumable Fuels — 6.2% | | | | |
| | 126 | | | Alpha Natural Resources, Inc. (a) | | | 1,229 | |
| | 19 | | | Anadarko Petroleum Corp. | | | 1,396 | |
| | 49 | | | Approach Resources, Inc. (a) | | | 1,226 | |
| | 10 | | | Berry Petroleum Co., Class A | | | 351 | |
| | 86 | | | Cheniere Energy, Inc. (a) | | | 1,620 | |
| | 28 | | | Cimarex Energy Co. | | | 1,635 | |
| | 42 | | | Cobalt International Energy, Inc. (a) | | | 1,032 | |
| | 45 | | | CONSOL Energy, Inc. | | | 1,448 | |
| | 9 | | | Continental Resources, Inc. (a) | | | 648 | |
| | 24 | | | EQT Corp. | | | 1,435 | |
| | 29 | | | Golar LNG Ltd., (Bermuda) | | | 1,073 | |
SEE NOTES TO FINANCIAL STATEMENTS.
| | | | | | | | |
| | | |
| DECEMBER 31, 2012 | | J.P. MORGAN MID CAP/MULTI-CAP FUNDS | | | | | 41 | |
JPMorgan Multi-Cap Market Neutral Fund
SCHEDULE OF PORTFOLIO INVESTMENTS
AS OF DECEMBER 31, 2012 (Unaudited) (continued)
(Amounts in thousands)
| | | | | | | | |
| SHARES | | | SECURITY DESCRIPTION | | VALUE($) | |
| | | | | | | | |
| | | | | | | | |
| Short Positions — Continued | | | | |
| Common Stocks — Continued | |
| | | | Oil, Gas & Consumable Fuels — Continued | | | | |
| | 56 | | | Gulfport Energy Corp. (a) | | | 2,152 | |
| | 43 | | | Kinder Morgan, Inc. | | | 1,503 | |
| | 51 | | | Kodiak Oil & Gas Corp. (a) | | | 455 | |
| | 39 | | | Marathon Oil Corp. | | | 1,185 | |
| | 8 | | | Murphy Oil Corp. | | | 467 | |
| | 21 | | | QEP Resources, Inc. | | | 651 | |
| | 18 | | | Range Resources Corp. | | | 1,122 | |
| | 35 | | | SemGroup Corp., Class A (a) | | | 1,367 | |
| | 27 | | | SM Energy Co. | | | 1,434 | |
| | 53 | | | Spectra Energy Corp. | | | 1,460 | |
| | 27 | | | Targa Resources Corp. | | | 1,408 | |
| | 56 | | | Teekay Corp., (Bermuda) | | | 1,784 | |
| | 21 | | | World Fuel Services Corp. | | | 882 | |
| | 83 | | | WPX Energy, Inc. (a) | | | 1,235 | |
| | | | | | | | |
| | | | | | | 30,198 | |
| | | | | | | | |
| | | | Total Energy | | | 42,254 | |
| | | | | | | | |
| | | | Financials — 11.9% | | | | |
| | | | Capital Markets — 3.3% | | | | |
| | 168 | | | E*TRADE Financial Corp. (a) | | | 1,499 | |
| | 34 | | | Greenhill & Co., Inc. | | | 1,751 | |
| | 65 | | | Invesco Ltd. | | | 1,700 | |
| | 140 | | | Janus Capital Group, Inc. | | | 1,193 | |
| | 57 | | | Lazard Ltd., (Bermuda), Class A | | | 1,696 | |
| | 62 | | | Legg Mason, Inc. | | | 1,584 | |
| | 46 | | | LPL Financial Holdings, Inc. | | | 1,307 | |
| | 74 | | | Morgan Stanley | | | 1,411 | |
| | 27 | | | Northern Trust Corp. | | | 1,366 | |
| | 62 | | | SEI Investments Co. | | | 1,439 | |
| | 61 | | | TD Ameritrade Holding Corp. | | | 1,029 | |
| | | | | | | | |
| | | | | | | 15,975 | |
| | | | | | | | |
| | | | Commercial Banks — 3.8% | | | | |
| | 43 | | | Commerce Bancshares, Inc. | | | 1,518 | |
| | 185 | | | First Horizon National Corp. | | | 1,837 | |
| | 163 | | | First Niagara Financial Group, Inc. | | | 1,291 | |
| | 4 | | | FNB Corp. | | | 43 | |
| | 43 | | | Hancock Holding Co. | | | 1,357 | |
| | 28 | | | Iberiabank Corp. | | | 1,391 | |
| | 60 | | | Popular, Inc. (a) | | | 1,251 | |
| | 24 | | | Signature Bank (a) | | | 1,745 | |
| | 25 | | | SVB Financial Group (a) | | | 1,396 | |
| | 674 | | | Synovus Financial Corp. | | | 1,650 | |
| | 147 | | | TCF Financial Corp. | | | 1,788 | |
| | 14 | | | UMB Financial Corp. | | | 605 | |
| | 28 | | | United Bankshares, Inc. | | | 682 | |
| | | | | | | | |
| SHARES | | | SECURITY DESCRIPTION | | VALUE($) | |
| | | | | | | | |
| | | | | | | | |
| | | | | | | | |
| | | | | | | | |
| | | | Commercial Banks — Continued | | | | |
| | 106 | | | Valley National Bancorp | | | 990 | |
| | 56 | | | Zions Bancorp | | | 1,205 | |
| | | | | | | | |
| | | | | | | 18,749 | |
| | | | | | | | |
| | | | Diversified Financial Services — 1.3% | | | | |
| | 26 | | | CME Group, Inc. | | | 1,332 | |
| | 10 | | | IntercontinentalExchange, Inc. (a) | | | 1,241 | |
| | 39 | | | MarketAxess Holdings, Inc. | | | 1,390 | |
| | 26 | | | NASDAQ OMX Group, Inc. (The) | | | 640 | |
| | 56 | | | NYSE Euronext | | | 1,754 | |
| | | | | | | | |
| | | | | | | 6,357 | |
| | | | | | | | |
| | | | Insurance — 1.9% | | | | |
| | 29 | | | Cincinnati Financial Corp. | | | 1,130 | |
| | 33 | | | Endurance Specialty Holdings Ltd., (Bermuda) | | | 1,292 | |
| | 3 | | | Markel Corp. (a) | | | 1,506 | |
| | 14 | | | Marsh & McLennan Cos., Inc. | | | 477 | |
| | 31 | | | Mercury General Corp. | | | 1,237 | |
| | 162 | | | Old Republic International Corp. | | | 1,724 | |
| | 64 | | | Progressive Corp. (The) | | | 1,344 | |
| | 13 | | | XL Group plc, (Ireland) | | | 328 | |
| | | | | | | | |
| | | | | | | 9,038 | |
| | | | | | | | |
| | | | Real Estate Investment Trusts (REITs) — 0.9% | |
| | 11 | | | BRE Properties, Inc. | | | 551 | |
| | 12 | | | Colonial Properties Trust | | | 250 | |
| | 44 | | | First Industrial Realty Trust, Inc. (a) | | | 614 | |
| | 14 | | | Kilroy Realty Corp. | | | 659 | |
| | 17 | | | Kimco Realty Corp. | | | 327 | |
| | 30 | | | Ryman Hospitality Properties | | | 1,173 | |
| | 43 | | | Weyerhaeuser Co. | | | 1,205 | |
| | | | | | | | |
| | | | | | | 4,779 | |
| | | | | | | | |
| | | | Thrifts & Mortgage Finance — 0.7% | | | | |
| | 100 | | | Astoria Financial Corp. | | | 934 | |
| | 120 | | | Capitol Federal Financial, Inc. | | | 1,407 | |
| | 106 | | | People's United Financial, Inc. | | | 1,284 | |
| | | | | | | | |
| | | | | | | 3,625 | |
| | | | | | | | |
| | | | Total Financials | | | 58,523 | |
| | | | | | | | |
| | | | Health Care — 9.3% | | | | |
| | | | Biotechnology — 0.9% | | | | |
| | 43 | | | Alkermes plc, (Ireland) (a) | | | 793 | |
| | 58 | | | Ariad Pharmaceuticals, Inc. (a) | | | 1,105 | |
| | 12 | | | BioMarin Pharmaceutical, Inc. (a) | | | 577 | |
| | 16 | | | Cepheid, Inc. (a) | | | 541 | |
SEE NOTES TO FINANCIAL STATEMENTS.
| | | | | | |
| | | |
| 42 | | | | J.P. MORGAN MID CAP/MULTI-CAP FUNDS | | DECEMBER 31, 2012 |
| | | | | | | | |
| SHARES | | | SECURITY DESCRIPTION | | VALUE($) | |
| | | | | | | | |
| Short Positions — Continued | |
| Common Stocks — Continued | |
| | | | Biotechnology — Continued | |
| | 19 | | | Medivation, Inc. (a) | | | 997 | |
| | 19 | | | Myriad Genetics, Inc. (a) | | | 525 | |
| | | | | | | | |
| | | | | | | 4,538 | |
| | | | | | | | |
| | | | Health Care Equipment & Supplies — 2.6% | |
| | 32 | | | Align Technology, Inc. (a) | | | 897 | |
| | 6 | | | Cooper Cos., Inc. (The) | | | 511 | |
| | 24 | | | DENTSPLY International, Inc. | | | 951 | |
| | 1 | | | Edwards Lifesciences Corp. (a) | | | 129 | |
| | 45 | | | Haemonetics Corp. (a) | | | 1,855 | |
| | 20 | | | HeartWare International, Inc. (a) | | | 1,651 | |
| | 39 | | | Hill-Rom Holdings, Inc. | | | 1,115 | |
| | 44 | | | Hologic, Inc. (a) | | | 875 | |
| | 14 | | | IDEXX Laboratories, Inc. (a) | | | 1,267 | |
| | 2 | | | Intuitive Surgical, Inc. (a) | | | 919 | |
| | 19 | | | Sirona Dental Systems, Inc. (a) | | | 1,213 | |
| | 54 | | | Volcano Corp. (a) | | | 1,285 | |
| | | | | | | | |
| | | | | | | 12,668 | |
| | | | | | | | |
| | | | Health Care Providers & Services — 2.5% | |
| | 99 | | | Accretive Health, Inc. (a) | | | 1,140 | |
| | 75 | | | Brookdale Senior Living, Inc. (a) | | | 1,897 | |
| | 28 | | | Cardinal Health, Inc. | | | 1,164 | |
| | 12 | | | Chemed Corp. | | | 850 | |
| | 7 | | | Henry Schein, Inc. (a) | | | 594 | |
| | 52 | | | HMS Holdings Corp. (a) | | | 1,351 | |
| | 29 | | | LifePoint Hospitals, Inc. (a) | | | 1,101 | |
| | 47 | | | Owens & Minor, Inc. | | | 1,342 | |
| | 6 | | | Quest Diagnostics, Inc. | | | 324 | |
| | 60 | | | VCA Antech, Inc. (a) | | | 1,260 | |
| | 23 | | | WellCare Health Plans, Inc. (a) | | | 1,104 | |
| | | | | | | | |
| | | | | | | 12,127 | |
| | | | | | | | |
| | | | Health Care Technology — 0.5% | |
| | 59 | | | Allscripts Healthcare Solutions, Inc. (a) | | | 558 | |
| | 10 | | | athenahealth, Inc. (a) | | | 742 | |
| | 63 | | | Quality Systems, Inc. | | | 1,092 | |
| | | | | | | | |
| | | | | | | 2,392 | |
| | | | | | | | |
| | | | Life Sciences Tools & Services — 1.2% | |
| | 33 | | | Agilent Technologies, Inc. | | | 1,343 | |
| | 11 | | | Bio-Rad Laboratories, Inc., Class A (a) | | | 1,140 | |
| | 21 | | | Covance, Inc. (a) | | | 1,232 | |
| | 61 | | | QIAGEN N.V., (Netherlands) (a) | | | 1,101 | |
| | 16 | | | Techne Corp. | | | 1,090 | |
| | | | | | | | |
| | | | | | | 5,906 | |
| | | | | | | | |
| | | | | | | | |
| SHARES | | | SECURITY DESCRIPTION | | VALUE($) | |
| | | | | | | | |
| | | | | | | | |
| | | | | | | | |
| | | | Pharmaceuticals — 1.6% | |
| | 54 | | | Akorn, Inc. (a) | | | 718 | |
| | 12 | | | Allergan, Inc. | | | 1,059 | |
| | 40 | | | Auxilium Pharmaceuticals, Inc. (a) | | | 748 | |
| | 46 | | | Bristol-Myers Squibb Co. | | | 1,496 | |
| | 43 | | | Forest Laboratories, Inc. (a) | | | 1,502 | |
| | 13 | | | Perrigo Co. | | | 1,360 | |
| | 19 | | | Pfizer, Inc. | | | 483 | |
| | 18 | | | ViroPharma, Inc. (a) | | | 402 | |
| | | | | | | | |
| | | | | | | 7,768 | |
| | | | | | | | |
| | | | Total Health Care | | | 45,399 | |
| | | | | | | | |
| | | | Industrials — 13.7% | | | | |
| | | | Aerospace & Defense — 1.5% | | | | |
| | 36 | | | Curtiss-Wright Corp. | | | 1,184 | |
| | 63 | | | Hexcel Corp. (a) | | | 1,688 | |
| | 10 | | | Precision Castparts Corp. | | | 1,934 | |
| | 19 | | | Teledyne Technologies, Inc. (a) | | | 1,261 | |
| | 14 | | | United Technologies Corp. | | | 1,151 | |
| | | | | | | | |
| | | | | | | 7,218 | |
| | | | | | | | |
| | | | Airlines — 0.2% | | | | |
| | 54 | | | United Continental Holdings, Inc. (a) | | | 1,262 | |
| | | | | | | | |
| | | | Building Products — 1.7% | | | | |
| | 25 | | | Armstrong World Industries, Inc. | | | 1,277 | |
| | 44 | | | Fortune Brands Home & Security, Inc. (a) | | | 1,290 | |
| | 75 | | | Masco Corp. | | | 1,250 | |
| | 48 | | | Owens Corning (a) | | | 1,775 | |
| | 44 | | | Simpson Manufacturing Co., Inc. | | | 1,456 | |
| | 44 | | | USG Corp. (a) | | | 1,226 | |
| | | | | | | | |
| | | | | | | 8,274 | |
| | | | | | | | |
| | | | Commercial Services & Supplies — 2.0% | | | | |
| | 20 | | | ADT Corp. (The) | | | 909 | |
| | 27 | | | Clean Harbors, Inc. (a) | | | 1,490 | |
| | 23 | | | Iron Mountain, Inc. | | | 719 | |
| | 46 | | | Republic Services, Inc. | | | 1,357 | |
| | 48 | | | Rollins, Inc. | | | 1,061 | |
| | 12 | | | Stericycle, Inc. (a) | | | 1,159 | |
| | 50 | | | Waste Connections, Inc. | | | 1,689 | |
| | 47 | | | Waste Management, Inc. | | | 1,570 | |
| | | | | | | | |
| | | | | | | 9,954 | |
| | | | | | | | |
| | | | Construction & Engineering — 0.3% | | | | |
| | 26 | | | Foster Wheeler AG, (Switzerland) (a) | | | 627 | |
| | 18 | | | Jacobs Engineering Group, Inc. (a) | | | 779 | |
| | | | | | | | |
| | | | | | | 1,406 | |
| | | | | | | | |
SEE NOTES TO FINANCIAL STATEMENTS.
| | | | | | | | |
| | | |
| DECEMBER 31, 2012 | | J.P. MORGAN MID CAP/MULTI-CAP FUNDS | | | | | 43 | |
JPMorgan Multi-Cap Market Neutral Fund
SCHEDULE OF PORTFOLIO INVESTMENTS
AS OF DECEMBER 31, 2012 (Unaudited) (continued)
(Amounts in thousands)
| | | | | | | | |
| SHARES | | | SECURITY DESCRIPTION | | VALUE($) | |
| | | | | | | | |
| Short Positions — Continued | |
| Common Stocks — Continued | |
| | | | Electrical Equipment — 0.8% | | | | |
| | 28 | | | AMETEK, Inc. | | | 1,058 | |
| | 9 | | | Eaton Corp. plc, (Ireland) | | | 508 | |
| | 119 | | | GrafTech International Ltd. (a) | | | 1,115 | |
| | 10 | | | Roper Industries, Inc. | | | 1,135 | |
| | | | | | | | |
| | | | | | | 3,816 | |
| | | | | | | | |
| | | | Machinery — 4.0% | |
| | 18 | | | Chart Industries, Inc. (a) | | | 1,203 | |
| | 31 | | | CLARCOR, Inc. | | | 1,464 | |
| | 27 | | | Colfax Corp. (a) | | | 1,089 | |
| | 11 | | | Cummins, Inc. | | | 1,182 | |
| | 30 | | | Donaldson Co., Inc. | | | 985 | |
| | 15 | | | Gardner Denver, Inc. | | | 1,043 | |
| | 23 | | | Graco, Inc. | | | 1,173 | |
| | 67 | | | Harsco Corp. | | | 1,572 | |
| | 36 | | | Kennametal, Inc. | | | 1,440 | |
| | 41 | | | Navistar International Corp. (a) | | | 884 | |
| | 19 | | | Nordson Corp. | | | 1,179 | |
| | 33 | | | PACCAR, Inc. | | | 1,507 | |
| | 24 | | | Pentair Ltd., (Switzerland) | | | 1,179 | |
| | 23 | | | SPX Corp. | | | 1,612 | |
| | 10 | | | WABCO Holdings, Inc. (a) | | | 642 | |
| | 46 | | | Woodward, Inc. | | | 1,750 | |
| | | | | | | | |
| | | | | | | 19,904 | |
| | | | | | | | |
| | | | Marine — 0.3% | |
| | 22 | | | Kirby Corp. (a) | | | 1,389 | |
| | | | | | | | |
| | | | Professional Services — 1.3% | | | | |
| | 21 | | | Acacia Research Corp. (a) | | | 541 | |
| | 26 | | | Advisory Board Co. (The) (a) | | | 1,222 | |
| | 20 | | | FTI Consulting, Inc. (a) | | | 661 | |
| | 14 | | | IHS, Inc., Class A (a) | | | 1,383 | |
| | 34 | | | Manpower, Inc. | | | 1,440 | |
| | 17 | | | Towers Watson & Co., Class A | | | 952 | |
| | | | | | | | |
| | | | | | | 6,199 | |
| | | | | | | | |
| | | | Road & Rail — 0.8% | |
| | 26 | | | Genesee & Wyoming, Inc., Class A (a) | | | 2,013 | |
| | 1 | | | Kansas City Southern | | | 52 | |
| | 35 | | | Ryder System, Inc. | | | 1,743 | |
| | | | | | | | |
| | | | | | | 3,808 | |
| | | | | | | | |
| | | | Trading Companies & Distributors — 0.8% | |
| | 20 | | | Aircastle Ltd. | | | 250 | |
| | 29 | | | Applied Industrial Technologies, Inc. | | | 1,199 | |
| | 36 | | | Fastenal Co. | | | 1,700 | |
| | | | | | | | |
| SHARES | | | SECURITY DESCRIPTION | | VALUE($) | |
| | | | | | | | |
| | | | | | | | |
| | | | | | | | |
| | | | Trading Companies & Distributors — Continued | |
| | 5 | | | W.W. Grainger, Inc. | | | 938 | |
| | | | | | | | |
| | | | | | | 4,087 | |
| | | | | | | | |
| | | | Total Industrials | | | 67,317 | |
| | | | | | | | |
| | | | Information Technology — 13.9% | |
| | | | Communications Equipment — 1.7% | |
| | 92 | | | Acme Packet, Inc. (a) | | | 2,028 | |
| | 96 | | | Finisar Corp. (a) | | | 1,562 | |
| | 144 | | | JDS Uniphase Corp. (a) | | | 1,947 | |
| | 33 | | | Juniper Networks, Inc. (a) | | | 657 | |
| | 159 | | | Tellabs, Inc. | | | 363 | |
| | 39 | | | ViaSat, Inc. (a) | | | 1,507 | |
| | | | | | | | |
| | | | | | | 8,064 | |
| | | | | | | | |
| | | | Computers & Peripherals — 0.4% | |
| | 39 | | | SanDisk Corp. (a) | | | 1,708 | |
| | 13 | | | Synaptics, Inc. (a) | | | 398 | |
| | | | | | | | |
| | | | | | | 2,106 | |
| | | | | | | | |
| | | | Electronic Equipment, Instruments & Components — 2.1% | |
| | 31 | | | Arrow Electronics, Inc. (a) | | | 1,167 | |
| | 43 | | | Cognex Corp. | | | 1,594 | |
| | 73 | | | FLIR Systems, Inc. | | | 1,618 | |
| | 19 | | | IPG Photonics Corp. | | | 1,292 | |
| | 42 | | | National Instruments Corp. | | | 1,093 | |
| | 18 | | | TE Connectivity Ltd., (Switzerland) | | | 658 | |
| | 52 | | | Universal Display Corp. (a) | | | 1,343 | |
| | 130 | | | Vishay Intertechnology, Inc. (a) | | | 1,387 | |
| | | | | | | | |
| | | | | | | 10,152 | |
| | | | | | | | |
| | | | Internet Software & Services — 1.5% | |
| | 110 | | | Bankrate, Inc. (a) | | | 1,364 | |
| | 46 | | | Cornerstone OnDemand, Inc. (a) | | | 1,345 | |
| | 20 | | | CoStar Group, Inc. (a) | | | 1,810 | |
| | 42 | | | Dealertrack Technologies, Inc. (a) | | | 1,198 | |
| | 12 | | | eBay, Inc. (a) | | | 607 | |
| | 47 | | | Facebook, Inc., Class A (a) | | | 1,243 | |
| | | | | | | | |
| | | | | | | 7,567 | |
| | | | | | | | |
| | | | IT Services — 1.8% | |
| | 23 | | | Automatic Data Processing, Inc. | | | 1,285 | |
| | 25 | | | FleetCor Technologies, Inc. (a) | | | 1,322 | |
| | — | (h) | | MasterCard, Inc., Class A | | | 40 | |
| | 37 | | | Paychex, Inc. | | | 1,164 | |
| | 67 | | | Sapient Corp. (a) | | | 710 | |
| | 22 | | | Teradata Corp. (a) | | | 1,353 | |
| | 48 | | | VeriFone Systems, Inc. (a) | | | 1,428 | |
SEE NOTES TO FINANCIAL STATEMENTS.
| | | | | | |
| | | |
| 44 | | | | J.P. MORGAN MID CAP/MULTI-CAP FUNDS | | DECEMBER 31, 2012 |
| | | | | | | | |
| SHARES | | | SECURITY DESCRIPTION | | VALUE($) | |
| Short Positions — Continued | |
| Common Stocks — Continued | |
| | | | IT Services — Continued | | | | |
| | 9 | | | Visa, Inc., Class A | | | 1,326 | |
| | | | | | | | |
| | | | | | | 8,628 | |
| | | | | | | | |
| | | | Office Electronics — 0.1% | |
| | 11 | | | Zebra Technologies Corp., Class A (a) | | | 438 | |
| | | | | | | | |
| | | | Semiconductors & Semiconductor Equipment — 3.4% | |
| | 42 | | | Altera Corp. | | | 1,446 | |
| | 75 | | | Atmel Corp. (a) | | | 488 | |
| | 52 | | | Cavium, Inc. (a) | | | 1,629 | |
| | 40 | | | Cirrus Logic, Inc. (a) | | | 1,164 | |
| | 86 | | | Fairchild Semiconductor International, Inc. (a) | | | 1,245 | |
| | 24 | | | Hittite Microwave Corp. (a) | | | 1,460 | |
| | 75 | | | International Rectifier Corp. (a) | | | 1,323 | |
| | 122 | | | Intersil Corp., Class A | | | 1,011 | |
| | 49 | | | Microchip Technology, Inc. | | | 1,582 | |
| | 36 | | | Power Integrations, Inc. | | | 1,213 | |
| | 294 | | | RF Micro Devices, Inc. (a) | | | 1,317 | |
| | 42 | | | Semtech Corp. (a) | | | 1,229 | |
| | 56 | | | Skyworks Solutions, Inc. (a) | | | 1,146 | |
| | 18 | | | Veeco Instruments, Inc. (a) | | | 536 | |
| | | | | | | | |
| | | | | | | 16,789 | |
| | | | | | | | |
| | | | Software — 2.9% | |
| | 30 | | | ACI Worldwide, Inc. (a) | | | 1,299 | |
| | 40 | | | BroadSoft, Inc. (a) | | | 1,470 | |
| | 4 | | | Citrix Systems, Inc. (a) | | | 249 | |
| | 126 | | | Compuware Corp. (a) | | | 1,367 | |
| | 8 | | | FactSet Research Systems, Inc. | | | 734 | |
| | 66 | | | Fortinet, Inc. (a) | | | 1,381 | |
| | 36 | | | MICROS Systems, Inc. (a) | | | 1,533 | |
| | 27 | | | NetSuite, Inc. (a) | | | 1,788 | |
| | 70 | | | QLIK Technologies, Inc. (a) | | | 1,525 | |
| | 20 | | | Red Hat, Inc. (a) | | | 1,059 | |
| | 10 | | | Solera Holdings, Inc. | | | 536 | |
| | 22 | | | Synchronoss Technologies, Inc. (a) | | | 462 | |
| | 66 | | | TiVo, Inc. (a) | | | 818 | |
| | | | | | | | |
| | | | | | | 14,221 | |
| | | | | | | | |
| | | | Total Information Technology | | | 67,965 | |
| | | | | | | | |
| | | | Materials — 6.1% | |
| | | | Chemicals — 3.6% | |
| | 16 | | | Air Products & Chemicals, Inc. | | | 1,370 | |
| | 8 | | | Airgas, Inc. | | | 696 | |
| | 31 | | | Celanese Corp., Series A, | | | 1,372 | |
| | 66 | | | Chemtura Corp. (a) | | | 1,408 | |
| | 38 | | | Dow Chemical Co. (The) | | | 1,228 | |
| | | | | | | | |
| SHARES | | | SECURITY DESCRIPTION | | VALUE($) | |
| | | | | | | | |
| | | | | | | | |
| | | | Chemicals — Continued | | | | |
| | 25 | | | E.I. du Pont de Nemours & Co. | | | 1,107 | |
| | 24 | | | FMC Corp. | | | 1,405 | |
| | 17 | | | Innophos Holdings, Inc. | | | 779 | |
| | 2 | | | Intrepid Potash, Inc. | | | 45 | |
| | 14 | | | Monsanto Co. | | | 1,361 | |
| | 12 | | | Praxair, Inc. | | | 1,329 | |
| | 33 | | | Rockwood Holdings, Inc. | | | 1,642 | |
| | 34 | | | Scotts Miracle-Gro Co. (The), Class A | | | 1,482 | |
| | 32 | | | Sensient Technologies Corp. | | | 1,123 | |
| | 18 | | | Sigma-Aldrich Corp. | | | 1,310 | |
| | | | | | | | |
| | | | | | | 17,657 | |
| | | | | | | | |
| | | | Construction Materials — 0.3% | |
| | 31 | | | Texas Industries, Inc. (a) | | | 1,606 | |
| | | | | | | | |
| | | | Containers & Packaging — 0.6% | | | | |
| | 27 | | | Aptargroup, Inc. | | | 1,305 | |
| | 79 | | | Sealed Air Corp. | | | 1,382 | |
| | | | | | | | |
| | | | | | | 2,687 | |
| | | | | | | | |
| | | | Metals & Mining — 1.3% | |
| | 57 | | | Allied Nevada Gold Corp. (a) | | | 1,707 | |
| | 14 | | | Compass Minerals International, Inc. | | | 1,040 | |
| | 62 | | | Globe Specialty Metals, Inc. | | | 857 | |
| | 262 | | | Hecla Mining Co. | | | 1,526 | |
| | 1 | | | Royal Gold, Inc. | | | 41 | |
| | 39 | | | Walter Energy, Inc. | | | 1,392 | |
| | | | | | | | |
| | | | | | | 6,563 | |
| | | | | | | | |
| | | | Paper & Forest Products — 0.3% | |
| | 42 | | | MeadWestvaco Corp. | | | 1,350 | |
| | | | | | | | |
| | | | Total Materials | | | 29,863 | |
| | | | | | | | |
| | | | Telecommunication Services — 1.2% | |
| | | | Diversified Telecommunication Services — 0.8% | |
| | 29 | | | AT&T, Inc. | | | 964 | |
| | 28 | | | CenturyLink, Inc. | | | 1,091 | |
| | 247 | | | Cincinnati Bell, Inc. (a) | | | 1,352 | |
| | 33 | | | Level 3 Communications, Inc. (a) | | | 759 | |
| | | | | | | | |
| | | | | | | 4,166 | |
| | | | | | | | |
| | | | Wireless Telecommunication Services — 0.4% | |
| | 19 | | | Crown Castle International Corp. (a) | | | 1,346 | |
| | 29 | | | Telephone & Data Systems, Inc. | | | 650 | |
| | | | | | | | |
| | | | | | | 1,996 | |
| | | | | | | | |
| | | | Total Telecommunication Services | | | 6,162 | |
| | | | | | | | |
SEE NOTES TO FINANCIAL STATEMENTS.
| | | | | | | | |
| | | |
| DECEMBER 31, 2012 | | J.P. MORGAN MID CAP/MULTI-CAP FUNDS | | | | | 45 | |
JPMorgan Multi-Cap Market Neutral Fund
SCHEDULE OF PORTFOLIO INVESTMENTS
AS OF DECEMBER 31, 2012 (Unaudited) (continued)
(Amounts in thousands)
| | | | | | | | |
| SHARES | | | SECURITY DESCRIPTION | | VALUE($) | |
| Short Positions — Continued | |
| Common Stocks — Continued | |
| | | | Utilities — 4.5% | |
| | | | Electric Utilities — 2.0% | |
| | 37 | | | Cleco Corp. | | | 1,478 | |
| | 20 | | | Duke Energy Corp. | | | 1,288 | |
| | 34 | | | Edison International | | | 1,538 | |
| | 16 | | | Exelon Corp. | | | 480 | |
| | 10 | | | NextEra Energy, Inc. | | | 662 | |
| | 42 | | | Northeast Utilities | | | 1,637 | |
| | 39 | | | Southern Co. (The) | | | 1,676 | |
| | 16 | | | UIL Holdings Corp. | | | 561 | |
| | 15 | | | UNS Energy Corp. | | | 631 | |
| | | | | | | | |
| | | | | | | 9,951 | |
| | | | | | | | |
| | | | Gas Utilities — 0.4% | |
| | 30 | | | Northwest Natural Gas Co. | | | 1,308 | |
| | 24 | | | Piedmont Natural Gas Co., Inc. | | | 755 | |
| | | | | | | | |
| | | | | | | 2,063 | |
| | | | | | | | |
| | | | | | | | |
| SHARES | | | SECURITY DESCRIPTION | | VALUE($) | |
| | | | | | | | |
| | | | | | | | |
| | | | Independent Power Producers & Energy Traders — 0.8% | |
| | 112 | | | Atlantic Power Corp. | | | 1,282 | |
| | 92 | | | Calpine Corp. (a) | | | 1,665 | |
| | 29 | | | NRG Energy, Inc. | | | 677 | |
| | | | | | | | |
| | | | | | | 3,624 | |
| | | | | | | | |
| | | | Multi-Utilities — 1.3% | |
| | 23 | | | Consolidated Edison, Inc. | | | 1,283 | |
| | 31 | | | Dominion Resources, Inc. | | | 1,630 | |
| | 14 | | | MDU Resources Group, Inc. | | | 305 | |
| | 63 | | | NiSource, Inc. | | | 1,564 | |
| | 34 | | | SCANA Corp. | | | 1,538 | |
| | | | | | | | |
| | | | | | | 6,320 | |
| | | | | | | | |
| | | | Total Utilities | | | 21,958 | |
| | | | | | | | |
| | | | Total Short Positions
(Proceeds $429,255) | | $ | 434,080 | |
| | | | | | | | |
Percentages indicated are based on net assets.
SEE NOTES TO FINANCIAL STATEMENTS.
| | | | | | |
| | | |
| 46 | | | | J.P. MORGAN MID CAP/MULTI-CAP FUNDS | | DECEMBER 31, 2012 |
JPMorgan Value Advantage Fund
SCHEDULE OF PORTFOLIO INVESTMENTS
AS OF DECEMBER 31, 2012 (Unaudited)
(Amounts in thousands)
| | | | | | | | |
| SHARES | | | SECURITY DESCRIPTION | | VALUE($) | |
| | | | | | | | |
| | | | | | | | |
| Common Stocks — 94.8% | | | | |
| | | | Consumer Discretionary — 13.0% | | | | |
| | | | Distributors — 1.0% | | | | |
| | 323 | | | Genuine Parts Co. | | | 20,562 | |
| | | | | | | | |
| | | | Hotels, Restaurants & Leisure — 1.4% | | | | |
| | 451 | | | Marriott International, Inc., Class A | | | 16,816 | |
| | 148 | | | McDonald's Corp. | | | 13,064 | |
| | | | | | | | |
| | | | | | | 29,880 | |
| | | | | | | | |
| | | | Household Durables — 0.4% | | | | |
| | 490 | | | Brookfield Residential Properties, Inc., (Canada) (a) | | | 8,782 | |
| | | | | | | | |
| | | | Internet & Catalog Retail — 0.6% | | | | |
| | 209 | | | Expedia, Inc. | | | 12,855 | |
| | | | | | | | |
| | | | Media — 3.6% | | | | |
| | 1,079 | | | Belo Corp., Class A | | | 8,278 | |
| | 438 | | | CBS Corp. (Non-Voting), Class B | | | 16,670 | |
| | 726 | | | Clear Channel Outdoor Holdings, Inc.,
Class A (a) | | | 5,098 | |
| | 383 | | | DISH Network Corp., Class A | | | 13,948 | |
| | 811 | | | Entercom Communications Corp., Class A (a) | | | 5,658 | |
| | 223 | | | Gannett Co., Inc. | | | 4,012 | |
| | 214 | | | Time Warner Cable, Inc. | | | 20,818 | |
| | | | | | | | |
| | | | | | | 74,482 | |
| | | | | | | | |
| | | | Multiline Retail — 1.4% | | | | |
| | 698 | | | Kohl's Corp. | | | 30,000 | |
| | | | | | | | |
| | | | Specialty Retail — 3.8% | | | | |
| | 79 | | | AutoZone, Inc. (a) | | | 27,901 | |
| | 253 | | | Bed Bath & Beyond, Inc. (a) | | | 14,145 | |
| | 310 | | | Home Depot, Inc. (The) | | | 19,192 | |
| | 424 | | | Williams-Sonoma, Inc. | | | 18,576 | |
| | | | | | | | |
| | | | | | | 79,814 | |
| | | | | | | | |
| | | | Textiles, Apparel & Luxury Goods — 0.8% | | | | |
| | 448 | | | Hanesbrands, Inc. (a) | | | 16,055 | |
| | | | | | | | |
| | | | Total Consumer Discretionary | | | 272,430 | |
| | | | | | | | |
| | | | Consumer Staples — 4.4% | | | | |
| | | | Beverages — 1.7% | | | | |
| | 175 | | | Diageo plc, (United Kingdom), ADR | | | 20,413 | |
| | 340 | | | Dr. Pepper Snapple Group, Inc. | | | 15,008 | |
| | | | | | | | |
| | | | | | | 35,421 | |
| | | | | | | | |
| | | | Food & Staples Retailing — 1.0% | | | | |
| | 602 | | | Walgreen Co. | | | 22,295 | |
| | | | | | | | |
| | | | Household Products — 1.7% | | | | |
| | 527 | | | Procter & Gamble Co. (The) | | | 35,758 | |
| | | | | | | | |
| | | | Total Consumer Staples | | | 93,474 | |
| | | | | | | | |
| | | | | | | | |
| SHARES | | | SECURITY DESCRIPTION | | VALUE($) | |
| | | | | | | | |
| | | | | | | | |
| | | | Energy — 11.3% | | | | |
| | | | Oil, Gas & Consumable Fuels — 11.3% | | | | |
| | 751 | | | Devon Energy Corp. | | | 39,098 | |
| | 416 | | | Energen Corp. | | | 18,755 | |
| | 897 | | | Exxon Mobil Corp. | | | 77,653 | |
| | 798 | | | Kinder Morgan, Inc. | | | 28,197 | |
| | 471 | | | NuStar GP Holdings LLC | | | 13,029 | |
| | 217 | | | PBF Energy, Inc. (a) | | | 6,312 | |
| | 214 | | | Phillips 66 | | | 11,379 | |
| | 360 | | | QEP Resources, Inc. | | | 10,888 | |
| | 497 | | | Southwestern Energy Co. (a) | | | 16,605 | |
| | 508 | | | Teekay Corp., (Bermuda) | | | 16,305 | |
| | | | | | | | |
| | | | Total Energy | | | 238,221 | |
| | | | | | | | |
| | | | Financials — 34.7% | | | | |
| | | | Capital Markets — 4.6% | | | | |
| | 411 | | | Ameriprise Financial, Inc. | | | 25,766 | |
| | 1,743 | | | Charles Schwab Corp. (The) | | | 25,032 | |
| | 825 | | | Invesco Ltd. | | | 21,529 | |
| | 465 | | | Legg Mason, Inc. | | | 11,968 | |
| | 263 | | | Northern Trust Corp. | | | 13,212 | |
| | | | | | | | |
| | | | | | | 97,507 | |
| | | | | | | | |
| | | | Commercial Banks — 8.4% | | | | |
| | 142 | | | City National Corp. | | | 7,017 | |
| | 290 | | | First Republic Bank | | | 9,522 | |
| | 284 | | | M&T Bank Corp. | | | 27,975 | |
| | 323 | | | National Bank Holdings Corp., Class A | | | 6,138 | |
| | 158 | | | PNC Financial Services Group, Inc. | | | 9,219 | |
| | 531 | | | SunTrust Banks, Inc. | | | 15,040 | |
| | 869 | | | U.S. Bancorp | | | 27,762 | |
| | 2,031 | | | Wells Fargo & Co. | | | 69,413 | |
| | 117 | | | Westamerica Bancorp | | | 4,990 | |
| | | | | | | | |
| | | | | | | 177,076 | |
| | | | | | | | |
| | | | Consumer Finance — 1.4% | | | | |
| | 492 | | | Capital One Financial Corp. | | | 28,496 | |
| | | | | | | | |
| | | | Diversified Financial Services — 3.5% | | | | |
| | 3,444 | | | Bank of America Corp. | | | 39,955 | |
| | 850 | | | Citigroup, Inc. | | | 33,632 | |
| | | | | | | | |
| | | | | | | 73,587 | |
| | | | | | | | |
| | | | Insurance — 12.3% | | | | |
| | 67 | | | Alleghany Corp. (a) | | | 22,625 | |
| | 126 | | | Allied World Assurance Co. Holdings AG, (Switzerland) | | | 9,921 | |
| | 1,197 | | | American International Group, Inc. (a) | | | 42,261 | |
| | – | (h) | | Berkshire Hathaway, Inc., Class A (a) | | | 29,493 | |
SEE NOTES TO FINANCIAL STATEMENTS.
| | | | | | | | |
| | | |
| DECEMBER 31, 2012 | | J.P. MORGAN MID CAP/MULTI-CAP FUNDS | | | | | 47 | |
JPMorgan Value Advantage Fund
SCHEDULE OF PORTFOLIO INVESTMENTS
AS OF DECEMBER 31, 2012 (Unaudited)
(Amounts in thousands)
| | | | | | | | |
| SHARES | | | SECURITY DESCRIPTION | | VALUE($) | |
| | | | | | | | |
| Common Stocks — Continued | | | | |
| | | | Insurance — Continued | | | | |
| | 259 | | | Endurance Specialty Holdings Ltd., (Bermuda) | | | 10,268 | |
| | 613 | | | Hartford Financial Services Group, Inc. | | | 13,747 | |
| | 1,153 | | | Loews Corp. | | | 46,997 | |
| | 842 | | | Old Republic International Corp. | | | 8,963 | |
| | 274 | | | OneBeacon Insurance Group Ltd., Class A | | | 3,810 | |
| | 229 | | | Prudential Financial, Inc. | | | 12,207 | |
| | 358 | | | Travelers Cos., Inc. (The) | | | 25,690 | |
| | 860 | | | Unum Group | | | 17,897 | |
| | 167 | | | W.R. Berkley Corp. | | | 6,291 | |
| | 240 | | | Willis Group Holdings plc, (United Kingdom) | | | 8,060 | |
| | | | | | | | |
| | | | | | | 258,230 | |
| | | | | | | | |
| | | | Real Estate Investment Trusts (REITs) — 2.4% | |
| | 209 | | | Agree Realty Corp. | | | 5,596 | |
| | 968 | | | Annaly Capital Management, Inc. | | | 13,595 | |
| | 875 | | | Cousins Properties, Inc. | | | 7,304 | |
| | 569 | | | Excel Trust, Inc. | | | 7,213 | |
| | 330 | | | Rayonier, Inc. | | | 17,094 | |
| | | | | | | | |
| | | | | | | 50,802 | |
| | | | | | | | |
| | | | Real Estate Management & Development — 0.5% | |
| | 265 | | | Brookfield Asset Management, Inc., (Canada), Class A | | | 9,709 | |
| | | | | | | | |
| | | | Thrifts & Mortgage Finance — 1.6% | | | | |
| | 551 | | | Capitol Federal Financial, Inc. | | | 6,441 | |
| | 403 | | | EverBank Financial Corp. | | | 6,015 | |
| | 159 | | | Ocwen Financial Corp. (a) | | | 5,514 | |
| | 1,214 | | | People's United Financial, Inc. | | | 14,676 | |
| | | | | | | | |
| | | | | | | 32,646 | |
| | | | | | | | |
| | | | Total Financials | | | 728,053 | |
| | | | | | | | |
| | | | Health Care — 9.5% | | | | |
| | | | Health Care Equipment & Supplies — 0.7% | | | | |
| | 258 | | | Covidien plc, (Ireland) | | | 14,903 | |
| | | | | | | | |
| | | | Health Care Providers & Services — 2.7% | | | | |
| | 318 | | | Humana, Inc. | | | 21,790 | |
| | 227 | | | McKesson Corp. | | | 22,000 | |
| | 254 | | | National Healthcare Corp. | | | 11,926 | |
| | | | | | | | |
| | | | | | | 55,716 | |
| | | | | | | | |
| | | | Pharmaceuticals — 6.1% | | | | |
| | 365 | | | Bristol-Myers Squibb Co. | | | 11,886 | |
| | 538 | | | Johnson & Johnson | | | 37,721 | |
| | 656 | | | Merck & Co., Inc. | | | 26,844 | |
| | 2,101 | | | Pfizer, Inc. | | | 52,685 | |
| | | | | | | | |
| | | | | | | 129,136 | |
| | | | | | | | |
| | | | Total Health Care | | | 199,755 | |
| | | | | | | | |
| | | | | | | | |
| SHARES | | | SECURITY DESCRIPTION | | VALUE($) | |
| | | | | | | | |
| | | | | | | | |
| | | | Industrials — 5.6% | | | | |
| | | | Aerospace & Defense — 1.3% | | | | |
| | 329 | | | United Technologies Corp. | | | 26,948 | |
| | | | | | | | |
| | | | Electrical Equipment — 0.5% | | | | |
| | 187 | | | Emerson Electric Co. | | | 9,893 | |
| | | | | | | | |
| | | | Industrial Conglomerates — 1.1% | | | | |
| | 387 | | | Carlisle Cos., Inc. | | | 22,765 | |
| | | | | | | | |
| | | | Machinery — 1.6% | | | | |
| | 360 | | | Dover Corp. | | | 23,623 | |
| | 154 | | | Illinois Tool Works, Inc. | | | 9,371 | |
| | | | | | | | |
| | | | | | | 32,994 | |
| | | | | | | | |
| | | | Professional Services — 0.8% | | | | |
| | 336 | | | Equifax, Inc. | | | 18,157 | |
| | | | | | | | |
| | | | Trading Companies & Distributors — 0.3% | | | | |
| | 321 | | | Air Lease Corp. (a) | | | 6,902 | |
| | | | | | | | |
| | | | Total Industrials | | | 117,659 | |
| | | | | | | | |
| | | | Information Technology — 3.9% | | | | |
| | | | Communications Equipment — 1.4% | | | | |
| | 1,449 | | | Cisco Systems, Inc. | | | 28,469 | |
| | | | | | | | |
| | | | Computers & Peripherals — 0.5% | | | | |
| | 766 | | | Hewlett-Packard Co. | | | 10,914 | |
| | | | | | | | |
| | | | Semiconductors & Semiconductor Equipment — 0.9% | |
| | 469 | | | Analog Devices, Inc. | | | 19,705 | |
| | | | | | | | |
| | | | Software — 1.1% | | | | |
| | 876 | | | Microsoft Corp. | | | 23,405 | |
| | | | | | | | |
| | | | Total Information Technology | | | 82,493 | |
| | | | | | | | |
| | | | Materials — 3.8% | | | | |
| | | | Chemicals — 0.9% | | | | |
| | 302 | | | Albemarle Corp. | | | 18,735 | |
| | | | | | | | |
| | | | Construction Materials — 0.6% | | | | |
| | 128 | | | Martin Marietta Materials, Inc. | | | 12,040 | |
| | | | | | | | |
| | | | Containers & Packaging — 0.9% | | | | |
| | 292 | | | Rock-Tenn Co., Class A | | | 20,379 | |
| | | | | | | | |
| | | | Metals & Mining — 0.4% | | | | |
| | 116 | | | Compass Minerals International, Inc. | | | 8,652 | |
| | | | | | | | |
| | | | Paper & Forest Products — 1.0% | | | | |
| | 654 | | | MeadWestvaco Corp. | | | 20,849 | |
| | | | | | | | |
| | | | Total Materials | | | 80,655 | |
| | | | | | | | |
| | | | Telecommunication Services — 2.4% | | | | |
| | | | Diversified Telecommunication Services — 2.2% | |
| | 1,359 | | | AT&T, Inc. | | | 45,805 | |
| | | | | | | | |
SEE NOTES TO FINANCIAL STATEMENTS.
| | | | | | |
| | | |
| 48 | | | | J.P. MORGAN MID CAP/MULTI-CAP FUNDS | | DECEMBER 31, 2012 |
| | | | | | | | |
| SHARES | | | SECURITY DESCRIPTION | | VALUE($) | |
| Common Stocks — Continued | | | | |
| | | | Wireless Telecommunication Services — 0.2% | |
| | 217 | | | Telephone & Data Systems, Inc. | | | 4,796 | |
| | | | | | | | |
| | | | Total Telecommunication Services | | | 50,601 | |
| | | | | | | | |
| | | | Utilities — 6.2% | | | | |
| | | | Electric Utilities — 2.5% | | | | |
| | 316 | | | NextEra Energy, Inc. | | | 21,843 | |
| | 369 | | | Northeast Utilities | | | 14,425 | |
| | 385 | | | Southern Co. (The) | | | 16,499 | |
| | | | | | | | |
| | | | | | | 52,767 | |
| | | | | | | | |
| | | | Gas Utilities — 0.7% | | | | |
| | 417 | | | Atmos Energy Corp. | | | 14,657 | |
| | | | | | | | |
| | | | Multi-Utilities — 3.0% | | | | |
| | 883 | | | CenterPoint Energy, Inc. | | | 16,998 | |
| | 484 | | | PG&E Corp. | | | 19,443 | |
| | 364 | | | Sempra Energy | | | 25,822 | |
| | | | | | | | |
| | | | | | | 62,263 | |
| | | | | | | | |
| | | | Total Utilities | | | 129,687 | |
| | | | | | | | |
| | | | Total Common Stocks
(Cost $1,770,131) | | | 1,993,028 | |
| | | | | | | | |
| | | | | | | | |
| SHARES | | | SECURITY DESCRIPTION | | VALUE($) | |
| Investment Company — 0.3% | | | | |
| | 387 | | | Cohen & Steers Infrastructure Fund, Inc.
(Cost $5,336) | | | 7,252 | |
| | | | | | | | |
| Short-Term Investment — 4.6% | |
| | | | Investment Company — 4.6% | |
| | 95,612 | | | JPMorgan Prime Money Market Fund, Institutional Class Shares, 0.080% (b) (l) (m)
(Cost $95,612) | | | 95,612 | |
| | | | | | | | |
| | | | Total Investments — 99.7%
(Cost $1,871,079) | | | 2,095,892 | |
| | | | Other Assets in Excess of
Liabilities — 0.3% | | | 5,349 | |
| | | | | | | | |
| | | | NET ASSETS — 100.0% | | $ | 2,101,241 | |
| | | | | | | | |
Percentages indicated are based on net assets.
SEE NOTES TO FINANCIAL STATEMENTS.
| | | | | | | | |
| | | |
| DECEMBER 31, 2012 | | J.P. MORGAN MID CAP/MULTI-CAP FUNDS | | | | | 49 | |
J.P. Morgan Mid Cap/Multi-Cap Funds
NOTES TO SCHEDULES OF PORTFOLIO INVESTMENTS
AS OF DECEMBER 31, 2012 (Unaudited)
| | | | | | |
| ADR | | — American Depositary Receipt |
| |
| (a) | | — Non-income producing security. |
| (b) | | — Investment in affiliate. Money market fund registered under the Investment Company Act of 1940, as amended, and advised by J.P. Morgan Investment Management Inc. |
| (c) | | — Security, or a portion of the security, has been delivered to a counterparty as part of a security lending transaction. |
| (g) | | — Amount rounds to less than 0.1%. |
| | | | | | |
| (h) | | — Amount rounds to less than one thousand (shares or dollars). |
| (j) | | — All or a portion of these securities are segregated for short sales. |
| (l) | | — The rate shown is the current yield as of December 31, 2012. |
| (m) | | — All or a portion of this security is reserved and/or pledged with the custodian for current or potential holdings of futures, swaps, options, TBAs, when-issued securities, delayed delivery securities, reverse repurchase agreements, unfunded commitments and/or forward foreign currency exchange contracts. |
SEE NOTES TO FINANCIAL STATEMENTS.
| | | | | | |
| | | |
| 50 | | | | J.P. MORGAN MID CAP/MULTI-CAP FUNDS | | DECEMBER 31, 2012 |
THIS PAGE IS INTENTIONALLY LEFT BLANK
| | | | | | | | |
| | | |
| DECEMBER 31, 2012 | | J.P. MORGAN MID CAP/MULTI-CAP FUNDS | | | | | 51 | |
STATEMENTS OF ASSETS AND LIABILITIES
AS OF DECEMBER 31, 2012 (Unaudited)
(Amounts in thousands, except per share amounts)
| | | | | | | | | | | | | | | | |
| | | Growth
Advantage Fund | | | Mid Cap
Core Fund | | | Mid Cap
Equity Fund | | | Mid Cap
Growth Fund | |
ASSETS: | | | | | | | | | | | | | | | | |
Investments in non-affiliates, at value | | $ | 1,474,911 | | | $ | 746,042 | | | $ | 896,570 | | | $ | 1,366,569 | |
Investments in affiliates, at value | | | 1,981 | | | | 14,817 | | | | 31,374 | | | | 13,350 | |
| | | | | | | | | | | | | | | | |
Total investment securities, at value | | | 1,476,892 | | | | 760,859 | | | | 927,944 | | | | 1,379,919 | |
Cash | | | — | | | | — | | | | 4 | | | | — | |
Receivables: | | | | | | | | | | | | | | | | |
Investment securities sold | | | 14,110 | | | | — | | | | 1,253 | | | | 26,297 | |
Fund shares sold | | | 3,482 | | | | 2,357 | | | | 2,752 | | | | 1,705 | |
Dividends from non-affiliates | | | 297 | | | | 484 | | | | 639 | | | | 439 | |
Dividends from affiliates | | | 2 | | | | 1 | | | | 2 | | | | 2 | |
Securities lending income | | | — | | | | — | | | | — | (a) | | | — | |
Prepaid expenses | | | — | | | | 20 | | | | — | | | | — | |
| | | | | | | | | | | | | | | | |
Total Assets | | | 1,494,783 | | | | 763,721 | | | | 932,594 | | | | 1,408,362 | |
| | | | | | | | | | | | | | | | |
| | | | |
LIABILITIES: | | | | | | | | | | | | | | | | |
Payables: | | | | | | | | | | | | | | | | |
Due to custodian | | | — | | | | 84 | | | | — | | | | — | |
Dividends | | | — | | | | 347 | | | | — | | | | — | |
Investment securities purchased | | | — | | | | — | | | | 311 | | | | — | |
Collateral for securities lending program | | | — | | | | — | | | | 1,056 | | | | — | |
Fund shares redeemed | | | 14,574 | | | | 430 | | | | 1,359 | | | | 20,861 | |
Accrued liabilities: | | | | | | | | | | | | | | | | |
Investment advisory fees | | | 826 | | | | 412 | | | | 503 | | | | 695 | |
Administration fees | | | 107 | | | | 52 | | | | 32 | | | | — | |
Shareholder servicing fees | | | 209 | | | | 99 | | | | 1 | | | | 250 | |
Distribution fees | | | 64 | | | | 5 | | | | 3 | | | | 133 | |
Custodian and accounting fees | | | 10 | | | | 4 | | | | 7 | | | | 12 | |
Trustees' and Chief Compliance Officer's fees | | | — | (a) | | | 1 | | | | 1 | | | | 1 | |
Transfer agent fees | | | 94 | | | | — | | | | 338 | | | | 522 | |
Other | | | 76 | | | | 18 | | | | 70 | | | | 188 | |
| | | | | | | | | | | | | | | | |
Total Liabilities | | | 15,960 | | | | 1,452 | | | | 3,681 | | | | 22,662 | |
| | | | | | | | | | | | | | | | |
Net Assets | | $ | 1,478,823 | | | $ | 762,269 | | | $ | 928,913 | | | $ | 1,385,700 | |
| | | | | | | | | | | | | | | | |
| (a) | Amount rounds to less than $1,000. |
SEE NOTES TO FINANCIAL STATEMENTS.
| | | | | | |
| | | |
| 52 | | | | J.P. MORGAN MID CAP/MULTI-CAP FUNDS | | DECEMBER 31, 2012 |
| | | | | | | | | | | | | | | | |
| | | Growth
Advantage Fund | | | Mid Cap Core Fund | | | Mid Cap
Equity Fund | | | Mid Cap
Growth Fund | |
NET ASSETS: | | | | | | | | | | | | | | | | |
Paid-in-Capital | | $ | 1,209,432 | | | $ | 728,294 | | | $ | 759,753 | | | $ | 1,145,086 | |
Accumulated undistributed (distributions in excess of) net investment income | | | 308 | | | | (326 | ) | | | 77 | | | | 502 | |
Accumulated net realized gains (losses) | | | (9,845 | ) | | | (5,586 | ) | | | (4,147 | ) | | | (39,602 | ) |
Net unrealized appreciation (depreciation) | | | 278,928 | | | | 39,887 | | | | 173,230 | | | | 279,714 | |
| | | | | | | | | | | | | | | | |
Total Net Assets | | $ | 1,478,823 | | | $ | 762,269 | | | $ | 928,913 | | | $ | 1,385,700 | |
| | | | | | | | | | | | | | | | |
| | | | |
Net Assets: | | | | | | | | | | | | | | | | |
Class A | | $ | 211,447 | | | $ | 21,659 | | | $ | 10,184 | | | $ | 533,328 | |
Class B | | | 2,111 | | | | — | | | | — | | | | 8,410 | |
Class C | | | 30,423 | | | | 133 | | | | 2,118 | | | | 20,767 | |
Class R2 | | | — | | | | 83 | | | | — | | | | 247 | |
Class R5 | | | 628,557 | | | | 61 | | | | — | | | | 15,286 | |
Class R6 | | | — | | | | 288,602 | | | | — | | | | 19,065 | |
Select Class | | | 606,285 | | | | 451,731 | | | | 916,611 | | | | 788,597 | |
| | | | | | | | | | | | | | | | |
Total | | $ | 1,478,823 | | | $ | 762,269 | | | $ | 928,913 | | | $ | 1,385,700 | |
| | | | | | | | | | | | | | | | |
| | | | |
Outstanding units of beneficial interest (shares) ($0.0001 par value; unlimited number of shares authorized): | | | | | | | | | | | | | | | | |
Class A | | | 21,381 | | | | 1,216 | | | | 307 | | | | 26,771 | |
Class B | | | 232 | | | | — | | | | — | | | | 569 | |
Class C | | | 3,336 | | | | 7 | | | | 64 | | | | 1,197 | |
Class R2 | | | — | | | | 5 | | | | — | | | | 12 | |
Class R5 | | | 62,309 | | | | 3 | | | | — | | | | 703 | |
Class R6 | | | — | | | | 16,132 | | | | — | | | | 876 | |
Select Class | | �� | 60,447 | | | | 25,297 | | | | 27,585 | | | | 36,336 | |
| | | | |
Net Asset Value (a): | | | | | | | | | | | | | | | | |
Class A — Redemption price per share | | $ | 9.89 | | | $ | 17.81 | | | $ | 33.13 | | | $ | 19.92 | |
Class B — Offering price per share (b) | | | 9.11 | | | | — | | | | — | | | | 14.77 | |
Class C — Offering price per share (b) | | | 9.12 | | | | 17.75 | | | | 32.84 | | | | 17.35 | |
Class R2 — Offering and redemption price per share | | | — | | | | 17.79 | | | | — | | | | 21.30 | |
Class R5 — Offering and redemption price per share | | | 10.09 | | | | 17.90 | | | | — | | | | 21.75 | |
Class R6 — Offering and redemption price per share | | | — | | | | 17.89 | | | | — | | | | 21.76 | |
Select Class — Offering and redemption price per share | | | 10.03 | | | | 17.86 | | | | 33.23 | | | | 21.70 | |
Class A maximum sales charge | | | 5.25 | % | | | 5.25 | % | | | 5.25 | % | | | 5.25 | % |
Class A maximum public offering price per share
[net asset value per share/(100% — maximum sales charge)] | | $ | 10.44 | | | $ | 18.80 | | | $ | 34.97 | | | $ | 21.02 | |
| | | | | | | | | | | | | | | | |
| | | | |
Cost of investments in non-affiliates | | $ | 1,195,983 | | | $ | 706,155 | | | $ | 723,340 | | | $ | 1,086,855 | |
Cost of investments in affiliates | | | 1,981 | | | | 14,817 | | | | 31,374 | | | | 13,350 | |
Value of securities on loan | | | — | | | | — | | | | 1,043 | | | | — | |
| (a) | Per share amounts may not recalculate due to rounding of net assets and/or shares outstanding. |
| (b) | Redemption price for Class B and Class C Shares varies based upon length of time the shares are held. |
SEE NOTES TO FINANCIAL STATEMENTS.
| | | | | | | | |
| | | |
| DECEMBER 31, 2012 | | J.P. MORGAN MID CAP/MULTI-CAP FUNDS | | | | | 53 | |
STATEMENTS OF ASSETS AND LIABILITIES
AS OF DECEMBER 31, 2012 (Unaudited) (continued)
(Amounts in thousands, except per share amounts)
| | | | | | | | | | | | |
| | | Mid Cap Value Fund | | | Multi-Cap
Market
Neutral Fund | | | Value
Advantage Fund | |
ASSETS: | | | | | | | | | | | | |
Investments in non-affiliates, at value | | $ | 9,421,174 | | | $ | 429,080 | | | $ | 2,000,280 | |
Investments in affiliates, at value | | | 505,766 | | | | 67,497 | | | | 95,612 | |
| | | | | | | | | | | | |
Total investment securities, at value | | | 9,926,940 | | | | 496,577 | | | | 2,095,892 | |
Cash | | | 92 | | | | 3,212 | | | | — | |
Deposits at broker for securities sold short | | | — | | | | 425,359 | | | | — | |
Receivables: | | | | | | | | | | | | |
Investment securities sold | | | 25,386 | | | | 14 | | | | — | |
Fund shares sold | | | 113,209 | | | | 73 | | | | 9,117 | |
Dividends from non-affiliates | | | 10,596 | | | | 294 | | | | 2,330 | |
Dividends from affiliates | | | 38 | | | | 6 | | | | 10 | |
Securities lending income | | | 1 | | | | — | | | | — | |
| | | | | | | | | | | | |
Total Assets | | | 10,076,262 | | | | 925,535 | | | | 2,107,349 | |
| | | | | | | | | | | | |
| | | |
LIABILITIES: | | | | | | | | | | | | |
Payables: | | | | | | | | | | | | |
Securities sold short, at value | | | — | | | | 434,080 | | | | — | |
Dividend expense to non-affiliates on securities sold short | | | — | | | | 211 | | | | — | |
Investment securities purchased | | | 135,852 | | | | — | | | | 1,719 | |
Interest expense to non-affiliates on securities sold short | | | — | | | | 30 | | | | — | |
Collateral for securities lending program | | | 3,656 | | | | — | | | | — | |
Fund shares redeemed | | | 99,226 | | | | 367 | | | | 2,390 | |
Accrued liabilities: | | | | | | | | | | | | |
Investment advisory fees | | | 4,967 | | | | 488 | | | | 1,093 | |
Administration fees | | | — | | | | — | | | | 18 | |
Shareholder servicing fees | | | 1,053 | | | | 3 | | | | 280 | |
Distribution fees | | | 824 | | | | 13 | | | | 187 | |
Custodian and accounting fees | | | 63 | | | | 13 | | | | 13 | |
Trustees’ and Chief Compliance Officer's fees | | | 6 | | | | — | | | | 2 | |
Transfer agent fees | | | 2,378 | | | | 96 | | | | 330 | |
Other | | | 574 | | | | 56 | | | | 76 | |
| | | | | | | | | | | | |
Total Liabilities | | | 248,599 | | | | 435,357 | | | | 6,108 | |
| | | | | | | | | | | | |
Net Assets | | $ | 9,827,663 | | | $ | 490,178 | | | $ | 2,101,241 | |
| | | | | | | | | | | | |
SEE NOTES TO FINANCIAL STATEMENTS.
| | | | | | |
| | | |
| 54 | | | | J.P. MORGAN MID CAP/MULTI-CAP FUNDS | | DECEMBER 31, 2012 |
| | | | | | | | | | | | |
| | | Mid Cap
Value Fund | | | Multi-Cap
Market
Neutral Fund | | | Value
Advantage Fund | |
NET ASSETS: | | | | | | | | | | | | |
Paid-in-Capital | | $ | 7,730,041 | | | $ | 541,311 | | | $ | 1,889,366 | |
Accumulated undistributed (distributions in excess of) net investment income | | | 2,964 | | | | (5,179 | ) | | | 297 | |
Accumulated net realized gains (losses) | | | (6,115 | ) | | | (88,553 | ) | | | (13,235 | ) |
Net unrealized appreciation (depreciation) | | | 2,100,773 | | | | 42,599 | | | | 224,813 | |
| | | | | | | | | | | | |
Total Net Assets | | $ | 9,827,663 | | | $ | 490,178 | | | $ | 2,101,241 | |
| | | | | | | | | | | | |
| | | |
Net Assets: | | | | | | | | | | | | |
Class A | | $ | 2,462,934 | | | $ | 19,603 | | | $ | 498,879 | |
Class B | | | 36,202 | | | | 978 | | | | — | |
Class C | | | 427,944 | | | | 12,166 | | | | 134,498 | |
Class R2 | | | 33,345 | | | | — | | | | — | |
Institutional Class | | | 4,599,177 | | | | — | | | | 735,751 | |
Select Class | | | 2,268,061 | | | | 457,431 | | | | 732,113 | |
| | | | | | | | | | | | |
Total | | $ | 9,827,663 | | | $ | 490,178 | | | $ | 2,101,241 | |
| | | | | | | | | | | | |
| | | |
Outstanding units of beneficial interest (shares) ($0.0001 par value; unlimited number of shares authorized): | | | | | | | | | | | | |
Class A | | | 89,387 | | | | 2,055 | | | | 23,491 | |
Class B | | | 1,337 | | | | 107 | | | | — | |
Class C | | | 15,913 | | | | 1,335 | | | | 6,324 | |
Class R2 | | | 1,243 | | | | — | | | | — | |
Institutional Class | | | 164,313 | | | | — | | | | 34,589 | |
Select Class | | | 81,710 | | | | 47,277 | | | | 34,406 | |
| | | |
Net Asset Value (a): | | | | | | | | | | | | |
Class A — Redemption price per share | | $ | 27.55 | | | $ | 9.54 | | | $ | 21.24 | |
Class B — Offering price per share (b) | | | 27.07 | | | | 9.11 | | | | — | |
Class C — Offering price per share (b) | | | 26.89 | | | | 9.12 | | | | 21.27 | |
Class R2 — Offering and redemption price per share | | | 26.83 | | | | — | | | | — | |
Institutional Class — Offering and redemption price per share | | | 27.99 | | | | — | | | | 21.27 | |
Select Class — Offering and redemption price per share | | | 27.76 | | | | 9.68 | | | | 21.28 | |
Class A maximum sales charge | | | 5.25 | % | | | 5.25 | % | | | 5.25 | % |
Class A maximum public offering price per share
[net asset value per share/(100% — maximum sales charge)] | | $ | 29.08 | | | $ | 10.07 | | | $ | 22.42 | |
| | | | | | | | | | | | |
| | | |
Cost of investments in non-affiliates | | $ | 7,320,401 | | | $ | 381,656 | | | $ | 1,775,467 | |
Cost of investments in affiliates | | | 505,766 | | | | 67,497 | | | | 95,612 | |
Value of securities on loan | | | 3,616 | | | | — | | | | — | |
Proceeds from securities sold short | | | — | | | | 429,255 | | | | — | |
| (a) | Per share amounts may not recalculate due to rounding of net assets and/or shares outstanding. |
| (b) | Redemption price for Class B and Class C Shares varies based upon length of time the shares are held. |
SEE NOTES TO FINANCIAL STATEMENTS.
| | | | | | | | |
| | | |
| DECEMBER 31, 2012 | | J.P. MORGAN MID CAP/MULTI-CAP FUNDS | | | | | 55 | |
STATEMENTS OF OPERATIONS
FOR THE SIX MONTHS ENDED DECEMBER 31, 2012 (Unaudited)
(Amounts in thousands)
| | | | | | | | | | | | | | | | |
| | | Growth
Advantage Fund | | | Mid Cap
Core Fund | | | Mid Cap
Equity Fund | | | Mid Cap
Growth Fund | |
INVESTMENT INCOME: | | | | | | | | | | | | | | | | |
Dividend income from non-affiliates | | $ | 12,854 | | | $ | 8,573 | | | $ | 7,126 | | | $ | 8,168 | |
Dividend income from affiliates | | | 23 | | | | 15 | | | | 16 | | | | 13 | |
Income from securities lending (net) | | | — | | | | — | | | | 1 | | | | 3 | |
| | | | | | | | | | | | | | | | |
Total investment income | | | 12,877 | | | | 8,588 | | | | 7,143 | | | | 8,184 | |
| | | | | | | | | | | | | | | | |
| | | | |
EXPENSES: | | | | | | | | | | | | | | | | |
Investment advisory fees | | | 4,882 | | | | 1,985 | | | | 2,872 | | | | 4,668 | |
Administration fees | | | 647 | | | | 263 | | | | 381 | | | | 619 | |
Distribution fees: | | | | | | | | | | | | | | | | |
Class A | | | 257 | | | | 21 | | | | 11 | | | | 679 | |
Class B | | | 8 | | | | — | | | | — | | | | 34 | |
Class C | | | 111 | | | | — | (a) | | | 6 | | | | 82 | |
Class R2 | | | — | | | | — | (a) | | | — | | | | 1 | |
Shareholder servicing fees: | | | | | | | | | | | | | | | | |
Class A | | | 257 | | | | 21 | | | | 11 | | | | 679 | |
Class B | | | 3 | | | | — | | | | — | | | | 11 | |
Class C | | | 37 | | | | — | (a) | | | 2 | | | | 27 | |
Class R2 | | | — | | | | — | (a) | | | — | | | | — | (a) |
Class R5 | | | 147 | | | | — | (a) | | | — | | | | 4 | |
Select Class | | | 846 | | | | 482 | | | | 1,092 | | | | 1,038 | |
Custodian and accounting fees | | | 31 | | | | 18 | | | | 20 | | | | 35 | |
Professional fees | | | 31 | | | | 27 | | | | 25 | | | | 29 | |
Trustees’ and Chief Compliance Officer’s fees | | | 9 | | | | 3 | | | | 4 | | | | 8 | |
Printing and mailing costs | | | 37 | | | | 10 | | | | 70 | | | | 147 | |
Registration and filing fees | | | 40 | | | | 24 | | | | 38 | | | | 53 | |
Transfer agent fees | | | 186 | | | | 11 | | | | 751 | | | | 823 | |
Other | | | 51 | | | | 6 | | | | 6 | | | | 25 | |
| | | | | | | | | | | | | | | | |
Total expenses | | | 7,580 | | | | 2,871 | | | | 5,289 | | | | 8,962 | |
| | | | | | | | | | | | | | | | |
Less amounts waived | | | (88 | ) | | | (83 | ) | | | (1,318 | ) | | | (1,364 | ) |
| | | | | | | | | | | | | | | | |
Net expenses | | | 7,492 | | | | 2,788 | | | | 3,971 | | | | 7,598 | |
| | | | | | | | | | | | | | | | |
Net investment income (loss) | | | 5,385 | | | | 5,800 | | | | 3,172 | | | | 586 | |
| | | | | | | | | | | | | | | | |
| | | | |
REALIZED/UNREALIZED GAINS (LOSSES): | | | | | | | | | | | | | | | | |
Net realized gain (loss) on transactions from investments in non-affiliates | | | 12,567 | | | | 4,587 | | | | 15,629 | | | | 62,226 | |
| | | | | | | | �� | | | | | | | | |
Change in net unrealized appreciation/depreciation of investments in non-affiliates | | | 54,314 | | | | 25,673 | | | | 49,047 | | | | 37,551 | |
| | | | | | | | | | | | | | | | |
Net realized/unrealized gains (losses) | | | 66,881 | | | | 30,260 | | | | 64,676 | | | | 99,777 | |
| | | | | | | | | | | | | | | | |
Change in net assets resulting from operations | | $ | 72,266 | | | $ | 36,060 | | | $ | 67,848 | | | $ | 100,363 | |
| | | | | | | | | | | | | | | | |
| (a) | Amount rounds to less than $1,000. |
SEE NOTES TO FINANCIAL STATEMENTS.
| | | | | | |
| | | |
| 56 | | | | J.P. MORGAN MID CAP/MULTI-CAP FUNDS | | DECEMBER 31, 2012 |
| | | | | | | | | | | | |
| | | Mid Cap
Value Fund | | | Multi-Cap Market
Neutral Fund | | | Value
Advantage Fund | |
INVESTMENT INCOME: | | | | | | | | | | | | |
Interest income from affiliates | | $ | — | | | $ | 7 | | | $ | — | |
Dividend income from non-affiliates | | | 94,606 | | | | 5,681 | | | | 19,547 | |
Dividend income from affiliates | | | 212 | | | | 35 | | | | 43 | |
Income from securities lending (net) | | | 8 | | | | — | | | | — | |
| | | | | | | | | | | | |
Total investment income | | | 94,826 | | | | 5,723 | | | | 19,590 | |
| | | | | | | | | | | | |
| | | |
EXPENSES: | | | | | | | | | | | | |
Investment advisory fees | | | 28,933 | | | | 3,122 | | | | 4,961 | |
Administration fees | | | 3,833 | | | | 215 | | | | 656 | |
Distribution fees: | | | | | | | | | | | | |
Class A | | | 2,802 | | | | 26 | | | | 378 | |
Class B | | | 182 | | | | 4 | | | | — | |
Class C | | | 1,514 | | | | 54 | | | | 477 | |
Class R2 | | | 59 | | | | — | | | | — | |
Shareholder servicing fees: | | | | | | | | | | | | |
Class A | | | 2,802 | | | | 26 | | | | 378 | |
Class B | | | 60 | | | | 1 | | | | — | |
Class C | | | 505 | | | | 18 | | | | 159 | |
Class R2 | | | 30 | | | | — | | | | — | |
Institutional Class | | | 2,061 | | | | — | | | | 288 | |
Select Class | | | 2,578 | | | | 579 | | | | 651 | |
Custodian and accounting fees | | | 178 | | | | 30 | | | | 34 | |
Professional fees | | | 75 | | | | 29 | | | | 33 | |
Trustees’ and Chief Compliance Officer’s fees | | | 51 | | | | 2 | | | | 9 | |
Printing and mailing costs | | | 590 | | | | 4 | | | | 52 | |
Registration and filing fees | | | 102 | | | | 24 | | | | 28 | |
Transfer agent fees | | | 5,393 | | | | 54 | | | | 626 | |
Other | | | 105 | | | | 11 | | | | 7 | |
Dividend expense to non-affiliates on securities sold short | | | — | | | | 4,300 | | | | — | |
Interest expense to non-affiliates on securities sold short | | | — | | | | 275 | | | | — | |
| | | | | | | | | | | | |
Total expenses | | | 51,853 | | | | 8,774 | | | | 8,737 | |
| | | | | | | | | | | | |
Less amounts waived | | | (8,500 | ) | | | (1,025 | ) | | | (1,036 | ) |
| | | | | | | | | | | | |
Net expenses | | | 43,353 | | | | 7,749 | | | | 7,701 | |
| | | | | | | | | | | | |
Net investment income (loss) | | | 51,473 | | | | (2,026 | ) | | | 11,889 | |
| | | | | | | | | | | | |
| | | |
REALIZED/UNREALIZED GAINS (LOSSES): | | | | | | | | | | | | |
Net realized gain (loss) on transactions from: | | | | | | | | | | | | |
Investments in non-affiliates | | | 233,396 | | | | 12,872 | | | | 21,576 | |
Securities sold short | | | — | | | | (8,904 | ) | | | — | |
Foreign currency transactions | | | — | | | | — | (a) | | | — | |
| | | | | | | | | | | | |
Net realized gain (loss) | | | 233,396 | | | | 3,968 | | | | 21,576 | |
| | | | | | | | | | | | |
Change in net unrealized appreciation/depreciation of: | | | | | | | | | | | | |
Investments in non-affiliates | | | 452,943 | | | | 16,062 | | | | 80,867 | |
Securities sold short | | | — | | | | (24,955 | ) | | | — | |
| | | | | | | | | | | | |
Change in net unrealized appreciation/depreciation | | | 452,943 | | | | (8,893 | ) | | | 80,867 | |
| | | | | | | | | | | | |
Net realized/unrealized gains (losses) | | | 686,339 | | | | (4,925 | ) | | | 102,443 | |
| | | | | | | | | | | | |
Change in net assets resulting from operations | | $ | 737,812 | | | $ | (6,951 | ) | | $ | 114,332 | |
| | | | | | | | | | | | |
| (a) | Amount rounds to less than $1,000. |
SEE NOTES TO FINANCIAL STATEMENTS.
| | | | | | | | |
| | | |
| DECEMBER 31, 2012 | | J.P. MORGAN MID CAP/MULTI-CAP FUNDS | | | | | 57 | |
STATEMENTS OF CHANGES IN NET ASSETS
FOR THE PERIODS INDICATED
(Amounts in thousands)
| | | | | | | | | | | | | | | | |
| | | Growth Advantage Fund | | | Mid Cap Core Fund | |
| | | Six Months Ended
12/31/2012
(Unaudited) | | | Year Ended
6/30/2012 | | | Six Months Ended
12/31/2012
(Unaudited) | | | Year Ended
6/30/2012 | |
CHANGE IN NET ASSETS RESULTING FROM OPERATIONS: | | | | | | | | | | | | | | | | |
Net investment income (loss) | | $ | 5,385 | | | $ | (1,993 | ) | | $ | 5,800 | | | $ | 1,921 | |
Net realized gain (loss) | | | 12,567 | | | | 36,525 | | | | 4,587 | | | | (1,412 | ) |
Change in net unrealized appreciation/depreciation | | | 54,314 | | | | (18,846 | ) | | | 25,673 | | | | 13,816 | |
| | | | | | | | | | | | | | | | |
Change in net assets resulting from operations | | | 72,266 | | | | 15,686 | | | | 36,060 | | | | 14,325 | |
| | | | | | | | | | | | | | | | |
| | | | |
DISTRIBUTIONS TO SHAREHOLDERS: | | | | | | | | | | | | | | | | |
Class A | | | | | | | | | | | | | | | | |
From net investment income | | | (188 | ) | | | — | | | | (194 | ) | | | — | (a) |
From net realized gains | | | (670 | ) | | | — | | | | (241 | ) | | | — | (a) |
Class B | | | | | | | | | | | | | | | | |
From net realized gains | | | (8 | ) | | | — | | | | — | | | | — | |
Class C | | | | | | | | | | | | | | | | |
From net investment income | | | — | | | | — | | | | — | (a) | | | — | (a) |
From net realized gains | | | (106 | ) | | | — | | | | (2 | ) | | | — | (a) |
Class R2 | | | | | | | | | | | | | | | | |
From net investment income | | | — | | | | — | | | | (1 | ) | | | — | (a) |
From net realized gains | | | — | | | | — | | | | (1 | ) | | | — | (a) |
Class R5 | | | | | | | | | | | | | | | | |
From net investment income | | | (2,904 | ) | | | — | | | | (1 | ) | | | — | (a) |
From net realized gains | | | (1,960 | ) | | | — | | | | (1 | ) | | | — | (a) |
Class R6 | | | | | | | | | | | | | | | | |
From net investment income | | | — | | | | — | | | | (3,133 | ) | | | — | (a) |
From net realized gains | | | — | | | | — | | | | (3,322 | ) | | | — | (a) |
Select Class | | | | | | | | | | | | | | | | |
From net investment income | | | (1,645 | ) | | | — | | | | (4,129 | ) | | | (632 | ) |
From net realized gains | | | (2,119 | ) | | | — | | | | (5,178 | ) | | | (94 | ) |
| | | | | | | | | | | | | | | | |
Total distributions to shareholders | | | (9,600 | ) | | | — | | | | (16,203 | ) | | | (726 | ) |
| | | | | | | | | | | | | | | | |
| | | | |
CAPITAL TRANSACTIONS: | | | | | | | | | | | | | | | | |
Change in net assets resulting from capital transactions | | | 60,600 | | | | 123,715 | | | | 392,890 | | | | 244,141 | |
| | | | | | | | | | | | | | | | |
| | | | |
NET ASSETS: | | | | | | | | | | | | | | | | |
Change in net assets | | | 123,266 | | | | 139,401 | | | | 412,747 | | | | 257,740 | |
Beginning of period | | | 1,355,557 | | | | 1,216,156 | | | | 349,522 | | | | 91,782 | |
| | | | | | | | | | | | | | | | |
End of period | | $ | 1,478,823 | | | $ | 1,355,557 | | | $ | 762,269 | | | $ | 349,522 | |
| | | | | | | | | | | | | | | | |
Accumulated undistributed (distributions in excess of) net investment income | | $ | 308 | | | $ | (340 | ) | | $ | (326 | ) | | $ | 1,332 | |
| | | | | | | | | | | | | | | | |
| (a) | Amount rounds to less than $1,000. |
SEE NOTES TO FINANCIAL STATEMENTS.
| | | | | | |
| | | |
| 58 | | | | J.P. MORGAN MID CAP/MULTI-CAP FUNDS | | DECEMBER 31, 2012 |
| | | | | | | | | | | | | | | | |
| | | Mid Cap Equity Fund | | | Mid Cap Growth Fund | |
| | | Six Months Ended
12/31/2012
(Unaudited) | | | Year Ended
6/30/2012 | | | Six Months Ended
12/31/2012
(Unaudited) | | | Year Ended
6/30/2012 | |
CHANGE IN NET ASSETS RESULTING FROM OPERATIONS: | | | | | | | | | | | | | | | | |
Net investment income (loss) | | $ | 3,172 | | | $ | 3,845 | | | $ | 586 | | | $ | (867 | ) |
Net realized gain (loss) | | | 15,629 | | | | 7,873 | | | | 62,226 | | | | 74,384 | |
Change in net unrealized appreciation/depreciation | | | 49,047 | | | | (3,327 | ) | | | 37,551 | | | | (186,566 | ) |
| | | | | | | | | | | | | | | | |
Change in net assets resulting from operations | | | 67,848 | | | | 8,391 | | | | 100,363 | | | | (113,049 | ) |
| | | | | | | | | | | | | | | | |
| | | | |
DISTRIBUTIONS TO SHAREHOLDERS: | | | | | | | | | | | | | | | | |
Class A | | | | | | | | | | | | | | | | |
From net investment income | | | (18 | ) | | | (15 | ) | | | — | | | | — | |
From net realized gains | | | (67 | ) | | | — | | | | (25,563 | ) | | | (55,641 | ) |
Class B | | | | | | | | | | | | | | | | |
From net realized gains | | | — | | | | — | | | | (531 | ) | | | (1,640 | ) |
Class C | | | | | | | | | | | | | | | | |
From net investment income | | | (2 | ) | | | — | (a) | | | — | | | | — | |
From net realized gains | | | (14 | ) | | | — | | | | (1,148 | ) | | | (2,514 | ) |
Class R2 | | | | | | | | | | | | | | | | |
From net realized gains | | | — | | | | — | | | | (11 | ) | | | (16 | ) |
Class R5 (b) | | | | | | | | | | | | | | | | |
From net realized gains | | | — | | | | — | | | | (664 | ) | | | (5 | ) |
Class R6 (b) | | | | | | | | | | | | | | | | |
From net realized gains | | | — | | | | — | | | | (826 | ) | | | (5 | ) |
Select Class | | | | | | | | | | | | | | | | |
From net investment income | | | (2,869 | ) | | | (3,722 | ) | | | — | | | | — | |
From net realized gains | | | (6,163 | ) | | | — | | | | (36,115 | ) | | | (74,559 | ) |
| | | | | | | | | | | | | | | | |
Total distributions to shareholders | | | (9,133 | ) | | | (3,737 | ) | | | (64,858 | ) | | | (134,380 | ) |
| | | | | | | | | | | | | | | | |
| | | | |
CAPITAL TRANSACTIONS: | | | | | | | | | | | | | | | | |
Change in net assets resulting from capital transactions | | | 48,864 | | | | 244,461 | | | | (76,621 | ) | | | (101,508 | ) |
| | | | | | | | | | | | | | | | |
| | | | |
NET ASSETS: | | | | | | | | | | | | | | | | |
Change in net assets | | | 107,579 | | | | 249,115 | | | | (41,116 | ) | | | (348,937 | ) |
Beginning of period | | | 821,334 | | | | 572,219 | | | | 1,426,816 | | | | 1,775,753 | |
| | | | | | | | | | | | | | | | |
End of period | | $ | 928,913 | | | $ | 821,334 | | | $ | 1,385,700 | | | $ | 1,426,816 | |
| | | | | | | | | | | | | | | | |
Accumulated undistributed (distributions in excess of) net investment income | | $ | 77 | | | $ | (206 | ) | | $ | 502 | | | $ | (84 | ) |
| | | | | | | | | | | | | | | | |
| (a) | Amount rounds to less than $1,000. |
| (b) | Commencement of offering of class of shares effective November 1, 2011 for Mid Cap Growth Fund. |
SEE NOTES TO FINANCIAL STATEMENTS.
| | | | | | | | |
| | | |
| DECEMBER 31, 2012 | | J.P. MORGAN MID CAP/MULTI-CAP FUNDS | | | | | 59 | |
STATEMENTS OF CHANGES IN NET ASSETS
FOR THE PERIODS INDICATED (continued)
(Amounts in thousands)
| | | | | | | | | | | | | | | | |
| | | Mid Cap Value Fund | | | Multi-Cap Market Neutral Fund | |
| | | Six Months Ended
12/31/2012
(Unaudited) | | | Year Ended
6/30/2012 | | | Six Months Ended
12/31/2012
(Unaudited) | | | Year Ended
6/30/2012 | |
CHANGE IN NET ASSETS RESULTING FROM OPERATIONS: | | | | | | | | | | | | | | | | |
Net investment income (loss) | | $ | 51,473 | | | $ | 72,482 | | | $ | (2,026 | ) | | $ | (6,364 | ) |
Net realized gain (loss) | | | 233,396 | | | | 226,074 | | | | 3,968 | | | | 27,034 | |
Change in net unrealized appreciation/depreciation | | | 452,943 | | | | 80,566 | | | | (8,893 | ) | | | (26,538 | ) |
| | | | | | | | | | | | | | | | |
Change in net assets resulting from operations | | | 737,812 | | | | 379,122 | | | | (6,951 | ) | | | (5,868 | ) |
| | | | | | | | | | | | | | | | |
| | | | |
DISTRIBUTIONS TO SHAREHOLDERS: | | | | | | | | | | | | | | | | |
Class A | | | | | | | | | | | | | | | | |
From net investment income | | | (25,622 | ) | | | (12,100 | ) | | | — | | | | — | |
From net realized gains | | | (19,155 | ) | | | — | | | | — | | | | — | |
Class B | | | | | | | | | | | | | | | | |
From net realized gains | | | (292 | ) | | | — | | | | — | | | | — | |
Class C | | | | | | | | | | | | | | | | |
From net investment income | | | (2,608 | ) | | | (616 | ) | | | — | | | | — | |
From net realized gains | | | (3,426 | ) | | | — | | | | — | | | | — | |
Class R2 | | | | | | | | | | | | | | | | |
From net investment income | | | (363 | ) | | | (67 | ) | | | — | | | | — | |
From net realized gains | | | (258 | ) | | | — | | | | — | | | | — | |
Institutional Class | | | | | | | | | | | | | | | | |
From net investment income | | | (64,280 | ) | | | (33,157 | ) | | | — | | | | — | |
From net realized gains | | | (34,137 | ) | | | — | | | | — | | | | — | |
Select Class | | | | | | | | | | | | | | | | |
From net investment income | | | (27,916 | ) | | | (14,296 | ) | | | — | | | | — | |
From net realized gains | | | (17,242 | ) | | | — | | | | — | | | | — | |
| | | | | | | | | | | | | | | | |
Total distributions to shareholders | | | (195,299 | ) | | | (60,236 | ) | | | — | | | | — | |
| | | | | | | | | | | | | | | | |
| | | | |
CAPITAL TRANSACTIONS: | | | | | | | | | | | | | | | | |
Change in net assets resulting from capital transactions | | | 1,475,603 | | | | 714,827 | | | | (16,511 | ) | | | (26,939 | ) |
| | | | | | | | | | | | | | | | |
| | | | |
NET ASSETS: | | | | | | | | | | | | | | | | |
Change in net assets | | | 2,018,116 | | | | 1,033,713 | | | | (23,462 | ) | | | (32,807 | ) |
Beginning of period | | | 7,809,547 | | | | 6,775,834 | | | | 513,640 | | | | 546,447 | |
| | | | | | | | | | | | | | | | |
End of period | | $ | 9,827,663 | | | $ | 7,809,547 | | | $ | 490,178 | | | $ | 513,640 | |
| | | | | | | | | | | | | | | | |
Accumulated undistributed (distributions in excess of) net investment income | | $ | 2,964 | | | $ | 72,280 | | | $ | (5,179 | ) | | $ | (3,153 | ) |
| | | | | | | | | | | | | | | | |
SEE NOTES TO FINANCIAL STATEMENTS.
| | | | | | |
| | | |
| 60 | | | | J.P. MORGAN MID CAP/MULTI-CAP FUNDS | | DECEMBER 31, 2012 |
| | | | | | | | |
| | | Value Advantage Fund | |
| | | Six Months Ended
12/31/2012
(Unaudited) | | | Year Ended
6/30/2012 | |
CHANGE IN NET ASSETS RESULTING FROM OPERATIONS: | | | | | | | | |
Net investment income (loss) | | $ | 11,889 | | | $ | 14,184 | |
Net realized gain (loss) | | | 21,576 | | | | 35,802 | |
Change in net unrealized appreciation/depreciation | | | 80,867 | | | | 1,096 | |
| | | | | | | | |
Change in net assets resulting from operations | | | 114,332 | | | | 51,082 | |
| | | | | | | | |
| | |
DISTRIBUTIONS TO SHAREHOLDERS: | | | | | | | | |
Class A | | | | | | | | |
From net investment income | | | (4,504 | ) | | | (2,164 | ) |
From net realized gains | | | (1,946 | ) | | | — | |
Class C | | | | | | | | |
From net investment income | | | (368 | ) | | | (619 | ) |
From net realized gains | | | (536 | ) | | | — | |
Institutional Class | | | | | | | | |
From net investment income | | | (8,338 | ) | | | (4,920 | ) |
From net realized gains | | | (2,763 | ) | | | — | |
Select Class | | | | | | | | |
From net investment income | | | (7,570 | ) | | | (3,577 | ) |
From net realized gains | | | (2,914 | ) | | | — | |
| | | | | | | | |
Total distributions to shareholders | | | (28,939 | ) | | | (11,280 | ) |
| | | | | | | | |
| | |
CAPITAL TRANSACTIONS: | | | | | | | | |
Change in net assets resulting from capital transactions | | | 883,709 | | | | 173,496 | |
| | | | | | | | |
| | |
NET ASSETS: | | | | | | | | |
Change in net assets | | | 969,102 | | | | 213,298 | |
Beginning of period | | | 1,132,139 | | | | 918,841 | |
| | | | | | | | |
End of period | | $ | 2,101,241 | | | $ | 1,132,139 | |
| | | | | | | | |
Accumulated undistributed (distributions in excess of) net
investment income | | $ | 297 | | | $ | 9,188 | |
| | | | | | | | |
SEE NOTES TO FINANCIAL STATEMENTS.
| | | | | | | | |
| | | |
| DECEMBER 31, 2012 | | J.P. MORGAN MID CAP/MULTI-CAP FUNDS | | | | | 61 | |
STATEMENTS OF CHANGES IN NET ASSETS
FOR THE PERIODS INDICATED (continued)
(Amounts in thousands)
| | | | | | | | | | | | | | | | |
| | | Growth Advantage Fund | | | Mid Cap Core Fund | |
| | | Six Months Ended
12/31/2012
(Unaudited) | | | Year Ended
6/30/2012 | | | Six Months Ended
12/31/2012
(Unaudited) | | | Year Ended
6/30/2012 | |
CAPITAL TRANSACTIONS: | | | | | | | | | | | | | | | | |
Class A | | | | | | | | | | | | | | | | |
Proceeds from shares issued | | $ | 46,013 | | | $ | 81,189 | | | $ | 22,093 | | | $ | 463 | |
Dividends and distributions reinvested | | | 834 | | | | — | | | | 434 | | | | — | (a) |
Cost of shares redeemed | | | (38,890 | ) | | | (65,978 | ) | | | (2,417 | ) | | | (281 | ) |
| | | | | | | | | | | | | | | | |
Change in net assets resulting from Class A capital transactions | | $ | 7,957 | | | $ | 15,211 | | | $ | 20,110 | | | $ | 182 | |
| | | | | | | | | | | | | | | | |
Class B | | | | | | | | | | | | | | | | |
Proceeds from shares issued | | $ | 39 | | | $ | 158 | | | $ | — | | | $ | — | |
Dividends and distributions reinvested | | | 7 | | | | — | | | | — | | | | — | |
Cost of shares redeemed | | | (352 | ) | | | (1,004 | ) | | | — | | | | — | |
| | | | | | | | | | | | | | | | |
Change in net assets resulting from Class B capital transactions | | $ | (306 | ) | | $ | (846 | ) | | $ | — | | | $ | — | |
| | | | | | | | | | | | | | | | |
Class C | | | | | | | | | | | | | | | | |
Proceeds from shares issued | | $ | 4,986 | | | $ | 15,180 | | | $ | 23 | | | $ | 50 | |
Dividends and distributions reinvested | | | 83 | | | | — | | | | 2 | | | | — | (a) |
Cost of shares redeemed | | | (3,286 | ) | | | (8,713 | ) | | | (22 | ) | | | (24 | ) |
| | | | | | | | | | | | | | | | |
Change in net assets resulting from Class C capital transactions | | $ | 1,783 | | | $ | 6,467 | | | $ | 3 | | | $ | 26 | |
| | | | | | | | | | | | | | | | |
Class R2 | | | | | | | | | | | | | | | | |
Proceeds from shares issued | | $ | — | | | $ | — | | | $ | 21 | | | $ | — | (a) |
Dividends and distributions reinvested | | | — | | | | — | | | | 2 | | | | — | (a) |
Cost of shares redeemed | | | — | | | | — | | | | — | (a) | | | — | |
| | | | | | | | | | | | | | | | |
Change in net assets resulting from Class R2 capital transactions | | $ | — | | | $ | — | | | $ | 23 | | | $ | — | (a) |
| | | | | | | | | | | | | | | | |
Class R5 | | | | | | | | | | | | | | | | |
Proceeds from shares issued | | $ | 214,353 | | | $ | 289,698 | | | $ | — | | | $ | — | |
Dividends and distributions reinvested | | | 4,864 | | | | — | | | | 2 | | | | — | (a) |
Cost of shares redeemed | | | (84,044 | ) | | | (4,352 | ) | | | — | | | | — | |
| | | | | | | | | | | | | | | | |
Change in net assets resulting from Class R5 capital transactions | | $ | 135,173 | | | $ | 285,346 | | | $ | 2 | | | $ | — | (a) |
| | | | | | | | | | | | | | | | |
Class R6 | | | | | | | | | | | | | | | | |
Proceeds from shares issued | | $ | — | | | $ | — | | | $ | 301,090 | | | $ | 33,949 | |
Dividends and distributions reinvested | | | — | | | | — | | | | 6,360 | | | | — | (a) |
Cost of shares redeemed | | | — | | | | — | | | | (52,619 | ) | | | (6,403 | ) |
| | | | | | | | | | | | | | | | |
Change in net assets resulting from Class R6 capital transactions | | $ | — | | | $ | — | | | $ | 254,831 | | | $ | 27,546 | |
| | | | | | | | | | | | | | | | |
Select Class | | | | | | | | | | | | | | | | |
Proceeds from shares issued | | $ | 44,212 | | | $ | 124,637 | | | $ | 153,497 | | | $ | 282,102 | |
Dividends and distributions reinvested | | | 264 | | | | — | | | | 201 | | | | 9 | |
Cost of shares redeemed | | | (128,483 | ) | | | (307,100 | ) | | | (35,777 | ) | | | (65,724 | ) |
| | | | | | | | | | | | | | | | |
Change in net assets resulting from Select Class capital transactions | | $ | (84,007 | ) | | $ | (182,463 | ) | | $ | 117,921 | | | $ | 216,387 | |
| | | | | | | | | | | | | | | | |
Total change in net assets resulting from capital transactions | | $ | 60,600 | | | $ | 123,715 | | | $ | 392,890 | | | $ | 244,141 | |
| | | | | | | | | | | | | | | | |
| (a) | Amount rounds to less than $1,000. |
SEE NOTES TO FINANCIAL STATEMENTS.
| | | | | | |
| | | |
| 62 | | | | J.P. MORGAN MID CAP/MULTI-CAP FUNDS | | DECEMBER 31, 2012 |
| | | | | | | | | | | | | | | | |
| | | Growth Advantage Fund | | | Mid Cap Core Fund | |
| | | Six Months Ended
12/31/2012
(Unaudited) | | | Year Ended
6/30/2012 | | | Six Months Ended
12/31/2012
(Unaudited) | | | Year Ended
6/30/2012 | |
SHARE TRANSACTIONS: | | | | | | | | | | | | | | | | |
Class A | | | | | | | | | | | | | | | | |
Issued | | | 4,715 | | | | 8,808 | | | | 1,301 | | | | 28 | |
Reinvested | | | 85 | | | | — | | | | 25 | | | | — | (a) |
Redeemed | | | (3,963 | ) | | | (7,290 | ) | | | (137 | ) | | | (17 | ) |
| | | | | | | | | | | | | | | | |
Change in Class A Shares | | | 837 | | | | 1,518 | | | | 1,189 | | | | 11 | |
| | | | | | | | | | | | | | | | |
Class B | | | | | | | | | | | | | | | | |
Issued | | | 4 | | | | 19 | | | | — | | | | — | |
Reinvested | | | 1 | | | | — | | | | — | | | | — | |
Redeemed | | | (39 | ) | | | (120 | ) | | | — | | | | — | |
| | | | | | | | | | | | | | | | |
Change in Class B Shares | | | (34 | ) | | | (101 | ) | | | — | | | | — | |
| | | | | | | | | | | | | | | | |
Class C | | | | | | | | | | | | | | | | |
Issued | | | 558 | | | | 1,759 | | | | 1 | | | | 2 | |
Reinvested | | | 9 | | | | — | | | | — | (a) | | | — | (a) |
Redeemed | | | (364 | ) | | | (1,026 | ) | | | (1 | ) | | | (1 | ) |
| | | | | | | | | | | | | | | | |
Change in Class C Shares | | | 203 | | | | 733 | | | | — | (a) | | | 1 | |
| | | | | | | | | | | | | | | | |
Class R2 | | | | | | | | | | | | | | | | |
Issued | | | — | | | | — | | | | 2 | | | | — | (a) |
Reinvested | | | — | | | | — | | | | — | (a) | | | — | (a) |
Redeemed | | | — | | | | — | | | | — | (a) | | | — | |
| | | | | | | | | | | | | | | | |
Change in Class R2 Shares | | | — | | | | — | | | | 2 | | | | — | (a) |
| | | | | | | | | | | | | | | | |
Class R5 | | | | | | | | | | | | | | | | |
Issued | | | 22,017 | | | | 29,732 | | | | — | | | | — | |
Reinvested | | | 481 | | | | — | | | | — | (a) | | | — | (a) |
Redeemed | | | (8,475 | ) | | | (477 | ) | | | — | | | | — | |
| | | | | | | | | | | | | | | | |
Change in Class R5 Shares | | | 14,023 | | | | 29,255 | | | | — | (a) | | | — | (a) |
| | | | | | | | | | | | | | | | |
Class R6 | | | | | | | | | | | | | | | | |
Issued | | | — | | | | — | | | | 17,124 | | | | 2,008 | |
Reinvested | | | — | | | | — | | | | 356 | | | | — | (a) |
Redeemed | | | — | | | | — | | | | (2,988 | ) | | | (371 | ) |
| | | | | | | | | | | | | | | | |
Change in Class R6 Shares | | | — | | | | — | | | | 14,492 | | | | 1,637 | |
| | | | | | | | | | | | | | | | |
Select Class | | | | | | | | | | | | | | | | |
Issued | | | 4,468 | | | | 13,293 | | | | 8,649 | | | | 17,322 | |
Reinvested | | | 26 | | | | — | | | | 11 | | | | — | (a) |
Redeemed | | | (12,897 | ) | | | (33,452 | ) | | | (2,020 | ) | | | (3,965 | ) |
| | | | | | | | | | | | | | | | |
Change in Select Class Shares | | | (8,403 | ) | | | (20,159 | ) | | | 6,640 | | | | 13,357 | |
| | | | | | | | | | | | | | | | |
| (a) | Amount rounds to less than 1,000. |
SEE NOTES TO FINANCIAL STATEMENTS.
| | | | | | | | |
| | | |
| DECEMBER 31, 2012 | | J.P. MORGAN MID CAP/MULTI-CAP FUNDS | | | | | 63 | |
STATEMENTS OF CHANGES IN NET ASSETS
FOR THE PERIODS INDICATED (continued)
(Amounts in thousands)
| | | | | | | | | | | | | | | | |
| | | Mid Cap Equity Fund | | | Mid Cap Growth Fund | |
| | | Six Months Ended
12/31/2012
(Unaudited) | | | Year Ended
6/30/2012 | | | Six Months Ended
12/31/2012
(Unaudited) | | | Year Ended
6/30/2012 | |
CAPITAL TRANSACTIONS: | | | | | | | | | | | | | | | | |
Class A | | | | | | | | | | | | | | | | |
Proceeds from shares issued | | $ | 3,539 | | | $ | 5,617 | | | $ | 15,870 | | | $ | 56,755 | |
Dividends and distributions reinvested | | | 85 | | | | 15 | | | | 23,844 | | | | 51,675 | |
Cost of shares redeemed | | | (923 | ) | | | (1,592 | ) | | | (56,467 | ) | | | (161,251 | ) |
| | | | | | | | | | | | | | | | |
Change in net assets resulting from Class A capital transactions | | $ | 2,701 | | | $ | 4,040 | | | $ | (16,753 | ) | | $ | (52,821 | ) |
| | | | | | | | | | | | | | | | |
Class B | | | | | | | | | | | | | | | | |
Proceeds from shares issued | | $ | — | | | $ | — | | | $ | 78 | | | $ | 386 | |
Dividends and distributions reinvested | | | — | | | | — | | | | 512 | | | | 1,556 | |
Cost of shares redeemed | | | — | | | | — | | | | (2,206 | ) | | | (7,602 | ) |
| | | | | | | | | | | | | | | | |
Change in net assets resulting from Class B capital transactions | | $ | — | | | $ | — | | | $ | (1,616 | ) | | $ | (5,660 | ) |
| | | | | | | | | | | | | | | | |
Class C | | | | | | | | | | | | | | | | |
Proceeds from shares issued | | $ | 859 | | | $ | 1,031 | | | $ | 626 | | | $ | 2,483 | |
Dividends and distributions reinvested | | | 16 | | | | — | (a) | | | 948 | | | | 2,079 | |
Cost of shares redeemed | | | (100 | ) | | | (204 | ) | | | (3,312 | ) | | | (6,708 | ) |
| | | | | | | | | | | | | | | | |
Change in net assets resulting from Class C capital transactions | | $ | 775 | | | $ | 827 | | | $ | (1,738 | ) | | $ | (2,146 | ) |
| | | | | | | | | | | | | | | | |
Class R2 | | | | | | | | | | | | | | | | |
Proceeds from shares issued | | $ | — | | | $ | — | | | $ | 37 | | | $ | 149 | |
Dividends and distributions reinvested | | | — | | | | — | | | | 11 | | | | 16 | |
Cost of shares redeemed | | | — | | | | — | | | | (36 | ) | | | (20 | ) |
| | | | | | | | | | | | | | | | |
Change in net assets resulting from Class R2 capital transactions | | $ | — | | | $ | — | | | $ | 12 | | | $ | 145 | |
| | | | | | | | | | | | | | | | |
Class R5 (b) | | | | | | | | | | | | | | | | |
Proceeds from shares issued | | $ | — | | | $ | — | | | $ | 1,213 | | | $ | 16,731 | |
Dividends and distributions reinvested | | | — | | | | — | | | | 664 | | | | 5 | |
Cost of shares redeemed | | | — | | | | — | | | | (1,845 | ) | | | (1,084 | ) |
| | | | | | | | | | | | | | | | |
Change in net assets resulting from Class R5 capital transactions | | $ | — | | | $ | — | | | $ | 32 | | | $ | 15,652 | |
| | | | | | | | | | | | | | | | |
Class R6 (b) | | | | | | | | | | | | | | | | |
Proceeds from shares issued | | $ | — | | | $ | — | | | $ | 5,704 | | | $ | 15,116 | |
Dividends and distributions reinvested | | | — | | | | — | | | | 826 | | | | 5 | |
Cost of shares redeemed | | | — | | | | — | | | | (1,633 | ) | | | (388 | ) |
| | | | | | | | | | | | | | | | |
Change in net assets resulting from Class R6 capital transactions | | $ | — | | | $ | — | | | $ | 4,897 | | | $ | 14,733 | |
| | | | | | | | | | | | | | | | |
Select Class | | | | | | | | | | | | | | | | |
Proceeds from shares issued | | $ | 133,867 | | | $ | 389,366 | | | $ | 46,809 | | | $ | 195,789 | |
Dividends and distributions reinvested | | | 7,867 | | | | 3,142 | | | | 30,576 | | | | 62,923 | |
Cost of shares redeemed | | | (96,346 | ) | | | (152,914 | ) | | | (138,840 | ) | | | (330,123 | ) |
| | | | | | | | | | | | | | | | |
Change in net assets resulting from Select Class capital transactions | | $ | 45,388 | | | $ | 239,594 | | | $ | (61,455 | ) | | $ | (71,411 | ) |
| | | | | | | | | | | | | | | | |
Total change in net assets resulting from capital transactions | | $ | 48,864 | | | $ | 244,461 | | | $ | (76,621 | ) | | $ | (101,508 | ) |
| | | | | | | | | | | | | | | | |
| (a) | Amount rounds to less than $1,000. |
| (b) | Commencement of offering of class of shares effective November 1, 2011 for Mid Cap Growth Fund. |
SEE NOTES TO FINANCIAL STATEMENTS.
| | | | | | |
| | | |
| 64 | | | | J.P. MORGAN MID CAP/MULTI-CAP FUNDS | | DECEMBER 31, 2012 |
| | | | | | | | | | | | | | | | |
| | | Mid Cap Equity Fund | | | Mid Cap Growth Fund | |
| | | Six Months Ended
12/31/2012
(Unaudited) | | | Year Ended
6/30/2012 | | | Six Months Ended
12/31/2012
(Unaudited) | | | Year Ended
6/30/2012 | |
SHARE TRANSACTIONS: | | | | | | | | | | | | | | | | |
Class A | | | | | | | | | | | | | | | | |
Issued | | | 108 | | | | 186 | | | | 787 | | | | 2,826 | |
Reinvested | | | 3 | | | | 1 | | | | 1,214 | | | | 2,951 | |
Redeemed | | | (29 | ) | | | (55 | ) | | | (2,802 | ) | | | (8,087 | ) |
| | | | | | | | | | | | | | | | |
Change in Class A Shares | | | 82 | | | | 132 | | | | (801 | ) | | | (2,310 | ) |
| | | | | | | | | | | | | | | | |
Class B | | | | | | | | | | | | | | | | |
Issued | | | — | | | | — | | | | 5 | | | | 26 | |
Reinvested | | | — | | | | — | | | | 35 | | | | 117 | |
Redeemed | | | — | | | | — | | | | (145 | ) | | | (489 | ) |
| | | | | | | | | | | | | | | | |
Change in Class B Shares | | | — | | | | — | | | | (105 | ) | | | (346 | ) |
| | | | | | | | | | | | | | | | |
Class C | | | | | | | | | | | | | | | | |
Issued | | | 27 | | | | 33 | | | | 37 | | | | 137 | |
Reinvested | | | — | (a) | | | — | (a) | | | 55 | | | | 135 | |
Redeemed | | | (3 | ) | | | (7 | ) | | | (187 | ) | | | (378 | ) |
| | | | | | | | | | | | | | | | |
Change in Class C Shares | | | 24 | | | | 26 | | | | (95 | ) | | | (106 | ) |
| | | | | | | | | | | | | | | | |
Class R2 | | | | | | | | | | | | | | | | |
Issued | | | — | | | | — | | | | 2 | | | | 6 | |
Reinvested | | | — | | | | — | | | | 1 | | | | 1 | |
Redeemed | | | — | | | | — | | | | (2 | ) | | | (1 | ) |
| | | | | | | | | | | | | | | | |
Change in Class R2 Shares | | | — | | | | — | | | | 1 | | | | 6 | |
| | | | | | | | | | | | | | | | |
Class R5 (b) | | | | | | | | | | | | | | | | |
Issued | | | — | | | | — | | | | 54 | | | | 749 | |
Reinvested | | | — | | | | — | | | | 31 | | | | — | (a) |
Redeemed | | | — | | | | — | | | | (83 | ) | | | (48 | ) |
| | | | | | | | | | | | | | | | |
Change in Class R5 Shares | | | — | | | | — | | | | 2 | | | | 701 | |
| | | | | | | | | | | | | | | | |
Class R6 (b) | | | | | | | | | | | | | | | | |
Issued | | | — | | | | — | | | | 253 | | | | 677 | |
Reinvested | | | — | | | | — | | | | 39 | | | | — | (a) |
Redeemed | | | — | | | | — | | | | (76 | ) | | | (17 | ) |
| | | | | | | | | | | | | | | | |
Change in Class R6 Shares | | | — | | | | — | | | | 216 | | | | 660 | |
| | | | | | | | | | | | | | | | |
Select Class | | | | | | | | | | | | | | | | |
Issued | | | 4,108 | | | | 13,099 | | | | 2,151 | | | | 9,090 | |
Reinvested | | | 238 | | | | 105 | | | | 1,429 | | | | 3,322 | |
Redeemed | | | (2,951 | ) | | | (5,154 | ) | | | (6,353 | ) | | | (14,607 | ) |
| | | | | | | | | | | | | | | | |
Change in Select Class Shares | | | 1,395 | | | | 8,050 | | | | (2,773 | ) | | | (2,195 | ) |
| | | | | | | | | | | | | | | | |
| (a) | Amount rounds to less than 1,000. |
| (b) | Commencement of offering of class of shares effective November 1, 2011 for Mid Cap Growth Fund. |
SEE NOTES TO FINANCIAL STATEMENTS.
| | | | | | | | |
| | | |
| DECEMBER 31, 2012 | | J.P. MORGAN MID CAP/MULTI-CAP FUNDS | | | | | 65 | |
STATEMENTS OF CHANGES IN NET ASSETS
FOR THE PERIODS INDICATED (continued)
(Amounts in thousands)
| | | | | | | | | | | | | | | | |
| | | Mid Cap Value Fund | | | Multi-Cap Market Neutral Fund | |
| | | Six Months Ended 12/31/2012
(Unaudited) | | | Year Ended 6/30/2012 | | | Six Months Ended 12/31/2012
(Unaudited) | | | Year Ended 6/30/2012 | |
CAPITAL TRANSACTIONS: | | | | | | | | | | | | | | | | |
Class A | | | | | | | | | | | | | | | | |
Proceeds from shares issued | | $ | 559,109 | | | $ | 443,021 | | | $ | 4,181 | | | $ | 5,323 | |
Dividends and distributions reinvested | | | 42,247 | | | | 11,492 | | | | — | | | | — | |
Cost of shares redeemed | | | (261,337 | ) | | | (520,453 | ) | | | (4,007 | ) | | | (14,467 | ) |
| | | | | | | | | | | | | | | | |
Change in net assets resulting from Class A capital transactions | | $ | 340,019 | | | $ | (65,940 | ) | | $ | 174 | | | $ | (9,144 | ) |
| | | | | | | | | | | | | | | | |
Class B | | | | | | | | | | | | | | | | |
Proceeds from shares issued | | $ | 230 | | | $ | 333 | | | $ | 3 | | | $ | 11 | |
Dividends and distributions reinvested | | | 267 | | | | — | | | | — | | | | — | |
Cost of shares redeemed | | | (25,234 | ) | | | (34,648 | ) | | | (404 | ) | | | (2,045 | ) |
| | | | | | | | | | | | | | | | |
Change in net assets resulting from Class B capital transactions | | $ | (24,737 | ) | | $ | (34,315 | ) | | $ | (401 | ) | | $ | (2,034 | ) |
| | | | | | | | | | | | | | | | |
Class C | | | | | | | | | | | | | | | | |
Proceeds from shares issued | | $ | 61,517 | | | $ | 48,613 | | | $ | 41 | | | $ | 572 | |
Dividends and distributions reinvested | | | 4,745 | | | | 474 | | | | — | | | | — | |
Cost of shares redeemed | | | (35,245 | ) | | | (64,672 | ) | | | (3,278 | ) | | | (6,619 | ) |
| | | | | | | | | | | | | | | | |
Change in net assets resulting from Class C capital transactions | | $ | 31,017 | | | $ | (15,585 | ) | | $ | (3,237 | ) | | $ | (6,047 | ) |
| | | | | | | | | | | | | | | | |
Class R2 | | | | | | | | | | | | | | | | |
Proceeds from shares issued | | $ | 20,006 | | | $ | 10,239 | | | $ | — | | | $ | — | |
Dividends and distributions reinvested | | | 576 | | | | 59 | | | | — | | | | — | |
Cost of shares redeemed | | | (3,346 | ) | | | (2,629 | ) | | | — | | | | — | |
| | | | | | | | | | | | | | | | |
Change in net assets resulting from Class R2 capital transactions | | $ | 17,236 | | | $ | 7,669 | | | $ | — | | | $ | — | |
| | | | | | | | | | | | | | | | |
Institutional Class | | | | | | | | | | | | | | | | |
Proceeds from shares issued | | $ | 1,218,688 | | | $ | 1,125,771 | | | $ | — | | | $ | — | |
Dividends and distributions reinvested | | | 79,639 | | | | 25,512 | | | | — | | | | — | |
Cost of shares redeemed | | | (491,078 | ) | | | (575,416 | ) | | | — | | | | — | |
| | | | | | | | | | | | | | | | |
Change in net assets resulting from Institutional Class capital transactions | | $ | 807,249 | | | $ | 575,867 | | | $ | — | | | $ | — | |
| | | | | | | | | | | | | | | | |
Select Class | | | | | | | | | | | | | | | | |
Proceeds from shares issued | | $ | 486,813 | | | $ | 675,718 | | | $ | 27,663 | | | $ | 42,277 | |
Dividends and distributions reinvested | | | 34,904 | | | | 10,362 | | | | — | | | | — | |
Cost of shares redeemed | | | (216,898 | ) | | | (438,949 | ) | | | (40,710 | ) | | | (51,991 | ) |
| | | | | | | | | | | | | | | | |
Change in net assets resulting from Select Class capital transactions | | $ | 304,819 | | | $ | 247,131 | | | $ | (13,047 | ) | | $ | (9,714 | ) |
| | | | | | | | | | | | | | | | |
Total change in net assets resulting from capital transactions | | $ | 1,475,603 | | | $ | 714,827 | | | $ | (16,511 | ) | | $ | (26,939 | ) |
| | | | | | | | | | | | | | | | |
SEE NOTES TO FINANCIAL STATEMENTS.
| | | | | | |
| | | |
| 66 | | | | J.P. MORGAN MID CAP/MULTI-CAP FUNDS | | DECEMBER 31, 2012 |
| | | | | | | | | | | | | | | | |
| | | Mid Cap Value Fund | | | Multi-Cap Market Neutral Fund | |
| | | Six Months Ended
12/31/2012
(Unaudited) | | | Year Ended
6/30/2012 | | | Six Months Ended
12/31/2012
(Unaudited) | | | Year Ended
6/30/2012 | |
SHARE TRANSACTIONS: | | | | | | | | | | | | | | | | |
Class A | | | | | | | | | | | | | | | | |
Issued | | | 20,477 | | | | 18,306 | | | | 433 | | | | 546 | |
Reinvested | | | 1,526 | | | | 500 | | | | — | | | | — | |
Redeemed | | | (9,623 | ) | | | (21,746 | ) | | | (417 | ) | | | (1,486 | ) |
| | | | | | | | | | | | | | | | |
Change in Class A Shares | | | 12,380 | | | | (2,940 | ) | | | 16 | | | | (940 | ) |
| | | | | | | | | | | | | | | | |
Class B | | | | | | | | | | | | | | | | |
Issued | | | 8 | | | | 14 | | | | — | (a) | | | 1 | |
Reinvested | | | 10 | | | | — | | | | — | | | | — | |
Redeemed | | | (950 | ) | | | (1,497 | ) | | | (44 | ) | | | (218 | ) |
| | | | | | | | | | | | | | | | |
Change in Class B Shares | | | (932 | ) | | | (1,483 | ) | | | (44 | ) | | | (217 | ) |
| | | | | | | | | | | | | | | | |
Class C | | | | | | | | | | | | | | | | |
Issued | | | 2,321 | | | | 2,044 | | | | 5 | | | | 60 | |
Reinvested | | | 176 | | | | 21 | | | | — | | | | — | |
Redeemed | | | (1,331 | ) | | | (2,794 | ) | | | (356 | ) | | | (705 | ) |
| | | | | | | | | | | | | | | | |
Change in Class C Shares | | | 1,166 | | | | (729 | ) | | | (351 | ) | | | (645 | ) |
| | | | | | | | | | | | | | | | |
Class R2 | | | | | | | | | | | | | | | | |
Issued | | | 758 | | | | 428 | | | | — | | | | — | |
Reinvested | | | 22 | | | | 3 | | | | — | | | | — | |
Redeemed | | | (126 | ) | | | (110 | ) | | | — | | | | — | |
| | | | | | | | | | | | | | | | |
Change in Class R2 Shares | | | 654 | | | | 321 | | | | — | | | | — | |
| | | | | | | | | | | | | | | | |
Institutional Class | | | | | | | | | | | | | | | | |
Issued | | | 44,146 | | | | 45,939 | | | | — | | | | — | |
Reinvested | | | 2,827 | | | | 1,094 | | | | — | | | | — | |
Redeemed | | | (17,698 | ) | | | (23,648 | ) | | | — | | | | — | |
| | | | | | | | | | | | | | | | |
Change in Institutional Class Shares | | | 29,275 | | | | 23,385 | | | | — | | | | — | |
| | | | | | | | | | | | | | | | |
Select Class | | | | | | | | | | | | | | | | |
Issued | | | 17,783 | | | | 27,581 | | | | 2,851 | | | | 4,266 | |
Reinvested | | | 1,250 | | | | 448 | | | | — | | | | — | |
Redeemed | | | (7,910 | ) | | | (18,067 | ) | | | (4,145 | ) | | | (5,300 | ) |
| | | | | | | | | | | | | | | | |
Change in Select Class Shares | | | 11,123 | | | | 9,962 | | | | (1,294 | ) | | | (1,034 | ) |
| | | | | | | | | | | | | | | | |
| (a) | Amount rounds to less than 1,000. |
SEE NOTES TO FINANCIAL STATEMENTS.
| | | | | | | | |
| | | |
| DECEMBER 31, 2012 | | J.P. MORGAN MID CAP/MULTI-CAP FUNDS | | | | | 67 | |
STATEMENTS OF CHANGES IN NET ASSETS
FOR THE PERIODS INDICATED (continued)
(Amounts in thousands)
| | | | | | | | |
| | | Value Advantage Fund | |
| | | Six Months Ended
12/31/2012
(Unaudited) | | | Year Ended
6/30/2012 | |
CAPITAL TRANSACTIONS: | | | | | | | | |
Class A | | | | | | | | |
Proceeds from shares issued | | $ | 316,735 | | | $ | 54,549 | |
Dividends and distributions reinvested | | | 6,154 | | | | 2,006 | |
Cost of shares redeemed | | | (46,868 | ) | | | (89,323 | ) |
| | | | | | | | |
Change in net assets resulting from Class A capital transactions | | $ | 276,021 | | | $ | (32,768 | ) |
| | | | | | | | |
Class C | | | | | | | | |
Proceeds from shares issued | | $ | 18,226 | | | $ | 11,596 | |
Dividends and distributions reinvested | | | 752 | | | | 513 | |
Cost of shares redeemed | | | (10,556 | ) | | | (30,037 | ) |
| | | | | | | | |
Change in net assets resulting from Class C capital transactions | | $ | 8,422 | | | $ | (17,928 | ) |
| | | | | | | | |
Institutional Class | | | | | �� | | | |
Proceeds from shares issued | | $ | 345,066 | | | $ | 136,991 | |
Dividends and distributions reinvested | | | 10,007 | | | | 4,597 | |
Cost of shares redeemed | | | (34,407 | ) | | | (56,466 | ) |
| | | | | | | | |
Change in net assets resulting from Institutional Class capital transactions | | $ | 320,666 | | | $ | 85,122 | |
| | | | | | | | |
Select Class | | | | | | | | |
Proceeds from shares issued | | $ | 299,932 | | | $ | 260,984 | |
Dividends and distributions reinvested | | | 7,729 | | | | 2,687 | |
Cost of shares redeemed | | | (29,061 | ) | | | (124,601 | ) |
| | | | | | | | |
Change in net assets resulting from Select Class capital transactions | | $ | 278,600 | | | $ | 139,070 | |
| | | | | | | | |
Total change in net assets resulting from capital transactions | | $ | 883,709 | | | $ | 173,496 | |
| | | | | | | | |
| | |
SHARE TRANSACTIONS: | | | | | | | | |
Class A | | | | | | | | |
Issued | | | 15,076 | | | | 2,947 | |
Reinvested | | | 287 | | | | 112 | |
Redeemed | | | (2,232 | ) | | | (4,870 | ) |
| | | | | | | | |
Change in Class A Shares | | | 13,131 | | | | (1,811 | ) |
| | | | | | | | |
Class C | | | | | | | | |
Issued | | | 872 | | | | 620 | |
Reinvested | | | 35 | | | | 29 | |
Redeemed | | | (506 | ) | | | (1,655 | ) |
| | | | | | | | |
Change in Class C Shares | | | 401 | | | | (1,006 | ) |
| | | | | | | | |
Institutional Class | | | | | | | | |
Issued | | | 16,538 | | | | 7,210 | |
Reinvested | | | 466 | | | | 258 | |
Redeemed | | | (1,647 | ) | | | (3,118 | ) |
| | | | | | | | |
Change in Institutional Class Shares | | | 15,357 | | | | 4,350 | |
| | | | | | | | |
Select Class | | | | | | | | |
Issued | | | 14,281 | | | | 13,542 | |
Reinvested | | | 360 | | | | 150 | |
Redeemed | | | (1,380 | ) | | | (6,701 | ) |
| | | | | | | | |
Change in Select Class Shares | | | 13,261 | | | | 6,991 | |
| | | | | | | | |
SEE NOTES TO FINANCIAL STATEMENTS.
| | | | | | |
| | | |
| 68 | | | | J.P. MORGAN MID CAP/MULTI-CAP FUNDS | | DECEMBER 31, 2012 |
THIS PAGE IS INTENTIONALLY LEFT BLANK
FINANCIAL HIGHLIGHTS
FOR THE PERIODS INDICATED
| | | | | | | | | | | | | | | | | | | | | | | | | | | | |
| | | | | | Per share operating performance | |
| | | | | | Investment operations | | | Distributions | |
| | | Net asset
value,
beginning
of period | | | Net
investment
income
(loss) | | | Net realized
and unrealized gains (losses) on
investments | | | Total from
investment
operations | | | Net
investment
income | | | Net
realized
gain | | | Total
distributions | |
Growth Advantage Fund | |
Class A | |
Six Months Ended December 31, 2012 (Unaudited) | | $ | 9.49 | | | $ | 0.02 | (f)(g) | | $ | 0.42 | | | $ | 0.44 | | | $ | (0.01 | ) | | $ | (0.03 | ) | | $ | (0.04 | ) |
Year Ended June 30, 2012 | | | 9.28 | | | | (0.03 | )(f)(h) | | | 0.24 | | | | 0.21 | | | | — | | | | — | | | | — | |
Year Ended June 30, 2011 | | | 6.76 | | | | (0.04 | )(f) | | | 2.56 | | | | 2.52 | | | | — | | | | — | | | | — | |
Year Ended June 30, 2010 | | | 5.88 | | | | (0.03 | )(f) | | | 0.91 | | | | 0.88 | | | | — | | | | — | | | | — | |
Year Ended June 30, 2009 | | | 8.14 | | | | (0.03 | )(f) | | | (2.23 | ) | | | (2.26 | ) | | | — | | | | — | | | | — | |
Year Ended June 30, 2008 | | | 8.18 | | | | (0.05 | )(f) | | | 0.01 | | | | (0.04 | ) | | | — | | | | — | | | | — | |
| | | | | | | |
Class B | | | | | | | | | | | | | | | | | | | | | | | | | | | | |
Six Months Ended December 31, 2012 (Unaudited) | | | 8.76 | | | | — | (f)(g)(i) | | | 0.38 | | | | 0.38 | | | | — | | | | (0.03 | ) | | | (0.03 | ) |
Year Ended June 30, 2012 | | | 8.61 | | | | (0.07 | )(f)(h) | | | 0.22 | | | | 0.15 | | | | — | | | | — | | | | — | |
Year Ended June 30, 2011 | | | 6.31 | | | | (0.07 | )(f) | | | 2.37 | | | | 2.30 | | | | — | | | | — | | | | — | |
Year Ended June 30, 2010 | | | 5.51 | | | | (0.06 | )(f) | | | 0.86 | | | | 0.80 | | | | — | | | | — | | | | — | |
Year Ended June 30, 2009 | | | 7.67 | | | | (0.06 | )(f) | | | (2.10 | ) | | | (2.16 | ) | | | — | | | | — | | | | — | |
Year Ended June 30, 2008 | | | 7.76 | | | | (0.09 | )(f) | | | — | (h) | | | (0.09 | ) | | | — | | | | — | | | | — | |
| | | | | | | |
Class C | | | | | | | | | | | | | | | | | | | | | | | | | | | | |
Six Months Ended December 31, 2012 (Unaudited) | | | 8.77 | | | | — | (f)(g)(i) | | | 0.38 | | | | 0.38 | | | | — | | | | (0.03 | ) | | | (0.03 | ) |
Year Ended June 30, 2012 | | | 8.61 | | | | (0.07 | )(f)(h) | | | 0.23 | | | | 0.16 | | | | — | | | | — | | | | — | |
Year Ended June 30, 2011 | | | 6.31 | | | | (0.08 | )(f) | | | 2.38 | | | | 2.30 | | | | — | | | | — | | | | — | |
Year Ended June 30, 2010 | | | 5.52 | | | | (0.06 | )(f) | | | 0.85 | | | | 0.79 | | | | — | | | | — | | | | — | |
Year Ended June 30, 2009 | | | 7.68 | | | | (0.06 | )(f) | | | (2.10 | ) | | | (2.16 | ) | | | — | | | | — | | | | — | |
Year Ended June 30, 2008 | | | 7.76 | | | | (0.09 | )(f) | | | 0.01 | | | | (0.08 | ) | | | — | | | | — | | | | — | |
| | | | | | | |
Class R5 | | | | | | | | | | | | | | | | | | | | | | | | | | | | |
Six Months Ended December 31, 2012 (Unaudited) | | | 9.69 | | | | 0.05 | (f)(g) | | | 0.43 | | | | 0.48 | | | | (0.05 | ) | | | (0.03 | ) | | | (0.08 | ) |
Year Ended June 30, 2012 | | | 9.44 | | | | 0.01 | (f)(h) | | | 0.24 | | | | 0.25 | | | | — | | | | — | | | | — | |
Year Ended June 30, 2011 | | | 6.86 | | | | — | (f)(i) | | | 2.58 | | | | 2.58 | | | | — | | | | — | | | | — | |
Year Ended June 30, 2010 | | | 5.93 | | | | — | (f)(i) | | | 0.93 | | | | 0.93 | | | | — | | | | — | | | | — | |
January 8, 2009 (j) through June 30, 2009 | | | 5.37 | | | | — | (f)(i) | | | 0.56 | | | | 0.56 | | | | — | | | | — | | | | — | |
| | | | | | | |
Select Class | | | | | | | | | | | | | | | | | | | | | | | | | | | | |
Six Months Ended December 31, 2012 (Unaudited) | | | 9.63 | | | | 0.03 | (f)(g) | | | 0.42 | | | | 0.45 | | | | (0.02 | ) | | | (0.03 | ) | | | (0.05 | ) |
Year Ended June 30, 2012 | | | 9.39 | | | | (0.02 | )(f)(h) | | | 0.26 | | | | 0.24 | | | | — | | | | — | | | | — | |
Year Ended June 30, 2011 | | | 6.83 | | | | (0.02 | )(f) | | | 2.58 | | | | 2.56 | | | | — | | | | — | | | | — | |
Year Ended June 30, 2010 | | | 5.93 | | | | (0.01 | )(f) | | | 0.91 | | | | 0.90 | | | | — | | | | — | | | | — | |
Year Ended June 30, 2009 | | | 8.18 | | | | (0.01 | )(f) | | | (2.24 | ) | | | (2.25 | ) | | | — | | | | — | | | | — | |
Year Ended June 30, 2008 | | | 8.20 | | | | (0.03 | )(f) | | | 0.01 | | | | (0.02 | ) | | | — | | | | — | | | | — | |
| (a) | Annualized for periods less than one year. |
| (b) | Not annualized for periods less than one year. |
| (c) | Includes adjustments in accordance with accounting principles generally accepted in the United States of America and as such, the net asset values for financial reporting purposes and the returns based upon those net asset values may differ from the net asset values and returns for shareholder transactions. |
| (d) | Includes earnings credits and interest expense, if applicable, each of which is less than 0.01% or unless otherwise noted. |
| (e) | Portfolio turnover is calculated by dividing the lesser of total purchases or sales of portfolio securities for the reporting period by the monthly average of portfolio securities owned during the reporting period. Excluded from both the numerator and denominator are amounts relating to derivatives and securities whose maturities or expiration dates at the time of acquisition were one year or less. |
| (f) | Calculated based upon average shares outstanding. |
| (g) | Reflects special dividends paid out during the period by several of the Fund’s holdings. Had the Fund not received the special dividends the net investment income (loss) per share would have been $0.01, $(0.02), $(0.02), $0.03 and $0.02 for Class A, Class B, Class C, Class R5 and Select Class Shares, respectively and the net investment income (loss) ratio would have been 0.13%, (0.39)%, (0.35)%, 0.61% and 0.34% for Class A, Class B, Class C, Class R5 and Select Class Shares, respectively. |
| (h) | Reflects a special dividend paid out during the period by one of the Fund’s holdings. Had the Fund not received the special dividend the net investment income (loss) per share would have been $(0.05), $(0.09), $(0.09), $(0.01) and $(0.03) for Class A, Class B, Class C, Class R5 and Select Class Shares, respectively and the net investment income (loss) ratio would have been (0.56)%, (1.08)%, (1.03)%, (0.12)% and (0.37)% for Class A, Class B, Class C, Class R5 and Select Class Shares, respectively. |
| (i) | Amount rounds to less than $0.01. |
| (j) | Commencement of offering of class of shares. |
SEE NOTES TO FINANCIAL STATEMENTS.
| | | | | | |
| | | |
| 70 | | | | J.P. MORGAN MID CAP/MULTI-CAP FUNDS | | DECEMBER 31, 2012 |
| | | | | | | | | | | | | | | | | | | | | | | | | | |
| | | Ratios/Supplemental data | |
| | | | | | | | | | Ratios to average net assets (a) | | | | |
Net asset
value,
end of
period | | | Total return
(excludes
sales charge) (b)(c) | | | Net assets,
end of
period
(000's) | | | Net
expenses (d) | | | Net
investment income
(loss) | | | Expenses without waivers,
reimbursements and
earnings credits | | | Portfolio
turnover
rate (b)(e) | |
| | | | | | | | | | | | | | | | | | | | | | | | | | |
| | | | | | | | | | | | | | | | | | | | | | | | | | |
| $ | 9.89 | | | | 4.65 | % | | $ | 211,447 | | | | 1.24 | % | | | 0.45 | %(g) | | | 1.28 | % | | | 46 | % |
| | 9.49 | | | | 2.26 | | | | 194,911 | | | | 1.25 | | | | (0.37 | )(h) | | | 1.30 | | | | 86 | |
| | 9.28 | | | | 37.28 | | | | 176,492 | | | | 1.25 | | | | (0.45 | ) | | | 1.31 | | | | 96 | |
| | 6.76 | | | | 14.97 | | | | 101,814 | | | | 1.31 | | | | (0.41 | ) | | | 1.31 | | | | 102 | |
| | 5.88 | | | | (27.76 | ) | | | 71,841 | | | | 1.35 | | | | (0.48 | ) | | | 1.42 | | | | 119 | |
| | 8.14 | | | | (0.49 | ) | | | 70,546 | | | | 1.34 | | | | (0.58 | ) | | | 1.47 | | | | 118 | |
| | | | | | |
| | | | | | | | | | | | | | | | | | | | | | | | | | |
| | 9.11 | | | | 4.37 | | | | 2,111 | | | | 1.74 | | | | (0.08 | )(g) | | | 1.78 | | | | 46 | |
| | 8.76 | | | | 1.74 | | | | 2,327 | | | | 1.75 | | | | (0.89 | )(h) | | | 1.80 | | | | 86 | |
| | 8.61 | | | | 36.45 | | | | 3,157 | | | | 1.75 | | | | (0.94 | ) | | | 1.81 | | | | 96 | |
| | 6.31 | | | | 14.52 | | | | 3,070 | | | | 1.81 | | | | (0.91 | ) | | | 1.81 | | | | 102 | |
| | 5.51 | | | | (28.16 | ) | | | 3,304 | | | | 1.87 | | | | (1.02 | ) | | | 1.92 | | | | 119 | |
| | 7.67 | | | | (1.16 | ) | | | 4,340 | | | | 1.91 | | | | (1.16 | ) | | | 1.94 | | | | 118 | |
| | | | | | |
| | | | | | | | | | | | | | | | | | | | | | | | | | |
| | 9.12 | | | | 4.36 | | | | 30,423 | | | | 1.74 | | | | (0.04 | )(g) | | | 1.78 | | | | 46 | |
| | 8.77 | | | | 1.86 | | | | 27,469 | | | | 1.75 | | | | (0.84 | )(h) | | | 1.80 | | | | 86 | |
| | 8.61 | | | | 36.45 | | | | 20,676 | | | | 1.75 | | | | (0.95 | ) | | | 1.81 | | | | 96 | |
| | 6.31 | | | | 14.31 | | | | 12,811 | | | | 1.81 | | | | (0.91 | ) | | | 1.81 | | | | 102 | |
| | 5.52 | | | | (28.13 | ) | | | 9,300 | | | | 1.87 | | | | (1.02 | ) | | | 1.91 | | | | 119 | |
| | 7.68 | | | | (1.03 | ) | | | 14,499 | | | | 1.88 | | | | (1.16 | ) | | | 1.89 | | | | 118 | |
| | | | | | |
| | | | | | | | | | | | | | | | | | | | | | | | | | |
| | 10.09 | | | | 4.95 | | | | 628,557 | | | | 0.83 | | | | 0.92 | (g) | | | 0.83 | | | | 46 | |
| | 9.69 | | | | 2.65 | | | | 468,064 | | | | 0.85 | | | | 0.07 | (h) | | | 0.85 | | | | 86 | |
| | 9.44 | | | | 37.61 | | | | 179,677 | | | | 0.86 | | | | (0.05 | ) | | | 0.86 | | | | 96 | |
| | 6.86 | | | | 15.68 | | | | 76,767 | | | | 0.86 | | | | 0.05 | | | | 0.86 | | | | 102 | |
| | 5.93 | | | | 10.43 | | | | 46,312 | | | | 0.90 | | | | (0.08 | ) | | | 1.06 | | | | 119 | |
| | | | | | |
| | | | | | | | | | | | | | | | | | | | | | | | | | |
| | 10.03 | | | | 4.75 | | | | 606,285 | | | | 1.03 | | | | 0.65 | (g) | | | 1.03 | | | | 46 | |
| | 9.63 | | | | 2.56 | | | | 662,786 | | | | 1.05 | | | | (0.18 | )(h) | | | 1.05 | | | | 86 | |
| | 9.39 | | | | 37.48 | | | | 836,154 | | | | 1.06 | | | | (0.27 | ) | | | 1.06 | | | | 96 | |
| | 6.83 | | | | 15.18 | | | | 604,663 | | | | 1.06 | | | | (0.16 | ) | | | 1.06 | | | | 102 | |
| | 5.93 | | | | (27.51 | ) | | | 441,345 | | | | 1.10 | | | | (0.24 | ) | | | 1.17 | | | | 119 | |
| | 8.18 | | | | (0.24 | ) | | | 399,777 | | | | 1.09 | | | | (0.41 | ) | | | 1.12 | | | | 118 | |
SEE NOTES TO FINANCIAL STATEMENTS.
| | | | | | | | |
| | | |
| DECEMBER 31, 2012 | | J.P. MORGAN MID CAP/MULTI-CAP FUNDS | | | | | 71 | |
FINANCIAL HIGHLIGHTS
FOR THE PERIODS INDICATED (continued)
| | | | | | | | | | | | | | | | | | | | | | | | | | | | |
| | | Per share operating performance | |
| | | | | | Investment operations | | | Distributions | |
| | | Net asset
value,
beginning
of period | | | Net
investment
income
(loss) | | | Net realized
and unrealized gains (losses) on
investments | | | Total from
investment
operations | | | Net
investment
income | | | Net
realized
gain | | | Total
distributions | |
Mid Cap Core Fund | |
Class A | |
Six Months Ended December 31, 2012 (Unaudited) | | $ | 17.16 | | | $ | 0.15 | (f)(g) | | $ | 0.87 | | | $ | 1.02 | | | $ | (0.16 | ) | | $ | (0.21 | ) | | $ | (0.37 | ) |
Year Ended June 30, 2012 | | | 17.19 | | | | 0.08 | (f) | | | (0.10 | ) | | | (0.02 | ) | | | — | (h) | | | (0.01 | ) | | | (0.01 | ) |
November 30, 2010 (i) through June 30, 2011 | | | 15.00 | | | | 0.01 | (f) | | | 2.18 | | | | 2.19 | | | | — | (h) | | | — | | | | — | (h) |
| | | | | | | |
Class C | | | | | | | | | | | | | | | | | | | | | | | | | | | | |
Six Months Ended December 31, 2012 (Unaudited) | | | 17.03 | | | | 0.07 | (f)(g) | | | 0.90 | | | | 0.97 | | | | (0.04 | ) | | | (0.21 | ) | | | (0.25 | ) |
Year Ended June 30, 2012 | | | 17.15 | | | | — | (f)(h) | | | (0.11 | ) | | | (0.11 | ) | | | — | (h) | | | (0.01 | ) | | | (0.01 | ) |
November 30, 2010 (i) through June 30, 2011 | | | 15.00 | | | | (0.04 | )(f) | | | 2.19 | | | | 2.15 | | | | — | | | | — | | | | — | |
| | | | | | | |
Class R2 | | | | | | | | | | | | | | | | | | | | | | | | | | | | |
Six Months Ended December 31, 2012 (Unaudited) | | | 17.10 | | | | 0.11 | (f)(g) | | | 0.88 | | | | 0.99 | | | | (0.09 | ) | | | (0.21 | ) | | | (0.30 | ) |
Year Ended June 30, 2012 | | | 17.17 | | | | 0.04 | (f) | | | (0.10 | ) | | | (0.06 | ) | | | — | (h) | | | (0.01 | ) | | | (0.01 | ) |
November 30, 2010 (i) through June 30, 2011 | | | 15.00 | | | | (0.02 | )(f) | | | 2.19 | | | | 2.17 | | | | — | | | | — | | | | — | |
| | | | | | | |
Class R5 | | | | | | | | | | | | | | | | | | | | | | | | | | | | |
Six Months Ended December 31, 2012 (Unaudited) | | | 17.23 | | | | 0.16 | (f)(g) | | | 0.91 | | | | 1.07 | | | | (0.19 | ) | | | (0.21 | ) | | | (0.40 | ) |
Year Ended June 30, 2012 | | | 17.23 | | | | 0.15 | (f) | | | (0.09 | ) | | | 0.06 | | | | (0.05 | ) | | | (0.01 | ) | | | (0.06 | ) |
November 30, 2010 (i) through June 30, 2011 | | | 15.00 | | | | 0.05 | (f) | | | 2.19 | | | | 2.24 | | | | (0.01 | ) | | | — | | | | (0.01 | ) |
| | | | | | | |
Class R6 | | | | | | | | | | | | | | | | | | | | | | | | | | | | |
Six Months Ended December 31, 2012 (Unaudited) | | | 17.23 | | | | 0.20 | (f)(g) | | | 0.87 | | | | 1.07 | | | | (0.20 | ) | | | (0.21 | ) | | | (0.41 | ) |
Year Ended June 30, 2012 | | | 17.24 | | | | 0.21 | (f) | | | (0.15 | ) | | | 0.06 | | | | (0.06 | ) | | | (0.01 | ) | | | (0.07 | ) |
January 31, 2011 (l) through June 30, 2011 | | | 16.36 | | | | 0.05 | (f) | | | 0.83 | | | | 0.88 | | | | — | | | | — | | | | — | |
| | | | | | | |
Select Class | | | | | | | | | | | | | | | | | | | | | | | | | | | | |
Six Months Ended December 31, 2012 (Unaudited) | | | 17.18 | | | | 0.15 | (f)(g) | | | 0.91 | | | | 1.06 | | | | (0.17 | ) | | | (0.21 | ) | | | (0.38 | ) |
Year Ended June 30, 2012 | | | 17.22 | | | | 0.13 | (f) | | | (0.12 | ) | | | 0.01 | | | | (0.04 | ) | | | (0.01 | ) | | | (0.05 | ) |
November 30, 2010 (i) through June 30, 2011 | | | 15.00 | | | | 0.04 | (f) | | | 2.19 | | | | 2.23 | | | | (0.01 | ) | | | — | | | | (0.01 | ) |
| (a) | Annualized for periods less than one year. |
| (b) | Not annualized for periods less than one year. |
| (c) | Includes adjustments in accordance with accounting principles generally accepted in the United States of America and as such, the net asset values for financial reporting purposes and the returns based upon those net asset values may differ from the net asset values and returns for shareholder transactions. |
| (d) | Includes earnings credits and interest expense, if applicable, each of which is less than 0.01% or unless otherwise noted. |
| (e) | Portfolio turnover is calculated by dividing the lesser of total purchases or sales of portfolio securities for the reporting period by the monthly average of portfolio securities owned during the reporting period. Excluded from both the numerator and denominator are amounts relating to derivatives and securities whose maturities or expiration dates at the time of acquisition were one year or less. |
| (f) | Calculated based upon average shares outstanding. |
| (g) | Reflects special dividends paid out during the period by several of the Fund’s holdings. Had the Fund not received the special dividends the net investment income (loss) per share would have been $0.06, $(0.02), $0.02, $0.07, $0.10 and $0.06 for Class A, Class C, Class R2, Class R5, Class R6 and Select Class Shares, respectively and the net investment income (loss) ratio would have been 0.66%, (0.22)%, 0.18%, 0.73%, 1.17% and 0.66% for Class A, Class C, Class R2, Class R5, Class R6 and Select Class Shares, respectively. |
| (h) | Amount rounds to less than $0.01. |
| (i) | Commencement of operations. |
| (j) | Certain non-recurring expenses incurred by the Fund were not annualized for the period ended June 30, 2011. |
| (k) | Ratios are disproportionate between classes due to the size of net assets and fixed expenses. |
| (l) | Commencement of offering of class of shares. |
SEE NOTES TO FINANCIAL STATEMENTS.
| | | | | | |
| | | |
| 72 | | | | J.P. MORGAN MID CAP/MULTI-CAP FUNDS | | DECEMBER 31, 2012 |
| | | | | | | | | | | | | | | | | | | | | | | | | | |
| | | Ratios/Supplemental data | |
| | | | | | | | | | Ratios to average net assets (a) | | | | |
Net asset
value,
end of
period | | | Total return
(excludes
sales charge) (b)(c) | | | Net assets,
end of
period
(000's) | | | Net
expenses (d) | | | Net
investment income
(loss) | | | Expenses
without waivers,
reimbursements and
earnings credits | | | Portfolio
turnover
rate (b)(e) | |
| | | | | | | | | | | | | | | | | | | | | | | | | | |
| | | | | | | | | | | | | | | | | | | | | | | | | | |
| $ | 17.81 | | | | 5.97 | % | | $ | 21,659 | | | | 1.24 | % | | | 1.72 | %(g) | | | 1.26 | % | | | 16 | % |
| | 17.16 | | | | (0.13 | ) | | | 455 | | | | 1.24 | | | | 0.50 | | | | 1.31 | | | | 44 | |
| | 17.19 | | | | 14.70 | | | | 276 | | | | 1.24 | (j) | | | 0.11 | (j) | | | 5.79 | (j)(k) | | | 13 | |
| | | | | | |
| | | | | | | | | | | | | | | | | | | | | | | | | | |
| | 17.75 | | | | 5.68 | | | | 133 | | | | 1.74 | | | | 0.84 | (g) | | | 1.77 | | | | 16 | |
| | 17.03 | | | | (0.65 | ) | | | 125 | | | | 1.74 | | | | (0.02 | ) | | | 1.81 | | | | 44 | |
| | 17.15 | | | | 14.33 | | | | 99 | | | | 1.75 | (j) | | | (0.39 | )(j) | | | 6.49 | (j)(k) | | | 13 | |
| | | | | | |
| | | | | | | | | | | | | | | | | | | | | | | | | | |
| | 17.79 | | | | 5.82 | | | | 83 | | | | 1.49 | | | | 1.24 | (g) | | | 1.52 | | | | 16 | |
| | 17.10 | | | | (0.36 | ) | | | 57 | | | | 1.49 | | | | 0.22 | | | | 1.57 | | | | 44 | |
| | 17.17 | | | | 14.53 | | | | 57 | | | | 1.49 | (j) | | | (0.17 | )(j) | | | 6.84 | (j)(k) | | | 13 | |
| | | | | | |
| | | | | | | | | | | | | | | | | | | | | | | | | | |
| | 17.90 | | | | 6.22 | | | | 61 | | | | 0.79 | | | | 1.79 | (g) | | | 0.82 | | | | 16 | |
| | 17.23 | | | | 0.33 | | | | 58 | | | | 0.79 | | | | 0.92 | | | | 0.86 | | | | 44 | |
| | 17.23 | | | | 15.00 | | | | 57 | | | | 0.80 | (j) | | | 0.52 | (j) | | | 6.17 | (j)(k) | | | 13 | |
| | | | | | |
| | | | | | | | | | | | | | | | | | | | | | | | | | |
| | 17.89 | | | | 6.21 | | | | 288,602 | | | | 0.74 | | | | 2.23 | (g) | | | 0.76 | | | | 16 | |
| | 17.23 | | | | 0.33 | | | | 28,251 | | | | 0.74 | | | | 1.18 | | | | 0.78 | | | | 44 | |
| | 17.24 | | | | 5.38 | | | | 53 | | | | 0.75 | (j) | | | 0.68 | (j) | | | 5.52 | (j)(k) | | | 13 | |
| | | | | | |
| | | | | | | | | | | | | | | | | | | | | | | | | | |
| | 17.86 | | | | 6.15 | | | | 451,731 | | | | 0.99 | | | | 1.72 | (g) | | | 1.02 | | | | 16 | |
| | 17.18 | | | | 0.06 | | | | 320,576 | | | | 0.99 | | | | 0.76 | | | | 1.06 | | | | 44 | |
| | 17.22 | | | | 14.84 | | | | 91,240 | | | | 1.00 | (j) | | | 0.41 | (j) | | | 3.41 | (j)(k) | | | 13 | |
SEE NOTES TO FINANCIAL STATEMENTS.
| | | | | | | | |
| | | |
| DECEMBER 31, 2012 | | J.P. MORGAN MID CAP/MULTI-CAP FUNDS | | | | | 73 | |
FINANCIAL HIGHLIGHTS
FOR THE PERIODS INDICATED (continued)
| | | | | | | | | | | | | | | | | | | | | | | | | | | | |
| | | | | | Per share operating performance | |
| | | | | | Investment operations | | | Distributions | |
| | | Net asset
value,
beginning
of period | | | Net
investment
income
(loss) | | | Net realized
and unrealized gains (losses) on
investments | | | Total from
investment
operations | | | Net
investment
income | | | Net
realized
gain | | | Total
distributions | |
Mid Cap Equity Fund | |
Class A | |
Six Months Ended December 31, 2012 (Unaudited) | | $ | 30.97 | | | $ | 0.07 | (f)(g) | | $ | 2.38 | | | $ | 2.45 | | | $ | (0.06 | ) | | $ | (0.23 | ) | | $ | (0.29 | ) |
Year Ended June 30, 2012 | | | 31.29 | | | | 0.10 | (f)(h) | | | (0.34 | ) | | | (0.24 | ) | | | (0.08 | ) | | | — | | | | (0.08 | ) |
Year Ended June 30, 2011 | | | 22.95 | | | | 0.04 | (f) | | | 8.36 | | | | 8.40 | | | | (0.06 | ) | | | — | | | | (0.06 | ) |
November 2, 2009 (i) through June 30, 2010 | | | 21.55 | | | | 0.05 | | | | 1.41 | | | | 1.46 | | | | (0.06 | ) | | | — | | | | (0.06 | ) |
| | | | | | | |
Class C | | | | | | | | | | | | | | | | | | | | | | | | | | | | |
Six Months Ended December 31, 2012 (Unaudited) | | | 30.75 | | | | (0.01 | )(f)(g) | | | 2.36 | | | | 2.35 | | | | (0.03 | ) | | | (0.23 | ) | | | (0.26 | ) |
Year Ended June 30, 2012 | | | 31.16 | | | | (0.05 | )(f)(h) | | | (0.35 | ) | | | (0.40 | ) | | | (0.01 | ) | | | — | | | | (0.01 | ) |
Year Ended June 30, 2011 | | | 22.93 | | | | (0.12 | )(f) | | | 8.37 | | | | 8.25 | | | | (0.02 | ) | | | — | | | | (0.02 | ) |
November 2, 2009 (i) through June 30, 2010 | | | 21.55 | | | | (0.03 | ) | | | 1.41 | | | | 1.38 | | | | — | (j) | | | — | | | | — | (j) |
| | | | | | | |
Select Class | | | | | | | | | | | | | | | | | | | | | | | | | | | | |
Six Months Ended December 31, 2012 (Unaudited) | | | 31.05 | | | | 0.12 | (f)(g) | | | 2.39 | | | | 2.51 | | | | (0.10 | ) | | | (0.23 | ) | | | (0.33 | ) |
Year Ended June 30, 2012 | | | 31.36 | | | | 0.19 | (f)(h) | | | (0.33 | ) | | | (0.14 | ) | | | (0.17 | ) | | | — | | | | (0.17 | ) |
Year Ended June 30, 2011 | | | 22.97 | | | | 0.14 | (f) | | | 8.37 | | | | 8.51 | | | | (0.12 | ) | | | — | | | | (0.12 | ) |
Year Ended June 30, 2010 | | | 18.97 | | | | 0.12 | | | | 4.00 | | | | 4.12 | | | | (0.12 | ) | | | — | | | | (0.12 | ) |
Year Ended June 30, 2009 | | | 28.63 | | | | 0.18 | | | | (8.37 | ) | | | (8.19 | ) | | | (0.17 | ) | | | (1.30 | ) | | | (1.47 | ) |
Year Ended June 30, 2008 | | | 37.93 | | | | 0.11 | | | | (2.80 | ) | | | (2.69 | ) | | | (0.11 | ) | | | (6.50 | ) | | | (6.61 | ) |
| (a) | Annualized for periods less than one year. |
| (b) | Not annualized for periods less than one year. |
| (c) | Includes adjustments in accordance with accounting principles generally accepted in the United States of America and as such, the net asset values for financial reporting purposes and the returns based upon those net asset values may differ from the net asset values and returns for shareholder transactions. |
| (d) | Includes earnings credits and interest expense, if applicable, each of which is less than 0.01% or unless otherwise noted. |
| (e) | Portfolio turnover is calculated by dividing the lesser of total purchases or sales of portfolio securities for the reporting period by the monthly average of portfolio securities owned during the reporting period. Excluded from both the numerator and denominator are amounts relating to derivatives and securities whose maturities or expiration dates at the time of acquisition were one year or less. |
| (f) | Calculated based upon average shares outstanding. |
| (g) | Reflects special dividends paid out during the period by several of the Fund’s holdings. Had the Fund not received the special dividends the net investment income (loss) per share would have been $0.02, $(0.05) and $0.07 for Class A, Class C and Select Class Shares, respectively and the net investment income (loss) ratio would have been 0.14%, (0.34)% and 0.45% for Class A, Class C and Select Class Shares, respectively. |
| (h) | Reflects a special dividend paid out during the period by one of the Fund’s holdings. Had the Fund not received the special dividend the net investment income (loss) per share would have been $0.05, $(0.10) and $0.14 for Class A, Class C and Select Class Shares, respectively and the net investment income (loss) ratio would have been 0.18%, (0.33)% and 0.48% for Class A, Class C and Select Class Shares, respectively. |
| (i) | Commencement of offering of class of shares. |
| (j) | Amount rounds to less than $0.01. |
SEE NOTES TO FINANCIAL STATEMENTS.
| | | | | | |
| | | |
| 74 | | | | J.P. MORGAN MID CAP/MULTI-CAP FUNDS | | DECEMBER 31, 2012 |
| | | | | | | | | | | | | | | | | | | | | | | | | | |
| | | Ratios/Supplemental data | |
| | | | | | | | | | Ratios to average net assets (a) | | | | |
Net asset
value,
end of
period | | | Total return
(excludes
sales charge) (b)(c) | | | Net assets,
end of
period
(000's) | | | Net
expenses (d) | | | Net
investment income
(loss) | | | Expenses without waivers,
reimbursements and
earnings credits | | | Portfolio
turnover
rate (b)(e) | |
| | | | | | | | | | | | | | | | | | | | | | | | | | |
| | | | | | | | | | | | | | | | | | | | | | | | | | |
| $ | 33.13 | | | | 7.91 | % | | $ | 10,184 | | | | 1.24 | % | | | 0.42 | %(g) | | | 1.44 | % | | | 21 | % |
| | 30.97 | | | | (0.76 | ) | | | 6,965 | | | | 1.24 | | | | 0.34 | (h) | | | 1.54 | | | | 55 | |
| | 31.29 | | | | 36.60 | | | | 2,918 | | | | 1.24 | | | | 0.14 | | | | 1.53 | | | | 88 | |
| | 22.95 | | | | 6.77 | | | | 1,394 | | | | 1.24 | | | | 0.30 | | | | 1.44 | | | | 56 | |
| | | | | | |
| | | | | | | | | | | | | | | | | | | | | | | | | | |
| | 32.84 | | | | 7.64 | | | | 2,118 | | | | 1.74 | | | | (0.06 | )(g) | | | 1.94 | | | | 21 | |
| | 30.75 | | | | (1.29 | ) | | | 1,244 | | | | 1.75 | | | | (0.18 | )(h) | | | 2.03 | | | | 55 | |
| | 31.16 | | | | 35.98 | | | | 447 | | | | 1.74 | | | | (0.40 | ) | | | 2.06 | | | | 88 | |
| | 22.93 | | | | 6.40 | | | | 65 | | | | 1.74 | | | | (0.23 | ) | | | 1.92 | | | | 56 | |
| | | | | | |
| | | | | | | | | | | | | | | | | | | | | | | | | | |
| | 33.23 | | | | 8.09 | | | | 916,611 | | | | 0.89 | | | | 0.72 | (g) | | | 1.19 | | | | 21 | |
| | 31.05 | | | | (0.42 | ) | | | 813,125 | | | | 0.89 | | | | 0.64 | (h) | | | 1.30 | | | | 55 | |
| | 31.36 | | | | 37.09 | | | | 568,854 | | | | 0.89 | | | | 0.50 | | | | 1.27 | | | | 88 | |
| | 22.97 | | | | 21.72 | | | | 463,478 | | | | 0.89 | | | | 0.55 | | | | 1.17 | | | | 56 | |
| | 18.97 | | | | (28.02 | ) | | | 195,785 | | | | 0.90 | | | | 0.94 | | | | 1.20 | | | | 107 | |
| | 28.63 | | | | (8.19 | ) | | | 189,589 | | | | 0.91 | | | | 0.32 | | | | 1.12 | | | | 79 | |
SEE NOTES TO FINANCIAL STATEMENTS.
| | | | | | | | |
| | | |
| DECEMBER 31, 2012 | | J.P. MORGAN MID CAP/MULTI-CAP FUNDS | | | | | 75 | |
FINANCIAL HIGHLIGHTS
FOR THE PERIODS INDICATED (continued)
| | | | | | | | | | | | | | | | | | | | |
| | | Per share operating performance | |
| | | | | | Investment operations | | | Distributions | |
| | | Net asset
value,
beginning
of period | | | Net
investment
income
(loss) | | | Net realized
and unrealized gains (losses) on investments | | | Total from
investment
operations | | | Net
realized
gain | |
Mid Cap Growth Fund | | | | | | | | | | | | | | | | | | | | |
Class A | | | | | | | | | | | | | | | | | | | | |
Six Months Ended December 31, 2012 (Unaudited) | | $ | 19.52 | | | $ | (0.01 | )(f)(g) | | $ | 1.40 | | | $ | 1.39 | | | $ | (0.99 | ) |
Year Ended June 30, 2012 | | | 23.30 | | | | (0.05 | )(f)(h) | | | (1.72 | ) | | | (1.77 | ) | | | (2.01 | ) |
Year Ended June 30, 2011 | | | 16.35 | | | | (0.09 | )(f) | | | 7.04 | | | | 6.95 | | | | — | |
Year Ended June 30, 2010 | | | 13.68 | | | | (0.09 | )(f) | | | 2.76 | | | | 2.67 | | | | — | |
Year Ended June 30, 2009 | | | 20.46 | | | | (0.07 | )(f) | | | (6.33 | ) | | | (6.40 | ) | | | (0.38 | ) |
Year Ended June 30, 2008 | | | 24.89 | | | | (0.17 | )(f) | | | (0.45 | ) | | | (0.62 | ) | | | (3.81 | ) |
| | | | | |
Class B | | | | | | | | | | | | | | | | | | | | |
Six Months Ended December 31, 2012 (Unaudited) | | | 14.76 | | | | (0.05 | )(f)(g) | | | 1.05 | | | | 1.00 | | | | (0.99 | ) |
Year Ended June 30, 2012 | | | 18.29 | | | | (0.12 | )(f)(h) | | | (1.40 | ) | | | (1.52 | ) | | | (2.01 | ) |
Year Ended June 30, 2011 | | | 12.90 | | | | (0.16 | )(f) | | | 5.55 | | | | 5.39 | | | | — | |
Year Ended June 30, 2010 | | | 10.85 | | | | (0.14 | )(f) | | | 2.19 | | | | 2.05 | | | | — | |
Year Ended June 30, 2009 | | | 16.45 | | | | (0.13 | )(f) | | | (5.09 | ) | | | (5.22 | ) | | | (0.38 | ) |
Year Ended June 30, 2008 | | | 20.88 | | | | (0.26 | )(f) | | | (0.36 | ) | | | (0.62 | ) | | | (3.81 | ) |
| | | | | |
Class C | | | | | | | | | | | | | | | | | | | | |
Six Months Ended December 31, 2012 (Unaudited) | | | 17.17 | | | | (0.05 | )(f)(g) | | | 1.22 | | | | 1.17 | | | | (0.99 | ) |
Year Ended June 30, 2012 | | | 20.88 | | | | (0.13 | )(f)(h) | | | (1.57 | ) | | | (1.70 | ) | | | (2.01 | ) |
Year Ended June 30, 2011 | | | 14.73 | | | | (0.18 | )(f) | | | 6.33 | | | | 6.15 | | | | — | |
Year Ended June 30, 2010 | | | 12.39 | | | | (0.16 | )(f) | | | 2.50 | | | | 2.34 | | | | — | |
Year Ended June 30, 2009 | | | 18.70 | | | | (0.15 | )(f) | | | (5.78 | ) | | | (5.93 | ) | | | (0.38 | ) |
Year Ended June 30, 2008 | | | 23.21 | | | | (0.29 | )(f) | | | (0.41 | ) | | | (0.70 | ) | | | (3.81 | ) |
| | | | | |
Class R2 | | | | | | | | | | | | | | | | | | | | |
Six Months Ended December 31, 2012 (Unaudited) | | | 20.83 | | | | (0.03 | )(f)(g) | | | 1.49 | | | | 1.46 | | | | (0.99 | ) |
Year Ended June 30, 2012 | | | 24.73 | | | | (0.07 | )(f)(h) | | | (1.82 | ) | | | (1.89 | ) | | | (2.01 | ) |
Year Ended June 30, 2011 | | | 17.38 | | | | (0.13 | )(f) | | | 7.48 | | | | 7.35 | | | | — | |
Year Ended June 30, 2010 | | | 14.56 | | | | (0.12 | )(f) | | | 2.94 | | | | 2.82 | | | | — | |
June 19, 2009 (i) through June 30, 2009 | | | 14.56 | | | | — | (f)(j) | | | — | (j) | | | — | (j) | | | — | |
| | | | | |
Class R5 | | | | | | | | | | | | | | | | | | | | |
Six Months Ended December 31, 2012 (Unaudited) | | | 21.18 | | | | 0.04 | (f)(g) | | | 1.52 | | | | 1.56 | | | | (0.99 | ) |
November 1, 2011 (i) through June 30, 2012 | | | 21.75 | | | | 0.04 | (f)(h) | | | 1.40 | | | | 1.44 | | | | (2.01 | ) |
| | | | | |
Class R6 | | | | | | | | | | | | | | | | | | | | |
Six Months Ended December 31, 2012 (Unaudited) | | | 21.19 | | | | 0.05 | (f)(g) | | | 1.51 | | | | 1.56 | | | | (0.99 | ) |
November 1, 2011 (i) through June 30, 2012 | | | 21.75 | | | | 0.08 | (f)(h) | | | 1.37 | | | | 1.45 | | | | (2.01 | ) |
| | | | | |
Select Class | | | | | | | | | | | | | | | | | | | | |
Six Months Ended December 31, 2012 (Unaudited) | | | 21.15 | | | | 0.02 | (f)(g) | | | 1.52 | | | | 1.54 | | | | (0.99 | ) |
Year Ended June 30, 2012 | | | 24.97 | | | | 0.02 | (f)(h) | | | (1.83 | ) | | | (1.81 | ) | | | (2.01 | ) |
Year Ended June 30, 2011 | | | 17.47 | | | | (0.03 | )(f) | | | 7.53 | | | | 7.50 | | | | — | |
Year Ended June 30, 2010 | | | 14.57 | | | | (0.04 | )(f) | | | 2.94 | | | | 2.90 | | | | — | |
Year Ended June 30, 2009 | | | 21.68 | | | | (0.03 | )(f) | | | (6.70 | ) | | | (6.73 | ) | | | (0.38 | ) |
Year Ended June 30, 2008 | | | 26.10 | | | | (0.12 | )(f) | | | (0.49 | ) | | | (0.61 | ) | | | (3.81 | ) |
| (a) | Annualized for periods less than one year. |
| (b) | Not annualized for periods less than one year. |
| (c) | Includes adjustments in accordance with accounting principles generally accepted in the United States of America and as such, the net asset values for financial reporting purposes and the returns based upon those net asset values may differ from the net asset values and returns for shareholder transactions. |
| (d) | Includes earnings credits and interest expense, if applicable, each of which is less than 0.01% or unless otherwise noted. |
| (e) | Portfolio turnover is calculated by dividing the lesser of total purchases or sales of portfolio securities for the reporting period by the monthly average of portfolio securities owned during the reporting period. Excluded from both the numerator and denominator are amounts relating to derivatives and securities whose maturities or expiration dates at the time of acquisition were one year or less. |
| (f) | Calculated based upon average shares outstanding. |
SEE NOTES TO FINANCIAL STATEMENTS.
| | | | | | |
| | | |
| 76 | | | | J.P. MORGAN MID CAP/MULTI-CAP FUNDS | | DECEMBER 31, 2012 |
| | | | | | | | | | | | | | | | | | | | | | | | | | |
| | | Ratios/Supplemental data | |
| | | | | | | | | | Ratios to average net assets (a) | | | | |
Net asset
value,
end of
period | | | Total return
(excludes
sales charge) (b)(c) | | | Net assets,
end of
period
(000's) | | | Net
expenses (d) | | | Net
investment income
(loss) | | | Expenses without waivers,
reimbursements and
earnings credits | | | Portfolio
turnover
rate (b)(e) | |
| | | | | | | | | | | | | | | | | | | | | | | | | | |
| | | | | | | | | | | | | | | | | | | | | | | | | | |
| $ | 19.92 | | | | 7.18 | % | | $ | 533,328 | | | | 1.23 | % | | | (0.10 | )%(g) | | | 1.39 | % | | | 34 | % |
| | 19.52 | | | | (6.61 | ) | | | 538,323 | | | | 1.24 | | | | (0.23 | )(h) | | | 1.38 | | | | 70 | |
| | 23.30 | | | | 42.51 | | | | 696,334 | | | | 1.24 | | | | (0.44 | ) | | | 1.36 | | | | 79 | |
| | 16.35 | | | | 19.52 | | | | 560,054 | | | | 1.24 | | | | (0.53 | ) | | | 1.42 | | | | 82 | |
| | 13.68 | | | | (30.97 | ) | | | 520,201 | | | | 1.24 | | | | (0.48 | ) | | | 1.56 | | | | 96 | |
| | 20.46 | | | | (3.22 | ) | | | 384,225 | | | | 1.24 | | | | (0.75 | ) | | | 1.39 | | | | 95 | |
| | | | | | |
| | | | | | | | | | | | | | | | | | | | | | | | | | |
| | 14.77 | | | | 6.86 | | | | 8,410 | | | | 1.73 | | | | (0.62 | )(g) | | | 1.89 | | | | 34 | |
| | 14.76 | | | | (7.08 | ) | | | 9,948 | | | | 1.75 | | | | (0.77 | )(h) | | | 1.88 | | | | 70 | |
| | 18.29 | | | | 41.78 | | | | 18,648 | | | | 1.77 | | | | (0.97 | ) | | | 1.86 | | | | 79 | |
| | 12.90 | | | | 18.89 | | | | 20,893 | | | | 1.77 | | | | (1.07 | ) | | | 1.92 | | | | 82 | |
| | 10.85 | | | | (31.35 | ) | | | 29,963 | | | | 1.88 | | | | (1.14 | ) | | | 2.03 | | | | 96 | |
| | 16.45 | | | | (3.90 | ) | | | 69,186 | | | | 1.88 | | | | (1.38 | ) | | | 1.89 | | | | 95 | |
| | | | | | |
| | | | | | | | | | | | | | | | | | | | | | | | | | |
| | 17.35 | | | | 6.89 | | | | 20,767 | | | | 1.73 | | | | (0.60 | )(g) | | | 1.89 | | | | 34 | |
| | 17.17 | | | | (7.06 | ) | | | 22,190 | | | | 1.75 | | | | (0.75 | )(h) | | | 1.88 | | | | 70 | |
| | 20.88 | | | | 41.75 | | | | 29,187 | | | | 1.77 | | | | (0.97 | ) | | | 1.86 | | | | 79 | |
| | 14.73 | | | | 18.89 | | | | 23,389 | | | | 1.77 | | | | (1.06 | ) | | | 1.92 | | | | 82 | |
| | 12.39 | | | | (31.38 | ) | | | 25,624 | | | | 1.88 | | | | (1.13 | ) | | | 2.04 | | | | 96 | |
| | 18.70 | | | | (3.85 | ) | | | 27,785 | | | | 1.88 | | | | (1.38 | ) | | | 1.89 | | | | 95 | |
| | | | | | |
| | | | | | | | | | | | | | | | | | | | | | | | | | |
| | 21.30 | | | | 7.07 | | | | 247 | | | | 1.39 | | | | (0.26 | )(g) | | | 1.64 | | | | 34 | |
| | 20.83 | | | | (6.72 | ) | | | 230 | | | | 1.40 | | | | (0.35 | )(h) | | | 1.63 | | | | 70 | |
| | 24.73 | | | | 42.29 | | | | 121 | | | | 1.40 | | | | (0.59 | ) | | | 1.60 | | | | 79 | |
| | 17.38 | | | | 19.37 | | | | 63 | | | | 1.40 | | | | (0.69 | ) | | | 1.67 | | | | 82 | |
| | 14.56 | | | | 0.00 | | | | 83 | | | | 1.22 | | | | (0.31 | ) | | | 1.94 | | | | 96 | |
| | | | | | |
| | | | | | | | | | | | | | | | | | | | | | | | | | |
| | 21.75 | | | | 7.43 | | | | 15,286 | | | | 0.79 | | | | 0.35 | (g) | | | 0.94 | | | | 34 | |
| | 21.18 | | | | 7.71 | | | | 14,837 | | | | 0.78 | | | | 0.31 | (h) | | | 0.92 | | | | 70 | |
| | | | | | |
| | | | | | | | | | | | | | | | | | | | | | | | | | |
| | 21.76 | | | | 7.42 | | | | 19,065 | | | | 0.74 | | | | 0.45 | (g) | | | 0.89 | | | | 34 | |
| | 21.19 | | | | 7.76 | | | | 13,982 | | | | 0.73 | | | | 0.58 | (h) | | | 0.87 | | | | 70 | |
| | | | | | |
| | | | | | | | | | | | | | | | | | | | | | | | | | |
| | 21.70 | | | | 7.34 | | | | 788,597 | | | | 0.92 | | | | 0.21 | (g) | | | 1.14 | | | | 34 | |
| | 21.15 | | | | (6.31 | ) | | | 827,306 | | | | 0.93 | | | | 0.09 | (h) | | | 1.13 | | | | 70 | |
| | 24.97 | | | | 42.93 | | | | 1,031,463 | | | | 0.93 | | | | (0.13 | ) | | | 1.10 | | | | 79 | |
| | 17.47 | | | | 19.90 | | | | 685,843 | | | | 0.93 | | | | (0.22 | ) | | | 1.17 | | | | 82 | |
| | 14.57 | | | | (30.74 | ) | | | 631,380 | | | | 0.98 | | | | (0.23 | ) | | | 1.30 | | | | 96 | |
| | 21.68 | | | | (3.02 | ) | | | 539,292 | | | | 0.99 | | | | (0.49 | ) | | | 1.13 | | | | 95 | |
| (g) | Reflects special dividends paid out during the period by several of the Fund’s holdings. Had the Fund not received the special dividends the net investment income (loss) per share would have been $(0.04), $(0.07), $(0.08), $(0.06), $0.01, $0.02 and $(0.01) for Class A, Class B, Class C, Class R2, Class R5, Class R6 and Select Class Shares, respectively and the net investment income (loss) ratio would have been (0.36)%, (0.88)%, (0.87)%, (0.52)%, 0.09%, 0.19% and (0.05)% for Class A, Class B, Class C, Class R2, Class R5, Class R6 and Select Class Shares, respectively. |
| (h) | Reflects a special dividend paid out during the period by one of the Fund’s holdings. Had the Fund not received the special dividend the net investment income (loss) per share would have been $(0.09), $(0.15), $(0.17), $(0.12), less than $0.01, $0.03 and $(0.03) for Class A, Class B, Class C, Class R2, Class R5, Class R6 and Select Class Shares, respectively and the net investment income (loss) ratio would have been (0.46)%, (0.99)%, (0.97)%, (0.57)%, (0.03)%, 0.24% and (0.14)% for Class A, Class B, Class C, Class R2, Class R5, Class R6 and Select Class Shares, respectively. |
| (i) | Commencement of offering of class of shares. |
| (j) | Amount rounds to less than $0.01. |
SEE NOTES TO FINANCIAL STATEMENTS.
| | | | | | | | |
| | | |
| DECEMBER 31, 2012 | | J.P. MORGAN MID CAP/MULTI-CAP FUNDS | | | | | 77 | |
FINANCIAL HIGHLIGHTS
FOR THE PERIODS INDICATED (continued)
| | | | | | | | | | | | | | | | | | | | | | | | | | | | |
| . | | Per share operating performance | |
| | | | | | Investment operations | | | Distributions | |
| | | Net asset
value,
beginning
of period | | | Net
investment
income
(loss) | | | Net realized
and unrealized
gains
(losses) on
investments | | | Total from
investment
operations | | | Net
investment
income | | | Net
realized
gain | | | Total
distributions | |
Mid Cap Value Fund | | | | | | | | | | | | | | | | | | | | | | | | | | | | |
Class A | | | | | | | | | | | | | | | | | | | | | | | | | | | | |
Six Months Ended December 31, 2012 (Unaudited) | | $ | 25.80 | | | $ | 0.12 | (f)(g) | | $ | 2.14 | | | $ | 2.26 | | | $ | (0.29 | ) | | $ | (0.22 | ) | | $ | (0.51 | ) |
Year Ended June 30, 2012 | | | 24.76 | | | | 0.20 | (f) | | | 1.00 | | | | 1.20 | | | | (0.16 | ) | | | — | | | | (0.16 | ) |
Year Ended June 30, 2011 | | | 18.91 | | | | 0.18 | (f) | | | 5.85 | | | | 6.03 | | | | (0.18 | ) | | | — | | | | (0.18 | ) |
Year Ended June 30, 2010 | | | 15.24 | | | | 0.19 | (f) | | | 3.48 | | | | 3.67 | | | | — | | | | — | | | | — | |
Year Ended June 30, 2009 | | | 21.91 | | | | 0.28 | (f) | | | (5.92 | ) | | | (5.64 | ) | | | (0.34 | ) | | | (0.69 | ) | | | (1.03 | ) |
Year Ended June 30, 2008 | | | 27.71 | | | | 0.16 | | | | (3.78 | ) | | | (3.62 | ) | | | (0.12 | ) | | | (2.06 | ) | | | (2.18 | ) |
| | | | | | | |
Class B | | | | | | | | | | | | | | | | | | | | | | | | | | | | |
Six Months Ended December 31, 2012 (Unaudited) | | | 25.16 | | | | 0.03 | (f)(g) | | | 2.10 | | | | 2.13 | | | | — | | | | (0.22 | ) | | | (0.22 | ) |
Year Ended June 30, 2012 | | | 24.10 | | | | 0.07 | (f) | | | 0.99 | | | | 1.06 | | | | — | | | | — | | | | — | |
Year Ended June 30, 2011 | | | 18.38 | | | | 0.07 | (f) | | | 5.69 | | | | 5.76 | | | | (0.04 | ) | | | — | | | | (0.04 | ) |
Year Ended June 30, 2010 | | | 14.89 | | | | 0.10 | (f) | | | 3.39 | | | | 3.49 | | | | — | | | | — | | | | — | |
Year Ended June 30, 2009 | | | 21.39 | | | | 0.20 | (f) | | | (5.79 | ) | | | (5.59 | ) | | | (0.22 | ) | | | (0.69 | ) | | | (0.91 | ) |
Year Ended June 30, 2008 | | | 27.11 | | | | 0.03 | | | | (3.69 | ) | | | (3.66 | ) | | | — | | | | (2.06 | ) | | | (2.06 | ) |
| | | | | | | |
Class C | | | | | | | | | | | | | | | | | | | | | | | | | | | | |
Six Months Ended December 31, 2012 (Unaudited) | | | 25.14 | | | | 0.05 | (f)(g) | | | 2.08 | | | | 2.13 | | | | (0.16 | ) | | | (0.22 | ) | | | (0.38 | ) |
Year Ended June 30, 2012 | | | 24.13 | | | | 0.07 | (f) | | | 0.98 | | | | 1.05 | | | | (0.04 | ) | | | — | | | | (0.04 | ) |
Year Ended June 30, 2011 | | | 18.44 | | | | 0.07 | (f) | | | 5.69 | | | | 5.76 | | | | (0.07 | ) | | | — | | | | (0.07 | ) |
Year Ended June 30, 2010 | | | 14.94 | | | | 0.10 | (f) | | | 3.40 | | | | 3.50 | | | | — | | | | — | | | | — | |
Year Ended June 30, 2009 | | | 21.45 | | | | 0.20 | (f) | | | (5.80 | ) | | | (5.60 | ) | | | (0.22 | ) | | | (0.69 | ) | | | (0.91 | ) |
Year Ended June 30, 2008 | | | 27.17 | | | | 0.04 | | | | (3.70 | ) | | | (3.66 | ) | | | — | | | | (2.06 | ) | | | (2.06 | ) |
| | | | | | | |
Class R2 | | | | | | | | | | | | | | | | | | | | | | | | | | | | |
Six Months Ended December 31, 2012 (Unaudited) | | | 25.18 | | | | 0.10 | (f)(g) | | | 2.07 | | | | 2.17 | | | | (0.30 | ) | | | (0.22 | ) | | | (0.52 | ) |
Year Ended June 30, 2012 | | | 24.27 | | | | 0.14 | (f) | | | 0.97 | | | | 1.11 | | | | (0.20 | ) | | | — | | | | (0.20 | ) |
Year Ended June 30, 2011 | | | 18.63 | | | | 0.12 | (f) | | | 5.76 | | | | 5.88 | | | | (0.24 | ) | | | — | | | | (0.24 | ) |
Year Ended June 30, 2010 | | | 15.06 | | | | 0.15 | (f) | | | 3.42 | | | | 3.57 | | | | — | | | | — | | | | — | |
November 3, 2008 (h) through June 30, 2009 | | | 16.34 | | | | 0.20 | (f) | | | (0.30 | ) | | | (0.10 | ) | | | (0.49 | ) | | | (0.69 | ) | | | (1.18 | ) |
| | | | | | | |
Institutional Class | | | | | | | | | | | | | | | | | | | | | | | | | | | | |
Six Months Ended December 31, 2012 (Unaudited) | | | 26.24 | | | | 0.19 | (f)(g) | | | 2.19 | | | | 2.38 | | | | (0.41 | ) | | | (0.22 | ) | | | (0.63 | ) |
Year Ended June 30, 2012 | | | 25.19 | | | | 0.32 | (f) | | | 1.01 | | | | 1.33 | | | | (0.28 | ) | | | — | | | | (0.28 | ) |
Year Ended June 30, 2011 | | | 19.22 | | | | 0.30 | (f) | | | 5.95 | | | | 6.25 | | | | (0.28 | ) | | | — | | | | (0.28 | ) |
Year Ended June 30, 2010 | | | 15.43 | | | | 0.29 | (f) | | | 3.52 | | | | 3.81 | | | | (0.02 | ) | | | — | | | | (0.02 | ) |
Year Ended June 30, 2009 | | | 22.31 | | | | 0.38 | (f) | | | (6.06 | ) | | | (5.68 | ) | | | (0.51 | ) | | | (0.69 | ) | | | (1.20 | ) |
Year Ended June 30, 2008 | | | 28.17 | | | | 0.31 | | | | (3.85 | ) | | | (3.54 | ) | | | (0.26 | ) | | | (2.06 | ) | | | (2.32 | ) |
| | | | | | | |
Select Class | | | | | | | | | | | | | | | | | | | | | | | | | | | | |
Six Months Ended December 31, 2012 (Unaudited) | | | 26.01 | | | | 0.16 | (f)(g) | | | 2.16 | | | | 2.32 | | | | (0.35 | ) | | | (0.22 | ) | | | (0.57 | ) |
Year Ended June 30, 2012 | | | 24.97 | | | | 0.26 | (f) | | | 1.01 | | | | 1.27 | | | | (0.23 | ) | | | — | | | | (0.23 | ) |
Year Ended June 30, 2011 | | | 19.07 | | | | 0.24 | (f) | | | 5.90 | | | | 6.14 | | | | (0.24 | ) | | | — | | | | (0.24 | ) |
Year Ended June 30, 2010 | | | 15.34 | | | | 0.24 | (f) | | | 3.49 | | | | 3.73 | | | | — | (i) | | | — | | | | — | (i) |
Year Ended June 30, 2009 | | | 22.14 | | | | 0.34 | (f) | | | (6.01 | ) | | | (5.67 | ) | | | (0.44 | ) | | | (0.69 | ) | | | (1.13 | ) |
Year Ended June 30, 2008 | | | 27.96 | | | | 0.27 | | | | (3.85 | ) | | | (3.58 | ) | | | (0.18 | ) | | | (2.06 | ) | | | (2.24 | ) |
| (a) | Annualized for periods less than one year. |
| (b) | Not annualized for periods less than one year. |
| (c) | Includes adjustments in accordance with accounting principles generally accepted in the United States of America and as such, the net asset values for financial reporting purposes and the returns based upon those net asset values may differ from the net asset values and returns for shareholder transactions. |
| (d) | Includes earnings credits and interest expense, if applicable, each of which is less than 0.01% or unless otherwise noted. |
| (e) | Portfolio turnover is calculated by dividing the lesser of total purchases or sales of portfolio securities for the reporting period by the monthly average of portfolio securities owned during the reporting period. Excluded from both the numerator and denominator are amounts relating to derivatives and securities whose maturities or expiration dates at the time of acquisition were one year or less. |
| (f) | Calculated based upon average shares outstanding. |
SEE NOTES TO FINANCIAL STATEMENTS.
| | | | | | |
| | | |
| 78 | | | | J.P. MORGAN MID CAP/MULTI-CAP FUNDS | | DECEMBER 31, 2012 |
| | | | | | | | | | | | | | | | | | | | | | | | | | |
| | | Ratios/Supplemental data | |
| | | | | | | | | | Ratios to average net assets (a) | | | | |
Net asset
value,
end of
period | | | Total return
(excludes
sales charge) (b)(c) | | | Net assets,
end of
period
(000's) | | | Net
expenses (d) | | | Net
investment
income
(loss) | | | Expenses
without waivers,
reimbursements and
earnings credits | | | Portfolio
turnover
rate (b)(e) | |
| | | | | | | | | | | | | | | | | | | | | | | | | | |
| | | | | | | | | | | | | | | | | | | | | | | | | | |
| $ | 27.55 | | | | 8.75 | % | | $ | 2,462,934 | | | | 1.23 | % | | | 0.90 | %(g) | | | 1.38 | % | | | 13 | % |
| | 25.80 | | | | 4.92 | | | | 1,986,930 | | | | 1.24 | | | | 0.83 | | | | 1.41 | | | | 30 | |
| | 24.76 | | | | 31.96 | | | | 1,979,270 | | | | 1.23 | | | | 0.81 | | | | 1.39 | | | | 41 | |
| | 18.91 | | | | 24.08 | | | | 1,705,572 | | | | 1.23 | | | | 1.04 | | | | 1.40 | | | | 34 | |
| | 15.24 | | | | (25.49 | ) | | | 1,600,044 | | | | 1.25 | | | | 1.71 | | | | 1.42 | | | | 47 | |
| | 21.91 | | | | (13.70 | ) | | | 2,661,377 | | | | 1.25 | | | | 0.66 | | | | 1.42 | | | | 31 | |
| | | | | | |
| | | | | | | | | | | | | | | | | | | | | | | | | | |
| | 27.07 | | | | 8.47 | | | | 36,202 | | | | 1.74 | | | | 0.26 | (g) | | | 1.88 | | | | 13 | |
| | 25.16 | | | | 4.40 | | | | 57,100 | | | | 1.75 | | | | 0.30 | | | | 1.91 | | | | 30 | |
| | 24.10 | | | | 31.33 | | | | 90,427 | | | | 1.74 | | | | 0.30 | | | | 1.89 | | | | 41 | |
| | 18.38 | | | | 23.44 | | | | 96,966 | | | | 1.74 | | | | 0.53 | | | | 1.90 | | | | 34 | |
| | 14.89 | | | | (25.89 | ) | | | 108,114 | | | | 1.75 | | | | 1.21 | | | | 1.92 | | | | 47 | |
| | 21.39 | | | | (14.14 | ) | | | 163,091 | | | | 1.75 | | | | 0.15 | | | | 1.92 | | | | 31 | |
| | | | | | |
| | | | | | | | | | | | | | | | | | | | | | | | | | |
| | 26.89 | | | | 8.49 | | | | 427,944 | | | | 1.74 | | | | 0.37 | (g) | | | 1.88 | | | | 13 | |
| | 25.14 | | | | 4.38 | | | | 370,781 | | | | 1.75 | | | | 0.32 | | | | 1.91 | | | | 30 | |
| | 24.13 | | | | 31.29 | | | | 373,415 | | | | 1.74 | | | | 0.30 | | | | 1.89 | | | | 41 | |
| | 18.44 | | | | 23.43 | | | | 309,513 | | | | 1.74 | | | | 0.53 | | | | 1.90 | | | | 34 | |
| | 14.94 | | | | (25.88 | ) | | | 299,956 | | | | 1.75 | | | | 1.20 | | | | 1.92 | | | | 47 | |
| | 21.45 | | | | (14.11 | ) | | | 523,722 | | | | 1.75 | | | | 0.14 | | | | 1.92 | | | | 31 | |
| | | | | | |
| | | | | | | | | | | | | | | | | | | | | | | | | | |
| | 26.83 | | | | 8.60 | | | | 33,345 | | | | 1.49 | | | | 0.76 | (g) | | | 1.63 | | | | 13 | |
| | 25.18 | | | | 4.65 | | | | 14,824 | | | | 1.49 | | | | 0.59 | | | | 1.66 | | | | 30 | |
| | 24.27 | | | | 31.66 | | | | 6,500 | | | | 1.49 | | | | 0.50 | | | | 1.65 | | | | 41 | |
| | 18.63 | | | | 23.71 | | | | 1,441 | | | | 1.49 | | | | 0.77 | | | | 1.65 | | | | 34 | |
| | 15.06 | | | | (0.24 | ) | | | 294 | | | | 1.50 | | | | 2.12 | | | | 1.69 | | | | 47 | |
| | | | | | |
| | | | | | | | | | | | | | | | | | | | | | | | | | |
| | 27.99 | | | | 9.04 | | | | 4,599,177 | | | | 0.74 | | | | 1.39 | (g) | | | 0.98 | | | | 13 | |
| | 26.24 | | | | 5.43 | | | | 3,543,900 | | | | 0.74 | | | | 1.33 | | | | 1.01 | | | | 30 | |
| | 25.19 | | | | 32.66 | | | | 2,812,296 | | | | 0.74 | | | | 1.29 | | | | 0.99 | | | | 41 | |
| | 19.22 | | | | 24.68 | | | | 1,913,930 | | | | 0.74 | | | | 1.52 | | | | 1.00 | | | | 34 | |
| | 15.43 | | | | (25.15 | ) | | | 1,424,004 | | | | 0.75 | | | | 2.26 | | | | 1.02 | | | | 47 | |
| | 22.31 | | | | (13.25 | ) | | | 1,777,057 | | | | 0.75 | | | | 1.16 | | | | 1.02 | | | | 31 | |
| | | | | | |
| | | | | | | | | | | | | | | | | | | | | | | | | | |
| | 27.76 | | | | 8.91 | | | | 2,268,061 | | | | 0.98 | | | | 1.14 | (g) | | | 1.13 | | | | 13 | |
| | 26.01 | | | | 5.20 | | | | 1,836,012 | | | | 0.98 | | | | 1.09 | | | | 1.16 | | | | 30 | |
| | 24.97 | | | | 32.29 | | | | 1,513,926 | | | | 0.98 | | | | 1.05 | | | | 1.14 | | | | 41 | |
| | 19.07 | | | | 24.35 | | | | 1,061,308 | | | | 0.98 | | | | 1.29 | | | | 1.15 | | | | 34 | |
| | 15.34 | | | | (25.31 | ) | | | 766,965 | | | | 1.00 | | | | 2.05 | | | | 1.18 | | | | 47 | |
| | 22.14 | | | | (13.46 | ) | | | 721,777 | | | | 1.00 | | | | 0.90 | | | | 1.16 | | | | 31 | |
| (g) | Reflects special dividends paid out during the period by several of the Fund’s holdings. Had the Fund not received the special dividends the net investment income (loss) per share would have been $0.08, $(0.01), $0.01, $0.06, $0.15 and $0.12 for Class A, Class B, Class C, Class R2, Institutional Class and Select Class Shares, respectively and the net investment income (loss) ratio would have been 0.61%, (0.03)%, 0.09%, 0.48%, 1.10% and 0.86% for Class A, Class B, Class C, Class R2, Institutional Class and Select Class Shares, respectively. |
| (h) | Commencement of offering of class of shares. |
| (i) | Amount rounds to less than $0.01. |
SEE NOTES TO FINANCIAL STATEMENTS.
| | | | | | | | |
| | | |
| DECEMBER 31, 2012 | | J.P. MORGAN MID CAP/MULTI-CAP FUNDS | | | | | 79 | |
FINANCIAL HIGHLIGHTS
FOR THE PERIODS INDICATED (continued)
| | | | | | | | | | | | | | | | | | | | | | | | | | | | |
| | | | | | Per share operating performance | |
| | | | | | Investment operations | | | Distributions | |
| | | Net asset
value,
beginning
of period | | | Net
investment
income
(loss) | | | Net realized
and unrealized
gains (losses) on
investments | | | Total from
investment
operations | | | Net
investment
income | | | Return of
capital | | | Total
distributions | |
Multi-Cap Market Neutral Fund | |
Class A | |
Six Months Ended December 31, 2012 (Unaudited) | | $ | 9.69 | | | $ | (0.05 | )(h) | | $ | (0.10 | ) | | $ | (0.15 | ) | | $ | — | | | $ | — | | | $ | — | |
Year Ended June 30, 2012 | | | 9.81 | | | | (0.14 | )(h) | | | 0.02 | | | | (0.12 | ) | | | — | | | | — | | | | — | |
Year Ended June 30, 2011 | | | 9.71 | | | | (0.16 | )(h) | | | 0.26 | | | | 0.10 | | | | — | | | | — | | | | — | |
Year Ended June 30, 2010 | | | 10.21 | | | | (0.17 | )(h) | | | (0.33 | ) | | | (0.50 | ) | | | — | | | | — | | | | — | |
Year Ended June 30, 2009 | | | 10.23 | | | | (0.08 | )(h) | | | 0.06 | | | | (0.02 | ) | | | — | | | | — | | | | — | |
Year Ended June 30, 2008 | | | 11.24 | | | | 0.28 | (h) | | | (0.74 | ) | | | (0.46 | ) | | | (0.54 | ) | | | (0.01 | ) | | | (0.55 | ) |
| | | | | | | |
Class B | | | | | | | | | | | | | | | | | | | | | | | | | | | | |
Six Months Ended December 31, 2012 (Unaudited) | | | 9.29 | | | | (0.08 | )(h) | | | (0.10 | ) | | | (0.18 | ) | | | — | | | | — | | | | — | |
Year Ended June 30, 2012 | | | 9.47 | | | | (0.20 | )(h) | | | 0.02 | | | | (0.18 | ) | | | — | | | | — | | | | — | |
Year Ended June 30, 2011 | | | 9.44 | | | | (0.23 | )(h) | | | 0.26 | | | | 0.03 | | | | — | | | | — | | | | — | |
Year Ended June 30, 2010 | | | 10.01 | | | | (0.23 | )(h) | | | (0.34 | ) | | | (0.57 | ) | | | — | | | | — | | | | — | |
Year Ended June 30, 2009 | | | 10.10 | | | | (0.15 | )(h) | | | 0.06 | | | | (0.09 | ) | | | — | | | | — | | | | — | |
Year Ended June 30, 2008 | | | 11.07 | | | | 0.17 | (h) | | | (0.70 | ) | | | (0.53 | ) | | | (0.43 | ) | | | (0.01 | ) | | | (0.44 | ) |
| | | | | | | |
Class C | | | | | | | | | | | | | | | | | | | | | | | | | | | | |
Six Months Ended December 31, 2012 (Unaudited) | | | 9.30 | | | | (0.08 | )(h) | | | (0.10 | ) | | | (0.18 | ) | | | — | | | | — | | | | — | |
Year Ended June 30, 2012 | | | 9.48 | | | | (0.20 | )(h) | | | 0.02 | | | | (0.18 | ) | | | — | | | | — | | | | — | |
Year Ended June 30, 2011 | | | 9.46 | | | | (0.23 | )(h) | | | 0.25 | | | | 0.02 | | | | — | | | | — | | | | — | |
Year Ended June 30, 2010 | | | 10.02 | | | | (0.23 | )(h) | | | (0.33 | ) | | | (0.56 | ) | | | — | | | | — | | | | — | |
Year Ended June 30, 2009 | | | 10.12 | | | | (0.15 | )(h) | | | 0.05 | | | | (0.10 | ) | | | — | | | | — | | | | — | |
Year Ended June 30, 2008 | | | 11.07 | | | | 0.19 | (h) | | | (0.71 | ) | | | (0.52 | ) | | | (0.42 | ) | | | (0.01 | ) | | | (0.43 | ) |
| | | | | | | |
Select Class | | | | | | | | | | | | | | | | | | | | | | | | | | | | |
Six Months Ended December 31, 2012 (Unaudited) | | | 9.82 | | | | (0.04 | )(h) | | | (0.10 | ) | | | (0.14 | ) | | | — | | | | — | | | | — | |
Year Ended June 30, 2012 | | | 9.91 | | | | (0.12 | )(h) | | | 0.03 | | | | (0.09 | ) | | | — | | | | — | | | | — | |
Year Ended June 30, 2011 | | | 9.79 | | | | (0.14 | )(h) | | | 0.26 | | | | 0.12 | | | | — | | | | — | | | | — | |
Year Ended June 30, 2010 | | | 10.27 | | | | (0.14 | )(h) | | | (0.34 | ) | | | (0.48 | ) | | | — | | | | — | | | | — | |
Year Ended June 30, 2009 | | | 10.27 | | | | (0.05 | )(h) | | | 0.05 | | | | — | (i) | | | — | | | | — | | | | — | |
Year Ended June 30, 2008 | | | 11.31 | | | | 0.30 | (h) | | | (0.73 | ) | | | (0.43 | ) | | | (0.60 | ) | | | (0.01 | ) | | | (0.61 | ) |
| (a) | Annualized for periods less than one year. |
| (b) | Not annualized for periods less than one year. |
| (c) | Includes adjustments in accordance with accounting principles generally accepted in the United States of America and as such, the net asset values for financial reporting purposes and the returns based upon those net asset values may differ from the net asset values and returns for shareholder transactions. |
| (d) | Includes earnings credits and interest expense, if applicable, each of which is less than 0.01% or unless otherwise noted. |
| (e) | The net expenses and expenses without waivers, reimbursements and earnings credits (excluding dividend expense and interest expense for securities sold short) for Class A are 1.48% and 1.90% for the six months ended December 31, 2012, 1.48% and 1.94% for the year ended June 30, 2012, 1.49% and 1.95% for 2011, 1.49% and 1.94% for 2010, 1.50% and 1.95% for 2009 and 1.51% and 1.93% for 2008; for Class B are 2.22% and 2.39 for the six months ended December 31, 2012, 2.23% and 2.45% for the year ended June 30, 2012, 2.24% and 2.45% for 2011, 2.24% and 2.44% for 2010, 2.25% and 2.45% for 2009 and 2.26% and 2.43% for 2008; for Class C are 2.22% and 2.39% for the six months ended December 31, 2012, 2.23% and 2.44% for the year ended June 30, 2012, 2.24% and 2.45% for 2011, 2.24% and 2.44% for 2010, 2.25% and 2.45% for 2009 and 2.26% and 2.43% for 2008; for Select Class are 1.23% and 1.65% for the six months ended December 31, 2012, 1.23% and 1.69% for the year ended June 30, 2012, 1.24% and 1.70% for 2011, 1.24% and 1.69% for 2010, 1.25% and 1.70% for 2009 and 1.25% and 1.67% for 2008, respectively. |
| (f) | Commencing on June 30, 2009, the Fund will present portfolio turnover in two ways, one including short sales and the other excluding short sales. For periods prior to June 30, 2009, the Fund's portfolio turnover calculation excluded short sales. |
| (g) | Portfolio turnover is calculated by dividing the lesser of total purchases or sales of portfolio securities for the reporting period by the monthly average of portfolio securities owned during the reporting period. Excluded from both the numerator and denominator are amounts relating to derivatives and securities whose maturities or expiration dates at the time of acquisition were one year or less. |
| (h) | Calculated based upon average shares outstanding. |
| (i) | Amount rounds to less than $0.01. |
SEE NOTES TO FINANCIAL STATEMENTS.
| | | | | | |
| | | |
| 80 | | | | J.P. MORGAN MID CAP/MULTI-CAP FUNDS | | DECEMBER 31, 2012 |
| | | | | | | | | | | | | | | | | | | | | | | | | | | | | | |
| | | Ratios/Supplemental data | |
| | | | | | | | | | Ratios to average net assets (a) | | | | | | | |
Net asset
value,
end of period | | | Total return
(excludes
sales charge) (b)(c) | | | Net assets,
end of period
(000's) | | | Net expenses
(including
dividend and
interest
expense for
securities sold
short) (d)(e) | | | Net
investment income
(loss) | | | Expenses without waivers,
reimbursements and
earnings credits
(including dividend
and interest expense
for securities sold
short) (e) | | | Portfolio
turnover rate
(excluding short
sales) (b)(f)(g) | | | Portfolio turnover rate (including short sales) (b)(f)(g) | |
| | | | | | | | | | | | | | | | | | | | | | | | | | | | | | |
| | | | | | | | | | | | | | | | | | | | | | | | | | | | | | |
| $ | 9.54 | | | | (1.55 | )% | | $ | 19,603 | | | | 3.30 | % | | | (1.00 | )% | | | 3.72 | % | | | 51 | % | | | 119 | % |
| | 9.69 | | | | (1.22 | ) | | | 19,759 | | | | 2.86 | | | | (1.42 | ) | | | 3.32 | | | | 151 | | | | 316 | |
| | 9.81 | | | | 1.03 | | | | 29,216 | | | | 2.92 | | | | (1.65 | ) | | | 3.38 | | | | 145 | | | | 339 | |
| | 9.71 | | | | (4.90 | ) | | | 94,549 | | | | 2.94 | | | | (1.65 | ) | | | 3.39 | | | | 146 | | | | 348 | |
| | 10.21 | | | | (0.20 | ) | | | 67,884 | | | | 2.84 | | | | (0.79 | ) | | | 3.29 | | | | 175 | | | | 350 | |
| | 10.23 | | | | (4.00 | ) | | | 77,838 | | | | 2.52 | | | | 2.62 | | | | 2.94 | | | | 116 | | | | — | |
| | | | | | | |
| | | | | | | | | | | | | | | | | | | | | | | | | | | | | | |
| | 9.11 | | | | (1.94 | ) | | | 978 | | | | 3.98 | | | | (1.76 | ) | | | 4.15 | | | | 51 | | | | 119 | |
| | 9.29 | | | | (1.90 | ) | | | 1,401 | | | | 3.61 | | | | (2.18 | ) | | | 3.83 | | | | 151 | | | | 316 | |
| | 9.47 | | | | 0.32 | | | | 3,484 | | | | 3.67 | | | | (2.47 | ) | | | 3.88 | | | | 145 | | | | 339 | |
| | 9.44 | | | | (5.69 | ) | | | 7,849 | | | | 3.69 | | | | (2.39 | ) | | | 3.89 | | | | 146 | | | | 348 | |
| | 10.01 | | | | (0.89 | ) | | | 12,766 | | | | 3.59 | | | | (1.55 | ) | | | 3.79 | | | | 175 | | | | 350 | |
| | 10.10 | | | | (4.77 | ) | | | 16,402 | | | | 3.28 | | | | 1.66 | | | | 3.45 | | | | 116 | | | | — | |
| | | | | | | |
| | | | | | | | | | | | | | | | | | | | | | | | | | | | | | |
| | 9.12 | | | | (1.94 | ) | | | 12,166 | | | | 4.01 | | | | (1.75 | ) | | | 4.18 | | | | 51 | | | | 119 | |
| | 9.30 | | | | (1.90 | ) | | | 15,677 | | | | 3.61 | | | | (2.17 | ) | | | 3.82 | | | | 151 | | | | 316 | |
| | 9.48 | | | | 0.21 | | | | 22,094 | | | | 3.67 | | | | (2.46 | ) | | | 3.88 | | | | 145 | | | | 339 | |
| | 9.46 | | | | (5.59 | ) | | | 39,610 | | | | 3.70 | | | | (2.39 | ) | | | 3.89 | | | | 146 | | | | 348 | |
| | 10.02 | | | | (0.99 | ) | | | 61,467 | | | | 3.59 | | | | (1.54 | ) | | | 3.79 | | | | 175 | | | | 350 | |
| | 10.12 | | | | (4.71 | ) | | | 90,603 | | | | 3.28 | | | | 1.79 | | | | 3.45 | | | | 116 | | | | — | |
| | | | | | | |
| | | | | | | | | | | | | | | | | | | | | | | | | | | | | | |
| | 9.68 | | | | (1.43 | ) | | | 457,431 | | | | 3.05 | | | | (0.77 | ) | | | 3.47 | | | | 51 | | | | 119 | |
| | 9.82 | | | | (0.91 | ) | | | 476,803 | | | | 2.61 | | | | (1.17 | ) | | | 3.07 | | | | 151 | | | | 316 | |
| | 9.91 | | | | 1.23 | | | | 491,653 | | | | 2.67 | | | | (1.39 | ) | | | 3.13 | | | | 145 | | | | 339 | |
| | 9.79 | | | | (4.67 | ) | | | 433,539 | | | | 2.70 | | | | (1.39 | ) | | | 3.15 | | | | 146 | | | | 348 | |
| | 10.27 | | | | 0.00 | | | | 528,478 | | | | 2.59 | | | | (0.45 | ) | | | 3.04 | | | | 175 | | | | 350 | |
| | 10.27 | | | | (3.73 | ) | | | 933,631 | | | | 2.27 | | | | 2.79 | | | | 2.69 | | | | 116 | | | | — | |
SEE NOTES TO FINANCIAL STATEMENTS.
| | | | | | | | |
| | | |
| DECEMBER 31, 2012 | | J.P. MORGAN MID CAP/MULTI-CAP FUNDS | | | | | 81 | |
FINANCIAL HIGHLIGHTS
FOR THE PERIODS INDICATED (continued)
| | | | | | | | | | | | | | | | | | | | | | | | | | | | |
| | | Per share operating performance | |
| | | | | | Investment operations | | | Distributions | |
| | | Net asset
value,
beginning
of period | | | Net
investment
income
(loss) | | | Net realized
and unrealized
gains
(losses) on
investments | | | Total from
investment
operations | | | Net
investment
income | | | Net
realized
gain | | | Total
distributions | |
Value Advantage Fund | | | | | | | | | | | | | | | | | | | | | | | | | | | | |
Class A | |
Six Months Ended December 31, 2012 (Unaudited) | | $ | 19.96 | | | $ | 0.15 | (f)(g) | | $ | 1.42 | | | $ | 1.57 | | | $ | (0.20 | ) | | $ | (0.09 | ) | | $ | (0.29 | ) |
Year Ended June 30, 2012 | | | 19.07 | | | | 0.25 | (f) | | | 0.84 | | | | 1.09 | | | | (0.20 | ) | | | — | | | | (0.20 | ) |
Year Ended June 30, 2011 | | | 15.22 | | | | 0.23 | (f) | | | 3.79 | | | | 4.02 | | | | (0.17 | ) | | | — | | | | (0.17 | ) |
Year Ended June 30, 2010 | | | 12.01 | | | | 0.23 | (f) | | | 3.17 | | | | 3.40 | | | | (0.19 | ) | | | — | | | | (0.19 | ) |
Year Ended June 30, 2009 | | | 16.38 | | | | 0.30 | (f) | | | (4.40 | ) | | | (4.10 | ) | | | (0.20 | ) | | | (0.07 | ) | | | (0.27 | ) |
Year Ended June 30, 2008 | | | 20.45 | | | | 0.35 | | | | (3.19 | ) | | | (2.84 | ) | | | (0.24 | ) | | | (0.99 | ) | | | (1.23 | ) |
| | | | | | | |
Class C | | | | | | | | | | | | | | | | | | | | | | | | | | | | |
Six Months Ended December 31, 2012 (Unaudited) | | | 19.91 | | | | 0.08 | (f)(g) | | | 1.43 | | | | 1.51 | | | | (0.06 | ) | | | (0.09 | ) | | | (0.15 | ) |
Year Ended June 30, 2012 | | | 19.01 | | | | 0.16 | (f) | | | 0.84 | | | | 1.00 | | | | (0.10 | ) | | | — | | | | (0.10 | ) |
Year Ended June 30, 2011 | | | 15.17 | | | | 0.14 | (f) | | | 3.77 | | | | 3.91 | | | | (0.07 | ) | | | — | | | | (0.07 | ) |
Year Ended June 30, 2010 | | | 11.97 | | | | 0.15 | (f) | | | 3.17 | | | | 3.32 | | | | (0.12 | ) | | | — | | | | (0.12 | ) |
Year Ended June 30, 2009 | | | 16.25 | | | | 0.23 | (f) | | | (4.34 | ) | | | (4.11 | ) | | | (0.10 | ) | | | (0.07 | ) | | | (0.17 | ) |
Year Ended June 30, 2008 | | | 20.31 | | | | 0.26 | | | | (3.18 | ) | | | (2.92 | ) | | | (0.15 | ) | | | (0.99 | ) | | | (1.14 | ) |
| | | | | | | |
Institutional Class | | | | | | | | | | | | | | | | | | | | | | | | | | | | |
Six Months Ended December 31, 2012 (Unaudited) | | | 19.99 | | | | 0.19 | (f)(g) | | | 1.43 | | | | 1.62 | | | | (0.25 | ) | | | (0.09 | ) | | | (0.34 | ) |
Year Ended June 30, 2012 | | | 19.11 | | | | 0.35 | (f) | | | 0.83 | | | | 1.18 | | | | (0.30 | ) | | | — | | | | (0.30 | ) |
Year Ended June 30, 2011 | | | 15.24 | | | | 0.32 | (f) | | | 3.79 | | | | 4.11 | | | | (0.24 | ) | | | — | | | | (0.24 | ) |
Year Ended June 30, 2010 | | | 12.01 | | | | 0.31 | (f) | | | 3.18 | | | | 3.49 | | | | (0.26 | ) | | | — | | | | (0.26 | ) |
Year Ended June 30, 2009 | | | 16.40 | | | | 0.37 | (f) | | | (4.42 | ) | | | (4.05 | ) | | | (0.27 | ) | | | (0.07 | ) | | | (0.34 | ) |
Year Ended June 30, 2008 | | | 20.47 | | | | 0.44 | | | | (3.19 | ) | | | (2.75 | ) | | | (0.33 | ) | | | (0.99 | ) | | | (1.32 | ) |
| | | | | | | |
Select Class | | | | | | | | | | | | | | | | | | | | | | | | | | | | |
Six Months Ended December 31, 2012 (Unaudited) | | | 20.00 | | | | 0.17 | (f)(g) | | | 1.42 | | | | 1.59 | | | | (0.22 | ) | | | (0.09 | ) | | | (0.31 | ) |
Year Ended June 30, 2012 | | | 19.12 | | | | 0.30 | (f) | | | 0.83 | | | | 1.13 | | | | (0.25 | ) | | | — | | | | (0.25 | ) |
Year Ended June 30, 2011 | | | 15.27 | | | | 0.28 | (f) | | | 3.79 | | | | 4.07 | | | | (0.22 | ) | | | — | | | | (0.22 | ) |
Year Ended June 30, 2010 | | | 12.04 | | | | 0.27 | (f) | | | 3.19 | | | | 3.46 | | | | (0.23 | ) | | | — | | | | (0.23 | ) |
Year Ended June 30, 2009 | | | 16.44 | | | | 0.34 | (f) | | | (4.42 | ) | | | (4.08 | ) | | | (0.25 | ) | | | (0.07 | ) | | | (0.32 | ) |
Year Ended June 30, 2008 | | | 20.52 | | | | 0.37 | | | | (3.17 | ) | | | (2.80 | ) | | | (0.29 | ) | | | (0.99 | ) | | | (1.28 | ) |
| (a) | Annualized for periods less than one year. |
| (b) | Not annualized for periods less than one year. |
| (c) | Includes adjustments in accordance with accounting principles generally accepted in the United States of America and as such, the net asset values for financial reporting purposes and the returns based upon those net asset values may differ from the net asset values and returns for shareholder transactions. |
| (d) | Includes earnings credits and interest expense, if applicable, each of which is less than 0.01% or unless otherwise noted. |
| (e) | Portfolio turnover is calculated by dividing the lesser of total purchases or sales of portfolio securities for the reporting period by the monthly average of portfolio securities owned during the reporting period. Excluded from both the numerator and denominator are amounts relating to derivatives and securities whose maturities or expiration dates at the time of acquisition were one year or less. |
| (f) | Calculated based upon average shares outstanding. |
| (g) | Reflects special dividends paid out during the period by several of the Fund’s holdings. Had the Fund not received the special dividends the net investment income (loss) per share would have been $0.13, $0.06, $0.17 and $0.15 for Class A, Class C, Institutional Class and Select Class Shares, respectively and the net investment income (loss) ratio would have been 1.19%, 0.57%, 1.63% and 1.38% for Class A, Class C, Institutional Class and Select Class Shares, respectively. |
SEE NOTES TO FINANCIAL STATEMENTS.
| | | | | | |
| | | |
| 82 | | | | J.P. MORGAN MID CAP/MULTI-CAP FUNDS | | DECEMBER 31, 2012 |
| | | | | | | | | | | | | | | | | | | | | | | | | | |
| | | Ratios/Supplemental data | |
| | | | | | | | | | Ratios to average net assets (a) | | | | |
Net asset
value,
end of
period | | | Total return
(excludes
sales charge) (b)(c) | | | Net assets,
end of
period
(000's) | | | Net
expenses (d) | | | Net
investment
income
(loss) | | | Expenses
without waivers,
reimbursements and
earnings credits | | | Portfolio
turnover
rate (b)(e) | |
| | | | | | | | | | | | | | | | | | | | | | | | | | |
| | | | | | | | | | | | | | | | | | | | | | | | | | |
| $ | 21.24 | | | | 7.83 | % | | $ | 498,879 | | | | 1.24 | % | | | 1.38 | %(g) | | | 1.33 | % | | | 12 | % |
| | 19.96 | | | | 5.83 | | | | 206,816 | | | | 1.25 | | | | 1.34 | | | | 1.41 | | | | 49 | |
| | 19.07 | | | | 26.45 | | | | 232,103 | | | | 1.24 | | | | 1.28 | | | | 1.34 | | | | 33 | |
| | 15.22 | | | | 28.35 | | | | 150,081 | | | | 1.24 | | | | 1.52 | | | | 1.38 | | | | 45 | |
| | 12.01 | | | | (24.82 | ) | | | 112,739 | | | | 1.25 | | | | 2.45 | | | | 1.50 | | | | 70 | |
| | 16.38 | | | | (14.42 | ) | | | 152,696 | | | | 1.25 | | | | 1.87 | | | | 1.43 | | | | 103 | |
| | | | | | |
| | | | | | | | | | | | | | | | | | | | | | | | | | |
| | 21.27 | | | | 7.56 | | | | 134,498 | | | | 1.74 | | | | 0.75 | (g) | | | 1.84 | | | | 12 | |
| | 19.91 | | | | 5.32 | | | | 117,937 | | | | 1.75 | | | | 0.84 | | | | 1.91 | | | | 49 | |
| | 19.01 | | | | 25.82 | | | | 131,743 | | | | 1.74 | | | | 0.78 | | | | 1.84 | | | | 33 | |
| | 15.17 | | | | 27.72 | | | | 108,165 | | | | 1.74 | | | | 1.01 | | | | 1.88 | | | | 45 | |
| | 11.97 | | | | (25.19 | ) | | | 97,723 | | | | 1.75 | | | | 1.86 | | | | 1.99 | | | | 70 | |
| | 16.25 | | | | (14.86 | ) | | | 182,093 | | | | 1.75 | | | | 1.36 | | | | 1.93 | | | | 103 | |
| | | | | | |
| | | | | | | | | | | | | | | | | | | | | | | | | | |
| | 21.27 | | | | 8.09 | | | | 735,751 | | | | 0.74 | | | | 1.82 | (g) | | | 0.94 | | | | 12 | |
| | 19.99 | | | | 6.36 | | | | 384,525 | | | | 0.75 | | | | 1.86 | | | | 1.01 | | | | 49 | |
| | 19.11 | | | | 27.06 | | | | 284,433 | | | | 0.74 | | | | 1.79 | | | | 0.94 | | | | 33 | |
| | 15.24 | | | | 29.03 | | | | 156,531 | | | | 0.74 | | | | 2.04 | | | | 0.98 | | | | 45 | |
| | 12.01 | | | | (24.41 | ) | | | 70,825 | | | | 0.75 | | | | 3.11 | | | | 1.15 | | | | 70 | |
| | 16.40 | | | | (13.97 | ) | | | 19,872 | | | | 0.75 | | | | 2.37 | | | | 1.03 | | | | 103 | |
| | | | | | |
| | | | | | | | | | | | | | | | | | | | | | | | | | |
| | 21.28 | | | | 7.94 | | | | 732,113 | | | | 0.99 | | | | 1.56 | (g) | | | 1.09 | | | | 12 | |
| | 20.00 | | | | 6.09 | | | | 422,861 | | | | 1.00 | | | | 1.62 | | | | 1.16 | | | | 49 | |
| | 19.12 | | | | 26.75 | | | | 270,562 | | | | 0.99 | | | | 1.53 | | | | 1.09 | | | | 33 | |
| | 15.27 | | | | 28.70 | | | | 71,209 | | | | 0.99 | | | | 1.77 | | | | 1.13 | | | | 45 | |
| | 12.04 | | | | (24.62 | ) | | | 51,000 | | | | 1.00 | | | | 2.75 | | | | 1.25 | | | | 70 | |
| | 16.44 | | | | (14.19 | ) | | | 49,262 | | | | 1.00 | | | | 2.18 | | | | 1.18 | | | | 103 | |
SEE NOTES TO FINANCIAL STATEMENTS.
| | | | | | | | |
| | | |
| DECEMBER 31, 2012 | | J.P. MORGAN MID CAP/MULTI-CAP FUNDS | | | | | 83 | |
NOTES TO FINANCIAL STATEMENTS
AS OF DECEMBER 31, 2012 (Unaudited)
1. Organization
JPMorgan Trust I (“JPM I”) and JPMorgan Trust II (“JPM II”) (the “Trusts”) were formed on November 12, 2004, as Delaware statutory trusts, pursuant to Declarations of Trust dated November 5, 2004 and are registered under the Investment Company Act of 1940, as amended (the “1940 Act”), as open-end management investment companies.
J.P. Morgan Mutual Fund Investment Trust (“JPMMFIT”), an open-end management investment company, was organized as a Massachusetts business trust on September 23, 1997.
J.P. Morgan Fleming Mutual Fund Group, Inc. (“JPMFMFG”), an open-end management investment company, was organized as a Maryland corporation on August 19, 1997.
The following are 7 separate funds of the Trusts (collectively, the “Funds”) covered by this report:
| | | | | | |
| | | Classes Offered | | Trust | | Diversified/Non-Diversified |
| Growth Advantage Fund | | Class A, Class B, Class C, Class R5 and Select Class | | JPMMFIT | | Diversified |
| Mid Cap Core Fund | | Class A, Class C, Class R2, Class R5, Class R6 and Select Class | | JPM I | | Diversified |
| Mid Cap Equity Fund | | Class A, Class C, and Select Class | | JPM I | | Diversified |
| Mid Cap Growth Fund | | Class A, Class B, Class C, Class R2, Class R5, Class R6 and Select Class | | JPM II | | Diversified |
| Mid Cap Value Fund | | Class A, Class B, Class C, Class R2, Institutional Class and Select Class | | JPMFMFG | | Diversified |
| Multi-Cap Market Neutral Fund | | Class A, Class B, Class C, and Select Class | | JPM II | | Diversified |
| Value Advantage Fund | | Class A, Class C, Institutional Class and Select Class | | JPM I | | Diversified |
Class R5 Shares and Class R6 Shares commenced operations on November 1, 2011 for the Mid Cap Growth Fund.
The investment objective of Growth Advantage Fund is to seek to provide long-term capital growth.
The investment objective of Mid Cap Core Fund is to seek long-term capital appreciation.
The investment objective of Mid Cap Equity Fund is to seek long-term capital growth.
The investment objective of Mid Cap Growth Fund is to seek growth of capital and secondarily, current income by investing primarily in equity securities.
The investment objective of Mid Cap Value Fund is to seek growth from capital appreciation.
The investment objective of Multi-Cap Market Neutral Fund is to seek long-term capital preservation and growth by using strategies designed to produce returns which have no correlation with general domestic market performance.
The investment objective of Value Advantage Fund is to seek to provide long-term total return from a combination of income and capital gains.
Effective as of the close of business on February 22, 2013, all share classes of the Mid Cap Value Fund are publicly offered only on a limited basis. Investors are not eligible to purchase shares of the Fund unless they meet certain requirements as described in their prospectuses.
Effective November 1, 2009, Class B Shares of the Growth Advantage Fund, Mid Cap Growth Fund, Mid Cap Value Fund and Multi-Cap Market Neutral Fund may not be purchased or acquired by new or existing shareholders, except through exchanges from Class B Shares of another J.P. Morgan Fund and dividend reinvestments. Shareholders who have invested in Class B Shares prior to November 1, 2009 may continue to hold their Class B Shares until they automatically convert to Class A Shares.
Class A Shares generally provide for a front-end sales charge while Class B and Class C Shares provide for a contingent deferred sales charge (“CDSC”). Class B Shares automatically convert to Class A Shares after eight years. No sales charges are assessed with respect to the Class R2, Class R5, Class R6, Institutional Class and Select Class Shares. All classes of shares have equal rights as to earnings, assets and voting privileges, except that each class may bear different distribution and shareholder servicing fees and each class has exclusive voting rights with respect to its distribution plan and shareholder servicing agreements. Certain Class A Shares, for which front-end sales charges have been waived, may be subject to a CDSC as described in the Funds’ prospectus.
2. Significant Accounting Policies
The following is a summary of significant accounting policies followed by the Funds in the preparation of their financial statements. The policies are in accordance with accounting principles generally accepted in the United States of America. The preparation of financial statements requires management to make estimates and assumptions that affect the reported amounts and disclosures in the financial statements. Actual results could differ from those estimates.
A. Valuation of Investments — Equity securities listed on a North American, Central American, South American or Caribbean securities exchange shall generally be valued at the last sale price on the exchange on which the security is principally traded that is reported before the time when the net assets of the Funds are valued. The value of securities listed on The NASDAQ Stock Market LLC shall generally be the NASDAQ Official Closing Price.
| | | | | | |
| | | |
| 84 | | | | J.P. MORGAN MID CAP/MULTI-CAP FUNDS | | DECEMBER 31, 2012 |
Generally, short-term investments of sufficient credit quality maturing in less than 61 days are valued at amortized cost, which approximates fair value. Certain investments of the Funds may, depending upon market conditions, trade in relatively thin markets and/or in markets that experience significant volatility. As a result of these conditions, the prices used by the Funds to value securities may differ from the value that would be realized if these securities were sold, and the differences could be material. Futures and options are generally valued on the basis of available market quotations. Swaps and other derivatives are valued daily, primarily using independent or affiliated pricing services approved by the Board of Trustees. If valuations are not available from such services or values received are deemed not representative of fair value, values will be obtained from a third party broker-dealer or counterparty. Investments in other open-end investment companies are valued at each investment company’s net asset value per share as of the report date.
Securities or other assets for which market quotations are not readily available or for which market quotations do not represent the fair value of the security or asset at the time of pricing (including certain illiquid securities) are fair valued in accordance with procedures established by and under the supervision and responsibility of the Board of Trustees. The Board of Trustees has established an Audit and Valuation Committee to assist with the oversight of the valuation of the Funds’ securities. JPMorgan Funds Management, Inc. (the “Administrator”, or “JPMFM”), an indirect, wholly-owned subsidiary of JPMorgan Chase & Co. (“JPMorgan”), has established a Valuation Committee (“VC”) that is comprised of senior representatives from JPMFM, J.P. Morgan Investment Management Inc. (“JPMIM” or the “Advisor”) , a wholly-owned subsidiary of JPMorgan Asset Management Holdings Inc. (“JPMAM”), which is a wholly-owned subsidiary of JPMorgan, JPMAM’s Legal and Compliance, JPMAM’s Risk Management and the Funds’ Chief Compliance Officer. The VC’s responsibilities include making determinations regarding Level 3 fair value measurements (“Fair Values”) and/or providing recommendations for approval to the Board of Trustees’ Audit and Valuation Committee, in accordance with the Funds’ valuation policies.
The VC or Board of Trustees, as applicable, primarily employ a market-based approach which may use related or comparable assets or liabilities, recent transactions, market multiples, book values, and other relevant information for the investment to determine the fair value of the investment. The VC or Board of Trustees may also use an income-based valuation approach in which the anticipated future cash flows of the investment are discounted to calculate fair value. Discounts may also be applied due to the nature or duration of any restrictions on the disposition of the investments. Valuations may be based upon current market prices of securities that are comparable in coupon, rating, maturity and industry.
It is possible that the estimated values may differ significantly from the values that would have been used had a ready market for the investments existed, and such differences could be material. JPMFM and JPMIM are responsible for monitoring developments that may impact Fair Values and for discussing and assessing Fair Values on an ongoing and at least a quarterly basis with the VC and Board of Trustees, as applicable. The appropriateness of Fair Values is assessed based on results of unchanged price review and consideration of macro or security specific events, back testing and broker and vendor due diligence.
Valuations reflected in this report are as of the report date. As a result, changes in valuation due to market events and/or issuer related events after the report date and prior to issuance of the report, are not reflected herein.
The various inputs that are used in determining the fair value of the Funds’ investments are summarized into the three broad levels listed below.
| Ÿ | | Level 1 — quoted prices in active markets for identical securities |
| Ÿ | | Level 2 — other significant observable inputs (including quoted prices for similar securities, interest rates, prepayment speeds, credit risk, etc.) |
| Ÿ | | Level 3 — significant unobservable inputs (including the Funds’ own assumptions in determining the fair value of investments) |
A financial instrument’s level within the fair value hierarchy is based on the lowest level of any input both individually and in the aggregate that is significant to the fair value measurement. The inputs or methodology used for valuing securities are not necessarily an indication of the risk associated with investing in those securities.
The following tables represent each valuation input as presented on the Schedules of Portfolio Investments (“SOIs”) (amounts in thousands):
Growth Advantage Fund
| | | | | | | | | | | | | | | | |
| | | Level 1 Quoted prices | | | Level 2 Other significant observable inputs | | | Level 3 Significant unobservable inputs | | | Total | |
Total Investments in Securities (a) | | $ | 1,476,892 | | | $ | — | | | $ | — | | | $ | 1,476,892 | |
| | | | | | | | | | | | | | | | |
| | | | |
| Mid Cap Core Fund | | | | | | | | | | | | | | | | |
| | | Level 1 Quoted prices | | | Level 2 Other significant observable inputs | | | Level 3 Significant unobservable inputs | | | Total | |
Total Investments in Securities (a) | | $ | 760,859 | | | $ | — | | | $ | — | | | $ | 760,859 | |
| | | | | | | | | | | | | | | | |
| | | | | | | | |
| | | |
| DECEMBER 31, 2012 | | J.P. MORGAN MID CAP/MULTI-CAP FUNDS | | | | | 85 | |
Mid Cap Equity Fund
| | | | | | | | | | | | | | | | |
| | | Level 1 Quoted prices | | | Level 2 Other significant observable inputs | | | Level 3 Significant unobservable inputs | | | Total | |
Total Investments in Securities (a) | | $ | 927,944 | | | $ | — | | | $ | — | | | $ | 927,944 | |
| | | | | | | | | | | | | | | | |
| | | | |
| Mid Cap Growth Fund | | | | | | | | | | | | | | | | |
| | | Level 1 Quoted prices | | | Level 2 Other significant observable inputs | | | Level 3 Significant unobservable inputs | | | Total | |
Total Investments in Securities (a) | | $ | 1,379,919 | | | $ | — | | | $ | — | | | $ | 1,379,919 | |
| | | | | | | | | | | | | | | | |
| | | | |
| Mid Cap Value Fund | | | | | | | | | | | | | | | | |
| | | Level 1 Quoted prices | | | Level 2 Other significant observable inputs | | | Level 3 Significant unobservable inputs | | | Total | |
Total Investments in Securities (a) | | $ | 9,926,940 | | | $ | — | | | $ | — | | | $ | 9,926,940 | |
| | | | | | | | | | | | | | | | |
| | | | |
| Multi-Cap Market Neutral Fund | | | | | | | | | | | | | | | | |
| | | Level 1 Quoted prices | | | Level 2 Other significant observable inputs | | | Level 3 Significant unobservable inputs | | �� | Total | |
Total Investments in Securities (a) | | $ | 496,577 | | | $ | — | | | $ | — | | | $ | 496,577 | |
| | | | | | | | | | | | | | | | |
Total Liabilities (a) | | $ | (434,080 | ) | | $ | — | | | $ | — | | | $ | (434,080 | ) |
| | | | | | | | | | | | | | | | |
| | | | |
| Value Advantage Fund | | | | | | | | | | | | | | | | |
| | | Level 1 Quoted prices | | | Level 2 Other significant observable inputs | | | Level 3 Significant unobservable inputs | | | Total | |
Total Investments in Securities (b) | | $ | 2,075,479 | | | $ | 20,413 | | | $ | — | | | $ | 2,095,892 | |
| | | | | | | | | | | | | | | | |
| (a) | All portfolio holdings designated as Level 1 are disclosed individually in the SOIs. Please refer to the SOIs for industry specifics of portfolio holdings. |
| (b) | All portfolio holdings designated as Level 1 and Level 2 are disclosed individually in the SOI. Level 2 consists of certain ADRs, the report values of which are evaluated prices. Please refer to the SOI for industry specifics of portfolio holdings. |
There were no transfers between Levels 1 and 2 during the six months ended December 31, 2012.
B. Short Sales — The Multi-Cap Market Neutral Fund engages in short sales as part of its normal investment activities. In a short sale, the Fund sells securities it does not own. In order to deliver securities to the purchaser, the Fund borrows securities from a broker. To close out a short position, the Fund delivers the same securities to the broker.
The Fund is required to pledge cash or securities to the broker as collateral for the securities sold short. Collateral requirements are calculated daily based on the current market value of the short positions. Cash collateral deposited with the broker is recorded as an asset on the Statements of Assets and Liabilities. Securities segregated as collateral are denoted in the SOI. The Fund may receive or pay the net of the following amounts: (i) a portion of the income from the investment of cash collateral; (ii) the broker’s fee on the borrowed securities (calculated daily based upon the market value of each borrowed security and a variable rate that is dependent on availability of the security); and (iii) a financing charge for the difference between the market value of the short position and cash collateral deposited with the broker. The net income or fee is included as interest income or interest expense, respectively, on securities sold short in the Statements of Operations.
The Fund is obligated to pay the broker dividends declared on short positions when a position is open on record date. Dividends on short positions are recorded on the Statements of Operations as dividend expense on securities sold short on ex-dividend date.
Liabilities for securities sold short are reported at market value on the Statements of Assets and Liabilities and the change in market value is recorded as unrealized gain or loss on the Statements of Operations. Short sale transactions may result in unlimited losses as the security’s price increases and the short position loses value. There is no upward limit on the price a borrowed security could attain. The Fund is also subject to risk of loss if the broker were to fail to perform its obligations under the contractual terms.
The Fund will record a realized loss if the price of the security increases between the date of the short sale and the date on which the Fund replaces the borrowed security. The Fund will record a realized gain if the price of the security declines between those dates.
| | | | | | |
| | | |
| 86 | | | | J.P. MORGAN MID CAP/MULTI-CAP FUNDS | | DECEMBER 31, 2012 |
As of December 31, 2012, the Fund had outstanding short sales as listed on its SOI.
C. Securities Lending — Each Fund (except Mid Cap Core Fund, Multi-Cap Market Neutral Fund and Value Advantage Fund) may lend securities to brokers approved by the Advisor in order to generate additional income. Goldman Sachs Bank USA, doing business as Goldman Sachs Agency Lending (“GSAL”) serves as lending agent for the Growth Advantage Fund, Mid Cap Equity Fund, Mid Cap Growth Fund and Mid Cap Value Fund pursuant to a Securities Lending Agreement (the “GSAL Securities Lending Agreement”). The Funds receive cash collateral, which is invested in Capital Shares of the JPMorgan Prime Money Market Fund (“Collateral Investments”). Upon termination of a loan, the Funds are required to return to the borrower the posted cash collateral. Loans are subject to termination by the Funds or the borrower at any time.
Securities lending income is comprised of income earned on Collateral Investments, net amount of a rebate received from or paid to borrowers for use of cash collateral and lending agent fees. This amount is recorded as Income from securities lending (net) on the Statements of Operations. The Funds also receive payments from the borrower during the period of the loan, equivalent to dividends and interest earned on the securities loaned, which are recorded as Dividend or Interest income, respectively, on the Statements of Operations.
For the six months ended December 31, 2012, the Funds earned the following amounts from the investment of cash collateral, prior to rebates or fees, from an investment in an affiliated fund as described below (amounts in thousands):
| | | | |
Mid Cap Equity Fund | | $ | 1 | |
Mid Cap Growth Fund | | | 2 | |
Mid Cap Value Fund | | | 2 | |
At the inception of a loan, securities are exchanged for cash collateral equal to at least 102% of the value of loaned U.S. securities, plus accrued interest. The GSAL Securities Lending Agreement requires that the loaned securities be marked to market on a daily basis and additional cash collateral is requested from borrowers when the cash received from borrowers becomes less than 102% of the value of loaned securities.
The value of the cash collateral received is recorded as a liability on the Statements of Assets and Liabilities and details of Collateral Investments are disclosed in the SOIs. At December 31, 2012, the value of outstanding securities on loan and the value of Collateral Investments were as follows (amounts in thousands):
| | | | | | | | | | | | |
| | | Value of
Securities
on Loan | | | Cash Collateral
Posted by
Borrowers | | | Total Value
of Collateral
Investments | |
Mid Cap Equity Fund | | $ | 1,043 | | | $ | 1,056 | * | | $ | 1,056 | |
Mid Cap Value Fund | | | 3,616 | | | | 3,656 | * | | | 3,656 | |
| * | Subsequent to December 31, 2012, additional collateral was received from borrowers. |
The Funds bear the risk of loss associated with the Collateral Investments and are not entitled to additional collateral from the borrower to cover any such losses. To the extent that the value of the Collateral Investments declines below the amount owed to a borrower, a Fund may incur losses that exceed the amount it earned on lending the security. Upon termination of a loan, a Fund may use leverage (borrow money) to repay the borrower for cash collateral posted, if the Advisor does not believe that it is prudent to sell the Collateral Investments to fund the payment of this liability.
Securities lending also involves counterparty risks, including the risk that the loaned securities may not be returned in a timely manner or at all. Subject to certain conditions, GSAL has agreed to indemnify the Funds from losses resulting from a borrower’s failure to return a loaned security.
JPMIM waived fees associated with the following Funds’ investment of collateral in JPMorgan Prime Money Market Fund as follows (amounts in thousands):
| | | | |
Mid Cap Equity Fund | | $ | — | (a) |
Mid Cap Growth Fund | | | 1 | |
Mid Cap Value Fund | | | 2 | |
| (a) | Amount rounds to less than $1,000. |
These amounts offset the administration fees and shareholder servicing fees incurred by JPMorgan Prime Money Market Fund related to the Funds’ investment in such fund. A portion of the waiver is voluntary.
D. Foreign Currency Translation — The books and records of the Multi-Cap Market Neutral Fund are maintained in U.S. dollars. Foreign currency amounts are translated into U.S. dollars at the prevailing exchange rates of such currencies against the U.S. dollar. The market value of investment securities and other assets and liabilities are translated at the exchange rate as of the valuation date. Purchases and sales of investment securities, income and expenses are translated at the exchange rate prevailing on the respective dates of such transactions.
Although the net assets of the Fund are presented at the foreign exchange rates and market values at the close of the period, the Fund does not isolate that portion of the results of operations arising as a result of changes in the foreign exchange rates from the fluctuations arising from
| | | | | | | | |
| | | |
| DECEMBER 31, 2012 | | J.P. MORGAN MID CAP/MULTI-CAP FUNDS | | | | | 87 | |
changes in the market prices of securities held or sold during the period. Accordingly, such foreign currency gains (losses) are included in the reported net realized and unrealized gains (losses) on investment transactions on the Statements of Operations.
Reported realized foreign currency gains or losses arise from the disposition of foreign currency, purchases of foreign currency in certain countries (such as Brazil) that impose a tax on such purchases, currency gains or losses realized between the trade and settlement dates on securities transactions, and the difference between the amounts of dividends, interest and foreign withholding taxes recorded on the Fund’s books on the transaction date and the U.S. dollar equivalent of the amounts actually received or paid. Unrealized foreign exchange gains and losses arise from changes (due to changes in the exchange rate) in the value of foreign currency and other assets and liabilities denominated in foreign currencies, which are held at period end.
E. Security Transactions and Investment Income — Investment transactions are accounted for on the trade date (the date the order to buy or sell is executed). Securities gains and losses are calculated on a specifically identified cost basis. Interest income is determined on the basis of coupon interest accrued using the effective interest method which adjusts for amortization of premiums and accretion of discounts. Dividend income net of foreign taxes withheld, if any, less dividend expense on securities sold short, is recorded on the ex-dividend date or when a Fund first learns of the dividend.
To the extent such information is publicly available, the Funds record distributions received in excess of income earned from underlying investments as a reduction of cost of investments and/or realized gain. Such amounts are based on estimates if actual amounts are not available and actual amounts of income, realized gain and return of capital may differ from the estimated amounts. The Funds adjust the estimated amounts of the components of distributions (and consequently their net investment income) as necessary once the issuers provide information about the actual composition of the distributions.
F. Allocation of Income and Expenses — Expenses directly attributable to a fund are charged directly to that fund, while the expenses attributable to more than one fund of the Trusts are allocated among the respective funds. In calculating the net asset value per share of each class, investment income, realized and unrealized gains and losses and expenses, other than class specific expenses, are allocated daily to each class of shares based upon the proportion of net assets of each class at the beginning of each day. Each class of shares bears its pro-rata portion of expenses attributable to its fund, except that each class separately bears expenses related specifically to that class.
G. Federal Income Taxes — Each Fund is treated as a separate taxable entity for Federal income tax purposes. Each Fund’s policy is to comply with the provisions of the Internal Revenue Code of 1986, as amended (the “Code”), applicable to regulated investment companies and to distribute to shareholders all of its distributable net investment income and net realized gain on investments. Accordingly, no provision for Federal income tax is necessary. The Funds are not aware of any tax positions for which it is reasonably possible that the total amounts of unrecognized tax benefits or losses will significantly change in the next twelve months. However, the Funds’ conclusions may be subject to future review based on changes in, or the interpretation of, the accounting standards or tax laws and regulations. Each of the Fund’s Federal tax returns for the prior three fiscal years, or since inception if shorter, remain subject to examination by the Internal Revenue Service.
H. Distributions to Shareholders — Distributions from net investment income are generally declared and paid at least annually, except for the Mid Cap Equity Fund, Mid Cap Growth Fund and Multi-Cap Market Neutral Fund, which are generally declared and paid at least quarterly. Distributions are declared separately for each class. No class has preferential dividend rights; differences in per share rates are due to differences in separate class expenses. Net realized capital gains, if any, are distributed by each Fund at least annually. The amount of distributions from net investment income and net realized capital gains is determined in accordance with Federal income tax regulations, which may differ from accounting principles generally accepted in the United States of America. To the extent these “book/tax” differences are permanent in nature (i.e., that they result from other than timing of recognition — “temporary differences”), such amounts are reclassified within the capital accounts based on their Federal tax-basis treatment.
3. Fees and Other Transactions with Affiliates
A. Investment Advisory Fee — Pursuant to the Investment Advisory Agreements, JPMIM supervises the investments of each respective Fund and for such services is paid a fee. The fee is accrued daily and paid monthly based on each Fund’s respective average daily net assets. The annual rate for each Fund is as follows:
| | | | |
Growth Advantage Fund | | | 0.65 | % |
Mid Cap Core Fund | | | 0.65 | |
Mid Cap Equity Fund | | | 0.65 | |
Mid Cap Growth Fund | | | 0.65 | |
Mid Cap Value Fund | | | 0.65 | |
Multi-Cap Market Neutral Fund | | | 1.25 | |
Value Advantage Fund | | | 0.65 | |
The Advisor waived Investment Advisory fees and/or reimbursed expenses as outlined in Note 3.F.
B. Administration Fee — Pursuant to an Administration Agreement, the Administrator provides certain administration services to the Funds. In consideration of these services, the Administrator receives a fee accrued daily and paid monthly at an annual rate of 0.15% of the first $25 billion of the average daily net assets of all funds in the J.P. Morgan Funds Complex (excluding certain funds of funds and money market funds) and 0.075%
| | | | | | |
| | | |
| 88 | | | | J.P. MORGAN MID CAP/MULTI-CAP FUNDS | | DECEMBER 31, 2012 |
of the average daily net assets in excess of $25 billion of all such funds. For the six months ended December 31, 2012, the annualized effective rate was 0.09% of each Fund’s average daily net assets, notwithstanding any fee waivers and/or expense reimbursements.
The Administrator waived Administration fees as outlined in Note 3.F.
JPMorgan Chase Bank, N.A. (“JPMCB”), a wholly-owned subsidiary of JPMorgan, serves as the Funds’ sub-administrator (the “Sub-administrator”). For its services as Sub-administrator, JPMCB receives a portion of the fees payable to the Administrator.
C. Distribution Fees — Pursuant to a Distribution Agreement, JPMorgan Distribution Services, Inc. (the “Distributor”), a wholly-owned subsidiary of JPMorgan, serves as the Trusts’ exclusive underwriter and promotes and arranges for the sale of each Fund’s shares.
The Board of Trustees has adopted a Distribution Plan (the “Distribution Plan”) for Class A, Class B, Class C and Class R2 Shares of the Funds in accordance with Rule 12b-1 under the 1940 Act. The Distribution Plan provides that each Fund shall pay distribution fees, including payments to the Distributor, at annual rates of the average daily net assets as shown in the table below:
| | | | | | | | | | | | | | | | |
| | | Class A | | | Class B | | | Class C | | | Class R2 | |
Growth Advantage Fund | | | 0.25 | % | | | 0.75 | % | | | 0.75 | % | | | n/a | |
Mid Cap Core Fund | | | 0.25 | | | | n/a | | | | 0.75 | | | | 0.50 | % |
Mid Cap Equity Fund | | | 0.25 | | | | n/a | | | | 0.75 | | | | n/a | |
Mid Cap Growth Fund | | | 0.25 | | | | 0.75 | | | | 0.75 | | | | 0.50 | |
Mid Cap Value Fund | | | 0.25 | | | | 0.75 | | | | 0.75 | | | | 0.50 | |
Multi-Cap Market Neutral Fund | | | 0.25 | | | | 0.75 | | | | 0.75 | | | | n/a | |
Value Advantage Fund | | | 0.25 | | | | n/a | | | | 0.75 | | | | n/a | |
In addition, the Distributor is entitled to receive the front-end sales charges from purchases of Class A Shares and the CDSC from redemptions of Class B and Class C Shares and certain Class A Shares for which front-end sales charges have been waived. For the six months ended December 31, 2012, the Distributor retained the following amounts (in thousands):
| | | | | | | | |
| | | Front-End Sales Charge | | | CDSC | |
Growth Advantage Fund | | $ | 27 | | | $ | 1 | |
Mid Cap Core Fund | | | — | (a) | | | — | |
Mid Cap Equity Fund | | | 3 | | | | — | (a) |
Mid Cap Growth Fund | | | 5 | | | | 2 | |
Mid Cap Value Fund | | | 113 | | | | 7 | |
Multi-Cap Market Neutral Fund | | | 1 | | | | — | (a) |
Value Advantage Fund | | | 31 | | | | 1 | |
| (a) | Amount rounds to less than $1,000. |
D. Shareholder Servicing Fees — The Trusts, on behalf of the Funds, have entered into Shareholder Servicing Agreements with the Distributor under which the Distributor provides certain support services to the shareholders. The Class R6 Shares do not participate in the Shareholder Servicing Agreement. For performing these services, the Distributor receives a fee that is accrued daily and paid monthly equal to a percentage of the average daily net assets as shown in the table below:
| | | | | | | | | | | | | | | | | | | | | | | | | | | | |
| | | Class A | | | Class B | | | Class C | | | Class R2 | | | Class R5 | | | Institutional Class | | | Select Class | |
Growth Advantage Fund | | | 0.25 | % | | | 0.25 | % | | | 0.25 | % | | | n/a | | | | 0.05 | % | | | n/a | | | | 0.25 | % |
Mid Cap Core Fund | | | 0.25 | | | | n/a | | | | 0.25 | | | | 0.25 | % | | | 0.05 | | | | n/a | | | | 0.25 | |
Mid Cap Equity Fund | | | 0.25 | | | | n/a | | | | 0.25 | | | | n/a | | | | n/a | | | | n/a | | | | 0.25 | |
Mid Cap Growth Fund | | | 0.25 | | | | 0.25 | | | | 0.25 | | | | 0.25 | | | | 0.05 | | | | n/a | | | | 0.25 | |
Mid Cap Value Fund | | | 0.25 | | | | 0.25 | | | | 0.25 | | | | 0.25 | | | | n/a | | | | 0.10 | % | | | 0.25 | |
Multi-Cap Market Neutral Fund | | | 0.25 | | | | 0.25 | | | | 0.25 | | | | n/a | | | | n/a | | | | n/a | | | | 0.25 | |
Value Advantage Fund | | | 0.25 | | | | n/a | | | | 0.25 | | | | n/a | | | | n/a | | | | 0.10 | | | | 0.25 | |
The Distributor has entered into shareholder services contracts with affiliated and unaffiliated financial intermediaries who provide shareholder services and other related services to their clients or customers who invest in the Funds under which the Distributor will pay all or a portion of such fees earned to financial intermediaries for performing such services.
The Distributor waived Shareholder Servicing fees as outlined in Note 3.F.
E. Custodian and Accounting Fees — JPMCB provides portfolio custody and accounting services to the Funds. The amounts paid directly to JPMCB by the Funds for custody and accounting services are included in Custodian and accounting fees in the Statements of Operations. Payments to the custodian may be reduced by credits earned by each Fund, based on uninvested cash balances held by the custodian. Such earnings credits are presented separately in the Statements of Operations.
| | | | | | | | |
| | | |
| DECEMBER 31, 2012 | | J.P. MORGAN MID CAP/MULTI-CAP FUNDS | | | | | 89 | |
Interest expense, if any, paid to the custodian related to cash overdrafts is included in Interest expense to affiliates in the Statements of Operations.
F. Waivers and Reimbursements — The Advisor, Administrator and Distributor have contractually agreed to waive fees and/or reimburse the Funds to the extent that total annual operating expenses (excluding acquired fund fees and expenses, dividend expenses related to short sales, interest, taxes, expenses related to litigation and potential litigation, extraordinary expenses and expenses related to the Board of Trustees’ deferred compensation plan) exceed the percentages of the Funds’ respective average daily net assets as shown in the table below:
| | | | | | | | | | | | | | | | | | | | | | | | | | | | | | | | |
| | | Class A | | | Class B | | | Class C | | | Class R2 | | | Class R5 | | | Class R6 | | | Institutional Class | | | Select Class | |
Growth Advantage Fund | | | 1.25 | % | | | 1.75 | % | | | 1.75 | % | | | n/a | | | | 0.90 | % | | | n/a | | | | n/a | | | | 1.10 | % |
Mid Cap Core Fund | | | 1.25 | | | | n/a | | | | 1.75 | | | | 1.50 | % | | | 0.80 | | | | 0.75 | % | | | n/a | | | | 1.00 | |
Mid Cap Equity Fund | | | 1.25 | | | | n/a | | | | 1.75 | | | | n/a | | | | n/a | | | | n/a | | | | n/a | | | | 0.90 | |
Mid Cap Growth Fund | | | 1.24 | | | | 1.74 | | | | 1.74 | | | | 1.40 | | | | 0.79 | | | | 0.74 | | | | n/a | | | | 0.93 | |
Mid Cap Value Fund | | | 1.24 | | | | 1.75 | | | | 1.75 | | | | 1.50 | | | | n/a | | | | n/a | | | | 0.75 | % | | | 0.99 | |
Multi-Cap Market Neutral Fund | | | 1.75 | | | | 2.50 | | | | 2.50 | | | | n/a | | | | n/a | | | | n/a | | | | n/a | | | | 1.50 | |
Value Advantage Fund | | | 1.25 | | | | n/a | | | | 1.75 | | | | n/a | | | | n/a | | | | n/a | | | | 0.75 | | | | 1.00 | |
The expense limitation agreements were in effect for the six months ended December 31, 2012. The contractual expense limitation percentages in the table above are in place until at least October 31, 2013. In addition, the Funds’ service providers have voluntarily waived fees during the six months ended December 31, 2012. However, the Funds’ service providers are under no obligation to do so and may discontinue such voluntary waivers at any time.
For the six months ended December 31, 2012, the Funds’ service providers waived fees and/or reimbursed expenses for each of the Funds as follows (amounts in thousands). None of these parties expect the Funds to repay any such waived fees and reimbursed expenses in future years.
| | | | | | | | | | | | | | | | |
| | | Contractual Waivers | |
| | | Investment
Advisory | | | Administration | | | Shareholder
Servicing | | | Total | |
Growth Advantage Fund | | $ | — | | | $ | — | | | $ | 44 | | | $ | 44 | |
Mid Cap Core Fund | | | — | | | | 57 | | | | — | | | | 57 | |
Mid Cap Equity Fund | | | — | | | | 190 | | | | 1,100 | | | | 1,290 | |
Mid Cap Growth Fund | | | 473 | | | | 619 | | | | 249 | | | | 1,341 | |
Mid Cap Value Fund | | | 2,043 | | | | 3,833 | | | | 2,276 | | | | 8,152 | |
Multi-Cap Market Neutral Fund | | | — | (a) | | | — | (a) | | | 353 | | | | 353 | |
Value Advantage Fund | | | 57 | | | | 625 | | | | 288 | | | | 970 | |
| |
| | | Voluntary Waivers | |
| | | Investment
Advisory | | | Administration | | | Shareholder
Servicing | | | Total | |
Mid Cap Growth Fund | | $ | — | (a) | | | — | | | | — | | | | — | (a) |
Multi-Cap Market Neutral Fund | | | 152 | | | | 215 | | | | 253 | | | | 620 | |
| (a) | Amount rounds to less than $1,000. |
Additionally, the Funds may invest in one or more money market funds advised by the Advisor or its affiliates. The Advisor, Administrator and Distributor, as shareholder servicing agent, waive fees in an amount sufficient to offset the respective fees each charges to the affiliated money market fund on the Funds’ investment in such affiliated money market fund. A portion of the waiver is voluntary.
The amount of waivers resulting from investments in these money market funds for the six months ended December 31, 2012 was as follows (excluding the waiver disclosed in Note 2.C. regarding cash collateral for securities lending invested in the JPMorgan Prime Money Market Fund) (amounts in thousands):
| | | | |
Growth Advantage Fund | | $ | 44 | |
Mid Cap Core Fund | | | 26 | |
Mid Cap Equity Fund | | | 28 | |
Mid Cap Growth Fund | | | 23 | |
Mid Cap Value Fund | | | 348 | |
Multi-Cap Market Neutral Fund | | | 52 | |
Value Advantage Fund | | | 66 | |
G. Other — Certain officers of the Trusts are affiliated with the Advisor, the Administrator and the Distributor. Such officers, with the exception of the Chief Compliance Officer, receive no compensation from the Funds for serving in their respective roles.
| | | | | | |
| | | |
| 90 | | | | J.P. MORGAN MID CAP/MULTI-CAP FUNDS | | DECEMBER 31, 2012 |
The Board of Trustees appointed a Chief Compliance Officer to the Funds in accordance with Federal securities regulations. Each Fund, along with other affiliated funds, makes reimbursement payments, on a pro-rata basis, to the Administrator for a portion of the fees associated with the Office of the Chief Compliance Officer. Such fees are included in Trustees’ and Chief Compliance Officer’s fees in the Statements of Operations.
The Trusts adopted a Trustee Deferred Compensation Plan (the “Plan”) which allows the Independent Trustees to defer the receipt of all or a portion of compensation related to performance of their duties as Trustees. The deferred fees are invested in various J.P. Morgan Funds until distribution in accordance with the Plan.
During the six months ended December 31, 2012 the Funds may have purchased securities from an underwriting syndicate in which the principal underwriter or members of the syndicate are affiliated with the Advisor.
The Funds may use related party broker-dealers. For the six months ended December 31, 2012, the Funds did not incur any brokerage commissions with brokers-dealers affiliated with the Advisor.
The Securities and Exchange Commission (“SEC”) has granted an exemptive order permitting the Funds to engage in principal transactions with J.P. Morgan Securities, Inc., an affiliated broker, involving taxable money market instruments, subject to certain conditions.
4. Investment Transactions
During the six months ended December 31, 2012, purchases and sales of investments (excluding short-term investments) were as follows (amounts in thousands):
| | | | | | | | | | | | | | | | |
| | | Purchases
(excluding U.S. Government) | | | Sales (excluding U.S. Government) | | | Securities
Sold Short | | | Covers on
Securities
Sold Short | |
Growth Advantage Fund | | $ | 774,743 | | | $ | 661,377 | | | $ | — | | | $ | — | |
Mid Cap Core Fund | | | 469,088 | | | | 93,962 | | | | — | | | | — | |
Mid Cap Equity Fund | | | 217,886 | | | | 176,325 | | | | — | | | | — | |
Mid Cap Growth Fund | | | 471,605 | | | | 584,880 | | | | — | | | | — | |
Mid Cap Value Fund | | | 2,305,189 | | | | 1,062,031 | | | | — | | | | — | |
Multi-Cap Market Neutral Fund | | | 226,148 | | | | 292,083 | | | | 239,512 | | | | 299,698 | |
Value Advantage Fund | | | 968,786 | | | | 178,351 | | | | — | | | | — | |
During the six months ended December 31, 2012, there were no purchases or sales of U.S. Government securities.
5. Federal Income Tax Matters
For Federal income tax purposes, the cost and unrealized appreciation (depreciation) in value of investment securities held at December 31, 2012 were as follows (amounts in thousands):
| | | | | | | | | | | | | | | | |
| | | Aggregate
Cost | | | Gross
Unrealized
Appreciation | | | Gross
Unrealized
Depreciation | | | Net Unrealized
Appreciation
(Depreciation) | |
Growth Advantage Fund | | $ | 1,197,964 | | | $ | 296,567 | | | $ | 17,639 | | | $ | 278,928 | |
Mid Cap Core Fund | | | 720,972 | | | | 54,397 | | | | 14,510 | | | | 39,887 | |
Mid Cap Equity Fund | | | 754,714 | | | | 183,083 | | | | 9,853 | | | | 173,230 | |
Mid Cap Growth Fund | | | 1,100,205 | | | | 310,336 | | | | 30,622 | | | | 279,714 | |
Mid Cap Value Fund | | | 7,826,167 | | | | 2,194,744 | | | | 93,971 | | | | 2,100,773 | |
Multi-Cap Market Neutral Fund | | | 449,153 | | | | 58,876 | | | | 11,452 | | | | 47,424 | |
Value Advantage Fund | | | 1,871,079 | | | | 239,761 | | | | 14,948 | | | | 224,813 | |
Under the Regulated Investment Company Modernization Act of 2010 (the “Act”), net capital losses recognized by the Funds after June 30, 2011 may get carried forward indefinitely, and retain their character as short-term and/or long term losses. Prior to the Act, net capital losses incurred by the Funds were carried forward for eight years and treated as short-term losses. The Act requires that post-enactment net capital losses be used before pre-enactment net capital losses.
At June 30, 2012, the following Fund had post-enactment net capital loss carryforwards (amounts in thousands):
| | | | | | | | |
| | | Capital Loss Carryforward Character | |
| | | Short-Term | | | Long-Term | |
Mid Cap Core Fund | | $ | 636 | | | $ | — | |
| | | | | | | | |
| | | |
| DECEMBER 31, 2012 | | J.P. MORGAN MID CAP/MULTI-CAP FUNDS | | | | | 91 | |
At June 30, 2012, the following Funds had the following pre-enactment net capital loss carryforwards, expiring during the year indicated, which are available to offset future realized gains (amounts in thousands):
| | | | | | | | | | | | | | | | |
| | | 2016 | | | 2017 | | | 2018 | | | Total | |
Mid Cap Value Fund | | $ | — | | | $ | 8,833 | | | $ | 117,351 | | | $ | 126,184 | * |
Multi-Cap Market Neutral Fund | | | 65,985 | | | | — | | | | — | | | | 65,985 | |
Value Advantage Fund | | | — | | | | — | | | | 13,485 | | | | 13,485 | |
| * | Amount includes capital loss carryforwards from business combinations, which may be limited in future years. |
6. Borrowings
The Funds rely upon an exemptive order granted by the SEC (the “Order”) permitting the establishment and operation of an Interfund Lending Facility (the “Facility”). The Facility allows the Funds to directly lend and borrow money to or from any other fund relying upon the Order at rates beneficial to both the borrowing and lending funds. Advances under the Facility are taken primarily for temporary or emergency purposes, including the meeting of redemption requests that otherwise might require the untimely disposition of securities, and are subject to each Fund’s borrowing restrictions. The Interfund loan rate is determined, as specified in the Order, by averaging the current repurchase agreement rate and the current bank loan rate. The Order was granted to JPM II and may be relied upon by the Funds because they are investment companies in the same “group of investment companies” (as defined in Section 12(d)(1)(G) of the 1940 Act).
In addition, the Trusts and JPMCB have entered into a financing arrangement. Under this arrangement, JPMCB provides an unsecured, uncommitted credit facility in the aggregate amount of $100 million to certain of the J.P. Morgan Funds, including the Funds. Advances under the arrangement are taken primarily for temporary or emergency purposes, including the meeting of redemption requests that otherwise might require the untimely disposition of securities, and are subject to each Fund’s borrowing restrictions. Interest on borrowings is payable at a rate determined by JPMCB at the time of borrowing. This agreement has been extended until November 11, 2013.
The Funds had no borrowings outstanding from another fund or from the unsecured, uncommitted credit facility at December 31, 2012 or at any time during the six months then ended.
Interest expense paid, if any, as a result of borrowings from another fund or from the unsecured, uncommitted credit facility is included in Interest expense to affiliates in the Statements of Operations.
7. Risks, Concentrations and Indemnifications
In the normal course of business, the Funds enter into contracts that contain a variety of representations which provide general indemnifications. Each Fund’s maximum exposure under these arrangements is unknown. The amount of exposure would depend on future claims that may be made against each Fund that have not yet occurred. However, based on experience, the Funds expect the risk of loss to be remote.
One or more affiliates of the Advisor have investment discretion with respect to their clients’ holdings in the Funds, which collectively represent a significant portion of the Funds’ assets for each of the Growth Advantage Fund and Mid Cap Core Fund.
In addition, the J.P. Morgan Investor Funds and JPMorgan SmartRetirement Funds, which are affiliated funds of funds, own in the aggregate more than 10% of the net assets of the Funds as follows:
| | | | | | | | |
| | | J.P. Morgan
Investor Funds | | | JPMorgan
SmartRetirement
Funds | |
Growth Advantage Fund | | | n/a | | | | 32.8 | % |
Mid Cap Core Fund | | | n/a | | | | 34.9 | |
Multi-Cap Market Neutral Fund | | | 90.2 | % | | | n/a | |
Value Advantage Fund | | | n/a | | | | 23.9 | |
Additionally, Mid Cap Equity Fund and Mid Cap Growth Fund each have a shareholder, which is an account maintained by a financial intermediary on behalf of its clients, that owns a significant portion of the Funds’ outstanding shares.
Significant shareholder transactions by these shareholders, if any, may impact the Funds’ performance.
As of December 31, 2012, the Multi-Cap Market Neutral Fund pledged substantially all of its assets to Credit Suisse Group for securities sold short, who also held 100% of the Multi-Cap Market Neutral Fund’s cash proceeds for securities sold short.
| | | | | | |
| | | |
| 92 | | | | J.P. MORGAN MID CAP/MULTI-CAP FUNDS | | DECEMBER 31, 2012 |
SCHEDULE OF SHAREHOLDER EXPENSES
(Unaudited)
Hypothetical $1,000 Investment
As a shareholder of the Funds, you incur two types of costs: (1) transaction costs, including sales charges (loads) on purchase payments and redemption fees and (2) ongoing costs, including investment advisory fees, administration fees, distribution fees and other Fund expenses. The examples below are intended to help you understand your ongoing costs (in dollars) of investing in the Funds and to compare these ongoing costs with the ongoing costs of investing in other mutual funds. The examples assume that you had a $1,000 investment in each Class at the beginning of the reporting period, July 1, 2012, and continued to hold your shares at the end of the reporting period, December 31, 2012.
Actual Expenses
For each Class of each Fund in the table below, the first line provides information about actual account values and actual expenses. You may use the information in this line, together with the amount you invested, to estimate the expenses that you paid over the period. Simply divide your account value by $1,000 (for example, an $8,600 account value divided by $1,000 = 8.6), then multiply the result by the number in the first line of each Class under the heading entitled “Expenses Paid During the Period” to estimate the expenses you paid on your account during this period.
Hypothetical Example for Comparison Purposes
The second line of each Class in the table below provides information about hypothetical account values and hypothetical expenses based on the Class’ actual expense ratio and an assumed rate of return of 5% per year before expenses, which is not the Class’ actual return. The hypothetical account values and expenses may not be used to estimate the actual ending account balance or expenses you paid for the period. You may use this information to compare the ongoing costs of investing in the Class of the Fund and other funds. To do so, compare this 5% hypothetical example with the 5% hypothetical examples that appear in the shareholder reports of the other funds. Please note that the expenses shown in the table are meant to highlight your ongoing costs only and do not reflect any transaction costs, such as sales charges (loads) or redemption fees. Therefore, the second line for each Class in the table is useful in comparing ongoing costs only, and will not help you determine the relative total costs of owning different funds. In addition, if these transaction costs were included, your costs would have been higher. The examples also assume all dividends and distributions have been reinvested.
| | | | | | | | | | | | | | | | |
| | | Beginning
Account Value,
July 1, 2012 | | | Ending
Account Value
December 31, 2012 | | | Expenses
Paid During
the Period* | | | Annualized
Expense
Ratio | |
Growth Advantage Fund | | | | | | | | | | | | | | | | |
Class A | | | | | | | | | | | | | | | | |
Actual | | $ | 1,000.00 | | | $ | 1,046.50 | | | $ | 6.40 | | | | 1.24 | % |
Hypothetical | | | 1,000.00 | | | | 1,018.95 | | | | 6.31 | | | | 1.24 | |
Class B | | | | | | | | | | | | | | | | |
Actual | | | 1,000.00 | | | | 1,043.70 | | | | 8.96 | | | | 1.74 | |
Hypothetical | | | 1,000.00 | | | | 1,016.43 | | | | 8.84 | | | | 1.74 | |
Class C | | | | | | | | | | | | | | | | |
Actual | | | 1,000.00 | | | | 1,043.60 | | | | 8.96 | | | | 1.74 | |
Hypothetical | | | 1,000.00 | | | | 1,016.43 | | | | 8.84 | | | | 1.74 | |
Class R5 | | | | | | | | | | | | | | | | |
Actual | | | 1,000.00 | | | | 1,049.50 | | | | 4.29 | | | | 0.83 | |
Hypothetical | | | 1,000.00 | | | | 1,021.02 | | | | 4.23 | | | | 0.83 | |
Select Class | | | | | | | | | | | | | | | | |
Actual | | | 1,000.00 | | | | 1,047.50 | | | | 5.32 | | | | 1.03 | |
Hypothetical | | | 1,000.00 | | | | 1,020.01 | | | | 5.24 | | | | 1.03 | |
| | | | |
Mid Cap Core Fund | | | | | | | | | | | | | | | | |
Class A | | | | | | | | | | | | | | | | |
Actual | | | 1,000.00 | | | | 1,059.70 | | | | 6.44 | | | | 1.24 | |
Hypothetical | | | 1,000.00 | | | | 1,018.95 | | | | 6.31 | | | | 1.24 | |
Class C | | | | | | | | | | | | | | | | |
Actual | | | 1,000.00 | | | | 1,056.80 | | | | 9.02 | | | | 1.74 | |
Hypothetical | | | 1,000.00 | | | | 1,016.43 | | | | 8.84 | | | | 1.74 | |
Class R2 | | | | | | | | | | | | | | | | |
Actual | | | 1,000.00 | | | | 1,058.20 | | | | 7.73 | | | | 1.49 | |
Hypothetical | | | 1,000.00 | | | | 1,017.69 | | | | 7.58 | | | | 1.49 | |
Class R5 | | | | | | | | | | | | | | | | |
Actual | | | 1,000.00 | | | | 1,062.20 | | | | 4.11 | | | | 0.79 | |
Hypothetical | | | 1,000.00 | | | | 1,021.22 | | | | 4.02 | | | | 0.79 | |
| | | | | | | | |
| | | |
| DECEMBER 31, 2012 | | J.P. MORGAN MID CAP/MULTI-CAP FUNDS | | | | | 93 | |
| | | | | | | | | | | | | | | | |
| | | Beginning
Account Value,
July 1, 2012 | | | Ending
Account Value
December 31, 2012 | | | Expenses
Paid During
the Period* | | | Annualized
Expense
Ratio | |
Mid Cap Core Fund (continued) | | | | | | | | | | | | | | | | |
Class R6 | | | | | | | | | | | | | | | | |
Actual | | $ | 1,000.00 | | | $ | 1,062.10 | | | $ | 3.85 | | | | 0.74 | % |
Hypothetical | | | 1,000.00 | | | | 1,021.48 | | | | 3.77 | | | | 0.74 | |
Select Class | | | | | | | | | | | | | | | | |
Actual | | | 1,000.00 | | | | 1,061.50 | | | | 5.14 | | | | 0.99 | |
Hypothetical | | | 1,000.00 | | | | 1,020.21 | | | | 5.04 | | | | 0.99 | |
| | | | |
Mid Cap Equity Fund | | | | | | | | | | | | | | | | |
Class A | | | | | | | | | | | | | | | | |
Actual | | | 1,000.00 | | | | 1,079.10 | | | | 6.50 | | | | 1.24 | |
Hypothetical | | | 1,000.00 | | | | 1,018.95 | | | | 6.31 | | | | 1.24 | |
Class C | | | | | | | | | | | | | | | | |
Actual | | | 1,000.00 | | | | 1,076.40 | | | | 9.11 | | | | 1.74 | |
Hypothetical | | | 1,000.00 | | | | 1,016.43 | | | | 8.84 | | | | 1.74 | |
Select Class | | | | | �� | | | | | | | | | | | |
Actual | | | 1,000.00 | | | | 1,080.90 | | | | 4.67 | | | | 0.89 | |
Hypothetical | | | 1,000.00 | | | | 1,020.72 | | | | 4.53 | | | | 0.89 | |
| | | | |
Mid Cap Growth Fund | | | | | | | | | | | | | | | | |
Class A | | | | | | | | | | | | | | | | |
Actual | | | 1,000.00 | | | | 1,071.80 | | | | 6.42 | | | | 1.23 | |
Hypothetical | | | 1,000.00 | | | | 1,019.00 | | | | 6.26 | | | | 1.23 | |
Class B | | | | | | | | | | | | | | | | |
Actual | | | 1,000.00 | | | | 1,068.60 | | | | 9.02 | | | | 1.73 | |
Hypothetical | | | 1,000.00 | | | | 1,016.48 | | | | 8.79 | | | | 1.73 | |
Class C | | | | | | | | | | | | | | | | |
Actual | | | 1,000.00 | | | | 1,068.90 | | | | 9.02 | | | | 1.73 | |
Hypothetical | | | 1,000.00 | | | | 1,016.48 | | | | 8.79 | | | | 1.73 | |
Class R2 | | | | | | | | | | | | | | | | |
Actual | | | 1,000.00 | | | | 1,070.70 | | | | 7.25 | | | | 1.39 | |
Hypothetical | | | 1,000.00 | | | | 1,018.20 | | | | 7.07 | | | | 1.39 | |
Class R5 | | | | | | | | | | | | | | | | |
Actual | | | 1,000.00 | | | | 1,074.30 | | | | 4.13 | | | | 0.79 | |
Hypothetical | | | 1,000.00 | | | | 1,021.22 | | | | 4.02 | | | | 0.79 | |
Class R6 | | | | | | | | | | | | | | | | |
Actual | | | 1,000.00 | | | | 1,074.20 | | | | 3.87 | | | | 0.74 | |
Hypothetical | | | 1,000.00 | | | | 1,021.48 | | | | 3.77 | | | | 0.74 | |
Select Class | | | | | | | | | | | | | | | | |
Actual | | | 1,000.00 | | | | 1,073.40 | | | | 4.81 | | | | 0.92 | |
Hypothetical | | | 1,000.00 | | | | 1,020.57 | | | | 4.69 | | | | 0.92 | |
| | | | |
Mid Cap Value Fund | | | | | | | | | | | | | | | | |
Class A | | | | | | | | | | | | | | | | |
Actual | | | 1,000.00 | | | | 1,087.50 | | | | 6.47 | | | | 1.23 | |
Hypothetical | | | 1,000.00 | | | | 1,019.00 | | | | 6.26 | | | | 1.23 | |
Class B | | | | | | | | | | | | | | | | |
Actual | | | 1,000.00 | | | | 1,084.70 | | | | 9.14 | | | | 1.74 | |
Hypothetical | | | 1,000.00 | | | | 1,016.43 | | | | 8.84 | | | | 1.74 | |
Class C | | | | | | | | | | | | | | | | |
Actual | | | 1,000.00 | | | | 1,084.90 | | | | 9.14 | | | | 1.74 | |
Hypothetical | | | 1,000.00 | | | | 1,016.43 | | | | 8.84 | | | | 1.74 | |
Class R2 | | | | | | | | | | | | | | | | |
Actual | | | 1,000.00 | | | | 1,086.00 | | | | 7.83 | | | | 1.49 | |
Hypothetical | | | 1,000.00 | | | | 1,017.69 | | | | 7.58 | | | | 1.49 | |
| | | | | | |
| | | |
| 94 | | | | J.P. MORGAN MID CAP/MULTI-CAP FUNDS | | DECEMBER 31, 2012 |
| | | | | | | | | | | | | | | | |
| | | Beginning
Account Value,
July 1, 2012 | | | Ending
Account Value
December 31, 2012 | | | Expenses
Paid During
the Period* | | | Annualized
Expense
Ratio | |
Mid Cap Value Fund (continued) | | | | | | | | | | | | | | | | |
Institutional Class | | | | | | | | | | | | | | | | |
Actual | | $ | 1,000.00 | | | $ | 1,090.40 | | | $ | 3.90 | | | | 0.74 | % |
Hypothetical | | | 1,000.00 | | | | 1,021.48 | | | | 3.77 | | | | 0.74 | |
Select Class | | | | | | | | | | | | | | | | |
Actual | | | 1,000.00 | | | | 1,089.10 | | | | 5.16 | | | | 0.98 | |
Hypothetical | | | 1,000.00 | | | | 1,020.27 | | | | 4.99 | | | | 0.98 | |
| | | | |
Multi-Cap Market Neutral Fund | | | | | | | | | | | | | | | | |
Class A | | | | | | | | | | | | | | | | |
Actual | | | 1,000.00 | | | | 984.50 | | | | 16.51 | | | | 3.30 | |
Hypothetical | | | 1,000.00 | | | | 1,008.57 | | | | 16.71 | | | | 3.30 | |
Class B | | | | | | | | | | | | | | | | |
Actual | | | 1,000.00 | | | | 980.60 | | | | 19.87 | | | | 3.98 | |
Hypothetical | | | 1,000.00 | | | | 1,005.14 | | | | 20.12 | | | | 3.98 | |
Class C | | | | | | | | | | | | | | | | |
Actual | | | 1,000.00 | | | | 980.60 | | | | 20.02 | | | | 4.01 | |
Hypothetical | | | 1,000.00 | | | | 1,004.99 | | | | 20.27 | | | | 4.01 | |
Select Class | | | | | | | | | | | | | | | | |
Actual | | | 1,000.00 | | | | 985.70 | | | | 15.27 | | | | 3.05 | |
Hypothetical | | | 1,000.00 | | | | 1,009.83 | | | | 15.45 | | | | 3.05 | |
| | | | |
Value Advantage Fund | | | | | | | | | | | | | | | | |
Class A | | | | | | | | | | | | | | | | |
Actual | | | 1,000.00 | | | | 1,078.30 | | | | 6.50 | | | | 1.24 | |
Hypothetical | | | 1,000.00 | | | | 1,018.95 | | | | 6.31 | | | | 1.24 | |
Class C | | | | | | | | | | | | | | | | |
Actual | | | 1,000.00 | | | | 1,075.60 | | | | 9.10 | | | | 1.74 | |
Hypothetical | | | 1,000.00 | | | | 1,016.43 | | | | 8.84 | | | | 1.74 | |
Institutional Class | | | | | | | | | | | | | | | | |
Actual | | | 1,000.00 | | | | 1,080.90 | | | | 3.88 | | | | 0.74 | |
Hypothetical | | | 1,000.00 | | | | 1,021.48 | | | | 3.77 | | | | 0.74 | |
Select Class | | | | | | | | | | | | | | | | |
Actual | | | 1,000.00 | | | | 1,079.40 | | | | 5.19 | | | | 0.99 | |
Hypothetical | | | 1,000.00 | | | | 1,020.21 | | | | 5.04 | | | | 0.99 | |
| * | Expenses are equal to each Class’ respective annualized expense ratio, multiplied by the average account value over the period, multiplied by 184/365 (to reflect the one-half year period). |
| | | | | | | | |
| | | |
| DECEMBER 31, 2012 | | J.P. MORGAN MID CAP/MULTI-CAP FUNDS | | | | | 95 | |
BOARD APPROVAL OF INVESTMENT ADVISORY AGREEMENTS
(Unaudited)
The Board of Trustees meets regularly throughout the year and considers factors that are relevant to its annual consideration of investment advisory agreements at each meeting. The Board of Trustees has established various standing committees, composed of Trustees with diverse backgrounds, to which the Board of Trustees has assigned specific subject matter responsibilities to further enhance the effectiveness of the Board’s oversight and decision making. The Board of Trustees and its investment subcommittees (money market and alternative products, equity, and fixed income) also meet for the specific purpose of considering advisory contract annual renewals. The Board of Trustees held meetings in person in June and August 2012, at which the Trustees considered the continuation of each of the investment advisory agreements for each of the Funds whose semi-annual report is contained herein (each an “Advisory Agreement” and collectively, the “Advisory Agreements”). At the June meeting, the Board’s investment subcommittees met to review and consider performance, expense and related information for the J.P. Morgan Funds. Each investment subcommittee reported to the full Board, which then considered the investment subcommittee’s preliminary findings. At the August meeting, the Trustees continued their review and consideration. The Trustees, including a majority of the Trustees who are not “interested persons” (as defined in the 1940 Act) of any party to the Advisory Agreements or any of their affiliates, approved the continuation of each Advisory Agreement on August 23, 2012.
The Trustees, as part of their review of the investment advisory arrangements for the J.P. Morgan Funds, considered and reviewed performance and other information received from the Advisor on a regular basis over the course of the year, as well as information specifically prepared for their annual review. This information includes the Funds’ performance compared to the performance of the Funds’ peers and benchmarks and analyses by the Advisor of the Funds’ performance. In addition, the Trustees have engaged an independent consultant to report on the performance of certain J.P. Morgan Funds at each of the Trustees’ regular meetings. The Advisor also periodically provides comparative information regarding the Funds’ expense ratios and those of the peer groups. In addition, in preparation for the June and August meetings, the Trustees requested, received and evaluated extensive materials from the Advisor, including, with respect to the Funds, performance and expense information compiled by Lipper Inc. (“Lipper”), an independent provider of investment company data. The independent consultant also provided additional analyses of the performance of the Funds with greater than two years of performance history in connection with the Trustees’ review of the investment advisory arrangements. Prior to voting, the Trustees reviewed the proposed approval of the Advisory Agreements with representatives of the Advisor and with counsels to the Trusts and independent Trustees and received a memorandum from
independent counsel to the Trustees discussing the legal standards for their consideration of the proposed approval. The Trustees also discussed the proposed approvals in executive sessions with counsels to the Trusts and independent Trustees at which no representatives of the Advisor were present. Set forth below is a summary of the material factors evaluated by the Trustees in determining whether to approve each Advisory Agreement.
In their deliberations, there was a comprehensive consideration of the information received by the Trustees. Each Trustee attributed different weights to the various factors and no factor alone was considered determinative. From year to year, the Trustees consider and place emphasis on relevant information in light of changing circumstances in market and economic conditions. The Trustees determined that the compensation to be received by the Advisor from each Fund under the applicable Advisory Agreement was fair and reasonable and that the continuance of the investment advisory contract was in the best interests of each Fund and its shareholders.
The factors summarized below were considered and discussed by the Trustees in reaching their conclusions:
Nature, Extent and Quality of Services Provided by the Advisor
The Trustees received and considered information regarding the nature, extent and quality of the services provided to each Fund under the Advisory Agreement. The Trustees took into account information furnished throughout the year at Trustee meetings, as well as the materials furnished specifically in connection with this annual review process. The Trustees considered the background and experience of the Advisor’s senior management and the expertise of, and the amount of attention given to each Fund by, investment personnel of the Advisor. In addition, the Trustees reviewed the qualifications, backgrounds and responsibilities of the portfolio management team primarily responsible for the day-to-day management of each Fund and the infrastructure supporting the team. The Trustees also considered information provided by the Advisor and JPMorgan Distribution Services, Inc. (“JPMDS”) about the structure and distribution strategy of each Fund. The Trustees also reviewed information relating to the Advisor’s risk governance model and reports showing the Advisor’s compliance structure and ongoing compliance processes. The quality of the administrative services provided by JPMorgan Funds Management, Inc. (“JPMFM”), an affiliate of the Advisor, was also considered.
The Board of Trustees also considered its knowledge of the nature and quality of the services provided by the Advisor to the Funds gained from their experience as Trustees of the Funds. In addition, they considered the overall reputation and capabilities of the Advisor and its affiliates, the commitment of the Advisor to provide high quality service to the Funds, their overall confidence in the Advisor’s integrity and the Advisor’s responsiveness to questions or concerns raised by them,
| | | | | | |
| | | |
| 96 | | | | J.P. MORGAN MID CAP/MULTI-CAP FUNDS | | DECEMBER 31, 2012 |
including the Advisor’s willingness to consider and implement organizational and operational changes designed to improve investment results and the services provided to each Fund.
Based on these considerations and other factors, the Trustees concluded that they were satisfied with the nature, extent and quality of the investment advisory services provided to the Funds by the Advisor.
Costs of Services Provided and Profitability to the Advisor and its Affiliates
The Trustees received and considered information regarding the profitability to the Advisor and its affiliates in providing services to each of the Funds. The Trustees reviewed and discussed this data. The Trustees recognized that this data is not audited and represents the Advisor’s determination of its and its affiliates’ revenues from the contractual services provided to the Funds, less expenses of providing such services. Expenses include direct and indirect costs and are calculated using an allocation methodology developed by the Advisor. The Trustees also recognized that it is difficult to make comparisons of profitability from fund investment advisory contracts because comparative information is not generally publicly available and is affected by numerous factors, including the structure of the particular adviser, the types of funds it manages, its business mix, numerous assumptions regarding allocations and the fact that publicly-traded fund managers’ operating profits and net income are net of distribution and marketing expenses. Based on their review, the Trustees concluded that the profitability to the Advisor under each of the Advisory Agreements was not unreasonable in light of the services and benefits provided to each Fund.
Fall-Out Benefits
The Trustees reviewed information regarding potential “fallout” or ancillary benefits received by the Advisor and its affiliates as a result of their relationship with the Funds. The Board considered that the Advisor currently uses third-party soft dollar arrangements with respect to securities transactions it executes for these Funds.
The Trustees also considered that JPMFM and JPMDS, affiliates of the Advisor, earn fees from the Funds for providing administrative and shareholder services. These fees were shown separately in the profitability analysis presented to the Trustees. The Trustees also considered the payments of Rule 12b-1 fees to JPMDS, which also acts as the Funds’ distributor and that these fees are in turn generally paid to financial intermediaries that sell the Funds, including financial intermediaries that are affiliates of the Advisor. The Trustees also considered the fees paid to JPMorgan Chase Bank, N.A. (“JPMCB”) for custody and fund accounting, and other related services. With respect to the Mid Cap Growth Fund and Mid Cap Value Fund, the Trustees also considered the fees paid to JPMCB, the former securities lending
agent during the review period. Effective March 1, 2011, these Funds retained an unaffiliated securities lending agent.
Economies of Scale
The Trustees noted that the proposed investment advisory fee schedule for each Fund does not contain breakpoints. The Trustees considered whether it would be appropriate to add advisory fee breakpoints and the Trustees concluded that the current fee structure was reasonable in light of the fee waivers and expense limitations that the Advisor has in place that serve to limit the overall net expense ratio at competitive levels. The Trustees also recognized that the fee schedule for the administrative services provided by JPMFM does include a fee breakpoint, which is tied to the overall level of non-money market fund assets excluding certain funds-of-funds, as applicable, advised by the Advisor, and that the Funds benefit from that breakpoint. The Trustees concluded that shareholders benefited from the lower expense ratios which resulted from these factors.
Independent Written Evaluation of the Funds’ Senior/Chief Compliance Officer
The Trustees noted that, upon their direction, the Senior Officer for the Mid Cap Growth Fund, Mid Cap Value Fund and Multi-Cap Market Neutral Fund had prepared an independent written evaluation in order to assist the Trustees in determining the reasonableness of the proposed management fees. In determining whether to continue the Advisory Agreements, the Trustees considered the Senior Officer’s report.
The Trustees noted that, upon their direction, the Chief Compliance Officer for the Growth Advantage Fund, Mid Cap Core Fund, Mid Cap Equity Fund, and Value Advantage Fund had prepared an independent written evaluation in order to assist the Trustees in determining the reasonableness of the proposed management fees. The Trustees considered the written evaluation in determining whether to continue the Advisory Agreements.
Fees Relative to Advisor’s Other Clients
The Trustees received and considered information about the nature and extent of investment advisory services and fee rates offered to other clients of the Advisor for investment management styles substantially similar to that of each Fund. The Trustees also considered the complexity of investment management for the Funds relative to the Advisor’s other clients and the differences in the nature and extent of the services provided to the different clients. The Trustees concluded that the fee rates charged to each Fund in comparison to those charged to the Advisor’s other clients were reasonable.
Investment Performance
The Trustees received and considered absolute and/or relative performance for Funds in a report prepared by Lipper. The
| | | | | | | | |
| | | |
| DECEMBER 31, 2012 | | J.P. MORGAN MID CAP/MULTI-CAP FUNDS | | | | | 97 | |
BOARD APPROVAL OF INVESTMENT ADVISORY AGREEMENTS
(Unaudited) (continued)
Trustees considered the total return performance information, which included the ranking of the Funds within a performance universe made up of funds with the same Lipper investment classification and objective (the “Universe Group”) by total return for applicable one-, three- and five-year periods. The Trustees reviewed a description of Lipper’s methodology for selecting mutual funds in each Fund’s Universe Group. The Lipper materials provided to the Trustees highlighted information with respect to certain representative classes to assist the Trustees in their review. As part of this review, the Trustees also reviewed each Fund’s performance against its benchmark and considered the performance information provided for the Funds at regular Board meetings by the Advisor and the independent consultant and also considered the special analysis prepared by the independent consultant. The Lipper performance data noted by the Trustees as part of their review and the determinations made by the Trustees with respect to each Fund’s performance for certain representative classes are summarized below:
The Trustees noted that the Growth Advantage Fund’s performance was in the second, third, and second quintiles for both Class A and Select Class shares for the one-, three- and five year periods ended December 31, 2011, respectively, and that the independent consultant indicated that the Fund’s overall performance was attractive. The Trustees discussed the performance and investment strategy of the Fund with the Advisor and, based upon this discussion and various other factors, concluded that the performance was reasonable.
The Trustees noted that the Mid Cap Core Fund’s performance was in the first quintile for both Class A shares and Select Class shares for the one-year period ended December 31, 2011. The Trustees discussed the performance and investment strategy of the Fund with the Advisor and, based upon this discussion and various other factors, concluded that the performance was reasonable.
The Trustees noted that the Mid Cap Equity Fund’s performance was in the third quintile for Class A shares for the one-year period ended December 31, 2011, and in the third, first and first quintiles for Select Class shares for each of the one-, three-, and five-year periods ended December 31, 2011, respectively, and that the independent consultant indicated that overall performance was satisfactory. The Trustees discussed the performance and investment strategy of the Fund with the Advisor and, based upon this discussion and various other factors, concluded that the performance was reasonable.
The Trustees noted that the Mid Cap Growth Fund’s performance was in the fourth, third and third quintiles for both Class A and Select Class shares for the one-, three-, and five-year periods ended December 31, 2011, respectively, and that the independent consultant indicated that overall performance was satisfactory. The Trustees discussed the performance and investment strategy of the Fund with the Advisor and, based
upon this discussion and various other factors, concluded that the performance was reasonable.
The Trustees noted that the Mid Cap Value Fund’s performance was in the first, second and first quintiles for both Class A and Select Class shares for the one-, three-, and five-year periods ended December 31, 2011, respectively, and that the independent consultant indicated that the Fund’s overall performance was satisfactory. The Trustees discussed the performance and investment strategy of the Fund with the Advisor and, based upon this discussion and various other factors, concluded that the performance was reasonable.
The Trustees noted that the Multi-Cap Market Neutral Fund’s performance was in the third, fourth and fifth quintiles for both Class A and Select Class shares for the one-, three-, and five-year periods ended December 31, 2011, respectively, and that the independent consultant indicated that the overall performance needed enhancement. The Trustees discussed the performance and investment strategy of the Fund with the Advisor and, based upon this discussion and various other factors, concluded that the performance was reasonable. They requested, however, that the Advisor provide additional Fund performance information to be reviewed with the members of the money market and alternative products subcommittee at each of their regular meetings over the course of next year.
The Trustees noted that the Value Advantage Fund’s performance was in the second, first and first quintiles for Class A shares and in the first quintile for Select Class shares for each of the one-, three-, and five-year periods ended December 31, 2011, respectively, and that the independent consultant indicated that overall performance was attractive. The Trustees discussed the performance and investment strategy of the Fund with the Advisor and, based upon this discussion and various other factors, concluded that the performance was reasonable.
Advisory Fees and Expense Ratios
The Trustees considered the contractual advisory fee rate paid by each Fund to the Advisor and compared that rate to the information prepared by Lipper concerning management fee rates paid by other funds in the same Lipper category as each Fund. The Trustees recognized that Lipper reported each Fund’s management fee rate as the combined contractual advisory fee and the administration fee rates. The Trustees also reviewed information about other expenses and the expense ratios for each Fund. The Trustees considered the fee waiver and/or expense reimbursement arrangements currently in place for each Fund and considered the net advisory fee rate after taking into account any waivers and/or reimbursements. The Trustees recognized that it is difficult to make comparisons of advisory fees because there are variations in the services that are included in the fees paid by other funds. The Trustees’ determinations as a result of the review of each Fund’s
| | | | | | |
| | | |
| 98 | | | | J.P. MORGAN MID CAP/MULTI-CAP FUNDS | | DECEMBER 31, 2012 |
advisory fees and expense ratios for certain representative classes are summarized below:
The Trustees noted that the Growth Advantage Fund’s net advisory fee for both Class A and Select Class shares was in the fourth quintile and that the actual total expenses for Class A and Select Class shares were in the third and fourth quintiles, respectively, of their Universe Group. After considering the factors identified above, in light of this information, the Trustees concluded that the advisory fee was reasonable.
The Trustees noted that the Mid Cap Core Fund’s net advisory fee for both Class A and Select Class shares was in the first quintile and that the actual total expenses for Class A and Select shares were in the second and third quintiles, respectively, of their Universe Group. After considering the factors identified above, in light of this information, the Trustees concluded that the advisory fee was reasonable.
The Trustees noted that the Mid Cap Equity Fund’s net advisory fee for both Class A and Select Class shares was in the second quintile and that the actual total expenses for Class A and Select shares were in the third and second quintiles, respectively, of their Universe Group. After considering the factors identified above, in light of this information, the Trustees concluded that the advisory fee was reasonable.
The Trustees noted that the Mid Cap Growth Fund’s net advisory fee for Class A and Select Class shares was in the second
and first quintiles, respectively, and actual total expenses for both Class A and Select Class shares were in the second quintile of their Universe Group. After considering the factors identified above, in light of this information, the Trustees concluded that the advisory fee was reasonable.
The Trustees noted that the Mid Cap Value Fund’s net advisory fee for both Class A and Select Class shares was in the second quintile and that the actual total expenses for Class A and Select shares were in the third quintile of their Universe Group. After considering the factors identified above, in light of this information, the Trustees concluded that the advisory fee was reasonable.
The Trustees noted that the Multi-Cap Market Neutral Fund’s net advisory fee for both Class A and Select Class shares was in the fourth quintile, and that the actual total expenses for both Class A and Select Class shares were in the second quintile of the Universe Group. After considering the factors identified above, in light of this information, the Trustees concluded that the advisory fee was reasonable.
The Trustees noted that the Value Advantage Fund’s net advisory fee for both Class A and Select Class shares was in the second quintile and that the actual total expenses for both Class A and Select Class shares were in the third quintile of the Universe Group. After considering the factors identified above, in light of this information, the Trustees concluded that the advisory fee was reasonable.
| | | | | | | | |
| | | |
| DECEMBER 31, 2012 | | J.P. MORGAN MID CAP/MULTI-CAP FUNDS | | | | | 99 | |
J.P. Morgan Funds are distributed by JPMorgan Distribution Services, Inc., which is an affiliate of JPMorgan Chase & Co. Affiliates of JPMorgan Chase & Co. receive fees for providing various services to the funds.
Contact JPMorgan Distribution Services, Inc. at 1-800-480-4111 for a fund prospectus. You can also visit us at www.jpmorganfunds.com. Investors should carefully consider the investment objectives and risk as well as charges and expenses of the mutual fund before investing. The prospectus contains this and other information about the mutual fund. Read the prospectus carefully before investing.
Investors may obtain information about the Securities Investor Protection Corporation (SIPC), including the SIPC brochure by visiting www.sipc.org or by calling SIPC at 202-371-8300.
Each Fund files a complete schedule of its fund holdings for the first and third quarters of its fiscal year with the SEC on Form N-Q. The Funds’ Forms N-Q are available on the SEC’s website at http://www.sec.gov and may be reviewed and copied at the SEC’s Public Reference Room in Washington, DC. Information on the operation of the SEC’s Public Reference Room may be obtained by calling 1-800-SEC-0330. Shareholders may request the Form N-Q without charge by calling 1-800-480-4111 or by visiting the J.P. Morgan Funds’ website at www.jpmorganfunds.com.
A description of each Fund’s policies and procedures with respect to the disclosure of each Fund’s holdings is available in the prospectus and Statement of Additional Information.
A copy of proxy policies and procedures is available without charge upon request by calling 1-800-480-4111 and on the Funds’ website at www.jpmorganfunds.com. A description of such policies and procedures is on the SEC’s website at www.sec.gov. The Trustees have delegated the authority to vote proxies for securities owned by the Funds to the Advisor. A copy of the Funds’ voting record for the most recent 12-month period ended June 30 is available on the SEC’s website at www.sec.gov or at the Funds’ website at www.jpmorganfunds.com no later than August 31 of each year. The Funds’ proxy voting record will include, among other things, a brief description of the matter voted on for each fund security, and will state how each vote was cast, for example, for or against the proposal.


J.P. Morgan Asset Management is the marketing name for the asset management business of JPMorgan Chase & Co. Those businesses include, but are not limited to, J.P. Morgan Investment Management Inc., Security Capital Research & Management Incorporated and J.P. Morgan Alternative Asset Management, Inc.
| | | | |
| | © JPMorgan Chase & Co., 2013. All rights reserved. December 2012. | | SAN-MC-1212 |
ITEM 2. CODE OF ETHICS.
Disclose whether, as of the end of the period covered by the report, the registrant has adopted a code of ethics that applies to the registrant’s principal executive officer, principal financial officer, principal accounting officer or controller, or persons performing similar functions, regardless of whether these individuals are employed by the registrant or a third party. If the registrant has not adopted such a code of ethics, explain why it has not done so.
The registrant must briefly describe the nature of any amendment, during the period covered by the report, to a provision of its code of ethics that applies to the registrant’s principal executive officer, principal financial officer, principal accounting officer or controller, or persons performing similar functions, regardless of whether these individuals are employed by the registrant or a third party, and that relates to any element of the code of ethics definition enumerated in paragraph (b) of this Item. The registrant must file a copy of any such amendment as an exhibit pursuant to Item 12(a)(1), unless the registrant has elected to satisfy paragraph (f) of this Item by positing its code of ethics on its website pursuant to paragraph (f)(2) of this Item, or by undertaking to provide its code of ethics to any person without charge, upon request, pursuant to paragraph (f)(3) of this Item.
If the registrant has, during the period covered by the report, granted a waiver, including an implicit waiver, from a provision of the code of ethics that applies to the registrant’s principal executive officer, principal financial officer, principal accounting officer or controller, or persons performing similar functions, regardless of whether these individuals are employed by the registrant or third party, that relates to one or more items set forth in paragraph (b) of this Item, the registrant must briefly describe the nature of the waiver, the name of the person to whom the waiver was granted, and the date of the waiver.
Not applicable to a semi-annual report.
ITEM 3. AUDIT COMMITTEE FINANCIAL EXPERT.
(a) (1) Disclose that the registrant’s board of directors has determined that the registrant either:
(i) Has at least one audit committee financial expert serving on its audit committee; or
(ii) Does not have an audit committee financial expert serving on its audit committee.
(2) If the registrant provides the disclosure required by paragraph (a)(1)(i) of this Item, it must disclose the name of the audit committee financial expert and whether that person is “independent.” In order to be considered “independent” for purposes of this Item, a member of an audit committee may not, other than in his or her capacity as a member of the audit committee, the board of directors, or any other board committee:
(i) Accept directly or indirectly any consulting, advisory, or other compensatory fee from the issuer; or
(ii) Be an “interested person” of the investment company as defined in Section 2(a)(19) of the Act (15 U.S.C. 80a-2(a)(19)).
(3) If the registrant provides the disclosure required by paragraph (a)(1)(ii) of this Item, it must explain why it does not have an audit committee financial expert.
Not applicable to a semi-annual report.
ITEM 4. PRINCIPAL ACCOUNTANT FEES AND SERVICES.
(a) Disclose, under the caption Audit Fees, the aggregate fees billed for each of the last two fiscal years for professional services rendered by the principal accountant for the audit of the registrant’s annual financial statements or services that are normally provided by the accountant in connection with statutory and regulatory filings or engagements for those fiscal years.
(b) Disclose, under the caption Audit-Related Fees, the aggregate fees billed in each of the last two fiscal years for assurance and related services by the principal accountant that are reasonably related to the performance of the audit of the registrant’s financial statements and are not reported under paragraph (a) of this Item. Registrants shall describe the nature of the services comprising the fees disclosed under this category.
(c) Disclose, under the caption Tax Fees, the aggregate fees billed in each of the last two fiscal years for professional services rendered by the principal accountant for tax compliance, tax advice, and tax planning. Registrants shall describe the nature of the services comprising the fees disclosed under this category.
(d) Disclose, under the caption All Other Fees, the aggregate fees billed in each of the last two fiscal years for products and services provided by the principal accountant, other than the services reported in paragraphs (a) through (c) of this Item. Registrants shall describe the nature of the services comprising the fees disclosed under this category.
(e) (1) Disclose the audit committee’s pre-approval policies and procedures described in paragraph (c)(7) of Rule 2-01 of Regulation S-X.
(2) Disclose the percentage of services described in each of paragraphs (b) through (d) of this Item that were approved by the audit committee pursuant to paragraph (c)(7)(i)(C) of Rule 2-01 of Regulation S-X.
(f) If greater than 50 percent, disclose the percentage of hours expended on the principal accountant’s engagement to audit the registrant’s financial statements for the most recent fiscal year that were attributed to work performed by persons other than the principal accountant’s full-time, permanent employees.
(g) Disclose the aggregate non-audit fees billed by the registrant’s accountant for services rendered to the registrant, and rendered to the registrant’s investment adviser (not including any sub-adviser whose role is primarily portfolio management and is subcontracted with or overseen by another investment adviser), and any entity controlling, controlled by, or under common control with the adviser that provides ongoing services to the registrant for each of the last two fiscal years of the registrant.
(h) Disclose whether the registrant’s audit committee of the board of directors has considered whether the provision of non-audit services that were rendered to the registrant’s investment adviser (not including any subadviser whose role is primarily portfolio management and is subcontracted with or overseen by another investment adviser), and any entity controlling, controlled by, or under common control with the investment adviser that provides ongoing services to the registrant that were not pre-approved pursuant to paragraph (c)(7)(ii) of Rule 2-01 of Regulation S-X is compatible with maintaining the principal accountant’s independence.
Not applicable to a semi-annual report.
ITEM 5. AUDIT COMMITTEE OF LISTED REGISTRANTS.
(a) If the registrant is a listed issuer as defined in Rule 10A-3 under the Exchange Act (17CFR 240.10A-3), state whether or not the registrant has a separately-designated standing audit committee established in accordance with Section 3(a)(58)(A) of the Exchange Act (15 U.S.C. 78c(a)(58)(A)). If the registrant has such a committee, however designated, identify each committee member. If the entire board of directors is acting as the registrant’s audit committee as specified in Section 3(a)(58)(B) of the Exchange Act (15 U.S.C. 78c(a)(58)(B)), so state.
(b) If applicable, provide the disclosure required by Rule 10A-3(d) under the Exchange Act (17CFR 240.10A-3(d)) regarding an exemption from the listing standards for all audit committees.
Not applicable to a semi-annual report.
ITEM 6. SCHEDULE OF INVESTMENTS.
File Schedule I – Investments in securities of unaffiliated issuers as of the close of the reporting period as set forth in Section 210.12-12 of Regulation S-X, unless the schedule is included as part of the report to shareholders filed under Item 1 of this Form.
Included in Item 1.
ITEM 7. DISCLOSURE OF PROXY VOTING POLICIES AND PROCEDURES FOR CLOSED-END MANAGEMENT INVESTMENT COMPANIES.
A closed-end management investment company that is filing an annual report on this Form N-CSR must, unless it invests exclusively in non-voting securities, describe the policies and procedures that it uses to determine how to vote proxies relating to portfolio securities, including the procedures that the company uses when a vote presents a conflict between the interests of its shareholders, on the one hand, and those of the company’s investment adviser; principal underwriter; or any affiliated person (as defined in Section 2(a)(3) of the Investment Company Act of 1940 (15 U.S.C. 80a-2(a)(3)) and the rules thereunder) of the company, its investment adviser, or its principal underwriter, on the other. Include any policies and procedures of the company’s investment adviser, or any other third party, that the company uses, or that are used on the company’s behalf, to determine how to vote proxies relating to portfolio securities.
Not applicable.
ITEM 8. PORTFOLIO MANAGERS OF CLOSED-END MANAGEMENT INVESTMENT COMPANIES.
Not applicable.
ITEM 9. PURCHASE OF EQUITY SECURITIES BY CLOSED-END MANAGEMENT INVESTMENT COMPANY AND AFFILIATED PURCHASERS.
(a) If the registrant is a closed-end management investment company, provide the information specified in paragraph (b) of this Item with respect to any purchase made by or on behalf of the registrant or any “affiliated purchaser,” as defined in Rule 10b-18(a)(3) under the Exchange Act (17 CFR 240.10b-18(a)(3)), of shares or other units of any class of the registrant’s equity securities that is registered by the registrant pursuant to Section 12 of the Exchange Act (15 U.S.C. 781).
Not applicable.
ITEM 10. SUBMISSION OF MATTERS TO A VOTE OF SECURITY HOLDERS.
Describe any material changes to the procedures by which shareholders may recommend nominees to the registrant’s board of directors, where those changes were implemented after the registrant last provided disclosure in response to the requirements of Item 7(d)(2)(ii)(G) of Schedule 14A (17 CFR 240.14a-101), or this Item.
No material changes to report.
ITEM 11. CONTROLS AND PROCEDURES.
(a) Disclose the conclusions of the registrant’s principal executive and principal financial officers, or persons performing similar functions, regarding the effectiveness of the registrant’s disclosure controls and procedures (as defined in Rule 30a-3(c) under the Act (17 CFR 270.30a-3(c))) as of a date within 90 days of the filing date of the report that includes the disclosure required by this paragraph, based on the evaluation of these controls and procedures required by Rule 30a-3(b) under the Act (17 CFR 270.30a-3(b)) and Rules 13a-15(b) or 15d-15(b) under the Exchange Act (17 CFR 240.13a-15(b) or 240.15d-15(b)).
The Registrant’s principal executive and principal financial officers have concluded, based on their evaluation of the Registrant’s disclosure controls and procedures as of a date within 90 days of the filing date of this report, that the Registrant’s disclosure controls and procedures are reasonably designed to ensure that information required to be disclosed by the Registrant on Form N-CSR is recorded, processed, summarized and reported within the required time periods and that information required to be disclosed by the Registrant in the reports that it files or submits on Form N-CSR is accumulated and communicated to the Registrant’s management, including its principal executive and principal financial officers, as appropriate to allow timely decisions regarding required disclosure.
(b) Disclose any change in the registrant’s internal control over financial reporting (as defined in Rule 30a-3(d) under the Act (17 CFR 270.30a-3(d)) that occurred during the registrant’s second fiscal quarter of the period covered by this report that has materially affected, or is reasonably likely to materially affect, the registrant’s internal control over financial reporting.
There were no changes in the Registrant’s internal control over financial reporting that occurred during the last fiscal quarter covered by this report that have materially affected, or are reasonably likely to materially affect, the Registrant’s internal control over financial reporting.
ITEM 12. EXHIBITS.
(a) File the exhibits listed below as part of this Form. Letter or number the exhibits in the sequence indicated.
(a)(1) Any code of ethics, or amendment thereto, that is the subject of the disclosure required by Item 2, to the extent that the registrant intends to satisfy the Item 2 requirements through filing of an exhibit.
Not applicable.
(a)(2) A separate certification for each principal executive officer and principal financial officer of the registrant as required by Rule 30a-2(a) under the Act (17 CFR 270.30a-2).
Certifications pursuant to Rule 30a-2(a) under the Investment Company Act of 1940 are attached hereto.
(a)(3) Any written solicitation to purchase securities under Rule 23c-1 under the Act (17 CFR 270.23c-1) sent or given during the period covered by the report by or on behalf of the registrant to 10 or more persons.
Not applicable.
(b) A separate or combined certification for each principal executive officer and principal officer of the registrant as required by Rule 30a-2(b) under the Act of 1940.
Certifications pursuant to Rule 30a-2(b) under the Investment Company Act of 1940 are attached hereto.
SIGNATURES
Pursuant to the requirements of the Securities Exchange Act of 1934 and the Investment Company Act of 1940, the registrant has duly caused this report to be signed on its behalf by the undersigned, thereunto duly authorized.
| | |
| J.P. Morgan Fleming Mutual Fund Group, Inc. |
| |
| By: | | /s/ Patricia A. Maleski |
| | Patricia A. Maleski |
| | President and Principal Executive Officer |
| | March 6, 2013 |
Pursuant to the requirements of the Securities Exchange Act of 1934 and the Investment Company Act of 1940, this report has been signed below by the following persons on behalf of the registrant and in the capacities and on the dates indicated.
| | |
| By: | | /s/ Patricia A. Maleski |
| | Patricia A. Maleski |
| | President and Principal Executive Officer |
| | March 6, 2013 |
| |
| By: | | /s/ Joy C. Dowd |
| | Joy C. Dowd |
| | Treasurer and Principal Financial Officer |
| | March 6, 2013 |