UNITED STATES
SECURITIES AND EXCHANGE COMMISSION
Washington, D.C. 20549
FORM N-CSR
CERTIFIED SHAREHOLDER REPORT OF REGISTERED
MANAGEMENT INVESTMENT COMPANIES
Investment Company Act file number: 811-08189
J.P. Morgan Fleming Mutual Fund Group, Inc.
(Exact name of registrant as specified in charter)
270 Park Avenue
New York, NY 10017
(Address of principal executive offices) (Zip code)
Frank J. Nasta
270 Park Avenue
New York, NY 10017
(Name and Address of Agent for Service)
Registrant’s telephone number, including area code: (800) 480-4111
Date of fiscal year end: June 30
Date of reporting period: July 1, 2014 through December 31, 2014
Form N-CSR is to be used by management investment companies to file reports with the Commission not later than 10 days after the transmission to stockholders of any report that is required to be transmitted to stockholders under Rule 30e-1 under the Investment Company Act of 1940 (17 CFR 270.30e-1). The Commission may use the information provided on Form N-CSR in its regulatory, disclosure review, inspection, and policymaking roles.
A registrant is required to disclose the information specified by Form N-CSR, and the Commission will make this information public. A registrant is not required to respond to the collection of information contained in Form N-CSR unless the Form displays a currently valid Office of Management and Budget (“OMB”) control number. Please direct comments concerning the accuracy of the information collection burden estimate and any suggestions for reducing the burden to Secretary, Securities and Exchange Commission, 450 Fifth Street, NW, Washington, DC 20549-0609. The OMB has reviewed this collection of information under the clearance requirements of 44 U.S.C. Section 3507.
ITEM 1. REPORTS TO STOCKHOLDERS.
The following is a copy of the report transmitted to shareholders pursuant to Rule 30e-1 under the Investment Company Act of 1940 (17 CFR 270.30e-1).
Semi-Annual Report
J.P. Morgan Mid Cap/Multi-Cap Funds
December 31, 2014 (Unaudited)
JPMorgan Growth Advantage Fund
JPMorgan Mid Cap Equity Fund
JPMorgan Mid Cap Growth Fund
JPMorgan Mid Cap Value Fund
JPMorgan Multi-Cap Market Neutral Fund
JPMorgan Value Advantage Fund

CONTENTS
Investments in a Fund are not bank deposits or obligations of, or guaranteed or endorsed by, any bank and are not insured or guaranteed by the FDIC, the Federal Reserve Board or any other government agency. You could lose money if you sell when the Fund’s share price is lower than when you invested.
Past performance is no guarantee of future performance. The general market views expressed in this report are opinions based on market and other conditions through the end of the reporting period and are subject to change without notice. These views are not intended to predict the future performance of a Fund or the securities markets. References to specific securities and their issuers are for illustrative purposes only and are not intended to be, and should not be interpreted as, recommendations to purchase or sell such securities. Such views are not meant as investment advice and may not be relied on as an indication of trading intent on behalf of any Fund.
Prospective investors should refer to the Funds’ prospectus for a discussion of the Funds’ investment objectives, strategies and risks. Call J.P. Morgan Funds Service Center at 1-800-480-4111 for a prospectus containing more complete information about a Fund, including management fees and other expenses. Please read it carefully before investing.
CEO’S LETTER
January 11, 2015 (Unaudited)
Dear Shareholder,
A growing divergence in the economic trajectories of U.S. and other developed markets and plummeting global energy prices provided a mixed backdrop for the latter half of 2014. The U.S. economy accelerated at a steady pace amid continued strength in corporate earnings, gains in employment and consumer spending and falling oil prices for the six months ended December 31, 2014. Gross domestic product (GDP) in the U.S. climbed by 5.0% in the third quarter of 2014 and unemployment dropped to 5.6% in December, a level not seen since June 2008.
| | |
 | | “Amid uncertainty about the global economy recovery, equity markets in the U.S., China and Japan provided investors with solid returns and served to emphasize the prudence of holding a broadly diversified portfolio and a long-term outlook.” |
In response to the continued improvement in the domestic economy, the U.S. Federal Reserve Bank proceeded to taper down its monthly purchases of bonds under its quantitative easing program and finally closed the program in October.
In stark contrast, the European Central Bank (ECB) took unprecedented steps to counter the threat of price deflation in the euro zone and the Bank of Japan stunned markets with a massive stimulus program as Japan’s economy slid into recession.
Another key development in the latter half of 2014 was a precipitous drop in global petroleum prices. A supply glut driven by new production in the U.S. and increased output from other nations, along with decreasing demand from China, Europe and Japan led to a 50% drop in the price of crude oil between July and December.
Amid this backdrop, U.S. equity markets outperformed most other assets classes over the six month period, with large cap stocks providing better returns than small caps and defensive sectors overtaking cyclical sectors. Notably, U.S. equities fell to six-month lows in mid October only to rebound 8.4%, driving the Standard & Poor’s 500 (“S&P 500”) Index to a new closing high of 2,018.05 points on October 31, 2014. In December, the Dow Jones Industrial Average closed above 18,000 points for the first time following the news that third quarter GDP showed the fastest growth in 11 years. The S&P 500 closed at a new high of 2,090.57 points on December 29, 2014, and returned 6.1% for the six months ended December 31, 2014.
Prices for U.S. Treasury securities with longer maturities rose during the six month period as investors sought safe havens amid deteriorating energy prices and geopolitical concerns. While declining oil prices helped bolster consumer spending in developed nations, energy related sectors came under pressure and yield spreads on high-yield debt — also known as junk bonds — widened. Nations dependent on oil exports experienced volatility in bond yield spreads and currency valuations.
Meanwhile, weak growth in the euro zone raised concerns about the potential for a destructive deflationary spiral. Even after the ECB had cut its deposit rate to negative 0.1% to encourage banks to extend lending by effectively charging them for parking excess cash with the central bank, growth
remained tepid and inflation was well below the ECB’s target of just below 2%. The inflation rate averaged 0.4% from July to October and then fell 0.3% in November and was estimated at -0.2% for December. Unemployment across the euro zone remained stubbornly high at 11.5%.
Japan’s economy retreated into recession during the six month period following two quarters of economic contraction, partly attributed to an increase in the national consumption tax earlier in the year. Responding to the crisis, the Bank of Japan surprised global markets on October 31 by unveiling plans to buy 8 trillion to 12 trillion yen ($71 billion to $107 billion) of Japanese government bonds per month, while also tripling its purchases of exchange-traded funds. The announcement drove Tokyo stocks to seven-year highs. For the six months ended December 31, 2014, the MSCI Europe, Australasia and Far East Index returned -9.2%.
Elsewhere, China’s economy continued to grow but at a slower pace for the six month period. At 7.3%, China’s GDP showed the slowest growth in five years, though it was slightly better than economists had expected. The weaker GDP growth was partly attributed to a slowdown in the property sector. However, Chinese equity securities performed well over the six months ended December 31, 2014, amid expectations that policy makers may ease monetary policy to spur growth. Chinese equity markets received an additional boost when regulators increased access to Chinese financial markets by allowing foreign investors in Hong Kong to buy shares in Shanghai.
Russia’s economy, already straining under Western economic sanctions following its annexation of Crimea, began sliding toward recession as prices plummeted for oil and natural gas, its biggest exports. In response, the Russian Central Bank spent heavily from its reserves and raised its key interest rate sharply in a largely unsuccessful effort to halt the ruble’s slide. The MSCI Emerging Markets Index returned -7.7% for the six months ended December 31, 2014.
During the six month period, financial market volatility returned after being largely absent in the first half of 2014. Meanwhile, economic growth outside the U.S. began to falter and the relative strength of the U.S. economy drove the dollar higher against other major currencies. Amid uncertainty about the global economy recovery, equity markets in the U.S., China and Japan provided investors with solid returns and served to emphasize the prudence of holding a broadly diversified portfolio and a long-term outlook.
On behalf of everyone at J.P. Morgan Asset Management, thank you for your continued support. We look forward to managing your investment needs for years to come. Should you have any questions, please visit www.jpmorganfunds.com or contact the J.P. Morgan Funds Service Center at 1-800-480-4111.
Sincerely yours,

George C.W. Gatch
CEO, Global Funds Management
J.P. Morgan Asset Management
| | | | | | | | |
| | | |
| DECEMBER 31, 2014 | | J.P. MORGAN MID CAP/MULTI-CAP FUNDS | | | | | 1 | |
J.P. Morgan Mid Cap/Multi-Cap Funds
MARKET OVERVIEW
SIX MONTHS ENDED DECEMBER 31, 2014 (Unaudited)
U.S equity markets performed strongly during the six month reporting period amid accommodative central bank policies, falling energy prices and steady overall improvement in the U.S. economy. While the second half of 2014 was marked by the return of volatility in financial markets and a sharp sell-off in mid-October, key U.S. equity indexes rebounded to closing highs in the final months of 2014. The Standard & Poor’s 500 Index (“S&P 500”) broke through the 2,000-point closing level for the first time on the final day of October and hit new closing highs in the final weeks of December. Also in late December, the Dow Jones Industrial Average closed above 18,000 points for the first time. U.S. Treasury securities with longer maturities also performed well during the six month reporting period, as geopolitical risks and concerns about weakness in the global economy pushed investors into so-called safe haven bonds.
Overall, U.S. large cap stocks outperformed small cap stocks and growth stocks outperformed value stocks during the reporting period. For the six months ended December 31, 2014, mid cap stocks as measured by the Russell Midcap Index returned 4.18%, outperforming the Russell 2000 Index, which returned 1.65%. The S&P 500 Index returned 6.12%.
| | | | | | |
| | | |
| 2 | | | | J.P. MORGAN MID CAP/MULTI-CAP FUNDS | | DECEMBER 31, 2014 |
JPMorgan Growth Advantage Fund
FUND COMMENTARY
SIX MONTHS ENDED DECEMBER 31, 2014 (Unaudited)
| | | | |
| REPORTING PERIOD RETURN: | |
| Fund (Class A Shares, without a sales charge)* | | | 4.69% | |
| Russell 3000 Growth Index | | | 6.10% | |
| |
| Net Assets as of 12/31/2014 (In Thousands) | | $ | 4,168,436 | |
INVESTMENT OBJECTIVE**
The JPMorgan Growth Advantage Fund (the “Fund”) seeks to provide long-term capital growth.
WHAT WERE THE MAIN DRIVERS OF THE FUND’S PERFORMANCE?
The Fund (Class A Shares, without a sales charge) underperformed the Russell 3000 Growth Index (the “Benchmark”) for the six months ended December 31, 2014. The Fund’s security selection in the consumer discretionary and producer durables sectors was a leading detractor from performance relative to the Benchmark, while the Fund’s underweight position in the energy sectors and its overweight position in the health care sector were leading contributors to relative performance.
Individual detractors from relative performance included the Fund’s underweight position in Apple Inc. and its overweight positions in Kirby Corp. and Antero Resources Corp. Shares of Apple, a maker of computers and mobile devices, rose on better-than-expected earnings and revenue, driven by sales of its iPhone and other products. Shares of Kirby, a tank and barge operator, fell after the company lowered its quarterly and full-year forecasts for earnings. Shares of Antero Resources, an independent oil and gas exploration and production company, declined amid falling global oil prices.
Leading individual contributors to relative performance included the Fund’s overweight positions in Regeneron Pharmaceuticals Inc. and Avago Technologies Inc., and its underweight position in Halliburton Co. Shares of Regeneron, a biopharmaceutical company, rose on investor expectations for its eye drug, Eylea, and advances in the company’s pipeline of potential new drugs. Shares of Avago, a Singapore producer of analog semiconductors, strengthened on revenue growth and increased demand for its radio frequency semiconductor chips, which are used by telecom operators upgrading their networks to accommodate so-called 4G smartphones. Shares of Halliburton, an oilfield services company not held by the Fund, declined amid falling global oil prices.
HOW WAS THE FUND POSITIONED?
The Fund’s portfolio managers utilized a bottom-up approach to stock selection, researching individual companies across
market capitalizations in an effort to construct portfolios of stocks that have strong fundamentals. The Fund’s portfolio managers sought to invest in high quality companies with durable franchises that, in their view, possessed the ability to generate strong future earnings growth.
| | | | | | | | |
| TOP TEN EQUITY HOLDINGS OF THE PORTFOLIO*** | |
| | 1. | | | Apple, Inc. | | | 4.0 | % |
| | 2. | | | Facebook, Inc., Class A | | | 3.9 | |
| | 3. | | | Gilead Sciences, Inc. | | | 3.4 | |
| | 4. | | | Google, Inc., Class C | | | 3.1 | |
| | 5. | | | Acuity Brands, Inc. | | | 2.4 | |
| | 6. | | | MasterCard, Inc., Class A | | | 2.3 | |
| | 7. | | | Home Depot, Inc. (The) | | | 2.0 | |
| | 8. | | | CBRE Group, Inc., Class A | | | 2.0 | |
| | 9. | | | Celgene Corp. | | | 1.8 | |
| | 10. | | | Affiliated Managers Group, Inc. | | | 1.7 | |
| | | | |
PORTFOLIO COMPOSITION BY SECTOR*** | |
| Information Technology | | | 29.0 | % |
| Health Care | | | 18.1 | |
| Consumer Discretionary | | | 17.7 | |
| Industrials | | | 13.4 | |
| Financials | | | 9.0 | |
| Materials | | | 4.6 | |
| Energy | | | 3.6 | |
| Consumer Staples | | | 1.2 | |
| Short-Term Investment | | | 3.4 | |
| * | | The return shown is based on net asset values calculated for shareholder transactions and may differ from the return shown in the financial highlights, which reflects adjustments made to the net asset values in accordance with accounting principles generally accepted in the United States of America. |
| ** | | The adviser seeks to achieve the Fund’s objective. There can be no guarantee it will be achieved. |
| *** | | Percentages indicated are based on total investments as of December 31, 2014. The Fund’s portfolio composition is subject to change. |
| | | | | | | | |
| | | |
| DECEMBER 31, 2014 | | J.P. MORGAN MID CAP/MULTI-CAP FUNDS | | | | | 3 | |
JPMorgan Growth Advantage Fund
FUND COMMENTARY
SIX MONTHS ENDED DECEMBER 31, 2014 (Unaudited) (continued)
| | | | | | | | | | | | | | | | | | |
AVERAGE ANNUAL TOTAL RETURNS AS OF DECEMBER 31, 2014 | |
| | | INCEPTION DATE OF
CLASS | | 6 MONTH* | | | 1 YEAR | | | 5 YEAR | | | 10 YEAR | |
CLASS A SHARES | | October 29, 1999 | | | | | | | | | | | | | | | | |
Without Sales Charge | | | | | 4.69 | % | | | 9.54 | % | | | 16.88 | % | | | 10.59 | % |
With Sales Charge** | | | | | (0.81 | ) | | | 3.82 | | | | 15.62 | | | | 9.99 | |
CLASS B SHARES | | October 29, 1999 | | | | | | | | | | | | | | | | |
Without CDSC | | | | | 4.38 | | | | 8.91 | | | | 16.29 | | | | 10.07 | |
With CDSC*** | | | | | (0.62 | ) | | | 3.91 | | | | 16.07 | | | | 10.07 | |
CLASS C SHARES | | May 1, 2006 | | | | | | | | | | | | | | | | |
Without CDSC | | | | | 4.37 | | | | 8.90 | | | | 16.27 | | | | 9.97 | |
With CDSC**** | | | | | 3.37 | | | | 7.90 | | | | 16.27 | | | | 9.97 | |
CLASS R5 SHARES | | January 8, 2009 | | | 4.84 | | | | 9.87 | | | | 17.34 | | | | 10.93 | |
CLASS R6 SHARES | | December 23, 2013 | | | 4.83 | | | | 9.94 | | | | 17.36 | | | | 10.94 | |
SELECT CLASS SHARES | | May 1, 2006 | | | 4.74 | | | | 9.66 | | | | 17.10 | | | | 10.80 | |
| ** | | Sales Charge for Class A Shares is 5.25%. |
| *** | | Assumes 5% CDSC (contingent deferred sales charge) for the one year period, 2% CDSC for the five year period and 0% CDSC thereafter. |
| **** | | Assumes a 1% CDSC for the one year period and 0% CDSC thereafter. |
TEN YEAR PERFORMANCE (12/31/04 TO 12/31/14)
The performance quoted is past performance and is not a guarantee of future results. Mutual funds are subject to certain market risks. Investment returns and principal value of an investment will fluctuate so that an investor’s shares, when redeemed, may be worth more or less than their original cost. Current performance may be higher or lower than the performance data shown. For up-to-date month-end performance information please call 1-800-480-4111.
As of August 17, 2005, the Fund changed its name, investment objective, certain investment policies and benchmark. Prior to that time, the Fund operated as JPMorgan Mid Cap Growth Fund. Although past performance is not necessarily an indication of how the Fund will perform in the future, in view of these changes, the Fund’s performance record prior to August 17, 2005 might be less pertinent for investors considering whether to purchase shares of the Fund. Returns for the Class C Shares prior to its inception date are based on the performance of Class B Shares, whose expenses are substantially similar to those of Class C Shares. Returns for the Select Class Shares prior to its inception date are based on the performance of Class A Shares. During this period, the actual returns of Select Class Shares would have been different than those shown because Select Class Shares have different expenses than Class A Shares. Returns for Class R5 Shares prior to its inception date are based on the performance of Select Class Shares from May 1, 2006 to January 7, 2009 and Class A Shares prior to May 1, 2006. The actual returns of Class R5 Shares would have been different than those shown because Class R5 Shares have different expenses than Select Class and Class A Shares. Returns for Class R6
Shares prior to its inception date are based on the performance of Class R5 Shares from January 8, 2009 to December 23, 2013, Select Class Shares from May 1, 2006 to January 8, 2009 and Class A Shares prior to May 1, 2006. The actual returns of Class R6 Shares would have been different than those shown because Class R6 Shares have different expenses than the other classes.
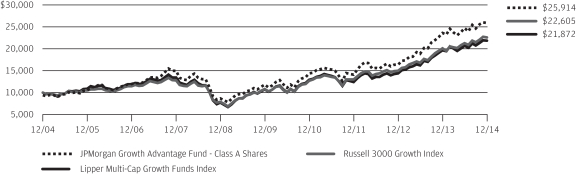
The graph illustrates comparative performance for $10,000 invested in Class A Shares of the JPMorgan Growth Advantage Fund, the Russell 3000 Growth Index and the Lipper Multi-Cap Growth Funds Index from December 31, 2004 to December 31, 2014. The performance of the Fund assumes reinvestment of all dividends and capital gain distributions, if any, and includes a sales charge. The performance of the Russell 3000 Growth Index does not reflect the deduction of expenses or a sales charge associated with a mutual fund and has been adjusted to reflect reinvestment of all dividends and capital gain distributions of the securities included in the benchmark, if applicable. The performance of the Lipper Multi-Cap Growth Funds Index includes expenses associated with a mutual fund, such as investment management fees. These expenses are not identical to the expenses incurred by the Fund. The Russell 3000 Growth Index is an unmanaged index which measures the performance of those Russell 3000 companies (largest 3000 U.S. companies) with higher price-to-book ratios and higher forecasted growth values. The Lipper Multi-Cap Growth Funds Index is an index based on total returns of certain mutual funds within the Fund’s designated category as determined by Lipper, Inc. Investors cannot invest directly in an index.
| | | | | | |
| | | |
| 4 | | | | J.P. MORGAN MID CAP/MULTI-CAP FUNDS | | DECEMBER 31, 2014 |
Class A Shares have a $1,000 minimum initial investment and carry a 5.25% sales charge.
Fund performance may reflect the waiver of the Fund’s fees and reimbursement of expenses for certain periods since the inception date. Without these waivers and reimbursements, performance would have been lower. Also, performance shown in this section does not reflect the deduction of taxes that a shareholder would pay on Fund distributions or redemption of Fund shares.
Because Class B Shares automatically convert to Class A Shares after 8 years, the 10 year annual average total return shown above for Class B reflects Class A performance for the period after conversion.
The returns shown are based on net asset values calculated for shareholder transactions and may differ from the returns shown in the financial highlights, which reflect adjustments made to the net asset values in accordance with accounting principles generally accepted in the United States of America.
| | | | | | | | |
| | | |
| DECEMBER 31, 2014 | | J.P. MORGAN MID CAP/MULTI-CAP FUNDS | | | | | 5 | |
JPMorgan Mid Cap Equity Fund
FUND COMMENTARY
SIX MONTHS ENDED DECEMBER 31, 2014 (Unaudited)
| | | | |
| REPORTING PERIOD RETURN: | |
| Fund (Select Class Shares)* | | | 4.22% | |
| Russell Midcap Index | | | 4.18% | |
| |
| Net Assets as of 12/31/2014 (In Thousands) | | $ | 3,075,048 | |
INVESTMENT OBJECTIVE**
The JPMorgan Mid Cap Equity Fund (the “Fund”) seeks long-term capital growth.
WHAT WERE THE MAIN DRIVERS OF THE FUND’S PERFORMANCE?
The Fund (Select Class Shares) outperformed the Russell Midcap Index (the “Benchmark”) for the six months ended December 31, 2014. The Fund’s security selection in the materials & processing sector and its underweight position in the energy sector were leading contributors to performance relative to the Benchmark, while the Fund’s security selection in the health care and consumer discretionary sectors detracted from relative performance.
Leading individual contributors to relative performance included the Fund’s overweight positions in Sherwin-Williams Co. and Delta Air Lines Inc. and its underweight position in Noble Energy Inc. Shares of Sherwin Williams, a manufacturer and retailer of paints and coatings, rose after the company increased its forecast for revenue and earnings. Shares of Delta Air Lines rose on overall improvement in the air line industry amid strong consumer spending and falling fuel prices. Shares of Noble Energy, an independent oil and natural exploration and production company not held by the Fund, fell after the company’s earnings fell below analysts’ estimates amid weakening global oil prices.
Leading individual detractors from relative performance included the Fund’s overweight positions in Laredo Petroleum Holdings Inc., Southwestern Energy Co. and Kirby Corp. Shares of Laredo Petroleum, an independent oil and natural gas exploration and production company, fell amid a decline in global oil prices. Shares of Southwestern Energy, an independent oil and natural gas exploration and production company, fell after the company lowered its cash flow forecast amid falling global oil prices. Shares of Kirby, a tank and barge operator, fell after the company lowered its quarter and full-year forecasts for earnings.
HOW WAS THE FUND POSITIONED?
The Fund’s portfolio managers employed a bottom-up approach to stock selection, constructing a portfolio based on
company fundamentals, quantitative screening and proprietary fundamental analysis. The Fund’s portfolio managers sought to identify dominant franchises with predictable business models deemed capable of achieving, in their view, sustained growth, as well as undervalued companies with the potential to grow their intrinsic value per share.
| | | | | | | | |
| TOP TEN EQUITY HOLDINGS OF THE PORTFOLIO*** | |
| | 1. | | | Sherwin-Williams Co. (The) | | | 1.4 | % |
| | 2. | | | Amphenol Corp., Class A | | | 1.4 | |
| | 3. | | | Carlisle Cos., Inc. | | | 1.3 | |
| | 4. | | | Humana, Inc. | | | 1.3 | |
| | 5. | | | Acuity Brands, Inc. | | | 1.2 | |
| | 6. | | | Fortune Brands Home & Security, Inc. | | | 1.1 | |
| | 7. | | | Mohawk Industries, Inc. | | | 1.1 | |
| | 8. | | | CBRE Group, Inc., Class A | | | 1.1 | |
| | 9. | | | Illumina, Inc. | | | 1.1 | |
| | 10. | | | Affiliated Managers Group, Inc. | | | 1.0 | |
| | | | |
PORTFOLIO COMPOSITION BY SECTOR*** | |
| Financials | | | 20.2 | % |
| Consumer Discretionary | | | 19.0 | |
| Information Technology | | | 16.5 | |
| Industrials | | | 13.1 | |
| Health Care | | | 10.7 | |
| Utilities | | | 4.7 | |
| Materials | | | 4.6 | |
| Consumer Staples | | | 4.0 | |
| Energy | | | 4.0 | |
| Short-Term Investment | | | 3.2 | |
| * | | The return shown is based on net asset values calculated for shareholder transactions and may differ from the return shown in the financial highlights, which reflects adjustments made to the net asset values in accordance with accounting principles generally accepted in the United States of America. |
| ** | | The adviser seeks to achieve the Fund’s objective. There can be no guarantee it will be achieved. |
| *** | | Percentages indicated are based on total investments as of December 31, 2014. The Fund’s portfolio composition is subject to change. |
| | | | | | |
| | | |
| 6 | | | | J.P. MORGAN MID CAP/MULTI-CAP FUNDS | | DECEMBER 31, 2014 |
| | | | | | | | | | | | | | | | | | |
AVERAGE ANNUAL TOTAL RETURNS AS OF DECEMBER 31, 2014 | |
| | | INCEPTION DATE OF
CLASS | | 6 MONTH* | | | 1 YEAR | | | 5 YEAR | | | 10 YEAR | |
CLASS A SHARES | | November 2, 2009 | | | | | | | | | | | | | | | | |
Without Sales Charge | | | | | 4.04 | % | | | 12.48 | % | | | 16.89 | % | | | 9.48 | % |
With Sales Charge** | | | | | (1.43 | ) | | | 6.58 | | | | 15.63 | | | | 8.89 | |
CLASS C SHARES | | November 2, 2009 | | | | | | | | | | | | | | | | |
Without CDSC | | | | | 3.77 | | | | 11.92 | | | | 16.31 | | | | 9.20 | |
With CDSC*** | | | | | 2.77 | | | | 10.92 | | | | 16.31 | | | | 9.20 | |
CLASS R2 SHARES | | March 14, 2014 | | | 3.92 | | | | 12.27 | | | | 16.84 | | | | 9.46 | |
CLASS R5 SHARES | | March 14, 2014 | | | 4.27 | | | | 12.96 | | | | 17.31 | | | | 9.68 | |
CLASS R6 SHARES | | March 14, 2014 | | | 4.29 | | | | 12.99 | | | | 17.32 | | | | 9.69 | |
SELECT CLASS SHARES | | January 1, 1997 | | | 4.22 | | | | 12.86 | | | | 17.29 | | | | 9.67 | |
| ** | | Sales Charge for Class A Shares is 5.25%. |
| *** | | Assumes a 1% CDSC (contingent deferred sales charge) for the one year period and 0% CDSC thereafter. |
TEN YEAR PERFORMANCE (12/31/04 TO 12/31/14)
The performance quoted is past performance and is not a guarantee of future results. Mutual funds are subject to certain market risks. Investment returns and principal value of an investment will fluctuate so that an investor’s shares, when redeemed, may be worth more or less than their original cost. Current performance may be higher or lower than the performance data shown. For up-to-date month-end performance information please call 1-800-480-4111.
Returns for Class A and Class C Shares prior to their inception date are based on the performance of Select Class Shares. The actual returns of Class A and Class C Shares would have been lower than those shown because Class A and Class C Shares have higher expenses than Select Class Shares. Returns for Class R2 Shares prior to their inception date are based of Class A Shares from November 2, 2009 to March 13, 2014 and Select Class Shares prior to November 2, 2009. The actual returns of Class R2 Shares would have been lower than those shown because Class R2 Shares have higher expenses than Class A and Select Class Shares. Returns for Class R5 and Class R6 Shares prior to their inception date are based on the performance of Select Class Shares. The actual returns of Class R5 and Class R6 Shares would have been different because Class R5 and Class R6 Shares have different expenses than Select Class Shares.
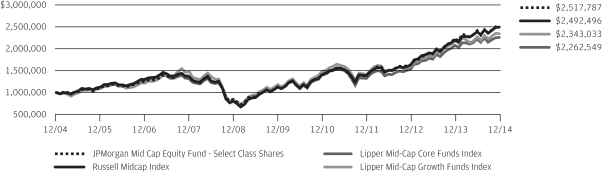
The graph illustrates comparative performance for $1,000,000 invested in the Select Class Shares of JPMorgan Mid Cap Equity Fund, the Russell Midcap Index Lipper Mid-Cap Core Funds Index and the Lipper Mid-Cap Growth Funds Index from December 31, 2004 to December 31, 2014. The performance of the Fund
assumes reinvestment of all dividends and capital gain distributions, if any, and
does not include a sales charge. The performance of the Russell Midcap Index does not reflect the deduction of expenses or a sales charge associated with a mutual fund and has been adjusted to reflect reinvestment of all dividends and capital gain distributions of the securities included in the benchmark, if applicable. The performance of the Lipper Mid-Cap Core Funds Index and Lipper Mid-Cap Growth Funds Index includes expenses associated with a mutual fund, such as investment management fees. These expenses are not identical to the expenses incurred by the Fund. The Russell Midcap Index is an unmanaged index which measures the performance of the 800 smallest companies in the Russell 1000 Index. The Lipper Mid-Cap Core Funds Index and the Lipper Mid-Cap Growth Funds Index are indices based on total returns of certain mutual funds within the Fund’s designated category as determined by Lipper, Inc. Investors cannot invest directly in an index.
Select Class Shares have a $1,000,000 minimum initial investment.
Fund performance may reflect the waiver of the Fund’s fees and reimbursement of expenses for certain periods since the inception date. Without these waivers and reimbursements, performance would have been lower. Also, performance shown in this section does not reflect the deduction of taxes that a shareholder would pay on Fund distributions or redemption of Fund shares.
The returns shown are based on net asset values calculated for shareholder transactions and may differ from the returns shown in the financial highlights, which reflect adjustments made to the net asset values in accordance with accounting principles generally accepted in the United States of America.
| | | | | | | | |
| | | |
| DECEMBER 31, 2014 | | J.P. MORGAN MID CAP/MULTI-CAP FUNDS | | | | | 7 | |
JPMorgan Mid Cap Growth Fund
FUND COMMENTARY
SIX MONTHS ENDED DECEMBER 31, 2014 (Unaudited)
| | | | |
| REPORTING PERIOD RETURN: | |
| Fund (Select Class Shares)* | | | 2.12% | |
| Russell Midcap Growth Index | | | 5.07% | |
| |
| Net Assets as of 12/31/2014 (In Thousands) | | $ | 2,369,846 | |
INVESTMENT OBJECTIVE**
The JPMorgan Mid Cap Growth Fund (the “Fund”) seeks growth of capital.1
WHAT WERE THE MAIN DRIVERS OF THE FUND’S PERFORMANCE?
The Fund (Select Class Shares) underperformed the Russell Midcap Growth Index (the “Benchmark”) for the six months ended December 31, 2014. The Fund’s security selection in the consumer discretionary and health care sectors was a leading detractor from performance relative to the Benchmark, while security selection in the technology sector and the materials & processing sector was a leading contributor to relative performance.
Leading individual detractors from relative performance included Laredo Petroleum Holdings Inc., Kirby Corp. and Concho Resources Inc. Shares of both Laredo Petroleum and Concho Resoiurces, independent oil and natural gas exploration and production companies, fell amid a decline in global oil prices. Shares of Kirby, a tank and barge operator, fell after the company lowered its quarter and full-year forecasts for earnings.
Leading individual contributors to relative performance included Delta Air Lines Inc., Avago Technologies Ltd. and Ulta Salon, Cosmetics & Fragrances Inc. Shares of Delta Air Lines, which was not held in the Benchmark, benefitted from improvement in the overall outlook for the airline industry, amid strong consumer spending and falling fuel prices. Shares of Avago, a Singapore producer of analog semiconductors, strengthened on revenue growth and increased demand for its radio frequency semiconductor chips, which are used by telecom operators upgrading their networks to accommodate so-called 4G smartphones. Shares of Ulta Salon, a cosmetics retail chain, strengthened after the company raised its forecast for earnings and sales.
HOW WAS THE FUND POSITIONED?
The Fund’s portfolio managers utilized a bottom-up approach to stock selection, researching individual companies in an effort to construct a portfolio of stocks that have strong fundamentals. The Fund’s portfolio managers sought to invest in high
quality companies with durable franchises that, in their view, possessed the ability to generate strong future earnings growth.
| | | | | | | | |
| TOP TEN EQUITY HOLDINGS OF THE PORTFOLIO*** | |
| | 1. | | | Acuity Brands, Inc. | | | 2.5 | % |
| | 2. | | | CBRE Group, Inc., Class A | | | 2.1 | |
| | 3. | | | Illumina, Inc. | | | 2.1 | |
| | 4. | | | Affiliated Managers Group, Inc. | | | 2.1 | |
| | 5. | | | Sherwin-Williams Co. (The) | | | 2.1 | |
| | 6. | | | Delta Air Lines, Inc. | | | 2.0 | |
| | 7. | | | Alliance Data Systems Corp. | | | 1.8 | |
| | 8. | | | Michael Kors Holdings Ltd., (Hong Kong) | | | 1.7 | |
| | 9. | | | Ulta Salon Cosmetics & Fragrance, Inc. | | | 1.7 | |
| | 10. | | | Amphenol Corp., Class A | | | 1.7 | |
| | | | |
PORTFOLIO COMPOSITION BY SECTOR*** | |
| Information Technology | | | 24.3 | % |
| Consumer Discretionary | | | 20.4 | |
| Industrials | | | 16.8 | |
| Health Care | | | 14.8 | |
| Financials | | | 10.8 | |
| Energy | | | 4.2 | |
| Materials | | | 3.0 | |
| Consumer Staples | | | 2.5 | |
Short-Term Investment | | | 3.2 | |
| * | | The return shown is based on net asset values calculated for shareholder transactions and may differ from the return shown in the financial highlights, which reflects adjustments made to the net asset values in accordance with accounting principles generally accepted in the United States of America. |
| ** | | The adviser seeks to achieve the Fund’s objective. There can be no guarantee it will be achieved. |
| *** | | Percentages indicated are based on total investments as of December 31, 2014. The Fund’s portfolio composition is subject to change. |
| 1 | | Effective July 23, 2014, following approval from the Fund’s Board of Trustees, shareholders approved the change to the Fund’s investment objective. The current investment objective is stated above. Prior to July 23, 2014, the Fund’s investment objective was to seek growth of capital and secondarily, current income by investing primarily in equity securities. |
| | | | | | |
| | | |
| 8 | | | | J.P. MORGAN MID CAP/MULTI-CAP FUNDS | | DECEMBER 31, 2014 |
| | | | | | | | | | | | | | | | | | |
AVERAGE ANNUAL TOTAL RETURNS AS OF DECEMBER 31, 2014 | |
| | | INCEPTION DATE OF
CLASS | | 6 MONTH* | | | 1 YEAR | | | 5 YEAR | | | 10 YEAR | |
| | | | | | | | | | | | | | | | | | |
CLASS A SHARES | | February 18, 1992 | | | | | | | | | | | | | | | | |
Without Sales Charge | | | | | 1.95 | % | | | 10.64 | % | | | 16.34 | % | | | 9.38 | % |
With Sales Charge** | | | | | (3.39 | ) | | | 4.85 | | | | 15.10 | | | | 8.79 | |
CLASS B SHARES | | January 14, 1994 | | | | | | | | | | | | | | | | |
Without CDSC | | | | | 1.73 | | | | 10.13 | | | | 15.77 | | | | 8.87 | |
With CDSC*** | | | | | (3.27 | ) | | | 5.13 | | | | 15.55 | | | | 8.87 | |
CLASS C SHARES | | November 4, 1997 | | | | | | | | | | | | | | | | |
Without CDSC | | | | | 1.69 | | | | 10.13 | | | | 15.77 | | | | 8.77 | |
With CDSC**** | | | | | 0.69 | | | | 9.13 | | | | 15.77 | | | | 8.77 | |
CLASS R2 SHARES | | June 19, 2009 | | | 1.88 | | | | 10.48 | | | | 16.17 | | | | 9.21 | |
CLASS R5 SHARES | | November 1, 2011 | | | 2.18 | | | | 11.14 | | | | 16.82 | | | | 9.74 | |
CLASS R6 SHARES | | November 1, 2011 | | | 2.25 | | | | 11.24 | | | | 16.87 | | | | 9.76 | |
SELECT CLASS SHARES | | March 2, 1989 | | | 2.12 | | | | 11.00 | | | | 16.71 | | | | 9.69 | |
| ** | | Sales Charge for Class A Shares is 5.25%. |
| *** | | Assumes a 5% CDSC (contingent deferred sales charge) for the one year period, 2% CDSC for the five year period and 0% CDSC thereafter. |
| **** | | Assumes a 1% CDSC for the one year period and 0% CDSC thereafter. |
TEN YEAR PERFORMANCE (12/31/04 TO 12/31/14)
The performance quoted is past performance and is not a guarantee of future results. Mutual funds are subject to certain market risks. Investment returns and principal value of an investment will fluctuate so that an investor’s shares, when redeemed, may be worth more or less than their original cost. Current performance may be higher or lower than the performance data shown. For up-to-date month-end performance information please call 1-800-480-4111.
Returns for the Class R2, Class R5 and Class R6 Shares prior to their inception dates are based on the performance of Select Class Shares. Prior performance for Class R2 Shares has been adjusted to reflect the differences in expenses between classes. The actual returns of Class R5 and Class R6 Shares would have been different than those shown because Class R5 and Class R6 Shares have different expenses than Select Class Shares.
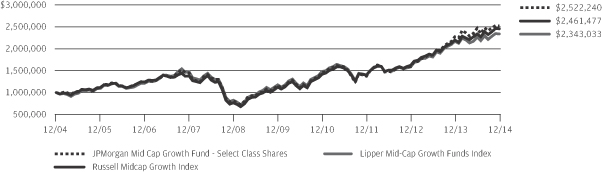
The graph illustrates comparative performance for $1,000,000 invested in Select Class Shares of the JPMorgan Mid Cap Growth Fund, the Russell Midcap Growth Index and the Lipper Mid-Cap Growth Funds Index from December 31, 2004 to December 31, 2014. The performance of the Fund assumes reinvestment of all dividends and capital gain distributions, if any, and does not include a sales charge. The performance of the Russell Midcap Growth Index does not reflect the deduction of expenses or a sales charge associated with a mutual fund and has been adjusted to reflect reinvestment of all dividends and capital gain distributions of the securities included in the benchmark, if applicable. The
performance of the Lipper Mid-Cap Growth Funds Index includes expenses associated with a mutual fund, such as investment management fees. These expenses are not identical to the expenses incurred by the Fund. The Russell Midcap Growth Index is an unmanaged index which measures the performance of those Russell Midcap companies with higher price-to-book ratios and higher forecasted growth values. The Lipper Mid-Cap Growth Funds Index is an index based on total returns of certain mutual funds as determined by Lipper, Inc. Investors cannot invest directly in an index.
Select Class Shares have a $1,000,000 minimum initial investment.
Fund performance may reflect the waiver of the Fund’s fees and reimbursement of expenses for certain periods since the inception date. Without these waivers and reimbursements, performance would have been lower. Also, performance shown in this section does not reflect the deduction of taxes that a shareholder would pay on Fund distributions or redemption of Fund shares.
Because Class B Shares automatically convert to Class A Shares after 8 years, the 10 year average annual total return shown above for Class B reflects Class A performance for the period after conversion.
The returns shown are based on net asset values calculated for shareholder transactions and may differ from the returns shown in the financial highlights, which reflect adjustments made to the net asset values in accordance with accounting principles generally accepted in the United States of America.
| | | | | | | | |
| | | |
| DECEMBER 31, 2014 | | J.P. MORGAN MID CAP/MULTI-CAP FUNDS | | | | | 9 | |
JPMorgan Mid Cap Value Fund
FUND COMMENTARY
SIX MONTHS ENDED DECEMBER 31, 2014 (Unaudited)
| | | | |
| REPORTING PERIOD RETURN: | |
| Fund (Institutional Class Shares)* | | | 6.45% | |
| Russell Midcap Value Index | | | 3.25% | |
| |
| Net Assets as of 12/31/2014 (In Thousands) | | $ | 15,993,084 | |
INVESTMENT OBJECTIVE**
The JPMorgan Mid Cap Value Fund (the “Fund”) seeks growth from capital appreciation.
WHAT WERE THE MAIN DRIVERS OF THE FUND’S PERFORMANCE?
The Fund (Institutional Class Shares) outperformed the Russell Midcap Value Index (the “Benchmark”) for the six months ended December 31, 2014. The Fund’s security selection in the materials sector and its security selection and overweight position in the consumer discretionary sectors were leading contributors to performance relative to the Benchmark, while the Fund’s underweight positions in the telecommunication services (no holdings) and utilities sectors were leading detractors from relative performance.
Leading individual contributors to relative performance included Sigma-Aldrich Corp., Kroger Co. and PBF Energy Co. Shares of Sigma-Aldrich, a U.S. laboratory supply company, rose on the company’s $17 billion acquisition by German drug and chemical company, Merck KGaA. Shares of Kroger, a supermarket chain not held in the Benchmark, rose on better-than-expected earnings and the company’s revised profit forecast, partly due to acquisitions. Shares of PBF Energy, an independent petroleum refiner, rose on the initial public offering for the company’s PBF Logistics LP unit.
Leading individual detractors from relative performance included Albermarle Corp., Gap Inc. and Xilinx Inc. Shares of Albermarle, a specialty chemicals company, declined on the company’s acquisition of Rockwood Holdings Inc. Shares of Gap, a clothing retailer not held in the Benchmark, fell after the company lowered its earnings forecast. Shares of Xilinx, a semiconductor company not held in the Benchmark, fell on a weak outlook for revenue.
HOW WAS THE FUND POSITIONED?
The Fund’s portfolio managers utilized a bottom-up approach to stock selection and sought to identify durable franchises possessing the ability to generate, in their view, sustainable
levels of free cash flow. The Fund continued to have an overweight position in consumer discretionary stocks. The Fund’s largest underweight position was in the telecommunication services sector, where it had no holdings during the reporting period.
| | | | | | | | |
| TOP TEN EQUITY HOLDINGS OF THE PORTFOLIO*** | |
| | 1. | | | Kohl’s Corp. | | | 1.6 | % |
| | 2. | | | Loews Corp. | | | 1.6 | |
| | 3. | | | Expedia, Inc. | | | 1.6 | |
| | 4. | | | Cigna Corp. | | | 1.6 | |
| | 5. | | | Gap, Inc. (The) | | | 1.6 | |
| | 6. | | | Arrow Electronics, Inc. | | | 1.5 | |
| | 7. | | | Jack Henry & Associates, Inc. | | | 1.5 | |
| | 8. | | | Fifth Third Bancorp | | | 1.4 | |
| | 9. | | | Questar Corp. | | | 1.4 | |
| | 10. | | | Ameriprise Financial, Inc. | | | 1.4 | |
| | | | |
PORTFOLIO COMPOSITION BY SECTOR*** | |
| Financials | | | 29.8 | % |
| Consumer Discretionary | | | 17.8 | |
| Industrials | | | 9.4 | |
| Utilities | | | 9.3 | |
| Information Technology | | | 8.8 | |
| Health Care | | | 6.7 | |
| Materials | | | 6.1 | |
| Consumer Staples | | | 5.5 | |
Energy | | | 3.8 | |
Short-Term Investment | | | 2.8 | |
| * | | The return shown is based on net asset values calculated for shareholder transactions and may differ from the return shown in the financial highlights, which reflects adjustments made to the net asset values in accordance with accounting principles generally accepted in the United States of America. |
| ** | | The adviser seeks to achieve the Fund’s objective. There can be no guarantee it will be achieved. |
| *** | | Percentages indicated are based on total investments as of December 31, 2014. The Fund’s portfolio composition is subject to change. |
| | | | | | |
| | | |
| 10 | | | | J.P. MORGAN MID CAP/MULTI-CAP FUNDS | | DECEMBER 31, 2014 |
| | | | | | | | | | | | | | | | | | |
AVERAGE ANNUAL TOTAL RETURNS AS OF DECEMBER 31, 2014 | |
| | | INCEPTION DATE OF
CLASS | | 6 MONTH* | | | 1 YEAR | | | 5 YEAR | | | 10 YEAR | |
CLASS A SHARES | | April 30, 2001 | | | | | | | | | | | | | | | | |
Without Sales Charge | | | | | 6.20 | % | | | 14.60 | % | | | 17.69 | % | | | 9.47 | % |
With Sales Charge** | | | | | 0.63 | | | | 8.59 | | | | 16.43 | | | | 8.88 | |
CLASS B SHARES | | April 30, 2001 | | | | | | | | | | | | | | | | |
Without CDSC | | | | | 5.88 | | | | 13.98 | | | | 17.08 | | | | 9.03 | |
With CDSC*** | | | | | 0.88 | | | | 8.98 | | | | 16.87 | | | | 9.03 | |
CLASS C SHARES | | April 30, 2001 | | | | | | | | | | | | | | | | |
Without CDSC | | | | | 5.92 | | | | 14.02 | | | | 17.09 | | | | 8.92 | |
With CDSC**** | | | | | 4.92 | | | | 13.02 | | | | 17.09 | | | | 8.92 | |
CLASS R2 SHARES | | November 3, 2008 | | | 6.03 | | | | 14.29 | | | | 17.38 | | | | 9.29 | |
INSTITUTIONAL CLASS SHARES | | November 13, 1997 | | | 6.45 | | | | 15.14 | | | | 18.26 | | | | 10.01 | |
SELECT CLASS SHARES | | October 31, 2001 | | | 6.30 | | | | 14.85 | | | | 17.98 | | | | 9.75 | |
| ** | | Sales Charge for Class A Shares is 5.25%. |
| *** | | Assumes a 5% CDSC (contingent deferred sales charge) for the one year period, 2% CDSC for the five year period and 0% CDSC thereafter. |
| **** | | Assumes a 1% CDSC for the one year period and 0% CDSC thereafter. |
TEN YEAR PERFORMANCE (12/31/04 TO 12/31/14)
The performance quoted is past performance and is not a guarantee of future results. Mutual funds are subject to certain market risks. Investment returns and principal value of an investment will fluctuate so that an investor’s shares, when redeemed, may be worth more or less than their original cost. Current performance may be higher or lower than the performance data shown. For up-to-date month-end performance information please call 1-800-480-4111.
Returns for Class R2 Shares prior to its inception date are based on the performance of Class A Shares. The actual returns of Class R2 Shares would have been lower than those shown because Class R2 Shares have higher expenses than Class A Shares.
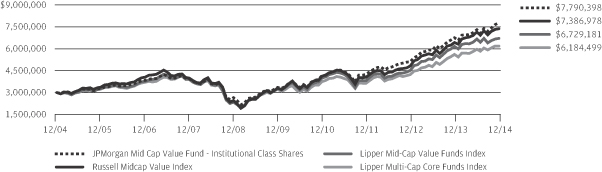
The graph illustrates comparative performance for $3,000,000 invested in Institutional Class Shares of the JPMorgan Mid Cap Value Fund, the Russell Midcap Value Index, the Lipper Mid-Cap Value Funds Index and the Lipper Multi-Cap Core Funds Index from December 31, 2004 to December 31, 2014. The performance of the Fund assumes reinvestment of all dividends and capital gain distributions, if any, and does not include a sales charge. The performance of the Russell Midcap Value Index does not reflect the deduction of expenses or a sales charge associated with a mutual fund and has been adjusted to reflect reinvestment of all dividends and capital gain distributions of the securities included in the benchmark, if applicable. The performance of the Lipper Mid-Cap Value Funds Index and the Lipper Multi-Cap Core Funds Index includes expenses associated with a mutual fund, such as investment management fees.
These expenses are not identical to the expenses incurred by the Fund. The Russell Midcap Value Index is an unmanaged index which measures the performance of those Russell Midcap companies with lower price-to-book ratios and lower forecasted growth values. The Lipper Mid-Cap Value Funds Index and the Lipper Multi-Cap Core Funds Index are indices based on total returns of certain mutual funds within the mid cap and multi cap fund categories, respectively, as determined by Lipper, Inc. Investors cannot invest directly in an index.
Institutional Class Shares have a $3,000,000 minimum initial investment.
Fund performance may reflect the waiver of the Fund’s fees and reimbursement of expenses for certain periods since the inception date. Without these waivers and reimbursements, performance would have been lower. Also, performance shown in this section does not reflect the deduction of taxes that a shareholder would pay on Fund distributions or redemption of Fund shares.
Because Class B Shares automatically convert to Class A Shares after 8 years, the 10 year average annual total return shown above for Class B reflects Class A performance for the period after conversion.
The returns shown are based on net asset values calculated for shareholder transactions and may differ from the returns shown in the financial highlights, which reflect adjustments made to the net asset values in accordance with accounting principles generally accepted in the United States of America.
| | | | | | | | |
| | | |
| DECEMBER 31, 2014 | | J.P. MORGAN MID CAP/MULTI-CAP FUNDS | | | | | 11 | |
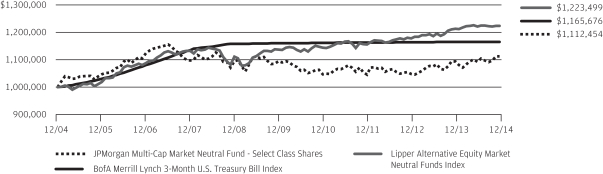
JPMorgan Multi-Cap Market Neutral Fund
FUND COMMENTARY
SIX MONTHS ENDED DECEMBER 31, 2014 (Unaudited)
| | | | |
| REPORTING PERIOD RETURN: | |
| Fund (Select Class Shares)* | | | 1.78% | |
| BofA Merrill Lynch 3-Month U.S. Treasury Bill Index | | | 0.01% | |
| |
| Net Assets as of 12/31/14 (In Thousands) | | $ | 321,008 | |
INVESTMENT OBJECTIVE**
The JPMorgan Multi-Cap Market Neutral Fund (the “Fund”) seeks long-term capital preservation and growth by using strategies designed to produce returns which have no correlation with general domestic market performance.
WHAT WERE THE MAIN DRIVERS OF THE FUND’S PERFORMANCE?
The Fund (Select Class Shares) outperformed the BofA Merrill Lynch 3-Month U.S. Treasury Bill Index (the “Benchmark”) for the six months ended December 31, 2014. The Fund’s security selection process produced positive returns in the information technology and health care sectors and negative returns in the energy and telecommunication services sectors.
Individual contributors to Fund returns included short positions in McDermott International Inc. and Transocean Ltd. and a long position in United Therapeutics Corp. Shares of both McDermott International and Transocean, both of which provide engineering and other services to the energy sector, declined amid investor concerns that falling global oil prices will hurt demand for their services. Shares of United Therapeutics, a drug maker, rose following a court ruling that blocked a competitor from selling a generic version of the company’s key hypertension drug.
Individual detractors from Fund returns included its long position in Patterson-UTI Energy Inc. and its short position in Norwegian Cruise Line Holdings Ltd. and Avago Technologies Ltd. Shares of Patterson-UTI, an owner/operator of oil drilling rigs, fell amid a decline in the global price of oil. Shares of Norwegian Cruise Lines, a cruise line operator, rose after the company raised its earnings forecast above analysts’ estimates. Shares of Avago, a Singapore maker of analog semiconductors, strengthened on revenue growth and increased demand for its radio frequency semiconductor chips as telecom operators upgraded their networks for so-called 4G smartphones.
HOW WAS THE FUND POSITIONED?
The Fund’s portfolio managers employed a bottom-up approach to stock selection, constructing a portfolio based on company fundamentals, quantitative screening and proprietary fundamental analysis. The Fund’s portfolio managers sought to identify dominant franchises with predictable business models deemed capable of achieving, in their view, sustained growth, as well as undervalued companies with the potential to grow their intrinsic value per share. Companies that ranked lowest in the above factors were selected by the Fund’s portfolio managers for possible short sales.
| | | | | | | | |
| TOP TEN LONG POSITIONS OF THE PORTFOLIO*** | |
| | 1. | | | Express Scripts Holding Co. | | | 1.2 | % |
| | 2. | | | RLJ Lodging Trust | | | 1.1 | |
| | 3. | | | Western Digital Corp. | | | 1.1 | |
| | 4. | | | Sealed Air Corp. | | | 1.1 | |
| | 5. | | | Stryker Corp. | | | 1.1 | |
| | 6. | | | Kroger Co. (The) | | | 1.1 | |
| | 7. | | | AT&T, Inc. | | | 1.1 | |
| | 8. | | | Pilgrim’s Pride Corp. | | | 1.1 | |
| | 9. | | | Restaurant Brands International, Inc. | | | 1.1 | |
| | 10. | | | Hewlett-Packard Co. | | | 1.1 | |
| | | | | | | | |
| TOP TEN SHORT POSITIONS OF THE PORTFOLIO**** | |
| | 1. | | | CarMax, Inc. | | | 1.2 | % |
| | 2. | | | Praxair, Inc. | | | 1.2 | |
| | 3. | | | Dominion Resources, Inc. | | | 1.2 | |
| | 4. | | | LinkedIn Corp., Class A | | | 1.2 | |
| | 5. | | | Estee Lauder Cos., Inc. (The), Class A | | | 1.2 | |
| | 6. | | | Hain Celestial Group, Inc. (The) | | | 1.1 | |
| | 7. | | | Charter Communications, Inc., Class A | | | 1.1 | |
| | 8. | | | McCormick & Co., Inc. (Non-Voting) | | | 1.1 | |
| | 9. | | | Panera Bread Co., Class A | | | 1.1 | |
| | 10. | | | CoStar Group, Inc. | | | 1.1 | |
| | | | | | |
| | | |
| 12 | | | | J.P. MORGAN MID CAP/MULTI-CAP FUNDS | | DECEMBER 31, 2014 |
| | | | |
LONG POSITION PORTFOLIO COMPOSITION BY SECTOR*** | |
| Information Technology | | | 25.6 | % |
| Consumer Discretionary | | | 16.3 | |
| Industrials | | | 14.0 | |
| Health Care | | | 12.3 | |
| Consumer Staples | | | 7.3 | |
| Financials | | | 4.8 | |
| Materials | | | 4.1 | |
| Utilities | | | 3.5 | |
| Energy | | | 3.0 | |
| Telecommunication Services | | | 2.8 | |
| Short-Term Investment | | | 6.3 | |
| | | | |
SHORT POSITION PORTFOLIO COMPOSITION BY SECTOR**** | |
| Information Technology | | | 24.0 | % |
| Industrials | | | 18.5 | |
| Consumer Discretionary | | | 17.8 | |
| Health Care | | | 12.0 | |
| Consumer Staples | | | 8.3 | |
| Financials | | | 5.5 | |
| Energy | | | 4.9 | |
| Materials | | | 4.2 | |
| Utilities | | | 3.3 | |
| Telecommunication Services | | | 1.5 | |
| * | | The return shown is based on net asset values calculated for shareholder transactions and may differ from the return shown in the financial highlights, which reflects adjustments made to the net asset values in accordance with accounting principles generally accepted in the United States of America. |
| ** | | The adviser seeks to achieve the Fund’s objective. There can be no guarantee it will be achieved. |
| *** | | Percentages indicated are based on total long investments as of December 31, 2014. The Fund’s portfolio composition is subject to change. |
| **** | | Percentages indicated are based on total short investments as of December 31, 2014. The Fund’s portfolio composition is subject to change. |
| | | | | | | | |
| | | |
| DECEMBER 31, 2014 | | J.P. MORGAN MID CAP/MULTI-CAP FUNDS | | | | | 13 | |
JPMorgan Multi-Cap Market Neutral Fund
FUND COMMENTARY
SIX MONTHS ENDED DECEMBER 31, 2014 (Unaudited) (continued)
| | | | | | | | | | | | | | | | | | | | |
AVERAGE ANNUAL TOTAL RETURNS AS OF DECEMBER 31, 2014 | |
| | | | | |
| | | INCEPTION DATE
OF CLASS | | | 6 MONTH* | | | 1 YEAR | | | 5 YEAR | | | 10 YEAR | |
CLASS A SHARES | | | May 23, 2003 | | | | | | | | | | | | | | | | | |
Without Sales Charge | | | | | | | 1.61 | % | | | 1.41 | % | | | 0.06 | % | | | 0.82 | % |
With Sales Charge** | | | | | | | (3.73 | ) | | | (3.91 | ) | | | (1.02 | ) | | | 0.28 | |
CLASS B SHARES | | | May 23, 2003 | | | | | | | | | | | | | | | | | |
Without CDSC | | | | | | | 1.38 | | | | 0.95 | | | | (0.58 | ) | | | 0.22 | |
With CDSC*** | | | | | | | (3.62 | ) | | | (4.05 | ) | | | (0.99 | ) | | | 0.22 | |
CLASS C SHARES | | | May 23, 2003 | | | | | | | | | | | | | | | | | |
Without CDSC | | | | | | | 1.38 | | | | 0.95 | | | | (0.58 | ) | | | 0.12 | |
With CDSC**** | | | | | | | 0.38 | | | | (0.05 | ) | | | (0.58 | ) | | | 0.12 | |
SELECT CLASS SHARES | | | May 23, 2003 | | | | 1.78 | | | | 1.68 | | | | 0.31 | | | | 1.07 | |
| ** | | Sales Charge for Class A Shares is 5.25%. |
| *** | | Assumes a 5% CDSC (contingent deferred sales charge) for the one year period, 2% CDSC for the five year period and 0% CDSC thereafter. |
| **** | | Assumes a 1% CDSC for the one year period and 0% CDSC thereafter. |
TEN YEAR PERFORMANCE (12/31/04 TO 12/31/14)
The performance quoted is past performance and is not a guarantee of future results. Mutual funds are subject to certain market risks. Investment returns and principal value of an investment will fluctuate so that an investor’s shares, when redeemed, may be worth more or less than their original cost. Current performance may be higher or lower than the performance data shown. For up-to-date month-end performance information please call 1-800-480-4111.
The graph illustrates comparative performance for $1,000,000 invested in Select Class Shares of the JPMorgan Multi-Cap Market Neutral Fund, the BofA Merrill Lynch 3-Month U.S. Treasury Bill Index and the Lipper Alternative Equity Market Neutral Funds Index from December 31, 2004 to December 31, 2014. The performance of the Fund assumes reinvestment of all dividends and capital gain distributions, if any, and does not include a sales charge. The performance of the indices reflects an initial investment at the end of the month following the Fund’s inception. The performance of the BofA Merrill Lynch 3-Month U.S. Treasury Bill Index does not reflect the deduction of expenses or a sales charge associated with a mutual fund and has been adjusted to reflect reinvestment of all dividends and capital gain distributions of the securities included in the benchmark, if applicable. The performance of the Lipper Alternative Equity Market Neutral Funds Index includes expenses associated with a mutual fund, such as investment management fees. These expenses are not identical to the expenses incurred by the Fund. The BofA Merrill Lynch 3-Month U.S. Treasury Bill Index is
comprised of a single issue purchased at the beginning of the month and held for a full month. Each month the index is rebalanced and the issue selected is the outstanding Treasury Bill that matures closest to, but not beyond, 3 months from the rebalancing date. The Lipper Alternative Equity Market Neutral Funds Index is an index based on total returns of certain mutual funds within the Fund’s designated category as determined by Lipper, Inc. Investors cannot invest directly in an index.
Select Class Shares have a $1,000,000 minimum initial investment.
Fund performance may reflect the waiver of the Fund’s fees and reimbursement of expenses for certain periods since the inception date. Without these waivers and reimbursements, performance would have been lower. Also, performance shown in this section does not reflect the deduction of taxes that a shareholder would pay on Fund distributions or redemption of Fund shares.
Because the Class B Shares automatically convert to Class A Shares after eight years, the since inception average annual total return shown above for Class B reflects Class A performance for the period after conversion.
The returns shown are based on net asset values calculated for shareholder transactions and may differ from the returns shown in the financial highlights, which reflect adjustments made to the net asset values in accordance with accounting principles generally accepted in the United States of America.
| | | | | | |
| | | |
| 14 | | | | J.P. MORGAN MID CAP/MULTI-CAP FUNDS | | DECEMBER 31, 2014 |
JPMorgan Value Advantage Fund
FUND COMMENTARY
SIX MONTHS ENDED DECEMBER 31, 2014 (Unaudited)
| | | | |
| REPORTING PERIOD RETURN: | |
| Fund (Institutional Class Shares)* | | | 5.48% | |
| Russell 3000 Value Index | | | 4.39% | |
| |
| Net Assets as of 12/31/2014 (In Thousands) | | $ | 9,854,695 | |
INVESTMENT OBJECTIVE**
The JPMorgan Value Advantage Fund (the “Fund”) seeks to provide long-term total return from a combination of income and capital gains.
WHAT WERE THE MAIN DRIVERS OF THE FUND’S PERFORMANCE?
The Fund (Institutional Class Shares) outperformed the Russell 3000 Value Index (the “Benchmark”) for the six months ended December 31, 2014. The Fund’s security selection and underweight position in the energy sector and its security selection in the consumer discretionary sector were leading contributors to performance relative to the Benchmark, while the Fund’s security selection in the financials sector and its security selection and underweight position in the health care sector were leading detractors from relative performance.
Leading individual contributors to relative performance included its underweight position in Chevron Corp. and its overweight positions in Bed Bath & Beyond and Home Depot Inc. Shares of Chevron, an integrated energy producer not held in the Fund, declined sharply along with the global price of oil. Shares of Bed Bath & Beyond, an operator of retail chains, rose on better-than-expected quarterly revenue and healthy earnings. Shares of Home Depot, a home improvement retail chain not held in the Benchmark, strengthened on better than expected quarterly sales.
Leading individual detractors from relative performance included The Fund’s overweight positions in Southwestern Energy Co. and Dover Corp and its underweight position in Berkshire Hathaway Inc. Shares of Southwestern Energy, an independent oil and natural gas exploration and production company not held in the Benchmark, fell after the company lowered its forecast of cash flow amid falling global oil prices. Shares of Dover, a manufacturer of pumps and compressors, declined on a lower forecast for quarterly earnings. Shares of Berkshire Hathaway, a financial holding company not held by the Fund, rose on the strength of the company’s core insurance and freight rail businesses.
HOW WAS THE FUND POSITIONED?
The Fund’s portfolio managers utilized a bottom-up approach to stock selection and sought to identify durable franchises possessing the ability to generate, in the portfolio managers’ view, significant levels of free cash flow. The Fund’s largest
overweight position continued to be in the consumer discretionary sector, where the Fund’s portfolio managers found what they believed to be compelling investment opportunities. The Fund’s largest underweight position was in the energy sector. In addition, the Fund’s relative performance was hindered by above-average cash holdings. The cash position accrued because the Fund’s portfolio managers believed valuations were stretched and did not want to invest in overvalued securities.
| | | | | | | | |
| TOP TEN EQUITY HOLDINGS OF THE PORTFOLIO*** | |
| | 1. | | | Wells Fargo & Co. | | | 3.3 | % |
| | 2. | | | Exxon Mobil Corp. | | | 2.6 | |
| | 3. | | | Pfizer, Inc. | | | 2.1 | |
| | 4. | | | Johnson & Johnson | | | 2.0 | |
| | 5. | | | Loews Corp. | | | 1.8 | |
| | 6. | | | Bank of America Corp. | | | 1.7 | |
| | 7. | | | DISH Network Corp., Class A | | | 1.6 | |
| | 8. | | | Capital One Financial Corp. | | | 1.6 | |
| | 9. | | | Merck & Co., Inc. | | | 1.6 | |
| | 10. | | | Kohl’s Corp. | | | 1.5 | |
| | | | |
PORTFOLIO COMPOSITION BY SECTOR*** | |
| Financials | | | 32.2 | % |
| Consumer Discretionary | | | 14.9 | |
| Health Care | | | 8.6 | |
| Industrials | | | 8.3 | |
| Energy | | | 7.1 | |
| Utilities | | | 5.8 | |
| Information Technology | | | 5.5 | |
| Consumer Staples | | | 4.8 | |
| Materials | | | 3.6 | |
| Telecommunication Services | | | 1.1 | |
| Short-Term Investment | | | 8.1 | |
| * | | The return shown is based on net asset values calculated for shareholder transactions and may differ from the return shown in the financial highlights, which reflects adjustments made to the net asset values in accordance with accounting principles generally accepted in the United States of America. |
| ** | | The adviser seeks to achieve the Fund’s objective. There can be no guarantee it will be achieved. |
| *** | | Percentages indicated are based on total investments as of December 31, 2014. The Fund’s portfolio composition is subject to change. |
| | | | | | | | |
| | | |
| DECEMBER 31, 2014 | | J.P. MORGAN MID CAP/MULTI-CAP FUNDS | | | | | 15 | |
JPMorgan Value Advantage Fund
FUND COMMENTARY
SIX MONTHS ENDED DECEMBER 31, 2014 (Unaudited) (continued)
| | | | | | | | | | | | | | | | | | | | |
AVERAGE ANNUAL TOTAL RETURNS AS OF DECEMBER 31, 2014 | |
| | | | | |
| | | INCEPTION DATE
OF CLASS | | | 6 MONTH* | | | 1 YEAR | | | 5 YEAR | | | SINCE
INCEPTION | |
CLASS A SHARES | | | February 28, 2005 | | | | | | | | | | | | | | | | | |
Without Sales Charge | | | | | | | 5.18 | % | | | 13.30 | % | | | 16.48 | % | | | 9.80 | % |
With Sales Charge** | | | | | | | (0.36 | ) | | | 7.35 | | | | 15.23 | | | | 9.20 | |
CLASS C SHARES | | | February 28, 2005 | | | | | | | | | | | | | | | | | |
Without CDSC | | | | | | | 4.91 | | | | 12.70 | | | | 15.90 | | | | 9.26 | |
With CDSC*** | | | | | | | 3.91 | | | | 11.70 | | | | 15.90 | | | | 9.26 | |
INSTITUTIONAL CLASS SHARES | | | February 28, 2005 | | | | 5.48 | | | | 13.87 | | | | 17.05 | | | | 10.30 | |
SELECT CLASS SHARES | | | February 28, 2005 | | | | 5.31 | | | | 13.57 | | | | 16.77 | | | | 10.08 | |
| ** | | Sales Charge for Class A Shares is 5.25%. |
| *** | | Assumes a 1% CDSC (contingent deferred sales charge) for the one year period and 0% CDSC thereafter. |
LIFE OF FUND PERFORMANCE (2/28/05 TO 12/31/14)
The performance quoted is past performance and is not a guarantee of future results. Mutual funds are subject to certain market risks. Investment returns and principal value of an investment will fluctuate so that an investor’s shares, when redeemed, may be worth more or less than their original cost. Current performance may be higher or lower than the performance data shown. For up-to-date month-end performance information please call 1-800-480-4111.
The Fund commenced operations on February 28, 2005.
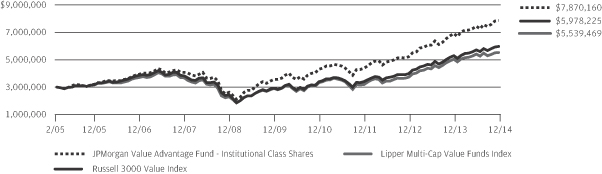
The graph illustrates comparative performance for $3,000,000 invested in Institutional Class Shares of the JPMorgan Value Advantage Fund, the Russell 3000 Value Index and the Lipper Multi-Cap Value Funds Index from February 28, 2005 to December 31, 2014. The performance of the Fund assumes reinvestment of all dividends and capital gain distributions, if any, and does not include a sales charge. The performance of the Russell 3000 Value Index does not reflect the deduction of expenses or a sales charge associated with a mutual fund and has been adjusted to reflect reinvestment of all dividends and capital gain distributions of the securities included in the benchmark, if applicable. The performance of the Lipper Multi-Cap Value Funds Index includes expenses associated with a mutual fund, such as investment
management fees. These expenses are not identical to the expenses incurred by the Fund. The Russell 3000 Value Index is an unmanaged index which measures the performance of those Russell 3000 companies (largest 3000 U.S. companies) with lower price-to-book ratios and lower forecasted growth values. The Lipper Multi-Cap Value Funds Index is an index based on total returns of certain mutual funds within the Fund’s designated category as determined by Lipper, Inc. Investors cannot invest directly in an index.
Institutional Class Shares have a $3,000,000 minimum initial investment.
Fund performance may reflect the waiver of the Fund’s fees and reimbursement of expenses for certain periods since the inception date. Without these waivers and reimbursements, performance would have been lower. Also, performance shown in this section does not reflect the deduction of taxes that a shareholder would pay on Fund distributions or redemption of Fund shares.
The returns shown are based on net asset values calculated for shareholder transactions and may differ from the returns shown in the financial highlights, which reflect adjustments made to the net asset values in accordance with accounting principles generally accepted in the United States of America.
| | | | | | |
| | | |
| 16 | | | | J.P. MORGAN MID CAP/MULTI-CAP FUNDS | | DECEMBER 31, 2014 |
JPMorgan Growth Advantage Fund
SCHEDULE OF PORTFOLIO INVESTMENTS
AS OF DECEMBER 31, 2014 (Unaudited)
(Amounts in thousands)
| | | | | | | | |
| SHARES | | | SECURITY DESCRIPTION | | VALUE($) | |
| | | | | | | | |
| Common Stocks — 96.5% | | | | |
| | | | Consumer Discretionary — 17.7% | | | | |
| | | | Auto Components — 0.9% | | | | |
| | 671 | | | BorgWarner, Inc. | | | 36,882 | |
| | | | | | | | |
| | | | Automobiles — 2.0% | |
| | 590 | | | Harley-Davidson, Inc. | | | 38,887 | |
| | 195 | | | Tesla Motors, Inc. (a) | | | 43,281 | |
| | | | | | | | |
| | | | | | | 82,168 | |
| | | | | | | | |
| | | | Hotels, Restaurants & Leisure — 2.2% | |
| | 1,717 | | | Hilton Worldwide Holdings, Inc. (a) | | | 44,786 | |
| | 576 | | | Starbucks Corp. | | | 47,277 | |
| | | | | | | | |
| | | | | | | 92,063 | |
| | | | | | | | |
| | | | Household Durables — 0.9% | |
| | 229 | | | Mohawk Industries, Inc. (a) | | | 35,624 | |
| | | | | | | | |
| | | | Internet & Catalog Retail — 3.5% | |
| | 163 | | | Amazon.com, Inc. (a) | | | 50,680 | |
| | 111 | | | Netflix, Inc. (a) | | | 37,782 | |
| | 51 | | | Priceline Group, Inc. (The) (a) | | | 58,151 | |
| | | | | | | | |
| | | | | | | 146,613 | |
| | | | | | | | |
| | | | Specialty Retail — 6.1% | |
| | 204 | | | Advance Auto Parts, Inc. | | | 32,557 | |
| | 963 | | | GameStop Corp., Class A | | | 32,553 | |
| | 795 | | | Home Depot, Inc. (The) | | | 83,472 | |
| | 475 | | | Ulta Salon Cosmetics & Fragrance, Inc. (a) | | | 60,775 | |
| | 1,339 | | | Urban Outfitters, Inc. (a) | | | 47,036 | |
| | | | | | | | |
| | | | | | | 256,393 | |
| | | | | | | | |
| | | | Textiles, Apparel & Luxury Goods — 2.1% | |
| | 804 | | | Michael Kors Holdings Ltd., (Hong Kong) (a) | | | 60,395 | |
| | 946 | | | Wolverine World Wide, Inc. | | | 27,888 | |
| | | | | | | | |
| | | | | | | 88,283 | |
| | | | | | | | |
| | | | Total Consumer Discretionary | | | 738,026 | |
| | | | | | | | |
| | | | Consumer Staples — 1.2% | |
| | | | Food & Staples Retailing — 1.2% | |
| | 1,423 | | | Sprouts Farmers Market, Inc. (a) | | | 48,364 | |
| | | | | | | | |
| | | | Energy — 3.6% | |
| | | | Energy Equipment & Services — 1.5% | |
| | 260 | | | Dril-Quip, Inc. (a) | | | 19,965 | |
| | 520 | | | Schlumberger Ltd. (m) | | | 44,448 | |
| | | | | | | | |
| | | | | | | 64,413 | |
| | | | | | | | |
| | | | Oil, Gas & Consumable Fuels — 2.1% | |
| | 486 | | | Antero Resources Corp. (a) | | | 19,734 | |
| | 324 | | | Concho Resources, Inc. (a) | | | 32,309 | |
| | | | | | | | |
| SHARES | | | SECURITY DESCRIPTION | | VALUE($) | |
| | | | | | | | |
| | | | | | | | |
| | | | Oil, Gas & Consumable Fuels — continued | |
| | 494 | | | Phillips 66 | | | 35,441 | |
| | | | | | | | |
| | | | | | | 87,484 | |
| | | | | | | | |
| | | | Total Energy | | | 151,897 | |
| | | | | | | | |
| | | | Financials — 9.0% | |
| | | | Banks — 1.8% | |
| | 872 | | | East West Bancorp, Inc. | | | 33,759 | |
| | 336 | | | Signature Bank (a) | | | 42,348 | |
| | | | | | | | |
| | | | | | | 76,107 | |
| | | | | | | | |
| | | | Capital Markets — 3.8% | |
| | 332 | | | Affiliated Managers Group, Inc. (a) | | | 70,485 | |
| | 750 | | | Lazard Ltd., (Bermuda), Class A | | | 37,497 | |
| | 1,368 | | | TD Ameritrade Holding Corp. | | | 48,933 | |
| | | | | | | | |
| | | | | | | 156,915 | |
| | | | | | | | |
| | | | Diversified Financial Services — 0.9% | |
| | 389 | | | Moody’s Corp. | | | 37,308 | |
| | | | | | | | |
| | | | Insurance — 0.5% | |
| | 381 | | | AmTrust Financial Services, Inc. | | | 21,416 | |
| | | | | | | | |
| | | | Real Estate Management & Development — 2.0% | |
| | 2,389 | | | CBRE Group, Inc., Class A (a) | | | 81,834 | |
| | | | | | | | |
| | | | Total Financials | | | 373,580 | |
| | | | | | | | |
| | | | Health Care — 18.1% | |
| | | | Biotechnology — 10.0% | |
| | 235 | | | Alexion Pharmaceuticals, Inc. (a) | | | 43,464 | |
| | 181 | | | Biogen Idec, Inc. (a) | | | 61,542 | |
| | 671 | | | Celgene Corp. (a) | | | 75,092 | |
| | 1,502 | | | Gilead Sciences, Inc. (a) | | | 141,578 | |
| | 149 | | | Regeneron Pharmaceuticals, Inc. (a) | | | 61,127 | |
| | 287 | | | Vertex Pharmaceuticals, Inc. (a) | | | 34,096 | |
| | | | | | | | |
| | | | | | | 416,899 | |
| | | | | | | | |
| | | | Health Care Equipment & Supplies — 0.6% | |
| | 1,566 | | | Novadaq Technologies, Inc., (Canada) (a) | | | 26,032 | |
| | | | | | | | |
| | | | Health Care Providers & Services — 2.6% | |
| | 750 | | | Acadia Healthcare Co., Inc. (a) | | | 45,901 | |
| | 608 | | | UnitedHealth Group, Inc. | | | 61,412 | |
| | | | | | | | |
| | | | | | | 107,313 | |
| | | | | | | | |
| | | | Health Care Technology — 0.6% | |
| | 924 | | | Veeva Systems, Inc., Class A (a) | | | 24,398 | |
| | | | | | | | |
| | | | Life Sciences Tools & Services — 2.2% | |
| | 759 | | | Fluidigm Corp. (a) | | | 25,584 | |
| | 360 | | | Illumina, Inc. (a) | | | 66,357 | |
| | | | | | | | |
| | | | | | | 91,941 | |
| | | | | | | | |
SEE NOTES TO FINANCIAL STATEMENTS.
| | | | | | | | |
| | | |
| DECEMBER 31, 2014 | | J.P. MORGAN MID CAP/MULTI-CAP FUNDS | | | | | 17 | |
JPMorgan Growth Advantage Fund
SCHEDULE OF PORTFOLIO INVESTMENTS
AS OF DECEMBER 31, 2014 (Unaudited) (continued)
(Amounts in thousands)
| | | | | | | | |
| SHARES | | | SECURITY DESCRIPTION | | VALUE($) | |
| | | | | | | | |
| Common Stocks — continued | | | | |
| | | | Pharmaceuticals — 2.1% | |
| | 1,552 | | | Nektar Therapeutics (a) | | | 24,059 | |
| | 451 | | | Valeant Pharmaceuticals International, Inc. (a) | | | 64,571 | |
| | | | | | | | |
| | | | | | | 88,630 | |
| | | | | | | | |
| | | | Total Health Care | | | 755,213 | |
| | | | | | | | |
| | | | Industrials — 13.4% | |
| | | | Airlines — 1.3% | |
| | 1,107 | | | Delta Air Lines, Inc. | | | 54,468 | |
| | | | | | | | |
| | | | Building Products — 2.2% | |
| | 1,264 | | | Fortune Brands Home & Security, Inc. | | | 57,203 | |
| | 768 | | | Trex Co., Inc. (a) | | | 32,706 | |
| | | | | | | | |
| | | | | | | 89,909 | |
| | | | | | | | |
| | | | Electrical Equipment — 2.4% | |
| | 715 | | | Acuity Brands, Inc. | | | 100,122 | |
| | | | | | | | |
| | | | Industrial Conglomerates — 1.5% | |
| | 694 | | | Carlisle Cos., Inc. | | | 62,636 | |
| | | | | | | | |
| | | | Machinery — 1.5% | |
| | 605 | | | Pall Corp. | | | 61,232 | |
| | | | | | | | |
| | | | Marine — 0.7% | |
| | 344 | | | Kirby Corp. (a) | | | 27,783 | |
| | | | | | | | |
| | | | Road & Rail — 1.9% | |
| | 149 | | | Canadian Pacific Railway Ltd., (Canada) | | | 28,740 | |
| | 677 | | | Old Dominion Freight Line, Inc. (a) | | | 52,527 | |
| | | | | | | | |
| | | | | | | 81,267 | |
| | | | | | | | |
| | | | Trading Companies & Distributors — 1.9% | |
| | 2,098 | | | HD Supply Holdings, Inc. (a) | | | 61,855 | |
| | 565 | | | Rush Enterprises, Inc., Class A (a) | | | 18,108 | |
| | | | | | | | |
| | | | | | | 79,963 | |
| | | | | | | | |
| | | | Total Industrials | | | 557,380 | |
| | | | | | | | |
| | | | Information Technology — 28.9% | |
| | | | Communications Equipment — 1.5% | |
| | 1,511 | | | Ciena Corp. (a) | | | 29,327 | |
| | 266 | | | Palo Alto Networks, Inc. (a) | | | 32,640 | |
| | | | | | | | |
| | | | | | | 61,967 | |
| | | | | | | | |
| | | | Electronic Equipment, Instruments & Components — 1.1% | |
| | 838 | | | Amphenol Corp., Class A | | | 45,087 | |
| | | | | | | | |
| | | | Internet Software & Services — 9.1% | |
| | 214 | | | CoStar Group, Inc. (a) | | | 39,260 | |
| | 1,024 | | | Dealertrack Technologies, Inc. (a) | | | 45,391 | |
| | 2,092 | | | Facebook, Inc., Class A (a) | | | 163,249 | |
| | 247 | | | Google, Inc., Class C (a) | | | 130,232 | |
| | | | | | | | |
| | | | | | | 378,132 | |
| | | | | | | | |
| | | | | | | | |
| SHARES | | | SECURITY DESCRIPTION | | VALUE($) | |
| | | | | | | | |
| | | | | | | | |
| | | | IT Services — 3.8% | |
| | 221 | | | Alliance Data Systems Corp. (a) | | | 63,274 | |
| | 1,090 | | | MasterCard, Inc., Class A | | | 93,880 | |
| | | | | | | | |
| | | | | | | 157,154 | |
| | | | | | | | |
| | | | Semiconductors & Semiconductor Equipment — 3.9% | |
| | 458 | | | Avago Technologies Ltd., (Singapore) | | | 46,090 | |
| | 733 | | | Lam Research Corp. | | | 58,117 | |
| | 780 | | | NXP Semiconductors N.V., (Netherlands) (a) | | | 59,615 | |
| | | | | | | | |
| | | | | | | 163,822 | |
| | | | | | | | |
| | | | Software — 5.6% | |
| | 652 | | | Adobe Systems, Inc. (a) | | | 47,364 | |
| | 939 | | | Electronic Arts, Inc. (a) | | | 44,128 | |
| | 643 | | | Guidewire Software, Inc. (a) | | | 32,560 | |
| | 1,331 | | | Microsoft Corp. | | | 61,844 | |
| | 403 | | | ServiceNow, Inc. (a) | | | 27,310 | |
| | 267 | | | Workday, Inc., Class A (a) | | | 21,749 | |
| | | | | | | | |
| | | | | | | 234,955 | |
| | | | | | | | |
| | | | Technology Hardware, Storage & Peripherals — 3.9% | |
| | 1,498 | | | Apple, Inc. (m) | | | 165,310 | |
| | | | | | | | |
| | | | Total Information Technology | | | 1,206,427 | |
| | | | | | | | |
| | | | Materials — 4.6% | |
| | | | Chemicals — 3.9% | |
| | 245 | | | Air Products & Chemicals, Inc. (m) | | | 35,293 | |
| | 294 | | | PPG Industries, Inc. (m) | | | 68,004 | |
| | 216 | | | Sherwin-Williams Co. (The) | | | 56,791 | |
| | | | | | | | |
| | | | | | | 160,088 | |
| | | | | | | | |
| | | | Construction Materials — 0.7% | |
| | 399 | | | Eagle Materials, Inc. | | | 30,305 | |
| | | | | | | | |
| | | | Total Materials | | | 190,393 | |
| | | | | | | | |
| | | | Total Common Stocks
(Cost $2,922,439) | | | 4,021,280 | |
| | | | | | | | |
| Short-Term Investment — 3.4% | |
| | | | Investment Company — 3.4% | |
| | 141,289 | | | JPMorgan Prime Money Market Fund, Institutional Class Shares, 0.020% (b) (l) (m)
(Cost $141,289) | | | 141,289 | |
| | | | | | | | |
| | | | Total Investments — 99.9%
(Cost $3,063,728) | | | 4,162,569 | |
| | | | Other Assets in Excess of Liabilities — 0.1% | | | 5,867 | |
| | | | | | | | |
| | | | NET ASSETS — 100.0% | | $ | 4,168,436 | |
| | | | | | | | |
Percentages indicated are based on net assets.
SEE NOTES TO FINANCIAL STATEMENTS.
| | | | | | |
| | | |
| 18 | | | | J.P. MORGAN MID CAP/MULTI-CAP FUNDS | | DECEMBER 31, 2014 |
JPMorgan Mid Cap Equity Fund
SCHEDULE OF PORTFOLIO INVESTMENTS
AS OF DECEMBER 31, 2014 (Unaudited)
(Amounts in thousands)
| | | | | | | | |
| SHARES | | | SECURITY DESCRIPTION | | VALUE($) | |
| | | | | | | | |
| Common Stocks — 96.7% | |
| | | | Consumer Discretionary — 19.0% | |
| | | | Auto Components — 0.6% | |
| | 324 | | | BorgWarner, Inc. | | | 17,826 | |
| | | | | | | | |
| | | | Automobiles — 1.3% | |
| | 272 | | | Harley-Davidson, Inc. | | | 17,910 | |
| | 97 | | | Tesla Motors, Inc. (a) | | | 21,463 | |
| | | | | | | | |
| | | | | | | 39,373 | |
| | | | | | | | |
| | | | Hotels, Restaurants & Leisure — 2.5% | |
| | 19 | | | Chipotle Mexican Grill, Inc. (a) | | | 13,006 | |
| | 624 | | | Hilton Worldwide Holdings, Inc. (a) | | | 16,272 | |
| | 84 | | | Marriott International, Inc., Class A | | | 6,590 | |
| | 307 | | | Norwegian Cruise Line Holdings Ltd. (a) | | | 14,345 | |
| | 78 | | | Panera Bread Co., Class A (a) | | | 13,547 | |
| | 174 | | | Starwood Hotels & Resorts Worldwide, Inc. | | | 14,097 | |
| | | | | | | | |
| | | | | | | 77,857 | |
| | | | | | | | |
| | | | Household Durables — 2.1% | |
| | 374 | | | Jarden Corp. (a) | | | 17,910 | |
| | 216 | | | Mohawk Industries, Inc. (a) | | | 33,510 | |
| | 347 | | | Toll Brothers, Inc. (a) | | | 11,882 | |
| | | | | | | | |
| | | | | | | 63,302 | |
| | | | | | | | |
| | | | Internet & Catalog Retail — 1.7% | |
| | 293 | | | Expedia, Inc. | | | 24,972 | |
| | 60 | | | Netflix, Inc. (a) | | | 20,360 | |
| | 94 | | | TripAdvisor, Inc. (a) | | | 7,003 | |
| | | | | | | | |
| | | | | | | 52,335 | |
| | | | | | | | |
| | | | Media — 1.5% | |
| | 143 | | | CBS Corp. (Non-Voting), Class B (m) | | | 7,911 | |
| | 336 | | | Clear Channel Outdoor Holdings, Inc., Class A | | | 3,564 | |
| | 224 | | | DISH Network Corp., Class A (a) | | | 16,291 | |
| | 389 | | | Gannett Co., Inc. (m) | | | 12,430 | |
| | 286 | | | Time, Inc. | | | 7,036 | |
| | | | | | | | |
| | | | | | | 47,232 | |
| | | | | | | | |
| | | | Multiline Retail — 1.5% | |
| | 210 | | | Big Lots, Inc. | | | 8,384 | |
| | 413 | | | Kohl’s Corp. | | | 25,238 | |
| | 151 | | | Nordstrom, Inc. | | | 12,025 | |
| | | | | | | | |
| | | | | | | 45,647 | |
| | | | | | | | |
| | | | Specialty Retail — 5.8% | |
| | 108 | | | Advance Auto Parts, Inc. | | | 17,266 | |
| | 26 | | | AutoZone, Inc. (a) | | | 16,048 | |
| | 161 | | | Bed Bath & Beyond, Inc. (a) | | | 12,285 | |
| | 373 | | | Best Buy Co., Inc. | | | 14,527 | |
| | 346 | | | GameStop Corp., Class A | | | 11,685 | |
| | | | | | | | |
| SHARES | | | SECURITY DESCRIPTION | | VALUE($) | |
| | | | | | | | |
| | | | | | | | |
| | | | Specialty Retail — continued | |
| | 571 | | | Gap, Inc. (The) | | | 24,057 | |
| | 240 | | | GNC Holdings, Inc., Class A | | | 11,266 | |
| | 145 | | | Tiffany & Co. | | | 15,461 | |
| | 201 | | | Ulta Salon Cosmetics & Fragrance, Inc. (a) | | | 25,696 | |
| | 519 | | | Urban Outfitters, Inc. (a) | | | 18,216 | |
| | 146 | | | Williams-Sonoma, Inc. | | | 11,070 | |
| | | | | | | | |
| | | | | | | 177,577 | |
| | | | | | | | |
| | | | Textiles, Apparel & Luxury Goods — 2.0% | |
| | 357 | | | Michael Kors Holdings Ltd., (Hong Kong) (a) | | | 26,841 | |
| | 104 | | | PVH Corp. | | | 13,388 | |
| | 79 | | | Ralph Lauren Corp. | | | 14,581 | |
| | 95 | | | V.F. Corp. | | | 7,107 | |
| | | | | | | | |
| | | | | | | 61,917 | |
| | | | | | | | |
| | | | Total Consumer Discretionary | | | 583,066 | |
| | | | | | | | |
| | | | Consumer Staples — 4.0% | |
| | | | Beverages — 1.4% | |
| | 122 | | | Constellation Brands, Inc., Class A (a) | | | 11,961 | |
| | 171 | | | Dr. Pepper Snapple Group, Inc. | | | 12,272 | |
| | 187 | | | Monster Beverage Corp. (a) | | | 20,218 | |
| | | | | | | | |
| | | | | | | 44,451 | |
| | | | | | | | |
| | | | Food & Staples Retailing — 1.7% | |
| | 322 | | | Kroger Co. (The) | | | 20,698 | |
| | 1,838 | | | Rite Aid Corp. (a) | | | 13,822 | |
| | 515 | | | Sprouts Farmers Market, Inc. (a) | | | 17,507 | |
| | | | | | | | |
| | | | | | | 52,027 | |
| | | | | | | | |
| | | | Food Products — 0.5% | |
| | 138 | | | Hershey Co. (The) (m) | | | 14,326 | |
| | | | | | | | |
| | | | Household Products — 0.4% | |
| | 105 | | | Energizer Holdings, Inc. | | | 13,499 | |
| | | | | | | | |
| | | | Total Consumer Staples | | | 124,303 | |
| | | | | | | | |
| | | | Energy — 4.0% | |
| | | | Energy Equipment & Services — 0.3% | |
| | 122 | | | Dril-Quip, Inc. (a) | | | 9,361 | |
| | | | | | | | |
| | | | Oil, Gas & Consumable Fuels — 3.7% | |
| | 174 | | | Antero Resources Corp. (a) | | | 7,077 | |
| | 181 | | | Concho Resources, Inc. (a) | | | 18,075 | |
| | 307 | | | Energen Corp. | | | 19,588 | |
| | 124 | | | EQT Corp. | | | 9,386 | |
| | 523 | | | Laredo Petroleum, Inc. (a) | | | 5,413 | |
| | 270 | | | PBF Energy, Inc., Class A | | | 7,186 | |
| | 252 | | | Plains All American Pipeline LP | | | 12,917 | |
| | 373 | | | QEP Resources, Inc. | | | 7,547 | |
| | 203 | | | Range Resources Corp. | | | 10,834 | |
SEE NOTES TO FINANCIAL STATEMENTS.
| | | | | | | | |
| | | |
| DECEMBER 31, 2014 | | J.P. MORGAN MID CAP/MULTI-CAP FUNDS | | | | | 19 | |
JPMorgan Mid Cap Equity Fund
SCHEDULE OF PORTFOLIO INVESTMENTS
AS OF DECEMBER 31, 2014 (Unaudited) (continued)
(Amounts in thousands)
| | | | | | | | |
| SHARES | | | SECURITY DESCRIPTION | | VALUE($) | |
| | | | | | | | |
| Common Stocks — continued | |
| | | | Oil, Gas & Consumable Fuels — continued | |
| | 540 | | | Southwestern Energy Co. (a) | | | 14,727 | |
| | | | | | | | |
| | | | | | | 112,750 | |
| | | | | | | | |
| | | | Total Energy | | | 122,111 | |
| | | | | | | | |
| | | | Financials — 20.2% | |
| | | | Banks — 4.1% | |
| | 322 | | | Citizens Financial Group, Inc. | | | 7,995 | |
| | 138 | | | City National Corp. | | | 11,175 | |
| | 392 | | | East West Bancorp, Inc. | | | 15,174 | |
| | 1,083 | | | Fifth Third Bancorp | | | 22,074 | |
| | 175 | | | First Republic Bank | | | 9,124 | |
| | 370 | | | Huntington Bancshares, Inc. | | | 3,895 | |
| | 136 | | | M&T Bank Corp. | | | 17,119 | |
| | 138 | | | Signature Bank (a) | | | 17,420 | |
| | 459 | | | SunTrust Banks, Inc. | | | 19,222 | |
| | 149 | | | Zions Bancorporation | | | 4,247 | |
| | | | | | | | |
| | | | | | | 127,445 | |
| | | | | | | | |
| | | | Capital Markets — 4.9% | |
| | 149 | | | Affiliated Managers Group, Inc. (a) | | | 31,666 | |
| | 151 | | | Ameriprise Financial, Inc. | | | 19,946 | |
| | 344 | | | Blackstone Group LP (The) | | | 11,624 | |
| | 381 | | | Invesco Ltd. | | | 15,066 | |
| | 314 | | | Lazard Ltd., (Bermuda), Class A | | | 15,705 | |
| | 169 | | | Legg Mason, Inc. | | | 9,038 | |
| | 139 | | | Northern Trust Corp. | | | 9,356 | |
| | 225 | | | T. Rowe Price Group, Inc. | | | 19,308 | |
| | 572 | | | TD Ameritrade Holding Corp. | | | 20,448 | |
| | | | | | | | |
| | | | | | | 152,157 | |
| | | | | | | | |
| | | | Consumer Finance — 0.4% | |
| | 534 | | | Ally Financial, Inc. (a) | | | 12,607 | |
| | | | | | | | |
| | | | Diversified Financial Services — 0.7% | |
| | 213 | | | Moody’s Corp. | | | 20,369 | |
| | | | | | | | |
| | | | Insurance — 4.4% | |
| | 20 | | | Alleghany Corp. (a) | | | 9,435 | |
| | 124 | | | Chubb Corp. (The) | | | 12,835 | |
| | 406 | | | Hartford Financial Services Group, Inc. (The) | | | 16,943 | |
| | 588 | | | Loews Corp. | | | 24,709 | |
| | 362 | | | Marsh & McLennan Cos., Inc. | | | 20,700 | |
| | 451 | | | Old Republic International Corp. | | | 6,604 | |
| | 251 | | | Progressive Corp. (The) | | | 6,778 | |
| | 364 | | | Unum Group | | | 12,696 | |
| | 198 | | | W.R. Berkley Corp. | | | 10,140 | |
| | 422 | | | XL Group plc, (Ireland) | | | 14,506 | |
| | | | | | | | |
| | | | | | | 135,346 | |
| | | | | | | | |
| | | | | | | | |
| SHARES | | | SECURITY DESCRIPTION | | VALUE($) | |
| | | | | | | | |
| | | | | | | | |
| | | | Real Estate Investment Trusts (REITs) — 4.4% | |
| | 268 | | | American Campus Communities, Inc. (m) | | | 11,087 | |
| | 101 | | | AvalonBay Communities, Inc. (m) | | | 16,472 | |
| | 62 | | | Boston Properties, Inc. (m) | | | 8,037 | |
| | 389 | | | Brixmor Property Group, Inc. (m) | | | 9,657 | |
| | 491 | | | General Growth Properties, Inc. (m) | | | 13,811 | |
| | 639 | | | Kimco Realty Corp. (m) | | | 16,073 | |
| | 221 | | | Outfront Media, Inc. | | | 5,934 | |
| | 310 | | | Rayonier, Inc. (m) | | | 8,668 | |
| | 173 | | | Regency Centers Corp. (m) | | | 11,034 | |
| | 158 | | | Vornado Realty Trust (m) | | | 18,568 | |
| | 415 | | | Weyerhaeuser Co. (m) | | | 14,910 | |
| | | | | | | | |
| | | | | | | 134,251 | |
| | | | | | | | |
| | | | Real Estate Management & Development — 1.1% | |
| | 952 | | | CBRE Group, Inc., Class A (a) | | | 32,589 | |
| | | | | | | | |
| | | | Thrifts & Mortgage Finance — 0.2% | |
| | 622 | | | Hudson City Bancorp, Inc. | | | 6,298 | |
| | | | | | | | |
| | | | Total Financials | | | 621,062 | |
| | | | | | | | |
| | | | Health Care — 10.6% | |
| | | | Biotechnology — 1.3% | |
| | 61 | | | Alexion Pharmaceuticals, Inc. (a) | | | 11,305 | |
| | 74 | | | Receptos, Inc. (a) | | | 9,115 | |
| | 175 | | | Vertex Pharmaceuticals, Inc. (a) | | | 20,755 | |
| | | | | | | | |
| | | | | | | 41,175 | |
| | | | | | | | |
| | | | Health Care Equipment & Supplies — 1.5% | |
| | 296 | | | CareFusion Corp. (a) | | | 17,566 | |
| | 240 | | | Insulet Corp. (a) | | | 11,045 | |
| | 196 | | | Sirona Dental Systems, Inc. (a) | | | 17,151 | |
| | | | | | | | |
| | | | | | | 45,762 | |
| | | | | | | | |
| | | | Health Care Providers & Services — 5.3% | |
| | 194 | | | Acadia Healthcare Co., Inc. (a) | | | 11,881 | |
| | 201 | | | AmerisourceBergen Corp. | | | 18,146 | |
| | 809 | | | Brookdale Senior Living, Inc. (a) | | | 29,673 | |
| | 230 | | | Cigna Corp. (m) | | | 23,637 | |
| | 518 | | | Envision Healthcare Holdings, Inc. (a) | | | 17,955 | |
| | 71 | | | Henry Schein, Inc. (a) | | | 9,675 | |
| | 281 | | | Humana, Inc. (m) | | | 40,325 | |
| | 315 | | | Premier, Inc., Class A (a) | | | 10,569 | |
| | | | | | | | |
| | | | | | | 161,861 | |
| | | | | | | | |
| | | | Health Care Technology — 0.2% | |
| | 261 | | | Veeva Systems, Inc., Class A (a) | | | 6,893 | |
| | | | | | | | |
| | | | Life Sciences Tools & Services — 1.0% | |
| | 176 | | | Illumina, Inc. (a) | | | 32,501 | |
| | | | | | | | |
SEE NOTES TO FINANCIAL STATEMENTS.
| | | | | | |
| | | |
| 20 | | | | J.P. MORGAN MID CAP/MULTI-CAP FUNDS | | DECEMBER 31, 2014 |
| | | | | | | | |
| SHARES | | | SECURITY DESCRIPTION | | VALUE($) | |
| | | | | | | | |
| Common Stocks — continued | |
| | | | Pharmaceuticals — 1.3% | |
| | 73 | | | Jazz Pharmaceuticals plc, (Ireland) (a) | | | 11,985 | |
| | 70 | | | Perrigo Co. plc, (Ireland) | | | 11,718 | |
| | 110 | | | Valeant Pharmaceuticals International, Inc. (a) | | | 15,713 | |
| | | | | | | | |
| | | | | | | 39,416 | |
| | | | | | | | |
| | | | Total Health Care | | | 327,608 | |
| | | | | | | | |
| | | | Industrials — 13.1% | |
| | | | Airlines — 1.0% | |
| | 607 | | | Delta Air Lines, Inc. | | | 29,873 | |
| | | | | | | | |
| | | | Building Products — 1.6% | |
| | 276 | | | A.O. Smith Corp. | | | 15,552 | |
| | 778 | | | Fortune Brands Home & Security, Inc. | | | 35,211 | |
| | | | | | | | |
| | | | | | | 50,763 | |
| | | | | | | | |
| | | | Commercial Services & Supplies — 0.6% | |
| | 139 | | | Stericycle, Inc. (a) | | | 18,227 | |
| | | | | | | | |
| | | | Electrical Equipment — 2.6% | |
| | 273 | | | Acuity Brands, Inc. | | | 38,211 | |
| | 267 | | | AMETEK, Inc. | | | 14,073 | |
| | 125 | | | Hubbell, Inc., Class B | | | 13,385 | |
| | 174 | | | Regal-Beloit Corp. | | | 13,068 | |
| | | | | | | | |
| | | | | | | 78,737 | |
| | | | | | | | |
| | | | Industrial Conglomerates — 1.3% | |
| | 453 | | | Carlisle Cos., Inc. | | | 40,864 | |
| | | | | | | | |
| | | | Machinery — 2.7% | |
| | 219 | | | IDEX Corp. | | | 17,042 | |
| | 164 | | | Middleby Corp. (The) (a) | | | 16,223 | |
| | 249 | | | Pall Corp. | | | 25,193 | |
| | 283 | | | Rexnord Corp. (a) | | | 7,991 | |
| | 113 | | | Snap-on, Inc. | | | 15,502 | |
| | | | | | | | |
| | | | | | | 81,951 | |
| | | | | | | | |
| | | | Marine — 0.4% | |
| | 149 | | | Kirby Corp. (a) | | | 12,014 | |
| | | | | | | | |
| | | | Professional Services — 0.6% | |
| | 237 | | | Equifax, Inc. | | | 19,175 | |
| | | | | | | | |
| | | | Road & Rail — 0.7% | |
| | 55 | | | Canadian Pacific Railway Ltd., (Canada) | | | 10,637 | |
| | 139 | | | Landstar System, Inc. | | | 10,067 | |
| | | | | | | | |
| | | | | | | 20,704 | |
| | | | | | | | |
| | | | Trading Companies & Distributors — 1.6% | |
| | 794 | | | HD Supply Holdings, Inc. (a) | | | 23,427 | |
| | 167 | | | MSC Industrial Direct Co., Inc., Class A | | | 13,592 | |
| | | | | | | | |
| SHARES | | | SECURITY DESCRIPTION | | VALUE($) | |
| | | | | | | | |
| | | | | | | | |
| | | | Trading Companies & Distributors — continued | |
| | 116 | | | Watsco, Inc. | | | 12,428 | |
| | | | | | | | |
| | | | | | | 49,447 | |
| | | | | | | | |
| | | | Total Industrials | | | 401,755 | |
| | | | | | | | |
| | | | Information Technology — 16.5% | |
| | | | Communications Equipment — 1.6% | |
| | 134 | | | Arista Networks, Inc. (a) | | | 8,142 | |
| | 347 | | | Aruba Networks, Inc. (a) | | | 6,303 | |
| | 568 | | | Ciena Corp. (a) | | | 11,032 | |
| | 504 | | | CommScope Holding Co., Inc. (a) | | | 11,516 | |
| | 109 | | | Palo Alto Networks, Inc. (a) | | | 13,348 | |
| | | | | | | | |
| | | | | | | 50,341 | |
| | | | | | | | |
| | | | Electronic Equipment, Instruments & Components — 2.1% | |
| | 772 | | | Amphenol Corp., Class A | | | 41,545 | |
| | 400 | | | Arrow Electronics, Inc. (a) | | | 23,184 | |
| | | | | | | | |
| | | | | | | 64,729 | |
| | | | | | | | |
| | | | Internet Software & Services — 1.6% | |
| | 97 | | | CoStar Group, Inc. (a) | | | 17,849 | |
| | 380 | | | Dealertrack Technologies, Inc. (a) | | | 16,829 | |
| | 360 | | | Twitter, Inc. (a) | | | 12,920 | |
| | | | | | | | |
| | | | | | | 47,598 | |
| | | | | | | | |
| | | | IT Services — 2.7% | |
| | 95 | | | Alliance Data Systems Corp. (a) | | | 27,203 | |
| | 162 | | | Gartner, Inc. (a) | | | 13,659 | |
| | 368 | | | Jack Henry & Associates, Inc. | | | 22,883 | |
| | 525 | | | VeriFone Systems, Inc. (a) | | | 19,523 | |
| | | | | | | | |
| | | | | | | 83,268 | |
| | | | | | | | |
| | | | Semiconductors & Semiconductor Equipment — 4.2% | |
| | 351 | | | Analog Devices, Inc. | | | 19,506 | |
| | 694 | | | Applied Materials, Inc. | | | 17,295 | |
| | 249 | | | Avago Technologies Ltd., (Singapore) | | | 25,077 | |
| | 144 | | | KLA-Tencor Corp. | | | 10,131 | |
| | 232 | | | Lam Research Corp. | | | 18,439 | |
| | 285 | | | NXP Semiconductors N.V., (Netherlands) (a) | | | 21,743 | |
| | 399 | | | Xilinx, Inc. | | | 17,270 | |
| | | | | | | | |
| | | | | | | 129,461 | |
| | | | | | | | |
| | | | Software — 3.8% | |
| | 278 | | | Autodesk, Inc. (a) | | | 16,703 | |
| | 406 | | | Electronic Arts, Inc. (a) | | | 19,083 | |
| | 247 | | | Guidewire Software, Inc. (a) | | | 12,500 | |
| | 176 | | | Mobileye N.V., (Israel) (a) | | | 7,147 | |
| | 92 | | | NetSuite, Inc. (a) | | | 10,055 | |
| | 200 | | | ServiceNow, Inc. (a) | | | 13,597 | |
| | 404 | | | Synopsys, Inc. (a) | | | 17,549 | |
SEE NOTES TO FINANCIAL STATEMENTS.
| | | | | | | | |
| | | |
| DECEMBER 31, 2014 | | J.P. MORGAN MID CAP/MULTI-CAP FUNDS | | | | | 21 | |
JPMorgan Mid Cap Equity Fund
SCHEDULE OF PORTFOLIO INVESTMENTS
AS OF DECEMBER 31, 2014 (Unaudited) (continued)
(Amounts in thousands)
| | | | | | | | |
| SHARES | | | SECURITY DESCRIPTION | | VALUE($) | |
| | | | | �� | | | |
| Common Stocks — continued | |
| | | | Software — continued | |
| | 125 | | | Tableau Software, Inc., Class A (a) | | | 10,553 | |
| | 130 | | | Workday, Inc., Class A (a) | | | 10,593 | |
| | | | | | | | |
| | | | | | | 117,780 | |
| | | | | | | | |
| | | | Technology Hardware, Storage & Peripherals — 0.5% | |
| | 160 | | | SanDisk Corp. | | | 15,647 | |
| | | | | | | | |
| | | | Total Information Technology | | | 508,824 | |
| | | | | | | | |
| | | | Materials — 4.6% | |
| | | | Chemicals — 2.7% | |
| | 172 | | | Airgas, Inc. | | | 19,844 | |
| | 204 | | | Albemarle Corp. | | | 12,281 | |
| | 167 | | | Sherwin-Williams Co. (The) | | | 43,991 | |
| | 46 | | | Sigma-Aldrich Corp. | | | 6,343 | |
| | | | | | | | |
| | | | | | | 82,459 | |
| | | | | | | | |
| | | | Construction Materials — 0.4% | |
| | 186 | | | Eagle Materials, Inc. | | | 14,141 | |
| | | | | | | | |
| | | | Containers & Packaging — 1.5% | |
| | 256 | | | Ball Corp. | | | 17,431 | |
| | 223 | | | Rock-Tenn Co., Class A | | | 13,619 | |
| | 274 | | | Silgan Holdings, Inc. | | | 14,707 | |
| | | | | | | | |
| | | | | | | 45,757 | |
| | | | | | | | |
| | | | Total Materials | | | 142,357 | |
| | | | | | | | |
| | | | Utilities — 4.7% | |
| | | | Electric Utilities — 1.4% | |
| | 219 | | | Edison International | | | 14,362 | |
| | 359 | | | Westar Energy, Inc. | | | 14,806 | |
| | 391 | | | Xcel Energy, Inc. | | | 14,028 | |
| | | | | | | | |
| | | | | | | 43,196 | |
| | | | | | | | |
| | | | | | | | |
| SHARES | | | SECURITY DESCRIPTION | | VALUE($) | |
| | | | | | | | |
| | | | Gas Utilities — 1.0% | |
| | 146 | | | National Fuel Gas Co. | | | 10,159 | |
| | 850 | | | Questar Corp. | | | 21,482 | |
| | | | | | | | |
| | | | | | | 31,641 | |
| | | | | | | | |
| | | | Multi-Utilities — 2.3% | |
| | 586 | | | CenterPoint Energy, Inc. | | | 13,723 | |
| | 458 | | | CMS Energy Corp. (m) | | | 15,919 | |
| | 151 | | | NiSource, Inc. | | | 6,422 | |
| | 182 | | | Sempra Energy | | | 20,297 | |
| | 239 | | | Wisconsin Energy Corp. | | | 12,587 | |
| | | | | | | | |
| | | | | | | 68,948 | |
| | | | | | | | |
| | | | Total Utilities | | | 143,785 | |
| | | | | | | | |
| | | | Total Common Stocks
(Cost $2,217,318) | | | 2,974,871 | |
| | | | | | | | |
| Short-Term Investment — 3.2% | |
| | | | Investment Company — 3.2% | |
| | 97,564 | | | JPMorgan Prime Money Market Fund, Institutional Class Shares, 0.020% (b) (l) (m)
(Cost $97,564) | | | 97,564 | |
| | | | | | | | |
| | | | Total Investments — 99.9%
(Cost $2,314,882) | | | 3,072,435 | |
| | | | Other Assets in Excess of
Liabilities — 0.1% | | | 2,613 | |
| | | | | | | | |
| | | | NET ASSETS — 100.0% | | $ | 3,075,048 | |
| | | | | | | | |
Percentages indicated are based on net assets.
SEE NOTES TO FINANCIAL STATEMENTS.
| | | | | | |
| | | |
| 22 | | | | J.P. MORGAN MID CAP/MULTI-CAP FUNDS | | DECEMBER 31, 2014 |
JPMorgan Mid Cap Growth Fund
SCHEDULE OF PORTFOLIO INVESTMENTS
AS OF DECEMBER 31, 2014 (Unaudited)
(Amounts in thousands)
| | | | | | | | |
| SHARES | | | SECURITY DESCRIPTION | | VALUE($) | |
| | | | | | | |
| Common Stocks — 96.5% | | | | |
| | | | Consumer Discretionary — 20.3% | | | | |
| | | | Auto Components — 1.2% | | | | |
| | 503 | | | BorgWarner, Inc. | | | 27,662 | |
| | | | | | | | |
| | | | Automobiles — 2.6% | |
| | 422 | | | Harley-Davidson, Inc. | | | 27,794 | |
| | 150 | | | Tesla Motors, Inc. (a) | | | 33,406 | |
| | | | | | | | |
| | | | | | | 61,200 | |
| | | | | | | | |
| | | | Hotels, Restaurants & Leisure — 3.7% | |
| | 30 | | | Chipotle Mexican Grill, Inc. (a) | | | 20,193 | |
| | 968 | | | Hilton Worldwide Holdings, Inc. (a) | | | 25,257 | |
| | 476 | | | Norwegian Cruise Line Holdings Ltd. (a) | | | 22,272 | |
| | 121 | | | Panera Bread Co., Class A (a) | | | 21,081 | |
| | | | | | | | |
| | | | | | | 88,803 | |
| | | | | | | | |
| | | | Household Durables — 1.6% | |
| | 130 | | | Mohawk Industries, Inc. (a) | | | 20,181 | |
| | 538 | | | Toll Brothers, Inc. (a) | | | 18,451 | |
| | | | | | | | |
| | | | | | | 38,632 | |
| | | | | | | | |
| | | | Internet & Catalog Retail — 1.8% | |
| | 93 | | | Netflix, Inc. (a) | | | 31,599 | |
| | 146 | | | TripAdvisor, Inc. (a) | | | 10,878 | |
| | | | | | | | |
| | | | | | | 42,477 | |
| | | | | | | | |
| | | | Multiline Retail — 0.5% | |
| | 326 | | | Big Lots, Inc. | | | 13,027 | |
| | | | | | | | |
| | | | Specialty Retail — 6.2% | |
| | 168 | | | Advance Auto Parts, Inc. | | | 26,807 | |
| | 537 | | | GameStop Corp., Class A | | | 18,140 | |
| | 366 | | | GNC Holdings, Inc., Class A | | | 17,197 | |
| | 310 | | | Ulta Salon Cosmetics & Fragrance, Inc. (a) | | | 39,630 | |
| | 795 | | | Urban Outfitters, Inc. (a) | | | 27,918 | |
| | 227 | | | Williams-Sonoma, Inc. | | | 17,195 | |
| | | | | | | | |
| | | | | | | 146,887 | |
| | | | | | | | |
| | | | Textiles, Apparel & Luxury Goods — 2.7% | |
| | 540 | | | Michael Kors Holdings Ltd., (Hong Kong) (a) | | | 40,531 | |
| | 122 | | | Ralph Lauren Corp. | | | 22,636 | |
| | | | | | | | |
| | | | | | | 63,167 | |
| | | | | | | | |
| | | | Total Consumer Discretionary | | | 481,855 | |
| | | | | | | | |
| | | | Consumer Staples — 2.5% | |
| | | | Beverages — 1.3% | |
| | 290 | | | Monster Beverage Corp. (a) | | | 31,378 | |
| | | | | | | | |
| | | | Food & Staples Retailing — 1.2% | |
| | 800 | | | Sprouts Farmers Market, Inc. (a) | | | 27,167 | |
| | | | | | | | |
| | | | Total Consumer Staples | | | 58,545 | |
| | | | | | | | |
| | | | | | | | |
| SHARES | | | SECURITY DESCRIPTION | | VALUE($) | |
| | | | | | | |
| | | | | | | | |
| | | | Energy — 4.1% | |
| | | | Energy Equipment & Services — 0.6% | |
| | 190 | | | Dril-Quip, Inc. (a) | | | 14,540 | |
| | | | | | | | |
| | | | Oil, Gas & Consumable Fuels — 3.5% | |
| | 271 | | | Antero Resources Corp. (a) | | | 10,993 | |
| | 277 | | | Concho Resources, Inc. (a) | | | 27,671 | |
| | 813 | | | Laredo Petroleum, Inc. (a) | | | 8,419 | |
| | 390 | | | Plains All American Pipeline LP | | | 19,989 | |
| | 310 | | | Range Resources Corp. | | | 16,591 | |
| | | | | | | | |
| | | | | | | 83,663 | |
| | | | | | | | |
| | | | Total Energy | | | 98,203 | |
| | | | | | | | |
| | | | Financials — 10.8% | |
| | | | Banks — 2.1% | |
| | 584 | | | East West Bancorp, Inc. | | | 22,595 | |
| | 215 | | | Signature Bank (a) | | | 27,044 | |
| | | | | | | | |
| | | | | | | 49,639 | |
| | | | | | | | |
| | | | Capital Markets — 5.2% | |
| | 232 | | | Affiliated Managers Group, Inc. (a) | | | 49,133 | |
| | 534 | | | Blackstone Group LP (The) | | | 18,052 | |
| | 486 | | | Lazard Ltd., (Bermuda), Class A | | | 24,294 | |
| | 887 | | | TD Ameritrade Holding Corp. | | | 31,730 | |
| | | | | | | | |
| | | | | | | 123,209 | |
| | | | | | | | |
| | | | Diversified Financial Services — 1.4% | |
| | 330 | | | Moody’s Corp. | | | 31,608 | |
| | | | | | | | |
| | | | Real Estate Management & Development — 2.1% | |
| | 1,476 | | | CBRE Group, Inc., Class A (a) | | | 50,553 | |
| | | | | | | | |
| | | | Total Financials | | | 255,009 | |
| | | | | | | | |
| | | | Health Care — 14.8% | |
| | | | Biotechnology — 2.7% | |
| | 95 | | | Alexion Pharmaceuticals, Inc. (a) | | | 17,559 | |
| | 116 | | | Receptos, Inc. (a) | | | 14,150 | |
| | 271 | | | Vertex Pharmaceuticals, Inc. (a) | | | 32,207 | |
| | | | | | | | |
| | | | | | | 63,916 | |
| | | | | | | | |
| | | | Health Care Equipment & Supplies — 1.8% | |
| | 372 | | | Insulet Corp. (a) | | | 17,153 | |
| | 305 | | | Sirona Dental Systems, Inc. (a) | | | 26,621 | |
| | | | | | | | |
| | | | | | | 43,774 | |
| | | | | | | | |
| | | | Health Care Providers & Services — 5.1% | |
| | 297 | | | Acadia Healthcare Co., Inc. (a) | | | 18,198 | |
| | 675 | | | Brookdale Senior Living, Inc. (a) | | | 24,749 | |
| | 803 | | | Envision Healthcare Holdings, Inc. (a) | | | 27,866 | |
| | 226 | | | Humana, Inc. (m) | | | 32,520 | |
| | 490 | | | Premier, Inc., Class A (a) | | | 16,413 | |
| | | | | | | | |
| | | | | | | 119,746 | |
| | | | | | | | |
SEE NOTES TO FINANCIAL STATEMENTS.
| | | | | | | | |
| | | |
| DECEMBER 31, 2014 | | J.P. MORGAN MID CAP/MULTI-CAP FUNDS | | | | | 23 | |
JPMorgan Mid Cap Growth Fund
SCHEDULE OF PORTFOLIO INVESTMENTS
AS OF DECEMBER 31, 2014 (Unaudited) (continued)
(Amounts in thousands)
| | | | | | | | |
| SHARES | | | SECURITY DESCRIPTION | | VALUE($) | |
| | | | | | | |
| Common Stocks — continued | | | | |
| | | | Health Care Technology — 0.5% | |
| | 406 | | | Veeva Systems, Inc., Class A (a) | | | 10,712 | |
| | | | | | | | |
| | | | Life Sciences Tools & Services — 2.1% | |
| | 273 | | | Illumina, Inc. (a) | | | 50,409 | |
| | | | | | | | |
| | | | Pharmaceuticals — 2.6% | |
| | 114 | | | Jazz Pharmaceuticals plc, (Ireland) (a) | | | 18,583 | |
| | 109 | | | Perrigo Co. plc, (Ireland) | | | 18,187 | |
| | 170 | | | Valeant Pharmaceuticals International, Inc. (a) | | | 24,329 | |
| | | | | | | | |
| | | | | | | 61,099 | |
| | | | | | | | |
| | | | Total Health Care | | | 349,656 | |
| | | | | | | | |
| | | | Industrials — 16.8% | |
| | | | Airlines — 2.0% | |
| | 944 | | | Delta Air Lines, Inc. | | | 46,455 | |
| | | | | | | | |
| | | | Building Products — 2.5% | |
| | 428 | | | A.O. Smith Corp. | | | 24,132 | |
| | 769 | | | Fortune Brands Home & Security, Inc. | | | 34,826 | |
| | | | | | | | |
| | | | | | | 58,958 | |
| | | | | | | | |
| | | | Commercial Services & Supplies — 1.2% | |
| | 216 | | | Stericycle, Inc. (a) | | | 28,283 | |
| | | | | | | | |
| | | | Electrical Equipment — 2.5% | |
| | 423 | | | Acuity Brands, Inc. | | | 59,278 | |
| | | | | | | | |
| | | | Industrial Conglomerates — 1.5% | |
| | 384 | | | Carlisle Cos., Inc. | | | 34,688 | |
| | | | | | | | |
| | | | Machinery — 2.7% | |
| | 254 | | | Middleby Corp. (The) (a) | | | 25,182 | |
| | 386 | | | Pall Corp. (m) | | | 39,087 | |
| | | | | | | | |
| | | | | | | 64,269 | |
| | | | | | | | |
| | | | Marine — 0.8% | |
| | 230 | | | Kirby Corp. (a) | | | 18,578 | |
| | | | | | | | |
| | | | Road & Rail — 1.3% | |
| | 83 | | | Canadian Pacific Railway Ltd., (Canada) | | | 16,071 | |
| | 216 | | | Landstar System, Inc. | | | 15,630 | |
| | | | | | | | |
| | | | | | | 31,701 | |
| | | | | | | | |
| | | | Trading Companies & Distributors — 2.3% | |
| | 1,233 | | | HD Supply Holdings, Inc. (a) | | | 36,347 | |
| | 180 | | | Watsco, Inc. | | | 19,292 | |
| | | | | | | | |
| | | | | | | 55,639 | |
| | | | | | | | |
| | | | Total Industrials | | | 397,849 | |
| | | | | | | | |
| | | | Information Technology — 24.2% | |
| | | | Communications Equipment — 2.5% | |
| | 205 | | | Arista Networks, Inc. (a) | | | 12,480 | |
| | 539 | | | Aruba Networks, Inc. (a) | | | 9,797 | |
| | | | | | | | |
| SHARES | | | SECURITY DESCRIPTION | | VALUE($) | |
| | | | | | | |
| | | | | | | | |
| | | | Communications Equipment — continued | |
| | 883 | | | Ciena Corp. (a) | | | 17,135 | |
| | 169 | | | Palo Alto Networks, Inc. (a) | | | 20,666 | |
| | | | | | | | |
| | | | | | | 60,078 | |
| | | | | | | | |
| | | | Electronic Equipment, Instruments & Components — 1.7% | |
| | 733 | | | Amphenol Corp., Class A | | | 39,443 | |
| | | | | | | | |
| | | | Internet Software & Services — 3.1% | |
| | 151 | | | CoStar Group, Inc. (a) | | | 27,691 | |
| | 586 | | | Dealertrack Technologies, Inc. (a) | | | 25,966 | |
| | 559 | | | Twitter, Inc. (a) | | | 20,055 | |
| | | | | | | | |
| | | | | | | 73,712 | |
| | | | | | | | |
| | | | IT Services — 3.9% | |
| | 147 | | | Alliance Data Systems Corp. (a) | | | 42,135 | |
| | 252 | | | Gartner, Inc. (a) | | | 21,196 | |
| | 814 | | | VeriFone Systems, Inc. (a) | | | 30,292 | |
| | | | | | | | |
| | | | | | | 93,623 | |
| | | | | | | | |
| | | | Semiconductors & Semiconductor Equipment — 5.4% | |
| | 1,074 | | | Applied Materials, Inc. (m) | | | 26,766 | |
| | 384 | | | Avago Technologies Ltd., (Singapore) | | | 38,667 | |
| | 361 | | | Lam Research Corp. (m) | | | 28,618 | |
| | 442 | | | NXP Semiconductors N.V., (Netherlands) (a) | | | 33,746 | |
| | | | | | | | |
| | | | | | | 127,797 | |
| | | | | | | | |
| | | | Software — 6.6% | |
| | 430 | | | Autodesk, Inc. (a) (m) | | | 25,844 | |
| | 630 | | | Electronic Arts, Inc. (a) (m) | | | 29,629 | |
| | 383 | | | Guidewire Software, Inc. (a) | | | 19,412 | |
| | 272 | | | Mobileye N.V., (Israel) (a) | | | 11,028 | |
| | 143 | | | NetSuite, Inc. (a) | | | 15,600 | |
| | 311 | | | ServiceNow, Inc. (a) | | | 21,108 | |
| | 193 | | | Tableau Software, Inc., Class A (a) | | | 16,393 | |
| | 202 | | | Workday, Inc., Class A (a) | | | 16,444 | |
| | | | | | | | |
| | | | | | | 155,458 | |
| | | | | | | | |
| | | | Technology Hardware, Storage & Peripherals — 1.0% | |
| | 248 | | | SanDisk Corp. | | | 24,299 | |
| | | | | | | | |
| | | | Total Information Technology | | | 574,410 | |
| | | | | | | | |
| | | | Materials — 3.0% | |
| | | | Chemicals — 2.1% | |
| | 185 | | | Sherwin-Williams Co. (The) | | | 48,583 | |
| | | | | | | | |
| | | | Construction Materials — 0.9% | |
| | 289 | | | Eagle Materials, Inc. | | | 21,950 | |
| | | | | | | | |
| | | | Total Materials | | | 70,533 | |
| | | | | | | | |
| | | | Total Common Stocks
(Cost $1,654,198) | | | 2,286,060 | |
| | | | | | | | |
SEE NOTES TO FINANCIAL STATEMENTS.
| | | | | | |
| | | |
| 24 | | | | J.P. MORGAN MID CAP/MULTI-CAP FUNDS | | DECEMBER 31, 2014 |
| | | | | | | | |
| SHARES | | | SECURITY DESCRIPTION | | VALUE($) | |
| | | | | | | |
| Short-Term Investment — 3.2% | |
| | | | Investment Company — 3.2% | |
| | 76,415 | | | JPMorgan Liquid Assets Money Market Fund, Institutional Class Shares, 0.030% (b) (l) (m)
(Cost $76,415 ) | | | 76,415 | |
| | | | | | | | |
| | | | Total Investments — 99.7%
(Cost $1,730,613) | | | 2,362,475 | |
| | | | Other Assets in Excess of
Liabilities — 0.3% | | | 7,371 | |
| | | | | | | | |
| | | | NET ASSETS — 100.0% | | $ | 2,369,846 | |
| | | | | | | | |
Percentages indicated are based on net assets.
SEE NOTES TO FINANCIAL STATEMENTS.
| | | | | | | | |
| | | |
| DECEMBER 31, 2014 | | J.P. MORGAN MID CAP/MULTI-CAP FUNDS | | | | | 25 | |
JPMorgan Mid Cap Value Fund
SCHEDULE OF PORTFOLIO INVESTMENTS
AS OF DECEMBER 31, 2014 (Unaudited)
(Amounts in thousands)
| | | | | | | | |
| SHARES | | | SECURITY DESCRIPTION | | VALUE($) | |
| | | | | | | |
| Common Stocks — 97.6% | |
| | | | Consumer Discretionary — 17.9% | | | | |
| | | | Hotels, Restaurants & Leisure — 1.4% | |
| | 978 | | | Marriott International, Inc., Class A | | | 76,299 | |
| | 1,788 | | | Starwood Hotels & Resorts Worldwide, Inc. | | | 144,925 | |
| | | | | | | | |
| | | | | | | 221,224 | |
| | | | | | | | |
| | | | Household Durables — 2.5% | |
| | 3,897 | | | Jarden Corp. (a) | | | 186,612 | |
| | 1,370 | | | Mohawk Industries, Inc. (a) | | | 212,824 | |
| | | | | | | | |
| | | | | | | 399,436 | |
| | | | | | | | |
| | | | Internet & Catalog Retail — 1.6% | |
| | 3,033 | | | Expedia, Inc. | | | 258,875 | |
| | | | | | | | |
| | | | Media — 3.2% | |
| | 1,469 | | | CBS Corp. (Non-Voting), Class B | | | 81,285 | |
| | 3,534 | | | Clear Channel Outdoor Holdings, Inc., Class A | | | 37,422 | |
| | 2,294 | | | DISH Network Corp., Class A (a) | | | 167,230 | |
| | 4,712 | | | Gannett Co., Inc. | | | 150,455 | |
| | 2,957 | | | Time, Inc. | | | 72,773 | |
| | | | | | | | |
| | | | | | | 509,165 | |
| | | | | | | | |
| | | | Multiline Retail — 2.4% | |
| | 4,288 | | | Kohl’s Corp. | | | 261,729 | |
| | 1,573 | | | Nordstrom, Inc. | | | 124,913 | |
| | | | | | | | |
| | | | | | | 386,642 | |
| | | | | | | | |
| | | | Specialty Retail — 5.4% | |
| | 266 | | | AutoZone, Inc. (a) | | | 164,887 | |
| | 1,677 | | | Bed Bath & Beyond, Inc. (a) | | | 127,720 | |
| | 3,920 | | | Best Buy Co., Inc. | | | 152,820 | |
| | 5,979 | | | Gap, Inc. (The) | | | 251,772 | |
| | 1,518 | | | Tiffany & Co. | | | 162,208 | |
| | | | | | | | |
| | | | | | | 859,407 | |
| | | | | | | | |
| | | | Textiles, Apparel & Luxury Goods — 1.4% | |
| | 1,095 | | | PVH Corp. | | | 140,366 | |
| | 1,067 | | | V.F. Corp. | | | 79,946 | |
| | | | | | | | |
| | | | | | | 220,312 | |
| | | | | | | | |
| | | | Total Consumer Discretionary | | | 2,855,061 | |
| | | | | | | | |
| | | | Consumer Staples — 5.5% | |
| | | | Beverages — 1.6% | |
| | 1,268 | | | Constellation Brands, Inc., Class A (a) | | | 124,510 | |
| | 1,886 | | | Dr. Pepper Snapple Group, Inc. | | | 135,214 | |
| | | | | | | | |
| | | | | | | 259,724 | |
| | | | | | | | |
| | | | Food & Staples Retailing — 2.1% | |
| | 3,346 | | | Kroger Co. (The) | | | 214,857 | |
| | 15,560 | | | Rite Aid Corp. (a) | | | 117,011 | |
| | | | | | | | |
| | | | | | | 331,868 | |
| | | | | | | | |
| | | | | | | | |
| SHARES | | | SECURITY DESCRIPTION | | VALUE($) | |
| | | | | | | |
| | | | | | | | |
| | | | Food Products — 0.9% | |
| | 1,448 | | | Hershey Co. (The) | | | 150,460 | |
| | | | | | | | |
| | | | Household Products — 0.9% | |
| | 1,083 | | | Energizer Holdings, Inc. | | | 139,241 | |
| | | | | | | | |
| | | | Total Consumer Staples | | | 881,293 | |
| | | | | | | | |
| | | | Energy — 3.8% | |
| | | | Oil, Gas & Consumable Fuels — 3.8% | |
| | 3,217 | | | Energen Corp. | | | 205,099 | |
| | 1,300 | | | EQT Corp. | | | 98,409 | |
| | 2,651 | | | PBF Energy, Inc., Class A | | | 70,635 | |
| | 3,903 | | | QEP Resources, Inc. | | | 78,915 | |
| | 5,608 | | | Southwestern Energy Co. (a) | | | 153,049 | |
| | | | | | | | |
| | | | Total Energy | | | 606,107 | |
| | | | | | | | |
| | | | Financials — 29.9% | |
| | | | Banks — 6.5% | |
| | 3,344 | | | Citizens Financial Group, Inc. | | | 83,137 | |
| | 1,553 | | | City National Corp. | | | 125,527 | |
| | 11,271 | | | Fifth Third Bancorp | | | 229,650 | |
| | 1,965 | | | First Republic Bank | | | 102,431 | |
| | 3,866 | | | Huntington Bancshares, Inc. | | | 40,668 | |
| | 1,674 | | | M&T Bank Corp. | | | 210,283 | |
| | 4,786 | | | SunTrust Banks, Inc. | | | 200,545 | |
| | 1,631 | | | Zions Bancorporation | | | 46,487 | |
| | | | | | | | |
| | | | | | | 1,038,728 | |
| | | | | | | | |
| | | | Capital Markets — 4.8% | |
| | 1,655 | | | Ameriprise Financial, Inc. | | | 218,872 | |
| | 3,935 | | | Invesco Ltd. | | | 155,523 | |
| | 1,751 | | | Legg Mason, Inc. | | | 93,444 | |
| | 1,450 | | | Northern Trust Corp. | | | 97,752 | |
| | 2,309 | | | T. Rowe Price Group, Inc. | | | 198,290 | |
| | | | | | | | |
| | | | | | | 763,881 | |
| | | | | | | | |
| | | | Consumer Finance — 0.7% | |
| | 4,995 | | | Ally Financial, Inc. (a) | | | 117,987 | |
| | | | | | | | |
| | | | Insurance — 8.8% | |
| | 214 | | | Alleghany Corp. (a) | | | 99,159 | |
| | 1,275 | | | Chubb Corp. (The) | | | 131,878 | |
| | 4,279 | | | Hartford Financial Services Group, Inc. (The) | | | 178,380 | |
| | 6,215 | | | Loews Corp. | | | 261,157 | |
| | 3,701 | | | Marsh & McLennan Cos., Inc. | | | 211,848 | |
| | 4,727 | | | Old Republic International Corp. | | | 69,151 | |
| | 2,582 | | | Progressive Corp. (The) | | | 69,696 | |
| | 3,743 | | | Unum Group | | | 130,544 | |
| | 2,039 | | | W.R. Berkley Corp. | | | 104,502 | |
| | 4,448 | | | XL Group plc, (Ireland) | | | 152,877 | |
| | | | | | | | |
| | | | | | | 1,409,192 | |
| | | | | | | | |
SEE NOTES TO FINANCIAL STATEMENTS.
| | | | | | |
| | | |
| 26 | | | | J.P. MORGAN MID CAP/MULTI-CAP FUNDS | | DECEMBER 31, 2014 |
| | | | | | | | |
| SHARES | | | SECURITY DESCRIPTION | | VALUE($) | |
| | | | | | | |
| Common Stocks — continued | |
| | | | Real Estate Investment Trusts (REITs) — 8.7% | |
| | 2,783 | | | American Campus Communities, Inc. (m) | | | 115,124 | |
| | 1,054 | | | AvalonBay Communities, Inc. (m) | | | 172,202 | |
| | 649 | | | Boston Properties, Inc. (m) | | | 83,508 | |
| | 4,041 | | | Brixmor Property Group, Inc. | | | 100,376 | |
| | 5,105 | | | General Growth Properties, Inc. (m) | | | 143,597 | |
| | 6,696 | | | Kimco Realty Corp. (m) | | | 168,327 | |
| | 2,321 | | | Outfront Media, Inc. | | | 62,287 | |
| | 2,993 | | | Rayonier, Inc. (m) | | | 83,626 | |
| | 1,757 | | | Regency Centers Corp. (m) | | | 112,092 | |
| | 1,636 | | | Vornado Realty Trust (m) | | | 192,540 | |
| | 4,370 | | | Weyerhaeuser Co. (m) | | | 156,848 | |
| | | | | | | | |
| | | | | | | 1,390,527 | |
| | | | | | | | |
| | | | Thrifts & Mortgage Finance — 0.4% | |
| | 6,261 | | | Hudson City Bancorp, Inc. | | | 63,362 | |
| | | | | | | | |
| | | | Total Financials | | | 4,783,677 | |
| | | | | | | | |
| | | | Health Care — 6.7% | |
| | | | Health Care Equipment & Supplies — 1.2% | |
| | 3,133 | | | CareFusion Corp. (a) | | | 185,911 | |
| | | | | | | | |
| | | | Health Care Providers & Services — 5.5% | |
| | 2,159 | | | AmerisourceBergen Corp. | | | 194,670 | |
| | 3,849 | | | Brookdale Senior Living, Inc. (a) | | | 141,145 | |
| | 2,448 | | | Cigna Corp. | | | 251,899 | |
| | 727 | | | Henry Schein, Inc. (a) | | | 99,016 | |
| | 1,404 | | | Humana, Inc. | | | 201,645 | |
| | | | | | | | |
| | | | | | | 888,375 | |
| | | | | | | | |
| | | | Total Health Care | | | 1,074,286 | |
| | | | | | | | |
| | | | Industrials — 9.4% | |
| | | | Building Products — 0.8% | |
| | 2,939 | | | Fortune Brands Home & Security, Inc. | | | 133,045 | |
| | | | | | | | |
| | | | Electrical Equipment — 2.7% | |
| | 2,818 | | | AMETEK, Inc. | | | 148,297 | |
| | 1,299 | | | Hubbell, Inc., Class B | | | 138,792 | |
| | 1,815 | | | Regal-Beloit Corp. | | | 136,508 | |
| | | | | | | | |
| | | | | | | 423,597 | |
| | | | | | | | |
| | | | Industrial Conglomerates — 1.2% | |
| | 2,101 | | | Carlisle Cos., Inc. | | | 189,624 | |
| | | | | | | | |
| | | | Machinery — 2.6% | |
| | 2,297 | | | IDEX Corp. | | | 178,832 | |
| | 2,958 | | | Rexnord Corp. (a) | | | 83,433 | |
| | 1,165 | | | Snap-on, Inc. | | | 159,268 | |
| | | | | | | | |
| | | | | | | 421,533 | |
| | | | | | | | |
| | | | | | | | |
| SHARES | | | SECURITY DESCRIPTION | | VALUE($) | |
| | | | | | | |
| | | | | | | | |
| | | | Professional Services — 1.2% | |
| | 2,462 | | | Equifax, Inc. | | | 199,134 | |
| | | | | | | | |
| | | | Trading Companies & Distributors — 0.9% | |
| | 1,718 | | | MSC Industrial Direct Co., Inc., Class A | | | 139,620 | |
| | | | | | | | |
| | | | Total Industrials | | | 1,506,553 | |
| | | | | | | | |
| | | | Information Technology — 8.9% | |
| | | | Communications Equipment — 0.7% | |
| | 5,188 | | | CommScope Holding Co., Inc. (a) | | | 118,436 | |
| | | | | | | | |
| | | | Electronic Equipment, Instruments & Components — 2.6% | |
| | 3,108 | | | Amphenol Corp., Class A | | | 167,249 | |
| | 4,182 | | | Arrow Electronics, Inc. (a) | | | 242,081 | |
| | | | | | | | |
| | | | | | | 409,330 | |
| | | | | | | | |
| | | | IT Services — 1.5% | |
| | 3,796 | | | Jack Henry & Associates, Inc. | | | 235,912 | |
| | | | | | | | |
| | | | Semiconductors & Semiconductor Equipment — 2.9% | |
| | 3,617 | | | Analog Devices, Inc. | | | 200,826 | |
| | 1,499 | | | KLA-Tencor Corp. | | | 105,401 | |
| | 3,764 | | | Xilinx, Inc. | | | 162,936 | |
| | | | | | | | |
| | | | | | | 469,163 | |
| | | | | | | | |
| | | | Software — 1.2% | |
| | 4,249 | | | Synopsys, Inc. (a) | | | 184,724 | |
| | | | | | | | |
| | | | Total Information Technology | | | 1,417,565 | |
| | | | | | | | |
| | | | Materials — 6.2% | |
| | | | Chemicals — 3.2% | |
| | 1,770 | | | Airgas, Inc. | | | 203,900 | |
| | 1,915 | | | Albemarle Corp. | | | 115,141 | |
| | 505 | | | Sherwin-Williams Co. (The) | | | 132,757 | |
| | 470 | | | Sigma-Aldrich Corp. | | | 64,552 | |
| | | | | | | | |
| | | | | | | 516,350 | |
| | | | | | | | |
| | | | Containers & Packaging — 3.0% | |
| | 2,626 | | | Ball Corp. | | | 179,014 | |
| | 2,298 | | | Rock-Tenn Co., Class A | | | 140,157 | |
| | 2,885 | | | Silgan Holdings, Inc. | | | 154,658 | |
| | | | | | | | |
| | | | | | | 473,829 | |
| | | | | | | | |
| | | | Total Materials | | | 990,179 | |
| | | | | | | | |
| | | | Utilities — 9.3% | |
| | | | Electric Utilities — 2.8% | |
| | 2,314 | | | Edison International | | | 151,537 | |
| | 3,687 | | | Westar Energy, Inc. | | | 152,046 | |
| | 4,011 | | | Xcel Energy, Inc. | | | 144,069 | |
| | | | | | | | |
| | | | | | | 447,652 | |
| | | | | | | | |
SEE NOTES TO FINANCIAL STATEMENTS.
| | | | | | | | |
| | | |
| DECEMBER 31, 2014 | | J.P. MORGAN MID CAP/MULTI-CAP FUNDS | | | | | 27 | |
JPMorgan Mid Cap Value Fund
SCHEDULE OF PORTFOLIO INVESTMENTS
AS OF DECEMBER 31, 2014 (Unaudited) (continued)
(Amounts in thousands)
| | | | | | | | |
| SHARES | | | SECURITY DESCRIPTION | | VALUE($) | |
| | | | | | | |
| Common Stocks — continued | |
| | | | Gas Utilities — 2.0% | |
| | 1,521 | | | National Fuel Gas Co. | | | 105,732 | |
| | 8,856 | | | Questar Corp. | | | 223,889 | |
| | | | | | | | |
| | | | | | | 329,621 | |
| | | | | | | | |
| | | | Multi-Utilities — 4.5% | |
| | 6,132 | | | CenterPoint Energy, Inc. | | | 143,667 | |
| | 4,842 | | | CMS Energy Corp. | | | 168,264 | |
| | 1,585 | | | NiSource, Inc. | | | 67,241 | |
| | 1,885 | | | Sempra Energy | | | 209,915 | |
| | 2,451 | | | Wisconsin Energy Corp. | | | 129,277 | |
| | | | | | | | |
| | | | | | | 718,364 | |
| | | | | | | | |
| | | | Total Utilities | | | 1,495,637 | |
| | | | | | | | |
| | | | Total Common Stocks
(Cost $9,995,548) | | | 15,610,358 | |
| | | | | | | | |
| | | | | | | | |
| SHARES | | | SECURITY DESCRIPTION | | VALUE($) | |
| | | | | | | |
| Short-Term Investment — 2.8% | |
| | | | Investment Company — 2.8% | |
| | 448,474 | | | JPMorgan Prime Money Market Fund, Institutional Class Shares,
0.020% (b) (l) (m)
(Cost $448,474 ) | | | 448,474 | |
| | | | | | | | |
| | | | Total Investments — 100.4%
(Cost $10,444,022 | | | 16,058,832 | |
| | | | Liabilities in Excess of
Other Assets — (0.4)% | | | (65,748 | ) |
| | | | | | | | |
| | | | NET ASSETS — 100.0% | | $ | 15,993,084 | |
| | | | | | | | |
Percentages indicated are based on net assets.
SEE NOTES TO FINANCIAL STATEMENTS.
| | | | | | |
| | | |
| 28 | | | | J.P. MORGAN MID CAP/MULTI-CAP FUNDS | | DECEMBER 31, 2014 |
JPMorgan Multi-Cap Market Neutral Fund
SCHEDULE OF PORTFOLIO INVESTMENTS
AS OF DECEMBER 31, 2014 (Unaudited)
(Amounts in thousands)
| | | | | | | | |
| SHARES | | | SECURITY DESCRIPTION | | VALUE($) | |
| | | | | | | |
| Long Positions — 99.1% (j) | |
| Common Stocks — 92.8% | |
| | | | Consumer Discretionary — 16.2% | |
| | | | Auto Components — 0.4% | |
| | 57 | | | Dana Holding Corp. | | | 1,236 | |
| | | | | | | | |
| | | | Diversified Consumer Services — 1.7% | |
| | 67 | | | Apollo Education Group, Inc. (a) | | | 2,281 | |
| | 63 | | | DeVry Education Group, Inc. | | | 2,979 | |
| | | | | | | | |
| | | | | | | 5,260 | |
| | | | | | | | |
| | | | Hotels, Restaurants & Leisure — 1.9% | |
| | 87 | | | Restaurant Brands International, Inc., (Canada) (a) | | | 3,400 | |
| | 33 | | | Royal Caribbean Cruises Ltd. | | | 2,741 | |
| | | | | | | | |
| | | | | | | 6,141 | |
| | | | | | | | |
| | | | Household Durables — 1.1% | |
| | 1 | | | NVR, Inc. (a) | | | 733 | |
| | 134 | | | PulteGroup, Inc. | | | 2,877 | |
| | | | | | | | |
| | | | | | | 3,610 | |
| | | | | | | | |
| | | | Internet & Catalog Retail — 0.8% | |
| | 15 | | | Expedia, Inc. | | | 1,319 | |
| | 37 | | | Liberty Interactive Corp., Class A (a) | | | 1,096 | |
| | | | | | | | |
| | | | | | | 2,415 | |
| | | | | | | | |
| | | | Media — 1.8% | |
| | 52 | | | Gannett Co., Inc. | | | 1,652 | |
| | 82 | | | Live Nation Entertainment, Inc. (a) | | | 2,133 | |
| | 6 | | | Regal Entertainment Group, Class A | | | 138 | |
| | 20 | | | Time Warner, Inc. | | | 1,749 | |
| | 9 | | | Time, Inc. | | | 210 | |
| | | | | | | | |
| | | | | | | 5,882 | |
| | | | | | | | |
| | | | Multiline Retail — 1.8% | |
| | 51 | | | Big Lots, Inc. | | | 2,046 | |
| | 19 | | | Dillard’s, Inc., Class A | | | 2,380 | |
| | 21 | | | Macy’s, Inc. | | | 1,362 | |
| | | | | | | | |
| | | | | | | 5,788 | |
| | | | | | | | |
| | | | Specialty Retail — 5.1% | |
| | 26 | | | Abercrombie & Fitch Co., Class A | | | 750 | |
| | 86 | | | Best Buy Co., Inc. | | | 3,354 | |
| | 35 | | | Foot Locker, Inc. | | | 1,973 | |
| | 65 | | | GameStop Corp., Class A | | | 2,188 | |
| | 116 | | | Guess?, Inc. | | | 2,436 | |
| | 45 | | | Lowe’s Cos., Inc. | | | 3,105 | |
| | 147 | | | Staples, Inc. | | | 2,656 | |
| | | | | | | | |
| | | | | | | 16,462 | |
| | | | | | | | |
| | | | | | | | |
| SHARES | | | SECURITY DESCRIPTION | | VALUE($) | |
| | | | | | | |
| | | | | | | | |
| | | | | | | | |
| | | | Textiles, Apparel & Luxury Goods — 1.6% | |
| | 31 | | | Deckers Outdoor Corp. (a) | | | 2,832 | |
| | 21 | | | Hanesbrands, Inc. | | | 2,313 | |
| | | | | | | | |
| | | | | | | 5,145 | |
| | | | | | | | |
| | | | Total Consumer Discretionary | | | 51,939 | |
| | | | | | | | |
| | | | Consumer Staples — 7.2% | |
| | | | Beverages — 1.0% | |
| | 42 | | | Molson Coors Brewing Co., Class B | | | 3,097 | |
| | | | | | | | |
| | | | Food & Staples Retailing — 1.6% | |
| | 55 | | | Kroger Co. (The) | | | 3,500 | |
| | 221 | | | Rite Aid Corp. (a) | | | 1,663 | |
| | | | | | | | |
| | | | | | | 5,163 | |
| | | | | | | | |
| | | | Food Products — 2.7% | |
| | 63 | | | Archer-Daniels-Midland Co. | | | 3,299 | |
| | 25 | | | Ingredion, Inc. | | | 2,081 | |
| | 105 | | | Pilgrim’s Pride Corp. (a) | | | 3,438 | |
| | | | | | | | |
| | | | | | | 8,818 | |
| | | | | | | | |
| | | | Household Products — 1.0% | |
| | 26 | | | Energizer Holdings, Inc. | | | 3,291 | |
| | | | | | | | |
| | | | Personal Products — 0.4% | |
| | 34 | | | Herbalife Ltd. | | | 1,286 | |
| | | | | | | | |
| | | | Tobacco — 0.5% | |
| | 25 | | | Lorillard, Inc. | | | 1,549 | |
| | | | | | | | |
| | | | Total Consumer Staples | | | 23,204 | |
| | | | | | | | |
| | | | Energy — 3.0% | |
| | | | Energy Equipment & Services — 0.8% | |
| | 18 | | | Baker Hughes, Inc. | | | 995 | |
| | 81 | | | Superior Energy Services, Inc. | | | 1,636 | |
| | | | | | | | |
| | | | | | | 2,631 | |
| | | | | | | | |
| | | | Oil, Gas & Consumable Fuels — 2.2% | |
| | 19 | | | ConocoPhillips | | | 1,332 | |
| | 53 | | | Kosmos Energy Ltd., (Bermuda) (a) | | | 447 | |
| | 5 | | | Marathon Petroleum Corp. | | | 460 | |
| | 21 | | | Newfield Exploration Co. (a) | | | 571 | |
| | 17 | | | Tesoro Corp. | | | 1,261 | |
| | 33 | | | Valero Energy Corp. | | | 1,625 | |
| | 22 | | | World Fuel Services Corp. | | | 1,026 | |
| | 15 | | | WPX Energy, Inc. (a) | | | 179 | |
| | | | | | | | |
| | | | | | | 6,901 | |
| | | | | | | | |
| | | | Total Energy | | | 9,532 | |
| | | | | | | | |
SEE NOTES TO FINANCIAL STATEMENTS.
| | | | | | | | |
| | | |
| DECEMBER 31, 2014 | | J.P. MORGAN MID CAP/MULTI-CAP FUNDS | | | | | 29 | |
JPMorgan Multi-Cap Market Neutral Fund
SCHEDULE OF PORTFOLIO INVESTMENTS
AS OF DECEMBER 31, 2014 (Unaudited) (continued)
(Amounts in thousands)
| | | | | | | | |
| SHARES | | | SECURITY DESCRIPTION | | VALUE($) | |
| | | | | | | |
| Long Positions — continued | |
| Common Stocks — continued | |
| | | | Financials — 4.7% | |
| | | | Banks — 0.7% | |
| | 78 | | | KeyCorp | | | 1,085 | |
| | 37 | | | Popular, Inc., (Puerto Rico) (a) | | | 1,254 | |
| | | | | | | | |
| | | | | | | 2,339 | |
| | | | | | | | |
| | | | Capital Markets — 1.5% | |
| | 79 | | | E*TRADE Financial Corp. (a) | | | 1,909 | |
| | 56 | | | Lazard Ltd., (Bermuda), Class A | | | 2,807 | |
| | | | | | | | |
| | | | | | | 4,716 | |
| | | | | | | | |
| | | | Consumer Finance — 0.5% | |
| | 28 | | | Discover Financial Services | | | 1,820 | |
| | | | | | | | |
| | | | Insurance — 0.8% | |
| | 14 | | | Aspen Insurance Holdings Ltd., (Bermuda) | | | 595 | |
| | 3 | | | Everest Re Group Ltd., (Bermuda) | | | 453 | |
| | 16 | | | Prudential Financial, Inc. | | | 1,456 | |
| | | | | | | | |
| | | | | | | 2,504 | |
| | | | | | | | |
| | | | Real Estate Investment Trusts (REITs) — 1.2% | |
| | 17 | | | NorthStar Realty Finance Corp. | | | 301 | |
| | 107 | | | RLJ Lodging Trust | | | 3,585 | |
| | | | | | | | |
| | | | | | | 3,886 | |
| | | | | | | | |
| | | | Total Financials | | | 15,265 | |
| | | | | | | | |
| | | | Health Care — 12.2% | |
| | | | Biotechnology — 2.2% | |
| | 10 | | | Amgen, Inc. | | | 1,630 | |
| | 15 | | | Gilead Sciences, Inc. (a) | | | 1,371 | |
| | 12 | | | United Therapeutics Corp. (a) | | | 1,613 | |
| | 21 | | | Vertex Pharmaceuticals, Inc. (a) | | | 2,448 | |
| | | | | | | | |
| | | | | | | 7,062 | |
| | | | | | | | |
| | | | Health Care Equipment & Supplies — 3.1% | |
| | 24 | | | Alere, Inc. (a) | | | 895 | |
| | 11 | | | Becton, Dickinson and Co. | | | 1,568 | |
| | 41 | | | Hologic, Inc. (a) | | | 1,104 | |
| | 39 | | | Medtronic, Inc. | | | 2,826 | |
| | 37 | | | Stryker Corp. | | | 3,504 | |
| | | | | | | | |
| | | | | | | 9,897 | |
| | | | | | | | |
| | | | Health Care Providers & Services — 5.9% | |
| | 20 | | | Aetna, Inc. | | | 1,770 | |
| | 26 | | | Anthem, Inc. | | | 3,208 | |
| | 41 | | | Cardinal Health, Inc. | | | 3,276 | |
| | 12 | | | Cigna Corp. | | | 1,267 | |
| | 45 | | | Express Scripts Holding Co. (a) | | | 3,787 | |
| | 58 | | | Health Net, Inc. (a) | | | 3,111 | |
| | | | | | | | |
| SHARES | | | SECURITY DESCRIPTION | | VALUE($) | |
| | | | | | | |
| | | | | | | | |
| | | | | | | | |
| | | | Health Care Providers & Services — continued | |
| | 3 | | | Laboratory Corp. of America Holdings (a) | | | 337 | |
| | 29 | | | Omnicare, Inc. | | | 2,104 | |
| | | | | | | | |
| | | | | | | 18,860 | |
| | | | | | | | |
| | | | Pharmaceuticals — 1.0% | |
| | 107 | | | Pfizer, Inc. | | | 3,328 | |
| | | | | | | | |
| | | | Total Health Care | | | 39,147 | |
| | | | | | | | |
| | | | Industrials — 13.9% | |
| | | | Aerospace & Defense — 1.4% | |
| | 12 | | | General Dynamics Corp. | | | 1,703 | |
| | 12 | | | Huntington Ingalls Industries, Inc. | | | 1,392 | |
| | 10 | | | Northrop Grumman Corp. | | | 1,438 | |
| | | | | | | | |
| | | | | | | 4,533 | |
| | | | | | | | |
| | | | Air Freight & Logistics — 0.5% | |
| | 9 | | | FedEx Corp. | | | 1,606 | |
| | | | | | | | |
| | | | Airlines — 1.5% | |
| | 17 | | | Alaska Air Group, Inc. | | | 1,003 | |
| | 22 | | | Delta Air Lines, Inc. | | | 1,090 | |
| | 64 | | | Southwest Airlines Co. | | | 2,702 | |
| | | | | | | | |
| | | | | | | 4,795 | |
| | | | | | | | |
| | | | Commercial Services & Supplies — 1.1% | |
| | 128 | | | Pitney Bowes, Inc. | | | 3,126 | |
| | 23 | | | R.R. Donnelley & Sons Co. | | | 387 | |
| | | | | | | | |
| | | | | | | 3,513 | |
| | | | | | | | |
| | | | Construction & Engineering — 1.5% | |
| | 101 | | | AECOM Technology Corp. (a) | | | 3,057 | |
| | 109 | | | KBR, Inc. | | | 1,845 | |
| | | | | | | | |
| | | | | | | 4,902 | |
| | | | | | | | |
| | | | Electrical Equipment — 1.0% | |
| | 43 | | | Regal-Beloit Corp. | | | 3,221 | |
| | | | | | | | |
| | | | Machinery — 5.1% | |
| | 91 | | | Allison Transmission Holdings, Inc. | | | 3,072 | |
| | 42 | | | IDEX Corp. | | | 3,244 | |
| | 32 | | | Illinois Tool Works, Inc. | | | 3,052 | |
| | 24 | | | Joy Global, Inc. | | | 1,123 | |
| | 24 | | | Parker-Hannifin Corp. | | | 3,075 | |
| | 32 | | | SPX Corp. | | | 2,707 | |
| | | | | | | | |
| | | | | | | 16,273 | |
| | | | | | | | |
| | | | Professional Services — 1.2% | |
| | 26 | | | Dun & Bradstreet Corp. (The) | | | 3,085 | |
| | 12 | | | ManpowerGroup, Inc. | | | 816 | |
| | | | | | | | |
| | | | | | | 3,901 | |
| | | | | | | | |
SEE NOTES TO FINANCIAL STATEMENTS.
| | | | | | |
| | | |
| 30 | | | | J.P. MORGAN MID CAP/MULTI-CAP FUNDS | | DECEMBER 31, 2014 |
| | | | | | | | |
| SHARES | | | SECURITY DESCRIPTION | | VALUE($) | |
| | | | | | | |
| Long Positions — continued | |
| Common Stocks — continued | |
| | | | Road & Rail — 0.6% | |
| | 26 | | | Landstar System, Inc. | | | 1,870 | |
| | | | | | | | |
| | | | Total Industrials | | | 44,614 | |
| | | | | | | | |
| | | | Information Technology — 25.4% | |
| | | | Communications Equipment — 2.5% | |
| | 103 | | | ARRIS Group, Inc. (a) | | | 3,112 | |
| | 268 | | | Brocade Communications Systems, Inc. | | | 3,172 | |
| | 5 | | | Harris Corp. | | | 346 | |
| | 109 | | | Polycom, Inc. (a) | | | 1,474 | |
| | | | | | | | |
| | | | | | | 8,104 | |
| | | | | | | | |
| | | | Electronic Equipment, Instruments & Components — 0.4% | |
| | 81 | | | Vishay Intertechnology, Inc. | | | 1,144 | |
| | | | | | | | |
| | | | Internet Software & Services — 2.1% | |
| | 36 | | | eBay, Inc. (a) | | | 2,014 | |
| | 23 | | | LendingClub Corp. (a) | | | 583 | |
| | 23 | | | VeriSign, Inc. (a) | | | 1,288 | |
| | 60 | | | Yahoo!, Inc. (a) | | | 3,018 | |
| | | | | | | | |
| | | | | | | 6,903 | |
| | | | | | | | |
| | | | IT Services — 4.8% | |
| | 63 | | | Amdocs Ltd. | | | 2,916 | |
| | 69 | | | Broadridge Financial Solutions, Inc. | | | 3,207 | |
| | 21 | | | Computer Sciences Corp. | | | 1,350 | |
| | 13 | | | Global Payments, Inc. | | | 1,045 | |
| | 71 | | | Leidos Holdings, Inc. | | | 3,088 | |
| | 16 | | | VeriFone Systems, Inc. (a) | | | 598 | |
| | 174 | | | Western Union Co. (The) | | | 3,117 | |
| | | | | | | | |
| | | | | | | 15,321 | |
| | | | | | | | |
| | | | Semiconductors & Semiconductor Equipment — 1.7% | |
| | 77 | | | Broadcom Corp., Class A | | | 3,315 | |
| | 6 | | | Lam Research Corp. | | | 455 | |
| | 82 | | | NVIDIA Corp. | | | 1,642 | |
| | | | | | | | |
| | | | | | | 5,412 | |
| | | | | | | | |
| | | | Software — 8.9% | |
| | 59 | | | Activision Blizzard, Inc. | | | 1,195 | |
| | 27 | | | Aspen Technology, Inc. (a) | | | 953 | |
| | 104 | | | CA, Inc. | | | 3,162 | |
| | 59 | | | Cadence Design Systems, Inc. (a) | | | 1,112 | |
| | 29 | | | Citrix Systems, Inc. (a) | | | 1,845 | |
| | 70 | | | Electronic Arts, Inc. (a) | | | 3,280 | |
| | 36 | | | Intuit, Inc. | | | 3,333 | |
| | 213 | | | Nuance Communications, Inc. (a) | | | 3,034 | |
| | 70 | | | Oracle Corp. | | | 3,128 | |
| | 59 | | | PTC, Inc. (a) | | | 2,177 | |
| | | | | | | | |
| SHARES | | | SECURITY DESCRIPTION | | VALUE($) | |
| | | | | | | |
| | | | | | | | |
| | | | | | | | |
| | | | Software — continued | |
| | 142 | | | Rovi Corp. (a) | | | 3,197 | |
| | 80 | | | Symantec Corp. | | | 2,056 | |
| | | | | | | | |
| | | | | | | 28,472 | |
| | | | | | | | |
| | | | Technology Hardware, Storage & Peripherals — 5.0% | |
| | 30 | | | Apple, Inc. | | | 3,262 | |
| | 84 | | | Hewlett-Packard Co. | | | 3,370 | |
| | 67 | | | Lexmark International, Inc., Class A | | | 2,772 | |
| | 77 | | | NetApp, Inc. | | | 3,198 | |
| | 32 | | | Western Digital Corp. | | | 3,547 | |
| | | | | | | | |
| | | | | | | 16,149 | |
| | | | | | | | |
| | | | Total Information Technology | | | 81,505 | |
| | | | | | | | |
| | | | Materials — 4.1% | |
| | | | Chemicals — 0.2% | |
| | 9 | | | Scotts Miracle-Gro Co. (The), Class A | | | 544 | |
| | | | | | | | |
| | | | Containers & Packaging — 1.9% | |
| | 20 | | | Ball Corp. | | | 1,366 | |
| | 83 | | | Sealed Air Corp. | | | 3,536 | |
| | 21 | | | Silgan Holdings, Inc. | | | 1,103 | |
| | | | | | | | |
| | | | | | | 6,005 | |
| | | | | | | | |
| | | | Metals & Mining — 1.2% | |
| | 36 | | | Steel Dynamics, Inc. | | | 701 | |
| | 78 | | | United States Steel Corp. | | | 2,090 | |
| | 34 | | | Worthington Industries, Inc. | | | 1,014 | |
| | | | | | | | |
| | | | | | | 3,805 | |
| | | | | | | | |
| | | | Paper & Forest Products — 0.8% | |
| | 68 | | | Domtar Corp., (Canada) | | | 2,750 | |
| | | | | | | | |
| | | | Total Materials | | | 13,104 | |
| | | | | | | | |
| | | | Telecommunication Services — 2.7% | |
| | | | Diversified Telecommunication Services — 2.7% | |
| | 103 | | | AT&T, Inc. | | | 3,456 | |
| | 80 | | | CenturyLink, Inc. | | | 3,174 | |
| | 309 | | | Frontier Communications Corp. | | | 2,063 | |
| | | | | | | | |
| | | | Total Telecommunication Services | | | 8,693 | |
| | | | | | | | |
| | | | Utilities — 3.4% | |
| | | | Gas Utilities — 1.0% | |
| | 85 | | | UGI Corp. | | | 3,234 | |
| | | | | | | | |
| | | | Independent Power & Renewable Electricity Producers — 2.4% | |
| | 243 | | | AES Corp. | | | 3,346 | |
| | 71 | | | Calpine Corp. (a) | | | 1,562 | |
SEE NOTES TO FINANCIAL STATEMENTS.
| | | | | | | | |
| | | |
| DECEMBER 31, 2014 | | J.P. MORGAN MID CAP/MULTI-CAP FUNDS | | | | | 31 | |
JPMorgan Multi-Cap Market Neutral Fund
SCHEDULE OF PORTFOLIO INVESTMENTS
AS OF DECEMBER 31, 2014 (Unaudited) (continued)
(Amounts in thousands)
| | | | | | | | |
| SHARES | | | SECURITY DESCRIPTION | | VALUE($) | |
| | | | | | | |
| Long Positions — continued | |
| Common Stocks — continued | |
| | | | Independent Power & Renewable Electricity Producers — continued | |
| | 95 | | | Dynegy, Inc. (a) | | | 2,871 | |
| | | | | | | | |
| | | | | | | 7,779 | |
| | | | | | | | |
| | | | Total Utilities | | | 11,013 | |
| | | | | | | | |
| | | | Total Common Stocks
(Cost $235,301) | | | 298,016 | |
| | | | | | | | |
| Short-Term Investment — 6.3% | |
| | | | Investment Company— 6.3% | |
| | 20,186 | | | JPMorgan Liquid Assets Money Market Fund, Institutional Class Shares, 0.030% (b) (l)
(Cost $20,186 ) | | | 20,186 | |
| | | | | | | | |
| | | | Total Investments — 99.1%
(Cost $255,487) | | | 318,202 | |
| | | | Other Assets in Excess of
Liabilities — 0.9% (c) | | | 2,806 | |
| | | | | | | | |
| | | | NET ASSETS — 100.0% | | $ | 321,008 | |
| | | | | | | | |
| Short Positions — 92.6% | |
| Common Stocks — 92.6% | |
| | | | Consumer Discretionary — 16.5% | | | | |
| | | | Distributors — 1.0% | |
| | 113 | | | LKQ Corp. (a) | | | 3,186 | |
| | | | | | | | |
| | | | Hotels, Restaurants & Leisure — 3.7% | |
| | 6 | | | McDonald’s Corp. | | | 554 | |
| | 67 | | | Norwegian Cruise Line Holdings Ltd. (a) | | | 3,139 | |
| | 19 | | | Panera Bread Co., Class A (a) | | | 3,286 | |
| | 36 | | | Starbucks Corp. | | | 2,929 | |
| | 14 | | | Wynn Resorts Ltd. | | | 2,083 | |
| | | | | | | | |
| | | | | | | 11,991 | |
| | | | | | | | |
| | | | Household Durables — 1.1% | |
| | 13 | | | Mohawk Industries, Inc. (a) | | | 2,028 | |
| | 41 | | | Toll Brothers, Inc. (a) | | | 1,411 | |
| | | | | | | | |
| | | | | | | 3,439 | |
| | | | | | | | |
| | | | Internet & Catalog Retail — 0.8% | |
| | 3 | | | Amazon.com, Inc. (a) | | | 1,063 | |
| | 176 | | | Groupon, Inc. (a) | | | 1,456 | |
| | | | | | | | |
| | | | | | | 2,519 | |
| | | | | | | | |
| | | | Leisure Products — 0.2% | |
| | 19 | | | Mattel, Inc. | | | 583 | |
| | | | | | | | |
| | | | Media — 3.1% | |
| | 35 | | | AMC Networks, Inc., Class A (a) | | | 2,247 | |
| | 20 | | | Charter Communications, Inc., Class A (a) | | | 3,353 | |
| | 61 | | | DreamWorks Animation SKG, Inc., Class A (a) | | | 1,361 | |
| | 40 | | | Madison Square Garden Co. (The), Class A (a) | | | 3,029 | |
| | | | | | | | |
| | | | | | | 9,990 | |
| | | | | | | | |
| | | | | | | | |
| SHARES | | | SECURITY DESCRIPTION | | VALUE($) | |
| | | | | | | |
| | | | | | | | |
| | | | | | | | |
| | | | Specialty Retail — 5.4% | |
| | 228 | | | American Eagle Outfitters, Inc. | | | 3,166 | |
| | 59 | | | Cabela’s, Inc. (a) | | | 3,109 | |
| | 55 | | | CarMax, Inc. (a) | | | 3,693 | |
| | 11 | | | Restoration Hardware Holdings, Inc. (a) | | | 1,020 | |
| | 24 | | | Signet Jewelers Ltd., (Bermuda) | | | 3,147 | |
| | 39 | | | Tractor Supply Co. | | | 3,065 | |
| | | | | | | | |
| | | | | | | 17,200 | |
| | | | | | | | |
| | | | Textiles, Apparel & Luxury Goods — 1.2% | |
| | 100 | | | Kate Spade & Co. (a) | | | 3,209 | |
| | 12 | | | Under Armour, Inc., Class A (a) | | | 808 | |
| | | | | | | | |
| | | | | | | 4,017 | |
| | | | | | | | |
| | | | Total Consumer Discretionary | | | 52,925 | |
| | | | | | | | |
| | | | Consumer Staples — 7.7% | |
| | | | Beverages — 1.4% | |
| | 4 | | | Boston Beer Co., Inc. (The), Class A (a) | | | 1,231 | |
| | 36 | | | Brown-Forman Corp., Class B | | | 3,152 | |
| | | | | | | | |
| | | | | | | 4,383 | |
| | | | | | | | |
| | | | Food & Staples Retailing — 1.6% | |
| | 55 | | | Fresh Market, Inc. (The) (a) | | | 2,264 | |
| | 38 | | | United Natural Foods, Inc. (a) | | | 2,930 | |
| | | | | | | | |
| | | | | | | 5,194 | |
| | | | | | | | |
| | | | Food Products — 3.2% | |
| | 98 | | | Darling Ingredients, Inc. (a) | | | 1,788 | |
| | 98 | | | Flowers Foods, Inc. | | | 1,889 | |
| | 58 | | | Hain Celestial Group, Inc. (The) (a) | | | 3,390 | |
| | 45 | | | McCormick & Co., Inc. (Non-Voting) | | | 3,322 | |
| | | | | | | | |
| | | | | | | 10,389 | |
| | | | | | | | |
| | | | Household Products — 0.4% | |
| | 12 | | | Procter & Gamble Co. (The) | | | 1,097 | |
| | | | | | | | |
| | | | Personal Products — 1.1% | |
| | 46 | | | Estee Lauder Cos., Inc. (The), Class A | | | 3,475 | |
| | | | | | | | |
| | | | Total Consumer Staples | | | 24,538 | |
| | | | | | | | |
| | | | Energy — 4.5% | |
| | | | Energy Equipment & Services — 1.4% | |
| | 503 | | | McDermott International, Inc. (a) | | | 1,465 | |
| | 56 | | | Noble Corp. plc, (United Kingdom) | | | 931 | |
| | 50 | | | Seadrill Ltd., (Bermuda) | | | 596 | |
| | 74 | | | Transocean Ltd., (Switzerland) | | | 1,358 | |
| | | | | | | | |
| | | | | | | 4,350 | |
| | | | | | | | |
SEE NOTES TO FINANCIAL STATEMENTS.
| | | | | | |
| | | |
| 32 | | | | J.P. MORGAN MID CAP/MULTI-CAP FUNDS | | DECEMBER 31, 2014 |
| | | | | | | | |
| SHARES | | | SECURITY DESCRIPTION | | VALUE($) | |
| | | | | | | |
| Short Positions — continued | |
| Common Stocks — continued | |
| | | | Oil, Gas & Consumable Fuels — 3.1% | |
| | 59 | | | Antero Resources Corp. (a) | | | 2,379 | |
| | 36 | | | Cabot Oil & Gas Corp. | | | 1,051 | |
| | 7 | | | Concho Resources, Inc. (a) | | | 703 | |
| | 80 | | | CONSOL Energy, Inc. | | | 2,696 | |
| | 35 | | | Diamondback Energy, Inc. (a) | | | 2,113 | |
| | 25 | | | Golar LNG Ltd., (Bermuda) | | | 896 | |
| | 8 | | | Whiting Petroleum Corp. (a) | | | 278 | |
| | | | | | | | |
| | | | | | | 10,116 | |
| | | | | | | | |
| | | | Total Energy | | | 14,466 | |
| | | | | | | | |
| | | | Financials — 5.1% | |
| | | | Capital Markets — 1.3% | |
| | 51 | | | Artisan Partners Asset Management, Inc., Class A | | | 2,553 | |
| | 19 | | | T. Rowe Price Group, Inc. | | | 1,654 | |
| | | | | | | | |
| | | | | | | 4,207 | |
| | | | | | | | |
| | | | Diversified Financial Services — 0.2% | |
| | 8 | | | CME Group, Inc. | | | 677 | |
| | | | | | | | |
| | | | Insurance — 1.2% | |
| | 4 | | | Markel Corp. (a) | | | 2,561 | |
| | 132 | | | MBIA, Inc. (a) | | | 1,257 | |
| | | | | | | | |
| | | | | | | 3,818 | |
| | | | | | | | |
| | | | Real Estate Investment Trusts (REITs) — 1.5% | |
| | 20 | | | Crown Castle International Corp. | | | 1,610 | |
| | 15 | | | Lamar Advertising Co., Class A | | | 793 | |
| | 60 | | | Plum Creek Timber Co., Inc. | | | 2,573 | |
| | | | | | | | |
| | | | | | | 4,976 | |
| | | | | | | | |
| | | | Real Estate Management & Development — 0.2% | |
| | 15 | | | Realogy Holdings Corp. (a) | | | 672 | |
| | | | | | | | |
| | | | Thrifts & Mortgage Finance — 0.7% | |
| | 24 | | | Ocwen Financial Corp. (a) | | | 360 | |
| | 117 | | | People’s United Financial, Inc. | | | 1,770 | |
| | | | | | | | |
| | | | | | | 2,130 | |
| | | | | | | | |
| | | | Total Financials | | | 16,480 | |
| | | | | | | | |
| | | | Health Care — 11.1% | |
| | | | Biotechnology — 1.8% | |
| | 8 | | | Alnylam Pharmaceuticals, Inc. (a) | | | 793 | |
| | 60 | | | Cepheid, Inc. (a) | | | 3,251 | |
| | 9 | | | Pharmacyclics, Inc. (a) | | | 1,067 | |
| | 1 | | | Regeneron Pharmaceuticals, Inc. (a) | | | 574 | |
| | | | | | | | |
| | | | | | | 5,685 | |
| | | | | | | | |
| | | | | | | | |
| SHARES | | | SECURITY DESCRIPTION | | VALUE($) | |
| | | | | | | |
| | | | | | | | |
| | | | | | | | |
| | | | Health Care Equipment & Supplies — 1.3% | |
| | 19 | | | Cooper Cos., Inc. (The) | | | 3,007 | |
| | 14 | | | Sirona Dental Systems, Inc. (a) | | | 1,192 | |
| | | | | | | | |
| | | | | | | 4,199 | |
| | | | | | | | |
| | | | Health Care Providers & Services — 3.5% | |
| | 53 | | | Acadia Healthcare Co., Inc. (a) | | | 3,252 | |
| | 5 | | | Henry Schein, Inc. (a) | | | 650 | |
| | 19 | | | Patterson Cos., Inc. | | | 907 | |
| | 57 | | | Team Health Holdings, Inc. (a) | | | 3,257 | |
| | 62 | | | Tenet Healthcare Corp. (a) | | | 3,151 | |
| | | | | | | | |
| | | | | | | 11,217 | |
| | | | | | | | |
| | | | Health Care Technology — 0.7% | |
| | 76 | | | Allscripts Healthcare Solutions, Inc. (a) | | | 968 | |
| | 10 | | | athenahealth, Inc. (a) | | | 1,504 | |
| | | | | | | | |
| | | | | | | 2,472 | |
| | | | | | | | |
| | | | Pharmaceuticals — 3.8% | |
| | 62 | | | Akorn, Inc. (a) | | | 2,241 | |
| | 21 | | | Eli Lilly & Co. | | | 1,430 | |
| | 18 | | | Hospira, Inc. (a) | | | 1,107 | |
| | 18 | | | Perrigo Co. plc, (Ireland) | | | 3,012 | |
| | 11 | | | Salix Pharmaceuticals Ltd. (a) | | | 1,241 | |
| | 72 | | | Zoetis, Inc. | | | 3,106 | |
| | | | | | | | |
| | | | | | | 12,137 | |
| | | | | | | | |
| | | | Total Health Care | | | 35,710 | |
| | | | | | | | |
| | | | Industrials — 17.1% | |
| | | | Aerospace & Defense — 2.9% | |
| | 17 | | | B/E Aerospace, Inc. (a) | | | 991 | |
| | 71 | | | Hexcel Corp. (a) | | | 2,930 | |
| | — | (h) | | KLX, Inc. (a) | | | — | (h) |
| | 11 | | | Precision Castparts Corp. | | | 2,707 | |
| | 39 | | | Triumph Group, Inc. | | | 2,600 | |
| | | | | | | | |
| | | | | | | 9,228 | |
| | | | | | | | |
| | | | Airlines — 0.4% | |
| | 17 | | | Spirit Airlines, Inc. (a) | | | 1,275 | |
| | | | | | | | |
| | | | Building Products — 2.2% | |
| | 59 | | | Armstrong World Industries, Inc. (a) | | | 3,029 | |
| | 45 | | | Fortune Brands Home & Security, Inc. | | | 2,046 | |
| | 53 | | | Owens Corning | | | 1,888 | |
| | | | | | | | |
| | | | | | | 6,963 | |
| | | | | | | | |
| | | | Commercial Services & Supplies — 3.1% | |
| | 86 | | | Copart, Inc. (a) | | | 3,155 | |
SEE NOTES TO FINANCIAL STATEMENTS.
| | | | | | | | |
| | | |
| DECEMBER 31, 2014 | | J.P. MORGAN MID CAP/MULTI-CAP FUNDS | | | | | 33 | |
JPMorgan Multi-Cap Market Neutral Fund
SCHEDULE OF PORTFOLIO INVESTMENTS
AS OF DECEMBER 31, 2014 (Unaudited) (continued)
(Amounts in thousands, except number of Futures contracts)
| | | | | | | | |
| SHARES | | | SECURITY DESCRIPTION | | VALUE($) | |
| | | | | | | |
| Short Positions — continued | |
| Common Stocks — continued | |
| | | | Commercial Services & Supplies — continued | |
| | 51 | | | Republic Services, Inc. | | | 2,045 | |
| | 22 | | | Stericycle, Inc. (a) | | | 2,857 | |
| | 41 | | | Waste Connections, Inc. | | | 1,807 | |
| | | | | | | | |
| | | | | | | 9,864 | |
| | | | | | | | |
| | | | Construction & Engineering — 0.8% | |
| | 94 | | | Quanta Services, Inc. (a) | | | 2,669 | |
| | | | | | | | |
| | | | Electrical Equipment — 0.2% | |
| | 16 | | | SolarCity Corp. (a) | | | 852 | |
| | | | | | | | |
| | | | Machinery — 1.4% | |
| | 22 | | | AGCO Corp. | | | 1,001 | |
| | 40 | | | CLARCOR, Inc. | | | 2,659 | |
| | 16 | | | Colfax Corp. (a) | | | 808 | |
| | | | | | | | |
| | | | | | | 4,468 | |
| | | | | | | | |
| | | | Professional Services — 0.6% | |
| | 29 | | | Verisk Analytics, Inc., Class A (a) | | | 1,864 | |
| | | | | | | | |
| | | | Road & Rail — 2.7% | |
| | 13 | | | Genesee & Wyoming, Inc., Class A (a) | | | 1,179 | |
| | 58 | | | Hertz Global Holdings, Inc. (a) | | | 1,438 | |
| | 20 | | | J.B. Hunt Transport Services, Inc. | | | 1,693 | |
| | 21 | | | Kansas City Southern | | | 2,547 | |
| | 20 | | | Ryder System, Inc. | | | 1,849 | |
| | | | | | | | |
| | | | | | | 8,706 | |
| | | | | | | | |
| | | | Trading Companies & Distributors — 2.8% | |
| | 64 | | | Fastenal Co. | | | 3,049 | |
| | 38 | | | MSC Industrial Direct Co., Inc., Class A | | | 3,110 | |
| | 12 | | | W.W. Grainger, Inc. | | | 2,970 | |
| | | | | | | | |
| | | | | | | 9,129 | |
| | | | | | | | |
| | | | Total Industrials | | | 55,018 | |
| | | | | | | | |
| | | | Information Technology — 22.3% | |
| | | | Communications Equipment — 1.4% | |
| | 41 | | | JDS Uniphase Corp. (a) | | | 566 | |
| | 11 | | | Motorola Solutions, Inc. | | | 750 | |
| | 50 | | | ViaSat, Inc. (a) | | | 3,175 | |
| | | | | | | | |
| | | | | | | 4,491 | |
| | | | | | | | |
| | | | Electronic Equipment, Instruments & Components — 3.8% | |
| | 21 | | | Amphenol Corp., Class A | | | 1,154 | |
| | 25 | | | Arrow Electronics, Inc. (a) | | | 1,429 | |
| | 33 | | | FEI Co. | | | 2,952 | |
| | 91 | | | Ingram Micro, Inc., Class A (a) | | | 2,513 | |
| | 19 | | | IPG Photonics Corp. (a) | | | 1,386 | |
| | 100 | | | Trimble Navigation Ltd. (a) | | | 2,654 | |
| | | | | | | | |
| | | | | | | 12,088 | |
| | | | | | | | |
| | | | | | | | |
| SHARES | | | SECURITY DESCRIPTION | | VALUE($) | |
| | | | | | | |
| | | | | | | | |
| | | | | | | | |
| | | | Internet Software & Services — 3.9% | |
| | 18 | | | CoStar Group, Inc. (a) | | | 3,278 | |
| | 15 | | | LinkedIn Corp., Class A (a) | | | 3,526 | |
| | 124 | | | Pandora Media, Inc. (a) | | | 2,211 | |
| | 12 | | | Rackspace Hosting, Inc. (a) | | | 566 | |
| | 74 | | | Twitter, Inc. (a) | | | 2,672 | |
| | 6 | | | Yelp, Inc. (a) | | | 335 | |
| | | | | | | | |
| | | | | | | 12,588 | |
| | | | | | | | |
| | | | IT Services — 3.8% | |
| | 35 | | | Accenture plc, (Ireland), Class A | | | 3,081 | |
| | 27 | | | Automatic Data Processing, Inc. | | | 2,215 | |
| | 61 | | | CoreLogic, Inc. (a) | | | 1,924 | |
| | 11 | | | FleetCor Technologies, Inc. (a) | | | 1,688 | |
| | 69 | | | Paychex, Inc. | | | 3,184 | |
| | | | | | | | |
| | | | | | | 12,092 | |
| | | | | | | | |
| | | | Semiconductors & Semiconductor Equipment — 1.6% | |
| | 200 | | | Advanced Micro Devices, Inc. (a) | | | 534 | |
| | 22 | | | Analog Devices, Inc. | | | 1,238 | |
| | 30 | | | Avago Technologies Ltd., (Singapore) | | | 3,040 | |
| | 26 | | | SunEdison, Inc. (a) | | | 511 | |
| | | | | | | | |
| | | | | | | 5,323 | |
| | | | | | | | |
| | | | Software — 6.0% | |
| | 61 | | | CommVault Systems, Inc. (a) | | | 3,145 | |
| | 101 | | | FireEye, Inc. (a) | | | 3,175 | |
| | 28 | | | NetSuite, Inc. (a) | | | 3,043 | |
| | 26 | | | ServiceNow, Inc. (a) | | | 1,740 | |
| | 35 | | | Splunk, Inc. (a) | | | 2,037 | |
| | 5 | | | Tableau Software, Inc., Class A (a) | | | 384 | |
| | 22 | | | Ultimate Software Group, Inc. (The) (a) | | | 3,208 | |
| | 931 | | | Zynga, Inc., Class A (a) | | | 2,475 | |
| | | | | | | | |
| | | | | | | 19,207 | |
| | | | | | | | |
| | | | Technology Hardware, Storage & Peripherals — 1.8% | |
| | 108 | | | NCR Corp. (a) | | | 3,136 | |
| | 30 | | | Stratasys Ltd. (a) | | | 2,517 | |
| | | | | | | | |
| | | | | | | 5,653 | |
| | | | | | | | |
| | | | Total Information Technology | | | 71,442 | |
| | | | | | | | |
| | | | Materials — 3.9% | |
| | | | Chemicals — 2.8% | |
| | 18 | | | Air Products & Chemicals, Inc. | | | 2,591 | |
| | 52 | | | FMC Corp. | | | 2,962 | |
| | 28 | | | Praxair, Inc. | | | 3,617 | |
| | | | | | | | |
| | | | | | | 9,170 | |
| | | | | | | | |
SEE NOTES TO FINANCIAL STATEMENTS.
| | | | | | |
| | | |
| 34 | | | | J.P. MORGAN MID CAP/MULTI-CAP FUNDS | | DECEMBER 31, 2014 |
| | | | | | | | |
| SHARES | | | SECURITY DESCRIPTION | | VALUE($) | |
| | | | | | | |
| Short Positions — continued | |
| Common Stocks — continued | |
| | | | Metals & Mining — 1.1% | |
| | 44 | | | Carpenter Technology Corp. | | | 2,184 | |
| | 32 | | | Southern Copper Corp. | | | 894 | |
| | 11 | | | TimkenSteel Corp. | | | 395 | |
| | | | | | | | |
| | | | | | | 3,473 | |
| | | | | | | | |
| | | | Total Materials | | | 12,643 | |
| | | | | | | | |
| | | | Telecommunication Services — 1.4% | |
| | | | Wireless Telecommunication Services — 1.4% | |
| | 376 | | | Sprint Corp. (a) | | | 1,562 | |
| | 84 | | | Telephone & Data Systems, Inc. | | | 2,116 | |
| | 18 | | | United States Cellular Corp. (a) | | | 703 | |
| | | | | | | | |
| | | | Total Telecommunication Services | | | 4,381 | |
| | | | | | | | |
| | | | | | | | |
| SHARES | | | SECURITY DESCRIPTION | | VALUE($) | |
| | | | | | | |
| | | | | | | | |
| | | | | | | | |
| | | | Utilities — 3.0% | |
| | | | Electric Utilities — 1.0% | |
| | 43 | | | Southern Co. (The) | | | 2,114 | |
| | 30 | | | Xcel Energy, Inc. | | | 1,084 | |
| | | | | | | | |
| | | | | | | 3,198 | |
| | | | | | | | |
| | | | Multi-Utilities — 2.0% | |
| | 46 | | | Dominion Resources, Inc. | | | 3,550 | |
| | 69 | | | NiSource, Inc. | | | 2,927 | |
| | | | | | | | |
| | | | | | | 6,477 | |
| | | | | | | | |
| | | | Total Utilities | | | 9,675 | |
| | | | | | | | |
| | | | Total Securities Sold Short
(Proceeds $291,535) | | $ | 297,278 | |
| | | | | | | | |
Percentages indicated are based on net assets.
| | | | | | | | | | | | | | | | |
| Futures Contracts | |
NUMBER OF
CONTRACTS | | | DESCRIPTION | | EXPIRATION
DATE | | | NOTIONAL
VALUE AT
DECEMBER 31, 2014 | | | NET
UNREALIZED
APPRECIATION
(DEPRECIATION) | |
| | | | Short Futures Outstanding | | | | | | | | | | | | |
| | (7 | ) | | S&P Mid Cap 400 | | | 03/20/15 | | | $ | (1,014 | ) | | $ | 12 | |
| | (5 | ) | | E-mini S&P 500 | | | 03/20/15 | | | | (513 | ) | | | 6 | |
| | | | | | | | | | | | | | | | |
| | | | | | | | | | | | | | $ | 18 | |
| | | | | | | | | | | | | | | | |
SEE NOTES TO FINANCIAL STATEMENTS.
| | | | | | | | |
| | | |
| DECEMBER 31, 2014 | | J.P. MORGAN MID CAP/MULTI-CAP FUNDS | | | | | 35 | |
JPMorgan Value Advantage Fund
SCHEDULE OF PORTFOLIO INVESTMENTS
AS OF DECEMBER 31, 2014 (Unaudited)
(Amounts in thousands)
| | | | | | | | |
| SHARES | | | SECURITY DESCRIPTION | | VALUE($) | |
| Common Stocks — 91.6% | | | | |
| | | | Consumer Discretionary — 14.9% | | | | |
| | | | Distributors — 0.4% | | | | |
| | 369 | | | Genuine Parts Co. | | | 39,292 | |
| | | | | | | | |
| | | | Hotels, Restaurants & Leisure — 0.7% | | | | |
| | 1,489 | | | ClubCorp Holdings, Inc. | | | 26,701 | |
| | 2,166 | | | La Quinta Holdings, Inc. (a) | | | 47,773 | |
| | | | | | | | |
| | | | | | | 74,474 | |
| | | | | | | | |
| | | | Household Durables — 0.6% | | | | |
| | 2,281 | | | Brookfield Residential Properties, Inc., (Canada) (a) | | | 54,874 | |
| | | | | | | | |
| | | | Internet & Catalog Retail — 1.3% | | | | |
| | 1,485 | | | Expedia, Inc. | | | 126,726 | |
| | | | | | | | |
| | | | Media — 5.1% | | | | |
| | 623 | | | CBS Corp. (Non-Voting), Class B | | | 34,477 | |
| | 461 | | | DIRECTV (a) | | | 40,003 | |
| | 2,199 | | | DISH Network Corp., Class A (a) | | | 160,278 | |
| | 1,642 | | | Entercom Communications Corp., Class A (a) | | | 19,962 | |
| | 1,275 | | | Gannett Co., Inc. | | | 40,724 | |
| | 933 | | | Omnicom Group, Inc. | | | 72,256 | |
| | 514 | | | Time Warner, Inc. | | | 43,880 | |
| | 1,744 | | | Time, Inc. | | | 42,912 | |
| | 1,287 | | | Twenty-First Century Fox, Inc., Class B | | | 47,463 | |
| | | | | | | | |
| | | | | | | 501,955 | |
| | | | | | | | |
| | | | Multiline Retail — 1.5% | | | | |
| | 2,360 | | | Kohl’s Corp. | | | 144,024 | |
| | | | | | | | |
| | | | Specialty Retail — 4.4% | | | | |
| | 153 | | | AutoZone, Inc. (a) | | | 94,922 | |
| | 1,034 | | | Bed Bath & Beyond, Inc. (a) | | | 78,767 | |
| | 2,673 | | | Best Buy Co., Inc. | | | 104,198 | |
| | 1,835 | | | Gap, Inc. (The) | | | 77,280 | |
| | 749 | | | Home Depot, Inc. (The) | | | 78,582 | |
| | | | | | | | |
| | | | | | | 433,749 | |
| | | | | | | | |
| | | | Textiles, Apparel & Luxury Goods — 0.9% | | | | |
| | 654 | | | Coach, Inc. | | | 24,572 | |
| | 597 | | | Hanesbrands, Inc. | | | 66,659 | |
| | | | | | | | |
| | | | | | | 91,231 | |
| | | | | | | | |
| | | | Total Consumer Discretionary | | | 1,466,325 | |
| | | | | | | | |
| | | | Consumer Staples — 4.7% | | | | |
| | | | Beverages — 0.8% | | | | |
| | 1,055 | | | Dr. Pepper Snapple Group, Inc. | | | 75,592 | |
| | | | | | | | |
| | | | Food & Staples Retailing — 1.5% | | | | |
| | 809 | | | CVS Health Corp. | | | 77,886 | |
| | | | | | | | |
| SHARES | | | SECURITY DESCRIPTION | | VALUE($) | |
| | | | | | | | |
| | | | Food & Staples Retailing — continued | |
| | 1,131 | | | Kroger Co. (The) | | | 72,621 | |
| | | | | | | | |
| | | | | | | 150,507 | |
| | | | | | | | |
| | | | Food Products — 1.0% | |
| | 1,081 | | | Post Holdings, Inc. (a) | | | 45,279 | |
| | 635 | | | TreeHouse Foods, Inc. (a) | | | 54,276 | |
| | | | | | | | |
| | | | | | | 99,555 | |
| | | | | | | | |
| | | | Household Products — 1.4% | |
| | 1,546 | | | Procter & Gamble Co. (The) | | | 140,816 | |
| | | | | | | | |
| | | | Total Consumer Staples | | | 466,470 | |
| | | | | | | | |
| | | | Energy — 7.1% | |
| | | | Oil, Gas & Consumable Fuels — 7.1% | |
| | 2,223 | | | CONSOL Energy, Inc. | | | 75,153 | |
| | 1,205 | | | Devon Energy Corp. | | | 73,752 | |
| | 2,718 | | | Exxon Mobil Corp. | | | 251,297 | |
| | 1,049 | | | Kinder Morgan, Inc. | | | 44,375 | |
| | 1,646 | | | Marathon Oil Corp. | | | 46,571 | |
| | 1,923 | | | PBF Energy, Inc., Class A | | | 51,230 | |
| | 1,444 | | | Phillips 66 | | | 103,549 | |
| | 1,868 | | | Southwestern Energy Co. (a) | | | 50,978 | |
| | | | | | | | |
| | | | Total Energy | | | 696,905 | |
| | | | | | | | |
| | | | Financials — 32.1% | |
| | | | Banks — 11.8% | |
| | 9,141 | | | Bank of America Corp. | | | 163,533 | |
| | 2,322 | | | Citigroup, Inc. | | | 125,635 | |
| | 2,042 | | | Citizens Financial Group, Inc. | | | 50,752 | |
| | 3,593 | | | Fifth Third Bancorp | | | 73,208 | |
| | 861 | | | First Republic Bank | | | 44,879 | |
| | 429 | | | M&T Bank Corp. | | | 53,872 | |
| | 1,154 | | | National Bank Holdings Corp., Class A | | | 22,394 | |
| | 1,088 | | | PNC Financial Services Group, Inc. (The) | | | 99,258 | |
| | 2,302 | | | SunTrust Banks, Inc. | | | 96,433 | |
| | 2,397 | | | U.S. Bancorp | | | 107,732 | |
| | 5,993 | | | Wells Fargo & Co. | | | 328,547 | |
| | | | | | | | |
| | | | | | | 1,166,243 | |
| | | | | | | | |
| | | | Capital Markets — 3.4% | |
| | 454 | | | Ameriprise Financial, Inc. | | | 60,002 | |
| | 1,756 | | | Legg Mason, Inc. | | | 93,692 | |
| | 726 | | | Northern Trust Corp. | | | 48,927 | |
| | 1,549 | | | T. Rowe Price Group, Inc. | | | 133,025 | |
| | | | | | | | |
| | | | | | | 335,646 | |
| | | | | | | | |
| | | | Consumer Finance — 2.6% | |
| | 4,235 | | | Ally Financial, Inc. (a) | | | 100,021 | |
SEE NOTES TO FINANCIAL STATEMENTS.
| | | | | | |
| | | |
| 36 | | | | J.P. MORGAN MID CAP/MULTI-CAP FUNDS | | DECEMBER 31, 2014 |
| | | | | | | | |
| SHARES | | | SECURITY DESCRIPTION | | VALUE($) | |
| Common Stocks — continued | |
| | | | Consumer Finance — continued | |
| | 1,903 | | | Capital One Financial Corp. | | | 157,126 | |
| | | | | | | | |
| | | | | | | 257,147 | |
| | | | | | | | |
| | | | Insurance — 9.5% | |
| | 109 | | | Alleghany Corp. (a) | | | 50,681 | |
| | 1,045 | | | Allied World Assurance Co. Holdings AG, (Switzerland) | | | 39,607 | |
| | 2,368 | | | American International Group, Inc. | | | 132,648 | |
| | 2,365 | | | CNO Financial Group, Inc. | | | 40,729 | |
| | 2,511 | | | Hartford Financial Services Group, Inc. (The) | | | 104,688 | |
| | 4,234 | | | Loews Corp. | | | 177,901 | |
| | 1,106 | | | Marsh & McLennan Cos., Inc. | | | 63,279 | |
| | 1,998 | | | Old Republic International Corp. | | | 29,231 | |
| | 1,091 | | | Prudential Financial, Inc. | | | 98,692 | |
| | 906 | | | Travelers Cos., Inc. (The) | | | 95,858 | |
| | 2,041 | | | Unum Group | | | 71,179 | |
| | 638 | | | W.R. Berkley Corp. | | | 32,709 | |
| | | | | | | | |
| | | | | | | 937,202 | |
| | | | | | | | |
| | | | Real Estate Investment Trusts (REITs) — 3.7% | |
| | 1,910 | | | American Homes 4 Rent, Class A | | | 32,527 | |
| | 1,639 | | | American Residential Properties, Inc. (a) | | | 28,801 | |
| | 2,328 | | | Brixmor Property Group, Inc. | | | 57,832 | |
| | 488 | | | EastGroup Properties, Inc.(m) | | | 30,869 | |
| | 2,245 | | | Excel Trust, Inc. | | | 30,057 | |
| | 2,349 | | | Kimco Realty Corp. (m) | | | 59,044 | |
| | 1,580 | | | Rayonier, Inc. (m) | | | 44,134 | |
| | 2,196 | | | Weyerhaeuser Co. (m) | | | 78,796 | |
| | | | | | | | |
| | | | | | | 362,060 | |
| | | | | | | | |
| | | | Real Estate Management & Development — 0.7% | |
| | 1,260 | | | Brookfield Asset Management, Inc., (Canada), Class A | | | 63,164 | |
| | | | | | | | |
| | | | Thrifts & Mortgage Finance — 0.4% | |
| | 4,049 | | | Hudson City Bancorp, Inc. | | | 40,973 | |
| | | | | | | | |
| | | | Total Financials | | | 3,162,435 | |
| | | | | | | | |
| | | | Health Care — 8.6% | |
| | | | Health Care Providers & Services — 2.3% | |
| | 972 | | | Aetna, Inc. | | | 86,316 | |
| | 480 | | | National Healthcare Corp. | | | 30,136 | |
| | 1,108 | | | UnitedHealth Group, Inc. | | | 112,018 | |
| | | | | | | | |
| | | | | | | 228,470 | |
| | | | | | | | |
| | | | Pharmaceuticals — 6.3% | |
| | 1,900 | | | Johnson & Johnson | | | 198,714 | |
| | 2,732 | | | Merck & Co., Inc. | | | 155,162 | |
| | 6,659 | | | Pfizer, Inc. | | | 207,434 | |
| | | | | | | | |
| SHARES | | | SECURITY DESCRIPTION | | VALUE($) | |
| | | | | | | | |
| | | | Pharmaceuticals — continued | |
| | 390 | | | Valeant Pharmaceuticals International, Inc. (a) | | | 55,842 | |
| | | | | | | | |
| | | | | | | 617,152 | |
| | | | | | | | |
| | | | Total Health Care | | | 845,622 | |
| | | | | | | | |
| | | | Industrials — 8.3% | |
| | | | Aerospace & Defense — 2.1% | |
| | 896 | | | Honeywell International, Inc. | | | 89,548 | |
| | 1,024 | | | United Technologies Corp. | | | 117,737 | |
| | | | | | | | |
| | | | | | | 207,285 | |
| | | | | | | | |
| | | | Airlines — 1.0% | |
| | 1,986 | | | Delta Air Lines, Inc. | | | 97,677 | |
| | | | | | | | |
| | | | Industrial Conglomerates — 0.9% | |
| | 998 | | | Carlisle Cos., Inc. | | | 90,017 | |
| | | | | | | | |
| | | | Machinery — 2.4% | |
| | 537 | | | Crane Co. | | | 31,522 | |
| | 1,512 | | | Dover Corp. | | | 108,412 | |
| | 1,045 | | | Illinois Tool Works, Inc. | | | 98,933 | |
| | | | | | | | |
| | | | | | | 238,867 | |
| | | | | | | | |
| | | | Marine — 0.3% | |
| | 376 | | | Kirby Corp. (a) | | | 30,382 | |
| | | | | | | | |
| | | | Professional Services — 0.9% | |
| | 1,063 | | | Equifax, Inc. | | | 85,997 | |
| | | | | | | | |
| | | | Trading Companies & Distributors — 0.7% | |
| | 261 | | | W.W. Grainger, Inc. | | | 66,450 | |
| | | | | | | | |
| | | | Total Industrials | | | 816,675 | |
| | | | | | | | |
| | | | Information Technology — 5.4% | |
| | | | Communications Equipment — 1.9% | |
| | 4,243 | | | Cisco Systems, Inc. | | | 118,030 | |
| | 896 | | | QUALCOMM, Inc. | | | 66,618 | |
| | | | | | | | |
| | | | | | | 184,648 | |
| | | | | | | | |
| | | | IT Services — 0.5% | |
| | 2,633 | | | Western Union Co. (The) | | | 47,164 | |
| | | | | | | | |
| | | | Semiconductors & Semiconductor Equipment — 1.9% | |
| | 1,016 | | | Analog Devices, Inc. | | | 56,419 | |
| | 577 | | | KLA-Tencor Corp. | | | 40,554 | |
| | 1,799 | | | Texas Instruments, Inc. | | | 96,200 | |
| | | | | | | | |
| | | | | | | 193,173 | |
| | | | | | | | |
| | | | Software — 0.5% | |
| | 1,130 | | | Microsoft Corp. | | | 52,483 | |
| | | | | | | | |
| | | | Technology Hardware, Storage & Peripherals — 0.6% | |
| | 1,516 | | | Hewlett-Packard Co. | | | 60,857 | |
| | | | | | | | |
| | | | Total Information Technology | | | 538,325 | |
| | | | | | | | |
SEE NOTES TO FINANCIAL STATEMENTS.
| | | | | | | | |
| | | |
| DECEMBER 31, 2014 | | J.P. MORGAN MID CAP/MULTI-CAP FUNDS | | | | | 37 | |
JPMorgan Value Advantage Fund
SCHEDULE OF PORTFOLIO INVESTMENTS
AS OF DECEMBER 31, 2014 (Unaudited) (continued)
(Amounts in thousands)
| | | | | | | | |
| SHARES | | | SECURITY DESCRIPTION | | VALUE($) | |
| Common Stocks — continued | |
| | | | Materials — 3.6% | |
| | | | Chemicals — 0.7% | |
| | 1,465 | | | Mosaic Co. (The) | | | 66,882 | |
| | | | | | | | |
| | | | Construction Materials — 1.0% | |
| | 892 | | | Martin Marietta Materials, Inc. | | | 98,445 | |
| | | | | | | | |
| | | | Containers & Packaging — 1.5% | |
| | 989 | | | Ball Corp. | | | 67,420 | |
| | 1,427 | | | Rock-Tenn Co., Class A | | | 87,013 | |
| | | | | | | | |
| | | | | | | 154,433 | |
| | | | | | | | |
| | | | Paper & Forest Products — 0.4% | |
| | 1,303 | | | KapStone Paper & Packaging Corp. | | | 38,188 | |
| | | | | | | | |
| | | | Total Materials | | | 357,948 | |
| | | | | | | | |
| | | | Telecommunication Services — 1.1% | |
| | | | Diversified Telecommunication Services — 1.1% | |
| | 2,385 | | | Verizon Communications, Inc. | | | 111,557 | |
| | | | | | | | |
| | | | Utilities — 5.8% | |
| | | | Electric Utilities — 4.6% | |
| | 1,233 | | | American Electric Power Co., Inc. | | | 74,850 | |
| | 1,049 | | | Duke Energy Corp. | | | 87,650 | |
| | 1,025 | | | Edison International | | | 67,106 | |
| | 851 | | | NextEra Energy, Inc. | | | 90,474 | |
| | 1,013 | | | Northeast Utilities | | | 54,232 | |
| | 2,204 | | | Xcel Energy, Inc. | | | 79,157 | |
| | | | | | | | |
| | | | | | | 453,469 | |
| | | | | | | | |
| | | | | | | | |
| SHARES | | | SECURITY DESCRIPTION | | VALUE($) | |
| | | | | | | | |
| | | | Multi-Utilities — 1.2% | |
| | 560 | | | NiSource, Inc. | | | 23,734 | |
| | 819 | | | Sempra Energy | | | 91,158 | |
| | | | | | | | |
| | | | | | | 114,892 | |
| | | | | | | | |
| | | | Total Utilities | | | 568,361 | |
| | | | | | | | |
| | | | Total Common Stocks
(Cost $7,299,304) | | | 9,030,623 | |
| | | | | | | | |
| Short-Term Investment — 8.1% | |
| | | | Investment Company — 8.1% | | | | |
| | 794,754 | | | JPMorgan Prime Money Market Fund, Institutional Class Shares, 0.020% (b) (l) (m)
(Cost $794,754) | | | 794,754 | |
| | | | | | | | |
| | | | Total Investments — 99.7%
(Cost $8,094,058) | | | 9,825,377 | |
| | | | Other Assets in Excess of
Liabilities — 0.3% | | | 29,318 | |
| | | | | | | | |
| | | | NET ASSETS — 100.0% | | $ | 9,854,695 | |
| | | | | | | | |
Percentages indicated are based on net assets.
SEE NOTES TO FINANCIAL STATEMENTS.
| | | | | | |
| | | |
| 38 | | | | J.P. MORGAN MID CAP/MULTI-CAP FUNDS | | DECEMBER 31, 2014 |
J.P. Morgan Mid Cap/Multi-Cap Funds
NOTES TO SCHEDULES OF PORTFOLIO INVESTMENTS
AS OF DECEMBER 31, 2014 (Unaudited)
| | | | | | |
| (a) | | — Non-income producing security. |
| (b) | | — Investment in affiliate. Money market fund registered under the Investment Company Act of 1940, as amended, and advised by J.P. Morgan Investment Management Inc. |
| (c) | | — Included in this amount is cash segregated as collateral for future contracts. |
| (g) | | — Amount rounds to less than 0.1%. |
| (h) | | — Amount rounds to less than one thousand (shares or dollars). |
| (j) | | — All or a portion of these securities are segregated for short sales. |
| | | | | | |
| (l) | | — The rate shown is the current yield as of December 31, 2014 |
| (m) | | — All or a portion of this security is reserved and/or pledged with the custodian for current or potential holdings of futures, swaps, options, TBAs, when-issued securities, delayed delivery securities, reverse repurchase agreements, unfunded commitments and/or forward foreign currency exchange contracts. |
SEE NOTES TO FINANCIAL STATEMENTS.
| | | | | | | | |
| | | |
| DECEMBER 31, 2014 | | J.P. MORGAN MID CAP/MULTI-CAP FUNDS | | | | | 39 | |
STATEMENTS OF ASSETS AND LIABILITIES
AS OF DECEMBER 31, 2014 (Unaudited)
(Amounts in thousands, except per share amounts)
| | | | | | | | | | | | |
| | | Growth
Advantage Fund | | | Mid Cap
Equity Fund | | | Mid Cap
Growth Fund | |
ASSETS: | | | | | | | | | | | | |
Investments in non-affiliates, at value | | $ | 4,021,280 | | | $ | 2,974,871 | | | $ | 2,286,060 | |
Investments in affiliates, at value | | | 141,289 | | | | 97,564 | | | | 76,415 | |
| | | | | | | | | | | | |
Total investment securities, at value | | | 4,162,569 | | | | 3,072,435 | | | | 2,362,475 | |
Receivables: | | | | | | | | | | | | |
Fund shares sold | | | 10,650 | | | | 3,558 | | | | 13,304 | |
Dividends from non-affiliates | | | 860 | | | | 3,163 | | | | 333 | |
Dividends from affiliates | | | 5 | | | | 3 | | | | 4 | |
Other assets | | | 129 | | | | — | | | | — | |
| | | | | | | | | | | | |
Total Assets | | | 4,174,213 | | | | 3,079,159 | | | | 2,376,116 | |
| | | | | | | | | | | | |
LIABILITIES: | | | | | | | | | | | | |
Payables: | | | | | | | | | | | | |
Investment securities purchased | | | 145 | | | | — | | | | — | |
Fund shares redeemed | | | 2,043 | | | | 1,552 | | | | 3,589 | |
Accrued liabilities: | | | | | | | | | | | | |
Investment advisory fees | | | 2,240 | | | | 1,650 | | | | 1,246 | |
Administration fees | | | 287 | | | | 199 | | | | 149 | |
Distribution fees | | | 304 | | | | 53 | | | | 210 | |
Shareholder servicing fees | | | 356 | | | | 13 | | | | 219 | |
Custodian and accounting fees | | | 43 | | | | 53 | | | | 33 | |
Trustees’ and Chief Compliance Officer’s fees | | | — | (a) | | | 1 | | | | — | (a) |
Transfer agent fees | | | 233 | | | | 556 | | | | 720 | |
Other | | | 126 | | | | 34 | | | | 104 | |
| | | | | | | | | | | | |
Total Liabilities | | | 5,777 | | | | 4,111 | | | | 6,270 | |
| | | | | | | | | | | | |
Net Assets | | $ | 4,168,436 | | | $ | 3,075,048 | | | $ | 2,369,846 | |
| | | | | | | | | | | | |
| (a) | Amount rounds to less than $1,000. |
SEE NOTES TO FINANCIAL STATEMENTS.
| | | | | | |
| | | |
| 40 | | | | J.P. MORGAN MID CAP/MULTI-CAP FUNDS | | DECEMBER 31, 2014 |
| | | | | | | | | | | | |
| | | Growth
Advantage Fund | | | Mid Cap
Equity Fund | | | Mid Cap
Growth Fund | |
NET ASSETS: | |
Paid-in-Capital | | $ | 3,047,492 | | | $ | 2,306,211 | | | $ | 1,727,354 | |
Accumulated undistributed (distributions in excess of) net investment income | | | (15,966 | ) | | | (991 | ) | | | (11,359 | ) |
Accumulated net realized gains (losses) | | | 38,069 | | | | 12,275 | | | | 21,989 | |
Net unrealized appreciation (depreciation) | | | 1,098,841 | | | | 757,553 | | | | 631,862 | |
| | | | | | | | | | | | |
Total Net Assets | | $ | 4,168,436 | | | $ | 3,075,048 | | | $ | 2,369,846 | |
| | | | | | | | | | | | |
| | | |
Net Assets: | | | | | | | | | | | | |
Class A | | $ | 872,880 | | | $ | 185,853 | | | $ | 844,077 | |
Class B | | | 2,295 | | | | — | | | | 4,247 | |
Class C | | | 194,883 | | | | 22,366 | | | | 53,753 | |
Class R2 | | | — | | | | 687 | | | | 4,059 | |
Class R5 | | | 47,921 | | | | 589 | | | | 44,142 | |
Class R6 | | | 1,993,565 | | | | 1,066,585 | | | | 92,712 | |
Select Class | | | 1,056,892 | | | | 1,798,968 | | | | 1,326,856 | |
| | | | | | | | | | | | |
Total | | $ | 4,168,436 | | | $ | 3,075,048 | | | $ | 2,369,846 | |
| | | | | | | | | | | | |
| | | |
Outstanding units of beneficial interest (shares) | | | | | | | | | | | | |
($0.0001 par value; unlimited number of shares authorized): | | | | | | | | | | | | |
Class A | | | 60,917 | | | | 4,170 | | | | 33,570 | |
Class B | | | 177 | | | | — | | | | 252 | |
Class C | | | 15,021 | | | | 511 | | | | 2,577 | |
Class R2 | | | — | | | | 15 | | | | 149 | |
Class R5 | | | 3,246 | | | | 13 | | | | 1,560 | |
Class R6 | | | 134,927 | | | | 23,779 | | | | 3,270 | |
Select Class | | | 72,343 | | | | 40,114 | | | | 47,145 | |
Net Asset Value (a): | | | | | | | | | | | | |
Class A — Redemption price per share | | $ | 14.33 | | | $ | 44.57 | | | $ | 25.14 | |
Class B — Offering price per share (b) | | | 12.96 | | | | — | | | | 16.85 | |
Class C — Offering price per share (b) | | | 12.97 | | | | 43.77 | | | | 20.86 | |
Class R2 — Offering and redemption price per share | | | — | | | | 44.50 | | | | 27.21 | |
Class R5 — Offering and redemption price per share | | | 14.77 | | | | 44.85 | | | | 28.30 | |
Class R6 — Offering and redemption price per share | | | 14.78 | | | | 44.85 | | | | 28.36 | |
Select Class — Offering and redemption price per share | | | 14.61 | | | | 44.85 | | | | 28.14 | |
Class A maximum sales charge | | | 5.25 | % | | | 5.25 | % | | | 5.25 | % |
Class A maximum public offering price per share | | | | | | | | | | | | |
[net asset value per share/(100% — maximum sales charge)] | | $ | 15.12 | | | $ | 47.04 | | | $ | 26.53 | |
| | | | | | | | | | | | |
| | | |
Cost of investments in non-affiliates | | $ | 2,922,439 | | | $ | 2,217,318 | | | $ | 1,654,198 | |
Cost of investments in affiliates | | | 141,289 | | | | 97,564 | | | | 76,415 | |
| (a) | Per share amounts may not recalculate due to rounding of net assets and/or shares outstanding. |
| (b) | Redemption price for Class B and Class C Shares varies based upon length of time the shares are held. |
SEE NOTES TO FINANCIAL STATEMENTS.
| | | | | | | | |
| | | |
| DECEMBER 31, 2014 | | J.P. MORGAN MID CAP/MULTI-CAP FUNDS | | | | | 41 | |
STATEMENTS OF ASSETS AND LIABILITIES
AS OF DECEMBER 31, 2014 (Unaudited) (continued)
(Amounts in thousands, except per share amounts)
| | | | | | | | | | | | |
| | | Mid Cap
Value Fund | | | Multi-Cap
Market
Neutral Fund | | | Value
Advantage Fund | |
ASSETS: | | | | | | | | | | | | |
Investments in non-affiliates, at value | | $ | 15,610,358 | | | $ | 298,016 | | | $ | 9,030,623 | |
Investments in affiliates, at value | | | 448,474 | | | | 20,186 | | | | 794,754 | |
| | | | | | | | | | | | |
Total investment securities, at value | | | 16,058,832 | | | | 318,202 | | | | 9,825,377 | |
Cash | | | — | | | | 123 | | | | — | |
Deposits at broker for futures contracts | | | — | | | | 210 | | | | — | |
Deposits at broker for securities sold short | | | — | | | | 299,435 | | | | — | |
Receivables: | | | | | | | | | | | | |
Investment securities sold | | | — | | | | 5,369 | | | | — | |
Fund shares sold | | | 22,268 | | | | 1 | | | | 34,949 | |
Dividends from non-affiliates | | | 31,078 | | | | 374 | | | | 8,772 | |
Dividends from affiliates | | | 15 | | | | 2 | | | | 24 | |
Variation margin on futures contracts | | | — | | | | 40 | | | | — | |
| | | | | | | | | | | | |
Total Assets | | | 16,112,193 | | | | 623,756 | | | | 9,869,122 | |
| | | | | | | | | | | | |
LIABILITIES: | | | | | | | | | | | | |
Payables: | | | | | | | | | | | | |
Securities sold short, at value | | | — | | | | 297,278 | | | | — | |
Dividend expense to non-affiliates on securities sold short | | | — | | | | 133 | | | | — | |
Investment securities purchased | | | — | | | | 4,876 | | | | — | |
Fund shares redeemed | | | 103,355 | | | | 33 | | | | 6,492 | |
Accrued liabilities: | | | | | | | | | | | | |
Investment advisory fees | | | 8,007 | | | | 273 | | | | 4,966 | |
Administration fees | | | 712 | | | | — | | | | 536 | |
Distribution fees | | | 1,009 | | | | 7 | | | | 787 | |
Shareholder servicing fees | | | 901 | | | | 71 | | | | 986 | |
Custodian and accounting fees | | | 250 | | | | 20 | | | | 89 | |
Trustees’ and Chief Compliance Officer’s fees | | | 2 | | | | — | (a) | | | 2 | |
Other | | | 4,873 | | | | 57 | | | | 569 | |
| | | | | | | | | | | | |
Total Liabilities | | | 119,109 | | | | 302,748 | | | | 14,427 | |
| | | | | | | | | | | | |
Net Assets | | $ | 15,993,084 | | | $ | 321,008 | | | $ | 9,854,695 | |
| | | | | | | | | | | | |
| (a) | Amount rounds to less than $1,000. |
SEE NOTES TO FINANCIAL STATEMENTS.
| | | | | | |
| | | |
| 42 | | | | J.P. MORGAN MID CAP/MULTI-CAP FUNDS | | DECEMBER 31, 2014 |
| | | | | | | | | | | | |
| | | Mid Cap
Value Fund | | | Multi-Cap
Market
Neutral Fund | | | Value
Advantage Fund | |
NET ASSETS: | | | | | | | | | | | | |
Paid-in-Capital | | $ | 10,240,088 | | | $ | 338,991 | | | $ | 8,140,900 | |
Accumulated undistributed (distributions in excess of) net investment income | | | (1,520 | ) | | | (4,446 | ) | | | (808 | ) |
Accumulated net realized gains (losses) | | | 139,706 | | | | (70,527 | ) | | | (16,716 | ) |
Net unrealized appreciation (depreciation) | | | 5,614,810 | | | | 56,990 | | | | 1,731,319 | |
| | | | | | | | | | | | |
Total Net Assets | | $ | 15,993,084 | | | $ | 321,008 | | | $ | 9,854,695 | |
| | | | | | | | | | | | |
| | | |
Net Assets: | | | | | | | | | | | | |
Class A | | $ | 2,700,548 | | | $ | 7,007 | | | $ | 2,151,927 | |
Class B | | | 8,990 | | | | 156 | | | | — | |
Class C | | | 613,455 | | | | 7,655 | | | | 552,738 | |
Class R2 | | | 75,043 | | | | — | | | | — | |
Institutional Class | | | 10,164,312 | | | | — | | | | 4,179,965 | |
Select Class | | | 2,430,736 | | | | 306,190 | | | | 2,970,065 | |
| | | | | | | | | | | | |
Total | | $ | 15,993,084 | | | $ | 321,008 | | | $ | 9,854,695 | |
| | | | | | | | | | | | |
| | | |
Outstanding units of beneficial interest (shares) | | | | | | | | | | | | |
($0.0001 par value; unlimited number of shares authorized): | | | | | | | | | | | | |
Class A | | | 74,051 | | | | 696 | | | | 72,533 | |
Class B | | | 252 | | | | 16 | | | | — | |
Class C | | | 17,335 | | | | 803 | | | | 18,658 | |
Class R2 | | | 2,127 | | | | — | | | | — | |
Institutional Class | | | 273,625 | | | | — | | | | 140,235 | |
Select Class | | | 66,048 | | | | 29,816 | | | | 99,734 | |
| | | |
Net Asset Value (a): | | | | | | | | | | | | |
Class A — Redemption price per share | | $ | 36.47 | | | $ | 10.07 | | | $ | 29.67 | |
Class B — Offering price per share (b) | | | 35.73 | | | | 9.52 | | | | — | |
Class C — Offering price per share (b) | | | 35.39 | | | | 9.53 | | | | 29.62 | |
Class R2 — Offering and redemption price per share | | | 35.29 | | | | — | | | | — | |
Institutional Class — Offering and redemption price per share | | | 37.15 | | | | — | | | | 29.81 | |
Select Class — Offering and redemption price per share | | | 36.80 | | | | 10.27 | | | | 29.78 | |
Class A maximum sales charge | | | 5.25 | % | | | 5.25 | % | | | 5.25 | % |
Class A maximum public offering price per share | | | | | | | | | | | | |
[net asset value per share/(100% — maximum sales charge)] | | $ | 38.49 | | | $ | 10.63 | | | $ | 31.31 | |
| | | | | | | | | | | | |
Cost of investments in non-affiliates | | $ | 9,995,548 | | | $ | 235,301 | | | $ | 7,299,304 | |
Cost of investments in affiliates | | | 448,474 | | | | 20,186 | | | | 794,754 | |
Proceeds from securities sold short | | | — | | | | 291,535 | | | | — | |
| (a) | Per share amounts may not recalculate due to rounding of net assets and/or shares outstanding. |
| (b) | Redemption price for Class B and Class C Shares varies based upon length of time the shares are held. |
SEE NOTES TO FINANCIAL STATEMENTS.
| | | | | | | | |
| | | |
| DECEMBER 31, 2014 | | J.P. MORGAN MID CAP/MULTI-CAP FUNDS | | | | | 43 | |
STATEMENTS OF OPERATIONS
FOR THE SIX MONTHS ENDED DECEMBER 31, 2014 (Unaudited)
(Amounts in thousands)
| | | | | | | | | | | | |
| | | Growth
Advantage Fund | | | Mid Cap
Equity Fund | | | Mid Cap
Growth Fund | |
INVESTMENT INCOME: | | | | | | | | | | | | |
Dividend income from non-affiliates | | $ | 11,034 | | | $ | 19,597 | | | $ | 6,011 | |
Dividend income from affiliates | | | 11 | | | | 10 | | | | 13 | |
| | | | | | | | | | | | |
Total investment income | | | 11,045 | | | | 19,607 | | | | 6,024 | |
| | | | | | | | | | | | |
| | | |
EXPENSES: | | | | | | | | | | | | |
Investment advisory fees | | | 12,463 | | | | 9,517 | | | | 7,204 | |
Administration fees | | | 1,582 | | | | 1,208 | | | | 914 | |
Distribution fees: | | | | | | | | | | | | |
Class A | | | 972 | | | | 210 | | | | 971 | |
Class B | | | 9 | | | | — | | | | 17 | |
Class C | | | 626 | | | | 78 | | | | 178 | |
Class R2 | | | — | | | | 2 | | | | 7 | |
Shareholder servicing fees: | | | | | | | | | | | | |
Class A | | | 972 | | | | 210 | | | | 971 | |
Class B | | | 3 | | | | — | | | | 6 | |
Class C | | | 209 | | | | 26 | | | | 59 | |
Class R2 | | | — | | | | 1 | | | | 4 | |
Class R5 | | | 166 | | | | — | (a) | | | 8 | |
Select Class | | | 1,277 | | | | 2,218 | | | | 1,584 | |
Custodian and accounting fees | | | 54 | | | | 51 | | | | 35 | |
Interest expense to affiliates | | | — | (a) | | | — | | | | — | |
Professional fees | | | 35 | | | | 35 | | | | 30 | |
Trustees’ and Chief Compliance Officer’s fees | | | 18 | | | | 13 | | | | 11 | |
Printing and mailing costs | | | 103 | | | | 157 | | | | 111 | |
Registration and filing fees | | | 133 | | | | 93 | | | | 55 | |
Transfer agent fees | | | 874 | | | | 1,513 | | | | 1,245 | |
Other | | | 178 | | | | 284 | | | | 17 | |
| | | | | | | | | | | | |
Total expenses | | | 19,674 | | | | 15,616 | | | | 13,427 | |
| | | | | | | | | | | | |
Less fees waived | | | (449 | ) | | | (2,847 | ) | | | (1,850 | ) |
Less expense reimbursements | | | — | | | | (19 | ) | | | (2 | ) |
| | | | | | | | | | | | |
Net expenses | | | 19,225 | | | | 12,750 | | | | 11,575 | |
| | | | | | | | | | | | |
Net investment income (loss) | | | (8,180 | ) | | | 6,857 | | | | (5,551 | ) |
| | | | | | | | | | | | |
| | | |
REALIZED/UNREALIZED GAINS (LOSSES): | | | | | | | | | | | | |
Net realized gain (loss) on transactions from investments in non-affiliates | | | 64,047 | | | | 62,348 | | | | 61,706 | |
Change in net unrealized appreciation/depreciation of investments in non-affiliates | | | 129,273 | | | | 59,933 | | | | (5,841 | ) |
| | | | | | | | | | | | |
Net realized/unrealized gains (losses) | | | 193,320 | | | | 122,281 | | | | 55,865 | |
| | | | | | | | | | | | |
Change in net assets resulting from operations | | $ | 185,140 | | | $ | 129,138 | | | $ | 50,314 | |
| | | | | | | | | | | | |
| (a) | Amount rounds to less than $1,000. |
SEE NOTES TO FINANCIAL STATEMENTS.
| | | | | | |
| | | |
| 44 | | | | J.P. MORGAN MID CAP/MULTI-CAP FUNDS | | DECEMBER 31, 2014 |
| | | | | | | | | | | | |
| | | Mid Cap
Value Fund | | | Multi-Cap
Market
Neutral Fund | | | Value
Advantage Fund | |
INVESTMENT INCOME: | | | | | | | | | | | | |
Dividend income from non-affiliates | | $ | 167,159 | | | $ | 2,880 | | | $ | 88,518 | |
Dividend income from affiliates | | | 42 | | | | 9 | | | | 67 | |
| | | | | | | | | | | | |
Total investment income | | | 167,201 | | | | 2,889 | | | | 88,585 | |
| | | | | | | | | | | | |
| | | |
EXPENSES: | | | | | | | | | | | | |
Investment advisory fees | | | 50,926 | | | | 2,609 | | | | 28,378 | |
Administration fees | | | 6,464 | | | | 172 | | | | 3,601 | |
Distribution fees: | | | | | | | | | | | | |
Class A | | | 3,593 | | | | 10 | | | | 2,396 | |
Class B | | | 36 | | | | 1 | | | | — | |
Class C | | | 2,259 | | | | 31 | | | | 1,743 | |
Class R2 | | | 180 | | | | — | | | | — | |
Shareholder servicing fees: | | | | | | | | | | | | |
Class A | | | 3,593 | | | | 10 | | | | 2,396 | |
Class B | | | 12 | | | | — | (a) | | | — | |
Class C | | | 753 | | | | 10 | | | | 581 | |
Class R2 | | | 90 | | | | — | | | | — | |
Institutional Class | | | 4,510 | | | | — | | | | 1,803 | |
Select Class | | | 3,865 | | | | 501 | | | | 3,430 | |
Custodian and accounting fees | | | 235 | | | | 18 | | | | 109 | |
Interest expense to affiliates | | | — | | | | — | (a) | | | — | |
Professional fees | | | 118 | | | | 28 | | | | 48 | |
Trustees’ and Chief Compliance Officer’s fees | | | 76 | | | | 2 | | | | 38 | |
Printing and mailing costs | | | 519 | | | | 4 | | | | 213 | |
Registration and filing fees | | | 157 | | | | 24 | | | | 172 | |
Transfer agent fees | | | 8,328 | | | | 35 | | | | 2,758 | |
Other | | | 723 | | | | 7 | | | | 381 | |
Dividend expense to non-affiliates on securities sold short | | | — | | | | 2,304 | | | | — | |
Interest expense to non-affiliates on securities sold short | | | — | | | | 311 | | | | — | |
| | | | | | | | | | | | |
Total expenses | | | 86,437 | | | | 6,077 | | | | 48,047 | |
| | | | | | | | | | | | |
Less fees waived | | | (13,998 | ) | | | (852 | ) | | | (5,324 | ) |
Less expense reimbursements | | | (19 | ) | | | — | (a) | | | — | |
| | | | | | | | | | | | |
Net expenses | | | 72,420 | | | | 5,225 | | | | 42,723 | |
| | | | | | | | | | | | |
Net investment income (loss) | | | 94,781 | | | | (2,336 | ) | | | 45,862 | |
| | | | | | | | | | | | |
| | | |
REALIZED/UNREALIZED GAINS (LOSSES): | | | | | | | | | | | | |
Net realized gain (loss) on transactions from: | | | | | | | | | | | | |
Investments in non-affiliates | | | 570,998 | | | | 30,678 | | | | 42,577 | |
Futures | | | — | | | | 569 | | | | — | |
Securities sold short | | | — | | | | (40,678 | ) | | | — | |
| | | | | | | | | | | | |
Net realized gain (loss) | | | 570,998 | | | | (9,431 | ) | | | 42,577 | |
| | | | | | | | | | | | |
Change in net unrealized appreciation/depreciation of: | | | | | | | | | | | | |
Investments in non-affiliates | | | 298,211 | | | | (10,409 | ) | | | 402,206 | |
Futures | | | — | | | | 39 | | | | — | |
Securities sold short | | | — | | | | 28,989 | | | | — | |
| | | | | | | | | | | | |
Change in net unrealized appreciation/depreciation | | | 298,211 | | | | 18,619 | | | | 402,206 | |
| | | | | | | | | | | | |
Net realized/unrealized gains (losses) | | | 869,209 | | | | 9,188 | | | | 444,783 | |
| | | | | | | | | | | | |
Change in net assets resulting from operations | | $ | 963,990 | | | $ | 6,852 | | | $ | 490,645 | |
| | | | | | | | | | | | |
| (a) | Amount rounds to less than $1,000. |
SEE NOTES TO FINANCIAL STATEMENTS.
| | | | | | | | |
| | | |
| DECEMBER 31, 2014 | | J.P. MORGAN MID CAP/MULTI-CAP FUNDS | | | | | 45 | |
STATEMENTS OF CHANGES IN NET ASSETS
FOR THE PERIODS INDICATED
(Amounts in thousands)
| | | | | | | | | | | | | | | | |
| | | Growth Advantage Fund | | | Mid Cap Equity Fund | |
| | | Six Months Ended
December 31, 2014 (Unaudited) | | | Year Ended
June 30, 2014 | | | Six Months Ended
December 31, 2014
(Unaudited) | | | Year Ended
June 30, 2014 | |
CHANGE IN NET ASSETS RESULTING FROM OPERATIONS: | | | | | | | | | | | | | | | | |
Net investment income (loss) | | $ | (8,180 | ) | | $ | (7,964 | ) | | $ | 6,857 | | | $ | 4,036 | |
Net realized gain (loss) | | | 64,047 | | | | 223,546 | | | | 62,348 | | | | 135,142 | |
Distributions of capital gains received from investment company affiliates | | | — | | | | 3 | | | | — | | | | 1 | |
Change in net unrealized appreciation/depreciation | | | 129,273 | | | | 492,238 | | | | 59,933 | | | | 222,527 | |
| | | | | | | | | | | | | | | | |
Change in net assets resulting from operations | | | 185,140 | | | | 707,823 | | | | 129,138 | | | | 361,706 | |
| | | | | | | | | | | | | | | | |
| | | | |
DISTRIBUTIONS TO SHAREHOLDERS: | | | | | | | | | | | | | | | | |
Class A | | | | | | | | | | | | | | | | |
From net investment income | | | — | | | | — | | | | (206 | ) | | | (29 | ) |
From net realized gains | | | (32,469 | ) | | | (21,773 | ) | | | (7,964 | ) | | | (4,217 | ) |
Class B | | | | | | | | | | | | | | | | |
From net realized gains | | | (98 | ) | | | (123 | ) | | | — | | | | — | |
Class C | | | | | | | | | | | | | | | | |
From net investment income | | | — | | | | — | | | | (3 | ) | | | — | |
From net realized gains | | | (7,969 | ) | | | (4,242 | ) | | | (987 | ) | | | (1,100 | ) |
Class R2 (a) | | | | | | | | | | | | | | | | |
From net investment income | | | — | | | | — | | | | (1 | ) | | | — | (b) |
From net realized gains | | | — | | | | — | | | | (30 | ) | | | — | |
Class R5 (a) | | | | | | | | | | | | | | | | |
From net investment income | | | — | | | | — | | | | (1 | ) | | | — | (b) |
From net realized gains | | | (1,758 | ) | | | (54,106 | ) | | | (26 | ) | | | — | |
Class R6 (a) | | | | | | | | | | | | | | | | |
From net investment income | | | — | | | | — | | | | (3,034 | ) | | | (913 | ) |
From net realized gains | | | (73,271 | ) | | | — | | | | (46,016 | ) | | | — | |
Select Class | | | | | | | | | | | | | | | | |
From net investment income | | | — | | | | — | | | | (4,068 | ) | | | (3,282 | ) |
From net realized gains | | | (39,626 | ) | | | (49,152 | ) | | | (78,884 | ) | | | (90,616 | ) |
| | | | | | | | | | | | | | | | |
Total distributions to shareholders | | | (155,191 | ) | | | (129,396 | ) | | | (141,220 | ) | | | (100,157 | ) |
| | | | | | | | | | | | | | | | |
| | | | |
CAPITAL TRANSACTIONS: | | | | | | | | | | | | | | | | |
Change in net assets resulting from capital transactions | | | 573,280 | | | | 987,358 | | | | 313,960 | | | | 1,551,394 | |
| | | | | | | | | | | | | | | | |
| | | | |
NET ASSETS: | | | | | | | | | | | | | | | | |
Change in net assets | | | 603,229 | | | | 1,565,785 | | | | 301,878 | | | | 1,812,943 | |
Beginning of period | | | 3,565,207 | | | | 1,999,422 | | | | 2,773,170 | | | | 960,227 | |
| | | | | | | | | | | | | | | | |
End of period | | $ | 4,168,436 | | | $ | 3,565,207 | | | $ | 3,075,048 | | | $ | 2,773,170 | |
| | | | | | | | | | | | | | | | |
Accumulated undistributed (distributions in excess of) net investment income | | $ | (15,966 | ) | | $ | (7,786 | ) | | $ | (991 | ) | | $ | (535 | ) |
| | | | | | | | | | | | | | | | |
| (a) | Commencement of offering of class of shares effective March 14, 2014 for Mid Cap Equity Fund. |
| (b) | Amount rounds to less than $1,000. |
SEE NOTES TO FINANCIAL STATEMENTS.
| | | | | | |
| | | |
| 46 | | | | J.P. MORGAN MID CAP/MULTI-CAP FUNDS | | DECEMBER 31, 2014 |
| | | | | | | | | | | | | | | | |
| | | Mid Cap Growth Fund | | | Mid Cap Value Fund | |
| | | Six Months Ended
December 31, 2014
(Unaudited) | | | Year Ended
June 30, 2014 | | | Six Months Ended
December 31, 2014
(Unaudited) | | | Year Ended
June 30, 2014 | |
CHANGE IN NET ASSETS RESULTING FROM OPERATIONS: | | | | | | | | | | | | | | | | |
Net investment income (loss) | | $ | (5,551 | ) | | $ | (6,054 | ) | | $ | 94,781 | | | $ | 103,278 | |
Net realized gain (loss) | | | 61,706 | | | | 314,124 | | | | 570,998 | | | | 1,068,473 | |
Distributions of capital gains received from investment company affiliates | | | — | | | | — | (a) | | | — | | | | 6 | |
Change in net unrealized appreciation/depreciation | | | (5,841 | ) | | | 225,799 | | | | 298,211 | | | | 1,889,585 | |
| | | | | | | | | | | | | | | | |
Change in net assets resulting from operations | | | 50,314 | | | | 533,869 | | | | 963,990 | | | | 3,061,342 | |
| | | | | | | | | | | | | | | | |
| | | | |
DISTRIBUTIONS TO SHAREHOLDERS: | | | | | | | | | | | | | | | | |
Class A | | | | | | | | | | | | | | | | |
From net investment income | | | — | | | | — | | | | (15,287 | ) | | | (14,338 | ) |
From net realized gains | | | (80,615 | ) | | | (69,231 | ) | | | (197,218 | ) | | | (135,361 | ) |
Class B | | | | | | | | | | | | | | | | |
From net realized gains | | | (608 | ) | | | (943 | ) | | | (668 | ) | | | (524 | ) |
Class C | | | | | | | | | | | | | | | | |
From net investment income | | | — | | | | — | | | | (1,024 | ) | | | (38 | ) |
From net realized gains | | | (6,222 | ) | | | (3,392 | ) | | | (45,175 | ) | | | (24,588 | ) |
Class R2 | | | | | �� | | | | | | | | | | | |
From net investment income | | | — | | | | — | | | | (331 | ) | | | (201 | ) |
From net realized gains | | | (345 | ) | | | (58 | ) | | | (5,603 | ) | | | (2,784 | ) |
Class R5 | | | | | | | | | | | | | | | | |
From net realized gains | | | (3,427 | ) | | | (2,276 | ) | | | — | | | | — | |
Class R6 | | | | | | | | | | | | | | | | |
From net realized gains | | | (7,943 | ) | | | (5,408 | ) | | | — | | | | — | |
Institutional Class | | | | | | | | | | | | | | | | |
From net investment income | | | — | | | | — | | | | (108,605 | ) | | | (69,637 | ) |
From net realized gains | | | — | | | | — | | | | (711,308 | ) | | | (318,626 | ) |
Select Class | | | | | | | | | | | | | | | | |
From net investment income | | | — | | | | — | | | | (19,269 | ) | | | (17,743 | ) |
From net realized gains | | | (119,065 | ) | | | (99,863 | ) | | | (172,337 | ) | | | (112,976 | ) |
| | | | | | | | | | | | | | | | |
Total distributions to shareholders | | | (218,225 | ) | | | (181,171 | ) | | | (1,276,825 | ) | | | (696,816 | ) |
| | | | | | | | | | | | | | | | |
| | | | |
CAPITAL TRANSACTIONS: | | | | | | | | | | | | | | | | |
Change in net assets resulting from capital transactions | | | 355,953 | | | | 251,309 | | | | 660,334 | | | | 18,077 | |
| | | | | | | | | | | | | | | | |
| | | | |
NET ASSETS: | | | | | | | | | | | | | | | | |
Change in net assets | | | 188,042 | | | | 604,007 | | | | 347,499 | | | | 2,382,603 | |
Beginning of period | | | 2,181,804 | | | | 1,577,797 | | | | 15,645,585 | | | | 13,262,982 | |
| | | | | | | | | | | | | | | | |
End of period | | $ | 2,369,846 | | | $ | 2,181,804 | | | $ | 15,993,084 | | | $ | 15,645,585 | |
| | | | | | | | | | | | | | | | |
Accumulated undistributed (distributions in excess of) net investment income | | $ | (11,359 | ) | | $ | (5,808 | ) | | $ | (1,520 | ) | | $ | 48,215 | |
| | | | | | | | | | | | | | | | |
| (a) | Amount rounds to less than $1,000. |
SEE NOTES TO FINANCIAL STATEMENTS.
| | | | | | | | |
| | | |
| DECEMBER 31, 2014 | | J.P. MORGAN MID CAP/MULTI-CAP FUNDS | | | | | 47 | |
STATEMENTS OF CHANGES IN NET ASSETS
FOR THE PERIODS INDICATED (continued)
(Amounts in thousands)
| | | | | | | | | | | | | | | | |
| | | Multi-Cap Market Neutral Fund | | | Value Advantage Fund | |
| | | Six Months Ended
December 31, 2014
(Unaudited) | | | Year Ended
June 30, 2014 | | | Six Months Ended
December 31, 2014
(Unaudited) | | | Year Ended
June 30, 2014 | |
CHANGE IN NET ASSETS RESULTING FROM OPERATIONS: | | | | | | | | | | | | | | | | |
Net investment income (loss) | | $ | (2,336 | ) | | $ | (4,373 | ) | | $ | 45,862 | | | $ | 83,781 | |
Net realized gain (loss) | | | (9,431 | ) | | | 9,737 | | | | 42,577 | | | | 278,242 | |
Distributions of capital gains received from investment company affiliates | | | — | | | | — | (a) | | | — | | | | 5 | |
Change in net unrealized appreciation/depreciation | | | 18,619 | | | | (136 | ) | | | 402,206 | | | | 747,106 | |
| | | | | | | | | | | | | | | | |
Change in net assets resulting from operations | | | 6,852 | | | | 5,228 | | | | 490,645 | | | | 1,109,134 | |
| | | | | | | | | | | | | | | | |
| | | | |
DISTRIBUTIONS TO SHAREHOLDERS: | | | | | | | | | | | | | | | | |
Class A | | | | | | | | | | | | | | | | |
From net investment income | | | — | | | | — | | | | (18,586 | ) | | | (6,931 | ) |
From net realized gains | | | — | | | | — | | | | (49,085 | ) | | | (30,061 | ) |
Class C | | | | | | | | | | | | | | | | |
From net investment income | | | — | | | | — | | | | (2,882 | ) | | | (562 | ) |
From net realized gains | | | — | | | | — | | | | (12,315 | ) | | | (7,282 | ) |
Institutional Class | | | | | | | | | | | | | | | | |
From net investment income | | | — | | | | — | | | | (51,909 | ) | | | (19,755 | ) |
From net realized gains | | | — | | | | — | | | | (93,724 | ) | | | (54,303 | ) |
Select Class | | | | | | | | | | | | | | | | |
From net investment income | | | — | | | | — | | | | (31,036 | ) | | | (12,951 | ) |
From net realized gains | | | — | | | | — | | | | (67,644 | ) | | | (42,336 | ) |
| | | | | | | | | | | | | | | | |
Total distributions to shareholders | | | — | | | | — | | | | (327,181 | ) | | | (174,181 | ) |
| | | | | | | | | | | | | | | | |
| | | | |
CAPITAL TRANSACTIONS: | | | | | | | | | | | | | | | | |
Change in net assets resulting from capital transactions | | | (136,846 | ) | | | 101,988 | | | | 1,997,787 | | | | 3,061,568 | |
| | | | | | | | | | | | | | | | |
| | | | |
NET ASSETS: | | | | | | | | | | | | | | | | |
Change in net assets | | | (129,994 | ) | | | 107,216 | | | | 2,161,251 | | | | 3,996,521 | |
Beginning of period | | | 451,002 | | | | 343,786 | | | | 7,693,444 | | | | 3,696,923 | |
| | | | | | | | | | | | | | | | |
End of period | | $ | 321,008 | | | $ | 451,002 | | | $ | 9,854,695 | | | $ | 7,693,444 | |
| | | | | | | | | | | | | | | | |
Accumulated undistributed (distributions in excess of) net investment income | | $ | (4,446 | ) | | $ | (2,110 | ) | | $ | (808 | ) | | $ | 57,743 | |
| | | | | | | | | | | | | | | | |
| (a) | Amount rounds to less than $1,000. |
SEE NOTES TO FINANCIAL STATEMENTS.
| | | | | | |
| | | |
| 48 | | | | J.P. MORGAN MID CAP/MULTI-CAP FUNDS | | DECEMBER 31, 2014 |
| | | | | | | | | | | | | | | | |
| | | Growth Advantage Fund | | | Mid Cap Equity Fund | |
| | | Six Months Ended
December 31, 2014
(Unaudited) | | | Year Ended
June 30, 2014 | | | Six Months Ended
December 31, 2014
(Unaudited) | | | Year Ended
June 30, 2014 | |
CAPITAL TRANSACTIONS: | | | | | | | | | | | | | | | | |
Class A | | | | | | | | | | | | | | | | |
Proceeds from shares issued | | $ | 223,391 | | | $ | 463,212 | | | $ | 39,469 | | | $ | 92,281 | |
Net assets acquired in Fund reorganization
(See Note 8) | | | — | | | | — | | | | — | | | | 42,694 | |
Distributions reinvested | | | 31,822 | | | | 21,355 | | | | 8,101 | | | | 4,242 | |
Cost of shares redeemed | | | (104,576 | ) | | | (135,058 | ) | | | (16,733 | ) | | | (16,208 | ) |
| | | | | | | | | | | | | | | | |
Change in net assets resulting from Class A capital transactions | | $ | 150,637 | | | $ | 349,509 | | | $ | 30,837 | | | $ | 123,009 | |
| | | | | | | | | | | | | | | | |
Class B | | | | | | | | | | | | | | | | |
Proceeds from shares issued | | $ | 129 | | | $ | 342 | | | $ | — | | | $ | — | |
Distributions reinvested | | | 94 | | | | 118 | | | | — | | | | — | |
Cost of shares redeemed | | | (344 | ) | | | (599 | ) | | | — | | | | — | |
| | | | | | | | | | | | | | | | |
Change in net assets resulting from Class B capital transactions | | $ | (121 | ) | | $ | (139 | ) | | $ | — | | | $ | — | |
| | | | | | | | | | | | | | | | |
Class C | | | | | | | | | | | | | | | | |
Proceeds from shares issued | | $ | 58,436 | | | $ | 101,473 | | | $ | 2,900 | | | $ | 11,105 | |
Net assets acquired in Fund reorganization
(See Note 8) | | | — | | | | — | | | | — | | | | 1,648 | |
Distributions reinvested | | | 6,954 | | | | 3,500 | | | | 988 | | | | 1,100 | |
Cost of shares redeemed | | | (14,461 | ) | | | (18,573 | ) | | | (1,386 | ) | | | (1,925 | ) |
| | | | | | | | | | | | | | | | |
Change in net assets resulting from Class C capital transactions | | $ | 50,929 | | | $ | 86,400 | | | $ | 2,502 | | | $ | 11,928 | |
| | | | | | | | | | | | | | | | |
Class R2 (a) | | | | | | | | | | | | | | | | |
Proceeds from shares issued | | $ | — | | | $ | — | | | $ | 131 | | | $ | 51 | |
Net assets acquired in Fund reorganization
(See Note 8) | | | — | | | | — | | | | — | | | | 632 | |
Distributions reinvested | | | — | | | | — | | | | 18 | | | | — | (b) |
Cost of shares redeemed | | | — | | | | — | | | | (141 | ) | | | (28 | ) |
| | | | | | | | | | | | | | | | |
Change in net assets resulting from Class R2 capital transactions | | $ | — | | | $ | — | | | $ | 8 | | | $ | 655 | |
| | | | | | | | | | | | | | | | |
Class R5 (a) | | | | | | | | | | | | | | | | |
Proceeds from shares issued | | $ | 63,965 | | | $ | 540,555 | | | $ | 481 | | | $ | 1 | |
Net assets acquired in Fund reorganization
(See Note 8) | | | — | | | | — | | | | — | | | | 87 | |
Distributions reinvested | | | 1,758 | | | | 54,106 | | | | 27 | | | | — | (b) |
Cost of shares redeemed | | | (1,499,170 | ) | | | (225,926 | ) | | | (44 | ) | | | — | |
| | | | | | | | | | | | | | | | |
Change in net assets resulting from Class R5 capital transactions | | $ | (1,433,447 | ) | | $ | 368,735 | | | $ | 464 | | | $ | 88 | |
| | | | | | | | | | | | | | | | |
Class R6 (a) | | | | | | | | | | | | | | | | |
Proceeds from shares issued | | $ | 1,672,189 | | | $ | 276,436 | | | $ | 202,904 | | | $ | 108,850 | |
Net assets acquired in Fund reorganization
(See Note 8) | | | — | | | | — | | | | — | | | | 676,262 | |
Distributions reinvested | | | 70,799 | | | | — | | | | 48,799 | | | | 906 | |
Cost of shares redeemed | | | (11,553 | ) | | | (11,268 | ) | | | (6,760 | ) | | | (751 | ) |
| | | | | | | | | | | | | | | | |
Change in net assets resulting from Class R6 capital transactions | | $ | 1,731,435 | | | $ | 265,168 | | | $ | 244,943 | | | $ | 785,267 | |
| | | | | | | | | | | | | | | | |
Select Class | | | | | | | | | | | | | | | | |
Proceeds from shares issued | | $ | 164,859 | | | $ | 429,743 | | | $ | 160,248 | | | $ | 490,477 | |
Net assets acquired in Fund reorganization
(See Note 8) | | | — | | | | — | | | | — | | | | 390,167 | |
Distributions reinvested | | | 23,846 | | | | 20,345 | | | | 60,283 | | | | 82,318 | |
Cost of shares redeemed | | | (114,858 | ) | | | (532,403 | ) | | | (185,325 | ) | | | (332,515 | ) |
| | | | | | | | | | | | | | | | |
Change in net assets resulting from Select Class capital transactions | | $ | 73,847 | | | $ | (82,315 | ) | | $ | 35,206 | | | $ | 630,447 | |
| | | | | | | | | | | | | | | | |
Total change in net assets resulting from capital transactions | | $ | 573,280 | | | $ | 987,358 | | | $ | 313,960 | | | $ | 1,551,394 | |
| | | | | | | | | | | | | | | | |
| (a) | Commencement of offering of class of shares effective March 14, 2014 for Mid Cap Equity Fund. |
| (b) | Amount rounds to less than 1,000 dollars. |
SEE NOTES TO FINANCIAL STATEMENTS.
| | | | | | | | |
| | | |
| DECEMBER 31, 2014 | | J.P. MORGAN MID CAP/MULTI-CAP FUNDS | | | | | 49 | |
STATEMENTS OF CHANGES IN NET ASSETS
FOR THE PERIODS INDICATED (continued)
(Amounts in thousands)
| | | | | | | | | | | | | | | | |
| | | Growth Advantage Fund | | | Mid Cap Equity Fund | |
| | | Six Months Ended
December 31, 2014
(Unaudited) | | | Year Ended
June 30, 2014 | | | Six Months Ended
December 31, 2014
(Unaudited) | | | Year Ended
June 30, 2014 | |
SHARE TRANSACTIONS: | | | | | | | | | | | | | | | | |
Class A | | | | | | | | | | | | | | | | |
Issued | | | 15,587 | | | | 34,641 | | | | 886 | | | | 2,197 | |
Shares issued in connection with Fund reorganization (See Note 8) | | | — | | | | — | | | | — | | | | 995 | |
Reinvested | | | 2,270 | | | | 1,645 | | | | 188 | | | | 107 | |
Redeemed | | | (7,319 | ) | | | (10,120 | ) | | | (378 | ) | | | (381 | ) |
| | | | | | | | | | | | | | | | |
Change in Class A Shares | | | 10,538 | | | | 26,166 | | | | 696 | | | | 2,918 | |
| | | | | | | | | | | | | | | | |
Class B | | | | | | | | | | | | | | | | |
Issued | | | 10 | | | | 28 | | | | — | | | | — | |
Reinvested | | | 7 | | | | 10 | | | | — | | | | — | |
Redeemed | | | (26 | ) | | | (50 | ) | | | — | | | | — | |
| | | | | | | | | | | | | | | | |
Change in Class B Shares | | | (9 | ) | | | (12 | ) | | | — | | | | — | |
| | | | | | | | | | | | | | | | |
Class C | | | | | | | | | | | | | | | | |
Issued | | | 4,483 | | | | 8,282 | | | | 67 | | | | 269 | |
Shares issued in connection with Fund reorganization (See Note 8) | | | — | | | | — | | | | — | | | | 39 | |
Reinvested | | | 547 | | | | 295 | | | | 23 | | | | 28 | |
Redeemed | | | (1,120 | ) | | | (1,524 | ) | | | (32 | ) | | | (46 | ) |
| | | | | | | | | | | | | | | | |
Change in Class C Shares | | | 3,910 | | | | 7,053 | | | | 58 | | | | 290 | |
| | | | | | | | | | | | | | | | |
Class R2 (a) | | | | | | | | | | | | | | | | |
Issued | | | — | | | | — | | | | 2 | | | | 2 | |
Shares issued in connection with Fund reorganization (See Note 8) | | | — | | | | — | | | | — | | | | 15 | |
Reinvested | | | — | | | | — | | | | 1 | | | | — | (b) |
Redeemed | | | — | | | | — | | | | (4 | ) | | | (1 | ) |
| | | | | | | | | | | | | | | | |
Change in Class R2 Shares | | | — | | | | — | | | | (1 | ) | | | 16 | |
| | | | | | | | | | | | | | | | |
Class R5 (a) | | | | | | | | | | | | | | | | |
Issued | | | 4,356 | | | | 39,731 | | | | 11 | | | | — | (b) |
Shares issued in connection with Fund reorganization (See Note 8) | | | — | | | | — | | | | — | | | | 2 | |
Reinvested | | | 122 | | | | 4,065 | | | | 1 | | | | — | (b) |
Redeemed | | | (100,595 | ) | | | (15,945 | ) | | | (1 | ) | | | — | |
| | | | | | | | | | | | | | | | |
Change in Class R5 Shares | | | (96,117 | ) | | | 27,851 | | | | 11 | | | | 2 | |
| | | | | | | | | | | | | | | | |
Class R6 (a) | | | | | | | | | | | | | | | | |
Issued | | | 112,242 | | | | 19,372 | | | | 4,579 | | | | 2,551 | |
Shares issued in connection with Fund reorganization (See Note 8) | | | — | | | | — | | | | — | | | | 15,676 | |
Reinvested | | | 4,896 | | | | — | | | | 1,121 | | | | 20 | |
Redeemed | | | (792 | ) | | | (791 | ) | | | (150 | ) | | | (18 | ) |
| | | | | | | | | | | | | | | | |
Change in Class R6 Shares | | | 116,346 | | | | 18,581 | | | | 5,550 | | | | 18,229 | |
| | | | | | | | | | | | | | | | |
Select Class | | | | | | | | | | | | | | | | |
Issued | | | 11,313 | | | | 31,913 | | | | 3,586 | | | | 11,736 | |
Shares issued in connection with Fund reorganization (See Note 8) | | | — | | | | — | | | | — | | | | 9,044 | |
Reinvested | | | 1,668 | | | | 1,541 | | | | 1,386 | | | | 2,060 | |
Redeemed | | | (7,901 | ) | | | (38,838 | ) | | | (4,137 | ) | | | (7,967 | ) |
| | | | | | | | | | | | | | | | |
Change in Select Class Shares | | | 5,080 | | | | (5,384 | ) | | | 835 | | | | 14,873 | |
| | | | | | | | | | | | | | | | |
| (a) | Commencement of offering of class of shares effective March 14, 2014 for Mid Cap Equity Fund. |
| (b) | Amount rounds to less than 1,000 shares. |
SEE NOTES TO FINANCIAL STATEMENTS.
| | | | | | |
| | | |
| 50 | | | | J.P. MORGAN MID CAP/MULTI-CAP FUNDS | | DECEMBER 31, 2014 |
| | | | | | | | | | | | | | | | |
| | | Mid Cap Growth Fund | | | Mid Cap Value Fund | |
| | | Six Months Ended
December 31, 2014
(Unaudited) | | | Year Ended
June 30, 2014 | | | Six Months Ended
December 31, 2014
(Unaudited) | | | Year Ended
June 30, 2014 | |
CAPITAL TRANSACTIONS: | | | | | | | | | | | | | | | | |
Class A | | | | | | | | | | | | | | | | |
Proceeds from shares issued | | $ | 154,352 | | | $ | 117,470 | | | $ | 190,442 | | | $ | 455,863 | |
Distributions reinvested | | | 76,908 | | | | 65,053 | | | | 195,292 | | | | 139,350 | |
Cost of shares redeemed | | | (88,838 | ) | | | (127,370 | ) | | | (1,035,632 | ) | | | (880,766 | ) |
| | | | | | | | | | | | | | | | |
Change in net assets resulting from Class A capital transactions | | $ | 142,422 | | | $ | 55,153 | | | $ | (649,898 | ) | | $ | (285,553 | ) |
| | | | | | | | | | | | | | | | |
Class B | | | | | | | | | | | | | | | | |
Proceeds from shares issued | | $ | 22 | | | $ | 60 | | | $ | 16 | | | $ | 98 | |
Distributions reinvested | | | 593 | | | | 905 | | | | 639 | | | | 502 | |
Cost of shares redeemed | | | (1,061 | ) | | | (3,553 | ) | | | (2,136 | ) | | | (7,405 | ) |
| | | | | | | | | | | | | | | | |
Change in net assets resulting from Class B capital transactions | | $ | (446 | ) | | $ | (2,588 | ) | | $ | (1,481 | ) | | $ | (6,805 | ) |
| | | | | | | | | | | | | | | | |
Class C | | | | | | | | | | | | | | | | |
Proceeds from shares issued | | $ | 16,756 | | | $ | 14,903 | | | $ | 17,013 | | | $ | 27,504 | |
Distributions reinvested | | | 5,274 | | | | 2,860 | | | | 36,724 | | | | 19,472 | |
Cost of shares redeemed | | | (4,181 | ) | | | (5,376 | ) | | | (36,801 | ) | | | (66,037 | ) |
| | | | | | | | | | | | | | | | |
Change in net assets resulting from Class C capital transactions | | $ | 17,849 | | | $ | 12,387 | | | $ | 16,936 | | | $ | (19,061 | ) |
| | | | | | | | | | | | | | | | |
Class R2 | | | | | | | | | | | | | | | | |
Proceeds from shares issued | | $ | 2,717 | | | $ | 1,589 | | | $ | 9,372 | | | $ | 21,879 | |
Distributions reinvested | | | 345 | | | | 58 | | | | 5,637 | | | | 2,790 | |
Cost of shares redeemed | | | (599 | ) | | | (276 | ) | | | (10,283 | ) | | | (20,179 | ) |
| | | | | | | | | | | | | | | | |
Change in net assets resulting from Class R2 capital transactions | | $ | 2,463 | | | $ | 1,371 | | | $ | 4,726 | | | $ | 4,490 | |
| | | | | | | | | | | | | | | | |
Class R5 | | | | | | | | | | | | | | | | |
Proceeds from shares issued | | $ | 18,990 | | | $ | 11,177 | | | $ | — | | | $ | — | |
Distributions reinvested | | | 3,427 | | | | 2,276 | | | | — | | | | — | |
Cost of shares redeemed | | | (3,103 | ) | | | (8,354 | ) | | | — | | | | — | |
| | | | | | | | | | | | | | | | |
Change in net assets resulting from Class R5 capital transactions | | $ | 19,314 | | | $ | 5,099 | | | $ | — | | | $ | — | |
| | | | | | | | | | | | | | | | |
Class R6 | | | | | | | | | | | | | | | | |
Proceeds from shares issued | | $ | 20,429 | | | $ | 33,802 | | | $ | — | | | $ | — | |
Distributions reinvested | | | 7,291 | | | | 4,757 | | | | — | | | | — | |
Cost of shares redeemed | | | (15,047 | ) | | | (12,254 | ) | | | — | | | | — | |
| | | | | | | | | | | | | | | | |
Change in net assets resulting from Class R6 capital transactions | | $ | 12,673 | | | $ | 26,305 | | | $ | — | | | $ | — | |
| | | | | | | | | | | | | | | | |
Institutional Class | | | | | | | | | | | | | | | | |
Proceeds from shares issued | | $ | — | | | $ | — | | | $ | 1,906,087 | | | $ | 1,953,853 | |
Distributions reinvested | | | — | | | | — | | | | 686,825 | | | | 315,542 | |
Cost of shares redeemed | | | — | | | | — | | | | (775,800 | ) | | | (1,555,034 | ) |
| | | | | | | | | | | | | | | | |
Change in net assets resulting from Institutional Class capital transactions | | $ | — | | | $ | — | | | $ | 1,817,112 | | | $ | 714,361 | |
| | | | | | | | | | | | | | | | |
Select Class | | | | | | | | | | | | | | | | |
Proceeds from shares issued | | $ | 172,723 | | | $ | 235,397 | | | $ | 874,338 | | | $ | 551,560 | |
Distributions reinvested | | | 103,039 | | | | 84,914 | | | | 174,083 | | | | 120,569 | |
Cost of shares redeemed | | | (114,084 | ) | | | (166,729 | ) | | | (1,575,482 | ) | | | (1,061,484 | ) |
| | | | | | | | | | | | | | | | |
Change in net assets resulting from Select Class capital transactions | | $ | 161,678 | | | $ | 153,582 | | | $ | (527,061 | ) | | $ | (389,355 | ) |
| | | | | | | | | | | | | | | | |
Total change in net assets resulting from capital transactions | | $ | 355,953 | | | $ | 251,309 | | | $ | 660,334 | | | $ | 18,077 | |
| | | | | | | | | | | | | | | | |
SEE NOTES TO FINANCIAL STATEMENTS.
| | | | | | | | |
| | | |
| DECEMBER 31, 2014 | | J.P. MORGAN MID CAP/MULTI-CAP FUNDS | | | | | 51 | |
STATEMENTS OF CHANGES IN NET ASSETS
FOR THE PERIODS INDICATED (continued)
(Amounts in thousands)
| | | | | | | | | | | | | | | | |
| | | Mid Cap Growth Fund | | | Mid Cap Value Fund | |
| | | Six Months Ended
December 31, 2014
(Unaudited) | | | Year Ended
June 30, 2014 | | | Six Months Ended
December 31, 2014
(Unaudited) | | | Year Ended
June 30, 2014 | |
SHARE TRANSACTIONS: | | | | | | | | | | | | | | | | |
Class A | | | | | | | | | | | | | | | | |
Issued | | | 5,901 | | | | 4,546 | | | | 5,152 | | | | 13,275 | |
Reinvested | | | 3,166 | | | | 2,708 | | | | 5,494 | | | | 4,172 | |
Redeemed | | | (3,335 | ) | | | (4,940 | ) | | | (27,993 | ) | | | (25,729 | ) |
| | | | | | | | | | | | | | | | |
Change in Class A Shares | | | 5,732 | | | | 2,314 | | | | (17,347 | ) | | | (8,282 | ) |
| | | | | | | | | | | | | | | | |
Class B | | | | | | | | | | | | | | | | |
Issued | | | 1 | | | | 3 | | | | — | (a) | | | 4 | |
Reinvested | | | 37 | | | | 53 | | | | 18 | | | | 15 | |
Redeemed | | | (56 | ) | | | (193 | ) | | | (57 | ) | | | (223 | ) |
| | | | | | | | | | | | | | | | |
Change in Class B Shares | | | (18 | ) | | | (137 | ) | | | (39 | ) | | | (204 | ) |
| | | | | | | | | | | | | | | | |
Class C | | | | | | | | | | | | | | | | |
Issued | | | 744 | | | | 673 | | | | 483 | | | | 830 | |
Reinvested | | | 262 | | | | 140 | | | | 1,070 | | | | 602 | |
Redeemed | | | (187 | ) | | | (244 | ) | | | (1,025 | ) | | | (1,968 | ) |
| | | | | | | | | | | | | | | | |
Change in Class C Shares | | | 819 | | | | 569 | | | | 528 | | | | (536 | ) |
| | | | | | | | | | | | | | | | |
Class R2 | | | | | | | | | | | | | | | | |
Issued | | | 94 | | | | 58 | | | | 261 | | | | 654 | |
Reinvested | | | 13 | | | | 2 | | | | 164 | | | | 86 | |
Redeemed | | | (21 | ) | | | (10 | ) | | | (289 | ) | | | (599 | ) |
| | | | | | | | | | | | | | | | |
Change in Class R2 Shares | | | 86 | | | | 50 | | | | 136 | | | | 141 | |
| | | | | | | | | | | | | | | | |
Class R5 | | | | | | | | | | | | | | | | |
Issued | | | 639 | | | | 397 | | | | — | | | | — | |
Reinvested | | | 125 | | | | 86 | | | | — | | | | — | |
Redeemed | | | (104 | ) | | | (293 | ) | | | — | | | | — | |
| | | | | | | | | | | | | | | | |
Change in Class R5 Shares | | | 660 | | | | 190 | | | | — | | | | — | |
| | | | | | | | | | | | | | | | |
Class R6 | | | | | | | | | | | | | | | | |
Issued | | | 689 | | | | 1,187 | | | | — | | | | — | |
Reinvested | | | 266 | | | | 179 | | | | — | | | | — | |
Redeemed | | | (503 | ) | | | (432 | ) | | | — | | | | — | |
| | | | | | | | | | | | | | | | |
Change in Class R6 Shares | | | 452 | | | | 934 | | | | — | | | | — | |
| | | | | | | | | | | | | | | | |
Institutional Class | | | | | | | | | | | | | | | | |
Issued | | | — | | | | — | | | | 49,420 | | | | 55,438 | |
Reinvested | | | — | | | | — | | | | 18,860 | | | | 9,240 | |
Redeemed | | | — | | | | — | | | | (20,573 | ) | | | (44,220 | ) |
| | | | | | | | | | | | | | | | |
Change in Institutional Class Shares | | | — | | | | — | | | | 47,707 | | | | 20,458 | |
| | | | | | | | | | | | | | | | |
Select Class | | | | | | | | | | | | | | | | |
Issued | | | 5,934 | | | | 8,322 | | | | 23,375 | | | | 15,917 | |
Reinvested | | | 3,790 | | | | 3,204 | | | | 4,839 | | | | 3,571 | |
Redeemed | | | (3,872 | ) | | | (5,903 | ) | | | (41,079 | ) | | | (30,426 | ) |
| | | | | | | | | | | | | | | | |
Change in Select Class Shares | | | 5,852 | | | | 5,623 | | | | (12,865 | ) | | | (10,938 | ) |
| | | | | | | | | | | | | | | | |
| (a) | Amount rounds to less than 1,000 shares. |
SEE NOTES TO FINANCIAL STATEMENTS.
| | | | | | |
| | | |
| 52 | | | | J.P. MORGAN MID CAP/MULTI-CAP FUNDS | | DECEMBER 31, 2014 |
| | | | | | | | | | | | | | | | |
| | | Multi-Cap Market Neutral Fund | | | Value Advantage Fund | |
| | | Six Months Ended
December 31, 2014
(Unaudited) | | | Year Ended
June 30, 2014 | | | Six Months Ended
December 31, 2014
(Unaudited) | | | Year Ended
June 30, 2014 | |
CAPITAL TRANSACTIONS: | | | | | | | | | | | | | | | | |
Class A | | | | | | | | | | | | | | | | |
Proceeds from shares issued | | $ | 256 | | | $ | 2,563 | | | $ | 615,706 | | | $ | 931,606 | |
Distributions reinvested | | | — | | | | — | | | | 63,610 | | | | 34,685 | |
Cost of shares redeemed | | | (3,682 | ) | | | (6,487 | ) | | | (264,402 | ) | | | (255,314 | ) |
| | | | | | | | | | | | | | | | |
Change in net assets resulting from Class A capital transactions | | $ | (3,426 | ) | | $ | (3,924 | ) | | $ | 414,914 | | | $ | 710,977 | |
| | | | | | | | | | | | | | | | |
Class B | | | | | | | | | | | | | | | | |
Proceeds from shares issued | | $ | — | | | $ | 3 | | | $ | — | | | $ | — | |
Cost of shares redeemed | | | (55 | ) | | | (325 | ) | | | — | | | | — | |
| | | | | | | | | | | | | | | | |
Change in net assets resulting from Class B capital transactions | | $ | (55 | ) | | $ | (322 | ) | | $ | — | | | $ | — | |
| | | | | | | | | | | | | | | | |
Class C | | | | | | | | | | | | | | | | |
Proceeds from shares issued | | $ | 367 | | | $ | 505 | | | $ | 154,592 | | | $ | 164,051 | |
Distributions reinvested | | | — | | | | — | | | | 12,024 | | | | 6,053 | |
Cost of shares redeemed | | | (1,424 | ) | | | (3,141 | ) | | | (26,075 | ) | | | (28,716 | ) |
| | | | | | | | | | | | | | | | |
Change in net assets resulting from Class C capital transactions | | $ | (1,057 | ) | | $ | (2,636 | ) | | $ | 140,541 | | | $ | 141,388 | |
| | | | | | | | | | | | | | | | |
Institutional Class | | | | | | | | | | | | | | | | |
Proceeds from shares issued | | $ | — | | | $ | — | | | $ | 1,108,871 | | | $ | 1,480,427 | |
Distributions reinvested | | | — | | | | — | | | | 134,005 | | | | 69,075 | |
Cost of shares redeemed | | | — | | | | — | | | | (173,103 | ) | | | (330,856 | ) |
| | | | | | | | | | | | | | | | |
Change in net assets resulting from Institutional Class capital transactions | | $ | — | | | $ | — | | | $ | 1,069,773 | | | $ | 1,218,646 | |
| | | | | | | | | | | | | | | | |
Select Class | | | | | | | | | | | | | | | | |
Proceeds from shares issued | | $ | 5,339 | | | $ | 114,928 | | | $ | 398,848 | | | $ | 1,276,857 | |
Distributions reinvested | | | — | | | | — | | | | 87,369 | | | | 49,543 | |
Cost of shares redeemed | | | (137,647 | ) | | | (6,058 | ) | | | (113,658 | ) | | | (335,843 | ) |
| | | | | | | | | | | | | | | | |
Change in net assets resulting from Select Class capital transactions | | $ | (132,308 | ) | | $ | 108,870 | | | $ | 372,559 | | | $ | 990,557 | |
| | | | | | | | | | | | | | | | |
Total change in net assets resulting from capital transactions | | $ | (136,846 | ) | | $ | 101,988 | | | $ | 1,997,787 | | | $ | 3,061,568 | |
| | | | | | | | | | | | | | | | |
SEE NOTES TO FINANCIAL STATEMENTS.
| | | | | | | | |
| | | |
| DECEMBER 31, 2014 | | J.P. MORGAN MID CAP/MULTI-CAP FUNDS | | | | | 53 | |
STATEMENTS OF CHANGES IN NET ASSETS
FOR THE PERIODS INDICATED (continued)
(Amounts in thousands)
| | | | | | | | | | | | | | | | |
| | | Multi-Cap Market Neutral Fund | | | Value Advantage Fund | |
| | | Six Months Ended
December 31, 2014
(Unaudited) | | | Year Ended
June 30, 2014 | | | Six Months Ended
December 31, 2014
(Unaudited) | | | Year Ended
June 30, 2014 | |
SHARE TRANSACTIONS: | | | | | | | | | | | | | | | | |
Class A | | | | | | | | | | | | | | | | |
Issued | | | 25 | | | | 262 | | | | 21,021 | | | | 34,698 | |
Reinvested | | | — | | | | — | | | | 2,177 | | | | 1,320 | |
Redeemed | | | (369 | ) | | | (663 | ) | | | (9,035 | ) | | | (9,483 | ) |
| | | | | | | | | | | | | | | | |
Change in Class A Shares | | | (344 | ) | | | (401 | ) | | | 14,163 | | | | 26,535 | |
| | | | | | | | | | | | | | | | |
Class B | | | | | | | | | | | | | | | | |
Issued | | | — | | | | 1 | | | | — | | | | — | |
Redeemed | | | (6 | ) | | | (36 | ) | | | — | | | | — | |
| | | | | | | | | | | | | | | | |
Change in Class B Shares | | | (6 | ) | | | (35 | ) | | | — | | | | — | |
| | | | | | | | | | | | | | | | |
Class C | | | | | | | | | | | | | | | | |
Issued | | | 39 | | | | 54 | | | | 5,285 | | | | 6,062 | |
Reinvested | | | — | | | | — | | | | 414 | | | | 232 | |
Redeemed | | | (151 | ) | | | (338 | ) | | | (895 | ) | | | (1,062 | ) |
| | | | | | | | | | | | | | | | |
Change in Class C Shares | | | (112 | ) | | | (284 | ) | | | 4,804 | | | | 5,232 | |
| | | | | | | | | | | | | | | | |
Institutional Class | | | | | | | | | | | | | | | | |
Issued | | | — | | | | — | | | | 37,756 | | | | 54,588 | |
Reinvested | | | — | | | | — | | | | 4,545 | | | | 2,610 | |
Redeemed | | | — | | | | — | | | | (5,853 | ) | | | (12,230 | ) |
| | | | | | | | | | | | | | | | |
Change in Institutional Class Shares | | | — | | | | — | | | | 36,448 | | | | 44,968 | |
| | | | | | | | | | | | | | | | |
Select Class | | | | | | | | | | | | | | | | |
Issued | | | 527 | | | | 11,408 | | | | 13,607 | | | | 47,271 | |
Reinvested | | | — | | | | — | | | | 2,972 | | | | 1,877 | |
Redeemed | | | (13,502 | ) | | | (607 | ) | | | (3,865 | ) | | | (12,507 | ) |
| | | | | | | | | | | | | | | | |
Change in Select Class Shares | | | (12,975 | ) | | | 10,801 | | | | 12,714 | | | | 36,641 | |
| | | | | | | | | | | | | | | | |
SEE NOTES TO FINANCIAL STATEMENTS.
| | | | | | |
| | | |
| 54 | | | | J.P. MORGAN MID CAP/MULTI-CAP FUNDS | | DECEMBER 31, 2014 |
THIS PAGE IS INTENTIONALLY LEFT BLANK
| | | | | | | | |
| | | |
| DECEMBER 31, 2014 | | J.P. MORGAN MID CAP/MULTI-CAP FUNDS | | | | | 55 | |
FINANCIAL HIGHLIGHTS
FOR THE PERIODS INDICATED
| | | | | | | | | | | | | | | | | | | | | | | | | | | | |
| | | | | | Per share operating performance | |
| | | | | | Investment operations | | | Distributions | |
| | | Net asset
value,
beginning
of period | | | Net
investment
income
(loss) | | | Net realized
and unrealized
gains
(losses) on
investments | | | Total from
investment
operations | | | Net
investment
income | | | Net
realized
gain | | | Total
distributions | |
Growth Advantage Fund | | | | | | | | | | | | | | | | | | | | | | | | | | | | |
Class A | | | | | | | | | | | | | | | | | | | | | | | | | | | | |
Six Months Ended December 31, 2014 (Unaudited) | | $ | 14.24 | | | $ | (0.05 | )(f) | | $ | 0.71 | | | $ | 0.66 | | | $ | — | | | $ | (0.57 | ) | | $ | (0.57 | ) |
Year Ended June 30, 2014 | | | 11.43 | | | | (0.07 | )(f) | | | 3.52 | | | | 3.45 | | | | — | | | | (0.64 | ) | | | (0.64 | ) |
Year Ended June 30, 2013 | | | 9.49 | | | | 0.01 | (f)(g) | | | 1.97 | | | | 1.98 | | | | (0.01 | ) | | | (0.03 | ) | | | (0.04 | ) |
Year Ended June 30, 2012 | | | 9.28 | | | | (0.03 | )(f)(h) | | | 0.24 | | | | 0.21 | | | | — | | | | — | | | | — | |
Year Ended June 30, 2011 | | | 6.76 | | | | (0.04 | )(f) | | | 2.56 | | | | 2.52 | | | | — | | | | — | | | | — | |
Year Ended June 30, 2010 | | | 5.88 | | | | (0.03 | )(f) | | | 0.91 | | | | 0.88 | | | | — | | | | — | | | | — | |
| | | | | | | |
Class B | | | | | | | | | | | | | | | | | | | | | | | | | | | | |
Six Months Ended December 31, 2014 (Unaudited) | | | 12.97 | | | | (0.08 | )(f) | | | 0.64 | | | | 0.56 | | | | — | | | | (0.57 | ) | | | (0.57 | ) |
Year Ended June 30, 2014 | | | 10.50 | | | | (0.12 | )(f) | | | 3.23 | | | | 3.11 | | | | — | | | | (0.64 | ) | | | (0.64 | ) |
Year Ended June 30, 2013 | | | 8.76 | | | | (0.04 | )(f)(g) | | | 1.81 | | | | 1.77 | | | | — | | | | (0.03 | ) | | | (0.03 | ) |
Year Ended June 30, 2012 | | | 8.61 | | | | (0.07 | )(f)(h) | | | 0.22 | | | | 0.15 | | | | — | | | | — | | | | — | |
Year Ended June 30, 2011 | | | 6.31 | | | | (0.07 | )(f) | | | 2.37 | | | | 2.30 | | | | — | | | | — | | | | — | |
Year Ended June 30, 2010 | | | 5.51 | | | | (0.06 | )(f) | | | 0.86 | | | | 0.80 | | | | — | | | | — | | | | — | |
| | | | | | | |
Class C | | | | | | | | | | | | | | | | | | | | | | | | | | | | |
Six Months Ended December 31, 2014 (Unaudited) | | | 12.98 | | | | (0.08 | )(f) | | | 0.64 | | | | 0.56 | | | | — | | | | (0.57 | ) | | | (0.57 | ) |
Year Ended June 30, 2014 | | | 10.51 | | | | (0.12 | )(f) | | | 3.23 | | | | 3.11 | | | | — | | | | (0.64 | ) | | | (0.64 | ) |
Year Ended June 30, 2013 | | | 8.77 | | | | (0.04 | )(f)(g) | | | 1.81 | | | | 1.77 | | | | — | | | | (0.03 | ) | | | (0.03 | ) |
Year Ended June 30, 2012 | | | 8.61 | | | | (0.07 | )(f)(h) | | | 0.23 | | | | 0.16 | | | | — | | | | — | | | | — | |
Year Ended June 30, 2011 | | | 6.31 | | | | (0.08 | )(f) | | | 2.38 | | | | 2.30 | | | | — | | | | — | | | | — | |
Year Ended June 30, 2010 | | | 5.52 | | | | (0.06 | )(f) | | | 0.85 | | | | 0.79 | | | | — | | | | — | | | | — | |
| | | | | | | |
Class R5 | | | | | | | | | | | | | | | | | | | | | | | | | | | | |
Six Months Ended December 31, 2014 (Unaudited) | | | 14.63 | | | | (0.02 | )(f) | | | 0.73 | | | | 0.71 | | | | — | | | | (0.57 | ) | | | (0.57 | ) |
Year Ended June 30, 2014 | | | 11.68 | | | | (0.02 | )(f) | | | 3.61 | | | | 3.59 | | | | — | | | | (0.64 | ) | | | (0.64 | ) |
Year Ended June 30, 2013 | | | 9.69 | | | | 0.06 | (f)(g) | | | 2.01 | | | | 2.07 | | | | (0.05 | ) | | | (0.03 | ) | | | (0.08 | ) |
Year Ended June 30, 2012 | | | 9.44 | | | | 0.01 | (f)(h) | | | 0.24 | | | | 0.25 | | | | — | | | | — | | | | — | |
Year Ended June 30, 2011 | | | 6.86 | | | | — | (f)(i) | | | 2.58 | | | | 2.58 | | | | — | | | | — | | | | — | |
Year Ended June 30, 2010 | | | 5.93 | | | | — | (f)(i) | | | 0.93 | | | | 0.93 | | | | — | | | | — | | | | — | |
| | | | | | | |
Class R6 | | | | | | | | | | | | | | | | | | | | | | | | | | | | |
Six Months Ended December 31, 2014 (Unaudited) | | | 14.64 | | | | (0.02 | )(f) | | | 0.73 | | | | 0.71 | | | | — | | | | (0.57 | ) | | | (0.57 | ) |
December 23, 2013(j) through June 30, 2014 | | | 13.86 | | | | (0.01 | )(f) | | | 0.79 | | | | 0.78 | | | | — | | | | — | | | | — | |
| | | | | | | |
Select Class | | | | | | | | | | | | | | | | | | | | | | | | | | | | |
Six Months Ended December 31, 2014 (Unaudited) | | | 14.50 | | | | (0.04 | )(f) | | | 0.72 | | | | 0.68 | | | | — | | | | (0.57 | ) | | | (0.57 | ) |
Year Ended June 30, 2014 | | | 11.60 | | | | (0.04 | )(f) | | | 3.58 | | | | 3.54 | | | | — | | | | (0.64 | ) | | | (0.64 | ) |
Year Ended June 30, 2013 | | | 9.63 | | | | 0.04 | (f)(g) | | | 1.98 | | | | 2.02 | | | | (0.02 | ) | | | (0.03 | ) | | | (0.05 | ) |
Year Ended June 30, 2012 | | | 9.39 | | | | (0.02 | )(f)(h) | | | 0.26 | | | | 0.24 | | | | — | | | | — | | | | — | |
Year Ended June 30, 2011 | | | 6.83 | | | | (0.02 | )(f) | | | 2.58 | | | | 2.56 | | | | — | | | | — | | | | — | |
Year Ended June 30, 2010 | | | 5.93 | | | | (0.01 | )(f) | | | 0.91 | | | | 0.90 | | | | — | | | | — | | | | — | |
| (a) | Annualized for periods less than one year, unless otherwise noted. |
| (b) | Not annualized for periods less than one year. |
| (c) | Includes adjustments in accordance with accounting principles generally accepted in the United States of America and as such, the net asset values for financial reporting purposes and the returns based upon those net asset values may differ from the net asset values and returns for shareholder transactions. |
| (d) | Includes earnings credits and interest expense, if applicable, each of which is less than 0.01% unless otherwise noted. |
| (e) | Portfolio turnover is calculated by dividing the lesser of total purchases or sales of portfolio securities for the reporting period by the monthly average value of portfolio securities owned during the reporting period. Excluded from both the numerator and denominator are amounts relating to derivatives and securities whose maturities or expiration dates at the time of acquisition were one year or less. |
| (f) | Calculated based upon average shares outstanding. |
| (g) | Reflects special dividends paid out during the period by several of the Fund’s holdings. Had the Fund not received the special dividends, the net investment income (loss) per share would have been $(0.02), $(0.06), $(0.06), $0.03 and $0.01 for Class A, Class B, Class C, Class R5 and Select Class Shares, respectively, and the net investment income (loss) ratio would have been (0.17)%, (0.66)%, (0.66)%, 0.27% and 0.09% for Class A, Class B, Class C, Class R5 and Select Class Shares, respectively. |
| (h) | Reflects a special dividend paid out during the period by one of the Fund’s holdings. Had the Fund not received the special dividend, the net investment income (loss) per share would have been $(0.05), $(0.09), $(0.09), $(0.01) and $(0.03) for Class A, Class B, Class C, Class R5 and Select Class Shares, respectively, and the net investment income (loss) ratio would have been (0.56)%, (1.08)%, (1.03)%, (0.12)% and (0.37)% for Class A, Class B, Class C, Class R5 and Select Class Shares, respectively. |
| (i) | Amount rounds to less than $0.01. |
| (j) | Commencement of offering of class of shares. |
SEE NOTES TO FINANCIAL STATEMENTS.
| | | | | | |
| | | |
| 56 | | | | J.P. MORGAN MID CAP/MULTI-CAP FUNDS | | DECEMBER 31, 2014 |
| | | | | | | | | | | | | | | | | | | | | | | | | | |
| | | Ratios/Supplemental data | |
| | | | | | | | | | Ratios to average net assets (a) | | | | |
Net asset
value,
end of
period | | | Total return
(excludes
sales charge) (b)(c) | | | Net assets,
end of
period
(000’s) | | | Net
expenses (d) | | | Net
investment income
(loss) | | | Expenses
without waivers,
reimbursements and
earnings credits | | | Portfolio
turnover
rate (b)(e) | |
| | | | | | | | | | | | | | | | | | | | | | | | | | |
| | | | | | | | | | | | | | | | | | | | | | | | | | |
| $ | 14.33 | | | | 4.69 | % | | $ | 872,880 | | | | 1.25 | % | | | (0.67 | )% | | | 1.32 | % | | | 26 | % |
| | 14.24 | | | | 30.69 | | | | 717,564 | | | | 1.24 | | | | (0.51 | ) | | | 1.31 | | | | 62 | |
| | 11.43 | | | | 20.95 | | | | 276,670 | | | | 1.24 | | | | 0.11 | (g) | | | 1.28 | | | | 76 | |
| | 9.49 | | | | 2.26 | | | | 194,911 | | | | 1.25 | | | | (0.37 | )(h) | | | 1.30 | | | | 86 | |
| | 9.28 | | | | 37.28 | | | | 176,492 | | | | 1.25 | | | | (0.45 | ) | | | 1.31 | | | | 96 | |
| | 6.76 | | | | 14.97 | | | | 101,814 | | | | 1.31 | | | | (0.41 | ) | | | 1.31 | | | | 102 | |
| | | | | | |
| | | | | | | | | | | | | | | | | | | | | | | | | | |
| | 12.96 | | | | 4.38 | | | | 2,295 | | | | 1.75 | | | | (1.17 | ) | | | 1.83 | | | | 26 | |
| | 12.97 | | | | 30.15 | | | | 2,417 | | | | 1.74 | | | | (0.99 | ) | | | 1.81 | | | | 62 | |
| | 10.50 | | | | 20.29 | | | | 2,081 | | | | 1.74 | | | | (0.38 | )(g) | | | 1.78 | | | | 76 | |
| | 8.76 | | | | 1.74 | | | | 2,327 | | | | 1.75 | | | | (0.89 | )(h) | | | 1.80 | | | | 86 | |
| | 8.61 | | | | 36.45 | | | | 3,157 | | | | 1.75 | | | | (0.94 | ) | | | 1.81 | | | | 96 | |
| | 6.31 | | | | 14.52 | | | | 3,070 | | | | 1.81 | | | | (0.91 | ) | | | 1.81 | | | | 102 | |
| | | | | | |
| | | | | | | | | | | | | | | | | | | | | | | | | | |
| | 12.97 | | | | 4.37 | | | | 194,883 | | | | 1.75 | | | | (1.17 | ) | | | 1.82 | | | | 26 | |
| | 12.98 | | | | 30.12 | | | | 144,229 | | | | 1.74 | | | | (1.01 | ) | | | 1.81 | | | | 62 | |
| | 10.51 | | | | 20.27 | | | | 42,655 | | | | 1.74 | | | | (0.38 | )(g) | | | 1.78 | | | | 76 | |
| | 8.77 | | | | 1.86 | | | | 27,469 | | | | 1.75 | | | | (0.84 | )(h) | | | 1.80 | | | | 86 | |
| | 8.61 | | | | 36.45 | | | | 20,676 | | | | 1.75 | | | | (0.95 | ) | | | 1.81 | | | | 96 | |
| | 6.31 | | | | 14.31 | | | | 12,811 | | | | 1.81 | | | | (0.91 | ) | | | 1.81 | | | | 102 | |
| | | | | | |
| | | | | | | | | | | | | | | | | | | | | | | | | | |
| | 14.77 | | | | 4.91 | | | | 47,921 | | | | 0.85 | | | | (0.25 | ) | | | 0.86 | | | | 26 | |
| | 14.63 | | | | 31.25 | | | | 1,453,864 | | | | 0.85 | | | | (0.11 | ) | | | 0.86 | | | | 62 | |
| | 11.68 | | | | 21.49 | | | | 835,233 | | | | 0.83 | | | | 0.55 | (g) | | | 0.84 | | | | 76 | |
| | 9.69 | | | | 2.65 | | | | 468,064 | | | | 0.85 | | | | 0.07 | (h) | | | 0.85 | | | | 86 | |
| | 9.44 | | | | 37.61 | | | | 179,677 | | | | 0.86 | | | | (0.05 | ) | | | 0.86 | | | | 96 | |
| | 6.86 | | | | 15.68 | | | | 76,767 | | | | 0.86 | | | | 0.05 | | | | 0.86 | | | | 102 | |
| | | | | | |
| | | | | | | | | | | | | | | | | | | | | | | | | | |
| | 14.78 | | | | 4.96 | | | | 1,993,565 | | | | 0.77 | | | | (0.21 | ) | | | 0.78 | | | | 26 | |
| | 14.64 | | | | 5.63 | | | | 271,958 | | | | 0.80 | | | | (0.15 | ) | | | 0.82 | | | | 62 | |
| | | | | | |
| | | | | | | | | | | | | | | | | | | | | | | | | | |
| | 14.61 | | | | 4.74 | | | | 1,056,892 | | | | 1.06 | | | | (0.49 | ) | | | 1.07 | | | | 26 | |
| | 14.50 | | | | 31.03 | | | | 975,175 | | | | 1.05 | | | | (0.30 | ) | | | 1.06 | | | | 62 | |
| | 11.60 | | | | 21.14 | | | | 842,783 | | | | 1.03 | | | | 0.37 | (g) | | | 1.03 | | | | 76 | |
| | 9.63 | | | | 2.56 | | | | 662,786 | | | | 1.05 | | | | (0.18 | )(h) | | | 1.05 | | | | 86 | |
| | 9.39 | | | | 37.48 | | | | 836,154 | | | | 1.06 | | | | (0.27 | ) | | | 1.06 | | | | 96 | |
| | 6.83 | | | | 15.18 | | | | 604,663 | | | | 1.06 | | | | (0.16 | ) | | | 1.06 | | | | 102 | |
SEE NOTES TO FINANCIAL STATEMENTS.
| | | | | | | | |
| | | |
| DECEMBER 31, 2014 | | J.P. MORGAN MID CAP/MULTI-CAP FUNDS | | | | | 57 | |
FINANCIAL HIGHLIGHTS
FOR THE PERIODS INDICATED (continued)
| | | | | | | | | | | | | | | | | | | | | | | | | | | | |
| | | Per share operating performance | |
| | | | | | Investment operations | | | Distributions | |
| | | Net asset
value,
beginning
of period | | | Net
investment
income
(loss) | | | Net realized
and unrealized
gains
(losses) on
investments | | | Total from
investment
operations | | | Net
investment
income | | | Net
realized
gain | | | Total
distributions | |
Mid Cap Equity Fund | | | | | | | | | | | | | | | | | | | | | | | | | | | | |
Class A | | | | | | | | | | | | | | | | | | | | | | | | | | | | |
Six Months Ended December 31, 2014 (Unaudited) | | $ | 44.91 | | | $ | 0.03 | (f) | | $ | 1.71 | | | $ | 1.74 | | | $ | (0.05 | ) | | $ | (2.03 | ) | | $ | (2.08 | ) |
Year Ended June 30, 2014 | | | 38.10 | | | | (0.04 | )(g) | | | 10.25 | | | | 10.21 | | | | (0.02 | ) | | | (3.38 | ) | | | (3.40 | ) |
Year Ended June 30, 2013 | | | 30.97 | | | | 0.10 | (g)(h) | | | 7.36 | | | | 7.46 | | | | (0.07 | ) | | | (0.26 | ) | | | (0.33 | ) |
Year Ended June 30, 2012 | | | 31.29 | | | | 0.10 | (g)(i) | | | (0.34 | ) | | | (0.24 | ) | | | (0.08 | ) | | | — | | | | (0.08 | ) |
Year Ended June 30, 2011 | | | 22.95 | | | | 0.04 | (g) | | | 8.36 | | | | 8.40 | | | | (0.06 | ) | | | — | | | | (0.06 | ) |
November 2, 2009 (j) through June 30, 2010 | | | 21.55 | | | | 0.05 | | | | 1.41 | | | | 1.46 | | | | (0.06 | ) | | | — | | | | (0.06 | ) |
| | | | | | | |
Class C | | | | | | | | | | | | | | | | | | | | | | | | | | | | |
Six Months Ended December 31, 2014 (Unaudited) | | | 44.21 | | | | (0.06 | )(f) | | | 1.65 | | | | 1.59 | | | | — | (k) | | | (2.03 | ) | | | (2.03 | ) |
Year Ended June 30, 2014 | | | 37.71 | | | | (0.24 | )(g) | | | 10.12 | | | | 9.88 | | | | — | | | | (3.38 | ) | | | (3.38 | ) |
Year Ended June 30, 2013 | | | 30.75 | | | | (0.07 | )(g)(h) | | | 7.29 | | | | 7.22 | | | | — | (k) | | | (0.26 | ) | | | (0.26 | ) |
Year Ended June 30, 2012 | | | 31.16 | | | | (0.05 | )(g)(i) | | | (0.35 | ) | | | (0.40 | ) | | | (0.01 | ) | | | — | | | | (0.01 | ) |
Year Ended June 30, 2011 | | | 22.93 | | | | (0.12 | )(g) | | | 8.37 | | | | 8.25 | | | | (0.02 | ) | | | — | | | | (0.02 | ) |
November 2, 2009 (j) through June 30, 2010 | | | 21.55 | | | | (0.03 | ) | | | 1.41 | | | | 1.38 | | | | — | (k) | | | — | | | | — | (k) |
| | | | | | | |
Class R2 | | | | | | | | | | | | | | | | | | | | | | | | | | | | |
Six Months Ended December 31, 2014 (Unaudited) | | | 44.87 | | | | (0.04 | )(f) | | | 1.72 | | | | 1.68 | | | | (0.02 | ) | | | (2.03 | ) | | | (2.05 | ) |
March 14, 2014 (j) through June 30, 2014 | | | 42.92 | | | | (0.05 | )(g) | | | 2.01 | | | | 1.96 | | | | (0.01 | ) | | | — | | | | (0.01 | ) |
| | | | | | | |
Class R5 | | | | | | | | | | | | | | | | | | | | | | | | | | | | |
Six Months Ended December 31, 2014 (Unaudited) | | | 45.15 | | | | 0.13 | (f) | | | 1.72 | | | | 1.85 | | | | (0.12 | ) | | | (2.03 | ) | | | (2.15 | ) |
March 14, 2014 (j) through June 30, 2014 | | | 43.14 | | | | 0.04 | (g) | | | 2.02 | | | | 2.06 | | | | (0.05 | ) | | | — | | | | (0.05 | ) |
| | | | | | | |
Class R6 | | | | | | | | | | | | | | | | | | | | | | | | | | | | |
Six Months Ended December 31, 2014 (Unaudited) | | | 45.15 | | | | 0.13 | (f) | | | 1.73 | | | | 1.86 | | | | (0.13 | ) | | | (2.03 | ) | | | (2.16 | ) |
March 14, 2014 (j) through June 30, 2014 | | | 43.14 | | | | 0.04 | (g) | | | 2.02 | | | | 2.06 | | | | (0.05 | ) | | | — | | | | (0.05 | ) |
| | | | | | | |
Select Class | | | | | | | | | | | | | | | | | | | | | | | | | | | | |
Six Months Ended December 31, 2014 (Unaudited) | | | 45.15 | | | | 0.10 | (f) | | | 1.73 | | | | 1.83 | | | | (0.10 | ) | | | (2.03 | ) | | | (2.13 | ) |
Year Ended June 30, 2014 | | | 38.22 | | | | 0.11 | (g) | | | 10.30 | | | | 10.41 | | | | (0.10 | ) | | | (3.38 | ) | | | (3.48 | ) |
Year Ended June 30, 2013 | | | 31.05 | | | | 0.20 | (g)(h) | | | 7.40 | | | | 7.60 | | | | (0.17 | ) | | | (0.26 | ) | | | (0.43 | ) |
Year Ended June 30, 2012 | | | 31.36 | | | | 0.19 | (g)(i) | | | (0.33 | ) | | | (0.14 | ) | | | (0.17 | ) | | | — | | | | (0.17 | ) |
Year Ended June 30, 2011 | | | 22.97 | | | | 0.14 | (g) | | | 8.37 | | | | 8.51 | | | | (0.12 | ) | | | — | | | | (0.12 | ) |
Year Ended June 30, 2010 | | | 18.97 | | | | 0.12 | | | | 4.00 | | | | 4.12 | | | | (0.12 | ) | | | — | | | | (0.12 | ) |
| (a) | Annualized for periods less than one year, unless otherwise noted. |
| (b) | Not annualized for periods less than one year. |
| (c) | Includes adjustments in accordance with accounting principles generally accepted in the United States of America and as such, the net asset values for financial reporting purposes and the returns based upon those net asset values may differ from the net asset values and returns for shareholder transactions. |
| (d) | Includes earnings credits and interest expense, if applicable, each of which is less than 0.01% unless otherwise noted. |
| (e) | Portfolio turnover is calculated by dividing the lesser of total purchases or sales of portfolio securities for the reporting period by the monthly average value of portfolio securities owned during the reporting period. Excluded from both the numerator and denominator are amounts relating to derivatives and securities whose maturities or expiration dates at the time of acquisition were one year or less. |
| (f) | Reflects special dividends paid out during the period by several of the Fund’s holdings. Had the Fund not received the special dividends, the net investment income (loss) per share would have been $(0.03), $(0.12), $(0.10), $0.07, $0.07 and $0.04 for Class A, Class C, Class R2, Class R5, Class R6 and Select Class Shares, respectively, and the net investment income (loss) ratio would have been (0.16)%, (0.67)%, (0.43)%, 0.52%, 0.35% and 0.18% for Class A, Class C, Class R2, Class R5, Class R6 and Select Class Shares, respectively. |
| (g) | Calculated based upon average shares outstanding. |
| (h) | Reflects special dividends paid out during the period by several of the Fund’s holdings. Had the Fund not received the special dividends, the net investment income (loss) per share would have been $0.03, $(0.14) and $0.14 for Class A, Class C and Select Class Shares, respectively, and the net investment income (loss) ratio would have been 0.09%, (0.39)% and 0.39% for Class A, Class C and Select Class Shares, respectively. |
| (i) | Reflects a special dividend paid out during the period by one of the Fund’s holdings. Had the Fund not received the special dividend the net investment income (loss) per share would have been $0.05, $(0.10) and $0.14 for Class A, Class C and Select Class Shares, respectively and the net investment income (loss) ratio would have been 0.18%, (0.33)% and 0.48% for Class A, Class C and Select Class Shares, respectively. |
| (j) | Commencement of offering of class of shares. |
| (k) | Amount rounds to less than $0.01. |
SEE NOTES TO FINANCIAL STATEMENTS.
| | | | | | |
| | | |
| 58 | | | | J.P. MORGAN MID CAP/MULTI-CAP FUNDS | | DECEMBER 31, 2014 |
| | | | | | | | | | | | | | | | | | | | | | | | | | |
| | | Ratios/Supplemental data | |
| | | | | | | | | | Ratios to average net assets (a) | | | | |
Net asset
value,
end of
period | | | Total return
(excludes
sales charge) (b)(c) | | | Net assets,
end of
period (000’s) | | | Net
expenses (d) | | | Net
investment income
(loss) | | | Expenses without
waivers,
reimbursements and
earnings credits | | | Portfolio
turnover
rate (b)(e) | |
| | | | | | | | | | | | | | | | | | | | | | | | | | |
| | | | | | | | | | | | | | | | | | | | | | | | | | |
| $ | 44.57 | | | | 4.04 | % | | $ | 185,853 | | | | 1.24 | % | | | 0.10 | %(f) | | | 1.41 | % | | | 18 | % |
| | 44.91 | | | | 27.96 | | | | 156,016 | | | | 1.24 | | | | (0.08 | ) | | | 1.41 | | | | 47 | |
| | 38.10 | | | | 24.23 | | | | 21,171 | | | | 1.24 | | | | 0.27 | (h) | | | 1.49 | | | | 67 | |
| | 30.97 | | | | (0.76 | ) | | | 6,965 | | | | 1.24 | | | | 0.34 | (i) | | | 1.54 | | | | 55 | |
| | 31.29 | | | | 36.60 | | | | 2,918 | | | | 1.24 | | | | 0.14 | | | | 1.53 | | | | 88 | |
| | 22.95 | | | | 6.77 | | | | 1,394 | | | | 1.24 | | | | 0.30 | | | | 1.44 | | | | 56 | |
| | | | | | |
| | | | | | | | | | | | | | | | | | | | | | | | | | |
| | 43.77 | | | | 3.77 | | | | 22,366 | | | | 1.74 | | | | (0.41 | )(f) | | | 1.89 | | | | 18 | |
| | 44.21 | | | | 27.34 | | | | 20,018 | | | | 1.74 | | | | (0.57 | ) | | | 1.93 | | | | 47 | |
| | 37.71 | | | | 23.60 | | | | 6,136 | | | | 1.74 | | | | (0.21 | )(h) | | | 2.00 | | | | 67 | |
| | 30.75 | | | | (1.29 | ) | | | 1,244 | | | | 1.75 | | | | (0.18 | )(i) | | | 2.03 | | | | 55 | |
| | 31.16 | | | | 35.98 | | | | 447 | | | | 1.74 | | | | (0.40 | ) | | | 2.06 | | | | 88 | |
| | 22.93 | | | | 6.40 | | | | 65 | | | | 1.74 | | | | (0.23 | ) | | | 1.92 | | | | 56 | |
| | | | | | |
| | | | | | | | | | | | | | | | | | | | | | | | | | |
| | 44.50 | | | | 3.92 | | | | 687 | | | | 1.49 | | | | (0.17 | )(f) | | | 1.63 | | | | 18 | |
| | 44.87 | | | | 4.56 | | | | 688 | | | | 1.47 | | | | (0.41 | ) | | | 1.60 | | | | 47 | |
| | | | | | |
| | | | | | | | | | | | | | | | | | | | | | | | | | |
| | 44.85 | | | | 4.27 | | | | 589 | | | | 0.79 | | | | 0.83 | (f) | | | 0.85 | | | | 18 | |
| | 45.15 | | | | 4.77 | | | | 91 | | | | 0.78 | | | | 0.27 | | | | 0.91 | | | | 47 | |
| | | | | | |
| | | | | | | | | | | | | | | | | | | | | | | | | | |
| | 44.85 | | | | 4.29 | | | | 1,066,585 | | | | 0.74 | | | | 0.61 | (f) | | | 0.84 | | | | 18 | |
| | 45.15 | | | | 4.78 | | | | 823,036 | | | | 0.73 | | | | 0.34 | | | | 0.86 | | | | 47 | |
| | | | | | |
| | | | | | | | | | | | | | | | | | | | | | | | | | |
| | 44.85 | | | | 4.22 | | | | 1,798,968 | | | | 0.89 | | | | 0.44 | (f) | | | 1.15 | | | | 18 | |
| | 45.15 | | | | 28.45 | | | | 1,773,321 | | | | 0.89 | | | | 0.27 | | | | 1.18 | | | | 47 | |
| | 38.22 | | | | 24.64 | | | | 932,920 | | | | 0.89 | | | | 0.57 | (h) | | | 1.23 | | | | 67 | |
| | 31.05 | | | | (0.42 | ) | | | 813,125 | | | | 0.89 | | | | 0.64 | (i) | | | 1.30 | | | | 55 | |
| | 31.36 | | | | 37.09 | | | | 568,854 | | | | 0.89 | | | | 0.50 | | | | 1.27 | | | | 88 | |
| | 22.97 | | | | 21.72 | | | | 463,478 | | | | 0.89 | | | | 0.55 | | | | 1.17 | | | | 56 | |
SEE NOTES TO FINANCIAL STATEMENTS.
| | | | | | | | |
| | | |
| DECEMBER 31, 2014 | | J.P. MORGAN MID CAP/MULTI-CAP FUNDS | | | | | 59 | |
FINANCIAL HIGHLIGHTS
FOR THE PERIODS INDICATED (continued)
| | | | | | | | | | | | | | | | | | | | | | | | | | | | |
| | | Per share operating performance | |
| | | | | | Investment operations | | | Distributions | |
| | | Net asset
value,
beginning
of period | | | Net
investment
income
(loss) | | | Net realized
and unrealized
gains
(losses) on
investments | | | Total from
investment
operations | | | Net
realized
gain | | | Net asset
value, end
of period | | | Total return
(excludes
sales
charge) (b)(c) | |
Mid Cap Growth Fund | | | | | | | | | | | | | | | | | | | | | | | | | | | | |
Class A | | | | | | | | | | | | | | | | | | | | | | | | | | | | |
Six Months Ended December 31, 2014 (Unaudited) | | $ | 27.49 | | | $ | (0.09 | )(f) | | $ | 0.53 | | | $ | 0.44 | | | $ | (2.79 | ) | | $ | 25.14 | | | | 1.95 | % |
Year Ended June 30, 2014 | | | 22.99 | | | | (0.13 | )(f)(g) | | | 7.42 | | | | 7.29 | | | | (2.79 | ) | | | 27.49 | | | | 33.44 | |
Year Ended June 30, 2013 | | | 19.52 | | | | (0.04 | )(f)(h) | | | 4.50 | | | | 4.46 | | | | (0.99 | ) | | | 22.99 | | | | 23.70 | |
Year Ended June 30, 2012 | | | 23.30 | | | | (0.05 | )(f)(i) | | | (1.72 | ) | | | (1.77 | ) | | | (2.01 | ) | | | 19.52 | | | | (6.61 | ) |
Year Ended June 30, 2011 | | | 16.35 | | | | (0.09 | )(f) | | | 7.04 | | | | 6.95 | | | | — | | | | 23.30 | | | | 42.51 | |
Year Ended June 30, 2010 | | | 13.68 | | | | (0.09 | )(f) | | | 2.76 | | | | 2.67 | | | | — | | | | 16.35 | | | | 19.52 | |
| | | | | | | |
Class B | | | | | | | | | | | | | | | | | | | | | | | | | | | | |
Six Months Ended December 31, 2014 (Unaudited) | | | 19.40 | | | | (0.11 | )(f) | | | 0.35 | | | | 0.24 | | | | (2.79 | ) | | | 16.85 | | | | 1.73 | |
Year Ended June 30, 2014 | | | 17.00 | | | | (0.18 | )(f)(g) | | | 5.37 | | | | 5.19 | | | | (2.79 | ) | | | 19.40 | | | | 32.81 | |
Year Ended June 30, 2013 | | | 14.76 | | | | (0.11 | )(f)(h) | | | 3.34 | | | | 3.23 | | | | (0.99 | ) | | | 17.00 | | | | 22.99 | |
Year Ended June 30, 2012 | | | 18.29 | | | | (0.12 | )(f)(i) | | | (1.40 | ) | | | (1.52 | ) | | | (2.01 | ) | | | 14.76 | | | | (7.08 | ) |
Year Ended June 30, 2011 | | | 12.90 | | | | (0.16 | )(f) | | | 5.55 | | | | 5.39 | | | | — | | | | 18.29 | | | | 41.78 | |
Year Ended June 30, 2010 | | | 10.85 | | | | (0.14 | )(f) | | | 2.19 | | | | 2.05 | | | | — | | | | 12.90 | | | | 18.89 | |
| | | | | | | |
Class C | | | | | | | | | | | | | | | | | | | | | | | | | | | | |
Six Months Ended December 31, 2014 (Unaudited) | | | 23.35 | | | | (0.14 | )(f) | | | 0.44 | | | | 0.30 | | | | (2.79 | ) | | | 20.86 | | | | 1.69 | |
Year Ended June 30, 2014 | | | 19.97 | | | | (0.22 | )(f)(g) | | | 6.39 | | | | 6.17 | | | | (2.79 | ) | | | 23.35 | | | | 32.85 | |
Year Ended June 30, 2013 | | | 17.17 | | | | (0.12 | )(f)(h) | | | 3.91 | | | | 3.79 | | | | (0.99 | ) | | | 19.97 | | | | 23.03 | |
Year Ended June 30, 2012 | | | 20.88 | | | | (0.13 | )(f)(i) | | | (1.57 | ) | | | (1.70 | ) | | | (2.01 | ) | | | 17.17 | | | | (7.06 | ) |
Year Ended June 30, 2011 | | | 14.73 | | | | (0.18 | )(f) | | | 6.33 | | | | 6.15 | | | | — | | | | 20.88 | | | | 41.75 | |
Year Ended June 30, 2010 | | | 12.39 | | | | (0.16 | )(f) | | | 2.50 | | | | 2.34 | | | | — | | | | 14.73 | | | | 18.89 | |
| | | | | | | |
Class R2 | | | | | | | | | | | | | | | | | | | | | | | | | | | | |
Six Months Ended December 31, 2014 (Unaudited) | | | 29.54 | | | | (0.13 | )(f) | | | 0.59 | | | | 0.46 | | | | (2.79 | ) | | | 27.21 | | | | 1.88 | |
Year Ended June 30, 2014 | | | 24.56 | | | | (0.20 | )(f)(g) | | | 7.97 | | | | 7.77 | | | | (2.79 | ) | | | 29.54 | | | | 33.25 | |
Year Ended June 30, 2013 | | | 20.83 | | | | (0.07 | )(f)(h) | | | 4.79 | | | | 4.72 | | | | (0.99 | ) | | | 24.56 | | | | 23.46 | |
Year Ended June 30, 2012 | | | 24.73 | | | | (0.07 | )(f)(i) | | | (1.82 | ) | | | (1.89 | ) | | | (2.01 | ) | | | 20.83 | | | | (6.72 | ) |
Year Ended June 30, 2011 | | | 17.38 | | | | (0.13 | )(f) | | | 7.48 | | | | 7.35 | | | | — | | | | 24.73 | | | | 42.29 | |
Year Ended June 30, 2010 | | | 14.56 | | | | (0.12 | )(f) | | | 2.94 | | | | 2.82 | | | | — | | | | 17.38 | | | | 19.37 | |
| (a) | Annualized for periods less than one year, unless otherwise noted. |
| (b) | Not annualized for periods less than one year. |
| (c) | Includes adjustments in accordance with accounting principles generally accepted in the United States of America and as such, the net asset values for financial reporting purposes and the returns based upon those net asset values may differ from the net asset values and returns for shareholder transactions. |
| (d) | Includes earnings credits and interest expense, if applicable, each of which is less than 0.01% unless otherwise noted. |
| (e) | Portfolio turnover is calculated by dividing the lesser of total purchases or sales of portfolio securities for the reporting period by the monthly average value of portfolio securities owned during the reporting period. Excluded from both the numerator and denominator are amounts relating to derivatives and securities whose maturities or expiration dates at the time of acquisition were one year or less. |
| (f) | Calculated based upon average shares outstanding. |
| (g) | Reflects special dividends paid out during the period by several of the Fund’s holdings. Had the Fund not received the special dividends, the net investment income (loss) per share would have been $(0.14), $(0.19), $(0.23), $(0.20), $(0.02), $(0.01) and $(0.06) for Class A, Class B, Class C, Class R2, Class R5, Class R6 and Select Class Shares, respectively, and the net investment income (loss) ratio would have been (0.53)%, (1.00)%, (1.03)%, (0.73)%, (0.08)%, (0.03)% and (0.22)% for Class A, Class B, Class C, Class R2, Class R5, Class R6 and Select Class Shares, respectively. |
| (h) | Reflects special dividends paid out during the period by several of the Fund’s holdings. Had the Fund not received the special dividends, the net investment income (loss) per share would have been $(0.09), $(0.15), $(0.17), $(0.13), $0.01, $0.02 and $(0.02) for Class A, Class B, Class C, Class R2, Class R5, Class R6 and Select Class Shares, respectively, and the net investment income (loss) ratio would have been (0.42)%, (0.94)%, (0.92)%, (0.57)%, 0.04%, 0.09% and (0.10)% for Class A, Class B, Class C, Class R2, Class R5, Class R6 and Select Class Shares, respectively. |
| (i) | Reflects a special dividend paid out during the period by one of the Fund’s holdings. Had the Fund not received the special dividend, the net investment income (loss) per share would have been $(0.09), $(0.15), $(0.17), $(0.12), less than $0.01, $0.03 and $(0.03) for Class A, Class B, Class C, Class R2, Class R5, Class R6 and Select Class Shares, respectively, and the net investment income (loss) ratio would have been (0.46)%, (0.99)%, (0.97)%, (0.57)%, (0.03)%, 0.24% and (0.14)% for Class A, Class B, Class C, Class R2, Class R5, Class R6 and Select Class Shares, respectively. |
| (j) | Commencement of offering of class of shares. |
SEE NOTES TO FINANCIAL STATEMENTS.
| | | | | | |
| | | |
| 60 | | | | J.P. MORGAN MID CAP/MULTI-CAP FUNDS | | DECEMBER 31, 2014 |
| | | | | | | | | | | | | | | | | | |
| | | Ratios/Supplemental data | |
| | | | Ratios to average net assets (a) | | | | |
Net assets,
end of
period
(000’s) | | | Net
expenses (d) | | | Net
investment income
(loss) | | | Expenses without
waivers,
reimbursements and
earnings credits | | | Portfolio
turnover
rate (b)(e) | |
| | | | | | | | | | | | | | | | | | |
| | | | | | | | | | | | | | | | | | |
| $ | 844,077 | | | | 1.24 | % | | | (0.69 | )% | | | 1.36 | % | | | 26 | % |
| | 765,310 | | | | 1.24 | | | | (0.51 | )(g) | | | 1.37 | | | | 69 | |
| | 586,787 | | | | 1.23 | | | | (0.17 | )(h) | | | 1.45 | | | | 70 | |
| | 538,323 | | | | 1.24 | | | | (0.23 | )(i) | | | 1.38 | | | | 70 | |
| | 696,334 | | | | 1.24 | | | | (0.44 | ) | | | 1.36 | | | | 79 | |
| | 560,054 | | | | 1.24 | | | | (0.53 | ) | | | 1.42 | | | | 82 | |
| | | | |
| | | | | | | | | | | | | | | | | | |
| | 4,247 | | | | 1.74 | | | | (1.19 | ) | | | 1.88 | | | | 26 | |
| | 5,243 | | | | 1.72 | | | | (0.98 | )(g) | | | 1.87 | | | | 69 | |
| | 6,923 | | | | 1.73 | | | | (0.69 | )(h) | | | 1.94 | | | | 70 | |
| | 9,948 | | | | 1.75 | | | | (0.77 | )(i) | | | 1.88 | | | | 70 | |
| | 18,648 | | | | 1.77 | | | | (0.97 | ) | | | 1.86 | | | | 79 | |
| | 20,893 | | | | 1.77 | | | | (1.07 | ) | | | 1.92 | | | | 82 | |
| | | | |
| | | | | | | | | | | | | | | | | | |
| | 53,753 | | | | 1.74 | | | | (1.19 | ) | | | 1.87 | | | | 26 | |
| | 41,047 | | | | 1.73 | | | | (1.01 | )(g) | | | 1.86 | | | | 69 | |
| | 23,745 | | | | 1.73 | | | | (0.67 | )(h) | | | 1.95 | | | | 70 | |
| | 22,190 | | | | 1.75 | | | | (0.75 | )(i) | | | 1.88 | | | | 70 | |
| | 29,187 | | | | 1.77 | | | | (0.97 | ) | | | 1.86 | | | | 79 | |
| | 23,389 | | | | 1.77 | | | | (1.06 | ) | | | 1.92 | | | | 82 | |
| | | | |
| | | | | | | | | | | | | | | | | | |
| | 4,059 | | | | 1.40 | | | | (0.87 | ) | | | 1.64 | | | | 26 | |
| | 1,852 | | | | 1.40 | | | | (0.71 | )(g) | | | 1.59 | | | | 69 | |
| | 320 | | | | 1.39 | | | | (0.32 | )(h) | | | 1.71 | | | | 70 | |
| | 230 | | | | 1.40 | | | | (0.35 | )(i) | | | 1.63 | | | | 70 | |
| | 121 | | | | 1.40 | | | | (0.59 | ) | | | 1.60 | | | | 79 | |
| | 63 | | | | 1.40 | | | | (0.69 | ) | | | 1.67 | | | | 82 | |
SEE NOTES TO FINANCIAL STATEMENTS.
| | | | | | | | |
| | | |
| DECEMBER 31, 2014 | | J.P. MORGAN MID CAP/MULTI-CAP FUNDS | | | | | 61 | |
FINANCIAL HIGHLIGHTS
FOR THE PERIODS INDICATED (continued)
| | | | | | | | | | | | | | | | | | | | | | | | | | | | |
| | | Per share operating performance | |
| | | | | | Investment operations | | | Distributions | |
| | | Net asset
value,
beginning
of period | | | Net
investment
income
(loss) | | | Net realized
and unrealized
gains
(losses) on
investments | | | Total from
investment
operations | | | Net
realized
gain | | | Net asset
value, end
of period | | | Total return
(excludes
sales
charge) (b)(c) | |
Mid Cap Growth Fund (continued) | | | | | | | | | | | | | | | | | | | | | | | | | | | | |
Class R5 | | | | | | | | | | | | | | | | | | | | | | | | | | | | |
Six Months Ended December 31, 2014 (Unaudited) | | $ | 30.52 | | | $ | (0.04 | )(f) | | $ | 0.61 | | | $ | 0.57 | | | $ | (2.79 | ) | | $ | 28.30 | | | | 2.18 | % |
Year Ended June 30, 2014 | | | 25.15 | | | | (0.02 | )(f)(g) | | | 8.18 | | | | 8.16 | | | | (2.79 | ) | | | 30.52 | | | | 34.06 | |
Year Ended June 30, 2013 | | | 21.18 | | | | 0.06 | (f)(h) | | | 4.90 | | | | 4.96 | | | | (0.99 | ) | | | 25.15 | | | | 24.22 | |
November 1, 2011(j) through June 30, 2012 | | | 21.75 | | | | 0.04 | (f)(i) | | | 1.40 | | | | 1.44 | | | | (2.01 | ) | | | 21.18 | | | | 7.71 | |
| | | | | | | |
Class R6 | | | | | | | | | | | | | | | | | | | | | | | | | | | | |
Six Months Ended December 31, 2014 (Unaudited) | | | 30.57 | | | | (0.03 | )(f) | | | 0.61 | | | | 0.58 | | | | (2.79 | ) | | | 28.36 | | | | 2.21 | |
Year Ended June 30, 2014 | | | 25.17 | | | | — | (f)(g)(k) | | | 8.19 | | | | 8.19 | | | | (2.79 | ) | | | 30.57 | | | | 34.16 | |
Year Ended June 30, 2013 | | | 21.19 | | | | 0.08 | (f)(h) | | | 4.89 | | | | 4.97 | | | | (0.99 | ) | | | 25.17 | | | | 24.26 | |
November 1, 2011(j) through June 30, 2012 | | | 21.75 | | | | 0.08 | (f)(i) | | | 1.37 | | | | 1.45 | | | | (2.01 | ) | | | 21.19 | | | | 7.76 | |
| | | | | | | |
Select Class | | | | | | | | | | | | | | | | | | | | | | | | | | | | |
Six Months Ended December 31, 2014 (Unaudited) | | | 30.39 | | | | (0.06 | )(f) | | | 0.60 | | | | 0.54 | | | | (2.79 | ) | | | 28.14 | | | | 2.09 | |
Year Ended June 30, 2014 | | | 25.08 | | | | (0.06 | )(f)(g) | | | 8.16 | | | | 8.10 | | | | (2.79 | ) | | | 30.39 | | | | 33.91 | |
Year Ended June 30, 2013 | | | 21.15 | | | | 0.03 | (f)(h) | | | 4.89 | | | | 4.92 | | | | (0.99 | ) | | | 25.08 | | | | 24.06 | |
Year Ended June 30, 2012 | | | 24.97 | | | | 0.02 | (f)(i) | | | (1.83 | ) | | | (1.81 | ) | | | (2.01 | ) | | | 21.15 | | | | (6.31 | ) |
Year Ended June 30, 2011 | | | 17.47 | | | | (0.03 | )(f) | | | 7.53 | | | | 7.50 | | | | — | | | | 24.97 | | | | 42.93 | |
Year Ended June 30, 2010 | | | 14.57 | | | | (0.04 | )(f) | | | 2.94 | | | | 2.90 | | | | — | | | | 17.47 | | | | 19.90 | |
| (a) | Annualized for periods less than one year, unless otherwise noted. |
| (b) | Not annualized for periods less than one year. |
| (c) | Includes adjustments in accordance with accounting principles generally accepted in the United States of America and as such, the net asset values for financial reporting purposes and the returns based upon those net asset values may differ from the net asset values and returns for shareholder transactions. |
| (d) | Includes earnings credits and interest expense, if applicable, each of which is less than 0.01% unless otherwise noted. |
| (e) | Portfolio turnover is calculated by dividing the lesser of total purchases or sales of portfolio securities for the reporting period by the monthly average value of portfolio securities owned during the reporting period. Excluded from both the numerator and denominator are amounts relating to derivatives and securities whose maturities or expiration dates at the time of acquisition were one year or less. |
| (f) | Calculated based upon average shares outstanding. |
| (g) | Reflects special dividends paid out during the period by several of the Fund’s holdings. Had the Fund not received the special dividends, the net investment income (loss) per share would have been $(0.14), $(0.19), $(0.23), $(0.20), $(0.02), $(0.01) and $(0.06) for Class A, Class B, Class C, Class R2, Class R5, Class R6 and Select Class Shares, respectively, and the net investment income (loss) ratio would have been (0.53)%, (1.00)%, (1.03)%, (0.73)%, (0.08)%, (0.03)% and (0.22)% for Class A, Class B, Class C, Class R2, Class R5, Class R6 and Select Class Shares, respectively. |
| (h) | Reflects special dividends paid out during the period by several of the Fund’s holdings. Had the Fund not received the special dividends, the net investment income (loss) per share would have been $(0.09), $(0.15), $(0.17), $(0.13), $0.01, $0.02 and $(0.02) for Class A, Class B, Class C, Class R2, Class R5, Class R6 and Select Class Shares, respectively, and the net investment income (loss) ratio would have been (0.42)%, (0.94)%, (0.92)%, (0.57)%, 0.04%, 0.09% and (0.10)% for Class A, Class B, Class C, Class R2, Class R5, Class R6 and Select Class Shares, respectively. |
| (i) | Reflects a special dividend paid out during the period by one of the Fund’s holdings. Had the Fund not received the special dividend, the net investment income (loss) per share would have been $(0.09), $(0.15), $(0.17), $(0.12), less than $0.01, $0.03 and $(0.03) for Class A, Class B, Class C, Class R2, Class R5, Class R6 and Select Class Shares, respectively, and the net investment income (loss) ratio would have been (0.46)%, (0.99)%, (0.97)%, (0.57)%, (0.03)%, 0.24% and (0.14)% for Class A, Class B, Class C, Class R2, Class R5, Class R6 and Select Class Shares, respectively. |
| (j) | Commencement of offering of class of shares. |
| (k) | Amount rounds to less than $0.01. |
SEE NOTES TO FINANCIAL STATEMENTS.
| | | | | | |
| | | |
| 62 | | | | J.P. MORGAN MID CAP/MULTI-CAP FUNDS | | DECEMBER 31, 2014 |
| | | | | | | | | | | | | | | | | | |
| | | Ratios/Supplemental data | |
| | | | Ratios to average net assets (a) | | | | |
Net assets,
end of
period
(000’s) | | | Net
expenses (d) | | | Net
investment income
(loss) | | | Expenses without
waivers,
reimbursements and
earnings credits | | | Portfolio
turnover
rate (b)(e) | |
| | | | | | | | | | | | | | | | | | |
| | | | | | | | | | | | | | | | | | |
| $ | 44,142 | | | | 0.79 | % | | | (0.25 | )% | | | 0.92 | % | | | 26 | % |
| | 27,454 | | | | 0.79 | | | | (0.06 | )(g) | | | 0.92 | | | | 69 | |
| | 17,848 | | | | 0.79 | | | | 0.28 | (h) | | | 1.00 | | | | 70 | |
| | 14,837 | | | | 0.78 | | | | 0.31 | (i) | | | 0.92 | | | | 70 | |
| | | | |
| | | | | | | | | | | | | | | | | | |
| | 92,712 | | | | 0.74 | | | | (0.19 | ) | | | 0.84 | | | | 26 | |
| | 86,150 | | | | 0.74 | | | | (0.01 | )(g) | | | 0.86 | | | | 69 | |
| | 47,434 | | | | 0.74 | | | | 0.34 | (h) | | | 0.98 | | | | 70 | |
| | 13,982 | | | | 0.73 | | | | 0.58 | (i) | | | 0.87 | | | | 70 | |
| | | | |
| | | | | | | | | | | | | | | | | | |
| | 1,326,856 | | | | 0.93 | | | | (0.38 | ) | | | 1.13 | | | | 26 | |
| | 1,254,748 | | | | 0.93 | | | | (0.20 | )(g) | | | 1.12 | | | | 69 | |
| | 894,740 | | | | 0.93 | | | | 0.14 | (h) | | | 1.20 | | | | 70 | |
| | 827,306 | | | | 0.93 | | | | 0.09 | (i) | | | 1.13 | | | | 70 | |
| | 1,031,463 | | | | 0.93 | | | | (0.13 | ) | | | 1.10 | | | | 79 | |
| | 685,843 | | | | 0.93 | | | | (0.22 | ) | | | 1.17 | | | | 82 | |
SEE NOTES TO FINANCIAL STATEMENTS.
| | | | | | | | |
| | | |
| DECEMBER 31, 2014 | | J.P. MORGAN MID CAP/MULTI-CAP FUNDS | | | | | 63 | |
FINANCIAL HIGHLIGHTS
FOR THE PERIODS INDICATED (continued)
| | | | | | | | | | | | | | | | | | | | | | | | | | | | |
| | | Per share operating performance | |
| | | | | | Investment operations | | | Distributions | |
| | | Net asset
value,
beginning
of period | | | Net
investment
income
(loss) | | | Net realized
and unrealized
gains
(losses) on
investments | | | Total from
investment
operations | | | Net
investment
income | | | Net
realized
gain | | | Total
distributions | |
Mid Cap Value Fund | | | | | | | | | | | | | | | | | | | | | | | | | | | | |
Class A | | | | | | | | | | | | | | | | | | | | | | | | | | | | |
Six Months Ended December 31, 2014 (Unaudited) | | $ | 37.25 | | | $ | 0.16 | (f)(g) | | $ | 2.05 | | | $ | 2.21 | | | $ | (0.20 | ) | | $ | (2.79 | ) | | $ | (2.99 | ) |
Year Ended June 30, 2014 | | | 31.68 | | | | 0.15 | (f)(h) | | | 7.02 | | | | 7.17 | | | | (0.15 | ) | | | (1.45 | ) | | | (1.60 | ) |
Year Ended June 30, 2013 | | | 25.80 | | | | 0.19 | (f)(i) | | | 6.20 | | | | 6.39 | | | | (0.29 | ) | | | (0.22 | ) | | | (0.51 | ) |
Year Ended June 30, 2012 | | | 24.76 | | | | 0.20 | (f) | | | 1.00 | | | | 1.20 | | | | (0.16 | ) | | | — | | | | (0.16 | ) |
Year Ended June 30, 2011 | | | 18.91 | | | | 0.18 | (f) | | | 5.85 | | | | 6.03 | | | | (0.18 | ) | | | — | | | | (0.18 | ) |
Year Ended June 30, 2010 | | | 15.24 | | | | 0.19 | (f) | | | 3.48 | | | | 3.67 | | | | — | | | | — | | | | — | |
| | | | | | | |
Class B | | | | | | | | | | | | | | | | | | | | | | | | | | | | |
Six Months Ended December 31, 2014 (Unaudited) | | | 36.46 | | | | 0.06 | (f)(g) | | | 2.00 | | | | 2.06 | | | | — | | | | (2.79 | ) | | | (2.79 | ) |
Year Ended June 30, 2014 | | | 31.05 | | | | (0.03 | )(f)(h) | | | 6.89 | | | | 6.86 | | | | — | | | | (1.45 | ) | | | (1.45 | ) |
Year Ended June 30, 2013 | | | 25.16 | | | | 0.03 | (f)(i) | | | 6.08 | | | | 6.11 | | | | — | | | | (0.22 | ) | | | (0.22 | ) |
Year Ended June 30, 2012 | | | 24.10 | | | | 0.07 | (f) | | | 0.99 | | | | 1.06 | | | | — | | | | — | | | | — | |
Year Ended June 30, 2011 | | | 18.38 | | | | 0.07 | (f) | | | 5.69 | | | | 5.76 | | | | (0.04 | ) | | | — | | | | (0.04 | ) |
Year Ended June 30, 2010 | | | 14.89 | | | | 0.10 | (f) | | | 3.39 | | | | 3.49 | | | | — | | | | — | | | | — | |
| | | | | | | |
Class C | | | | | | | | | | | | | | | | | | | | | | | | | | | | |
Six Months Ended December 31, 2014 (Unaudited) | | | 36.19 | | | | 0.07 | (f)(g) | | | 1.98 | | | | 2.05 | | | | (0.06 | ) | | | (2.79 | ) | | | (2.85 | ) |
Year Ended June 30, 2014 | | | 30.84 | | | | (0.03 | )(f)(h) | | | 6.83 | | | | 6.80 | | | | — | (j) | | | (1.45 | ) | | | (1.45 | ) |
Year Ended June 30, 2013 | | | 25.14 | | | | 0.05 | (f)(i) | | | 6.03 | | | | 6.08 | | | | (0.16 | ) | | | (0.22 | ) | | | (0.38 | ) |
Year Ended June 30, 2012 | | | 24.13 | | | | 0.07 | (f) | | | 0.98 | | | | 1.05 | | | | (0.04 | ) | | | — | | | | (0.04 | ) |
Year Ended June 30, 2011 | | | 18.44 | | | | 0.07 | (f) | | | 5.69 | | | | 5.76 | | | | (0.07 | ) | | | — | | | | (0.07 | ) |
Year Ended June 30, 2010 | | | 14.94 | | | | 0.10 | (f) | | | 3.40 | | | | 3.50 | | | | — | | | | — | | | | — | |
| | | | | | | |
Class R2 | | | | | | | | | | | | | | | | | | | | | | | | | | | | |
Six Months Ended December 31, 2014 (Unaudited) | | | 36.14 | | | | 0.12 | (f)(g) | | | 1.97 | | | | 2.09 | | | | (0.15 | ) | | | (2.79 | ) | | | (2.94 | ) |
Year Ended June 30, 2014 | | | 30.81 | | | | 0.06 | (f)(h) | | | 6.82 | | | | 6.88 | | | | (0.10 | ) | | | (1.45 | ) | | | (1.55 | ) |
Year Ended June 30, 2013 | | | 25.18 | | | | 0.12 | (f)(i) | | | 6.03 | | | | 6.15 | | | | (0.30 | ) | | | (0.22 | ) | | | (0.52 | ) |
Year Ended June 30, 2012 | | | 24.27 | | | | 0.14 | (f) | | | 0.97 | | | | 1.11 | | | | (0.20 | ) | | | — | | | | (0.20 | ) |
Year Ended June 30, 2011 | | | 18.63 | | | | 0.12 | (f) | | | 5.76 | | | | 5.88 | | | | (0.24 | ) | | | — | | | | (0.24 | ) |
Year Ended June 30, 2010 | | | 15.06 | | | | 0.15 | (f) | | | 3.42 | | | | 3.57 | | | | — | | | | — | | | | — | |
| (a) | Annualized for periods less than one year, unless otherwise noted. |
| (b) | Not annualized for periods less than one year. |
| (c) | Includes adjustments in accordance with accounting principles generally accepted in the United States of America and as such, the net asset values for financial reporting purposes and the returns based upon those net asset values may differ from the net asset values and returns for shareholder transactions. |
| (d) | Includes earnings credits and interest expense, if applicable, each of which is less than 0.01% unless otherwise noted. |
| (e) | Portfolio turnover is calculated by dividing the lesser of total purchases or sales of portfolio securities for the reporting period by the monthly average value of portfolio securities owned during the reporting period. Excluded from both the numerator and denominator are amounts relating to derivatives and securities whose maturities or expiration dates at the time of acquisition were one year or less. |
| (f) | Calculated based upon average shares outstanding. |
| (g) | Reflects special dividends paid out during the period by several of the Fund’s holdings. Had the Fund not received the special dividends, the net investment income (loss) per share would have been $0.07, $(0.03), $(0.02), $0.03, $0.18 and $0.10 for Class A, Class B, Class C, Class R2, Institutional Class and Select Class Shares, respectively, and the net investment income (loss) ratio would have been 0.34%, (0.14)%, (0.12)%, 0.15%, 0.94% and 0.53% for Class A, Class B, Class C, Class R2, Institutional Class and Select Class Shares, respectively. |
| (h) | Reflects special dividends paid out during the period by several of the Fund’s holdings. Had the Fund not received the special dividends, the net investment income (loss) per share would have been $0.14, $(0.03), $(0.03), $0.05, $0.32 and $0.23 for Class A, Class B, Class C, Class R2, Institutional Class and Select Class Shares, respectively, and the net investment income (loss) ratio would have been 0.41%, (0.10)%, (0.10)%, 0.16%, 0.90% and 0.66% for Class A, Class B, Class C, Class R2, Institutional Class and Select Class Shares, respectively. |
| (i) | Reflects special dividends paid out during the period by several of the Fund’s holdings. Had the Fund not received the special dividends, the net investment income (loss) per share would have been $0.16, $0.00, $0.01, $0.09, $0.31 and $0.23 for Class A, Class B, Class C, Class R2, Institutional Class and Select Class Shares, respectively, and the net investment income (loss) ratio would have been 0.55%, 0.00%, 0.04%, 0.31%, 1.04% and 0.80% for Class A, Class B, Class C, Class R2, Institutional Class and Select Class Shares, respectively. |
| (j) | Amount rounds to less than $0.01. |
SEE NOTES TO FINANCIAL STATEMENTS.
| | | | | | |
| | | |
| 64 | | | | J.P. MORGAN MID CAP/MULTI-CAP FUNDS | | DECEMBER 31, 2014 |
| | | | | | | | | | | | | | | | | | | | | | | | | | |
| | | Ratios/Supplemental data | |
| | | | | | | | | | Ratios to average net assets (a) | | | | |
Net asset
value,
end of
period | | | Total return
(excludes
sales charge) (b)(c) | | | Net assets,
end of
period
(000’s) | | | Net
expenses (d) | | | Net
investment income
(loss) | | | Expenses
without waivers,
reimbursements
and earnings
credits | | | Portfolio
turnover
rate (b)(e) | |
| | | | | | | | | | | | | | | | | | | | | | | | | | |
| | | | | | | | | | | | | | | | | | | | | | | | | | |
| $ | 36.47 | | | | 6.20 | % | | $ | 2,700,548 | | | | 1.23 | % | | | 0.84 | %(g) | | | 1.39 | % | | | 10 | % |
| | 37.25 | | | | 23.25 | | | | 3,404,974 | | | | 1.23 | | | | 0.42 | (h) | | | 1.37 | | | | 25 | |
| | 31.68 | | | | 25.06 | | | | 3,157,503 | | | | 1.23 | | | | 0.67 | (i) | | | 1.38 | | | | 23 | |
| | 25.80 | | | | 4.92 | | | | 1,986,930 | | | | 1.24 | | | | 0.83 | | | | 1.41 | | | | 30 | |
| | 24.76 | | | | 31.96 | | | | 1,979,270 | | | | 1.23 | | | | 0.81 | | | | 1.39 | | | | 41 | |
| | 18.91 | | | | 24.08 | | | | 1,705,572 | | | | 1.23 | | | | 1.04 | | | | 1.40 | | | | 34 | |
| | | | | | |
| | | | | | | | | | | | | | | | | | | | | | | | | | |
| | 35.73 | | | | 5.91 | | | | 8,990 | | | | 1.74 | | | | 0.35 | (g) | | | 1.87 | | | | 10 | |
| | 36.46 | | | | 22.67 | | | | 10,619 | | | | 1.72 | | | | (0.08 | )(h) | | | 1.87 | | | | 25 | |
| | 31.05 | | | | 24.42 | | | | 15,382 | | | | 1.74 | | | | 0.13 | (i) | | | 1.88 | | | | 23 | |
| | 25.16 | | | | 4.40 | | | | 57,100 | | | | 1.75 | | | | 0.30 | | | | 1.91 | | | | 30 | |
| | 24.10 | | | | 31.33 | | | | 90,427 | | | | 1.74 | | | | 0.30 | | | | 1.89 | | | | 41 | |
| | 18.38 | | | | 23.44 | | | | 96,966 | | | | 1.74 | | | | 0.53 | | | | 1.90 | | | | 34 | |
| | | | | | |
| | | | | | | | | | | | | | | | | | | | | | | | | | |
| | 35.39 | | | | 5.92 | | | | 613,455 | | | | 1.74 | | | | 0.38 | (g) | | | 1.90 | | | | 10 | |
| | 36.19 | | | | 22.63 | | | | 608,283 | | | | 1.74 | | | | (0.09 | )(h) | | | 1.87 | | �� | | 25 | |
| | 30.84 | | | | 24.43 | | | | 534,813 | | | | 1.74 | | | | 0.16 | (i) | | | 1.88 | | | | 23 | |
| | 25.14 | | | | 4.38 | | | | 370,781 | | | | 1.75 | | | | 0.32 | | | | 1.91 | | | | 30 | |
| | 24.13 | | | | 31.29 | | | | 373,415 | | | | 1.74 | | | | 0.30 | | | | 1.89 | | | | 41 | |
| | 18.44 | | | | 23.43 | | | | 309,513 | | | | 1.74 | | | | 0.53 | | | | 1.90 | | | | 34 | |
| | | | | | |
| | | | | | | | | | | | | | | | | | | | | | | | | | |
| | 35.29 | | | | 6.06 | | | | 75,043 | | | | 1.49 | | | | 0.65 | (g) | | | 1.66 | | | | 10 | |
| | 36.14 | | | | 22.94 | | | | 71,958 | | | | 1.49 | | | | 0.17 | (h) | | | 1.62 | | | | 25 | |
| | 30.81 | | | | 24.71 | | | | 57,003 | | | | 1.49 | | | | 0.43 | (i) | | | 1.63 | | | | 23 | |
| | 25.18 | | | | 4.65 | | | | 14,824 | | | | 1.49 | | | | 0.59 | | | | 1.66 | | | | 30 | |
| | 24.27 | | | | 31.66 | | | | 6,500 | | | | 1.49 | | | | 0.50 | | | | 1.65 | | | | 41 | |
| | 18.63 | | | | 23.71 | | | | 1,441 | | | | 1.49 | | | | 0.77 | | | | 1.65 | | | | 34 | |
SEE NOTES TO FINANCIAL STATEMENTS.
| | | | | | | | |
| | | |
| DECEMBER 31, 2014 | | J.P. MORGAN MID CAP/MULTI-CAP FUNDS | | | | | 65 | |
FINANCIAL HIGHLIGHTS
FOR THE PERIODS INDICATED (continued)
| | | | | | | | | | | | | | | | | | | | | | | | | | | | |
| | | Per share operating performance | |
| | | | | | Investment operations | | | Distributions | |
| | | Net asset
value,
beginning
of period | | | Net
investment
income
(loss) | | | Net realized
and unrealized
gains
(losses) on
investments | | | Total from
investment
operations | | | Net
investment
income | | | Net
realized
gain | | | Total
distributions | |
Mid Cap Value Fund (continued) | | | | | | | | | | | | | | | | | | | | | | | | | | | | |
Institutional Class | | | | | | | | | | | | | | | | | | | | | | | | | | | | |
Six Months Ended December 31, 2014 (Unaudited) | | $ | 37.99 | | | $ | 0.28 | (f)(g) | | $ | 2.07 | | | $ | 2.35 | | | $ | (0.40 | ) | | $ | (2.79 | ) | | $ | (3.19 | ) |
Year Ended June 30, 2014 | | | 32.26 | | | | 0.32 | (f)(h) | | | 7.17 | | | | 7.49 | | | | (0.31 | ) | | | (1.45 | ) | | | (1.76 | ) |
Year Ended June 30, 2013 | | | 26.24 | | | | 0.34 | (f)(i) | | | 6.31 | | | | 6.65 | | | | (0.41 | ) | | | (0.22 | ) | | | (0.63 | ) |
Year Ended June 30, 2012 | | | 25.19 | | | | 0.32 | (f) | | | 1.01 | | | | 1.33 | | | | (0.28 | ) | | | — | | | | (0.28 | ) |
Year Ended June 30, 2011 | | | 19.22 | | | | 0.30 | (f) | | | 5.95 | | | | 6.25 | | | | (0.28 | ) | | | — | | | | (0.28 | ) |
Year Ended June 30, 2010 | | | 15.43 | | | | 0.29 | (f) | | | 3.52 | | | | 3.81 | | | | (0.02 | ) | | | — | | | | (0.02 | ) |
| | | | | | | |
Select Class | | | | | | | | | | | | | | | | | | | | | | | | | | | | |
Six Months Ended December 31, 2014 (Unaudited) | | | 37.61 | | | | 0.19 | (f)(g) | | | 2.08 | | | | 2.27 | | | | (0.29 | ) | | | (2.79 | ) | | | (3.08 | ) |
Year Ended June 30, 2014 | | | 31.95 | | | | 0.23 | (f)(h) | | | 7.10 | | | | 7.33 | | | | (0.22 | ) | | | (1.45 | ) | | | (1.67 | ) |
Year Ended June 30, 2013 | | | 26.01 | | | | 0.27 | (f)(i) | | | 6.24 | | | | 6.51 | | | | (0.35 | ) | | | (0.22 | ) | | | (0.57 | ) |
Year Ended June 30, 2012 | | | 24.97 | | | | 0.26 | (f) | | | 1.01 | | | | 1.27 | | | | (0.23 | ) | | | — | | | | (0.23 | ) |
Year Ended June 30, 2011 | | | 19.07 | | | | 0.24 | (f) | | | 5.90 | | | | 6.14 | | | | (0.24 | ) | | | — | | | | (0.24 | ) |
Year Ended June 30, 2010 | | | 15.34 | | | | 0.24 | (f) | | | 3.49 | | | | 3.73 | | | | — | (j) | | | — | | | | — | (j) |
| (a) | Annualized for periods less than one year, unless otherwise noted. |
| (b) | Not annualized for periods less than one year. |
| (c) | Includes adjustments in accordance with accounting principles generally accepted in the United States of America and as such, the net asset values for financial reporting purposes and the returns based upon those net asset values may differ from the net asset values and returns for shareholder transactions. |
| (d) | Includes earnings credits and interest expense, if applicable, each of which is less than 0.01% unless otherwise noted. |
| (e) | Portfolio turnover is calculated by dividing the lesser of total purchases or sales of portfolio securities for the reporting period by the monthly average value of portfolio securities owned during the reporting period. Excluded from both the numerator and denominator are amounts relating to derivatives and securities whose maturities or expiration dates at the time of acquisition were one year or less. |
| (f) | Calculated based upon average shares outstanding. |
| (g) | Reflects special dividends paid out during the period by several of the Fund’s holdings. Had the Fund not received the special dividends, the net investment income (loss) per share would have been $0.07, $(0.03), $(0.02), $0.03, $0.18 and $0.10 for Class A, Class B, Class C, Class R2, Institutional Class and Select Class Shares, respectively, and the net investment income (loss) ratio would have been 0.34%, (0.14)%, (0.12)%, 0.15%, 0.94% and 0.53% for Class A, Class B, Class C, Class R2, Institutional Class and Select Class Shares, respectively. |
| (h) | Reflects special dividends paid out during the period by several of the Fund’s holdings. Had the Fund not received the special dividends, the net investment income (loss) per share would have been $0.14, $(0.03), $(0.03), $0.05, $0.32 and $0.23 for Class A, Class B, Class C, Class R2, Institutional Class and Select Class Shares, respectively, and the net investment income (loss) ratio would have been 0.41%, (0.10)%, (0.10)%, 0.16%, 0.90% and 0.66% for Class A, Class B, Class C, Class R2, Institutional Class and Select Class Shares, respectively. |
| (i) | Reflects special dividends paid out during the period by several of the Fund’s holdings. Had the Fund not received the special dividends, the net investment income (loss) per share would have been $0.16, $0.00, $0.01, $0.09, $0.31 and $0.23 for Class A, Class B, Class C, Class R2, Institutional Class and Select Class Shares, respectively, and the net investment income (loss) ratio would have been 0.55%, 0.00%, 0.04%, 0.31%, 1.04% and 0.80% for Class A, Class B, Class C, Class R2, Institutional Class and Select Class Shares, respectively. |
| (j) | Amount rounds to less than $0.01. |
SEE NOTES TO FINANCIAL STATEMENTS.
| | | | | | |
| | | |
| 66 | | | | J.P. MORGAN MID CAP/MULTI-CAP FUNDS | | DECEMBER 31, 2014 |
| | | | | | | | | | | | | | | | | | | | | | | | | | |
| | | Ratios/Supplemental data | |
| | | | | | | | | | Ratios to average net assets (a) | | | | |
Net asset
value,
end of
period | | | Total return
(excludes
sales charge) (b)(c) | | | Net assets,
end of period
(000’s) | | | Net
expenses (d) | | | Net
investment income
(loss) | | | Expenses
without waivers,
reimbursements
and earnings
credits | | | Portfolio
turnover
rate (b)(e) | |
| | | | | | |
| | | | | | | | | | | | | | | | | | | | | | | | | | |
| $ | 37.15 | | | | 6.45 | % | | $ | 10,164,312 | | | | 0.74 | % | | | 1.46 | %(g) | | | 0.95 | % | | | 10 | % |
| | 37.99 | | | | 23.88 | | | | 8,581,992 | | | | 0.74 | | | | 0.92 | (h) | | | 0.97 | | | | 25 | |
| | 32.26 | | | | 25.68 | | | | 6,627,529 | | | | 0.74 | | | | 1.16 | (i) | | | 0.98 | | | | 23 | |
| | 26.24 | | | | 5.43 | | | | 3,543,900 | | | | 0.74 | | | | 1.33 | | | | 1.01 | | | | 30 | |
| | 25.19 | | | | 32.66 | | | | 2,812,296 | | | | 0.74 | | | | 1.29 | | | | 0.99 | | | | 41 | |
| | 19.22 | | | | 24.68 | | | | 1,913,930 | | | | 0.74 | | | | 1.52 | | | | 1.00 | | | | 34 | |
| | | | | | |
| | | | | | | | | | | | | | | | | | | | | | | | | | |
| | 36.80 | | | | 6.30 | | | | 2,430,736 | | | | 0.98 | | | | 1.00 | (g) | | | 1.11 | | | | 10 | |
| | 37.61 | | | | 23.59 | | | | 2,967,759 | | | | 0.98 | | | | 0.67 | (h) | | | 1.12 | | | | 25 | |
| | 31.95 | | | | 25.35 | | | | 2,870,752 | | | | 0.98 | | | | 0.92 | (i) | | | 1.13 | | | | 23 | |
| | 26.01 | | | | 5.20 | | | | 1,836,012 | | | | 0.98 | | | | 1.09 | | | | 1.16 | | | | 30 | |
| | 24.97 | | | | 32.29 | | | | 1,513,926 | | | | 0.98 | | | | 1.05 | | | | 1.14 | | | | 41 | |
| | 19.07 | | | | 24.35 | | | | 1,061,308 | | | | 0.98 | | | | 1.29 | | | | 1.15 | | | | 34 | |
SEE NOTES TO FINANCIAL STATEMENTS.
| | | | | | | | |
| | | |
| DECEMBER 31, 2014 | | J.P. MORGAN MID CAP/MULTI-CAP FUNDS | | | | | 67 | |
FINANCIAL HIGHLIGHTS
FOR THE PERIODS INDICATED (continued)
| | | | | | | | | | | | | | | | | | | | | | | | |
| | | Per share operating performance | |
| | | | | | Investment operations | | | | | | | |
| | |
Net asset
value,
beginning
of period | | | Net
investment
income
(loss) | | | Net realized
and unrealized
gains
(losses) on
investments | | | Total from
investment
operations | | | Net asset
value,
end of
period | | | Total return
(excludes
sales charge) (b)(c) | |
Multi-Cap Market Neutral Fund | | | | | | | | | | | | | | | | | | | | | | | | |
Class A | | | | | | | | | | | | | | | | | | | | | | | | |
Six Months Ended December 31, 2014 (Unaudited) | | $ | 9.91 | | | $ | (0.07 | )(g) | | $ | 0.23 | | | $ | 0.16 | | | $ | 10.07 | | | | 1.61 | % |
Year Ended June 30, 2014 | | | 9.79 | | | | (0.13 | )(g) | | | 0.25 | | | | 0.12 | | | | 9.91 | | | | 1.23 | |
Year Ended June 30, 2013 | | | 9.69 | | | | (0.11 | )(g)(h) | | | 0.21 | | | | 0.10 | | | | 9.79 | | | | 1.03 | |
Year Ended June 30, 2012 | | | 9.81 | | | | (0.14 | )(g) | | | 0.02 | | | | (0.12 | ) | | | 9.69 | | | | (1.22 | ) |
Year Ended June 30, 2011 | | | 9.71 | | | | (0.16 | )(g) | | | 0.26 | | | | 0.10 | | | | 9.81 | | | | 1.03 | |
Year Ended June 30, 2010 | | | 10.21 | | | | (0.17 | )(g) | | | (0.33 | ) | | | (0.50 | ) | | | 9.71 | | | | (4.90 | ) |
| | | | | | |
Class B | | | | | | | | | | | | | | | | | | | | | | | | |
Six Months Ended December 31, 2014 (Unaudited) | | | 9.39 | | | | (0.09 | )(g) | | | 0.22 | | | | 0.13 | | | | 9.52 | | | | 1.38 | |
Year Ended June 30, 2014 | | | 9.31 | | | | (0.17 | )(g) | | | 0.25 | | | | 0.08 | | | | 9.39 | | | | 0.86 | |
Year Ended June 30, 2013 | | | 9.29 | | | | (0.17 | )(g)(h) | | | 0.19 | | | | 0.02 | | | | 9.31 | | | | 0.22 | |
Year Ended June 30, 2012 | | | 9.47 | | | | (0.20 | )(g) | | | 0.02 | | | | (0.18 | ) | | | 9.29 | | | | (1.90 | ) |
Year Ended June 30, 2011 | | | 9.44 | | | | (0.23 | )(g) | | | 0.26 | | | | 0.03 | | | | 9.47 | | | | 0.32 | |
Year Ended June 30, 2010 | | | 10.01 | | | | (0.23 | )(g) | | | (0.34 | ) | | | (0.57 | ) | | | 9.44 | | | | (5.69 | ) |
| | | | | | |
Class C | | | | | | | | | | | | | | | | | | | | | | | | |
Six Months Ended December 31, 2014 (Unaudited) | | | 9.40 | | | | (0.09 | )(g) | | | 0.22 | | | | 0.13 | | | | 9.53 | | | | 1.38 | |
Year Ended June 30, 2014 | | | 9.33 | | | | (0.17 | )(g) | | | 0.24 | | | | 0.07 | | | | 9.40 | | | | 0.75 | |
Year Ended June 30, 2013 | | | 9.30 | | | | (0.17 | )(g)(h) | | | 0.20 | | | | 0.03 | | | | 9.33 | | | | 0.32 | |
Year Ended June 30, 2012 | | | 9.48 | | | | (0.20 | )(g) | | | 0.02 | | | | (0.18 | ) | | | 9.30 | | | | (1.90 | ) |
Year Ended June 30, 2011 | | | 9.46 | | | | (0.23 | )(g) | | | 0.25 | | | | 0.02 | | | | 9.48 | | | | 0.21 | |
Year Ended June 30, 2010 | | | 10.02 | | | | (0.23 | )(g) | | | (0.33 | ) | | | (0.56 | ) | | | 9.46 | | | | (5.59 | ) |
| | | | | | |
Select Class | | | | | | | | | | | | | | | | | | | | | | | | |
Six Months Ended December 31, 2014 (Unaudited) | | | 10.09 | | | | (0.06 | )(g) | | | 0.24 | | | | 0.18 | | | | 10.27 | | | | 1.78 | |
Year Ended June 30, 2014 | | | 9.94 | | | | (0.11 | )(g) | | | 0.26 | | | | 0.15 | | | | 10.09 | | | | 1.51 | |
Year Ended June 30, 2013 | | | 9.82 | | | | (0.09 | )(g)(h) | | | 0.21 | | | | 0.12 | | | | 9.94 | | | | 1.22 | |
Year Ended June 30, 2012 | | | 9.91 | | | | (0.12 | )(g) | | | 0.03 | | | | (0.09 | ) | | | 9.82 | | | | (0.91 | ) |
Year Ended June 30, 2011 | | | 9.79 | | | | (0.14 | )(g) | | | 0.26 | | | | 0.12 | | | | 9.91 | | | | 1.23 | |
Year Ended June 30, 2010 | | | 10.27 | | | | (0.14 | )(g) | | | (0.34 | ) | | | (0.48 | ) | | | 9.79 | | | | (4.67 | ) |
| (a) | Annualized for periods less than one year, unless otherwise noted. |
| (b) | Not annualized for periods less than one year. |
| (c) | Includes adjustments in accordance with accounting principles generally accepted in the United States of America and as such, the net asset values for financial reporting purposes and the returns based upon those net asset values may differ from the net asset values and returns for shareholder transactions. |
| (d) | Includes earnings credits and interest expense, if applicable, each of which is less than 0.01% or unless otherwise noted. |
| (e) | The net expenses and expenses without waivers, reimbursements and earnings credits (excluding dividend expense and interest expense for securities sold short) for Class A are 1.49% and 1.93% for the six months ended December 31, 2014, 1.49% and 1.91% for the year ended June 30, 2014, 1.48% and 1.88% for 2013, 1.48% and 1.94% for 2012, 1.49% and 1.95% for 2011 and 1.49% and 1.94% for 2010; for Class B are 1.99% and 2.46% for the six months ended December 31, 2014, 1.99% and 2.41% for the year ended June 30, 2014, 2.16% and 2.38% for 2013, 2.23% and 2.45% for 2012, 2.24% and 2.45% for 2011 and 2.24% and 2.44% for 2010; for Class C are 1.99% and 2.43% for the six months ended December 31, 2014, 1.99% and 2.40% for the year ended June 30, 2014, 2.15% and 2.38% for 2013, 2.23% and 2.44% for 2012, 2.24% and 2.45% for 2011 and 2.24% and 2.44% for 2010; for Select Class are 1.23% and 1.64% for the six months ended December 31, 2014, 1.23% and 1.65% for the year ended June 30, 2014, 1.23% and 1.63% for 2013, 1.23% and 1.69% for 2012, 1.24% and 1.70% for 2011 and 1.24% and 1.69% for 2010, respectively. |
| (f) | Portfolio turnover is calculated by dividing the lesser of total purchases or sales of portfolio securities for the reporting period by the monthly average value of portfolio securities owned during the reporting period. Excluded from both the numerator and denominator are amounts relating to derivatives and securities whose maturities or expiration dates at the time of acquisition were one year or less. |
| (g) | Calculated based upon average shares outstanding. |
| (h) | Reflects special dividends paid out during the period by several of the Fund’s holdings. Had the Fund not received the special dividends, the net investment income (loss) per share would have been $(0.13),$(0.19),$(0.19) and $(0.11) for Class A,Class B,Class C and Select Class Shares, respectively, and the net investment income (loss) ratio would have been (1.38)%,(2.07)%,(2.06)% and (1.16)% for Class A,Class B,Class C and Select Class Shares, respectively. |
SEE NOTES TO FINANCIAL STATEMENTS.
| | | | | | |
| | | |
| 68 | | | | J.P. MORGAN MID CAP/MULTI-CAP FUNDS | | DECEMBER 31, 2014 |
| | | | | | | | | | | | | | | | | | | | | | |
| | | Ratios/Supplemental data | |
| | | | Ratios to average net assets (a) | | | | | | | |
Net assets,
end of
period
(000’s) | | | Net expenses
(including
dividend and
interest
expense for
securities
sold short)(d)(e) | | | Net
investment income
(loss) | | | Expenses
without waivers,
reimbursements and
earnings credits
(including dividend
and interest expense
for securities sold
short) (e) | | | Portfolio
turnover
rate (b)(f) | | | Portfolio
turnover rate
(including short
sales) (b)(f) | |
| | | | | | | | | | | | | | | | | | | | | | |
| | | | | | | | | | | | | | | | | | | | | | |
| $ | 7,007 | | | | 2.74 | % | | | (1.35 | )% | | | 3.18 | % | | | 43 | % | | | 124 | % |
| | 10,301 | | | | 2.78 | | | | (1.36 | ) | | | 3.20 | | | | 106 | | | | 227 | |
| | 14,101 | | | | 3.04 | | | | (1.13 | )(h) | | | 3.44 | | | | 94 | | | | 251 | |
| | 19,759 | | | | 2.86 | | | | (1.42 | ) | | | 3.32 | | | | 151 | | | | 316 | |
| | 29,216 | | | | 2.92 | | | | (1.65 | ) | | | 3.38 | | | | 145 | | | | 339 | |
| | 94,549 | | | | 2.94 | | | | (1.65 | ) | | | 3.39 | | | | 146 | | | | 348 | |
| | | | | |
| | | | | | | | | | | | | | | | | | | | | | |
| | 156 | | | | 3.24 | | | | (1.83 | ) | | | 3.71 | | | | 43 | | | | 124 | |
| | 209 | | | | 3.28 | | | | (1.88 | ) | | | 3.70 | | | | 106 | | | | 227 | |
| | 530 | | | | 3.70 | | | | (1.82 | )(h) | | | 3.92 | | | | 94 | | | | 251 | |
| | 1,401 | | | | 3.61 | | | | (2.18 | ) | | | 3.83 | | | | 151 | | | | 316 | |
| | 3,484 | | | | 3.67 | | | | (2.47 | ) | | | 3.88 | | | | 145 | | | | 339 | |
| | 7,849 | | | | 3.69 | | | | (2.39 | ) | | | 3.89 | | | | 146 | | | | 348 | |
| | | | | |
| | | | | | | | | | | | | | | | | | | | | | |
| | 7,655 | | | | 3.23 | | | | (1.83 | ) | | | 3.69 | | | | 43 | | | | 124 | |
| | 8,602 | | | | 3.28 | | | | (1.85 | ) | | | 3.70 | | | | 106 | | | | 227 | |
| | 11,181 | | | | 3.69 | | | | (1.81 | )(h) | | | 3.92 | | | | 94 | | | | 251 | |
| | 15,677 | | | | 3.61 | | | | (2.17 | ) | | | 3.82 | | | | 151 | | | | 316 | |
| | 22,094 | | | | 3.67 | | | | (2.46 | ) | | | 3.88 | | | | 145 | | | | 339 | |
| | 39,610 | | | | 3.70 | | | | (2.39 | ) | | | 3.89 | | | | 146 | | | | 348 | |
| | | | | |
| | | | | | | | | | | | | | | | | | | | | | |
| | 306,190 | | | | 2.48 | | | | (1.10 | ) | | | 2.89 | | | | 43 | | | | 124 | |
| | 431,890 | | | | 2.52 | | | | (1.07 | ) | | | 2.94 | | | | 106 | | | | 227 | |
| | 317,974 | | | | 2.78 | | | | (0.90 | )(h) | | | 3.18 | | | | 94 | | | | 251 | |
| | 476,803 | | | | 2.61 | | | | (1.17 | ) | | | 3.07 | | | | 151 | | | | 316 | |
| | 491,653 | | | | 2.67 | | | | (1.39 | ) | | | 3.13 | | | | 145 | | | | 339 | |
| | 433,539 | | | | 2.70 | | | | (1.39 | ) | | | 3.15 | | | | 146 | | | | 348 | |
SEE NOTES TO FINANCIAL STATEMENTS.
| | | | | | | | |
| | | |
| DECEMBER 31, 2014 | | J.P. MORGAN MID CAP/MULTI-CAP FUNDS | | | | | 69 | |
FINANCIAL HIGHLIGHTS
FOR THE PERIODS INDICATED (continued)
| | | | | | | | | | | | | | | | | | | | | | | | | | | | |
| | | Per share operating performance | |
| | | | | | Investment operations | | | Distributions | |
| | | Net asset
value,
beginning
of period | | | Net
investment
income (loss) | | | Net realized
and unrealized
gains
(losses) on
investments | | | Total from
investment
operations | | | Net
investment
income | | | Net
realized
gain | | | Total
distributions | |
Value Advantage Fund | | | | | | | | | | | | | | | | | | | | | | | | | | | | |
Class A | | | | | | | | | | | | | | | | | | | | | | | | | | | | |
Six Months Ended December 31, 2014 (Unaudited) | | $ | 29.15 | | | $ | 0.12 | (f) | | $ | 1.37 | | | $ | 1.49 | | | $ | (0.26 | ) | | $ | (0.71 | ) | | $ | (0.97 | ) |
Year Ended June 30, 2014 | | | 24.64 | | | | 0.34 | (f) | | | 5.03 | | | | 5.37 | | | | (0.16 | ) | | | (0.70 | ) | | | (0.86 | ) |
Year Ended June 30, 2013 | | | 19.96 | | | | 0.22 | (f) | | | 4.75 | | | | 4.97 | | | | (0.20 | ) | | | (0.09 | ) | | | (0.29 | ) |
Year Ended June 30, 2012 | | | 19.07 | | | | 0.25 | (f) | | | 0.84 | | | | 1.09 | | | | (0.20 | ) | | | — | | | | (0.20 | ) |
Year Ended June 30, 2011 | | | 15.22 | | | | 0.23 | (f) | | | 3.79 | | | | 4.02 | | | | (0.17 | ) | | | — | | | | (0.17 | ) |
Year Ended June 30, 2010 | | | 12.01 | | | | 0.23 | (f) | | | 3.17 | | | | 3.40 | | | | (0.19 | ) | | | — | | | | (0.19 | ) |
| | | | | | | |
Class C | | | | | | | | | | | | | | | | | | | | | | | | | | | | |
Six Months Ended December 31, 2014 (Unaudited) | | | 29.08 | | | | 0.04 | (f) | | | 1.37 | | | | 1.41 | | | | (0.16 | ) | | | (0.71 | ) | | | (0.87 | ) |
Year Ended June 30, 2014 | | | 24.61 | | | | 0.20 | (f) | | | 5.02 | | | | 5.22 | | | | (0.05 | ) | | | (0.70 | ) | | | (0.75 | ) |
Year Ended June 30, 2013 | | | 19.91 | | | | 0.11 | (f) | | | 4.74 | | | | 4.85 | | | | (0.06 | ) | | | (0.09 | ) | | | (0.15 | ) |
Year Ended June 30, 2012 | | | 19.01 | | | | 0.16 | (f) | | | 0.84 | | | | 1.00 | | | | (0.10 | ) | | | — | | | | (0.10 | ) |
Year Ended June 30, 2011 | | | 15.17 | | | | 0.14 | (f) | | | 3.77 | | | | 3.91 | | | | (0.07 | ) | | | — | | | | (0.07 | ) |
Year Ended June 30, 2010 | | | 11.97 | | | | 0.15 | (f) | | | 3.17 | | | | 3.32 | | | | (0.12 | ) | | | — | | | | (0.12 | ) |
| | | | | | | |
Institutional Class | | | | | | | | | | | | | | | | | | | | | | | | | | | | |
Six Months Ended December 31, 2014 (Unaudited) | | | 29.31 | | | | 0.19 | (f) | | | 1.40 | | | | 1.59 | | | | (0.38 | ) | | | (0.71 | ) | | | (1.09 | ) |
Year Ended June 30, 2014 | | | 24.74 | | | | 0.48 | (f) | | | 5.04 | | | | 5.52 | | | | (0.25 | ) | | | (0.70 | ) | | | (0.95 | ) |
Year Ended June 30, 2013 | | | 19.99 | | | | 0.34 | (f) | | | 4.75 | | | | 5.09 | | | | (0.25 | ) | | | (0.09 | ) | | | (0.34 | ) |
Year Ended June 30, 2012 | | | 19.11 | | | | 0.35 | (f) | | | 0.83 | | | | 1.18 | | | | (0.30 | ) | | | — | | | | (0.30 | ) |
Year Ended June 30, 2011 | | | 15.24 | | | | 0.32 | (f) | | | 3.79 | | | | 4.11 | | | | (0.24 | ) | | | — | | | | (0.24 | ) |
Year Ended June 30, 2010 | | | 12.01 | | | | 0.31 | (f) | | | 3.18 | | | | 3.49 | | | | (0.26 | ) | | | — | | | | (0.26 | ) |
| | | | | | | |
Select Class | | | | | | | | | | | | | | | | | | | | | | | | | | | | |
Six Months Ended December 31, 2014 (Unaudited) | | | 29.27 | | | | 0.15 | (f) | | | 1.39 | | | | 1.54 | | | | (0.32 | ) | | | (0.71 | ) | | | (1.03 | ) |
Year Ended June 30, 2014 | | | 24.72 | | | | 0.42 | (f) | | | 5.03 | | | | 5.45 | | | | (0.20 | ) | | | (0.70 | ) | | | (0.90 | ) |
Year Ended June 30, 2013 | | | 20.00 | | | | 0.28 | (f) | | | 4.75 | | | | 5.03 | | | | (0.22 | ) | | | (0.09 | ) | | | (0.31 | ) |
Year Ended June 30, 2012 | | | 19.12 | | | | 0.30 | (f) | | | 0.83 | | | | 1.13 | | | | (0.25 | ) | | | — | | | | (0.25 | ) |
Year Ended June 30, 2011 | | | 15.27 | | | | 0.28 | (f) | | | 3.79 | | | | 4.07 | | | | (0.22 | ) | | | — | | | | (0.22 | ) |
Year Ended June 30, 2010 | | | 12.04 | | | | 0.27 | (f) | | | 3.19 | | | | 3.46 | | | | (0.23 | ) | | | — | | | | (0.23 | ) |
| (a) | Annualized for periods less than one year, unless otherwise noted. |
| (b) | Not annualized for periods less than one year. |
| (c) | Includes adjustments in accordance with accounting principles generally accepted in the United States of America and as such, the net asset values for financial reporting purposes and the returns based upon those net asset values may differ from the net asset values and returns for shareholder transactions. |
| (d) | Includes earnings credits and interest expense, if applicable, each of which is less than 0.01% unless otherwise noted. |
| (e) | Portfolio turnover is calculated by dividing the lesser of total purchases or sales of portfolio securities for the reporting period by the monthly average value of portfolio securities owned during the reporting period. Excluded from both the numerator and denominator are amounts relating to derivatives and securities whose maturities or expiration dates at the time of acquisition were one year or less. |
| (f) | Calculated based upon average shares outstanding. |
SEE NOTES TO FINANCIAL STATEMENTS.
| | | | | | |
| | | |
| 70 | | | | J.P. MORGAN MID CAP/MULTI-CAP FUNDS | | DECEMBER 31, 2014 |
| | | | | | | | | | | | | | | | | | | | | | | | | | |
| | | Ratios/Supplemental data | |
| | | | | | | | | | Ratios to average net assets (a) | | | | |
Net asset
value,
end of
period | | | Total return
(excludes
sales charge) (b)(c) | | | Net assets,
end of period (000’s) | | | Net
expenses (d) | | | Net
investment income (loss) | | | Expenses
without waivers,
reimbursements and
earnings credits | | | Portfolio
turnover
rate (b)(e) | |
| | | | | | | | | | | | | | | | | | | | | | | | | | |
| | | | | | | | | | | | | | | | | | | | | | | | | | |
| $ | 29.67 | | | | 5.18 | % | | $ | 2,151,927 | | | | 1.24 | % | | | 0.79 | % | | | 1.36 | % | | | 9 | % |
| | 29.15 | | | | 22.19 | | | | 1,701,250 | | | | 1.24 | | | | 1.26 | | | | 1.33 | | | | 36 | |
| | 24.64 | | | | 25.09 | | | | 784,359 | | | | 1.24 | | | | 0.98 | | | | 1.33 | | | | 22 | |
| | 19.96 | | | | 5.83 | | | | 206,816 | | | | 1.25 | | | | 1.34 | | | | 1.41 | | | | 49 | |
| | 19.07 | | | | 26.45 | | | | 232,103 | | | | 1.24 | | | | 1.28 | | | | 1.34 | | | | 33 | |
| | 15.22 | | | | 28.35 | | | | 150,081 | | | | 1.24 | | | | 1.52 | | | | 1.38 | | | | 45 | |
| | | | | | |
| | | | | | | | | | | | | | | | | | | | | | | | | | |
| | 29.62 | | | | 4.91 | | | | 552,738 | | | | 1.74 | | | | 0.30 | | | | 1.82 | | | | 9 | |
| | 29.08 | | | | 21.58 | | | | 402,880 | | | | 1.74 | | | | 0.74 | | | | 1.83 | | | | 36 | |
| | 24.61 | | | | 24.45 | | | | 212,198 | | | | 1.74 | | | | 0.49 | | | | 1.83 | | | | 22 | |
| | 19.91 | | | | 5.32 | | | | 117,937 | | | | 1.75 | | | | 0.84 | | | | 1.91 | | | | 49 | |
| | 19.01 | | | | 25.82 | | | | 131,743 | | | | 1.74 | | | | 0.78 | | | | 1.84 | | | | 33 | |
| | 15.17 | | | | 27.72 | | | | 108,165 | | | | 1.74 | | | | 1.01 | | | | 1.88 | | | | 45 | |
| | | | | | |
| | | | | | | | | | | | | | | | | | | | | | | | | | |
| | 29.81 | | | | 5.48 | | | | 4,179,965 | | | | 0.74 | | | | 1.30 | | | | 0.90 | | | | 9 | |
| | 29.31 | | | | 22.77 | | | | 3,042,506 | | | | 0.74 | | | | 1.77 | | | | 0.93 | | | | 36 | |
| | 24.74 | | | | 25.73 | | | | 1,455,125 | | | | 0.74 | | | | 1.50 | | | | 0.93 | | | | 22 | |
| | 19.99 | | | | 6.36 | | | | 384,525 | | | | 0.75 | | | | 1.86 | | | | 1.01 | | | | 49 | |
| | 19.11 | | | | 27.06 | | | | 284,433 | | | | 0.74 | | | | 1.79 | | | | 0.94 | | | | 33 | |
| | 15.24 | | | | 29.03 | | | | 156,531 | | | | 0.74 | | | | 2.04 | | | | 0.98 | | | | 45 | |
| | | | | | |
| | | | | | | | | | | | | | | | | | | | | | | | | | |
| | 29.78 | | | | 5.31 | | | | 2,970,065 | | | | 0.99 | | | | 1.03 | | | | 1.06 | | | | 9 | |
| | 29.27 | | | | 22.49 | | | | 2,546,808 | | | | 0.99 | | | | 1.53 | | | | 1.08 | | | | 36 | |
| | 24.72 | | | | 25.38 | | | | 1,245,241 | | | | 0.99 | | | | 1.23 | | | | 1.08 | | | | 22 | |
| | 20.00 | | | | 6.09 | | | | 422,861 | | | | 1.00 | | | | 1.62 | | | | 1.16 | | | | 49 | |
| | 19.12 | | | | 26.75 | | | | 270,562 | | | | 0.99 | | | | 1.53 | | | | 1.09 | | | | 33 | |
| | 15.27 | | | | 28.70 | | | | 71,209 | | | | 0.99 | | | | 1.77 | | | | 1.13 | | | | 45 | |
SEE NOTES TO FINANCIAL STATEMENTS.
| | | | | | | | |
| | | |
| DECEMBER 31, 2014 | | J.P. MORGAN MID CAP/MULTI-CAP FUNDS | | | | | 71 | |
NOTES TO FINANCIAL STATEMENTS
AS OF DECEMBER 31, 2014 (Unaudited)
1. Organization
JPMorgan Trust I (“JPM I”) and JPMorgan Trust II (“JPM II”) were formed on November 12, 2004, as Delaware statutory trusts, pursuant to Declarations of Trust dated November 5, 2004 and are registered under the Investment Company Act of 1940, as amended (the “1940 Act”), as open-end management investment companies.
J.P. Morgan Mutual Fund Investment Trust (“JPMMFIT”), an open-end management investment company, was organized as a Massachusetts business trust on September 23, 1997.
J.P. Morgan Fleming Mutual Fund Group, Inc. (“JPMFMFG”, with JPM I, JPM II and JPMMFIT (the “Trusts”)), an open-end management investment company, was organized as a Maryland corporation on August 19, 1997.
The following are 6 separate funds of the Trusts (collectively, the “Funds”) covered by this report:
| | | | | | |
| | | Classes Offered | | Trust | | Diversified/Non-Diversified |
| Growth Advantage Fund | | Class A, Class B, Class C, Class R5, Class R6* and Select Class | | JPMMFIT | | Diversified |
| Mid Cap Equity Fund | | Class A, Class C, Class R2**, Class R5**, Class R6** and Select Class | | JPM I | | Diversified |
| Mid Cap Growth Fund | | Class A, Class B, Class C, Class R2, Class R5, Class R6 and Select Class | | JPM II | | Diversified |
| Mid Cap Value Fund | | Class A, Class B, Class C, Class R2, Institutional Class and Select Class | | JPMFMFG | | Diversified |
| Multi-Cap Market Neutral Fund | | Class A, Class B, Class C, and Select Class | | JPM II | | Diversified |
| Value Advantage Fund | | Class A, Class C, Institutional Class and Select Class | | JPM I | | Diversified |
| * | Class R6 Shares of Growth Advantage Fund commenced operations on December 23, 2013. |
| ** | Class R2, Class R5 and Class R6 Shares of Mid Cap Equity Fund commenced operations on March 14, 2014. |
The investment objective of Growth Advantage Fund and Mid Cap Equity Fund is to seek to provide long-term capital growth.
The investment objective of Mid Cap Growth Fund is to seek growth of capital.
The investment objective of Mid Cap Value Fund is to seek growth from capital appreciation.
The investment objective of Multi-Cap Market Neutral Fund is to seek long-term capital preservation and growth by using strategies designed to produce returns which have no correlation with general domestic market performance.
The investment objective of Value Advantage Fund is to seek to provide long-term total return from a combination of income and capital gains.
Effective as of the close of business on January 3, 2014, all share classes of the Mid Cap Equity Fund are publicly offered only on a limited basis. Investors are not eligible to purchase shares of the Fund unless they meet certain requirements as described in the Classes’ prospectuses.
Effective as of the close of business on February 22, 2013, all share classes of the Mid Cap Value Fund are publicly offered only on a limited basis. Investors are not eligible to purchase shares of the Fund unless they meet certain requirements as described in the Classes’ prospectuses.
Effective November 1, 2009, Class B Shares of the Growth Advantage Fund, Mid Cap Growth Fund, Mid Cap Value Fund and Multi-Cap Market Neutral Fund may not be purchased or acquired by new or existing shareholders, except through exchanges from Class B Shares of another J.P. Morgan Fund and dividend reinvestments. Shareholders who invested in Class B Shares prior to November 1, 2009 may continue to hold their Class B Shares until they automatically convert to Class A Shares.
Class A Shares generally provide for a front-end sales charge while Class B and Class C Shares provide for a contingent deferred sales charge (“CDSC”). Class B Shares automatically convert to Class A Shares after eight years. No sales charges are assessed with respect to Class R2, Class R5, Class R6, Institutional Class and Select Class Shares. All classes of shares have equal rights as to earnings, assets and voting privileges, except that each class may bear different distribution and shareholder servicing fees and each class has exclusive voting rights with respect to its distribution plan and shareholder servicing agreements. Certain Class A Shares, for which front-end sales charges have been waived, may be subject to a CDSC as described in the Funds’ prospectus.
2. Significant Accounting Policies
The following is a summary of significant accounting policies followed by the Funds in the preparation of their financial statements. The Funds are investment companies and, accordingly, follow the investment company accounting and reporting guidance of the Financial Accounting Standards Board Accounting Standards Codification Topic 946—Investment Companies, which is part of U.S. generally accepted accounting principles (“GAAP”). The preparation of financial statements in conformity with GAAP requires management to make estimates and assumptions that affect the reported amounts of assets and liabilities and disclosure of contingent assets and liabilities at the date of the financial statements and the reported amounts of increases and decreases in net assets from operations during the reporting period. Actual results could differ from those estimates.
A. Valuation of Investments — The valuation of the investments is in accordance with GAAP and the Funds’ valuation policies set forth by and under the supervision and responsibility of the Board of Trustees (the “Board”), which established the following approach to valuation, as described more fully below: (i) investments for which market quotations are readily available shall be valued at such unadjusted quoted prices and (ii) all other investments for which market quotations are not readily available shall be valued at their fair value as determined in good faith by the Board.
| | | | | | |
| | | |
| 72 | | | | J.P. MORGAN MID CAP/MULTI-CAP FUNDS | | DECEMBER 31, 2014 |
JPMorgan Funds Management, Inc. (the “Administrator” or “JPMFM”) has established the J.P. Morgan Asset Management Americas Valuation Committee (“AVC”) to assist the Board with the oversight and monitoring of the valuation of the Funds’ investments. The Administrator implements the valuation policies of the Funds’ investments, as directed by the Board. The AVC oversees and carries out the policies for the valuation of investments held in the Funds. This includes monitoring the appropriateness of fair values based on results of ongoing valuation oversight, including but not limited to consideration of macro or security specific events, market events and pricing vendor and broker due diligence. The Administrator is responsible for discussing and assessing the potential impacts to the fair values on an ongoing basis, and at least on a quarterly basis with the AVC and the Board.
Equities and other exchange-traded instruments are valued at the last sale price or official market closing price on the primary exchange on which the instrument is traded before the net asset values (“NAV”) of the Funds are calculated on a valuation date. Investments in open-end investment companies (the “Underlying Funds”) are valued at each investment company’s NAV per share as of the report date.
Futures are generally valued on the basis of available market quotations.
Valuations reflected in this report are as of the report date. As a result, changes in valuation due to market events and/or issuer related events after the report date and prior to issuance of the report are not reflected herein.
The various inputs that are used in determining the valuation of the Funds’ investments are summarized into the three broad levels listed below.
| Ÿ | | Level 1 — Unadjusted inputs using quoted prices in active markets for identical investments. |
| Ÿ | | Level 2— Other significant observable inputs including, but are not limited to, quoted prices for similar investments, inputs other than quoted prices that are observable for investments (such as interest rates, prepayment speeds, credit risk, etc.) or other market corroborated inputs. |
| Ÿ | | Level 3 — Significant inputs based on the best information available in the circumstances, to the extent observable inputs are not available (including the Funds’ assumptions in determining the fair value of investments). |
A financial instrument’s level within the fair value hierarchy is based on the lowest level of any input, both individually and in the aggregate, that is significant to the fair value measurement. The inputs or methodology used for valuing instruments are not necessarily an indication of the risk associated with investing in those instruments.
The following tables represent each valuation input as presented on the Schedules of Portfolio Investments (“SOIs”) (amounts in thousands):
Growth Advantage Fund
| | | | | | | | | | | | | | | | |
| | | Level 1
Quoted prices | | | Level 2
Other significant
observable inputs | | | Level 3
Significant
unobservable inputs | | | Total | |
Total Investments in Securities (a) | | $ | 4,162,569 | | | $ | — | | | $ | — | | | $ | 4,162,569 | |
| | | | | | | | | | | | | | | | |
| | | | |
Mid Cap Equity Fund | | | | | | | | | | | | | | | | |
| | | Level 1
Quoted prices | | | Level 2
Other significant
observable inputs | | | Level 3
Significant
unobservable inputs | | | Total | |
Total Investments in Securities (a) | | $ | 3,072,435 | | | $ | — | | | $ | — | | | $ | 3,072,435 | |
| | | | | | | | | | | | | | | | |
| | | | |
Mid Cap Growth Fund | | | | | | | | | | | | | | | | |
| | | Level 1
Quoted prices | | | Level 2
Other significant
observable inputs | | | Level 3
Significant
unobservable inputs | | | Total | |
Total Investments in Securities (a) | | $ | 2,362,475 | | | $ | — | | | $ | — | | | $ | 2,362,475 | |
| | | | | | | | | | | | | | | | |
| | | | |
Mid Cap Value Fund | | | | | | | | | | | | | | | | |
| | | Level 1
Quoted prices | | | Level 2
Other significant
observable inputs | | | Level 3
Significant
unobservable inputs | | | Total | |
Total Investments in Securities (a) | | $ | 16,058,832 | | | $ | — | | | $ | — | | | $ | 16,058,832 | |
| | | | | | | | | | | | | | | | |
| | | | | | | | |
| | | |
| DECEMBER 31, 2014 | | J.P. MORGAN MID CAP/MULTI-CAP FUNDS | | | | | 73 | |
NOTES TO FINANCIAL STATEMENTS
AS OF DECEMBER 31, 2014 (Unaudited) (continued)
| | | | | | | | | | | | | | | | |
| | | | |
Multi-Cap Market Neutral Fund | | | | | | | | | | | | | | | | |
| | | Level 1
Quoted prices | | | Level 2
Other significant
observable inputs | | | Level 3
Significant
unobservable inputs | | | Total | |
Total Investments in Securities (a) | | $ | 318,202 | | | $ | — | | | $ | — | | | $ | 318,202 | |
| | | | | | | | | | | | | | | | |
Total Liabilities for Securities Sold Short (a) | | $ | (297,278 | ) | | $ | — | | | $ | — | | | $ | (297,278 | ) |
| | | | | | | | | | | | | | | | |
Appreciation in Other Financial Instruments | | | | | | | | | | | | | | | | |
Futures Contracts | | $ | 18 | | | $ | — | | | $ | — | | | $ | 18 | |
| | | | | | | | | | | | | | | | |
| | | | |
Value Advantage Fund | | | | | | | | | | | | | | | | |
| | | Level 1
Quoted prices | | | Level 2
Other significant
observable inputs | | | Level 3
Significant
unobservable inputs | | | Total | |
Total Investments in Securities (a) | | $ | 9,825,377 | | | $ | — | | | $ | — | | | $ | 9,825,377 | |
| | | | | | | | | | | | | | | | |
| (a) | All portfolio holdings designated as Level 1 are disclosed individually on the SOIs. Please refer to the SOIs for industry specifics of portfolio holdings. |
There were no transfers among any levels during the six months ended December 31, 2014.
B. Short Sales — Multi-Cap Market Neutral Fund engages in short sales as part of its normal investment activities. In a short sale, the Fund sells securities it does not own in anticipation of a decline in the market value of those securities. In order to deliver securities to the purchaser, the Fund borrows securities from a broker. To close out a short position, the Fund delivers the same securities to the broker.
The Fund is required to pledge cash or securities to the broker as collateral for the securities sold short. Collateral requirements are calculated daily based on the current market value of the short positions. Cash collateral deposited with the broker is recorded as an asset on the Statements of Assets and Liabilities. Securities segregated as collateral are denoted in the SOIs. The Fund may receive or pay the net of the following amounts: (i) a portion of the income from the investment of cash collateral; (ii) the broker’s fee on the borrowed securities (calculated daily based upon the market value of each borrowed security and a variable rate that is dependent on availability of the security); and (iii) a financing charge for the difference between the market value of the short position and cash collateral deposited with the broker. The net income or fee is reported as interest income or interest expense, respectively, on securities sold short in the Statements of Operations.
The Fund is obligated to pay the broker dividends declared on short positions when a position is open on the record date. Dividends on short positions are reported on ex-dividend date on the Statements of Operations as dividend expense on securities sold short.
Liabilities for securities sold short are reported at market value on the Statements of Assets and Liabilities and the change in market value is recorded as change in net unrealized appreciation (depreciation) in the Statements of Operations. Short sale transactions may result in unlimited losses as the security’s price increases and the short position loses value. There is no upward limit on the price a borrowed security could attain. The Fund is also subject to risk of loss if the broker were to fail to perform its obligations under the contractual terms.
The Fund will record a realized loss if the price of the borrowed security increases between the date of the short sale and the date on which the Fund replaces the borrowed security. The Fund will record a realized gain if the price of the borrowed security declines between those dates.
As of December 31, 2014, the Fund had outstanding short sales as listed on its SOI.
C. Futures Contracts — Multi-Cap Market Neutral Fund uses index futures contracts to gain or reduce exposure to the stock market, maintain liquidity and minimize transaction costs. The Fund also buys futures contracts to immediately invest incoming cash in the market or sell futures in response to cash outflows, thereby simulating an invested position in the underlying index while maintaining a cash balance for liquidity. The use of futures contracts exposes the Fund to equity price risk.
Futures contracts provide for the delayed delivery of the underlying instrument at a fixed price or are settled for a cash amount based on the change in the value of the underlying instrument at a specific date in the future. Upon entering into a futures contract, the Fund is required to deposit with the broker, cash or securities in an amount equal to a certain percentage of the contract amount, which is referred to as the initial margin deposit. Subsequent payments, referred to as variation margin, are made or received by the Fund periodically and are based on changes in the market value of open futures contracts. Changes in the market value of open futures contracts are recorded as change in net unrealized appreciation/depreciation on the Statements of Operations. Realized gains or losses, representing the difference between the value of the contract at the time it was opened and the value at the time it was closed, are reported in the Statements of Operations at the closing or expiration of the futures contract. Securities deposited as initial margin are designated in the SOIs and cash deposited is recorded on the Statements of Assets and Liabilities. A receivable from and/or a payable to brokers for the daily variation margin is also recorded on the Statements of Assets and Liabilities.
| | | | | | |
| | | |
| 74 | | | | J.P. MORGAN MID CAP/MULTI-CAP FUNDS | | DECEMBER 31, 2014 |
The Fund may be subject to the risk that the change in the value of the futures contract may not correlate perfectly with the underlying instrument. Use of long futures contracts subjects the Fund to risk of loss in excess of the amounts shown on the Statements of Assets and Liabilities, up to the notional amount of the futures contracts. Use of short futures contracts subjects the Fund to unlimited risk of loss. The Fund may enter into futures contracts only on exchanges or boards of trade. The exchange or board of trade acts as the counterparty to each futures transaction; therefore, the Fund’s credit risk is limited to failure of the exchange or board of trade. Under some circumstances, futures exchanges may establish daily limits on the amount that the price of a futures contract can vary from the previous day’s settlement price, which could effectively prevent liquidation of positions.
The table below discloses the volume of the Fund’s futures contracts activity during the six months ended December 31, 2014 (amounts in thousands):
| | | | |
| | | Multi-Cap Market
Neutral Fund | |
Futures Contracts: | | | | |
Average Notional Balance Short | | $ | 3,319 | |
Ending Notional Balance Short | | | 1,527 | |
The Fund’s futures contracts are not subject to master netting arrangements (the right to close out all transactions traded with a counterparty and net amounts owed or due across transactions).
D. Security Transactions and Investment Income — Investment transactions are accounted for on the trade date (the date the order to buy or sell is executed). Securities gains and losses are calculated on a specifically identified cost basis. Interest income is determined on the basis of coupon interest accrued using the effective interest method which adjusts for amortization of premiums and accretion of discounts. Dividend income, net of foreign taxes withheld, if any, and dividend expense on securities sold short, are recorded on the ex-dividend date or when a Fund first learns of the dividend.
To the extent such information is publicly available, the Funds record distributions received in excess of income earned from underlying investments as a reduction of cost of investments and/or realized gain. Such amounts are based on estimates if actual amounts are not available and actual amounts of income, realized gain and return of capital may differ from the estimated amounts. The Funds adjust the estimated amounts of the components of distributions (and consequently their net investment income) as necessary once the issuers provide information about the actual composition of the distributions.
E. Allocation of Income and Expenses — Expenses directly attributable to a fund are charged directly to that fund, while the expenses attributable to more than one fund of the Trusts are allocated among the respective funds. In calculating the NAV of each class, investment income, realized and unrealized gains and losses and expenses, other than class specific expenses, are allocated daily to each class of shares based upon the proportion of net assets of each class at the beginning of each day.
F. Federal Income Taxes — Each Fund is treated as a separate taxable entity for Federal income tax purposes. Each Fund’s policy is to comply with the provisions of the Internal Revenue Code of 1986, as amended (the “Code”), applicable to regulated investment companies and to distribute to shareholders all of its distributable net investment income and net realized capital gains on investments. Accordingly, no provision for Federal income tax is necessary. Management has reviewed the Funds’ tax positions for all open tax years and has determined that as of December 31, 2014, no liability for income tax is required in the Funds’ financial statements for net unrecognized tax benefits. However, management’s conclusions may be subject to future review based on changes in, or the interpretation of, the accounting standards or tax laws and regulations. Each of the Fund’s Federal tax returns for the prior three fiscal years remains subject to examination by the Internal Revenue Service.
G. Distributions to Shareholders — Distributions from net investment income are generally declared and paid at least annually, except for the Mid Cap Equity Fund, Mid Cap Growth Fund and Multi-Cap Market Neutral Fund, for which distributions are generally declared and paid at least quarterly. Distributions are declared separately for each class of each Fund. No class has preferential dividend rights; differences in per share rates are due to differences in separate class expenses. Net realized capital gains, if any, are distributed by each Fund at least annually. The amount of distributions from net investment income and net realized capital gains is determined in accordance with Federal income tax regulations, which may differ from GAAP. To the extent these “book/tax” differences are permanent in nature (i.e., that they result from other than timing of recognition — “temporary differences”), such amounts are reclassified within the capital accounts based on their Federal tax-basis treatment.
| | | | | | | | |
| | | |
| DECEMBER 31, 2014 | | J.P. MORGAN MID CAP/MULTI-CAP FUNDS | | | | | 75 | |
NOTES TO FINANCIAL STATEMENTS
AS OF DECEMBER 31, 2014 (Unaudited) (continued)
3. Fees and Other Transactions with Affiliates
A. Investment Advisory Fee — Pursuant to the Investment Advisory Agreements, J.P. Morgan Investment Management, Inc. (the “Adviser” or “JPMIM”), an indirect, wholly-owned subsidiary of JPMorgan Chase & Co. (“JPMorgan”), supervises the investments of each Fund and for such services is paid a fee. The fee is accrued daily and paid monthly based on each Fund’s respective average daily net assets. The annual rate for each Fund is as follows:
| | | | |
Growth Advantage Fund | | | 0.65 | % |
Mid Cap Equity Fund | | | 0.65 | |
Mid Cap Growth Fund | | | 0.65 | |
Mid Cap Value Fund | | | 0.65 | |
Multi-Cap Market Neutral Fund | | | 1.25 | |
Value Advantage Fund | | | 0.65 | |
The Adviser waived Investment Advisory fees and/or reimbursed expenses as outlined in Note 3.F.
B. Administration Fee — Pursuant to an Administration Agreement, the Administrator, an indirect, wholly-owned subsidiary of JPMorgan, provides certain administration services to the Funds. In consideration of these services, the Administrator receives a fee accrued daily and paid monthly at an annual rate of 0.15% of the first $25 billion of the average daily net assets of all funds in the J.P. Morgan Funds Complex covered by the Administration Agreement (excluding certain funds of funds and money market funds) and 0.075% of the average daily net assets in excess of $25 billion of all such funds. For the six months ended December 31, 2014, the effective annualized rate was 0.08% of each Fund’s average daily net assets, notwithstanding any fee waivers and/or expense reimbursements.
The Administrator waived Administration fees as outlined in Note 3.F.
JPMorgan Chase Bank, N.A. (“JPMCB”), a wholly-owned subsidiary of JPMorgan, serves as the Funds’ sub-administrator (the “Sub-administrator”). For its services as Sub-administrator, JPMCB receives a portion of the fees payable to the Administrator.
C. Distribution Fees — Pursuant to a Distribution Agreement, JPMorgan Distribution Services, Inc. (the “Distributor”), a wholly-owned subsidiary of JPMorgan, serves as the Trusts’ exclusive underwriter and promotes and arranges for the sale of each Fund’s shares.
The Board has adopted a Distribution Plan (the “Distribution Plan”) for Class A, Class B, Class C and Class R2 Shares of the Funds in accordance with Rule 12b-1 under the 1940 Act. The Distribution Plan provides that each Fund shall pay distribution fees, including payments to the Distributor, at annual rates of the average daily net assets as shown in the table below:
| | | | | | | | | | | | | | | | |
| | | Class A | | | Class B | | | Class C | | | Class R2 | |
Growth Advantage Fund | | | 0.25 | % | | | 0.75 | % | | | 0.75 | % | | | n/a | |
Mid Cap Equity Fund | | | 0.25 | | | | n/a | | | | 0.75 | | | | 0.50 | % |
Mid Cap Growth Fund | | | 0.25 | | | | 0.75 | | | | 0.75 | | | | 0.50 | |
Mid Cap Value Fund | | | 0.25 | | | | 0.75 | | | | 0.75 | | | | 0.50 | |
Multi-Cap Market Neutral Fund | | | 0.25 | | | | 0.75 | | | | 0.75 | | | | n/a | |
Value Advantage Fund | | | 0.25 | | | | n/a | | | | 0.75 | | | | n/a | |
In addition, the Distributor is entitled to receive the front-end sales charges from purchases of Class A Shares and the CDSC from redemptions of Class B and Class C Shares and certain Class A Shares for which front-end sales charges have been waived. For the six months ended December 31, 2014, the Distributor retained the following (amounts in thousands):
| | | | | | | | |
| | | Front-End Sales Charge | | | CDSC | |
Growth Advantage Fund | | $ | 299 | | | $ | 1 | |
Mid Cap Equity Fund | | | 89 | | | | — | (a) |
Mid Cap Growth Fund | | | 43 | | | | — | (a) |
Mid Cap Value Fund | | | 17 | | | | 1 | |
Multi-Cap Market Neutral Fund | | | 1 | | | | — | |
Value Advantage Fund | | | 297 | | | | 1 | |
| (a) | Amount rounds to less than $1,000. |
| | | | | | |
| | | |
| 76 | | | | J.P. MORGAN MID CAP/MULTI-CAP FUNDS | | DECEMBER 31, 2014 |
D. Shareholder Servicing Fees — The Trusts, on behalf of the Funds, have entered into Shareholder Servicing Agreements with the Distributor under which the Distributor provides certain support services to the shareholders. The Class R6 Shares do not participate in the Shareholder Servicing Agreement. For performing these services, the Distributor receives a fee that is accrued daily and paid monthly equal to a percentage of the average daily net assets as shown in the table below:
| | | | | | | | | | | | | | | | | | | | | | | | | | | | |
| | | Class A | | | Class B | | | Class C | | | Class R2 | | | Class R5 | | | Institutional Class | | | Select Class | |
Growth Advantage Fund | | | 0.25 | % | | | 0.25 | % | | | 0.25 | % | | | n/a | | | | 0.05 | % | | | n/a | | | | 0.25 | % |
Mid Cap Equity Fund | | | 0.25 | | | | n/a | | | | 0.25 | | | | 0.25 | % | | | 0.05 | | | | n/a | | | | 0.25 | |
Mid Cap Growth Fund | | | 0.25 | | | | 0.25 | | | | 0.25 | | | | 0.25 | | | | 0.05 | | | | n/a | | | | 0.25 | |
Mid Cap Value Fund | | | 0.25 | | | | 0.25 | | | | 0.25 | | | | 0.25 | | | | n/a | | | | 0.10 | % | | | 0.25 | |
Multi-Cap Market Neutral Fund | | | 0.25 | | | | 0.25 | | | | 0.25 | | | | n/a | | | | n/a | | | | n/a | | | | 0.25 | |
Value Advantage Fund | | | 0.25 | | | | n/a | | | | 0.25 | | | | n/a | | | | n/a | | | | 0.10 | | | | 0.25 | |
The Distributor has entered into shareholder services contracts with affiliated and unaffiliated financial intermediaries who provide shareholder services and other related services to their clients or customers who invest in the Funds under which the Distributor will pay all or a portion of such fees earned to financial intermediaries for performing such services.
The Distributor waived Shareholder Servicing fees as outlined in Note 3.F.
E. Custodian and Accounting Fees — JPMCB provides portfolio custody and accounting services to the Funds. For these services, the Funds pay JPMCB transaction and asset-based fees that vary according to the number of transactions and positions, plus out-of-pocket expenses. The amounts paid directly to JPMCB by the Funds for custody and accounting services are included in Custodian and accounting fees in the Statements of Operations. Payments to the custodian may be reduced by credits earned by each Fund, based on uninvested cash balances held by the custodian. Such earnings credits, if any, are presented separately in the Statements of Operations.
Interest expense paid to the custodian related to cash overdrafts, if any, is included in Interest expense to affiliates in the Statements of Operations.
F. Waivers and Reimbursements — The Adviser, Administrator and Distributor have contractually agreed to waive fees and/or reimburse the Funds to the extent that total annual operating expenses (excluding acquired fund fees and expenses, dividend expenses related to short sales, interest, taxes, expenses related to litigation and potential litigation, extraordinary expenses and expenses related to the Board’s deferred compensation plan) exceed the percentages of the Funds’ respective average daily net assets as shown in the table below:
| | | | | | | | | | | | | | | | | | | | | | | | | | | | | | | | |
| | | Class A | | | Class B | | | Class C | | | Class R2 | | | Class R5 | | | Class R6 | | | Institutional Class | | | Select Class | |
Growth Advantage Fund | | | 1.25 | % | | | 1.75 | % | | | 1.75 | % | | | n/a | | | | 0.90 | % | | | 0.80 | % | | | n/a | | | | 1.10 | % |
Mid Cap Equity Fund | | | 1.25 | | | | n/a | | | | 1.75 | | | | 1.50 | % | | | 0.80 | | | | 0.75 | | | | n/a | | | | 0.90 | |
Mid Cap Growth Fund | | | 1.24 | | | | 1.74 | | | | 1.74 | | | | 1.40 | | | | 0.79 | | | | 0.74 | | | | n/a | | | | 0.93 | |
Mid Cap Value Fund | | | 1.24 | | | | 1.75 | | | | 1.75 | | | | 1.50 | | | | n/a | | | | n/a | | | | 0.75 | % | | | 0.99 | |
Multi-Cap Market Neutral Fund | | | 1.50 | | | | 2.00 | | | | 2.00 | | | | n/a | | | | n/a | | | | n/a | | | | n/a | | | | 1.25 | |
Value Advantage Fund | | | 1.25 | | | | n/a | | | | 1.75 | | | | n/a | | | | n/a | | | | n/a | | | | 0.75 | | | | 1.00 | |
The expense limitation agreements were in effect for the six months ended December 31, 2014. The contractual expense limitation percentages in the table above are in place until at least October 31, 2015, except Growth Advantage Fund Class R6 which is in place until December 31, 2014 and Mid Cap Equity Fund which is in place until October 31, 2016. Effective January 1, 2015, the contractual expense limitation for Growth Advantage Fund Class R6 was increased to 0.85% until at least October 31, 2015. In addition, the Funds’ service providers have voluntarily waived fees during the six months ended December 31, 2014. However, the Funds’ service providers are under no obligation to do so and may discontinue such voluntary waivers at any time.
For the six months ended December 31, 2014, the Funds’ service providers waived fees and/or reimbursed expenses for each of the Funds as follows (amounts in thousands). None of these parties expect the Funds to repay any such waived fees and reimbursed expenses in future years.
| | | | | | | | | | | | | | | | | | | | |
| | | Contractual Waivers | |
| | | Investment
Advisory | | | Administration | | | Shareholder
Servicing | | | Total | | | Contractual
Reimbursements | |
Growth Advantage Fund | | $ | 40 | | | $ | 3 | | | $ | 332 | | | $ | 375 | | | $ | — | |
Mid Cap Equity Fund | | | 816 | | | | 545 | | | | 1,396 | | | | 2,757 | | | | 19 | |
Mid Cap Growth Fund | | | 636 | | | | 420 | | | | 743 | | | | 1,799 | | | | 2 | |
Mid Cap Value Fund | | | 5,146 | | | | 3,337 | | | | 5,090 | | | | 13,573 | | | | 19 | |
Multi-Cap Market Neutral Fund | | | 635 | | | | 172 | | | | 3 | | | | 810 | | | | — | (a) |
Value Advantage Fund | | | 1,563 | | | | 1,009 | | | | 2,184 | | | | 4,756 | | | | — | |
| (a) | Amount rounds to less than $1,000. |
Additionally, the Funds may invest in one or more money market funds advised by the Adviser or its affiliates. The Adviser, Administrator and Distributor, as shareholder servicing agent, waive fees in an amount sufficient to offset the respective fees each charges to the affiliated money market fund on the Funds’ investment in such affiliated money market fund. A portion of the waiver is voluntary.
| | | | | | | | |
| | | |
| DECEMBER 31, 2014 | | J.P. MORGAN MID CAP/MULTI-CAP FUNDS | | | | | 77 | |
NOTES TO FINANCIAL STATEMENTS
AS OF DECEMBER 31, 2014 (Unaudited) (continued)
The amount of waivers resulting from investments in these money market funds for the six months ended December 31, 2014 was as follows (amounts in thousands):
| | | | |
Growth Advantage Fund | | $ | 74 | |
Mid Cap Equity Fund | | | 90 | |
Mid Cap Growth Fund | | | 51 | |
Mid Cap Value Fund | | | 425 | |
Multi-Cap Market Neutral Fund | | | 42 | |
Value Advantage Fund | | | 568 | |
G. Other — Certain officers of the Trusts are affiliated with the Adviser, the Administrator and the Distributor. Such officers, with the exception of the Chief Compliance Officer, receive no compensation from the Funds for serving in their respective roles.
The Board appointed a Chief Compliance Officer to the Funds in accordance with Federal securities regulations. Each Fund, along with other affiliated funds, makes reimbursement payments, on a pro-rata basis, to the Administrator for a portion of the fees associated with the Office of the Chief Compliance Officer. Such fees are included in Trustees’ and Chief Compliance Officer’s fees in the Statements of Operations.
The Trusts adopted a Trustee Deferred Compensation Plan (the “Plan”) which allows the Independent Trustees to defer the receipt of all or a portion of compensation related to performance of their duties as Trustees. The deferred fees are invested in various J.P. Morgan Funds until distribution in accordance with the Plan.
During the six months ended December 31, 2014, the Funds may have purchased securities from an underwriting syndicate in which the principal underwriter or members of the syndicate are affiliated with the Adviser.
The Funds may use related party broker-dealers. For the six months ended December 31, 2014, the Funds did not incur any brokerage commissions with broker-dealers affiliated with the Adviser.
The Securities and Exchange Commission (“SEC”) has granted an exemptive order permitting the Funds to engage in principal transactions with J.P. Morgan Securities, Inc., an affiliated broker, involving taxable money market instruments, subject to certain conditions.
4. Investment Transactions
During the six months ended December 31, 2014, purchases and sales of investments (excluding short-term investments) were as follows (amounts in thousands):
| | | | | | | | | | | | | | | | |
| | | Purchases
(excluding U.S. Government) | | | Sales (excluding U.S. Government) | | | Securities
Sold Short | | | Covers on
Securities
Sold Short | |
Growth Advantage Fund | | $ | 1,255,468 | | | $ | 953,897 | | | $ | — | | | $ | — | |
Mid Cap Equity Fund | | | 703,146 | | | | 512,731 | | | | — | | | | — | |
Mid Cap Growth Fund | | | 678,546 | | | | 551,646 | | | | — | | | | — | |
Mid Cap Value Fund | | | 1,550,189 | | | | 1,883,654 | | | | — | | | | — | |
Multi-Cap Market Neutral Fund | | | 157,178 | | | | 273,030 | | | | 188,296 | | | | 291,738 | |
Value Advantage Fund | | | 2,152,827 | | | | 705,819 | | | | — | | | | — | |
During the six months ended December 31, 2014, there were no purchases or sales of U.S. Government securities.
5. Federal Income Tax Matters
For Federal income tax purposes, the cost and unrealized appreciation (depreciation) in value of investment securities held at December 31, 2014 were as follows (amounts in thousands):
| | | | | | | | | | | | | | | | |
| | | Aggregate
Cost | | | Gross
Unrealized
Appreciation | | | Gross
Unrealized
Depreciation | | | Net
Unrealized
Appreciation
(Depreciation) | |
Growth Advantage Fund | | $ | 3,063,728 | | | $ | 1,147,279 | | | $ | 48,438 | | | $ | 1,098,841 | |
Mid Cap Equity Fund | | | 2,314,882 | | | | 775,491 | | | | 17,938 | | | | 757,553 | |
Mid Cap Growth Fund | | | 1,730,613 | | | | 692,528 | | | | 60,666 | | | | 631,862 | |
Mid Cap Value Fund | | | 10,444,022 | | | | 5,738,724 | | | | 123,914 | | | | 5,614,810 | |
Multi-Cap Market Neutral Fund | | | 255,487 | | | | 66,272 | | | | 3,557 | | | | 62,715 | |
Value Advantage Fund | | | 8,094,058 | | | | 1,792,991 | | | | 61,672 | | | | 1,731,319 | |
Under the Regulated Investment Company Modernization Act of 2010 (“the “Act”), net capital losses recognized by the Funds after June 30, 2011 are carried forward indefinitely, and retain their character as short-term and/or long-term losses. Prior to the Act, net capital losses incurred by the Funds were carried forward for eight years and treated as short-term losses. The Act requires that post-enactment net capital losses be used before pre-enactment net capital losses.
| | | | | | |
| | | |
| 78 | | | | J.P. MORGAN MID CAP/MULTI-CAP FUNDS | | DECEMBER 31, 2014 |
At June 30, 2014, the Funds did not have post-enactment capital loss carryforwards.
At June 30, 2014, the following Funds had pre-enactment net capital loss carryforwards, expiring during the years indicated, which are available to offset future realized gains (amounts in thousands):
| | | | | | | | | | | | | | | | |
| | | 2016 | | | 2017 | | | 2018 | | | Total | |
Mid Cap Growth Fund | | $ | — | | | $ | — | | | $ | 13,557 | * | | $ | 13,557 | * |
Mid Cap Value Fund | | | — | | | | — | | | | 34,731 | * | | | 34,731 | * |
Multi-Cap Market Neutral Fund | | | 29,615 | | | | — | | | | — | | | | 29,615 | |
| * | Amount includes capital loss carryforwards from business combinations, which are limited in future years under Internal Revenue Code Sections 381-384. |
6. Borrowings
The Funds rely upon an exemptive order granted by the SEC (the “Order”) permitting the establishment and operation of an Interfund Lending Facility (the “Facility”). The Facility allows the Funds to directly lend and borrow money to or from any other fund relying upon the Order at rates beneficial to both the borrowing and lending funds. Advances under the Facility are taken primarily for temporary or emergency purposes, including the meeting of redemption requests that otherwise might require the untimely disposition of securities, and are subject to each Fund’s borrowing restrictions. The Interfund loan rate is determined, as specified in the Order, by averaging the current repurchase agreement rate and the current bank loan rate. The Order was granted to JPM II and may be relied upon by the Funds because the Funds and the series of JPM II are all investment companies in the same “group of investment companies” (as defined in Section 12(d)(1)(G) of the 1940 Act).
In addition, the Trusts and JPMCB have entered into a financing arrangement. Under this arrangement, JPMCB provides an unsecured, uncommitted credit facility in the aggregate amount of $100 million to certain of the J.P. Morgan Funds, including the Funds. Advances under the arrangement are taken primarily for temporary or emergency purposes, including the meeting of redemption requests that otherwise might require the untimely disposition of securities, and are subject to each Fund’s borrowing restrictions. Interest on borrowings is payable at a rate determined by JPMCB at the time of borrowing. This agreement has been extended until November 9, 2015.
The Funds had no borrowings outstanding from another fund or from the unsecured, uncommitted credit facility at December 31, 2014. Average borrowings from the Facility for the six months ended December 31, 2014, were as follows (amounts in thousands):
| | | | | | | | | | | | | | | | |
| | | Average
Borrowings | | | Average Interest Rate Paid | | | Number
of Days
Outstanding | | | Interest
Paid | |
Multi-Cap Market Neutral Fund | | $ | 21,128 | | | | 0.21 | % | | | 4 | | | $ | — | (a) |
| (a) | Amount rounds to less than $1,000. |
Interest expense paid, if any, as a result of borrowings from another fund or from the unsecured, uncommitted credit facility is included in Interest expense to affiliates in the Statements of Operations.
7. Risks, Concentrations and Indemnifications
In the normal course of business, the Funds enter into contracts that contain a variety of representations which provide general indemnifications. Each Fund’s maximum exposure under these arrangements is unknown. The amount of exposure would depend on future claims that may be made against each Fund that have not yet occurred. However, based on experience, the Funds expect the risk of loss to be remote.
One or more affiliates of the Adviser have investment discretion with respect to their clients’ holdings in the Funds, which collectively represent a significant portion of the Funds’ assets for each of the Growth Advantage Fund, Mid Cap Equity Fund and Mid Cap Growth Fund.
In addition, as of December 31, 2014, the J.P. Morgan Investor Funds and JPMorgan SmartRetirement Funds, which are affiliated funds of funds, own in the aggregate, more than 10% of the net assets of the following Funds as follows:
| | | | | | | | |
| | | J.P. Morgan
Investor Funds | | | JPMorgan
SmartRetirement
Funds | |
Growth Advantage Fund | | | — | | | | 40.6 | % |
Mid Cap Equity Fund | | | — | | | | 30.0 | |
Multi-Cap Market Neutral Fund | | | 89.1 | % | | | — | |
Value Advantage Fund | | | — | | | | 16.7 | |
Additionally, Growth Advantage Fund, Mid Cap Equity Fund, Mid Cap Growth Fund, Mid Cap Value Fund and Value Advantage Fund each have one or more shareholders, each of which is an account maintained by a financial intermediary on behalf of its clients, that owns a significant portion of that Fund’s outstanding shares.
Significant shareholder transactions by these shareholders may impact the Funds’ performance.
| | | | | | | | |
| | | |
| DECEMBER 31, 2014 | | J.P. MORGAN MID CAP/MULTI-CAP FUNDS | | | | | 79 | |
NOTES TO FINANCIAL STATEMENTS
AS OF DECEMBER 31, 2014 (Unaudited) (continued)
As of December 31, 2014, the Multi-Cap Market Neutral Fund pledged substantially all of its assets for securities sold short to Citigroup Global Markets, Inc., who also held 100% of the Multi-Cap Market Neutral Fund’s cash proceeds for securities sold short.
8. Business Combinations
In November 2013, the Board of Trustees of JPM I approved management’s proposal to merge JPMorgan Mid Cap Core Fund (the “Target Fund”) into JPMorgan Mid Cap Equity Fund (the “Acquiring Fund”). The Agreement and Plan of Reorganization with respect to the Target Fund was approved by the Target Fund’s Board of Trustees on November 19-21, 2013. The purpose of the transaction was to combine two portfolios with comparable investment objectives and strategies. The reorganization was effective after the close of business on March 14, 2014. The Acquiring Fund acquired all of the assets and liabilities of the Target Fund as shown in the table below. The transaction was structured to qualify as a tax-free reorganization under the Code. Pursuant to the Agreement and Plan of Reorganization, shareholders of the Target Fund received a number of shares of the corresponding class in the Acquiring Fund, with a value equal to their holdings in the Target Fund as of the close of business on the date of the reorganization. The investment portfolio of the Target Fund, with a fair value of approximately $1,111,228,000 and identified cost of approximately $904,208,000 as of the date of the reorganization, was the principal asset acquired by the Acquiring Fund. For financial statement purposes, assets received and shares issued by the Acquiring Fund were recorded at fair value; however, the cost basis of the investments received from the Target Fund was carried forward to align ongoing reporting of the Acquiring Fund’s realized and unrealized gains and losses with amounts distributable to shareholders for tax purposes.
The following is a summary of Shares Outstanding, Net Assets, NAV and Net Unrealized Appreciation (Depreciation) immediately before and after the reorganization (amounts in thousands, except per share amounts):
| | | | | | | | | | | | | | | | |
| | | Shares
Outstanding | | | Net Assets | | | Net Asset
Value
Per Share | | | Net
Unrealized
Appreciation
(Depreciation) | |
Target Fund | | | | | | | | | | | | | | | | |
Mid Cap Core Fund | | | | | | | | | | | | | | $ | 207,020 | |
Class A | | | 1,967 | | | $ | 42,694 | | | $ | 21.70 | | | | | |
Class C | | | 77 | | | | 1,648 | | | | 21.48 | | | | | |
Class R2 | | | 29 | | | | 632 | | | | 21.60 | | | | | |
Class R5 | | | 4 | | | | 87 | | | | 21.87 | | | | | |
Class R6 | | | 30,932 | | | | 676,262 | | | | 21.86 | | | | | |
Select Class | | | 17,884 | | | | 390,167 | | | | 21.82 | | | | | |
Acquiring Fund | | | | | | | | | | | | | | | | |
Mid Cap Equity Fund | | | | | | | | | | | | | | | 407,160 | |
Class A | | | 1,999 | | | | 85,802 | | | | 42.92 | | | | | |
Class C | | | 386 | | | | 16,354 | | | | 42.32 | | | | | |
Select Class | | | 29,489 | | | | 1,272,165 | | | | 43.14 | | | | | |
| | | | | | | | | | | | | | | | |
| | | Shares
Outstanding | | | Net Assets | | | Net Asset
Value
Per Share | | | Net
Unrealized
Appreciation
(Depreciation) | |
Post Reorganization | | | | | | | | | | | | | | | | |
Mid Cap Equity Fund | | | | | | | | | | | | | | $ | 614,180 | |
Class A | | | 2,994 | | | $ | 128,496 | | | $ | 42.92 | | | | | |
Class C | | | 425 | | | | 18,002 | | | | 42.32 | | | | | |
Class R2 | | | 15 | | | | 632 | | | | 42.92 | | | | | |
Class R5 | | | 2 | | | | 87 | | | | 43.14 | | | | | |
Class R6 | | | 15,676 | | | | 676,262 | | | | 43.14 | | | | | |
Select Class | | | 38,533 | | | | 1,662,333 | | | | 43.14 | | | | | |
Expenses related to reorganization were incurred by the Acquiring Fund. The Adviser, the Administrator and the Distributor waived their fees and/or reimbursed the Fund in an amount sufficient to offset costs incurred by the Fund relating to the reorganization, excluding brokerage fees and brokerage expenses related to the disposition and acquisition of Fund assets associated with the reorganization.
Assuming the reorganization had been completed on July 1, 2013, the beginning of the annual reporting period, the pro forma results of operations for the year ended June 30, 2014, are as follows (amounts in thousands):
| | | | |
Net investment income (loss) | | $ | 7,170 | |
Net realized/unrealized gains (losses) | | | 555,924 | |
| | | | |
Change in net assets resulting from operations | | $ | 563,094 | |
| | | | |
Because the combined investment portfolios have been managed as a single integrated portfolio since the reorganization was completed, it is not practicable to separate the amounts of revenue and earnings of the Target Fund that have been included in the Statements of Operations since March 14, 2014.
| | | | | | |
| | | |
| 80 | | | | J.P. MORGAN MID CAP/MULTI-CAP FUNDS | | DECEMBER 31, 2014 |
SCHEDULE OF SHAREHOLDER EXPENSES
(Unaudited)
Hypothetical $1,000 Investment
As a shareholder of the Funds, you incur two types of costs: (1) transaction costs, including sales charges (loads) on purchase payments and (2) ongoing costs, including investment advisory fees, administration fees, distribution fees and other Fund expenses. The examples below are intended to help you understand your ongoing costs (in dollars) of investing in the Funds and to compare these ongoing costs with the ongoing costs of investing in other mutual funds. The examples assume that you had a $1,000 investment in each Class at the beginning of the reporting period, July 1, 2014, and continued to hold your shares at the end of the reporting period, December 31, 2014.
Actual Expenses
For each Class of each Fund in the table below, the first line provides information about actual account values and actual expenses. You may use the information in this line, together with the amount you invested, to estimate the expenses that you paid over the period. Simply divide your account value by $1,000 (for example, an $8,600 account value divided by $1,000 = 8.6), then multiply the result by the number in the first line of each Class under the heading entitled “Expenses Paid During the Period” to estimate the expenses you paid on your account during this period.
Hypothetical Example for Comparison Purposes
The second line of each Class in the table below provides information about hypothetical account values and hypothetical expenses based on the Class’ actual expense ratio and an assumed rate of return of 5% per year before expenses, which is not the Class’ actual return. The hypothetical account values and expenses may not be used to estimate the actual ending account balance or expenses you paid for the period. You may use this information to compare the ongoing costs of investing in the Class of the Fund and other funds. To do so, compare this 5% hypothetical example with the 5% hypothetical examples that appear in the shareholder reports of the other funds. Please note that the expenses shown in the table are meant to highlight your ongoing costs only and do not reflect any transaction costs, such as sales charges (loads) or redemption fees. Therefore, the second line for each Class in the table is useful in comparing ongoing costs only, and will not help you determine the relative total costs of owning different funds. In addition, if these transaction costs were included, your costs would have been higher. The examples also assume all dividends and distributions have been reinvested.
Expense Example
| | | | | | | | | | | | | | | | |
| | | Beginning
Account Value
July 1, 2014 | | | Ending
Account Value
December 31,
2014 | | | Expenses
Paid During
the Period* | | | Annualized
Expense
Ratio | |
Growth Advantage Fund | | | | | | | | | | | | | | | | |
Class A | | | | | | | | | | | | | | | | |
Actual | | $ | 1,000.00 | | | $ | 1,046.90 | | | $ | 6.45 | | | | 1.25 | % |
Hypothetical | | | 1,000.00 | | | | 1,018.90 | | | | 6.36 | | | | 1.25 | |
Class B | | | | | | | | | | | | | | | | |
Actual | | | 1,000.00 | | | | 1,043.80 | | | | 9.02 | | | | 1.75 | |
Hypothetical | | | 1,000.00 | | | | 1,016.38 | | | | 8.89 | | | | 1.75 | |
Class C | | | | | | | | | | | | | | | | |
Actual | | | 1,000.00 | | | | 1,043.70 | | | | 9.01 | | | | 1.75 | |
Hypothetical | | | 1,000.00 | | | | 1,016.38 | | | | 8.89 | | | | 1.75 | |
Class R5 | | | | | | | | | | | | | | | | |
Actual | | | 1,000.00 | | | | 1,049.10 | | | | 4.39 | | | | 0.85 | |
Hypothetical | | | 1,000.00 | | | | 1,020.92 | | | | 4.33 | | | | 0.85 | |
Class R6 | | | | | | | | | | | | | | | | |
Actual | | | 1,000.00 | | | | 1,049.60 | | | | 3.98 | | | | 0.77 | |
Hypothetical | | | 1,000.00 | | | | 1,021.32 | | | | 3.92 | | | | 0.77 | |
Select Class | | | | | | | | | | | | | | | | |
Actual | | | 1,000.00 | | | | 1,047.40 | | | | 5.47 | | | | 1.06 | |
Hypothetical | | | 1,000.00 | | | | 1,019.86 | | | | 5.40 | | | | 1.06 | |
| | | | |
Mid Cap Equity Fund | | | | | | | | | | | | | | | | |
Class A | | | | | | | | | | | | | | | | |
Actual | | | 1,000.00 | | | | 1,040.40 | | | | 6.38 | | | | 1.24 | |
Hypothetical | | | 1,000.00 | | | | 1,018.95 | | | | 6.31 | | | | 1.24 | |
Class C | | | | | | | | | | | | | | | | |
Actual | | | 1,000.00 | | | | 1,037.70 | | | | 8.94 | | | | 1.74 | |
Hypothetical | | | 1,000.00 | | | | 1,016.43 | | | | 8.84 | | | | 1.74 | |
| | | | | | | | |
| | | |
| DECEMBER 31, 2014 | | J.P. MORGAN MID CAP/MULTI-CAP FUNDS | | | | | 81 | |
SCHEDULE OF SHAREHOLDER EXPENSES
(Unaudited) (continued)
Hypothetical $1,000 Investment
| | | | | | | | | | | | | | | | |
| | | Beginning
Account Value
July 1, 2014 | | | Ending
Account Value
December 31,
2014 | | | Expenses
Paid During
the Period* | | | Annualized
Expense
Ratio | |
Mid Cap Equity Fund (continued) | | | | | | | | | | | | | | | | |
Class R2 | | | | | | | | | | | | | | | | |
Actual | | $ | 1,000.00 | | | $ | 1,039.20 | | | $ | 7.66 | | | | 1.49 | % |
Hypothetical | | | 1,000.00 | | | | 1,017.69 | | | | 7.58 | | | | 1.49 | |
Class R5 | | | | | | | | | | | | | | | | |
Actual | | | 1,000.00 | | | | 1,042.70 | | | | 4.07 | | | | 0.79 | |
Hypothetical | | | 1,000.00 | | | | 1,021.22 | | | | 4.02 | | | | 0.79 | |
Class R6 | | | | | | | | | | | | | | | | |
Actual | | | 1,000.00 | | | | 1,042.90 | | | | 3.81 | | | | 0.74 | |
Hypothetical | | | 1,000.00 | | | | 1,021.48 | | | | 3.77 | | | | 0.74 | |
Select Class | | | | | | | | | | | | | | | | |
Actual | | | 1,000.00 | | | | 1,042.20 | | | | 4.58 | | | | 0.89 | |
Hypothetical | | | 1,000.00 | | | | 1,020.72 | | | | 4.53 | | | | 0.89 | |
| | | | |
Mid Cap Growth Fund | | | | | | | | | | | | | | | | |
Class A | | | | | | | | | | | | | | | | |
Actual | | | 1,000.00 | | | | 1,019.50 | | | | 6.31 | | | | 1.24 | |
Hypothetical | | | 1,000.00 | | | | 1,018.95 | | | | 6.31 | | | | 1.24 | |
Class B | | | | | | | | | | | | | | | | |
Actual | | | 1,000.00 | | | | 1,017.30 | | | | 8.85 | | | | 1.74 | |
Hypothetical | | | 1,000.00 | | | | 1,016.43 | | | | 8.84 | | | | 1.74 | |
Class C | | | | | | | | | | | | | | | | |
Actual | | | 1,000.00 | | | | 1,016.90 | | | | 8.85 | | | | 1.74 | |
Hypothetical | | | 1,000.00 | | | | 1,016.43 | | | | 8.84 | | | | 1.74 | |
Class R2 | | | | | | | | | | | | | | | | |
Actual | | | 1,000.00 | | | | 1,018.80 | | | | 7.12 | | | | 1.40 | |
Hypothetical | | | 1,000.00 | | | | 1,018.15 | | | | 7.12 | | | | 1.40 | |
Class R5 | | | | | | | | | | | | | | | | |
Actual | | | 1,000.00 | | | | 1,021.80 | | | | 4.03 | | | | 0.79 | |
Hypothetical | | | 1,000.00 | | | | 1,021.22 | | | | 4.02 | | | | 0.79 | |
Class R6 | | | | | | | | | | | | | | | | |
Actual | | | 1,000.00 | | | | 1,022.10 | | | | 3.77 | | | | 0.74 | |
Hypothetical | | | 1,000.00 | | | | 1,021.48 | | | | 3.77 | | | | 0.74 | |
Select Class | | | | | | | | | | | | | | | | |
Actual | | | 1,000.00 | | | | 1,020.90 | | | | 4.74 | | | | 0.93 | |
Hypothetical | | | 1,000.00 | | | | 1,020.52 | | | | 4.74 | | | | 0.93 | |
| | | | |
Mid Cap Value Fund | | | | | | | | | | | | | | | | |
Class A | | | | | | | | | | | | | | | | |
Actual | | | 1,000.00 | | | | 1,062.00 | | | | 6.39 | | | | 1.23 | |
Hypothetical | | | 1,000.00 | | | | 1,019.00 | | | | 6.26 | | | | 1.23 | |
Class B | | | | | | | | | | | | | | | | |
Actual | | | 1,000.00 | | | | 1,059.10 | | | | 9.03 | | | | 1.74 | |
Hypothetical | | | 1,000.00 | | | | 1,016.43 | | | | 8.84 | | | | 1.74 | |
Class C | | | | | | | | | | | | | | | | |
Actual | | | 1,000.00 | | | | 1,059.20 | | | | 9.03 | | | | 1.74 | |
Hypothetical | | | 1,000.00 | | | | 1,016.43 | | | | 8.84 | | | | 1.74 | |
Class R2 | | | | | | | | | | | | | | | | |
Actual | | | 1,000.00 | | | | 1,060.60 | | | | 7.74 | | | | 1.49 | |
Hypothetical | | | 1,000.00 | | | | 1,017.69 | | | | 7.58 | | | | 1.49 | |
Institutional Class | | | | | | | | | | | | | | | | |
Actual | | | 1,000.00 | | | | 1,064.50 | | | | 3.85 | | | | 0.74 | |
Hypothetical | | | 1,000.00 | | | | 1,021.48 | | | | 3.77 | | | | 0.74 | |
Select Class | | | | | | | | | | | | | | | | |
Actual | | | 1,000.00 | | | | 1,063.00 | | | | 5.10 | | | | 0.98 | |
Hypothetical | | | 1,000.00 | | | | 1,020.27 | | | | 4.99 | | | | 0.98 | |
| | | | | | |
| | | |
| 82 | | | | J.P. MORGAN MID CAP/MULTI-CAP FUNDS | | DECEMBER 31, 2014 |
| | | | | | | | | | | | | | | | |
| | | Beginning
Account Value
July 1, 2014 | | | Ending
Account Value
December 31,
2014 | | | Expenses
Paid During
the Period* | | | Annualized
Expense
Ratio | |
Multi-Cap Market Neutral Fund | | | | | | | | | | | | | | | | |
Class A | | | | | | | | | | | | | | | | |
Actual | | $ | 1,000.00 | | | $ | 1,016.10 | | | $ | 13.92 | | | | 2.74 | % |
Hypothetical | | | 1,000.00 | | | | 1,011.39 | | | | 13.89 | | | | 2.74 | |
Class B | | | | | | | | | | | | | | | | |
Actual | | | 1,000.00 | | | | 1,013.80 | | | | 16.45 | | | | 3.24 | |
Hypothetical | | | 1,000.00 | | | | 1,008.87 | | | | 16.41 | | | | 3.24 | |
Class C | | | | | | | | | | | | | | | | |
Actual | | | 1,000.00 | | | | 1,013.80 | | | | 16.40 | | | | 3.23 | |
Hypothetical | | | 1,000.00 | | | | 1,008.92 | | | | 16.36 | | | | 3.23 | |
Select Class | | | | | | | | | | | | | | | | |
Actual | | | 1,000.00 | | | | 1,017.80 | | | | 12.61 | | | | 2.48 | |
Hypothetical | | | 1,000.00 | | | | 1,012.70 | | | | 12.58 | | | | 2.48 | |
| | | | |
Value Advantage Fund | | | | | | | | | | | | | | | | |
Class A | | | | | | | | | | | | | | | | |
Actual | | | 1,000.00 | | | | 1,051.80 | | | | 6.41 | | | | 1.24 | |
Hypothetical | | | 1,000.00 | | | | 1,018.95 | | | | 6.31 | | | | 1.24 | |
Class C | | | | | | | | | | | | | | | | |
Actual | | | 1,000.00 | | | | 1,049.10 | | | | 8.99 | | | | 1.74 | |
Hypothetical | | | 1,000.00 | | | | 1,016.43 | | | | 8.84 | | | | 1.74 | |
Institutional Class | | | | | | | | | | | | | | | | |
Actual | | | 1,000.00 | | | | 1,054.80 | | | | 3.83 | | | | 0.74 | |
Hypothetical | | | 1,000.00 | | | | 1,021.48 | | | | 3.77 | | | | 0.74 | |
Select Class | | | | | | | | | | | | | | | | |
Actual | | | 1,000.00 | | | | 1,053.10 | | | | 5.12 | | | | 0.99 | |
Hypothetical | | | 1,000.00 | | | | 1,020.21 | | | | 5.04 | | | | 0.99 | |
| * | Expenses are equal to each Class’ respective annualized expense ratio, multiplied by the average account value over the period, multiplied by 184/365 (to reflect the one-half year period). |
| | | | | | | | |
| | | |
| DECEMBER 31, 2014 | | J.P. MORGAN MID CAP/MULTI-CAP FUNDS | | | | | 83 | |
SPECIAL SHAREHOLDER MEETING RESULTS
(Unaudited)
JPM Trust I
JPM I held a special meeting of shareholders on June 10, 2014, for the purpose of considering and voting upon the election of Trustees.
Trustees were elected by the shareholders of all of the series of JPM I, including Mid Cap Equity Fund and Value Advantage Fund. The results of the voting were as follows:
| | | | |
| | | Votes Received
(Amounts in
thousands) | |
| John F. Finn | | | | |
In Favor | | | 172,130,223 | |
Withheld | | | 1,157,495 | |
| |
| Dr. Matthew Goldstein | | | | |
In Favor | | | 172,109,164 | |
Withheld | | | 1,178,553 | |
| |
| Robert J. Higgins | | | | |
In Favor | | | 158,338,954 | |
Withheld | | | 14,948,763 | |
| |
| Frankie D. Hughes | | | | |
In Favor | | | 172,148,985 | |
Withheld | | | 1,138,733 | |
| |
| Peter C. Marshall | | | | |
In Favor | | | 172,124,473 | |
Withheld | | | 1,163,244 | |
| |
| Mary E. Martinez | | | | |
In Favor | | | 172,132,763 | |
Withheld | | | 1,154,954 | |
| |
| Marilyn McCoy | | | | |
In Favor | | | 172,123,615 | |
Withheld | | | 1,164,102 | |
| | | | |
| | | Votes Received
(Amounts in
thousands) | |
| Mitchell M. Merin | | | | |
In Favor | | | 172,132,812 | |
Withheld | | | 1,154,905 | |
| |
| William G. Morton, Jr. | | | | |
In Favor | | | 172,111,749 | |
Withheld | | | 1,175,968 | |
| |
| Robert A. Oden, Jr. | | | | |
In Favor | | | 172,098,600 | |
Withheld | | | 1,189,117 | |
| |
| Marian U. Pardo | | | | |
In Favor | | | 172,162,159 | |
Withheld | | | 1,125,559 | |
| |
| Frederick W. Ruebeck | | | | |
In Favor | | | 172,051,301 | |
Withheld | | | 1,236,416 | |
| |
| James J. Schonbachler | | | | |
In Favor | | | 172,078,691 | |
Withheld | | | 1,209,026 | |
| | | | | | |
| | | |
| 84 | | | | J.P. MORGAN MID CAP/MULTI-CAP FUNDS | | DECEMBER 31, 2014 |
J.P. Morgan Fleming Mutual Fund Group, Inc.
JPMFMFG held a special meeting of shareholders on June 10, 2014, for the purpose of considering and voting upon the election of Trustees.
Trustees were elected by the shareholders of all of the series of JPMFMFG, including Mid Cap Value Fund. The results of the voting were as follows:
| | | | |
| | | Votes Received
(Amounts in
thousands) | |
| John F. Finn | | | | |
In Favor | | | 248,045 | |
Withheld | | | 2,166 | |
| |
| Dr. Matthew Goldstein | | | | |
In Favor | | | 247,867 | |
Withheld | | | 2,343 | |
| |
| Robert J. Higgins | | | | |
In Favor | | | 193,893 | |
Withheld | | | 56,317 | |
| |
| Frankie D. Hughes | | | | |
In Favor | | | 247,973 | |
Withheld | | | 2,237 | |
| |
| Peter C. Marshall | | | | |
In Favor | | | 247,787 | |
Withheld | | | 2,423 | |
| |
| Mary E. Martinez | | | | |
In Favor | | | 247,969 | |
Withheld | | | 2,241 | |
| |
| Marilyn McCoy | | | | |
In Favor | | | 248,057 | |
Withheld | | | 2,153 | |
| | | | |
| | | Votes Received
(Amounts in
thousands) | |
| Mitchell M. Merin | | | | |
In Favor | | | 248,056 | |
Withheld | | | 2,154 | |
| |
| William G. Morton, Jr. | | | | |
In Favor | | | 247,904 | |
Withheld | | | 2,306 | |
| |
| Robert A. Oden, Jr. | | | | |
In Favor | | | 247,855 | |
Withheld | | | 2,355 | |
| |
| Marian U. Pardo | | | | |
In Favor | | | 248,110 | |
Withheld | | | 2,101 | |
| |
| Frederick W. Ruebeck | | | | |
In Favor | | | 247,773 | |
Withheld | | | 2,437 | |
| |
| James J. Schonbachler | | | | |
In Favor | | | 247,959 | |
Withheld | | | 2,251 | |
| | | | | | | | |
| | | |
| DECEMBER 31, 2014 | | J.P. MORGAN MID CAP/MULTI-CAP FUNDS | | | | | 85 | |
SPECIAL SHAREHOLDER MEETING RESULTS
(Unaudited) (continued)
J.P. Morgan Mutual Fund Investment Trust
JPMMFIT held a special meeting of shareholders on June 10, 2014, for the purpose of considering and voting upon the election of Trustees.
Trustees were elected by the shareholders of all of the series of JPMMFIT, including Growth Advantage Fund. The results of the voting were as follows:
| | | | |
| | | Votes Received
(Amounts in
thousands) | |
| John F. Finn | | | | |
In Favor | | | 215,054 | |
Withheld | | | 617 | |
| |
| Dr. Matthew Goldstein | | | | |
In Favor | | | 215,008 | |
Withheld | | | 662 | |
| |
| Robert J. Higgins | | | | |
In Favor | | | 208,280 | |
Withheld | | | 7,391 | |
| |
| Frankie D. Hughes | | | | |
In Favor | | | 215,086 | |
Withheld | | | 584 | |
| |
| Peter C. Marshall | | | | |
In Favor | | | 215,045 | |
Withheld | | | 625 | |
| |
| Mary E. Martinez | | | | |
In Favor | | | 215,037 | |
Withheld | | | 633 | |
| |
| Marilyn McCoy | | | | |
In Favor | | | 215,057 | |
Withheld | | | 614 | |
| | | | |
| | | Votes Received
(Amounts in
thousands) | |
| Mitchell M. Merin | | | | |
In Favor | | | 215,054 | |
Withheld | | | 616 | |
| |
| William G. Morton, Jr. | | | | |
In Favor | | | 215,030 | |
Withheld | | | 640 | |
| |
| Robert A. Oden, Jr. | | | | |
In Favor | | | 215,047 | |
Withheld | | | 623 | |
| |
| Marian U. Pardo | | | | |
In Favor | | | 215,021 | |
Withheld | | | 649 | |
| |
| Frederick W. Ruebeck | | | | |
In Favor | | | 215,049 | |
Withheld | | | 621 | |
| |
| James J. Schonbachler | | | | |
In Favor | | | 215,049 | |
Withheld | | | 622 | |
| | | | | | |
| | | |
| 86 | | | | J.P. MORGAN MID CAP/MULTI-CAP FUNDS | | DECEMBER 31, 2014 |
JPM Trust II
JPM II held a special meeting of shareholders on June 10, 2014, for the purpose of considering and voting upon the following proposals.
Proposal 1: Election of Trustees
Trustees were elected by the shareholders of all of the series of the JPM II, including Mid Cap Growth Fund and Multi-Cap Market Neutral Fund. The results of the voting were as follows:
| | | | |
| | | Votes Received
(Amounts in
thousands) | |
| John F. Finn | | | | |
In Favor | | | 132,674,822 | |
Withheld | | | 508,692 | |
| |
| Dr. Matthew Goldstein | | | | |
In Favor | | | 132,670,672 | |
Withheld | | | 512,842 | |
| |
| Robert J. Higgins | | | | |
In Favor | | | 124,038,998 | |
Withheld | | | 9,144,516 | |
| |
| Frankie D. Hughes | | | | |
In Favor | | | 132,681,734 | |
Withheld | | | 501,780 | |
| |
| Peter C. Marshall | | | | |
In Favor | | | 132,663,579 | |
Withheld | | | 519,935 | |
| |
| Mary E. Martinez | | | | |
In Favor | | | 132,682,318 | |
Withheld | | | 501,196 | |
| |
| Marilyn McCoy | | | | |
In Favor | | | 132,681,993 | |
Withheld | | | 501,520 | |
| | | | |
| | | Votes Received
(Amounts in
thousands) | |
| Mitchell M. Merin | | | | |
In Favor | | | 132,664,715 | |
Withheld | | | 518,799 | |
| |
| William G. Morton, Jr. | | | | |
In Favor | | | 132,650,698 | |
Withheld | | | 532,816 | |
| Robert A. Oden, Jr. | | | | |
In Favor | | | 132,664,727 | |
Withheld | | | 518,788 | |
| |
| Marian U. Pardo | | | | |
In Favor | | | 132,690,792 | |
Withheld | | | 492,722 | |
| |
| Frederick W. Ruebeck | | | | |
In Favor | | | 132,644,244 | |
Withheld | | | 539,269 | |
| |
| James J. Schonbachler | | | | |
In Favor | | | 132,671,281 | |
Withheld | | | 512,233 | |
Proposal 2: To approve the replacement of the fundamental investment objective for the Mid Cap Growth Fund with a new fundamental investment objective. The special meeting was adjourned because the proposal did not receive enough shareholder votes to pass.
The results of the voting were as follows:
| | | | |
| | | Votes Received
(Amounts in
thousands) | |
For | | | 13,083 | |
Against | | | 326 | |
Abstain | | | 229 | |
Broker Non Votes | | | 15,311 | |
The new fundamental investment objective was approved by shareholders of the Fund when the special meeting reconvened on July 23, 2014.
The results of the voting were as follows:
| | | | |
| | | Votes Received
(Amounts in
thousands) | |
For | | | 39,826 | |
Against | | | 593 | |
Abstain | | | 529 | |
Broker Non Votes | | | 12,639 | |
| | | | | | | | |
| | | |
| DECEMBER 31, 2014 | | J.P. MORGAN MID CAP/MULTI-CAP FUNDS | | | | | 87 | |
BOARD APPROVAL OF INVESTMENT ADVISORY AGREEMENTS
(Unaudited)
The Board of Trustees has established various standing committees, composed of Trustees with diverse backgrounds, to which the Board of Trustees has assigned specific subject matter responsibilities to further enhance the effectiveness of the Board’s oversight and decision making. The Board of Trustees and its investment committees (money market and alternative products, equity, and fixed income) meet regularly throughout the year and consider factors that are relevant to their annual consideration of investment advisory agreements at each meeting. They also meet for the specific purpose of considering investment advisory agreement annual renewals. The Board of Trustees held meetings in person in June and August 2014, at which the Trustees considered the continuation of the investment advisory agreements for each of the Funds whose semi-annual report is contained herein (each an “Advisory Agreement” and collectively, the “Advisory Agreements”). At the June meeting, the Board’s investment committees met to review and consider performance, expense and related information for the J.P. Morgan Funds. Each investment committee reported to the full Board, which then considered the investment committee’s preliminary findings. At the August meeting, the Trustees continued their review and consideration. The Trustees, including a majority of the Trustees who are not “interested persons” (as defined in the 1940 Act) of any party to the Advisory Agreements or any of their affiliates, approved the continuation of each Advisory Agreement on August 20, 2014.
As part of their review of the Advisory Agreements, the Trustees considered and reviewed performance and other information about the Funds received from the Adviser. This information includes the Funds’ performance as compared to the performance of their peers and benchmarks and analyses by the Adviser of the Funds’ performance. In addition, the Trustees have engaged an independent management consulting firm (“independent consultant”) to report on the performance of certain J.P. Morgan Funds at each of the Trustees’ regular meetings. The Adviser also periodically provides comparative information regarding the Funds’ expense ratios and those of their peer groups. In addition, in preparation for the June and August meetings, the Trustees requested, received and evaluated extensive materials from the Adviser, including, performance and expense information compiled by Lipper Inc. (“Lipper”), an independent provider of investment company data. The Trustees’ independent consultant also provided additional analyses of the performance of the Funds in connection with the Trustees’ review of the Advisory Agreements. Before voting on the proposed Advisory Agreements, the Trustees reviewed the proposed Advisory Agreements with representatives of the Adviser, counsel to the Trusts and independent legal counsel and received a memorandum from independent legal counsel to the Trustees discussing the legal standards for their consideration of the proposed Advisory Agreements. The Trustees also discussed the proposed Advisory Agreements in
executive session with independent legal counsel at which no representatives of the Adviser were present. Set forth below is a summary of the material factors evaluated by the Trustees in determining whether to approve each Advisory Agreement.
The Trustees considered information provided with respect to the Funds over the course of the year. Each Trustee attributed different weights to the various factors, and no factor alone was considered determinative. From year to year, the Trustees consider and place emphasis on relevant information in light of changing circumstances in market and economic conditions. The Trustees determined that the compensation to be received by the Adviser from each Fund under the applicable Advisory Agreement was fair and reasonable and that the continuance of each Advisory Agreement was in the best interests of each Fund and its shareholders.
The factors summarized below were considered and discussed by the Trustees in reaching their conclusions:
Nature, Extent and Quality of Services Provided by the Adviser
The Trustees received and considered information regarding the nature, extent and quality of the services provided to each Fund under the Advisory Agreement. The Trustees took into account information furnished throughout the year at Trustee meetings, as well as the materials furnished specifically in connection with this annual review process. The Trustees considered the background and experience of the Adviser’s senior management and the expertise of, and the amount of attention given to each Fund by, investment personnel of the Adviser. In addition, the Trustees reviewed the qualifications, backgrounds and responsibilities of the portfolio management team primarily responsible for the day-to-day management of each Fund and the infrastructure supporting the team. The Trustees also considered information provided by the Adviser and JPMorgan Distribution Services, Inc. (“JPMDS”) about the structure and distribution strategy of each Fund. The Trustees reviewed information relating to the Adviser’s risk governance model and reports showing the Adviser’s compliance structure and ongoing compliance processes. The Trustees also considered the quality of the administrative services provided by JPMorgan Funds Management, Inc. (“JPMFM”), an affiliate of the Adviser.
The Trustees also considered their knowledge of the nature and quality of the services provided by the Adviser and its affiliates to the Funds gained from their experience as Trustees of the J.P. Morgan Funds. In addition, they considered the overall reputation and capabilities of the Adviser and its affiliates, the commitment of the Adviser to provide high quality service to the Funds, their overall confidence in the Adviser’s integrity and the Adviser’s responsiveness to questions or concerns raised by them, including the Adviser’s willingness to consider and implement organizational and operational changes designed to improve investment results and the services provided to each Fund.
| | | | | | |
| | | |
| 88 | | | | J.P. MORGAN MID CAP/MULTI-CAP FUNDS | | DECEMBER 31, 2014 |
Based upon these considerations and other factors, the Trustees concluded that they were satisfied with the nature, extent and quality of the investment advisory services provided to the Funds by the Adviser.
Costs of Services Provided and Profitability to the Adviser and its Affiliates
The Trustees received and considered information regarding the profitability to the Adviser and its affiliates in providing services to each of the Funds. The Trustees reviewed and discussed this data. The Trustees recognized that this data is not audited and represents the Adviser’s determination of its and its affiliates’ revenues from the contractual services provided to the Funds, less expenses of providing such services. Expenses include direct and indirect costs and are calculated using an allocation methodology developed by the Adviser. The Trustees also recognized that it is difficult to make comparisons of profitability from fund investment advisory contracts because comparative information is not generally publicly available and is affected by numerous factors, including the structure of the particular adviser, the types of funds it manages, its business mix, numerous assumptions regarding allocations and the fact that publicly-traded fund managers’ operating profits and net income are net of distribution and marketing expenses. Based on their review, the Trustees concluded that the profitability to the Adviser under each of the Advisory Agreements was not unreasonable in light of the services and benefits provided to each Fund.
Fall-Out Benefits
The Trustees reviewed information regarding potential “fallout” or ancillary benefits received by the Adviser and its affiliates as a result of their relationship with the Funds. The Trustees also reviewed the Adviser’s allocation of fund brokerage for the J.P. Morgan Funds complex, including allocations to brokers who provide research to the Adviser.
The Trustees also considered that JPMFM and JPMDS, affiliates of the Adviser, earn fees from the Funds for providing administrative and shareholder services. These fees were shown separately in the profitability analysis presented to the Trustees. The Trustees also considered the payments of Rule 12b-1 fees to JPMDS, which also acts as the Funds’ distributor and that these fees are in turn generally paid to financial intermediaries that sell the Funds, including financial intermediaries that are affiliates of the Adviser. The Trustees also considered the fees paid to JPMorgan Chase Bank, N.A. (“JPMCB”) for custody and fund accounting, and other related services.
Economies of Scale
The Trustees considered the extent to which the Funds benefit from economies of scale. The Trustees noted that the proposed investment advisory fee schedule for each Fund does not
contain breakpoints, but that the fee schedule for the
administrative services provided by JPMFM does include a fee breakpoint, which is tied to the overall level of non-money market fund assets excluding certain funds-of-funds, as applicable, advised by the Adviser, and that the Funds benefit from that breakpoint. The Trustees also noted that the Adviser and its affiliates have implemented fee waivers and expense limitations. The Trustees considered whether it would be appropriate to add advisory fee breakpoints, and the Trustees concluded that the current fee structure was reasonable in light of the fee waivers and expense limitations that the Adviser and its affiliates have in place that serve to limit the overall net expense ratios of the Fund at competitive levels. The Trustees concluded that shareholders of the Funds effectively participated in the economies of scale through these fee waivers and expense limitations and administrative service fee breakpoints.
Independent Written Evaluation of the Funds’ Senior/Chief Compliance Officer
The Trustees noted that, upon their direction, the Senior Officer for the Mid Cap Growth Fund, Mid Cap Value Fund and Multi-Cap Market Neutral Fund had prepared an independent written evaluation in order to assist the Trustees in determining the reasonableness of the proposed management fees. In determining whether to continue the Advisory Agreements, the Trustees considered the Senior Officer’s report.
The Trustees noted that, upon their direction, the Chief Compliance Officer for the Growth Advantage Fund, Mid Cap Equity Fund, and Value Advantage Fund had prepared an independent written evaluation in order to assist the Trustees in determining the reasonableness of the proposed management fees. The Trustees considered the written evaluation in determining whether to continue the Advisory Agreements.
Fees Relative to Adviser’s Other Clients
The Trustees received and considered information about the nature and extent of investment advisory services and fee rates offered to other clients of the Adviser for investment management styles substantially similar to that of each Fund. The Trustees also considered the complexity of investment management for the Funds relative to the Adviser’s other clients and the differences in the nature and extent of the services provided to the different clients. The Trustees concluded that the fee rates charged to each Fund in comparison to those charged to the Adviser’s other clients were reasonable.
Investment Performance
The Trustees received and considered absolute and/or relative performance for the Funds in a report prepared by Lipper. The Trustees considered the total return performance information, which included the ranking of the Funds within a performance universe made up of funds with the same Lipper investment
| | | | | | | | |
| | | |
| DECEMBER 31, 2014 | | J.P. MORGAN MID CAP/MULTI-CAP FUNDS | | | | | 89 | |
BOARD APPROVAL OF INVESTMENT ADVISORY AGREEMENTS
(Unaudited) (continued)
classification and objective (the “Universe Group”) by total return for applicable one-, three- and five-year periods. The Trustees reviewed a description of Lipper’s methodology for selecting mutual funds in each Fund’s Universe Group. The Lipper materials provided to the Trustees highlighted information with respect to certain representative classes to assist the Trustees in their review. As part of this review, the Trustees also reviewed each Fund’s performance against its benchmark and considered the performance information provided for the Funds at regular Board meetings by the Adviser and the Trustees’ independent consultant and also considered the special analysis prepared by the Trustees’ independent consultant. The Lipper performance data noted by the Trustees as part of their review and the determinations made by the Trustees with respect to each Fund’s performance for certain representative classes are summarized below:
The Trustees noted that the Growth Advantage Fund’s performance was in the first, first, and second quintiles for both Class A and Select Class shares for the one-, three- and five year periods ended December 31, 2013, respectively, and that the Trustees’ independent consultant indicated that the Fund’s overall performance was attractive. The Trustees discussed the performance and investment strategy of the Fund with the Adviser and, based upon this discussion and various other factors, concluded that the performance was reasonable.
The Trustees noted that the Mid Cap Equity Fund’s performance was in the third and first quintiles for Class A shares for the one- and three year periods ended December 31, 2013, respectively and in the second, first and third quintiles for Select Class shares for the one-, three-, and five-year periods ended December 31, 2013, respectively and that the Trustees’ independent consultant indicated that overall performance was attractive. The Trustees discussed the performance and investment strategy of the Fund with the Adviser and, based upon this discussion and various other factors, concluded that the performance was reasonable.
The Trustees noted that the Mid Cap Growth Fund’s performance was in the first, second and second quintiles for both Class A and Select Class shares for the one-, three-, and five-year periods ended December 31, 2013, respectively, and that the Trustees’ independent consultant indicated that overall performance was satisfactory. The Trustees discussed the performance and investment strategy of the Fund with the Adviser and, based upon this discussion and various other factors, concluded that the performance was reasonable.
The Trustees noted that the Mid Cap Value Fund’s performance was in the fourth, first, and second quintiles for Class A shares and in the fourth, first, and first quintiles for Select Class shares for the one-, three-, and five-year periods ended December 31, 2013, respectively and that the Trustees’ independent consultant indicated that the Fund’s overall performance was
attractive. The Trustees discussed the performance and investment strategy of the Fund with the Adviser and, based upon this discussion and various other factors, concluded that they were satisfied with the Adviser’s analysis of the Fund’s performance.
The Trustees noted that the Multi-Cap Market Neutral Fund’s performance was in the second, third and fourth quintiles for both Class A and Select Class shares for the one-, three-, and five-year periods ended December 31, 2013, respectively, and that the Trustees’ independent consultant indicated that the overall performance was satisfactory. The Trustees discussed the performance and investment strategy of the Fund with the Adviser and, based upon this discussion and various other factors, concluded that they were satisfied with the Adviser’s analysis of the Fund’s performance.
The Trustees noted that the Value Advantage Fund’s performance was in the fourth, second, and second quintiles for Class A shares and in the third, first, and first quintiles for Select Class shares for the one-, three-, and five-year periods ended December 31, 2013, respectively and that the Trustees’ independent consultant indicated that overall performance was attractive. The Trustees discussed the performance and investment strategy of the Fund with the Adviser and, based upon this discussion and various other factors, concluded that they were satisfied with the Adviser’s analysis of the Fund’s performance.
Advisory Fees and Expense Ratios
The Trustees considered the contractual advisory fee rate paid by each Fund to the Adviser and compared that rate to the information prepared by Lipper concerning management fee rates paid by other funds in the same Lipper category as each Fund. The Trustees recognized that Lipper reported each Fund’s management fee rate as the combined contractual advisory fee and administration fee rates. The Trustees also reviewed information about other expenses and the expense ratios for each Fund. The Trustees considered the fee waiver and/or expense reimbursement arrangements currently in place for each Fund and considered the net advisory fee rate after taking into account any waivers and/or reimbursements. The Trustees recognized that it is difficult to make comparisons of advisory fees because there are variations in the services that are included in the fees paid by other funds. The Trustees’ determinations as a result of the review of each Fund’s advisory fees and expense ratios for certain representative classes are summarized below:
The Trustees noted that the Growth Advantage Fund’s net advisory fee and actual total expenses for both Class A and Select Class shares were in the third and fourth quintiles, respectively, of the Universe Group After considering the factors identified above, in light of this information, the Trustees concluded that the advisory fees were reasonable.
| | | | | | |
| | | |
| 90 | | | | J.P. MORGAN MID CAP/MULTI-CAP FUNDS | | DECEMBER 31, 2014 |
The Trustees noted that the Mid Cap Equity Fund’s net advisory fee for Class A and Select Class shares was in the first and second quintiles, respectively, and that the actual total expenses for both Class A and Select Class shares were in the second quintile of the Universe Group. After considering the factors identified above, in light of this information, the Trustees concluded that the advisory fees were reasonable.
The Trustees noted that the Mid Cap Growth Fund’s net advisory fee for both Class A and Select Class shares was in the first quintile, and that the actual total expenses for both Class A and Select Class shares were in the second quintile of the Universe Group. After considering the factors identified above, in light of this information, the Trustees concluded that the advisory fee was reasonable.
The Trustees noted that the Mid Cap Value Fund’s net advisory fee and actual total expenses for both Class A and Select Class shares were in the third quintile of the Universe Group. After
considering the factors identified above, in light of this information, the Trustees concluded that the advisory fees were reasonable.
The Trustees noted that the Multi-Cap Market Neutral Fund’s net advisory fee for both Class A and Select Class shares was in the fourth quintile, and that the actual total expenses for Class A and Select Class shares were in the second and third quintile of their Universe Group. After considering the factors identified above, in light of this information, the Trustees concluded that the advisory fee was reasonable.
The Trustees noted that the Value Advantage Fund’s net advisory fee for Class A and Select Class shares was in the third and second quintiles, respectively, and that the actual total expenses for both Class A and Select Class shares were in the third quintile of their Universe Group. After considering the factors identified above, in light of this information, the Trustees concluded that the advisory fees were reasonable.
| | | | | | | | |
| | | |
| DECEMBER 31, 2014 | | J.P. MORGAN MID CAP/MULTI-CAP FUNDS | | | | | 91 | |
J.P. Morgan Funds are distributed by JPMorgan Distribution Services, Inc., which is an affiliate of JPMorgan Chase & Co. Affiliates of JPMorgan Chase & Co. receive fees for providing various services to the funds.
Contact JPMorgan Distribution Services, Inc. at 1-800-480-4111 for a fund prospectus. You can also visit us at www.jpmorganfunds.com. Investors should carefully consider the investment objectives and risk as well as charges and expenses of the mutual fund before investing. The prospectus contains this and other information about the mutual fund. Read the prospectus carefully before investing.
Investors may obtain information about the Securities Investor Protection Corporation (SIPC), including the SIPC brochure by visiting www.sipc.org or by calling SIPC at 202-371-8300.
Each Fund files a complete schedule of its fund holdings for the first and third quarters of its fiscal year with the SEC on Form N-Q. The Funds’ Forms N-Q are available on the SEC’s website at http://www.sec.gov and may be reviewed and copied at the SEC’s Public Reference Room in Washington, DC. Information on the operation of the SEC’s Public Reference Room may be obtained by calling 1-800-SEC-0330. Shareholders may request the Form N-Q without charge by calling 1-800-480-4111 or by visiting the J.P. Morgan Funds’ website at www.jpmorganfunds.com.
A description of each Fund’s policies and procedures with respect to the disclosure of each Fund’s holdings is available in the prospectus and Statement of Additional Information.
A copy of proxy policies and procedures is available without charge upon request by calling 1-800-480-4111 and on the Funds’ website at www.jpmorganfunds.com. A description of such policies and procedures is on the SEC’s website at www.sec.gov. The Trustees have delegated the authority to vote proxies for securities owned by the Funds to the Adviser. A copy of the Funds’ voting record for the most recent 12-month period ended June 30 is available on the SEC’s website at www.sec.gov or at the Funds’ website at www.jpmorganfunds.com no later than August 31 of each year. The Funds’ proxy voting record will include, among other things, a brief description of the matter voted on for each fund security, and will state how each vote was cast, for example, for or against the proposal.


J.P. Morgan Asset Management is the marketing name for the asset management business of JPMorgan Chase & Co. Those businesses include, but are not limited to, J.P. Morgan Investment Management Inc., Security Capital Research & Management Incorporated and J.P. Morgan Alternative Asset Management, Inc.
| | | | |
| | © JPMorgan Chase & Co., 2015. All rights reserved. December 2014. | | SAN-MC-1214 |
ITEM 2. CODE OF ETHICS.
Disclose whether, as of the end of the period covered by the report, the registrant has adopted a code of ethics that applies to the registrant’s principal executive officer, principal financial officer, principal accounting officer or controller, or persons performing similar functions, regardless of whether these individuals are employed by the registrant or a third party. If the registrant has not adopted such a code of ethics, explain why it has not done so.
The registrant must briefly describe the nature of any amendment, during the period covered by the report, to a provision of its code of ethics that applies to the registrant’s principal executive officer, principal financial officer, principal accounting officer or controller, or persons performing similar functions, regardless of whether these individuals are employed by the registrant or a third party, and that relates to any element of the code of ethics definition enumerated in paragraph (b) of this Item. The registrant must file a copy of any such amendment as an exhibit pursuant to Item 12(a)(1), unless the registrant has elected to satisfy paragraph (f) of this Item by positing its code of ethics on its website pursuant to paragraph (f)(2) of this Item, or by undertaking to provide its code of ethics to any person without charge, upon request, pursuant to paragraph (f)(3) of this Item.
If the registrant has, during the period covered by the report, granted a waiver, including an implicit waiver, from a provision of the code of ethics that applies to the registrant’s principal executive officer, principal financial officer, principal accounting officer or controller, or persons performing similar functions, regardless of whether these individuals are employed by the registrant or third party, that relates to one or more items set forth in paragraph (b) of this Item, the registrant must briefly describe the nature of the waiver, the name of the person to whom the waiver was granted, and the date of the waiver.
Not applicable to a semi-annual report.
ITEM 3. AUDIT COMMITTEE FINANCIAL EXPERT.
(a) (1) Disclose that the registrant’s board of directors has determined that the registrant either:
(i) Has at least one audit committee financial expert serving on its audit committee; or
(ii) Does not have an audit committee financial expert serving on its audit committee.
(2) If the registrant provides the disclosure required by paragraph (a)(1)(i) of this Item, it must disclose the name of the audit committee financial expert and whether that person is “independent.” In order to be considered “independent” for purposes of this Item, a member of an audit committee may not, other than in his or her capacity as a member of the audit committee, the board of directors, or any other board committee:
(i) Accept directly or indirectly any consulting, advisory, or other compensatory fee from the issuer; or
(ii) Be an “interested person” of the investment company as defined in Section 2(a)(19) of the Act (15 U.S.C. 80a-2(a)(19)).
(3) If the registrant provides the disclosure required by paragraph (a)(1)(ii) of this Item, it must explain why it does not have an audit committee financial expert.
Not applicable to a semi-annual report.
ITEM 4. PRINCIPAL ACCOUNTANT FEES AND SERVICES.
(a) Disclose, under the caption Audit Fees, the aggregate fees billed for each of the last two fiscal years for professional services rendered by the principal accountant for the audit of the registrant’s annual financial statements or services that are normally provided by the accountant in connection with statutory and regulatory filings or engagements for those fiscal years.
(b) Disclose, under the caption Audit-Related Fees, the aggregate fees billed in each of the last two fiscal years for assurance and related services by the principal accountant that are reasonably related to the performance of the audit of the registrant’s financial statements and are not reported under paragraph (a) of this Item. Registrants shall describe the nature of the services comprising the fees disclosed under this category.
(c) Disclose, under the caption Tax Fees, the aggregate fees billed in each of the last two fiscal years for professional services rendered by the principal accountant for tax compliance, tax advice, and tax planning. Registrants shall describe the nature of the services comprising the fees disclosed under this category.
(d) Disclose, under the caption All Other Fees, the aggregate fees billed in each of the last two fiscal years for products and services provided by the principal accountant, other than the services reported in paragraphs (a) through (c) of this Item. Registrants shall describe the nature of the services comprising the fees disclosed under this category.
(e) (1) Disclose the audit committee’s pre-approval policies and procedures described in paragraph (c)(7) of Rule 2-01 of Regulation S-X.
(2) Disclose the percentage of services described in each of paragraphs (b) through (d) of this Item that were approved by the audit committee pursuant to paragraph (c)(7)(i)(C) of Rule 2-01 of Regulation S-X.
(f) If greater than 50 percent, disclose the percentage of hours expended on the principal accountant’s engagement to audit the registrant’s financial statements for the most recent fiscal year that were attributed to work performed by persons other than the principal accountant’s full-time, permanent employees.
(g) Disclose the aggregate non-audit fees billed by the registrant’s accountant for services rendered to the registrant, and rendered to the registrant’s investment adviser (not including any sub-adviser whose role is primarily portfolio management and is subcontracted with or overseen by another investment adviser), and any entity controlling, controlled by, or under common control with the adviser that provides ongoing services to the registrant for each of the last two fiscal years of the registrant.
(h) Disclose whether the registrant’s audit committee of the board of directors has considered whether the provision of non-audit services that were rendered to the registrant’s investment adviser (not including any subadviser whose role is primarily portfolio management and is subcontracted with or overseen by another investment adviser), and any entity controlling, controlled by, or under common control with the investment adviser that provides ongoing services to the registrant that were not pre-approved pursuant to paragraph (c)(7)(ii) of Rule 2-01 of Regulation S-X is compatible with maintaining the principal accountant’s independence.
Not applicable to a semi-annual report.
ITEM 5. AUDIT COMMITTEE OF LISTED REGISTRANTS.
(a) If the registrant is a listed issuer as defined in Rule 10A-3 under the Exchange Act (17CFR 240.10A-3), state whether or not the registrant has a separately-designated standing audit committee established in accordance with Section 3(a)(58)(A) of the Exchange Act (15 U.S.C. 78c(a)(58)(A)). If the registrant has such a committee, however designated, identify each committee member. If the entire board of directors is acting as the registrant’s audit committee as specified in Section 3(a)(58)(B) of the Exchange Act (15 U.S.C. 78c(a)(58)(B)), so state.
(b) If applicable, provide the disclosure required by Rule 10A-3(d) under the Exchange Act (17CFR 240.10A-3(d)) regarding an exemption from the listing standards for all audit committees.
Not applicable to a semi-annual report.
ITEM 6. SCHEDULE OF INVESTMENTS.
File Schedule I – Investments in securities of unaffiliated issuers as of the close of the reporting period as set forth in Section 210.12-12 of Regulation S-X, unless the schedule is included as part of the report to shareholders filed under Item 1 of this Form.
Included in Item 1.
ITEM 7. DISCLOSURE OF PROXY VOTING POLICIES AND PROCEDURES FOR CLOSED-END MANAGEMENT INVESTMENT COMPANIES.
A closed-end management investment company that is filing an annual report on this Form N-CSR must, unless it invests exclusively in non-voting securities, describe the policies and procedures that it uses to determine how to vote proxies relating to portfolio securities, including the procedures that the company uses when a vote presents a conflict between the interests of its shareholders, on the one hand, and those of the company’s investment adviser; principal underwriter; or any affiliated person (as defined in Section 2(a)(3) of the Investment Company Act of 1940 (15 U.S.C. 80a-2(a)(3)) and the rules thereunder) of the company, its investment adviser, or its principal underwriter, on the other. Include any policies and procedures of the company’s investment adviser, or any other third party, that the company uses, or that are used on the company’s behalf, to determine how to vote proxies relating to portfolio securities.
Not applicable.
ITEM 8. PORTFOLIO MANAGERS OF CLOSED-END MANAGEMENT INVESTMENT COMPANIES.
Not applicable.
ITEM 9. PURCHASE OF EQUITY SECURITIES BY CLOSED-END MANAGEMENT INVESTMENT COMPANY AND AFFILIATED PURCHASERS.
(a) If the registrant is a closed-end management investment company, provide the information specified in paragraph (b) of this Item with respect to any purchase made by or on behalf of the registrant or any “affiliated purchaser,” as defined in Rule 10b-18(a)(3) under the Exchange Act (17 CFR 240.10b-18(a)(3)), of shares or other units of any class of the registrant’s equity securities that is registered by the registrant pursuant to Section 12 of the Exchange Act (15 U.S.C. 781).
Not applicable.
ITEM 10. SUBMISSION OF MATTERS TO A VOTE OF SECURITY HOLDERS.
Describe any material changes to the procedures by which shareholders may recommend nominees to the registrant’s board of directors, where those changes were implemented after the registrant last provided disclosure in response to the requirements of Item 7(d)(2)(ii)(G) of Schedule 14A (17 CFR 240.14a-101), or this Item.
No material changes to report.
ITEM 11. CONTROLS AND PROCEDURES.
(a) Disclose the conclusions of the registrant’s principal executive and principal financial officers, or persons performing similar functions, regarding the effectiveness of the registrant’s disclosure controls and procedures (as defined in Rule 30a-3(c) under the Act (17 CFR 270.30a-3(c))) as of a date within 90 days of the filing date of the report that includes the disclosure required by this paragraph, based on the evaluation of these controls and procedures required by Rule 30a-3(b) under the Act (17 CFR 270.30a-3(b)) and Rules 13a-15(b) or 15d-15(b) under the Exchange Act (17 CFR 240.13a-15(b) or 240.15d-15(b)).
The Registrant’s principal executive and principal financial officers have concluded, based on their evaluation of the Registrant’s disclosure controls and procedures as of a date within 90 days of the filing date of this report, that the Registrant’s disclosure controls and procedures are reasonably designed to ensure that information required to be disclosed by the Registrant on Form N-CSR is recorded, processed, summarized and reported within the required time periods and that information required to be disclosed by the Registrant in the reports that it files or submits on Form N-CSR is accumulated and communicated to the Registrant’s management, including its principal executive and principal financial officers, as appropriate to allow timely decisions regarding required disclosure.
(b) Disclose any change in the registrant’s internal control over financial reporting (as defined in Rule 30a-3(d) under the Act (17 CFR 270.30a-3(d)) that occurred during the registrant’s second fiscal quarter of the period covered by this report that has materially affected, or is reasonably likely to materially affect, the registrant’s internal control over financial reporting.
There were no changes in the Registrant’s internal control over financial reporting that occurred during the last fiscal quarter covered by this report that have materially affected, or are reasonably likely to materially affect, the Registrant’s internal control over financial reporting.
ITEM 12. EXHIBITS.
(a) File the exhibits listed below as part of this Form. Letter or number the exhibits in the sequence indicated.
(a)(1) Any code of ethics, or amendment thereto, that is the subject of the disclosure required by Item 2, to the extent that the registrant intends to satisfy the Item 2 requirements through filing of an exhibit.
Not applicable.
(a)(2) A separate certification for each principal executive officer and principal financial officer of the registrant as required by Rule 30a-2(a) under the Act (17 CFR 270.30a-2).
Certifications pursuant to Rule 30a-2(a) under the Investment Company Act of 1940 are attached hereto.
(a)(3) Any written solicitation to purchase securities under Rule 23c-1 under the Act (17 CFR 270.23c-1) sent or given during the period covered by the report by or on behalf of the registrant to 10 or more persons.
Not applicable.
(b) A separate or combined certification for each principal executive officer and principal officer of the registrant as required by Rule 30a-2(b) under the Act of 1940.
Certifications pursuant to Rule 30a-2(b) under the Investment Company Act of 1940 are attached hereto.
SIGNATURES
Pursuant to the requirements of the Securities Exchange Act of 1934 and the Investment Company Act of 1940, the registrant has duly caused this report to be signed on its behalf by the undersigned, thereunto duly authorized.
J.P. Morgan Fleming Mutual Fund Group, Inc.
| | |
| By: | | /s/ Robert L. Young |
| | Robert L. Young |
| | President and Principal Executive Officer |
| | February 27, 2015 |
Pursuant to the requirements of the Securities Exchange Act of 1934 and the Investment Company Act of 1940, this report has been signed below by the following persons on behalf of the registrant and in the capacities and on the dates indicated.
| | |
By: | | /s/ Robert L. Young |
| | Robert L. Young |
| | President and Principal Executive Officer |
| | February 27, 2015 |
| |
By: | | /s/ Laura M. Del Prato |
| | Laura M. Del Prato |
| | Treasurer and Principal Financial Officer |
| | February 27, 2015 |