UNITED STATES
SECURITIES AND EXCHANGE COMMISSION
Washington, D.C. 20549
FORM N-CSR
CERTIFIED SHAREHOLDER REPORT OF REGISTERED
MANAGEMENT INVESTMENT COMPANIES
Investment Company Act file number: 811-08189
J.P. Morgan Fleming Mutual Fund Group, Inc.
(Exact name of registrant as specified in charter)
270 Park Avenue
New York, NY 10017
(Address of principal executive offices) (Zip code)
Frank J. Nasta
270 Park Avenue
New York, NY 10017
(Name and Address of Agent for Service)
Registrant’s telephone number, including area code: (800) 480-4111
Date of fiscal year end: June 30
Date of reporting period: July 1, 2013 through December 31, 2013
Form N-CSR is to be used by management investment companies to file reports with the Commission not later than 10 days after the transmission to stockholders of any report that is required to be transmitted to stockholders under Rule 30e-1 under the Investment Company Act of 1940 (17 CFR 270.30e-1). The Commission may use the information provided on Form N-CSR in its regulatory, disclosure review, inspection, and policymaking roles.
A registrant is required to disclose the information specified by Form N-CSR, and the Commission will make this information public. A registrant is not required to respond to the collection of information contained in Form N-CSR unless the Form displays a currently valid Office of Management and Budget (“OMB”) control number. Please direct comments concerning the accuracy of the information collection burden estimate and any suggestions for reducing the burden to Secretary, Securities and Exchange Commission, 450 Fifth Street, NW, Washington, DC 20549-0609. The OMB has reviewed this collection of information under the clearance requirements of 44 U.S.C. Section 3507.
ITEM 1. REPORTS TO STOCKHOLDERS.
The following is a copy of the report transmitted to shareholders pursuant to Rule 30e-1 under the Investment Company Act of 1940 (17 CFR 270.30e-1).
Semi-Annual Report
J.P. Morgan Mid Cap/Multi-Cap Funds
December 31, 2013 (Unaudited)
JPMorgan Growth Advantage Fund
JPMorgan Mid Cap Core Fund
JPMorgan Mid Cap Equity Fund
JPMorgan Mid Cap Growth Fund
JPMorgan Mid Cap Value Fund
JPMorgan Multi-Cap Market Neutral Fund
JPMorgan Value Advantage Fund

CONTENTS
Investments in a Fund are not bank deposits or obligations of, or guaranteed or endorsed by, any bank and are not insured or guaranteed by the FDIC, the Federal Reserve Board or any other government agency. You could lose money if you sell when the Fund’s share price is lower than when you invested.
Past performance is no guarantee of future performance. The general market views expressed in this report are opinions based on market and other conditions through the end of the reporting period and are subject to change without notice. These views are not intended to predict the future performance of a Fund or the securities markets. References to specific securities and their issuers are for illustrative purposes only and are not intended to be, and should not be interpreted as, recommendations to purchase or sell such securities. Such views are not meant as investment advice and may not be relied on as an indication of trading intent on behalf of any Fund.
Prospective investors should refer to the Funds’ prospectus for a discussion of the Funds’ investment objectives, strategies and risks. Call J.P. Morgan Funds Service Center at 1-800-480-4111 for a prospectus containing more complete information about a Fund, including management fees and other expenses. Please read it carefully before investing.
CEO’S LETTER
January 23, 2014 (Unaudited)
Dear Shareholder,
Equity markets in developed economies performed strongly as the pace of the global economy accelerated during the six months ended December 31, 2013. Healthy corporate earnings and steady improvement in a range of economic indicators provided a positive backdrop for investors seeking returns in the low interest rate environment. While political discord in Washington injected volatility into the market, a bipartisan budget agreement at the end of 2013 relieved much of the political uncertainty created by partisan brinkmanship that led to the partial shutdown of the federal government in October. In December, the U.S. Federal Reserve (the “Fed”) responded to marked improvement in employment and other measures of economic growth by announcing it would trim its $85 billion in monthly asset purchases by $10 billion. The news drove U.S. equities to new highs, with the Standard & Poor’s 500 stock index reaching seven closing highs in December, ending the six-month period with a 16.31% return.
| | |
 | | “ While a repeat of the equity performance we experienced during the six month period may be a tall order, we believe stocks in the U.S. and Europe may continue to show gains” |
Overseas, the European Union returned to positive economic growth during the six month period and by the end of the period, Ireland became the first nation to exit from its European Union bailout program. The Fed’s decision to curb its asset purchases also sent equities higher in Europe, as investors viewed the move as a sign of further economic stability. The euro zone’s composite Purchasing Managers Index ended the period at a three-month high. Amid signs of continued economic expansion, it is notable that the European Central Bank cut its benchmark interest rate to a historical low in November in an attempt to counter a drop in the inflation rate.
In Japan, equity markets posted strong gains, benefitting from Prime Minister Shinzo Abe’s efforts to revive the economy. Low returns on bonds and short-term debt instruments also drove investors into stocks in Japan and Europe.
Emerging market equities were weaker overall as China’s economy showed signs of slower growth and political unrest in
Turkey and Thailand shook investor confidence. The Fed’s decision to taper its asset purchase program also set off speculation that the maturation of the emerging markets credit cycle would push yield-seeking investors to rotate into developed markets.
Taper Talk Pressures Bonds
Fixed-income markets generally remained weak during the six month period, with the Barclays Aggregate Index returning 0.43% for the six month period. U.S. Treasury security yields remained low from a historical perspective but peaked in September after the Fed declined to taper its asset purchases at that time. Globally, emerging market debt continued to struggle as stronger developed market growth trends led to declines in the relatively high yields and strong currencies, causing outflows that led to further weakness. The yield for 10-year U.S. Treasury securities ended December 31, 2013 at 3.04%, while the yields for 2- and 30-year U.S. Treasury securities finished the reporting period at 0.38% and 3.96%, respectively.
We welcome the Fed’s move to curb its Quantitative Easing program as a sign that the U.S. economy’s need for artificial stimulus is waning. While a repeat of the equity performance we experienced during the six month period may be a tall order, we believe stocks in the U.S. and Europe may continue to show gains. In the fixed-income market, persistent weakness has led to attractive valuations in some sectors. The reporting period market swings and intermittent volatility underlined the importance of maintaining a long-term view of your investment portfolio and the benefits derived from diversified holdings.
On behalf of everyone at J.P. Morgan Asset Management, thank you for your continued support. We look forward to managing your investment needs for years to come. Should you have any questions, please visit www.jpmorganfunds.com or contact the J.P. Morgan Funds Service Center at 1-800-480-4111.
Sincerely yours,

George C.W. Gatch
CEO, Global Funds Management
J.P. Morgan Asset Management
| | | | | | | | |
| | | |
| DECEMBER 31, 2013 | | J.P. MORGAN MID CAP/MULTI-CAP FUNDS | | | | | 1 | |
J.P. Morgan Mid Cap/Multi-Cap Funds
MARKET OVERVIEW
SIX MONTHS ENDED DECEMBER 31, 2013 (Unaudited)
Overall, the U.S. equity market performed strongly during the six months ended December 31, 2013, as a tepid economic recovery continued to gain strength from healthy corporate earnings, along with improvements in employment, housing and consumer sentiment. Volatility marked the start of the second half of the year amid investor uncertainty about the intent of the U.S. Federal Reserve Board (the “Fed”) to taper off its monthly purchases of $85 billion in U.S. Treasuries and mortgage-backed securities. Partisan brinkmanship in Washington added to the uncertainty, leading to a partial shutdown of the federal government in October. However, a bipartisan budget agreement toward the end of the period dispelled some of the political uncertainty and the Fed followed through by trimming $10 billion from its monthly asset purchases, which sent equities higher. During the six-month period, the U.S. unemployment rate declined from 7.3% in July to 6.7% at year end, with a slight uptick in joblessness in October. Adding to the positive trend were advances in housing prices and auto sales and a rebound in consumer sentiment to a five-month high in December.
| | | | | | |
| | | |
| 2 | | | | J.P. MORGAN MID CAP/MULTI-CAP FUNDS | | DECEMBER 31, 2013 |
JPMorgan Growth Advantage Fund
FUND COMMENTARY
SIX MONTHS ENDED DECEMBER 31, 2013 (Unaudited)
| | | | |
| REPORTING PERIOD RETURN: | | | |
| Fund (Class A Shares, without a sales charge)* | | | 25.24% | |
| Russell 3000 Growth Index | | | 19.60% | |
| |
| Net Assets as of 12/31/2013 (In Thousands) | | $ | 2,952,882 | |
INVESTMENT OBJECTIVE**
The JPMorgan Growth Advantage Fund (the “Fund”) seeks to provide long-term capital growth.
WHAT WERE THE MAIN DRIVERS OF THE FUND’S PERFORMANCE?
The Fund (Class A Shares, without a sales charge) outperformed the Russell 3000 Growth Index (the “Benchmark”) for the six months ended December 31, 2013. The Fund’s stock selection in the technology sector and the health care sector contributed to performance relative to the Benchmark. While the Fund’s underweight position in the consumer discretionary sector and its overweight position in the material & processing sector detracted from relative performance, the impact was not significant.
Individual contributors to relative performance included IBM Corp. and the Fund’s overweight position in Onyx Pharmaceuticals and its underweight position in Microsoft Corp. The Fund had no position in IBM, and the Fund benefited as the stock underperformed on continued deterioration in the company’s hardware business and declining free cash flow generation. Shares of Onyx, a maker of anti-cancer drugs, rose sharply after it agreed to an all-cash takeover offer from Amgen Inc. Shares of Microsoft, a maker of software and computer hardware, came under pressure from declining trends in personal computer growth and problems with the company’s Windows 8 and Surface tablet products.
Individual detractors from relative performance included Lululemon Athletica Inc., Broadcom Corp. and Exact Sciences Corp. Shares of Lululemon, a maker of athletic apparel, fell after the company cut its forecast for its fiscal fourth-quarter results, which indicated lower-than-expected organic retail growth. Shares of Broadcom, a supplier of semiconductors, mainly to the mobile and wireless segment, fell on weak revenue growth. Shares of Exact Sciences, a medical molecular diagnostics company, were weak due to lower-than-expected revenue in its second and third quarters.
HOW WAS THE FUND POSITIONED?
The Fund’s portfolio managers utilized a bottom-up approach to stock selection, researching individual companies across market capitalizations in an effort to construct portfolios of stocks that have strong fundamentals. The Fund’s portfolio managers sought to invest in high quality companies with durable franchises that, in their view, possessed the ability to generate strong future earnings growth.
| | | | | | | | |
| TOP TEN EQUITY HOLDINGS OF THE PORTFOLIO*** | |
| | 1. | | | Google, Inc., Class A | | | 4.0 | % |
| | 2. | | | Apple, Inc. | | | 3.0 | |
| | 3. | | | MasterCard, Inc., Class A | | | 2.8 | |
| | 4. | | | Gilead Sciences, Inc. | | | 2.7 | |
| | 5. | | | Harley-Davidson, Inc. | | | 2.2 | |
| | 6. | | | Amazon.com, Inc. | | | 2.1 | |
| | 7. | | | Celgene Corp. | | | 2.1 | |
| | 8. | | | Facebook, Inc., Class A | | | 1.9 | |
| | 9. | | | Biogen Idec, Inc. | | | 1.7 | |
| | 10. | | | Acuity Brands, Inc. | | | 1.6 | |
| | | | |
PORTFOLIO COMPOSITION BY SECTOR*** | |
| Information Technology | | | 28.9 | % |
| Consumer Discretionary | | | 20.0 | |
| Industrials | | | 17.8 | |
| Health Care | | | 14.9 | |
| Financials | | | 8.1 | |
| Energy | | | 4.8 | |
| Materials | | | 2.7 | |
| Short-Term Investment | | | 2.8 | |
| * | | The return shown is based on net asset values calculated for shareholder transactions and may differ from the return shown in the financial highlights, which reflects adjustments made to the net asset values in accordance with accounting principles generally accepted in the United States of America. |
| ** | | The adviser seeks to achieve the Fund’s objective. There can be no guarantee it will be achieved. |
| *** | | Percentages indicated are based on total investments as of December 31, 2013. The Fund’s portfolio composition is subject to change. |
| | | | | | | | |
| | | |
| DECEMBER 31, 2013 | | J.P. MORGAN MID CAP/MULTI-CAP FUNDS | | | | | 3 | |
JPMorgan Growth Advantage Fund
FUND COMMENTARY
SIX MONTHS ENDED DECEMBER 31, 2013 (Unaudited) (continued)
| | | | | | | | | | | | | | | | | | | | |
AVERAGE ANNUAL TOTAL RETURNS AS OF DECEMBER 31, 2013 | |
| | | | | |
| | | INCEPTION DATE
OF CLASS | | | 6 MONTH* | | | 1 YEAR | | | 5 YEAR | | | 10 YEAR | |
CLASS A SHARES | | | 10/29/99 | | | | | | | | | | | | | | | | | |
Without Sales Charge | | | | | | | 25.24 | % | | | 44.36 | % | | | 22.16 | % | | | 11.31 | % |
With Sales Charge** | | | | | | | 18.68 | | | | 36.75 | | | | 20.86 | | | | 10.72 | |
CLASS B SHARES | | | 10/29/99 | | | | | | | | | | | | | | | | | |
Without CDSC | | | | | | | 24.97 | | | | 43.76 | | | | 21.52 | | | | 10.77 | |
With CDSC*** | | | | | | | 19.97 | | | | 38.76 | | | | 21.34 | | | | 10.77 | |
CLASS C SHARES | | | 5/1/06 | | | | | | | | | | | | | | | | | |
Without CDSC | | | | | | | 24.95 | | | | 43.72 | | | | 21.54 | | | | 10.68 | |
With CDSC**** | | | | | | | 23.95 | | | | 42.72 | | | | 21.54 | | | | 10.68 | |
CLASS R5 SHARES | | | 1/8/09 | | | | 25.56 | | | | 44.97 | | | | 22.66 | | | | 11.62 | |
CLASS R6 SHARES | | | 12/23/13 | | | | 25.56 | | | | 44.97 | | | | 22.66 | | | | 11.62 | |
SELECT CLASS SHARES | | | 5/1/06 | | | | 25.37 | | | | 44.74 | | | | 22.42 | | | | 11.51 | |
| ** | | Sales Charge for Class A Shares is 5.25%. |
| *** | | Assumes 5% CDSC (contingent deferred sales charge) for the one year period, 2% CDSC for the five year period and 0% CDSC thereafter. |
| **** | | Assumes a 1% CDSC for the one year period and 0% CDSC thereafter. |
TEN YEAR PERFORMANCE (12/31/03 TO 12/31/13)
The performance quoted is past performance and is not a guarantee of future results. Mutual funds are subject to certain market risks. Investment returns and principal value of an investment will fluctuate so that an investor’s shares, when redeemed, may be worth more or less than their original cost. Current performance may be higher or lower than the performance data shown. For up-to-date month-end performance information please call 1-800-480-4111.
As of August 17, 2005, the Fund changed its name, investment objective, certain investment policies and benchmark. Prior to that time, the Fund operated as JPMorgan Mid Cap Growth Fund. Although past performance is not necessarily an indication of how the Fund will perform in the future, in view of these changes, the Fund’s performance record prior to August 17, 2005 might be less pertinent for investors considering whether to purchase shares of the Fund. Returns for the Class C Shares prior to its inception date are based on the performance of Class B Shares, whose expenses are substantially similar to those of Class C Shares. Returns for the Select Class Shares prior to its inception date are based on the performance of Class A Shares. During this period, the actual returns of Select Class Shares would have been different than those shown because Select Class Shares have different expenses than Class A Shares. Returns for Class R5 Shares prior to its inception date are based on the performance of Select Class Shares from May 1, 2006 to January 8, 2009 and Class A Shares prior to May 1, 2006. The actual returns of Class R5 Shares
would have been different than those shown because Class R5 Shares have different expenses than Select Class and Class A Shares. Returns for Class R6 Shares prior to its inception date are based on the performance of Class R5 Shares from January 9, 2009 to December 23, 2013, Select Class Shares from May 1, 2006 to January 8, 2009 and Class A Shares prior to May 1, 2006. The actual returns of Class R6 Shares would have been different than those shown because Class R6 Shares have different expenses than Class R5 Shares.
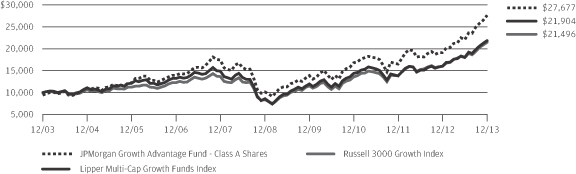
The graph illustrates comparative performance for $10,000 invested in Class A Shares of the JPMorgan Growth Advantage Fund, the Russell 3000 Growth Index and the Lipper Multi-Cap Growth Funds Index from December 31, 2003 to December 31, 2013. The performance of the Fund assumes reinvestment of all dividends and capital gain distributions, if any, and includes a sales charge. The performance of the Russell 3000 Growth Index does not reflect the deduction of expenses or a sales charge associated with a mutual fund and has been adjusted to reflect reinvestment of all dividends and capital gain distributions of the securities included in the benchmark, if applicable. The performance of the Lipper Multi-Cap Growth Funds Index includes expenses associated with a mutual fund, such as investment management fees. These expenses are not identical to the expenses incurred by the Fund. The Russell 3000 Growth Index is an unmanaged index which measures the performance of those Russell 3000 companies (largest 3000 U.S. companies) with higher price-to-book ratios and higher forecasted growth values. The Lipper Multi-Cap Growth Funds Index is
| | | | | | |
| | | |
| 4 | | | | J.P. MORGAN MID CAP/MULTI-CAP FUNDS | | DECEMBER 31, 2013 |
an index based on total returns of certain mutual funds within the Fund’s designated category as determined by Lipper, Inc. Investors cannot invest directly in an index.
Class A Shares have a $1,000 minimum initial investment and carry a 5.25% sales charge.
Fund performance may reflect the waiver of the Fund’s fees and reimbursement of expenses for certain periods since the inception date. Without these waivers and reimbursements, performance would have been lower. Also,
performance shown in this section does not reflect the deduction of taxes that a shareholder would pay on Fund distributions or redemption of Fund shares.
Because Class B Shares automatically convert to Class A Shares after 8 years, the 10 year annual average total return shown above for Class B reflects Class A performance for the period after conversion.
The returns shown are based on net asset values calculated for shareholder transactions and may differ from the returns shown in the financial highlights, which reflect adjustments made to the net asset values in accordance with accounting principles generally accepted in the United States of America.
| | | | | | | | |
| | | |
| DECEMBER 31, 2013 | | J.P. MORGAN MID CAP/MULTI-CAP FUNDS | | | | | 5 | |
JPMorgan Mid Cap Core Fund
FUND COMMENTARY
SIX MONTHS ENDED DECEMBER 31, 2013 (Unaudited)
| | | | |
| REPORTING PERIOD RETURN: | |
| Fund (Select Class Shares)* | | | 18.77% | |
| Russell Midcap Index | | | 16.73% | |
| |
| Net Assets as of 12/31/2013 (In Thousands) | | $ | 1,029,301 | |
INVESTMENT OBJECTIVE**
The JPMorgan Mid Cap Core Fund (the “Fund”) seeks long-term capital appreciation.
WHAT WERE THE MAIN DRIVERS OF THE FUND’S PERFORMANCE?
The Fund (Select Class Shares) outperformed the Russell Midcap Index (the “Benchmark”) for the six months ended December 31, 2013. The Fund’s stock selection in the financial services and technology sectors contributed to relative performance, while stock selection in the consumer discretionary and energy sectors detracted from performance, though in the latter case the impact was modest.
Individual contributors to relative performance included the Fund’s positions in Alliance Data Systems Corp., Twitter Inc., and FleetCor Technologies Inc. Shares of Alliance Data, a provider of marketing and customer loyalty programs, rose on strong quarterly earnings and the company’s upward revision of its forecast for 2013 results. Shares of Twitter, a provider of social networking and so-called micro-blogging services, retained their strength following the company’s initial public offering in November. Shares of FleetCor, a manager of commercial vehicle fuel cards, gained from overall growth in its core business line, along with rising earnings and revenue.
Individual detractors from relative performance included Urban Outfitters Inc., MSC Industrial Direct Inc and Gap Inc. Shares of Urban Oufitters, a retail clothing chain, slumped on mistakes in fashion trends both at its namesake stores and at its Anthropologie retail unit. Shares of MSC Industrial, a maker of metalworking tools and related products, had a positive return for the period, but could not keep pace with the overall Benchmark. Shares of The Gap, a retail clothing chain, fell as sales among retailers were weak ahead of the important holiday season.
HOW WAS THE FUND POSITIONED?
The Fund’s portfolio managers employed a bottom-up approach to stock selection, constructing a portfolio based on company fundamentals, quantitative screening and proprietary
fundamental analysis. The Fund’s portfolio managers invested in companies that, in their view, had leading competitive advantages, predictable and durable business models, sustainable free cash flow generation and management teams committed to increasing intrinsic value.
| | | | | | | | |
| TOP TEN EQUITY HOLDINGS OF THE PORTFOLIO*** | |
| | 1. | | | Amphenol Corp., Class A | | | 1.6 | % |
| | 2. | | | Carlisle Cos., Inc. | | | 1.3 | |
| | 3. | | | Harley-Davidson, Inc. | | | 1.3 | |
| | 4. | | | Mohawk Industries, Inc. | | | 1.2 | |
| | 5. | | | Xilinx, Inc. | | | 1.2 | |
| | 6. | | | Fortune Brands Home & Security, Inc. | | | 1.1 | |
| | 7. | | | Humana, Inc. | | | 1.0 | |
| | 8. | | | Alliance Data Systems Corp. | | | 1.0 | |
| | 9. | | | KLA-Tencor Corp. | | | 1.0 | |
| | 10. | | | MSC Industrial Direct Co., Inc., Class A | | | 1.0 | |
| | | | |
PORTFOLIO COMPOSITION BY SECTOR*** | |
| Consumer Discretionary | | | 21.9 | % |
| Financials | | | 19.4 | |
| Industrials | | | 16.3 | |
| Information Technology | | | 14.4 | |
| Health Care | | | 9.4 | |
| Materials | | | 4.9 | |
| Energy | | | 4.7 | |
| Utilities | | | 4.5 | |
| Consumer Staples | | | 2.3 | |
| Short-Term Investment | | | 2.2 | |
| * | | The return shown is based on net asset values calculated for shareholder transactions and may differ from the return shown in the financial highlights, which reflects adjustments made to the net asset values in accordance with accounting principles generally accepted in the United States of America. |
| ** | | The adviser seeks to achieve the Fund’s objective. There can be no guarantee it will be achieved. |
| *** | | Percentages indicated are based on total investments as of December 31, 2013. The Fund’s portfolio composition is subject to change. |
| | | | | | |
| | | |
| 6 | | | | J.P. MORGAN MID CAP/MULTI-CAP FUNDS | | DECEMBER 31, 2013 |
| | | | | | | | | | | | | | | | | | | | |
AVERAGE ANNUAL TOTAL RETURNS AS OF DECEMBER 31, 2013 | |
| | | | | |
| | | INCEPTION DATE
OF CLASS | | | 6 MONTH* | | | 1 YEAR | | | 3 YEAR | | | SINCE
INCEPTION | |
CLASS A SHARES | | | 11/30/10 | | | | | | | | | | | | | | | | | |
Without Sales Charge | | | | | | | 18.49 | % | | | 36.92 | % | | | 16.19 | % | | | 17.88 | % |
With Sales Charge** | | | | | | | 12.27 | | | | 29.71 | | | | 14.12 | | | | 15.84 | |
CLASS C SHARES | | | 11/30/10 | | | | | | | | | | | | | | | | | |
Without CDSC | | | | | | | 18.20 | | | | 36.25 | | | | 15.63 | | | | 17.29 | |
With CDSC*** | | | | | | | 17.20 | | | | 35.25 | | | | 15.63 | | | | 17.29 | |
CLASS R2 SHARES | | | 11/30/10 | | | | 18.38 | | | | 36.55 | | | | 15.90 | | | | 17.58 | |
CLASS R5 SHARES | | | 11/30/10 | | | | 18.76 | | | | 37.47 | | | | 16.71 | | | | 18.40 | |
CLASS R6 SHARES | | | 1/31/11 | | | | 18.82 | | | | 37.61 | | | | 16.77 | | | | 18.46 | |
SELECT CLASS SHARES | | | 11/30/10 | | | | 18.77 | | | | 37.39 | | | | 16.53 | | | | 18.22 | |
| ** | | Sales Charge for Class A Shares is 5.25%. |
| *** | | Assumes a 1% CDSC (contingent deferred sales charge) for the one year period and 0% CDSC thereafter. |
LIFE OF FUND PERFORMANCE (11/30/10 TO 12/31/13)
The performance quoted is past performance and is not a guarantee of future results. Mutual funds are subject to certain market risks. Investment returns and principal value of an investment will fluctuate so that an investor’s shares, when redeemed, may be worth more or less than their original cost. Current performance may be higher or lower than the performance data shown. For up-to-date, month-end performance information please call 1-800-480-4111.
The fund commenced operations on November 30, 2010.
Returns for Class R6 Shares prior to its inception date are based on the performance of Class R5 Shares. The actual returns of Class R6 Shares would have been different than those shown because Class R6 Shares have different expenses than Class R5 Shares.
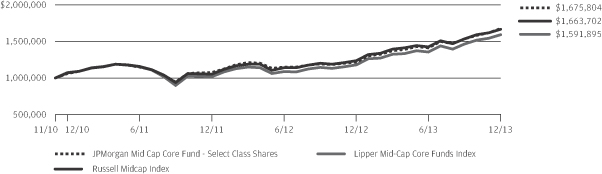
The graph illustrates comparative performance for $1,000,000 invested in Select Class Shares of the JPMorgan Mid Cap Core Fund, the Russell Midcap Index and the Lipper Mid-Cap Core Funds Index from November 30, 2010 to December 31, 2013. The performance of the Fund assumes reinvestment of all dividends and capital gain distributions, if any, and does not include a sales charge. The performance of the Russell Midcap Index does not reflect the deduction of expenses or a sales charge associated with a mutual fund and has been adjusted to reflect reinvestment of all dividends and capital gain
distributions of the securities included in the benchmark, if applicable. The performance of the Lipper Mid-Cap Core Funds Index includes expenses associated with a mutual fund, such as investment management fees. These expenses are not identical to the expenses incurred by the Fund. The Russell Midcap Index is an unmanaged index which measures the performance of the 800 smallest companies in the Russell 1000 Index. The Lipper Mid-Cap Core Funds Index is an index based on total returns of certain mutual funds within the Fund’s designated category as determined by Lipper, Inc. Investors cannot invest directly in an index.
Select Class Shares have a $1,000,000 minimum initial investment.
Fund performance may reflect the waiver of the Fund’s fees and reimbursement of expenses for certain periods since the inception date. Without these waivers and reimbursements, performance would have been lower. Also, performance shown in this section does not reflect the deduction of taxes that a shareholder would pay on Fund distributions or redemption of Fund shares.
The returns shown are based on net asset values calculated for shareholder transactions and may differ from the returns shown in the financial highlights, which reflect adjustments made to the net asset values in accordance with accounting principles generally accepted in the United States of America.
| | | | | | | | |
| | | |
| DECEMBER 31, 2013 | | J.P. MORGAN MID CAP/MULTI-CAP FUNDS | | | | | 7 | |
JPMorgan Mid Cap Equity Fund
FUND COMMENTARY
SIX MONTHS ENDED DECEMBER 31, 2013 (Unaudited)
| | | | |
| REPORTING PERIOD RETURN: | |
| Fund (Select Class Shares)* | | | 18.72% | |
| Russell Midcap Index | | | 16.73% | |
| |
| Net Assets as of 12/31/2013 (In Thousands) | | $ | 1,268,665 | |
INVESTMENT OBJECTIVE**
The JPMorgan Mid Cap Equity Fund (the “Fund”) seeks long-term capital growth.
WHAT WERE THE MAIN DRIVERS OF THE FUND’S PERFORMANCE?
The Fund (Select Class Shares) outperformed the Russell Midcap Index (the “Benchmark”) for the six months ended December 31, 2013. The Fund’s stock selection in the financial services sector and the technology sector contributed to relative performance. Stock selection in the consumer discretionary sector was the notable detractor, while stock selection in the energy sector detracted from relative performance.
Individual contributors to relative performance included the Fund’s positions in Alliance Data Systems Corp., Twitter Inc., and FleetCor Technologies Inc. Shares of Alliance Data, a provider of marketing and customer loyalty programs, rose on continued strong growth in its private label credit card business. Also driving the stock’s performance was the accelerating growth in the Epsilon marketing business due to secular growth in targeted loyalty-based marketing programs.
We participated in the initial public offering of Twitter, a provider of social networking and so-called micro-blogging services, and the stock continued to perform well on the strength of its potential to monetize the use of mobile devices. Shares of FleetCor, a manager of commercial vehicle fuel cards, gained from overall growth in its core business line as it continued to generate strong organic growth and improved profit margins, while gaining global market share through acquisitions.
Individual detractors from relative performance included Urban Outfitters Inc., MSC Industrial Direct Inc and Gap Inc. Shares of Urban Oufitters, a retail clothing chain, were weak after the company reported a difficult back-to-school season at its core brand. Shares of MSC Industrial, a maker of metalworking tools and related products, fell due to a difficult outlook for profit margins amid rising expenses. Shares of Gap, a retail clothing chain, fell as sales among retailers were weak ahead of the holiday shopping season.
HOW WAS THE FUND POSITIONED?
The Fund’s portfolio managers employed a bottom-up approach to stock selection, constructing a portfolio based on company fundamentals, quantitative screening and proprietary fundamental analysis. The Fund’s portfolio managers sought to identify dominant franchises with predictable business models deemed capable of achieving, in their view, sustained growth, as well as undervalued companies with the potential to grow their intrinsic value per share.
| | | | | | | | |
| TOP TEN EQUITY HOLDINGS OF THE PORTFOLIO*** | |
| | 1. | | | Amphenol Corp., Class A | | | 1.5 | % |
| | 2. | | | Carlisle Cos., Inc. | | | 1.3 | |
| | 3. | | | Harley-Davidson, Inc. | | | 1.3 | |
| | 4. | | | Mohawk Industries, Inc. | | | 1.2 | |
| | 5. | | | Xilinx, Inc. | | | 1.2 | |
| | 6. | | | Fortune Brands Home & Security, Inc. | | | 1.1 | |
| | 7. | | | Humana, Inc. | | | 1.0 | |
| | 8. | | | Alliance Data Systems Corp. | | | 1.0 | |
| | 9. | | | KLA-Tencor Corp. | | | 1.0 | |
| | 10. | | | MSC Industrial Direct Co., Inc., Class A | | | 1.0 | |
| | | | |
PORTFOLIO COMPOSITION BY SECTOR*** | |
| Consumer Discretionary | | | 21.3 | % |
| Financials | | | 18.7 | |
| Industrials | | | 15.9 | |
| Information Technology | | | 13.9 | |
| Health Care | | | 9.1 | |
| Materials | | | 4.8 | |
| Energy | | | 4.5 | |
| Utilities | | | 4.4 | |
| Consumer Staples | | | 2.3 | |
| Short-Term Investment | | | 5.1 | |
| * | | The return shown is based on net asset values calculated for shareholder transactions and may differ from the return shown in the financial highlights, which reflects adjustments made to the net asset values in accordance with accounting principles generally accepted in the United States of America. |
| ** | | The adviser seeks to achieve the Fund’s objective. There can be no guarantee it will be achieved. |
| *** | | Percentages indicated are based on total investments as of December 31, 2013. The Fund’s portfolio composition is subject to change. |
| | | | | | |
| | | |
| 8 | | | | J.P. MORGAN MID CAP/MULTI-CAP FUNDS | | DECEMBER 31, 2013 |
| | | | | | | | | | | | | | | | | | | | |
AVERAGE ANNUAL TOTAL RETURNS AS OF DECEMBER 31, 2013 | |
| | | | | |
| | | INCEPTION DATE
OF CLASS | | | 6 MONTH* | | | 1 YEAR | | | 5 YEAR | | | 10 YEAR | |
CLASS A SHARES | | | 11/2/09 | | | | | | | | | | | | | | | | | |
Without Sales Charge | | | | | | | 18.51 | % | | | 36.26 | % | | | 21.07 | % | | | 10.13 | % |
With Sales Charge** | | | | | | | 12.29 | | | | 29.09 | | | | 19.77 | | | | 9.54 | |
CLASS C SHARES | | | 11/2/09 | | | | | | | | | | | | | | | | | |
Without CDSC | | | | | | | 18.22 | | | | 35.58 | | | | 20.57 | | | | 9.90 | |
With CDSC*** | | | | | | | 17.22 | | | | 34.58 | | | | 20.57 | | | | 9.90 | |
SELECT CLASS SHARES | | | 1/1/97 | | | | 18.72 | | | | 36.74 | | | | 21.42 | | | | 10.29 | |
| ** | | Sales Charge for Class A Shares is 5.25%. |
| *** | | Assumes a 1% CDSC (contingent deferred sales charge) for the one year period and 0% CDSC thereafter. |
TEN YEAR PERFORMANCE (12/31/03 TO 12/31/13)
The performance quoted is past performance and is not a guarantee of future results. Mutual funds are subject to certain market risks. Investment returns and principal value of an investment will fluctuate so that an investor’s shares, when redeemed, may be worth more or less than their original cost. Current performance may be higher or lower than the performance data shown. For up-to-date month-end performance information please call 1-800-480-4111.
Returns for Class A and Class C Shares prior to their inception date are based on the performance of Select Class Shares. The actual returns of Class A and Class C Shares would have been lower than those shown because Class A and Class C Shares have higher expenses than Select Class Shares.
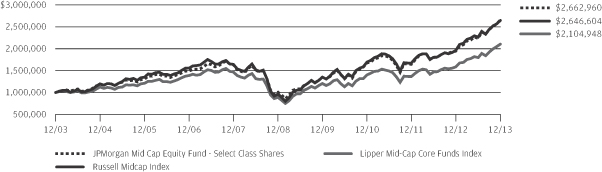
The graph illustrates comparative performance for $1,000,000 invested in the Select Class Shares of JPMorgan Mid Cap Equity Fund, the Russell Midcap Index and the Lipper Mid-Cap Core Funds Index from December 31, 2003 to December 31, 2013. The performance of the Fund assumes reinvestment of all dividends and capital gain distributions, if any, and does not include a sales charge. The performance of the Russell Midcap Index does not reflect the deduction of expenses or a sales charge associated with a mutual fund and has been adjusted to reflect reinvestment of all dividends and capital gain distributions of the securities included in the benchmark, if applicable. The
performance of the Lipper Mid-Cap Core Funds Index includes expenses associated with a mutual fund, such as investment management fees. These expenses are not identical to the expenses incurred by the Fund. The Russell Midcap Index is an unmanaged index which measures the performance of the 800 smallest companies in the Russell 1000 Index. The Lipper Mid-Cap Core Funds Index is an index based on total returns of certain mutual funds within the Fund’s designated category as determined by Lipper, Inc. Investors cannot invest directly in an index.
Select Class Shares have a $1,000,000 minimum initial investment.
Fund performance may reflect the waiver of the Fund’s fees and reimbursement of expenses for certain periods since the inception date. Without these waivers and reimbursements, performance would have been lower. Also, performance shown in this section does not reflect the deduction of taxes that a shareholder would pay on Fund distributions or redemption of Fund shares.
The returns shown are based on net asset values calculated for shareholder transactions and may differ from the returns shown in the financial highlights, which reflect adjustments made to the net asset values in accordance with accounting principles generally accepted in the United States of America.
| | | | | | | | |
| | | |
| DECEMBER 31, 2013 | | J.P. MORGAN MID CAP/MULTI-CAP FUNDS | | | | | 9 | |
JPMorgan Mid Cap Growth Fund
FUND COMMENTARY
SIX MONTHS ENDED DECEMBER 31, 2013 (Unaudited)
| | | | |
| REPORTING PERIOD RETURN: | |
| Fund (Select Class Shares)* | | | 23.45% | |
| Russell Midcap Growth Index | | | 18.34% | |
| |
| Net Assets as of 12/31/2013 (In Thousands) | | $ | 1,908,183 | |
INVESTMENT OBJECTIVE**
The JPMorgan Mid Cap Growth Fund (the “Fund”) seeks growth of capital and secondarily, current income by investing primarily in equity securities.
WHAT WERE THE MAIN DRIVERS OF THE FUND’S PERFORMANCE?
The Fund (Select Class Shares) outperformed the Russell Midcap Growth Index (the “Benchmark”) for the six months ended December 31, 2013. The Fund’s stock selection in the financial services sector and the technology sector contributed to relative performance. The Fund’s stock selection in the consumer discretionary sector and the energy sector detracted from performance, though in the latter case the impact was not significant.
Individual contributors to relative performance included Twitter Inc., Alliance Data Systems Inc. and Onyx Pharmaceuticals Inc. Shares of Twitter, a provider of social networking and micro-blogging services, contributed to performance given our participation in their successful IPO and continued strength in the stock given their strong mobile monetization potential. Shares of Alliance Data, a provider of marketing and customer loyalty programs, rose on continued strong growth in the private label credit card business. Driving the stock’s performance was also the accelerating growth in the Epsilon marketing business due to secular growth in targeted loyalty based marketing programs. Shares of Onyx, a maker of anti-cancer drugs, rose sharply after it agreed to an all-cash takeover offer from Amgen Inc.
Individual detractors to relative performance included Urban Outfitters Inc., Lululemon Athletica Inc. and Plains All American Pipeline LP. Shares of Urban Oufitters, a retail clothing chain, were weak after reporting a difficult back-to-school season at its core Urban Outfitters brand as lack of compelling fashion across retail led to a more promotional environment. Shares of Lululemon, a maker of athletic apparel, fell after the company cut its forecast for its fiscal fourth-quarter results, which indicated much lower organic retail growth than market expectations. Shares of Plains All American, an operator of pipelines and storage for crude, natural gas and refined product, were weak due to the increase in interest rates, which put pressure on high yielding equities and master limited partnerships like Plains All American.
HOW WAS THE FUND POSITIONED?
The Fund’s portfolio managers utilized a bottom-up approach to stock selection, researching individual companies in an effort to construct a portfolio of stocks that have strong fundamentals. The Fund’s portfolio managers sought to invest in high quality companies with durable franchises that, in their view, possessed the ability to generate strong future earnings growth.
| | | | | | | | |
| TOP TEN EQUITY HOLDINGS OF THE PORTFOLIO*** | |
| | 1. | | | Harley-Davidson, Inc. | | | 2.7 | % |
| | 2. | | | Alliance Data Systems Corp. | | | 2.0 | |
| | 3. | | | Flowserve Corp. | | | 1.8 | |
| | 4. | | | Pall Corp. | | | 1.8 | |
| | 5. | | | Illumina, Inc. | | | 1.8 | |
| | 6. | | | Affiliated Managers Group, Inc. | | | 1.8 | |
| | 7. | | | Michael Kors Holdings Ltd. | | | 1.7 | |
| | 8. | | | Moody’s Corp. | | | 1.7 | |
| | 9. | | | Agilent Technologies, Inc. | | | 1.7 | |
| | 10. | | | Acuity Brands, Inc. | | | 1.6 | |
| | | | |
PORTFOLIO COMPOSITION BY SECTOR*** | |
| Consumer Discretionary | | | 23.7 | % |
| Industrials | | | 22.3 | |
| Information Technology | | | 19.1 | |
| Health Care | | | 13.9 | |
| Financials | | | 11.9 | |
| Energy | | | 4.7 | |
| Materials | | | 2.2 | |
| Short-Term Investment | | | 2.2 | |
| * | | The return shown is based on net asset values calculated for shareholder transactions and may differ from the return shown in the financial highlights, which reflects adjustments made to the net asset values in accordance with accounting principles generally accepted in the United States of America. |
| ** | | The adviser seeks to achieve the Fund’s objective. There can be no guarantee it will be achieved. |
| *** | | Percentages indicated are based on total investments as of December 31, 2013. The Fund’s portfolio composition is subject to change. |
| | | | | | |
| | | |
| 10 | | | | J.P. MORGAN MID CAP/MULTI-CAP FUNDS | | DECEMBER 31, 2013 |
| | | | | | | | | | | | | | | | | | | | |
AVERAGE ANNUAL TOTAL RETURNS AS OF DECEMBER 31, 2013 | |
| | | | | |
| | | INCEPTION DATE
OF CLASS | | | 6 MONTH* | | | 1 YEAR | | | 5 YEAR | | | 10 YEAR | |
CLASS A SHARES | | | 2/18/92 | | | | | | | | | | | | | | | | | |
Without Sales Charge | | | | | | | 23.28 | % | | | 41.90 | % | | | 22.46 | % | | | 9.57 | % |
With Sales Charge** | | | | | | | 16.81 | | | | 34.48 | | | | 21.13 | | | | 8.98 | |
CLASS B SHARES | | | 1/14/94 | | | | | | | | | | | | | | | | | |
Without CDSC | | | | | | | 22.97 | | | | 41.21 | | | | 21.82 | | | | 9.03 | |
With CDSC*** | | | | | | | 17.97 | | | | 36.21 | | | | 21.63 | | | | 9.03 | |
CLASS C SHARES | | | 11/4/97 | | | | | | | | | | | | | | | | | |
Without CDSC | | | | | | | 22.97 | | | | 41.19 | | | | 21.81 | | | | 8.92 | |
With CDSC**** | | | | | | | 21.97 | | | | 40.19 | | | | 21.81 | | | | 8.92 | |
CLASS R2 SHARES | | | 6/19/09 | | | | 23.17 | | | | 41.68 | | | | 22.25 | | | | 9.40 | |
CLASS R5 SHARES | | | 11/1/11 | | | | 23.55 | | | | 42.53 | | | | 22.91 | | | | 9.92 | |
CLASS R6 SHARES | | | 11/1/11 | | | | 23.57 | | | | 42.59 | | | | 22.93 | | | | 9.93 | |
SELECT CLASS SHARES | | | 3/2/89 | | | | 23.45 | | | | 42.34 | | | | 22.82 | | | | 9.88 | |
| ** | | Sales Charge for Class A Shares is 5.25%. |
| *** | | Assumes a 5% CDSC (contingent deferred sales charge) for the one year period, 2% CDSC for the five year period and 0% CDSC thereafter. |
| **** | | Assumes a 1% CDSC for the one year period and 0% CDSC thereafter. |
TEN YEAR PERFORMANCE (12/31/03 TO 12/31/13)
The performance quoted is past performance and is not a guarantee of future results. Mutual funds are subject to certain market risks. Investment returns and principal value of an investment will fluctuate so that an investor’s shares, when redeemed, may be worth more or less than their original cost. Current performance may be higher or lower than the performance data shown. For up-to-date month-end performance information please call 1-800-480-4111.
Returns for the Class R2, Class R5 and Class R6 Shares prior to their inception dates are based on the performance of Select Class Shares. Prior performance for Class R2 Shares has been adjusted to reflect the differences in expenses between classes. The actual returns of Class R5 and Class R6 Shares would have been different than those shown because Class R5 and Class R6 Shares have different expenses than Select Class Shares.
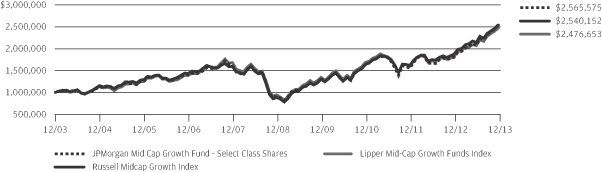
The graph illustrates comparative performance for $1,000,000 invested in Select Class Shares of the JPMorgan Mid Cap Growth Fund, the Russell Midcap Growth Index and the Lipper Mid-Cap Growth Funds Index from December 31, 2003 to December 31, 2013. The performance of the Fund assumes reinvestment of all dividends and capital gain distributions, if any, and does not include a sales charge. The performance of the Russell Midcap Growth Index does not reflect the deduction of expenses or a sales charge associated with a mutual fund and has been adjusted to reflect reinvestment of all dividends and capital gain distributions of the securities included in the benchmark, if applicable. The
performance of the Lipper Mid-Cap Growth Funds Index includes expenses associated with a mutual fund, such as investment management fees. These expenses are not identical to the expenses incurred by the Fund. The Russell Midcap Growth Index is an unmanaged index which measures the performance of those Russell Midcap companies with higher price-to-book ratios and higher forecasted growth values. The Lipper Mid-Cap Growth Funds Index is an index based on total returns of certain mutual funds as determined by Lipper, Inc. Investors cannot invest directly in an index.
Select Class Shares have a $1,000,000 minimum initial investment.
Fund performance may reflect the waiver of the Fund’s fees and reimbursement of expenses for certain periods since the inception date. Without these waivers and reimbursements, performance would have been lower. Also, performance shown in this section does not reflect the deduction of taxes that a shareholder would pay on Fund distributions or redemption of Fund shares.
Because Class B Shares automatically convert to Class A Shares after 8 years, the 10 year average annual total return shown above for Class B reflects Class A performance for the period after conversion.
The returns shown are based on net asset values calculated for shareholder transactions and may differ from the returns shown in the financial highlights, which reflect adjustments made to the net asset values in accordance with accounting principles generally accepted in the United States of America.
| | | | | | | | |
| | | |
| DECEMBER 31, 2013 | | J.P. MORGAN MID CAP/MULTI-CAP FUNDS | | | | | 11 | |
JPMorgan Mid Cap Value Fund
FUND COMMENTARY
SIX MONTHS ENDED DECEMBER 31, 2013 (Unaudited)
| | | | |
| Reporting Period Return: | | | |
| Fund (Institutional Class Shares)* | | | 14.52% | |
| Russell Midcap Value Index | | | 14.95% | |
| |
| Net Assets as of 12/31/2013 (In Thousands) | | $ | 14,825,753 | |
INVESTMENT OBJECTIVE**
The JPMorgan Mid Cap Value Fund (the “Fund”) seeks growth from capital appreciation.
WHAT WERE THE MAIN DRIVERS OF THE FUND’S PERFORMANCE?
The Fund (Institutional Class Shares) underperformed the Russell Midcap Value Index (the “Benchmark”) for the six months ended December 31, 2013. The Fund’s stock selection in the materials sector and its underweight position in the health care sector detracted from relative performance. The Fund’s stock selection and underweight position in the financials sector and its underweight position in the utilities sector contributed to relative performance.
Shares of real estate investment trusts Rayonier Inc. and HCP Inc. struggled as investor expectations of rising interest rates led to a de-emphasis on yield. Shares of Rayonier declined after the company’s 2014 pricing outlook indicated that price-per-unit declines might be structural. Investors responded by revising downward their long-term growth estimates for revenue and earnings, as well as the long-term outlook for the company’s dividends. Shares of HCP underperformed largely due to expectations of near-term headwinds, including a refinancing in February and the potential exercise of a buy option by one of its main tenants. The potentially more expensive debt from the refinancing and the reinvestment risks from the potential sale of assets are expected to meaningfully reduce income in 2014. The company also experienced a CEO change which introduced some uncertainty on future strategy.
Individual contributors to relative performance included the Fund’s positions in out-of-benchmark companies Ball Corp. and Idex Corp., and Dish Network Corp. Shares of Ball Corp., a metal and plastic packaging manufacturer, gained from better-than-expected volumes, earnings growth and a strong forecast of earnings growth. Shares of Idex, a maker of industrial and engineering equipment, jumped on its forecast of earnings and revenue growth and its announcement of a $300 million share repurchase plan. Shares of Dish Network, a provider of satellite television service, rose on the company’s aggressive moves to make deals and acquire companies that could help it expand beyond its core business.
HOW WAS THE FUND POSITIONED?
The Fund’s portfolio managers utilized a bottom-up approach to stock selection and sought to identify durable franchises possessing the ability to generate, in their view, sustainable levels of free cash flow. The portfolio continued to have a large overweight position in consumer discretionary stocks. The portfolio’s largest underweight position remained the financial sector due to the portfolio’s underweighting of REITs, based on their valuations. However, the Fund’s portfolio managers have been slowly and selectively adding positions in certain REITs that have niche business models.
| | | | | | | | |
| TOP TEN EQUITY HOLDINGS OF THE PORTFOLIO*** | |
| | 1. | | | Ball Corp. | | | 2.0 | % |
| | 2. | | | Marsh & McLennan Cos., Inc. | | | 1.9 | |
| | 3. | | | Loews Corp. | | | 1.8 | |
| | 4. | | | Ameriprise Financial, Inc. | | | 1.6 | |
| | 5. | | | Amphenol Corp., Class A | | | 1.6 | |
| | 6. | | | AutoZone, Inc. | | | 1.6 | |
| | 7. | | | Kohl’s Corp. | | | 1.6 | |
| | 8. | | | Fifth Third Bancorp | | | 1.5 | |
| | 9. | | | Gap, Inc. (The) | | | 1.5 | |
| | 10. | | | Arrow Electronics, Inc. | | | 1.5 | |
| | | | |
PORTFOLIO COMPOSITION BY SECTOR*** | |
| Financials | | | 27.0 | % |
| Consumer Discretionary | | | 20.0 | |
| Industrials | | | 10.2 | |
| Information Technology | | | 9.6 | |
| Utilities | | | 9.1 | |
| Materials | | | 7.8 | |
| Health Care | | | 4.7 | |
| Consumer Staples | | | 4.7 | |
| Energy | | | 4.6 | |
| Short-Term Investment | | | 2.3 | |
| * | | The return shown is based on net asset values calculated for shareholder transactions and may differ from the return shown in the financial highlights, which reflects adjustments made to the net asset values in accordance with accounting principles generally accepted in the United States of America. |
| ** | | The adviser seeks to achieve the Fund’s objective. There can be no guarantee it will be achieved. |
| *** | | Percentages indicated are based on total investments as of December 31, 2013. The Fund’s portfolio composition is subject to change. |
| | | | | | |
| | | |
| 12 | | | | J.P. MORGAN MID CAP/MULTI-CAP FUNDS | | DECEMBER 31, 2013 |
| | | | | | | | | | | | | | | | | | | | |
AVERAGE ANNUAL TOTAL RETURNS AS OF DECEMBER 31, 2013 | |
| | | | | |
| | | INCEPTION DATE
OF CLASS | | | 6 MONTH* | | | 1 YEAR | | | 5 YEAR | | | 10 YEAR | |
CLASS A SHARES | | | 4/30/01 | | | | | | | | | | | | | | | | | |
Without Sales Charge | | | | | | | 14.22 | % | | | 31.34 | % | | | 19.95 | % | | | 10.01 | % |
With Sales Charge** | | | | | | | 8.20 | | | | 24.43 | | | | 18.67 | | | | 9.42 | |
CLASS B SHARES | | | 4/30/01 | | | | | | | | | | | | | | | | | |
Without CDSC | | | | | | | 13.95 | | | | 30.71 | | | | 19.35 | | | | 9.55 | |
With CDSC*** | | | | | | | 8.95 | | | | 25.71 | | | | 19.16 | | | | 9.55 | |
CLASS C SHARES | | | 4/30/01 | | | | | | | | | | | | | | | | | |
Without CDSC | | | | | | | 13.93 | | | | 30.66 | | | | 19.35 | | | | 9.44 | |
With CDSC**** | | | | | | | 12.93 | | | | 29.66 | | | | 19.35 | | | | 9.44 | |
CLASS R2 SHARES | | | 11/3/08 | | | | 14.07 | | | | 30.99 | | | | 19.64 | | | | 9.86 | |
INSTITUTIONAL CLASS SHARES | | | 11/13/97 | | | | 14.52 | | | | 31.99 | | | | 20.55 | | | | 10.56 | |
SELECT CLASS SHARES | | | 10/31/01 | | | | 14.39 | | | | 31.66 | | | | 20.25 | | | | 10.29 | |
| ** | | Sales Charge for Class A Shares is 5.25%. |
| *** | | Assumes a 5% CDSC (contingent deferred sales charge) for the one year period, 2% CDSC for the five year period and 0% CDSC thereafter. |
| **** | | Assumes a 1% CDSC for the one year period and 0% CDSC thereafter. |
TEN YEAR PERFORMANCE (12/31/03 TO 12/31/13)
The performance quoted is past performance and is not a guarantee of future results. Mutual funds are subject to certain market risks. Investment returns and principal value of an investment will fluctuate so that an investor’s shares, when redeemed, may be worth more or less than their original cost. Current performance may be higher or lower than the performance data shown. For up-to-date month-end performance information please call 1-800-480-4111.
Returns for Class R2 Shares prior to its inception date are based on the performance of Class A Shares. The actual returns of Class R2 Shares would have been lower than those shown because Class R2 Shares have higher expenses than Class A Shares.
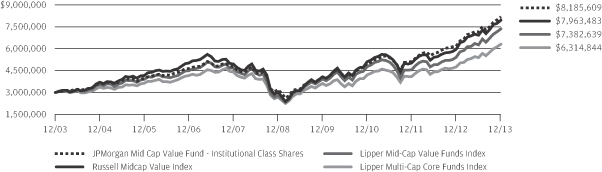
The graph illustrates comparative performance for $3,000,000 invested in Institutional Class Shares of the JPMorgan Mid Cap Value Fund, the Russell Midcap Value Index, the Lipper Mid-Cap Value Funds Index and the Lipper Multi-Cap Core Funds Index from December 31, 2003 to December 31, 2013. The performance of the Fund assumes reinvestment of all dividends and capital gain distributions, if any, and does not include a sales charge. The performance of the Russell Midcap Value Index does not reflect the deduction of expenses or a sales charge associated with a mutual fund and has been adjusted to reflect reinvestment of all dividends and capital gain distributions of the securities included in the benchmark, if applicable. The performance of the Lipper Mid-Cap Value Funds Index and the Lipper Multi-Cap Core Funds Index includes
expenses associated with a mutual fund, such as investment management fees. These expenses are not identical to the expenses incurred by the Fund. The Russell Midcap Value Index is an unmanaged index which measures the performance of those Russell Midcap companies with lower price-to-book ratios and lower forecasted growth values. The Lipper Mid-Cap Value Funds Index and the Lipper Multi-Cap Core Funds Index are indexes based on total returns of certain groups of mutual funds within the Fund’s designated category as determined by Lipper, Inc. Investors cannot invest directly in an index.
Institutional Class Shares have a $3,000,000 minimum initial investment.
Fund performance may reflect the waiver of the Fund’s fees and reimbursement of expenses for certain periods since the inception date. Without these waivers and reimbursements, performance would have been lower. Also, performance shown in this section does not reflect the deduction of taxes that a shareholder would pay on Fund distributions or redemption of Fund shares.
Because Class B Shares automatically convert to Class A Shares after 8 years, the 10 year average annual total return shown above for Class B reflects Class A performance for the period after conversion.
The returns shown are based on net asset values calculated for shareholder transactions and may differ from the returns shown in the financial highlights, which reflect adjustments made to the net asset values in accordance with accounting principles generally accepted in the United States of America.
| | | | | | | | |
| | | |
| DECEMBER 31, 2013 | | J.P. MORGAN MID CAP/MULTI-CAP FUNDS | | | | | 13 | |
JPMorgan Multi-Cap Market Neutral Fund
FUND COMMENTARY
SIX MONTHS ENDED DECEMBER 31, 2013 (Unaudited)
| | | | |
| REPORTING PERIOD RETURN: | |
| Fund (Select Class Shares)* | | | 1.61% | |
| BofA Merrill Lynch 3-Month U.S. Treasury Bill Index | | | 0.03% | |
| |
| Net Assets as of 12/31/13 (In Thousands) | | $ | 422,119 | |
INVESTMENT OBJECTIVE**
The JPMorgan Multi-Cap Market Neutral Fund (the “Fund”) seeks long-term capital preservation and growth by using strategies designed to produce returns which have no correlation with general domestic market performance.
WHAT WERE THE MAIN DRIVERS OF THE FUND’S PERFORMANCE?
The Fund (Select Class Shares) outperformed the BofA Merrill Lynch 3-Month U.S. Treasury Bill Index for the six months ended December 31, 2013.
The Fund’s portfolio managers employed a quantitative bottom-up approach for their stock selection process, focusing on both valuation and fundamentals. The valuation stock selection model seeks to determine how a stock is priced relative to what the Fund’s portfolio managers believe is its intrinsic value by considering valuation factors such as a company’s cash flow and price-to-book values. The fundamental stock selection model attempts to identify how healthy a company’s short-term operating trends are by using metrics such as stock price momentum and earnings momentum.
During the reporting period, the Fund’s stock selection process produced positive returns in the industrials and health care sectors and negative returns in the energy and consumer staples sectors.
Individual contributors to Fund returns included long positions in Pitney Bowes Inc., Yahoo! Inc. and United Therapeutics Corp. Shares of Pitney Bowes, a maker of mail processing equipment, software and services, rose on the company’s good cash flow and expanding profit margins. Shares of Yahoo, an online portal, rose on its acquisition of Tumblr and investors response to Chief Executive Marissa Mayer’s strategic plans. Shares of United Therapeutics, a biotechnology company, climbed after the U.S. Food and Drug Administration approved the company’s oral formulation of its high blood pressure drug.
Individual detractors from Fund returns included short positions in Stratasys Ltd., United Natural Foods Inc. and athenahealth Inc. Shares of Stratasys, a maker of three-dimensional printers and materials, rose on the company’s upward revisions to its forecast for revenue and earnings growth. Shares of
United Natural, a distributor of natural foods and products, gained from growth in quarterly earnings and sales. Shares of athenahealth, a provider of business services to the health care sector, benefited from positive comments from several securities analysts and from a general increase in health care stocks overall.
HOW WAS THE FUND POSITIONED?
The Fund’s portfolio managers employed a bottom-up approach to stock selection, constructing a portfolio based on company fundamentals, quantitative screening and proprietary fundamental analysis. The Fund’s portfolio managers sought to identify dominant franchises with predictable business models deemed capable of achieving, in their view, sustained growth, as well as undervalued companies with the potential to grow their intrinsic value per share.
| | | | | | | | |
| TOP TEN LONG POSITIONS OF THE PORTFOLIO*** | |
| | 1. | | | Pitney Bowes, Inc. | | | 1.1 | % |
| | 2. | | | R.R. Donnelley & Sons Co. | | | 1.1 | |
| | 3. | | | Activision Blizzard, Inc. | | | 1.1 | |
| | 4. | | | Manpowergroup, Inc. | | | 1.1 | |
| | 5. | | | Computer Sciences Corp. | | | 1.0 | |
| | 6. | | | Yahoo!, Inc. | | | 1.0 | |
| | 7. | | | Omnicare, Inc. | | | 1.0 | |
| | 8. | | | United Therapeutics Corp. | | | 1.0 | |
| | 9. | | | Western Digital Corp. | | | 1.0 | |
| | 10. | | | Medtronic, Inc. | | | 1.0 | |
| | | | | | | | |
| TOP TEN SHORT POSITIONS OF THE PORTFOLIO**** | |
| | 1. | | | Hain Celestial Group, Inc. (The) | | | 1.2 | % |
| | 2. | | | Salesforce.com, Inc. | | | 1.2 | |
| | 3. | | | Copart, Inc. | | �� | 1.2 | |
| | 4. | | | Stratasys Ltd. | | | 1.1 | |
| | 5. | | | Brown-Forman Corp., Class B | | | 1.1 | |
| | 6. | | | United Natural Foods, Inc. | | | 1.1 | |
| | 7. | | | Paychex, Inc. | | | 1.1 | |
| | 8. | | | Trimble Navigation Ltd. | | | 1.1 | |
| | 9. | | | McDermott International, Inc. | | | 1.1 | |
| | 10. | | | Charter Communications, Inc., Class A | | | 1.1 | |
| | | | | | |
| | | |
| 14 | | | | J.P. MORGAN MID CAP/MULTI-CAP FUNDS | | DECEMBER 31, 2013 |
| | | | |
LONG POSITION PORTFOLIO COMPOSITION BY SECTOR*** | |
| Information Technology | | | 20.1 | % |
| Industrials | | | 16.6 | |
| Consumer Discretionary | | | 15.1 | |
| Health Care | | | 11.5 | |
| Consumer Staples | | | 7.9 | |
| Energy | | | 7.2 | |
| Financials | | | 5.5 | |
| Materials | | | 5.5 | |
| Utilities | | | 2.7 | |
| Telecommunication Services | | | 1.4 | |
| Short-Term Investment | | | 6.5 | |
| | | | |
SHORT POSITION PORTFOLIO COMPOSITION BY SECTOR**** | |
| Information Technology | | | 20.5 | % |
| Industrials | | | 18.9 | |
| Consumer Discretionary | | | 15.1 | |
| Health Care | | | 12.2 | |
| Energy | | | 8.9 | |
| Consumer Staples | | | 8.9 | |
| Financials | | | 7.0 | |
| Materials | | | 4.6 | |
| Utilities | | | 3.2 | |
| Telecommunication Services | | | 0.7 | |
| * | | The return shown is based on net asset values calculated for shareholder transactions and may differ from the return shown in the financial highlights, which reflects adjustments made to the net asset values in accordance with accounting principles generally accepted in the United States of America. |
| ** | | The adviser seeks to achieve the Fund’s objective. There can be no guarantee it will be achieved. |
| *** | | Percentages indicated are based on total long investments as of December 31, 2013. The Fund’s portfolio composition is subject to change. |
| **** | | Percentages indicated are based on total short investments as of December 31, 2013. The Fund’s portfolio composition is subject to change. |
| | | | | | | | |
| | | |
| DECEMBER 31, 2013 | | J.P. MORGAN MID CAP/MULTI-CAP FUNDS | | | | | 15 | |
JPMorgan Multi-Cap Market Neutral Fund
FUND COMMENTARY
SIX MONTHS ENDED DECEMBER 31, 2013 (Unaudited) (continued)
| | | | | | | | | | | | | | | | | | | | |
AVERAGE ANNUAL TOTAL RETURNS AS OF DECEMBER 31, 2013 | |
| | | | | |
| | | INCEPTION DATE
OF CLASS | | | 6 MONTH* | | | 1 YEAR | | | 5 YEAR | | | 10 YEAR | |
CLASS A SHARES | | | 5/23/03 | | | | | | | | | | | | | | | | | |
Without Sales Charge | | | | | | | 1.43 | % | | | 4.09 | % | | | (0.28 | )% | | | 1.04 | % |
With Sales Charge** | | | | | | | (3.87 | ) | | | (1.39 | ) | | | (1.35 | ) | | | 0.50 | |
CLASS B SHARES | | | 5/23/03 | | | | | | | | | | | | | | | | | |
Without CDSC | | | | | | | 1.29 | | | | 3.51 | | | | (0.97 | ) | | | 0.44 | |
With CDSC*** | | | | | | | (3.71 | ) | | | (1.49 | ) | | | (1.39 | ) | | | 0.44 | |
CLASS C SHARES | | | 5/23/03 | | | | | | | | | | | | | | | | | |
Without CDSC | | | | | | | 1.18 | | | | 3.51 | | | | (0.99 | ) | | | 0.31 | |
With CDSC**** | | | | | | | 0.18 | | | | 2.51 | | | | (0.99 | ) | | | 0.31 | |
SELECT CLASS SHARES | | | 5/23/03 | | | | 1.61 | | | | 4.34 | | | | (0.02 | ) | | | 1.29 | |
| ** | | Sales Charge for Class A Shares is 5.25%. |
| *** | | Assumes a 5% CDSC (contingent deferred sales charge) for the one year period, 2% CDSC for the five year period and 0% CDSC thereafter. |
| **** | | Assumes a 1% CDSC for the one year period and 0% CDSC thereafter. |
TEN YEAR PERFORMANCE (12/31/03 TO 12/31/13)
The performance quoted is past performance and is not a guarantee of future results. Mutual funds are subject to certain market risks. Investment returns and principal value of an investment will fluctuate so that an investor’s shares, when redeemed, may be worth more or less than their original cost. Current performance may be higher or lower than the performance data shown. For up-to-date month-end performance information please call 1-800-480-4111.
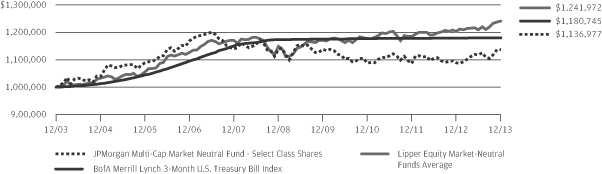
The graph illustrates comparative performance for $1,000,000 invested in Select Class Shares of the JPMorgan Multi-Cap Market Neutral Fund, the BofA Merrill Lynch 3-Month U.S. Treasury Bill Index and the Lipper Equity Market-Neutral Funds Average from December 31, 2003 to December 31, 2013. The performance of the Fund assumes reinvestment of all dividends and capital gain distributions, if any, and does not include a sales charge. The performance of the indices reflects an initial investment at the end of the month following the Fund’s inception. The performance of the BofA Merrill Lynch 3-Month U.S. Treasury Bill Index does not reflect the deduction of expenses or a sales charge associated with a mutual fund and has been adjusted to reflect reinvestment of all dividends and capital gain distributions of the securities included in the benchmark, if applicable. The performance of the Lipper Equity Market-Neutral Funds Average includes expenses associated with a mutual fund, such as investment management fees. These expenses are not identical to the expenses incurred by the Fund. The BofA Merrill Lynch 3-Month U.S. Treasury Bill Index is
comprised of a single issue purchased at the beginning of the month and held for a full month. Each month the index is rebalanced and the issue selected is the outstanding Treasury Bill that matures closest to, but not beyond, 3 months from the rebalancing date. Investors cannot invest directly in an index. The Lipper Equity Market-Neutral Funds Average is an average based on the total returns of all mutual funds within the Fund’s designated category as determined by Lipper, Inc.
Select Class Shares have a $1,000,000 minimum initial investment.
Fund performance may reflect the waiver of the Fund’s fees and reimbursement of expenses for certain periods since the inception date. Without these waivers and reimbursements, performance would have been lower. Also, performance shown in this section does not reflect the deduction of taxes that a shareholder would pay on Fund distributions or redemption of Fund shares.
Because the Class B Shares automatically convert to Class A Shares after eight years, the since inception average annual total return shown above for Class B reflects Class A performance for the period after conversion.
The returns shown are based on net asset values calculated for shareholder transactions and may differ from the returns shown in the financial highlights, which reflect adjustments made to the net asset values in accordance with accounting principles generally accepted in the United States of America.
| | | | | | |
| | | |
| 16 | | | | J.P. MORGAN MID CAP/MULTI-CAP FUNDS | | DECEMBER 31, 2013 |
JPMorgan Value Advantage Fund
FUND COMMENTARY
SIX MONTHS ENDED DECEMBER 31, 2013 (Unaudited)
| | | | |
| REPORTING PERIOD RETURN: | |
| Fund (Institutional Class Shares)* | | | 13.72% | |
| Russell 3000 Value Index | | | 14.60% | |
| |
| Net Assets as of 12/31/2013 (In Thousands) | | $ | 5,458,712 | |
INVESTMENT OBJECTIVE**
The JPMorgan Value Advantage Fund (the “Fund”) seeks to provide long-term total return from a combination of income and capital gains.
WHAT WERE THE MAIN DRIVERS OF THE FUND’S PERFORMANCE?
The Fund (Institutional Class Shares) underperformed the Russell 3000 Value Index (the “Benchmark”) for the six months ended December 31, 2013. The Fund’s stock selection in the materials sector and the materials sector were leading detractors from relative performance, while the Fund’s stock selection in the financials sector and the energy sector were leading contributors to relative performance.
Individual detractors from relative performance included Rayonier Inc., Cisco Systems Inc. and Xcel Energy Inc. Shares of Rayonier, a real estate investment trust that also provides forest products and performance fibers, fell after the company posted significantly lower than expected earnings. Shares of Cisco, a provider of networking products and services, fell on weakness in orders from emerging markets. Shares of Xcel Energy, an electricity and natural gas utility, performed well during the period but the Fund’s lack of a position in the stock hurt performance relative to the Benchmark.
Individual contributors to relative performance included Exxon Mobil Corp., Capital One Financial Corp. and Wells Fargo & Co. Shares of Exxon, an integrated oil and natural gas company, rose on news of its joint venture with Russian oil giant Rosneft, and on expectations of rising demand amid global economic growth. Shares of Capital One, a banking and credit-card lender, gained from better-than-expected earnings. Shares of Wells Fargo, a financial services company, weakened on expectations that rising interest rates would curb demand for the company’s residential mortgage business.
HOW WAS THE FUND POSITIONED?
The Fund’s portfolio managers utilized a bottom-up approach to stock selection and sought to identify durable franchises possessing the ability to generate, in their view, significant levels of free cash flow. The portfolio’s largest overweight continued to be the consumer discretionary sector, where the
Fund’s portfolio managers found what they believed to be compelling investment opportunities. The portfolio’s largest underweight was the industrials sector. In addition, the portfolio’s 2013 relative performance was hindered by above-average cash holdings. The cash position accrued because the Fund’s portfolio managers believed valuations were stretched and they did not want to invest in overvalued securities.
| | | | | | | | |
| TOP TEN EQUITY HOLDINGS OF THE PORTFOLIO*** | |
| | 1. | | | Exxon Mobil Corp. | | | 4.4 | % |
| | 2. | | | Wells Fargo & Co. | | | 4.1 | |
| | 3. | | | Pfizer, Inc. | | | 2.2 | |
| | 4. | | | Capital One Financial Corp. | | | 2.1 | |
| | 5. | | | Loews Corp. | | | 1.8 | |
| | 6. | | | Merck & Co., Inc. | | | 1.7 | |
| | 7. | | | Bank of America Corp. | | | 1.7 | |
| | 8. | | | Johnson & Johnson | | | 1.7 | |
| | 9. | | | Kohl’s Corp. | | | 1.6 | |
| | 10. | | | AutoZone, Inc. | | | 1.5 | |
| | | | |
PORTFOLIO COMPOSITION BY SECTOR*** | |
| Financials | | | 30.4 | % |
| Consumer Discretionary | | | 16.4 | |
| Energy | | | 9.4 | |
| Health Care | | | 9.4 | |
| Utilities | | | 6.5 | |
| Information Technology | | | 6.1 | |
| Industrials | | | 5.8 | |
| Consumer Staples | | | 5.6 | |
| Materials | | | 3.0 | |
| Telecommunication Services | | | 1.0 | |
| Short-Term Investment | | | 6.4 | |
| * | | The return shown is based on net asset values calculated for shareholder transactions and may differ from the return shown in the financial highlights, which reflects adjustments made to the net asset values in accordance with accounting principles generally accepted in the United States of America. |
| ** | | The adviser seeks to achieve the Fund’s objective. There can be no guarantee it will be achieved. |
| *** | | Percentages indicated are based on total investments as of December 31, 2013. The Fund’s portfolio composition is subject to change. |
| | | | | | | | |
| | | |
| DECEMBER 31, 2013 | | J.P. MORGAN MID CAP/MULTI-CAP FUNDS | | | | | 17 | |
JPMorgan Value Advantage Fund
FUND COMMENTARY
SIX MONTHS ENDED DECEMBER 31, 2013 (Unaudited) (continued)
| | | | | | | | | | | | | | | | | | | | |
AVERAGE ANNUAL TOTAL RETURNS AS OF DECEMBER 31, 2013 | |
| | | | | |
| | | INCEPTION DATE
OF CLASS | | | 6 MONTH* | | | 1 YEAR | | | 5 YEAR | | | SINCE
INCEPTION | |
CLASS A SHARES | | | 2/28/05 | | | | | | | | | | | | | | | | | |
Without Sales Charge | | | | | | | 13.43 | % | | | 31.59 | % | | | 20.65 | % | | | 9.41 | % |
With Sales Charge** | | | | | | | 7.45 | | | | 24.66 | | | | 19.36 | | | | 8.75 | |
CLASS C SHARES | | | 2/28/05 | | | | | | | | | | | | | | | | | |
Without CDSC | | | | | | | 13.18 | | | | 30.95 | | | | 20.04 | | | | 8.87 | |
With CDSC*** | | | | | | | 12.18 | | | | 29.95 | | | | 20.04 | | | | 8.87 | |
INSTITUTIONAL CLASS SHARES | | | 2/28/05 | | | | 13.72 | | | | 32.27 | | | | 21.26 | | | | 9.90 | |
SELECT CLASS SHARES | | | 2/28/05 | | | | 13.57 | | | | 31.93 | | | | 20.94 | | | | 9.69 | |
| ** | | Sales Charge for Class A Shares is 5.25%. |
| *** | | Assumes a 1% CDSC (contingent deferred sales charge) for the one year period and 0% CDSC thereafter. |
LIFE OF FUND PERFORMANCE (2/28/05 TO 12/31/13)
The performance quoted is past performance and is not a guarantee of future results. Mutual funds are subject to certain market risks. Investment returns and principal value of an investment will fluctuate so that an investor’s shares, when redeemed, may be worth more or less than their original cost. Current performance may be higher or lower than the performance data shown. For up-to-date month-end performance information please call 1-800-480-4111.
The Fund commenced operations on February 28, 2005.
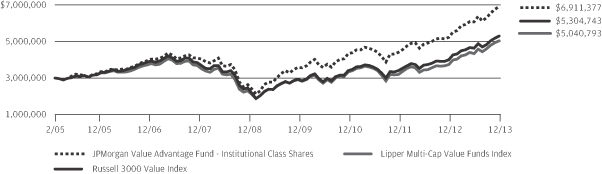
The graph illustrates comparative performance for $3,000,000 invested in Institutional Class Shares of the JPMorgan Value Advantage Fund, the Russell 3000 Value Index and the Lipper Multi-Cap Value Funds Index from February 28, 2005 to December 31, 2013. The performance of the Fund assumes reinvestment of all dividends and capital gain distributions, if any, and does not include a sales charge. The performance of the Russell 3000 Value Index does not reflect the deduction of expenses or a sales charge associated with a mutual fund and has been adjusted to reflect reinvestment of all dividends and capital gain distributions of the securities included in the benchmark, if applicable. The performance of the Lipper Multi-Cap Value Funds Index includes expenses associated with a mutual fund, such as investment
management fees. These expenses are not identical to the expenses incurred by the Fund. The Russell 3000 Value Index is an unmanaged index which measures the performance of those Russell 3000 companies (largest 3000 U.S. companies) with lower price-to-book ratios and lower forecasted growth values. The Lipper Multi-Cap Value Funds Index is an index based on total returns of certain mutual funds within the Fund’s designated category as determined by Lipper, Inc. Investors cannot invest directly in an index.
Institutional Class Shares have a $3,000,000 minimum initial investment.
Fund performance may reflect the waiver of the Fund’s fees and reimbursement of expenses for certain periods since the inception date. Without these waivers and reimbursements, performance would have been lower. Also, performance shown in this section does not reflect the deduction of taxes that a shareholder would pay on Fund distributions or redemption of Fund shares.
The returns shown are based on net asset values calculated for shareholder transactions and may differ from the returns shown in the financial highlights, which reflect adjustments made to the net asset values in accordance with accounting principles generally accepted in the United States of America.
| | | | | | |
| | | |
| 18 | | | | J.P. MORGAN MID CAP/MULTI-CAP FUNDS | | DECEMBER 31, 2013 |
JPMorgan Growth Advantage Fund
SCHEDULE OF PORTFOLIO INVESTMENTS
AS OF DECEMBER 31, 2013 (Unaudited)
(Amounts in thousands)
| | | | | | | | |
| SHARES | | | SECURITY DESCRIPTION | | VALUE($) | |
| Common Stocks — 97.4% | | | | |
| | | | Consumer Discretionary — 20.0% | | | | |
| | | | Automobiles — 2.8% | | | | |
| | 955 | | | Harley-Davidson, Inc. | | | 66,110 | |
| | 105 | | | Tesla Motors, Inc. (a) | | | 15,715 | |
| | | | | | | | |
| | | | | | | 81,825 | |
| | | | | | | | |
| | | | Hotels, Restaurants & Leisure — 3.9% | | | | |
| | 762 | | | Apollo Global Management LLC, Class A | | | 24,092 | |
| | 1,089 | | | Hilton Worldwide Holdings, Inc. (a) | | | 24,239 | |
| | 399 | | | Las Vegas Sands Corp. | | | 31,454 | |
| | 461 | | | Starbucks Corp. | | | 36,122 | |
| | | | | | | | |
| | | | | | | 115,907 | |
| | | | | | | | |
| | | | Household Durables — 1.3% | | | | |
| | 266 | | | Mohawk Industries, Inc. (a) | | | 39,592 | |
| | | | | | | | |
| | | | Internet & Catalog Retail — 4.3% | | | | |
| | 158 | | | Amazon.com, Inc. (a) | | | 62,969 | |
| | 68 | | | Netflix, Inc. (a) | | | 24,888 | |
| | 32 | | | priceline.com, Inc. (a) | | | 37,662 | |
| | | | | | | | |
| | | | | | | 125,519 | |
| | | | | | | | |
| | | | Specialty Retail — 4.7% | | | | |
| | 270 | | | Advance Auto Parts, Inc. | | | 29,906 | |
| | 812 | | | GameStop Corp., Class A | | | 40,019 | |
| | 526 | | | Home Depot, Inc. (The) | | | 43,278 | |
| | 446 | | | Williams-Sonoma, Inc. | | | 26,004 | |
| | | | | | | | |
| | | | | | | 139,207 | |
| | | | | | | | |
| | | | Textiles, Apparel & Luxury Goods — 3.0% | | | | |
| | 512 | | | Lululemon Athletica, Inc., (Canada) (a) | | | 30,223 | |
| | 483 | | | Michael Kors Holdings Ltd., (Hong Kong) (a) | | | 39,239 | |
| | 601 | | | Wolverine World Wide, Inc. | | | 20,397 | |
| | | | | | | | |
| | | | | | | 89,859 | |
| | | | | | | | |
| | | | Total Consumer Discretionary | | | 591,909 | |
| | | | | | | | |
| | | | Energy — 4.8% | | | | |
| | | | Energy Equipment & Services — 1.5% | | | | |
| | 206 | | | Dril-Quip, Inc. (a) | | | 22,635 | |
| | 828 | | | Frank’s International N.V., (Netherlands) | | | 22,361 | |
| | | | | | | | |
| | | | | | | 44,996 | |
| | | | | | | | |
| | | | Oil, Gas & Consumable Fuels — 3.3% | | | | |
| | 294 | | | Antero Resources Corp. (a) | | | 18,633 | |
| | 736 | | | Cabot Oil & Gas Corp. | | | 28,531 | |
| | 220 | | | Concho Resources, Inc. (a) | | | 23,760 | |
| | 333 | | | Phillips 66 | | | 25,684 | |
| | | | | | | | |
| | | | | | | 96,608 | |
| | | | | | | | |
| | | | Total Energy | | | 141,604 | |
| | | | | | | | |
| | | | | | | | |
| SHARES | | | SECURITY DESCRIPTION | | VALUE($) | |
| | | | | |
| | | | Financials — 8.1% | | | | |
| | | | Capital Markets — 2.1% | | | | |
| | 199 | | | Affiliated Managers Group, Inc. (a) | | | 43,159 | |
| | 419 | | | Lazard Ltd., (Bermuda), Class A | | | 18,971 | |
| | | | | | | | |
| | | | | | | 62,130 | |
| | | | | | | | |
| | | | Commercial Banks — 1.8% | | | | |
| | 766 | | | East West Bancorp, Inc. | | | 26,791 | |
| | 266 | | | Signature Bank (a) | | | 28,563 | |
| | | | | | | | |
| | | | | | | 55,354 | |
| | | | | | | | |
| | | | Diversified Financial Services — 1.3% | | | | |
| | 480 | | | Moody’s Corp. | | | 37,681 | |
| | | | | | | | |
| | | | Insurance — 1.7% | | | | |
| | 266 | | | ACE Ltd., (Switzerland) | | | 27,487 | |
| | 681 | | | Amtrust Financial Services, Inc. | | | 22,260 | |
| | | | | | | | |
| | | | | | | 49,747 | |
| | | | | | | | |
| | | | Real Estate Management & Development — 1.2% | |
| | 1,349 | | | CBRE Group, Inc., Class A (a) | | | 35,484 | |
| | | | | | | | |
| | | | Total Financials | | | 240,396 | |
| | | | | | | | |
| | | | Health Care — 14.9% | | | | |
| | | | Biotechnology — 7.8% | | | | |
| | 209 | | | Aegerion Pharmaceuticals, Inc. (a) | | | 14,809 | |
| | 177 | | | Biogen Idec, Inc. (a) | | | 49,376 | |
| | 365 | | | Celgene Corp. (a) | | | 61,586 | |
| | 1,059 | | | Gilead Sciences, Inc. (a) | | | 79,614 | |
| | 95 | | | Regeneron Pharmaceuticals, Inc. (a) | | | 26,120 | |
| | | | | | | | |
| | | | | | | 231,505 | |
| | | | | | | | |
| | | | Health Care Equipment & Supplies — 0.6% | | | | |
| | 1,081 | | | Novadaq Technologies, Inc., (Canada) (a) | | | 17,817 | |
| | | | | | | | |
| | | | Health Care Providers & Services — 2.7% | | | | |
| | 452 | | | Acadia Healthcare Co., Inc. (a) | | | 21,384 | |
| | 544 | | | Premier, Inc., Class A (a) | | | 20,005 | |
| | 487 | | | UnitedHealth Group, Inc. | | | 36,663 | |
| | | | | | | | |
| | | | | | | 78,052 | |
| | | | | | | | |
| | | | Life Sciences Tools & Services — 2.5% | | | | |
| | 681 | | | Agilent Technologies, Inc. | | | 38,935 | |
| | 310 | | | Illumina, Inc. (a) | | | 34,281 | |
| | | | | | | | |
| | | | | | | 73,216 | |
| | | | | | | | |
| | | | Pharmaceuticals — 1.3% | | | | |
| | 328 | | | Valeant Pharmaceuticals International, Inc. (a) | | | 38,542 | |
| | | | | | | | |
| | | | Total Health Care | | | 439,132 | |
| | | | | | | | |
| | | | Industrials — 17.8% | | | | |
| | | | Aerospace & Defense — 1.3% | | | | |
| | 143 | | | Precision Castparts Corp. | | | 38,537 | |
| | | | | | | | |
SEE NOTES TO FINANCIAL STATEMENTS.
| | | | | | | | |
| | | |
| DECEMBER 31, 2013 | | J.P. MORGAN MID CAP/MULTI-CAP FUNDS | | | | | 19 | |
JPMorgan Growth Advantage Fund
SCHEDULE OF PORTFOLIO INVESTMENTS
AS OF DECEMBER 31, 2013 (Unaudited) (continued)
(Amounts in thousands)
| | | | | | | | |
| SHARES | | | SECURITY DESCRIPTION | | VALUE($) | |
| Common Stocks — Continued | | | | |
| | | | Airlines — 0.9% | | | | |
| | 985 | | | Delta Air Lines, Inc. | | | 27,050 | |
| | | | | | | | |
| | | | Building Products — 1.2% | | | | |
| | 780 | | | Fortune Brands Home & Security, Inc. | | | 35,660 | |
| | | | | | | | |
| | | | Electrical Equipment — 1.6% | | | | |
| | 432 | | | Acuity Brands, Inc. | | | 47,193 | |
| | | | | | | | |
| | | | Industrial Conglomerates — 1.4% | | | | |
| | 503 | | | Carlisle Cos., Inc. | | | 39,946 | |
| | | | | | | | |
| | | | Machinery — 3.1% | | | | |
| | 596 | | | Flowserve Corp. | | | 46,990 | |
| | 522 | | | Pall Corp. | | | 44,536 | |
| | | | | | | | |
| | | | | | | 91,526 | |
| | | | | | | | |
| | | | Marine — 1.0% | | | | |
| | 307 | | | Kirby Corp. (a) | | | 30,430 | |
| | | | | | | | |
| | | | Professional Services — 1.3% | | | | |
| | 302 | | | Towers Watson & Co., Class A | | | 38,525 | |
| | | | | | | | |
| | | | Road & Rail — 3.1% | | | | |
| | 201 | | | Canadian Pacific Railway Ltd., (Canada) | | | 30,370 | |
| | 1,153 | | | Hertz Global Holdings, Inc. (a) | | | 32,999 | |
| | 541 | | | Old Dominion Freight Line, Inc. (a) | | | 28,660 | |
| | | | | | | | |
| | | | | | | 92,029 | |
| | | | | | | | |
| | | | Trading Companies & Distributors — 2.9% | | | | |
| | 781 | | | Air Lease Corp. | | | 24,264 | |
| | 1,119 | | | HD Supply Holdings, Inc. (a) | | | 26,855 | |
| | 592 | | | Rush Enterprises, Inc., Class A (a) | | | 17,541 | |
| | 179 | | | Watsco, Inc. | | | 17,176 | |
| | | | | | | | |
| | | | | | | 85,836 | |
| | | | | | | | |
| | | | Total Industrials | | | 526,732 | |
| | | | | | | | |
| | | | Information Technology — 29.0% | | | | |
| | | | Communications Equipment — 2.0% | | | | |
| | 959 | | | Ciena Corp. (a) | | | 22,958 | |
| | 350 | | | Palo Alto Networks, Inc. (a) | | | 20,126 | |
| | 1,222 | | | Ruckus Wireless, Inc. (a) | | | 17,359 | |
| | | | | | | | |
| | | | | | | 60,443 | |
| | | | | | | | |
| | | | Computers & Peripherals — 3.0% | | | | |
| | 156 | | | Apple, Inc. | | | 87,617 | |
| | | | | | | | |
| | | | Electronic Equipment, Instruments & Components — 1.0% | |
| | 335 | | | Amphenol Corp., Class A | | | 29,831 | |
| | | | | | | | |
| | | | Internet Software & Services — 8.7% | | | | |
| | 491 | | | Dealertrack Technologies, Inc. (a) | | | 23,617 | |
| | 1,028 | | | Facebook, Inc., Class A (a) | | | 56,212 | |
| | 106 | | | Google, Inc., Class A (a) | | | 119,244 | |
| | 99 | | | LinkedIn Corp., Class A (a) | | | 21,444 | |
| | 565 | | | Trulia, Inc. (a) | | | 19,942 | |
| | | | | | | | |
| SHARES | | | SECURITY DESCRIPTION | | VALUE($) | |
| | | | | |
| | | | Internet Software & Services — Continued | | | | |
| | 239 | | | Twitter, Inc. (a) | | | 15,231 | |
| | | | | | | | |
| | | | | | | 255,690 | |
| | | | | | | | |
| | | | IT Services — 6.6% | | | | |
| | 155 | | | Alliance Data Systems Corp. (a) | | | 40,859 | |
| | 385 | | | Cognizant Technology Solutions Corp., Class A (a) | | | 38,898 | |
| | 257 | | | FleetCor Technologies, Inc. (a) | | | 30,089 | |
| | 100 | | | MasterCard, Inc., Class A | | | 83,797 | |
| | | | | | | | |
| | | | | | | 193,643 | |
| | | | | | | | |
| | | | Semiconductors & Semiconductor Equipment — 2.9% | |
| | 1,668 | | | Applied Materials, Inc. | | | 29,500 | |
| | 620 | | | Avago Technologies Ltd., (Singapore) | | | 32,776 | |
| | 428 | | | Lam Research Corp. (a) | | | 23,299 | |
| | | | | | | | |
| | | | | | | 85,575 | |
| | | | | | | | |
| | | | Software — 4.8% | | | | |
| | 521 | | | Adobe Systems, Inc. (a) | | | 31,198 | |
| | 63 | | | CommVault Systems, Inc. (a) | | | 4,745 | |
| | 469 | | | Infoblox, Inc. (a) | | | 15,473 | |
| | 781 | | | Microsoft Corp. | | | 29,233 | |
| | 329 | | | ServiceNow, Inc. (a) | | | 18,433 | |
| | 228 | | | Splunk, Inc. (a) | | | 15,664 | |
| | 336 | | | Workday, Inc., Class A (a) | | | 27,958 | |
| | | | | | | | |
| | | | | | | 142,704 | |
| | | | | | | | |
| | | | Total Information Technology | | | 855,503 | |
| | | | | | | | |
| | | | Materials — 2.8% | | | | |
| | | | Chemicals — 2.8% | | | | |
| | 210 | | | Ecolab, Inc. | | | 21,939 | |
| | 188 | | | PPG Industries, Inc. | | | 35,656 | |
| | 129 | | | Sherwin-Williams Co. (The) | | | 23,653 | |
| | | | | | | | |
| | | | Total Materials | | | 81,248 | |
| | | | | | | | |
| | | | Total Common Stocks
(Cost $1,991,366) | | | 2,876,524 | |
| | | | | | | | |
| Short-Term Investment — 2.8% | | | | |
| | | | Investment Company — 2.8% | | | | |
| | 81,356 | | | JPMorgan Prime Money Market Fund, Institutional Class Shares, 0.010% (b) (l) (m)
(Cost $81,356) | | | 81,356 | |
| | | | | | | | |
| | | | Total Investments — 100.2%
(Cost $2,072,722) | | | 2,957,880 | |
| | | | Liabilities in Excess of
Other Assets — (0.2)% | | | (4,998 | ) |
| | | | | | | | |
| | | | NET ASSETS — 100.0% | | $ | 2,952,882 | |
| | | | | | | | |
Percentages indicated are based on net assets.
SEE NOTES TO FINANCIAL STATEMENTS.
| | | | | | |
| | | |
| 20 | | | | J.P. MORGAN MID CAP/MULTI-CAP FUNDS | | DECEMBER 31, 2013 |
JPMorgan Mid Cap Core Fund
SCHEDULE OF PORTFOLIO INVESTMENTS
AS OF DECEMBER 31, 2013 (Unaudited)
(Amounts in thousands)
| | | | | | | | |
| SHARES | | | SECURITY DESCRIPTION | | VALUE($) | |
| Common Stocks — 97.8% | | | | |
| | | | Consumer Discretionary — 21.9% | | | | |
| | | | Auto Components — 0.5% | | | | |
| | 94 | | | BorgWarner, Inc. | | | 5,233 | |
| | | | | | | | |
| | | | Automobiles — 1.7% | |
| | 198 | | | Harley-Davidson, Inc. | | | 13,726 | |
| | 28 | | | Tesla Motors, Inc. (a) | | | 4,226 | |
| | | | | | | | |
| | | | | | | 17,952 | |
| | | | | | | | |
| | | | Distributors — 0.2% | | | | |
| | 30 | | | Genuine Parts Co. | | | 2,507 | |
| | | | | | | | |
| | | | Hotels, Restaurants & Leisure — 3.1% | |
| | 5 | | | Chipotle Mexican Grill, Inc. (a) | | | 2,877 | |
| | 17 | | | Darden Restaurants, Inc. | | | 917 | |
| | 17 | | | Extended Stay America, Inc. (a) | | | 449 | |
| | 186 | | | Hilton Worldwide Holdings, Inc. (a) | | | 4,141 | |
| | 101 | | | Marriott International, Inc., Class A | | | 4,981 | |
| | 140 | | | Norwegian Cruise Line Holdings Ltd. (a) | | | 4,969 | |
| | 22 | | | Panera Bread Co., Class A (a) | | | 3,799 | |
| | 29 | | | Wynn Resorts Ltd. | | | 5,535 | |
| | 50 | | | Yum! Brands, Inc. | | | 3,795 | |
| | | | | | | | |
| | | | | | | 31,463 | |
| | | | | | | | |
| | | | Household Durables — 1.7% | | | | |
| | 75 | | | Jarden Corp. (a) | | | 4,608 | |
| | 86 | | | Mohawk Industries, Inc. (a) | | | 12,776 | |
| | | | | | | | |
| | | | | | | 17,384 | |
| | | | | | | | |
| | | | Internet & Catalog Retail — 1.5% | | | | |
| | 103 | | | Expedia, Inc. | | | 7,174 | |
| | 18 | | | Netflix, Inc. (a) | | | 6,664 | |
| | 14 | | | TripAdvisor, Inc. (a) | | | 1,168 | |
| | | | | | | | |
| | | | | | | 15,006 | |
| | | | | | | | |
| | | | Media — 2.1% | | | | |
| | 63 | | | CBS Corp. (Non-Voting), Class B | | | 3,993 | |
| | 108 | | | Clear Channel Outdoor Holdings, Inc. Class A | | | 1,100 | |
| | 67 | | | Discovery Communications, Inc., Class A (a) | | | 6,094 | |
| | 125 | | | DISH Network Corp., Class A (a) | | | 7,267 | |
| | 120 | | | Gannett Co., Inc. | | | 3,555 | |
| | | | | | | | |
| | | | | | | 22,009 | |
| | | | | | | | |
| | | | Multiline Retail — 1.3% | | | | |
| | 75 | | | Family Dollar Stores, Inc. | | | 4,884 | |
| | 141 | | | Kohl’s Corp. | | | 7,974 | |
| | | | | | | | |
| | | | | | | 12,858 | |
| | | | | | | | |
| | | | Specialty Retail — 7.3% | | | | |
| | 48 | | | Advance Auto Parts, Inc. | | | 5,301 | |
| | 17 | | | AutoZone, Inc. (a) | | | 7,985 | |
| | | | | | | | |
| SHARES | | | SECURITY DESCRIPTION | | VALUE($) | |
| | | | | |
| | | | Specialty Retail — Continued | | | | |
| | 52 | | | Bed Bath & Beyond, Inc. (a) | | | 4,138 | |
| | 142 | | | GameStop Corp., Class A | | | 7,005 | |
| | 193 | | | Gap, Inc. (The) | | | 7,527 | |
| | 48 | | | O’Reilly Automotive, Inc. (a) | | | 6,204 | |
| | 76 | | | PetSmart, Inc. | | | 5,530 | |
| | 85 | | | Ross Stores, Inc. | | | 6,399 | |
| | 82 | | | Signet Jewelers Ltd. (Bermuda) | | | 6,430 | |
| | 35 | | | Tiffany & Co. | | | 3,231 | |
| | 73 | | | TJX Cos., Inc. | | | 4,641 | |
| | 103 | | | Urban Outfitters, Inc. (a) | | | 3,821 | |
| | 127 | | | Williams-Sonoma, Inc. | | | 7,423 | |
| | | | | | | | |
| | | | | | | 75,635 | |
| | | | | | | | |
| | | | Textiles, Apparel & Luxury Goods — 2.5% | | | | |
| | 89 | | | Lululemon Athletica, Inc., (Canada) (a) | | | 5,277 | |
| | 111 | | | Michael Kors Holdings Ltd., (Hong Kong) (a) | | | 8,972 | |
| | 39 | | | PVH Corp. | | | 5,291 | |
| | 41 | | | Under Armour, Inc., Class A (a) | | | 3,579 | |
| | 37 | | | V.F. Corp. | | | 2,308 | |
| | | | | | | | |
| | | | | | | 25,427 | |
| | | | | | | | |
| | | | Total Consumer Discretionary | | | 225,474 | |
| | | | | | | | |
| | | | Consumer Staples — 2.3% | | | | |
| | | | Beverages — 1.1% | |
| | 69 | | | Beam, Inc. | | | 4,695 | |
| | 20 | | | Brown-Forman Corp., Class B | | | 1,525 | |
| | 106 | | | Dr. Pepper Snapple Group, Inc. | | | 5,184 | |
| | | | | | | | |
| | | | | | | 11,404 | |
| | | | | | | | |
| | | | Food & Staples Retailing — 0.5% | |
| | 122 | | | Kroger Co. (The) | | | 4,809 | |
| | | | | | | | |
| | | | Food Products — 0.3% | |
| | 39 | | | Hershey Co. (The) | | | 3,770 | |
| | | | | | | | |
| | | | Household Products — 0.4% | |
| | 36 | | | Energizer Holdings, Inc. | | | 3,880 | |
| | | | | | | | |
| | | | Total Consumer Staples | | | 23,863 | |
| | | | | | | | |
| | | | Energy — 4.7% | | | | |
| | | | Energy Equipment & Services — 0.4% | |
| | 149 | | | Frank’s International N.V., (Netherlands) | | | 4,018 | |
| | | | | | | | |
| | | | Oil, Gas & Consumable Fuels — 4.3% | |
| | 52 | | | Antero Resources Corp. (a) | | | 3,311 | |
| | 166 | | | Cabot Oil & Gas Corp. | | | 6,434 | |
| | 54 | | | Concho Resources, Inc. (a) | | | 5,854 | |
| | 77 | | | Energen Corp. | | | 5,453 | |
| | 49 | | | EQT Corp. | | | 4,414 | |
SEE NOTES TO FINANCIAL STATEMENTS.
| | | | | | | | |
| | | |
| DECEMBER 31, 2013 | | J.P. MORGAN MID CAP/MULTI-CAP FUNDS | | | | | 21 | |
JPMorgan Mid Cap Core Fund
SCHEDULE OF PORTFOLIO INVESTMENTS
AS OF DECEMBER 31, 2013 (Unaudited) (continued)
(Amounts in thousands)
| | | | | | | | |
| SHARES | | | SECURITY DESCRIPTION | | VALUE($) | |
| Common Stocks — Continued | | | | |
| | | | Oil, Gas & Consumable Fuels — Continued | |
| | 110 | | | PBF Energy, Inc., Class A | | | 3,462 | |
| | 95 | | | Plains All American Pipeline LP | | | 4,913 | |
| | 131 | | | QEP Resources, Inc. | | | 4,003 | |
| | 58 | | | Southwestern Energy Co. (a) | | | 2,269 | |
| | 101 | | | Williams Cos., Inc. (The) | | | 3,893 | |
| | | | | | | | |
| | | | | | | 44,006 | |
| | | | | | | | |
| | | | Total Energy | | | 48,024 | |
| | | | | | | | |
| | | | Financials — 19.4% | | | | |
| | | | Capital Markets — 4.9% | |
| | 42 | | | Affiliated Managers Group, Inc. (a) | | | 9,065 | |
| | 69 | | | Ameriprise Financial, Inc. | | | 7,881 | |
| | 181 | | | Blackstone Group LP (The) | | | 5,705 | |
| | 141 | | | Invesco Ltd. | | | 5,131 | |
| | 100 | | | Lazard Ltd., (Bermuda), Class A | | | 4,545 | |
| | 47 | | | Legg Mason, Inc. | | | 2,036 | |
| | 81 | | | Northern Trust Corp. | | | 5,002 | |
| | 70 | | | T. Rowe Price Group, Inc. | | | 5,829 | |
| | 168 | | | TD Ameritrade Holding Corp. | | | 5,157 | |
| | | | | | | | |
| | | | | | | 50,351 | |
| | | | | | | | |
| | | | Commercial Banks — 4.2% | |
| | 44 | | | City National Corp. | | | 3,478 | |
| | 17 | | | Cullen/Frost Bankers, Inc. | | | 1,247 | |
| | 164 | | | East West Bancorp, Inc. | | | 5,749 | |
| | 363 | | | Fifth Third Bancorp | | | 7,630 | |
| | 59 | | | First Republic Bank | | | 3,071 | |
| | 245 | | | Huntington Bancshares, Inc. | | | 2,366 | |
| | 54 | | | M&T Bank Corp. | | | 6,231 | |
| | 50 | | | Signature Bank (a) | | | 5,317 | |
| | 158 | | | SunTrust Banks, Inc. | | | 5,818 | |
| | 90 | | | Zions Bancorporation | | | 2,683 | |
| | | | | | | | |
| | | | | | | 43,590 | |
| | | | | | | | |
| | | | Diversified Financial Services — 0.9% | |
| | 114 | | | Moody’s Corp. | | | 8,938 | |
| | | | | | | | |
| | | | Insurance — 5.6% | |
| | 9 | | | Alleghany Corp. (a) | | | 3,530 | |
| | 78 | | | Aon plc, (United Kingdom) | | | 6,560 | |
| | 81 | | | Axis Capital Holdings Ltd., (Bermuda) | | | 3,848 | |
| | 37 | | | Chubb Corp. (The) | | | 3,620 | |
| | 126 | | | Hartford Financial Services Group, Inc. | | | 4,565 | |
| | 186 | | | Loews Corp. | | | 8,960 | |
| | 196 | | | Marsh & McLennan Cos., Inc. | | | 9,475 | |
| | 202 | | | Old Republic International Corp. | | | 3,493 | |
| | 134 | | | Unum Group | | | 4,711 | |
| | | | | | | | |
| SHARES | | | SECURITY DESCRIPTION | | VALUE($) | |
| | | | | |
| | | | Insurance — Continued | |
| | 94 | | | W.R. Berkley Corp. | | | 4,061 | |
| | 138 | | | XL Group plc, (Ireland) | | | 4,407 | |
| | | | | | | | |
| | | | | | | 57,230 | |
| | | | | | | | |
| | | | Real Estate Investment Trusts (REITs) — 2.7% | |
| | 75 | | | American Campus Communities, Inc. | | | 2,408 | |
| | 153 | | | American Homes 4 Rent, Class A | | | 2,476 | |
| | 25 | | | AvalonBay Communities, Inc. | | | 2,956 | |
| | 62 | | | Brixmor Property Group, Inc. (a) | | | 1,260 | |
| | 95 | | | HCP, Inc. | | | 3,468 | |
| | 236 | | | Kimco Realty Corp. | | | 4,670 | |
| | 60 | | | Rayonier, Inc. | | | 2,534 | |
| | 63 | | | Regency Centers Corp. | | | 2,937 | |
| | 58 | | | Vornado Realty Trust | | | 5,190 | |
| | | | | | | | |
| | | | | | | 27,899 | |
| | | | | | | | |
| | | | Real Estate Management & Development — 1.0% | |
| | 182 | | | Brookfield Office Properties, Inc. | | | 3,500 | |
| | 271 | | | CBRE Group, Inc., Class A (a) | | | 7,114 | |
| | | | | | | | |
| | | | | | | 10,614 | |
| | | | | | | | |
| | | | Thrifts & Mortgage Finance — 0.1% | |
| | 134 | | | Hudson City Bancorp, Inc. | | | 1,268 | |
| | | | | | | | |
| | | | Total Financials | | | 199,890 | |
| | | | | | | | |
| | | | Health Care — 9.4% | | | | |
| | | | Biotechnology — 1.1% | |
| | 47 | | | Alexion Pharmaceuticals, Inc. (a) | | | 6,307 | |
| | 68 | | | Vertex Pharmaceuticals, Inc. (a) | | | 5,045 | |
| | | | | | | | |
| | | | | | | 11,352 | |
| | | | | | | | |
| | | | Health Care Equipment & Supplies — 0.9% | |
| | 102 | | | CareFusion Corp. (a) | | | 4,045 | |
| | 76 | | | Sirona Dental Systems, Inc. (a) | | | 5,356 | |
| | | | | | | | |
| | | | | | | 9,401 | |
| | | | | | | | |
| | | | Health Care Providers & Services — 3.8% | |
| | 74 | | | AmerisourceBergen Corp. | | | 5,236 | |
| | 169 | | | Brookdale Senior Living, Inc. (a) | | | 4,591 | |
| | 80 | | | Cigna Corp. | | | 6,965 | |
| | 130 | | | Envision Healthcare Holdings, Inc. (a) | | | 4,607 | |
| | 28 | | | Henry Schein, Inc. (a) | | | 3,237 | |
| | 102 | | | Humana, Inc. | | | 10,560 | |
| | 103 | | | Premier, Inc., Class A (a) | | | 3,779 | |
| | | | | | | | |
| | | | | | | 38,975 | |
| | | | | | | | |
| | | | Life Sciences Tools & Services — 2.1% | |
| | 151 | | | Agilent Technologies, Inc. | | | 8,614 | |
| | 172 | | | Bruker Corp. (a) | | | 3,399 | |
SEE NOTES TO FINANCIAL STATEMENTS.
| | | | | | |
| | | |
| 22 | | | | J.P. MORGAN MID CAP/MULTI-CAP FUNDS | | DECEMBER 31, 2013 |
| | | | | | | | |
| SHARES | | | SECURITY DESCRIPTION | | VALUE($) | |
| Common Stocks — Continued | | | | |
| | | | Life Sciences Tools & Services — Continued | |
| | 83 | | | Illumina, Inc. (a) | | | 9,137 | |
| | | | | | | | |
| | | | | | | 21,150 | |
| | | | | | | | |
| | | | Pharmaceuticals — 1.5% | | | | |
| | 44 | | | Actavis plc (a) | | | 7,375 | |
| | 21 | | | Jazz Pharmaceuticals plc, (Ireland) (a) | | | 2,645 | |
| | 46 | | | Valeant Pharmaceuticals International, Inc. (a) | | | 5,365 | |
| | | | | | | | |
| | | | | | | 15,385 | |
| | | | | | | | |
| | | | Total Health Care | | | 96,263 | |
| | | | | | | | |
| | | | Industrials — 16.3% | | | | |
| | | | Aerospace & Defense — 0.2% | | | | |
| | 60 | | | DigitalGlobe, Inc. (a) | | | 2,448 | |
| | | | | | | | |
| | | | Airlines — 0.7% | | | | |
| | 259 | | | Delta Air Lines, Inc. | | | 7,117 | |
| | | | | | | | |
| | | | Building Products — 1.1% | | | | |
| | 245 | | | Fortune Brands Home & Security, Inc. | | | 11,206 | |
| | | | | | | | |
| | | | Commercial Services & Supplies — 0.6% | | | | |
| | 54 | | | Stericycle, Inc. (a) | | | 6,273 | |
| | | | | | | | |
| | | | Construction & Engineering — 0.5% | | | | |
| | 64 | | | Fluor Corp. | | | 5,171 | |
| | | | | | | | |
| | | | Electrical Equipment — 2.9% | | | | |
| | 75 | | | Acuity Brands, Inc. | | | 8,221 | |
| | 103 | | | AMETEK, Inc. | | | 5,420 | |
| | 107 | | | Generac Holdings, Inc. | | | 6,055 | |
| | 38 | | | Hubbell, Inc., Class B | | | 4,095 | |
| | 80 | | | Regal-Beloit Corp. | | | 5,861 | |
| | | | | | | | |
| | | | | | | 29,652 | |
| | | | | | | | |
| | | | Industrial Conglomerates — 1.3% | | | | |
| | 173 | | | Carlisle Cos., Inc. | | | 13,770 | |
| | | | | | | | |
| | | | Machinery — 3.7% | | | | |
| | 121 | | | Flowserve Corp. | | | 9,523 | |
| | 88 | | | IDEX Corp. | | | 6,501 | |
| | 108 | | | Pall Corp. | | | 9,218 | |
| | 103 | | | Rexnord Corp. (a) | | | 2,779 | |
| | 52 | | | Snap-on, Inc. | | | 5,670 | |
| | 46 | | | WABCO Holdings, Inc. (a) | | | 4,259 | |
| | | | | | | | |
| | | | | | | 37,950 | |
| | | | | | | | |
| | | | Marine — 0.6% | | | | |
| | 65 | | | Kirby Corp. (a) | | | 6,461 | |
| | | | | | | | |
| | | | Professional Services — 1.0% | | | | |
| | 88 | | | Equifax, Inc. | | | 6,079 | |
| | 33 | | | Towers Watson & Co., Class A | | | 4,147 | |
| | | | | | | | |
| | | | | | | 10,226 | |
| | | | | | | | |
| | | | | | | | |
| SHARES | | | SECURITY DESCRIPTION | | VALUE($) | |
| | | | | |
| | | | Road & Rail — 1.7% | | | | |
| | 36 | | | Canadian Pacific Railway Ltd., (Canada) | | | 5,402 | |
| | 267 | | | Hertz Global Holdings, Inc. (a) | | | 7,647 | |
| | 55 | | | J.B. Hunt Transport Services, Inc. | | | 4,283 | |
| | | | | | | | |
| | | | | | | 17,332 | |
| | | | | | | | |
| | | | Trading Companies & Distributors — 2.0% | | | | |
| | 160 | | | Air Lease Corp. | | | 4,979 | |
| | 197 | | | HD Supply Holdings, Inc. (a) | | | 4,723 | |
| | 128 | | | MSC Industrial Direct Co., Inc., Class A | | | 10,387 | |
| | | | | | | | |
| | | | | | | 20,089 | |
| | | | | | | | |
| | | | Total Industrials | | | 167,695 | |
| | | | | | | | |
| | | | Information Technology — 14.4% | | | | |
| | | | Communications Equipment — 1.2% | | | | |
| | 134 | | | Aruba Networks, Inc. (a) | | | 2,400 | |
| | 171 | | | Ciena Corp. (a) | | | 4,083 | |
| | 123 | | | CommScope Holding Co., Inc. (a) | | | 2,333 | |
| | 72 | | | Palo Alto Networks, Inc. (a) | | | 4,155 | |
| | | | | | | | |
| | | | | | | 12,971 | |
| | | | | | | | |
| | | | Computers & Peripherals — 0.3% | | | | |
| | 32 | | | 3D Systems Corp. (a) | | | 2,927 | |
| | | | | | | | |
| | | | Electronic Equipment, Instruments & Components — 2.3% | |
| | 184 | | | Amphenol Corp., Class A | | | 16,385 | |
| | 138 | | | Arrow Electronics, Inc. (a) | | | 7,490 | |
| | | | | | | | |
| | | | | | | 23,875 | |
| | | | | | | | |
| | | | Internet Software & Services — 0.5% | | | | |
| | 22 | | | LinkedIn Corp., Class A (a) | | | 4,792 | |
| | | | | | | | |
| | | | IT Services — 2.8% | | | | |
| | 40 | | | Alliance Data Systems Corp. (a) | | | 10,517 | |
| | 128 | | | CoreLogic, Inc. (a) | | | 4,534 | |
| | 53 | | | FleetCor Technologies, Inc. (a) | | | 6,257 | |
| | 120 | | | Jack Henry & Associates, Inc. | | | 7,123 | |
| | | | | | | | |
| | | | | | | 28,431 | |
| | | | | | | | |
| | | | Semiconductors & Semiconductor Equipment — 4.4% | |
| | 142 | | | Analog Devices, Inc. | | | 7,253 | |
| | 445 | | | Applied Materials, Inc. | | | 7,877 | |
| | 140 | | | Avago Technologies Ltd., (Singapore) | | | 7,426 | |
| | 161 | | | KLA-Tencor Corp. | | | 10,410 | |
| | 273 | | | Xilinx, Inc. | | | 12,554 | |
| | | | | | | | |
| | | | | | | 45,520 | |
| | | | | | | | |
| | | | Software — 2.9% | | | | |
| | 11 | | | CommVault Systems, Inc. (a) | | | 854 | |
| | 54 | | | Guidewire Software, Inc. (a) | | | 2,655 | |
| | 88 | | | Red Hat, Inc. (a) | | | 4,948 | |
SEE NOTES TO FINANCIAL STATEMENTS.
| | | | | | | | |
| | | |
| DECEMBER 31, 2013 | | J.P. MORGAN MID CAP/MULTI-CAP FUNDS | | | | | 23 | |
JPMorgan Mid Cap Core Fund
SCHEDULE OF PORTFOLIO INVESTMENTS
AS OF DECEMBER 31, 2013 (Unaudited) (continued)
(Amounts in thousands)
| | | | | | | | |
| SHARES | | | SECURITY DESCRIPTION | | VALUE($) | |
| Common Stocks — Continued | | | | |
| | | | Software — Continued | | | | |
| | 68 | | | ServiceNow, Inc. (a) | | | 3,825 | |
| | 51 | | | Splunk, Inc. (a) | | | 3,482 | |
| | 138 | | | Synopsys, Inc. (a) | | | 5,612 | |
| | 38 | | | Tableau Software, Inc., Class A (a) | | | 2,626 | |
| | 66 | | | Workday, Inc., Class A (a) | | | 5,455 | |
| | | | | | | | |
| | | | | | | 29,457 | |
| | | | | | | | |
| | | | Total Information Technology | | | 147,973 | |
| | | | | | | | |
| | | | Materials — 4.9% | | | | |
| | | | Chemicals — 3.0% | | | | |
| | 58 | | | Airgas, Inc. | | | 6,468 | |
| | 95 | | | Albemarle Corp. | | | 6,043 | |
| | 27 | | | PPG Industries, Inc. | | | 5,197 | |
| | 46 | | | Sherwin-Williams Co. (The) | | | 8,445 | |
| | 57 | | | Sigma-Aldrich Corp. | | | 5,327 | |
| | | | | | | | |
| | | | | | | 31,480 | |
| | | | | | | | |
| | | | Containers & Packaging — 1.9% | | | | |
| | 196 | | | Ball Corp. | | | 10,141 | |
| | 44 | | | Rock Tenn Co., Class A | | | 4,588 | |
| | 97 | | | Silgan Holdings, Inc. | | | 4,681 | |
| | | | | | | | |
| | | | | | | 19,410 | |
| | | | | | | | |
| | | | Total Materials | | | 50,890 | |
| | | | | | | | |
| | | | Utilities — 4.5% | | | | |
| | | | Electric Utilities — 1.4% | | | | |
| | 93 | | | Edison International | | | 4,323 | |
| | 158 | | | Westar Energy, Inc. | | | 5,074 | |
| | 169 | | | Xcel Energy, Inc. | | | 4,727 | |
| | | | | | | | |
| | | | | | | 14,124 | |
| | | | | | | | |
| | | | | | | | |
| SHARES | | | SECURITY DESCRIPTION | | VALUE($) | |
| | | | | | | | |
| | | | Gas Utilities — 0.7% | | | | |
| | 45 | | | National Fuel Gas Co. | | | 3,195 | |
| | 201 | | | Questar Corp. | | | 4,620 | |
| | | | | | | | |
| | | | | | | 7,815 | |
| | | | | | | | |
| | | | Multi-Utilities — 2.4% | | | | |
| | 200 | | | CenterPoint Energy, Inc. | | | 4,635 | |
| | 185 | | | CMS Energy Corp. | | | 4,964 | |
| | 148 | | | NiSource, Inc. | | | 4,878 | |
| | 71 | | | Sempra Energy | | | 6,406 | |
| | 97 | | | Wisconsin Energy Corp. | | | 3,996 | |
| | | | | | | | |
| | | | | | | 24,879 | |
| | | | | | | | |
| | | | Total Utilities | | | 46,818 | |
| | | | | | | | |
| | | | Total Common Stocks
(Cost $819,886) | | | 1,006,890 | |
| | | | | | | | |
| Short-Term Investment — 2.2% | | | | |
| | | | Investment Company — 2.2% | | | | |
| | 22,556 | | | JPMorgan Prime Money Market Fund, Institutional Class Shares, 0.010% (b) (l) (m)
(Cost $22,556) | | | 22,556 | |
| | | | | | | | |
| | | | Total Investments — 100.0%
(Cost $842,442) | | | 1,029,446 | |
| | | | Liabilities in Excess of
Other Assets — 0.0% (g) | | | (145 | ) |
| | | | | | | | |
| | | | NET ASSETS — 100.0% | | $ | 1,029,301 | |
| | | | | | | | |
Percentages indicated are based on net assets.
SEE NOTES TO FINANCIAL STATEMENTS.
| | | | | | |
| | | |
| 24 | | | | J.P. MORGAN MID CAP/MULTI-CAP FUNDS | | DECEMBER 31, 2013 |
JPMorgan Mid Cap Equity Fund
SCHEDULE OF PORTFOLIO INVESTMENTS
AS OF DECEMBER 31, 2013 (Unaudited)
(Amounts in thousands)
| | | | | | | | |
| SHARES | | | SECURITY DESCRIPTION | | VALUE($) | |
| Common Stocks — 97.5% | | | | |
| | | | Consumer Discretionary — 21.9% | | | | |
| | | | Auto Components — 0.5% | | | | |
| | 116 | | | BorgWarner, Inc. | | | 6,458 | |
| | | | | | | | |
| | | | Automobiles — 1.8% | | | | |
| | 244 | | | Harley-Davidson, Inc. | | | 16,916 | |
| | 35 | | | Tesla Motors, Inc. (a) | | | 5,218 | |
| | | | | | | | |
| | | | | | | 22,134 | |
| | | | | | | | |
| | | | Distributors — 0.2% | | | | |
| | 37 | | | Genuine Parts Co. | | | 3,085 | |
| | | | | | | | |
| | | | Hotels, Restaurants & Leisure — 3.1% | | | | |
| | 7 | | | Chipotle Mexican Grill, Inc. (a) | | | 3,516 | |
| | 21 | | | Darden Restaurants, Inc. | | | 1,131 | |
| | 21 | | | Extended Stay America, Inc. (a) | | | 546 | |
| | 230 | | | Hilton Worldwide Holdings, Inc. (a) | | | 5,109 | |
| | 124 | | | Marriott International, Inc., Class A | | | 6,116 | |
| | 172 | | | Norwegian Cruise Line Holdings Ltd. (a) | | | 6,108 | |
| | 27 | | | Panera Bread Co., Class A (a) | | | 4,700 | |
| | 35 | | | Wynn Resorts Ltd. | | | 6,817 | |
| | 62 | | | Yum! Brands, Inc. | | | 4,666 | |
| | | | | | | | |
| | | | | | | 38,709 | |
| | | | | | | | |
| | | | Household Durables — 1.7% | | | | |
| | 92 | | | Jarden Corp. (a) | | | 5,663 | |
| | 106 | | | Mohawk Industries, Inc. (a) | | | 15,722 | |
| | | | | | | | |
| | | | | | | 21,385 | |
| | | | | | | | |
| | | | Internet & Catalog Retail — 1.5% | | | | |
| | 126 | | | Expedia, Inc. | | | 8,804 | |
| | 22 | | | Netflix, Inc. (a) | | | 8,210 | |
| | 17 | | | TripAdvisor, Inc. (a) | | | 1,444 | |
| | | | | | | | |
| | | | | | | 18,458 | |
| | | | | | | | |
| | | | Media — 2.1% | | | | |
| | 77 | | | CBS Corp. (Non-Voting), Class B | | | 4,902 | |
| | 134 | | | Clear Channel Outdoor Holdings, Inc., Class A | | | 1,363 | |
| | 83 | | | Discovery Communications, Inc., Class A (a) | | | 7,514 | |
| | 154 | | | DISH Network Corp., Class A (a) | | | 8,913 | |
| | 142 | | | Gannett Co., Inc. | | | 4,194 | |
| | | | | | | | |
| | | | | | | 26,886 | |
| | | | | | | | |
| | | | Multiline Retail — 1.2% | | | | |
| | 92 | | | Family Dollar Stores, Inc. | | | 5,995 | |
| | 172 | | | Kohl’s Corp. | | | 9,778 | |
| | | | | | | | |
| | | | | | | 15,773 | |
| | | | | | | | |
| | | | Specialty Retail — 7.3% | | | | |
| | 59 | | | Advance Auto Parts, Inc. | | | 6,541 | |
| | | | | | | | |
| SHARES | | | SECURITY DESCRIPTION | | VALUE($) | |
| | | | | |
| | | | Specialty Retail — Continued | | | | |
| | 20 | | | AutoZone, Inc. (a) | | | 9,793 | |
| | 63 | | | Bed Bath & Beyond, Inc. (a) | | | 5,073 | |
| | 175 | | | GameStop Corp., Class A | | | 8,635 | |
| | 236 | | | Gap, Inc. (The) | | | 9,233 | |
| | 60 | | | O’Reilly Automotive, Inc. (a) | | | 7,658 | |
| | 93 | | | PetSmart, Inc. | | | 6,788 | |
| | 105 | | | Ross Stores, Inc. | | | 7,890 | |
| | 101 | | | Signet Jewelers Ltd., (Bermuda) | | | 7,925 | |
| | 43 | | | Tiffany & Co. | | | 3,969 | |
| | 89 | | | TJX Cos., Inc. | | | 5,696 | |
| | 127 | | | Urban Outfitters, Inc. (a) | | | 4,716 | |
| | 157 | | | Williams-Sonoma, Inc. | | | 9,146 | |
| | | | | | | | |
| | | | | | | 93,063 | |
| | | | | | | | |
| | | | Textiles, Apparel & Luxury Goods — 2.5% | | | | |
| | 110 | | | Lululemon Athletica, Inc., (Canada) (a) | | | 6,508 | |
| | 136 | | | Michael Kors Holdings Ltd., (Hong Kong) (a) | | | 11,058 | |
| | 48 | | | PVH Corp. | | | 6,498 | |
| | 51 | | | Under Armour, Inc., Class A (a) | | | 4,417 | |
| | 45 | | | V.F. Corp. | | | 2,834 | |
| | | | | | | | |
| | | | | | | 31,315 | |
| | | | | | | | |
| | | | Total Consumer Discretionary | | | 277,266 | |
| | | | | | | | |
| | | | Consumer Staples — 2.3% | | | | |
| | | | Beverages — 1.1% | | | | |
| | 85 | | | Beam, Inc. | | | 5,762 | |
| | 25 | | | Brown-Forman Corp., Class B | | | 1,880 | |
| | 131 | | | Dr. Pepper Snapple Group, Inc. | | | 6,367 | |
| | | | | | | | |
| | | | | | | 14,009 | |
| | | | | | | | |
| | | | Food & Staples Retailing — 0.5% | | | | |
| | 149 | | | Kroger Co. (The) | | | 5,903 | |
| | | | | | | | |
| | | | Food Products — 0.3% | | | | |
| | 48 | | | Hershey Co. (The) | | | 4,634 | |
| | | | | | | | |
| | | | Household Products — 0.4% | | | | |
| | 44 | | | Energizer Holdings, Inc. | | | 4,772 | |
| | | | | | | | |
| | | | Total Consumer Staples | | | 29,318 | |
| | | | | | | | |
| | | | Energy — 4.7% | | | | |
| | | | Energy Equipment & Services — 0.4% | | | | |
| | 184 | | | Frank’s International N.V., (Netherlands) | | | 4,960 | |
| | | | | | | | |
| | | | Oil, Gas & Consumable Fuels — 4.3% | | | | |
| | 65 | | | Antero Resources Corp. (a) | | | 4,092 | |
| | 205 | | | Cabot Oil & Gas Corp. | | | 7,934 | |
| | 67 | | | Concho Resources, Inc. (a) | | | 7,214 | |
| | 95 | | | Energen Corp. | | | 6,691 | |
SEE NOTES TO FINANCIAL STATEMENTS.
| | | | | | | | |
| | | |
| DECEMBER 31, 2013 | | J.P. MORGAN MID CAP/MULTI-CAP FUNDS | | | | | 25 | |
JPMorgan Mid Cap Equity Fund
SCHEDULE OF PORTFOLIO INVESTMENTS
AS OF DECEMBER 31, 2013 (Unaudited) (continued)
(Amounts in thousands)
| | | | | | | | |
| SHARES | | | SECURITY DESCRIPTION | | VALUE($) | |
| Common Stocks — Continued | | | | |
| | | | Oil, Gas & Consumable Fuels — Continued | | | | |
| | 60 | | | EQT Corp. | | | 5,422 | |
| | 132 | | | PBF Energy, Inc., Class A | | | 4,149 | |
| | 117 | | | Plains All American Pipeline LP | | | 6,062 | |
| | 160 | | | QEP Resources, Inc. | | | 4,917 | |
| | 73 | | | Southwestern Energy Co. (a) | | | 2,877 | |
| | 124 | | | Williams Cos., Inc. (The) | | | 4,771 | |
| | | | | | | | |
| | | | | | | 54,129 | |
| | | | | | | | |
| | | | Total Energy | | | 59,089 | |
| | | | | | | | |
| | | | Financials — 19.3% | | | | |
| | | | Capital Markets — 4.8% | | | | |
| | 52 | | | Affiliated Managers Group, Inc. (a) | | | 11,169 | |
| | 77 | | | Ameriprise Financial, Inc. | | | 8,802 | |
| | 223 | | | Blackstone Group LP (The) | | | 7,037 | |
| | 173 | | | Invesco Ltd. | | | 6,298 | |
| | 124 | | | Lazard Ltd., (Bermuda), Class A | | | 5,606 | |
| | 57 | | | Legg Mason, Inc. | | | 2,490 | |
| | 99 | | | Northern Trust Corp. | | | 6,141 | |
| | 85 | | | T. Rowe Price Group, Inc. | | | 7,158 | |
| | 207 | | | TD Ameritrade Holding Corp. | | | 6,349 | |
| | | | | | | | |
| | | | | | | 61,050 | |
| | | | | | | | |
| | | | Commercial Banks — 4.2% | | | | |
| | 54 | | | City National Corp. | | | 4,272 | |
| | 21 | | �� | Cullen/Frost Bankers, Inc. | | | 1,545 | |
| | 192 | | | East West Bancorp, Inc. | | | 6,721 | |
| | 445 | | | Fifth Third Bancorp | | | 9,359 | |
| | 72 | | | First Republic Bank | | | 3,777 | |
| | 302 | | | Huntington Bancshares, Inc. | | | 2,913 | |
| | 65 | | | M&T Bank Corp. | | | 7,573 | |
| | 61 | | | Signature Bank (a) | | | 6,553 | |
| | 194 | | | SunTrust Banks, Inc. | | | 7,139 | |
| | 104 | | | Zions Bancorporation | | | 3,113 | |
| | | | | | | | |
| | | | | | | 52,965 | |
| | | | | | | | |
| | | | Diversified Financial Services — 0.9% | | | | |
| | 140 | | | Moody’s Corp. | | | 11,009 | |
| | | | | | | | |
| | | | Insurance — 5.6% | | | | |
| | 11 | | | Alleghany Corp. (a) | | | 4,288 | |
| | 96 | | | Aon plc, (United Kingdom) | | | 8,087 | |
| | 100 | | | Axis Capital Holdings Ltd., (Bermuda) | | | 4,747 | |
| | 46 | | | Chubb Corp. (The) | | | 4,446 | |
| | 155 | | | Hartford Financial Services Group, Inc. | | | 5,605 | |
| | 228 | | | Loews Corp. | | | 10,989 | |
| | 240 | | | Marsh & McLennan Cos., Inc. | | | 11,621 | |
| | 249 | | | Old Republic International Corp. | | | 4,293 | |
| | | | | | | | |
| SHARES | | | SECURITY DESCRIPTION | | VALUE($) | |
| | | | | |
| | | | Insurance — Continued | | | | |
| | 165 | | | Unum Group | | | 5,783 | |
| | 115 | | | W.R. Berkley Corp. | | | 4,991 | |
| | 170 | | | XL Group plc, (Ireland) | | | 5,412 | |
| | | | | | | | |
| | | | | | | 70,262 | |
| | | | | | | | |
| | | | Real Estate Investment Trusts (REITs) — 2.7% | | | | |
| | 92 | | | American Campus Communities, Inc. | | | 2,964 | |
| | 188 | | | American Homes 4 Rent, Class A | | | 3,046 | |
| | 31 | | | AvalonBay Communities, Inc. | | | 3,656 | |
| | 77 | | | Brixmor Property Group, Inc. (a) | | | 1,559 | |
| | 117 | | | HCP, Inc. | | | 4,264 | |
| | 290 | | | Kimco Realty Corp. | | | 5,732 | |
| | 74 | | | Rayonier, Inc. | | | 3,107 | |
| | 78 | | | Regency Centers Corp. | | | 3,611 | |
| | 72 | | | Vornado Realty Trust | | | 6,369 | |
| | | | | | | | |
| | | | | | | 34,308 | |
| | | | | | | | |
| | | | Real Estate Management & Development — 1.0% | |
| | 223 | | | Brookfield Office Properties, Inc. | | | 4,301 | |
| | 334 | | | CBRE Group, Inc., Class A (a) | | | 8,771 | |
| | | | | | | | |
| | | | | | | 13,072 | |
| | | | | | | | |
| | | | Thrifts & Mortgage Finance — 0.1% | | | | |
| | 166 | | | Hudson City Bancorp, Inc. | | | 1,568 | |
| | | | | | | | |
| | | | Total Financials | | | 244,234 | |
| | | | | | | | |
| | | | Health Care — 9.3% | | | | |
| | | | Biotechnology — 1.1% | | | | |
| | 59 | | | Alexion Pharmaceuticals, Inc. (a) | | | 7,784 | |
| | 84 | | | Vertex Pharmaceuticals, Inc. (a) | | | 6,219 | |
| | | | | | | | |
| | | | | | | 14,003 | |
| | | | | | | | |
| | | | Health Care Equipment & Supplies — 0.9% | | | | |
| | 125 | | | CareFusion Corp. (a) | | | 4,966 | |
| | 94 | | | Sirona Dental Systems, Inc. (a) | | | 6,606 | |
| | | | | | | | |
| | | | | | | 11,572 | |
| | | | | | | | |
| | | | Health Care Providers & Services — 3.8% | | | | |
| | 91 | | | AmerisourceBergen Corp. | | | 6,427 | |
| | 208 | | | Brookdale Senior Living, Inc. (a) | | | 5,664 | |
| | 98 | | | Cigna Corp. | | | 8,542 | |
| | 160 | | | Envision Healthcare Holdings, Inc. (a) | | | 5,687 | |
| | 35 | | | Henry Schein, Inc. (a) | | | 3,981 | |
| | 126 | | | Humana, Inc. | | | 12,998 | |
| | 127 | | | Premier, Inc., Class A (a) | | | 4,665 | |
| | | | | | | | |
| | | | | | | 47,964 | |
| | | | | | | | |
SEE NOTES TO FINANCIAL STATEMENTS.
| | | | | | |
| | | |
| 26 | | | | J.P. MORGAN MID CAP/MULTI-CAP FUNDS | | DECEMBER 31, 2013 |
| | | | | | | | |
| SHARES | | | SECURITY DESCRIPTION | | VALUE($) | |
| Common Stocks — Continued | | | | |
| | | | Life Sciences Tools & Services — 2.0% | | | | |
| | 186 | | | Agilent Technologies, Inc. | | | 10,614 | |
| | 212 | | | Bruker Corp. (a) | | | 4,195 | |
| | 102 | | | Illumina, Inc. (a) | | | 11,259 | |
| | | | | | | | |
| | | | | | | 26,068 | |
| | | | | | | | |
| | | | Pharmaceuticals — 1.5% | |
| | 54 | | | Actavis plc (a) | | | 9,089 | |
| | 26 | | | Jazz Pharmaceuticals plc, (Ireland) (a) | | | 3,278 | |
| | 56 | | | Valeant Pharmaceuticals International, Inc. (a) | | | 6,621 | |
| | | | | | | | |
| | | | | | | 18,988 | |
| | | | | | | | |
| | | | Total Health Care | | | 118,595 | |
| | | | | | | | |
| | | | Industrials — 16.3% | | | | |
| | | | Aerospace & Defense — 0.2% | |
| | 74 | | | DigitalGlobe, Inc. (a) | | | 3,029 | |
| | | | | | | | |
| | | | Airlines — 0.7% | |
| | 319 | | | Delta Air Lines, Inc. | | | 8,774 | |
| | | | | | | | |
| | | | Building Products — 1.1% | |
| | 306 | | | Fortune Brands Home & Security, Inc. | | | 13,986 | |
| | | | | | | | |
| | | | Commercial Services & Supplies — 0.6% | |
| | 67 | | | Stericycle, Inc. (a) | | | 7,744 | |
| | | | | | | | |
| | | | Construction & Engineering — 0.5% | |
| | 80 | | | Fluor Corp. | | | 6,383 | |
| | | | | | | | |
| | | | Electrical Equipment — 2.9% | |
| | 93 | | | Acuity Brands, Inc. | | | 10,134 | |
| | 126 | | | AMETEK, Inc. | | | 6,654 | |
| | 132 | | | Generac Holdings, Inc. | | | 7,471 | |
| | 46 | | | Hubbell, Inc., Class B | | | 5,035 | |
| | 98 | | | Regal-Beloit Corp. | | | 7,196 | |
| | | | | | | | |
| | | | | | | 36,490 | |
| | | | | | | | |
| | | | Industrial Conglomerates — 1.3% | |
| | 213 | | | Carlisle Cos., Inc. | | | 16,931 | |
| | | | | | | | |
| | | | Machinery — 3.7% | |
| | 149 | | | Flowserve Corp. | | | 11,730 | |
| | 108 | | | IDEX Corp. | | | 7,978 | |
| | 133 | | | Pall Corp. | | | 11,361 | |
| | 127 | | | Rexnord Corp. (a) | | | 3,418 | |
| | 64 | | | Snap-on, Inc. | | | 6,961 | |
| | 56 | | | WABCO Holdings, Inc. (a) | | | 5,259 | |
| | | | | | | | |
| | | | | | | 46,707 | |
| | | | | | | | |
| | | | Marine — 0.6% | |
| | 80 | | | Kirby Corp. (a) | | | 7,970 | |
| | | | | | | | |
| | | | | | | | |
| SHARES | | | SECURITY DESCRIPTION | | VALUE($) | |
| | | | | |
| | | | Professional Services — 1.0% | |
| | 108 | | | Equifax, Inc. | | | 7,456 | |
| | 40 | | | Towers Watson & Co., Class A | | | 5,104 | |
| | | | | | | | |
| | | | | | | 12,560 | |
| | | | | | | | |
| | | | Road & Rail — 1.7% | |
| | 44 | | | Canadian Pacific Railway Ltd., (Canada) | | | 6,658 | |
| | 329 | | | Hertz Global Holdings, Inc. (a) | | | 9,428 | |
| | 68 | | | J.B. Hunt Transport Services, Inc. | | | 5,287 | |
| | | | | | | | |
| | | | | | | 21,373 | |
| | | | | | | | |
| | | | Trading Companies & Distributors — 2.0% | |
| | 198 | | | Air Lease Corp. | | | 6,142 | |
| | 243 | | | HD Supply Holdings, Inc. (a) | | | 5,827 | |
| | 158 | | | MSC Industrial Direct Co., Inc., Class A | | | 12,779 | |
| | | | | | | | |
| | | | | | | 24,748 | |
| | | | | | | | |
| | | | Total Industrials | | | 206,695 | |
| | | | | | | | |
| | | | Information Technology — 14.3% | | | | |
| | | | Communications Equipment — 1.2% | |
| | 166 | | | Aruba Networks, Inc. (a) | | | 2,968 | |
| | 211 | | | Ciena Corp. (a) | | | 5,037 | |
| | 152 | | | CommScope Holding Co., Inc. (a) | | | 2,872 | |
| | 89 | | | Palo Alto Networks, Inc. (a) | | | 5,132 | |
| | | | | | | | |
| | | | | | | 16,009 | |
| | | | | | | | |
| | | | Computers & Peripherals — 0.3% | |
| | 39 | | | 3D Systems Corp. (a) | | | 3,624 | |
| | | | | | | | |
| | | | Electronic Equipment, Instruments & Components — 2.3% | |
| | 226 | | | Amphenol Corp., Class A | | | 20,151 | |
| | 168 | | | Arrow Electronics, Inc. (a) | | | 9,103 | |
| | | | | | | | |
| | | | | | | 29,254 | |
| | | | | | | | |
| | | | Internet Software & Services — 0.5% | |
| | 27 | | | LinkedIn Corp., Class A (a) | | | 5,898 | |
| | | | | | | | |
| | | | IT Services — 2.7% | |
| | 49 | | | Alliance Data Systems Corp. (a) | | | 12,963 | |
| | 157 | | | CoreLogic, Inc. (a) | | | 5,592 | |
| | 66 | | | FleetCor Technologies, Inc. (a) | | | 7,710 | |
| | 148 | | | Jack Henry & Associates, Inc. | | | 8,740 | |
| | | | | | | | |
| | | | | | | 35,005 | |
| | | | | | | | |
| | | | Semiconductors & Semiconductor Equipment — 4.4% | |
| | 175 | | | Analog Devices, Inc. | | | 8,896 | |
| | 547 | | | Applied Materials, Inc. | | | 9,678 | |
| | 168 | | | Avago Technologies Ltd., (Singapore) | | | 8,870 | |
| | 198 | | | KLA-Tencor Corp. | | | 12,786 | |
| | 336 | | | Xilinx, Inc. | | | 15,442 | |
| | | | | | | | |
| | | | | | | 55,672 | |
| | | | | | | | |
SEE NOTES TO FINANCIAL STATEMENTS.
| | | | | | | | |
| | | |
| DECEMBER 31, 2013 | | J.P. MORGAN MID CAP/MULTI-CAP FUNDS | | | | | 27 | |
JPMorgan Mid Cap Equity Fund
SCHEDULE OF PORTFOLIO INVESTMENTS
AS OF DECEMBER 31, 2013 (Unaudited) (continued)
(Amounts in thousands)
| | | | | | | | |
| SHARES | | | SECURITY DESCRIPTION | | VALUE($) | |
| Common Stocks — Continued | | | | |
| | | | Software — 2.9% | | | | |
| | 15 | | | CommVault Systems, Inc. (a) | | | 1,123 | |
| | 67 | | | Guidewire Software, Inc. (a) | | | 3,278 | |
| | 109 | | | Red Hat, Inc. (a) | | | 6,103 | |
| | 84 | | | ServiceNow, Inc. (a) | | | 4,716 | |
| | 63 | | | Splunk, Inc. (a) | | | 4,292 | |
| | 170 | | | Synopsys, Inc. (a) | | | 6,887 | |
| | 47 | | | Tableau Software, Inc., Class A (a) | | | 3,247 | |
| | 81 | | | Workday, Inc., Class A (a) | | | 6,736 | |
| | | | | | | | |
| | | | | | | 36,382 | |
| | | | | | | | |
| | | | Total Information Technology | | | 181,844 | |
| | | | | | | | |
| | | | Materials — 4.9% | | | | |
| | | | Chemicals — 3.0% | |
| | 71 | | | Airgas, Inc. | | | 7,937 | |
| | 117 | | | Albemarle Corp. | | | 7,416 | |
| | 34 | | | PPG Industries, Inc. | | | 6,411 | |
| | 57 | | | Sherwin-Williams Co. (The) | | | 10,371 | |
| | 70 | | | Sigma-Aldrich Corp. | | | 6,536 | |
| | | | | | | | |
| | | | | | | 38,671 | |
| | | | | | | | |
| | | | Containers & Packaging — 1.9% | |
| | 241 | | | Ball Corp. | | | 12,438 | |
| | 54 | | | Rock Tenn Co., Class A | | | 5,637 | |
| | 120 | | | Silgan Holdings, Inc. | | | 5,746 | |
| | | | | | | | |
| | | | | | | 23,821 | |
| | | | | | | | |
| | | | Total Materials | | | 62,492 | |
| | | | | | | | |
| | | | Utilities — 4.5% | | | | |
| | | | Electric Utilities — 1.4% | |
| | 115 | | | Edison International | | | 5,307 | |
| | 194 | | | Westar Energy, Inc. | | | 6,228 | |
| | | | | | | | |
| SHARES | | | SECURITY DESCRIPTION | | VALUE($) | |
| | | | | |
| | | | Electric Utilities — Continued | |
| | 208 | | | Xcel Energy, Inc. | | | 5,804 | |
| | | | | | | | |
| | | | | | | 17,339 | |
| | | | | | | | |
| | | | Gas Utilities — 0.7% | |
| | 55 | | | National Fuel Gas Co. | | | 3,906 | |
| | 245 | | | Questar Corp. | | | 5,640 | |
| | | | | | | | |
| | | | | | | 9,546 | |
| | | | | | | | |
| | | | Multi-Utilities — 2.4% | |
| | 246 | | | CenterPoint Energy, Inc. | | | 5,691 | |
| | 228 | | | CMS Energy Corp. | | | 6,094 | |
| | 183 | | | NiSource, Inc. | | | 6,020 | |
| | 88 | | | Sempra Energy | | | 7,859 | |
| | 119 | | | Wisconsin Energy Corp. | | | 4,909 | |
| | | | | | | | |
| | | | | | | 30,573 | |
| | | | | | | | |
| | | | Total Utilities | | | 57,458 | |
| | | | | | | | |
| | | | Total Common Stocks
(Cost $844,303) | | | 1,236,991 | |
| | | | | | | | |
| Short-Term Investment — 5.3% | |
| | | | Investment Company — 5.3% | |
| | 66,929 | | | JPMorgan Prime Money Market Fund, Institutional Class Shares, 0.010% (b) (l) (m)
(Cost $66,929) | | | 66,929 | |
| | | | | | | | |
| | | | Total Investments — 102.8%
(Cost $911,232) | | | 1,303,920 | |
| | | | Liabilities in Excess of
Other Assets — (2.8)% | | | (35,255 | ) |
| | | | | | | | |
| | | | NET ASSETS — 100.0% | | $ | 1,268,665 | |
| | | | | | | | |
Percentages indicated are based on net assets.
SEE NOTES TO FINANCIAL STATEMENTS.
| | | | | | |
| | | |
| 28 | | | | J.P. MORGAN MID CAP/MULTI-CAP FUNDS | | DECEMBER 31, 2013 |
JPMorgan Mid Cap Growth Fund
SCHEDULE OF PORTFOLIO INVESTMENTS
AS OF DECEMBER 31, 2013 (Unaudited)
(Amounts in thousands)
| | | | | | | | |
| SHARES | | | SECURITY DESCRIPTION | | VALUE($) | |
| Common Stocks — 98.2% | |
| | | | Consumer Discretionary — 23.7% | | | | |
| | | | Auto Components — 1.0% | |
| | 346 | | | BorgWarner, Inc. | | | 19,367 | |
| | | | | | | | |
| | | | Automobiles — 3.5% | |
| | 733 | | | Harley-Davidson, Inc. | | | 50,759 | |
| | 104 | | | Tesla Motors, Inc. (a) | | | 15,640 | |
| | | | | | | | |
| | | | | | | 66,399 | |
| | | | | | | | |
| | | | Hotels, Restaurants & Leisure — 4.1% | |
| | 20 | | | Chipotle Mexican Grill, Inc. (a) | | | 10,549 | |
| | 689 | | | Hilton Worldwide Holdings, Inc. (a) | | | 15,321 | |
| | 517 | | | Norwegian Cruise Line Holdings Ltd. (a) | | | 18,324 | |
| | 80 | | | Panera Bread Co., Class A (a) | | | 14,100 | |
| | 105 | | | Wynn Resorts Ltd. | | | 20,450 | |
| | | | | | | | |
| | | | | | | 78,744 | |
| | | | | | | | |
| | | | Household Durables — 1.4% | |
| | 179 | | | Mohawk Industries, Inc. (a) | | | 26,653 | |
| | | | | | | | |
| | | | Internet & Catalog Retail — 1.3% | |
| | 67 | | | Netflix, Inc. (a) | | | 24,631 | |
| | | | | | | | |
| | | | Media — 1.2% | |
| | 249 | | | Discovery Communications, Inc., Class A (a) | | | 22,542 | |
| | | | | | | | |
| | | | Specialty Retail — 7.8% | |
| | 177 | | | Advance Auto Parts, Inc. | | | 19,634 | |
| | 526 | | | GameStop Corp., Class A | | | 25,916 | |
| | 178 | | | O’Reilly Automotive, Inc. (a) | | | 22,962 | |
| | 316 | | | Ross Stores, Inc. | | | 23,678 | |
| | 302 | | | Signet Jewelers Ltd., (Bermuda) | | | 23,775 | |
| | 381 | | | Urban Outfitters, Inc. (a) | | | 14,150 | |
| | 319 | | | Williams-Sonoma, Inc. | | | 18,603 | |
| | | | | | | | |
| | | | | | | 148,718 | |
| | | | | | | | |
| | | | Textiles, Apparel & Luxury Goods — 3.4% | |
| | 331 | | | Lululemon Athletica, Inc., (Canada) (a) | | | 19,515 | |
| | 409 | | | Michael Kors Holdings Ltd., (Hong Kong) (a) | | | 33,191 | |
| | 152 | | | Under Armour, Inc., Class A (a) | | | 13,243 | |
| | | | | | | | |
| | | | | | | 65,949 | |
| | | | | | | | |
| | | | Total Consumer Discretionary | | | 453,003 | |
| | | | | | | | |
| | | | Energy — 4.8% | | | | |
| | | | Energy Equipment & Services — 0.8% | |
| | 551 | | | Frank’s International N.V., (Netherlands) | | | 14,874 | |
| | | | | | | | |
| | | | Oil, Gas & Consumable Fuels — 4.0% | |
| | 193 | | | Antero Resources Corp. (a) | | | 12,269 | |
| | 614 | | | Cabot Oil & Gas Corp. | | | 23,807 | |
| | 200 | | | Concho Resources, Inc. (a) | | | 21,643 | |
| | | | | | | | |
| SHARES | | | SECURITY DESCRIPTION | | VALUE($) | |
| | | | | | | | |
| | | | Oil, Gas & Consumable Fuels — Continued | |
| | 351 | | | Plains All American Pipeline LP | | | 18,182 | |
| | | | | | | | |
| | | | | | | 75,901 | |
| | | | | | | | |
| | | | Total Energy | | | 90,775 | |
| | | | | | | | |
| | | | Financials — 12.0% | | | | |
| | | | Capital Markets — 4.8% | |
| | 155 | | | Affiliated Managers Group, Inc. (a) | | | 33,508 | |
| | 670 | | | Blackstone Group LP (The) | | | 21,108 | |
| | 371 | | | Lazard Ltd., (Bermuda), Class A | | | 16,823 | |
| | 622 | | | TD Ameritrade Holding Corp. | | | 19,046 | |
| | | | | | | | |
| | | | | | | 90,485 | |
| | | | | | | | |
| | | | Commercial Banks — 2.1% | |
| | 584 | | | East West Bancorp, Inc. | | | 20,412 | |
| | 183 | | | Signature Bank (a) | | | 19,668 | |
| | | | | | | | |
| | | | | | | 40,080 | |
| | | | | | | | |
| | | | Diversified Financial Services — 1.7% | |
| | 421 | | | Moody’s Corp. | | | 33,044 | |
| | | | | | | | |
| | | | Insurance — 2.0% | |
| | 289 | | | Aon plc, (United Kingdom) | | | 24,253 | |
| | 299 | | | Axis Capital Holdings Ltd., (Bermuda) | | | 14,242 | |
| | | | | | | | |
| | | | | | | 38,495 | |
| | | | | | | | |
| | | | Real Estate Management & Development — 1.4% | |
| | 1,001 | | | CBRE Group, Inc., Class A (a) | | | 26,316 | |
| | | | | | | | |
| | | | Total Financials | | | 228,420 | |
| | | | | | | | |
| | | | Health Care — 14.0% | | | | |
| | | | Biotechnology — 2.2% | |
| | 175 | | | Alexion Pharmaceuticals, Inc. (a) | | | 23,339 | |
| | 251 | | | Vertex Pharmaceuticals, Inc. (a) | | | 18,664 | |
| | | | | | | | |
| | | | | | | 42,003 | |
| | | | | | | | |
| | | | Health Care Equipment & Supplies — 1.0% | |
| | 282 | | | Sirona Dental Systems, Inc. (a) | | | 19,817 | |
| | | | | | | | |
| | | | Health Care Providers & Services — 3.7% | |
| | 625 | | | Brookdale Senior Living, Inc. (a) | | | 16,987 | |
| | 480 | | | Envision Healthcare Holdings, Inc. (a) | | | 17,057 | |
| | 210 | | | Humana, Inc. | | | 21,678 | |
| | 381 | | | Premier, Inc., Class A (a) | | | 13,991 | |
| | | | | | | | |
| | | | | | | 69,713 | |
| | | | | | | | |
| | | | Life Sciences Tools & Services — 4.1% | |
| | 557 | | | Agilent Technologies, Inc. | | | 31,852 | |
| | 637 | | | Bruker Corp. (a) | | | 12,584 | |
| | 305 | | | Illumina, Inc. (a) | | | 33,783 | |
| | | | | | | | |
| | | | | | | 78,219 | |
| | | | | | | | |
SEE NOTES TO FINANCIAL STATEMENTS.
| | | | | | | | |
| | | |
| DECEMBER 31, 2013 | | J.P. MORGAN MID CAP/MULTI-CAP FUNDS | | | | | 29 | |
JPMorgan Mid Cap Growth Fund
SCHEDULE OF PORTFOLIO INVESTMENTS
AS OF DECEMBER 31, 2013 (Unaudited) (continued)
(Amounts in thousands)
| | | | | | | | |
| SHARES | | | SECURITY DESCRIPTION | | VALUE($) | |
| Common Stocks — Continued | | | | |
| | | | Pharmaceuticals — 3.0% | | | | |
| | 162 | | | Actavis plc (a) | | | 27,267 | |
| | 78 | | | Jazz Pharmaceuticals plc, (Ireland) (a) | | | 9,821 | |
| | 169 | | | Valeant Pharmaceuticals International, Inc. (a) | | | 19,852 | |
| | | | | | | | |
| | | | | | | 56,940 | |
| | | | | | | | |
| | | | Total Health Care | | | 266,692 | |
| | | | | | | | |
| | | | Industrials — 22.4% | | | | |
| | | | Aerospace & Defense — 0.5% | | | | |
| | 221 | | | DigitalGlobe, Inc. (a) | | | 9,076 | |
| | | | | | | | |
| | | | Airlines — 1.4% | | | | |
| | 958 | | | Delta Air Lines, Inc. | | | 26,327 | |
| | | | | | | | |
| | | | Building Products — 1.5% | | | | |
| | 613 | | | Fortune Brands Home & Security, Inc. | | | 28,023 | |
| | | | | | | | |
| | | | Commercial Services & Supplies — 1.2% | | | | |
| | 200 | | | Stericycle, Inc. (a) | | | 23,219 | |
| | | | | | | | |
| | | | Construction & Engineering — 1.0% | | | | |
| | 238 | | | Fluor Corp. | | | 19,141 | |
| | | | | | | | |
| | | | Electrical Equipment — 2.8% | | | | |
| | 278 | | | Acuity Brands, Inc. | | | 30,413 | |
| | 396 | | | Generac Holdings, Inc. | | | 22,407 | |
| | | | | | | | |
| | | | | | | 52,820 | |
| | | | | | | | |
| | | | Industrial Conglomerates — 1.4% | | | | |
| | 339 | | | Carlisle Cos., Inc. | | | 26,901 | |
| | | | | | | | |
| | | | Machinery — 4.4% | | | | |
| | 447 | | | Flowserve Corp. | | | 35,206 | |
| | 399 | | | Pall Corp. | | | 34,080 | |
| | 169 | | | WABCO Holdings, Inc. (a) | | | 15,768 | |
| | | | | | | | |
| | | | | | | 85,054 | |
| | | | | | | | |
| | | | Marine — 1.2% | | | | |
| | 241 | | | Kirby Corp. (a) | | | 23,909 | |
| | | | | | | | |
| | | | Professional Services — 0.8% | | | | |
| | 120 | | | Towers Watson & Co., Class A | | | 15,326 | |
| | | | | | | | |
| | | | Road & Rail — 3.4% | | | | |
| | 132 | | | Canadian Pacific Railway Ltd., (Canada) | | | 19,975 | |
| | 988 | | | Hertz Global Holdings, Inc. (a) | | | 28,285 | |
| | 205 | | | J.B. Hunt Transport Services, Inc. | | | 15,854 | |
| | | | | | | | |
| | | | | | | 64,114 | |
| | | | | | | | |
| | | | Trading Companies & Distributors — 2.8% | | | | |
| | 593 | | | Air Lease Corp. | | | 18,424 | |
| | 728 | | | HD Supply Holdings, Inc. (a) | | | 17,479 | |
| | 218 | | | MSC Industrial Direct Co., Inc., Class A | | | 17,638 | |
| | | | | | | | |
| | | | | | | 53,541 | |
| | | | | | | | |
| | | | Total Industrials | | | 427,451 | |
| | | | | | | | |
| | | | | | | | |
| SHARES | | | SECURITY DESCRIPTION | | VALUE($) | |
| | | | | |
| | | | Information Technology — 19.2% | | | | |
| | | | Communications Equipment — 2.1% | | | | |
| | 497 | | | Aruba Networks, Inc. (a) | | | 8,898 | |
| | 631 | | | Ciena Corp. (a) | | | 15,109 | |
| | 268 | | | Palo Alto Networks, Inc. (a) | | | 15,391 | |
| | | | | | | | |
| | | | | | | 39,398 | |
| | | | | | | | |
| | | | Computers & Peripherals — 0.6% | | | | |
| | 117 | | | 3D Systems Corp. (a) | | | 10,854 | |
| | | | | | | | |
| | | | Electronic Equipment, Instruments & Components — 1.6% | |
| | 340 | | | Amphenol Corp., Class A | | | 30,312 | |
| | | | | | | | |
| | | | Internet Software & Services — 0.9% | | | | |
| | 82 | | | LinkedIn Corp., Class A (a) | | | 17,715 | |
| | | | | | | | |
| | | | IT Services — 4.1% | | | | |
| | 148 | | | Alliance Data Systems Corp. (a) | | | 38,861 | |
| | 472 | | | CoreLogic, Inc. (a) | | | 16,777 | |
| | 198 | | | FleetCor Technologies, Inc. (a) | | | 23,141 | |
| | | | | | | | |
| | | | | | | 78,779 | |
| | | | | | | | |
| | | | Semiconductors & Semiconductor Equipment — 5.3% | |
| | 1,642 | | | Applied Materials, Inc. | | | 29,040 | |
| | 519 | | | Avago Technologies Ltd., (Singapore) | | | 27,434 | |
| | 327 | | | KLA-Tencor Corp. | | | 21,078 | |
| | 512 | | | Xilinx, Inc. | | | 23,507 | |
| | | | | | | | |
| | | | | | | 101,059 | |
| | | | | | | | |
| | | | Software — 4.6% | | | | |
| | 41 | | | CommVault Systems, Inc. (a) | | | 3,093 | |
| | 200 | | | Guidewire Software, Inc. (a) | | | 9,829 | |
| | 327 | | | Red Hat, Inc. (a) | | | 18,310 | |
| | 253 | | | ServiceNow, Inc. (a) | | | 14,142 | |
| | 188 | | | Splunk, Inc. (a) | | | 12,876 | |
| | 141 | | | Tableau Software, Inc., Class A (a) | | | 9,733 | |
| | 243 | | | Workday, Inc., Class A (a) | | | 20,200 | |
| | | | | | | | |
| | | | | | | 88,183 | |
| | | | | | | | |
| | | | Total Information Technology | | | 366,300 | |
| | | | | | | | |
| | | | Materials — 2.1% | | | | |
| | | | Chemicals — 2.1% | | | | |
| | 101 | | | PPG Industries, Inc. | | | 19,213 | |
| | 119 | | | Sherwin-Williams Co. (The) | | | 21,836 | |
| | | | | | | | |
| | | | Total Materials | | | 41,049 | |
| | | | | | | | |
| | | | Total Common Stocks
(Cost $1,280,654) | | | 1,873,690 | |
| | | | | | | | |
SEE NOTES TO FINANCIAL STATEMENTS.
| | | | | | |
| | | |
| 30 | | | | J.P. MORGAN MID CAP/MULTI-CAP FUNDS | | DECEMBER 31, 2013 |
| | | | | | | | |
| SHARES | | | SECURITY DESCRIPTION | | VALUE($) | |
| Short-Term Investment — 2.2% | | | | |
| | | | Investment Company — 2.2% | | | | |
| | 42,060 | | | JPMorgan Liquid Assets Money Market Fund, Institutional Class Shares, 0.020% (b) (l) (m)
(Cost $42,060) | | | 42,060 | |
| | | | | | | | |
| | | | Total Investments — 100.4%
(Cost $1,322,714) | | | 1,915,750 | |
| | | | Liabilities in Excess of
Other Assets — (0.4)% | | | (7,567 | ) |
| | | | | | | | |
| | | | NET ASSETS — 100.0% | | $ | 1,908,183 | |
| | | | | | | | |
Percentages indicated are based on net assets.
SEE NOTES TO FINANCIAL STATEMENTS.
| | | | | | | | |
| | | |
| DECEMBER 31, 2013 | | J.P. MORGAN MID CAP/MULTI-CAP FUNDS | | | | | 31 | |
JPMorgan Mid Cap Value Fund
SCHEDULE OF PORTFOLIO INVESTMENTS
AS OF DECEMBER 31, 2013 (Unaudited)
(Amounts in thousands)
| | | | | | | | |
| SHARES | | | SECURITY DESCRIPTION | | VALUE($) | |
| Common Stocks — 97.8% | |
| | | | Consumer Discretionary — 20.1% | | | | |
| | | | Distributors — 0.5% | | | | |
| | 874 | | | Genuine Parts Co. | | | 72,688 | |
| | | | | | | | |
| | | | Hotels, Restaurants & Leisure — 1.9% | | | | |
| | 487 | | | Darden Restaurants, Inc. | | | 26,501 | |
| | 186 | | | Extended Stay America, Inc. (a) | | | 4,871 | |
| | 2,926 | | | Marriott International, Inc., Class A | | | 144,439 | |
| | 1,457 | | | Yum! Brands, Inc. | | | 110,127 | |
| | | | | | | | |
| | | | | | | 285,938 | |
| | | | | | | | |
| | | | Household Durables — 2.0% | | | | |
| | 2,179 | | | Jarden Corp. (a) | | | 133,698 | |
| | 1,084 | | | Mohawk Industries, Inc. (a) | | | 161,414 | |
| | | | | | | | |
| | | | | | | 295,112 | |
| | | | | | | | |
| | | | Internet & Catalog Retail — 1.6% | | | | |
| | 2,987 | | | Expedia, Inc. | | | 208,047 | |
| | 409 | | | TripAdvisor, Inc. (a) | | | 33,894 | |
| | | | | | | | |
| | | | | | | 241,941 | |
| | | | | | | | |
| | | | Media — 3.1% | | | | |
| | 1,815 | | | CBS Corp. (Non-Voting), Class B | | | 115,689 | |
| | 3,149 | | | Clear Channel Outdoor Holdings, Inc., Class A | | | 31,930 | |
| | 3,637 | | | DISH Network Corp., Class A (a) | | | 210,630 | |
| | 3,384 | | | Gannett Co., Inc. | | | 100,103 | |
| | | | | | | | |
| | | | | | | 458,352 | |
| | | | | | | | |
| | | | Multiline Retail — 2.5% | | | | |
| | 2,179 | | | Family Dollar Stores, Inc. | | | 141,571 | |
| | 4,073 | | | Kohl’s Corp. | | | 231,143 | |
| | | | | | | | |
| | | | | | | 372,714 | |
| | | | | | | | |
| | | | Specialty Retail — 7.0% | | | | |
| | 484 | | | AutoZone, Inc. (a) | | | 231,513 | |
| | 1,496 | | | Bed Bath & Beyond, Inc. (a) | | | 120,104 | |
| | 5,584 | | | Gap, Inc. (The) | | | 218,220 | |
| | 2,204 | | | PetSmart, Inc. | | | 160,354 | |
| | 1,009 | | | Tiffany & Co. | | | 93,641 | |
| | 2,110 | | | TJX Cos., Inc. | | | 134,501 | |
| | 1,191 | | | Williams-Sonoma, Inc. | | | 69,397 | |
| | | | | | | | |
| | | | | | | 1,027,730 | |
| | | | | | | | |
| | | | Textiles, Apparel & Luxury Goods — 1.5% | | | | |
| | 1,128 | | | PVH Corp. | | | 153,464 | |
| | 1,071 | | | V.F. Corp. | | | 66,749 | |
| | | | | | | | |
| | | | | | | 220,213 | |
| | | | | | | | |
| | | | Total Consumer Discretionary | | | 2,974,688 | |
| | | | | | | | |
| | | | | | | | |
| SHARES | | | SECURITY DESCRIPTION | | VALUE($) | |
| | |
| | | | Consumer Staples — 4.7% | | | | |
| | | | Beverages — 2.2% | | | | |
| | 1,999 | | | Beam, Inc. | | | 136,064 | |
| | 584 | | | Brown-Forman Corp., Class B | | | 44,167 | |
| | 3,087 | | | Dr. Pepper Snapple Group, Inc. | | | 150,390 | |
| | | | | | | | |
| | | | | | | 330,621 | |
| | | | | | | | |
| | | | Food & Staples Retailing — 1.0% | | | | |
| | 3,527 | | | Kroger Co. (The) | | | 139,412 | |
| | | | | | | | |
| | | | Food Products — 0.7% | | | | |
| | 1,125 | | | Hershey Co. (The) | | | 109,360 | |
| | | | | | | | |
| | | | Household Products — 0.8% | | | | |
| | 1,041 | | | Energizer Holdings, Inc. | | | 112,638 | |
| | | | | | | | |
| | | | Total Consumer Staples | | | 692,031 | |
| | | | | | | | |
| | | | Energy — 4.6% | | | | |
| | | | Oil, Gas & Consumable Fuels — 4.6% | | | | |
| | 2,234 | | | Energen Corp. | | | 158,038 | |
| | 1,426 | | | EQT Corp. | | | 128,018 | |
| | 3,291 | | | PBF Energy, Inc., Class A | | | 103,545 | |
| | 3,787 | | | QEP Resources, Inc. | | | 116,067 | |
| | 1,674 | | | Southwestern Energy Co. (a) | | | 65,822 | |
| | 2,934 | | | Williams Cos., Inc. (The) | | | 113,159 | |
| | | | | | | | |
| | | | Total Energy | | | 684,649 | |
| | | | | | | | |
| | | | Financials — 27.0% | | | | |
| | | | Capital Markets — 5.1% | | | | |
| | 2,108 | | | Ameriprise Financial, Inc. | | | 242,528 | |
| | 4,087 | | | Invesco Ltd. | | | 148,755 | |
| | 1,317 | | | Legg Mason, Inc. | | | 57,273 | |
| | 2,343 | | | Northern Trust Corp. | | | 145,009 | |
| | 2,019 | | | T. Rowe Price Group, Inc. | | | 169,102 | |
| | | | | | | | |
| | | | | | | 762,667 | |
| | | | | | | | |
| | | | Commercial Banks — 6.3% | | | | |
| | 1,273 | | | City National Corp. | | | 100,815 | |
| | 487 | | | Cullen/Frost Bankers, Inc. | | | 36,247 | |
| | 10,519 | | | Fifth Third Bancorp | | | 221,213 | |
| | 1,701 | | | First Republic Bank | | | 89,073 | |
| | 7,112 | | | Huntington Bancshares, Inc. | | | 68,634 | |
| | 1,552 | | | M&T Bank Corp. | | | 180,653 | |
| | 4,582 | | | SunTrust Banks, Inc. | | | 168,663 | |
| | 2,475 | | | Zions Bancorporation | | | 74,139 | |
| | | | | | | | |
| | | | | | | 939,437 | |
| | | | | | | | |
| | | | Insurance — 9.2% | | | | |
| | 255 | | | Alleghany Corp. (a) | | | 102,185 | |
| | 1,086 | | | Chubb Corp. (The) | | | 104,899 | |
SEE NOTES TO FINANCIAL STATEMENTS.
| | | | | | |
| | | |
| 32 | | | | J.P. MORGAN MID CAP/MULTI-CAP FUNDS | | DECEMBER 31, 2013 |
| | | | | | | | |
| SHARES | | | SECURITY DESCRIPTION | | VALUE($) | |
| Common Stocks — Continued | |
| | | | Insurance — Continued | | | | |
| | 3,653 | | | Hartford Financial Services Group, Inc. | | | 132,356 | |
| | 5,386 | | | Loews Corp. | | | 259,801 | |
| | 5,681 | | | Marsh & McLennan Cos., Inc. | | | 274,744 | |
| | 5,865 | | | Old Republic International Corp. | | | 101,281 | |
| | 3,893 | | | Unum Group | | | 136,570 | |
| | 2,715 | | | W.R. Berkley Corp. | | | 117,805 | |
| | 4,013 | | | XL Group plc, (Ireland) | | | 127,773 | |
| | | | | | | | |
| | | | | | | 1,357,414 | |
| | | | | | | | |
| | | | Real Estate Investment Trusts (REITs) — 5.5% | |
| | 2,168 | | | American Campus Communities, Inc. | | | 69,836 | |
| | 4,431 | | | American Homes 4 Rent, Class A | | | 71,783 | |
| | 725 | | | AvalonBay Communities, Inc. | | | 85,702 | |
| | 1,799 | | | Brixmor Property Group, Inc. (a) | | | 36,580 | |
| | 2,770 | | | HCP, Inc. | | | 100,620 | |
| | 6,855 | | | Kimco Realty Corp. | | | 135,384 | |
| | 1,747 | | | Rayonier, Inc. | | | 73,553 | |
| | 1,839 | | | Regency Centers Corp. | | | 85,158 | |
| | 1,694 | | | Vornado Realty Trust | | | 150,432 | |
| | | | | | | | |
| | | | | | | 809,048 | |
| | | | | | | | |
| | | | Real Estate Management & Development — 0.7% | |
| | 5,272 | | | Brookfield Office Properties, Inc. | | | 101,480 | |
| | | | | | | | |
| | | | Thrifts & Mortgage Finance — 0.2% | | | | |
| | 3,902 | | | Hudson City Bancorp, Inc. | | | 36,798 | |
| | | | | | | | |
| | | | Total Financials | | | 4,006,844 | |
| | | | | | | | |
| | | | Health Care — 4.7% | | | | |
| | | | Health Care Equipment & Supplies — 0.8% | | | | |
| | 2,944 | | | CareFusion Corp. (a) | | | 117,231 | |
| | | | | | | | |
| | | | Health Care Providers & Services — 3.9% | | | | |
| | 2,159 | | | AmerisourceBergen Corp. | | | 151,811 | |
| | 2,308 | | | Cigna Corp. | | | 201,880 | |
| | 822 | | | Henry Schein, Inc. (a) | | | 93,900 | |
| | 1,321 | | | Humana, Inc. | | | 136,391 | |
| | | | | | | | |
| | | | | | | 583,982 | |
| | | | | | | | |
| | | | Total Health Care | | | 701,213 | |
| | | | | | | | |
| | | | Industrials — 10.2% | | | | |
| | | | Building Products — 0.7% | | | | |
| | 2,399 | | | Fortune Brands Home & Security, Inc. | | | 109,616 | |
| | | | | | | | |
| | | | Electrical Equipment — 3.0% | | | | |
| | 2,984 | | | AMETEK, Inc. | | | 157,186 | |
| | 1,092 | | | Hubbell, Inc., Class B | | | 118,870 | |
| | 2,306 | | | Regal-Beloit Corp. | | | 169,995 | |
| | | | | | | | |
| | | | | | | 446,051 | |
| | | | | | | | |
| | | | | | | | |
| SHARES | | | SECURITY DESCRIPTION | | VALUE($) | |
| | |
| | | | Industrial Conglomerates — 1.3% | | | | |
| | 2,371 | | | Carlisle Cos., Inc. | | | 188,253 | |
| | | | | | | | |
| | | | Machinery — 2.9% | | | | |
| | 2,553 | | | IDEX Corp. | | | 188,507 | |
| | 2,983 | | | Rexnord Corp. (a) | | | 80,578 | |
| | 1,501 | | | Snap-on, Inc. | | | 164,429 | |
| | | | | | | | |
| | | | | | | 433,514 | |
| | | | | | | | |
| | | | Professional Services — 1.2% | | | | |
| | 2,550 | | | Equifax, Inc. | | | 176,159 | |
| | | | | | | | |
| | | | Trading Companies & Distributors — 1.1% | | | | |
| | 2,016 | | | MSC Industrial Direct Co., Inc., Class A | | | 163,009 | |
| | | | | | | | |
| | | | Total Industrials | | | 1,516,602 | |
| | | | | | | | |
| | | | Information Technology — 9.6% | | | | |
| | | | Communications Equipment — 0.5% | | | | |
| | 3,575 | | | CommScope Holding Co., Inc. (a) | | | 67,645 | |
| | | | | | | | |
| | | | Electronic Equipment, Instruments & Components — 3.1% | |
| | 2,663 | | | Amphenol Corp., Class A | | | 237,492 | |
| | 4,003 | | | Arrow Electronics, Inc. (a) | | | 217,149 | |
| | | | | | | | |
| | | | | | | 454,641 | |
| | | | | | | | |
| | | | IT Services — 1.4% | | | | |
| | 3,488 | | | Jack Henry & Associates, Inc. | | | 206,554 | |
| | | | | | | | |
| | | | Semiconductors & Semiconductor Equipment — 3.5% | |
| | 4,128 | | | Analog Devices, Inc. | | | 210,236 | |
| | 2,110 | | | KLA-Tencor Corp. | | | 136,006 | |
| | 3,914 | | | Xilinx, Inc. | | | 179,751 | |
| | | | | | | | |
| | | | | | | 525,993 | |
| | | | | | | | |
| | | | Software — 1.1% | | | | |
| | 4,011 | | | Synopsys, Inc. (a) | | | 162,708 | |
| | | | | | | | |
| | | | Total Information Technology | | | 1,417,541 | |
| | | | | | | | |
| | | | Materials — 7.8% | | | | |
| | | | Chemicals — 4.0% | | | | |
| | 1,677 | | | Airgas, Inc. | | | 187,549 | |
| | 2,764 | | | Albemarle Corp. | | | 175,240 | |
| | 396 | | | Sherwin-Williams Co. (The) | | | 72,738 | |
| | 1,642 | | | Sigma-Aldrich Corp. | | | 154,363 | |
| | | | | | | | |
| | | | | | | 589,890 | |
| | | | | | | | |
| | | | Containers & Packaging — 3.8% | | | | |
| | 5,693 | | | Ball Corp. | | | 294,080 | |
| | 1,267 | | | Rock Tenn Co., Class A | | | 133,088 | |
| | 2,826 | | | Silgan Holdings, Inc. | | | 135,701 | |
| | | | | | | | |
| | | | | | | 562,869 | |
| | | | | | | | |
| | | | Total Materials | | | 1,152,759 | |
| | | | | | | | |
SEE NOTES TO FINANCIAL STATEMENTS.
| | | | | | | | |
| | | |
| DECEMBER 31, 2013 | | J.P. MORGAN MID CAP/MULTI-CAP FUNDS | | | | | 33 | |
JPMorgan Mid Cap Value Fund
SCHEDULE OF PORTFOLIO INVESTMENTS
AS OF DECEMBER 31, 2013 (Unaudited) (continued)
(Amounts in thousands)
| | | | | | | | |
| SHARES | | | SECURITY DESCRIPTION | | VALUE($) | |
| Common Stocks — Continued | |
| | | | Utilities — 9.1% | | | | |
| | | | Electric Utilities — 2.7% | | | | |
| | 2,706 | | | Edison International | | | 125,279 | |
| | 4,572 | | | Westar Energy, Inc. | | | 147,097 | |
| | 4,906 | | | Xcel Energy, Inc. | | | 137,071 | |
| | | | | | | | |
| | | | | | | 409,447 | |
| | | | | | | | |
| | | | Gas Utilities — 1.5% | | | | |
| | 1,255 | | | National Fuel Gas Co. | | | 89,627 | |
| | 5,649 | | | Questar Corp. | | | 129,868 | |
| | | | | | | | |
| | | | | | | 219,495 | |
| | | | | | | | |
| | | | Multi-Utilities — 4.9% | | | | |
| | 5,798 | | | CenterPoint Energy, Inc. | | | 134,400 | |
| | 5,377 | | | CMS Energy Corp. | | | 143,935 | |
| | 4,295 | | | NiSource, Inc. | | | 141,224 | |
| | 2,069 | | | Sempra Energy | | | 185,696 | |
| | 2,803 | | | Wisconsin Energy Corp. | | | 115,887 | |
| | | | | | | | |
| | | | | | | 721,142 | |
| | | | | | | | |
| | | | Total Utilities | | | 1,350,084 | |
| | | | | | | | |
| | | | Total Common Stocks
(Cost $9,647,629) | | | 14,496,411 | |
| | | | | | | | |
| | | | | | | | |
| SHARES | | | SECURITY DESCRIPTION | | VALUE($) | |
| Short-Term Investment — 2.3% | |
| | | | Investment Company — 2.3% | | | | |
| | 338,467 | | | JPMorgan Prime Money Market Fund, Institutional Class Shares, 0.010% (b) (l) (m)
(Cost $338,467) | | | 338,467 | |
| | | | | | | | |
| | | | Total Investments — 100.1%
(Cost $9,986,096) | | | 14,834,878 | |
| | | | Liabilities in Excess of
Other Assets — (0.1)% | | | (9,125 | ) |
| | | | | | | | |
| | | | NET ASSETS — 100.0% | | $ | 14,825,753 | |
| | | | | | | | |
Percentages indicated are based on net assets.
SEE NOTES TO FINANCIAL STATEMENTS.
| | | | | | |
| | | |
| 34 | | | | J.P. MORGAN MID CAP/MULTI-CAP FUNDS | | DECEMBER 31, 2013 |
JPMorgan Multi-Cap Market Neutral Fund
SCHEDULE OF PORTFOLIO INVESTMENTS
AS OF DECEMBER 31, 2013 (Unaudited)
(Amounts in thousands)
| | | | | | | | |
| SHARES | | | SECURITY DESCRIPTION | | VALUE($) | |
| Long Positions — 100.5% (j) | |
| Common Stocks — 93.9% | |
| | | | Consumer Discretionary — 15.1% | |
| | | | Auto Components — 0.5% | |
| | 102 | | | Dana Holding Corp. | | | 2,008 | |
| | | | | | | | |
| | | | Diversified Consumer Services — 2.0% | |
| | 69 | | | Apollo Education Group, Inc. (a) | | | 1,881 | |
| | 139 | | | H&R Block, Inc. | | | 4,040 | |
| | 143 | | | Service Corp. International | | | 2,591 | |
| | | | | | | | |
| | | | | | | 8,512 | |
| | | | | | | | |
| | | | Hotels, Restaurants & Leisure — 1.8% | |
| | 21 | | | Bally Technologies, Inc. (a) | | | 1,609 | |
| | 16 | | | Hyatt Hotels Corp., Class A (a) | | | 799 | |
| | 131 | | | International Game Technology | | | 2,378 | |
| | 24 | | | Marriott Vacations Worldwide Corp. (a) | | | 1,264 | |
| | 64 | | | MGM Resorts International (a) | | | 1,511 | |
| | | | | | | | |
| | | | | | | 7,561 | |
| | | | | | | | |
| | | | Household Durables — 1.9% | |
| | 21 | | | Garmin Ltd., (Switzerland) | | | 953 | |
| | 48 | | | Jarden Corp. (a) | | | 2,971 | |
| | 138 | | | PulteGroup, Inc. | | | 2,813 | |
| | 9 | | | Whirlpool Corp. | | | 1,456 | |
| | | | | | | | |
| | | | | | | 8,193 | |
| | | | | | | | |
| | | | Internet & Catalog Retail — 0.7% | |
| | 16 | | | Expedia, Inc. | | | 1,108 | |
| | 44 | | | HomeAway, Inc. (a) | | | 1,799 | |
| | | | | | | | |
| | | | | | | 2,907 | |
| | | | | | | | |
| | | | Leisure Equipment & Products — 0.5% | |
| | 28 | | | Hasbro, Inc. | | | 1,548 | |
| | 7 | | | Sturm Ruger & Co., Inc. | | | 480 | |
| | | | | | | | |
| | | | | | | 2,028 | |
| | | | | | | | |
| | | | Media — 3.0% | |
| | 15 | | | Comcast Corp., Class A | | | 796 | |
| | 31 | | | Gannett Co., Inc. | | | 906 | |
| | 6 | | | Graham Holdings Co., Class B (a) | | | 3,980 | |
| | 21 | | | Omnicom Group, Inc. | | | 1,562 | |
| | 7 | | | Regal Entertainment Group, Class A | | | 130 | |
| | 18 | | | Scripps Networks Interactive, Inc., Class A | | | 1,571 | |
| | 43 | | | Viacom, Inc., Class B | | | 3,712 | |
| | | | | | | | |
| | | | | | | 12,657 | |
| | | | | | | | |
| | | | Multiline Retail — 0.2% | |
| | 8 | | | Dillard’s, Inc., Class A | | | 740 | |
| | | | | | | | |
| | | | Specialty Retail — 4.1% | |
| | 97 | | | Best Buy Co., Inc. | | | 3,887 | |
| | | | | | | | |
| SHARES | | | SECURITY DESCRIPTION | | VALUE($) | |
| | |
| | |
| | | | Specialty Retail — Continued | |
| | 84 | | | GameStop Corp., Class A | | | 4,116 | |
| | 25 | | | Guess?, Inc. | | | 788 | |
| | 46 | | | Lowe’s Cos., Inc. | | | 2,302 | |
| | 192 | | | Office Depot, Inc. (a) | | | 1,018 | |
| | 11 | | | O’Reilly Automotive, Inc. (a) | | | 1,365 | |
| | 248 | | | Staples, Inc. | | | 3,946 | |
| | | | | | | | |
| | | | | | | 17,422 | |
| | | | | | | | |
| | | | Textiles, Apparel & Luxury Goods — 0.4% | |
| | 27 | | | Hanesbrands, Inc. | | | 1,880 | |
| | | | | | | | |
| | | | Total Consumer Discretionary | | | 63,908 | |
| | | | | | | | |
| | | | Consumer Staples — 7.9% | |
| | | | Beverages — 0.9% | |
| | 68 | | | Molson Coors Brewing Co., Class B | | | 3,841 | |
| | | | | | | | |
| | | | Food & Staples Retailing — 2.2% | |
| | 84 | | | Kroger Co. (The) | | | 3,329 | |
| | 344 | | | Rite Aid Corp. (a) | | | 1,738 | |
| | 65 | | | Safeway, Inc. | | | 2,118 | |
| | 40 | | | Walgreen Co. | | | 2,318 | |
| | | | | | | | |
| | | | | | | 9,503 | |
| | | | | | | | |
| | | | Food Products — 2.4% | |
| | 96 | | | Archer-Daniels-Midland Co. | | | 4,146 | |
| | 176 | | | Pilgrim’s Pride Corp. (a) | | | 2,861 | |
| | 19 | | | Sanderson Farms, Inc. | | | 1,387 | |
| | 49 | | | Tyson Foods, Inc., Class A | | | 1,654 | |
| | | | | | | | |
| | | | | | | 10,048 | |
| | | | | | | | |
| | | | Household Products — 1.0% | |
| | 37 | | | Energizer Holdings, Inc. | | | 4,057 | |
| | | | | | | | |
| | | | Personal Products — 0.8% | |
| | 23 | | | Herbalife Ltd., (Cayman Islands) | | | 1,825 | |
| | 12 | | | Nu Skin Enterprises, Inc., Class A | | | 1,711 | |
| | | | | | | | |
| | | | | | | 3,536 | |
| | | | | | | | |
| | | | Tobacco — 0.6% | |
| | 29 | | | Altria Group, Inc. | | | 1,131 | |
| | 25 | | | Lorillard, Inc. | | | 1,248 | |
| | | | | | | | |
| | | | | | | 2,379 | |
| | | | | | | | |
| | | | Total Consumer Staples | | | 33,364 | |
| | | | | | | | |
| | | | Energy — 7.2% | | | | |
| | | | Energy Equipment & Services — 2.0% | |
| | 56 | | | Diamond Offshore Drilling, Inc. | | | 3,165 | |
| | 20 | | | Ensco plc, (United Kingdom), Class A | | | 1,164 | |
| | 25 | | | Helix Energy Solutions Group, Inc. (a) | | | 586 | |
SEE NOTES TO FINANCIAL STATEMENTS.
| | | | | | | | |
| | | |
| DECEMBER 31, 2013 | | J.P. MORGAN MID CAP/MULTI-CAP FUNDS | | | | | 35 | |
JPMorgan Multi-Cap Market Neutral Fund
SCHEDULE OF PORTFOLIO INVESTMENTS
AS OF DECEMBER 31, 2013 (Unaudited) (continued)
(Amounts in thousands)
| | | | | | | | |
| SHARES | | | SECURITY DESCRIPTION | | VALUE($) | |
| Long Positions — Continued | |
| Common Stocks — Continued | |
| | | | Energy Equipment & Services — Continued | |
| | 91 | | | Nabors Industries Ltd., (Bermuda) | | | 1,544 | |
| | 14 | | | Oil States International, Inc. (a) | | | 1,428 | |
| | 16 | | | Rowan Cos. plc, Class A (a) | | | 564 | |
| | | | | | | | |
| | | | | | | 8,451 | |
| | | | | | | | |
| | | | Oil, Gas & Consumable Fuels — 5.2% | |
| | 43 | | | Anadarko Petroleum Corp. | | | 3,433 | |
| | 8 | | | Chevron Corp. | | | 943 | |
| | 20 | | | ConocoPhillips | | | 1,404 | |
| | 32 | | | Devon Energy Corp. | | | 1,961 | |
| | 234 | | | Kosmos Energy Ltd., (Bermuda) (a) | | | 2,621 | |
| | 8 | | | Marathon Petroleum Corp. | | | 722 | |
| | 30 | | | Newfield Exploration Co. (a) | | | 738 | |
| | 29 | | | Oasis Petroleum, Inc. (a) | | | 1,385 | |
| | 29 | | | Phillips 66 | | | 2,210 | |
| | 61 | | | Tesoro Corp. | | | 3,579 | |
| | 15 | | | Whiting Petroleum Corp. (a) | | | 948 | |
| | 46 | | | World Fuel Services Corp. | | | 1,983 | |
| | | | | | | | |
| | | | | | | 21,927 | |
| | | | | | | | |
| | | | Total Energy | | | 30,378 | |
| | | | | | | | |
| | | | Financials — 5.6% | | | | |
| | | | Capital Markets — 0.2% | |
| | 6 | | | Ameriprise Financial, Inc. | | | 648 | |
| | | | | | | | |
| | | | Commercial Banks — 1.0% | | | | |
| | 37 | | | East West Bancorp, Inc. | | | 1,281 | |
| | 174 | | | Huntington Bancshares, Inc. | | | 1,681 | |
| | 109 | | | Regions Financial Corp. | | | 1,076 | |
| | | | | | | | |
| | | | | | | 4,038 | |
| | | | | | | | |
| | | | Consumer Finance — 0.6% | |
| | 26 | | | Discover Financial Services | | | 1,430 | |
| | 39 | | | SLM Corp. | | | 1,036 | |
| | | | | | | | |
| | | | | | | 2,466 | |
| | | | | | | | |
| | | | Diversified Financial Services — 0.5% | |
| | 31 | | | Citigroup, Inc. | | | 1,615 | |
| | 8 | | | Moody’s Corp. | | | 597 | |
| | | | | | | | |
| | | | | | | 2,212 | |
| | | | | | | | |
| | | | Insurance — 1.5% | |
| | 34 | | | Allstate Corp. (The) | | | 1,879 | |
| | 14 | | | Aspen Insurance Holdings Ltd., (Bermuda) | | | 579 | |
| | 9 | | | Everest Re Group Ltd., (Bermuda) | | | 1,326 | |
| | 13 | | | HCC Insurance Holdings, Inc. | | | 593 | |
| | 17 | | | Prudential Financial, Inc. | | | 1,529 | |
| | 7 | | | Travelers Cos., Inc. (The) | | | 624 | |
| | | | | | | | |
| | | | | | | 6,530 | |
| | | | | | | | |
| | | | | | | | |
| SHARES | | | SECURITY DESCRIPTION | | VALUE($) | |
| | |
| | |
| | | | Real Estate Investment Trusts (REITs) — 1.5% | |
| | 38 | | | Brandywine Realty Trust | | | 538 | |
| | 22 | | | CBL & Associates Properties, Inc. | | | 397 | |
| | 12 | | | Highwoods Properties, Inc. | | | 436 | |
| | 170 | | | RLJ Lodging Trust | | | 4,131 | |
| | 6 | | | SL Green Realty Corp. | | | 514 | |
| | 15 | | | Weingarten Realty Investors | | | 403 | |
| | | | | | | | |
| | | | | | | 6,419 | |
| | | | | | | | |
| | | | Thrifts & Mortgage Finance — 0.3% | |
| | 22 | | | Ocwen Financial Corp. (a) | | | 1,205 | |
| | | | | | | | |
| | | | Total Financials | | | 23,518 | |
| | | | | | | | |
| | | | Health Care — 11.6% | | | | |
| | | | Biotechnology — 2.5% | |
| | 18 | | | Amgen, Inc. | | | 2,110 | |
| | 12 | | | Gilead Sciences, Inc. (a) | | | 911 | |
| | 65 | | | PDL BioPharma, Inc. | | | 551 | |
| | 39 | | | United Therapeutics Corp. (a) | | | 4,357 | |
| | 32 | | | Vertex Pharmaceuticals, Inc. (a) | | | 2,412 | |
| | | | | | | | |
| | | | | | | 10,341 | |
| | | | | | | | |
| | | | Health Care Equipment & Supplies — 3.6% | |
| | 20 | | | Align Technology, Inc. (a) | | | 1,120 | |
| | 12 | | | Becton, Dickinson & Co. | | | 1,281 | |
| | 31 | | | Boston Scientific Corp. (a) | | | 370 | |
| | 104 | | | CareFusion Corp. (a) | | | 4,130 | |
| | 74 | | | Medtronic, Inc. | | | 4,261 | |
| | 55 | | | Stryker Corp. | | | 4,110 | |
| | | | | | | | |
| | | | | | | 15,272 | |
| | | | | | | | |
| | | | Health Care Providers & Services — 4.2% | |
| | 48 | | | AmerisourceBergen Corp. | | | 3,360 | |
| | 23 | | | Cigna Corp. | | | 1,993 | |
| | 24 | | | McKesson Corp. | | | 3,886 | |
| | 72 | | | Omnicare, Inc. | | | 4,367 | |
| | 46 | | | WellPoint, Inc. | | | 4,234 | |
| | | | | | | | |
| | | | | | | 17,840 | |
| | | | | | | | |
| | | | Pharmaceuticals — 1.3% | |
| | 22 | | | Endo Health Solutions, Inc. (a) | | | 1,463 | |
| | 132 | | | Pfizer, Inc. | | | 4,029 | |
| | | | | | | | |
| | | | | | | 5,492 | |
| | | | | | | | |
| | | | Total Health Care | | | 48,945 | |
| | | | | | | | |
| | | | Industrials — 16.6% | | | | |
| | | | Aerospace & Defense — 2.8% | |
| | 28 | | | Boeing Co. (The) | | | 3,873 | |
| | 15 | | | Esterline Technologies Corp. (a) | | | 1,509 | |
SEE NOTES TO FINANCIAL STATEMENTS.
| | | | | | |
| | | |
| 36 | | | | J.P. MORGAN MID CAP/MULTI-CAP FUNDS | | DECEMBER 31, 2013 |
| | | | | | | | |
| SHARES | | | SECURITY DESCRIPTION | | VALUE($) | |
| Long Positions — Continued | |
| Common Stocks — Continued | |
| | | | Aerospace & Defense — Continued | |
| | 19 | | | Northrop Grumman Corp. | | | 2,219 | |
| | 6 | | | Raytheon Co. | | | 578 | |
| | 58 | | | Spirit Aerosystems Holdings, Inc., Class A (a) | | | 1,990 | |
| | 10 | | | TransDigm Group, Inc. | | | 1,660 | |
| | | | | | | | |
| | | | | | | 11,829 | |
| | | | | | | | |
| | | | Air Freight & Logistics — 0.1% | |
| | 2 | | | United Parcel Service, Inc., Class B | | | 255 | |
| | | | | | | | |
| | | | Airlines — 0.9% | |
| | 9 | | | Alaska Air Group, Inc. | | | 635 | |
| | 71 | | | Delta Air Lines, Inc. | | | 1,962 | |
| | 58 | | | Southwest Airlines Co. | | | 1,093 | |
| | | | | | | | |
| | | | | | | 3,690 | |
| | | | | | | | |
| | | | Building Products — 0.1% | |
| | 10 | | | Allegion plc, (Ireland) (a) | | | 443 | |
| | | | | | | | |
| | | | Commercial Services & Supplies — 2.2% | |
| | 207 | | | Pitney Bowes, Inc. | | | 4,825 | |
| | 231 | | | R.R. Donnelley & Sons Co. | | | 4,685 | |
| | | | | | | | |
| | | | | | | 9,510 | |
| | | | | | | | |
| | | | Construction & Engineering — 2.0% | |
| | 134 | | | AECOM Technology Corp. (a) | | | 3,954 | |
| | 30 | | | EMCOR Group, Inc. | | | 1,254 | |
| | 16 | | | Fluor Corp. | | | 1,320 | |
| | 36 | | | URS Corp. | | | 1,893 | |
| | | | | | | | |
| | | | | | | 8,421 | |
| | | | | | | | |
| | | | Electrical Equipment — 0.5% | |
| | 30 | | | EnerSys, Inc. | | | 2,075 | |
| | | | | | | | |
| | | | Machinery — 5.2% | |
| | 21 | | | AGCO Corp. | | | 1,268 | |
| | 35 | | | Briggs & Stratton Corp. | | | 760 | |
| | 16 | | | Crane Co. | | | 1,046 | |
| | 56 | | | IDEX Corp. | | | 4,158 | |
| | 30 | | | Ingersoll-Rand plc, (Ireland) | | | 1,851 | |
| | 97 | | | ITT Corp. | | | 4,229 | |
| | 81 | | | Oshkosh Corp. | | | 4,086 | |
| | 16 | | | Parker Hannifin Corp. | | | 2,119 | |
| | — | (h) | | Standex International Corp. | | | 25 | |
| | 63 | | | Terex Corp. | | | 2,664 | |
| | | | | | | | |
| | | | | | | 22,206 | |
| | | | | | | | |
| | | | Professional Services — 2.8% | |
| | 35 | | | Dun & Bradstreet Corp. (The) | | | 4,241 | |
| | 52 | | | Manpowergroup, Inc. | | | 4,473 | |
| | | | | | | | |
| SHARES | | | SECURITY DESCRIPTION | | VALUE($) | |
| | |
| | |
| | | | Professional Services — Continued | |
| | 25 | | | Towers Watson & Co., Class A | | | 3,200 | |
| | | | | | | | |
| | | | | | | 11,914 | |
| | | | | | | | |
| | | | Total Industrials | | | 70,343 | |
| | | | | | | | |
| | | | Information Technology — 20.2% | | | | |
| | | | Communications Equipment — 2.9% | |
| | 18 | | | Aruba Networks, Inc. (a) | | | 316 | |
| | 461 | | | Brocade Communications Systems, Inc. (a) | | | 4,087 | |
| | 71 | | | Cisco Systems, Inc. | | | 1,598 | |
| | 21 | | | Harris Corp. | | | 1,443 | |
| | 357 | | | Polycom, Inc. (a) | | | 4,006 | |
| | 18 | | | Ubiquiti Networks, Inc. (a) | | | 820 | |
| | | | | | | | |
| | | | | | | 12,270 | |
| | | | | | | | |
| | | | Computers & Peripherals — 4.4% | |
| | 148 | | | Hewlett-Packard Co. | | | 4,150 | |
| | 117 | | | Lexmark International, Inc., Class A | | | 4,166 | |
| | 96 | | | NetApp, Inc. | | | 3,947 | |
| | 37 | | | Seagate Technology plc, (Ireland) | | | 2,059 | |
| | 51 | | | Western Digital Corp. | | | 4,303 | |
| | | | | | | | |
| | | | | | | 18,625 | |
| | | | | | | | |
| | | | Internet Software & Services — 2.1% | |
| | 6 | | | Twitter, Inc. (a) | | | 388 | |
| | 71 | | | VeriSign, Inc. (a) | | | 4,249 | |
| | 109 | | | Yahoo!, Inc. (a) | | | 4,397 | |
| | | | | | | | |
| | | | | | | 9,034 | |
| | | | | | | | |
| | | | IT Services — 2.5% | |
| | 99 | | | Amdocs Ltd. | | | 4,102 | |
| | 79 | | | Computer Sciences Corp. | | | 4,433 | |
| | 11 | | | Jack Henry & Associates, Inc. | | | 650 | |
| | 31 | | | NeuStar, Inc., Class A (a) | | | 1,526 | |
| | | | | | | | |
| | | | | | | 10,711 | |
| | | | | | | | |
| | | | Office Electronics — 0.5% | |
| | 109 | | | Xerox Corp. | | | 1,324 | |
| | 11 | | | Zebra Technologies Corp., Class A (a) | | | 573 | |
| | | | | | | | |
| | | | | | | 1,897 | |
| | | | | | | | |
| | | | Semiconductors & Semiconductor Equipment — 2.7% | |
| | 37 | | | Broadcom Corp., Class A | | | 1,082 | |
| | 23 | | | KLA-Tencor Corp. | | | 1,486 | |
| | 58 | | | Lam Research Corp. (a) | | | 3,180 | |
| | 292 | | | Marvell Technology Group Ltd., (Bermuda) | | | 4,201 | |
| | 84 | | | NVIDIA Corp. | | | 1,352 | |
| | | | | | | | |
| | | | | | | 11,301 | |
| | | | | | | | |
SEE NOTES TO FINANCIAL STATEMENTS.
| | | | | | | | |
| | | |
| DECEMBER 31, 2013 | | J.P. MORGAN MID CAP/MULTI-CAP FUNDS | | | | | 37 | |
JPMorgan Multi-Cap Market Neutral Fund
SCHEDULE OF PORTFOLIO INVESTMENTS
AS OF DECEMBER 31, 2013 (Unaudited) (continued)
(Amounts in thousands)
| | | | | | | | |
| SHARES | | | SECURITY DESCRIPTION | | VALUE($) | |
| Long Positions — Continued | |
| Common Stocks — Continued | |
| | | | Software — 5.1% | |
| | 256 | | | Activision Blizzard, Inc. | | | 4,573 | |
| | 81 | | | CA, Inc. | | | 2,737 | |
| | 109 | | | Cadence Design Systems, Inc. (a) | | | 1,534 | |
| | 86 | | | Microsoft Corp. | | | 3,228 | |
| | 50 | | | Oracle Corp. | | | 1,902 | |
| | 16 | | | PTC, Inc. (a) | | | 575 | |
| | 202 | | | Rovi Corp. (a) | | | 3,974 | |
| | 83 | | | Symantec Corp. | | | 1,946 | |
| | 57 | | | Take-Two Interactive Software, Inc. (a) | | | 998 | |
| | | | | | | | |
| | | | | | | 21,467 | |
| | | | | | | | |
| | | | Total Information Technology | | | 85,305 | |
| | | | | | | | |
| | | | Materials — 5.5% | | | | |
| | | | Chemicals — 0.6% | |
| | 49 | | | Huntsman Corp. | | | 1,217 | |
| | 21 | | | Scotts Miracle-Gro Co. (The), Class A | | | 1,322 | |
| | | | | | | | |
| | | | | | | 2,539 | |
| | | | | | | | |
| | | | Containers & Packaging — 2.6% | |
| | 21 | | | Ball Corp. | | | 1,067 | |
| | 22 | | | Greif, Inc., Class A | | | 1,174 | |
| | 33 | | | Owens-Illinois, Inc. (a) | | | 1,191 | |
| | 25 | | | Packaging Corp. of America | | | 1,606 | |
| | 121 | | | Sealed Air Corp. | | | 4,121 | |
| | 38 | | | Silgan Holdings, Inc. | | | 1,817 | |
| | | | | | | | |
| | | | | | | 10,976 | |
| | | | | | | | |
| | | | Metals & Mining — 1.0% | |
| | 16 | | | Reliance Steel & Aluminum Co. | | | 1,224 | |
| | 37 | | | Steel Dynamics, Inc. | | | 715 | |
| | 22 | | | SunCoke Energy, Inc. (a) | | | 505 | |
| | 43 | | | Worthington Industries, Inc. | | | 1,790 | |
| | | | | | | | |
| | | | | | | 4,234 | |
| | | | | | | | |
| | | | Paper & Forest Products — 1.3% | |
| | 35 | | | Domtar Corp., (Canada) | | | 3,323 | |
| | 50 | | | Louisiana-Pacific Corp. (a) | | | 933 | |
| | 26 | | | Schweitzer-Mauduit International, Inc. | | | 1,326 | |
| | | | | | | | |
| | | | | | | 5,582 | |
| | | | | | | | |
| | | | Total Materials | | | 23,331 | |
| | | | | | | | |
| | | | Telecommunication Services — 1.4% | | | | |
| | | | Diversified Telecommunication Services — 1.2% | |
| | 106 | | | AT&T, Inc. | | | 3,725 | |
| | 227 | | | Frontier Communications Corp. | | | 1,055 | |
| | 3 | | | Verizon Communications, Inc. | | | 126 | |
| | | | | | | | |
| | | | | | | 4,906 | |
| | | | | | | | |
| | | | | | | | |
| SHARES | | | SECURITY DESCRIPTION | | VALUE($) | |
| | |
| | |
| | | | Wireless Telecommunication Services — 0.2% | |
| | 27 | | | T-Mobile US, Inc. (a) | | | 918 | |
| | | | | | | | |
| | | | Total Telecommunication Services | | | 5,824 | |
| | | | | | | | |
| | | | Utilities — 2.8% | | | | |
| | | | Gas Utilities — 1.3% | |
| | 24 | | | AGL Resources, Inc. | | | 1,116 | |
| | 102 | | | UGI Corp. | | | 4,212 | |
| | | | | | | | |
| | | | | | | 5,328 | |
| | | | | | | | |
| | | | Independent Power Producers & Energy Traders — 1.5% | |
| | 273 | | | AES Corp. | | | 3,966 | |
| | 113 | | | Calpine Corp. (a) | | | 2,211 | |
| | | | | | | | |
| | | | | | | 6,177 | |
| | | | | | | | |
| | | | Multi-Utilities — 0.0% (g) | |
| | 5 | | | Ameren Corp. | | | 190 | |
| | | | | | | | |
| | | | Total Utilities | | | 11,695 | |
| | | | | | | | |
| | | | Total Common Stocks
(Cost $316,685) | | | 396,611 | |
| | | | | | | | |
| Short-Term Investment — 6.6% | |
| | | | Investment Company — 6.6% | |
| | 27,757 | | | JPMorgan Liquid Assets Money Market Fund, Institutional Class Shares, 0.020% (b) (l)
(Cost $27,757) | | | 27,757 | |
| | | | | | | | |
| | | | Total Investments — 100.5%
(Cost $344,442) | | | 424,368 | |
| | | | Liabilities in Excess of
Other Assets — (0.5)% | | | (2,249 | ) |
| | | | | | | | |
| | | | NET ASSETS — 100.0% | | $ | 422,119 | |
| | | | | | | | |
| Short Positions — 93.0% | |
| Common Stocks — 93.0% | |
| | | | Consumer Discretionary — 14.0% | |
| | | | Automobiles — 0.8% | |
| | 20 | | | Harley-Davidson, Inc. | | | 1,362 | |
| | 14 | | | Tesla Motors, Inc. (a) | | | 2,060 | |
| | | | | | | | |
| | | | | | | 3,422 | |
| | | | | | | | |
| | | | Distributors — 0.2% | |
| | 25 | | | LKQ Corp. (a) | | | 811 | |
| | | | | | | | |
| | | | Hotels, Restaurants & Leisure — 4.2% | |
| | 104 | | | Carnival Corp. | | | 4,198 | |
| | 35 | | | Choice Hotels International, Inc. | | | 1,698 | |
| | 74 | | | Darden Restaurants, Inc. | | | 4,033 | |
| | 16 | | | Marriott International, Inc., Class A | | | 807 | |
| | 5 | | | McDonald’s Corp. | | | 521 | |
| | 114 | | | Norwegian Cruise Line Holdings Ltd. (a) | | | 4,044 | |
| | 32 | | | Yum! Brands, Inc. | | | 2,397 | |
| | | | | | | | |
| | | | | | | 17,698 | |
| | | | | | | | |
SEE NOTES TO FINANCIAL STATEMENTS.
| | | | | | |
| | | |
| 38 | | | | J.P. MORGAN MID CAP/MULTI-CAP FUNDS | | DECEMBER 31, 2013 |
| | | | | | | | |
| SHARES | | | SECURITY DESCRIPTION | | VALUE($) | |
| Short Positions — Continued | |
| Common Stocks — Continued | |
| | | | Household Durables — 0.6% | |
| | 66 | | | D.R. Horton, Inc. (a) | | | 1,469 | |
| | 22 | | | Tempur Sealy International, Inc. (a) | | | 1,213 | |
| | | | | | | | |
| | | | | | | 2,682 | |
| | | | | | | | |
| | | | Media — 2.7% | |
| | 32 | | | Charter Communications, Inc., Class A (a) | | | 4,325 | |
| | 19 | | | Discovery Communications, Inc., Class A (a) | | | 1,713 | |
| | 41 | | | DreamWorks Animation SKG, Inc., Class A (a) | | | 1,459 | |
| | 13 | | | Lamar Advertising Co., Class A (a) | | | 698 | |
| | 9 | | | Liberty Global plc, (United Kingdom), Class A (a) | | | 782 | |
| | 505 | | | Sirius XM Holdings, Inc. (a) | | | 1,763 | |
| | 23 | | | Thomson Reuters Corp. | | | 868 | |
| | | | | | | | |
| | | | | | | 11,608 | |
| | | | | | | | |
| | | | Multiline Retail — 1.4% | |
| | 58 | | | Family Dollar Stores, Inc. | | | 3,772 | |
| | 228 | | | J.C. Penney Co., Inc. (a) | | | 2,083 | |
| | | | | | | | |
| | | | | | | 5,855 | |
| | | | | | | | |
| | | | Specialty Retail — 2.5% | |
| | 53 | | | Sally Beauty Holdings, Inc. (a) | | | 1,590 | |
| | 36 | | | Signet Jewelers Ltd., (Bermuda) | | | 2,825 | |
| | 45 | | | Tractor Supply Co. | | | 3,519 | |
| | 25 | | | Ulta Salon Cosmetics & Fragrance, Inc. (a) | | | 2,424 | |
| | | | | | | | |
| | | | | | | 10,358 | |
| | | | | | | | |
| | | | Textiles, Apparel & Luxury Goods — 1.6% | |
| | 109 | | | Fifth & Pacific Cos., Inc. (a) | | | 3,494 | |
| | 12 | | | Lululemon Athletica, Inc., (Canada) (a) | | | 685 | |
| | 29 | | | Under Armour, Inc., Class A (a) | | | 2,530 | |
| | | | | | | | |
| | | | | | | 6,709 | |
| | | | | | | | |
| | | | Total Consumer Discretionary | | | 59,143 | |
| | | | | | | | |
| | | | Consumer Staples — 8.2% | |
| | | | Beverages — 2.5% | |
| | 62 | | | Beam, Inc. | | | 4,193 | |
| | 60 | | | Brown-Forman Corp., Class B | | | 4,507 | |
| | 26 | | | Monster Beverage Corp. (a) | | | 1,785 | |
| | | | | | | | |
| | | | | | | 10,485 | |
| | | | | | | | |
| | | | Food & Staples Retailing — 1.9% | |
| | 18 | | | PriceSmart, Inc. | | | 2,031 | |
| | 59 | | | United Natural Foods, Inc. (a) | | | 4,467 | |
| | 25 | | | Whole Foods Market, Inc. | | | 1,453 | |
| | | | | | | | |
| | | | | | | 7,951 | |
| | | | | | | | |
| | | | Food Products — 2.6% | |
| | 138 | | | Flowers Foods, Inc. | | | 2,965 | |
| | 53 | | | Hain Celestial Group, Inc. (The) (a) | | | 4,818 | |
| | | | | | | | |
| SHARES | | | SECURITY DESCRIPTION | | VALUE($) | |
| | |
| | |
| | | | Food Products — Continued | |
| | 12 | | | Hormel Foods Corp. | | | 543 | |
| | 25 | | | McCormick & Co., Inc. (Non-Voting) | | | 1,753 | |
| | 31 | | | Mondelez International, Inc., Class A | | | 1,080 | |
| | | | | | | | |
| | | | | | | 11,159 | |
| | | | | | | | |
| | | | Household Products — 0.2% | |
| | 11 | | | Procter & Gamble Co. (The) | | | 884 | |
| | | | | | | | |
| | | | Personal Products — 1.0% | |
| | 39 | | | Coty, Inc., Class A | | | 593 | |
| | 49 | | | Estee Lauder Cos., Inc. (The), Class A | | | 3,719 | |
| | | | | | | | |
| | | | | | | 4,312 | |
| | | | | | | | |
| | | | Total Consumer Staples | | | 34,791 | |
| | | | | | | | |
| | | | Energy — 8.3% | |
| | | | Energy Equipment & Services — 1.8% | |
| | 24 | | | Dresser-Rand Group, Inc. (a) | | | 1,441 | |
| | 30 | | | FMC Technologies, Inc. (a) | | | 1,586 | |
| | 479 | | | McDermott International, Inc. (a) | | | 4,389 | |
| | | | | | | | |
| | | | | | | 7,416 | |
| | | | | | | | |
| | | | Oil, Gas & Consumable Fuels — 6.5% | |
| | 7 | | | Cimarex Energy Co. | | | 749 | |
| | 38 | | | Concho Resources, Inc. (a) | | | 4,147 | |
| | 108 | | | CONSOL Energy, Inc. | | | 4,100 | |
| | 22 | | | Energen Corp. | | | 1,544 | |
| | 71 | | | Golar LNG Ltd., (Bermuda) | | | 2,578 | |
| | 23 | | | Gulfport Energy Corp. (a) | | | 1,475 | |
| | 43 | | | Kodiak Oil & Gas Corp. (a) | | | 481 | |
| | 136 | | | Laredo Petroleum Holdings, Inc. (a) | | | 3,762 | |
| | 48 | | | Range Resources Corp. | | | 4,010 | |
| | 2 | | | SM Energy Co. | | | 166 | |
| | 53 | | | Spectra Energy Corp. | | | 1,885 | |
| | 22 | | | Williams Cos., Inc. (The) | | | 850 | |
| | 86 | | | WPX Energy, Inc. (a) | | | 1,744 | |
| | | | | | | | |
| | | | | | | 27,491 | |
| | | | | | | | |
| | | | Total Energy | | | 34,907 | |
| | | | | | | | |
| | | | Financials — 6.5% | |
| | | | Capital Markets — 1.2% | |
| | 173 | | | Ares Capital Corp. | | | 3,081 | |
| | 22 | | | T. Rowe Price Group, Inc. | | | 1,858 | |
| | | | | | | | |
| | | | | | | 4,939 | |
| | | | | | | | |
| | | | Commercial Banks — 1.4% | |
| | 146 | | | TCF Financial Corp. | | | 2,373 | |
| | 364 | | | Valley National Bancorp | | | 3,687 | |
| | | | | | | | |
| | | | | | | 6,060 | |
| | | | | | | | |
SEE NOTES TO FINANCIAL STATEMENTS.
| | | | | | | | |
| | | |
| DECEMBER 31, 2013 | | J.P. MORGAN MID CAP/MULTI-CAP FUNDS | | | | | 39 | |
JPMorgan Multi-Cap Market Neutral Fund
SCHEDULE OF PORTFOLIO INVESTMENTS
AS OF DECEMBER 31, 2013 (Unaudited) (continued)
(Amounts in thousands)
| | | | | | | | |
| SHARES | | | SECURITY DESCRIPTION | | VALUE($) | |
| Short Positions — Continued | |
| Common Stocks — Continued | |
| | | | Diversified Financial Services — 0.3% | |
| | 18 | | | CME Group, Inc. | | | 1,429 | |
| | | | | | | | |
| | | | Insurance — 1.9% | |
| | 2 | | | Alleghany Corp. (a) | | | 746 | |
| | 29 | | | Cincinnati Financial Corp. | | | 1,501 | |
| | 3 | | | Markel Corp. (a) | | | 1,973 | |
| | 16 | | | Marsh & McLennan Cos., Inc. | | | 778 | |
| | 119 | | | MBIA, Inc. (a) | | | 1,423 | |
| | 34 | | | Mercury General Corp. | | | 1,668 | |
| | | | | | | | |
| | | | | | | 8,089 | |
| | | | | | | | |
| | | | Real Estate Investment Trusts (REITs) — 1.3% | |
| | 197 | | | American Capital Agency Corp. | | | 3,792 | |
| | 165 | | | Annaly Capital Management, Inc. | | | 1,644 | |
| | | | | | | | |
| | | | | | | 5,436 | |
| | | | | | | | |
| | | | Thrifts & Mortgage Finance — 0.4% | |
| | 105 | | | People’s United Financial, Inc. | | | 1,593 | |
| | | | | | | | |
| | | | Total Financials | | | 27,546 | |
| | | | | | | | |
| | | | Health Care — 11.4% | |
| | | | Biotechnology — 1.3% | |
| | 7 | | | Biogen Idec, Inc. (a) | | | 1,909 | |
| | 75 | | | Cepheid, Inc. (a) | | | 3,482 | |
| | | | | | | | |
| | | | | | | 5,391 | |
| | | | | | | | |
| | | | Health Care Equipment & Supplies — 2.7% | |
| | 32 | | | Cooper Cos., Inc. (The) | | | 3,935 | |
| | 22 | | | DENTSPLY International, Inc. | | | 1,051 | |
| | 14 | | | HeartWare International, Inc. (a) | | | 1,310 | |
| | 2 | | | Intuitive Surgical, Inc. (a) | | | 852 | |
| | 44 | | | Teleflex, Inc. | | | 4,153 | |
| | | | | | | | |
| | | | | | | 11,301 | |
| | | | | | | | |
| | | | Health Care Providers & Services — 4.5% | |
| | 159 | | | Brookdale Senior Living, Inc. (a) | | | 4,318 | |
| | 87 | | | Catamaran Corp. (a) | | | 4,141 | |
| | 47 | | | DaVita HealthCare Partners, Inc. (a) | | | 2,978 | |
| | 6 | | | HCA Holdings, Inc. (a) | | | 277 | |
| | 22 | | | Quest Diagnostics, Inc. | | | 1,194 | |
| | 50 | | | Team Health Holdings, Inc. (a) | | | 2,279 | |
| | 59 | | | Tenet Healthcare Corp. (a) | | | 2,473 | |
| | 15 | | | Universal Health Services, Inc., Class B | | | 1,197 | |
| | | | | | | | |
| | | | | | | 18,857 | |
| | | | | | | | |
| | | | Health Care Technology — 1.0% | |
| | 32 | | | athenahealth, Inc. (a) | | | 4,277 | |
| | | | | | | | |
| | | | Life Sciences Tools & Services — 0.2% | |
| | 20 | | | PerkinElmer, Inc. | | | 822 | |
| | | | | | | | |
| | | | | | | | |
| SHARES | | | SECURITY DESCRIPTION | | VALUE($) | |
| | |
| | |
| | | | Pharmaceuticals — 1.7% | |
| | 46 | | | Bristol-Myers Squibb Co. | | | 2,422 | |
| | 16 | | | Perrigo Co. plc | | | 2,497 | |
| | 78 | | | Zoetis, Inc. | | | 2,533 | |
| | | | | | | | |
| | | | | | | 7,452 | |
| | | | | | | | |
| | | | Total Health Care | | | 48,100 | |
| | | | | | | | |
| | | | Industrials — 17.6% | |
| | | | Aerospace & Defense — 3.1% | |
| | 15 | | | B/E Aerospace, Inc. (a) | | | 1,342 | |
| | 57 | | | DigitalGlobe, Inc. (a) | | | 2,334 | |
| | 62 | | | Hexcel Corp. (a) | | | 2,779 | |
| | 10 | | | Precision Castparts Corp. | | | 2,730 | |
| | 52 | | | Triumph Group, Inc. | | | 3,971 | |
| | | | | | | | |
| | | | | | | 13,156 | |
| | | | | | | | |
| | | | Building Products — 0.8% | |
| | 26 | | | Armstrong World Industries, Inc. (a) | | | 1,497 | |
| | 48 | | | Owens Corning (a) | | | 1,940 | |
| | | | | | | | |
| | | | | | | 3,437 | |
| | | | | | | | |
| | | | Commercial Services & Supplies — 4.6% | |
| | 72 | | | Clean Harbors, Inc. (a) | | | 4,292 | |
| | 125 | | | Copart, Inc. (a) | | | 4,572 | |
| | 47 | | | Covanta Holding Corp. | | | 840 | |
| | 66 | | | Iron Mountain, Inc. | | | 1,992 | |
| | 46 | | | Republic Services, Inc. | | | 1,525 | |
| | 7 | | | Rollins, Inc. | | | 219 | |
| | 15 | | | Stericycle, Inc. (a) | | | 1,734 | |
| | 50 | | | Waste Connections, Inc. | | | 2,166 | |
| | 46 | | | Waste Management, Inc. | | | 2,072 | |
| | | | | | | | |
| | | | | | | 19,412 | |
| | | | | | | | |
| | | | Construction & Engineering — 1.0% | |
| | 136 | | | Quanta Services, Inc. (a) | | | 4,306 | |
| | | | | | | | |
| | | | Electrical Equipment — 0.4% | |
| | 16 | | | Acuity Brands, Inc. | | | 1,706 | |
| | | | | | | | |
| | | | Machinery — 3.2% | |
| | 12 | | | Chart Industries, Inc. (a) | | | 1,185 | |
| | 23 | | | Graco, Inc. | | | 1,769 | |
| | 151 | | | Harsco Corp. | | | 4,229 | |
| | 58 | | | Joy Global, Inc. | | | 3,419 | |
| | 26 | | | PACCAR, Inc. | | | 1,561 | |
| | 27 | | | Woodward, Inc. | | | 1,214 | |
| | | | | | | | |
| | | | | | | 13,377 | |
| | | | | | | | |
| | | | Marine — 0.5% | |
| | 22 | | | Kirby Corp. (a) | | | 2,213 | |
| | | | | | | | |
SEE NOTES TO FINANCIAL STATEMENTS.
| | | | | | |
| | | |
| 40 | | | | J.P. MORGAN MID CAP/MULTI-CAP FUNDS | | DECEMBER 31, 2013 |
| | | | | | | | |
| SHARES | | | SECURITY DESCRIPTION | | VALUE($) | |
| Short Positions — Continued | | | | |
| Common Stocks — Continued | |
| | | | Professional Services — 1.2% | | | | |
| | 27 | | | Advisory Board Co. (The) (a) | | | 1,691 | |
| | 14 | | | IHS, Inc., Class A (a) | | | 1,713 | |
| | 23 | | | Verisk Analytics, Inc., Class A (a) | | | 1,492 | |
| | | | | | | | |
| | | | | | | 4,896 | |
| | | | | | | | |
| | | | Road & Rail — 0.9% | | | | |
| | 26 | | | Genesee & Wyoming, Inc., Class A (a) | | | 2,518 | |
| | 18 | | | Ryder System, Inc. | | | 1,329 | |
| | | | | | | | |
| | | | | | | 3,847 | |
| | | | | | | | |
| | | | Trading Companies & Distributors — 1.9% | | | | |
| | 84 | | | Fastenal Co. | | | 4,000 | |
| | 26 | | | GATX Corp. | | | 1,345 | |
| | 16 | | | MSC Industrial Direct Co., Inc., Class A | | | 1,304 | |
| | 30 | | | Textainer Group Holdings Ltd., (Bermuda) | | | 1,215 | |
| | | | | | | | |
| | | | | | | 7,864 | |
| | | | | | | | |
| | | | Total Industrials | | | 74,214 | |
| | | | | | | | |
| | | | Information Technology — 19.1% | | | | |
| | | | Communications Equipment — 1.6% | | | | |
| | 12 | | | F5 Networks, Inc. (a) | | | 1,131 | |
| | 68 | | | JDS Uniphase Corp. (a) | | | 883 | |
| | 16 | | | NETGEAR, Inc. (a) | | | 523 | |
| | 63 | | | ViaSat, Inc. (a) | | | 3,919 | |
| | | | | | | | |
| | | | | | | 6,456 | |
| | | | | | | | |
| | | | Computers & Peripherals — 2.0% | | | | |
| | 117 | | | NCR Corp. (a) | | | 3,968 | |
| | 33 | | | Stratasys Ltd. (a) | | | 4,508 | |
| | | | | | | | |
| | | | | | | 8,476 | |
| | | | | | | | |
| | | | Electronic Equipment, Instruments & Components — 3.6% | |
| | 30 | | | Arrow Electronics, Inc. (a) | | | 1,601 | |
| | 61 | | | Ingram Micro, Inc., Class A (a) | | | 1,436 | |
| | 46 | | | IPG Photonics Corp. (a) | | | 3,564 | |
| | 126 | | | National Instruments Corp. | | | 4,035 | |
| | 127 | | | Trimble Navigation Ltd. (a) | | | 4,421 | |
| | | | | | | | |
| | | | | | | 15,057 | |
| | | | | | | | |
| | | | Internet Software & Services — 1.9% | | | | |
| | 35 | | | Akamai Technologies, Inc. (a) | | | 1,645 | |
| | 17 | | | eBay, Inc. (a) | | | 933 | |
| | 8 | | | Equinix, Inc. (a) | | | 1,344 | |
| | 108 | | | Rackspace Hosting, Inc. (a) | | | 4,217 | |
| | | | | | | | |
| | | | | | | 8,139 | |
| | | | | | | | |
| | | | IT Services — 2.6% | | | | |
| | 22 | | | Automatic Data Processing, Inc. | | | 1,805 | |
| | 9 | | | FleetCor Technologies, Inc. (a) | | | 1,035 | |
| | | | | | | | |
| SHARES | | | SECURITY DESCRIPTION | | VALUE($) | |
| | | | | |
| | | | | |
| | | | IT Services — Continued | | | | |
| | 34 | | | MAXIMUS, Inc. | | | 1,496 | |
| | 97 | | | Paychex, Inc. | | | 4,425 | |
| | 22 | | | Teradata Corp. (a) | | | 985 | |
| | 48 | | | VeriFone Systems, Inc. (a) | | | 1,283 | |
| | | | | | | | |
| | | | | | | 11,029 | |
| | | | | | | | |
| | | | Semiconductors & Semiconductor Equipment — 2.7% | |
| | 74 | | | Avago Technologies Ltd., (Singapore) | | | 3,935 | |
| | 48 | | | Microchip Technology, Inc. | | | 2,155 | |
| | 42 | | | Silicon Laboratories, Inc. (a) | | | 1,802 | |
| | 276 | | | SunEdison, Inc. (a) | | | 3,601 | |
| | | | | | | | |
| | | | | | | 11,493 | |
| | | | | | | | |
| | | | Software — 4.7% | | | | |
| | 4 | | | Citrix Systems, Inc. (a) | | | 241 | |
| | 1 | | | Compuware Corp. | | | 7 | |
| | 11 | | | FactSet Research Systems, Inc. | | | 1,238 | |
| | 65 | | | Fortinet, Inc. (a) | | | 1,244 | |
| | 21 | | | Guidewire Software, Inc. (a) | | | 1,027 | |
| | 26 | | | NetSuite, Inc. (a) | | | 2,722 | |
| | 37 | | | Red Hat, Inc. (a) | | | 2,086 | |
| | 84 | | | Salesforce.com, Inc. (a) | | | 4,612 | |
| | 27 | | | ServiceNow, Inc. (a) | | | 1,516 | |
| | 9 | | | Tyler Technologies, Inc. (a) | | | 919 | |
| | 28 | | | Ultimate Software Group, Inc. (The) (a) | | | 4,317 | |
| | | | | | | | |
| | | | | | | 19,929 | |
| | | | | | | | |
| | | | Total Information Technology | | | 80,579 | |
| | | | | | | | |
| | | | Materials — 4.3% | | | | |
| | | | Chemicals — 2.8% | | | | |
| | 16 | | | Air Products & Chemicals, Inc. | | | 1,812 | |
| | 8 | | | Airgas, Inc. | | | 847 | |
| | 56 | | | FMC Corp. | | | 4,227 | |
| | 21 | | | Mosaic Co. (The) | | | 982 | |
| | 30 | | | Praxair, Inc. | | | 3,929 | |
| | | | | | | | |
| | | | | | | 11,797 | |
| | | | | | | | |
| | | | Construction Materials — 0.5% | | | | |
| | 30 | | | Eagle Materials, Inc. | | | 2,333 | |
| | | | | | | | |
| | | | Containers & Packaging — 0.4% | | | | |
| | 42 | | | MeadWestvaco Corp. | | | 1,552 | |
| | | | | | | | |
| | | | Metals & Mining — 0.6% | | | | |
| | 5 | | | Allegheny Technologies, Inc. | | | 169 | |
| | 56 | | | Allied Nevada Gold Corp. (a) | | | 199 | |
| | 19 | | | Carpenter Technology Corp. | | | 1,189 | |
| | 37 | | | Newmont Mining Corp. | | | 859 | |
SEE NOTES TO FINANCIAL STATEMENTS.
| | | | | | | | |
| | | |
| DECEMBER 31, 2013 | | J.P. MORGAN MID CAP/MULTI-CAP FUNDS | | | | | 41 | |
JPMorgan Multi-Cap Market Neutral Fund
SCHEDULE OF PORTFOLIO INVESTMENTS
AS OF DECEMBER 31, 2013 (Unaudited) (continued)
(Amounts in thousands, except number of contracts)
| | | | | | | | |
| SHARES | | | SECURITY DESCRIPTION | | VALUE($) | |
| Short Positions — Continued | | | | |
| Common Stocks — Continued | |
| | | | Metals & Mining — Continued | | | | |
| | 3 | | | Nucor Corp. | | | 180 | |
| | | | | | | | |
| | | | | | | 2,596 | |
| | | | | | | | |
| | | | Total Materials | | | 18,278 | |
| | | | | | | | |
| | | | Telecommunication Services — 0.6% | | | | |
| | | | Wireless Telecommunication Services — 0.6% | | | | |
| | 18 | | | Crown Castle International Corp. (a) | | | 1,357 | |
| | 112 | | | Sprint Corp. (a) | | | 1,200 | |
| | | | | | | | |
| | | | Total Telecommunication Services | | | 2,557 | |
| | | | | | | | |
| | | | Utilities — 3.0% | | | | |
| | | | Electric Utilities — 0.7% | | | | |
| | 23 | | | OGE Energy Corp. | | | 786 | |
| | 39 | | | Southern Co. (The) | | | 1,599 | |
| | 27 | | | Xcel Energy, Inc. | | | 763 | |
| | | | | | | | |
| | | | | | | 3,148 | |
| | | | | | | | |
| | | | | | | | |
| SHARES | | | SECURITY DESCRIPTION | | VALUE($) | |
| | | | | |
| | | | | |
| | | | Gas Utilities — 0.9% | | | | |
| | 45 | | | ONEOK, Inc. | | | 2,827 | |
| | 24 | | | Piedmont Natural Gas Co., Inc. | | | 793 | |
| | | | | | | | |
| | | | | | | 3,620 | |
| | | | | | | | |
| | | | Independent Power Producers & Energy Traders — 0.3% | |
| | 40 | | | NRG Energy, Inc. | | | 1,149 | |
| | | | | | | | |
| | | | Multi-Utilities — 1.1% | | | | |
| | 42 | | | Dominion Resources, Inc. | | | 2,701 | |
| | 62 | | | NiSource, Inc. | | | 2,050 | |
| | | | | | | | |
| | | | | | | 4,751 | |
| | | | | | | | |
| | | | Total Utilities | | | 12,668 | |
| | | | | | | | |
| | | | Total Short Positions
(Proceeds $349,840) | | $ | 392,783 | |
| | | | | | | | |
Percentages indicated are based on net assets.
| | | | | | | | | | | | | | | | |
| Futures Contracts | |
NUMBER OF
CONTRACTS | | | DESCRIPTION | | EXPIRATION
DATE | | | NOTIONAL
VALUE AT
12/31/13 | | | NET
UNREALIZED
APPRECIATION
(DEPRECIATION) | |
| | | | Short Futures Outstanding | | | | | | | | | | | | |
| | (13 | ) | | E-mini S&P 500 | | | 03/21/14 | | | $ | (1,197 | ) | | $ | (40 | ) |
| | (18 | ) | | S&P Mid Cap 400 | | | 03/21/14 | | | | (2,411 | ) | | | (77 | ) |
| | | | | | | | | | | | | | | | |
| | | | | | | | | | | | | | $ | (117 | ) |
| | | | | | | | | | | | | | | | |
SEE NOTES TO FINANCIAL STATEMENTS.
| | | | | | |
| | | |
| 42 | | | | J.P. MORGAN MID CAP/MULTI-CAP FUNDS | | DECEMBER 31, 2013 |
JPMorgan Value Advantage Fund
SCHEDULE OF PORTFOLIO INVESTMENTS
AS OF DECEMBER 31, 2013 (Unaudited)
(Amounts in thousands)
| | | | | | | | |
| SHARES | | | SECURITY DESCRIPTION | | VALUE($) | |
| Common Stocks — 93.0% | |
| | | | Consumer Discretionary — 16.3% | | | | |
| | | | Distributors — 0.4% | |
| | 274 | | | Genuine Parts Co. | | | 22,819 | |
| | | | | | | | |
| | | | Hotels, Restaurants & Leisure — 1.6% | |
| | 538 | | | Brinker International, Inc. | | | 24,908 | |
| | 1,014 | | | ClubCorp Holdings, Inc. | | | 17,994 | |
| | 712 | | | Hilton Worldwide Holdings, Inc. (a) | | | 15,835 | |
| | 559 | | | Marriott International, Inc., Class A | | | 27,612 | |
| | | | | | | | |
| | | | | | | 86,349 | |
| | | | | | | | |
| | | | Household Durables — 0.5% | |
| | 1,180 | | | Brookfield Residential Properties, Inc., (Canada) (a) | | | 28,533 | |
| | | | | | | | |
| | | | Internet & Catalog Retail — 1.4% | |
| | 1,053 | | | Expedia, Inc. | | | 73,380 | |
| | | | | | | | |
| | | | Media — 4.2% | |
| | 443 | | | CBS Corp. (Non-Voting), Class B | | | 28,218 | |
| | 866 | | | Clear Channel Outdoor Holdings, Inc., Class A | | | 8,777 | |
| | 645 | | | DIRECTV (a) | | | 44,570 | |
| | 1,270 | | | DISH Network Corp., Class A (a) | | | 73,564 | |
| | 1,200 | | | Entercom Communications Corp., Class A (a) | | | 12,617 | |
| | 1,378 | | | Gannett Co., Inc. | | | 40,747 | |
| | 133 | | | Time Warner Cable, Inc. | | | 17,967 | |
| | | | | | | | |
| | | | | | | 226,460 | |
| | | | | | | | |
| | | | Multiline Retail — 1.5% | |
| | 1,484 | | | Kohl’s Corp. | | | 84,234 | |
| | | | | | | | |
| | | | Specialty Retail — 5.9% | |
| | 176 | | | AutoZone, Inc. (a) | | | 83,936 | |
| | 771 | | | Bed Bath & Beyond, Inc. (a) | | | 61,927 | |
| | 673 | | | Best Buy Co., Inc. | | | 26,843 | |
| | 1,470 | | | Gap, Inc. (The) | | | 57,452 | |
| | 378 | | | Home Depot, Inc. (The) | | | 31,158 | |
| | 821 | | | PetSmart, Inc. | | | 59,760 | |
| | | | | | | | |
| | | | | | | 321,076 | |
| | | | | | | | |
| | | | Textiles, Apparel & Luxury Goods — 0.8% | |
| | 643 | | | Hanesbrands, Inc. | | | 45,155 | |
| | | | | | | | |
| | | | Total Consumer Discretionary | | | 888,006 | |
| | | | | | | | |
| | | | Consumer Staples — 5.6% | |
| | | | Beverages — 1.9% | |
| | 386 | | | Diageo plc, (United Kingdom), ADR | | | 51,167 | |
| | 1,107 | | | Dr. Pepper Snapple Group, Inc. | | | 53,946 | |
| | | | | | | | |
| | | | | | | 105,113 | |
| | | | | | | | |
| | | | | | | | |
| SHARES | | | SECURITY DESCRIPTION | | VALUE($) | |
| | |
| | | | Food & Staples Retailing — 1.8% | | | | |
| | 782 | | | Walgreen Co. | | | 44,941 | |
| | 686 | | | Wal-Mart Stores, Inc. | | | 53,989 | |
| | | | | | | | |
| | | | | | | 98,930 | |
| | | | | | | | |
| | | | Food Products — 0.5% | | | | |
| | 354 | | | TreeHouse Foods, Inc. (a) | | | 24,376 | |
| | | | | | | | |
| | | | Household Products — 1.4% | | | | |
| | 956 | | | Procter & Gamble Co. (The) | | | 77,836 | |
| | | | | | | | |
| | | | Total Consumer Staples | | | 306,255 | |
| | | | | | | | |
| | | | Energy — 9.4% | | | | |
| | | | Oil, Gas & Consumable Fuels — 9.4% | | | | |
| | 1,202 | | | Devon Energy Corp. | | | 74,349 | |
| | 2,358 | | | Exxon Mobil Corp. | | | 238,579 | |
| | 453 | | | NuStar GP Holdings LLC | | | 12,734 | |
| | 1,057 | | | PBF Energy, Inc., Class A | | | 33,267 | |
| | 778 | | | Phillips 66 | | | 59,976 | |
| | 878 | | | QEP Resources, Inc. | | | 26,905 | |
| | 934 | | | Southwestern Energy Co. (a) | | | 36,727 | |
| | 639 | | | Teekay Corp., (Bermuda) | | | 30,659 | |
| | | | | | | | |
| | | | Total Energy | | | 513,196 | |
| | | | | | | | |
| | | | Financials — 30.2% | | | | |
| | | | Capital Markets — 3.2% | | | | |
| | 304 | | | Ameriprise Financial, Inc. | | | 35,021 | |
| | 1,467 | | | Legg Mason, Inc. | | | 63,790 | |
| | 740 | | | Northern Trust Corp. | | | 45,781 | |
| | 393 | | | T. Rowe Price Group, Inc. | | | 32,930 | |
| | | | | | | | |
| | | | | | | 177,522 | |
| | | | | | | | |
| | | | Commercial Banks — 8.9% | | | | |
| | 506 | | | First Republic Bank | | | 26,504 | |
| | 429 | | | M&T Bank Corp. | | | 49,927 | |
| | 1,034 | | | National Bank Holdings Corp., Class A | | | 22,120 | |
| | 624 | | | PNC Financial Services Group, Inc. (The) | | | 48,394 | |
| | 1,366 | | | SunTrust Banks, Inc. | | | 50,279 | |
| | 1,515 | | | U.S. Bancorp | | | 61,222 | |
| | 4,956 | | | Wells Fargo & Co. | | | 224,998 | |
| | | | | | | | |
| | | | | | | 483,444 | |
| | | | | | | | |
| | | | Consumer Finance — 2.1% | | | | |
| | 1,500 | | | Capital One Financial Corp. | | | 114,946 | |
| | | | | | | | |
| | | | Diversified Financial Services — 2.8% | | | | |
| | 5,879 | | | Bank of America Corp. | | | 91,536 | |
| | 1,209 | | | Citigroup, Inc. | | | 62,977 | |
| | | | | | | | |
| | | | | | | 154,513 | |
| | | | | | | | |
SEE NOTES TO FINANCIAL STATEMENTS.
| | | | | | | | |
| | | |
| DECEMBER 31, 2013 | | J.P. MORGAN MID CAP/MULTI-CAP FUNDS | | | | | 43 | |
JPMorgan Value Advantage Fund
SCHEDULE OF PORTFOLIO INVESTMENTS
AS OF DECEMBER 31, 2013 (Unaudited) (continued)
(Amounts in thousands)
| | | | | | | | |
| SHARES | | | SECURITY DESCRIPTION | | VALUE($) | |
| Common Stocks — Continued | |
| | | | Insurance — 9.5% | | | | |
| | 111 | | | Aflac, Inc. | | | 7,435 | |
| | 46 | | | Alleghany Corp. (a) | | | 18,380 | |
| | 132 | | | Allied World Assurance Co. Holdings AG, (Switzerland) | | | 14,835 | |
| | 1,332 | | | American International Group, Inc. | | | 68,014 | |
| | — | (h) | | Berkshire Hathaway, Inc., Class A (a) | | | 19,569 | |
| | 1,508 | | | Hartford Financial Services Group, Inc. | | | 54,649 | |
| | 1,971 | | | Loews Corp. | | | 95,064 | |
| | 882 | | | Marsh & McLennan Cos., Inc. | | | 42,649 | |
| | 1,170 | | | Old Republic International Corp. | | | 20,209 | |
| | 727 | | | Prudential Financial, Inc. | | | 67,062 | |
| | 545 | | | Travelers Cos., Inc. (The) | | | 49,362 | |
| | 1,226 | | | Unum Group | | | 42,994 | |
| | 374 | | | W.R. Berkley Corp. | | | 16,228 | |
| | | | | | | | |
| | | | | | | 516,450 | |
| | | | | | | | |
| | | | Real Estate Investment Trusts (REITs) — 2.8% | |
| | 892 | | | American Homes 4 Rent, Class A | | | 14,450 | |
| | 1,113 | | | American Residential Properties, Inc. (a) | | | 19,105 | |
| | 863 | | | Brixmor Property Group, Inc. (a) | | | 17,543 | |
| | 924 | | | Excel Trust, Inc. | | | 10,524 | |
| | 749 | | | Kimco Realty Corp. | | | 14,789 | |
| | 1,021 | | | Rayonier, Inc. | | | 42,976 | |
| | 1,222 | | | Starwood Property Trust, Inc. | | | 33,838 | |
| | | | | | | | |
| | | | | | | 153,225 | |
| | | | | | | | |
| | | | Real Estate Management & Development — 0.5% | |
| | 739 | | | Brookfield Asset Management, Inc., (Canada), Class A | | | 28,684 | |
| | | | | | | | |
| | | | Thrifts & Mortgage Finance — 0.4% | |
| | 2,339 | | | Hudson City Bancorp, Inc. | | | 22,052 | |
| | | | | | | | |
| | | | Total Financials | | | 1,650,836 | |
| | | | | | | | |
| | | | Health Care — 9.3% | |
| | | | Health Care Providers & Services — 1.7% | |
| | 255 | | | Humana, Inc. | | | 26,311 | |
| | 397 | | | National Healthcare Corp. | | | 21,396 | |
| | 602 | | | UnitedHealth Group, Inc. | | | 45,331 | |
| | | | | | | | |
| | | | | | | 93,038 | |
| | | | | | | | |
| | | | Pharmaceuticals — 7.6% | |
| | 974 | | | Bristol-Myers Squibb Co. | | | 51,772 | |
| | 992 | | | Johnson & Johnson | | | 90,830 | |
| | 1,878 | | | Merck & Co., Inc. | | | 93,994 | |
| | 3,854 | | | Pfizer, Inc. | | | 118,032 | |
| | 515 | | | Valeant Pharmaceuticals International, Inc. (a) | | | 60,473 | |
| | | | | | | | |
| | | | | | | 415,101 | |
| | | | | | | | |
| | | | Total Health Care | | | 508,139 | |
| | | | | | | | |
| | | | | | | | |
| SHARES | | | SECURITY DESCRIPTION | | VALUE($) | |
| | |
| | | | Industrials — 5.7% | |
| | | | Aerospace & Defense — 1.4% | |
| | 660 | | | United Technologies Corp. | | | 75,154 | |
| | | | | | | | |
| | | | Industrial Conglomerates — 1.0% | |
| | 667 | | | Carlisle Cos., Inc. | | | 52,930 | |
| | | | | | | | |
| | | | Machinery — 1.7% | |
| | 675 | | | Dover Corp. | | | 65,194 | |
| | 351 | | | Illinois Tool Works, Inc. | | | 29,478 | |
| | | | | | | | |
| | | | | | | 94,672 | |
| | | | | | | | |
| | | | Professional Services — 1.0% | |
| | 803 | | | Equifax, Inc. | | | 55,472 | |
| | | | | | | | |
| | | | Road & Rail — 0.6% | |
| | 212 | | | Union Pacific Corp. | | | 35,566 | |
| | | | | | | | |
| | | | Total Industrials | | | 313,794 | |
| | | | | | | | |
| | | | Information Technology — 6.1% | |
| | | | Communications Equipment — 2.1% | |
| | 3,308 | | | Cisco Systems, Inc. | | | 74,273 | |
| | 522 | | | QUALCOMM, Inc. | | | 38,792 | |
| | | | | | | | |
| | | | | | | 113,065 | |
| | | | | | | | |
| | | | Computers & Peripherals — 0.9% | |
| | 1,842 | | | Hewlett-Packard Co. | | | 51,539 | |
| | | | | | | | |
| | | | Semiconductors & Semiconductor Equipment — 2.4% | |
| | 889 | | | Analog Devices, Inc. | | | 45,267 | |
| | 560 | | | KLA-Tencor Corp. | | | 36,110 | |
| | 1,124 | | | Texas Instruments, Inc. | | | 49,359 | |
| | | | | | | | |
| | | | | | | 130,736 | |
| | | | | | | | |
| | | | Software — 0.7% | |
| | 1,032 | | | Microsoft Corp. | | | 38,639 | |
| | | | | | | | |
| | | | Total Information Technology | | | 333,979 | |
| | | | | | | | |
| | | | Materials — 3.0% | |
| | | | Chemicals — 0.5% | |
| | 425 | | | Albemarle Corp. | | | 26,966 | |
| | | | | | | | |
| | | | Construction Materials — 0.7% | |
| | 365 | | | Martin Marietta Materials, Inc. | | | 36,474 | |
| | | | | | | | |
| | | | Containers & Packaging — 1.4% | |
| | 775 | | | Ball Corp. | | | 40,021 | |
| | 332 | | | Rock Tenn Co., Class A | | | 34,811 | |
| | | | | | | | |
| | | | | | | 74,832 | |
| | | | | | | | |
| | | | Metals & Mining — 0.4% | |
| | 289 | | | Compass Minerals International, Inc. | | | 23,126 | |
| | | | | | | | |
| | | | Total Materials | | | 161,398 | |
| | | | | | | | |
SEE NOTES TO FINANCIAL STATEMENTS.
| | | | | | |
| | | |
| 44 | | | | J.P. MORGAN MID CAP/MULTI-CAP FUNDS | | DECEMBER 31, 2013 |
| | | | | | | | |
| SHARES | | | SECURITY DESCRIPTION | | VALUE($) | |
| Common Stocks — Continued | | | | |
| | | | Telecommunication Services — 1.0% | | | | |
| | | | Wireless Telecommunication Services — 1.0% | |
| | 1,357 | | | Vodafone Group plc, (United Kingdom), ADR | | | 53,359 | |
| | | | | | | | |
| | | | Utilities — 6.4% | | | | |
| | | | Electric Utilities — 4.5% | | | | |
| | 756 | | | American Electric Power Co., Inc. | | | 35,331 | |
| | 676 | | | Duke Energy Corp. | | | 46,671 | |
| | 845 | | | Edison International | | | 39,116 | |
| | 717 | | | NextEra Energy, Inc. | | | 61,390 | |
| | 438 | | | Northeast Utilities | | | 18,558 | |
| | 1,599 | | | Xcel Energy, Inc. | | | 44,679 | |
| | | | | | | | |
| | | | | | | 245,745 | |
| | | | | | | | |
| | | | Multi-Utilities — 1.9% | | | | |
| | 1,169 | | | CenterPoint Energy, Inc. | | | 27,107 | |
| | 564 | | | NiSource, Inc. | | | 18,544 | |
| | 664 | | | Sempra Energy | | | 59,574 | |
| | | | | | | | |
| | | | | | | 105,225 | |
| | | | | | | | |
| | | | Total Utilities | | | 350,970 | |
| | | | | | | | |
| | | | Total Common Stocks
(Cost $4,088,705) | | | 5,079,932 | |
| | | | | | | | |
| | | | | | | | |
| SHARES | | | SECURITY DESCRIPTION | | VALUE($) | |
| Short-Term Investment — 6.4% | | | | |
| | | | Investment Company — 6.4% | | | | |
| | 347,203 | | | JPMorgan Prime Money Market Fund, Institutional Class Shares, 0.010% (b) (l) (m)
(Cost $347,203) | | | 347,203 | |
| | | | | | | | |
| | | | Total Investments — 99.4%
(Cost $4,435,908) | | | 5,427,135 | |
| | | | Other Assets in Excess of
Liabilities — 0.6% | | | 31,577 | |
| | | | | | | | |
| | | | NET ASSETS — 100.0% | | $ | 5,458,712 | |
| | | | | | | | |
Percentages indicated are based on net assets.
SEE NOTES TO FINANCIAL STATEMENTS.
| | | | | | | | |
| | | |
| DECEMBER 31, 2013 | | J.P. MORGAN MID CAP/MULTI-CAP FUNDS | | | | | 45 | |
J.P. Morgan Mid Cap/Multi-Cap Funds
NOTES TO SCHEDULES OF PORTFOLIO INVESTMENTS
AS OF DECEMBER 31, 2013 (Unaudited)
| | | | | | |
| ADR | | — American Depositary Receipt |
| |
| (a) | | — Non-income producing security. |
| (b) | | — Investment in affiliate. Money market fund registered under the Investment Company Act of 1940, as amended, and advised by J.P. Morgan Investment Management Inc. |
| (g) | | — Amount rounds to less than 0.1%. |
| (h) | | — Amount rounds to less than one thousand (shares or dollars). |
| | | | | | |
| (j) | | — All or a portion of these securities are segregated for short sales. |
| (l) | | — The rate shown is the current yield as of December 31, 2013. |
| (m) | | — All or a portion of this security is reserved and/or pledged with the custodian for current or potential holdings of futures, swaps, options, TBAs, when-issued securities, delayed delivery securities, reverse repurchase agreements, unfunded commitments and/or forward foreign currency exchange contracts. |
SEE NOTES TO FINANCIAL STATEMENTS.
| | | | | | |
| | | |
| 46 | | | | J.P. MORGAN MID CAP/MULTI-CAP FUNDS | | DECEMBER 31, 2013 |
THIS PAGE IS INTENTIONALLY LEFT BLANK
| | | | | | | | |
| | | |
| DECEMBER 31, 2013 | | J.P. MORGAN MID CAP/MULTI-CAP FUNDS | | | | | 47 | |
STATEMENTS OF ASSETS AND LIABILITIES
AS OF DECEMBER 31, 2013 (Unaudited)
(Amounts in thousands, except per share amounts)
| | | | | | | | | | | | | | | | |
| | |
Growth
Advantage Fund | | | Mid Cap
Core Fund | | | Mid Cap
Equity Fund | | | Mid Cap
Growth Fund | |
ASSETS: | | | | | | | | | | | | | | | | |
Investments in non-affiliates, at value | | $ | 2,876,524 | | | $ | 1,006,890 | | | $ | 1,236,991 | | | $ | 1,873,690 | |
Investments in affiliates, at value | | | 81,356 | | | | 22,556 | | | | 66,929 | | | | 42,060 | |
| | | | | | | | | | | | | | | | |
Total investment securities, at value | | | 2,957,880 | | | | 1,029,446 | | | | 1,303,920 | | | | 1,915,750 | |
Receivables: | | | | | | | | | | | | | | | | |
Investment securities sold | | | — | | | | 591 | | | | 540 | | | | — | |
Fund shares sold | | | 7,901 | | | | 325 | | | | 3,359 | | | | 5,313 | |
Dividends from non-affiliates | | | 630 | | | | 735 | | | | 868 | | | | 474 | |
Dividends from affiliates | | | 1 | | | | — | (a) | | | 1 | | | | 1 | |
Other Assets | | | — | | | | 12 | | | | — | | | | — | |
| | | | | | | | | | | | | | | | |
Total Assets | | | 2,966,412 | | | | 1,031,109 | | | | 1,308,688 | | | | 1,921,538 | |
| | | | | | | | | | | | | | | | |
| | | | |
LIABILITIES: | | | | | | | | | | | | | | | | |
Payables: | | | | | | | | | | | | | | | | |
Investment securities purchased | | | 9,787 | | | | 976 | | | | 34,409 | | | | 1,333 | |
Fund shares redeemed | | | 1,412 | | | | 116 | | | | 4,430 | | | | 9,476 | |
Accrued liabilities: | | | | | | | | | | | | | | | | |
Investment advisory fees | | | 1,559 | | | | 559 | | | | 672 | | | | 906 | |
Administration fees | | | 203 | | | | 40 | | | | 6 | | | | — | |
Shareholder servicing fees | | | 365 | | | | 62 | | | | 6 | | | | 322 | |
Distribution fees | | | 158 | | | | 9 | | | | 21 | | | | 169 | |
Custodian and accounting fees | | | 20 | | | | 20 | | | | 15 | | | | 25 | |
Trustees’ and Chief Compliance Officer’s fees | | | 3 | | | | 2 | | | | 1 | | | | 2 | |
Transfer agent fees | | | 15 | | | | 15 | | | | 346 | | | | 998 | |
Other | | | 8 | | | | 9 | | | | 117 | | | | 124 | |
| | | | | | | | | | | | | | | | |
Total Liabilities | | | 13,530 | | | | 1,808 | | | | 40,023 | | | | 13,355 | |
| | | | | | | | | | | | | | | | |
Net Assets | | $ | 2,952,882 | | | $ | 1,029,301 | | | $ | 1,268,665 | | | $ | 1,908,183 | |
| | | | | | | | | | | | | | | | |
| (a) | Amount rounds to less than $1,000. |
SEE NOTES TO FINANCIAL STATEMENTS.
| | | | | | |
| | | |
| 48 | | | | J.P. MORGAN MID CAP/MULTI-CAP FUNDS | | DECEMBER 31, 2013 |
| | | | | | | | | | | | | | | | |
| | |
Growth
Advantage Fund | | | Mid Cap
Core Fund | | | Mid Cap
Equity Fund | | | Mid Cap
Growth Fund | |
NET ASSETS: | | | | | | | | | | | | | | | | |
Paid-in-Capital | | $ | 2,026,222 | | | $ | 831,023 | | | $ | 863,197 | | | $ | 1,268,947 | |
Accumulated undistributed (distributions in excess of) net investment income | | | (2,590 | ) | | | 336 | | | | (92 | ) | | | (3,849 | ) |
Accumulated net realized gains (losses) | | | 44,092 | | | | 10,938 | | | | 12,872 | | | | 50,049 | |
Net unrealized appreciation (depreciation) | | | 885,158 | | | | 187,004 | | | | 392,688 | | | | 593,036 | |
| | | | | | | | | | | | | | | | |
Total Net Assets | | $ | 2,952,882 | | | $ | 1,029,301 | | | $ | 1,268,665 | | | $ | 1,908,183 | |
| | | | | | | | | | | | | | | | |
| | | | |
Net Assets: | | | | | | | | | | | | | | | | |
Class A | | $ | 511,230 | | | $ | 40,331 | | | $ | 60,527 | | | $ | 698,868 | |
Class B | | | 2,532 | | | | — | | | | — | | | | 6,948 | |
Class C | | | 92,171 | | | | 1,525 | | | | 15,258 | | | | 29,739 | |
Class R2 | | | — | | | | 441 | | | | — | | | | 631 | |
Class R5 | | | 1,250,877 | | | | 84 | | | | — | | | | 25,345 | |
Class R6 | | | 50 | | | | 581,842 | | | | — | | | | 59,986 | |
Select Class | | | 1,096,022 | | | | 405,078 | | | | 1,192,880 | | | | 1,086,666 | |
| | | | | | | | | | | | | | | | |
Total | | $ | 2,952,882 | | | $ | 1,029,301 | | | $ | 1,268,665 | | | $ | 1,908,183 | |
| | | | | | | | | | | | | | | | |
| | | | |
Outstanding units of beneficial interest (shares) ($0.0001 par value; unlimited number of shares authorized): | | | | | | | | | | | | | | | | |
Class A | | | 37,552 | | | | 1,873 | | | | 1,457 | | | | 27,588 | |
Class B | | | 204 | | | | — | | | | — | | | | 388 | |
Class C | | | 7,410 | | | | 71 | | | | 372 | | | | 1,379 | |
Class R2 | | | — | | | | 21 | | | | — | | | | 23 | |
Class R5 | | | 89,604 | | | | 4 | | | | — | | | | 903 | |
Class R6 | | | 3 | | | | 26,838 | | | | — | | | | 2,135 | |
Select Class | | | 79,153 | | | | 18,723 | | | | 28,593 | | | | 38,872 | |
| | | | |
Net Asset Value (a): | | | | | | | | | | | | | | | | |
Class A — Redemption price per share | | $ | 13.61 | | | $ | 21.53 | | | $ | 41.54 | | | $ | 25.33 | |
Class B — Offering price per share (b) | | | 12.43 | | | | — | | | | — | | | | 17.92 | |
Class C — Offering price per share (b) | | | 12.44 | | | | 21.34 | | | | 40.99 | | | | 21.57 | |
Class R2 — Offering and redemption price per share | | | — | | | | 21.44 | | | | — | | | | 27.24 | |
Class R5 — Offering and redemption price per share | | | 13.96 | | | | 21.69 | | | | — | | | | 28.06 | |
Class R6 — Offering and redemption price per share | | | 13.96 | | | | 21.68 | | | | — | | | | 28.09 | |
Select Class — Offering and redemption price per share | | | 13.85 | | | | 21.64 | | | | 41.72 | | | | 27.96 | |
Class A maximum sales charge | | | 5.25 | % | | | 5.25 | % | | | 5.25 | % | | | 5.25 | % |
Class A maximum public offering price per share
[net asset value per share/(100% — maximum sales charge)] | | $ | 14.36 | | | $ | 22.72 | | | $ | 43.84 | | | $ | 26.73 | |
| | | | | | | | | | | | | | | | |
| | | | |
Cost of investments in non-affiliates | | $ | 1,991,366 | | | $ | 819,886 | | | $ | 844,303 | | | $ | 1,280,654 | |
Cost of investments in affiliates | | | 81,356 | | | | 22,556 | | | | 66,929 | | | | 42,060 | |
| (a) | Per share amounts may not recalculate due to rounding of net assets and/or shares outstanding. |
| (b) | Redemption price for Class B and Class C Shares varies based upon length of time the shares are held. |
SEE NOTES TO FINANCIAL STATEMENTS.
| | | | | | | | |
| | | |
| DECEMBER 31, 2013 | | J.P. MORGAN MID CAP/MULTI-CAP FUNDS | | | | | 49 | |
STATEMENTS OF ASSETS AND LIABILITIES
AS OF DECEMBER 31, 2013 (Unaudited) (continued)
(Amounts in thousands, except per share amounts)
| | | | | | | | | | | | |
| | | Mid Cap
Value Fund | | |
Multi-Cap
Market
Neutral Fund | | | Value
Advantage Fund | |
ASSETS: | | | | | | | | | | | | |
Investments in non-affiliates, at value | | $ | 14,496,411 | | | $ | 396,611 | | | $ | 5,079,932 | |
Investments in affiliates, at value | | | 338,467 | | | | 27,757 | | | | 347,203 | |
| | | | | | | | | | | | |
Total investment securities, at value | | | 14,834,878 | | | | 424,368 | | | | 5,427,135 | |
Cash | | | — | | | | 211 | | | | — | |
Deposits at broker for securities sold short | | | — | | | | 389,953 | | | | — | |
Deposits at broker for futures contracts | | | — | | | | 370 | | | | — | |
Receivables: | | | | | | | | | | | | |
Investment securities sold | | | 17,423 | | | | 800 | | | | 43,759 | |
Fund shares sold | | | 17,230 | | | | 3 | | | | 17,418 | |
Dividends from non-affiliates | | | 17,091 | | | | 423 | | | | 7,129 | |
Dividends from affiliates | | | 6 | | | | 1 | | | | 6 | |
| | | | | | | | | | | | |
Total Assets | | | 14,886,628 | | | | 816,129 | | | | 5,495,447 | |
| | | | | | | | | | | | |
| | | |
LIABILITIES: | | | | | | | | | | | | |
Payables: | | | | | | | | | | | | |
Securities sold short, at value | | | — | | | | 392,783 | | | | — | |
Dividend expense to non-affiliates on securities sold short | | | — | | | | 467 | | | | — | |
Investment securities purchased | | | 17,282 | | | | 23 | | | | 30,822 | |
Interest expense to non-affiliates on securities sold short | | | — | | | | 77 | | | | — | |
Fund shares redeemed | | | 31,136 | | | | 120 | | | | 1,753 | |
Variation margin on futures contracts | | | — | | | | 10 | | | | — | |
Accrued liabilities: | | | | | | | | | | | | |
Investment advisory fees | | | 7,537 | | | | 412 | | | | 2,821 | |
Shareholder servicing fees | | | 1,371 | | | | — | | | | 665 | |
Distribution fees | | | 1,102 | | | | 9 | | | | 429 | |
Custodian and accounting fees | | | 122 | | | | 24 | | | | 41 | |
Trustees’ and Chief Compliance Officer’s fees | | | 18 | | | | 1 | | | | 8 | |
Other | | | 2,307 | | | | 84 | | | | 196 | |
| | | | | | | | | | | | |
Total Liabilities | | | 60,875 | | | | 394,010 | | | | 36,735 | |
| | | | | | | | | | | | |
Net Assets | | $ | 14,825,753 | | | $ | 422,119 | | | $ | 5,458,712 | |
| | | | | | | | | | | | |
SEE NOTES TO FINANCIAL STATEMENTS.
| | | | | | |
| | | |
| 50 | | | | J.P. MORGAN MID CAP/MULTI-CAP FUNDS | | DECEMBER 31, 2013 |
| | | | | | | | | | | | |
| | | Mid Cap
Value Fund | | |
Multi-Cap
Market
Neutral Fund | | | Value
Advantage Fund | |
NET ASSETS: | | | | | | | | | | | | |
Paid-in-Capital | | $ | 9,929,544 | | | $ | 451,127 | | | $ | 4,430,257 | |
Accumulated undistributed (distributions in excess of) net investment income | | | 2,640 | | | | (4,473 | ) | | | (881 | ) |
Accumulated net realized gains (losses) | | | 44,787 | | | | (61,401 | ) | | | 38,109 | |
Net unrealized appreciation (depreciation) | | | 4,848,782 | | | | 36,866 | | | | 991,227 | |
| | | | | | | | | | | | |
Total Net Assets | | $ | 14,825,753 | | | $ | 422,119 | | | $ | 5,458,712 | |
| | | | | | | | | | | | |
| | | |
Net Assets: | | | | | | | | | | | | |
Class A | | $ | 3,333,576 | | | $ | 13,110 | | | $ | 1,212,340 | |
Class B | | | 12,570 | | | | 252 | | | | — | |
Class C | | | 589,548 | | | | 9,738 | | | | 293,855 | |
Class R2 | | | 67,511 | | | | — | | | | — | |
Institutional Class | | | 8,027,191 | | | | — | | | | 2,166,564 | |
Select Class | | | 2,795,357 | | | | 399,019 | | | | 1,785,953 | |
| | | | | | | | | | | | |
Total | | $ | 14,825,753 | | | $ | 422,119 | | | $ | 5,458,712 | |
| | | | | | | | | | | | |
| | | |
Outstanding units of beneficial interest (shares) | | | | | | | | | | | | |
($0.0001 par value; unlimited number of shares authorized): | | | | | | | | | | | | |
Class A | | | 96,564 | | | | 1,320 | | | | 44,795 | |
Class B | | | 371 | | | | 27 | | | | — | |
Class C | | | 17,534 | | | | 1,031 | | | | 10,855 | |
Class R2 | | | 2,013 | | | | — | | | | — | |
Institutional Class | | | 228,592 | | | | — | | | | 79,790 | |
Select Class | | | 80,312 | | | | 39,510 | | | | 65,799 | |
| | | |
Net Asset Value (a): | | | | | | | | | | | | |
Class A — Redemption price per share | | $ | 34.52 | | | $ | 9.93 | | | $ | 27.06 | |
Class B — Offering price per share (b) | | | 33.87 | | | | 9.43 | | | | — | |
Class C — Offering price per share (b) | | | 33.62 | | | | 9.44 | | | | 27.07 | |
Class R2 — Offering and redemption price per share | | | 33.53 | | | | — | | | | — | |
Institutional Class — Offering and redemption price per share | | | 35.12 | | | | — | | | | 27.15 | |
Select Class — Offering and redemption price per share | | | 34.81 | | | | 10.10 | | | | 27.14 | |
Class A maximum sales charge | | | 5.25 | % | | | 5.25 | % | | | 5.25 | % |
Class A maximum public offering price per share
[net asset value per share/(100% — maximum sales charge)] | | $ | 36.43 | | | $ | 10.48 | | | $ | 28.56 | |
| | | | | | | | | | | | |
| | | |
Cost of investments in non-affiliates | | $ | 9,647,629 | | | $ | 316,685 | | | $ | 4,088,705 | |
Cost of investments in affiliates | | | 338,467 | | | | 27,757 | | | | 347,203 | |
Proceeds from securities sold short | | | — | | | | 349,840 | | | | — | |
| (a) | Per share amounts may not recalculate due to rounding of net assets and/or shares outstanding. |
| (b) | Redemption price for Class B and Class C Shares varies based upon length of time the shares are held. |
SEE NOTES TO FINANCIAL STATEMENTS.
| | | | | | | | |
| | | |
| DECEMBER 31, 2013 | | J.P. MORGAN MID CAP/MULTI-CAP FUNDS | | | | | 51 | |
STATEMENTS OF OPERATIONS
FOR THE SIX MONTHS ENDED DECEMBER 31, 2013 (Unaudited)
(Amounts in thousands)
| | | | | | | | | | | | | | | | |
| | |
Growth
Advantage Fund | | | Mid Cap
Core Fund | | | Mid Cap
Equity Fund | | | Mid Cap
Growth Fund | |
INVESTMENT INCOME: | | | | | | | | | | | | | | | | |
Dividend income from non-affiliates | | $ | 10,248 | | | $ | 6,256 | | | $ | 7,256 | | | $ | 7,261 | |
Dividend income from affiliates | | | 8 | | | | 10 | | | | 9 | | | | 8 | |
| | | | | | | | | | | | | | | | |
Total investment income | | | 10,256 | | | | 6,266 | | | | 7,265 | | | | 7,269 | |
| | | | | | | | | | | | | | | | |
| | | | |
EXPENSES: | | | | | | | | | | | | | | | | |
Investment advisory fees | | | 8,066 | | | | 3,165 | | | | 3,703 | | | | 5,772 | |
Administration fees | | | 1,044 | | | | 410 | | | | 479 | | | | 747 | |
Distribution fees: | | | | | | | | | | | | | | | | |
Class A | | | 478 | | | | 43 | | | | 49 | | | | 816 | |
Class B | | | 8 | | | | — | | | | — | | | | 27 | |
Class C | | | 242 | | | | 3 | | | | 39 | | | | 101 | |
Class R2 | | | — | | | | 1 | | | | — | | | | 1 | |
Shareholder servicing fees: | | | | | | | | | | | | | | | | |
Class A | | | 478 | | | | 43 | | | | 49 | | | | 816 | |
Class B | | | 3 | | | | — | | | | — | | | | 9 | |
Class C | | | 80 | | | | 1 | | | | 13 | | | | 34 | |
Class R2 | | | — | | | | — | (a) | | | — | | | | — | (a) |
Class R5 | | | 260 | | | | — | (a) | | | — | | | | 6 | |
Select Class | | | 1,240 | | | | 553 | | | | 1,362 | | | | 1,265 | |
Custodian and accounting fees | | | 37 | | | | 29 | | | | 24 | | | | 37 | |
Interest expense to affiliates | | | — | | | | — | (a) | | | — | (a) | | | — | |
Professional fees | | | 26 | | | | 27 | | | | 27 | | | | 30 | |
Trustees’ and Chief Compliance Officer’s fees | | | 14 | | | | 5 | | | | 6 | | | | 10 | |
Printing and mailing costs | | | 47 | | | | 19 | | | | 111 | | | | 110 | |
Registration and filing fees | | | 138 | | | | 51 | | | | 75 | | | | 55 | |
Transfer agent fees | | | 473 | | | | 63 | | | | 1,111 | | | | 1,284 | |
Other | | | 50 | | | | 10 | | | | 9 | | | | 18 | |
| | | | | | | | | | | | | | | | |
Total expenses | | | 12,684 | | | | 4,423 | | | | 7,057 | | | | 11,138 | |
| | | | | | | | | | | | | | | | |
Less amounts waived | | | (191 | ) | | | (371 | ) | | | (1,852 | ) | | | (1,842 | ) |
| | | | | | | | | | | | | | | | |
Net expenses | | | 12,493 | | | | 4,052 | | | | 5,205 | | | | 9,296 | |
| | | | | | | | | | | | | | | | |
Net investment income (loss) | | | (2,237 | ) | | | 2,214 | | | | 2,060 | | | | (2,027 | ) |
| | | | | | | | | | | | | | | | |
| | | | |
REALIZED/UNREALIZED GAINS (LOSSES): | | | | | | | | | | | | | | | | |
Net realized gain (loss) on transactions from investments in non-affiliates | | | 137,896 | | | | 32,445 | | | | 63,620 | | | | 183,600 | |
Distributions of realized gains by investment company affiliates | | | 1 | | | | — | | | | 1 | | | | — | |
Change in net unrealized appreciation/depreciation of investments in non-affiliates | | | 407,828 | | | | 128,965 | | | | 124,615 | | | | 181,132 | |
| | | | | | | | | | | | | | | | |
Net realized/unrealized gains (losses) | | | 545,725 | | | | 161,410 | | | | 188,236 | | | | 364,732 | |
| | | | | | | | | | | | | | | | |
Change in net assets resulting from operations | | $ | 543,488 | | | $ | 163,624 | | | $ | 190,296 | | | $ | 362,705 | |
| | | | | | | | | | | | | | | | |
| (a) | Amount rounds to less than $1,000. |
SEE NOTES TO FINANCIAL STATEMENTS.
| | | | | | |
| | | |
| 52 | | | | J.P. MORGAN MID CAP/MULTI-CAP FUNDS | | DECEMBER 31, 2013 |
| | | | | | | | | | | | |
| | |
Mid Cap
Value Fund | | | Multi-Cap Market
Neutral Fund | | | Value
Advantage Fund | |
INVESTMENT INCOME: | | | | | | | | | | | | |
Dividend income from non-affiliates | | $ | 123,425 | | | $ | 2,771 | | | $ | 47,350 | |
Dividend income from affiliates | | | 170 | | | | 8 | | | | 38 | |
| | | | | | | | | | | | |
Total investment income | | | 123,595 | | | | 2,779 | | | | 47,388 | |
| | | | | | | | | | | | |
| | | |
EXPENSES: | | | | | | | | | | | | |
Investment advisory fees | | | 46,289 | | | | 2,347 | | | | 14,738 | |
Administration fees | | | 5,994 | | | | 158 | | | | 1,907 | |
Distribution fees: | | | | | | | | | | | | |
Class A | | | 4,104 | | | | 17 | | | | 1,257 | |
Class B | | | 51 | | | | 1 | | | | — | |
Class C | | | 2,131 | | | | 39 | | | | 955 | |
Class R2 | | | 157 | | | | — | | | | — | |
Shareholder servicing fees: | | | | | | | | | | | | |
Class A | | | 4,104 | | | | 17 | | | | 1,257 | |
Class B | | | 17 | | | | — | (a) | | | — | |
Class C | | | 710 | | | | 13 | | | | 318 | |
Class R2 | | | 79 | | | | — | | | | — | |
Institutional Class | | | 3,679 | | | | — | | | | 901 | |
Select Class | | | 3,696 | | | | 439 | | | | 1,841 | |
Custodian and accounting fees | | | 214 | | | | 42 | | | | 71 | |
Professional fees | | | 66 | | | | 35 | | | | 35 | |
Trustees’ and Chief Compliance Officer’s fees | | | 80 | | | | 2 | | | | 25 | |
Printing and mailing costs | | | 604 | | | | 3 | | | | 126 | |
Registration and filing fees | | | 262 | | | | 25 | | | | 131 | |
Transfer agent fees | | | 7,802 | | | | 53 | | | | 1,713 | |
Other | | | 131 | | | | 11 | | | | 21 | |
Dividend expense to non-affiliates on securities sold short | | | — | | | | 2,066 | | | | — | |
Interest expense to non-affiliates on securities sold short | | | — | | | | 333 | | | | — | |
| | | | | | | | | | | | |
Total expenses | | | 80,170 | | | | 5,601 | | | | 25,296 | |
| | | | | | | | | | | | |
Less amounts waived | | | (12,528 | ) | | | (832 | ) | | | (2,956 | ) |
| | | | | | | | | | | | |
Net expenses | | | 67,642 | | | | 4,769 | | | | 22,340 | |
| | | | | | | | | | | | |
Net investment income (loss) | | | 55,953 | | | | (1,990 | ) | | | 25,048 | |
| | | | | | | | | | | | |
| | | |
REALIZED/UNREALIZED GAINS (LOSSES): | | | | | | | | | | | | |
Net realized gain (loss) on transactions from: | | | | | | | | | | | | |
Investments in non-affiliates | | | 413,993 | | | | 42,234 | | | | 152,985 | |
Futures | | | — | | | | (970 | ) | | | — | |
Securities sold short | | | — | | | | (31,780 | ) | | | — | |
| | | | | | | | | | | | |
Net realized gain (loss) | | | 413,993 | | | | 9,484 | | | | 152,985 | |
| | | | | | | | | | | | |
Distributions of realized gains by investment company affiliates | | | 6 | | | | — | | | | 5 | |
Change in net unrealized appreciation/depreciation of: | | | | | | | | | | | | |
Investments in non-affiliates | | | 1,421,768 | | | | 19,890 | | | | 409,220 | |
Futures | | | — | | | | (124 | ) | | | — | |
Securities sold short | | | — | | | | (21,407 | ) | | | — | |
| | | | | | | | | | | | |
Change in net unrealized appreciation/depreciation | | | 1,421,768 | | | | (1,641 | ) | | | 409,220 | |
| | | | | | | | | | | | |
Net realized/unrealized gains (losses) | | | 1,835,767 | | | | 7,843 | | | | 562,210 | |
| | | | | | | | | | | | |
Change in net assets resulting from operations | | $ | 1,891,720 | | | $ | 5,853 | | | $ | 587,258 | |
| | | | | | | | | | | | |
| (a) | Amount rounds to less than $1,000. |
SEE NOTES TO FINANCIAL STATEMENTS.
| | | | | | | | |
| | | |
| DECEMBER 31, 2013 | | J.P. MORGAN MID CAP/MULTI-CAP FUNDS | | | | | 53 | |
STATEMENTS OF CHANGES IN NET ASSETS
FOR THE PERIODS INDICATED
(Amounts in thousands)
| | | | | | | | | | | | | | | | |
| | | Growth Advantage Fund | | | Mid Cap Core Fund | |
| | | Six Months Ended
12/31/2013
(Unaudited) | | | Year Ended
6/30/2013 | | | Six Months Ended
12/31/2013
(Unaudited) | | | Year Ended
6/30/2013 | |
CHANGE IN NET ASSETS RESULTING FROM OPERATIONS: | | | | | | | | | | | | | | | | |
Net investment income (loss) | | $ | (2,237 | ) | | $ | 6,260 | | | $ | 2,214 | | | $ | 8,236 | |
Net realized gain (loss) | | | 137,896 | | | | 56,467 | | | | 32,445 | | | | 107,445 | |
Distributions of capital gains received from investment company affiliates | | | 1 | | | | — | | | | — | | | | — | |
Change in net unrealized appreciation/depreciation | | | 407,828 | | | | 252,716 | | | | 128,965 | | | | 43,825 | |
| | | | | | | | | | | | | | | | |
Change in net assets resulting from operations | | | 543,488 | | | | 315,443 | | | | 163,624 | | | | 159,506 | |
| | | | | | | | | | | | | | | | |
| | | | |
DISTRIBUTIONS TO SHAREHOLDERS: | | | | | | | | | | | | | | | | |
Class A | | | | | | | | | | | | | | | | |
From net investment income | | | — | | | | (188 | ) | | | (24 | ) | | | (194 | ) |
From net realized gains | | | (21,773 | ) | | | (670 | ) | | | (4,446 | ) | | | (241 | ) |
Class B | | | | | | | | | | | | | | | | |
From net realized gains | | | (123 | ) | | | (8 | ) | | | — | | | | — | |
Class C | | | | | | | | | | | | | | | | |
From net investment income | | | — | | | | — | | | | (1 | ) | | | — | (a) |
From net realized gains | | | (4,242 | ) | | | (106 | ) | | | (156 | ) | | | (2 | ) |
Class R2 | | | | | | | | | | | | | | | | |
From net investment income | | | — | | | | — | | | | — | (a) | | | (1 | ) |
From net realized gains | | | — | | | | — | | | | (49 | ) | | | (1 | ) |
Class R5 | | | | | | | | | | | | | | | | |
From net investment income | | | — | | | | (2,904 | ) | | | — | (a) | | | (1 | ) |
From net realized gains | | | (54,106 | ) | | | (1,960 | ) | | | (9 | ) | | | (1 | ) |
Class R6 | | | | | | | | | | | | | | | | |
From net investment income | | | — | | | | — | | | | (2,504 | ) | | | (3,133 | ) |
From net realized gains | | | — | | | | — | | | | (64,087 | ) | | | (3,322 | ) |
Select Class | | | | | | | | | | | | | | | | |
From net investment income | | | — | | | | (1,645 | ) | | | (1,001 | ) | | | (4,129 | ) |
From net realized gains | | | (49,152 | ) | | | (2,119 | ) | | | (50,490 | ) | | | (5,178 | ) |
| | | | | | | | | | | | | | | | |
Total distributions to shareholders | | | (129,396 | ) | | | (9,600 | ) | | | (122,767 | ) | | | (16,203 | ) |
| | | | | | | | | | | | | | | | |
| | | | |
CAPITAL TRANSACTIONS: | | | | | | | | | | | | | | | | |
Change in net assets resulting from capital transactions | | | 539,368 | | | | 338,022 | | | | 125,024 | | | | 370,595 | |
| | | | | | | | | | | | | | | | |
| | | | |
NET ASSETS: | | | | | | | | | | | | | | | | |
Change in net assets | | | 953,460 | | | | 643,865 | | | | 165,881 | | | | 513,898 | |
Beginning of period | | | 1,999,422 | | | | 1,355,557 | | | | 863,420 | | | | 349,522 | |
| | | | | | | | | | | | | | | | |
End of period | | $ | 2,952,882 | | | $ | 1,999,422 | | | $ | 1,029,301 | | | $ | 863,420 | |
| | | | | | | | | | | | | | | | |
Accumulated undistributed (distributions in excess of) net investment income | | $ | (2,590 | ) | | $ | (353 | ) | | $ | 336 | | | $ | 1,652 | |
| | | | | | | | | | | | | | | | |
| (a) | Amount rounds to less than $1,000. |
SEE NOTES TO FINANCIAL STATEMENTS.
| | | | | | |
| | | |
| 54 | | | | J.P. MORGAN MID CAP/MULTI-CAP FUNDS | | DECEMBER 31, 2013 |
| | | | | | | | | | | | | | | | |
| | | Mid Cap Equity Fund | | | Mid Cap Growth Fund | |
| | | Six Months Ended
12/31/2013
(Unaudited) | | | Year Ended
6/30/2013 | | | Six Months Ended
12/31/2013
(Unaudited) | | | Year Ended
6/30/2013 | |
CHANGE IN NET ASSETS RESULTING FROM OPERATIONS: | | | | | | | | | | | | | | | | |
Net investment income (loss) | | $ | 2,060 | | | $ | 5,474 | | | $ | (2,027 | ) | | $ | 155 | |
Net realized gain (loss) | | | 63,620 | | | | 64,936 | | | | 183,600 | | | | 146,094 | |
Distributions of capital gains received from investment company affiliates | | | 1 | | | | — | | | | — | | | | — | |
Change in net unrealized appreciation/depreciation | | | 124,615 | | | | 143,890 | | | | 181,132 | | | | 169,741 | |
| | | | | | | | | | | | | | | | |
Change in net assets resulting from operations | | | 190,296 | | | | 214,300 | | | | 362,705 | | | | 315,990 | |
| | | | | | | | | | | | | | | | |
| | | | |
DISTRIBUTIONS TO SHAREHOLDERS: | | | | | | | | | | | | | | | | |
Class A | | | | | | | | | | | | | | | | |
From net investment income | | | (29 | ) | | | (31 | ) | | | — | | | | — | |
From net realized gains | | | (4,217 | ) | | | (75 | ) | | | (69,231 | ) | | | (25,563 | ) |
Class B | | | | | | | | | | | | | | | | |
From net realized gains | | | — | | | | — | | | | (943 | ) | | | (531 | ) |
Class C | | | | | | | | | | | | | | | | |
From net investment income | | | — | | | | (1 | ) | | | — | | | | — | |
From net realized gains | | | (1,100 | ) | | | (15 | ) | | | (3,392 | ) | | | (1,148 | ) |
Class R2 | | | | | | | | | | | | | | | | |
From net realized gains | | | — | | | | — | | | | (58 | ) | | | (11 | ) |
Class R5 | | | | | | | | | | | | | | | | |
From net realized gains | | | — | | | | — | | | | (2,276 | ) | | | (664 | ) |
Class R6 | | | | | | | | | | | | | | | | |
From net realized gains | | | — | | | | — | | | | (5,408 | ) | | | (826 | ) |
Select Class | | | | | | | | | | | | | | | | |
From net investment income | | | (1,909 | ) | | | (4,620 | ) | | | — | | | | — | |
From net realized gains | | | (90,616 | ) | | | (6,960 | ) | | | (99,863 | ) | | | (36,115 | ) |
| | | | | | | | | | | | | | | | |
Total distributions to shareholders | | | (97,871 | ) | | | (11,702 | ) | | | (181,171 | ) | | | (64,858 | ) |
| | | | | | | | | | | | | | | | |
| | | | |
CAPITAL TRANSACTIONS: | | | | | | | | | | | | | | | | |
Change in net assets resulting from capital transactions | | | 216,013 | | | | (63,705 | ) | | | 148,852 | | | | (100,151 | ) |
| | | | | | | | | | | | | | | | |
| | | | |
NET ASSETS: | | | | | | | | | | | | | | | | |
Change in net assets | | | 308,438 | | | | 138,893 | | | | 330,386 | | | | 150,981 | |
Beginning of period | | | 960,227 | | | | 821,334 | | | | 1,577,797 | | | | 1,426,816 | |
| | | | | | | | | | | | | | | | |
End of period | | $ | 1,268,665 | | | $ | 960,227 | | | $ | 1,908,183 | | | $ | 1,577,797 | |
| | | | | | | | | | | | | | | | |
Accumulated undistributed (distributions in excess of) net investment income | | $ | (92 | ) | | $ | (214 | ) | | $ | (3,849 | ) | | $ | (1,822 | ) |
| | | | | | | | | | | | | | | | |
SEE NOTES TO FINANCIAL STATEMENTS.
| | | | | | | | |
| | | |
| DECEMBER 31, 2013 | | J.P. MORGAN MID CAP/MULTI-CAP FUNDS | | | | | 55 | |
STATEMENTS OF CHANGES IN NET ASSETS
FOR THE PERIODS INDICATED (continued)
(Amounts in thousands)
| | | | | | | | | | | | | | | | |
| | | Mid Cap Value Fund | | | Multi-Cap Market Neutral Fund | |
| | | Six Months Ended
12/31/2013
(Unaudited) | | | Year Ended
6/30/2013 | | | Six Months Ended
12/31/2013
(Unaudited) | | | Year Ended
6/30/2013 | |
CHANGE IN NET ASSETS RESULTING FROM OPERATIONS: | | | | | | | | | | | | | | | | |
Net investment income (loss) | | $ | 55,953 | | | $ | 98,124 | | | $ | (1,990 | ) | | $ | (4,302 | ) |
Net realized gain (loss) | | | 413,993 | | | | 465,647 | | | | 9,484 | | | | 21,526 | |
Distributions of capital gains received from investment company affiliates | | | 6 | | | | — | | | | — | | | | — | |
Change in net unrealized appreciation/depreciation | | | 1,421,768 | | | | 1,779,184 | | | | (1,641 | ) | | | (12,985 | ) |
| | | | | | | | | | | | | | | | |
Change in net assets resulting from operations | | | 1,891,720 | | | | 2,342,955 | | | | 5,853 | | | | 4,239 | |
| | | | | | | | | | | | | | | | |
| | | | |
DISTRIBUTIONS TO SHAREHOLDERS: | | | | | | | | | | | | | | | | |
Class A | | | | | | | | | | | | | | | | |
From net investment income | | | (14,338 | ) | | | (25,622 | ) | | | — | | | | — | |
From net realized gains | | | (135,361 | ) | | | (19,155 | ) | | | — | | | | — | |
Class B | | | | | | | | | | | | | | | | |
From net realized gains | | | (524 | ) | | | (292 | ) | | | — | | | | — | |
Class C | | | | | | | | | | | | | | | | |
From net investment income | | | (38 | ) | | | (2,608 | ) | | | — | | | | — | |
From net realized gains | | | (24,588 | ) | | | (3,426 | ) | | | — | | | | — | |
Class R2 | | | | | | | | | | | | | | | | |
From net investment income | | | (201 | ) | | | (363 | ) | | | — | | | | — | |
From net realized gains | | | (2,784 | ) | | | (258 | ) | | | — | | | | — | |
Institutional Class | | | | | | | | | | | | | | | | |
From net investment income | | | (69,637 | ) | | | (64,280 | ) | | | — | | | | — | |
From net realized gains | | | (318,626 | ) | | | (34,137 | ) | | | — | | | | — | |
Select Class | | | | | | | | | | | | | | | | |
From net investment income | | | (17,743 | ) | | | (27,916 | ) | | | — | | | | — | |
From net realized gains | | | (112,976 | ) | | | (17,242 | ) | | | — | | | | — | |
| | | | | | | | | | | | | | | | |
Total distributions to shareholders | | | (696,816 | ) | | | (195,299 | ) | | | — | | | | — | |
| | | | | | | | | | | | | | | | |
| | | | |
CAPITAL TRANSACTIONS: | | | | | | | | | | | | | | | | |
Change in net assets resulting from capital transactions | | | 367,867 | | | | 3,305,779 | | | | 72,480 | | | | (174,093 | ) |
| | | | | | | | | | | | | | | | |
| | | | |
NET ASSETS: | | | | | | | | | | | | | | | | |
Change in net assets | | | 1,562,771 | | | | 5,453,435 | | | | 78,333 | | | | (169,854 | ) |
Beginning of period | | | 13,262,982 | | | | 7,809,547 | | | | 343,786 | | | | 513,640 | |
| | | | | | | | | | | | | | | | |
End of period | | $ | 14,825,753 | | | $ | 13,262,982 | | | $ | 422,119 | | | $ | 343,786 | |
| | | | | | | | | | | | | | | | |
Accumulated undistributed (distributions in excess of) net investment income | | $ | 2,640 | | | $ | 48,644 | | | $ | (4,473 | ) | | $ | (2,483 | ) |
| | | | | | | | | | | | | | | | |
SEE NOTES TO FINANCIAL STATEMENTS.
| | | | | | |
| | | |
| 56 | | | | J.P. MORGAN MID CAP/MULTI-CAP FUNDS | | DECEMBER 31, 2013 |
| | | | | | | | |
| | | Value Advantage Fund | |
| | | Six Months Ended
12/31/2013
(Unaudited) | | | Year Ended
6/30/2013 | |
CHANGE IN NET ASSETS RESULTING FROM OPERATIONS: | | | | | | | | |
Net investment income (loss) | | $ | 25,048 | | | $ | 27,476 | |
Net realized gain (loss) | | | 152,985 | | | | 52,298 | |
Distributions of capital gains received from investment company affiliates | | | 5 | | | | — | |
Change in net unrealized appreciation/depreciation | | | 409,220 | | | | 438,061 | |
| | | | | | | | |
Change in net assets resulting from operations | | | 587,258 | | | | 517,835 | |
| | | | | | | | |
| | |
DISTRIBUTIONS TO SHAREHOLDERS: | | | | | | | | |
Class A | | | | | | | | |
From net investment income | | | (6,931 | ) | | | (4,504 | ) |
From net realized gains | | | (30,061 | ) | | | (1,946 | ) |
Class C | | | | | | | | |
From net investment income | | | (562 | ) | | | (368 | ) |
From net realized gains | | | (7,282 | ) | | | (536 | ) |
Institutional Class | | | | | | | | |
From net investment income | | | (19,755 | ) | | | (8,338 | ) |
From net realized gains | | | (54,303 | ) | | | (2,763 | ) |
Select Class | | | | | | | | |
From net investment income | | | (12,951 | ) | | | (7,570 | ) |
From net realized gains | | | (42,336 | ) | | | (2,914 | ) |
| | | | | | | | |
Total distributions to shareholders | | | (174,181 | ) | | | (28,939 | ) |
| | | | | | | | |
| | |
CAPITAL TRANSACTIONS: | | | | | | | | |
Change in net assets resulting from capital transactions | | | 1,348,712 | | | | 2,075,888 | |
| | | | | | | | |
| | |
NET ASSETS: | | | | | | | | |
Change in net assets | | | 1,761,789 | | | | 2,564,784 | |
Beginning of period | | | 3,696,923 | | | | 1,132,139 | |
| | | | | | | | |
End of period | | $ | 5,458,712 | | | $ | 3,696,923 | |
| | | | | | | | |
Accumulated undistributed (distributions in excess of) net investment income | | $ | (881 | ) | | $ | 14,270 | |
| | | | | | | | |
SEE NOTES TO FINANCIAL STATEMENTS.
| | | | | | | | |
| | | |
| DECEMBER 31, 2013 | | J.P. MORGAN MID CAP/MULTI-CAP FUNDS | | | | | 57 | |
STATEMENTS OF CHANGES IN NET ASSETS
FOR THE PERIODS INDICATED (continued)
(Amounts in thousands)
| | | | | | | | | | | | | | | | |
| | | Growth Advantage Fund | | | Mid Cap Core Fund | |
| | | Six Months Ended
12/31/2013
(Unaudited) | | | Year Ended
6/30/2013 | | | Six Months Ended
12/31/2013
(Unaudited) | | | Year Ended
6/30/2013 | |
CAPITAL TRANSACTIONS: | | | | | | | | | | | | | | | | |
Class A | | | | | | | | | | | | | | | | |
Proceeds from shares issued | | $ | 202,146 | | | $ | 118,895 | | | $ | 12,837 | | | $ | 30,581 | |
Distributions reinvested | | | 21,355 | | | | 834 | | | | 4,373 | | | | 434 | |
Cost of shares redeemed | | | (49,865 | ) | | | (80,737 | ) | | | (6,436 | ) | | | (7,742 | ) |
| | | | | | | | | | | | | | | | |
Change in net assets resulting from Class A capital transactions | | $ | 173,636 | | | $ | 38,992 | | | $ | 10,774 | | | $ | 23,273 | |
| | | | | | | | | | | | | | | | |
Class B | | | | | | | | | | | | | | | | |
Proceeds from shares issued | | $ | 179 | | | $ | 106 | | | $ | — | | | $ | — | |
Distributions reinvested | | | 118 | | | | 7 | | | | — | | | | — | |
Cost of shares redeemed | | | (223 | ) | | | (752 | ) | | | — | | | | — | |
| | | | | | | | | | | | | | | | |
Change in net assets resulting from Class B capital transactions | | $ | 74 | | | $ | (639 | ) | | $ | — | | | $ | — | |
| | | | | | | | | | | | | | | | |
Class C | | | | | | | | | | | | | | | | |
Proceeds from shares issued | | $ | 40,985 | | | $ | 15,313 | | | $ | 1,053 | | | $ | 402 | |
Distributions reinvested | | | 3,500 | | | | 83 | | | | 153 | | | | 2 | |
Cost of shares redeemed | | | (4,481 | ) | | | (6,338 | ) | | | (93 | ) | | | (134 | ) |
| | | | | | | | | | | | | | | | |
Change in net assets resulting from Class C capital transactions | | $ | 40,004 | | | $ | 9,058 | | | $ | 1,113 | | | $ | 270 | |
| | | | | | | | | | | | | | | | |
Class R2 | | | | | | | | | | | | | | | | |
Proceeds from shares issued | | $ | — | | | $ | — | | | $ | 232 | | | $ | 139 | |
Distributions reinvested | | | — | | | | — | | | | 16 | | | | 2 | |
Cost of shares redeemed | | | — | | | | — | | | | (25 | ) | | | (1 | ) |
| | | | | | | | | | | | | | | | |
Change in net assets resulting from Class R2 capital transactions | | $ | — | | | $ | — | | | $ | 223 | | | $ | 140 | |
| | | | | | | | | | | | | | | | |
Class R5 | | | | | | | | | | | | | | | | |
Proceeds from shares issued | | $ | 206,397 | | | $ | 327,999 | | | $ | — | | | $ | — | |
Distributions reinvested | | | 54,106 | | | | 4,864 | | | | 9 | | | | 2 | |
Cost of shares redeemed | | | (19,995 | ) | | | (97,306 | ) | | | — | | | | — | |
| | | | | | | | | | | | | | | | |
Change in net assets resulting from Class R5 capital transactions | | $ | 240,508 | | | $ | 235,557 | | | $ | 9 | | | $ | 2 | |
| | | | | | | | | | | | | | | | |
Class R6 (a) | | | | | | | | | | | | | | | | |
Proceeds from shares issued | | $ | 50 | | | $ | — | | | $ | 96,094 | | | $ | 370,724 | |
Distributions reinvested | | | — | | | | — | | | | 66,591 | | | | 6,360 | |
Cost of shares redeemed | | | — | | | | — | | | | (3 | ) | | | (60,026 | ) |
| | | | | | | | | | | | | | | | |
Change in net assets resulting from Class R6 capital transactions | | $ | 50 | | | $ | — | | | $ | 162,682 | | | $ | 317,058 | |
| | | | | | | | | | | | | | | | |
Select Class | | | | | | | | | | | | | | | | |
Proceeds from shares issued | | $ | 214,819 | | | $ | 347,648 | | | $ | 9,180 | | | $ | 184,036 | |
Distributions reinvested | | | 20,345 | | | | 264 | | | | 2,460 | | | | 201 | |
Cost of shares redeemed | | | (150,068 | ) | | | (292,858 | ) | | | (61,417 | ) | | | (154,385 | ) |
| | | | | | | | | | | | | | | | |
Change in net assets resulting from Select Class capital transactions | | $ | 85,096 | | | $ | 55,054 | | | $ | (49,777 | ) | | $ | 29,852 | |
| | | | | | | | | | | | | | | | |
Total change in net assets resulting from capital transactions | | $ | 539,368 | | | $ | 338,022 | | | $ | 125,024 | | | $ | 370,595 | |
| | | | | | | | | | | | | | | | |
| (a) | Commencement of offering of class of shares effective December 23, 2013 for Growth Advantage Fund. |
SEE NOTES TO FINANCIAL STATEMENTS.
| | | | | | |
| | | |
| 58 | | | | J.P. MORGAN MID CAP/MULTI-CAP FUNDS | | DECEMBER 31, 2013 |
| | | | | | | | | | | | | | | | |
| | | Growth Advantage Fund | | | Mid Cap Core Fund | |
| | | Six Months Ended
12/31/2013
(Unaudited) | | | Year Ended
6/30/2013 | | | Six Months Ended
12/31/2013
(Unaudited) | | | Year Ended
6/30/2013 | |
SHARE TRANSACTIONS: | | | | | | | | | | | | | | | | |
Class A | | | | | | | | | | | | | | | | |
Issued | | | 15,571 | | | | 11,374 | | | | 574 | | | | 1,728 | |
Reinvested | | | 1,645 | | | | 85 | | | | 213 | | | | 25 | |
Redeemed | | | (3,877 | ) | | | (7,790 | ) | | | (289 | ) | | | (405 | ) |
| | | | | | | | | | | | | | | | |
Change in Class A Shares | | | 13,339 | | | | 3,669 | | | | 498 | | | | 1,348 | |
| | | | | | | | | | | | | | | | |
Class B | | | | | | | | | | | | | | | | |
Issued | | | 15 | | | | 10 | | | | — | | | | — | |
Reinvested | | | 10 | | | | 1 | | | | — | | | | — | |
Redeemed | | | (19 | ) | | | (79 | ) | | | — | | | | — | |
| | | | | | | | | | | | | | | | |
Change in Class B Shares | | | 6 | | | | (68 | ) | | | — | | | | — | |
| | | | | | | | | | | | | | | | |
Class C | | | | | | | | | | | | | | | | |
Issued | | | 3,437 | | | | 1,585 | | | | 47 | | | | 21 | |
Reinvested | | | 295 | | | | 9 | | | | 7 | | | | — | (a) |
Redeemed | | | (380 | ) | | | (669 | ) | | | (4 | ) | | | (7 | ) |
| | | | | | | | | | | | | | | | |
Change in Class C Shares | | | 3,352 | | | | 925 | | | | 50 | | | | 14 | |
| | | | | | | | | | | | | | | | |
Class R2 | | | | | | | | | | | | | | | | |
Issued | | | — | | | | — | | | | 11 | | | | 7 | |
Reinvested | | | — | | | | — | | | | 1 | | | | — | (a) |
Redeemed | | | — | | | | — | | | | (1 | ) | | | — | (a) |
| | | | | | | | | | | | | | | | |
Change in Class R2 Shares | | | — | | | | — | | | | 11 | | | | 7 | |
| | | | | | | | | | | | | | | | |
Class R5 | | | | | | | | | | | | | | | | |
Issued | | | 15,558 | | | | 32,409 | | | | — | | | | — | |
Reinvested | | | 4,065 | | | | 481 | | | | 1 | | | | — | (a) |
Redeemed | | | (1,531 | ) | | | (9,664 | ) | | | — | | | | — | |
| | | | | | | | | | | | | | | | |
Change in Class R5 Shares | | | 18,092 | | | | 23,226 | | | | 1 | | | | — | (a) |
| | | | | | | | | | | | | | | | |
Class R6 (b) | | | | | | | | | | | | | | | | |
Issued | | | 3 | | | | — | | | | 4,280 | | | | 20,721 | |
Reinvested | | | — | | | | — | | | | 3,201 | | | | 356 | |
Redeemed | | | — | | | | — | | | | — | (a) | | | (3,360 | ) |
| | | | | | | | | | | | | | | | |
Change in Class R6 Shares | | | 3 | | | | — | | | | 7,481 | | | | 17,717 | |
| | | | | | | | | | | | | | | | |
Select Class | | | | | | | | | | | | | | | | |
Issued | | | 16,494 | | | | 31,902 | | | | 424 | | | | 10,273 | |
Reinvested | | | 1,541 | | | | 26 | | | | 119 | | | | 11 | |
Redeemed | | | (11,529 | ) | | | (28,131 | ) | | | (2,740 | ) | | | (8,021 | ) |
| | | | | | | | | | | | | | | | |
Change in Select Class Shares | | | 6,506 | | | | 3,797 | | | | (2,197 | ) | | | 2,263 | |
| | | | | | | | | | | | | | | | |
| (a) | Amount rounds to less than 1,000. |
| (b) | Commencement of offering of class of shares effective December 23, 2013 for Growth Advantage Fund. |
SEE NOTES TO FINANCIAL STATEMENTS.
| | | | | | | | |
| | | |
| DECEMBER 31, 2013 | | J.P. MORGAN MID CAP/MULTI-CAP FUNDS | | | | | 59 | |
STATEMENTS OF CHANGES IN NET ASSETS
FOR THE PERIODS INDICATED (continued)
(Amounts in thousands)
| | | | | | | | | | | | | | | | |
| | | Mid Cap Equity Fund | | | Mid Cap Growth Fund | |
| | | Six Months Ended
12/31/2013
(Unaudited) | | | Year Ended
6/30/2013 | | | Six Months Ended
12/31/2013
(Unaudited) | | | Year Ended
6/30/2013 | |
CAPITAL TRANSACTIONS: | | | | | | | | | | | | | | | | |
Class A | | | | | | | | | | | | | | | | |
Proceeds from shares issued | | $ | 35,763 | | | $ | 17,130 | | | $ | 40,866 | | | $ | 48,342 | |
Distributions reinvested | | | 4,242 | | | | 106 | | | | 65,053 | | | | 23,844 | |
Cost of shares redeemed | | | (2,808 | ) | | | (5,274 | ) | | | (57,579 | ) | | | (115,922 | ) |
| | | | | | | | | | | | | | | | |
Change in net assets resulting from Class A capital transactions | | $ | 37,197 | | | $ | 11,962 | | | $ | 48,340 | | | $ | (43,736 | ) |
| | | | | | | | | | | | | | | | |
Class B | | | | | | | | | | | | | | | | |
Proceeds from shares issued | | $ | — | | | $ | — | | | $ | 44 | | | $ | 163 | |
Distributions reinvested | | | — | | | | — | | | | 905 | | | | 512 | |
Cost of shares redeemed | | | — | | | | — | | | | (1,400 | ) | | | (4,906 | ) |
| | | | | | | | | | | | | | | | |
Change in net assets resulting from Class B capital transactions | | $ | — | | | $ | — | | | $ | (451 | ) | | $ | (4,231 | ) |
| | | | | | | | | | | | | | | | |
Class C | | | | | | | | | | | | | | | | |
Proceeds from shares issued | | $ | 8,269 | | | $ | 4,723 | | | $ | 3,537 | | | $ | 2,471 | |
Distributions reinvested | | | 1,100 | | | | 16 | | | | 2,860 | | | | 948 | |
Cost of shares redeemed | | | (836 | ) | | | (349 | ) | | | (2,433 | ) | | | (5,306 | ) |
| | | | | | | | | | | | | | | | |
Change in net assets resulting from Class C capital transactions | | $ | 8,533 | | | $ | 4,390 | | | $ | 3,964 | | | $ | (1,887 | ) |
| | | | | | | | | | | | | | | | |
Class R2 | | | | | | | | | | | | | | | | |
Proceeds from shares issued | | $ | — | | | $ | — | | | $ | 355 | | | $ | 122 | |
Distributions reinvested | | | — | | | | — | | | | 58 | | | | 11 | |
Cost of shares redeemed | | | — | | | | — | | | | (139 | ) | | | (90 | ) |
| | | | | | | | | | | | | | | | |
Change in net assets resulting from Class R2 capital transactions | | $ | — | | | $ | — | | | $ | 274 | | | $ | 43 | |
| | | | | | | | | | | | | | | | |
Class R5 | | | | | | | | | | | | | | | | |
Proceeds from shares issued | | $ | — | | | $ | — | | | $ | 4,753 | | | $ | 4,842 | |
Distributions reinvested | | | — | | | | — | | | | 2,276 | | | | 664 | |
Cost of shares redeemed | | | — | | | | — | | | | (1,903 | ) | | | (5,382 | ) |
| | | | | | | | | | | | | | | | |
Change in net assets resulting from Class R5 capital transactions | | $ | — | | | $ | — | | | $ | 5,126 | | | $ | 124 | |
| | | | | | | | | | | | | | | | |
Class R6 | | | | | | | | | | | | | | | | |
Proceeds from shares issued | | $ | — | | | $ | — | | | $ | 6,861 | | | $ | 32,440 | |
Distributions reinvested | | | — | | | | — | | | | 4,757 | | | | 826 | |
Cost of shares redeemed | | | — | | | | — | | | | (4,748 | ) | | | (4,753 | ) |
| | | | | | | | | | | | | | | | |
Change in net assets resulting from Class R6 capital transactions | | $ | — | | | $ | — | | | $ | 6,870 | | | $ | 28,513 | |
| | | | | | | | | | | | | | | | |
Select Class | | | | | | | | | | | | | | | | |
Proceeds from shares issued | | $ | 289,002 | | | $ | 425,901 | | | $ | 85,888 | | | $ | 131,018 | |
Distributions reinvested | | | 81,358 | | | | 10,102 | | | | 84,914 | | | | 30,576 | |
Cost of shares redeemed | | | (200,077 | ) | | | (516,060 | ) | | | (86,073 | ) | | | (240,571 | ) |
| | | | | | | | | | | | | | | | |
Change in net assets resulting from Select Class capital transactions | | $ | 170,283 | | | $ | (80,057 | ) | | $ | 84,729 | | | $ | (78,977 | ) |
| | | | | | | | | | | | | | | | |
Total change in net assets resulting from capital transactions | | $ | 216,013 | | | $ | (63,705 | ) | | $ | 148,852 | | | $ | (100,151 | ) |
| | | | | | | | | | | | | | | | |
SEE NOTES TO FINANCIAL STATEMENTS.
| | | | | | |
| | | |
| 60 | | | | J.P. MORGAN MID CAP/MULTI-CAP FUNDS | | DECEMBER 31, 2013 |
| | | | | | | | | | | | | | | | |
| | | Mid Cap Equity Fund | | | Mid Cap Growth Fund | |
| | | Six Months Ended
12/31/2013
(Unaudited) | | | Year
Ended
6/30/2013 | | | Six Months Ended
12/31/2013
(Unaudited) | | | Year Ended
6/30/2013 | |
SHARE TRANSACTIONS: | | | | | | | | | | | | | | | | |
Class A | | | | | | | | | | | | | | | | |
Issued | | | 862 | | | | 475 | | | | 1,615 | | | | 2,246 | |
Reinvested | | | 107 | | | | 3 | | | | 2,708 | | | | 1,214 | |
Redeemed | | | (68 | ) | | | (147 | ) | | | (2,259 | ) | | | (5,508 | ) |
| | | | | | | | | | | | | | | | |
Change in Class A Shares | | | 901 | | | | 331 | | | | 2,064 | | | | (2,048 | ) |
| | | | | | | | | | | | | | | | |
Class B | | | | | | | | | | | | | | | | |
Issued | | | — | | | | — | | | | 3 | | | | 11 | |
Reinvested | | | — | | | | — | | | | 53 | | | | 35 | |
Redeemed | | | — | | | | — | | | | (75 | ) | | | (313 | ) |
| | | | | | | | | | | | | | | | |
Change in Class B Shares | | | — | | | | — | | | | (19 | ) | | | (267 | ) |
| | | | | | | | | | | | | | | | |
Class C | | | | | | | | | | | | | | | | |
Issued | | | 201 | | | | 132 | | | | 161 | | | | 134 | |
Reinvested | | | 28 | | | | 1 | | | | 140 | | | | 55 | |
Redeemed | | | (20 | ) | | | (10 | ) | | | (111 | ) | | | (292 | ) |
| | | | | | | | | | | | | | | | |
Change in Class C Shares | | | 209 | | | | 123 | | | | 190 | | | | (103 | ) |
| | | | | | | | | | | | | | | | |
Class R2 | | | | | | | | | | | | | | | | |
Issued | | | — | | | | — | | | | 13 | | | | 5 | |
Reinvested | | | — | | | | — | | | | 2 | | | | 1 | |
Redeemed | | | — | | | | — | | | | (5 | ) | | | (4 | ) |
| | | | | | | | | | | | | | | | |
Change in Class R2 Shares | | | — | | | | — | | | | 10 | | | | 2 | |
| | | | | | | | | | | | | | | | |
Class R5 | | | | | | | | | | | | | | | | |
Issued | | | — | | | | — | | | | 177 | | | | 207 | |
Reinvested | | | — | | | | — | | | | 86 | | | | 31 | |
Redeemed | | | — | | | | — | | | | (70 | ) | | | (229 | ) |
| | | | | | | | | | | | | | | | |
Change in Class R5 Shares | | | — | | | | — | | | | 193 | | | | 9 | |
| | | | | | | | | | | | | | | | |
Class R6 | | | | | | | | | | | | | | | | |
Issued | | | — | | | | — | | | | 245 | | | | 1,389 | |
Reinvested | | | — | | | | — | | | | 179 | | | | 39 | |
Redeemed | | | — | | | | — | | | | (173 | ) | | | (204 | ) |
| | | | | | | | | | | | | | | | |
Change in Class R6 Shares | | | — | | | | — | | | | 251 | | | | 1,224 | |
| | | | | | | | | | | | | | | | |
Select Class | | | | | | | | | | | | | | | | |
Issued | | | 7,020 | | | | 12,148 | | | | 3,097 | | | | 5,687 | |
Reinvested | | | 2,038 | | | | 297 | | | | 3,204 | | | | 1,429 | |
Redeemed | | | (4,871 | ) | | | (14,229 | ) | | | (3,099 | ) | | | (10,555 | ) |
| | | | | | | | | | | | | | | | |
Change in Select Class Shares | | | 4,187 | | | | (1,784 | ) | | | 3,202 | | | | (3,439 | ) |
| | | | | | | | | | | | | | | | |
SEE NOTES TO FINANCIAL STATEMENTS.
| | | | | | | | |
| | | |
| DECEMBER 31, 2013 | | J.P. MORGAN MID CAP/MULTI-CAP FUNDS | | | | | 61 | |
STATEMENTS OF CHANGES IN NET ASSETS
FOR THE PERIODS INDICATED (continued)
(Amounts in thousands)
| | | | | | | | | | | | | | | | |
| | | Mid Cap Value Fund | | | Multi-Cap Market Neutral Fund | |
| | | Six Months Ended
12/31/2013
(Unaudited) | | | Year Ended
6/30/2013 | | | Six Months Ended
12/31/2013
(Unaudited) | | | Year Ended
6/30/2013 | |
CAPITAL TRANSACTIONS: | | | | | | | | | | | | | | | | |
Class A | | | | | | | | | | | | | | | | |
Proceeds from shares issued | | $ | 247,511 | | | $ | 1,210,890 | | | $ | 2,055 | | | $ | 5,478 | |
Distributions reinvested | | | 139,350 | | | | 42,247 | | | | — | | | | — | |
Cost of shares redeemed | | | (491,193 | ) | | | (610,574 | ) | | | (3,223 | ) | | | (11,203 | ) |
| | | | | | | | | | | | | | | | |
Change in net assets resulting from Class A capital transactions | | $ | (104,332 | ) | | $ | 642,563 | | | $ | (1,168 | ) | | $ | (5,725 | ) |
| | | | | | | | | | | | | | | | |
Class B | | | | | | | | | | | | | | | | |
Proceeds from shares issued | | $ | 52 | | | $ | 334 | | | $ | 3 | | | $ | 3 | |
Distributions reinvested | | | 502 | | | | 267 | | | | — | | | | — | |
Cost of shares redeemed | | | (4,631 | ) | | | (49,930 | ) | | | (283 | ) | | | (870 | ) |
| | | | | | | | | | | | | | | | |
Change in net assets resulting from Class B capital transactions | | $ | (4,077 | ) | | $ | (49,329 | ) | | $ | (280 | ) | | $ | (867 | ) |
| | | | | | | | | | | | | | | | |
Class C | | | | | | | | | | | | | | | | |
Proceeds from shares issued | | $ | 17,449 | | | $ | 133,195 | | | $ | 104 | | | $ | 751 | |
Distributions reinvested | | | 19,472 | | | | 4,745 | | | | — | | | | — | |
Cost of shares redeemed | | | (31,043 | ) | | | (66,664 | ) | | | (1,656 | ) | | | (5,233 | ) |
| | | | | | | | | | | | | | | | |
Change in net assets resulting from Class C capital transactions | | $ | 5,878 | | | $ | 71,276 | | | $ | (1,552 | ) | | $ | (4,482 | ) |
| | | | | | | | | | | | | | | | |
Class R2 | | | | | | | | | | | | | | | | |
Proceeds from shares issued | | $ | 10,559 | | | $ | 45,141 | | | $ | — | | | $ | — | |
Distributions reinvested | | | 2,790 | | | | 576 | | | | — | | | | — | |
Cost of shares redeemed | | | (8,068 | ) | | | (10,908 | ) | | | — | | | | — | |
| | | | | | | | | | | | | | | | |
Change in net assets resulting from Class R2 capital transactions | | $ | 5,281 | | | $ | 34,809 | | | $ | — | | | $ | — | |
| | | | | | | | | | | | | | | | |
Institutional Class | | | | | | | | | | | | | | | | |
Proceeds from shares issued | | $ | 1,168,105 | | | $ | 2,982,640 | | | $ | — | | | $ | — | |
Distributions reinvested | | | 315,542 | | | | 79,639 | | | | — | | | | — | |
Cost of shares redeemed | | | (678,281 | ) | | | (1,002,437 | ) | | | — | | | | — | |
| | | | | | | | | | | | | | | | |
Change in net assets resulting from Institutional Class capital transactions | | $ | 805,366 | | | $ | 2,059,842 | | | $ | — | | | $ | — | |
| | | | | | | | | | | | | | | | |
Select Class | | | | | | | | | | | | | | | | |
Proceeds from shares issued | | $ | 293,329 | | | $ | 1,124,563 | | | $ | 78,247 | | | $ | 29,513 | |
Distributions reinvested | | | 120,569 | | | | 34,904 | | | | — | | | | — | |
Cost of shares redeemed | | | (754,147 | ) | | | (612,849 | ) | | | (2,767 | ) | | | (192,532 | ) |
| | | | | | | | | | | | | | | | |
Change in net assets resulting from Select Class capital transactions | | $ | (340,249 | ) | | $ | 546,618 | | | $ | 75,480 | | | $ | (163,019 | ) |
| | | | | | | | | | | | | | | | |
Total change in net assets resulting from capital transactions | | $ | 367,867 | | | $ | 3,305,779 | | | $ | 72,480 | | | $ | (174,093 | ) |
| | | | | | | | | | | | | | | | |
SEE NOTES TO FINANCIAL STATEMENTS.
| | | | | | |
| | | |
| 62 | | | | J.P. MORGAN MID CAP/MULTI-CAP FUNDS | | DECEMBER 31, 2013 |
| | | | | | | | | | | | | | | | |
| | | Mid Cap Value Fund | | | Multi-Cap Market Neutral Fund | |
| | | Six Months Ended
12/31/2013
(Unaudited) | | | Year Ended
6/30/2013 | | | Six Months Ended
12/31/2013
(Unaudited) | | | Year Ended
6/30/2013 | |
SHARE TRANSACTIONS: | | | | | | | | | | | | | | | | |
Class A | | | | | | | | | | | | | | | | |
Issued | | | 7,353 | | | | 42,201 | | | | 209 | | | | 567 | |
Reinvested | | | 4,172 | | | | 1,526 | | | | — | | | | — | |
Redeemed | | | (14,641 | ) | | | (21,054 | ) | | | (330 | ) | | | (1,165 | ) |
| | | | | | | | | | | | | | | | |
Change in Class A Shares | | | (3,116 | ) | | | 22,673 | | | | (121 | ) | | | (598 | ) |
| | | | | | | | | | | | | | | | |
Class B | | | | | | | | | | | | | | | | |
Issued | | | 2 | | | | 12 | | | | 1 | | | | — | (a) |
Reinvested | | | 15 | | | | 10 | | | | — | | | | — | |
Redeemed | | | (141 | ) | | | (1,796 | ) | | | (31 | ) | | | (94 | ) |
| | | | | | | | | | | | | | | | |
Change in Class B Shares | | | (124 | ) | | | (1,774 | ) | | | (30 | ) | | | (94 | ) |
| | | | | | | | | | | | | | | | |
Class C | | | | | | | | | | | | | | | | |
Issued | | | 535 | | | | 4,806 | | | | 10 | | | | 81 | |
Reinvested | | | 602 | | | | 176 | | | | — | | | | — | |
Redeemed | | | (946 | ) | | | (2,386 | ) | | | (178 | ) | | | (568 | ) |
| | | | | | | | | | | | | | | | |
Change in Class C Shares | | | 191 | | | | 2,596 | | | | (168 | ) | | | (487 | ) |
| | | | | | | | | | | | | | | | |
Class R2 | | | | | | | | | | | | | | | | |
Issued | | | 323 | | | | 1,617 | | | | — | | | | — | |
Reinvested | | | 86 | | | | 22 | | | | — | | | | — | |
Redeemed | | | (246 | ) | | | (378 | ) | | | — | | | | — | |
| | | | | | | | | | | | | | | | |
Change in Class R2 Shares | | | 163 | | | | 1,261 | | | | — | | | | — | |
| | | | | | | | | | | | | | | | |
Institutional Class | | | | | | | | | | | | | | | | |
Issued | | | 33,569 | | | | 101,790 | | | | — | | | | — | |
Reinvested | | | 9,240 | | | | 2,827 | | | | — | | | | — | |
Redeemed | | | (19,677 | ) | | | (34,195 | ) | | | — | | | | — | |
| | | | | | | | | | | | | | | | |
Change in Institutional Class Shares | | | 23,132 | | | | 70,422 | | | | — | | | | — | |
| | | | | | | | | | | | | | | | |
Select Class | | | | | | | | | | | | | | | | |
Issued | | | 8,647 | | | | 38,813 | | | | 7,798 | | | | 3,039 | |
Reinvested | | | 3,571 | | | | 1,250 | | | | — | | | | — | |
Redeemed | | | (21,757 | ) | | | (20,799 | ) | | | (278 | ) | | | (19,620 | ) |
| | | | | | | | | | | | | | | | |
Change in Select Class Shares | | | (9,539 | ) | | | 19,264 | | | | 7,520 | | | | (16,581 | ) |
| | | | | | | | | | | | | | | | |
| (a) | Amount rounds to less than 1,000. |
SEE NOTES TO FINANCIAL STATEMENTS.
| | | | | | | | |
| | | |
| DECEMBER 31, 2013 | | J.P. MORGAN MID CAP/MULTI-CAP FUNDS | | | | | 63 | |
STATEMENTS OF CHANGES IN NET ASSETS
FOR THE PERIODS INDICATED (continued)
(Amounts in thousands)
| | | | | | | | |
| | | Value Advantage Fund | |
| | | Six Months Ended
12/31/2013
(Unaudited) | | | Year Ended
6/30/2013 | |
CAPITAL TRANSACTIONS: | | | | | | | | |
Class A | | | | | | | | |
Proceeds from shares issued | | $ | 420,020 | | | $ | 586,395 | |
Distributions reinvested | | | 34,685 | | | | 6,154 | |
Cost of shares redeemed | | | (119,561 | ) | | | (121,764 | ) |
| | | | | | | | |
Change in net assets resulting from Class A capital transactions | | $ | 335,144 | | | $ | 470,785 | |
| | | | | | | | |
Class C | | | | | | | | |
Proceeds from shares issued | | $ | 63,275 | | | $ | 82,479 | |
Distributions reinvested | | | 6,053 | | | | 752 | |
Cost of shares redeemed | | | (11,300 | ) | | | (20,667 | ) |
| | | | | | | | |
Change in net assets resulting from Class C capital transactions | | $ | 58,028 | | | $ | 62,564 | |
| | | | | | | | |
Institutional Class | | | | | | | | |
Proceeds from shares issued | | $ | 687,571 | | | $ | 953,269 | |
Distributions reinvested | | | 69,075 | | | | 10,007 | |
Cost of shares redeemed | | | (206,082 | ) | | | (69,891 | ) |
| | | | | | | | |
Change in net assets resulting from Institutional Class capital transactions | | $ | 550,564 | | | $ | 893,385 | |
| | | | | | | | |
Select Class | | | | | | | | |
Proceeds from shares issued | | $ | 619,318 | | | $ | 759,414 | |
Distributions reinvested | | | 49,543 | | | | 7,729 | |
Cost of shares redeemed | | | (263,885 | ) | | | (117,989 | ) |
| | | | | | | | |
Change in net assets resulting from Select Class capital transactions | | $ | 404,976 | | | $ | 649,154 | |
| | | | | | | | |
Total change in net assets resulting from capital transactions | | $ | 1,348,712 | | | $ | 2,075,888 | |
| | | | | | | | |
| | |
SHARE TRANSACTIONS: | | | | | | | | |
Class A | | | | | | | | |
Issued | | | 16,227 | | | | 26,590 | |
Reinvested | | | 1,320 | | | | 287 | |
Redeemed | | | (4,587 | ) | | | (5,402 | ) |
| | | | | | | | |
Change in Class A Shares | | | 12,960 | | | | 21,475 | |
| | | | | | | | |
Class C | | | | | | | | |
Issued | | | 2,434 | | | | 3,602 | |
Reinvested | | | 232 | | | | 35 | |
Redeemed | | | (433 | ) | | | (938 | ) |
| | | | | | | | |
Change in Class C Shares | | | 2,233 | | | | 2,699 | |
| | | | | | | | |
Institutional Class | | | | | | | | |
Issued | | | 26,119 | | | | 42,258 | |
Reinvested | | | 2,610 | | | | 466 | |
Redeemed | | | (7,758 | ) | | | (3,137 | ) |
| | | | | | | | |
Change in Institutional Class Shares | | | 20,971 | | | | 39,587 | |
| | | | | | | | |
Select Class | | | | | | | | |
Issued | | | 23,439 | | | | 34,123 | |
Reinvested | | | 1,877 | | | | 360 | |
Redeemed | | | (9,896 | ) | | | (5,249 | ) |
| | | | | | | | |
Change in Select Class Shares | | | 15,420 | | | | 29,234 | |
| | | | | | | | |
SEE NOTES TO FINANCIAL STATEMENTS.
| | | | | | |
| | | |
| 64 | | | | J.P. MORGAN MID CAP/MULTI-CAP FUNDS | | DECEMBER 31, 2013 |
THIS PAGE IS INTENTIONALLY LEFT BLANK
| | | | | | | | |
| | | |
| DECEMBER 31, 2013 | | J.P. MORGAN MID CAP/MULTI-CAP FUNDS | | | | | 65 | |
FINANCIAL HIGHLIGHTS
FOR THE PERIODS INDICATED
| | | | | | | | | | | | | | | | | | | | | | | | | | | | |
| | | | | | Per share operating performance | |
| | | | | | Investment operations | | | Distributions | |
| | | Net asset
value,
beginning
of period | | | Net
investment
income
(loss) | | | Net realized
and unrealized
gains
(losses) on
investments | | | Total from
investment
operations | | | Net
investment
income | | | Net
realized
gain | | | Total
distributions | |
Growth Advantage Fund | |
Class A | |
Six Months Ended December 31, 2013 (Unaudited) | | $ | 11.43 | | | $ | (0.03 | )(f) | | $ | 2.85 | | | $ | 2.82 | | | $ | — | | | $ | (0.64 | ) | | $ | (0.64 | ) |
Year Ended June 30, 2013 | | | 9.49 | | | | 0.01 | (f)(g) | | | 1.97 | | | | 1.98 | | | | (0.01 | ) | | | (0.03 | ) | | | (0.04 | ) |
Year Ended June 30, 2012 | | | 9.28 | | | | (0.03 | )(f)(h) | | | 0.24 | | | | 0.21 | | | | — | | | | — | | | | — | |
Year Ended June 30, 2011 | | | 6.76 | | | | (0.04 | )(f) | | | 2.56 | | | | 2.52 | | | | — | | | | — | | | | — | |
Year Ended June 30, 2010 | | | 5.88 | | | | (0.03 | )(f) | | | 0.91 | | | | 0.88 | | | | — | | | | — | | | | — | |
Year Ended June 30, 2009 | | | 8.14 | | | | (0.03 | )(f) | | | (2.23 | ) | | | (2.26 | ) | | | — | | | | — | | | | — | |
|
Class B | |
Six Months Ended December 31, 2013 (Unaudited) | | | 10.50 | | | | (0.05 | )(f) | | | 2.62 | | | | 2.57 | | | | — | | | | (0.64 | ) | | | (0.64 | ) |
Year Ended June 30, 2013 | | | 8.76 | | | | (0.04 | )(f)(g) | | | 1.81 | | | | 1.77 | | | | — | | | | (0.03 | ) | | | (0.03 | ) |
Year Ended June 30, 2012 | | | 8.61 | | | | (0.07 | )(f)(h) | | | 0.22 | | | | 0.15 | | | | — | | | | — | | | | — | |
Year Ended June 30, 2011 | | | 6.31 | | | | (0.07 | )(f) | | | 2.37 | | | | 2.30 | | | | — | | | | — | | | | — | |
Year Ended June 30, 2010 | | | 5.51 | | | | (0.06 | )(f) | | | 0.86 | | | | 0.80 | | | | — | | | | — | | | | — | |
Year Ended June 30, 2009 | | | 7.67 | | | | (0.06 | )(f) | | | (2.10 | ) | | | (2.16 | ) | | | — | | | | — | | | | — | |
|
Class C | |
Six Months Ended December 31, 2013 (Unaudited) | | | 10.51 | | | | (0.05 | )(f) | | | 2.62 | | | | 2.57 | | | | — | | | | (0.64 | ) | | | (0.64 | ) |
Year Ended June 30, 2013 | | | 8.77 | | | | (0.04 | )(f)(g) | | | 1.81 | | | | 1.77 | | | | — | | | | (0.03 | ) | | | (0.03 | ) |
Year Ended June 30, 2012 | | | 8.61 | | | | (0.07 | )(f)(h) | | | 0.23 | | | | 0.16 | | | | — | | | | — | | | | — | |
Year Ended June 30, 2011 | | | 6.31 | | | | (0.08 | )(f) | | | 2.38 | | | | 2.30 | | | | — | | | | — | | | | — | |
Year Ended June 30, 2010 | | | 5.52 | | | | (0.06 | )(f) | | | 0.85 | | | | 0.79 | | | | — | | | | — | | | | — | |
Year Ended June 30, 2009 | | | 7.68 | | | | (0.06 | )(f) | | | (2.10 | ) | | | (2.16 | ) | | | — | | | | — | | | | — | |
|
Class R5 | |
Six Months Ended December 31, 2013 (Unaudited) | | | 11.68 | | | | — | (f)(j) | | | 2.92 | | | | 2.92 | | | | — | | | | (0.64 | ) | | | (0.64 | ) |
Year Ended June 30, 2013 | | | 9.69 | | | | 0.06 | (f)(g) | | | 2.01 | | | | 2.07 | | | | (0.05 | ) | | | (0.03 | ) | | | (0.08 | ) |
Year Ended June 30, 2012 | | | 9.44 | | | | 0.01 | (f)(h) | | | 0.24 | | | | 0.25 | | | | — | | | | — | | | | — | |
Year Ended June 30, 2011 | | | 6.86 | | | | — | (f)(j) | | | 2.58 | | | | 2.58 | | | | — | | | | — | | | | — | |
Year Ended June 30, 2010 | | | 5.93 | | | | — | (f)(j) | | | 0.93 | | | | 0.93 | | | | — | | | | — | | | | — | |
January 8, 2009 (i) through June 30, 2009 | | | 5.37 | | | | — | (f)(j) | | | 0.56 | | | | 0.56 | | | | — | | | | — | | | | — | |
|
Class R6 | |
December 23, 2013 (i) through December 31, 2013 (Unaudited) | | | 13.86 | | | | — | (f)(j) | | | 0.10 | | | | 0.10 | | | | — | | | | — | | | | — | |
|
Select Class | |
Six Months Ended December 31, 2013 (Unaudited) | | | 11.60 | | | | (0.01 | )(f) | | | 2.90 | | | | 2.89 | | | | — | | | | (0.64 | ) | | | (0.64 | ) |
Year Ended June 30, 2013 | | | 9.63 | | | | 0.04 | (f)(g) | | | 1.98 | | | | 2.02 | | | | (0.02 | ) | | | (0.03 | ) | | | (0.05 | ) |
Year Ended June 30, 2012 | | | 9.39 | | | | (0.02 | )(f)(h) | | | 0.26 | | | | 0.24 | | | | — | | | | — | | | | — | |
Year Ended June 30, 2011 | | | 6.83 | | | | (0.02 | )(f) | | | 2.58 | | | | 2.56 | | | | — | | | | — | | | | — | |
Year Ended June 30, 2010 | | | 5.93 | | | | (0.01 | )(f) | | | 0.91 | | | | 0.90 | | | | — | | | | — | | | | — | |
Year Ended June 30, 2009 | | | 8.18 | | | | (0.01 | )(f) | | | (2.24 | ) | | | (2.25 | ) | | | — | | | | — | | | | — | |
| (a) | Annualized for periods less than one year. |
| (b) | Not annualized for periods less than one year. |
| (c) | Includes adjustments in accordance with accounting principles generally accepted in the United States of America and as such, the net asset values for financial reporting purposes and the returns based upon those net asset values may differ from the net asset values and returns for shareholder transactions. |
| (d) | Includes earnings credits and interest expense, if applicable, each of which is less than 0.01% unless otherwise noted. |
| (e) | Portfolio turnover is calculated by dividing the lesser of total purchases or sales of portfolio securities for the reporting period by the monthly average value of portfolio securities owned during the reporting period. Excluded from both the numerator and denominator are amounts relating to derivatives and securities whose maturities or expiration dates at the time of acquisition were one year or less. |
| (f) | Calculated based upon average shares outstanding. |
SEE NOTES TO FINANCIAL STATEMENTS.
| | | | | | |
| | | |
| 66 | | | | J.P. MORGAN MID CAP/MULTI-CAP FUNDS | | DECEMBER 31, 2013 |
| | | | | | | | | | | | | | | | | | | | | | | | | | |
| | | Ratios/Supplemental data | |
| | | | | | | | | | Ratios to average net assets (a) | | | | |
Net asset
value,
end of
period | | | Total return
(excludes
sales charge) (b)(c) | | | Net assets,
end of
period
(000’s) | | | Net
expenses (d) | | | Net
investment
income
(loss) | | | Expenses
without waivers,
reimbursements and
earnings credits | | | Portfolio
turnover
rate (b)(e) | |
| | | | | | | | | | | | | | | | | | | | | | | | | | |
| | | | | | | | | | | | | | | | | | | | | | | | | | |
| $ | 13.61 | | | | 24.91 | % | | $ | 511,230 | | | | 1.24 | % | | | (0.41 | )% | | | 1.30 | % | | | 34 | % |
| | 11.43 | | | | 20.95 | | | | 276,670 | | | | 1.24 | | | | 0.11 | (g) | | | 1.28 | | | | 76 | |
| | 9.49 | | | | 2.26 | | | | 194,911 | | | | 1.25 | | | | (0.37 | )(h) | | | 1.30 | | | | 86 | |
| | 9.28 | | | | 37.28 | | | | 176,492 | | | | 1.25 | | | | (0.45 | ) | | | 1.31 | | | | 96 | |
| | 6.76 | | | | 14.97 | | | | 101,814 | | | | 1.31 | | | | (0.41 | ) | | | 1.31 | | | | 102 | |
| | 5.88 | | | | (27.76 | ) | | | 71,841 | | | | 1.35 | | | | (0.48 | ) | | | 1.42 | | | | 119 | |
| | | | | | |
| | | | | | | | | | | | | | | | | | | | | | | | | | |
| | 12.43 | | | | 24.73 | | | | 2,532 | | | | 1.73 | | | | (0.91 | ) | | | 1.79 | | | | 34 | |
| | 10.50 | | | | 20.29 | | | | 2,081 | | | | 1.74 | | | | (0.38 | )(g) | | | 1.78 | | | | 76 | |
| | 8.76 | | | | 1.74 | | | | 2,327 | | | | 1.75 | | | | (0.89 | )(h) | | | 1.80 | | | | 86 | |
| | 8.61 | | | | 36.45 | | | | 3,157 | | | | 1.75 | | | | (0.94 | ) | | | 1.81 | | | | 96 | |
| | 6.31 | | | | 14.52 | | | | 3,070 | | | | 1.81 | | | | (0.91 | ) | | | 1.81 | | | | 102 | |
| | 5.51 | | | | (28.16 | ) | | | 3,304 | | | | 1.87 | | | | (1.02 | ) | | | 1.92 | | | | 119 | |
| | | | | | |
| | | | | | | | | | | | | | | | | | | | | | | | | | |
| | 12.44 | | | | 24.71 | | | | 92,171 | | | | 1.74 | | | | (0.91 | ) | | | 1.80 | | | | 34 | |
| | 10.51 | | | | 20.27 | | | | 42,655 | | | | 1.74 | | | | (0.38 | )(g) | | | 1.78 | | | | 76 | |
| | 8.77 | | | | 1.86 | | | | 27,469 | | | | 1.75 | | | | (0.84 | )(h) | | | 1.80 | | | | 86 | |
| | 8.61 | | | | 36.45 | | | | 20,676 | | | | 1.75 | | | | (0.95 | ) | | | 1.81 | | | | 96 | |
| | 6.31 | | | | 14.31 | | | | 12,811 | | | | 1.81 | | | | (0.91 | ) | | | 1.81 | | | | 102 | |
| | 5.52 | | | | (28.13 | ) | | | 9,300 | | | | 1.87 | | | | (1.02 | ) | | | 1.91 | | | | 119 | |
| | | | | | |
| | | | | | | | | | | | | | | | | | | | | | | | | | |
| | 13.96 | | | | 25.23 | | | | 1,250,877 | | | | 0.84 | | | | (0.02 | ) | | | 0.85 | | | | 34 | |
| | 11.68 | | | | 21.49 | | | | 835,233 | | | | 0.83 | | | | 0.55 | (g) | | | 0.84 | | | | 76 | |
| | 9.69 | | | | 2.65 | | | | 468,064 | | | | 0.85 | | | | 0.07 | (h) | | | 0.85 | | | | 86 | |
| | 9.44 | | | | 37.61 | | | | 179,677 | | | | 0.86 | | | | (0.05 | ) | | | 0.86 | | | | 96 | |
| | 6.86 | | | | 15.68 | | | | 76,767 | | | | 0.86 | | | | 0.05 | | | | 0.86 | | | | 102 | |
| | 5.93 | | | | 10.43 | | | | 46,312 | | | | 0.90 | | | | (0.08 | ) | | | 1.06 | | | | 119 | |
| | | | | | |
| | | | | | | | | | | | | | | | | | | | | | | | | | |
| 13.96 | | | | 0.72 | | | | 50 | | | | 0.80 | | | | (0.17 | ) | | | 0.82 | | | | 34 | |
| | | | | | |
| | | | | | | | | | | | | | | | | | | | | | | | | | |
| | 13.85 | | | | 25.15 | | | | 1,096,022 | | | | 1.04 | | | | (0.21 | ) | | | 1.05 | | | | 34 | |
| | 11.60 | | | | 21.14 | | | | 842,783 | | | | 1.03 | | | | 0.37 | (g) | | | 1.03 | | | | 76 | |
| | 9.63 | | | | 2.56 | | | | 662,786 | | | | 1.05 | | | | (0.18 | )(h) | | | 1.05 | | | | 86 | |
| | 9.39 | | | | 37.48 | | | | 836,154 | | | | 1.06 | | | | (0.27 | ) | | | 1.06 | | | | 96 | |
| | 6.83 | | | | 15.18 | | | | 604,663 | | | | 1.06 | | | | (0.16 | ) | | | 1.06 | | | | 102 | |
| | 5.93 | | | | (27.51 | ) | | | 441,345 | | | | 1.10 | | | | (0.24 | ) | | | 1.17 | | | | 119 | |
| (g) | Reflects special dividends paid out during the period by several of the Fund’s holdings. Had the Fund not received the special dividends, the net investment income (loss) per share would have been $(0.02), $(0.06), $(0.06), $0.03 and $0.01 for Class A, Class B, Class C, Class R5 and Select Class Shares, respectively, and the net investment income (loss) ratio would have been (0.17)%, (0.66)%, (0.66)%, 0.27% and 0.09% for Class A, Class B, Class C, Class R5 and Select Class Shares, respectively. |
| (h) | Reflects a special dividend paid out during the period by one of the Fund’s holdings. Had the Fund not received the special dividend, the net investment income (loss) per share would have been $(0.05), $(0.09), $(0.09), $(0.01) and $(0.03) for Class A, Class B, Class C, Class R5 and Select Class Shares, respectively, and the net investment income (loss) ratio would have been (0.56)%, (1.08)%, (1.03)%, (0.12)% and (0.37)% for Class A, Class B, Class C, Class R5 and Select Class Shares, respectively. |
| (i) | Commencement of offering of class of shares. |
| (j) | Amount rounds to less than $0.01. |
SEE NOTES TO FINANCIAL STATEMENTS.
| | | | | | | | |
| | | |
| DECEMBER 31, 2013 | | J.P. MORGAN MID CAP/MULTI-CAP FUNDS | | | | | 67 | |
FINANCIAL HIGHLIGHTS
FOR THE PERIODS INDICATED (continued)
| | | | | | | | | | | | | | | | | | | | | | | | | | | | |
| | | | | | Per share operating performance | |
| | | | | | Investment operations | | | Distributions | |
| | | Net asset
value,
beginning
of period | | | Net
investment
income
(loss) | | | Net realized
and unrealized
gains
(losses) on
investments | | | Total from
investment
operations | | | Net
investment
income | | | Net
realized
gain | | | Total
distributions | |
Mid Cap Core Fund | | | | | |
Class A | | | | | |
Six Months Ended December 31, 2013 (Unaudited) | | $ | 20.60 | | | $ | 0.01 | (f)(g) | | $ | 3.64 | | | $ | 3.65 | | | $ | (0.01 | ) | | $ | (2.71 | ) | | $ | (2.72 | ) |
Year Ended June 30, 2013 | | | 17.16 | | | | 0.15 | (f)(h) | | | 3.66 | | | | 3.81 | | | | (0.16 | ) | | | (0.21 | ) | | | (0.37 | ) |
Year Ended June 30, 2012 | | | 17.19 | | | | 0.08 | (f) | | | (0.10 | ) | | | (0.02 | ) | | | — | (i) | | | (0.01 | ) | | | (0.01 | ) |
November 30, 2010 (j) through June 30, 2011 | | | 15.00 | | | | 0.01 | (f) | | | 2.18 | | | | 2.19 | | | | — | (i) | | | — | | | | — | (i) |
| |
Class C | | | | | |
Six Months Ended December 31, 2013 (Unaudited) | | | 20.49 | | | | (0.05 | )(f)(g) | | | 3.62 | | | | 3.57 | | | | (0.01 | ) | | | (2.71 | ) | | | (2.72 | ) |
Year Ended June 30, 2013 | | | 17.03 | | | | 0.04 | (f)(h) | | | 3.67 | | | | 3.71 | | | | (0.04 | ) | | | (0.21 | ) | | | (0.25 | ) |
Year Ended June 30, 2012 | | | 17.15 | | | | — | (f)(i) | | | (0.11 | ) | | | (0.11 | ) | | | — | (i) | | | (0.01 | ) | | | (0.01 | ) |
November 30, 2010 (j) through June 30, 2011 | | | 15.00 | | | | (0.04 | )(f) | | | 2.19 | | | | 2.15 | | | | — | | | | — | | | | — | |
| |
Class R2 | | | | | |
Six Months Ended December 31, 2013 (Unaudited) | | | 20.55 | | | | (0.02 | )(f)(g) | | | 3.63 | | | | 3.61 | | | | (0.01 | ) | | | (2.71 | ) | | | (2.72 | ) |
Year Ended June 30, 2013 | | | 17.10 | | | | 0.10 | (f)(h) | | | 3.65 | | | | 3.75 | | | | (0.09 | ) | | | (0.21 | ) | | | (0.30 | ) |
Year Ended June 30, 2012 | | | 17.17 | | | | 0.04 | (f) | | | (0.10 | ) | | | (0.06 | ) | | | — | (i) | | | (0.01 | ) | | | (0.01 | ) |
November 30, 2010 (j) through June 30, 2011 | | | 15.00 | | | | (0.02 | )(f) | | | 2.19 | | | | 2.17 | | | | — | | | | — | | | | — | |
| |
Class R5 | | | | | |
Six Months Ended December 31, 2013 (Unaudited) | | | 20.75 | | | | 0.06 | (f)(g) | | | 3.67 | | | | 3.73 | | | | (0.08 | ) | | | (2.71 | ) | | | (2.79 | ) |
Year Ended June 30, 2013 | | | 17.23 | | | | 0.22 | (f)(h) | | | 3.70 | | | | 3.92 | | | | (0.19 | ) | | | (0.21 | ) | | | (0.40 | ) |
Year Ended June 30, 2012 | | | 17.23 | | | | 0.15 | (f) | | | (0.09 | ) | | | 0.06 | | | | (0.05 | ) | | | (0.01 | ) | | | (0.06 | ) |
November 30, 2010 (j) through June 30, 2011 | | | 15.00 | | | | 0.05 | (f) | | | 2.19 | | | | 2.24 | | | | (0.01 | ) | | | — | | | | (0.01 | ) |
| |
Class R6 | | | | | |
Six Months Ended December 31, 2013 (Unaudited) | | | 20.75 | | | | 0.06 | (f)(g) | | | 3.67 | | | | 3.73 | | | | (0.09 | ) | | | (2.71 | ) | | | (2.80 | ) |
Year Ended June 30, 2013 | | | 17.23 | | | | 0.24 | (f)(h) | | | 3.69 | | | | 3.93 | | | | (0.20 | ) | | | (0.21 | ) | | | (0.41 | ) |
Year Ended June 30, 2012 | | | 17.24 | | | | 0.21 | (f) | | | (0.15 | ) | | | 0.06 | | | | (0.06 | ) | | | (0.01 | ) | | | (0.07 | ) |
January 31, 2011 (m) through June 30, 2011 | | | 16.36 | | | | 0.05 | (f) | | | 0.83 | | | | 0.88 | | | | — | | | | — | | | | — | |
| |
Select Class | | | | | |
Six Months Ended December 31, 2013 (Unaudited) | | | 20.69 | | | | 0.04 | (f)(g) | | | 3.67 | | | | 3.71 | | | | (0.05 | ) | | | (2.71 | ) | | | (2.76 | ) |
Year Ended June 30, 2013 | | | 17.18 | | | | 0.20 | (f)(h) | | | 3.69 | | | | 3.89 | | | | (0.17 | ) | | | (0.21 | ) | | | (0.38 | ) |
Year Ended June 30, 2012 | | | 17.22 | | | | 0.13 | (f) | | | (0.12 | ) | | | 0.01 | | | | (0.04 | ) | | | (0.01 | ) | | | (0.05 | ) |
November 30, 2010 (j) through June 30, 2011 | | | 15.00 | | | | 0.04 | (f) | | | 2.19 | | | | 2.23 | | | | (0.01 | ) | | | — | | | | (0.01 | ) |
| (a) | Annualized for periods less than one year. |
| (b) | Not annualized for periods less than one year. |
| (c) | Includes adjustments in accordance with accounting principles generally accepted in the United States of America and as such, the net asset values for financial reporting purposes and the returns based upon those net asset values may differ from the net asset values and returns for shareholder transactions. |
| (d) | Includes earnings credits and interest expense, if applicable, each of which is less than 0.01% unless otherwise noted. |
| (e) | Portfolio turnover is calculated by dividing the lesser of total purchases or sales of portfolio securities for the reporting period by the monthly average value of portfolio securities owned during the reporting period. Excluded from both the numerator and denominator are amounts relating to derivatives and securities whose maturities or expiration dates at the time of acquisition were one year or less. |
| (f) | Calculated based upon average shares outstanding. |
| (g) | Reflects special dividends paid out during the period by several of the Fund’s holdings. Had the Fund not received the special dividends, the net investment income (loss) per share would have been $0.00, $(0.05), $(0.02), $0.05, $0.06 and $0.04 for Class A, Class C, Class R2, Class R5, Class R6 and Select Class Shares, respectively, and the net investment income (loss) ratio would have been 0.03%, (0.44)%, (0.21)%, 0.47%, 0.52% and 0.36% for Class A, Class C, Class R2, Class R5, Class R6 and Select Class Shares, respectively. |
| (h) | Reflects special dividends paid out during the period by several of the Fund’s holdings. Had the Fund not received the special dividends, the net investment income (loss) per share would have been $0.06, $(0.05), $0.01, $0.13, $0.15 and $0.11 for Class A, Class C, Class R2, Class R5, Class R6 and Select Class Shares, respectively, and the net investment income (loss) ratio would have been 0.32%, (0.29)%, 0.03%, 0.70%, 0.77% and 0.56% for Class A, Class C, Class R2, Class R5, Class R6 and Select Class Shares, respectively. |
| (i) | Amount rounds to less than $0.01. |
| (j) | Commencement of operations. |
| (k) | Certain non-recurring expenses incurred by the Fund were not annualized for the period ended June 30, 2011. |
| (l) | Ratios are disproportionate between classes due to the size of net assets and fixed expense. |
| (m) | Commencement of offering of class of shares. |
SEE NOTES TO FINANCIAL STATEMENTS.
| | | | | | |
| | | |
| 68 | | | | J.P. MORGAN MID CAP/MULTI-CAP FUNDS | | DECEMBER 31, 2013 |
| | | | | | | | | | | | | | | | | | | | | | | | | | |
| | | Ratios/Supplemental data | |
| | | | | | | | | | Ratios to average net assets (a) | | | | |
Net asset
value,
end of
period | | | Total return
(excludes
sales charge) (b)(c) | | | Net assets,
end of
period
(000’s) | | | Net
expenses (d) | | | Net
investment
income
(loss) | | | Expenses
without waivers,
reimbursements and
earnings credits | | | Portfolio
turnover
rate (b)(e) | |
| | | | | | | | | | | | | | | | | | | | | | | | | | |
| | | | | | | | | | | | | | | | | | | | | | | | | | |
| $ | 21.53 | | | | 18.38 | % | | $ | 40,331 | | | | 1.25 | % | | | 0.05 | %(g) | | | 1.28 | % | | | 32 | % |
| | 20.60 | | | | 22.57 | | | | 28,329 | | | | 1.24 | | | | 0.80 | (h) | | | 1.28 | | | | 159 | |
| | 17.16 | | | | (0.13 | ) | | | 455 | | | | 1.24 | | | | 0.50 | | | | 1.31 | | | | 44 | |
| | 17.19 | | | | 14.70 | | | | 276 | | | | 1.24 | (k) | | | 0.11 | (k) | | | 5.79 | (k)(l) | | | 13 | |
| | | | | | |
| | | | | | | | | | | | | | | | | | | | | | | | | | |
| | 21.34 | | | | 18.09 | | | | 1,525 | | | | 1.75 | | | | (0.41 | )(g) | | | 1.78 | | | | 32 | |
| | 20.49 | | | | 22.00 | | | | 422 | | | | 1.74 | | | | 0.20 | (h) | | | 1.78 | | | | 159 | |
| | 17.03 | | | | (0.65 | ) | | | 125 | | | | 1.74 | | | | (0.02 | ) | | | 1.81 | | | | 44 | |
| | 17.15 | | | | 14.33 | | | | 99 | | | | 1.75 | (k) | | | (0.39 | )(k) | | | 6.49 | (k)(l) | | | 13 | |
| | | | | | |
| | | | | | | | | | | | | | | | | | | | | | | | | | |
| | 21.44 | | | | 18.21 | | | | 441 | | | | 1.50 | | | | (0.19 | )(g) | | | 1.53 | | | | 32 | |
| | 20.55 | | | | 22.24 | | | | 210 | | | | 1.49 | | | | 0.51 | (h) | | | 1.53 | | | | 159 | |
| | 17.10 | | | | (0.36 | ) | | | 57 | | | | 1.49 | | | | 0.22 | | | | 1.57 | | | | 44 | |
| | 17.17 | | | | 14.53 | | | | 57 | | | | 1.49 | (k) | | | (0.17 | )(k) | | | 6.84 | (k)(l) | | | 13 | |
| | | | | | |
| | | | | | | | | | | | | | | | | | | | | | | | | | |
| | 21.69 | | | | 18.65 | | | | 84 | | | | 0.80 | | | | 0.49 | (g) | | | 0.83 | | | | 32 | |
| | 20.75 | | | | 23.13 | | | | 71 | | | | 0.79 | | | | 1.19 | (h) | | | 0.83 | | | | 159 | |
| | 17.23 | | | | 0.33 | | | | 58 | | | | 0.79 | | | | 0.92 | | | | 0.86 | | | | 44 | |
| | 17.23 | | | | 15.00 | | | | 57 | | | | 0.80 | (k) | | | 0.52 | (k) | | | 6.17 | (k)(l) | | | 13 | |
| | | | | | |
| | | | | | | | | | | | | | | | | | | | | | | | | | |
| | 21.68 | | | | 18.65 | | | | 581,842 | | | | 0.75 | | | | 0.55 | (g) | | | 0.78 | | | | 32 | |
| | 20.75 | | | | 23.19 | | | | 401,578 | | | | 0.74 | | | | 1.26 | (h) | | | 0.78 | | | | 159 | |
| | 17.23 | | | | 0.33 | | | | 28,251 | | | | 0.74 | | | | 1.18 | | | | 0.78 | | | | 44 | |
| | 17.24 | | | | 5.38 | | | | 53 | | | | 0.75 | (k) | | | 0.68 | (k) | | | 5.52 | (k)(l) | | | 13 | |
| | | | | | |
| | | | | | | | | | | | | | | | | | | | | | | | | | |
| | 21.64 | | | | 18.60 | | | | 405,078 | | | | 0.90 | | | | 0.39 | (g) | | | 1.03 | | | | 32 | |
| | 20.69 | | | | 22.97 | | | | 432,810 | | | | 0.95 | | | | 1.05 | (h) | | | 1.03 | | | | 159 | |
| | 17.18 | | | | 0.06 | | | | 320,576 | | | | 0.99 | | | | 0.76 | | | | 1.06 | | | | 44 | |
| | 17.22 | | | | 14.84 | | | | 91,240 | | | | 1.00 | (k) | | | 0.41 | (k) | | | 3.41 | (k)(l) | | | 13 | |
SEE NOTES TO FINANCIAL STATEMENTS.
| | | | | | | | |
| | | |
| DECEMBER 31, 2013 | | J.P. MORGAN MID CAP/MULTI-CAP FUNDS | | | | | 69 | |
FINANCIAL HIGHLIGHTS
FOR THE PERIODS INDICATED (continued)
| | | | | | | | | | | | | | | | | | | | | | | | | | | | |
| | | | | | Per share operating performance | |
| | | | | | Investment operations | | | Distributions | |
| | | Net asset
value,
beginning
of period | | | Net
investment
income
(loss) | | | Net realized
and unrealized
gains
(losses) on
investments | | | Total from
investment
operations | | | Net
investment
income | | | Net
realized
gain | | | Total
distributions | |
Mid Cap Equity Fund | |
Class A | |
Six Months Ended December 31, 2013 (Unaudited) | | $ | 38.10 | | | $ | 0.01 | (f)(g) | | $ | 6.83 | | | $ | 6.84 | | | $ | (0.02 | ) | | $ | (3.38 | ) | | $ | (3.40 | ) |
Year Ended June 30, 2013 | | | 30.97 | | | | 0.10 | (f)(h) | | | 7.36 | | | | 7.46 | | | | (0.07 | ) | | | (0.26 | ) | | | (0.33 | ) |
Year Ended June 30, 2012 | | | 31.29 | | | | 0.10 | (f)(i) | | | (0.34 | ) | | | (0.24 | ) | | | (0.08 | ) | | | — | | | | (0.08 | ) |
Year Ended June 30, 2011 | | | 22.95 | | | | 0.04 | (f) | | | 8.36 | | | | 8.40 | | | | (0.06 | ) | | | — | | | | (0.06 | ) |
November 2, 2009 (j) through June 30, 2010 | | | 21.55 | | | | 0.05 | | | | 1.41 | | | | 1.46 | | | | (0.06 | ) | | | — | | | | (0.06 | ) |
|
Class C | |
Six Months Ended December 31, 2013 (Unaudited) | | | 37.71 | | | | (0.09 | )(f)(g) | | | 6.75 | | | | 6.66 | | | | — | | | | (3.38 | ) | | | (3.38 | ) |
Year Ended June 30, 2013 | | | 30.75 | | | | (0.07 | )(f)(h) | | | 7.29 | | | | 7.22 | | | | — | (k) | | | (0.26 | ) | | | (0.26 | ) |
Year Ended June 30, 2012 | | | 31.16 | | | | (0.05 | )(f)(i) | | | (0.35 | ) | | | (0.40 | ) | | | (0.01 | ) | | | — | | | | (0.01 | ) |
Year Ended June 30, 2011 | | | 22.93 | | | | (0.12 | )(f) | | | 8.37 | | | | 8.25 | | | | (0.02 | ) | | | — | | | | (0.02 | ) |
November 2, 2009 (j) through June 30, 2010 | | | 21.55 | | | | (0.03 | ) | | | 1.41 | | | | 1.38 | | | | — | (k) | | | — | | | | — | (k) |
|
Select Class | |
Six Months Ended December 31, 2013 (Unaudited) | | | 38.22 | | | | 0.08 | (f)(g) | | | 6.87 | | | | 6.95 | | | | (0.07 | ) | | | (3.38 | ) | | | (3.45 | ) |
Year Ended June 30, 2013 | | | 31.05 | | | | 0.20 | (f)(h) | | | 7.40 | | | | 7.60 | | | | (0.17 | ) | | | (0.26 | ) | | | (0.43 | ) |
Year Ended June 30, 2012 | | | 31.36 | | | | 0.19 | (f)(i) | | | (0.33 | ) | | | (0.14 | ) | | | (0.17 | ) | | | — | | | | (0.17 | ) |
Year Ended June 30, 2011 | | | 22.97 | | | | 0.14 | (f) | | | 8.37 | | | | 8.51 | | | | (0.12 | ) | | | — | | | | (0.12 | ) |
Year Ended June 30, 2010 | | | 18.97 | | | | 0.12 | | | | 4.00 | | | | 4.12 | | | | (0.12 | ) | | | — | | | | (0.12 | ) |
Year Ended June 30, 2009 | | | 28.63 | | | | 0.18 | | | | (8.37 | ) | | | (8.19 | ) | | | (0.17 | ) | | | (1.30 | ) | | | (1.47 | ) |
| (a) | Annualized for periods less than one year. |
| (b) | Not annualized for periods less than one year. |
| (c) | Includes adjustments in accordance with accounting principles generally accepted in the United States of America and as such, the net asset values for financial reporting purposes and the returns based upon those net asset values may differ from the net asset values and returns for shareholder transactions. |
| (d) | Includes earnings credits and interest expense, if applicable, each of which is less than 0.01% unless otherwise noted. |
| (e) | Portfolio turnover is calculated by dividing the lesser of total purchases or sales of portfolio securities for the reporting period by the monthly average value of portfolio securities owned during the reporting period. Excluded from both the numerator and denominator are amounts relating to derivatives and securities whose maturities or expiration dates at the time of acquisition were one year or less. |
| (f) | Calculated based upon average shares outstanding. |
| (g) | Reflects special dividends paid out during the period by several of the Fund’s holdings. Had the Fund not received the special dividends, the net investment income (loss) per share would have been $0.01, $(0.10), and $0.07 for Class A, Class C and Select Class Shares, respectively, and the net investment income (loss) ratio would have been 0.04%, (0.46)% and 0.36% for Class A, Class C and Select Class Shares, respectively. |
| (h) | Reflects special dividends paid out during the period by several of the Fund’s holdings. Had the Fund not received the special dividends, the net investment income (loss) per share would have been $0.03, $(0.14) and $0.14 for Class A, Class C and Select Class Shares, respectively, and the net investment income (loss) ratio would have been 0.09%, (0.39)% and 0.39% for Class A, Class C and Select Class Shares, respectively. |
| (i) | Reflects a special dividend paid out during the period by one of the Fund’s holdings. Had the Fund not received the special dividend, the net investment income (loss) per share would have been $0.05, $(0.10) and $0.14 for Class A, Class C and Select Class Shares, respectively, and the net investment income (loss) ratio would have been 0.18%, (0.33)% and 0.48% for Class A, Class C and Select Class Shares, respectively. |
| (j) | Commencement of offering of class of shares. |
| (k) | Amount rounds to less than $0.01. |
SEE NOTES TO FINANCIAL STATEMENTS.
| | | | | | |
| | | |
| 70 | | | | J.P. MORGAN MID CAP/MULTI-CAP FUNDS | | DECEMBER 31, 2013 |
| | | | | | | | | | | | | | | | | | | | | | | | | | |
| | | Ratios/Supplemental data | |
| | | | | | | | | | Ratios to average net assets (a) | | | | |
Net asset
value,
end of
period | | | Total return
(excludes
sales charge) (b)(c) | | | Net assets,
end of
period
(000’s) | | | Net
expenses (d) | | | Net
investment
income
(loss) | | | Expenses
without waivers,
reimbursements and
earnings credits | | | Portfolio
turnover
rate (b)(e) | |
| | | | | | | | | | | | | | | | | | | | | | | | | | |
| | | | | | | | | | | | | | | | | | | | | | | | | | |
| $ | 41.54 | | | | 18.36 | % | | $ | 60,527 | | | | 1.24 | % | | | 0.07 | %(g) | | | 1.47 | % | | | 30 | % |
| | 38.10 | | | | 24.23 | | | | 21,171 | | | | 1.24 | | | | 0.27 | (h) | | | 1.49 | | | | 67 | |
| | 30.97 | | | | (0.76 | ) | | | 6,965 | | | | 1.24 | | | | 0.34 | (i) | | | 1.54 | | | | 55 | |
| | 31.29 | | | | 36.60 | | | | 2,918 | | | | 1.24 | | | | 0.14 | | | | 1.53 | | | | 88 | |
| | 22.95 | | | | 6.77 | | | | 1,394 | | | | 1.24 | | | | 0.30 | | | | 1.44 | | | | 56 | |
| | | | | | |
| | | | | | | | | | | | | | | | | | | | | | | | | | |
| | 40.99 | | | | 18.06 | | | | 15,258 | | | | 1.74 | | | | (0.44 | )(g) | | | 1.97 | | | | 30 | |
| | 37.71 | | | | 23.60 | | | | 6,136 | | | | 1.74 | | | | (0.21 | )(h) | | | 2.00 | | | | 67 | |
| | 30.75 | | | | (1.29 | ) | | | 1,244 | | | | 1.75 | | | | (0.18 | )(i) | | | 2.03 | | | | 55 | |
| | 31.16 | | | | 35.98 | | | | 447 | | | | 1.74 | | | | (0.40 | ) | | | 2.06 | | | | 88 | |
| | 22.93 | | | | 6.40 | | | | 65 | | | | 1.74 | | | | (0.23 | ) | | | 1.92 | | | | 56 | |
| | | | | | |
| | | | | | | | | | | | | | | | | | | | | | | | | | |
| | 41.72 | | | | 18.59 | | | | 1,192,880 | | | | 0.89 | | | | 0.38 | (g) | | | 1.22 | | | | 30 | |
| | 38.22 | | | | 24.64 | | | | 932,920 | | | | 0.89 | | | | 0.57 | (h) | | | 1.23 | | | | 67 | |
| | 31.05 | | | | (0.42 | ) | | | 813,125 | | | | 0.89 | | | | 0.64 | (i) | | | 1.30 | | | | 55 | |
| | 31.36 | | | | 37.09 | | | | 568,854 | | | | 0.89 | | | | 0.50 | | | | 1.27 | | | | 88 | |
| | 22.97 | | | | 21.72 | | | | 463,478 | | | | 0.89 | | | | 0.55 | | | | 1.17 | | | | 56 | |
| | 18.97 | | | | (28.02 | ) | | | 195,785 | | | | 0.90 | | | | 0.94 | | | | 1.20 | | | | 107 | |
SEE NOTES TO FINANCIAL STATEMENTS.
| | | | | | | | |
| | | |
| DECEMBER 31, 2013 | | J.P. MORGAN MID CAP/MULTI-CAP FUNDS | | | | | 71 | |
FINANCIAL HIGHLIGHTS
FOR THE PERIODS INDICATED (continued)
| | | | | | | | | | | | | | | | | | | | |
| | | | | | Per share operating performance | |
| | | | | | Investment operations | | | Distributions | |
| | | Net asset
value,
beginning
of period | | | Net
investment
income
(loss) | | | Net realized
and unrealized
gains
(losses) on
investments | | | Total from
investment
operations | | | Net
realized
gain | |
Mid Cap Growth Fund | |
Class A | | | | | | | | | | | | | | | | | | | | |
Six Months Ended December 31, 2013 (Unaudited) | | $ | 22.99 | | | $ | (0.05 | )(f)(g) | | $ | 5.18 | | | $ | 5.13 | | | $ | (2.79 | ) |
Year Ended June 30, 2013 | | | 19.52 | | | | (0.04 | )(f)(h) | | | 4.50 | | | | 4.46 | | | | (0.99 | ) |
Year Ended June 30, 2012 | | | 23.30 | | | | (0.05 | )(f)(i) | | | (1.72 | ) | | | (1.77 | ) | | | (2.01 | ) |
Year Ended June 30, 2011 | | | 16.35 | | | | (0.09 | )(f) | | | 7.04 | | | | 6.95 | | | | — | |
Year Ended June 30, 2010 | | | 13.68 | | | | (0.09 | )(f) | | | 2.76 | | | | 2.67 | | | | — | |
Year Ended June 30, 2009 | | | 20.46 | | | | (0.07 | )(f) | | | (6.33 | ) | | | (6.40 | ) | | | (0.38 | ) |
| | | | | |
Class B | | | | | | | | | | | | | | | | | | | | |
Six Months Ended December 31, 2013 (Unaudited) | | | 17.00 | | | | (0.08 | )(f)(g) | | | 3.79 | | | | 3.71 | | | | (2.79 | ) |
Year Ended June 30, 2013 | | | 14.76 | | | | (0.11 | )(f)(h) | | | 3.34 | | | | 3.23 | | | | (0.99 | ) |
Year Ended June 30, 2012 | | | 18.29 | | | | (0.12 | )(f)(i) | | | (1.40 | ) | | | (1.52 | ) | | | (2.01 | ) |
Year Ended June 30, 2011 | | | 12.90 | | | | (0.16 | )(f) | | | 5.55 | | | | 5.39 | | | | — | |
Year Ended June 30, 2010 | | | 10.85 | | | | (0.14 | )(f) | | | 2.19 | | | | 2.05 | | | | — | |
Year Ended June 30, 2009 | | | 16.45 | | | | (0.13 | )(f) | | | (5.09 | ) | | | (5.22 | ) | | | (0.38 | ) |
| | | | | |
Class C | | | | | | | | | | | | | | | | | | | | |
Six Months Ended December 31, 2013 (Unaudited) | | | 19.97 | �� | | | (0.10 | )(f)(g) | | | 4.49 | | | | 4.39 | | | | (2.79 | ) |
Year Ended June 30, 2013 | | | 17.17 | | | | (0.12 | )(f)(h) | | | 3.91 | | | | 3.79 | | | | (0.99 | ) |
Year Ended June 30, 2012 | | | 20.88 | | | | (0.13 | )(f)(i) | | | (1.57 | ) | | | (1.70 | ) | | | (2.01 | ) |
Year Ended June 30, 2011 | | | 14.73 | | | | (0.18 | )(f) | | | 6.33 | | | | 6.15 | | | | — | |
Year Ended June 30, 2010 | | | 12.39 | | | | (0.16 | )(f) | | | 2.50 | | | | 2.34 | | | | — | |
Year Ended June 30, 2009 | | | 18.70 | | | | (0.15 | )(f) | | | (5.78 | ) | | | (5.93 | ) | | | (0.38 | ) |
| | | | | |
Class R2 | | | | | | | | | | | | | | | | | | | | |
Six Months Ended December 31, 2013 (Unaudited) | | | 24.56 | | | | (0.08 | )(f)(g) | | | 5.55 | | | | 5.47 | | | | (2.79 | ) |
Year Ended June 30, 2013 | | | 20.83 | | | | (0.07 | )(f)(h) | | | 4.79 | | | | 4.72 | | | | (0.99 | ) |
Year Ended June 30, 2012 | | | 24.73 | | | | (0.07 | )(f)(i) | | | (1.82 | ) | | | (1.89 | ) | | | (2.01 | ) |
Year Ended June 30, 2011 | | | 17.38 | | | | (0.13 | )(f) | | | 7.48 | | | | 7.35 | | | | — | |
Year Ended June 30, 2010 | | | 14.56 | | | | (0.12 | )(f) | | | 2.94 | | | | 2.82 | | | | — | |
June 19, 2009 (j) through June 30, 2009 | | | 14.56 | | | | — | (f)(k) | | | — | (k) | | | — | (k) | | | — | |
| | | | | |
Class R5 | | | | | | | | | | | | | | | | | | | | |
Six Months Ended December 31, 2013 (Unaudited) | | | 25.15 | | | | — | (f)(g)(k) | | | 5.70 | | | | 5.70 | | | | (2.79 | ) |
Year Ended June 30, 2013 | | | 21.18 | | | | 0.06 | (f)(h) | | | 4.90 | | | | 4.96 | | | | (0.99 | ) |
November 1, 2011 (j) through June 30, 2012 | | | 21.75 | | | | 0.04 | (f)(i) | | | 1.40 | | | | 1.44 | | | | (2.01 | ) |
| | | | | |
Class R6 | | | | | | | | | | | | | | | | | | | | |
Six Months Ended December 31, 2013 (Unaudited) | | | 25.17 | | | | 0.01 | (f)(g) | | | 5.70 | | | | 5.71 | | | | (2.79 | ) |
Year Ended June 30, 2013 | | | 21.19 | | | | 0.08 | (f)(h) | | | 4.89 | | | | 4.97 | | | | (0.99 | ) |
November 1, 2011 (j) through June 30, 2012 | | | 21.75 | | | | 0.08 | (f)(i) | | | 1.37 | | | | 1.45 | | | | (2.01 | ) |
| | | | | |
Select Class | | | | | | | | | | | | | | | | | | | | |
Six Months Ended December 31, 2013 (Unaudited) | | | 25.08 | | | | (0.01 | )(f)(g) | | | 5.68 | | | | 5.67 | | | | (2.79 | ) |
Year Ended June 30, 2013 | | | 21.15 | | | | 0.03 | (f)(h) | | | 4.89 | | | | 4.92 | | | | (0.99 | ) |
Year Ended June 30, 2012 | | | 24.97 | | | | 0.02 | (f)(i) | | | (1.83 | ) | | | (1.81 | ) | | | (2.01 | ) |
Year Ended June 30, 2011 | | | 17.47 | | | | (0.03 | )(f) | | | 7.53 | | | | 7.50 | | | | — | |
Year Ended June 30, 2010 | | | 14.57 | | | | (0.04 | )(f) | | | 2.94 | | | | 2.90 | | | | — | |
Year Ended June 30, 2009 | | | 21.68 | | | | (0.03 | )(f) | | | (6.70 | ) | | | (6.73 | ) | | | (0.38 | ) |
| (a) | Annualized for periods less than one year. |
| (b) | Not annualized for periods less than one year. |
| (c) | Includes adjustments in accordance with accounting principles generally accepted in the United States of America and as such, the net asset values for financial reporting purposes and the returns based upon those net asset values may differ from the net asset values and returns for shareholder transactions. |
| (d) | Includes earnings credits and interest expense, if applicable, each of which is less than 0.01% unless otherwise noted. |
| (e) | Portfolio turnover is calculated by dividing the lesser of total purchases or sales of portfolio securities for the reporting period by the monthly average value of portfolio securities owned during the reporting period. Excluded from both the numerator and denominator are amounts relating to derivatives and securities whose maturities or expiration dates at the time of acquisition were one year or less. |
| (f) | Calculated based upon average shares outstanding. |
| (g) | Reflects special dividends paid out during the period by several of the Fund’s holdings. Had the Fund not received the special dividends, the net investment income (loss) per share would have been $(0.06), $(0.09), $(0.11), $(0.09), $(0.00), $0.01 and $(0.02) for Class A, Class B, Class C, Class R2, Class R5, Class R6 and Select Class Shares, respectively, and the net investment income (loss) ratio would have been (0.46)%, (0.93)%, (0.95)%, (0.62)%, (0.01)%, 0.09% and (0.15)% for Class A, Class B, Class C, Class R2, Class R5, Class R6 and Select Class Shares, respectively. |
SEE NOTES TO FINANCIAL STATEMENTS.
| | | | | | |
| | | |
| 72 | | | | J.P. MORGAN MID CAP/MULTI-CAP FUNDS | | DECEMBER 31, 2013 |
| | | | | | | | | | | | | | | | | | | | | | | | | | |
| | | Ratios/Supplemental data | |
| | | | | | | | | | Ratios to average net assets (a) | | | | |
Net asset
value,
end of
period | | | Total return
(excludes
sales charge) (b)(c) | | | Net assets,
end of
period
(000’s) | | | Net
expenses (d) | | | Net
investment
income
(loss) | | | Expenses
without waivers,
reimbursements and
earnings credits | | | Portfolio
turnover
rate (b)(e) | |
| | | | | | | | | | | | | | | | | | | | | | | | | | |
| | | | | | | | | | | | | | | | | | | | | | | | | | |
| $ | 25.33 | | | | 22.95 | % | | $ | 698,868 | | | | 1.23 | % | | | (0.42 | )%(g) | | | 1.41 | % | | | 41 | % |
| | 22.99 | | | | 23.70 | | | | 586,787 | | | | 1.23 | | | | (0.17 | )(h) | | | 1.45 | | | | 70 | |
| | 19.52 | | | | (6.61 | ) | | | 538,323 | | | | 1.24 | | | | (0.23 | )(i) | | | 1.38 | | | | 70 | |
| | 23.30 | | | | 42.51 | | | | 696,334 | | | | 1.24 | | | | (0.44 | ) | | | 1.36 | | | | 79 | |
| | 16.35 | | | | 19.52 | | | | 560,054 | | | | 1.24 | | | | (0.53 | ) | | | 1.42 | | | | 82 | |
| | 13.68 | | | | (30.97 | ) | | | 520,201 | | | | 1.24 | | | | (0.48 | ) | | | 1.56 | | | | 96 | |
| | | | | | |
| | | | | | | | | | | | | | | | | | | | | | | | | | |
| | 17.92 | | | | 22.68 | | | | 6,948 | | | | 1.70 | | | | (0.89 | )(g) | | | 1.91 | | | | 41 | |
| | 17.00 | | | | 22.99 | | | | 6,923 | | | | 1.73 | | | | (0.69 | )(h) | | | 1.94 | | | | 70 | |
| | 14.76 | | | | (7.08 | ) | | | 9,948 | | | | 1.75 | | | | (0.77 | )(i) | | | 1.88 | | | | 70 | |
| | 18.29 | | | | 41.78 | | | | 18,648 | | | | 1.77 | | | | (0.97 | ) | | | 1.86 | | | | 79 | |
| | 12.90 | | | | 18.89 | | | | 20,893 | | | | 1.77 | | | | (1.07 | ) | | | 1.92 | | | | 82 | |
| | 10.85 | | | | (31.35 | ) | | | 29,963 | | | | 1.88 | | | | (1.14 | ) | | | 2.03 | | | | 96 | |
| | | | | | |
| | | | | | | | | | | | | | | | | | | | | | | | | | |
| | 21.57 | | | | 22.67 | | | | 29,739 | | | | 1.72 | | | | (0.91 | )(g) | | | 1.91 | | | | 41 | |
| | 19.97 | | | | 23.03 | | | | 23,745 | | | | 1.73 | | | | (0.67 | )(h) | | | 1.95 | | | | 70 | |
| | 17.17 | | | | (7.06 | ) | | | 22,190 | | | | 1.75 | | | | (0.75 | )(i) | | | 1.88 | | | | 70 | |
| | 20.88 | | | | 41.75 | | | | 29,187 | | | | 1.77 | | | | (0.97 | ) | | | 1.86 | | | | 79 | |
| | 14.73 | | | | 18.89 | | | | 23,389 | | | | 1.77 | | | | (1.06 | ) | | | 1.92 | | | | 82 | |
| | 12.39 | | | | (31.38 | ) | | | 25,624 | | | | 1.88 | | | | (1.13 | ) | | | 2.04 | | | | 96 | |
| | | | | | |
| | | | | | | | | | | | | | | | | | | | | | | | | | |
| | 27.24 | | | | 22.87 | | | | 631 | | | | 1.39 | | | | (0.58 | )(g) | | | 1.66 | | | | 41 | |
| | 24.56 | | | | 23.46 | | | | 320 | | | | 1.39 | | | | (0.32 | )(h) | | | 1.71 | | | | 70 | |
| | 20.83 | | | | (6.72 | ) | | | 230 | | | | 1.40 | | | | (0.35 | )(i) | | | 1.63 | | | | 70 | |
| | 24.73 | | | | 42.29 | | | | 121 | | | | 1.40 | | | | (0.59 | ) | | | 1.60 | | | | 79 | |
| | 17.38 | | | | 19.37 | | | | 63 | | | | 1.40 | | | | (0.69 | ) | | | 1.67 | | | | 82 | |
| | 14.56 | | | | 0.00 | | | | 83 | | | | 1.22 | | | | (0.31 | ) | | | 1.94 | | | | 96 | |
| | | | | | |
| | | | | | | | | | | | | | | | | | | | | | | | | | |
| | 28.06 | | | | 23.26 | | | | 25,345 | | | | 0.79 | | | | 0.03 | (g) | | | 0.96 | | | | 41 | |
| | 25.15 | | | | 24.22 | | | | 17,848 | | | | 0.79 | | | | 0.28 | (h) | | | 1.00 | | | | 70 | |
| | 21.18 | | | | 7.71 | | | | 14,837 | | | | 0.78 | | | | 0.31 | (i) | | | 0.92 | | | | 70 | |
| | | | | | |
| | | | | | | | | | | | | | | | | | | | | | | | | | |
| | 28.09 | | | | 23.27 | | | | 59,986 | | | | 0.74 | | | | 0.08 | (g) | | | 0.91 | | | | 41 | |
| | 25.17 | | | | 24.26 | | | | 47,434 | | | | 0.74 | | | | 0.34 | (h) | | | 0.98 | | | | 70 | |
| | 21.19 | | | | 7.76 | | | | 13,982 | | | | 0.73 | | | | 0.58 | (i) | | | 0.87 | | | | 70 | |
| | | | | | |
| | | | | | | | | | | | | | | | | | | | | | | | | | |
| | 27.96 | | | | 23.16 | | | | 1,086,666 | | | | 0.92 | | | | (0.11 | )(g) | | | 1.16 | | | | 41 | |
| | 25.08 | | | | 24.06 | | | | 894,740 | | | | 0.93 | | | | 0.14 | (h) | | | 1.20 | | | | 70 | |
| | 21.15 | | | | (6.31 | ) | | | 827,306 | | | | 0.93 | | | | 0.09 | (i) | | | 1.13 | | | | 70 | |
| | 24.97 | | | | 42.93 | | | | 1,031,463 | | | | 0.93 | | | | (0.13 | ) | | | 1.10 | | | | 79 | |
| | 17.47 | | | | 19.90 | | | | 685,843 | | | | 0.93 | | | | (0.22 | ) | | | 1.17 | | | | 82 | |
| | 14.57 | | | | (30.74 | ) | | | 631,380 | | | | 0.98 | | | | (0.23 | ) | | | 1.30 | | | | 96 | |
| (h) | Reflects special dividends paid out during the period by several of the Fund’s holdings. Had the Fund not received the special dividends, the net investment income (loss) per share would have been $(0.09), $(0.15), $(0.17), $(0.13), $0.01, $0.02 and $(0.02) for Class A, Class B, Class C, Class R2, Class R5, Class R6 and Select Class Shares, respectively, and the net investment income (loss) ratio would have been (0.42)%, (0.94)%, (0.92)%, (0.57)%, 0.04%, 0.09% and (0.10)% for Class A, Class B, Class C, Class R2, Class R5, Class R6 and Select Class Shares, respectively. |
| (i) | Reflects a special dividend paid out during the period by one of the Fund’s holdings. Had the Fund not received the special dividend, the net investment income (loss) per share would have been $(0.09), $(0.15), $(0.17), $(0.12), less than $0.01, $0.03 and $(0.03) for Class A, Class B, Class C, Class R2, Class R5, Class R6 and Select Class Shares, respectively, and the net investment income (loss) ratio would have been (0.46)%, (0.99)%, (0.97)%, (0.57)%, (0.03)%, 0.24% and (0.14)% for Class A, Class B, Class C, Class R2, Class R5, Class R6 and Select Class Shares, respectively. |
| (j) | Commencement of offering of class of shares. |
| (k) | Amount rounds to less than $0.01. |
SEE NOTES TO FINANCIAL STATEMENTS.
| | | | | | | | |
| | | |
| DECEMBER 31, 2013 | | J.P. MORGAN MID CAP/MULTI-CAP FUNDS | | | | | 73 | |
FINANCIAL HIGHLIGHTS
FOR THE PERIODS INDICATED (continued)
| | | | | | | | | | | | | | | | | | | | | | | | | | | | |
| | | | | | Per share operating performance | |
| | | | | | Investment operations | | | Distributions | |
| | | Net asset value,
beginning
of period | | | Net
investment
income
(loss) | | | Net realized
and unrealized
gains
(losses) on
investments | | | Total from
investment
operations | | | Net
investment
income | | | Net
realized
gain | | | Total
distributions | |
Mid Cap Value Fund | | | | | | | | | | | | | | | | | | | | | | | | | |
Class A | | | | | | | | | | | | | | | | | | | | | | | | | |
Six Months Ended December 31, 2013 (Unaudited) | | $ | 31.68 | | | $ | 0.08 | (f) | | $ | 4.36 | | | $ | 4.44 | | | $ | (0.15 | ) | | $ | (1.45 | ) | | $ | (1.60 | ) |
Year Ended June 30, 2013 | | | 25.80 | | | | 0.19 | (f)(g) | | | 6.20 | | | | 6.39 | | | | (0.29 | ) | | | (0.22 | ) | | | (0.51 | ) |
Year Ended June 30, 2012 | | | 24.76 | | | | 0.20 | (f) | | | 1.00 | | | | 1.20 | | | | (0.16 | ) | | | — | | | | (0.16 | ) |
Year Ended June 30, 2011 | | | 18.91 | | | | 0.18 | (f) | | | 5.85 | | | | 6.03 | | | | (0.18 | ) | | | — | | | | (0.18 | ) |
Year Ended June 30, 2010 | | | 15.24 | | | | 0.19 | (f) | | | 3.48 | | | | 3.67 | | | | — | | | | — | | | | — | |
Year Ended June 30, 2009 | | | 21.91 | | | | 0.28 | (f) | | | (5.92 | ) | | | (5.64 | ) | | | (0.34 | ) | | | (0.69 | ) | | | (1.03 | ) |
| | | | | | |
Class B | | | | | | | | | | | | | | | | | | | | | | | | | |
Six Months Ended December 31, 2013 (Unaudited) | | | 31.05 | | | | — | (f)(h) | | | 4.27 | | | | 4.27 | | | | — | | | | (1.45 | ) | | | (1.45 | ) |
Year Ended June 30, 2013 | | | 25.16 | | | | 0.03 | (f)(g) | | | 6.08 | | | | 6.11 | | | | — | | | | (0.22 | ) | | | (0.22 | ) |
Year Ended June 30, 2012 | | | 24.10 | | | | 0.07 | (f) | | | 0.99 | | | | 1.06 | | | | — | | | | — | | | | — | |
Year Ended June 30, 2011 | | | 18.38 | | | | 0.07 | (f) | | | 5.69 | | | | 5.76 | | | | (0.04 | ) | | | — | | | | (0.04 | ) |
Year Ended June 30, 2010 | | | 14.89 | | | | 0.10 | (f) | | | 3.39 | | | | 3.49 | | | | — | | | | — | | | | — | |
Year Ended June 30, 2009 | | | 21.39 | | | | 0.20 | (f) | | | (5.79 | ) | | | (5.59 | ) | | | (0.22 | ) | | | (0.69 | ) | | | (0.91 | ) |
| | | | | | |
Class C | | | | | | | | | | | | | | | | | | | | | | | | | |
Six Months Ended December 31, 2013 (Unaudited) | | | 30.84 | | | | — | (f)(h) | | | 4.23 | | | | 4.23 | | | | — | (h) | | | (1.45 | ) | | | (1.45 | ) |
Year Ended June 30, 2013 | | | 25.14 | | | | 0.05 | (f)(g) | | | 6.03 | | | | 6.08 | | | | (0.16 | ) | | | (0.22 | ) | | | (0.38 | ) |
Year Ended June 30, 2012 | | | 24.13 | | | | 0.07 | (f) | | | 0.98 | | | | 1.05 | | | | (0.04 | ) | | | — | | | | (0.04 | ) |
Year Ended June 30, 2011 | | | 18.44 | | | | 0.07 | (f) | | | 5.69 | | | | 5.76 | | | | (0.07 | ) | | | — | | | | (0.07 | ) |
Year Ended June 30, 2010 | | | 14.94 | | | | 0.10 | (f) | | | 3.40 | | | | 3.50 | | | | — | | | | — | | | | — | |
Year Ended June 30, 2009 | | | 21.45 | | | | 0.20 | (f) | | | (5.80 | ) | | | (5.60 | ) | | | (0.22 | ) | | | (0.69 | ) | | | (0.91 | ) |
| | | | | | |
Class R2 | | | | | | | | | | | | | | | | | | | | | | | | | |
Six Months Ended December 31, 2013 (Unaudited) | | | 30.81 | | | | 0.04 | (f) | | | 4.23 | | | | 4.27 | | | | (0.10 | ) | | | (1.45 | ) | | | (1.55 | ) |
Year Ended June 30, 2013 | | | 25.18 | | | | 0.12 | (f)(g) | | | 6.03 | | | | 6.15 | | | | (0.30 | ) | | | (0.22 | ) | | | (0.52 | ) |
Year Ended June 30, 2012 | | | 24.27 | | | | 0.14 | (f) | | | 0.97 | | | | 1.11 | | | | (0.20 | ) | | | — | | | | (0.20 | ) |
Year Ended June 30, 2011 | | | 18.63 | | | | 0.12 | (f) | | | 5.76 | | | | 5.88 | | | | (0.24 | ) | | | — | | | | (0.24 | ) |
Year Ended June 30, 2010 | | | 15.06 | | | | 0.15 | (f) | | | 3.42 | | | | 3.57 | | | | — | | | | — | | | | — | |
November 3, 2008 (h) through June 30, 2009 | | | 16.34 | | | | 0.20 | (f) | | | (0.30 | ) | | | (0.10 | ) | | | (0.49 | ) | | | (0.69 | ) | | | (1.18 | ) |
| | | | | | |
Institutional Class | | | | | | | | | | | | | | | | | | | | | | | | | |
Six Months Ended December 31, 2013 (Unaudited) | | | 32.26 | | | | 0.17 | (f) | | | 4.45 | | | | 4.62 | | | | (0.31 | ) | | | (1.45 | ) | | | (1.76 | ) |
Year Ended June 30, 2013 | | | 26.24 | | | | 0.34 | (f)(g) | | | 6.31 | | | | 6.65 | | | | (0.41 | ) | | | (0.22 | ) | | | (0.63 | ) |
Year Ended June 30, 2012 | | | 25.19 | | | | 0.32 | (f) | | | 1.01 | | | | 1.33 | | | | (0.28 | ) | | | — | | | | (0.28 | ) |
Year Ended June 30, 2011 | | | 19.22 | | | | 0.30 | (f) | | | 5.95 | | | | 6.25 | | | | (0.28 | ) | | | — | | | | (0.28 | ) |
Year Ended June 30, 2010 | | | 15.43 | | | | 0.29 | (f) | | | 3.52 | | | | 3.81 | | | | (0.02 | ) | | | — | | | | (0.02 | ) |
Year Ended June 30, 2009 | | | 22.31 | | | | 0.38 | (f) | | | (6.06 | ) | | | (5.68 | ) | | | (0.51 | ) | | | (0.69 | ) | | | (1.20 | ) |
| | | | | | |
Select Class | | | | | | | | | | | | | | | | | | | | | | | | | |
Six Months Ended December 31, 2013 (Unaudited) | | | 31.95 | | | | 0.13 | (f) | | | 4.40 | | | | 4.53 | | | | (0.22 | ) | | | (1.45 | ) | | | (1.67 | ) |
Year Ended June 30, 2013 | | | 26.01 | | | | 0.27 | (f)(g) | | | 6.24 | | | | 6.51 | | | | (0.35 | ) | | | (0.22 | ) | | | (0.57 | ) |
Year Ended June 30, 2012 | | | 24.97 | | | | 0.26 | (f) | | | 1.01 | | | | 1.27 | | | | (0.23 | ) | | | — | | | | (0.23 | ) |
Year Ended June 30, 2011 | | | 19.07 | | | | 0.24 | (f) | | | 5.90 | | | | 6.14 | | | | (0.24 | ) | | | — | | | | (0.24 | ) |
Year Ended June 30, 2010 | | | 15.34 | | | | 0.24 | (f) | | | 3.49 | | | | 3.73 | | | | — | (i) | | | — | | | | — | (i) |
Year Ended June 30, 2009 | | | 22.14 | | | | 0.34 | (f) | | | (6.01 | ) | | | (5.67 | ) | | | (0.44 | ) | | | (0.69 | ) | | | (1.13 | ) |
| (a) | Annualized for periods less than one year. |
| (b) | Not annualized for periods less than one year. |
| (c) | Includes adjustments in accordance with accounting principles generally accepted in the United States of America and as such, the net asset values for financial reporting purposes and the returns based upon those net asset values may differ from the net asset values and returns for shareholder transactions. |
| (d) | Includes earnings credits and interest expense, if applicable, each of which is less than 0.01% unless otherwise noted. |
| (e) | Portfolio turnover is calculated by dividing the lesser of total purchases or sales of portfolio securities for the reporting period by the monthly average value of portfolio securities owned during the reporting period. Excluded from both the numerator and denominator are amounts relating to derivatives and securities whose maturities or expiration dates at the time of acquisition were one year or less. |
SEE NOTES TO FINANCIAL STATEMENTS.
| | | | | | |
| | | |
| 74 | | | | J.P. MORGAN MID CAP/MULTI-CAP FUNDS | | DECEMBER 31, 2013 |
| | | | | | | | | | | | | | | | | | | | | | | | | | |
| | | Ratios/Supplemental data | |
| | | | | | | | | | Ratios to average net assets (a) | | | | |
Net asset
value,
end of
period | | | Total return
(excludes
sales charge) (b)(c) | | | Net assets,
end of
period
(000’s) | | | Net
expenses (d) | | | Net
investment
income
(loss) | | | Expenses
without waivers,
reimbursements and
earnings credits | | | Portfolio
turnover
rate (b)(e) | |
| | | | | | | | | | | | | | | | | | | | | | | | | | |
| | | | | | | | | | | | | | | | | | | | | | | | | | |
| $ | 34.52 | | | | 14.22 | % | | $ | 3,333,576 | | | | 1.23 | % | | | 0.50 | % | | | 1.36 | % | | | 12 | % |
| | 31.68 | | | | 25.06 | | | | 3,157,503 | | | | 1.23 | | | | 0.67 | (g) | | | 1.38 | | | | 23 | |
| | 25.80 | | | | 4.92 | | | | 1,986,930 | | | | 1.24 | | | | 0.83 | | | | 1.41 | | | | 30 | |
| | 24.76 | | | | 31.96 | | | | 1,979,270 | | | | 1.23 | | | | 0.81 | | | | 1.39 | | | | 41 | |
| | 18.91 | | | | 24.08 | | | | 1,705,572 | | | | 1.23 | | | | 1.04 | | | | 1.40 | | | | 34 | |
| | 15.24 | | | | (25.49 | ) | | | 1,600,044 | | | | 1.25 | | | | 1.71 | | | | 1.42 | | | | 47 | |
| | | | | | |
| | | | | | | | | | | | | | | | | | | | | | | | | | |
| | 33.87 | | | | 13.95 | | | | 12,570 | | | | 1.71 | | | | 0.00 | (j) | | | 1.86 | | | | 12 | |
| | 31.05 | | | | 24.42 | | | | 15,382 | | | | 1.74 | | | | 0.13 | (g) | | | 1.88 | | | | 23 | |
| | 25.16 | | | | 4.40 | | | | 57,100 | | | | 1.75 | | | | 0.30 | | | | 1.91 | | | | 30 | |
| | 24.10 | | | | 31.33 | | | | 90,427 | | | | 1.74 | | | | 0.30 | | | | 1.89 | | | | 41 | |
| | 18.38 | | | | 23.44 | | | | 96,966 | | | | 1.74 | | | | 0.53 | | | | 1.90 | | | | 34 | |
| | 14.89 | | | | (25.89 | ) | | | 108,114 | | | | 1.75 | | | | 1.21 | | | | 1.92 | | | | 47 | |
| | | | | | |
| | | | | | | | | | | | | | | | | | | | | | | | | | |
| | 33.62 | | | | 13.93 | | | | 589,548 | | | | 1.74 | | | | (0.01 | ) | | | 1.86 | | | | 12 | |
| | 30.84 | | | | 24.43 | | | | 534,813 | | | | 1.74 | | | | 0.16 | (g) | | | 1.88 | | | | 23 | |
| | 25.14 | | | | 4.38 | | | | 370,781 | | | | 1.75 | | | | 0.32 | | | | 1.91 | | | | 30 | |
| | 24.13 | | | | 31.29 | | | | 373,415 | | | | 1.74 | | | | 0.30 | | | | 1.89 | | | | 41 | |
| | 18.44 | | | | 23.43 | | | | 309,513 | | | | 1.74 | | | | 0.53 | | | | 1.90 | | | | 34 | |
| | 14.94 | | | | (25.88 | ) | | | 299,956 | | | | 1.75 | | | | 1.20 | | | | 1.92 | | | | 47 | |
| | | | | | |
| | | | | | | | | | | | | | | | | | | | | | | | | | |
| | 33.53 | | | | 14.07 | | | | 67,511 | | | | 1.49 | | | | 0.25 | | | | 1.61 | | | | 12 | |
| | 30.81 | | | | 24.71 | | | | 57,003 | | | | 1.49 | | | | 0.43 | (g) | | | 1.63 | | | | 23 | |
| | 25.18 | | | | 4.65 | | | | 14,824 | | | | 1.49 | | | | 0.59 | | | | 1.66 | | | | 30 | |
| | 24.27 | | | | 31.66 | | | | 6,500 | | | | 1.49 | | | | 0.50 | | | | 1.65 | | | | 41 | |
| | 18.63 | | | | 23.71 | | | | 1,441 | | | | 1.49 | | | | 0.77 | | | | 1.65 | | | | 34 | |
| | 15.06 | | | | (0.24 | ) | | | 294 | | | | 1.50 | | | | 2.12 | | | | 1.69 | | | | 47 | |
| | | | | | |
| | | | | | | | | | | | | | | | | | | | | | | | | | |
| | 35.12 | | | | 14.52 | | | | 8,027,191 | | | | 0.74 | | | | 1.00 | | | | 0.96 | | | | 12 | |
| | 32.26 | | | | 25.68 | | | | 6,627,529 | | | | 0.74 | | | | 1.16 | (g) | | | 0.98 | | | | 23 | |
| | 26.24 | | | | 5.43 | | | | 3,543,900 | | | | 0.74 | | | | 1.33 | | | | 1.01 | | | | 30 | |
| | 25.19 | | | | 32.66 | | | | 2,812,296 | | | | 0.74 | | | | 1.29 | | | | 0.99 | | | | 41 | |
| | 19.22 | | | | 24.68 | | | | 1,913,930 | | | | 0.74 | | | | 1.52 | | | | 1.00 | | | | 34 | |
| | 15.43 | | | | (25.15 | ) | | | 1,424,004 | | | | 0.75 | | | | 2.26 | | | | 1.02 | | | | 47 | |
| | | | | | |
| | | | | | | | | | | | | | | | | | | | | | | | | | |
| | 34.81 | | | | 14.39 | | | | 2,795,357 | | | | 0.98 | | | | 0.74 | | | | 1.11 | | | | 12 | |
| | 31.95 | | | | 25.35 | | | | 2,870,752 | | | | 0.98 | | | | 0.92 | (g) | | | 1.13 | | | | 23 | |
| | 26.01 | | | | 5.20 | | | | 1,836,012 | | | | 0.98 | | | | 1.09 | | | | 1.16 | | | | 30 | |
| | 24.97 | | | | 32.29 | | | | 1,513,926 | | | | 0.98 | | | | 1.05 | | | | 1.14 | | | | 41 | |
| | 19.07 | | | | 24.35 | | | | 1,061,308 | | | | 0.98 | | | | 1.29 | | | | 1.15 | | | | 34 | |
| | 15.34 | | | | (25.31 | ) | | | 766,965 | | | | 1.00 | | | | 2.05 | | | | 1.18 | | | | 47 | |
| (f) | Calculated based upon average shares outstanding. |
| (g) | Reflects special dividends paid out during the period by several of the Fund’s holdings. Had the Fund not received the special dividends the net investment income (loss) per share would have been $0.16, $0.00, $0.01, $0.09, $0.31 and $0.23 for Class A, Class B, Class C, Class R2, Institutional Class and Select Class Shares, respectively, and the net investment income (loss) ratio would have been 0.55%, 0.00%, 0.04%, 0.31%, 1.04% and 0.80% for Class A, Class B, Class C, Class R2, Institutional Class and Select Class Shares, respectively. |
| (h) | Commencement of offering of class of shares. |
| (i) | Amount rounds to less than $0.01. |
SEE NOTES TO FINANCIAL STATEMENTS.
| | | | | | | | |
| | | |
| DECEMBER 31, 2013 | | J.P. MORGAN MID CAP/MULTI-CAP FUNDS | | | | | 75 | |
FINANCIAL HIGHLIGHTS
FOR THE PERIODS INDICATED (continued)
| | | | | | | | | | | | | | | | |
| | | | | | Per share operating performance | |
| | | | | | Distributions | |
| | | Net asset
value,
beginning
of period | | | Net
investment
income
(loss) | | |
Net realized
and unrealized
gains
(losses) on
investments | | | Total from
investment
operations | |
Multi-Cap Market Neutral Fund | | | | | | | | | | | | | | | | |
Class A | | | | | | | | | | | | | | | | |
Six Months Ended December 31, 2013 (Unaudited) | | $ | 9.79 | | | $ | (0.06 | )(g) | | $ | 0.20 | | | $ | 0.14 | |
Year Ended June 30, 2013 | | | 9.69 | | | | (0.11 | )(g)(h) | | | 0.21 | | | | 0.10 | |
Year Ended June 30, 2012 | | | 9.81 | | | | (0.14 | )(g) | | | 0.02 | | | | (0.12 | ) |
Year Ended June 30, 2011 | | | 9.71 | | | | (0.16 | )(g) | | | 0.26 | | | | 0.10 | |
Year Ended June 30, 2010 | | | 10.21 | | | | (0.17 | )(g) | | | (0.33 | ) | | | (0.50 | ) |
Year Ended June 30, 2009 | | | 10.23 | | | | (0.08 | )(g) | | | 0.06 | | | | (0.02 | ) |
| | | | |
Class B | | | | | | | | | | | | | | | | |
Six Months Ended December 31, 2013 (Unaudited) | | | 9.31 | | | | (0.08 | )(g) | | | 0.20 | | | | 0.12 | |
Year Ended June 30, 2013 | | | 9.29 | | | | (0.17 | )(g)(h) | | | 0.19 | | | | 0.02 | |
Year Ended June 30, 2012 | | | 9.47 | | | | (0.20 | )(g) | | | 0.02 | | | | (0.18 | ) |
Year Ended June 30, 2011 | | | 9.44 | | | | (0.23 | )(g) | | | 0.26 | | | | 0.03 | |
Year Ended June 30, 2010 | | | 10.01 | | | | (0.23 | )(g) | | | (0.34 | ) | | | (0.57 | ) |
Year Ended June 30, 2009 | | | 10.10 | | | | (0.15 | )(g) | | | 0.06 | | | | (0.09 | ) |
| | | | |
Class C | | | | | | | | | | | | | | | | |
Six Months Ended December 31, 2013 (Unaudited) | | | 9.33 | | | | (0.08 | )(g) | | | 0.19 | | | | 0.11 | |
Year Ended June 30, 2013 | | | 9.30 | | | | (0.17 | )(g)(h) | | | 0.20 | | | | 0.03 | |
Year Ended June 30, 2012 | | | 9.48 | | | | (0.20 | )(g) | | | 0.02 | | | | (0.18 | ) |
Year Ended June 30, 2011 | | | 9.46 | | | | (0.23 | )(g) | | | 0.25 | | | | 0.02 | |
Year Ended June 30, 2010 | | | 10.02 | | | | (0.23 | )(g) | | | (0.33 | ) | | | (0.56 | ) |
Year Ended June 30, 2009 | | | 10.12 | | | | (0.15 | )(g) | | | 0.05 | | | | (0.10 | ) |
| | | | |
Select Class | | | | | | | | | | | | | | | | |
Six Months Ended December 31, 2013 (Unaudited) | | | 9.94 | | | | (0.05 | )(h) | | | 0.21 | | | | 0.16 | |
Year Ended June 30, 2013 | | | 9.82 | | | | (0.09 | )(g)(h) | | | 0.21 | | | | 0.12 | |
Year Ended June 30, 2012 | | | 9.91 | | | | (0.12 | )(g) | | | 0.03 | | | | (0.09 | ) |
Year Ended June 30, 2011 | | | 9.79 | | | | (0.14 | )(g) | | | 0.26 | | | | 0.12 | |
Year Ended June 30, 2010 | | | 10.27 | | | | (0.14 | )(g) | | | (0.34 | ) | | | (0.48 | ) |
Year Ended June 30, 2009 | | | 10.27 | | | | (0.05 | )(g) | | | 0.05 | | | | — | (i) |
| (a) | Annualized for periods less than one year. |
| (b) | Not annualized for periods less than one year. |
| (c) | Includes adjustments in accordance with accounting principles generally accepted in the United States of America and as such, the net asset values for financial reporting purposes and the returns based upon those net asset values may differ from the net asset values and returns for shareholder transactions. |
| (d) | Includes earnings credits and interest expense, if applicable, each of which is less than 0.01% unless otherwise noted. |
| (e) | The net expenses and expenses without waivers, reimbursements and earnings credits (excluding dividend expense and interest expense for securities sold short) for Class A are 1.49% and 1.93% for the six months ended December 31, 2013, 1.48% and 1.88% for the year ended June 30, 2013, 1.48% and 1.94% for 2012, 1.49 and 1.95% for 2011, 1.49% and 1.94% for 2010 and 1.50% and 1.95% for 2009; for Class B are 1.99% and 2.43 for the six months ended December 31, 2013, 2.16% and 2.38% for the year ended June 30, 2013, 2.23% and 2.45% for 2012, 2.24% and 2.45% for 2011, 2.24% and 2.44% for 2010 and 2.25% and 2.45% for 2009; for Class C are 1.99% and 2.43 for the six months ended December 31, 2013, 1.99% and 2.43% for the year ended June 30, 2013, 2.23% and 2.44% for 2012, 2.24% and 2.45% for 2011, 2.24% and 2.44% for 2010 and 2.25% and 2.45% for 2009; for Select Class are 1.23% and 1.67% for the six months ended December 31, 2013, 1.23% and 1.63% for the year ended June 30, 2013, 1.23% and 1.69% for 2012, 1.24% and 1.70% for 2011, 1.24% and 1.69% for 2010 and 1.25% and 1.70% for 2009, respectively. |
| (f) | Portfolio turnover is calculated by dividing the lesser of total purchases or sales of portfolio securities for the reporting period by the monthly average value of portfolio securities owned during the reporting period. Excluded from both the numerator and denominator are amounts relating to derivatives and securities whose maturities or expiration dates at the time of acquisition were one year or less. |
| (g) | Calculated based upon average shares outstanding. |
| (h) | Reflects special dividends paid out during the period by several of the Fund’s holdings. Had the Fund not received the special dividends, the net investment income (loss) per share would have been $(0.13), $(0.19), $(0.19) and $(0.11) for Class A, Class B, Class C and Select Class Shares, respectively, and the net investment income (loss) ratio would have been (1.38)%, (2.07)%, (2.06)% and (1.16)% for Class A, Class B, Class C and Select Class Shares, respectively. |
| (i) | Amount rounds to less than $0.01. |
SEE NOTES TO FINANCIAL STATEMENTS.
| | | | | | |
| | | |
| 76 | | | | J.P. MORGAN MID CAP/MULTI-CAP FUNDS | | DECEMBER 31, 2013 |
| | | | | | | | | | | | | | | | | | | | | | | | | | | | | | |
| | | Ratios/Supplemental data | |
| | | | | | | | | | Ratios to average net assets (a) | | | | | | | |
Net asset
value,
end of
period | | | Total return
(excludes
sales charge) (b)(c) | | | Net assets,
end of
period
(000’s) | | | Net expenses
(including
dividend and
interest
expense for
securities sold
short) (d)(e) | | | Net
investment
income
(loss) | | | Expenses
without waivers,
reimbursements and
earnings credits
(including dividend
and interest expense
for securities sold
short) (e) | | | Portfolio
turnover rate
(excluding short
sales) (b)(f) | | | Portfolio
turnover rate
(including short
sales) (b)(f) | |
| | | | | | | | | | | | | | | | | | | | | | | | | | | | | | |
| | | | | | | | | | | | | | | | | | | | | | | | | | | | | | |
| $ | 9.93 | | | | 1.43 | % | | $ | 13,110 | | | | 2.77 | % | | | (1.26 | )% | | | 3.21 | % | | | 56 | % | | | 129 | % |
| | 9.79 | | | | 1.03 | | | | 14,101 | | | | 3.04 | | | | (1.13 | )(h) | | | 3.44 | | | | 94 | | | | 251 | |
| | 9.69 | | | | (1.22 | ) | | | 19,759 | | | | 2.86 | | | | (1.42 | ) | | | 3.32 | | | | 151 | | | | 316 | |
| | 9.81 | | | | 1.03 | | | | 29,216 | | | | 2.92 | | | | (1.65 | ) | | | 3.38 | | | | 145 | | | | 339 | |
| | 9.71 | | | | (4.90 | ) | | | 94,549 | | | | 2.94 | | | | (1.65 | ) | | | 3.39 | | | | 146 | | | | 348 | |
| | 10.21 | | | | (0.20 | ) | | | 67,884 | | | | 2.84 | | | | (0.79 | ) | | | 3.29 | | | | 175 | | | | 350 | |
| | | | | | | |
| | | | | | | | | | | | | | | | | | | | | | | | | | | | | | |
| | 9.43 | | | | 1.29 | | | | 252 | | | | 3.27 | | | | (1.74 | ) | | | 3.71 | | | | 56 | | | | 129 | |
| | 9.31 | | | | 0.22 | | | | 530 | | | | 3.70 | | | | (1.82 | )(h) | | | 3.92 | | | | 94 | | | | 251 | |
| | 9.29 | | | | (1.90 | ) | | | 1,401 | | | | 3.61 | | | | (2.18 | ) | | | 3.83 | | | | 151 | | | | 316 | |
| | 9.47 | | | | 0.32 | | | | 3,484 | | | | 3.67 | | | | (2.47 | ) | | | 3.88 | | | | 145 | | | | 339 | |
| | 9.44 | | | | (5.69 | ) | | | 7,849 | | | | 3.69 | | | | (2.39 | ) | | | 3.89 | | | | 146 | | | | 348 | |
| | 10.01 | | | | (0.89 | ) | | | 12,766 | | | | 3.59 | | | | (1.55 | ) | | | 3.79 | | | | 175 | | | | 350 | |
| | | | | | | |
| | | | | | | | | | | | | | | | | | | | | | | | | | | | | | |
| | 9.44 | | | | 1.18 | | | | 9,738 | | | | 3.27 | | | | (1.76 | ) | | | 3.71 | | | | 56 | | | | 129 | |
| | 9.33 | | | | 0.32 | | | | 11,181 | | | | 3.69 | | | | (1.81 | )(h) | | | 3.92 | | | | 94 | | | | 251 | |
| | 9.30 | | | | (1.90 | ) | | | 15,677 | | | | 3.61 | | | | (2.17 | ) | | | 3.82 | | | | 151 | | | | 316 | |
| | 9.48 | | | | 0.21 | | | | 22,094 | | | | 3.67 | | | | (2.46 | ) | | | 3.88 | | | | 145 | | | | 339 | |
| | 9.46 | | | | (5.59 | ) | | | 39,610 | | | | 3.70 | | | | (2.39 | ) | | | 3.89 | | | | 146 | | | | 348 | |
| | 10.02 | | | | (0.99 | ) | | | 61,467 | | | | 3.59 | | | | (1.54 | ) | | | 3.79 | | | | 175 | | | | 350 | |
| | | | | | | |
| | | | | | | | | | | | | | | | | | | | | | | | | | | | | | |
| | 10.10 | | | | 1.61 | | | | 399,019 | | | | 2.51 | | | | (1.03 | ) | | | 2.95 | | | | 56 | | | | 129 | |
| | 9.94 | | | | 1.22 | | | | 317,974 | | | | 2.78 | | | | (0.90 | )(h) | | | 3.18 | | | | 94 | | | | 251 | |
| | 9.82 | | | | (0.91 | ) | | | 476,803 | | | | 2.61 | | | | (1.17 | ) | | | 3.07 | | | | 151 | | | | 316 | |
| | 9.91 | | | | 1.23 | | | | 491,653 | | | | 2.67 | | | | (1.39 | ) | | | 3.13 | | | | 145 | | | | 339 | |
| | 9.79 | | | | (4.67 | ) | | | 433,539 | | | | 2.70 | | | | (1.39 | ) | | | 3.15 | | | | 146 | | | | 348 | |
| | 10.27 | | | | 0.00 | | | | 528,478 | | | | 2.59 | | | | (0.45 | ) | | | 3.04 | | | | 175 | | | | 350 | |
SEE NOTES TO FINANCIAL STATEMENTS.
| | | | | | | | |
| | | |
| DECEMBER 31, 2013 | | J.P. MORGAN MID CAP/MULTI-CAP FUNDS | | | | | 77 | |
FINANCIAL HIGHLIGHTS
FOR THE PERIODS INDICATED (continued)
| | | | | | | | | | | | | | | | | | | | | | | | | | | | |
| | | | | | Per share operating performance | |
| | | | | | Investment operations | | | Distributions | |
| | | Net asset
value,
beginning
of period | | | Net
investment
income
(loss) | | | Net realized
and unrealized
gains
(losses) on
investments | | | Total from
investment
operations | | | Net
investment
income | | | Net
realized
gain | | | Total
distributions | |
Value Advantage Fund | |
Class A | |
Six Months Ended December 31, 2013 (Unaudited) | | $ | 24.64 | | | $ | 0.11 | (f) | | $ | 3.17 | | | $ | 3.28 | | | $ | (0.16 | ) | | $ | (0.70 | ) | | $ | (0.86 | ) |
Year Ended June 30, 2013 | | | 19.96 | | | | 0.22 | (f) | | | 4.75 | | | | 4.97 | | | | (0.20 | ) | | | (0.09 | ) | | | (0.29 | ) |
Year Ended June 30, 2012 | | | 19.07 | | | | 0.25 | (f) | | | 0.84 | | | | 1.09 | | | | (0.20 | ) | | | — | | | | (0.20 | ) |
Year Ended June 30, 2011 | | | 15.22 | | | | 0.23 | (f) | | | 3.79 | | | | 4.02 | | | | (0.17 | ) | | | — | | | | (0.17 | ) |
Year Ended June 30, 2010 | | | 12.01 | | | | 0.23 | (f) | | | 3.17 | | | | 3.40 | | | | (0.19 | ) | | | — | | | | (0.19 | ) |
Year Ended June 30, 2009 | | | 16.38 | | | | 0.30 | (f) | | | (4.40 | ) | | | (4.10 | ) | | | (0.20 | ) | | | (0.07 | ) | | | (0.27 | ) |
| | | | | | | |
Class C | | | | | | | | | | | | | | | | | | | | | | | | | | | | |
Six Months Ended December 31, 2013 (Unaudited) | | | 24.61 | | | | 0.05 | (f) | | | 3.16 | | | | 3.21 | | | | (0.05 | ) | | | (0.70 | ) | | | (0.75 | ) |
Year Ended June 30, 2013 | | | 19.91 | | | | 0.11 | (f) | | | 4.74 | | | | 4.85 | | | | (0.06 | ) | | | (0.09 | ) | | | (0.15 | ) |
Year Ended June 30, 2012 | | | 19.01 | | | | 0.16 | (f) | | | 0.84 | | | | 1.00 | | | | (0.10 | ) | | | — | | | | (0.10 | ) |
Year Ended June 30, 2011 | | | 15.17 | | | | 0.14 | (f) | | | 3.77 | | | | 3.91 | | | | (0.07 | ) | | | — | | | | (0.07 | ) |
Year Ended June 30, 2010 | | | 11.97 | | | | 0.15 | (f) | | | 3.17 | | | | 3.32 | | | | (0.12 | ) | | | — | | | | (0.12 | ) |
Year Ended June 30, 2009 | | | 16.25 | | | | 0.23 | (f) | | | (4.34 | ) | | | (4.11 | ) | | | (0.10 | ) | | | (0.07 | ) | | | (0.17 | ) |
| | | | | | | |
Institutional Class | | | | | | | | | | | | | | | | | | | | | | | | | | | | |
Six Months Ended December 31, 2013 (Unaudited) | | | 24.74 | | | | 0.18 | (f) | | | 3.18 | | | | 3.36 | | | | (0.25 | ) | | | (0.70 | ) | | | (0.95 | ) |
Year Ended June 30, 2013 | | | 19.99 | | | | 0.34 | (f) | | | 4.75 | | | | 5.09 | | | | (0.25 | ) | | | (0.09 | ) | | | (0.34 | ) |
Year Ended June 30, 2012 | | | 19.11 | | | | 0.35 | (f) | | | 0.83 | | | | 1.18 | | | | (0.30 | ) | | | — | | | | (0.30 | ) |
Year Ended June 30, 2011 | | | 15.24 | | | | 0.32 | (f) | | | 3.79 | | | | 4.11 | | | | (0.24 | ) | | | — | | | | (0.24 | ) |
Year Ended June 30, 2010 | | | 12.01 | | | | 0.31 | (f) | | | 3.18 | | | | 3.49 | | | | (0.26 | ) | | | — | | | | (0.26 | ) |
Year Ended June 30, 2009 | | | 16.40 | | | | 0.37 | (f) | | | (4.42 | ) | | | (4.05 | ) | | | (0.27 | ) | | | (0.07 | ) | | | (0.34 | ) |
| | | | | | | |
Select Class | | | | | | | | | | | | | | | | | | | | | | | | | | | | |
Six Months Ended December 31, 2013 (Unaudited) | | | 24.72 | | | | 0.15 | (f) | | | 3.17 | | | | 3.32 | | | | (0.20 | ) | | | (0.70 | ) | | | (0.90 | ) |
Year Ended June 30, 2013 | | | 20.00 | | | | 0.28 | (f) | | | 4.75 | | | | 5.03 | | | | (0.22 | ) | | | (0.09 | ) | | | (0.31 | ) |
Year Ended June 30, 2012 | | | 19.12 | | | | 0.30 | (f) | | | 0.83 | | | | 1.13 | | | | (0.25 | ) | | | — | | | | (0.25 | ) |
Year Ended June 30, 2011 | | | 15.27 | | | | 0.28 | (f) | | | 3.79 | | | | 4.07 | | | | (0.22 | ) | | | — | | | | (0.22 | ) |
Year Ended June 30, 2010 | | | 12.04 | | | | 0.27 | (f) | | | 3.19 | | | | 3.46 | | | | (0.23 | ) | | | — | | | | (0.23 | ) |
Year Ended June 30, 2009 | | | 16.44 | | | | 0.34 | (f) | | | (4.42 | ) | | | (4.08 | ) | | | (0.25 | ) | | | (0.07 | ) | | | (0.32 | ) |
| (a) | Annualized for periods less than one year. |
| (b) | Not annualized for periods less than one year. |
| (c) | Includes adjustments in accordance with accounting principles generally accepted in the United States of America and as such, the net asset values for financial reporting purposes and the returns based upon those net asset values may differ from the net asset values and returns for shareholder transactions. |
| (d) | Includes earnings credits and interest expense, if applicable, each of which is less than 0.01% unless otherwise noted. |
| (e) | Portfolio turnover is calculated by dividing the lesser of total purchases or sales of portfolio securities for the reporting period by the monthly average value of portfolio securities owned during the reporting period. Excluded from both the numerator and denominator are amounts relating to derivatives and securities whose maturities or expiration dates at the time of acquisition were one year or less. |
| (f) | Calculated based upon average shares outstanding. |
SEE NOTES TO FINANCIAL STATEMENTS.
| | | | | | |
| | | |
| 78 | | | | J.P. MORGAN MID CAP/MULTI-CAP FUNDS | | DECEMBER 31, 2013 |
| | | | | | | | | | | | | | | | | | | | | | | | | | |
| | | Ratios/Supplemental data | |
| | | | | | | | | | Ratios to average net assets (a) | | | | |
Net asset
value,
end of
period | | | Total return
(excludes
sales charge) (b)(c) | | | Net assets,
end of
period
(000’s) | | | Net
expenses (d) | | | Net
investment
income
(loss) | | | Expenses
without waivers,
reimbursements and
earnings credits | | | Portfolio
turnover
rate (b)(e) | |
| | | | | | | | | | | | | | | | | | | | | | | | | | |
| | | | | | | | | | | | | | | | | | | | | | | | | | |
| $ | 27.06 | | | | 13.43 | % | | $ | 1,212,340 | | | | 1.24 | % | | | 0.85 | % | | | 1.33 | % | | | 21 | % |
| | 24.64 | | | | 25.09 | | | | 784,359 | | | | 1.24 | | | | 0.98 | | | | 1.33 | | | | 22 | |
| | 19.96 | | | | 5.83 | | | | 206,816 | | | | 1.25 | | | | 1.34 | | | | 1.41 | | | | 49 | |
| | 19.07 | | | | 26.45 | | | | 232,103 | | | | 1.24 | | | | 1.28 | | | | 1.34 | | | | 33 | |
| | 15.22 | | | | 28.35 | | | | 150,081 | | | | 1.24 | | | | 1.52 | | | | 1.38 | | | | 45 | |
| | 12.01 | | | | (24.82 | ) | | | 112,739 | | | | 1.25 | | | | 2.45 | | | | 1.50 | | | | 70 | |
| | | | | | |
| | | | | | | | | | | | | | | | | | | | | | | | | | |
| | 27.07 | | | | 13.18 | | | | 293,855 | | | | 1.74 | | | | 0.35 | | | | 1.83 | | | | 21 | |
| | 24.61 | | | | 24.45 | | | | 212,198 | | | | 1.74 | | | | 0.49 | | | | 1.83 | | | | 22 | |
| | 19.91 | | | | 5.32 | | | | 117,937 | | | | 1.75 | | | | 0.84 | | | | 1.91 | | | | 49 | |
| | 19.01 | | | | 25.82 | | | | 131,743 | | | | 1.74 | | | | 0.78 | | | | 1.84 | | | | 33 | |
| | 15.17 | | | | 27.72 | | | | 108,165 | | | | 1.74 | | | | 1.01 | | | | 1.88 | | | | 45 | |
| | 11.97 | | | | (25.19 | ) | | | 97,723 | | | | 1.75 | | | | 1.86 | | | | 1.99 | | | | 70 | |
| | | | | | |
| | | | | | | | | | | | | | | | | | | | | | | | | | |
| | 27.15 | | | | 13.72 | | | | 2,166,564 | | | | 0.74 | | | | 1.35 | | | | 0.93 | | | | 21 | |
| | 24.74 | | | | 25.73 | | | | 1,455,125 | | | | 0.74 | | | | 1.50 | | | | 0.93 | | | | 22 | |
| | 19.99 | | | | 6.36 | | | | 384,525 | | | | 0.75 | | | | 1.86 | | | | 1.01 | | | | 49 | |
| | 19.11 | | | | 27.06 | | | | 284,433 | | | | 0.74 | | | | 1.79 | | | | 0.94 | | | | 33 | |
| | 15.24 | | | | 29.03 | | | | 156,531 | | | | 0.74 | | | | 2.04 | | | | 0.98 | | | | 45 | |
| | 12.01 | | | | (24.41 | ) | | | 70,825 | | | | 0.75 | | | | 3.11 | | | | 1.15 | | | | 70 | |
| | | | | | |
| | | | | | | | | | | | | | | | | | | | | | | | | | |
| | 27.14 | | | | 13.57 | | | | 1,785,953 | | | | 0.99 | | | | 1.11 | | | | 1.08 | | | | 21 | |
| | 24.72 | | | | 25.38 | | | | 1,245,241 | | | | 0.99 | | | | 1.23 | | | | 1.08 | | | | 22 | |
| | 20.00 | | | | 6.09 | | | | 422,861 | | | | 1.00 | | | | 1.62 | | | | 1.16 | | | | 49 | |
| | 19.12 | | | | 26.75 | | | | 270,562 | | | | 0.99 | | | | 1.53 | | | | 1.09 | | | | 33 | |
| | 15.27 | | | | 28.70 | | | | 71,209 | | | | 0.99 | | | | 1.77 | | | | 1.13 | | | | 45 | |
| | 12.04 | | | | (24.62 | ) | | | 51,000 | | | | 1.00 | | | | 2.75 | | | | 1.25 | | | | 70 | |
SEE NOTES TO FINANCIAL STATEMENTS.
| | | | | | | | |
| | | |
| DECEMBER 31, 2013 | | J.P. MORGAN MID CAP/MULTI-CAP FUNDS | | | | | 79 | |
NOTES TO FINANCIAL STATEMENTS
AS OF DECEMBER 31, 2013 (Unaudited)
1. Organization
JPMorgan Trust I (“JPM I”) and JPMorgan Trust II (“JPM II”) were formed on November 12, 2004, as Delaware statutory trusts, pursuant to Declarations of Trust dated November 5, 2004 and are registered under the Investment Company Act of 1940, as amended (the “1940 Act”), as open-end management investment companies.
J.P. Morgan Mutual Fund Investment Trust (“JPMMFIT”), an open-end management investment company, was organized as a Massachusetts business trust on September 23, 1997.
J.P. Morgan Fleming Mutual Fund Group, Inc. (“JPMFMFG”, with JPM I, JPM II and JPMMFIT (the “Trusts”)), an open-end management investment company, was organized as a Maryland corporation on August 19, 1997.
The following are 7 separate funds of the Trusts (collectively, the “Funds”) covered by this report:
| | | | | | |
| | | Classes Offered | | Trust | | Diversified/Non-Diversified |
| Growth Advantage Fund | | Class A, Class B, Class C, Class R5, Class R6* and Select Class | | JPMMFIT | | Diversified |
| Mid Cap Core Fund | | Class A, Class C, Class R2, Class R5, Class R6 and Select Class | | JPM I | | Diversified |
| Mid Cap Equity Fund | | Class A, Class C, and Select Class | | JPM I | | Diversified |
| Mid Cap Growth Fund | | Class A, Class B, Class C, Class R2, Class R5, Class R6 and Select Class | | JPM II | | Diversified |
| Mid Cap Value Fund | | Class A, Class B, Class C, Class R2, Institutional Class and Select Class | | JPMFMFG | | Diversified |
| Multi-Cap Market Neutral Fund | | Class A, Class B, Class C, and Select Class | | JPM II | | Diversified |
| Value Advantage Fund | | Class A, Class C, Institutional Class and Select Class | | JPM I | | Diversified |
| * | Class R6 Shares of Growth Advantage Fund commenced operations on December 23, 2013. |
The investment objective of Growth Advantage Fund is to seek to provide long-term capital growth.
The investment objective of Mid Cap Core Fund is to seek long-term capital appreciation.
The investment objective of Mid Cap Equity Fund is to seek long-term capital growth.
The investment objective of Mid Cap Growth Fund is to seek growth of capital and secondarily, current income by investing primarily in equity securities.
The investment objective of Mid Cap Value Fund is to seek growth from capital appreciation.
The investment objective of Multi-Cap Market Neutral Fund is to seek long-term capital preservation and growth by using strategies designed to produce returns which have no correlation with general domestic market performance.
The investment objective of Value Advantage Fund is to seek to provide long-term total return from a combination of income and capital gains.
Effective as of the close of business on February 22, 2013, all share classes of the Mid Cap Value Fund are publicly offered only on a limited basis. Investors are not eligible to purchase shares of the Fund unless they meet certain requirements as described in the Classes’ prospectuses.
Effective November 1, 2009, Class B Shares of the Growth Advantage Fund, Mid Cap Growth Fund, Mid Cap Value Fund and Multi-Cap Market Neutral Fund may not be purchased or acquired by new or existing shareholders, except through exchanges from Class B Shares of another J.P. Morgan Fund and dividend reinvestments. Shareholders who invested in Class B Shares prior to November 1, 2009 may continue to hold their Class B Shares until they automatically convert to Class A Shares.
Class A Shares generally provide for a front-end sales charge while Class B and Class C Shares provide for a contingent deferred sales charge (“CDSC”). Class B Shares automatically convert to Class A Shares after eight years. No sales charges are assessed with respect to Class R2, Class R5, Class R6, Institutional Class and Select Class Shares. All classes of shares have equal rights as to earnings, assets and voting privileges, except that each class may bear different distribution and shareholder servicing fees and each class has exclusive voting rights with respect to its distribution plan and shareholder servicing agreements. Certain Class A Shares, for which front-end sales charges have been waived, may be subject to a CDSC as described in the Funds’ prospectus.
2. Significant Accounting Policies
The following is a summary of significant accounting policies followed by the Funds in the preparation of their financial statements. The policies are in accordance with accounting principles generally accepted in the United States of America (“GAAP”). The preparation of financial statements requires management to make estimates and assumptions that affect the reported amounts and disclosures in the financial statements. Actual results could differ from those estimates.
A. Valuation of Investments — Equity securities listed on a North American, Central American, South American or Caribbean securities exchange shall generally be valued at the last sale price on the exchange on which the security is principally traded that is reported before the time when the net assets of the Funds are valued. Securities listed on the NASDAQ Stock Market LLC are generally valued at the NASDAQ Official Closing Price. Generally, short-term investments of sufficient credit quality maturing in less than 61 days are valued at amortized cost, which approximates fair
| | | | | | |
| | | |
| 80 | | | | J.P. MORGAN MID CAP/MULTI-CAP FUNDS | | DECEMBER 31, 2013 |
value. Investments in open-end investment companies are valued at each investment company’s net asset value per share (“NAV”) as of the report date.
Certain investments of the Funds may, depending upon market conditions, trade in relatively thin markets and/or in markets that experience significant volatility. As a result of these conditions, the prices used by the Funds to value these securities may differ from the value that would be realized if these securities were sold, and the differences could be material. Futures and options are generally valued on the basis of available market quotations. Swaps and other derivatives are valued daily, primarily using independent or affiliated pricing services approved by the Board of Trustees. If valuations are not available from such pricing services or values received are deemed not representative of fair value, values will be obtained from a third party broker-dealer or counterparty.
Securities or other assets for which market quotations are not readily available or for which market quotations are deemed to not represent the fair value of the security or asset at the time of pricing (including certain illiquid securities) are fair valued in accordance with procedures established by and under the supervision and responsibility of the Board of Trustees. The Board of Trustees has established an Audit and Valuation Committee to assist with the oversight of the valuation of the Funds’ securities. JPMorgan Funds Management, Inc. (the “Administrator” or “JPMFM”), has established a Valuation Committee (“VC”) that is comprised of senior representatives from JPMFM, J.P. Morgan Investment Management Inc. (the “Adviser” or “JPMIM”), and J.P. Morgan Asset Management’s Legal, Compliance and Risk Management groups and the Funds’ Chief Compliance Officer. The VC’s responsibilities include making determinations regarding Level 3 fair value measurements (“Fair Values”) and/or providing recommendations for approval to the Board of Trustees’ Audit and Valuation Committee, in accordance with the Funds’ valuation policies.
The VC or Board of Trustees, as applicable, primarily employs a market-based approach which may use related or comparable assets or liabilities, recent transactions, market multiples, book values, and other relevant information for the investment to determine the fair value of the investment. The VC or Board of Trustees may also use an income-based valuation approach in which the anticipated future cash flows of the investment are discounted to calculate fair value. Discounts may also be applied due to the nature or duration of any restrictions on the disposition of the investments. Valuations may be based upon current market prices of securities that are comparable in coupon, rating, maturity and industry.
It is possible that the estimated values may differ significantly from the values that would have been used had a ready market for the investments existed, and such differences could be material. JPMFM and JPMIM are responsible for monitoring developments that may impact Fair Values and for discussing and assessing Fair Values on an ongoing, and at least a quarterly, basis with the VC and Board of Trustees, as applicable. The appropriateness of Fair Values is assessed based on results of unchanged price review and consideration of macro or security specific events, back testing, and broker and vendor due diligence.
Valuations reflected in this report are as of the report date. As a result, changes in valuation due to market events and/or issuer related events after the report date and prior to issuance of the report, are not reflected herein.
The various inputs that are used in determining the fair value of the Funds’ investments are summarized into the three broad levels listed below.
| Ÿ | | Level 1 — quoted prices in active markets for identical securities |
| Ÿ | | Level 2 — other significant observable inputs (including quoted prices for similar securities, interest rates, prepayment speeds, credit risk, etc.) |
| Ÿ | | Level 3 — significant unobservable inputs (including the Funds’ own assumptions in determining the fair value of investments) |
A financial instrument’s level within the fair value hierarchy is based on the lowest level of any input, both individually and in the aggregate, that is significant to the fair value measurement. The inputs or methodology used for valuing securities are not necessarily an indication of the risk associated with investing in those securities.
The following tables represent each valuation input as presented on the Schedules of Portfolio Investments (“SOIs”) (amounts in thousands):
Growth Advantage Fund
| | | | | | | | | | | | | | | | |
| | | Level 1
Quoted prices | | | Level 2
Other significant
observable inputs | | | Level 3
Significant
unobservable inputs | | | Total | |
Total Investments in Securities (a) | | $ | 2,957,880 | | | $ | — | | | $ | — | | | $ | 2,957,880 | |
| | | | | | | | | | | | | | | | |
| | | | |
| Mid Cap Core Fund | | | | | | | | | | | | | | | | |
| | | Level 1
Quoted prices | | | Level 2
Other significant
observable inputs | | | Level 3
Significant
unobservable inputs | | | Total | |
Total Investments in Securities (a) | | $ | 1,029,446 | | | $ | — | | | $ | — | | | $ | 1,029,446 | |
| | | | | | | | | | | | | | | | |
| | | | | | | | |
| | | |
| DECEMBER 31, 2013 | | J.P. MORGAN MID CAP/MULTI-CAP FUNDS | | | | | 81 | |
NOTES TO FINANCIAL STATEMENTS
AS OF DECEMBER 31, 2013 (Unaudited) (continued)
| | | | | | | | | | | | | | | | |
| Mid Cap Equity Fund | | | | | | | | | | | | | | | | |
| | | Level 1
Quoted prices | | | Level 2
Other significant
observable inputs | | | Level 3
Significant
unobservable inputs | | | Total | |
Total Investments in Securities (a) | | $ | 1,303,920 | | | $ | — | | | $ | — | | | $ | 1,303,920 | |
| | | | | | | | | | | | | | | | |
| | | | |
| Mid Cap Growth Fund | | | | | | | | | | | | | | | | |
| | | Level 1
Quoted prices | | | Level 2
Other significant
observable inputs | | | Level 3
Significant
unobservable inputs | | | Total | |
Total Investments in Securities (a) | | $ | 1,915,750 | | | $ | — | | | $ | — | | | $ | 1,915,750 | |
| | | | | | | | | | | | | | | | |
| | | | |
| Mid Cap Value Fund | | | | | | | | | | | | | | | | |
| | | Level 1
Quoted prices | | | Level 2
Other significant
observable inputs | | | Level 3
Significant
unobservable inputs | | | Total | |
Total Investments in Securities (a) | | $ | 14,834,878 | | | $ | — | | | $ | — | | | $ | 14,834,878 | |
| | | | | | | | | | | | | | | | |
| | | | |
| Multi-Cap Market Neutral Fund | | | | | | | | | | | | | | | | |
| | | Level 1
Quoted prices | | | Level 2
Other significant
observable inputs | | | Level 3
Significant
unobservable inputs | | | Total | |
Total Investments in Securities (a) | | $ | 424,368 | | | $ | — | | | $ | — | | | $ | 424,368 | |
| | | | | | | | | | | | | | | | |
Total Liabilities (a) | | $ | (392,783 | ) | | $ | — | | | $ | — | | | $ | (392,783 | ) |
| | | | | | | | | | | | | | | | |
Depreciation in Other Financial Instruments | | | | | | | | | | | | | | | | |
Futures Contracts | | $ | (117 | ) | | $ | — | | | $ | — | | | $ | (117 | ) |
| | | | | | | | | | | | | | | | |
| | | | |
| Value Advantage Fund | | | | | | | | | | | | | | | | |
| | | Level 1
Quoted prices | | | Level 2
Other significant
observable inputs | | | Level 3
Significant
unobservable inputs | | | Total | |
Total Investments in Securities (a) | | $ | 5,427,135 | | | $ | — | | | $ | — | | | $ | 5,427,135 | |
| | | | | | | | | | | | | | | | |
| (a) | All portfolio holdings designated as Level 1 are disclosed individually on the SOIs. Please refer to the SOIs for industry specifics of portfolio holdings. |
There were no transfers among any levels during the six months ended December 31, 2013.
B. Short Sales — The Multi-Cap Market Neutral Fund engages in short sales as part of its normal investment activities. In a short sale, the Fund sells securities it does not own. In order to deliver securities to the purchaser, the Fund borrows securities from a broker. To close out a short position, the Fund delivers the same securities to the broker.
The Fund is required to pledge cash or securities to the broker as collateral for the securities sold short. Collateral requirements are calculated daily based on the current market value of the short positions. Cash collateral deposited with the broker is recorded as an asset on the Statements of Assets and Liabilities. Securities segregated as collateral are denoted in the SOI. The Fund may receive or pay the net of the following amounts: (i) a portion of the income from the investment of cash collateral; (ii) the broker’s fee on the borrowed securities (calculated daily based upon the market value of each borrowed security and a variable rate that is dependent on availability of the security); and (iii) a financing charge for the difference between the market value of the short position and cash collateral deposited with the broker. The net income or fee is reported as interest income or interest expense, respectively, on securities sold short in the Statements of Operations.
The Fund is obligated to pay the broker dividends declared on short positions when a position is open on the record date. Dividends on short positions are reported on ex-dividend date on the Statements of Operations as dividend expense on securities sold short.
Liabilities for securities sold short are reported at market value on the Statements of Assets and Liabilities and the change in market value is recorded as change in net unrealized appreciation (depreciation) in the Statements of Operations. Short sale transactions may result in unlimited losses as the security’s price increases and the short position loses value. There is no upward limit on the price a borrowed security could attain. The Fund is also subject to risk of loss if the broker were to fail to perform its obligations under the contractual terms.
| | | | | | |
| | | |
| 82 | | | | J.P. MORGAN MID CAP/MULTI-CAP FUNDS | | DECEMBER 31, 2013 |
The Fund will record a realized loss if the price of the borrowed security increases between the date of the short sale and the date on which the Fund replaces the borrowed security. The Fund will record a realized gain if the price of the borrowed security declines between those dates.
As of December 31, 2013, the Fund had outstanding short sales as listed on its SOI.
C. Futures Contracts — The Multi-Cap Market Neutral Fund uses index futures contracts to gain or reduce exposure to the stock market, maintain liquidity and minimize transaction costs. The Fund also buys futures contracts to immediately invest incoming cash in the market or sell futures in response to cash outflows, thereby simulating an invested position in the underlying index while maintaining a cash balance for liquidity. The use of futures contracts exposes the Fund to equity price risk.
Futures contracts provide for the delayed delivery of the underlying instrument at a fixed price or are settled for a cash amount based on the change in the value of the underlying instrument at a specific date in the future. Upon entering into a futures contract, the Fund is required to deposit with the broker, cash or securities in an amount equal to a certain percentage of the contract amount, which is referred to as the initial margin deposit. Subsequent payments, referred to as variation margin, are made or received by the Fund periodically and are based on changes in the market value of open futures contracts. Changes in the market value of open futures contracts are recorded as change in net unrealized appreciation (depreciation) in the Statements of Operations. Realized gains or losses, representing the difference between the value of the contract at the time it was opened and the value at the time it was closed, are reported in the Statements of Operations at the closing or expiration of the futures contract. Securities deposited as initial margin are designated in the SOIs and cash deposited is recorded on the Statements of Assets and Liabilities. A receivable from and/or a payable to brokers for the daily variation margin is also recorded on the Statements of Assets and Liabilities.
The Fund may be subject to the risk that the change in the value of the futures contract may not correlate perfectly with the underlying instrument. Use of long futures contracts subjects the Fund to risk of loss in excess of the amounts shown on the Statements of Assets and Liabilities, up to the notional amount of the futures contracts. Use of short futures contracts subjects the Fund to unlimited risk of loss. The Fund may enter into futures contracts only on exchanges or boards of trade. The exchange or board of trade acts as the counterparty to each futures transaction; therefore, the Fund’s credit risk is limited to failure of the exchange or board of trade. Under some circumstances, futures exchanges may establish daily limits on the amount that the price of a futures contract can vary from the previous day’s settlement price, which could effectively prevent liquidation of positions.
The table below discloses the volume of the Fund’s futures contracts activity during the six months ended December 31, 2013 (amounts in thousands):
| | | | |
| | | Multi-Cap Market
Neutral Fund | |
Futures Contracts: | | | | |
Average Notional Balance Long | | $ | 9,251 | (a) |
Ending Notional Balance Long | | | — | |
Average Notional Balance Short | | | 5,082 | |
Ending Notional Balance Short | | | 3,608 | |
| (a) | For the period August 1, 2013 through August 31, 2013. |
The Fund’s futures contracts are not subject to master netting arrangements.
D. Security Transactions and Investment Income — Investment transactions are accounted for on the trade date (the date the order to buy or sell is executed). Securities gains and losses are calculated on a specifically identified cost basis. Interest income is determined on the basis of coupon interest accrued using the effective interest method which adjusts for amortization of premiums and accretion of discounts. Dividend income, net of foreign taxes withheld, if any, less dividend expense on securities sold short, are recorded on the ex-dividend date or when a Fund first learns of the dividend.
To the extent such information is publicly available, the Funds record distributions received in excess of income earned from underlying investments as a reduction of cost of investments and/or realized gain. Such amounts are based on estimates if actual amounts are not available and actual amounts of income, realized gain and return of capital may differ from the estimated amounts. The Funds adjust the estimated amounts of the components of distributions (and consequently their net investment income) as necessary once the issuers provide information about the actual composition of the distributions.
E. Allocation of Income and Expenses — Expenses directly attributable to a fund are charged directly to that fund, while the expenses attributable to more than one fund of the Trusts are allocated among the respective funds. In calculating the NAV of each class, investment income, realized and unrealized gains and losses and expenses, other than class specific expenses, are allocated daily to each class of shares based upon the proportion of net assets of each class at the beginning of each day.
F. Federal Income Taxes — Each Fund is treated as a separate taxable entity for Federal income tax purposes. Each Fund’s policy is to comply with the provisions of the Internal Revenue Code of 1986, as amended (the “Code”), applicable to regulated investment companies and to distribute to shareholders all of its distributable net investment income and net realized capital gains on investments. Accordingly, no provision for Federal
| | | | | | | | |
| | | |
| DECEMBER 31, 2013 | | J.P. MORGAN MID CAP/MULTI-CAP FUNDS | | | | | 83 | |
NOTES TO FINANCIAL STATEMENTS
AS OF DECEMBER 31, 2013 (Unaudited) (continued)
income tax is necessary. Management has reviewed the Funds’ tax positions for all open tax years and has determined that as of December 31, 2013, no liability for income tax is required in the Funds’ financial statements for net unrecognized tax benefits. However, management’s conclusions may be subject to future review based on changes in, or the interpretation of, the accounting standards or tax laws and regulations. Each of the Fund’s Federal tax returns for the prior three fiscal years remain subject to examination by the Internal Revenue Service.
G. Distributions to Shareholders — Distributions from net investment income are generally declared and paid at least annually, except for the Mid Cap Equity Fund, Mid Cap Growth Fund and Multi-Cap Market Neutral Fund, whose distributions are generally declared and paid at least quarterly. Distributions are declared separately for each class of each Fund. No class has preferential dividend rights; differences in per share rates are due to differences in separate class expenses. Net realized capital gains, if any, are distributed by each Fund at least annually. The amount of distributions from net investment income and net realized capital gains is determined in accordance with Federal income tax regulations, which may differ from GAAP. To the extent these “book/tax” differences are permanent in nature (i.e., that they result from other than timing of recognition — “temporary differences”), such amounts are reclassified within the capital accounts based on their Federal tax-basis treatment.
3. Fees and Other Transactions with Affiliates
A. Investment Advisory Fee — Pursuant to the Investment Advisory Agreements, the Adviser, an indirect, wholly-owned subsidiary of JPMorgan Chase & Co. (“JPMorgan”), supervises the investments of each Fund and for such services is paid a fee. The fee is accrued daily and paid monthly based on each Fund’s respective average daily net assets. The annual rate for each Fund is as follows:
| | | | |
Growth Advantage Fund | | | 0.65 | % |
Mid Cap Core Fund | | | 0.65 | |
Mid Cap Equity Fund | | | 0.65 | |
Mid Cap Growth Fund | | | 0.65 | |
Mid Cap Value Fund | | | 0.65 | |
Multi-Cap Market Neutral Fund | | | 1.25 | |
Value Advantage Fund | | | 0.65 | |
The Adviser waived Investment Advisory fees and/or reimbursed expenses as outlined in Note 3.F.
B. Administration Fee — Pursuant to an Administration Agreement, the Administrator, an indirect, wholly-owned subsidiary of JPMorgan, provides certain administration services to the Funds. In consideration of these services, the Administrator receives a fee accrued daily and paid monthly at an annual rate of 0.15% of the first $25 billion of the average daily net assets of all funds in the J.P. Morgan Funds Complex covered by the Administration Agreement (excluding certain funds of funds and money market funds) and 0.075% of the average daily net assets in excess of $25 billion of all such funds. For the six months ended December 31, 2013, the annualized effective rate was 0.08% of each Fund’s average daily net assets, notwithstanding any fee waivers and/or expense reimbursements.
The Administrator waived Administration fees as outlined in Note 3.F.
JPMorgan Chase Bank, N.A. (“JPMCB”), a wholly-owned subsidiary of JPMorgan, serves as the Funds’ sub-administrator (the “Sub-administrator”). For its services as Sub-administrator, JPMCB receives a portion of the fees payable to the Administrator.
C. Distribution Fees — Pursuant to a Distribution Agreement, JPMorgan Distribution Services, Inc. (the “Distributor”), a wholly-owned subsidiary of JPMorgan, serves as the Trusts’ exclusive underwriter and promotes and arranges for the sale of each Fund’s shares.
The Board of Trustees has adopted a Distribution Plan (the “Distribution Plan”) for Class A, Class B, Class C and Class R2 Shares of the Funds in accordance with Rule 12b-1 under the 1940 Act. The Distribution Plan provides that each Fund shall pay distribution fees, including payments to the Distributor, at annual rates of the average daily net assets as shown in the table below:
| | | | | | | | | | | | | | | | |
| | | Class A | | | Class B | | | Class C | | | Class R2 | |
Growth Advantage Fund | | | 0.25 | % | | | 0.75 | % | | | 0.75 | % | | | n/a | |
Mid Cap Core Fund | | | 0.25 | | | | n/a | | | | 0.75 | | | | 0.50 | % |
Mid Cap Equity Fund | | | 0.25 | | | | n/a | | | | 0.75 | | | | n/a | |
Mid Cap Growth Fund | | | 0.25 | | | | 0.75 | | | | 0.75 | | | | 0.50 | |
Mid Cap Value Fund | | | 0.25 | | | | 0.75 | | | | 0.75 | | | | 0.50 | |
Multi-Cap Market Neutral Fund | | | 0.25 | | | | 0.75 | | | | 0.75 | | | | n/a | |
Value Advantage Fund | | | 0.25 | | | | n/a | | | | 0.75 | | | | n/a | |
| | | | | | |
| | | |
| 84 | | | | J.P. MORGAN MID CAP/MULTI-CAP FUNDS | | DECEMBER 31, 2013 |
In addition, the Distributor is entitled to receive the front-end sales charges from purchases of Class A Shares and the CDSC from redemptions of Class B and Class C Shares and certain Class A Shares for which front-end sales charges have been waived. For the six months ended December 31, 2013, the Distributor retained the following (amounts in thousands):
| | | | | | | | |
| | | Front-End Sales Charge | | | CDSC | |
Growth Advantage Fund | | $ | 248 | | | $ | — | (a) |
Mid Cap Core Fund | | | 5 | | | | — | |
Mid Cap Equity Fund | | | 79 | | | | — | (a) |
Mid Cap Growth Fund | | | 28 | | | | — | (a) |
Mid Cap Value Fund | | | 26 | | | | 6 | |
Multi-Cap Market Neutral Fund | | | 1 | | | | — | (a) |
Value Advantage Fund | | | 188 | | | | 4 | |
| (a) | Amount rounds to less than $1,000. |
D. Shareholder Servicing Fees — The Trusts, on behalf of the Funds, have entered into Shareholder Servicing Agreements with the Distributor under which the Distributor provides certain support services to the shareholders. The Class R6 Shares do not participate in the Shareholder Servicing Agreement. For performing these services, the Distributor receives a fee that is accrued daily and paid monthly equal to a percentage of the average daily net assets as shown in the table below:
| | | | | | | | | | | | | | | | | | | | | | | | | | | | |
| | | Class A | | | Class B | | | Class C | | | Class R2 | | | Class R5 | | | Institutional Class | | | Select Class | |
Growth Advantage Fund | | | 0.25 | % | | | 0.25 | % | | | 0.25 | % | | | n/a | | | | 0.05 | % | | | n/a | | | | 0.25 | % |
Mid Cap Core Fund | | | 0.25 | | | | n/a | | | | 0.25 | | | | 0.25 | % | | | 0.05 | | | | n/a | | | | 0.25 | |
Mid Cap Equity Fund | | | 0.25 | | | | n/a | | | | 0.25 | | | | n/a | | | | n/a | | | | n/a | | | | 0.25 | |
Mid Cap Growth Fund | | | 0.25 | | | | 0.25 | | | | 0.25 | | | | 0.25 | | | | 0.05 | | | | n/a | | | | 0.25 | |
Mid Cap Value Fund | | | 0.25 | | | | 0.25 | | | | 0.25 | | | | 0.25 | | | | n/a | | | | 0.10 | % | | | 0.25 | |
Multi-Cap Market Neutral Fund | | | 0.25 | | | | 0.25 | | | | 0.25 | | | | n/a | | | | n/a | | | | n/a | | | | 0.25 | |
Value Advantage Fund | | | 0.25 | | | | n/a | | | | 0.25 | | | | n/a | | | | n/a | | | | 0.10 | | | | 0.25 | |
The Distributor has entered into shareholder services contracts with affiliated and unaffiliated financial intermediaries who provide shareholder services and other related services to their clients or customers who invest in the Funds under which the Distributor will pay all or a portion of such fees earned to financial intermediaries for performing such services.
The Distributor waived Shareholder Servicing fees as outlined in Note 3.F.
E. Custodian and Accounting Fees — JPMCB provides portfolio custody and accounting services to the Funds. The amounts paid directly to JPMCB by the Funds for custody and accounting services are included in Custodian and accounting fees in the Statements of Operations. Payments to the custodian may be reduced by credits earned by each Fund, based on uninvested cash balances held by the custodian. Such earnings credits, if any, are presented separately in the Statements of Operations.
Interest expense, if any, paid to the custodian related to cash overdrafts is included in Interest expense to affiliates in the Statements of Operations.
F. Waivers and Reimbursements — The Adviser, Administrator and Distributor have contractually agreed to waive fees and/or reimburse the Funds to the extent that total annual operating expenses (excluding acquired fund fees and expenses, dividend expenses related to short sales, interest, taxes, expenses related to litigation and potential litigation, extraordinary expenses and expenses related to the Board of Trustees’ deferred compensation plan) exceed the percentages of the Funds’ respective average daily net assets as shown in the table below:
| | | | | | | | | | | | | | | | | | | | | | | | | | | | | | | | |
| | | Class A | | | Class B | | | Class C | | | Class R2 | | | Class R5 | | | Class R6 | | | Institutional Class | | | Select Class | |
Growth Advantage Fund | | | 1.25 | % | | | 1.75 | % | | | 1.75 | % | | | n/a | | | | 0.90 | % | | | 0.85 | % | | | n/a | | | | 1.10 | % |
Mid Cap Core Fund | | | 1.25 | | | | n/a | | | | 1.75 | | | | 1.50 | % | | | 0.80 | | | | 0.75 | | | | n/a | | | | 0.90 | |
Mid Cap Equity Fund | | | 1.25 | | | | n/a | | | | 1.75 | | | | n/a | | | | n/a | | | | n/a | | | | n/a | | | | 0.90 | |
Mid Cap Growth Fund | | | 1.24 | | | | 1.74 | | | | 1.74 | | | | 1.40 | | | | 0.79 | | | | 0.74 | | | | n/a | | | | 0.93 | |
Mid Cap Value Fund | | | 1.24 | | | | 1.75 | | | | 1.75 | | | | 1.50 | | | | n/a | | | | n/a | | | | 0.75 | % | | | 0.99 | |
Multi-Cap Market Neutral Fund | | | 1.50 | | | | 2.00 | | | | 2.00 | | | | n/a | | | | n/a | | | | n/a | | | | n/a | | | | 1.25 | |
Value Advantage Fund | | | 1.25 | | | | n/a | | | | 1.75 | | | | n/a | | | | n/a | | | | n/a | | | | 0.75 | | | | 1.00 | |
The expense limitation agreements were in effect for the six months ended December 31, 2013. The contractual expense limitation percentages in the table above are in place until at least October 31, 2014, except Growth Advantage Fund Class R6 which is in place until at least December 31, 2014. In addition, the Funds’ service providers have voluntarily waived fees during the six months ended December 31, 2013. However, the Funds’ service providers are under no obligation to do so and may discontinue such voluntary waivers at any time.
| | | | | | | | |
| | | |
| DECEMBER 31, 2013 | | J.P. MORGAN MID CAP/MULTI-CAP FUNDS | | | | | 85 | |
NOTES TO FINANCIAL STATEMENTS
AS OF DECEMBER 31, 2013 (Unaudited) (continued)
For the six months ended December 31, 2013, the Funds’ service providers waived fees and/or reimbursed expenses for each of the Funds as follows (amounts in thousands). None of these parties expect the Funds to repay any such waived fees and reimbursed expenses in future years.
| | | | | | | | | | | | | | | | |
| | | Contractual Waivers | |
| | | Investment
Advisory | | | Administration | | | Shareholder
Servicing | | | Total | |
Growth Advantage Fund | | $ | — | | | $ | — | | | $ | 109 | | | $ | 109 | |
Mid Cap Core Fund | | | — | | | | 126 | | | | 221 | | | | 347 | |
Mid Cap Equity Fund | | | 22 | | | | 395 | | | | 1,400 | | | | 1,817 | |
Mid Cap Growth Fund | | | 743 | | | | 747 | | | | 304 | | | | 1,794 | |
Mid Cap Value Fund | | | 2,039 | | | | 5,994 | | | | 3,991 | | | | 12,024 | |
Multi-Cap Market Neutral Fund | | | 170 | | | | 158 | | | | 469 | | | | 797 | |
Value Advantage Fund | | | 102 | | | | 1,659 | | | | 901 | | | | 2,662 | |
| |
| | | Voluntary Waivers | |
| | | Investment
Advisory | | | Administration | | | Shareholder
Servicing | | | Total | |
Growth Advantage Fund | | $ | — | | | $ | — | | | $ | 17 | | | $ | 17 | |
Mid Cap Growth Fund | | | 3 | | | | — | | | | 3 | | | | 6 | |
Mid Cap Value Fund | | | 1 | | | | — | | | | 15 | | | | 16 | |
Additionally, the Funds may invest in one or more money market funds advised by the Adviser or its affiliates. The Adviser, Administrator and Distributor, as shareholder servicing agent, waive fees in an amount sufficient to offset the respective fees each charges to the affiliated money market fund on the Funds’ investment in such affiliated money market fund. A portion of the waiver is voluntary.
The amount of waivers resulting from investments in these money market funds for the six months ended December 31, 2013 was as follows (excluding the waiver disclosed in Note 2.D. regarding cash collateral for securities lending invested in the JPMorgan Prime Money Market Fund) (amounts in thousands):
| | | | |
Growth Advantage Fund | | $ | 65 | |
Mid Cap Core Fund | | | 24 | |
Mid Cap Equity Fund | | | 35 | |
Mid Cap Growth Fund | | | 42 | |
Mid Cap Value Fund | | | 488 | |
Multi-Cap Market Neutral Fund | | | 35 | |
Value Advantage Fund | | | 294 | |
G. Other — Certain officers of the Trusts are affiliated with the Adviser, the Administrator and the Distributor. Such officers, with the exception of the Chief Compliance Officer, receive no compensation from the Funds for serving in their respective roles.
The Board of Trustees appointed a Chief Compliance Officer to the Funds in accordance with Federal securities regulations. Each Fund, along with other affiliated funds, makes reimbursement payments, on a pro-rata basis, to the Administrator for a portion of the fees associated with the Office of the Chief Compliance Officer. Such fees are included in Trustees’ and Chief Compliance Officer’s fees in the Statements of Operations.
The Trusts adopted a Trustee Deferred Compensation Plan (the “Plan”) which allows the Independent Trustees to defer the receipt of all or a portion of compensation related to performance of their duties as Trustees. The deferred fees are invested in various J.P. Morgan Funds until distribution in accordance with the Plan.
During the six months ended December 31, 2013, the Funds may have purchased securities from an underwriting syndicate in which the principal underwriter or members of the syndicate are affiliated with the Adviser.
The Funds may use related party broker-dealers. For the six months ended December 31, 2013, the Funds did not incur any brokerage commissions with broker-dealers affiliated with the Adviser.
The Securities and Exchange Commission (“SEC”) has granted an exemptive order permitting the Funds to engage in principal transactions with J.P. Morgan Securities, Inc., an affiliated broker, involving taxable money market instruments, subject to certain conditions.
| | | | | | |
| | | |
| 86 | | | | J.P. MORGAN MID CAP/MULTI-CAP FUNDS | | DECEMBER 31, 2013 |
4. Investment Transactions
During the six months ended December 31, 2013, purchases and sales of investments (excluding short-term investments) were as follows (amounts in thousands):
| | | | | | | | | | | | | | | | |
| | | Purchases
(excluding
U.S. Government) | | | Sales
(excluding
U.S. Government) | | | Securities
Sold Short | | | Covers on
Securities
Sold Short | |
Growth Advantage Fund | | $ | 1,203,870 | | | $ | 820,829 | | | $ | — | | | $ | — | |
Mid Cap Core Fund | | | 304,593 | | | | 305,104 | | | | — | | | | — | |
Mid Cap Equity Fund | | | 439,709 | | | | 326,339 | | | | — | | | | — | |
Mid Cap Growth Fund | | | 704,272 | | | | 738,369 | | | | — | | | | — | |
Mid Cap Value Fund | | | 1,632,594 | | | | 1,901,416 | | | | — | | | | — | |
Multi-Cap Market Neutral Fund | | | 211,240 | | | | 189,451 | | | | 256,979 | | | | 223,670 | |
Value Advantage Fund | | | 1,929,258 | | | | 887,597 | | | | — | | | | — | |
During the six months ended December 31, 2013, there were no purchases or sales of U.S. Government securities.
5. Federal Income Tax Matters
For Federal income tax purposes, the cost and unrealized appreciation (depreciation) in value of investment securities held at December 31, 2013 were as follows (amounts in thousands):
| | | | | | | | | | | | | | | | |
| | | Aggregate
Cost | | | Gross
Unrealized
Appreciation | | | Gross
Unrealized
Depreciation | | | Net Unrealized
Appreciation
(Depreciation) | |
Growth Advantage Fund | | $ | 2,072,722 | | | $ | 894,365 | | | $ | 9,207 | | | $ | 885,158 | |
Mid Cap Core Fund | | | 842,442 | | | | 193,100 | | | | 6,096 | | | | 187,004 | |
Mid Cap Equity Fund | | | 911,232 | | | | 395,843 | | | | 3,155 | | | | 392,688 | |
Mid Cap Growth Fund | | | 1,322,714 | | | | 601,077 | | | | 8,041 | | | | 593,036 | |
Mid Cap Value Fund | | | 9,986,096 | | | | 4,894,834 | | | | 46,052 | | | | 4,848,782 | |
Multi-Cap Market Neutral Fund | | | 344,442 | | | | 81,748 | | | | 1,822 | | | | 79,926 | |
Value Advantage Fund | | | 4,435,908 | | | | 1,006,489 | | | | 15,262 | | | | 991,227 | |
Under the Regulated Investment Company Modernization Act of 2010 (“the “Act”), net capital losses recognized by the Funds after June 30, 2011 are carried forward indefinitely, and retain their character as short-term and/or long-term losses. Prior to the Act, net capital losses incurred by the Funds were carried forward for eight years and treated as short-term losses. The Act requires that post-enactment net capital losses be used before pre-enactment net capital losses.
At June 30, 2013, the Funds had pre-enactment net capital loss carryforwards, expiring during the year indicated, which are available to offset future realized gains (amounts in thousands):
| | | | | | | | | | | | | | | | |
| | | 2016 | | | 2017 | | | 2018 | | | Total | |
Mid Cap Growth Fund | | $ | — | | | $ | — | | | $ | 39,020 | | | $ | 39,020 | * |
Mid Cap Value Fund | | | — | | | | 3,017 | | | | 38,368 | | | | 41,385 | * |
Multi-Cap Market Neutral Fund | | | 39,205 | | | | — | | | | — | | | | 39,205 | |
| * | Amount includes capital loss carryforwards from business combinations, which are limited in future years under Internal Revenue Code Sections 381-384. |
6. Borrowings
The Funds rely upon an exemptive order granted by the SEC (the “Order”) permitting the establishment and operation of an Interfund Lending Facility (the “Facility”). The Facility allows the Funds to directly lend and borrow money to or from any other fund relying upon the Order at rates beneficial to both the borrowing and lending funds. Advances under the Facility are taken primarily for temporary or emergency purposes, including the meeting of redemption requests that otherwise might require the untimely disposition of securities, and are subject to each Fund’s borrowing restrictions. The Interfund loan rate is determined, as specified in the Order, by averaging the current repurchase agreement rate and the current bank loan rate. The Order was granted to JPM II and may be relied upon by the Funds because the Funds and the series of JPM II are all investment companies in the same “group of investment companies” (as defined in Section 12(d)(1)(G) of the 1940 Act).
In addition, the Trusts and JPMCB have entered into a financing arrangement. Under this arrangement, JPMCB provides an unsecured, uncommitted credit facility in the aggregate amount of $100 million to certain of the J.P. Morgan Funds, including the Funds. Advances under the arrangement are taken primarily for temporary or emergency purposes, including the meeting of redemption requests that otherwise might require the untimely disposition of securities, and are subject to each Fund’s borrowing restrictions. Interest on borrowings is payable at a rate determined by JPMCB at the time of borrowing. This agreement has been extended until November 10, 2014.
| | | | | | | | |
| | | |
| DECEMBER 31, 2013 | | J.P. MORGAN MID CAP/MULTI-CAP FUNDS | | | | | 87 | |
NOTES TO FINANCIAL STATEMENTS
AS OF DECEMBER 31, 2013 (Unaudited) (continued)
The Funds had no borrowings outstanding from another fund or from the unsecured, uncommitted credit facility at December 31, 2013. Average borrowings from the Facility for the six months ended December 31, 2013, were as follows (amounts in thousands):
| | | | | | | | | | | | |
| | | Average
Borrowings | | | Number
of Days
Outstanding | | | Interest
Paid | |
Mid Cap Core Fund | | $ | 20,941 | | | | 3 | | | $ | — | (a) |
Mid Cap Equity Fund | | | 11,650 | | | | 3 | | | | — | (a) |
| (a) | Amount rounds to less than $1,000. |
Interest expense paid, if any, as a result of borrowings from another fund or from the unsecured, uncommitted credit facility is included in Interest expense to affiliates in the Statements of Operations.
7. Risks, Concentrations and Indemnifications
In the normal course of business, the Funds enter into contracts that contain a variety of representations which provide general indemnifications. Each Fund’s maximum exposure under these arrangements is unknown. The amount of exposure would depend on future claims that may be made against each Fund that have not yet occurred. However, based on experience, the Funds expect the risk of loss to be remote.
One or more affiliates of the Adviser have investment discretion with respect to their clients’ holdings in the Funds, which collectively represent a significant portion of the Funds’ assets for each of the Growth Advantage Fund, Mid Cap Core Fund, Mid Cap Equity Fund and Mid Cap Growth Fund.
In addition, the J.P. Morgan Investor Funds and JPMorgan SmartRetirement Funds, which are affiliated funds of funds, own in the aggregate, more than 10% of the net assets of the following Funds as follows:
| | | | | | | | |
| | | J.P. Morgan
Investor Funds | | | JPMorgan
SmartRetirement
Funds | |
Growth Advantage Fund | | | — | | | | 35.3 | % |
Mid Cap Core Fund | | | — | | | | 53.3 | |
Multi-Cap Market Neutral Fund | | | 90.4 | % | | | — | |
Value Advantage Fund | | | — | | | | 18.6 | |
Additionally, Mid Cap Equity Fund, Mid Cap Value Fund and Value Advantage Fund each have a shareholder, which is an account maintained by a financial intermediary on behalf of its clients, that owns a significant portion of the Funds’ outstanding shares.
Significant shareholder transactions by these shareholders, if any, may impact the Funds’ performance.
As of December 31, 2013, the Multi-Cap Market Neutral Fund pledged substantially all of its assets for securities sold short to Credit Suisse Group, who also held 100% of the Multi-Cap Market Neutral Fund’s cash proceeds for securities sold short.
8. Reorganization
On November 21, 2013, the Board of Trustees of JPM I approved the reorganization of the Mid Cap Core Fund into the Mid Cap Equity Fund. The reorganization is expected to occur on or about March 14, 2014.
9. Other Matters
On February 12, 2014, the Board of Trustees of JPM II approved a change to the Mid Cap Growth Fund’s fundamental investment objective, which will be presented to shareholders for their approval. Subject to shareholder approval, the Fund’s new investment objective will be to seek growth of capital. The shareholder meeting is expected to occur on or about June 10, 2014.
| | | | | | |
| | | |
| 88 | | | | J.P. MORGAN MID CAP/MULTI-CAP FUNDS | | DECEMBER 31, 2013 |
SCHEDULE OF SHAREHOLDER EXPENSES
(Unaudited)
Hypothetical $1,000 Investment
As a shareholder of the Funds, you incur two types of costs: (1) transaction costs, including sales charges (loads) on purchase payments and redemption fees and (2) ongoing costs, including investment advisory fees, administration fees, distribution fees and other Fund expenses. The examples below are intended to help you understand your ongoing costs (in dollars) of investing in the Funds and to compare these ongoing costs with the ongoing costs of investing in other mutual funds. The examples assume that you had a $1,000 investment in each Class at the beginning of the reporting period, July 1, 2013, and continued to hold your shares at the end of the reporting period, December 31, 2013.
Actual Expenses
For each Class of each Fund in the table below, the first line provides information about actual account values and actual expenses. You may use the information in this line, together with the amount you invested, to estimate the expenses that you paid over the period. Simply divide your account value by $1,000 (for example, an $8,600 account value divided by $1,000 = 8.6), then multiply the result by the number in the first line of each Class under the heading entitled “Expenses Paid During the Period” to estimate the expenses you paid on your account during this period.
Hypothetical Example for Comparison Purposes
The second line of each Class in the table below provides information about hypothetical account values and hypothetical expenses based on the Class’ actual expense ratio and an assumed rate of return of 5% per year before expenses, which is not the Class’ actual return. The hypothetical account values and expenses may not be used to estimate the actual ending account balance or expenses you paid for the period. You may use this information to compare the ongoing costs of investing in the Class of the Fund and other funds. To do so, compare this 5% hypothetical example with the 5% hypothetical examples that appear in the shareholder reports of the other funds. Please note that the expenses shown in the table are meant to highlight your ongoing costs only and do not reflect any transaction costs, such as sales charges (loads) or redemption fees. Therefore, the second line for each Class in the table is useful in comparing ongoing costs only, and will not help you determine the relative total costs of owning different funds. In addition, if these transaction costs were included, your costs would have been higher. The examples also assume all dividends and distributions have been reinvested.
Expense Example
| | | | | | | | | | | | | | | | |
| | | Beginning
Account Value
July 1, 2013 | | | Ending
Account Value
December 31, 2013 | | | Expenses
Paid During
the Period | | | Annualized
Expense
Ratio | |
Growth Advantage Fund | | | | | | | | | | | | | | | | |
Class A | | | | | | | | | | | | | | | | |
Actual* | | $ | 1,000.00 | | | $ | 1,249.10 | | | $ | 7.03 | | | | 1.24 | % |
Hypothetical* | | | 1,000.00 | | | | 1,018.95 | | | | 6.31 | | | | 1.24 | |
Class B | | | | | | | | | | | | | | | | |
Actual* | | | 1,000.00 | | | | 1,247.30 | | | | 9.80 | | | | 1.73 | |
Hypothetical* | | | 1,000.00 | | | | 1,016.48 | | | | 8.79 | | | | 1.73 | |
Class C | | | | | | | | | | | | | | | | |
Actual* | | | 1,000.00 | | | | 1,247.10 | | | | 9.86 | | | | 1.74 | |
Hypothetical* | | | 1,000.00 | | | | 1,016.43 | | | | 8.84 | | | | 1.74 | |
Class R5 | | | | | | | | | | | | | | | | |
Actual* | | | 1,000.00 | | | | 1,252.30 | | | | 4.77 | | | | 0.84 | |
Hypothetical* | | | 1,000.00 | | | | 1,020.97 | | | | 4.28 | | | | 0.84 | |
Class R6 | | | | | | | | | | | | | | | | |
Actual** | | | 1,000.00 | | | | 1,007.20 | | | | 0.18 | | | | 0.80 | |
Hypothetical* | | | 1,000.00 | | | | 1,021.17 | | | | 4.08 | | | | 0.80 | |
Select Class | | | | | | | | | | | | | | | | |
Actual* | | | 1,000.00 | | | | 1,251.50 | | | | 5.90 | | | | 1.04 | |
Hypothetical* | | | 1,000.00 | | | | 1,019.96 | | | | 5.30 | | | | 1.04 | |
| | | | |
Mid Cap Core Fund | | | | | | | | | | | | | | | | |
Class A | | | | | | | | | | | | | | | | |
Actual* | | | 1,000.00 | | | | 1,183.80 | | | | 6.88 | | | | 1.25 | |
Hypothetical* | | | 1,000.00 | | | | 1,018.90 | | | | 6.36 | | | | 1.25 | |
Class C | | | | | | | | | | | | | | | | |
Actual* | | | 1,000.00 | | | | 1,180.90 | | | | 9.62 | | | | 1.75 | |
Hypothetical* | | | 1,000.00 | | | | 1,016.38 | | | | 8.89 | | | | 1.75 | |
| | | | | | | | |
| | | |
| DECEMBER 31, 2013 | | J.P. MORGAN MID CAP/MULTI-CAP FUNDS | | | | | 89 | |
SCHEDULE OF SHAREHOLDER EXPENSES
(Unaudited) (continued)
Hypothetical $1,000 Investment
| | | | | | | | | | | | | | | | |
| | | Beginning
Account Value
July 1, 2013 | | | Ending
Account Value
December 31, 2013 | | | Expenses
Paid During
the Period | | | Annualized
Expense
Ratio | |
Mid Cap Core Fund (continued) | | | | | | | | | | | | | | | | |
Class R2 | | | | | | | | | | | | | | | | |
Actual* | | $ | 1,000.00 | | | $ | 1,182.10 | | | $ | 8.25 | | | | 1.50 | % |
Hypothetical* | | | 1,000.00 | | | | 1,017.64 | | | | 7.63 | | | | 1.50 | |
Class R5 | | | | | | | | | | | | | | | | |
Actual* | | | 1,000.00 | | | | 1,186.50 | | | | 4.41 | | | | 0.80 | |
Hypothetical* | | | 1,000.00 | | | | 1,021.17 | | | | 4.08 | | | | 0.80 | |
Class R6 | | | | | | | | | | | | | | | | |
Actual* | | | 1,000.00 | | | | 1,186.50 | | | | 4.13 | | | | 0.75 | |
Hypothetical* | | | 1,000.00 | | | | 1,021.42 | | | | 3.82 | | | | 0.75 | |
Select Class | | | | | | | | | | | | | | | | |
Actual* | | | 1,000.00 | | | | 1,186.00 | | | | 4.96 | | | | 0.90 | |
Hypothetical* | | | 1,000.00 | | | | 1,020.67 | | | | 4.58 | | | | 0.90 | |
| | | | |
Mid Cap Equity Fund | | | | | | | | | | | | | | | | |
Class A | | | | | | | | | | | | | | | | |
Actual* | | | 1,000.00 | | | | 1,183.60 | | | | 6.82 | | | | 1.24 | |
Hypothetical* | | | 1,000.00 | | | | 1,018.95 | | | | 6.31 | | | | 1.24 | |
Class C | | | | | | | | | | | | | | | | |
Actual* | | | 1,000.00 | | | | 1,180.60 | | | | 9.56 | | | | 1.74 | |
Hypothetical* | | | 1,000.00 | | | | 1,016.43 | | | | 8.84 | | | | 1.74 | |
Select Class | | | | | | | | | | | | | | | | |
Actual* | | | 1,000.00 | | | | 1,185.90 | | | | 4.90 | | | | 0.89 | |
Hypothetical* | | | 1,000.00 | | | | 1,020.72 | | | | 4.53 | | | | 0.89 | |
| | | | |
Mid Cap Growth Fund | | | | | | | | | | | | | | | | |
Class A | | | | | | | | | | | | | | | | |
Actual* | | | 1,000.00 | | | | 1,229.50 | | | | 6.91 | | | | 1.23 | |
Hypothetical* | | | 1,000.00 | | | | 1,019.00 | | | | 6.26 | | | | 1.23 | |
Class B | | | | | | | | | | | | | | | | |
Actual* | | | 1,000.00 | | | | 1,226.80 | | | | 9.54 | | | | 1.70 | |
Hypothetical* | | | 1,000.00 | | | | 1,016.64 | | | | 8.64 | | | | 1.70 | |
Class C | | | | | | | | | | | | | | | | |
Actual* | | | 1,000.00 | | | | 1,226.70 | | | | 9.65 | | | | 1.72 | |
Hypothetical* | | | 1,000.00 | | | | 1,016.53 | | | | 8.74 | | | | 1.72 | |
Class R2 | | | | | | | | | | | | | | | | |
Actual* | | | 1,000.00 | | | | 1,228.70 | | | | 7.81 | | | | 1.39 | |
Hypothetical* | | | 1,000.00 | | | | 1,018.20 | | | | 7.07 | | | | 1.39 | |
Class R5 | | | | | | | | | | | | | | | | |
Actual* | | | 1,000.00 | | | | 1,232.60 | | | | 4.45 | | | | 0.79 | |
Hypothetical* | | | 1,000.00 | | | | 1,021.22 | | | | 4.02 | | | | 0.79 | |
Class R6 | | | | | | | | | | | | | | | | |
Actual* | | | 1,000.00 | | | | 1,232.70 | | | | 4.16 | | | | 0.74 | |
Hypothetical* | | | 1,000.00 | | | | 1,021.48 | | | | 3.77 | | | | 0.74 | |
Select Class | | | | | | | | | | | | | | | | |
Actual* | | | 1,000.00 | | | | 1,231.60 | | | | 5.17 | | | | 0.92 | |
Hypothetical* | | | 1,000.00 | | | | 1,020.57 | | | | 4.69 | | | | 0.92 | |
| | | | |
Mid Cap Value Fund | | | | | | | | | | | | | | | | |
Class A | | | | | | | | | | | | | | | | |
Actual* | | | 1,000.00 | | | | 1,142.20 | | | | 6.64 | | | | 1.23 | |
Hypothetical* | | | 1,000.00 | | | | 1,019.00 | | | | 6.26 | | | | 1.23 | |
Class B | | | | | | | | | | | | | | | | |
Actual* | | | 1,000.00 | | | | 1,139.50 | | | | 9.22 | | | | 1.71 | |
Hypothetical* | | | 1,000.00 | | | | 1,016.59 | | | | 8.69 | | | | 1.71 | |
| | | | | | |
| | | |
| 90 | | | | J.P. MORGAN MID CAP/MULTI-CAP FUNDS | | DECEMBER 31, 2013 |
| | | | | | | | | | | | | | | | |
| | | Beginning
Account Value
July 1, 2013 | | | Ending
Account Value
December 31, 2013 | | | Expenses
Paid During
the Period | | | Annualized
Expense
Ratio | |
Mid Cap Value Fund (continued) | | | | | | | | | | | | | | | | |
Class C | | | | | | | | | | | | | | | | |
Actual* | | $ | 1,000.00 | | | $ | 1,139.30 | | | $ | 9.38 | | | | 1.74 | % |
Hypothetical* | | | 1,000.00 | | | | 1,016.43 | | | | 8.84 | | | | 1.74 | |
Class R2 | | | | | | | | | | | | | | | | |
Actual* | | | 1,000.00 | | | | 1,140.70 | | | | 8.04 | | | | 1.49 | |
Hypothetical* | | | 1,000.00 | | | | 1,017.69 | | | | 7.58 | | | | 1.49 | |
Institutional Class | | | | | | | | | | | | | | | | |
Actual* | | | 1,000.00 | | | | 1,145.20 | | | | 4.00 | | | | 0.74 | |
Hypothetical* | | | 1,000.00 | | | | 1,021.48 | | | | 3.77 | | | | 0.74 | |
Select Class | | | | | | | | | | | | | | | | |
Actual* | | | 1,000.00 | | | | 1,143.90 | | | | 5.30 | | | | 0.98 | |
Hypothetical* | | | 1,000.00 | | | | 1,020.27 | | | | 4.99 | | | | 0.98 | |
| | | | |
Multi-Cap Market Neutral Fund | | | | | | | | | | | | | | | | |
Class A | | | | | | | | | | | | | | | | |
Actual* | | | 1,000.00 | | | | 1,014.30 | | | | 14.06 | | | | 2.77 | |
Hypothetical* | | | 1,000.00 | | | | 1,011.24 | | | | 14.04 | | | | 2.77 | |
Class B | | | | | | | | | | | | | | | | |
Actual* | | | 1,000.00 | | | | 1,012.90 | | | | 16.59 | | | | 3.27 | |
Hypothetical* | | | 1,000.00 | | | | 1,008.72 | | | | 16.56 | | | | 3.27 | |
Class C | | | | | | | | | | | | | | | | |
Actual* | | | 1,000.00 | | | | 1,011.80 | | | | 16.58 | | | | 3.27 | |
Hypothetical* | | | 1,000.00 | | | | 1,008.72 | | | | 16.56 | | | | 3.27 | |
Select Class | | | | | | | | | | | | | | | | |
Actual* | | | 1,000.00 | | | | 1,016.10 | | | | 12.76 | | | | 2.51 | |
Hypothetical* | | | 1,000.00 | | | | 1,012.55 | | | | 12.73 | | | | 2.51 | |
| | | | |
Value Advantage Fund | | | | | | | | | | | | | | | | |
Class A | | | | | | | | | | | | | | | | |
Actual* | | | 1,000.00 | | | | 1,134.30 | | | | 6.67 | | | | 1.24 | |
Hypothetical* | | | 1,000.00 | | | | 1,018.95 | | | | 6.31 | | | | 1.24 | |
Class C | | | | | | | | | | | | | | | | |
Actual* | | | 1,000.00 | | | | 1,131.80 | | | | 9.35 | | | | 1.74 | |
Hypothetical* | | | 1,000.00 | | | | 1,016.43 | | | | 8.84 | | | | 1.74 | |
Institutional Class | | | | | | | | | | | | | | | | |
Actual* | | | 1,000.00 | | | | 1,137.20 | | | | 3.99 | | | | 0.74 | |
Hypothetical* | | | 1,000.00 | | | | 1,021.48 | | | | 3.77 | | | | 0.74 | |
Select Class | | | | | | | | | | | | | | | | |
Actual* | | | 1,000.00 | | | | 1,135.70 | | | | 5.33 | | | | 0.99 | |
Hypothetical* | | | 1,000.00 | | | | 1,020.21 | | | | 5.04 | | | | 0.99 | |
| * | Expenses are equal to each Class’ respective annualized expense ratio, multiplied by the average account value over the period, multiplied by 184/365 (to reflect the one-half year period). |
| ** | Expenses are equal to each Class’ respective annualized expense ratio, multiplied by the average account value over the period, multiplied by 8/365 (to reflect the one-half year period). |
| | | | | | | | |
| | | |
| DECEMBER 31, 2013 | | J.P. MORGAN MID CAP/MULTI-CAP FUNDS | | | | | 91 | |
BOARD APPROVAL OF INVESTMENT ADVISORY AGREEMENT
(Unaudited)
The Board of Trustees has established various standing committees, composed of Trustees with diverse backgrounds, to which the Board of Trustees has assigned specific subject matter responsibilities to further enhance the effectiveness of the Board’s oversight and decision making. The Board of Trustees and its investment committees (money market and alternative products, equity, and fixed income) meet regularly throughout the year and consider factors that are relevant to their annual consideration of investment advisory agreements at each meeting. They also meet for the specific purpose of considering advisory contract annual renewals. The Board of Trustees held meetings in person in June and August 2013, at which the Trustees considered the continuation of the investment advisory agreements for each of the Funds whose semi-annual report is contained herein (each an “Advisory Agreement” and collectively, the “Advisory Agreements”). At the June meeting, the Board’s investment committees met to review and consider performance, expense and related information for the J.P. Morgan Funds. Each investment committee reported to the full Board, which then considered the investment committee’s preliminary findings. At the August meeting, the Trustees continued their review and consideration. The Trustees, including a majority of the Trustees who are not “interested persons” (as defined in the 1940 Act) of any party to the Advisory Agreements or any of their affiliates, approved the continuation of each Advisory Agreement on August 22, 2013.
As part of their review of the investment advisory arrangements for the J.P. Morgan Funds, the Trustees considered and reviewed performance and other information about the Funds received from the Adviser. This information includes the Funds’ performance as compared to the performance of their peers and benchmarks and analyses by the Adviser of the Funds’ performance. In addition, the Trustees have engaged an independent consultant to report on the performance of certain J.P. Morgan Funds at each of the Trustees’ regular meetings. The Adviser also periodically provides comparative information regarding the Funds’ expense ratios and those of their peer groups. In addition, in preparation for the June and August meetings, the Trustees requested, received and evaluated extensive materials from the Adviser, including, with respect to the Funds, performance and expense information compiled by Lipper Inc. (“Lipper”), an independent provider of investment company data. The Trustees’ independent consultant also provided additional analyses of the performance of the Funds in connection with the Trustees’ review of the investment advisory arrangements. Before voting on the proposed Advisory Agreements, the Trustees reviewed the proposed agreements with representatives of the Adviser, counsel to the Trusts and independent legal counsel and received a memorandum from independent legal counsel discussing the legal standards for their consideration of the proposed agreements. The Trustees also discussed the proposed agreements in executive session with counsel to the Trusts and independent legal counsel at
which no representatives of the Adviser were present. Set forth below is a summary of the material factors evaluated by the Trustees in determining whether to approve each Advisory Agreement.
The Trustees considered information provided with respect to the Funds over the course of the year . Each Trustee attributed different weights to the various factors and no factor alone was considered determinative. From year to year, the Trustees consider and place emphasis on relevant information in light of changing circumstances in market and economic conditions. The Trustees determined that the compensation to be received by the Adviser from each Fund under the applicable Advisory Agreement was fair and reasonable and that the continuance of the investment advisory contract was in the best interests of each Fund and its shareholders.
The factors summarized below were considered and discussed by the Trustees in reaching their conclusions:
Nature, Extent and Quality of Services Provided by the Adviser
The Trustees received and considered information regarding the nature, extent and quality of the services provided to each Fund under the Advisory Agreement. The Trustees took into account information furnished throughout the year at Trustee meetings, as well as the materials furnished specifically in connection with this annual review process. The Trustees considered the background and experience of the Adviser’s senior management and the expertise of, and the amount of attention given to each Fund by, investment personnel of the Adviser. In addition, the Trustees reviewed the qualifications, backgrounds and responsibilities of the portfolio management team primarily responsible for the day-to-day management of each Fund and the infrastructure supporting the team. The Trustees also considered information provided by the Adviser and JPMorgan Distribution Services, Inc. (“JPMDS”) about the structure and distribution strategy of each Fund. The Trustees also reviewed information relating to the Adviser’s risk governance model and reports showing the Adviser’s compliance structure and ongoing compliance processes. The Trustees also considered the quality of the administrative services provided by JPMorgan Funds Management, Inc. (“JPMFM”), an affiliate of the Adviser.
The Trustees also considered its knowledge of the nature and quality of the services provided by the Adviser to the Funds gained from their experience as Trustees of the J.P. Morgan Funds. In addition, they considered the overall reputation and capabilities of the Adviser and its affiliates, the commitment of the Adviser to provide high quality service to the Funds, their overall confidence in the Adviser’s integrity and the Adviser’s responsiveness to questions or concerns raised by them, including the Adviser’s willingness to consider and implement organizational and operational changes designed to improve investment results and the services provided to each Fund.
| | | | | | |
| | | |
| 92 | | | | J.P. MORGAN MID CAP/MULTI-CAP FUNDS | | DECEMBER 31, 2013 |
Based on these considerations and other factors, the Trustees concluded that they were satisfied with the nature, extent and quality of the investment advisory services provided to the Funds by the Adviser.
Costs of Services Provided and Profitability to the Adviser and its Affiliates
The Trustees received and considered information regarding the profitability to the Adviser and its affiliates in providing services to each of the Funds. The Trustees reviewed and discussed this data. The Trustees recognized that this data is not audited and represents the Adviser’s determination of its and its affiliates’ revenues from the contractual services provided to the Funds, less expenses of providing such services. Expenses include direct and indirect costs and are calculated using an allocation methodology developed by the Adviser. The Trustees also recognized that it is difficult to make comparisons of profitability from fund investment advisory contracts because comparative information is not generally publicly available and is affected by numerous factors, including the structure of the particular adviser, the types of funds it manages, its business mix, numerous assumptions regarding allocations and the fact that publicly-traded fund managers’ operating profits and net income are net of distribution and marketing expenses. Based on their review, the Trustees concluded that the profitability to the Adviser under each of the Advisory Agreements was not unreasonable in light of the services and benefits provided to each Fund.
Fall-Out Benefits
The Trustees reviewed information regarding potential “fallout” or ancillary benefits received by the Adviser and its affiliates as a result of their relationship with the Funds. The Trustees also reviewed the Adviser’s allocation of fund brokerage for the J.P. Morgan Funds complex, including allocations to brokers who provide research to the Adviser.
The Trustees also considered that JPMFM and JPMDS, affiliates of the Adviser, earn fees from the Funds for providing administrative and shareholder services. These fees were shown separately in the profitability analysis presented to the Trustees. The Trustees also considered the payments of Rule 12b-1 fees to JPMDS, which also acts as the Funds’ distributor and that these fees are in turn generally paid to financial intermediaries that sell the Funds, including financial intermediaries that are affiliates of the Adviser. The Trustees also considered the fees paid to JPMorgan Chase Bank, N.A. (“JPMCB”) for custody and fund accounting, and other related services.
Economies of Scale
The Trustees noted that the proposed investment advisory fee schedule for each Fund does not contain breakpoints. The Trustees considered whether it would be appropriate to add
advisory fee breakpoints and the Trustees concluded that the current fee structure was reasonable in light of the fee waivers and expense limitations that the Adviser has in place that serve to limit the overall net expense ratio at competitive levels. The Trustees also recognized that the fee schedule for the administrative services provided by JPMFM does include a fee breakpoint, which is tied to the overall level of non-money market fund assets excluding certain funds-of-funds, as applicable, advised by the Adviser, and that the Funds benefit from that breakpoint. The Trustees concluded that shareholders benefited from the lower expense ratios which resulted from these factors.
Independent Written Evaluation of the Funds’ Senior/Chief Compliance Officer
The Trustees noted that, upon their direction, the Senior Officer for the Mid Cap Growth Fund, Mid Cap Value Fund and Multi-Cap Market Neutral Fund had prepared an independent written evaluation in order to assist the Trustees in determining the reasonableness of the proposed management fees. In determining whether to continue the Advisory Agreements, the Trustees considered the Senior Officer’s report.
The Trustees noted that, upon their direction, the Chief Compliance Officer for the Growth Advantage Fund, Mid Cap Core Fund, Mid Cap Equity Fund, and Value Advantage Fund had prepared an independent written evaluation in order to assist the Trustees in determining the reasonableness of the proposed management fees. The Trustees considered the written evaluation in determining whether to continue the Advisory Agreements.
Fees Relative to Adviser’s Other Clients
The Trustees received and considered information about the nature and extent of investment advisory services and fee rates offered to other clients of the Adviser for investment management styles substantially similar to that of each Fund. The Trustees also considered the complexity of investment management for the Funds relative to the Adviser’s other clients and the differences in the nature and extent of the services provided to the different clients. The Trustees concluded that the fee rates charged to each Fund in comparison to those charged to the Adviser’s other clients were reasonable.
Investment Performance
The Trustees received and considered absolute and/or relative performance for Funds in a report prepared by Lipper. The Trustees considered the total return performance information, which included the ranking of the Funds within a performance universe made up of funds with the same Lipper investment classification and objective (the “Universe Group”) by total return for applicable one-, three- and five-year periods. The Trustees reviewed a description of Lipper’s methodology for
| | | | | | | | |
| | | |
| DECEMBER 31, 2013 | | J.P. MORGAN MID CAP/MULTI-CAP FUNDS | | | | | 93 | |
BOARD APPROVAL OF INVESTMENT ADVISORY AGREEMENT
(Unaudited) (continued)
selecting mutual funds in each Fund’s Universe Group. The Lipper materials provided to the Trustees highlighted information with respect to certain representative classes to assist the Trustees in their review. As part of this review, the Trustees also reviewed each Fund’s performance against its benchmark and considered the performance information provided for the Funds at regular Board meetings by the Adviser and the Trustees��� independent consultant and also considered the special analysis prepared by the Trustees’ independent consultant. The Lipper performance data noted by the Trustees as part of their review and the determinations made by the Trustees with respect to each Fund’s performance for certain representative classes are summarized below:
The Trustees noted that the Growth Advantage Fund’s performance was in the third, second, and third quintiles for Class A shares and in the third, second, and second quintiles for Select Class shares for the one-, three- and five year periods ended December 31, 2012, respectively, and that the Trustees’ independent consultant indicated that the Fund’s overall performance was satisfactory. The Trustees discussed the performance and investment strategy of the Fund with the Adviser and, based upon this discussion and various other factors, concluded that the performance was reasonable.
The Trustees noted that the Mid Cap Core Fund’s performance was in the fourth quintile for both Class A and Select Class shares for the one-year period ended December 31, 2012, and that the Trustees’ independent consultant indicated that overall performance was attractive. The Trustees discussed the performance and investment strategy of the Fund with the Adviser and, based upon this discussion and various other factors, concluded that the performance was reasonable.
The Trustees noted that the Mid Cap Equity Fund’s performance was in the second quintile for Class A shares for each of the one- and three year periods ended December 31, 2012, and in the second quintile for Select Class shares for each of the one-, three-, and five-year periods ended December 31, 2012, and that the Trustees’ independent consultant indicated that overall performance was satisfactory. The Trustees discussed the performance and investment strategy of the Fund with the Adviser and, based upon this discussion and various other factors, concluded that the performance was reasonable.
The Trustees noted that the Mid Cap Growth Fund’s performance was in the second, fourth and third quintiles for Class A shares and in the second, third and third quintiles for Select Class shares for the one-, three-, and five-year periods ended December 31, 2012, respectively, and that the Trustees’ independent consultant indicated that overall performance needed enhancement. The Trustees discussed the performance and investment strategy of the Fund with the Adviser and, based upon this discussion and various other factors, concluded that the performance was reasonable.
The Trustees noted that the Mid Cap Value Fund’s performance was in the first quintile for both Class A and Select Class shares for each of the one-, three-, and five-year periods ended December 31, 2012, and that the Trustees’ independent consultant indicated that the Fund’s overall performance was attractive. The Trustees discussed the performance and investment strategy of the Fund with the Adviser and, based upon this discussion and various other factors, concluded that the performance was reasonable.
The Trustees noted that the Multi-Cap Market Neutral Fund’s performance was in the fourth, fifth and fourth quintiles for Class A shares and in the third, fourth and fourth quintiles for Select Class shares for the one-, three-, and five-year periods ended December 31, 2012, respectively, and that the Trustees’ independent consultant indicated that the overall performance needed enhancement. The Trustees also noted that effective February 28, 2013, the Fund changed portfolio managers and its investment strategy and process. The Trustees discussed the performance and investment strategy of the Fund with the Adviser and, based upon this discussion and various other factors, concluded that they were satisfied with the Adviser’s analysis of the Fund’s performance. The Trustees requested, however, that the Adviser provide additional Fund performance information to be reviewed with the members of the equity committee at each of their regular meetings over the course of next year.
The Trustees noted that the Value Advantage Fund’s performance was in the first quintile for both Class A and Select Class shares for each of the one-, three-, and five-year periods ended December 31, 2012, and that the Trustees’ independent consultant indicated that overall performance was attractive. The Trustees discussed the performance and investment strategy of the Fund with the Adviser and, based upon this discussion and various other factors, concluded that the performance was reasonable.
Advisory Fees and Expense Ratios
The Trustees considered the contractual advisory fee rate paid by each Fund to the Adviser and compared that rate to the information prepared by Lipper concerning management fee rates paid by other funds in the same Lipper category as each Fund. The Trustees recognized that Lipper reported each Fund’s management fee rate as the combined contractual advisory fee and administration fee rates. The Trustees also reviewed information about other expenses and the expense ratios for each Fund. The Trustees considered the fee waiver and/or expense reimbursement arrangements currently in place for each Fund and considered the net advisory fee rate after taking into account any waivers and/or reimbursements. The Trustees recognized that it is difficult to make comparisons of advisory fees because there are variations in the services that are included in the fees paid by other funds. The Trustees’
| | | | | | |
| | | |
| 94 | | | | J.P. MORGAN MID CAP/MULTI-CAP FUNDS | | DECEMBER 31, 2013 |
determinations as a result of the review of each Fund’s advisory fees and expense ratios for certain representative classes are summarized below:
The Trustees noted that the Growth Advantage Fund’s net advisory fee for Class A and Select Class shares was in the third and fourth quintiles, respectively, and that the actual total expenses for Class A and Select Class shares were in the second and third quintiles, respectively, of the Universe Group. After considering the factors identified above, in light of this information, the Trustees concluded that the advisory fees were reasonable.
The Trustees noted that the Mid Cap Core Fund’s net advisory fee for both Class A and Select Class shares was in the second quintile and that the actual total expenses for Class A and Select shares were in the second and third quintiles, respectively, of the Universe Group. After considering the factors identified above, in light of this information, the Trustees concluded that the advisory fee was reasonable.
The Trustees noted that the Mid Cap Equity Fund’s net advisory fee for Class A and Select Class shares was in the second and first quintiles, respectively, and that the actual total expenses for both Class A and Select shares were in the second quintile of the Universe Group. After considering the factors identified above, in light of this information, the Trustees concluded that the advisory fees were reasonable.
The Trustees noted that the Mid Cap Growth Fund’s net advisory fee for both Class A and Select Class shares was in the first
quintile, and that the actual total expenses for both Class A and
Select Class shares were in the second quintile of the Universe Group. After considering the factors identified above, in light of this information, the Trustees concluded that the advisory fee was reasonable.
The Trustees noted that the Mid Cap Value Fund’s net advisory fee for Class A and Select Class shares was in the second and third quintiles, respectively, and that the actual total expenses for both Class A and Select shares were in the third quintile of the Universe Group. After considering the factors identified above, in light of this information, the Trustees concluded that the advisory fees were reasonable.
The Trustees noted that the Multi-Cap Market Neutral Fund’s net advisory fee for both Class A and Select Class shares was in the fourth quintile, and that the actual total expenses for both Class A and Select Class shares were in the second quintile of the Universe Group. After considering the factors identified above, in light of this information, the Trustees concluded that the advisory fee was reasonable.
The Trustees noted that the Value Advantage Fund’s net advisory fee for Class A and Select Class shares was in the third and second quintiles, respectively, and that the actual total expenses for Class A and Select Class shares were in the second and third quintiles, respectively, of their Universe Group. After considering the factors identified above, in light of this information, the Trustees concluded that the advisory fees were reasonable.
| | | | | | | | |
| | | |
| DECEMBER 31, 2013 | | J.P. MORGAN MID CAP/MULTI-CAP FUNDS | | | | | 95 | |
J.P. Morgan Funds are distributed by JPMorgan Distribution Services, Inc., which is an affiliate of JPMorgan Chase & Co. Affiliates of JPMorgan Chase & Co. receive fees for providing various services to the funds.
Contact JPMorgan Distribution Services, Inc. at 1-800-480-4111 for a fund prospectus. You can also visit us at www.jpmorganfunds.com. Investors should carefully consider the investment objectives and risk as well as charges and expenses of the mutual fund before investing. The prospectus contains this and other information about the mutual fund. Read the prospectus carefully before investing.
Investors may obtain information about the Securities Investor Protection Corporation (SIPC), including the SIPC brochure by visiting www.sipc.org or by calling SIPC at 202-371-8300.
Each Fund files a complete schedule of its fund holdings for the first and third quarters of its fiscal year with the SEC on Form N-Q. The Funds’ Forms N-Q are available on the SEC’s website at http://www.sec.gov and may be reviewed and copied at the SEC’s Public Reference Room in Washington, DC. Information on the operation of the SEC’s Public Reference Room may be obtained by calling 1-800-SEC-0330. Shareholders may request the Form N-Q without charge by calling 1-800-480-4111 or by visiting the J.P. Morgan Funds’ website at www.jpmorganfunds.com.
A description of each Fund’s policies and procedures with respect to the disclosure of each Fund’s holdings is available in the prospectus and Statement of Additional Information.
A copy of proxy policies and procedures is available without charge upon request by calling 1-800-480-4111 and on the Funds’ website at www.jpmorganfunds.com. A description of such policies and procedures is on the SEC’s website at www.sec.gov. The Trustees have delegated the authority to vote proxies for securities owned by the Funds to the Adviser. A copy of the Funds’ voting record for the most recent 12-month period ended June 30 is available on the SEC’s website at www.sec.gov or at the Funds’ website at www.jpmorganfunds.com no later than August 31 of each year. The Funds’ proxy voting record will include, among other things, a brief description of the matter voted on for each fund security, and will state how each vote was cast, for example, for or against the proposal.


J.P. Morgan Asset Management is the marketing name for the asset management business of JPMorgan Chase & Co. Those businesses include, but are not limited to, J.P. Morgan Investment Management Inc., Security Capital Research & Management Incorporated and J.P. Morgan Alternative Asset Management, Inc.
| | | | |
| | © JPMorgan Chase & Co., 2014. All rights reserved. December 2013. | | SAN-MC-1213 |
ITEM 2. CODE OF ETHICS.
Disclose whether, as of the end of the period covered by the report, the registrant has adopted a code of ethics that applies to the registrant’s principal executive officer, principal financial officer, principal accounting officer or controller, or persons performing similar functions, regardless of whether these individuals are employed by the registrant or a third party. If the registrant has not adopted such a code of ethics, explain why it has not done so.
The registrant must briefly describe the nature of any amendment, during the period covered by the report, to a provision of its code of ethics that applies to the registrant’s principal executive officer, principal financial officer, principal accounting officer or controller, or persons performing similar functions, regardless of whether these individuals are employed by the registrant or a third party, and that relates to any element of the code of ethics definition enumerated in paragraph (b) of this Item. The registrant must file a copy of any such amendment as an exhibit pursuant to Item 12(a)(1), unless the registrant has elected to satisfy paragraph (f) of this Item by positing its code of ethics on its website pursuant to paragraph (f)(2) of this Item, or by undertaking to provide its code of ethics to any person without charge, upon request, pursuant to paragraph (f)(3) of this Item.
If the registrant has, during the period covered by the report, granted a waiver, including an implicit waiver, from a provision of the code of ethics that applies to the registrant’s principal executive officer, principal financial officer, principal accounting officer or controller, or persons performing similar functions, regardless of whether these individuals are employed by the registrant or third party, that relates to one or more items set forth in paragraph (b) of this Item, the registrant must briefly describe the nature of the waiver, the name of the person to whom the waiver was granted, and the date of the waiver.
Not applicable to a semi-annual report.
ITEM 3. AUDIT COMMITTEE FINANCIAL EXPERT.
(a) (1) Disclose that the registrant’s board of directors has determined that the registrant either:
(i) Has at least one audit committee financial expert serving on its audit committee; or
(ii) Does not have an audit committee financial expert serving on its audit committee.
(2) If the registrant provides the disclosure required by paragraph (a)(1)(i) of this Item, it must disclose the name of the audit committee financial expert and whether that person is “independent.” In order to be considered “independent” for purposes of this Item, a member of an audit committee may not, other than in his or her capacity as a member of the audit committee, the board of directors, or any other board committee:
(i) Accept directly or indirectly any consulting, advisory, or other compensatory fee from the issuer; or
(ii) Be an “interested person” of the investment company as defined in Section 2(a)(19) of the Act (15 U.S.C. 80a-2(a)(19)).
(3) If the registrant provides the disclosure required by paragraph (a)(1)(ii) of this Item, it must explain why it does not have an audit committee financial expert.
Not applicable to a semi-annual report.
ITEM 4. PRINCIPAL ACCOUNTANT FEES AND SERVICES.
(a) Disclose, under the caption Audit Fees, the aggregate fees billed for each of the last two fiscal years for professional services rendered by the principal accountant for the audit of the registrant’s annual financial statements or services that are normally provided by the accountant in connection with statutory and regulatory filings or engagements for those fiscal years.
(b) Disclose, under the caption Audit-Related Fees, the aggregate fees billed in each of the last two fiscal years for assurance and related services by the principal accountant that are reasonably related to the performance of the audit of the registrant’s financial statements and are not reported under paragraph (a) of this Item. Registrants shall describe the nature of the services comprising the fees disclosed under this category.
(c) Disclose, under the caption Tax Fees, the aggregate fees billed in each of the last two fiscal years for professional services rendered by the principal accountant for tax compliance, tax advice, and tax planning. Registrants shall describe the nature of the services comprising the fees disclosed under this category.
(d) Disclose, under the caption All Other Fees, the aggregate fees billed in each of the last two fiscal years for products and services provided by the principal accountant, other than the services reported in paragraphs (a) through (c) of this Item. Registrants shall describe the nature of the services comprising the fees disclosed under this category.
(e) (1) Disclose the audit committee’s pre-approval policies and procedures described in paragraph (c)(7) of Rule 2-01 of Regulation S-X.
(2) Disclose the percentage of services described in each of paragraphs (b) through (d) of this Item that were approved by the audit committee pursuant to paragraph (c)(7)(i)(C) of Rule 2-01 of Regulation S-X.
(f) If greater than 50 percent, disclose the percentage of hours expended on the principal accountant’s engagement to audit the registrant’s financial statements for the most recent fiscal year that were attributed to work performed by persons other than the principal accountant’s full-time, permanent employees.
(g) Disclose the aggregate non-audit fees billed by the registrant’s accountant for services rendered to the registrant, and rendered to the registrant’s investment adviser (not including any sub-adviser whose role is primarily portfolio management and is subcontracted with or overseen by another investment adviser), and any entity controlling, controlled by, or under common control with the adviser that provides ongoing services to the registrant for each of the last two fiscal years of the registrant.
(h) Disclose whether the registrant’s audit committee of the board of directors has considered whether the provision of non-audit services that were rendered to the registrant’s investment adviser (not including any subadviser whose role is primarily portfolio management and is subcontracted with or overseen by another investment adviser), and any entity controlling, controlled by, or under common control with the investment adviser that provides ongoing services to the registrant that were not pre-approved pursuant to paragraph (c)(7)(ii) of Rule 2-01 of Regulation S-X is compatible with maintaining the principal accountant’s independence.
Not applicable to a semi-annual report.
ITEM 5. AUDIT COMMITTEE OF LISTED REGISTRANTS.
(a) If the registrant is a listed issuer as defined in Rule 10A-3 under the Exchange Act (17CFR 240.10A-3), state whether or not the registrant has a separately-designated standing audit committee established in accordance with Section 3(a)(58)(A) of the Exchange Act (15 U.S.C. 78c(a)(58)(A)). If the registrant has such a committee, however designated, identify each committee member. If the entire board of directors is acting as the registrant’s audit committee as specified in Section 3(a)(58)(B) of the Exchange Act (15 U.S.C. 78c(a)(58)(B)), so state.
(b) If applicable, provide the disclosure required by Rule 10A-3(d) under the Exchange Act (17CFR 240.10A-3(d)) regarding an exemption from the listing standards for all audit committees.
Not applicable to a semi-annual report.
ITEM 6. SCHEDULE OF INVESTMENTS.
File Schedule I – Investments in securities of unaffiliated issuers as of the close of the reporting period as set forth in Section 210.12-12 of Regulation S-X, unless the schedule is included as part of the report to shareholders filed under Item 1 of this Form.
Included in Item 1.
ITEM 7. DISCLOSURE OF PROXY VOTING POLICIES AND PROCEDURES FOR CLOSED-END MANAGEMENT INVESTMENT COMPANIES.
A closed-end management investment company that is filing an annual report on this Form N-CSR must, unless it invests exclusively in non-voting securities, describe the policies and procedures that it uses to determine how to vote proxies relating to portfolio securities, including the procedures that the company uses when a vote presents a conflict between the interests of its shareholders, on the one hand, and those of the company’s investment adviser; principal underwriter; or any affiliated person (as defined in Section 2(a)(3) of the Investment Company Act of 1940 (15 U.S.C. 80a-2(a)(3)) and the rules thereunder) of the company, its investment adviser, or its principal underwriter, on the other. Include any policies and procedures of the company’s investment adviser, or any other third party, that the company uses, or that are used on the company’s behalf, to determine how to vote proxies relating to portfolio securities.
Not applicable.
ITEM 8. PORTFOLIO MANAGERS OF CLOSED-END MANAGEMENT INVESTMENT COMPANIES.
Not applicable.
ITEM 9. PURCHASE OF EQUITY SECURITIES BY CLOSED-END MANAGEMENT INVESTMENT COMPANY AND AFFILIATED PURCHASERS.
(a) If the registrant is a closed-end management investment company, provide the information specified in paragraph (b) of this Item with respect to any purchase made by or on behalf of the registrant or any “affiliated purchaser,” as defined in Rule 10b-18(a)(3) under the Exchange Act (17 CFR 240.10b-18(a)(3)), of shares or other units of any class of the registrant’s equity securities that is registered by the registrant pursuant to Section 12 of the Exchange Act (15 U.S.C. 781).
Not applicable.
ITEM 10. SUBMISSION OF MATTERS TO A VOTE OF SECURITY HOLDERS.
Describe any material changes to the procedures by which shareholders may recommend nominees to the registrant’s board of directors, where those changes were implemented after the registrant last provided disclosure in response to the requirements of Item 7(d)(2)(ii)(G) of Schedule 14A (17 CFR 240.14a-101), or this Item.
No material changes to report.
ITEM 11. CONTROLS AND PROCEDURES.
(a) Disclose the conclusions of the registrant’s principal executive and principal financial officers, or persons performing similar functions, regarding the effectiveness of the registrant’s disclosure controls and procedures (as defined in Rule 30a-3(c) under the Act (17 CFR 270.30a-3(c))) as of a date within 90 days of the filing date of the report that includes the disclosure required by this paragraph, based on the evaluation of these controls and procedures required by Rule 30a-3(b) under the Act (17 CFR 270.30a-3(b)) and Rules 13a-15(b) or 15d-15(b) under the Exchange Act (17 CFR 240.13a-15(b) or 240.15d-15(b)).
The Registrant’s principal executive and principal financial officers have concluded, based on their evaluation of the Registrant’s disclosure controls and procedures as of a date within 90 days of the filing date of this report, that the Registrant’s disclosure controls and procedures are reasonably designed to ensure that information required to be disclosed by the Registrant on Form N-CSR is recorded, processed, summarized and reported within the required time periods and that information required to be disclosed by the Registrant in the reports that it files or submits on Form N- CSR is accumulated and communicated to the Registrant’s management, including its principal executive and principal financial officers, as appropriate to allow timely decisions regarding required disclosure.
(b) Disclose any change in the registrant’s internal control over financial reporting (as defined in Rule 30a-3(d) under the Act (17 CFR 270.30a-3(d)) that occurred during the registrant’s second fiscal quarter of the period covered by this report that has materially affected, or is reasonably likely to materially affect, the registrant’s internal control over financial reporting.
There were no changes in the Registrant’s internal control over financial reporting that occurred during the last fiscal quarter covered by this report that have materially affected, or are reasonably likely to materially affect, the Registrant’s internal control over financial reporting.
ITEM 12. EXHIBITS.
(a) File the exhibits listed below as part of this Form. Letter or number the exhibits in the sequence indicated.
(a)(1) Any code of ethics, or amendment thereto, that is the subject of the disclosure required by Item 2, to the extent that the registrant intends to satisfy the Item 2 requirements through filing of an exhibit.
Not applicable.
(a)(2) A separate certification for each principal executive officer and principal financial officer of the registrant as required by Rule 30a-2(a) under the Act (17 CFR 270.30a-2).
Certifications pursuant to Rule 30a-2(a) under the Investment Company Act of 1940 are attached hereto.
(a)(3) Any written solicitation to purchase securities under Rule 23c-1 under the Act (17 CFR 270.23c-1) sent or given during the period covered by the report by or on behalf of the registrant to 10 or more persons.
Not applicable.
(b) A separate or combined certification for each principal executive officer and principal officer of the registrant as required by Rule 30a-2(b) under the Act of 1940.
Certifications pursuant to Rule 30a-2(b) under the Investment Company Act of 1940 are attached hereto.
SIGNATURES
Pursuant to the requirements of the Securities Exchange Act of 1934 and the Investment Company Act of 1940, the registrant has duly caused this report to be signed on its behalf by the undersigned, thereunto duly authorized.
| | |
| J.P. Morgan Fleming Mutual Fund Group, Inc. |
| |
| By: | | /s/ Robert L. Young |
| | Robert L. Young |
| | President and Principal Executive Officer |
| | March 7, 2014 |
Pursuant to the requirements of the Securities Exchange Act of 1934 and the Investment Company Act of 1940, this report has been signed below by the following persons on behalf of the registrant and in the capacities and on the dates indicated.
| | |
| By: | | /s/ Robert L. Young |
| | Robert L. Young |
| | President and Principal Executive Officer |
| | March 7, 2014 |
| |
| By: | | /s/ Joy C. Dowd |
| | Joy C. Dowd |
| | Treasurer and Principal Financial Officer |
| | March 7, 2014 |