UNITED STATES
SECURITIES AND EXCHANGE COMMISSION
Washington, D.C. 20549
FORM N-CSR
CERTIFIED SHAREHOLDER REPORT OF REGISTERED
MANAGEMENT INVESTMENT COMPANIES
Investment Company Act file number: 811-08189
J.P. Morgan Fleming Mutual Fund Group, Inc.
(Exact name of registrant as specified in charter)
277 Park Avenue
New York, NY 10172
(Address of principal executive offices) (Zip code)
Gregory S. Samuels
277 Park Avenue
New York, NY 10172
(Name and Address of Agent for Service)
Registrant’s telephone number, including area code: (800) 480-4111
Date of fiscal year end: June 30
Date of reporting period: July 1, 2023 through December 31, 2023
Form N-CSR is to be used by management investment companies to file reports with the Commission not later than 10 days after the transmission to stockholders of any report that is required to be transmitted to stockholders under Rule 30e-1 under the Investment Company Act of 1940 (17 CFR 270.30e-1). The Commission may use the information provided on Form N-CSR in its regulatory, disclosure review, inspection, and policymaking roles.
A registrant is required to disclose the information specified by Form N-CSR, and the Commission will make this information public. A registrant is not required to respond to the collection of information contained in Form N-CSR unless the Form displays a currently valid Office of Management and Budget (“OMB”) control number. Please direct comments concerning the accuracy of the information collection burden estimate and any suggestions for reducing the burden to Secretary, Securities and Exchange Commission, 450 Fifth Street, NW, Washington, DC 20549-0609. The OMB has reviewed this collection of information under the clearance requirements of 44 U.S.C. Section 3507.
ITEM 1. REPORTS TO STOCKHOLDERS.
a.) The following is a copy of the report transmitted to shareholders pursuant to Rule 30e-1 under the Investment Company Act of 1940 (17 CFR 270.30e-1).
b.) A copy of the notice transmitted to shareholders in reliance on Rule 30e-3 under the 1940 Act that contains disclosures specified by paragraph (c)(3) of that rule is included in the Annual Reports. Not Applicable. Notices do not incorporate disclosures from the shareholder report.
Semi-Annual Report
J.P. Morgan Mid Cap/Multi-Cap Funds
December 31, 2023 (Unaudited)
JPMorgan Growth Advantage Fund |
JPMorgan Mid Cap Equity Fund |
JPMorgan Mid Cap Growth Fund |
JPMorgan Mid Cap Value Fund |
JPMorgan Value Advantage Fund |
CONTENTS
Investments in a Fund are not deposits or obligations of, or guaranteed or endorsed by, any bank and are not insured or guaranteed by the FDIC, the Federal Reserve Board or any other government agency. You could lose money if you sell when a Fund’s share price is lower than when you invested.
Past performance is no guarantee of future performance. The general market views expressed in this report are opinions based on market and other conditions through the end of the reporting period and are subject to change without notice. These views are not intended to predict the future performance of a Fund or the securities markets.
Prospective investors should refer to the Funds’ prospectuses for a discussion of the Funds’ investment objectives, strategies and risks. Call J.P. Morgan Funds Service Center at 1-800-480-4111 for a prospectus containing more complete information about a Fund, including management fees and other expenses. Please read it carefully before investing.
Letter to ShareholdersFebruary 7, 2024 (Unaudited)
Dear Shareholder,
U.S. equity markets surged through the end of 2023 and into early 2024 as the risk of economic recession receded and the prospect of lower interest rates drove investor optimism. Globally, financial markets largely generated positive returns, despite heightened geopolitical tensions and signs of economic weakness across Europe and China.
|
“Investors appear to have begun 2024 with a positive outlook, with the U.S. economy and its financial markets leading global growth.” — Brian S. Shlissel
|
Inflation pressures eased sufficiently during the second half of 2023 to allow the U.S. Federal Reserve (the “Fed”) to hold the benchmark discount interest rate at 5.25% at its June 2023 meeting, ending a string of 10 consecutive interest rate increases. The Fed raised rates once more in July 2023, then held the benchmark rate at 5.50% for the remainder of the 2023.
In the face of elevated interest rates, the U.S. economy proved surprisingly resilient and largely led developed markets in growth through the end of 2023. Gross domestic product outpaced economists’ consensus expectations with a 4.9% jump in the third quarter and estimated growth of 3.3% in the fourth quarter. Though the U.S. economy continued to expand, inflation data indicated that the Fed’s efforts to cool the domestic economy appeared to be effective.
Certain other measures of the U.S. economy showed little sign of weakness. Consumer spending remained elevated in the second half of 2023 and rose month-to-month to reach approximately $709.9 billion in retail sales in December 2023. The unemployment rate settled at 3.7% in the final two months of 2023 as approximately 333,000 jobs were added in December alone. Further, an estimated 353,000 jobs were added in January 2024, approximately double the increase anticipated by certain economists.
Both equity and bond markets in the U.S. performed well, buoyed by the overall strength shown by the U.S. economy and the apparent turn in Fed policy. Stronger-than-expected consumer spending and corporate earnings, as well as investor expectations for artificial-intelligence-driven productivity gains bolstered demand for equities in recent months. Certain leading U.S. equity indexes returned more than 9% in November and in excess of 5% in December 2023. In January 2024, the S&P 500 Index reached six new closing highs and surpassed 4,800 points for the first time. However, equity market gains were not broadly spread: The largest 10 stocks in the S&P 500 Index comprised approximately 90% of the index’s price gains for all of 2023.
While U.S. financial markets largely appeared to withstand increased geopolitical tensions in 2023, the potential for the conflicts in Ukraine and Israel to expand in intensity and geography may threaten global economic growth and increase market volatility. Additionally, the Fed may be forced to change policy should the strength of U.S. economy recede or the downward trend in inflation were to reverse.
Investors appear to have begun 2024 with a positive outlook, with the U.S. economy and its financial markets leading global growth. While risks to the growth outlook remain, we believe investors who hold a well-diversified portfolio over the long term should be positioned to benefit from positive economic trends.
Our suite of investment solutions seeks to provide investors with the ability to build durable portfolios that meet their financial goals, regardless of macroeconomic and geopolitical uncertainties.
Sincerely,
Brian S. Shlissel
President, J.P. Morgan Funds
J.P. Morgan Asset Management
1-800-480-4111 or www.jpmorganfunds.com for more information
| J.P. Morgan Mid Cap/Multi-Cap Funds | |
J.P. Morgan Mid Cap/Multi-Cap Funds
MARKET OVERVIEWSIX MONTHS ENDED December 31, 2023 (Unaudited)
U.S. equity markets largely rallied in the final two months of 2023, rebounding from three months of declines to generate positive returns for the six month period. Investor demand for large cap stocks in the technology and communications sectors was a leading driver of equity market returns. Bond markets generally provided positive returns but underperformed equity markets.
After raising its policy benchmark interest rates by 0.25% in July 2023, the U.S. Federal Reserve (the “Fed”) declined to raise rates further at its next three meetings for the year. More importantly for investors, the central bank stated in December 2023 that it could begin to lower interest rates in the first half of 2024, if inflationary pressures continued to recede.
While the U.S. economic growth showed signs of slowing in mid-2023, third-quarter gross domestic product exceeded economists’ consensus expectations with a 4.9% increase. Growth was largely driven by resilient consumer spending and inventory building by businesses. The unemployment rate in the U.S. remained historically low at 3.8% for most of the six-month period before settling at 3.7% in December 2023. The data and the outlook for interest rates fed investor expectations that the U.S. could avoid an economic recession in 2024.
U.S. equities generally outperformed both international developed markets and emerging markets equities for the period. Overall, gains in U.S. markets were led by large capitalization stocks in the technology and communications sectors, particularly the so-called Magnificent Seven: Apple Inc., Amazon.com Inc., Alphabet Inc., Meta Platforms Inc., Microsoft Corp., Nvidia Corp. and Tesla Inc. At the end of 2023, the 10 largest companies in the S&P 500 Index accounted for 31.2% of the index’s total market capitalization. Notably, only within small cap stocks did value outperform growth for the period.
Investor expectations that the Fed and private sector banks could begin to lower their interest rates sparked a broad rally in U.S. fixed income markets in the final two months of 2023. Overall, lower quality bonds, high yield bonds (also known a junk bonds) and emerging markets debt outperformed U.S. Treasury bonds and higher quality U.S. corporate debt.
| J.P. Morgan Mid Cap/Multi-Cap Funds | |
JPMorgan Growth Advantage Fund
FUND COMMENTARYSIX MONTHS ENDED December 31, 2023 (Unaudited)
| |
Fund (Class A Shares, without a sales charge) * | |
Russell 3000 Growth Index | |
Net Assets as of 12/31/2023 (In Thousands) | |
INVESTMENT OBJECTIVE **
The JPMorgan Growth Advantage Fund (the “Fund”) seeks to provide long-term capital growth.
WHAT WERE THE MAIN DRIVERS OF THE FUND’S PERFORMANCE?
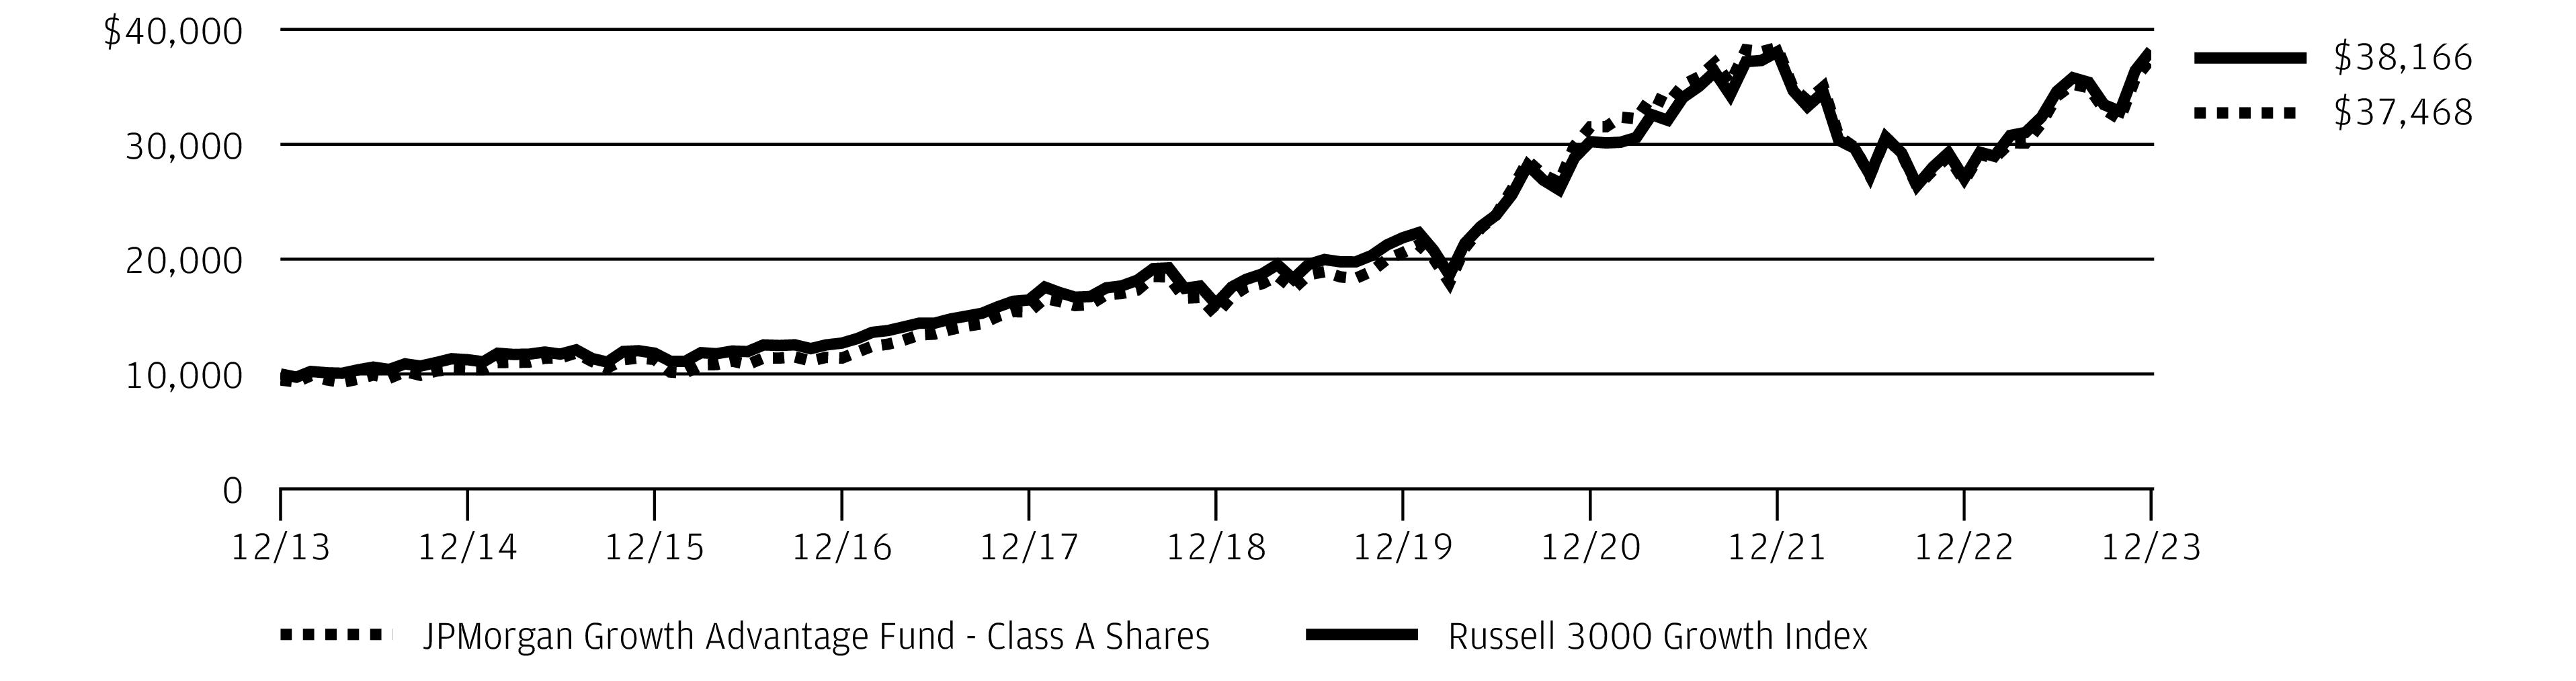
The Fund’s Class A Shares, without a sales charge, underperformed the Russell 3000 Growth Index (the “Benchmark”) for the six months ended December 31, 2023.
The Fund’s security selection in the health care and industrials sectors was a leading detractor from performance relative to the Benchmark, while the Fund’s security selection in the technology and consumer discretionary sectors was a leading contributor to relative performance.
Leading individual detractors from relative performance included the Fund’s out-of-Benchmark position in SolarEdge Technologies Inc. and its overweight positions in Confluent Inc. and Exact Sciences Inc. Shares of SolarEdge Technologies, a manufacturer of semiconductor materials and equipment for the solar energy industry, fell amid lower-than-expected reported sales during the period and weakness in the broader solar energy sector. Shares of Confluent, a software developer, fell sharply after the company issued a weaker than expected earnings forecast. Shares of Exact Sciences, a provider of cancer screening and medical diagnostic tests, fell following a rally in the shares in the first half of 2023.
Leading individual contributors to relative performance included the Fund’s underweight position in Apple Inc. and its overweight positions in Intuit Inc. and Uber Technologies Inc. Shares of Apple, a diversified information technology provider, fell late in the period following a rally that pushed the company’s share price to a record high on December 14, 2023. Shares of Intuit, a financial software developer, rose after the company reported better-than-expected earnings and revenue for its fiscal first quarter. Shares of Uber Technologies, a ride-hailing service, rose amid increased bookings and after the company was included in the S&P 500 Index.
HOW WAS THE FUND POSITIONED?
The Fund’s portfolio managers utilized a bottom-up approach to stock selection, researching individual companies across
market capitalizations in an effort to construct portfolios of stocks that have strong fundamentals. The Fund’s portfolio managers sought to invest in high quality companies with durable franchises that, in their view, possessed the ability to
generate strong future earnings growth.
TOP TEN HOLDINGS OF THE
PORTFOLIO AS OF December 31, 2023 | PERCENT OF
TOTAL
INVESTMENTS |
| | |
| | |
| | |
| | |
| Meta Platforms, Inc., Class A | |
| | |
| Mastercard, Inc., Class A | |
| | |
| | |
| | |
PORTFOLIO COMPOSITION BY SECTOR
AS OF December 31, 2023 | PERCENT OF
TOTAL
INVESTMENTS |
| |
| |
| |
| |
| |
| |
| |
Others (each less than 1.0%) | |
| |
*
The return shown is based on net asset values calculated for shareholder transactions and may differ from the return shown in the financial highlights, which reflects adjustments made to the net asset values in accordance with accounting principles generally accepted in the United States of America.
**
The adviser seeks to achieve the Fund’s objective. There can be no guarantee it will be achieved.
| J.P. Morgan Mid Cap/Multi-Cap Funds | |
JPMorgan Growth Advantage Fund
FUND COMMENTARYSIX MONTHS ENDED December 31, 2023 (Unaudited) (continued)
AVERAGE ANNUAL TOTAL RETURNS AS OF December 31, 2023
|
| |
| Sales Charge for Class A Shares is 5.25%. |
| Assumes a 1% CDSC (contingent deferred sales charge) for the 6 month and one year periods and 0% CDSC thereafter. |
TEN YEAR FUND PERFORMANCE (12/31/13 TO 12/31/23)
The performance quoted is past performance and is not a guarantee of future results. Mutual funds are subject to certain market risks. Investment returns and principal value of an investment will fluctuate so that an investor’s shares, when redeemed, may be worth more or less than their original cost. Current performance may be higher or lower than the performance data shown. Updated performance information is available by visiting www.jpmorganfunds.com or by calling 1-800-480-4111.
Returns for Class R2 and Class R3 Shares prior to their inception dates are based on the performance of Class A Shares. The actual returns for Class R2 Shares would have been lower than those shown because Class R2 Shares have higher expenses than Class A Shares. The actual returns for Class R3 Shares would have been similar to those shown because Class R3 Shares have similar expenses to Class A Shares.
Returns for Class R4 Shares prior to their inception dates are based on the performance of Class I Shares. The actual returns of Class R4 Shares would have been different than those shown because Class R4 Shares have different expenses to Class I Shares.
The graph illustrates comparative performance for $10,000 invested in Class A Shares of the JPMorgan Growth Advantage Fund and the Russell 3000 Growth Index from December 31, 2013 to December 31, 2023. The performance of the Fund assumes reinvestment of all dividends and capital gain distributions, if any, and includes a sales charge. The performance of the Russell 3000 Growth Index does not reflect the deduction of expenses or a sales charge associated with a mutual fund and has been adjusted to reflect reinvestment of all
dividends and capital gain distributions of the securities included in the benchmark, if applicable. The Russell 3000 Growth Index is an unmanaged index which measures the performance of those Russell 3000 companies (largest 3000 U.S. companies) with higher price-to-book ratios and higher forecasted growth values. Investors cannot invest directly in an index.
Class A Shares have a $1,000 minimum initial investment and carry a 5.25% sales charge.
Fund performance may reflect the waiver of the Fund’s fees and reimbursement of expenses for certain periods. Without these waivers and reimbursements, performance would have been lower. Also, performance shown in this section does not reflect the deduction of taxes that a shareholder would pay on Fund distributions or on gains resulting from redemptions of Fund shares.
Because Class C Shares automatically convert to Class A Shares after 8 years, the 10 year average annual total return shown above for Class C Shares reflects Class A Share's performance for the period after conversion.
The returns shown are based on net asset values calculated for shareholder transactions and may differ from the returns shown in the financial highlights, which reflect adjustments made to the net asset values in accordance with accounting principles generally accepted in the United States of America.
Frank Russell Company is the source and owner of the Russell Index data contained or reflected in this material and all trademarks and copyrights related thereto. Frank Russell Company is not responsible for the formatting or configuration of this material or for any inaccuracy in the adviser's presentation thereof.
| J.P. Morgan Mid Cap/Multi-Cap Funds | |
JPMorgan Mid Cap Equity Fund
FUND COMMENTARYSIX MONTHS ENDED December 31, 2023 (Unaudited)
| |
| |
| |
Net Assets as of 12/31/2023 (In Thousands) | |
INVESTMENT OBJECTIVE **
The JPMorgan Mid Cap Equity Fund (the “Fund”) seeks long-term capital growth.
WHAT WERE THE MAIN DRIVERS OF THE FUND’S PERFORMANCE?
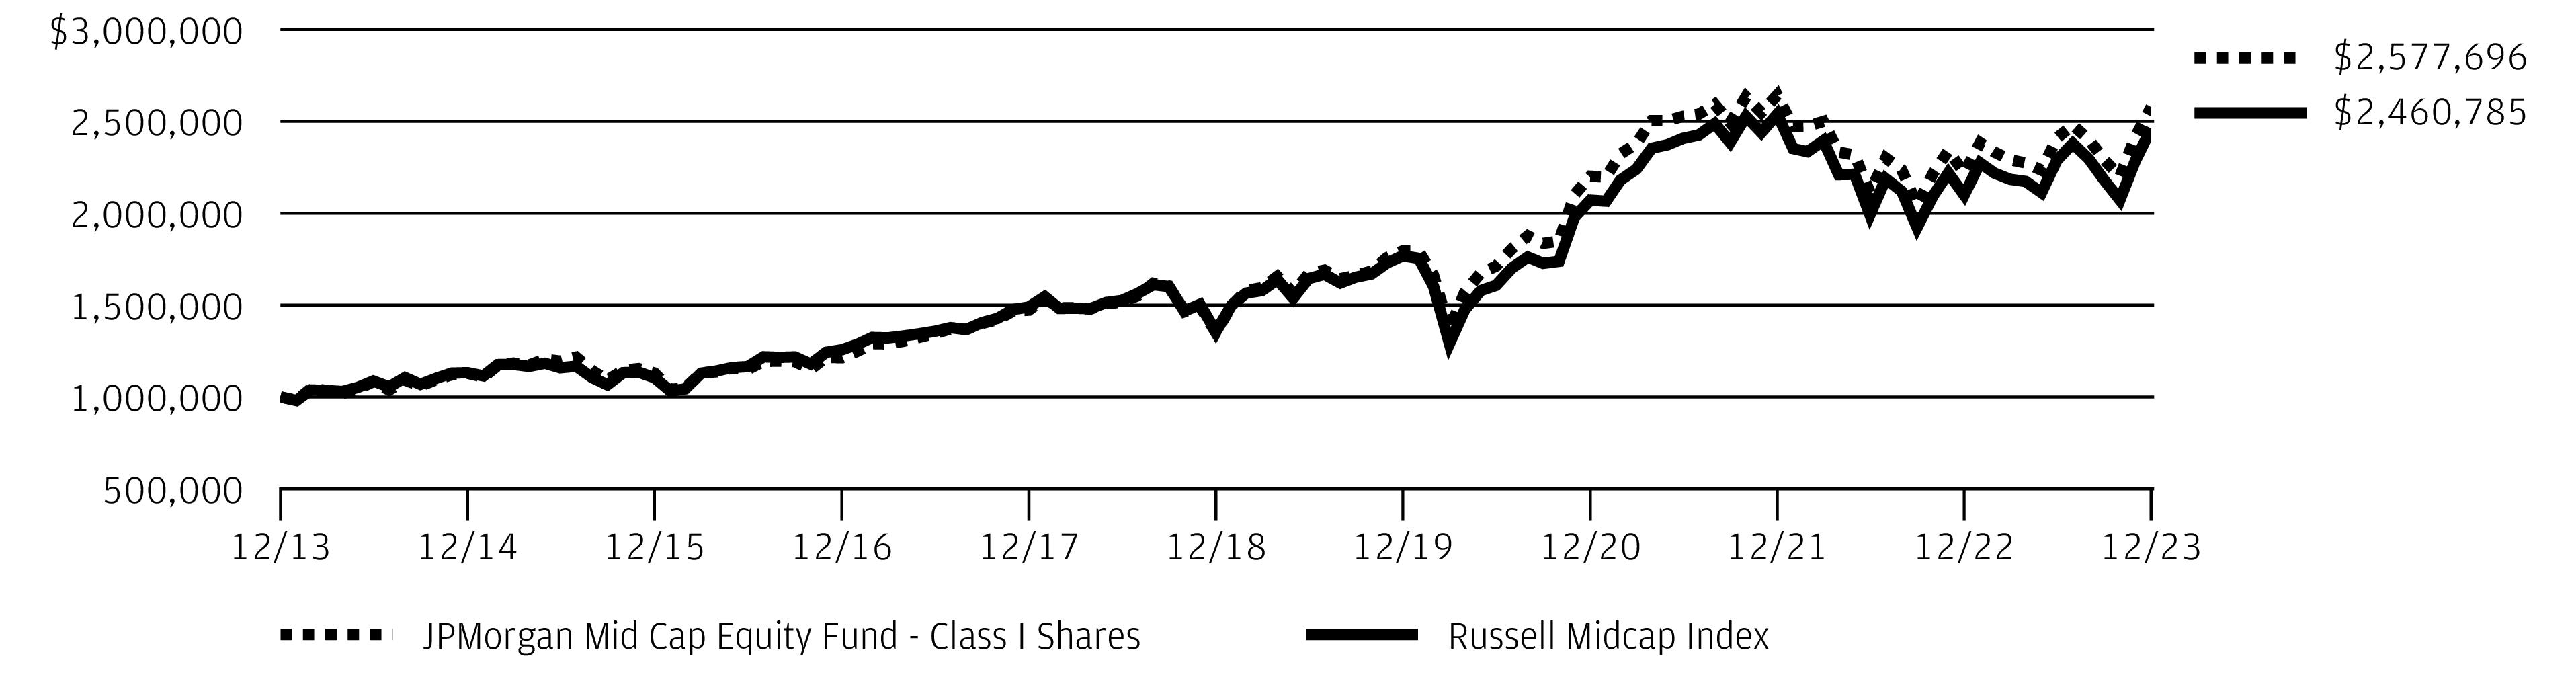
The Fund’s Class I Shares underperformed the Russell Midcap Index (the “Benchmark”) for the six months ended December 31, 2023.
The Fund’s security selection in the industrials and energy sectors was a leading detractor from performance relative to the Benchmark, while the Fund’s security selection in the consumer discretionary and consumer staples sectors was a leading contributor to relative performance.
Leading individual detractors from relative performance included the Fund’s out-of-Benchmark position in SolarEdge Technologies Inc. and its overweight positions in LKQ Corp. and Confluent Inc. Shares of SolarEdge Technologies, a manufacturer of semiconductor materials and equipment for the solar energy industry, fell amid lower-than-expected reported sales during the period and weakness in the broader solar energy sector. Shares of LKQ, an automotive parts distributor, fell after the company reported lower-than-expected earnings for the third quarter of 2023. Shares of Confluent, a software developer, fell sharply after the company issued a weaker than expected earnings forecast.
Leading individual contributors to relative performance included the Fund’s overweight positions in ITT Inc., CrowdStrike Holdings Inc., and Jabil Inc. Shares of ITT, a manufacturer of industrial machinery and components, rose amid consecutive quarters of better-than-expected earnings during the period. Shares of CrowdStrike Holdings, a data security software provider, rose amid surging corporate demand for cybersecurity and artificial intelligence technologies. Shares of Jabil, an electronics manufacturer, rose after the company reported better-than-expected earnings and revenue for its fiscal first quarter.
HOW WAS THE FUND POSITIONED?
The Fund’s portfolio managers employed a bottom-up approach to stock selection, constructing a portfolio based on company
fundamentals, quantitative screening and proprietary fundamental analysis. The Fund’s portfolio managers sought to identify dominant franchises with predictable business models they deemed capable of achieving, in their view, sustained growth, as well as undervalued companies with the potential to
grow their intrinsic value per share.
TOP TEN HOLDINGS OF THE
PORTFOLIO AS OF December 31, 2023 | PERCENT OF
TOTAL
INVESTMENTS |
| | |
| | |
| | |
| Ameriprise Financial, Inc. | |
| | |
| Raymond James Financial, Inc. | |
| Teledyne Technologies, Inc. | |
| | |
| | |
| | |
PORTFOLIO COMPOSITION BY SECTOR
AS OF December 31, 2023 | PERCENT OF
TOTAL
INVESTMENTS |
| |
| |
| |
| |
| |
| |
| |
| |
| |
| |
| |
| |
*
The return shown is based on net asset values calculated for shareholder transactions and may differ from the return shown in
| J.P. Morgan Mid Cap/Multi-Cap Funds | |
JPMorgan Mid Cap Equity Fund
FUND COMMENTARYSIX MONTHS ENDED December 31, 2023 (Unaudited) (continued)
the financial highlights, which reflects adjustments made to the net asset values in accordance with accounting principles generally accepted in the United States of America.
**
The adviser seeks to achieve the Fund’s objective. There can be no guarantee it will be achieved.
| J.P. Morgan Mid Cap/Multi-Cap Funds | |
AVERAGE ANNUAL TOTAL RETURNS AS OF December 31, 2023
|
| |
| Sales Charge for Class A Shares is 5.25%. |
| Assumes a 1% CDSC (contingent deferred sales charge) for the 6 month and one year periods and 0% CDSC thereafter. |
TEN YEAR FUND PERFORMANCE (12/31/13 TO 12/31/23)
The performance quoted is past performance and is not a guarantee of future results. Mutual funds are subject to certain market risks. Investment returns and principal value of an investment will fluctuate so that an investor’s shares, when redeemed, may be worth more or less than their original cost. Current performance may be higher or lower than the performance data shown. Updated performance information is available by visiting www.jpmorganfunds.com or by calling 1-800-480-4111.
Returns for Class R2 Shares prior to their inception date are based on the performance of Class A Shares. The actual returns of Class R2 Shares would have been lower than those shown because Class R2 Shares have higher expenses than Class A Shares.
Returns for Class R5 and Class R6 Shares prior to their inception date are based on the performance of Class I Shares. The actual returns of Class R5 and Class R6 Shares would have been different than those shown because Class R5 and Class R6 Shares have different expenses than Class I Shares.
The graph illustrates comparative performance for $1,000,000 invested in the Class I Shares of JPMorgan Mid Cap Equity Fund and the Russell Midcap Index from December 31, 2013 to December 31, 2023. The performance of the Fund assumes reinvestment of all dividends and capital gain distributions, if any, and does not include a sales charge. The performance of the Russell Midcap Index does not reflect the deduction of expenses or a sales charge associated with a mutual fund and has been adjusted to reflect reinvestment of all dividends and capital gain distributions of the securities included in the bench mark, if
applicable. The Russell Midcap Index is an unmanaged index which measures the performance of the 800 smallest companies in the Russell 1000 Index. Investors cannot invest directly in an index.
Class I Shares have a $1,000,000 minimum initial investment.
Fund performance may reflect the waiver of the Fund’s fees and reimbursement of expenses for certain periods. Without these waivers and reimbursements, performance would have been lower. Also, performance shown in this section does not reflect the deduction of taxes that a shareholder would pay on Fund distributions or on gains resulting from redemptions of Fund shares.
Because Class C Shares automatically convert to Class A Shares after 8 years, the 10 year average annual total return shown above for Class C Shares reflects Class A Share's performance for the period after conversion.
The returns shown are based on net asset values calculated for shareholder transactions and may differ from the returns shown in the financial highlights, which reflect adjustments made to the net asset values in accordance with accounting principles generally accepted in the United States of America.
Frank Russell Company is the source and owner of the Russell Index data contained or reflected in this material and all trademarks and copyrights related thereto. Frank Russell Company is not responsible for the formatting or configuration of this material or for any inaccuracy in the adviser's presentation thereof.
| J.P. Morgan Mid Cap/Multi-Cap Funds | |
JPMorgan Mid Cap Growth Fund
FUND COMMENTARYSIX MONTHS ENDED December 31, 2023 (Unaudited)
| |
| |
Russell Midcap Growth Index | |
Net Assets as of 12/31/2023 (In Thousands) | |
INVESTMENT OBJECTIVE **
The JPMorgan Mid Cap Growth Fund (the “Fund”) seeks growth of capital.
WHAT WERE THE MAIN DRIVERS OF THE FUND’S PERFORMANCE?
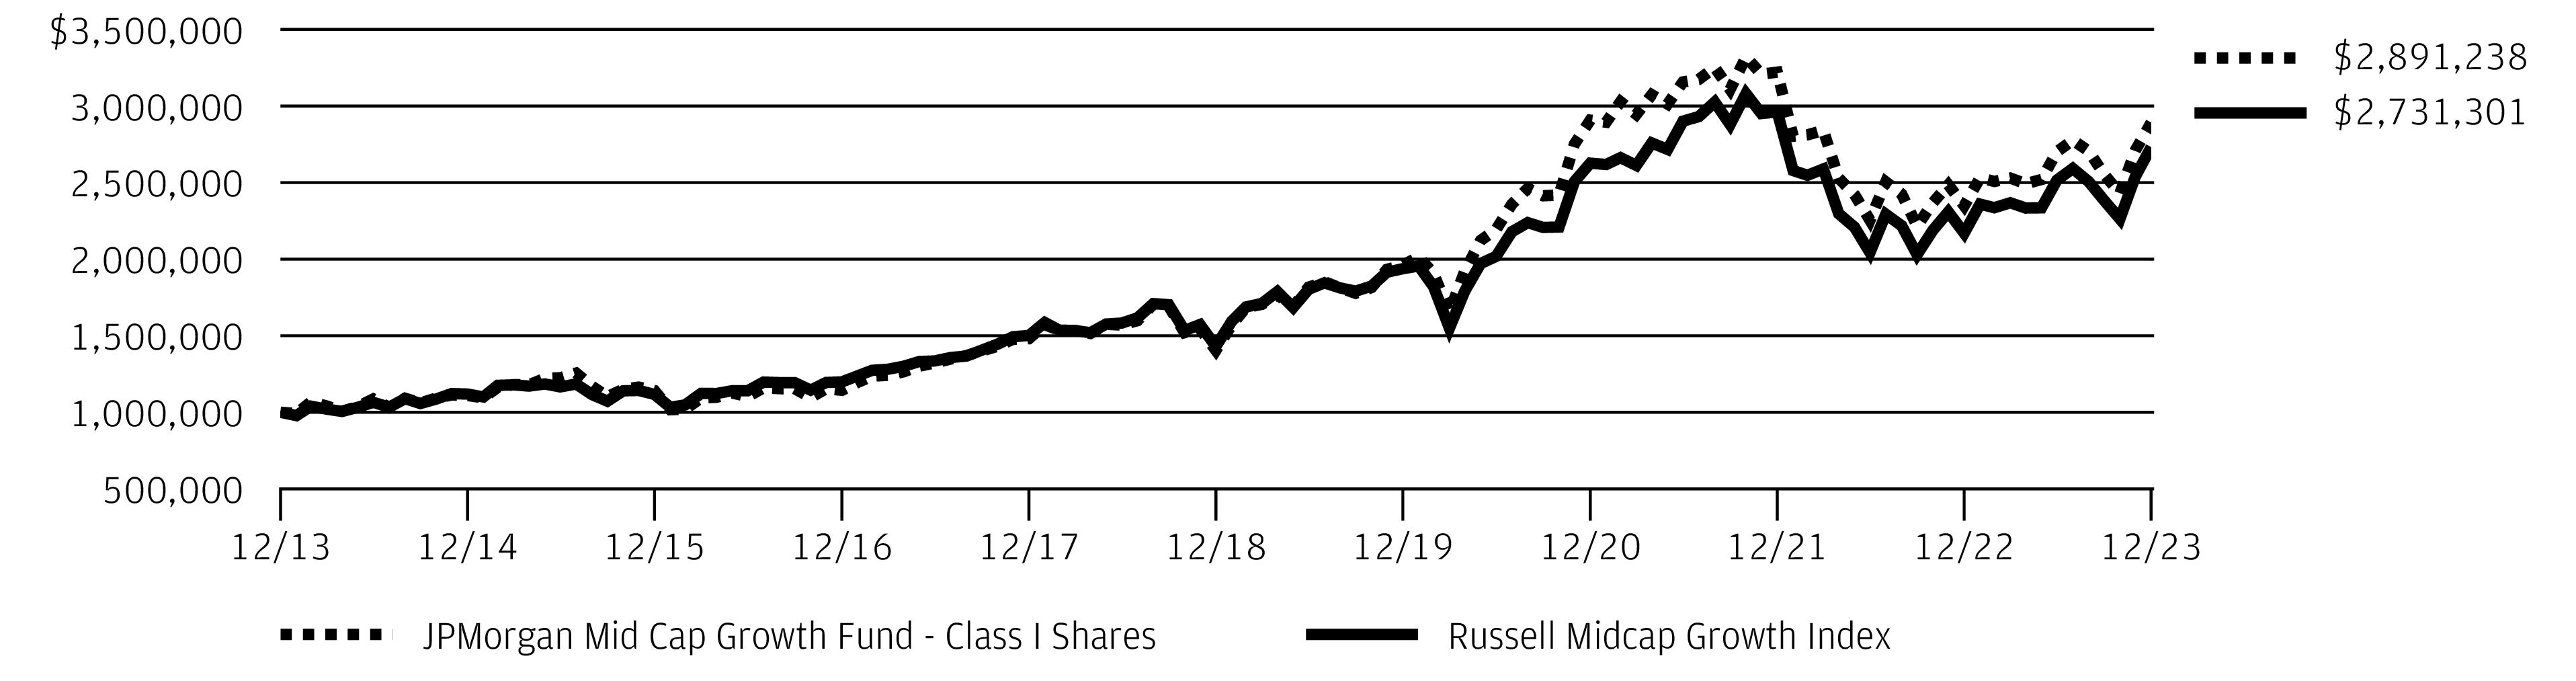
The Fund’s Class I Shares underperformed the Russell Midcap Growth Index (the “Benchmark”) for the six months ended December 31, 2023.
The Fund’s security selection in the technology and industrials sectors was a leading detractor from performance relative to the Benchmark, while the Fund’s security selection in the consumer discretionary sector and its underweight position in the consumer staples sectors were leading contributors to relative performance.
Leading individual detractors from relative performance included the Fund’s out-of-Benchmark position in SolarEdge Technologies Inc. and its overweight positions in Confluent Inc. and Exact Sciences Inc. Shares of SolarEdge Technologies, a manufacturer of semiconductor materials and equipment for the solar energy industry, fell amid lower-than-expected reported sales during the period and weakness in the broader solar energy sector. Shares of Confluent, a software developer, fell sharply after the company issued a weaker-than-expected earnings forecast. Shares of Exact Sciences, a provider of cancer screening and medical diagnostic tests, fell following a rally in the shares in the first half of 2023.
Leading individual contributors to relative performance included the Fund’s overweight position in CrowdStrike Holdings Inc., its out-of-Benchmark position in Uber Technologies Inc. and its underweight position in Paycom Software Inc. Shares of CrowdStrike Holdings, a data security software provider, rose amid surging corporate demand for cybersecurity and artificial intelligence technologies. Shares of Uber Technologies, a ride-hailing service, rose amid increased bookings and after the company was included in the S&P 500 Index. Shares of Paycom Software, a provider of business management software, fell after the company reported lower-than-expected revenue for the third quarter of 2023 and issued a weaker-than-expected revenue forecast for the fourth quarter of 2023.
HOW WAS THE FUND POSITIONED?
The Fund’s portfolio managers utilized a bottom-up approach to stock selection, researching individual companies in an effort to construct a portfolio of stocks that have strong fundamentals. The Fund’s portfolio managers sought to invest in high quality companies with durable franchises that, in their view, possessed the ability to generate strong future earnings
growth.
TOP TEN HOLDINGS OF THE
PORTFOLIO AS OF December 31, 2023 | PERCENT OF
TOTAL
INVESTMENTS |
| Crowdstrike Holdings, Inc., Class A | |
| | |
| | |
| | |
| | |
| Agilent Technologies, Inc. | |
| | |
| Trade Desk, Inc. (The), Class A | |
| | |
| | |
PORTFOLIO COMPOSITION BY SECTOR
AS OF December 31, 2023 | PERCENT OF
TOTAL
INVESTMENTS |
| |
| |
| |
| |
| |
| |
| |
| |
Others (each less than 1.0%) | |
| |
*
The return shown is based on net asset values calculated for shareholder transactions and may differ from the return shown in
| J.P. Morgan Mid Cap/Multi-Cap Funds | |
the financial highlights, which reflects adjustments made to the net asset values in accordance with accounting principles generally accepted in the United States of America.
**
The adviser seeks to achieve the Fund’s objective. There can be no guarantee it will be achieved.
| J.P. Morgan Mid Cap/Multi-Cap Funds | |
JPMorgan Mid Cap Growth Fund
FUND COMMENTARYSIX MONTHS ENDED December 31, 2023 (Unaudited) (continued)
AVERAGE ANNUAL TOTAL RETURNS AS OF December 31, 2023
|
| |
| Sales Charge for Class A Shares is 5.25%. |
| Assumes a 1% CDSC (contingent deferred sales charge) for the 6 month and one year periods and 0% CDSC thereafter. |
TEN YEAR FUND PERFORMANCE (12/31/13 TO 12/31/23)
The performance quoted is past performance and is not a guarantee of future results. Mutual funds are subject to certain market risks. Investment returns and principal value of an investment will fluctuate so that an investor’s shares, when redeemed, may be worth more or less than their original cost. Current performance may be higher or lower than the performance data shown. Updated performance information is available by visiting www.jpmorganfunds.com or by calling 1-800-480-4111.
Returns for the Class R3 and Class R4 Shares prior to their inception dates are based on the performance of Class I Shares. Prior performance for Class R3 and Class R4 Shares has been adjusted to reflect the differences in expenses between classes.
The graph illustrates comparative performance for $1,000,000 invested in Class I Shares of the JPMorgan Mid Cap Growth Fund and the Russell Midcap Growth Index from December 31, 2013 to December 31, 2023. The performance of the Fund assumes reinvestment of all dividends and capital gain distributions, if any, and does not include a sales charge. The performance of the Russell Midcap Growth Index does not reflect the deduction of expenses or a sales charge associated with a mutual fund and has been adjusted to reflect reinvestment of all dividends and capital gain distributions of the securities included in the benchmark, if applicable. The Russell Midcap Growth Index is an unmanaged index which measures the performance of those Russell Midcap companies with higher price-to-book ratios and higher forecasted growth values. Investors cannot invest directly in an index.
Class I Shares have a $1,000,000 minimum initial investment.
Fund performance may reflect the waiver of the Fund’s fees and reimbursement of expenses for certain periods. Without these waivers and reimbursements, performance would have been lower. Also, performance shown in this section does not reflect the deduction of taxes that a shareholder would pay on Fund distributions or on gains resulting from redemptions of Fund shares.
Because Class C Shares automatically convert to Class A Shares after 8 years, the 10 year average annual total return shown above for Class C Shares reflects Class A Share's performance for the period after conversion.
The returns shown are based on net asset values calculated for shareholder transactions and may differ from the returns shown in the financial highlights, which reflect adjustments made to the net asset values in accordance with accounting principles generally accepted in the United States of America.
Frank Russell Company is the source and owner of the Russell Index data contained or reflected in this material and all trademarks and copyrights related thereto. Frank Russell Company is not responsible for the formatting or configuration of this material or for any inaccuracy in the adviser's presentation thereof.
| J.P. Morgan Mid Cap/Multi-Cap Funds | |
JPMorgan Mid Cap Value Fund
FUND COMMENTARYSIX MONTHS ENDED December 31, 2023 (Unaudited)
| |
| |
Russell Midcap Value Index | |
Net Assets as of 12/31/2023 (In Thousands) | |
INVESTMENT OBJECTIVE**
The JPMorgan Mid Cap Value Fund (the “Fund”) seeks growth from capital appreciation.
WHAT WERE THE MAIN DRIVERS OF THE FUND’S PERFORMANCE?
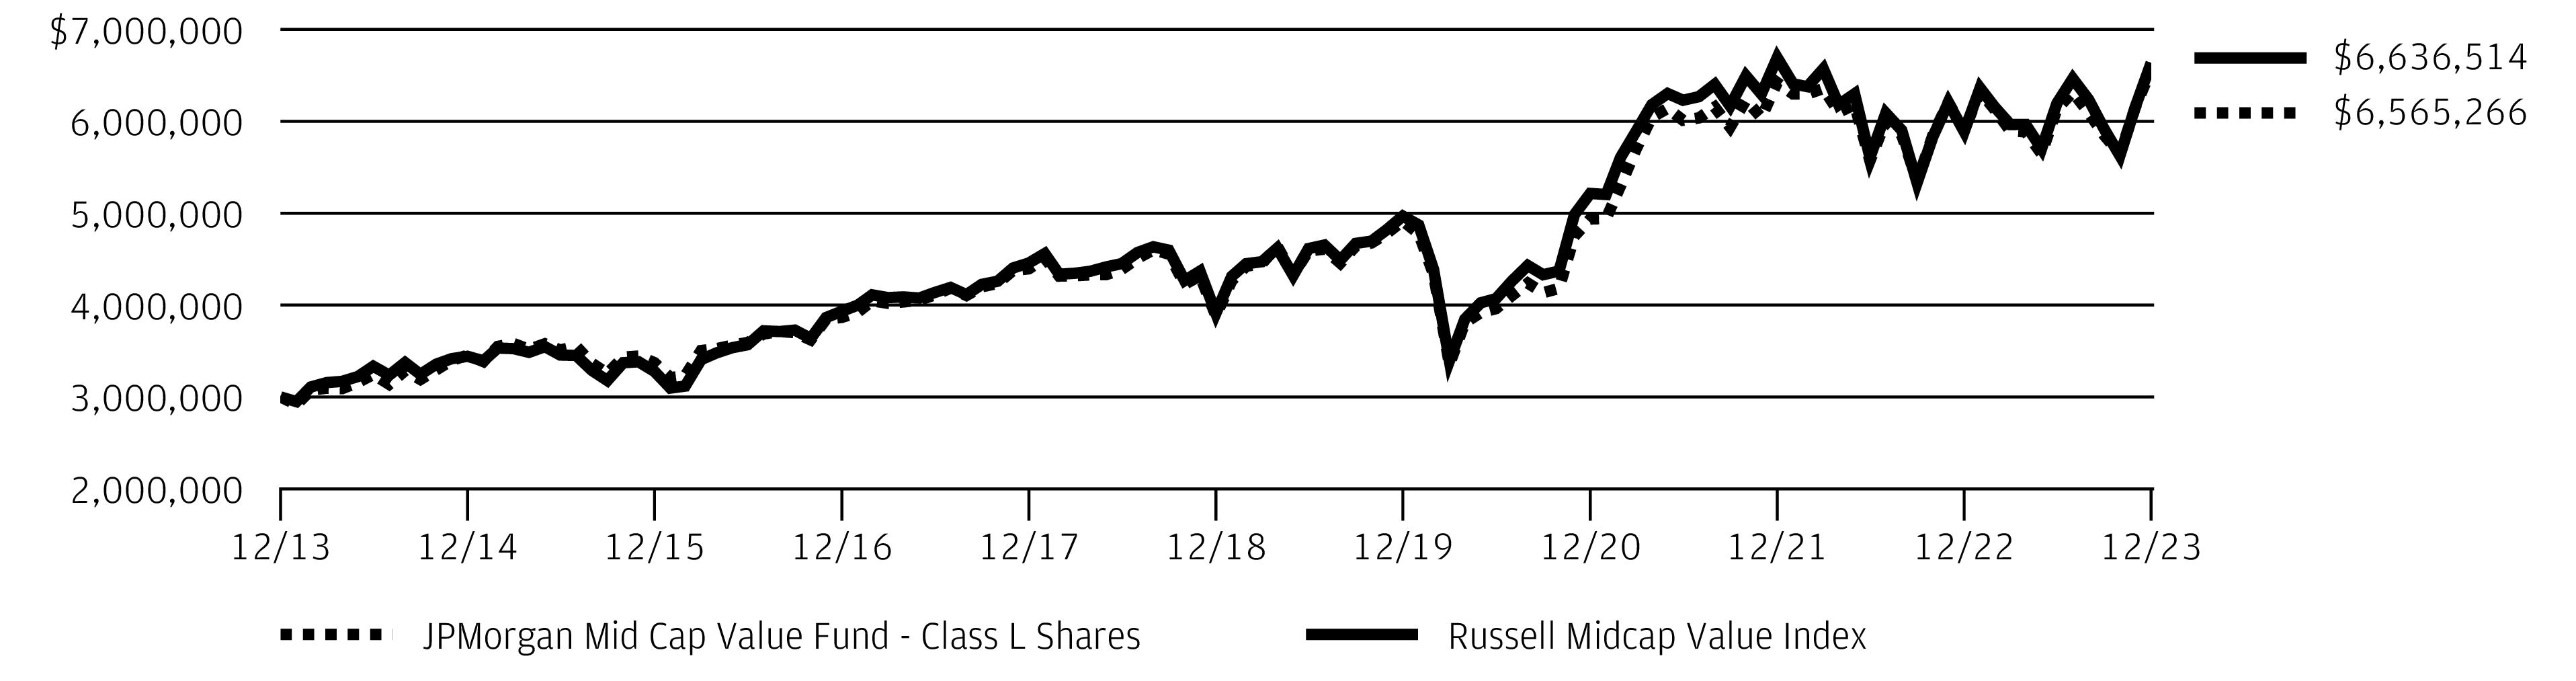
The Fund’s Class L Shares underperformed the Russell Midcap Value Index (the “Benchmark”) for the six months ended December 31, 2023.
The Fund’s security selection in the consumer discretionary and financials sector was a leading detractor from performance relative to the Benchmark, while the Fund’s security selection in the information technology and materials sectors was a leading contributor to relative performance.
Leading individual detractors from relative performance included the Fund’s overweight positions in LKQ Corp. and IAC Inc., and its underweight position in Coinbase Global Inc.
Shares of LKQ, an automotive parts distributor, fell after the company reported lower-than-expected earnings for the third quarter of 2023. Shares of IAC, a provider of interactive media and services, fell amid consecutive quarters of lower-than-expected earnings. Shares of Coinbase Global, a cryptocurrency exchange provider, rose amid a broad rally among stocks in the cryptocurrency subsector late in the period.
Leading individual contributors to relative performance included the Fund’s overweight positions in GoDaddy Inc., ITT Inc. and Expedia Group Inc. Shares of GoDaddy, an e-commerce platform provider, rose after the company reported better-than-expected earnings and revenue for the third quarter of 2023 and investor expectations for the company’s artificial intelligence technology. Shares of ITT, a manufacturer of industrial machinery and components, rose amid consecutive quarters of better-than-expected earnings during the period. Shares of Expedia Group, an online travel and vacation booking service, rose after the company reported better-than-expected earnings and revenue for the third quarter and unveiled a $5 billion share repurchase plan.
HOW WAS THE FUND POSITIONED?
The Fund’s portfolio managers utilized a bottom-up approach to stock selection and sought to identify durable franchises possessing the ability to generate, in their view, sustainable
levels of free cash flow.
TOP TEN HOLDINGS OF THE
PORTFOLIO AS OF December 31, 2023 | PERCENT OF
TOTAL
INVESTMENTS |
| Ameriprise Financial, Inc. | |
| | |
| | |
| | |
| | |
| | |
| Martin Marietta Materials, Inc. | |
| | |
| | |
| Lincoln Electric Holdings, Inc. | |
PORTFOLIO COMPOSITION BY SECTOR
AS OF December 31, 2023 | PERCENT OF
TOTAL
INVESTMENTS |
| |
| |
| |
| |
| |
| |
| |
| |
| |
| |
| |
| |
*
The return shown is based on net asset values calculated for shareholder transactions and may differ from the return shown in the financial highlights, which reflects adjustments made to the net asset values in accordance with accounting principles generally accepted in the United States of America.
**
The adviser seeks to achieve the Fund’s objective. There can be no guarantee it will be achieved.
| J.P. Morgan Mid Cap/Multi-Cap Funds | |
JPMorgan Mid Cap Value Fund
FUND COMMENTARYSIX MONTHS ENDED December 31, 2023 (Unaudited) (continued)
AVERAGE ANNUAL TOTAL RETURNS AS OF December 31, 2023
|
| |
| Sales Charge for Class A Shares is 5.25%. |
| Assumes a 1% CDSC (contingent deferred sales charge) for the 6 month and one year periods and 0% CDSC thereafter. |
TEN YEAR FUND PERFORMANCE (12/31/13 TO 12/31/23)
The performance quoted is past performance and is not a guarantee of future results. Mutual funds are subject to certain market risks. Investment returns and principal value of an investment will fluctuate so that an investor’s shares, when redeemed, may be worth more or less than their original cost. Current performance may be higher or lower than the performance data shown. Updated performance information is available by visiting www.jpmorganfunds.com or by calling 1-800-480-4111.
Returns for Class R3 Shares prior to their inception dates are based on the performance of Class A Shares. The actual returns of Class R3 Shares would have been lower than those shown because Class R3 Shares have higher expenses than Class A Shares.
Returns for the Class R4 Shares prior to their inception date are based on the performance of Class I Shares. The actual returns of Class R4 Shares would have been lower because Class R4 Shares have higher expenses than Class I Shares.
Returns for the Class R5 and R6 Shares prior to their inception date are based on the performance of Class L Shares. The actual returns of Class R5 Shares would have been lower than those shown because Class R5 Shares have higher expenses than Class L Shares. The actual returns for Class R6 Shares would have been different than those shown because Class R6 Shares have different expenses to Class L Shares.
The graph illustrates comparative performance for $3,000,000 invested in Class L Shares of the JPMorgan Mid Cap Value Fund and the Russell Midcap Value Index from December 31, 2013 to December 31, 2023. The performance of the Fund assumes reinvestment of all dividends and capital gain distributions, if any, and does not include a sales charge. The performance of the Russell Mid-cap Value Index does not reflect the deduction of expenses or a sales charge associated with a mutual fund and has been adjusted to reflect reinvestment of all dividends and capital gain distributions of the securities included in the benchmark, if applicable. The Russell Midcap Value Index is an unmanaged index which measures the performance of those Russell Midcap companies with lower price-to-book ratios and lower forecasted growth values. Investors cannot invest directly in an index.
Class L Shares have a $3,000,000 minimum initial investment.
Fund performance may reflect the waiver of the Fund’s fees and reimbursement of expenses for certain periods. Without these waivers and reimbursements, performance would have been lower. Also, performance shown in this section does not reflect the deduction of taxes that a shareholder would pay on Fund distributions or on gains resulting from redemptions of Fund shares.
Because Class C Shares automatically convert to Class A Shares after 8 years, the 10 year average annual total return shown above for Class C Shares reflects Class A Share's performance for the period after conversion.
| J.P. Morgan Mid Cap/Multi-Cap Funds | |
The returns shown are based on net asset values calculated for shareholder transactions and may differ from the returns shown in the financial highlights, which reflect adjustments made to the net asset values in accordance with accounting principles generally accepted in the United States of America.
Frank Russell Company is the source and owner of the Russell Index data contained or reflected in this material and all trademarks and copyrights related
thereto. Frank Russell Company is not responsible for the formatting or configuration of this material or for any inaccuracy in the adviser's presentation thereof.
| J.P. Morgan Mid Cap/Multi-Cap Funds | |
JPMorgan Value Advantage Fund
FUND COMMENTARYSIX MONTHS ENDED December 31, 2023 (Unaudited)
| |
| |
| |
Net Assets as of 12/31/2023 (In Thousands) | |
INVESTMENT OBJECTIVE**
The JPMorgan Value Advantage Fund (the “Fund”) seeks to provide long-term total return from a combination of income and capital gains.
WHAT WERE THE MAIN DRIVERS OF THE FUND’S PERFORMANCE?
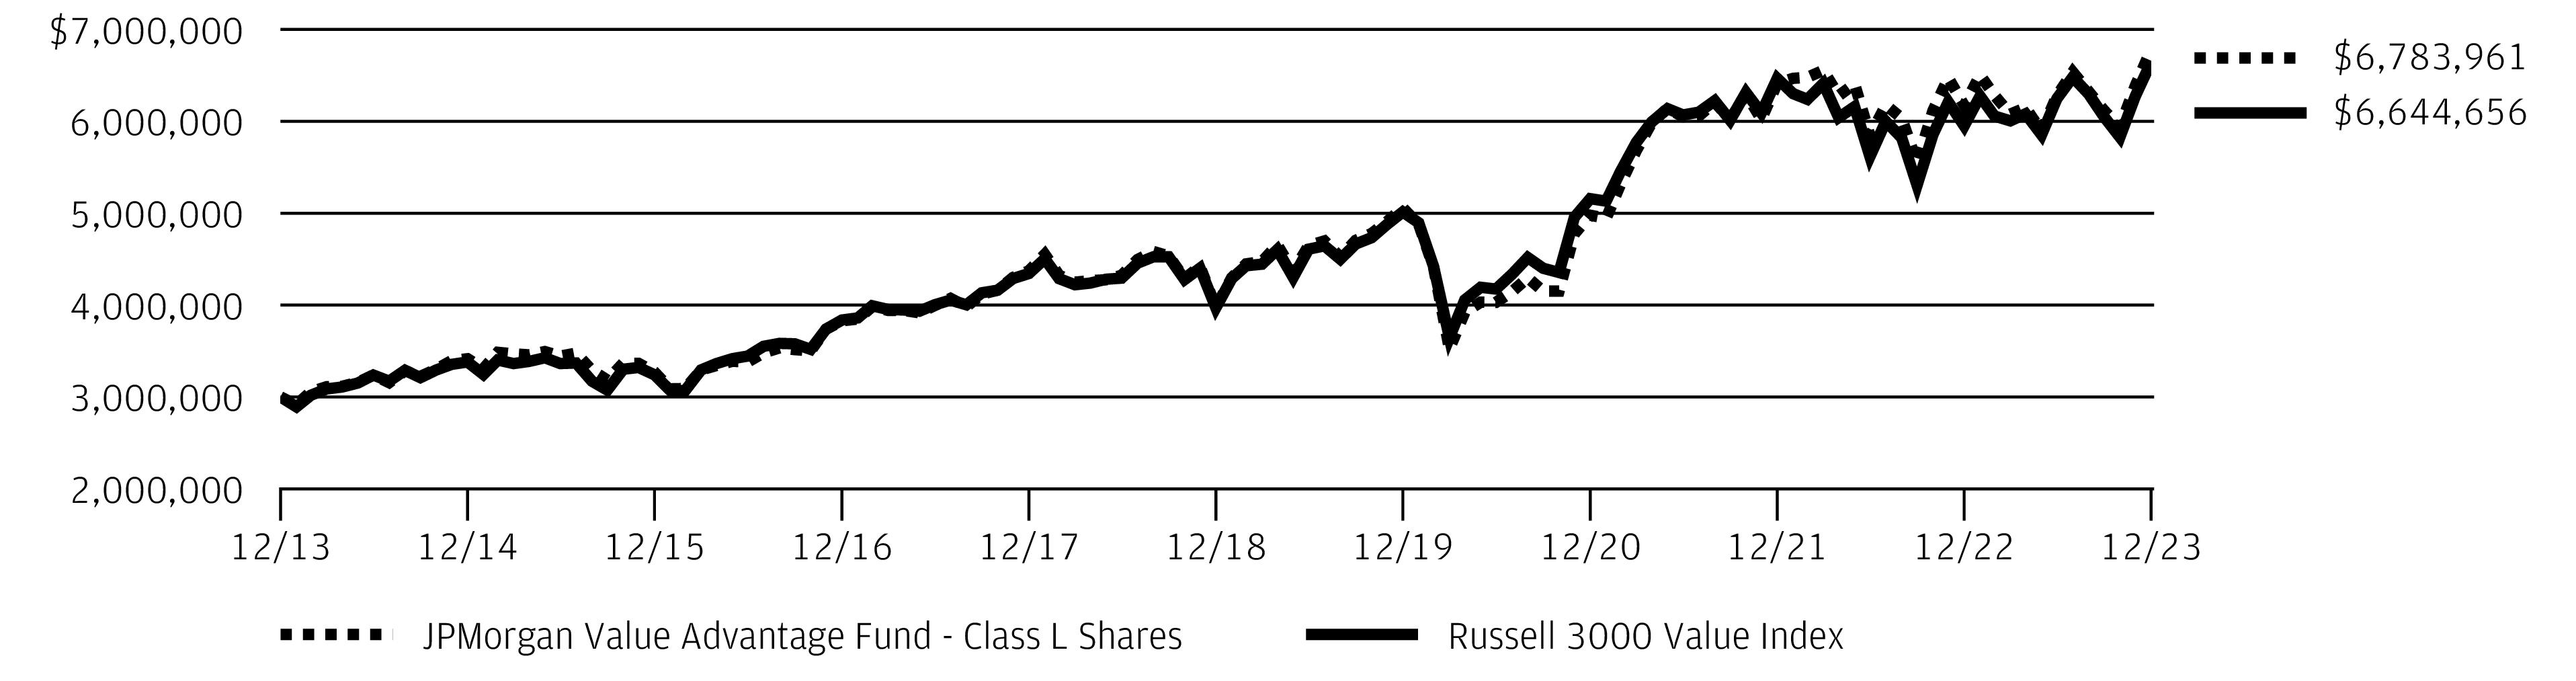
The Fund’s Class L Shares outperformed the Russell 3000 Value Index (the “Benchmark”) for the six months ended December 31, 2023.
The Fund’s security selection in the health care and consumer discretionary sectors was a leading contributor to performance relative to the Benchmark, while the Fund’s underweight positions in the information technology and industrials sectors was a leading detractor from relative performance.
Leading individual contributors to relative performance included the Fund’s overweight position in Capital One Financial Corp. and its underweight positions in Pfizer Inc. and Exxon Mobil Corp. Shares of Capital One Financial, a credit card and consumer banking provider, rose after the company reported consecutive quarters of better-than-expected earnings and amid investor expectations that banks would generally benefit from lower interest rates in 2024. Shares of Pfizer, a pharmaceuticals developer and health care products manufacturer not held in the Fund, fell after the company issued a weaker-than-expected earnings forecast. Shares of Exxon Mobil, an integrated petroleum and natural gas producer, fell after the company reported lower-than-expected earnings and revenue for the third quarter of 2023, and amid investor concerns over increased regulatory scrutiny of the company’s proposed $60 billion takeover of Pioneer Natural Resources Co.
Leading individual detractors from relative performance included the Fund’s underweight positions in Intel Inc. and JPMorgan Chase & Co., and its overweight position in Bristol-Myers Squibb Co. Shares of Intel, a semiconductor manufacturer not held in the Fund, rose amid broad demand for artificial intelligence technologies and after the company obtained a $3.2 billion grant from Israel to build a factory there. Shares of JPMorgan Chase, a banking and financial services company that the Fund is prohibited from holding because it is an affiliate, rose amid consecutive quarters of better-than-expected earnings and investor expectations that the company
would benefit from lower interest rates in 2024. Shares of Bristol-Myers Squibb, a developer and manufacturer of pharmaceuticals, fell after the company reported a decline in sales for the third quarter of 2023, amid increased competition from generic versions of the company’s leading anti-cancer drug.
HOW WAS THE FUND POSITIONED?
The Fund’s portfolio managers utilized a bottom-up approach to stock selection and sought to identify durable franchises possessing the ability to generate, in the portfolio managers’
view, significant levels of free cash flow.
TOP TEN HOLDINGS OF THE
PORTFOLIO AS OF December 31, 2023 | PERCENT OF
TOTAL
INVESTMENTS |
| Berkshire Hathaway, Inc., Class B | |
| Capital One Financial Corp. | |
| | |
| | |
| | |
| | |
| | |
| | |
| | |
| Martin Marietta Materials, Inc. | |
PORTFOLIO COMPOSITION BY SECTOR
AS OF December 31, 2023 | PERCENT OF
TOTAL
INVESTMENTS |
| |
| |
| |
| |
| |
| |
| |
| |
| |
| |
| |
| |
| J.P. Morgan Mid Cap/Multi-Cap Funds | |
*
The return shown is based on net asset values calculated for shareholder transactions and may differ from the return shown in the financial highlights, which reflects adjustments made to the net asset values in accordance with accounting principles generally accepted in the United States of America.
**
The adviser seeks to achieve the Fund’s objective. There can be no guarantee it will be achieved.
| J.P. Morgan Mid Cap/Multi-Cap Funds | |
JPMorgan Value Advantage Fund
FUND COMMENTARYSIX MONTHS ENDED December 31, 2023 (Unaudited) (continued)
AVERAGE ANNUAL TOTAL RETURNS AS OF December 31, 2023
|
| |
| Sales Charge for Class A Shares is 5.25%. |
| Assumes a 1% CDSC (contingent deferred sales charge) for the 6 month and one year periods and 0% CDSC thereafter. |
TEN YEAR FUND PERFORMANCE (12/31/13 TO 12/31/23)
The performance quoted is past performance and is not a guarantee of future results. Mutual funds are subject to certain market risks. Investment returns and principal value of an investment will fluctuate so that an investor’s shares, when redeemed, may be worth more or less than their original cost. Current performance may be higher or lower than the performance data shown. Updated performance information is available by visiting www.jpmorganfunds.com or by calling 1-800-480-4111.
Returns for Class R2 and Class R3 Shares prior to their inception date are based on the performance of Class A Shares. The actual returns of Class R2 Shares would have been lower than those shown because Class R2 Shares have higher expenses than Class A Shares. Returns for Class R3 Shares would have been similar to those shown because Class R3 Shares have similar expenses to Class A Shares.
Returns for the Class R4 Shares prior to their inception date are based on the performance of Class I Shares. The actual returns of Class R4 Shares would have been similar to those shown because Class R4 Shares have similar expenses to Class I Shares.
Returns for the Class R5 and Class R6 Shares prior to their inception date are based on the performance of Class L Shares. The actual returns for Class R5 and Class R6 Shares would have been different than those shown because Class R5 and Class R6 Shares have different expenses to Class L Shares.
The graph illustrates comparative performance for $3,000,000 invested in Class L Shares of the JPMorgan Value Advantage Fund and the Russell 3000 Value Index from December 31, 2013 to December 31, 2023. The performance of the Fund assumes reinvestment of all dividends and capital gain distributions, if any, and does not include a sales charge. The performance of the Russell 3000 Value Index does not reflect the deduction of expenses or a sales charge associated with a mutual fund and has been adjusted to reflect reinvestment of all dividends and capital gain distributions of the securities included in the benchmark, if applicable. The Russell 3000 Value Index is an unmanaged index which measures the performance of those Russell 3000 companies (largest 3000 U.S. companies) with lower price-to-book ratios and lower forecasted growth values. Investors cannot invest directly in an index.
Class L Shares have a $3,000,000 minimum initial investment.
Fund performance may reflect the waiver of the Fund’s fees and reimbursement of expenses for certain periods. Without these waivers and reimbursements, performance would have been lower. Also, performance shown in this section does not reflect the deduction of taxes that a shareholder would pay on Fund distributions or on gains resulting from redemptions of Fund shares.
Because Class C Shares automatically convert to Class A Shares after 8 years, the 10 year average annual total return shown above for Class C Shares reflects Class A Share's performance for the period after conversion.
| J.P. Morgan Mid Cap/Multi-Cap Funds | |
The returns shown are based on net asset values calculated for shareholder transactions and may differ from the returns shown in the financial highlights, which reflect adjustments made to the net asset values in accordance with accounting principles generally accepted in the United States of America.
Frank Russell Company is the source and owner of the Russell Index data contained or reflected in this material and all trademarks and copyrights related
thereto. Frank Russell Company is not responsible for the formatting or configuration of this material or for any inaccuracy in the adviser's presentation thereof.
| J.P. Morgan Mid Cap/Multi-Cap Funds | |
JPMorgan Growth Advantage Fund
SCHEDULE OF PORTFOLIO INVESTMENTSAS OF December 31, 2023 (Unaudited)
| | |
|
|
| | |
|
Constellation Brands, Inc., Class A | | |
|
Alnylam Pharmaceuticals, Inc. * | | |
| | |
| | |
Regeneron Pharmaceuticals, Inc. * | | |
| | |
|
| | |
|
| | |
|
| | |
| | |
| | |
| | |
Commercial Services & Supplies — 1.0% |
| | |
Communications Equipment — 0.6% |
| | |
Construction & Engineering — 1.7% |
| | |
| | |
| | |
|
| | |
Electrical Equipment — 1.5% |
| | |
| | |
| | |
Electronic Equipment, Instruments & Components — 0.8% |
| | |
Energy Equipment & Services — 0.9% |
TechnipFMC plc (United Kingdom) | | |
| | |
|
|
| | |
Take-Two Interactive Software, Inc. * | | |
| | |
Financial Services — 3.3% |
Mastercard, Inc., Class A | | |
Ground Transportation — 2.8% |
JB Hunt Transport Services, Inc. | | |
Old Dominion Freight Line, Inc. | | |
Uber Technologies, Inc. * | | |
| | |
Health Care Equipment & Supplies — 2.0% |
| | |
| | |
Intuitive Surgical, Inc. * | | |
| | |
Health Care Providers & Services — 2.6% |
| | |
| | |
| | |
Hotels, Restaurants & Leisure — 1.9% |
| | |
Hilton Worldwide Holdings, Inc. | | |
| | |
Household Durables — 0.5% |
| | |
|
| | |
Interactive Media & Services — 8.7% |
Alphabet, Inc., Class C * | | |
Meta Platforms, Inc., Class A * | | |
| | |
|
| | |
Snowflake, Inc., Class A * | | |
| | |
Life Sciences Tools & Services — 1.3% |
Mettler-Toledo International, Inc. * | | |
Thermo Fisher Scientific, Inc. | | |
| | |
SEE NOTES TO FINANCIAL STATEMENTS.
| J.P. Morgan Mid Cap/Multi-Cap Funds | |
| | |
Common Stocks — continued |
|
| | |
|
Trade Desk, Inc. (The), Class A * | | |
|
| | |
Oil, Gas & Consumable Fuels — 1.3% |
| | |
| | |
| | |
|
| | |
Royalty Pharma plc, Class A | | |
| | |
Professional Services — 0.7% |
Booz Allen Hamilton Holding Corp. | | |
Semiconductors & Semiconductor Equipment — 10.3% |
Advanced Micro Devices, Inc. * | | |
| | |
| | |
| | |
| | |
| | |
|
Cadence Design Systems, Inc. * | | |
Confluent, Inc., Class A * | | |
| | |
Crowdstrike Holdings, Inc., Class A * | | |
| | |
| | |
| | |
| | |
Palo Alto Networks, Inc. * | | |
| | |
| | |
| | |
|
| | |
| | |
| | |
| | |
| | |
|
Technology Hardware, Storage & Peripherals — 6.9% |
| | |
Textiles, Apparel & Luxury Goods — 0.7% |
Lululemon Athletica, Inc. * | | |
Trading Companies & Distributors — 0.3% |
| | |
Total Common Stocks
(Cost $8,782,642) | | |
Short-Term Investments — 1.7% |
Investment Companies — 1.5% |
JPMorgan Prime Money Market Fund Class IM Shares, 5.51% (c) (d)
(Cost $257,039) | | |
Investment of Cash Collateral from Securities Loaned — 0.2% |
JPMorgan Securities Lending Money Market Fund Agency SL Class Shares, 5.56% (c) (d) | | |
JPMorgan U.S. Government Money Market Fund Class IM Shares, 5.30% (c) (d) | | |
Total Investment of Cash Collateral from Securities Loaned
(Cost $26,324) | | |
Total Short-Term Investments
(Cost $283,363) | | |
Total Investments — 100.2%
(Cost $9,066,005) | | |
Liabilities in Excess of Other Assets — (0.2)% | | |
| | |
Percentages indicated are based on net assets. |
| Value determined using significant unobservable inputs. |
| Non-income producing security. |
| The security or a portion of this security is on loan at December 31, 2023. The total value of securities on loan at December 31, 2023 is $25,418. |
| Restricted security. See Note 2.B. |
| Investment in an affiliated fund, which is registered under the Investment Company Act of 1940, as amended, and is advised by J.P. Morgan Investment Management Inc. |
| The rate shown is the current yield as of December 31, 2023. |
SEE NOTES TO FINANCIAL STATEMENTS.
| J.P. Morgan Mid Cap/Multi-Cap Funds | |
JPMorgan Mid Cap Equity Fund
SCHEDULE OF PORTFOLIO INVESTMENTSAS OF December 31, 2023 (Unaudited)
| | |
|
Aerospace & Defense — 0.4% |
| | |
|
Thor Industries, Inc. (a) | | |
|
| | |
First Citizens BancShares, Inc., Class A | | |
Huntington Bancshares, Inc. | | |
| | |
| | |
| | |
|
Constellation Brands, Inc., Class A | | |
| | |
| | |
|
Alnylam Pharmaceuticals, Inc. * | | |
Amicus Therapeutics, Inc. * | | |
Apellis Pharmaceuticals, Inc. * (a) | | |
Exact Sciences Corp. * (a) | | |
| | |
| | |
Neurocrine Biosciences, Inc. * | | |
| | |
|
| | |
Fortune Brands Innovations, Inc. | | |
Simpson Manufacturing Co., Inc. | | |
| | |
| | |
|
Ameriprise Financial, Inc. | | |
Ares Management Corp., Class A | | |
FactSet Research Systems, Inc. | | |
Interactive Brokers Group, Inc., Class A | | |
| | |
LPL Financial Holdings, Inc. | | |
| | |
| | |
| | |
Raymond James Financial, Inc. | | |
| | |
|
Capital Markets — continued |
| | |
Tradeweb Markets, Inc., Class A | | |
| | |
|
| | |
| | |
| | |
Commercial Services & Supplies — 1.3% |
| | |
| | |
| | |
| | |
Communications Equipment — 0.7% |
| | |
| | |
| | |
Construction & Engineering — 0.8% |
| | |
Quanta Services, Inc. (a) | | |
| | |
Construction Materials — 1.0% |
Martin Marietta Materials, Inc. | | |
|
Discover Financial Services | | |
Consumer Staples Distribution & Retail — 1.2% |
| | |
| | |
| | |
Containers & Packaging — 1.9% |
| | |
Packaging Corp. of America | | |
| | |
| | |
|
| | |
| | |
| | |
| | |
SEE NOTES TO FINANCIAL STATEMENTS.
| J.P. Morgan Mid Cap/Multi-Cap Funds | |
| | |
Common Stocks — continued |
Diversified Consumer Services — 0.3% |
Bright Horizons Family Solutions, Inc. * (a) | | |
|
| | |
Electric Utilities — 2.3% |
| | |
| | |
| | |
| | |
Electrical Equipment — 3.3% |
| | |
| | |
| | |
| | |
Electronic Equipment, Instruments & Components — 4.2% |
| | |
| | |
| | |
Keysight Technologies, Inc. * | | |
Teledyne Technologies, Inc. * | | |
Zebra Technologies Corp., Class A * | | |
| | |
Energy Equipment & Services — 0.3% |
TechnipFMC plc (United Kingdom) | | |
|
Liberty Media Corp-Liberty Live, Class C * | | |
Take-Two Interactive Software, Inc. * | | |
| | |
Financial Services — 1.8% |
Fidelity National Information Services, Inc. | | |
| | |
| | |
| | |
Rocket Cos., Inc., Class A * (a) | | |
| | |
| | |
|
| | |
|
| | |
| | |
|
Ground Transportation — 1.1% |
JB Hunt Transport Services, Inc. | | |
Old Dominion Freight Line, Inc. | | |
Uber Technologies, Inc. * | | |
| | |
Health Care Equipment & Supplies — 3.1% |
| | |
| | |
| | |
Globus Medical, Inc., Class A * | | |
IDEXX Laboratories, Inc. * | | |
Inspire Medical Systems, Inc. * (a) | | |
| | |
Shockwave Medical, Inc. * | | |
Zimmer Biomet Holdings, Inc. | | |
| | |
Health Care Providers & Services — 4.3% |
Acadia Healthcare Co., Inc. * | | |
| | |
| | |
| | |
Laboratory Corp. of America Holdings (a) | | |
| | |
| | |
Universal Health Services, Inc., Class B | | |
| | |
|
| | |
Hotel & Resort REITs — 0.3% |
Host Hotels & Resorts, Inc. | | |
Hotels, Restaurants & Leisure — 3.3% |
Chipotle Mexican Grill, Inc. * | | |
| | |
| | |
DoorDash, Inc., Class A * | | |
| | |
Hilton Worldwide Holdings, Inc. | | |
| | |
Royal Caribbean Cruises Ltd. * | | |
| | |
Household Durables — 1.1% |
| | |
SEE NOTES TO FINANCIAL STATEMENTS.
| J.P. Morgan Mid Cap/Multi-Cap Funds | |
JPMorgan Mid Cap Equity Fund
SCHEDULE OF PORTFOLIO INVESTMENTSAS OF December 31, 2023 (Unaudited) (continued)
| | |
Common Stocks — continued |
Household Durables — continued |
| | |
Mohawk Industries, Inc. * | | |
| | |
| | |
Household Products — 0.3% |
| | |
|
Rexford Industrial Realty, Inc. | | |
|
Arch Capital Group Ltd. * | | |
Arthur J Gallagher & Co. (a) | | |
| | |
Hartford Financial Services Group, Inc. (The) | | |
| | |
| | |
| | |
Interactive Media & Services — 0.6% |
| | |
|
| | |
| | |
| | |
| | |
Snowflake, Inc., Class A * | | |
| | |
Life Sciences Tools & Services — 2.0% |
10X Genomics, Inc., Class A * | | |
Agilent Technologies, Inc. | | |
| | |
Mettler-Toledo International, Inc. * | | |
West Pharmaceutical Services, Inc. | | |
| | |
|
| | |
| | |
| | |
| | |
Lincoln Electric Holdings, Inc. (a) | | |
| | |
| | |
|
|
| | |
| | |
| | |
|
Liberty Media Corp-Liberty SiriusXM * | | |
Trade Desk, Inc. (The), Class A * | | |
| | |
|
| | |
|
| | |
| | |
| | |
|
| | |
Oil, Gas & Consumable Fuels — 3.3% |
| | |
| | |
| | |
| | |
Williams Cos., Inc. (The) | | |
| | |
Personal Care Products — 0.2% |
| | |
|
Jazz Pharmaceuticals plc * | | |
Royalty Pharma plc, Class A | | |
| | |
Professional Services — 0.7% |
Booz Allen Hamilton Holding Corp. | | |
| | |
| | |
Real Estate Management & Development — 0.5% |
CBRE Group, Inc., Class A * | | |
|
American Homes 4 Rent, Class A | | |
AvalonBay Communities, Inc. | | |
Essex Property Trust, Inc. | | |
SEE NOTES TO FINANCIAL STATEMENTS.
| J.P. Morgan Mid Cap/Multi-Cap Funds | |
| | |
Common Stocks — continued |
Residential REITs — continued |
Mid-America Apartment Communities, Inc. | | |
| | |
| | |
|
Brixmor Property Group, Inc. | | |
Federal Realty Investment Trust | | |
| | |
| | |
| | |
Semiconductors & Semiconductor Equipment — 2.4% |
Allegro MicroSystems, Inc. (Japan) * | | |
| | |
| | |
| | |
Microchip Technology, Inc. | | |
Monolithic Power Systems, Inc. | | |
| | |
| | |
| | |
|
Cadence Design Systems, Inc. * | | |
Confluent, Inc., Class A * | | |
Crowdstrike Holdings, Inc., Class A * | | |
| | |
| | |
| | |
| | |
Palo Alto Networks, Inc. * | | |
Procore Technologies, Inc. * | | |
| | |
| | |
Zoom Video Communications, Inc., Class A * | | |
| | |
|
| | |
| | |
| | |
|
| | |
| | |
| | |
| | |
|
Specialty Retail — continued |
Burlington Stores, Inc. * | | |
Floor & Decor Holdings, Inc., Class A * (a) | | |
| | |
| | |
| | |
Textiles, Apparel & Luxury Goods — 1.9% |
| | |
Lululemon Athletica, Inc. * | | |
| | |
| | |
| | |
Trading Companies & Distributors — 0.2% |
| | |
Total Common Stocks
(Cost $2,791,292) | | |
Short-Term Investments — 4.1% |
Investment Companies — 2.3% |
JPMorgan Prime Money Market Fund Class IM Shares, 5.51% (b) (c)
(Cost $93,016) | | |
Investment of Cash Collateral from Securities Loaned — 1.8% |
JPMorgan Securities Lending Money Market Fund Agency SL Class Shares, 5.56% (b) (c) | | |
JPMorgan U.S. Government Money Market Fund Class IM Shares, 5.30% (b) (c) | | |
Total Investment of Cash Collateral from Securities Loaned
(Cost $71,238) | | |
Total Short-Term Investments
(Cost $164,254) | | |
Total Investments — 101.6%
(Cost $2,955,546) | | |
Liabilities in Excess of Other Assets — (1.6)% | | |
| | |
Percentages indicated are based on net assets. |
| |
| Real Estate Investment Trust |
| Non-income producing security. |
SEE NOTES TO FINANCIAL STATEMENTS.
| J.P. Morgan Mid Cap/Multi-Cap Funds | |
JPMorgan Mid Cap Equity Fund
SCHEDULE OF PORTFOLIO INVESTMENTSAS OF December 31, 2023 (Unaudited) (continued)
| The security or a portion of this security is on loan at December 31, 2023. The total value of securities on loan at December 31, 2023 is $69,077. |
| Investment in an affiliated fund, which is registered under the Investment Company Act of 1940, as amended, and is advised by J.P. Morgan Investment Management Inc. |
| The rate shown is the current yield as of December 31, 2023. |
SEE NOTES TO FINANCIAL STATEMENTS.
| J.P. Morgan Mid Cap/Multi-Cap Funds | |
JPMorgan Mid Cap Growth Fund
SCHEDULE OF PORTFOLIO INVESTMENTSAS OF December 31, 2023 (Unaudited)
| | |
|
Aerospace & Defense — 1.2% |
| | |
|
Thor Industries, Inc. (a) | | |
|
Constellation Brands, Inc., Class A | | |
|
Alnylam Pharmaceuticals, Inc. * | | |
Amicus Therapeutics, Inc. * (a) | | |
Apellis Pharmaceuticals, Inc. * (a) | | |
| | |
| | |
| | |
Neurocrine Biosciences, Inc. * | | |
| | |
|
Simpson Manufacturing Co., Inc. | | |
| | |
| | |
|
Ares Management Corp., Class A | | |
FactSet Research Systems, Inc. (a) | | |
Interactive Brokers Group, Inc., Class A | | |
| | |
LPL Financial Holdings, Inc. | | |
| | |
| | |
Raymond James Financial, Inc. | | |
Tradeweb Markets, Inc., Class A | | |
| | |
Commercial Services & Supplies — 3.7% |
| | |
| | |
| | |
| | |
Communications Equipment — 0.6% |
| | |
Construction & Engineering — 2.2% |
| | |
| | |
| | |
| | |
|
|
| | |
Diversified Consumer Services — 0.7% |
Bright Horizons Family Solutions, Inc. * (a) | | |
Electrical Equipment — 1.8% |
| | |
| | |
| | |
Electronic Equipment, Instruments & Components — 3.6% |
| | |
| | |
Keysight Technologies, Inc. * | | |
Teledyne Technologies, Inc. * | | |
| | |
Energy Equipment & Services — 0.9% |
TechnipFMC plc (United Kingdom) (a) | | |
|
Take-Two Interactive Software, Inc. * | | |
Financial Services — 1.5% |
| | |
| | |
Rocket Cos., Inc., Class A * (a) | | |
| | |
Ground Transportation — 3.3% |
JB Hunt Transport Services, Inc. | | |
Old Dominion Freight Line, Inc. | | |
Uber Technologies, Inc. * | | |
| | |
Health Care Equipment & Supplies — 6.2% |
| | |
| | |
| | |
IDEXX Laboratories, Inc. * | | |
Inspire Medical Systems, Inc. * | | |
| | |
Shockwave Medical, Inc. * | | |
| | |
Health Care Providers & Services — 2.6% |
Acadia Healthcare Co., Inc. * | | |
SEE NOTES TO FINANCIAL STATEMENTS.
| J.P. Morgan Mid Cap/Multi-Cap Funds | |
JPMorgan Mid Cap Growth Fund
SCHEDULE OF PORTFOLIO INVESTMENTSAS OF December 31, 2023 (Unaudited) (continued)
| | |
Common Stocks — continued |
Health Care Providers & Services — continued |
| | |
| | |
| | |
Hotels, Restaurants & Leisure — 5.8% |
Chipotle Mexican Grill, Inc. * | | |
| | |
DoorDash, Inc., Class A * | | |
Hilton Worldwide Holdings, Inc. | | |
| | |
Royal Caribbean Cruises Ltd. * (a) | | |
| | |
Household Durables — 1.0% |
| | |
| | |
| | |
|
Arthur J Gallagher & Co. (a) | | |
|
| | |
| | |
| | |
Snowflake, Inc., Class A * | | |
| | |
Life Sciences Tools & Services — 5.7% |
10X Genomics, Inc., Class A * | | |
Agilent Technologies, Inc. | | |
| | |
Mettler-Toledo International, Inc. * (a) | | |
West Pharmaceutical Services, Inc. | | |
| | |
|
| | |
| | |
| | |
|
Trade Desk, Inc. (The), Class A * | | |
|
| | |
| | |
|
Oil, Gas & Consumable Fuels — 2.9% |
| | |
| | |
| | |
Personal Care Products — 0.6% |
| | |
|
Royalty Pharma plc, Class A | | |
Professional Services — 1.9% |
Booz Allen Hamilton Holding Corp. | | |
| | |
| | |
Semiconductors & Semiconductor Equipment — 5.3% |
Allegro MicroSystems, Inc. (Japan) * | | |
| | |
| | |
| | |
Monolithic Power Systems, Inc. (a) | | |
ON Semiconductor Corp. * (a) | | |
| | |
| | |
|
Cadence Design Systems, Inc. * | | |
Confluent, Inc., Class A * | | |
| | |
Crowdstrike Holdings, Inc., Class A * | | |
Datadog, Inc., Class A * (a) | | |
| | |
| | |
| | |
Palo Alto Networks, Inc. * | | |
Procore Technologies, Inc. * | | |
| | |
| | |
Zoom Video Communications, Inc., Class A * | | |
| | |
|
| | |
Burlington Stores, Inc. * | | |
Floor & Decor Holdings, Inc., Class A * (a) | | |
SEE NOTES TO FINANCIAL STATEMENTS.
| J.P. Morgan Mid Cap/Multi-Cap Funds | |
| | |
Common Stocks — continued |
Specialty Retail — continued |
| | |
| | |
| | |
Textiles, Apparel & Luxury Goods — 0.9% |
Lululemon Athletica, Inc. * | | |
Trading Companies & Distributors — 0.7% |
| | |
Total Common Stocks
(Cost $7,510,938) | | |
Short-Term Investments — 4.3% |
Investment Companies — 1.3% |
JPMorgan Prime Money Market Fund Class IM Shares, 5.51% (c) (d)
(Cost $139,677) | | |
Investment of Cash Collateral from Securities Loaned — 3.0% |
JPMorgan Securities Lending Money Market Fund Agency SL Class Shares, 5.56% (c) (d) | | |
JPMorgan U.S. Government Money Market Fund Class IM Shares, 5.30% (c) (d) | | |
Total Investment of Cash Collateral from Securities Loaned
(Cost $309,473) | | |
Total Short-Term Investments
(Cost $449,150) | | |
Total Investments — 103.1%
(Cost $7,960,088) | | |
Liabilities in Excess of Other Assets — (3.1)% | | |
| | |
Percentages indicated are based on net assets. |
| Value determined using significant unobservable inputs. |
| Non-income producing security. |
| The security or a portion of this security is on loan at December 31, 2023. The total value of securities on loan at December 31, 2023 is $299,746. |
| Restricted security. See Note 2.B. |
| Investment in an affiliated fund, which is registered under the Investment Company Act of 1940, as amended, and is advised by J.P. Morgan Investment Management Inc. |
| The rate shown is the current yield as of December 31, 2023. |
SEE NOTES TO FINANCIAL STATEMENTS.
| J.P. Morgan Mid Cap/Multi-Cap Funds | |
JPMorgan Mid Cap Value Fund
SCHEDULE OF PORTFOLIO INVESTMENTSAS OF December 31, 2023 (Unaudited)
| | |
|
|
| | |
First Citizens BancShares, Inc., Class A | | |
Huntington Bancshares, Inc. | | |
| | |
| | |
| | |
|
Constellation Brands, Inc., Class A | | |
| | |
| | |
|
| | |
Fortune Brands Innovations, Inc. | | |
| | |
|
Ameriprise Financial, Inc. | | |
| | |
Raymond James Financial, Inc. | | |
| | |
| | |
|
| | |
| | |
| | |
Communications Equipment — 0.8% |
| | |
Construction Materials — 1.6% |
Martin Marietta Materials, Inc. | | |
|
Discover Financial Services | | |
Consumer Staples Distribution & Retail — 1.8% |
| | |
| | |
| | |
Containers & Packaging — 3.0% |
| | |
Packaging Corp. of America | | |
| | |
| | |
| | |
|
|
| | |
| | |
| | |
|
| | |
Electric Utilities — 3.5% |
| | |
| | |
| | |
| | |
Electrical Equipment — 4.2% |
| | |
| | |
| | |
| | |
Electronic Equipment, Instruments & Components — 4.6% |
| | |
| | |
| | |
Teledyne Technologies, Inc. * | | |
Zebra Technologies Corp., Class A * | | |
| | |
|
Liberty Media Corp-Liberty Live, Class C * | | |
Take-Two Interactive Software, Inc. * | | |
| | |
Financial Services — 2.0% |
Fidelity National Information Services, Inc. | | |
| | |
| | |
| | |
|
Post Holdings, Inc. * (a) | | |
|
| | |
Health Care Equipment & Supplies — 1.5% |
Globus Medical, Inc., Class A * | | |
Zimmer Biomet Holdings, Inc. | | |
| | |
SEE NOTES TO FINANCIAL STATEMENTS.
| J.P. Morgan Mid Cap/Multi-Cap Funds | |
| | |
Common Stocks — continued |
Health Care Providers & Services — 5.2% |
| | |
| | |
Laboratory Corp. of America Holdings (a) | | |
| | |
Universal Health Services, Inc., Class B | | |
| | |
|
| | |
Hotel & Resort REITs — 0.4% |
Host Hotels & Resorts, Inc. | | |
Hotels, Restaurants & Leisure — 2.0% |
| | |
| | |
| | |
Household Durables — 1.3% |
Mohawk Industries, Inc. * | | |
| | |
| | |
Household Products — 0.5% |
| | |
|
Rexford Industrial Realty, Inc. (a) | | |
|
Arch Capital Group Ltd. * | | |
| | |
Hartford Financial Services Group, Inc. (The) | | |
| | |
| | |
| | |
Interactive Media & Services — 0.9% |
| | |
|
| | |
|
| | |
| | |
| | |
Lincoln Electric Holdings, Inc. (a) | | |
| | |
| | |
|
|
| | |
| | |
| | |
|
Liberty Media Corp-Liberty SiriusXM * | | |
|
| | |
|
| | |
| | |
| | |
|
| | |
Oil, Gas & Consumable Fuels — 3.6% |
| | |
Diamondback Energy, Inc. (a) | | |
Williams Cos., Inc. (The) | | |
| | |
|
Jazz Pharmaceuticals plc * | | |
Real Estate Management & Development — 0.9% |
CBRE Group, Inc., Class A * | | |
|
American Homes 4 Rent, Class A | | |
AvalonBay Communities, Inc. | | |
Essex Property Trust, Inc. | | |
Mid-America Apartment Communities, Inc. | | |
| | |
| | |
|
Brixmor Property Group, Inc. | | |
Federal Realty Investment Trust | | |
| | |
| | |
| | |
Semiconductors & Semiconductor Equipment — 0.9% |
Microchip Technology, Inc. | | |
SEE NOTES TO FINANCIAL STATEMENTS.
| J.P. Morgan Mid Cap/Multi-Cap Funds | |
JPMorgan Mid Cap Value Fund
SCHEDULE OF PORTFOLIO INVESTMENTSAS OF December 31, 2023 (Unaudited) (continued)
| | |
Common Stocks — continued |
|
| | |
| | |
| | |
|
| | |
| | |
| | |
| | |
Textiles, Apparel & Luxury Goods — 2.4% |
| | |
| | |
| | |
| | |
Total Common Stocks
(Cost $7,863,795) | | |
Short-Term Investments — 2.0% |
Investment Companies — 1.3% |
JPMorgan Prime Money Market Fund Class IM Shares, 5.51% (b) (c)
(Cost $168,263) | | |
Investment of Cash Collateral from Securities Loaned — 0.7% |
JPMorgan Securities Lending Money Market Fund Agency SL Class Shares, 5.56% (b) (c) | | |
| | |
|
Investment of Cash Collateral from Securities Loaned — continued |
JPMorgan U.S. Government Money Market Fund Class IM Shares, 5.30% (b) (c) | | |
Total Investment of Cash Collateral from Securities Loaned
(Cost $94,631) | | |
Total Short-Term Investments
(Cost $262,894) | | |
Total Investments — 100.8%
(Cost $8,126,689) | | |
Liabilities in Excess of Other Assets — (0.8)% | | |
| | |
Percentages indicated are based on net assets. |
| |
| Real Estate Investment Trust |
| Non-income producing security. |
| The security or a portion of this security is on loan at December 31, 2023. The total value of securities on loan at December 31, 2023 is $92,233. |
| Investment in an affiliated fund, which is registered under the Investment Company Act of 1940, as amended, and is advised by J.P. Morgan Investment Management Inc. |
| The rate shown is the current yield as of December 31, 2023. |
SEE NOTES TO FINANCIAL STATEMENTS.
| J.P. Morgan Mid Cap/Multi-Cap Funds | |
JPMorgan Value Advantage Fund
SCHEDULE OF PORTFOLIO INVESTMENTSAS OF December 31, 2023 (Unaudited)
| | |
|
Aerospace & Defense — 2.2% |
| | |
| | |
| | |
| | |
Air Freight & Logistics — 0.9% |
| | |
United Parcel Service, Inc., Class B | | |
| | |
|
| | |
| | |
Citizens Financial Group, Inc. | | |
First Citizens BancShares, Inc., Class A | | |
| | |
PNC Financial Services Group, Inc. (The) | | |
| | |
| | |
| | |
|
| | |
|
| | |
Regeneron Pharmaceuticals, Inc. * | | |
Vertex Pharmaceuticals, Inc. * | | |
| | |
|
| | |
Fortune Brands Innovations, Inc. | | |
| | |
|
Charles Schwab Corp. (The) | | |
| | |
| | |
| | |
| | |
|
Axalta Coating Systems Ltd. * | | |
Communications Equipment — 0.4% |
| | |
| | |
|
Construction Materials — 1.7% |
Martin Marietta Materials, Inc. | | |
| | |
| | |
|
| | |
Capital One Financial Corp. | | |
| | |
Consumer Staples Distribution & Retail — 0.6% |
Albertsons Cos., Inc., Class A | | |
Containers & Packaging — 2.3% |
Graphic Packaging Holding Co. | | |
Packaging Corp. of America | | |
| | |
| | |
| | |
Diversified Telecommunication Services — 0.5% |
Verizon Communications, Inc. | | |
Electric Utilities — 3.1% |
| | |
| | |
| | |
| | |
| | |
| | |
Electrical Equipment — 0.6% |
| | |
Electronic Equipment, Instruments & Components — 1.0% |
| | |
| | |
| | |
|
Liberty Media Corp-Liberty Live, Class C * | | |
Financial Services — 4.2% |
Berkshire Hathaway, Inc., Class B * | | |
FleetCor Technologies, Inc. * | | |
| | |
| | |
SEE NOTES TO FINANCIAL STATEMENTS.
| J.P. Morgan Mid Cap/Multi-Cap Funds | |
JPMorgan Value Advantage Fund
SCHEDULE OF PORTFOLIO INVESTMENTSAS OF December 31, 2023 (Unaudited) (continued)
| | |
Common Stocks — continued |
|
| | |
| | |
| | |
Ground Transportation — 1.0% |
| | |
Health Care Equipment & Supplies — 1.0% |
| | |
Zimmer Biomet Holdings, Inc. | | |
| | |
Health Care Providers & Services — 6.2% |
| | |
| | |
| | |
| | |
| | |
Laboratory Corp. of America Holdings | | |
| | |
| | |
| | |
|
| | |
Hotel & Resort REITs — 0.4% |
Apple Hospitality REIT, Inc. (a) | | |
Hotels, Restaurants & Leisure — 1.4% |
| | |
Texas Roadhouse, Inc., Class A | | |
| | |
Household Durables — 1.2% |
Mohawk Industries, Inc. * | | |
| | |
| | |
Household Products — 1.5% |
| | |
Procter & Gamble Co. (The) | | |
| | |
Industrial Conglomerates — 0.7% |
Honeywell International, Inc. | | |
|
EastGroup Properties, Inc. | | |
| | |
|
|
| | |
| | |
Fairfax Financial Holdings Ltd. (Canada) | | |
| | |
| | |
Travelers Cos., Inc. (The) | | |
| | |
| | |
Interactive Media & Services — 1.5% |
Alphabet, Inc., Class C * | | |
| | |
Meta Platforms, Inc., Class A * | | |
| | |
|
International Business Machines Corp. | | |
Life Sciences Tools & Services — 0.2% |
Fortrea Holdings, Inc. * (a) | | |
|
| | |
| | |
| | |
| | |
|
Liberty Broadband Corp., Class C * | | |
Liberty Media Corp-Liberty SiriusXM * | | |
Nexstar Media Group, Inc., Class A (a) | | |
| | |
|
Public Service Enterprise Group, Inc. | | |
Oil, Gas & Consumable Fuels — 8.3% |
| | |
| | |
| | |
| | |
| | |
| | |
Williams Cos., Inc. (The) | | |
| | |
Personal Care Products — 0.6% |
| | |
SEE NOTES TO FINANCIAL STATEMENTS.
| J.P. Morgan Mid Cap/Multi-Cap Funds | |
| | |
Common Stocks — continued |
|
| | |
| | |
| | |
| | |
Real Estate Management & Development — 0.7% |
CBRE Group, Inc., Class A * | | |
|
American Homes 4 Rent, Class A | | |
Mid-America Apartment Communities, Inc. | | |
| | |
|
Brixmor Property Group, Inc. | | |
Federal Realty Investment Trust | | |
| | |
| | |
| | |
Semiconductors & Semiconductor Equipment — 2.4% |
| | |
NXP Semiconductors NV (China) | | |
| | |
| | |
|
Lamar Advertising Co., Class A | | |
| | |
| | |
| | |
| | |
|
| | |
| | |
| | |
Dick's Sporting Goods, Inc. (a) | | |
| | |
| | |
| | |
| | |
Textiles, Apparel & Luxury Goods — 1.2% |
| | |
| | |
|
Textiles, Apparel & Luxury Goods — continued |
Columbia Sportswear Co. (a) | | |
| | |
| | |
|
Philip Morris International, Inc. | | |
Wireless Telecommunication Services — 0.5% |
| | |
Total Common Stocks
(Cost $5,753,042) | | |
Short-Term Investments — 1.7% |
Investment Companies — 1.0% |
JPMorgan Prime Money Market Fund Class IM Shares, 5.51% (b) (c)
(Cost $86,191) | | |
Investment of Cash Collateral from Securities Loaned — 0.7% |
JPMorgan Securities Lending Money Market Fund Agency SL Class Shares, 5.56% (b) (c) | | |
JPMorgan U.S. Government Money Market Fund Class IM Shares, 5.30% (b) (c) | | |
Total Investment of Cash Collateral from Securities Loaned
(Cost $65,583) | | |
Total Short-Term Investments
(Cost $151,774) | | |
Total Investments — 100.9%
(Cost $5,904,816) | | |
Liabilities in Excess of Other Assets — (0.9)% | | |
| | |
Percentages indicated are based on net assets. |
| |
| Real Estate Investment Trust |
| Non-income producing security. |
| The security or a portion of this security is on loan at December 31, 2023. The total value of securities on loan at December 31, 2023 is $63,676. |
| Investment in an affiliated fund, which is registered under the Investment Company Act of 1940, as amended, and is advised by J.P. Morgan Investment Management Inc. |
| The rate shown is the current yield as of December 31, 2023. |
SEE NOTES TO FINANCIAL STATEMENTS.
| J.P. Morgan Mid Cap/Multi-Cap Funds | |
STATEMENTS OF ASSETS AND LIABILITIESAS OF December 31, 2023 (Unaudited)
(Amounts in thousands, except per share amounts)
| JPMorgan
Growth
Advantage Fund | JPMorgan
Mid Cap
Equity Fund | |
| | | |
Investments in non-affiliates, at value | | | |
Investments in affiliates, at value | | | |
Investments of cash collateral received from securities loaned, at value (See Note 2.C.) | | | |
| | | |
| | | |
| | | |
Dividends from non-affiliates | | | |
Dividends from affiliates | | | |
Securities lending income (See Note 2.C.) | | | |
| | | |
| | | |
| | | |
| | | |
Investment securities purchased | | | |
Collateral received on securities loaned (See Note 2.C.) | | | |
| | | |
| | | |
| | | |
| | | |
| | | |
| | | |
Custodian and accounting fees | | | |
Trustees’ and Chief Compliance Officer’s fees | | | |
| | | |
| | | |
| | | |
SEE NOTES TO FINANCIAL STATEMENTS.
| J.P. Morgan Mid Cap/Multi-Cap Funds | |
| JPMorgan Growth Advantage Fund | JPMorgan Mid Cap Equity Fund | |
| | | |
| | | |
Total distributable earnings (loss) | | | |
| | | |
| | | |
| | | |
| | | |
| | | |
| | | |
| | | |
| | | |
| | | |
| | | |
| | | |
Outstanding units of beneficial interest (shares)
($0.0001 par value; unlimited number of shares authorized): | | | |
| | | |
| | | |
| | | |
| | | |
| | | |
| | | |
| | | |
| | | |
| | | |
Class A — Redemption price per share | | | |
Class C — Offering price per share (b) | | | |
Class I — Offering and redemption price per share | | | |
Class R2 — Offering and redemption price per share | | | |
Class R3 — Offering and redemption price per share | | | |
Class R4 — Offering and redemption price per share | | | |
Class R5 — Offering and redemption price per share | | | |
Class R6 — Offering and redemption price per share | | | |
Class A maximum sales charge | | | |
Class A maximum public offering price per share
[net asset value per share/(100% – maximum sales charge)] | | | |
Cost of investments in non-affiliates | | | |
Cost of investments in affiliates | | | |
Investment securities on loan, at value (See Note 2.C.) | | | |
Cost of investment of cash collateral (See Note 2.C.) | | | |
(a)
Per share amounts may not recalculate due to rounding of net assets and/or shares outstanding.
(b)
Redemption price for Class C Shares varies based upon length of time the shares are held.
SEE NOTES TO FINANCIAL STATEMENTS.
| J.P. Morgan Mid Cap/Multi-Cap Funds | |
STATEMENTS OF ASSETS AND LIABILITIESAS OF December 31, 2023 (Unaudited) (continued)
(Amounts in thousands, except per share amounts)
| JPMorgan
Mid Cap
Value Fund | |
| | |
Investments in non-affiliates, at value | | |
Investments in affiliates, at value | | |
Investments of cash collateral received from securities loaned, at value (See Note 2.C.) | | |
| | |
| | |
| | |
Dividends from non-affiliates | | |
Dividends from affiliates | | |
Securities lending income (See Note 2.C.) | | |
| | |
| | |
| | |
Investment securities purchased | | |
Collateral received on securities loaned (See Note 2.C.) | | |
| | |
| | |
| | |
| | |
| | |
| | |
Custodian and accounting fees | | |
Trustees’ and Chief Compliance Officer’s fees | | |
| | |
| | |
| | |
(a)
Amount rounds to less than one thousand.
SEE NOTES TO FINANCIAL STATEMENTS.
| J.P. Morgan Mid Cap/Multi-Cap Funds | |
| JPMorgan Mid Cap Value Fund | |
| | |
| | |
Total distributable earnings (loss) | | |
| | |
| | |
| | |
| | |
| | |
| | |
| | |
| | |
| | |
| | |
| | |
| | |
Outstanding units of beneficial interest (shares)
($0.0001 par value; unlimited number of shares authorized): | | |
| | |
| | |
| | |
| | |
| | |
| | |
| | |
| | |
| | |
| | |
Class A — Redemption price per share | | |
Class C — Offering price per share (b) | | |
Class I — Offering and redemption price per share | | |
Class L — Offering and redemption price per share | | |
Class R2 — Offering and redemption price per share | | |
Class R3 — Offering and redemption price per share | | |
Class R4 — Offering and redemption price per share | | |
Class R5 — Offering and redemption price per share | | |
Class R6 — Offering and redemption price per share | | |
Class A maximum sales charge | | |
Class A maximum public offering price per share
[net asset value per share/(100% – maximum sales charge)] | | |
Cost of investments in non-affiliates | | |
Cost of investments in affiliates | | |
Investment securities on loan, at value (See Note 2.C.) | | |
Cost of investment of cash collateral (See Note 2.C.) | | |
(a)
Per share amounts may not recalculate due to rounding of net assets and/or shares outstanding.
(b)
Redemption price for Class C Shares varies based upon length of time the shares are held.
SEE NOTES TO FINANCIAL STATEMENTS.
| J.P. Morgan Mid Cap/Multi-Cap Funds | |
STATEMENTS OF OPERATIONSFOR THE SIX MONTHS ENDED December 31, 2023 (Unaudited)
(Amounts in thousands)
| JPMorgan
Growth
Advantage Fund | JPMorgan
Mid Cap
Equity Fund | |
| | | |
Interest income from affiliates | | | |
Dividend income from non-affiliates | | | |
Dividend income from affiliates | | | |
Income from securities lending (net) (See Note 2.C.) | | | |
| | | |
| | | |
| | | |
| | | |
| | | |
| | | |
| | | |
| | | |
| | | |
| | | |
| | | |
| | | |
| | | |
| | | |
| | | |
| | | |
| | | |
Custodian and accounting fees | | | |
| | | |
Trustees’ and Chief Compliance Officer’s fees | | | |
Printing and mailing costs | | | |
Registration and filing fees | | | |
Transfer agency fees (See Note 2.G.) | | | |
| | | |
| | | |
| | | |
Less expense reimbursements | | | |
| | | |
Net investment income (loss) | | | |
(a)
Amount rounds to less than one thousand.
SEE NOTES TO FINANCIAL STATEMENTS.
| J.P. Morgan Mid Cap/Multi-Cap Funds | |
| JPMorgan Growth Advantage Fund | JPMorgan Mid Cap Equity Fund | |
REALIZED/UNREALIZED GAINS (LOSSES): | | | |
Net realized gain (loss) on transactions from: | | | |
Investments in non-affiliates | | | |
Investments in affiliates | | | |
| | | |
Change in net unrealized appreciation/depreciation on: | | | |
Investments in non-affiliates | | | |
Investments in affiliates | | | |
Change in net unrealized appreciation/depreciation | | | |
Net realized/unrealized gains (losses) | | | |
Change in net assets resulting from operations | | | |
SEE NOTES TO FINANCIAL STATEMENTS.
| J.P. Morgan Mid Cap/Multi-Cap Funds | |
STATEMENTS OF OPERATIONSFOR THE SIX MONTHS ENDED December 31, 2023 (Unaudited) (continued)
(Amounts in thousands)
| JPMorgan
Mid Cap
Value Fund | |
| | |
Interest income from affiliates | | |
Dividend income from non-affiliates | | |
Dividend income from affiliates | | |
Income from securities lending (net) (See Note 2.C.) | | |
| | |
| | |
| | |
| | |
| | |
| | |
| | |
| | |
| | |
| | |
| | |
| | |
| | |
| | |
| | |
| | |
| | |
| | |
Custodian and accounting fees | | |
| | |
Trustees’ and Chief Compliance Officer’s fees | | |
Printing and mailing costs | | |
Registration and filing fees | | |
Transfer agency fees (See Note 2.G.) | | |
| | |
| | |
| | |
Less expense reimbursements | | |
| | |
Net investment income (loss) | | |
(a)
Amount rounds to less than one thousand.
SEE NOTES TO FINANCIAL STATEMENTS.
| J.P. Morgan Mid Cap/Multi-Cap Funds | |
| JPMorgan Mid Cap Value Fund | |
REALIZED/UNREALIZED GAINS (LOSSES): | | |
Net realized gain (loss) on transactions from: | | |
Investments in non-affiliates | | |
Investments in affiliates | | |
| | |
Change in net unrealized appreciation/depreciation on: | | |
Investments in non-affiliates | | |
Investments in affiliates | | |
Change in net unrealized appreciation/depreciation | | |
Net realized/unrealized gains (losses) | | |
Change in net assets resulting from operations | | |
SEE NOTES TO FINANCIAL STATEMENTS.
| J.P. Morgan Mid Cap/Multi-Cap Funds | |
STATEMENTS OF CHANGES IN NET ASSETSFOR THE PERIODS INDICATED
(Amounts in thousands)
| JPMorgan Growth Advantage Fund | JPMorgan Mid Cap Equity Fund |
| Six Months Ended
December 31, 2023
(Unaudited) | | Six Months Ended
December 31, 2023
(Unaudited) | |
CHANGE IN NET ASSETS RESULTING FROM OPERATIONS: | | | | |
Net investment income (loss) | | | | |
| | | | |
Change in net unrealized appreciation/depreciation | | | | |
Change in net assets resulting from operations | | | | |
DISTRIBUTIONS TO SHAREHOLDERS: | | | | |
| | | | |
| | | | |
| | | | |
| | | | |
| | | | |
| | | | |
| | | | |
| | | | |
Total distributions to shareholders | | | | |
| | | | |
Change in net assets resulting from capital transactions | | | | |
| | | | |
| | | | |
| | | | |
| | | | |
SEE NOTES TO FINANCIAL STATEMENTS.
| J.P. Morgan Mid Cap/Multi-Cap Funds | |
| JPMorgan Mid Cap Growth Fund | JPMorgan Mid Cap Value Fund |
| Six Months Ended
December 31, 2023
(Unaudited) | | Six Months Ended
December 31, 2023
(Unaudited) | |
CHANGE IN NET ASSETS RESULTING FROM OPERATIONS: | | | | |
Net investment income (loss) | | | | |
| | | | |
Change in net unrealized appreciation/depreciation | | | | |
Change in net assets resulting from operations | | | | |
DISTRIBUTIONS TO SHAREHOLDERS: | | | | |
| | | | |
| | | | |
| | | | |
| | | | |
| | | | |
| | | | |
| | | | |
| | | | |
| | | | |
Total distributions to shareholders | | | | |
| | | | |
Change in net assets resulting from capital transactions | | | | |
| | | | |
| | | | |
| | | | |
| | | | |
SEE NOTES TO FINANCIAL STATEMENTS.
| J.P. Morgan Mid Cap/Multi-Cap Funds | |
STATEMENTS OF CHANGES IN NET ASSETSFOR THE PERIODS INDICATED (continued)
(Amounts in thousands)
| JPMorgan Value Advantage Fund |
| Six Months Ended
December 31, 2023
(Unaudited) | |
CHANGE IN NET ASSETS RESULTING FROM OPERATIONS: | | |
Net investment income (loss) | | |
| | |
Change in net unrealized appreciation/depreciation | | |
Change in net assets resulting from operations | | |
DISTRIBUTIONS TO SHAREHOLDERS: | | |
| | |
| | |
| | |
| | |
| | |
| | |
| | |
| | |
| | |
Total distributions to shareholders | | |
| | |
Change in net assets resulting from capital transactions | | |
| | |
| | |
| | |
| | |
SEE NOTES TO FINANCIAL STATEMENTS.
| J.P. Morgan Mid Cap/Multi-Cap Funds | |
| JPMorgan Growth Advantage Fund | JPMorgan Mid Cap Equity Fund |
| Six Months Ended December 31, 2023
(Unaudited) | | Six Months Ended December 31, 2023
(Unaudited) | |
| | | | |
| | | | |
Proceeds from shares issued | | | | |
| | | | |
| | | | |
Change in net assets resulting from Class A capital transactions | | | | |
| | | | |
Proceeds from shares issued | | | | |
| | | | |
| | | | |
Change in net assets resulting from Class C capital transactions | | | | |
| | | | |
Proceeds from shares issued | | | | |
| | | | |
| | | | |
Change in net assets resulting from Class I capital transactions | | | | |
| | | | |
Proceeds from shares issued | | | | |
| | | | |
| | | | |
Change in net assets resulting from Class R2 capital transactions | | | | |
| | | | |
Proceeds from shares issued | | | | |
| | | | |
| | | | |
Change in net assets resulting from Class R3 capital transactions | | | | |
| | | | |
Proceeds from shares issued | | | | |
| | | | |
| | | | |
Change in net assets resulting from Class R4 capital transactions | | | | |
| | | | |
Proceeds from shares issued | | | | |
| | | | |
| | | | |
Change in net assets resulting from Class R5 capital transactions | | | | |
SEE NOTES TO FINANCIAL STATEMENTS.
| J.P. Morgan Mid Cap/Multi-Cap Funds | |
STATEMENTS OF CHANGES IN NET ASSETSFOR THE PERIODS INDICATED (continued)
(Amounts in thousands)
| JPMorgan Growth Advantage Fund | JPMorgan Mid Cap Equity Fund |
| Six Months Ended December 31, 2023 (Unaudited) | | Six Months Ended December 31, 2023 (Unaudited) | |
CAPITAL TRANSACTIONS: (continued) | | | | |
| | | | |
Proceeds from shares issued | | | | |
| | | | |
| | | | |
Change in net assets resulting from Class R6 capital transactions | | | | |
Total change in net assets resulting from capital transactions | | | | |
| | | | |
| | | | |
| | | | |
| | | | |
| | | | |
| | | | |
| | | | |
| | | | |
| | | | |
| | | | |
| | | | |
| | | | |
| | | | |
| | | | |
| | | | |
| | | | |
| | | | |
| | | | |
| | | | |
| | | | |
Change in Class R2 Shares | | | | |
| | | | |
| | | | |
| | | | |
| | | | |
Change in Class R3 Shares | | | | |
| | | | |
| | | | |
| | | | |
| | | | |
Change in Class R4 Shares | | | | |
(a)
Amount rounds to less than one thousand.
SEE NOTES TO FINANCIAL STATEMENTS.
| J.P. Morgan Mid Cap/Multi-Cap Funds | |
| JPMorgan Growth Advantage Fund | JPMorgan Mid Cap Equity Fund |
| Six Months Ended December 31, 2023 (Unaudited) | | Six Months Ended December 31, 2023 (Unaudited) | |
SHARE TRANSACTIONS: (continued) | | | | |
| | | | |
| | | | |
| | | | |
| | | | |
Change in Class R5 Shares | | | | |
| | | | |
| | | | |
| | | | |
| | | | |
Change in Class R6 Shares | | | | |
(a)
Amount rounds to less than one thousand.
SEE NOTES TO FINANCIAL STATEMENTS.
| J.P. Morgan Mid Cap/Multi-Cap Funds | |
STATEMENTS OF CHANGES IN NET ASSETSFOR THE PERIODS INDICATED (continued)
(Amounts in thousands)
| JPMorgan Mid Cap Growth Fund | JPMorgan Mid Cap Value Fund |
| Six Months Ended December 31, 2023
(Unaudited) | | Six Months Ended December 31, 2023
(Unaudited) | |
| | | | |
| | | | |
Proceeds from shares issued | | | | |
| | | | |
| | | | |
Change in net assets resulting from Class A capital transactions | | | | |
| | | | |
Proceeds from shares issued | | | | |
| | | | |
| | | | |
Change in net assets resulting from Class C capital transactions | | | | |
| | | | |
Proceeds from shares issued | | | | |
| | | | |
| | | | |
Change in net assets resulting from Class I capital transactions | | | | |
| | | | |
Proceeds from shares issued | | | | |
| | | | |
| | | | |
Change in net assets resulting from Class L capital transactions | | | | |
| | | | |
Proceeds from shares issued | | | | |
| | | | |
| | | | |
Change in net assets resulting from Class R2 capital transactions | | | | |
| | | | |
Proceeds from shares issued | | | | |
| | | | |
| | | | |
Change in net assets resulting from Class R3 capital transactions | | | | |
| | | | |
Proceeds from shares issued | | | | |
| | | | |
| | | | |
Change in net assets resulting from Class R4 capital transactions | | | | |
| | | | |
Proceeds from shares issued | | | | |
| | | | |
| | | | |
Change in net assets resulting from Class R5 capital transactions | | | | |
SEE NOTES TO FINANCIAL STATEMENTS.
| J.P. Morgan Mid Cap/Multi-Cap Funds | |
| JPMorgan Mid Cap Growth Fund | JPMorgan Mid Cap Value Fund |
| Six Months Ended December 31, 2023 (Unaudited) | | Six Months Ended December 31, 2023 (Unaudited) | |
CAPITAL TRANSACTIONS: (continued) | | | | |
| | | | |
Proceeds from shares issued | | | | |
| | | | |
| | | | |
Change in net assets resulting from Class R6 capital transactions | | | | |
Total change in net assets resulting from capital transactions | | | | |
| | | | |
| | | | |
| | | | |
| | | | |
| | | | |
| | | | |
| | | | |
| | | | |
| | | | |
| | | | |
| | | | |
| | | | |
| | | | |
| | | | |
| | | | |
| | | | |
| | | | |
| | | | |
| | | | |
| | | | |
| | | | |
| | | | |
| | | | |
| | | | |
| | | | |
Change in Class R2 Shares | | | | |
| | | | |
| | | | |
| | | | |
| | | | |
Change in Class R3 Shares | | | | |
SEE NOTES TO FINANCIAL STATEMENTS.
| J.P. Morgan Mid Cap/Multi-Cap Funds | |
STATEMENTS OF CHANGES IN NET ASSETSFOR THE PERIODS INDICATED (continued)
(Amounts in thousands)
| JPMorgan Mid Cap Growth Fund | JPMorgan Mid Cap Value Fund |
| Six Months Ended December 31, 2023 (Unaudited) | | Six Months Ended December 31, 2023 (Unaudited) | |
SHARE TRANSACTIONS: (continued) | | | | |
| | | | |
| | | | |
| | | | |
| | | | |
Change in Class R4 Shares | | | | |
| | | | |
| | | | |
| | | | |
| | | | |
Change in Class R5 Shares | | | | |
| | | | |
| | | | |
| | | | |
| | | | |
Change in Class R6 Shares | | | | |
SEE NOTES TO FINANCIAL STATEMENTS.
| J.P. Morgan Mid Cap/Multi-Cap Funds | |
| JPMorgan Value Advantage Fund |
| Six Months Ended December 31, 2023
(Unaudited) | |
| | |
| | |
Proceeds from shares issued | | |
| | |
| | |
Change in net assets resulting from Class A capital transactions | | |
| | |
Proceeds from shares issued | | |
| | |
| | |
Change in net assets resulting from Class C capital transactions | | |
| | |
Proceeds from shares issued | | |
| | |
| | |
Change in net assets resulting from Class I capital transactions | | |
| | |
Proceeds from shares issued | | |
| | |
| | |
Change in net assets resulting from Class L capital transactions | | |
| | |
Proceeds from shares issued | | |
| | |
| | |
Change in net assets resulting from Class R2 capital transactions | | |
| | |
Proceeds from shares issued | | |
| | |
| | |
Change in net assets resulting from Class R3 capital transactions | | |
| | |
Proceeds from shares issued | | |
| | |
| | |
Change in net assets resulting from Class R4 capital transactions | | |
SEE NOTES TO FINANCIAL STATEMENTS.
| J.P. Morgan Mid Cap/Multi-Cap Funds | |
STATEMENTS OF CHANGES IN NET ASSETSFOR THE PERIODS INDICATED (continued)
(Amounts in thousands)
| JPMorgan Value Advantage Fund |
| Six Months Ended December 31, 2023 (Unaudited) | |
CAPITAL TRANSACTIONS: (continued) | | |
| | |
Proceeds from shares issued | | |
| | |
| | |
Change in net assets resulting from Class R5 capital transactions | | |
| | |
Proceeds from shares issued | | |
| | |
| | |
Change in net assets resulting from Class R6 capital transactions | | |
Total change in net assets resulting from capital transactions | | |
| | |
| | |
| | |
| | |
| | |
| | |
| | |
| | |
| | |
| | |
| | |
| | |
| | |
| | |
| | |
| | |
| | |
| | |
| | |
| | |
| | |
| | |
| | |
| | |
| | |
Change in Class R2 Shares | | |
(a)
Amount rounds to less than one thousand.
SEE NOTES TO FINANCIAL STATEMENTS.
| J.P. Morgan Mid Cap/Multi-Cap Funds | |
| JPMorgan Value Advantage Fund |
| Six Months Ended December 31, 2023 (Unaudited) | |
SHARE TRANSACTIONS: (continued) | | |
| | |
| | |
| | |
| | |
Change in Class R3 Shares | | |
| | |
| | |
| | |
| | |
Change in Class R4 Shares | | |
| | |
| | |
| | |
| | |
Change in Class R5 Shares | | |
| | |
| | |
| | |
| | |
Change in Class R6 Shares | | |
(a)
Amount rounds to less than one thousand.
SEE NOTES TO FINANCIAL STATEMENTS.
| J.P. Morgan Mid Cap/Multi-Cap Funds | |
FINANCIAL HIGHLIGHTSFOR THE PERIODS INDICATED
| Per share operating performance |
| | | |
| Net asset
value,
beginning
of period | Net
investment
income
(loss)(b) | Net realized
and unrealized
gains
(losses) on
investments | Total from
investment
operations | | | |
JPMorgan Growth Advantage Fund | | | | | | | |
| | | | | | | |
Six Months Ended December 31, 2023 (Unaudited) | | | | | | | |
| | | | | | | |
| | | | | | | |
| | | | | | | |
| | | | | | | |
| | | | | | | |
| | | | | | | |
Six Months Ended December 31, 2023 (Unaudited) | | | | | | | |
| | | | | | | |
| | | | | | | |
| | | | | | | |
| | | | | | | |
| | | | | | | |
| | | | | | | |
Six Months Ended December 31, 2023 (Unaudited) | | | | | | | |
| | | | | | | |
| | | | | | | |
| | | | | | | |
| | | | | | | |
| | | | | | | |
| | | | | | | |
Six Months Ended December 31, 2023 (Unaudited) | | | | | | | |
| | | | | | | |
| | | | | | | |
| | | | | | | |
| | | | | | | |
| | | | | | | |
| | | | | | | |
Six Months Ended December 31, 2023 (Unaudited) | | | | | | | |
| | | | | | | |
| | | | | | | |
| | | | | | | |
| | | | | | | |
| | | | | | | |
| | | | | | | |
Six Months Ended December 31, 2023 (Unaudited) | | | | | | | |
| | | | | | | |
| | | | | | | |
| | | | | | | |
| | | | | | | |
| | | | | | | |
SEE NOTES TO FINANCIAL STATEMENTS.
| J.P. Morgan Mid Cap/Multi-Cap Funds | |
| |
| | | Ratios to average net assets(a) |
Net asset
value,
end of
period | Total return
(excludes
sales charge)(c)(d) | Net assets,
end of
period
(000's) | | Net
investment
income
(loss) | Expenses without
waivers and reimbursements | |
| | | | | | |
| | | | | | |
| | | | | | |
| | | | | | |
| | | | | | |
| | | | | | |
| | | | | | |
| | | | | | |
| | | | | | |
| | | | | | |
| | | | | | |
| | | | | | |
| | | | | | |
| | | | | | |
| | | | | | |
| | | | | | |
| | | | | | |
| | | | | | |
| | | | | | |
| | | | | | |
| | | | | | |
| | | | | | |
| | | | | | |
| | | | | | |
| | | | | | |
| | | | | | |
| | | | | | |
| | | | | | |
| | | | | | |
| | | | | | |
| | | | | | |
| | | | | | |
| | | | | | |
| | | | | | |
| | | | | | |
| | | | | | |
| | | | | | |
| | | | | | |
| | | | | | |
| | | | | | |
| | | | | | |
| | | | | | |
| | | | | | |
SEE NOTES TO FINANCIAL STATEMENTS.
| J.P. Morgan Mid Cap/Multi-Cap Funds | |
FINANCIAL HIGHLIGHTSFOR THE PERIODS INDICATED (continued)
| Per share operating performance |
| | | |
| Net asset
value,
beginning
of period | Net
investment
income
(loss)(b) | Net realized
and unrealized
gains
(losses) on
investments | Total from
investment
operations | | | |
JPMorgan Growth Advantage Fund (continued) | | | | | | | |
| | | | | | | |
Six Months Ended December 31, 2023 (Unaudited) | | | | | | | |
| | | | | | | |
| | | | | | | |
| | | | | | | |
| | | | | | | |
| | | | | | | |
| | | | | | | |
Six Months Ended December 31, 2023 (Unaudited) | | | | | | | |
| | | | | | | |
| | | | | | | |
| | | | | | | |
| | | | | | | |
| | | | | | | |
|
| Annualized for periods less than one year, unless otherwise noted. |
| Calculated based upon average shares outstanding. |
| Not annualized for periods less than one year. |
| Includes adjustments in accordance with accounting principles generally accepted in the United States of America and as such, the net asset values for financial reporting purposes and the returns based upon those net asset values may differ from the net asset values and returns for shareholder transactions. |
| Includes interest expense, if applicable, each of which is less than 0.005% unless otherwise noted. |
SEE NOTES TO FINANCIAL STATEMENTS.
| J.P. Morgan Mid Cap/Multi-Cap Funds | |
| |
| | | Ratios to average net assets(a) |
Net asset
value,
end of
period | Total return
(excludes
sales charge)(c)(d) | Net assets,
end of
period
(000's) | | Net
investment
income
(loss) | Expenses without
waivers and reimbursements | |
|
| | | | | | |
| | | | | | |
| | | | | | |
| | | | | | |
| | | | | | |
| | | | | | |
| | | | | | |
| | | | | | |
| | | | | | |
| | | | | | |
| | | | | | |
| | | | | | |
| | | | | | |
| | | | | | |
SEE NOTES TO FINANCIAL STATEMENTS.
| J.P. Morgan Mid Cap/Multi-Cap Funds | |
FINANCIAL HIGHLIGHTSFOR THE PERIODS INDICATED
| Per share operating performance |
| | | |
| Net asset
value,
beginning
of period | Net
investment
income
(loss)(b) | Net realized
and unrealized
gains
(losses) on
investments | Total from
investment
operations | | | |
JPMorgan Mid Cap Equity Fund | | | | | | | |
| | | | | | | |
Six Months Ended December 31, 2023 (Unaudited) | | | | | | | |
| | | | | | | |
| | | | | | | |
| | | | | | | |
| | | | | | | |
| | | | | | | |
| | | | | | | |
Six Months Ended December 31, 2023 (Unaudited) | | | | | | | |
| | | | | | | |
| | | | | | | |
| | | | | | | |
| | | | | | | |
| | | | | | | |
| | | | | | | |
Six Months Ended December 31, 2023 (Unaudited) | | | | | | | |
| | | | | | | |
| | | | | | | |
| | | | | | | |
| | | | | | | |
| | | | | | | |
| | | | | | | |
Six Months Ended December 31, 2023 (Unaudited) | | | | | | | |
| | | | | | | |
| | | | | | | |
| | | | | | | |
| | | | | | | |
| | | | | | | |
| | | | | | | |
Six Months Ended December 31, 2023 (Unaudited) | | | | | | | |
| | | | | | | |
| | | | | | | |
| | | | | | | |
| | | | | | | |
| | | | | | | |
SEE NOTES TO FINANCIAL STATEMENTS.
| J.P. Morgan Mid Cap/Multi-Cap Funds | |
| |
| | | Ratios to average net assets(a) |
Net asset
value,
end of
period | Total return
(excludes
sales charge)(c)(d) | Net assets,
end of
period
(000's) | | Net
investment
income
(loss) | Expenses without
waivers and reimbursements | |
| | | | | | |
| | | | | | |
| | | | | | |
| | | | | | |
| | | | | | |
| | | | | | |
| | | | | | |
| | | | | | |
| | | | | | |
| | | | | | |
| | | | | | |
| | | | | | |
| | | | | | |
| | | | | | |
| | | | | | |
| | | | | | |
| | | | | | |
| | | | | | |
| | | | | | |
| | | | | | |
| | | | | | |
| | | | | | |
| | | | | | |
| | | | | | |
| | | | | | |
| | | | | | |
| | | | | | |
| | | | | | |
| | | | | | |
| | | | | | |
| | | | | | |
| | | | | | |
| | | | | | |
| | | | | | |
| | | | | | |
| | | | | | |
SEE NOTES TO FINANCIAL STATEMENTS.
| J.P. Morgan Mid Cap/Multi-Cap Funds | |
FINANCIAL HIGHLIGHTSFOR THE PERIODS INDICATED (continued)
| Per share operating performance |
| | | |
| Net asset
value,
beginning
of period | Net
investment
income
(loss)(b) | Net realized
and unrealized
gains
(losses) on
investments | Total from
investment
operations | | | |
JPMorgan Mid Cap Equity Fund (continued) | | | | | | | |
| | | | | | | |
Six Months Ended December 31, 2023 (Unaudited) | | | | | | | |
| | | | | | | |
| | | | | | | |
| | | | | | | |
| | | | | | | |
| | | | | | | |
|
| Annualized for periods less than one year, unless otherwise noted. |
| Calculated based upon average shares outstanding. |
| Not annualized for periods less than one year. |
| Includes adjustments in accordance with accounting principles generally accepted in the United States of America and as such, the net asset values for financial reporting purposes and the returns based upon those net asset values may differ from the net asset values and returns for shareholder transactions. |
| Includes interest expense, if applicable, each of which is less than 0.005% unless otherwise noted. |
SEE NOTES TO FINANCIAL STATEMENTS.
| J.P. Morgan Mid Cap/Multi-Cap Funds | |
| |
| | | Ratios to average net assets(a) |
Net asset
value,
end of
period | Total return
(excludes
sales charge)(c)(d) | Net assets,
end of
period
(000's) | | Net
investment
income
(loss) | Expenses without
waivers and reimbursements | |
|
| | | | | | |
| | | | | | |
| | | | | | |
| | | | | | |
| | | | | | |
| | | | | | |
| | | | | | |
SEE NOTES TO FINANCIAL STATEMENTS.
| J.P. Morgan Mid Cap/Multi-Cap Funds | |
FINANCIAL HIGHLIGHTSFOR THE PERIODS INDICATED
| Per share operating performance |
| | | |
| Net asset
value,
beginning
of period | Net
investment
income
(loss)(b) | Net realized
and unrealized
gains
(losses) on
investments | Total from
investment
operations | | | |
JPMorgan Mid Cap Growth Fund | | | | | | | |
| | | | | | | |
Six Months Ended December 31, 2023 (Unaudited) | | | | | | | |
| | | | | | | |
| | | | | | | |
| | | | | | | |
| | | | | | | |
| | | | | | | |
| | | | | | | |
Six Months Ended December 31, 2023 (Unaudited) | | | | | | | |
| | | | | | | |
| | | | | | | |
| | | | | | | |
| | | | | | | |
| | | | | | | |
| | | | | | | |
Six Months Ended December 31, 2023 (Unaudited) | | | | | | | |
| | | | | | | |
| | | | | | | |
| | | | | | | |
| | | | | | | |
| | | | | | | |
| | | | | | | |
Six Months Ended December 31, 2023 (Unaudited) | | | | | | | |
| | | | | | | |
| | | | | | | |
| | | | | | | |
| | | | | | | |
| | | | | | | |
| | | | | | | |
Six Months Ended December 31, 2023 (Unaudited) | | | | | | | |
| | | | | | | |
| | | | | | | |
| | | | | | | |
| | | | | | | |
| | | | | | | |
| | | | | | | |
Six Months Ended December 31, 2023 (Unaudited) | | | | | | | |
| | | | | | | |
| | | | | | | |
| | | | | | | |
| | | | | | | |
| | | | | | | |
SEE NOTES TO FINANCIAL STATEMENTS.
| J.P. Morgan Mid Cap/Multi-Cap Funds | |
| |
| | | Ratios to average net assets(a) |
Net asset
value,
end of
period | | Net assets,
end of
period
(000's) | | Net
investment
income
(loss) | Expenses without
waivers and reimbursements | |
| | | | | | |
| | | | | | |
| | | | | | |
| | | | | | |
| | | | | | |
| | | | | | |
| | | | | | |
| | | | | | |
| | | | | | |
| | | | | | |
| | | | | | |
| | | | | | |
| | | | | | |
| | | | | | |
| | | | | | |
| | | | | | |
| | | | | | |
| | | | | | |
| | | | | | |
| | | | | | |
| | | | | | |
| | | | | | |
| | | | | | |
| | | | | | |
| | | | | | |
| | | | | | |
| | | | | | |
| | | | | | |
| | | | | | |
| | | | | | |
| | | | | | |
| | | | | | |
| | | | | | |
| | | | | | |
| | | | | | |
| | | | | | |
| | | | | | |
| | | | | | |
| | | | | | |
| | | | | | |
| | | | | | |
| | | | | | |
| | | | | | |
SEE NOTES TO FINANCIAL STATEMENTS.
| J.P. Morgan Mid Cap/Multi-Cap Funds | |
FINANCIAL HIGHLIGHTSFOR THE PERIODS INDICATED (continued)
| Per share operating performance |
| | | |
| Net asset
value,
beginning
of period | Net
investment
income
(loss)(b) | Net realized
and unrealized
gains
(losses) on
investments | Total from
investment
operations | | | |
JPMorgan Mid Cap Growth Fund (continued) | | | | | | | |
| | | | | | | |
Six Months Ended December 31, 2023 (Unaudited) | | | | | | | |
| | | | | | | |
| | | | | | | |
| | | | | | | |
| | | | | | | |
| | | | | | | |
| | | | | | | |
Six Months Ended December 31, 2023 (Unaudited) | | | | | | | |
| | | | | | | |
| | | | | | | |
| | | | | | | |
| | | | | | | |
| | | | | | | |
|
| Annualized for periods less than one year, unless otherwise noted. |
| Calculated based upon average shares outstanding. |
| Not annualized for periods less than one year. |
| Includes adjustments in accordance with accounting principles generally accepted in the United States of America and as such, the net asset values for financial reporting purposes and the returns based upon those net asset values may differ from the net asset values and returns for shareholder transactions. |
| Includes interest expense, if applicable, each of which is less than 0.005% unless otherwise noted. |
SEE NOTES TO FINANCIAL STATEMENTS.
| J.P. Morgan Mid Cap/Multi-Cap Funds | |
| |
| | | Ratios to average net assets(a) |
Net asset
value,
end of
period | | Net assets,
end of
period
(000's) | | Net
investment
income
(loss) | Expenses without
waivers and reimbursements | |
|
| | | | | | |
| | | | | | |
| | | | | | |
| | | | | | |
| | | | | | |
| | | | | | |
| | | | | | |
| | | | | | |
| | | | | | |
| | | | | | |
| | | | | | |
| | | | | | |
| | | | | | |
| | | | | | |
SEE NOTES TO FINANCIAL STATEMENTS.
| J.P. Morgan Mid Cap/Multi-Cap Funds | |
FINANCIAL HIGHLIGHTSFOR THE PERIODS INDICATED
| Per share operating performance |
| | | |
| Net asset
value,
beginning
of period | Net
investment
income
(loss)(b) | Net realized
and unrealized
gains
(losses) on
investments | Total from
investment
operations | | | |
JPMorgan Mid Cap Value Fund | | | | | | | |
| | | | | | | |
Six Months Ended December 31, 2023 (Unaudited) | | | | | | | |
| | | | | | | |
| | | | | | | |
| | | | | | | |
| | | | | | | |
| | | | | | | |
| | | | | | | |
Six Months Ended December 31, 2023 (Unaudited) | | | | | | | |
| | | | | | | |
| | | | | | | |
| | | | | | | |
| | | | | | | |
| | | | | | | |
| | | | | | | |
Six Months Ended December 31, 2023 (Unaudited) | | | | | | | |
| | | | | | | |
| | | | | | | |
| | | | | | | |
| | | | | | | |
| | | | | | | |
| | | | | | | |
Six Months Ended December 31, 2023 (Unaudited) | | | | | | | |
| | | | | | | |
| | | | | | | |
| | | | | | | |
| | | | | | | |
| | | | | | | |
| | | | | | | |
Six Months Ended December 31, 2023 (Unaudited) | | | | | | | |
| | | | | | | |
| | | | | | | |
| | | | | | | |
| | | | | | | |
| | | | | | | |
| | | | | | | |
Six Months Ended December 31, 2023 (Unaudited) | | | | | | | |
| | | | | | | |
| | | | | | | |
| | | | | | | |
| | | | | | | |
| | | | | | | |
SEE NOTES TO FINANCIAL STATEMENTS.
| J.P. Morgan Mid Cap/Multi-Cap Funds | |
| |
| | | Ratios to average net assets(a) |
Net asset
value,
end of
period | Total return
(excludes
sales charge)(c)(d) | Net assets,
end of
period
(000's) | | Net
investment
income
(loss) | Expenses without
waivers and reimbursements | |
| | | | | | |
| | | | | | |
| | | | | | |
| | | | | | |
| | | | | | |
| | | | | | |
| | | | | | |
| | | | | | |
| | | | | | |
| | | | | | |
| | | | | | |
| | | | | | |
| | | | | | |
| | | | | | |
| | | | | | |
| | | | | | |
| | | | | | |
| | | | | | |
| | | | | | |
| | | | | | |
| | | | | | |
| | | | | | |
| | | | | | |
| | | | | | |
| | | | | | |
| | | | | | |
| | | | | | |
| | | | | | |
| | | | | | |
| | | | | | |
| | | | | | |
| | | | | | |
| | | | | | |
| | | | | | |
| | | | | | |
| | | | | | |
| | | | | | |
| | | | | | |
| | | | | | |
| | | | | | |
| | | | | | |
| | | | | | |
| | | | | | |
SEE NOTES TO FINANCIAL STATEMENTS.
| J.P. Morgan Mid Cap/Multi-Cap Funds | |
FINANCIAL HIGHLIGHTSFOR THE PERIODS INDICATED (continued)
| Per share operating performance |
| | | |
| Net asset
value,
beginning
of period | Net
investment
income
(loss)(b) | Net realized
and unrealized
gains
(losses) on
investments | Total from
investment
operations | | | |
JPMorgan Mid Cap Value Fund (continued) | | | | | | | |
| | | | | | | |
Six Months Ended December 31, 2023 (Unaudited) | | | | | | | |
| | | | | | | |
| | | | | | | |
| | | | | | | |
| | | | | | | |
| | | | | | | |
| | | | | | | |
Six Months Ended December 31, 2023 (Unaudited) | | | | | | | |
| | | | | | | |
| | | | | | | |
| | | | | | | |
| | | | | | | |
| | | | | | | |
| | | | | | | |
Six Months Ended December 31, 2023 (Unaudited) | | | | | | | |
| | | | | | | |
| | | | | | | |
| | | | | | | |
| | | | | | | |
| | | | | | | |
|
| Annualized for periods less than one year, unless otherwise noted. |
| Calculated based upon average shares outstanding. |
| Not annualized for periods less than one year. |
| Includes adjustments in accordance with accounting principles generally accepted in the United States of America and as such, the net asset values for financial reporting purposes and the returns based upon those net asset values may differ from the net asset values and returns for shareholder transactions. |
| Includes interest expense, if applicable, each of which is less than 0.005% unless otherwise noted. |
SEE NOTES TO FINANCIAL STATEMENTS.
| J.P. Morgan Mid Cap/Multi-Cap Funds | |
| |
| | | Ratios to average net assets(a) |
Net asset
value,
end of
period | Total return
(excludes
sales charge)(c)(d) | Net assets,
end of
period
(000's) | | Net
investment
income
(loss) | Expenses without
waivers and reimbursements | |
|
| | | | | | |
| | | | | | |
| | | | | | |
| | | | | | |
| | | | | | |
| | | | | | |
| | | | | | |
| | | | | | |
| | | | | | |
| | | | | | |
| | | | | | |
| | | | | | |
| | | | | | |
| | | | | | |
| | | | | | |
| | | | | | |
| | | | | | |
| | | | | | |
| | | | | | |
| | | | | | |
| | | | | | |
SEE NOTES TO FINANCIAL STATEMENTS.
| J.P. Morgan Mid Cap/Multi-Cap Funds | |
FINANCIAL HIGHLIGHTSFOR THE PERIODS INDICATED
| Per share operating performance |
| | | |
| Net asset
value,
beginning
of period | Net
investment
income
(loss)(b) | Net realized
and unrealized
gains
(losses) on
investments | Total from
investment
operations | | | |
JPMorgan Value Advantage Fund | | | | | | | |
| | | | | | | |
Six Months Ended December 31, 2023 (Unaudited) | | | | | | | |
| | | | | | | |
| | | | | | | |
| | | | | | | |
| | | | | | | |
| | | | | | | |
| | | | | | | |
Six Months Ended December 31, 2023 (Unaudited) | | | | | | | |
| | | | | | | |
| | | | | | | |
| | | | | | | |
| | | | | | | |
| | | | | | | |
| | | | | | | |
Six Months Ended December 31, 2023 (Unaudited) | | | | | | | |
| | | | | | | |
| | | | | | | |
| | | | | | | |
| | | | | | | |
| | | | | | | |
| | | | | | | |
Six Months Ended December 31, 2023 (Unaudited) | | | | | | | |
| | | | | | | |
| | | | | | | |
| | | | | | | |
| | | | | | | |
| | | | | | | |
| | | | | | | |
Six Months Ended December 31, 2023 (Unaudited) | | | | | | | |
| | | | | | | |
| | | | | | | |
| | | | | | | |
| | | | | | | |
| | | | | | | |
| | | | | | | |
Six Months Ended December 31, 2023 (Unaudited) | | | | | | | |
| | | | | | | |
| | | | | | | |
| | | | | | | |
| | | | | | | |
| | | | | | | |
SEE NOTES TO FINANCIAL STATEMENTS.
| J.P. Morgan Mid Cap/Multi-Cap Funds | |
| |
| | | Ratios to average net assets(a) |
Net asset
value,
end of
period | Total return
(excludes
sales charge)(c)(d) | Net assets,
end of
period
(000's) | | Net
investment
income
(loss) | Expenses without
waivers and reimbursements | |
| | | | | | |
| | | | | | |
| | | | | | |
| | | | | | |
| | | | | | |
| | | | | | |
| | | | | | |
| | | | | | |
| | | | | | |
| | | | | | |
| | | | | | |
| | | | | | |
| | | | | | |
| | | | | | |
| | | | | | |
| | | | | | |
| | | | | | |
| | | | | | |
| | | | | | |
| | | | | | |
| | | | | | |
| | | | | | |
| | | | | | |
| | | | | | |
| | | | | | |
| | | | | | |
| | | | | | |
| | | | | | |
| | | | | | |
| | | | | | |
| | | | | | |
| | | | | | |
| | | | | | |
| | | | | | |
| | | | | | |
| | | | | | |
| | | | | | |
| | | | | | |
| | | | | | |
| | | | | | |
| | | | | | |
| | | | | | |
| | | | | | |
SEE NOTES TO FINANCIAL STATEMENTS.
| J.P. Morgan Mid Cap/Multi-Cap Funds | |
FINANCIAL HIGHLIGHTSFOR THE PERIODS INDICATED (continued)
| Per share operating performance |
| | | |
| Net asset
value,
beginning
of period | Net
investment
income
(loss)(b) | Net realized
and unrealized
gains
(losses) on
investments | Total from
investment
operations | | | |
JPMorgan Value Advantage Fund (continued) | | | | | | | |
| | | | | | | |
Six Months Ended December 31, 2023 (Unaudited) | | | | | | | |
| | | | | | | |
| | | | | | | |
| | | | | | | |
| | | | | | | |
| | | | | | | |
| | | | | | | |
Six Months Ended December 31, 2023 (Unaudited) | | | | | | | |
| | | | | | | |
| | | | | | | |
| | | | | | | |
| | | | | | | |
| | | | | | | |
| | | | | | | |
Six Months Ended December 31, 2023 (Unaudited) | | | | | | | |
| | | | | | | |
| | | | | | | |
| | | | | | | |
| | | | | | | |
| | | | | | | |
|
| Annualized for periods less than one year, unless otherwise noted. |
| Calculated based upon average shares outstanding. |
| Not annualized for periods less than one year. |
| Includes adjustments in accordance with accounting principles generally accepted in the United States of America and as such, the net asset values for financial reporting purposes and the returns based upon those net asset values may differ from the net asset values and returns for shareholder transactions. |
| Includes interest expense, if applicable, each of which is less than 0.005% unless otherwise noted. |
SEE NOTES TO FINANCIAL STATEMENTS.
| J.P. Morgan Mid Cap/Multi-Cap Funds | |
| |
| | | Ratios to average net assets(a) |
Net asset
value,
end of
period | Total return
(excludes
sales charge)(c)(d) | Net assets,
end of
period
(000's) | | Net
investment
income
(loss) | Expenses without
waivers and reimbursements | |
|
| | | | | | |
| | | | | | |
| | | | | | |
| | | | | | |
| | | | | | |
| | | | | | |
| | | | | | |
| | | | | | |
| | | | | | |
| | | | | | |
| | | | | | |
| | | | | | |
| | | | | | |
| | | | | | |
| | | | | | |
| | | | | | |
| | | | | | |
| | | | | | |
| | | | | | |
| | | | | | |
| | | | | | |
SEE NOTES TO FINANCIAL STATEMENTS.
| J.P. Morgan Mid Cap/Multi-Cap Funds | |
NOTES TO FINANCIAL STATEMENTSAS OF December 31, 2023 (Unaudited)
(Dollar values in thousands)
1. Organization
JPMorgan Trust I (“JPM I") and JPMorgan Trust II (“JPM II") (collectively, the “Trusts”) were formed on November 12, 2004, as Delaware statutory trusts, pursuant to Declarations of Trust dated November 5, 2004 and are registered under the Investment Company Act of 1940, as amended (the “1940 Act”), as open-end management investment companies.
J.P. Morgan Mutual Fund Investment Trust (“JPMMFIT”) was organized as a Massachusetts business trust on September 23, 1997, as an open-end management investment company.
J.P. Morgan Fleming Mutual Fund Group, Inc. (“JPMFMFG,” and with JPM I, JPM II and JPMMFIT, collectively, the “Trusts”) was organized as a Maryland corporation on August 19, 1997, as an open-end management investment company.
The following are 5 separate funds of the Trusts (each, a "Fund" and collectively, the "Funds") covered by this report:
| | | Diversification Classification |
JPMorgan Growth Advantage Fund | Class A, Class C, Class I, Class R2, Class R3, Class R4, Class R5 and Class R6 | | |
JPMorgan Mid Cap Equity Fund | Class A, Class C, Class I, Class R2, Class R5 and Class R6 | | |
JPMorgan Mid Cap Growth Fund | Class A, Class C, Class I, Class R2, Class R3, Class R4, Class R5 and Class R6 | | |
JPMorgan Mid Cap Value Fund | Class A, Class C, Class I, Class L, Class R2, Class R3, Class R4, Class R5 and Class R6 | | |
JPMorgan Value Advantage Fund | Class A, Class C, Class I, Class L, Class R2, Class R3, Class R4, Class R5 and Class R6 | | |
The investment objective of JPMorgan Growth Advantage Fund (“Growth Advantage Fund”) and JPMorgan Mid Cap Equity Fund (“Mid Cap Equity Fund”) is to seek to provide long-term capital growth.
The investment objective of JPMorgan Mid Cap Growth Fund (“Mid Cap Growth Fund”) is to seek growth of capital.
The investment objective of JPMorgan Mid Cap Value Fund (“Mid Cap Value Fund”) is to seek growth from capital appreciation.
The investment objective of JPMorgan Value Advantage Fund (“Value Advantage Fund”) is to seek to provide long-term total return from a combination of income and capital gains.
Class L Shares of Mid Cap Value Fund and Value Advantage Fund are publicly offered on a limited basis. Investors are not eligible to purchase Class L Shares of the Funds unless they meet certain requirements as described in the Funds’ prospectus.
Class A Shares generally provide for a front-end sales charge while Class C Shares provide for a contingent deferred sales charge ("CDSC"). No sales charges are assessed with respect to Class I, Class L, Class R2, Class R3, Class R4, Class R5 and Class R6 Shares. Certain Class A Shares, for which front-end sales charges have been waived, may be subject to a CDSC as described in the Funds' prospectus. Class C Shares automatically convert to Class A Shares after eight years. All classes of shares have equal rights as to earnings, assets and voting privileges, except that each class may bear different transfer agency, distribution and service fees and each class has exclusive voting rights with respect to its distribution plan and shareholder servicing agreements.
J.P. Morgan Investment Management Inc. (“JPMIM”), an indirect, wholly-owned subsidiary of JPMorgan Chase & Co. (“JPMorgan”), acts as adviser (the “Adviser”) and administrator (the “Administrator”) to the Funds.
2. Significant Accounting Policies
The following is a summary of significant accounting policies followed by the Funds in the preparation of their financial statements. The Funds are investment companies and, accordingly, follow the investment company accounting and reporting guidance of the Financial Accounting Standards Board (“FASB”) Accounting Standards Codification Topic 946 — Investment Companies, which is part of U.S. generally accepted accounting principles (“GAAP”). The preparation of financial statements in conformity with GAAP requires management to make estimates and assumptions that affect (i) the reported amounts of assets and liabilities, (ii) disclosure of contingent assets and liabilities at the date of the financial statements, and (iii) the reported amounts of increases and decreases in net assets from operations during the reporting period. Actual results could differ from those estimates.
| J.P. Morgan Mid Cap/Multi-Cap Funds | |
A. Valuation of Investments — Investments are valued in accordance with GAAP and the Funds' valuation policies set forth by, and under the supervision and responsibility of, the Boards of Trustees of the Trusts (the "Boards"), which established the following approach to valuation, as described more fully below: (i) investments for which market quotations are readily available shall be valued at their market value and (ii) all other investments for which market quotations are not readily available shall be valued at their fair value as determined in good faith by the Boards.
Under Section 2(a)(41) of the 1940 Act, the Boards are required to determine fair value for securities that do not have readily available market quotations. Under SEC Rule 2a-5 (Good Faith Determinations of Fair Value), the Boards may designate the performance of these fair valuation determinations to a valuation designee. The Boards have designated the Adviser as the “Valuation Designee” to perform fair valuation determinations for the Funds on behalf of the Boards subject to appropriate oversight by the Boards. The Adviser, as Valuation Designee, leverages the J.P. Morgan Asset Management Americas Valuation Committee (“AVC”) to help oversee and carry out the policies for the valuation of investments held in the Funds. The Adviser, as Valuation Designee, remains responsible for the valuation determinations.
This oversight by the AVC includes monitoring the appropriateness of fair values based on results of ongoing valuation oversight including, but not limited to, consideration of macro or security specific events, market events, and pricing vendor and broker due diligence. The Administrator is responsible for discussing and assessing the potential impacts to the fair values on an ongoing basis, and, at least on a quarterly basis, with the AVC and the Boards.
Equities and other exchange-traded instruments are valued at the last sale price or official market closing price on the primary exchange on which the instrument is traded before the net asset values (“NAV”) of the Funds are calculated on a valuation date.
Investments in open-end investment companies (“Underlying Funds”) are valued at each Underlying Fund’s NAV per share as of the report date.
Valuations reflected in this report are as of the report date. As a result, changes in valuation due to market events and/or issuer-related events after the report date and prior to issuance of the report are not reflected herein.
The various inputs that are used in determining the valuation of the Funds' investments are summarized into the three broad levels listed below.
•
Level 1 — Unadjusted inputs using quoted prices in active markets for identical investments.
•
Level 2 — Other significant observable inputs including, but not limited to, quoted prices for similar investments, inputs other than quoted prices that are observable for investments (such as interest rates, prepayment speeds, credit risk, etc.) or other market corroborated inputs.
•
Level 3 — Significant inputs based on the best information available in the circumstances, to the extent observable inputs are not available (including the Funds' assumptions in determining the fair value of investments).
A financial instrument’s level within the fair value hierarchy is based on the lowest level of any input, both individually and in the aggregate, that is significant to the fair value measurement. The inputs or methodology used for valuing instruments are not necessarily an indication of the risk associated with investing in those instruments.
The following tables represent each valuation input as presented on the Schedules of Portfolio Investments ("SOIs"):
| | | | |
| | Level 2
Other significant
observable inputs | Level 3
Significant
unobservable inputs | |
Investments in Securities | | | | |
| | | | |
| | | | |
| | | | |
| | | | |
| | | | |
| | | | |
| | | | |
Commercial Services & Supplies | | | | |
| | | | |
Construction & Engineering | | | | |
| | | | |
| | | | |
Electronic Equipment, Instruments & Components | | | | |
Energy Equipment & Services | | | | |
| | | | |
| | | | |
| J.P. Morgan Mid Cap/Multi-Cap Funds | |
NOTES TO FINANCIAL STATEMENTSAS OF December 31, 2023 (Unaudited) (continued)
(Dollar values in thousands)
Growth Advantage Fund (continued) | | | | |
| | Level 2 Other significant observable inputs | Level 3 Significant unobservable inputs | |
| | | | |
Health Care Equipment & Supplies | | | | |
Health Care Providers & Services | | | | |
Hotels, Restaurants & Leisure | | | | |
| | | | |
| | | | |
Interactive Media & Services | | | | |
| | | | |
Life Sciences Tools & Services | | | | |
| | | | |
| | | | |
| | | | |
Oil, Gas & Consumable Fuels | | | | |
| | | | |
| | | | |
Semiconductors & Semiconductor Equipment | | | | |
| | | | |
| | | | |
Technology Hardware, Storage & Peripherals | | | | |
Textiles, Apparel & Luxury Goods | | | | |
Trading Companies & Distributors | | | | |
| | | | |
| | | | |
| | | | |
Investment of Cash Collateral from Securities Loaned | | | | |
Total Short-Term Investments | | | | |
Total Investments in Securities | | | | |
| | | | |
| | Level 2
Other significant
observable inputs | Level 3
Significant
unobservable inputs | |
Total Investments in Securities (a) | | | | |
|
| Please refer to the SOI for specifics of portfolio holdings. |
| | | | |
| | Level 2
Other significant
observable inputs | Level 3
Significant
unobservable inputs | |
Investments in Securities | | | | |
| | | | |
| | | | |
| | | | |
| | | | |
| | | | |
| | | | |
| | | | |
| J.P. Morgan Mid Cap/Multi-Cap Funds | |
Mid Cap Growth Fund (continued) | | | | |
| | Level 2 Other significant observable inputs | Level 3 Significant unobservable inputs | |
Commercial Services & Supplies | | | | |
| | | | |
Construction & Engineering | | | | |
| | | | |
Diversified Consumer Services | | | | |
| | | | |
Electronic Equipment, Instruments & Components | | | | |
Energy Equipment & Services | | | | |
| | | | |
| | | | |
| | | | |
Health Care Equipment & Supplies | | | | |
Health Care Providers & Services | | | | |
Hotels, Restaurants & Leisure | | | | |
| | | | |
| | | | |
| | | | |
Life Sciences Tools & Services | | | | |
| | | | |
| | | | |
| | | | |
Oil, Gas & Consumable Fuels | | | | |
| | | | |
| | | | |
| | | | |
Semiconductors & Semiconductor Equipment | | | | |
| | | | |
| | | | |
Textiles, Apparel & Luxury Goods | | | | |
Trading Companies & Distributors | | | | |
| | | | |
| | | | |
| | | | |
Investment of Cash Collateral from Securities Loaned | | | | |
Total Short-Term Investments | | | | |
Total Investments in Securities | | | | |
| | | | |
| | Level 2
Other significant
observable inputs | Level 3
Significant
unobservable inputs | |
Total Investments in Securities (a) | | | | |
|
| Please refer to the SOI for specifics of portfolio holdings. |
| J.P. Morgan Mid Cap/Multi-Cap Funds | |
NOTES TO FINANCIAL STATEMENTSAS OF December 31, 2023 (Unaudited) (continued)
(Dollar values in thousands)
| | | | |
| | Level 2
Other significant
observable inputs | Level 3
Significant
unobservable inputs | |
Total Investments in Securities (a) | | | | |
|
| Please refer to the SOI for specifics of portfolio holdings. |
B. Restricted Securities— Certain securities held by the Funds may be subject to legal or contractual restrictions on resale. Restricted securities generally are resold in transactions exempt from registration under the Securities Act of 1933, as amended (the “Securities Act”). Disposal of these securities may involve time-consuming negotiations and expense. Prompt sale at the current valuation may be difficult and could adversely affect the NAVs of the Funds.
As of December 31, 2023, the Funds, with the exception of Growth Advantage Fund and Mid Cap Growth Fund, had no investments in restricted securities other than securities sold to the Funds under Rule 144A and/or Regulation S under the Securities Act.
As of December 31, 2023, Growth Advantage Fund and Mid Cap Growth Fund held restricted securities as follows:
Growth Advantage Fund
| | | | Percentage
of Funds
Net Assets |
| | | | |
Mid Cap Growth Fund
| | | | Percentage
of Funds
Net Assets |
| | | | |
C. Securities Lending — The Funds are authorized to engage in securities lending in order to generate additional income. The Funds are able to lend to approved borrowers. Citibank N.A. (“Citibank”) serves as lending agent for the Funds, pursuant to a Securities Lending Agency Agreement (the “Securities Lending Agency Agreement”). Securities loaned are collateralized by cash equal to at least 100% of the market value plus accrued interest on the securities lent, which is invested in the Class IM Shares of the JPMorgan U.S. Government Money Market Fund and the Agency SL Class Shares of the JPMorgan Securities Lending Money Market Fund. The Funds retain the interest earned on cash collateral investments but are required to pay the borrower a rebate for the use of the cash collateral. In cases where the lent security is of high value to borrowers, there may be a negative rebate (i.e., a net payment from the borrower to the Funds). Upon termination of a loan, the Funds are required to return to the borrower an amount equal to the cash collateral, plus any rebate owed to the borrowers. The remaining maturities of the securities lending transactions are considered overnight and continuous. Loans are subject to termination by the Funds or the borrower at any time.
The net income earned on the securities lending (after payment of rebates and Citibank’s fee) is included on the Statements of Operations as Income from securities lending (net). The Funds also receive payments from the borrower during the period of the loan, equivalent to dividends and interest earned on the securities loaned, which are recorded as Dividend or Interest income, respectively, on the Statements of Operations.
Under the Securities Lending Agency Agreement, Citibank marks to market the loaned securities on a daily basis. In the event the cash received from the borrower is less than 102% of the value of the loaned securities (105% for loans of non-U.S. securities), Citibank requests additional cash from the borrower so as to maintain a collateralization level of at least 102% of the value of the loaned securities plus accrued interest (105% for loans of non-U.S. securities), subject to certain de minimis amounts.
The value of securities out on loan is recorded as an asset on the Statements of Assets and Liabilities. The value of the cash collateral received is recorded as a liability on the Statements of Assets and Liabilities and details of collateral investments are disclosed on the SOIs.
The Funds bear the risk of loss associated with the collateral investments and are not entitled to additional collateral from the borrower to cover any such losses. To the extent that the value of the collateral investments declines below the amount owed to a borrower, the Funds may incur losses that exceed the amount they earned on lending the security. Upon termination of a loan, the Funds may use leverage (borrow money) to repay the borrower for cash collateral posted if the Adviser does not believe that it is prudent to sell the collateral investments to fund the payment of this liability. Securities lending activity is subject to master netting arrangements.
| J.P. Morgan Mid Cap/Multi-Cap Funds | |
The following table presents for each lending Fund, the value of the securities on loan with Citibank, net of amounts available for offset under the master netting arrangements and any related collateral received or posted by the Funds as of December 31, 2023.
| Investment Securities
on Loan, at value,
Presented on the
Statements of Assets
and Liabilities | Cash Collateral
Posted by Borrower* | Net Amount Due
to Counterparty
(not less than zero) |
| | | |
| | | |
| | | |
| | | |
| | | |
|
| Collateral posted reflects the value of securities on loan and does not include any additional amounts received from the borrower. |
Securities lending also involves counterparty risks, including the risk that the loaned securities may not be returned in a timely manner or at all. Subject to certain conditions, Citibank has agreed to indemnify the Funds from losses resulting from a borrower’s failure to return a loaned security.
JPMIM voluntarily waived investment advisory fees charged to the Funds to reduce the impact of the cash collateral investment in the JPMorgan U.S. Government Money Market Fund from 0.13% to 0.06%. For the six months ended December 31, 2023, JPMIM waived fees associated with the Funds' investment in the JPMorgan U.S. Government Money Market Fund as follows:
The above waiver is included in the determination of earnings on cash collateral investment and in the calculation of Citibank’s compensation and is included on the Statements of Operations as Income from securities lending (net).
D. Investment Transactions with Affiliates — The Funds invested in Underlying Funds advised by the Adviser. An issuer which is under common control with a Fund may be considered an affiliate. For the purposes of the financial statements, the Funds assume the issuers listed in the tables below to be affiliated issuers. The Underlying Funds’ distributions may be reinvested into such Underlying Funds. Reinvestment amounts are included in the purchases at cost amounts in the tables below.
|
For the six months ended December 31, 2023 |
| | | | | Change in
Unrealized
Appreciation/
(Depreciation) | | Shares at
December 31,
2023 | | Capital Gain
Distributions |
JPMorgan Prime Money Market Fund Class IM Shares, 5.51% (a) (b) | | | | | | | | | |
JPMorgan Securities Lending Money Market Fund Agency SL Class Shares, 5.56% (a) (b) | | | | | | | | | |
JPMorgan U.S. Government Money Market Fund Class IM Shares, 5.30% (a) (b) | | | | | | | | | |
| | | | | | | | | |
|
| Investment in an affiliated fund, which is registered under the Investment Company Act of 1940, as amended, and is advised by J.P. Morgan Investment Management Inc. |
| The rate shown is the current yield as of December 31, 2023. |
| Amount rounds to less than one thousand. |
| Amount is included on the Statements of Operations as Income from securities lending (net) (after payments of rebates and Citibank’s fee). |
| J.P. Morgan Mid Cap/Multi-Cap Funds | |
NOTES TO FINANCIAL STATEMENTSAS OF December 31, 2023 (Unaudited) (continued)
(Dollar values in thousands)
|
For the six months ended December 31, 2023 |
| | | | | Change in
Unrealized
Appreciation/
(Depreciation) | | Shares at
December 31,
2023 | | Capital Gain
Distributions |
JPMorgan Prime Money Market Fund Class IM Shares, 5.51% (a) (b) | | | | | | | | | |
JPMorgan Securities Lending Money Market Fund Agency SL Class Shares, 5.56% (a) (b) | | | | | | | | | |
JPMorgan U.S. Government Money Market Fund Class IM Shares, 5.30% (a) (b) | | | | | | | | | |
| | | | | | | | | |
|
| Investment in an affiliated fund, which is registered under the Investment Company Act of 1940, as amended, and is advised by J.P. Morgan Investment Management Inc. |
| The rate shown is the current yield as of December 31, 2023. |
| Amount rounds to less than one thousand. |
| Amount is included on the Statements of Operations as Income from securities lending (net) (after payments of rebates and Citibank’s fee). |
|
For the six months ended December 31, 2023 |
| | | | | Change in
Unrealized
Appreciation/
(Depreciation) | | Shares at
December 31,
2023 | | Capital Gain
Distributions |
JPMorgan Prime Money Market Fund Class IM Shares, 5.51% (a) (b) | | | | | | | | | |
JPMorgan Securities Lending Money Market Fund Agency SL Class Shares, 5.56% (a) (b) | | | | | | | | | |
JPMorgan U.S. Government Money Market Fund Class IM Shares, 5.30% (a) (b) | | | | | | | | | |
| | | | | | | | | |
|
| Investment in an affiliated fund, which is registered under the Investment Company Act of 1940, as amended, and is advised by J.P. Morgan Investment Management Inc. |
| The rate shown is the current yield as of December 31, 2023. |
| Amount is included on the Statements of Operations as Income from securities lending (net) (after payments of rebates and Citibank’s fee). |
|
For the six months ended December 31, 2023 |
| | | | | Change in
Unrealized
Appreciation/
(Depreciation) | | Shares at
December 31,
2023 | | Capital Gain
Distributions |
JPMorgan Prime Money Market Fund Class IM Shares, 5.51% (a) (b) | | | | | | | | | |
| J.P. Morgan Mid Cap/Multi-Cap Funds | |
Mid Cap Value Fund (continued) |
For the six months ended December 31, 2023 |
| | | | | Change in Unrealized Appreciation/ (Depreciation) | | Shares at December 31, 2023 | | Capital Gain Distributions |
JPMorgan Securities Lending Money Market Fund Agency SL Class Shares, 5.56% (a) (b) | | | | | | | | | |
JPMorgan U.S. Government Money Market Fund Class IM Shares, 5.30% (a) (b) | | | | | | | | | |
| | | | | | | | | |
|
| Investment in an affiliated fund, which is registered under the Investment Company Act of 1940, as amended, and is advised by J.P. Morgan Investment Management Inc. |
| The rate shown is the current yield as of December 31, 2023. |
| Amount is included on the Statements of Operations as Income from securities lending (net) (after payments of rebates and Citibank’s fee). |
|
For the six months ended December 31, 2023 |
| | | | | Change in
Unrealized
Appreciation/
(Depreciation) | | Shares at
December 31,
2023 | | Capital Gain
Distributions |
JPMorgan Prime Money Market Fund Class IM Shares, 5.51% (a) (b) | | | | | | | | | |
JPMorgan Securities Lending Money Market Fund Agency SL Class Shares, 5.56% (a) (b) | | | | | | | | | |
JPMorgan U.S. Government Money Market Fund Class IM Shares, 5.30% (a) (b) | | | | | | | | | |
| | | | | | | | | |
|
| Investment in an affiliated fund, which is registered under the Investment Company Act of 1940, as amended, and is advised by J.P. Morgan Investment Management Inc. |
| The rate shown is the current yield as of December 31, 2023. |
| Amount is included on the Statements of Operations as Income from securities lending (net) (after payments of rebates and Citibank’s fee). |
E. Foreign Currency Translation — The books and records of the Funds are maintained in U.S. dollars. Foreign currency amounts are translated into U.S. dollars at the prevailing exchange rates of such currencies against the U.S. dollar. The market value of investment securities and other assets and liabilities are translated at the exchange rate as of the valuation date. Purchases and sales of investment securities, income and expenses are translated at the exchange rate prevailing on the respective dates of such transactions.
The Funds do not isolate the effect of changes in foreign exchange rates from changes in market prices on securities held. Accordingly, such changes are included within Change in net unrealized appreciation/depreciation on investments in non-affiliates on the Statements of Operations.
Reported realized foreign currency gains and losses arise from the disposition of foreign currency, currency gains or losses realized between the trade and settlement dates on securities transactions, and the difference between the amounts of dividends, interest and foreign withholding taxes recorded on each Fund's books on the transaction date and the U.S. dollar equivalent of the amounts actually received or paid. These reported realized foreign currency gains and losses are included in Net realized gain (loss) on foreign currency transactions on the Statements of Operations. Unrealized foreign currency gains and losses arise from changes (due to changes in exchange rates) in the value of foreign currency and other assets and liabilities denominated in foreign currencies, which are held at period end and are included in Change in net unrealized appreciation/depreciation on foreign currency translations on the Statements of Operations.
F. Security Transactions and Investment Income — Investment transactions are accounted for on the trade date (the date the order to buy or sell is executed). Securities gains and losses are calculated on a specifically identified cost basis.
Dividend income is recorded on the ex-dividend date or when a Fund first learns of the dividend.
| J.P. Morgan Mid Cap/Multi-Cap Funds | |
NOTES TO FINANCIAL STATEMENTSAS OF December 31, 2023 (Unaudited) (continued)
(Dollar values in thousands)
To the extent such information is publicly available, the Funds record distributions received in excess of income earned from underlying investments as a reduction of cost of investments and/or realized gain. Such amounts are based on estimates if actual amounts are not available and actual amounts of income, realized gain and return of capital may differ from the estimated amounts. The Funds adjust the estimated amounts of the components of distributions (and consequently their net investment income) as necessary, once the issuers provide information about the actual composition of the distributions.
G. Allocation of Income and Expenses— Expenses directly attributable to a Fund are charged directly to that Fund, while the expenses attributable to more than one fund of the Trusts are allocated among the applicable funds. Investment income, realized and unrealized gains and losses and expenses, other than class-specific expenses, are allocated daily to each class of shares based upon the proportion of net assets of each class at the beginning of each day.
Transfer agency fees are class-specific expenses. The amount of the transfer agency fees charged to each share class of the Funds for the six months ended December 31, 2023 are as follows:
|
| Amount rounds to less than one thousand. |
H. Federal Income Taxes — Each Fund is treated as a separate taxable entity for Federal income tax purposes. Each Fund's policy is to comply with the provisions of the Internal Revenue Code (the “Code”) applicable to regulated investment companies and to distribute to shareholders all of its distributable net investment income and net realized capital gains on investments. Accordingly, no provision for Federal income tax is necessary. Management has reviewed the Funds' tax positions for all open tax years and has determined that as of December 31, 2023, no liability for Federal income tax is required in the Funds' financial statements for net unrecognized tax benefits. However, management’s conclusions may be subject to future review based on changes in, or the interpretation of, the accounting standards or tax laws and regulations. Each Fund's Federal tax returns for the prior three fiscal years remain subject to examination by the Internal Revenue Service.
I. Distributions to Shareholders— Distributions from net investment income, if any, are generally declared and paid at least annually and are declared separately for each class. No class has preferential dividend rights; differences in per share rates are due to differences in separate class expenses. Net realized capital gains, if any, are distributed by each Fund at least annually. The amount of distributions from net investment income and net realized capital gains is determined in accordance with Federal income tax regulations, which may differ from GAAP. To the extent these “book/tax” differences are permanent in nature (i.e., that they result from other than timing of recognition — “temporary differences”), such amounts are reclassified within the capital accounts based on their Federal tax basis treatment.
3. Fees and Other Transactions with Affiliates
A. Investment Advisory Fee — Pursuant to an Investment Advisory Agreement, the Adviser manages the investments of each Fund and for such services is paid a fee. The investment advisory fee is accrued daily and paid monthly at an annual rate based on each Fund's respective average daily net assets. The annual rate for each Fund is as follows:
The Adviser waived investment advisory fees and/or reimbursed expenses as outlined in Note 3.F.
| J.P. Morgan Mid Cap/Multi-Cap Funds | |
B. Administration Fee— Pursuant to an Administration Agreement, the Administrator provides certain administration services to each Fund. In consideration of these services, the Administrator receives a fee accrued daily and paid monthly at an annual rate of 0.075% of the first $10 billion of each Fund's respective average daily net assets, plus 0.050% of each Fund's respective average daily net assets between $10 billion and $20 billion, plus 0.025% of each Fund's respective average daily net assets between $20 billion and $25 billion, plus 0.010% of each Fund's respective average daily net assets in excess of $25 billion. For the six months ended December 31, 2023, the effective annualized rate was 0.070% of each Fund's average daily net assets, notwithstanding any fee waivers and/or expense reimbursements.
The Administrator waived administration fees as outlined in Note 3.F.
JPMorgan Chase Bank, N.A. ("JPMCB"), a wholly-owned subsidiary of JPMorgan, serves as the Funds' sub-administrator (the “Sub-administrator”). For its services as Sub-administrator, JPMCB receives a portion of the fees payable to the Administrator.
C. Distribution Fees — Pursuant to a Distribution Agreement, JPMorgan Distribution Services, Inc. (“JPMDS”), an indirect, wholly-owned subsidiary of JPMorgan, serves as each Fund's principal underwriter and promotes and arranges for the sale of each Fund's shares.
The Boards have adopted a Distribution Plan (the “Distribution Plan”) for Class A, Class C, Class R2 and Class R3 Shares of the Funds, as applicable, pursuant to Rule 12b-1 under the 1940 Act. Class I, Class L, Class R4, Class R5 and Class R6 Shares of the Funds do not charge a distribution fee. The Distribution Plan provides that each Fund shall pay, with respect to the applicable share classes, distribution fees, including payments to JPMDS, at annual rates of the average daily net assets as shown in the table below:
In addition, JPMDS is entitled to receive the front-end sales charges from purchases of Class A Shares and the CDSC from redemptions of Class C Shares and certain Class A Shares for which front-end sales charges have been waived. For the six months ended December 31, 2023, JPMDS retained the following:
|
| Amount rounds to less than one thousand. |
D. Service Fees — The Trusts, on behalf of the Funds, have entered into a Shareholder Servicing Agreement with JPMDS under which JPMDS provides certain support services to fund shareholders. For performing these services, JPMDS receives a fee with respect to all share classes, except Class R6 Shares which do not charge a service fee, that is accrued daily and paid monthly equal to a percentage of the average daily net assets as shown in the table below:
JPMDS has entered into shareholder services contracts with affiliated and unaffiliated financial intermediaries who provide shareholder services and other related services to their clients or customers who invest in the Funds. Pursuant to such contracts, JPMDS will pay all or a portion of such fees earned to financial intermediaries for performing such services.
JPMDS waived service fees as outlined in Note 3.F.
| J.P. Morgan Mid Cap/Multi-Cap Funds | |
NOTES TO FINANCIAL STATEMENTSAS OF December 31, 2023 (Unaudited) (continued)
(Dollar values in thousands)
E. Custodian and Accounting Fees — JPMCB provides portfolio custody and accounting services to the Funds. For performing these services, the Funds pay JPMCB transaction and asset-based fees that vary according to the number of transactions and positions, plus out-of-pocket expenses. The amounts paid directly to JPMCB by the Funds for custody and accounting services are included in Custodian and accounting fees on the Statements of Operations.
Interest income earned on cash balances at the custodian, if any, is included in Interest income from affiliates on the Statements of Operations.
Interest expense paid to the custodian related to cash overdrafts, if any, is included in Interest expense to affiliates on the Statements of Operations.
F. Waivers and Reimbursements —The Adviser, Administrator and/or JPMDS have contractually agreed to waive fees and/or reimburse the Funds to the extent that total annual operating expenses (excluding acquired fund fees and expenses other than certain money market fund fees as described below, dividend and interest expenses related to short sales, interest, taxes, expenses related to litigation and potential litigation, expenses related to trustee elections and extraordinary expenses) exceed the percentages of the Funds' respective average daily net assets as shown in the table below:
The expense limitation agreements were in effect for the six months ended December 31, 2023 and are in place until at least October 31, 2024.
For the six months ended December 31, 2023, the Funds' service providers waived fees and/or reimbursed expenses for each of the Funds as follows. None of these parties expect the Funds to repay any such waived fees and/or reimbursed expenses in future years.
| | |
| | | | | Contractual
Reimbursements |
| | | | | |
| | | | | |
| | | | | |
| | | | | |
| | | | | |
Additionally, the Funds may invest in one or more money market funds advised by the Adviser (affiliated money market funds). The Adviser, Administrator and/or JPMDS, as shareholder servicing agent, have contractually agreed to waive fees and/or reimburse expenses in an amount sufficient to offset the respective net fees each collects from the affiliated money market fund on the applicable Fund's investment in such affiliated money market fund, except for investments of securities lending cash collateral. None of these parties expect the Funds to repay any such waived fees and/or reimbursed expenses in future years.
The amounts of these waivers resulting from investments in these money market funds for the six months ended December 31, 2023 were as follows:
JPMIM voluntarily agreed to reimburse the Funds for the Trustee Fees paid to one of the interested Trustees. For the six months ended December 31, 2023 the amount of these reimbursements were as follows:
| J.P. Morgan Mid Cap/Multi-Cap Funds | |
G. Other— Certain officers of the Trusts are affiliated with the Adviser, the Administrator and JPMDS. Such officers, with the exception of the Chief Compliance Officer, receive no compensation from the Funds for serving in their respective roles.
The Boards designated and appointed a Chief Compliance Officer to the Funds pursuant to Rule 38a-1 under the 1940 Act. Each Fund, along with affiliated funds, makes reimbursement payments, on a pro-rata basis, to the Administrator for a portion of the fees associated with the office of the Chief Compliance Officer. Such fees are included in Trustees’ and Chief Compliance Officer’s fees on the Statements of Operations.
The Trusts adopted a Trustee Deferred Compensation Plan (the “Plan”) which allows the independent Trustees to defer the receipt of all or a portion of compensation related to performance of their duties as Trustees. The deferred fees are invested in various J.P. Morgan Funds until distribution in accordance with the Plan.
The below Funds used related party broker-dealers during the six months ended December 31, 2023, and incurred brokerage commissions with broker-dealers affiliated with the Adviser as follows:
The Securities and Exchange Commission ("SEC") has granted an exemptive order permitting the Funds to engage in principal transactions with J.P. Morgan Securities LLC, an affiliated broker, involving taxable money market instruments, subject to certain conditions.
4. Investment Transactions
During the six months ended December 31, 2023, purchases and sales of investments (excluding short-term investments) were as follows:
| Purchases
(excluding
U.S. Government) | Sales
(excluding
U.S. Government) |
| | |
| | |
| | |
| | |
| | |
During the six months ended December 31, 2023, there were no purchases or sales of U.S. Government securities.
5. Federal Income Tax Matters
For Federal income tax purposes, the estimated cost and unrealized appreciation (depreciation) in value of investments held at December 31, 2023 were as follows:
| | Gross
Unrealized
Appreciation | Gross
Unrealized
Depreciation | Net Unrealized
Appreciation
(Depreciation) |
| | | | |
| | | | |
| | | | |
| | | | |
| | | | |
| J.P. Morgan Mid Cap/Multi-Cap Funds | |
NOTES TO FINANCIAL STATEMENTSAS OF December 31, 2023 (Unaudited) (continued)
(Dollar values in thousands)
At June 30, 2023, the following Funds had net capital loss carryforwards which are available to offset future realized gains:
| Capital Loss Carryforward Character |
| | |
| | |
| | |
Net capital losses (gains) and specified ordinary losses incurred after October 31 and late year ordinary losses incurred after December 31 and within the taxable year are deemed to arise on the first business day of the Funds' next taxable year. For the year ended June 30, 2023, the following Funds deferred to July 1, 2023 the following net capital losses (gains), specified ordinary losses and late year ordinary losses of:
| Net Capital Losses (Gains) | | Late Year Ordinary Loss Deferral |
| | |
| | | | |
| | | | |
| | | | |
| | | | |
6. Borrowings
The Funds rely upon an exemptive order granted by the SEC (the “Order”) permitting the establishment and operation of an Interfund Lending Facility (the “Facility”). The Facility allows the Funds to directly lend and borrow money to or from any other fund relying upon the Order at rates beneficial to both the borrowing and lending funds. Advances under the Facility are taken primarily for temporary or emergency purposes, including the meeting of redemption requests that otherwise might require the untimely disposition of securities, and are subject to each Fund's borrowing restrictions. The interfund loan rate is determined, as specified in the Order, by averaging the current repurchase agreement rate and the current bank loan rate. The Order was granted to JPM II and may be relied upon by the Funds because the Funds and the series of JPM II are all investment companies in the same “group of investment companies” (as defined in Section 12(d)(1)(G) of the 1940 Act).
The Funds had no borrowings outstanding from another fund, or loans outstanding to another fund, during the six months ended December 31, 2023.
The Trusts and JPMCB have entered into a financing arrangement. Under this arrangement, JPMCB provides an unsecured, uncommitted credit facility in the aggregate amount of $100 million to certain of the J.P. Morgan Funds, including the Funds. Advances under the arrangement are taken primarily for temporary or emergency purposes, including the meeting of redemption requests that otherwise might require the untimely disposition of securities, and are subject to each Fund's borrowing restrictions. Interest on borrowings is payable at a rate determined by JPMCB at the time of borrowing. This agreement has been extended until October 29, 2024.
The Funds had no borrowings outstanding from the unsecured, uncommitted credit facility during the six months ended December 31, 2023.
The Trusts, along with certain other trusts for J.P. Morgan Funds (“Borrowers”), have entered into a joint syndicated senior unsecured revolving credit facility totaling $1.5 billion (“Credit Facility”) with various lenders and The Bank of New York Mellon, as administrative agent for the lenders. This Credit Facility provides a source of funds to the Borrowers for temporary and emergency purposes, including the meeting of redemption requests that otherwise might require the untimely disposition of securities. Under the terms of the Credit Facility, a borrowing fund must have a minimum of $25 million in adjusted net asset value and not exceed certain adjusted net asset coverage ratios prior to and during the time in which any borrowings are outstanding. If a fund does not comply with the aforementioned requirements, the fund must remediate within three business days with respect to the $25 million minimum adjusted net asset value or within one business day with respect to certain asset coverage ratios or the administrative agent at the request of, or with the consent of, the lenders may terminate the Credit Facility and declare any outstanding borrowings to be due and payable immediately.
Interest associated with any borrowing under the Credit Facility is charged to the borrowing fund at a rate of interest equal to 1.00% (the "Applicable Margin"), plus the greater on the day of the borrowing, of the federal funds effective rate, or the Adjusted Secured Overnight Financing Rate ("SOFR"). Effective August 8, 2023, the Credit Facility was amended and restated for a term of 364 days, unless extended.
The Funds did not utilize the Credit Facility during the six months ended December 31, 2023.
7. Risks, Concentrations and Indemnifications
In the normal course of business, the Funds enter into contracts that contain a variety of representations which provide general indemnifications. Each Fund's maximum exposure under these arrangements is unknown. The amount of exposure would depend on future claims that may be brought against each Fund. However, based on experience, the Funds expect the risk of loss to be remote.
| J.P. Morgan Mid Cap/Multi-Cap Funds | |
As of December 31, 2023, the Funds had individual shareholders and/or non-affiliated omnibus accounts each owning more than 10% of the respective Fund's outstanding shares as follows:
| Number of
Individual Shareholder
and/or Affiliated
Omnibus Accounts | | Number of
Individual Shareholder
and/or Non-Affiliated
Omnibus Accounts | |
| | | | |
| | | | |
| | | | |
| | | | |
| | | | |
Significant shareholder transactions by these shareholders may impact the Funds' performance and liquidity.
As of December 31, 2023, the Funds owned in the aggregate, shares representing more than 10% of the net assets of the following Underlying Funds:
| JPMorgan
SmartRetirement
Funds |
| |
| |
Because Mid Cap Equity Fund, Mid Cap Value Fund and Value Advantage Fund invest in Real Estate Investment Trusts (“REITs”), the Funds may be subject to certain risks similar to those associated with direct investments in real estate. REITs may be affected by changes in the value of their underlying properties and by defaults by tenants. REITs depend generally on their ability to generate cash flow to make distributions to shareholders, and certain REITs have self-liquidation provisions by which mortgages held may be paid in full and distributions of capital returns may be made at any time.
London Interbank Offered Rate ("LIBOR") was a leading floating rate benchmark used in loans, notes, derivatives and other instruments or investments. As a result of benchmark reforms, publication of most LIBOR settings has ceased. Some LIBOR settings continue to be published but only on a temporary, synthetic and non-representative basis. Regulated entities have generally ceased entering into new LIBOR contracts in connection with regulatory guidance or prohibitions. Public and private sector actors have worked to establish alternative reference rates to be used in place of LIBOR. There is no assurance that any such alternative reference rate will be similar to or produce the same value or economic equivalence as LIBOR or that it will have the same volume or liquidity as did LIBOR which may affect the value, volatility, liquidity or return on certain of the Funds' loans, notes, derivatives and other instruments or investments comprising some or all of the Funds' investments and result in costs incurred in connection with changing reference rates used for positions, closing out positions and entering into new trades. Certain of the Funds' investments may have transitioned from LIBOR or will transition from LIBOR in the future. The transition from LIBOR to alternative reference rates may result in operational issues for the Funds or their investments. No assurances can be given as to the impact of the LIBOR transition (and the timing of any such impact) on the Funds and their investments.
The Funds are subject to infectious disease epidemics/pandemics risk. For example, the outbreak of COVID-19 negatively affected economies, markets and individual companies throughout the world, including those in which the Funds invest. The effects of any future pandemic or other global event to business and market conditions may have a significant negative impact on the performance of a Fund's investments, increase a Fund's volatility, exacerbate other pre-existing political, social and economic risks to the Funds and negatively impact broad segments of businesses and populations. In addition, governments, their regulatory agencies, or self-regulatory organizations have taken or may take actions in response to a pandemic or other global event that affect the instruments in which the Funds invest, or the issuers of such instruments, in ways that could have a significant negative impact on a Fund’s investment performance. The ultimate impact of any pandemic or other global event and the extent to which the associated conditions and governmental responses impact a Fund will also depend on future developments, which are highly uncertain, difficult to accurately predict and subject to frequent changes.
| J.P. Morgan Mid Cap/Multi-Cap Funds | |
SCHEDULE OF SHAREHOLDER EXPENSES(Unaudited)
Hypothetical $1,000 Investment
As a shareholder of the Funds, you incur two types of costs: (1) transaction costs, including sales charges (loads) on purchase payments and (2) ongoing costs, including investment advisory fees, administration fees, distribution fees and other Fund expenses. The examples below are intended to help you understand your ongoing costs (in dollars) of investing in the Funds (not including expenses of the Underlying Funds) and to compare these ongoing costs with the ongoing costs of investing in other mutual funds. The examples assume that you had a $1,000 investment in each Class at the beginning of the reporting period, July 1, 2023, and continued to hold your shares at the end of the reporting period, December 31, 2023.
Actual Expenses
For each Class of each Fund in the table below, the first line provides information about actual account values and actual expenses. You may use the information in this line, together with the amount you invested, to estimate the expenses that you paid over the period. Simply divide your account value by $1,000 (for example, an $8,600 account value divided by $1,000 = 8.6), then multiply the result by the number in the first line of each Class under the heading titled “Expenses Paid During the Period” to estimate the expenses you paid on your account during this period.
Hypothetical Example for Comparison Purposes
The second line of each Class in the table below provides information about hypothetical account values and hypothetical expenses based on the Class’ actual expense ratio and an assumed rate of return of 5% per year before expenses, which is not the Class’ actual return. The hypothetical account values and expenses may not be used to estimate the actual ending account balance or expenses you paid for the period. You may use this information to compare the ongoing costs of investing in the Class of the Funds and other funds. To do so, compare this 5% hypothetical example with the 5% hypothetical examples that appear in the shareholder reports of the other funds. Please note that the expenses shown in the table are meant to highlight your ongoing costs only and do not reflect any transaction costs, such as sales charges (loads) or redemption fees, and expenses of the Underlying Funds. Therefore, the second line for each Class in the table is useful in comparing ongoing costs only, and will not help you determine the relative total costs of owning different funds. In addition, if these transaction costs were included, your costs would have been higher. The examples also assume all dividends and distributions have been reinvested.
| Beginning
Account Value
July 1, 2023 | Ending
Account Value
December 31, 2023 | Expenses
Paid During
the Period* | |
JPMorgan Growth Advantage Fund | | | | |
| | | | |
| | | | |
| | | | |
| | | | |
| | | | |
| | | | |
| | | | |
| | | | |
| | | | |
| | | | |
| | | | |
| | | | |
| | | | |
| | | | |
| | | | |
| | | | |
| | | | |
| | | | |
| | | | |
| | | | |
| | | | |
| | | | |
| | | | |
| | | | |
| J.P. Morgan Mid Cap/Multi-Cap Funds | |
| Beginning Account Value July 1, 2023 | Ending Account Value December 31, 2023 | Expenses Paid During the Period* | |
JPMorgan Mid Cap Equity Fund | | | | |
| | | | |
| | | | |
| | | | |
| | | | |
| | | | |
| | | | |
| | | | |
| | | | |
| | | | |
| | | | |
| | | | |
| | | | |
| | | | |
| | | | |
| | | | |
| | | | |
| | | | |
| | | | |
JPMorgan Mid Cap Growth Fund | | | | |
| | | | |
| | | | |
| | | | |
| | | | |
| | | | |
| | | | |
| | | | |
| | | | |
| | | | |
| | | | |
| | | | |
| | | | |
| | | | |
| | | | |
| | | | |
| | | | |
| | | | |
| | | | |
| | | | |
| | | | |
| | | | |
| | | | |
| | | | |
| | | | |
JPMorgan Mid Cap Value Fund | | | | |
| | | | |
| | | | |
| | | | |
| | | | |
| | | | |
| | | | |
| J.P. Morgan Mid Cap/Multi-Cap Funds | |
SCHEDULE OF SHAREHOLDER EXPENSES(Unaudited) (continued)
Hypothetical $1,000 Investment
| Beginning Account Value July 1, 2023 | Ending Account Value December 31, 2023 | Expenses Paid During the Period* | |
JPMorgan Mid Cap Value Fund (continued) | | | | |
| | | | |
| | | | |
| | | | |
| | | | |
| | | | |
| | | | |
| | | | |
| | | | |
| | | | |
| | | | |
| | | | |
| | | | |
| | | | |
| | | | |
| | | | |
| | | | |
| | | | |
| | | | |
| | | | |
| | | | |
| | | | |
JPMorgan Value Advantage Fund | | | | |
| | | | |
| | | | |
| | | | |
| | | | |
| | | | |
| | | | |
| | | | |
| | | | |
| | | | |
| | | | |
| | | | |
| | | | |
| | | | |
| | | | |
| | | | |
| | | | |
| | | | |
| | | | |
| | | | |
| | | | |
| | | | |
| | | | |
| | | | |
| | | | |
| | | | |
| | | | |
| | | | |
|
| Expenses are equal to each Class’ respective annualized net expense ratio, multiplied by the average account value over the period, multiplied by 184/366 (to reflect the one-half year period). |
| J.P. Morgan Mid Cap/Multi-Cap Funds | |
BOARD APPROVAL OF INVESTMENT ADVISORY AGREEMENTS(Unaudited)
The Board of Trustees (the “Board” or the “Trustees”) has established various standing committees composed of Trustees with diverse backgrounds, to which the Board has assigned specific subject matter responsibilities to further enhance the effectiveness of the Board’s oversight and decision making. The Board and its investment committees (Money Market and Alternative Products Committee, Equity Committee, and Fixed Income Committee) met regularly throughout the year and, at each meeting, considered factors that are relevant to their annual consideration of the continuation of the investment advisory agreements. The Board also met for the specific purpose of considering investment advisory agreement annual renewals. The Board held meetings June 20-21, 2023 and August 8-10, 2023, at which the Trustees considered the continuation of the investment advisory agreements for each Fund whose semi-annual report is contained herein (each an “Advisory Agreement” and collectively, the “Advisory Agreements”). At the June meeting, the Board’s investment committees met to review and consider performance, expense and related information for the J.P. Morgan Funds. Each investment committee reported to the full Board, which then considered each investment committee’s preliminary findings. At the August meeting, the Trustees continued their review and consideration. The Trustees, including a majority of the Trustees who are not parties to an Advisory Agreement or “interested persons” (as defined in the Investment Company Act of 1940) of any party to an Advisory Agreement or any of their affiliates, approved the continuation of each Advisory Agreement on August 10, 2023.
As part of their review of the Advisory Agreements, the Trustees considered and reviewed performance and other information about the Funds received from J.P. Morgan Investment Management Inc. (the “Adviser”). This information included the Funds’ performance as compared to the performance of their peers and benchmarks, and analyses by the Adviser of the Funds’ performance. In addition, at each of their regular meetings throughout the year, the Trustees considered reports on the performance of certain J.P. Morgan Funds provided by an independent investment consulting firm (the “independent consultant”). In addition, in preparation for the June and August meetings, the Trustees requested, received and evaluated extensive materials from the Adviser, including performance and expense information compiled by Broadridge, using data from Lipper Inc. and/or Morningstar Inc., independent providers of investment company data (together, “Broadridge”). The Trustees’ independent consultant also provided additional quantitative and statistical analyses of the Funds, including risk and performance return assessments as compared to the Funds’ objectives, benchmarks, and peers. Before voting on the Advisory Agreements, the Trustees reviewed the Advisory Agreements with representatives of the Adviser, counsel to the Funds, and independent legal counsel to the Trustees, and received a memorandum from independent
legal counsel to the Trustees discussing the legal standards for their consideration of the Advisory Agreements. The Trustees also discussed the Advisory Agreements with independent legal counsel in executive sessions at which no representatives of the Adviser were present.
A summary of the material factors evaluated by the Trustees in determining whether to approve each Advisory Agreement is provided below. Each Trustee attributed different weights to the various factors, and no factor alone was considered determinative. The Trustees considered information provided with respect to the Funds throughout the year, as well as materials furnished specifically in connection with the annual review process. From year to year, the Trustees consider and place emphasis on relevant information in light of changing circumstances in market and economic conditions.
After considering and weighing the factors and information they had received, the Trustees found that the compensation to be received by the Adviser from each Fund under the applicable Advisory Agreement was fair and reasonable under the circumstances, and determined that the continuance of each Advisory Agreement was in the best interests of each Fund and its shareholders.
Nature, Extent and Quality of Services Provided by the Adviser
The Trustees received and considered information regarding the nature, extent and quality of services provided to each Fund under the applicable Advisory Agreement. The Trustees took into account information furnished throughout the year at Trustee meetings, as well as the materials furnished specifically in connection with this annual review process. Among other things, the Trustees considered:
• The background and experience of the Adviser’s senior management and investment personnel, including personnel changes, if any;
• The qualifications, backgrounds and responsibilities of the portfolio management team primarily responsible for the day-to-day management of each Fund, including personnel changes, if any;
• The investment strategy for each Fund, and the infrastructure supporting the portfolio management teams;
• Information about the structure and distribution strategy for each Fund and how it fits within the Adviser’s other fund offerings within the J.P. Morgan Funds complex;
• The administration services provided by the Adviser in its role as Administrator;
| J.P. Morgan Mid Cap/Multi-Cap Funds | |
BOARD APPROVAL OF INVESTMENT ADVISORY AGREEMENTS(Unaudited) (continued)
• Their knowledge of the nature and quality of the services provided by the Adviser and its affiliates gained from their experience as Trustees of the Funds and in the financial industry generally;
• The overall reputation and capabilities of the Adviser and its affiliates;
• The commitment of the Adviser to provide high quality service to the Funds;
• Their overall confidence in the Adviser’s integrity; and
• The Adviser’s responsiveness to requests for additional information, questions or concerns raised by them, including the Adviser’s willingness to consider and implement organizational and operational changes designed to improve investment results and the services provided to each Fund.
Based upon these considerations and other factors, the Trustees concluded that they were satisfied with the nature, extent and quality of the services provided to the Funds by the Adviser.
Costs of Services Provided and Profitability to the Adviser and its Affiliates
The Trustees received and considered information regarding the profitability to the Adviser and its affiliates from providing services to each Fund. The Trustees reviewed and discussed this information. The Trustees recognized that this information is not audited and represents the Adviser’s determination of its and its affiliates’ revenues from the contractual services provided to the Funds, less expenses of providing such services. Expenses include direct and indirect costs and are calculated using an allocation methodology developed by the Adviser and reviewed with the Board. The Trustees also recognized that it is difficult to make comparisons of profitability from fund investment advisory contracts because comparative information is not generally publicly available and is affected by numerous factors, including the structure of the particular adviser, the types of funds it manages, its business mix, numerous assumptions regarding allocations and the fact that publicly-traded fund managers’ operating profits and net income are net of distribution and marketing expenses. Based upon their review, and taking into consideration the factors noted above, the Trustees concluded that the profitability to the Adviser under each Advisory Agreement was not unreasonable in light of the services and benefits provided to each Fund.
The Trustees also considered that JPMorgan Distribution Services, Inc. (“JPMDS”), an affiliate of the Adviser, and the Adviser earn fees from the Funds for providing shareholder and administration services, respectively. These fees were shown separately in the profitability analysis presented to the Trustees. The Trustees also considered the payments of Rule 12b-1 fees to JPMDS, which also acts as the Funds’
distributor, and that these fees are in turn generally paid to financial intermediaries that sell the Funds, including financial intermediaries that are affiliates of the Adviser (although they are retained by JPMDS in certain instances). The Trustees also considered the fees earned by JPMorgan Chase Bank, N.A. (“JPMCB”), an affiliate of the Adviser, for custody, fund accounting and other related services for each Fund, and the profitability of the arrangements to JPMCB.
Fall-Out Benefits
The Trustees reviewed information regarding potential “fall-out” or ancillary benefits received by the Adviser and its affiliates as a result of their relationship with the Funds. The Trustees considered that the J.P. Morgan Funds’ operating accounts are held at JPMCB, which, as a result, will receive float benefits for certain J.P. Morgan Funds, as applicable. The Trustees also noted that the Adviser supports a diverse set of products and services, which benefits the Adviser by allowing it to leverage its infrastructure to serve additional clients, including benefits that may be received by the Adviser and its affiliates in connection with the Funds’ potential investments in other funds advised by the Adviser. The Trustees also reviewed the Adviser’s allocation of fund brokerage for the J.P. Morgan Funds complex, including allocations to brokers who provide research to the Adviser, as well as the Adviser’s use of affiliates to provide other services and the benefits to such affiliates of doing so. The Trustees also considered the benefit to the Adviser and its affiliates from allocating client assets to the Funds.
Economies of Scale
The Trustees considered the extent to which the Funds may benefit from potential economies of scale. The Trustees considered that there may not be a direct relationship between economies of scale realized by the Funds and those realized by the Adviser as assets increase. The Trustees considered the extent to which the Funds were priced to scale and whether it would be appropriate to add advisory fee breakpoints. The Trustees noted certain Funds with contractual expense limitations and fee waivers (“Fee Caps”), which allow a Fund’s shareholders to share potential economies of scale from a Fund’s inception, prior to reaching scale. The Trustees also noted that certain other Funds that had achieved scale as asset levels had increased, no longer had Fee Caps in place for some or all of their share classes, but shared economies of scale through lower average expenses. The Trustees noted that the fees remain fair and reasonable relative to peer funds. The Trustees considered the benefits to the Funds of the use of an affiliated distributor and custodian, including the ability to rely on existing infrastructure supporting distribution, custodial and transfer agent services and the ability to negotiate competitive fees for the Funds. The Trustees further considered the Adviser's and JPMDS's ongoing investments in their business in support of the Funds, including the Adviser's and/or JPMDS's
| J.P. Morgan Mid Cap/Multi-Cap Funds | |
investments in trading systems, technology (including improvements to the J.P. Morgan Funds’ website, and cybersecurity improvements), retention of key talent, and regulatory support enhancements. The Trustees concluded that the current fee structure for each Fund, including any Fee Caps the Adviser has in place that serve to limit the overall net expense ratios of each Fund at competitive levels, was reasonable. The Trustees concluded that, for Funds with Fee Caps in place for some or all of their share classes, the relevant Fund’s shareholders received the benefits of potential economies of scale through the Fee Caps and, for Funds that achieved scale and no longer had Fee Caps in place for some or all of their share classes, the relevant Fund’s shareholders benefited from lower average expenses resulting from increased assets. The Trustees also concluded that all Funds benefited from the Adviser’s reinvestment in its operations to serve the Funds and their shareholders. The Trustees noted that the Adviser’s reinvestment ensures sufficient resources in terms of personnel and infrastructure to support the Funds.
Independent Written Evaluation of the Funds’ Senior Officer
The Trustees noted that, upon their direction, the Senior Officer for the Mid Cap Growth Fund and Mid Cap Value Fund had prepared an independent written evaluation in order to assist the Trustees in determining the reasonableness of the proposed management fees. In determining whether to continue the Advisory Agreements, the Trustees considered the Senior Officer’s report.
Fees Relative to Adviser’s Other Clients
The Trustees received and considered information about the nature and extent of investment advisory services and fee rates offered to other clients of the Adviser, including, to the extent applicable, institutional separate accounts, collective investment trusts, other registered investment companies and/or private funds sub-advised by the Adviser, for investment management styles substantially similar to that of each Fund. The Trustees considered the complexity of investment management for registered investment companies relative to the Adviser’s other clients and noted differences, as applicable, in the fee structure and the regulatory, legal and other risks and responsibilities of providing services to the different clients. The Trustees considered that serving as an adviser to a registered investment company involves greater responsibilities and risks than acting as a sub-adviser and observed that sub-advisory fees may be lower than those charged by the Adviser to each Fund. The Trustees also noted that the adviser, not the applicable registered investment company, typically bears the sub-advisory fee and that many responsibilities related to the advisory function are typically retained by the primary adviser. The Trustees concluded that the fee rates charged to each Fund in comparison to those charged to the Adviser’s other clients were reasonable.
Investment Performance
The Trustees receive and consider information about each Fund’s performance throughout the year. In addition, the Trustees received and considered absolute and/or relative performance information for the Funds in a report prepared by Broadridge. The Trustees considered the total return performance information, which included the ranking of the Funds within a performance universe comprised of funds’ selected share classes with the same Broadridge investment classification and objective (the “Universe”), by total return for the applicable one-, three- and five-year periods. The Trustees reviewed a description of Broadridge’s methodology for selecting mutual funds in each Fund’s Universe, and noted that Universe quintile rankings were not calculated if the number of funds in the Universe did not meet a predetermined minimum. The Broadridge materials provided to the Trustees highlighted information with respect to certain representative classes to assist the Trustees in their review. As part of this review, the Trustees also reviewed each Fund’s performance against its benchmark and considered the performance information provided for the Funds at regular Board meetings by the Adviser and the Trustees’ independent consultant and also considered the special analysis prepared for the Funds by the Trustees’ independent consultant. The Trustees also engaged with the Adviser to consider what steps might be taken to improve performance, as applicable. The Broadridge performance data noted by the Trustees as part of their review and the determinations made by the Trustees with respect to each Fund’s performance for certain representative classes are summarized below:
The Trustees noted that the Growth Advantage Fund’s performance for Class A, Class I and Class R6 shares was in the third, first and first quintiles of the Universe, for the one-, three- and five-year periods ended December 31, 2022, respectively. The Trustees discussed the performance and investment strategy of the Fund with the Adviser and reviewed the performance analysis and evaluation prepared by the independent consultant. Based upon these discussions and various other factors, the Trustees concluded that the Fund’s performance was satisfactory.
The Trustees noted that the Mid Cap Equity Fund’s performance for Class A and Class R6 shares was in the third, first and first quintiles of the Universe for the one-, three- and five-year periods ended December 31, 2022, respectively. The Trustees noted that the performance for Class I shares was in the fourth, second and first quintiles of the Universe for the one-, three- and five-year periods ended December 31, 2022, respectively. The Trustees discussed the performance and investment strategy of the Fund with the Adviser and reviewed the
| J.P. Morgan Mid Cap/Multi-Cap Funds | |
BOARD APPROVAL OF INVESTMENT ADVISORY AGREEMENTS(Unaudited) (continued)
performance analysis and evaluation prepared by the independent consultant. Based upon these discussions and various other factors, the Trustees concluded that the Fund’s performance was satisfactory under the circumstances.
The Trustees noted that the Mid Cap Growth Fund’s performance for Class A and Class I shares was in the second, second and first quintiles of the Universe for the one-, three- and five-year periods ended December 31, 2022, respectively. The Trustees noted that the performance for Class R6 shares was in the second, first and first quintiles of the Universe for the one-, three- and five-year periods ended December 31, 2022, respectively. The Trustees discussed the performance and investment strategy of the Fund with the Adviser and reviewed the performance analysis and evaluation prepared by the independent consultant. Based upon these discussions and various other factors, the Trustees concluded that the Fund’s performance was satisfactory.
The Trustees noted that the Mid Cap Value Fund’s performance for Class A, Class I and Class R6 shares was in the third quintiles of the Universe for each of the one-, three- and five-year periods ended December 31, 2022. The Trustees discussed the performance and investment strategy of the Fund with the Adviser and reviewed the performance analysis and evaluation prepared by the independent consultant. Based upon these discussions and various other factors, the Trustees concluded that the Fund’s performance was satisfactory.
The Trustees noted that the Value Advantage Fund’s performance for Class A, Class I and Class R6 shares was in the second, third and third quintiles of the Universe for the one-, three- and five-year periods ended December 31, 2022, respectively. The Trustees discussed the performance and investment strategy of the Fund with the Adviser and reviewed the performance analysis and evaluation prepared by the independent consultant. Based upon these discussions and various other factors, the Trustees concluded that the Fund’s performance was satisfactory.
Advisory Fees and Expense Ratios
The Trustees considered the contractual advisory fee rate and administration fee rate paid by each Fund to the Adviser and compared the combined rate to the information prepared by Broadridge concerning management fee rates paid by other funds’ selected share classes in the Universe, as well as a subset of funds within the Universe (the “Peer Group”). The Trustees recognized that Broadridge reported each Fund’s management fee rate as the combined contractual advisory fee and administration fee rates. The Trustees also reviewed information about other expenses and the expense ratios for each Fund and noted that Universe and Peer Group quintile rankings were not calculated if the number of funds in the Universe and/or Peer Groups did not meet a predetermined minimum. For each Fund that had a Fee Cap in place, the
Trustees considered the net advisory fee rate and net expense ratio for each share class, as applicable, taking into account any waivers and/or reimbursements. The Trustees also considered any proposed changes to a Fee Cap, and, where deemed appropriate by the Trustees, additional waivers and/or reimbursements. The Trustees recognized that it can be difficult to make comparisons of advisory fees because there are variations in the services that are included in the fees paid by other funds. The Trustees’ determinations as a result of the review of each Fund’s advisory fees and expense ratios for certain representative classes are summarized below:
The Trustees noted that the Growth Advantage Fund’s net advisory fee for Class A shares was in the third and second quintile of the Peer Group and Universe, respectively, and that the actual total expenses for Class A shares were in the fifth and third quintiles of the Peer Group and Universe, respectively. The Trustees noted that the net advisory fee for Class I shares was in the third and second quintile of the Peer Group and Universe, respectively, and that the actual total expenses for Class I shares were in the first and third quintiles of the Peer Group and Universe, respectively. The Trustees noted that the net advisory fee for Class R6 shares was in the second quintile of both the Peer Group and Universe, and that the actual total expenses for Class R6 shares were in the second and first quintiles of the Peer Group and Universe, respectively. After considering the factors identified above, in light of this information, the Trustees concluded that the advisory fee was fair and reasonable in light of the services provided to the Fund.
The Trustees noted that the Mid Cap Equity Fund’s net advisory fee for Class A shares was in the first and second quintiles of the Peer Group and Universe, respectively, and that the actual total expenses for Class A shares were in the second quintiles of both the Peer Group and Universe. The Trustees noted that the net advisory fee for Class I shares was in the first and second quintiles of the Peer Group and Universe, respectively, and that the actual total expenses for Class I shares were in the first and third quintiles of the Peer Group and Universe, respectively. The Trustees noted that the net advisory fee for Class R6 shares was in the first and second quintiles of the Peer Group and Universe, respectively, and that the actual total expenses for Class R6 shares were in the first quintile of both the Peer Group and Universe. After considering the factors identified above, in light of this information, the Trustees concluded that the advisory fee was fair and reasonable in light of the services provided to the Fund.
The Trustees noted that the Mid Cap Growth Fund’s net advisory fee for Class A shares was in the third and second quintiles of the Peer Group and Universe, respectively, and that the actual total expenses for Class A shares were in the fourth and third quintiles of the Peer Group and Universe, respectively. The Trustees noted that the net advisory fee for Class I shares was
| J.P. Morgan Mid Cap/Multi-Cap Funds | |
in the third quintile of both the Peer Group and Universe, and that the actual total expenses for Class I shares were in the first and third quintiles of the Peer Group and Universe, respectively. The Trustees noted that the net advisory fee for Class R6 shares was in the third quintile of both the Peer Group and Universe, and that the actual total expenses for Class R6 shares were in the third and first quintiles of the Peer Group and Universe, respectively. After considering the factors identified above, in light of this information, the Trustees concluded that the advisory fee was fair and reasonable in light of the services provided to the Fund.
The Trustees noted that the Mid Cap Value Fund’s net advisory fee for Class A shares was in the third and second quintiles of the Peer Group and Universe, respectively, and that the actual total expenses for Class A shares were in the fourth and third quintile of the Peer Group and Universe, respectively. The Trustees noted that the net advisory fee for Class I shares was in the third quintile of both the Peer Group and Universe, and that the actual total expenses for Class I shares were in the second and fourth quintiles of the Peer Group and Universe, respectively. The Trustees noted that the net advisory fee for Class R6 shares was in the third quintile of both the Peer Group and Universe, and that the actual total expenses for Class R6
shares were in the third and first quintiles of the Peer Group and Universe, respectively. After considering the factors identified above, in light of this information, the Trustees concluded that the advisory fee was fair and reasonable in light of the services provided to the Fund.
The Trustees noted that the Value Advantage Fund’s net advisory fee Class A shares was in the third and second quintiles of the Peer Group and Universe, respectively, and that the actual total expenses for Class A shares were in the fourth and third quintiles of the Peer Group and Universe, respectively. The Trustees noted that the net advisory fee for Class I shares was in the third quintile of both the Peer Group and Universe, and that the actual total expenses for Class I shares were in the second and fourth quintiles of the Peer Group and Universe, respectively. The Trustees noted that the net advisory fee for Class R6 shares was in the second and third quintiles of the Peer Group and Universe, respectively, and that the actual total expenses for Class R6 shares were in the second and first quintiles of the Peer Group and Universe, respectively. After considering the factors identified above, in light of this information, the Trustees concluded that the advisory fee was fair and reasonable in light of the services provided to the Fund.
| J.P. Morgan Mid Cap/Multi-Cap Funds | |
THIS PAGE IS INTENTIONALLY LEFT BLANK
J.P. Morgan Funds are distributed by JPMorgan Distribution Services, Inc., which is an affiliate of JPMorgan Chase & Co. Affiliates of JPMorgan Chase & Co. receive fees for providing various services to the Funds.
Contact JPMorgan Distribution Services, Inc. at 1-800-480-4111 for a fund prospectus. You can also visit us at www.jpmorganfunds.com. Investors should carefully consider the investment objectives and risk as well as charges and expenses of the mutual fund before investing. The prospectus contains this and other information about the mutual fund. Read the prospectus carefully before investing.
Investors may obtain information about the Securities Investor Protection Corporation (SIPC), including the SIPC brochure, by visiting www.sipc.org or by calling SIPC at 202-371-8300.
Each Fund files a complete schedule of its fund holdings for the first and third quarters of its fiscal year with the SEC as an exhibit to its report on Form N-PORT. The Funds' Form N-PORT reports are available on the SEC’s website at http://www.sec.gov. Each Fund's quarterly holdings can be found by visiting the J.P. Morgan Funds’ website at www.jpmorganfunds.com.
Effective January 24, 2023, the SEC adopted rule and form amendments that will result in changes to the design and delivery of shareholder reports of mutual funds and ETFs, requiring them to transmit concise and visually engaging streamlined annual and semi-annual reports to shareholders that highlight key information. Other information, including financial statements, will no longer appear in a streamlined shareholder report but must be available online, delivered free of charge upon request, and filed on a semi-annual basis on Form N-CSR. The rule and form amendments have a compliance date of July 24, 2024.
A description of each Fund's policies and procedures with respect to the disclosure of each Fund's holdings is available in the prospectuses and Statement of Additional Information.
A copy of proxy policies and procedures is available without charge upon request by calling 1-800-480-4111 and on the Funds' website at www.jpmorganfunds.com. A description of such policies and procedures is on the SEC’s website at www.sec.gov. The Trustees have delegated the authority to vote proxies for securities owned by the Funds to the Adviser. A copy of the Funds' voting record for the most recent 12-month period ended June 30 is available on the SEC’s website at www.sec.gov or at the Funds' website at www.jpmorganfunds.com no later than August 31 of each year. The Funds' proxy voting record will include, among other things, a brief description of the matter voted on for each fund security, and will state how each vote was cast, for example, for or against the proposal.
J.P. Morgan Asset Management is the brand name for the asset management business of JPMorgan Chase & Co. and its affiliates worldwide.
© JPMorgan Chase & Co., 2023. All rights reserved. December 2023.
SAN-MC-1223
ITEM 2. CODE OF ETHICS.
Not applicable to a semi-annual report.
ITEM 3. AUDIT COMMITTEE FINANCIAL EXPERT.
Not applicable to a semi-annual report.
ITEM 4. PRINCIPAL ACCOUNTANT FEES AND SERVICES.
Not applicable to a semi-annual report.
ITEM 5. AUDIT COMMITTEE OF LISTED REGISTRANTS.
Not applicable to a semi-annual report.
ITEM 6. INVESTMENTS.
File Schedule I – Investments in securities of unaffiliated issuers as of the close of the reporting period as set forth in Section 210.12-12 of Regulation S-X, unless the schedule is included as part of the report to shareholders filed under Item 1 of this Form.
Included in Item 1.
ITEM 7. DISCLOSURE OF PROXY VOTING POLICIES AND PROCEDURES FOR CLOSED-END MANAGEMENT INVESTMENT COMPANIES.
Not applicable.
ITEM 8. PORTFOLIO MANAGERS OF CLOSED-END MANAGEMENT INVESTMENT COMPANIES.
Not applicable.
ITEM 9. PURCHASE OF EQUITY SECURITIES BY CLOSED-END MANAGEMENT INVESTMENT COMPANY AND AFFILIATED PURCHASERS.
Not applicable.
ITEM 10. SUBMISSION OF MATTERS TO A VOTE OF SECURITY HOLDERS.
Describe any material changes to the procedures by which shareholders may recommend nominees to the registrant’s board of directors, where those changes were implemented after the registrant last provided disclosure in response to the requirements of Item 7(d)(2)(ii)(G) of Schedule 14A (17 CFR 240.14a-101), or this Item.
No material changes to report.
ITEM 11. CONTROLS AND PROCEDURES.
(a) Disclose the conclusions of the registrant’s principal executive and principal financial officers, or persons performing similar functions, regarding the effectiveness of the registrant’s disclosure controls and procedures (as defined in Rule 30a-3(c) under the Act (17 CFR 270.30a-3(c))) as of a date within 90 days of the filing date of the report that includes the disclosure required by this paragraph, based on the evaluation of these controls and procedures required by Rule 30a-3(b) under the Act (17 CFR 270.30a-3(b)) and Rules 13a-15(b) or 15d-15(b) under the Exchange Act (17 CFR 240.13a-15(b) or 240.15d-15(b)).
The Registrant’s principal executive and principal financial officers have concluded, based on their evaluation of the Registrant’s disclosure controls and procedures as of a date within 90 days of the filing date of this report, that the Registrant’s disclosure controls and procedures are reasonably designed to ensure that information required to be disclosed by the Registrant on Form N-CSR is recorded, processed, summarized and reported within the required time periods and that information required to be disclosed by the Registrant in the reports that it files or submits on Form N-CSR is accumulated and communicated to the Registrant’s management, including its principal executive and principal financial officers, as appropriate to allow timely decisions regarding required disclosure.
(b) Disclose any change in the registrant’s internal control over financial reporting (as defined in Rule 30a-3(d) under the Act (17 CFR 270.30a-3(d)) that occurred during the period covered by this report that has materially affected, or is reasonably likely to materially affect, the registrant’s internal control over financial reporting.
There were no changes in the Registrant’s internal control over financial reporting that occurred during the period covered by this report that have materially affected, or are reasonably likely to materially affect, the Registrant’s internal control over financial reporting.
ITEM 12. DISCLOSURE OF SECURITIES LENDING ACTIVITIES FOR CLOSED-END MANAGEMENT INVESTMENT COMPANIES.
Not applicable.
ITEM 13. EXHIBITS.
| | (a) | File the exhibits listed below as part of this Form. Letter or number the exhibits in the sequence indicated. |
(1) Any code of ethics, or amendment thereto, that is the subject of the disclosure required by Item 2, to the extent that the registrant intends to satisfy the Item 2 requirements through filing of an exhibit.
Not applicable.
(2) A separate certification for each principal executive officer and principal financial officer of the registrant as required by Rule 30a-2(a) under the Act (17 CFR 270.30a-2), exactly as set forth below:
Certifications pursuant to Rule 30a-2(a) under the Investment Company Act of 1940 are attached hereto.
(1) Any written solicitation to purchase securities under Rule 23c-1 under the Act (17 CFR 270.23c-1) sent or given during the period covered by the report by or on behalf of the registrant to 10 or more persons.
Not applicable.
(2) Change in the registrant’s independent public accountant. Provide the information called for by Item 4 of Form 8-K under the Exchange Act (17 CFR 249.308). Unless otherwise specified by Item 4, or related to and necessary for a complete understanding of information not previously disclosed, the information should relate to events occurring during the reporting period.
Not applicable.
| | (b) | A separate or combined certification for each principal executive officer and principal officer of the registrant as required by Rule 30a-2(b) under the Act of 1940. |
Certifications pursuant to Rule 30a-2(b) under the Investment Company Act of 1940 are attached hereto.
SIGNATURES
Pursuant to the requirements of the Securities Exchange Act of 1934 and the Investment Company Act of 1940, the registrant has duly caused this report to be signed on its behalf by the undersigned, thereunto duly authorized.
| | |
| J.P. Morgan Fleming Mutual Fund Group, Inc. |
| |
| By: | | /s/ Brian S. Shlissel |
| | Brian S. Shlissel |
| | President and Principal Executive Officer |
| | March 4, 2024 |
Pursuant to the requirements of the Securities Exchange Act of 1934 and the Investment Company Act of 1940, this report has been signed below by the following persons on behalf of the registrant and in the capacities and on the dates indicated.
| | |
| By: | | /s/ Brian S. Shlissel |
| | Brian S. Shlissel |
| | President and Principal Executive Officer |
| | March 4, 2024 |
| |
| By: | | /s/ Timothy J. Clemens |
| | Timothy J. Clemens |
| | Treasurer and Principal Financial Officer |
| | March 4, 2024 |