UNITED STATES
SECURITIES AND EXCHANGE COMMISSION
Washington, D.C. 20549
FORM N-CSR
CERTIFIED SHAREHOLDER REPORT OF REGISTERED MANAGEMENT INVESTMENT COMPANIES
Investment Company Act file number 811-08191
Name of Fund: Bullfinch Fund, Inc.
| Fund Address: | 3909 Rush Mendon Road |
| | Mendon, New York 14506 |
Name and address of agent for service: Christopher Carosa, President,
Bullfinch Fund, Inc., 3909 Rush Mendon Road,
Mendon, New York 14506
Mailing address: 3909 Rush Mendon Road
Mendon, New York 14506
Registrant’s telephone number, including area code: (585) 624-3150
Date of fiscal year end: 10/31/16
Date of reporting period: 11/01/16 - 04/30/17
Item 1 - Attach shareholder report
BULLFINCH FUND, INC.
3909 Rush Mendon Road
Mendon, New York 14506
(585) 624-3150
1-888-BULLFINCH
(1-888-285-5346)

3909 Rush Mendon Road
Mendon, New York 14506
(585) 624-3150
1-888-BULLFINCH
(1-888-285-5346)
Unrestricted Series
Greater Western New York Series
Semi-Annual Report
April 30, 2017
(Unaudited)
Management’s Discussion of Fund Performance
June 26, 2017
Dear Fellow Shareholders:
We are very proud to present the April 2017 Semi-Annual Report of Bullfinch Fund, Inc. This report contains the unaudited financial statements for both the Unrestricted Series and the Greater Western New York Series.
The close of our last fiscal year (October 31, 2016) coincided closely with the presidential election, and the market has become more bifurcated. Growth stocks have accelerated while value stocks have tailed back. At the same time, small cap stocks have lagged large cap stocks. While this is reflected in what you’re seeing in the indices, what’s really telling is the breakdown of the Lipper averages. In the first quarter of this year, the large cap growth sector outperformed small cap value by roughly 8%, with the latter barely ending the quarter in positive territory.
Ironically, this “split-personality” market has created buying opportunities for the first time in some time, even while the market index reaches new highs. Economic confidence, though mixed, appears to be growing, despite the sluggishness in Washington regarding the promotion of the new administration’s economic and tax agenda (the reason many cite for this increased confidence).
In terms of individual stock performance, the Unrestricted Series was led by RetailMeNot, Fred’s, Universal Corp, and Bristol-Myers-Squibb, all up by more than 30%. In all, for the period, nearly two-thirds of the stocks in our portfolio exceeded double-digit performance and only five of them suffered negative returns. Underperforming companies included Mattel, Zumiez, and Xperi Corp.
In the Greater Western New York Series, Integer Holdings Corp, Southwest Airlines, Computer Task Group, Columbus McKinnon, and Ultralife, led the pack with returns in excess of 30% each. In addition, 19 other stocks were up more than double digits. Unfortunately, eight stocks had negative returns, including three that were down more than 20% (Frontier Communications, Manning & Napier, and Mattel). In all, the Greater Western New York Series has experienced a total return that you might expect from a fund with many small cap stocks in it.
We wish to thank our shareholders for expressing their confidence in us and wish you continued good fortune.
Best Regards,
Bullfinch Fund, Inc.
Christopher Carosa, CTFA
President
BULLFINCH FUND INC.
PERFORMANCE SUMMARY
The graph below represents the changes in value for an initial $10,000 investment in the BULLFINCH Fund from 7/1/06 to 4/30/17. These changes are then compared to a $10,000 investment in the Value Line Geometric Index. The Value LINE Geometric Index (VLG) is an unmanaged index of between 1,600 and 1,700 stocks. Value Line states “The VLG was intended to provide a rough approximation of how the median stock in the Value Line Universe performed. The VLG also has appeal to institutional investors as a proxy for the so-called ‘multi-cap’ market because it includes large cap, mid cap and small cap stocks alike.” The Fund feels it is an appropriate benchmark because the Fund’s portfolios are multi-cap portfolios. The Fund’s returns include the reinvestment of all dividends, but do not reflect the deduction of taxes that a shareholder would pay on fund distributions or the redemptions of fund shares. Past performance is not predictive of future performance. Investment return and principal value will fluctuate, so that your shares, when redeemed, may be worth more or less than the original cost.
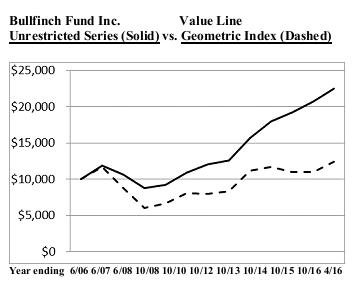
Annualized Returns Ending 4/30/2017 | | Bullfinch Fund Inc. Unrestricted Series | | | Value Line Geometric Index | |
| | | | | | | |
| One – Year | | | +11.83 | % | | | +13.81 | % |
| Five – Year | | | +11.39 | % | | | +7.57 | % |
| Ten – Year | | | +6.80 | % | | | +1.06 | % |
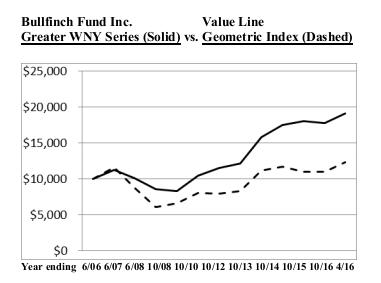
| Annualized Returns Ending | | Bullfinch Fund Inc. | | Value Line |
| 4/30/2017 | | Greater WNY Series | | Geometric Index |
| | | | | | | | | |
| One – Year | | | +3.78 | % | | | -13.81 | % |
| Five – Year | | | +9.43 | % | | | +7.57 | % |
| Ten – Year | | | +6.21 | % | | | +1.06 | % |
UNRESTRICTED SERIES
(A Series Within Bullfinch Fund, Inc.)
FINANCIAL STATEMENTS AS OF
April 30, 2017
(UNAUDITED)
The accompanying notes are an integral part of these statements
UNRESTRICTED SERIES
(A SERIES WITHIN BULLFINCH FUND, INC.)
STATEMENT OF ASSETS AND LIABILITIES
APRIL 30, 2017 (UNAUDITED)
| ASSETS | | | | |
| | | | | |
| Investments in Securities, at Fair Value, Identified Cost of $4,820,786 | | $ | 7,642,064 | |
| | | | | |
| Cash and Cash Equivalents | | | 1,692,053 | |
| | | | | |
| Accrued Interest and Dividends | | | 10,012 | |
| | | | | |
| Prepaid Expenses | | | 4,781 | |
| | | | | |
| Total Assets | | $ | 9,348,910 | |
| | | | | |
| LIABILITIES AND NET ASSETS | | | | |
| | | | | |
| LIABILITIES | | | | |
| | | | | |
| Accrued Expenses | | $ | 5,869 | |
| | | | | |
| Due to Investment Adviser | | | 7,725 | |
| | | | | |
| NET ASSETS | | | | |
| | | | | |
| Net Assets (Equivalent to $ 20.35 per share based on 458,662.454 shares of stock outstanding) | | | 9,335,316 | |
| | | | | |
| Total Liabilities and Net Assets | | $ | 9,348,910 | |
| | | | | |
| COMPOSITION OF NET ASSETS | | | | |
| | | | | |
| Shares of Common Stock - Par Value $.01; 458,662.454 Shares Outstanding | | $ | 6,725,656 | |
| | | | | |
| Accumulated Net Investment Loss & Realized Loss from Securities Transactions | | | (211,618 | ) |
| | | | | |
| Net Unrealized Appreciation on Investments | | | 2,821,278 | |
| | | | | |
| Net Assets at April 30, 2017 | | $ | 9,335,316 | |
The accompanying notes are an integral part of these statements
UNRESTRICTED SERIES(A SERIES WITHIN BULLFINCH FUND, INC.)
SCHEDULE OF INVESTMENTS IN SECURITIES
APRIL 30, 2017 (UNAUDITED)
| | | Historical |
| | | Shares | | Cost | | Value |
| | | | | | | | | | | | | |
| Level 1 – Common Stocks – 81.87% |
| | | | | | | | | | | | | |
| * ASTERISK DENOTES A NON INCOME PRODUCING SECURITY |
| | | | | | | | | | | | | |
| Computers – Software – 16.27% | | | | | | | | | | | | |
| Adobe Systems Inc.* | | | 3,250 | | | | 84,678 | | | | 434,655 | |
| Microsoft Corp. | | | 6,200 | | | | 151,626 | | | | 424,452 | |
| Oracle Corp. | | | 5,500 | | | | 56,122 | | | | 247,280 | |
| Synopsis, Inc. * | | | 5,600 | | | | 115,460 | | | | 412,720 | |
| | | | | | | 407,886 | | | | 1,519,107 | |
| | | | | | | | | | | | | |
| Medical Products and Supplies - 9.94% | | | | | | | | | | | | |
| Bristol-Myers Squibb | | | 5,450 | | | | 266,295 | | | | 305,472 | |
| Edwards Lifesciences* | | | 2,750 | | | | 108,269 | | | | 301,593 | |
| Johnson & Johnson | | | 2,400 | | | | 136,714 | | | | 296,328 | |
| Medtronic Inc. | | | 300 | | | | 22,701 | | | | 24,927 | |
| | | | | | | | 533,979 | | | | 928,320 | |
| | | | | | | | | | | | | |
| Retail - General - 6.66% | | | | | | | | | | | | |
| Fred’s Inc. Class A | | | 18,200 | | | | 182,669 | | | | 267,904 | |
| RetailMeNot Inc.* | | | 30,500 | | | | 276,559 | | | | 353,800 | |
| | | | | | | 459,228 | | | | 621,704 | |
| | | | | | | | | | | | | |
| Semiconductors - 4.64% | | | | | | | | | | | | |
| Intel Corporation | | | 5,000 | | | | 85,564 | | | | 180,750 | |
| Xperi Corporation | | | 7,500 | | | | 165,852 | | | | 252,000 | |
| | | | | | | | 251,416 | | | | 432,750 | |
| | | | | | | | | | | | | |
| Retail – Specialty – 4.01% | | | | | | | | | | | | |
| Fastenal Co. | | | 4,800 | | | | 83,684 | | | | 214,464 | |
| Zumiez Inc.* | | | 8,900 | | | | 193,235 | | | | 159,755 | |
| | | | | | | | 276,919 | | | | 374,219 | |
| | | | | | | | | | | | | |
| Computers - Networking - 3.91% | | | | | | | | | | | | |
| Cisco Systems, Inc. | | | 10,700 | | | | 160,238 | | | | 364,549 | |
| | | | | | | | | | | | | |
| Telecommunications – 3.69% | | | | | | | | | | | | |
| AT&T Corporation | | | 4,400 | | | | 158,437 | | | | 174,372 | |
| Verizon Communications | | | 3,700 | | | | 180,520 | | | | 169,867 | |
| | | | | | | | 338,957 | | | | 344,239 | |
| | | | | | | | | | | | | |
| Electrical Equipment – 3.53% | | | | | | | | | | | | |
| Corning Inc. | | | 7,300 | | | | 66,773 | | | | 210,605 | |
| General Electric Co. | | | 4,100 | | | | 77,607 | | | | 118,859 | |
| | | | | | | | 144,380 | | | | 329,464 | |
| | | Historical |
| | | Shares | | Cost | | Value |
| | | | | | | |
| Level 1 – Common Stocks – 81.87% |
| | | | | | | | | | | | | |
| Insurance - 3.41% | | | | | | | | | | | | |
| Gallagher Arthur J & Co. | | | 5,700 | | | | 138,298 | | | | 318,117 | |
| | | | | | | | | | | | | |
| Building & Related – 3.12% | | | | | | | | | | | | |
| Toll Brothers Inc. | | | 8,100 | | | | 274,638 | | | | 291,519 | |
| | | | | | | | | | | | | |
| Commercial Services – 3.02% | | | | | | | | | | | | |
| Paychex, Inc. | | | 4,750 | | | | 130,495 | | | | 281,580 | |
| | | | | | | | | | | | | |
| Leisure & Recreational – 2.94% | | | | | | | | | | | | |
| Mattel Inc. | | | 12,250 | | | | 287,490 | | | | 274,645 | |
| | | | | | | | | | | | | |
| Consumer – Electronics – 2.72% | | | | | | | | | | | | |
| Canon Inc. | | | 7,650 | | | | 260,879 | | | | 254,057 | |
| | | | | | | | | | | | | |
| Pharmaceuticals – 2.52% | | | | | | | | | | | | |
| Mylan Inc.* | | | 6,300 | | | | 363,525 | | | | 235,305 | |
| | | | | | | | | | | | | |
| Tobacco Products – 2.52% | | | | | | | | | | | | |
| Universal Corp. VA | | | 3,200 | | | | 120,756 | | | | 235,040 | |
| | | | | | | | | | | | | |
| Oil & Related – 2.41% | | | | | | | | | | | | |
| Total SA ADR | | | 4,400 | | | | 227,558 | | | | 225,148 | |
| | | | | | | | | | | | | |
| Biotech – 2.19% | | | | | | | | | | | | |
| Meridian Bioscience, Inc. | | | 13,800 | | | | 249,015 | | | | 204,240 | |
| | | | | | | | | | | | | |
| Aerospace – 1.70% | | | | | | | | | | | | |
| AAR Corporation | | | 4,400 83, | | | | 191 158, | | | | 356 | |
| | | | | | | | | | | | | |
| Electronics Components – 1.53% | | | | | | | | | | | | |
| TE Connectivity Ltd. | | | 1,850 | | | | 50,371 | | | | 143,134 | |
| | | | | | | | | | | | | |
| Industrial Services – 1.14% | | | | | | | | | | | | |
| Expeditors Int’l Washington | | | 1,900 | | | | 61,567 | | | | 106,571 | |
| | | | | | | | | | | | | |
| Total Investments in Securities | | | | | | | 4,820,786 | | | | 7,642,064 | |
| | | | | | | | | | | | | |
| Level 1 – Cash & Equivalents - 18.13% | | | | | | | | | | | | |
| | | | | | | | | | | | | |
| Schwab Gov’t Money Fund - 18.13% | | | | | | | 1,692,053 | | | | 1,692,053 | |
| Sweep Shares 7 Day Yield .16% | | | | | | | | | | | | |
| | | | | | | | | | | | | |
| Total Invested Assets | | | | | | $ | 6,512,839 | | | $ | 9,334,117 | |
The accompanying notes are an integral part of these statements
UNRESTRICTED SERIES
(A SERIES WITHIN BULLFINCH FUND, INC.)
SCHEDULE OF INVESTMENTS IN SECURITIES
APRIL 30, 2017 (UNAUDITED)
Table of Industries
| Industry | | Market Value | | Percent |
| | | | | |
| Aerospace | | $ | 158,356 | | | | 1.70 | % |
| Biotech | | $ | 204,240 | | | | 2.19 | % |
| Building & Related $ 291,519 3.12% | | | | | | | | |
| Commercial Services | | $ | 281,580 | | | | 3.02 | % |
| Computers – Networking | | $ | 364,549 | | | | 3.91 | % |
| Computers – Software | | $ | 1,519,107 | | | | 16.27 | % |
| Consumer –Electronics $ 254,057 2.72% | | | | | | | | |
| Electrical Equipment | | $ | 329,464 | | | | 3.53 | % |
| Electronics Components | | $ | 143,134 | | | | 1.53 | % |
| Industrial Services | | $ | 106,571 | | | | 1.14 | % |
| Insurance | | $ | 318,117 | | | | 3.41 | % |
| Leisure & Recreational $ 274,645 2.94% | | | | | | | | |
| Medical Products & Supplies | | $ | 928,320 | | | | 9.94 | % |
| Oil & Related $ 225,148 2.41% | | | | | | | | |
| Pharmaceuticals | | $ | 235,305 | | | | 2.52 | % |
| Retail – General | | $ | 621,704 | | | | 6.66 | % |
| Retail – Specialty | | $ | 374,219 | | | | 4.01 | % |
| Semiconductors | | $ | 432,750 | | | | 4.64 | % |
| Telecommunications $ 344,239 3.69% | | | | | | | | |
| Tobacco Products | | $ | 235,040 | | | | 2.52 | % |
| Total Equities | | $ | 7,642,064 | | | | 81.87 | % |
| | | | | | | | | |
| Cash & Equivalents (7 day yield .16%) | | $ | 1,692,053 | | | | 18.13 | % |
| | | | | | | | | |
| Total Invested Assets | | $ | 9,334,117 | | | | 100.00 | % |
The accompanying notes are an integral part of these statements
UNRESTRICTED SERIES (A SERIES WITHIN BULLFINCH FUND, INC.)
STATEMENTS OF OPERATIONS
FOR THE 6 MONTHS ENDED APRIL 30, 2017 (UNAUDITED)
| INVESTMENT INCOME: | | |
| Dividends & Interest Income | | $ | 60,350 | |
| | | | | |
| FEES AND EXPENSES: | | | | |
| Investment Adviser Fees | | | 45,742 | |
| Legal and Professional | | | 5,869 | |
| Director’s Fees | | | 1,050 | |
| D&O/E&O | | | 4,211 | |
| Fidelity Bond | | | 939 | |
| State IncomeTaxes | | | 155 | |
| Foreign Taxes | | | 2,183 | |
| Telephone | | | 0 | |
| Registration Fees | | | 2,710 | |
| Custodian Fees | | | 4,542 | |
| Travel | | | 0 | |
| Dues and Subscriptions | | | 1,770 | |
| Total Fees and Expenses | | | 69,171 | |
| Net investment loss | | | (8,821 | ) |
| | | | | |
| REALIZED AND UNREALIZED GAIN ON INVESTMENTS: | | | | |
| Realized gain from securities transactions | | | 217,228 | |
| Unrealized appreciation during the period | | | 535,704 | |
| Net gain on investments | | | 752,932 | |
| CHANGE IN NET ASSETS FROM OPERATIONS | | $ | 744,111 | |
UNRESTRICTED SERIES (A SERIES WITHIN BULLFINCH FUND, INC.)
STATEMENTS OF CHANGES IN NET ASSETS
| | | Six Months Ended | | Year Ended |
| | | April 30, 2017* | | October 31, 2016 |
| | | | | |
| CHANGE IN NET ASSETS FROM OPERATIONS: | | | | | | | | |
| Net investment income (loss) | | $ | (8,821 | ) | | $ | 13,894 | |
| Net realized gain from securities transactions | | | 217,228 | | | | 625,476 | |
| Net change in unrealized appreciation (depreciation) of investments | | | 535,704 | | | | (33,427 | ) |
| Change in net assets from operations | | | 744,111 | | | | 605,943 | |
| DISTRIBUTIONS TO SHAREHOLDERS: | | | | | | | | |
| Distribution of ordinary income | | | (13,862 | ) | | | (14,067 | ) |
| Distribution of capital gains | | | (676,498 | ) | | | (707,089 | ) |
| Reinvested dividend distributions | | | 690,360 | | | | 721,156 | |
| CAPITAL SHARE TRANSACTIONS: | | | | | | | | |
| Sales | | | 86,965 | | | | 670,510 | |
| Redemptions | | | (73,897 | ) | | | (331,114 | ) |
| Net Capital Share Transactions | | | 13,068 | | | | 339,396 | |
| TOTAL INCREASE IN NET ASSETS | | | 757,179 | | | | 945,339 | |
| | | | | | | | | |
| NET ASSETS: | | | | | | | | |
| Beginning of period | | | 8,578,137 | | | | 7,632,798 | |
| End of period | | $ | 9,335,316 | | | $ | 8,578,137 | |
*Unaudited
The accompanying notes are an integral part of these statements
UNRESTRICTED SERIES (A SERIES WITHIN BULLFINCH FUND, INC.)
FINANCIAL HIGHLIGHTS
(PER SHARE DATA FOR A SHARE OUTSTANDING)
| | | Six Months Ended | | Year Ended | | Year Ended | | Year Ended | | Year Ended | | Year Ended |
| | | April 30, 2017* | | October 31, 2016 | | October 31, 2015 | | October 31, 2014 | | October 31, 2013 | | October 31, 2012 |
| | | | | | | | | | | | | |
| NET ASSET VALUE, beginning of period | | $ | 20.29 | | | $ | 20.75 | | | $ | 20.42 | | | $ | 18.46 | | | $ | 15.35 | | | $ | 14.62 | |
| | | | | | | | | | | | | | | | | | | | | | | | | |
| INCOME FROM INVESTMENT OPERATIONS | | | | | | | | | | | | | | | | | | | | | | | | |
| Net investment income (loss) | | | (0.02 | ) | | | 0.03 | | | | 0.04 | | | | (0.01 | ) | | | 0.05 | | | | (0.02 | ) |
| Net gain on securities both realized and unrealized | | | 1.71 | | | | 1.47 | | | | 1.34 | | | | 2.74 | | | | 3.57 | | | | 0.76 | |
| Total from investment operations | | | 1.69 | | | | 1.50 | | | | 1.38 | | | | 2.73 | | | | 3.62 | | | | 0.74 | |
| | | | | | | | | | | | | | | | | | | | | | | | | |
| DISTRIBUTIONS TO SHAREHOLDERS FROM: | | | | | | | | | | | | | | | | | | | | | | | | |
| Distribution of ordinary income | | | (0.03 | ) | | | (0.04 | ) | | | 0.00 | | | | (0.05 | ) | | | (0.06 | ) | | | (0.01 | ) |
| Distribution of capital gains | | | (1.60 | ) | | | (1.92 | ) | | | (1.05 | ) | | | (0.72 | ) | | | (0.45 | ) | | | 0.00 | |
| Total Stock Dividend Distributions | | | (1.63 | ) | | | (1.96 | ) | | | (1.05 | ) | | | (0.77 | ) | | | (0.51 | ) | | | (0.01 | ) |
| | | | | | | | | | | | | | | | | | | | | | | | | |
| NET ASSET VALUE, end of period | | $ | 20.35 | | | $ | 20.29 | | | $ | 20.75 | | | $ | 20.42 | | | $ | 18.46 | | | $ | 15.35 | |
| | | | | | | | | | | | | | | | | | | | | | | | | |
| NET ASSETS, end of period | | $ | 9,335,316 | | | $ | 8,578,137 | | | $ | 7,632,798 | | | $ | 7,127,458 | | | $ | 6,287,193 | | | $ | 4,921,128 | |
*Unaudited
UNRESTRICTED SERIES (A SERIES WITHIN BULLFINCH FUND, INC.)
FINANCIAL HIGHLIGHTS
(RATIOS AND SUPPLEMENTAL DATA)
| | | Six Months Ended | | Year Ended | | Year Ended | | Year Ended | | Year Ended | | Year Ended |
| | | April 30, 2017* | | October 31, 2016 | | October 31, 2015 | | October 31, 2014 | | October 31, 2013 | | October 31, 2012 |
| | | | | | | | | | | | | |
| RATIO OF EXPENSES TO AVERAGE | | | | | | | | | | | | | | | | | | | | | | | | |
| NET ASSETS** | | | 0.77 | %*** | | | 1.50 | % | | | 1.48 | % | | | 1.51 | % | | | 1.63 | % | | | 1.73 | % |
| | | | | | | | | | | | | | | | | | | | | | | | | |
| RATIO OF NET INVESTMENT INCOME TO | | | | | | | | | | | | | | | | | | | | | | | | |
| AVERAGE NET ASSETS** | | | (0.10 | )%*** | | | 0.17 | % | | | 0.19 | % | | | (0.05 | )% | | | 0.29 | % | | | (0.14 | )% |
| | | | | | | | | | | | | | | | | | | | | | | | | |
| PORTFOLIO TURNOVER RATE** | | | 3.03 | %*** | | | 1.95 | % | | | 10.55 | % | | | 11.74 | % | | | 6.54 | % | | | 7.23 | % |
| | | | | | | | | | | | | | | | | | | | | | | | | |
| TOTAL RETURN | | | 11.83 | % | | | 7.62 | % | | | 6.83 | % | | | 15.02 | % | | | 24.20 | % | | | 5.06 | % |
*Unaudited
**Per share amounts calculated using the average shares method
*** The ratios presented were calculated using operating data for the six-month period from November 1, 2016 to April 30, 2017.
The accompanying notes are an integral part of these statements
UNRESTRICTED SERIES
(A SERIES WITHIN BULLFINCH FUND, INC.)
NOTES TO FINANCIAL STATEMENTS
APRIL 30, 2017 (UNAUDITED)
NOTE A - SCOPE OF BUSINESS
The Unrestricted Series (the “Series”) is a series within the Bullfinch Fund, Inc. (the “Fund”), which was organized as a Maryland corporation registered under the Investment Company Act of 1940 as an open-ended non-diversified management investment company. The Fund offers two series of common stock. In addition to the Unrestricted Series, the Fund also offers the Greater Western New York Series.
The investment objective of the Series is to seek conservative long-term growth in capital. The Adviser seeks to achieve this objective by using an asset mix consisting primarily of exchange listed securities and over-the-counter common stocks as well as U.S. Government securities maturing within five years.
NOTE B - SUMMARY OF SIGNIFICANT ACCOUNTING POLICIES
The following is a summary of significant accounting policies followed by the Series in the preparation of its financial statements. These policies are in conformity with accounting principles generally accepted in the United States (“GAAP”). The Series follows the investment company accounting and reporting guidance of the Financial Accounting Standard Board Accounting Standard Codification 946, Financial Services – Investment Companies.
Fair Value Measurements – ASC 820-10 establishes a fair value hierarchy which requires an entity to maximize the use of observable inputs and minimize the use of unobservable inputs when measuring fair value. The standard describes three levels of inputs that may be used to measure fair value:
Level 1: Quoted prices (unadjusted) for identical assets or liabilities in active markets that the entity has the ability to access as of the measurement date.
Level 2: Significant other observable inputs other than Level 1 prices such as quoted prices for similar assets or liabilities; quoted prices in markets that are not active; or other inputs that are observable or can be corroborated by observable market data.
Level 3: Significant unobservable inputs that reflect a reporting entity’s own assumptions about the assumptions that market participants would use in pricing an asset or liability.
The following is a description of the valuation methodologies used for assets measured at fair value:
Cash & Equivalents- Cash consists of amounts deposited in money market accounts or treasury bills and is not federally insured. The Series has not experienced any losses on such amounts and believes it is not exposed to any significant credit risk on cash.
Security Valuation - The Series records its investments at fair value and is in compliance with FASB ASC 820-10-50. Securities traded on national securities exchanges or the NASDAQ National Market System are valued daily at the closing prices of the securities on those exchanges and securities traded on over-the-counter markets are valued daily at the closing bid prices. Short-term and money market securities are valued at amortized cost, which approximates market value.
The accompanying notes are an integral part of these statements
ASSETS AT FAIR VALUE AS OF:
| | | 4/30/17
LEVEL 1 | |
| COMMON STOCKS | | $ | 7,642,064 | |
| CASH & EQUIVALENTS | | $ | 1,692,053 | |
| TOTAL INVESTED ASSETS | | $ | 9,334,117 | |
In cases where market prices are unreliable or not readily available, for example, when trading on securities are halted as permitted by the SEC or when there is no trading volume on an Over-the-Counter security held by the Fund, the Fund relies on fair value pricing provided by the Adviser. In performing its fair value pricing, the Adviser acts under the ultimate supervision of, and follows, the policies of the Board of Directors. The Board of Directors retains the right to determine its own fair value price should it have reason to believe the price provided by the Adviser does not reflect fair value. Valuing securities at fair value involves greater reliance on judgment than securities that have readily available market quotations. There can be no assurance the Fund could obtain the fair value assigned to a security if they were to sell the security at approximately the time at which the Fund determines their net asset value per share.
Series Allocations - Common expenses of the Fund are evenly split between the two series of the Fund unless the Board of Directors approves an alternative allocation of expenses based on management’s estimate.
Income Taxes - It is the policy of the Fund to comply with the requirements of Subchapter M of the Internal Revenue Code (the “Code”) applicable to regulated investment companies and to distribute all of its taxable income to its shareholders. In addition, the Fund intends to distribute an amount sufficient to avoid imposition of any excise tax under Section 4982 of the Code. Therefore, no provision for federal income taxes or excise taxes has been made.
Management has reviewed all open tax years and major tax jurisdictions and concluded that no liability for unrecognized tax benefits should be recorded related to uncertain tax positions taken on returns filed or expected to be taken on a tax return. The tax returns of the Series for the prior three years are open for examination.
Distributions to Shareholders - Distributions to shareholders are recorded on the ex-dividend date. The Series made a distribution of its ordinary income of $14,067 to its shareholders on December 29, 2015, in the form of stock dividends equal to 722.839 shares of stock. The Series made a distribution of its capital gains of $707,089 to its shareholders on December 29, 2015, in the form of stock dividends equal to 36,335.515 shares of stock. The Series made a distribution of its ordinary income of $13,862 to its shareholders on December 29, 2016, in the form of stock dividends equal to 707.261 shares of stock. The Series made a distribution of its capital gains of $676,498 to its shareholders on December 29, 2016, in the form of stock dividends equal to 34,515.213 shares of stock.
Other - The Series follows industry practice and records security transactions on the trade date. The specific identification method is used for determining gains and losses for financial statement and income tax purposes. Dividend income is recorded on the ex-dividend date.
The accompanying notes are an integral part of these statements
Use of Estimates - The preparation of financial statements in conformity with generally accepted accounting principles requires management to make estimates and assumptions that affect the amounts reported in the financial statements and accompanying notes. Actual results can differ from those estimates.
Subsequent Events - In accordance with GAAP, the Fund has evaluated the need for disclosures and/or adjustments resulting from subsequent events through the date of issuance of these financial statements.
NOTE C – INVESTMENTS
For the six months ended April 30, 2017, the Series purchased $1,010,062 of common stock. During the same period, the Series sold $272,022 of common stock.
At April 30, 2017, the gross unrealized appreciation for all securities totaled $3,079,488 and the gross unrealized depreciation for all securities totaled $258,210 or a net unrealized appreciation of $2,821,278. The aggregate cost of securities for federal income tax purposes at April 30, 2017 was $4,820,786.
NOTE D – RELATED PARTY TRANSACTIONS
Carosa Stanton Asset Management, LLC serves as investment adviser to the Fund pursuant to an investment adviser agreement which was approved by the Fund’s board of directors. Carosa Stanton Asset Management, LLC is a Registered Investment Adviser under the Investment Advisers Act of 1940. The Investment adviser agreement provides that Carosa Stanton Asset Management, LLC, subject to the supervision and approval of the Fund’s board of directors, is responsible for the day-to-day management of the Fund’s portfolio, which includes selecting investments and handling its business affairs.
The accompanying notes are an integral part of these statements
As compensation for its services to the Fund, the investment adviser receives monthly compensation at an annual rate of 1.25% on the first $1 million of daily average net assets and 1% on that portion of the daily average net assets in excess of $1 million. These fees are reduced by any sub-transfer agent fees incurred by the Fund.
Carosa Stanton Asset Management, LLC has agreed as part of its contract to forego sufficient investment adviser fees to limit total expenses of the Fund to 2% of the first $10 million in average assets and 1.5% of the next $20 million in average assets.
During the six months ended April 30, 2017, the Fund paid investment adviser fees of $45,742.
As of April 30, 2017, the Fund had $7,725 included in accrued liabilities, as owed to Carosa Stanton Asset Management, LLC.
Certain officers of the Fund are also officers of Carosa Stanton Asset Management.
NOTE E – REMUNERATION OF DIRECTORS
The Directors are paid a fee of $50 per meeting. They may be reimbursed for travel expenses.
NOTE F – COMMITMENTS AND CONTINGENCIES
The Series indemnifies the Fund’s officers and the Board of Directors for certain liabilities that might arise from their performance of their duties to the Series. Additionally, in the normal course of business the Fund enters into contracts that contain a variety of representations and warranties and which provide for general indemnifications. The Fund’s maximum exposure under these arrangements is unknown, as this would involve future claims that may be made against the Fund that have not yet occurred. However, based on its experience, the Fund expects the risk of loss to be remote.
The accompanying notes are an integral part of these statements
NOTE G - CAPITAL SHARE TRANSACTIONS
The Fund has authorized 10,000,000 shares of common stock at $0.01 par value per share. These shares are issued under either of the two series of the Fund. Each share has equal dividend, distribution and liquidation rights. Transactions in capital stock of the Series were as follows:
| | | Shares | | Amount |
| | | | | |
| Balance at October 31, 2015 | | | 367,912.112 | | | $ | 4,961,676 | |
| | | | | | | | | |
| Shares sold during 2016 | | | 34,807.058 | | | $ | 670,510 | |
| Shares redeemed during 2016 | | | (16,934.829 | ) | | | (331,114 | ) |
| Reinvestment of Distributions, December 29, 2015 | | | 37,058.354 | | | | 721,156 | |
| Balance at October 31, 2016 | | | 422,842.695 | | | $ | 6,022,228 | |
| Shares sold during six months ended April 30, 2017 | | | 4,341.201 | | | $ | 86,965 | |
| Shares redeemed during six months ended April 30, 2017 | | | (3,743.916 | ) | | | (73,897 | ) |
| Reinvestment of Distributions, December 29, 2016 | | | 35,222.474 | | | | 690,360 | |
| Balance at April 30, 2017 | | | 458,662.454 | | | $ | 6,725,656 | |
The accompanying notes are an integral part of these statements
GREATER WESTERN NEW YORK SERIES
(A Series Within Bullfinch Fund, Inc.)
FINANCIAL STATEMENTS AS OF
APRIL 30, 2017
(UNAUDITED)
The accompanying notes are an integral part of these statements
GREATER WESTERN NEW YORK SERIES
(A SERIES WITHIN BULLFINCH FUND, INC.)
STATEMENT OF ASSETS AND LIABILITIES
APRIL 30, 2017 (UNAUDITED)
| ASSETS | | | | |
| | | | | |
| Investments in Securities, at Fair Value, Identified Cost of $ 814,490 | | $ | 1,580,347 | |
| | | | | |
| Cash and Cash Equivalents | | | 300,197 | |
| | | | | |
| Accrued Interest and Dividends | | | 1,958 | |
| | | | | |
| Prepaid Expenses | | | 776 | |
| | | | | |
| Total Assets | | $ | 1,883,278 | |
| | | | | |
| LIABILITIES AND NET ASSETS | | | | |
| | | | | |
| LIABILITIES | | | | |
| | | | | |
| Accrued Expenses | | $ | 652 | |
| | | | | |
| Due to Investment Adviser | | | 1,734 | |
| | | | | |
| NET ASSETS | | | | |
| | | | | |
| Net Assets (Equivalent to $21.52 per share based on 87,417.651 shares of stock outstanding) | | | 1,880,892 | |
| | | | | |
| Total Liabilities and Net Assets | | $ | 1,883,278 | |
| | | | | |
| COMPOSITION OF NET ASSETS | | | | |
| | | | | |
| Shares of Common Stock - Par Value $.01; 87,417.651 Shares Outstanding | | $ | 1,171,864 | |
| | | | | |
| Accumulated Net Investment Loss & Realized Loss from Securities Transactions | | | (56,829 | ) |
| | | | | |
| Net Unrealized Appreciation on Investments | | | 765,857 | |
| | | | | |
| Net assets at April 30, 2017 | | $ | 1,880,892 | |
The accompanying notes are an integral part of these statements
GREATER WESTERN NEW YORK SERIES (A SERIES WITHIN BULLFINCH FUND, INC.)
SCHEDULE OF INVESTMENTS IN SECURITIES
APRIL 30, 2017 (UNAUDITED)
| | | Historical |
| | | Shares | | Cost | | Value |
| | | | | | | |
| Level 1 – Common Stocks – 84.04% |
| * ASTERISK DENOTES A NON INCOME PRODUCING SECURITY |
| | | | | | | | | | | | | |
| Electrical Equipment – 10.70% | | | | | | | | | | | | |
| Corning, Inc. | | | 2,200 | | | | 26,502 | | | | 63,470 | |
| General Electric Co. | | | 1,450 | | | | 35,248 | | | | 42,035 | |
| Ultralife Corporation* | | | 17,400 | | | | 65,037 | | | | 95,700 | |
| | | | | | | | 126,787 | | | | 201,205 | |
| Aerospace - 7.92% | | | | | | | | | | | | |
| Harris Corporation | | | 500 | | | | 24,989 | | | | 55,945 | |
| Moog, Inc. Class A* | | | 637 | | | | 15,976 | | | | 43,730 | |
| Northrop Grumman | | | 200 | | | | 2,294 | | | | 49,192 | |
| | | | | | | | 43,259 | | | | 148,867 | |
| Medical Products & Supplies - 7.72% | | | | | | | | | | | | |
| Bristol-Myers Squibb Co. | | | 1,150 | | �� | | 29,276 | | | | 64,457 | |
| Integer Holdings Corp.* | | | 850 | | | | 17,417 | | | | 31,238 | |
| Johnson & Johnson | | | 400 | | | | 22,617 | | | | 49,388 | |
| | | | | | | | 69,310 | | | | 145,083 | |
| Banking & Finance – 7.53% | | | | | | | | | | | | |
| Community Bank System | | | 1,200 | | | | 23,452 | | | | 67,140 | |
| M &T Bank Corp. | | | 300 | | | | 29,839 | | | | 46,623 | |
| Manning & Napier Inc. | | | 4,800 | | | | 31,164 | | | | 27,840 | |
| | | | | | | | 84,455 | | | | 141,603 | |
| Electronics Components - 5.15% | | | | | | | | | | | | |
| Astronics Corp.* | | | 1,491 | | | | 3,025 | | | | 48,472 | |
| IEC Electronics Corp.* | | | 4,518 | | | | 6,984 | | | | 17,440 | |
| TE Connectivity Ltd | | | 400 | | | | 10,904 | | | | 30,948 | |
| | | | | | | | 20,913 | | | | 96,860 | |
| Telecommunications – 4.75% | | | | | | | | | | | | |
| AT&T Corp. | | | 950 | | | | 33,705 | | | | 37,648 | |
| Frontier Communications | | | 10,400 | | | | 44,495 | | | | 19,552 | |
| Verizon Communications | | | 700 | | | | 34,210 | | | | 32,137 | |
| | | | | | | 112,410 | | | | 89,337 | |
| Steel - 4.17% | | | | | | | | | | | | |
| Gibraltar Industries Inc.* | | | 2,000 | | | | 25,111 | | | | 78,500 | |
| | | | | | | | | | | | | |
| Utilities - Natural Resources - 3.68% | | | | | | | | | | | | |
| National Fuel Gas Co. | | | 1,250 | | | | 50,833 | | | | 69,225 | |
| | | | | | | | | | | | | |
| Foods & Beverages - 3.67% | | | | | | | | | | | | |
| Constellation Brands Inc. | | | 400 | | | | 2,509 | | | | 69,016 | |
| | | | | | | | | | | | | |
| Leisure & Recreational – 3.58% | | | | | | | | | | | | |
| Mattel Inc. | | | 3,000 | | | | 70,144 | | | | 67,260 | |
| | | | | | | | | | | | | |
| Commercial Services - 3.32% | | | | | | | | | | | | |
| Conduent* | | | 280 | | | | 5,074 | | | | 4,567 | |
| Paychex, Inc. | | | 975 | | | | 25,852 | | | | 57,798 | |
| | | | | | | | 30,926 | | | | 62,365 | |
| | | Historical |
| | | Shares | | Cost | | Value |
| | | | | | | |
| Level 1 – Common Stocks – 84.04% | | | | | | | | | | | | |
| | | | | | | | | | | | | |
| Railroads - 3.24% | | | | | | | | | | | | |
| Genesee & Wyoming Class A* | | | 900 | | | | 2,522 | | | | 60,984 | |
| | | | | | | | | | | | | |
| Airlines - 3.14% | | | | | | | | | | | | |
| Southwest Airlines Co. | | | 1,050 | | | | 19,813 | | | | 59,031 | |
| | | | | | | | | | | | | |
| Automotive – 2.90% | | | | | | | | | | | | |
| Monro Muffler Brake Inc. | | | 1,050 | | | | 12,443 | | | | 54,442 | |
| | | | | | | | | | | | | |
| Real Estate & Related - 2.50% | | | | | | | | | | | | |
| Life Storage Inc. | | | 600 | | | | 22,199 | | | | 47,034 | |
| | | | | | | | | | | | | |
| Computers - Software - 2.15% | | | | | | | | | | | | |
| Oracle Corporation | | | 900 | | | | 12,070 | | | | 40,464 | |
| | | | | | | | | | | | | |
| Retail - Specialty – 1.90% | | | | | | | | | | | | |
| Fastenal Co. | | | 800 | | | | 13,954 | | | | 35,744 | |
| | | | | | | | | | | | | |
| Computers - Services - 1.89% | | | | | | | | | | | | |
| Computer Task Group Inc.* | | | 6,000 | | | | 33,877 | | | | 35,580 | |
| | | | | | | | | | | | | |
| Metal Fabrication & Hardware – 1.64% | | | | | | | | | | | | |
| Graham Corporation | | | 1,400 | | | | 15,140 | | | | 30,898 | |
| | | | | | | | | | | | | |
| Environmental Services – 1.13% | | | | | | | | | | | | |
| Ecology & Environment | | | 2,000 | | | | 25,398 | | | | 21,251 | |
| | | | | | | | | | | | | |
| Instruments - 0.63% | | | | | | | | | | | | |
| Taylor Devices* | | | 877 4, | | | | 394 | | | | 11,899 | |
| | | | | | | | | | | | | |
| Office Equipment - 0.54% | | | | | | | | | | | | |
| Xerox Corporation | | | 1,400 | | | | 12,742 | | | | 10,066 | |
| | | | | | | | | | | | | |
| Machinery - 0.14% | | | | | | | | | | | | |
| Columbus McKinnon Corp. | | | 100 | | | | 2,344 | | | | 2,613 | |
| | | | | | | | | | | | | |
| Industrial Materials - 0.05% | | | | | | | | | | | | |
| Servotronics, Inc. | | | 100 | | | | 937 | | | | 1,020 | |
| | | | | | | | | | | | | |
| Total Investments in Securities | | | | | | | 814,490 | | | | 1,580,347 | |
| | | | | | | | | | | | | |
| Level 1 – Cash & Equivalents - 15.96% | | | | | | | | | | | | |
| Schwab Gov’t Money Fund -15.96% | | | | | | | 300, 197 | | | | 300,197 | |
| Sweep Shares 7 Day Yield .16% | | | | | | | | | | | | |
| | | | | | | | | | | | | |
| Total Invested Assets | | | | | | $ | 1,114,687 | | | $ | 1,880,544 | |
The accompanying notes are an integral part of these statements
GREATER WESTERN NEW YORK SERIES
(A SERIES WITHIN BULLFINCH FUND, INC.)
SCHEDULE OF INVESTMENTS IN SECURITIES
APRIL 30, 2017 (UNAUDITED)
Table of Industries
| Industry | | Market Value | | | Percent | |
| | | | | | | |
| Aerospace | | $ | 148,867 | | | | 7.92 | % |
| Airlines | | $ | 59,031 | | | | 3.14 | % |
| Automotive | | $ | 54,442 | | | | 2.90 | % |
| Banking & Finance | | $ | 141,603 | | | | 7.53 | % |
| Commercial Services | | $ | 62,365 | | | | 3.32 | % |
| Computers – Services | | $ | 35,580 | | | | 1.89 | % |
| Computers – Software | | $ | 40,464 | | | | 2.15 | % |
| Electrical Equipment | | $ | 201,205 | | | | 10.70 | % |
| Electronics Components | | $ | 96,860 | | | | 5.15 | % |
| Environmental Services | | $ | 21,251 | | | | 1.13 | % |
| Foods & Beverages | | $ | 69,016 | | | | 3.67 | % |
| Industrial Materials | | $ | 1,020 | | | | 0.05 | % |
| Instruments | | $ | 11,899 | | | | 0.63 | % |
| Leisure & Recreational | | $ | 67,260 | | | | 3.58 | % |
| Machinery | | $ | 2,613 | | | | 0.14 | % |
| Medical Products & Supplies | | $ | 145,083 | | | | 7.72 | % |
| Metal Fabrication & Hardware | | $ | 30,898 | | | | 1.64 | % |
| Office Equipment | | $ | 10,066 | | | | 0.54 | % |
| Railroads | | $ | 60,984 | | | | 3.24 | % |
| Real Estate & Related | | $ | 47,034 | | | | 2.50 | % |
| Retail – Specialty | | $ | 35,744 | | | | 1.90 | % |
| Steel | | $ | 78,500 | | | | 4.17 | % |
| Telecommunications | | $ | 89,337 | | | | 4.75 | % |
| Utilities – Natural Resources | | $ | 69,225 | | | | 3.68 | % |
| Total Equities | | $ | 1,580,347 | | | | 84.04 | % |
| | | | | | | | | |
| Cash & Equivalents (7 day yield .16%) | | $ | 300,197 | | | | 15.96 | % |
| | | | | | | | | |
| Total Invested Assets | | $ | 1,880,544 | | | | 100.00 | % |
The accompanying notes are an integral part of these statements
GREATER WESTERN NEW YORK SERIES (A SERIES WITHIN BULLFINCH FUND, INC.)
STATEMENTS OF OPERATIONS
FOR THE 6 MONTHS ENDED APRIL 30, 2017 (UNAUDITED)
| INVESTMENT INCOME: | | | | |
| Dividends & Interest Income | | $ | 8,267 | |
| | | | | |
| FEES AND EXPENSES: | | | | |
| Investment Adviser Fees | | | 10,493 | |
| Legal and Professional | | | 652 | |
| Director’s Fees | | | 1,050 | |
| D&O/E&O | | | 468 | |
| Fidelity Bond | | | 104 | |
| State IncomeTaxes | | | (2,570 | ) |
| Telephone | | | 0 | |
| Registration Fees | | | 0 | |
| Custodian Fees | | | 1,375 | |
| Travel | | | 0 | |
| Dues and Subscriptions | | | 970 | |
| Total Fees and Expenses | | | 12,542 | |
| Net investment loss | | | (4,275 | ) |
| | | | | |
| REALIZED AND UNREALIZED GAIN ON INVESTMENTS: | | | | |
| Realized gain from securities transactions | | | 81,862 | |
| Unrealized appreciation during the period | | | 49,716 | |
| Net gain on investments | | | 131,578 | |
| CHANGE IN NET ASSETS FROM OPERATIONS | | $ | 127,303 | |
GREATER WESTERN NEW YORK SERIES (A SERIES WITHIN BULLFINCH FUND, INC.)
STATEMENTS OF CHANGES IN NET ASSETS
| | | Six Months Ended | | | Year Ended | |
| | | April 30, 2017* | | | October 31, 2016 | |
| CHANGE IN NET ASSETS FROM OPERATIONS: | | | | | | | | |
| Net investment income (loss) | | $ | (4,275 | ) | | $ | (809 | ) |
| Net realized gain (loss) from securities transactions | | | 81,862 | | | | (1,629 | ) |
| Net change in unrealized appreciation (depreciation) of investments | | | 49,716 | | | | (21,724 | ) |
| Change in net assets from operations | | | 127,303 | | | | (24,162 | ) |
| | | | | | | | | |
| DISTRIBUTIONS TO SHAREHOLDERS: | | | | | | | | |
| Distribution of ordinary income | | | 0 | | | | (5,115 | ) |
| Distribution of capital gains | | | (28,776 | ) | | | (6,100 | ) |
| Reinvested dividend distributions | | | 28,776 | | | | 11,215 | |
| | | | | | | | | |
| CAPITAL SHARE TRANSACTIONS: | | | | | | | | |
| Sales | | | 32,331 | | | | 61,728 | |
| Redemptions | | | (15,283 | ) | | | (79,828 | ) |
| Net Capital Share Transactions | | | 17,048 | | | | (18,100 | ) |
| | | | | | | | | |
| TOTAL INCREASE (DECREASE) IN NET ASSETS | | | 144,351 | | | | (42,262 | ) |
| | | | | | | | | |
| NET ASSETS: | | | | | | | | |
| Beginning of period | | | 1,736,541 | | | | 1,778,803 | |
| End of period | | $ | 1,880,892 | | | $ | 1,736,541 | |
*Unaudited
The accompanying notes are an integral part of these statements
GREATER WESTERN NEW YORK SERIES (A SERIES WITHIN BULLFINCH FUND, INC.)
FINANCIAL HIGHLIGHTS
(PER SHARE DATA FOR A SHARE OUTSTANDING)
| | | Six Months Ended | | | Year Ended | | | Year Ended | | | Year Ended | | | Year Ended | | | Year Ended | |
| | | April 30, 2017* | | | October 31, 2016 | | | October 31, 2015 | | | October 31, 2014 | | | October 31, 2013 | | | October 31, 2012 | |
| NET ASSET VALUE, beginning of period | | $ | 20.36 | | | $ | 20.79 | | | $ | 22.41 | | | $ | 20.16 | | | $ | 15.53 | | | $ | 14.70 | |
| | | | | | | | | | | | | | | | | | | | | | | | | |
| INCOME (LOSS) FROM INVESTMENT OPERATIONS | | | | | | | | | | | | | | | | | | | | | | | | |
| Net investment income (loss) | | | (0.05 | ) | | | (0.01 | ) | | | 0.00 | | | | (0.08 | ) | | | (0.08 | ) | | | (0.11 | ) |
| Net gain (loss) on securities both realized and unrealized | | | 1.55 | | | | (0.29 | ) | | | 0.65 | | | | 2.33 | | | | 4.71 | | | | 0.94 | |
| Total from investment operations | | | 1.50 | | | | (0.30 | ) | | | 0.65 | | | | 2.25 | | | | 4.63 | | | | 0.83 | |
| | | | | | | | | | | | | | | | | | | | | | | | | |
| DISTRIBUTIONS TO SHAREHOLDERS FROM: | | | | | | | | | | | | | | | | | | | | | | | | |
| Distribution of ordinary income | | | (0.00 | ) | | | (0.06 | ) | | | 0.00 | | | | 0.00 | | | | 0.00 | | | | 0.00 | |
| Distribution of capital gains | | | (0.34 | ) | | | (0.07 | ) | | | (2.27 | ) | | | 0.00 | | | | 0.00 | | | | 0.00 | |
| Total Stock Dividend Distributions | | | (0.34 | ) | | | (0.13 | ) | | | (2.27 | ) | | | 0.00 | | | | 0.00 | | | | 0.00 | |
| | | | | | | | | | | | | | | | | | | | | | | | | |
| | | | | | | | | | | | | | | | | | | | | | | | | |
| NET ASSET VALUE, end of period | | $ | 21.52 | | | $ | 20.36 | | | $ | 20.79 | | | $ | 22.41 | | | $ | 20.16 | | | $ | 15.53 | |
| | | | | | | | | | | | | | | | | | | | | | | | | |
| NET ASSETS, end of period | | $ | 1,880,892 | | | $ | 1,736,541 | | | $ | 1,778,803 | | | $ | 1,774,261 | | | $ | 1,554,267 | | | $ | 1,101,480 | |
*Unaudited
GREATER WESTERN NEW YORK SERIES (A SERIES WITHIN BULLFINCH FUND, INC.)
FINANCIAL HIGHLIGHTS
(RATIOS AND SUPPLEMENTAL DATA)
| | | Six Months Ended | | | Year Ended | | | Year Ended | | | Year Ended | | | Year Ended | | | Year Ended | |
| | | April 30, 2017* | | | October 31, 2016 | | | October 31, 2015 | | | October 31, 2014 | | | October 31, 2013 | | | October 31, 2012 | |
| RATIO OF EXPENSES TO AVERAGE | | | | | | | | | | | | | | | | | | | | | | | | |
| NET ASSETS** | | | 0.67 | %*** | | | 1.56 | % | | | 1.54 | % | | | 1.68 | % | | | 1.74 | % | | | 1.97 | % |
| | | | | | | | | | | | | | | | | | | | | | | | | |
| RATIO OF NET INVESTMENT INCOME TO | | | | | | | | | | | | | | | | | | | | | | | | |
| AVERAGE NET ASSETS** | | | (0.23 | )%*** | | | (0.05 | )% | | | (0.02 | )% | | | (0.38 | )% | | | (0.45 | )% | | | (0.72 | )% |
| | | | | | | | | | | | | | | | | | | | | | | | | |
| PORTFOLIO TURNOVER RATE** | | | 2.07 | %*** | | | 0.16 | % | | | 4.34 | % | | | 13.65 | % | | | 0.00 | % | | | 0.05 | % |
| | | | | | | | | | | | | | | | | | | | | | | | | |
| TOTAL RETURN | | | 3.78 | % | | | (1.45 | )% | | | 2.85 | % | | | 11.16 | % | | | 29.81 | % | | | 5.65 | % |
*Unaudited
**Per share amounts calculated using the average shares method
*** The ratios presented were calculated using operating data for the six-month period from November 1, 2016 to April 30, 2017.
The accompanying notes are an integral part of these statements
GREATER WESTERN NEW YORK SERIES (A SERIES WITHIN BULLFINCH FUND, INC.)
NOTES TO FINANCIAL STATEMENTS APRIL 30, 2017
NOTE A - SCOPE OF BUSINESS
The Greater Western New York Series (the “Series”) is a series within the Bullfinch Fund, Inc. (the “Fund”), which was organized as a Maryland corporation registered under the Investment Company Act of 1940 as an open-ended non-diversified management investment company. The Fund offers two series of common stock. In addition to the Greater Western New York Series, the Fund also offers the Unrestricted Series.
The investment objective of the Series is to seek capital appreciation through the investment in common stock of companies with an important economic presence in the Greater Western New York Region. The Adviser seeks to achieve this objective by using an asset mix consisting primarily of exchange listed securities and over-the-counter common stocks as well as U.S. Government securities maturing within five years.
NOTE B - SUMMARY OF SIGNIFICANT ACCOUNTING POLICIES
The following is a summary of significant accounting policies followed by the Series in the preparation of its financial statements. These policies are in conformity with accounting principles generally accepted in the United States (“GAAP”). The Series follows the investment company accounting and reporting guidance of the Financial Accounting Standard Board Accounting Standard Codification 946, Financial Services – Investment Companies.
Fair Value Measurements – ASC 820-10 establishes a fair value hierarchy which requires an entity to maximize the use of observable inputs and minimize the use of unobservable inputs when measuring fair value. The standard describes three levels of inputs that may be used to measure fair value:
Level 1: Quoted prices (unadjusted) for identical assets or liabilities in active markets that the entity has the ability to access as of the measurement date.
Level 2: Significant other observable inputs other than Level 1 prices such as quoted prices for similar assets or liabilities; quoted prices in markets that are not active; or other inputs that are observable or can be corroborated by observable market data.
Level 3: Significant unobservable inputs that reflect a reporting entity’s own assumptions about the assumptions that market participants would use in pricing an asset or liability.
The following is a description of the valuation methodologies used for assets measured at fair value:
Cash & Equivalents- Cash consists of amounts deposited in money market accounts or treasury bills and is not federally insured. The Series has not experienced any losses on such amounts and believes it is not exposed to any significant credit risk on cash.
Security Valuation - The Series records its investments at fair value and is in compliance with FASB ASC 820-10-50. Securities traded on national securities exchanges or the NASDAQ National Market System are valued daily at the closing prices of the securities on those exchanges and securities traded on over-the-counter markets are valued daily at the closing bid prices. Short-term and money market securities are valued at amortized cost, which approximates market value.
The accompanying notes are an integral part of these statements
ASSETS AT FAIR VALUE AS OF:
| | | 4/30/17 | |
| | | LEVEL 1 | |
| COMMON STOCKS | | $ | 1,580,347 | |
| CASH & EQUIVALENTS | | $ | 300,197 | |
| TOTAL INVESTED ASSETS | | $ | 1,880,544 | |
In cases where market prices are unreliable or not readily available, for example, when trading on securities are halted as permitted by the SEC or when there is no trading volume on an Over-the-Counter security held by the Fund, the Fund relies on fair value pricing provided by the Adviser. In performing its fair value pricing, the Adviser acts under the ultimate supervision of, and follows, the policies of the Board of Directors. The Board of Directors retains the right to determine its own fair value price should it have reason to believe the price provided by the Adviser does not reflect fair value. Valuing securities at fair value involves greater reliance on judgment than securities that have readily available market quotations. There can be no assurance the Fund could obtain the fair value assigned to a security if they were to sell the security at approximately the time at which the Fund determines their net asset value per share.
Series Allocations - Common expenses of the Fund are evenly split between the two series of the Fund unless the Board of Directors approves an alternative allocation of expenses based on management’s estimate.
Income Taxes - It is the policy of the Fund to comply with the requirements of Subchapter M of the Internal Revenue Code (the “Code”) applicable to regulated investment companies and to distribute all of its taxable income to its shareholders. In addition, the Fund intends to distribute an amount sufficient to avoid imposition of any excise tax under Section 4982 of the Code. Therefore, no provision for federal income taxes or excise taxes has been made.
Management has reviewed all open tax years and major tax jurisdictions and concluded that no liability for unrecognized tax benefits should be recorded related to uncertain tax positions taken on returns filed or expected to be taken on a tax return. The tax returns of the Series for the prior three years are open for examination.
Distributions to Shareholders - Distributions to shareholders are recorded on the ex-dividend date. The Series made a distribution of its ordinary income of $5,115 to its shareholders on December 29, 2015 in the form of stock dividends equal to 246.371 shares of stock. The Series made a distribution of its capital gains of $6,100 to its shareholders on December 29, 2015 in the form of stock dividends equal to 293.831 shares of stock. The Series made a distribution of its capital gains of $28,776 to its shareholders on December 29, 2016 in the form of stock dividends equal to 1,336.559 shares of stock.
Other - The Series follows industry practice and records security transactions on the trade date. The specific identification method is used for determining gains and losses for financial statement and income tax purposes. Dividend income is recorded on the ex-dividend date.
Use of Estimates - The preparation of financial statements in conformity with generally accepted accounting principles requires management to make estimates and assumptions that affect the amounts reported in the financial statements and accompanying notes. Actual results can differ from those estimates.
The accompanying notes are an integral part of these statements
Subsequent Events - In accordance with GAAP, the Fund has evaluated the need for disclosures and/or adjustments resulting from subsequent events through the date of issuance of these financial statements.
NOTE C – INVESTMENTS
For the six months ended April 30, 2017, the Series purchased $38,503 of common stock. During the same period, the Series sold $154,343 of common stock.
At April 30, 2017, the gross unrealized appreciation for all securities totaled $824,386 and the gross unrealized depreciation for all securities totaled $58,529 or a net unrealized appreciation of $765,857. The aggregate cost of securities for federal income tax purposes at April 30, 2017 was 814,490.
NOTE D – RELATED PARTY TRANSACTIONS
Carosa Stanton Asset Management, LLC serves as investment adviser to the Fund pursuant to an investment adviser agreement which was approved by the Fund’s board of directors. Carosa Stanton Asset Management, LLC is a Registered Investment Adviser under the Investment Advisers Act of 1940. The Investment adviser agreement provides that Carosa Stanton Asset Management, LLC, subject to the supervision and approval of the Fund’s board of directors, is responsible for the day-to-day management of the Fund’s portfolio, which includes selecting investments and handling its business affairs.
As compensation for its services to the Fund, the investment adviser receives monthly compensation at an annual rate of 1.25% on the first $1 million of daily average net assets and 1% on that portion of the daily average net assets in excess of $1 million. These fees are reduced by any sub-transfer agent fees incurred by the Fund.
Carosa Stanton Asset Management, LLC has agreed as part of its contract to forego sufficient investment adviser fees to limit total expenses of the Fund to 2% of the first $10 million in average assets and 1.5% of the next $20 million in average assets.
During the six months ended April 30, 2017, the Fund paid investment adviser fees of $10,493.
As of April 30, 2017, the Fund had $1,734 included in accrued liabilities, as owed to Carosa Stanton Asset Management, LLC.
Certain officers of the Fund are also officers of Carosa Stanton Asset Management.
NOTE E – REMUNERATION OF DIRECTORS
The Directors are paid a fee of $50 per meeting. They may be reimbursed for travel expenses.
NOTE F – COMMITMENTS AND CONTINGENCIES
The Series indemnifies the Fund’s officers and the Board of Directors for certain liabilities that might arise from their performance of their duties to the Series. Additionally, in the normal course of business the Fund enters into contracts that contain a variety of representations and warranties and which provide for general indemnifications. The Fund’s maximum exposure under these arrangements is unknown, as this would involve future claims that may be made against the Fund that have not yet occurred. However, based on its experience, the Fund expects the risk of loss to be remote.
NOTE G - CAPITAL SHARE TRANSACTIONS
The Fund has authorized 10,000,000 shares of common stock at $0.01 par value per share. These shares are issued under either of the two series of the Fund. Each share has equal dividend, distribution and liquidation rights. Transactions in capital stock of the Series were as follows:
| | | Shares | | | Amount | |
| | | | | | | |
| Balance at October 31, 2015 | | | 85,564.891 | | | $ | 1,132,925 | |
| | | | | | | | | |
| Shares sold during 2016 | | | 2,995.918 | | | $ | 61,728 | |
| Shares redeemed during 2016 | | | (3,811.697 | ) | | | (79,828 | ) |
| Reinvestment of Distributions, December 29, 2015 | | | 540.202 | | | | 11,215 | |
| Balance at October 31, 2016 | | | 85,289.314 | | | $ | 1,126,040 | |
| | | | | | | | | |
| Shares sold during six months ended April 30, 2017 | | | 1,496.703 | $ | | | 32,331 | |
| Shares redeemed during six months ended April 30, 2017 | | | (704.925 | ) | | | (15,283 | ) |
| Reinvestment of Distributions, December 29, 2016 | | | 1,336.559 | | | | 28,776 | |
| Balance at April 30, 2017 | | | 87,417.651 | | | $ | 1,171,864 | |
The accompanying notes are an integral part of these statements
Item 2 - CODE OF ETHICS.
| | (a) | The registrant has adopted a code of ethics that applies to the registrant’s principal executive officer, its principal financial officer, principal accounting officer, controller, as well as any other officers and persons providing similar functions. This code of ethics is included as Exhibit 11(a)(1). |
| | | |
| | (b) | During the period covered by this report, no amendments were made to the provisions of the code of ethics |
| | | |
| | (c) | During the period covered by this report, no implicit or explicit waivers to the provisions of the code of ethics were granted. |
Item 3 - AUDIT COMMITTEE FINANCIAL EXPERT.
The registrant’s Board of Directors determined that the registrant does not have an Audit Committee member who possesses all of the attributes required to be an “audit committee financial expert” as defined in instruction 2(b) of Item 3 of Form N-CSR. It was the consensus of the board that, although no one individual Audit Committee member meets the technical definition of an audit committee financial expert, the Committee has sufficient expertise collectively among its members to effectively discharge its duties and that the Committee will engage additional expertise if needed.
Item 4 - PRINCIPAL ACCOUNTANT FEES AND SERVICES.
The registrant has engaged its principal accountant to perform audit services. “Audit services” refer to performing an audit of the registrant’s annual financial statements or services that are normally provided by the accountant in connection with statutory and regulatory filings or engagements for those fiscal years. “Audit-related services” refer to the assurance and related services by the principal accountant that are reasonably related to the performance of the audit. “Tax services” refer to professional services rendered by the principal accountant for tax compliance, tax advice, and tax planning. The following table details the aggregate fees billed for each of the last two fiscal years for audit fees, audit-related fees, tax fees and other fees by the principal accountant. Since the accounting fees were approved by the Board of Directors in total, the principal accountant has provided an estimate of the split between audit and preparation of the tax filings.
| | | 10/31/2016 | | | 10/31/2015 | |
| | | | | | | | | |
| Audit Fees | | $ | 10,000 | | | $ | 13,125 | |
| | | | | | | | | |
| Audit-Related Fees | | $ | 0 | | | $ | 0 | |
| Tax Fees | | $ | 2,000 | | | $ | 1,245 | |
| All Other Fees | | $ | 0 | | | $ | 0 | |
The Audit Committee of the registrant’s Board of Directors recommends a principal accountant to perform audit services for the registrant. Each year, the registrant’s Board of Directors vote to approve or disapprove the principal accountant recommended by the Audit Committee for the following year’s accounting work.
Item 5 - AUDIT COMMITTEE OF LISTED REGISTRANTS.
Not applicable to open-end investment companies.
Item 6 - INVESTMENTS
Item 6(a) -The list of investments is included in the shareholder report.
Item 6(b) -Not applicable.
Item 7 - DISCLOSURE OF PROXY VOTING POLICIES AND PROCEDURES FOR CLOSED-END MANAGEMENT INVESTMENT COMPANIES.
Not applicable to open-end investment companies.
Item 8 - PORTFOLIO MANAGERS OF CLOSED-END MANAGEMENT INVESTMENT COMPANIES.
Not applicable to open-end investment companies.
Item 9 - PURCHASES OF EQUITY SECURITIES BY CLOSED-END MANAGEMENT INVESTMENT COMPANIES.
Not applicable to open-end investment companies.
ITEM 10. SUBMISSION OF MATTERS TO A VOTE OF SECURITY HOLDERS.
None.
ITEM 11. CONTROLS AND PROCEDURES.
| Item 11(a) - | The registrant’s principal executive and principal financial officer has determined that the registrant’s disclosure controls and procedures (as defined in Rule 30a-3(c) under the Investment Company Act of 1940) are effective based on the evaluation of these controls and procedures are effective as of a date within 90 days prior to the filing date of this report. |
| | |
| Item 11(b) - | There were no changes in the registrant’s internal control over financial reporting (as defined in Rule 30a-3(d) under the Investment Company Act of 1940) that occurred during the registrant’s last fiscal half-year (the registrant’s second fiscal half-year in the case of an annual report) that has materially affected, or is reasonably likely to materially affect, the registrant’s internal control over financial reporting. |
Item 12 - EXHIBITS.
| | (a)(1) | Code of Ethics - (incorporated by reference to Bullfinch Fund, Inc.; 333-26321; 811-08191; Form N-1A filed on October 30, 2003 with Accession Number 0001038199-02-000005). |
| | | |
| | (a)(2) | Certifications pursuant to Section 302 of the Sarbanes- Oxley Act of 2002 are attached hereto. |
| | | |
| | (b) | Certifications pursuant to Section 906 of the Sarbanes- Oxley Act of 2002 are attached hereto. |
SIGNATURES
Pursuant to the requirements of the Securities Exchange Act of 1934 and the Investment Company Act of 1940, the registrant has duly caused this report to be signed on its behalf by the undersigned, thereunto duly authorized.
| Bullfinch Fund, Inc. | |
| | | |
| By: | /s/ Christopher Carosa | |
| | Christopher Carosa, | |
| | President of Bullfinch Fund, Inc. | |
Date: June 26, 2017
Pursuant to the requirements of the Securities Exchange Act of 1934 and the Investment Company Act of 1940, this report has been signed below by the following persons on behalf of the registrant and in the capacities and on the dates indicated.
| By: | /s/ Christopher Carosa | |
| | Christopher Carosa, | |
| | President of Bullfinch Fund, Inc. | |
Date: June 26, 2017