UNITED STATES
SECURITIES AND EXCHANGE COMMISSION
Washington, D.C. 20549
FORM N-CSR
CERTIFIED SHAREHOLDER REPORT OF REGISTERED MANAGEMENT INVESTMENT COMPANIES
Investment Company Act file number 811-08191
| Name of Fund: | Bullfinch Fund, Inc. |
| | |
| Fund Address: | 3909 Rush Mendon Road |
| | Mendon, New York 14506 |
| Name and address of agent for service: | Christopher Carosa, President, |
| | Bullfinch Fund, Inc., 3909 Rush Mendon Road, |
| | Mendon, New York 14506 |
| | Mailing address: 3909 Rush Mendon Road |
| | Mendon, New York 14506 |
Registrant’s telephone number, including area code: (585) 624-3150
Date of fiscal year end: 10/31/18
Date of reporting period: 11/01/17 - 10/31/18
| Item 1 | - | Attach shareholder report |

3909 Rush Mendon Road
Mendon, New York 14506
(585) 624-3150
1-888-BULLFINCH
(1-888-285-5346)
Annual Report
October 31, 2018
Management’s Discussion of Fund Performance
December 21, 2018
Dear Fellow Shareholders:
We are very proud to present the October 2018 Annual Report of Bullfinch Fund, Inc. This report contains the audited financial statements for both the Unrestricted Series and the Greater Western New York Series.
This year produced excellent results for the Bullfinch Fund, Inc., even taking into account the terrible October we just had. Both series surpassed their benchmark (the Value Line Geometric Index) over the past year and impressively so over the past five and ten years. While past performance can never guarantee future results, we would like to remind you this has occurred at a time when our value style of management has been out of favor. You can see these benchmark comparisons in the performance summary on the next page.
In the Unrestricted Series, the top performing stocks included Adobe Systems, Edwards Lifesciences, and Synopsis (which we sold during the year). Among the laggards were General Electric and Xperi Corporation, as well as Fred’s and Mattel, both of which we sold during the year. A total of 14 out of the 33 stocks we held during the year were up double digits, compared to a total of 11 that were down double digits for the year.
During the fiscal year, in the Greater Western New York Series, a total of 11 (out of 38) individual stocks experienced greater than double digit returns. Of these, 3 roughly 50% (or more): Integer Holdings Corporation, Monro, Inc., and Conduent (which has since been sold). A total of 7 stocks had double-digit negative return for the year, the worst being Mattel (sold during the year), General Electric, and Manning and Napier.
Over the past twelve months, the market seems to be trying to flirt with value stocks but has continually returned to growth stocks. In the recent downturn going through the mid-term election, the market appears to have responded negatively to a number of factors. Let’s take a closer look at these factors and how they have impacted our portfolios and what opportunities they may offer.
It is now clear the mid-term election has introduced uncertainty in Washington. This, together with the ongoing geopolitical uncertainty and the rise in interest rates, has fueled the ongoing market descent. Fortunately for us, it has been the growth stocks that have been hit harder than the value stocks. Leading this down turn has been the technology sector, most notably the FAANG stocks – Facebook, Amazon, Apple, Netflix, and Google (now Alphabet). Of course, this makes sense as these same stocks led the run-up in the market.
With the market continuing to fall, we may be entering the “throw the baby out with the bathwater” phase. We continue to look for those babies. In the meantime, with interest rates rising, we’re finally able to return to actively consider short-term fixed income investments in lieu of our current stable value holdings.
We wish to thank our shareholders for expressing their confidence in us and wish you continued good fortune.
Best Regards,
Bullfinch Fund, Inc.
Christopher Carosa, CTFA
President
BULLFINCH FUND INC.
PERFORMANCE SUMMARY
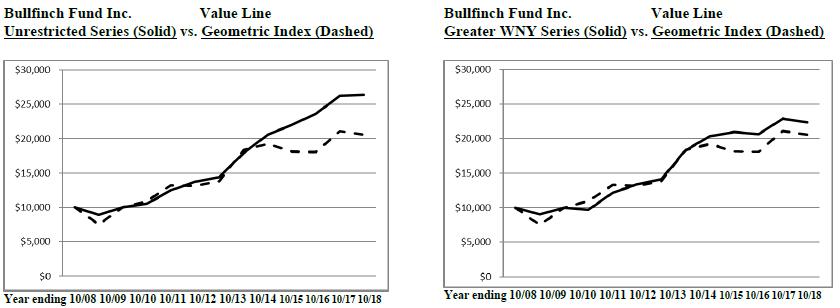
The graph below represents the changes in value for an initial $10,000 investment in the BULLFINCH Fund from 10/31/08 to 10/31/18. These changes are then compared to a $10,000 investment in the Value Line Geometric Index. The Value LINE Geometric Index (VLG) is an unmanaged index of between 1,600 and 1,700 stocks. Value Line states “The VLG was intended to provide a rough approximation of how the median stock in the Value Line Universe performed. The VLG also has appeal to institutional investors as a proxy for the so-called ‘multi-cap’ market because it includes large cap, mid cap and small cap stocks alike.” The Fund feels it is an appropriate benchmark because the Fund’s portfolios are multi-cap portfolios. The Fund’s returns include the reinvestment of all dividends, but do not reflect the deduction of taxes that a shareholder would pay on fund distributions or the redemptions of fund shares. Past performance is not predictive of future performance. Investment return and principal value will fluctuate, so that your shares, when redeemed, may be worth more or less than the original cost.
| Annualized | | | | | | | | Annualized | | | | | | |
| Returns Ending | | Bullfinch
Fund Inc. | | | Value Line Geometric | | | Returns Ending | | Bullfinch
Fund Inc. | | | Value Line | |
| 10/31/2018 | | Unrestricted Series | | | Index | | | 10/31/2018 | | Greater WNY Series | | | Geometric Index | |
| | | | | | | | | | | | | | | | | | | |
| One – Year | | | +0.45 | % | | | -2.54 | % | | One – Year | | | -2.15 | % | | | -2.54 | % |
| Five – Year | | | +8.06 | % | | | +2.28 | % | | Five – Year | | | +4.10 | % | | | +2.28 | % |
| Ten – Year | | | +10.18 | % | | | +4.23 | % | | Ten – Year | | | +8.38 | % | | | +4.23 | % |
UNRESTRICTED SERIES
(A Series Within Bullfinch Fund, Inc.)
FINANCIAL STATEMENTS AS OF OCTOBER 31, 2018
TOGETHER WITH INDEPENDENT AUDITORS’ REPORT
DeJoy, Knauf & Blood, LLP
Certified Public Accountants
280 East Broad Street, Suite 300
Rochester, NY 14604
Tel 585-546-1840
REPORT OF INDEPENDENT REGISTERED PUBLIC ACCOUNTING FIRM
To the Board of Directors and
Shareholders of
Bullfinch Fund, Inc. - Unrestricted Series:
Opinion on the Financial Statements
We have audited the accompanying statement of assets and liabilities, including the schedule of investments in securities, of Bullfinch Fund, Inc. - Unrestricted Series (one of the series constituting the Bullfinch Fund, Inc. [the “Company”]) as of October 31, 2018, the related statement of operations for the year then ended, and the statements of changes in net assets for each of the two years in the period then ended, and the related notes (collectively referred to as the “financial statements”), and the financial highlights for each of the three years in the period then ended.
In our opinion, the financial statements present fairly, in all material respects, the financial position of Bullfinch Fund, Inc. - Unrestricted Series as of October 31, 2018, and the results of its operations for the year then ended, the changes in its net assets for each of the two years in the period then ended, and the financial highlights for each of the three years in the period then ended, in conformity with accounting principles generally accepted in the United States of America.
The financial highlights of Bullfinch Fund, Inc. - Unrestricted Series for each of the two years in the period ended October 31, 2015, were audited by other auditors whose report dated December 21, 2015, expressed an unqualified opinion on those statements.
Basis for Opinion
These financial statements and financial highlights are the responsibility of the Company’s management. Our responsibility is to express an opinion on the Company’s financial statements and financial highlights based on our audits. We are a public accounting firm registered with the Public Company Accounting Oversight Board (United States) (“PCAOB”) and are required to be independent with respect to the Company in accordance with the U.S. federal securities laws and the applicable rules and regulations of the Securities and Exchange Commission and the PCAOB.
We conducted our audits in accordance with the standards of the PCAOB. Those standards require that we plan and perform the audit to obtain reasonable assurance about whether the financial statements and financial highlights are free of material misstatement whether due to error or fraud. The Company is not required to have, nor were we engaged to perform, an audit of its internal control over financial reporting. As part of our audits, we are required to obtain an understanding of internal control over financial reporting but not for the purpose of expressing an opinion on the effectiveness of the Company’s internal control over financial reporting. Accordingly, we express no such opinion.
Our audits included performing procedures to assess the risks of material misstatement of the financial statements and financial highlights, whether due to error or fraud, and performing procedures that respond to those risks. Such procedures included examining, on a test basis, evidence regarding the amounts and disclosures in the financial statements and financial highlights. Our procedures included confirmation of securities owned as of October 31, 2018, by correspondence with the custodian. Our audits also included evaluating the accounting principles used and significant estimates made by management, as well as evaluating the overall presentation of the financial statements and financial highlights. We believe that our audits provide a reasonable basis for our opinion.
/s/ DeJoy, Knauf & Blood, LLP
We have served as the auditor of Bullfinch Fund, Inc. - Unrestricted Series since 2016.
Rochester, New York
December 21, 2018
UNRESTRICTED SERIES
(A SERIES WITHIN THE BULLFINCH FUND, INC.)
STATEMENT OF ASSETS AND LIABILITIES
OCTOBER 31, 2018
| ASSETS | | | |
| | | | |
| Investments in Securities, at Fair Value, Identified Cost of $6,557,635 | | $ | 8,781,510 | |
| | | | | |
| Cash & Cash Equivalents | | | 346,341 | |
| | | | | |
| Accrued Interest and Dividends | | | 13,919 | |
| | | | | |
| Prepaid Expenses | | | 8,943 | |
| | | | | |
| Total Assets | | $ | 9,150,713 | |
| | | | | |
| LIABILITIES AND NET ASSETS | | | | |
| | | | | |
| LIABILITIES | | | | |
| | | | | |
| Accrued Expenses | | $ | 12,825 | |
| | | | | |
| Due to Investment Adviser | | | 8,095 | |
| | | | | |
| NET ASSETS | | | | |
| | | | | |
| Net Assets (Equivalent to $19.59 per share based on 465,952.754 shares of stock outstanding) | | | 9,129,793 | |
| | | | | |
| Total Liabilities and Net Assets | | $ | 9,150,713 | |
| | | | | |
| COMPOSITION OF NET ASSETS | | | | |
| | | | | |
| Shares of Common Stock - Par Value $.01; 465,952.754 Shares Outstanding | | $ | 6,877,819 | |
| | | | | |
| Accumulated Net Investment Gain & Realized Gain from Security Transactions | | | 28,099 | |
| | | | | |
| Net Unrealized Appreciation on Investments | | | 2,223,875 | |
| | | | | |
| Net Assets at October 31, 2018 | | $ | 9,129,793 | |
The accompanying notes are an integral part of these financial statements.
UNRESTRICTED SERIES
(A SERIES WITHIN BULLFINCH FUND, INC.)
SCHEDULE OF INVESTMENTS IN SECURITIES OCTOBER 31, 2018
| | | Historical | |
| | | Shares | | | Cost | | | Value | |
| Level 1 - Common Stocks – 79.87% | | | | | | | | | | | | |
| | | | | | | | | | | | | |
| *ASTERISK DENOTES A NON INCOME PRODUCING SECURITY | | | | | | | | | | | | |
| | | | | | | | | | | | | |
| Medical Products and Supplies - 12.73% | | | | | | | | | | | | |
| Bristol-Myers Squibb Co. | | | 5,450 | | | | 266,295 | | | | 275,443 | |
| Celgene Corporation* | | | 1,650 | | | | 141,408 | | | | 118,140 | |
| Edwards Lifesciences* | | | 2,750 | | | | 108,269 | | | | 405,900 | |
| Johnson & Johnson | | | 2,400 | | | | 136,714 | | | | 335,976 | |
| Medtronic Inc. | | | 300 | | | | 22,701 | | | | 26,946 | |
| | | | | | | 675,387 | | | | 1,162,405 | |
| | | | | | | | | | | | | |
| Computers - Software – 9.01% | | | | | | | | | | | | |
| Adobe Systems Inc.* | | | 1,100 | | | | 28,660 | | | | 270,336 | |
| Microsoft Corp. | | | 2,650 | | | | 61,847 | | | | 283,046 | |
| Oracle Corp. | | | 5,500 | | | | 56,122 | | | | 268,620 | |
| | | | | | | | 146,629 | | | | 822,002 | |
| Electrical Equipment - 6.10% | | | | | | | | | | | | |
| Corning Inc. | | | 7,300 | | | | 66,773 | | | | 233,235 | |
| General Electric Co. | | | 32,000 | | | | 617,355 | | | | 323,200 | |
| | | | | | | | 684,128 | | | | 556,435 | |
| Building & Related – 5.37% | | | | | | | | | | | | |
| Meritage Homes Corp.* | | | 5,850 | | | | 246,488 | | | | 217,913 | |
| Toll Brothers Inc. | | | 8,100 | | | | 274,638 | | | | 272,646 | |
| | | | | | | | 521,126 | | | | 490,559 | |
| Computers -Networking - 5.36% | | | | | | | | | | | | |
| Cisco Systems, Inc. | | | 10,700 | | | | 160,238 | | | | 489,525 | |
| | | | | | | | | | | | | |
| Retail – Specialty – 4.97% | | | | | | | | | | | | |
| Fastenal Co. | | | 4,800 | | | | 83,684 | | | | 246,768 | |
| Zumiez Inc.* | | | 8,900 | | | | 193,235 | | | | 207,014 | |
| | | | | | | | 276,919 | | | | 453,782 | |
| Insurance – 4.62% | | | | | | | | | | | | |
| Arthur J Gallagher & Co | | | 5,700 | | | | 138,298 | | | | 421,857 | |
| | | | | | | | | | | | | |
| Telecommunications – 3.79% | | | | | | | | | | | | |
| AT&T Corporation | | | 4,400 | | | | 158,437 | | | | 134,992 | |
| Verizon Communications | | | 3,700 | | | | 180,520 | | | | 211,233 | |
| | | | | | | | 338,957 | | | | 346,225 | |
| Semiconductors - 3.79% | | | | | | | | | | | | |
| Intel Corp. | | | 5,000 | | | | 85,564 | | | | 234,400 | |
| Xperi Corporation | | | 8,550 | | | | 198,390 | | | | 111,150 | |
| | | | | | | | 283,954 | | | | 345,550 | |
| | | Historical | |
| | | Shares | | | Cost | | | Value | |
| Level 1 - Common Stocks – 79.87% | | | | | | | | | | | | |
| | | | | | | | | | | | | |
| Commercial Services - 3.41% | | | | | | | | | | | | |
| Paychex, Inc. | | | 4,750 | | | | 130,496 | | | | 311,078 | |
| | | | | | | | | | | | | |
| Utilities – Natural Resources – 3.17% | | | | | | | | | | | | |
| Consolidated Water Co. | | | 23,500 | | | | 276,520 | | | | 289,050 | |
| | | | | | | | | | | | | |
| Oil & Related – 2.83% | | | | | | | | | | | | |
| Total SA ADR | | | 4,400 | | | | 227,558 | | | | 257,840 | |
| | | | | | | | | | | | | |
| Biotech – 2.45% | | | | | | | | | | | | |
| Meridian Bioscience Inc. | | | 13,800 | | | | 249,015 | | | | 223,698 | |
| | | | | | | | | | | | | |
| Tobacco Products – 2.38% | | | | | | | | | | | | |
| Universal Corp. VA | | | 3,200 | | | | 120,756 | | | | 217,152 | |
| | | | | | | | | | | | | |
| Consumer – Electronics – 2.36% | | | | | | | | | | | | |
| Canon Inc. | | | 7,650 | | | | 260,879 | | | | 215,577 | |
| | | | | | | | | | | | | |
| Pharmaceuticals -2.31% | | | | | | | | | | | | |
| Mylan Inc.* | | | 6,750 | | | | 381,117 | | | | 210,937 | |
| | | | | | | | | | | | | |
| Aerospace – 2.29% | | | | | | | | | | | | |
| AAR Corporation | | | 4,400 | | | | 83,191 | | | | 209,352 | |
| | | | | | | | | | | | | |
| Electronics Components – 1.53% | | | | | | | | | | | | |
| TE Connectivity Ltd. | | | 1,850 | | | | 50,371 | | | | 139,527 | |
| | | | | | | | | | | | | |
| Industrial Services – 1.40% | | | | | | | | | | | | |
| Expeditors Int’l Washington | | | 1,900 | | | | 61,567 | | | | 127,642 | |
| | | | | | | | | | | | | |
| Total Investments in Common Stocks | | | | | | | 5,067,106 | | | | 7,290,193 | |
| | | | | | | | | | | | | |
| Level 1 – Cash & Equivalents – 3.79% | | | | | | | | | | | | |
| | | | | | | | | | | | | |
| Schwab Bank - 3.79% | | | | | | | 346,341 | | | | 346,341 | |
| Sweep Shares 7 day Yield .30% | | | | | | | | | | | | |
| | | | | | | | | | | | | |
| Level 2 – Short Term Instruments – 16.34% | | | | | | | | | | | | |
| | | | | | | | | | | | | |
| US Treasury Bill – 16.34% | | | | | | | 1,490,529 | | | | 1,491,317 | |
| Due 01/31/19 0.00% | | | | | | | | | | | | |
| | | | | | | | | | | | | |
| Total Invested Assets | | | | | | $ | 6,903,976 | | | $ | 9,127,851 | |
The accompanying notes are an integral part of these financial statements.
UNRESTRICTED SERIES
(A SERIES WITHIN BULLFINCH FUND, INC.)
SCHEDULE OF INVESTMENTS IN SECURITIES OCTOBER 31, 2018
Table of Industries
| Industry | | Market Value | | | Percent | |
| | | | | | | |
| Aerospace | | $ | 209,352 | | | | 2.29 | % |
| Biotech | | $ | 223,698 | | | | 2.45 | % |
| Building & Related | | $ | 490,559 | | | | 5.37 | % |
| Commercial Services | | $ | 311,078 | | | | 3.41 | % |
| Computers – Networking | | $ | 489,525 | | | | 5.36 | % |
| Computers – Software | | $ | 822,002 | | | | 9.01 | % |
| Consumer – Electronics | | $ | 215,577 | | | | 2.36 | % |
| Electrical Equipment | | $ | 556,435 | | | | 6.10 | % |
| Electronics Components | | $ | 139,527 | | | | 1.53 | % |
| Industrial Services | | $ | 127,642 | | | | 1.40 | % |
| Insurance | | $ | 421,857 | | | | 4.62 | % |
| Medical Products & Supplies | | $ | 1,162,405 | | | | 12.73 | % |
| Oil & Related | | $ | 257,840 | | | | 2.83 | % |
| Pharmaceuticals | | $ | 210,937 | | | | 2.31 | % |
| Retail – Specialty | | $ | 453,782 | | | | 4.97 | % |
| Semiconductors | | $ | 345,550 | | | | 3.79 | % |
| Telecommunications | | $ | 346,225 | | | | 3.79 | % |
| Tobacco Products | | $ | 217,152 | | | | 2.38 | % |
| Utilities – Natural Resources | | $ | 289,050 | | | | 3.17 | % |
| Total Equities | | $ | 7,290,193 | | | | 79.87 | % |
| | | | | | | | | |
| Cash & Equivalents (7 day yield .30%) | | $ | 346,341 | | | | 3.79 | % |
| | | | | | | | | |
| US Treasury Bill (Due 01/31/19 0.00%) | | $ | 1,491,317 | | | | 16.34 | % |
| | | | | | | | | |
| Total Invested Assets | | $ | 9,127,851 | | | | 100.00 | % |
The accompanying notes are an integral part of these financial statements.
UNRESTRICTED SERIES (A SERIES WITHIN BULLFINCH FUND, INC.)
STATEMENT OF OPERATIONS FOR THE YEAR ENDED OCTOBER 31, 2018
| INVESTMENT INCOME: | | | |
| Dividend and Interest Income | | $ | 189,475 | |
| EXPENSES: | | | | |
| Adviser Fees | | | 96,734 | |
| Legal and Professional | | | 18,180 | |
| D&O/E&O | | | 8,443 | |
| Foreign Taxes | | | 5,071 | |
| Custodian Fees | | | 4,387 | |
| Registration Fees | | | 2,400 | |
| Dues & Subscriptions | | | 2,148 | |
| Director’s Fees | | | 1,400 | |
| Fidelity Bond | | | 939 | |
| State Income Taxes | | | 150 | |
| Telephone | | | 118 | |
| Total expense | | | 139,970 | |
| Net investment income | | | 49,505 | |
| | | | | |
| REALIZED AND UNREALIZED GAIN (LOSS) ON INVESTMENTS: | | | | |
| Realized gain from securities transactions | | | 398,573 | |
| Unrealized depreciation during the period | | | (410,156 | ) |
| Net loss on investments | | | (11,583 | ) |
| CHANGE IN NET ASSETS FROM OPERATIONS | | $ | 37,922 | |
UNRESTRICTED SERIES (A SERIES WITHIN BULLFINCH FUND, INC.)
STATEMENTS OF CHANGES IN NET ASSETS
FOR THE YEARS ENDED OCTOBER 31, 2018 AND 2017
| | | October 2018 | | | October 2017 | |
| CHANGE IN NET ASSETS FROM OPERATIONS: | | | | | | | | |
| Net investment income | | $ | 49,505 | | | $ | 20,737 | |
| Net realized gain from security transactions | | | 398,573 | | | | 557,090 | |
| Net change in unrealized appreciation (depreciation) of investments | | | (410,156 | ) | | | 348,458 | |
| Increase in net assets from operations | | | 37,922 | | | | 926,285 | |
| | | | | | | | | |
| DISTRIBUTIONS TO SHAREHOLDERS: | | | | | | | | |
| Distribution of capital gains | | | (557,069 | ) | | | (676,498 | ) |
| Distribution of ordinary income | | | (20,713 | ) | | | (13,862 | ) |
| Decrease in net assets from distributions to shareholders | | | (577,782 | ) | | | (690,360 | ) |
| | | | | | | | | |
| CAPITAL SHARE TRANSACTIONS: | | | | | | | | |
| Shares Sold | | | 468,409 | | | | 163,697 | |
| Reinvestment of distributions to shareholders | | | 577,782 | | | | 690,360 | |
| Shares Redeemed | | | (234,477 | ) | | | (810,180 | ) |
| Increase in net assets from capital share transactions | | | 811,714 | | | | 43,877 | |
| TOTAL INCREASE IN NET ASSETS | | | 271,854 | | | | 279,802 | |
| | | | | | | | | |
| NET ASSETS: | | | | | | | | |
| Beginning of year | | | 8,857,939 | | | | 8,578,137 | |
| End of year | | $ | 9,129,793 | | | $ | 8,857,939 | |
The accompanying notes are an integral part of these financial statements.
UNRESTRICTED SERIES (A SERIES WITHIN BULLFINCH FUND, INC.)
FINANCIAL HIGHLIGHTS (PER SHARE DATA FOR A SHARE OUTSTANDING)
FOR THE YEARS ENDED OCTOBER 31, 2018, 2017, 2016, 2015 AND 2014
| | | October 2018 | | | October 2017 | | | October 2016 | | | October 2015 | | | October 2014 | |
| NET ASSET VALUE, beginning of year | | $ | 20.78 | | | $ | 20.29 | | | $ | 20.75 | | | $ | 20.42 | | | $ | 18.46 | |
| | | | | | | | | | | | | | | | | | | | | |
INCOME FROM INVESTMENT OPERATIONS | | | | | | | | | | | | | | | | | | | | |
| Net investment income (loss) | | | 0.11 | | | | 0.05 | | | | 0.03 | | | | 0.04 | | | | (0.01 | ) |
| Net gain (loss) on securities both realized and unrealized | | | 0.02 | | | | 2.07 | | | | 1.47 | | | | 1.34 | | | | 2.74 | |
| | | | | | | | | | | | | | | | | | | | | |
| Total from investment operations | | | 0.13 | | | | 2.12 | | | | 1.50 | | | | 1.38 | | | | 2.73 | |
| | | | | | | | | | | | | | | | | | | | | |
DISTRIBUTIONS TO SHAREHOLDERS FROM: | | | | | | | | | | | | | | | | | | | | |
| Distribution of capital gains | | | (1.27 | ) | | | (1.60 | ) | | | (1.92 | ) | | | (1.05 | ) | | | (0.72 | ) |
| Distribution of ordinary income | | | (0.05 | ) | | | 0.03 | | | | (0.04 | ) | | | 0.00 | | | | (0.05 | ) |
| Total stock dividend distributions | | | (1.32 | ) | | | (1.63 | ) | | | (1.96 | ) | | | (1.05 | ) | | | (0.77 | ) |
| NET ASSET VALUE, end of year | | $ | 19.59 | | | $ | 20.78 | | | $ | 20.29 | | | $ | 20.75 | | | $ | 20.42 | |
| | | | | | | | | | | | | | | | | | | | | |
| NET ASSETS, end of year | | $ | 9,129,793 | | | $ | 8,857,939 | | | $ | 8,578,137 | | | $ | 7,632,798 | | | $ | 7,127,458 | |
UNRESTRICTED SERIES (A SERIES WITHIN BULLFINCH FUND, INC.)
FINANCIAL HIGHLIGHTS (RATIOS AND SUPPLEMENTAL DATA)
FOR THE YEARS ENDED OCTOBER 31, 2018, 2017, 2016, 2015 AND 2014
| | | October | | | October | | | October | | | October | | | October | |
| | | 2018 | | | 2017 | | | 2016 | | | 2015 | | | 2014 | |
| RATIO OF EXPENSES TO AVERAGE NET ASSETS* | | | 1.49 | % | | | 1.51 | % | | | 1.50 | % | | | 1.48 | % | | | 1.51 | % |
| | | | | | | | | | | | | | | | | | | | | |
| RATIO OF NET INVESTMENT INCOME TO AVERAGE NET ASSETS* | | | (0.53 | )% | | | 0.24 | % | | | 0.17 | % | | | 0.19 | % | | | (0.05 | )% |
| | | | | | | | | | | | | | | | | | | | | |
| PORTFOLIO TURNOVER RATE* | | | 11.41 | % | | | 10.72 | % | | | 1.95 | % | | | 10.55 | % | | | 11.74 | % |
| | | | | | | | | | | | | | | | | | | | | |
| TOTAL RETURN | | | 0.45 | % | | | 10.92 | % | | | 7.62 | % | | | 6.83 | % | | | 15.02 | % |
| * | Per share amounts calculated using the average shares method |
The accompanying notes are an integral part of these financial highlights.
UNRESTRICTED SERIES (A SERIES WITHIN BULLFINCH FUND, INC.)
NOTES TO FINANCIAL STATEMENTS OCTOBER 31, 2018
NOTE A - SCOPE OF BUSINESS
The Unrestricted Series (the “Series”) is a series within the Bullfinch Fund, Inc. (the “Fund”), which was organized as a Maryland corporation registered under the Investment Company Act of 1940 as an open-ended non-diversified management investment company. The Fund offers two series of common stock. In addition to the Unrestricted Series, the Fund also offers the Greater Western New York Series.
The investment objective of the Series is to seek conservative long-term growth in capital. The Adviser seeks to achieve this objective by using an asset mix consisting primarily of exchange listed securities and over-the-counter common stocks as well as U.S. Government securities maturing within five years.
NOTE B - SUMMARY OF SIGNIFICANT ACCOUNTING POLICIES
The following is a summary of significant accounting policies followed by the Series in the preparation of its financial statements. These policies are in conformity with accounting principles generally accepted in the United States (“GAAP”). The Series follows the investment company accounting and reporting guidance of the Financial Accounting Standard Board Accounting Standard Codification 946, Financial Services – Investment Companies.
Fair Value Measurements – ASC 820-10 establishes a fair value hierarchy which requires an entity to maximize the use of observable inputs and minimize the use of unobservable inputs when measuring fair value. The standard describes three levels of inputs that may be used to measure fair value:
Level 1: Quoted prices (unadjusted) for identical assets or liabilities in active markets that the entity has the ability to access as of the measurement date.
Level 2: Significant other observable inputs other than Level 1 prices such as quoted prices for similar assets or liabilities; quoted prices in markets that are not active; or other inputs that are observable or can be corroborated by observable market data.
Level 3: Significant unobservable inputs that reflect a reporting entity’s own assumptions about the assumptions that market participants would use in pricing an asset or liability.
The following is a description of the valuation methodologies used for assets measured at fair value:
Cash & Equivalents- Cash consists of amounts deposited in a bank sweep account and is federally insured. The Series has not experienced any losses on such amounts and believes it is not exposed to any significant credit risk on cash.
Security Valuation - The Series records its investments at fair value and is in compliance with FASB ASC 820-10-50. Securities traded on national securities exchanges or the NASDAQ National Market System are valued daily at the closing prices of the securities on those exchanges and securities traded on over-the-counter markets are valued daily at the closing bid prices. Short-term and money market securities are valued at amortized cost, which approximates market value. The treasury bill is valued based on the rates currently offered for treasury bills of similar maturities.
ASSETS AT FAIR VALUE AS OF:
| | | 10/31/18 | |
| | | LEVEL 1 | | | LEVEL 2 | |
| COMMON STOCKS | | $ | 7,290,193 | | | $ | - | |
| CASH & EQUIVALENTS | | $ | 346,341 | | | $ | - | |
| TREASURY BILL | | $ | - | | | $ | 1,491,317 | |
| TOTALS BY LEVEL | | $ | 7,636,534 | | | $ | 1,491,317 | |
In cases where market prices are unreliable or not readily available, for example, when trading on securities are halted as permitted by the SEC or when there is no trading volume on an Over-the-Counter security held by the Fund, the Fund relies on fair value pricing provided by the Adviser. In performing its fair value pricing, the Adviser acts under the ultimate supervision of, and follows, the policies of the Board of Directors. The Board of Directors retains the right to determine its own fair value price should it have reason to believe the price provided by the Adviser does not reflect fair value. Valuing securities at fair value involves greater reliance on judgment than securities that have readily available market quotations. There can be no assurance the Fund could obtain the fair value assigned to a security if they were to sell the security at approximately the time at which the Fund determines their net asset value per share.
Series Allocations - Common expenses of the Fund are evenly split between the two series of the Fund unless the Board of Directors approves an alternative allocation of expenses based on management’s estimate.
Income Taxes - It is the policy of the Fund to comply with the requirements of Subchapter M of the Internal Revenue Code (the “Code”) applicable to regulated investment companies and to distribute all of its taxable income to its shareholders. In addition, the Fund intends to distribute an amount sufficient to avoid imposition of any excise tax under Section 4982 of the Code. Therefore, no provision for federal income taxes or excise taxes has been made.
Management has reviewed all open tax years and major tax jurisdictions and concluded that no liability for unrecognized tax benefits should be recorded related to uncertain tax positions taken on returns filed or expected to be taken on a tax return. The tax returns of the Series for the prior three years are open for examination.
Distributions to Shareholders - Distributions to shareholders are recorded on the ex-dividend date. The Series made a distribution of its ordinary income of $13,862 to its shareholders on December 29, 2016, in the form of stock dividends equal to 707.261 shares of stock. The Series made a distribution of its capital gains of $676,498 to its shareholders on December 29, 2016, in the form of stock dividends equal to 34,515.213 shares of stock. The Series made a distribution of its ordinary income of $20,713 to its shareholders on December 22, 2017, in the form of stock dividends equal to 1,031.033 shares of stock. The Series made a distribution of its short term capital gains of $77,237 to its shareholders on December 22, 2017, in the form of stock dividends equal to 3,844.526 shares of stock. The Series made a distribution of its capital gains of $479,832 to its shareholders on December 22, 2017, in the form of stock dividends equal to 23,884.119 shares of stock.
Other - The Series follows industry practice and records security transactions on the trade date. The specific identification method is used for determining gains and losses for financial statement and income tax purposes. Dividend income is recorded on the ex-dividend date.
Use of Estimates - The preparation of financial statements in conformity with generally accepted accounting principles requires management to make estimates and assumptions that affect the amounts reported in the financial statements and accompanying notes. Actual results can differ from those estimates.
Subsequent Events - In accordance with GAAP, the Fund has evaluated the need for disclosures and/or adjustments resulting from subsequent events through December 21, 2018, the date of issuance of these financial statements.
NOTE C – INVESTMENTS
For the year ended October 31, 2018, the Series purchased $2,025,769 of common stock. During the same period, the Series sold $1,073,859 of common stock.
At October 31, 2018, the gross unrealized appreciation for all securities totaled $2,923,349 and the gross unrealized depreciation for all securities totaled $699,474 or a net unrealized appreciation of $2,223,875. The aggregate cost of securities for federal income tax purposes at October 31, 2018 was $6,557,635.
NOTE D – RELATED PARTY TRANSACTIONS
Carosa Stanton Asset Management, LLC serves as investment adviser to the Fund pursuant to an investment adviser agreement which was approved by the Fund’s board of directors. Carosa Stanton Asset Management, LLC is a Registered Investment Adviser under the Investment Advisers Act of 1940. The Investment adviser agreement provides that Carosa Stanton Asset Management, LLC, subject to the supervision and approval of the Fund’s board of directors, is responsible for the day-to-day management of the Fund’s portfolio, which includes selecting investments and handling its business affairs.
As compensation for its services to the Fund, the investment adviser receives monthly compensation at an annual rate of 1.25% on the first $1 million of daily average net assets and 1% on that portion of the daily average net assets in excess of $1 million. These fees are reduced by any sub-transfer agent fees incurred by the Fund.
Carosa Stanton Asset Management, LLC has agreed as part of its contract to forego sufficient investment adviser fees to limit total expenses of the Fund to 2% of the first $10 million in average assets and 1.5% of the next $20 million in average assets.
During the year ended October 31, 2018, the Fund paid investment adviser fees of $96,734.
As of October 31, 2018, the Fund had $8,095 included in liabilities, as owed to Carosa Stanton Asset Management, LLC.
Certain officers of the Fund are also officers of Carosa Stanton Asset Management.
NOTE E – REMUNERATION OF DIRECTORS
The Directors are paid a fee of $50 per meeting. They may be reimbursed for travel expenses.
NOTE F – COMMITMENTS AND CONTINGENCIES
The Series indemnifies the Fund’s officers and the Board of Directors for certain liabilities that might arise from their performance of their duties to the Series. Additionally, in the normal course of business the Fund enters into contracts that contain a variety of representations and warranties and which provide for general indemnifications. The Fund’s maximum exposure under these arrangements is unknown, as this would involve future claims that may be made against the Fund that have not yet occurred. However, based on its experience, the Fund expects the risk of loss to be remote.
NOTE G - CAPITAL SHARE TRANSACTIONS
The Fund has authorized 10,000,000 shares of common stock at $0.01 par value per share. These shares are issued under either of the two series of the Fund. Each share has equal dividend, distribution and liquidation rights. Transactions in capital stock of the Series were as follows:
| | | Shares | | | Amount | |
| | | | | | | |
| Balance at October 31, 2016 | | | 422,842.695 | | | $ | 6,022,228 | |
| | | | | | | | | |
| Shares sold during 2017 | | | 8,172.333 | | | | 163,697 | |
| Shares redeemed during 2017 | | | (39,940.187 | ) | | | (810,180 | ) |
| Reinvestment of Distributions, December 29, 2016 | | | 35,222.474 | | | | 690,360 | |
| Balance at October 31, 2017 | | | 426,297.315 | | | $ | 6,066,105 | |
| | | | | | | | | |
| Shares sold during 2018 | | | 22,710.751 | | | | 468,409 | |
| Shares redeemed during 2018 | | | (11,814.990 | ) | | | (234,477 | ) |
| Reinvestment of Distributions, December 22, 2017 | | | 28,759.678 | | | | 577,782 | |
| Balance at October 31, 2018 | | | 465,952.754 | | | $ | 6,877,819 | |
GREATER WESTERN NEW YORK SERIES (A Series Within Bullfinch Fund, Inc.)
FINANCIAL STATEMENTS AS OF OCTOBER 31, 2018
TOGETHER WITH INDEPENDENT AUDITORS’ REPORT
DeJoy, Knauf & Blood, LLP
Certified Public Accountants
280 East Broad Street, Suite 300
Rochester, NY 14604
Tel 585-546-1840
REPORT OF INDEPENDENT REGISTERED PUBLIC ACCOUNTING FIRM
To the Board of Directors and
Shareholders of
Bullfinch Fund, Inc. - Greater Western New York Series:
Opinion on the Financial Statements
We have audited the accompanying statement of assets and liabilities, including the schedule of investments in securities, of Bullfinch Fund, Inc. - Greater Western New York Series (one of the series constituting the Bullfinch Fund, Inc. [the “Company”]) as of October 31, 2018, the related statement of operations for the year then ended, and the statements of changes in net assets for each of the two years in the period then ended, and the related notes (collectively referred to as the “financial statements”), and the financial highlights for each of the three years in the period then ended.
In our opinion, the financial statements present fairly, in all material respects, the financial position of Bullfinch Fund, Inc. - Greater Western New York Series as of October 31, 2018, and the results of its operations for the year then ended, the changes in its net assets for each of the two years in the period then ended, and the financial highlights for each of the three years in the period then ended, in conformity with accounting principles generally accepted in the United States of America.
The financial highlights of Bullfinch Fund, Inc. - Greater Western New York Series for each of the two years in the period ended October 31, 2015, were audited by other auditors whose report dated December 21, 2015, expressed an unqualified opinion on those statements.
Basis for Opinion
These financial statements and financial highlights are the responsibility of the Company’s management. Our responsibility is to express an opinion on the Company’s financial statements and financial highlights based on our audits. We are a public accounting firm registered with the Public Company Accounting Oversight Board (United States) (“PCAOB”) and are required to be independent with respect to the Company in accordance with the U.S. federal securities laws and the applicable rules and regulations of the Securities and Exchange Commission and the PCAOB.
We conducted our audits in accordance with the standards of the PCAOB. Those standards require that we plan and perform the audit to obtain reasonable assurance about whether the financial statements and financial highlights are free of material misstatement whether due to error or fraud. The Company is not required to have, nor were we engaged to perform, an audit of its internal control over financial reporting. As part of our audits, we are required to obtain an understanding of internal control over financial reporting but not for the purpose of expressing an opinion on the effectiveness of the Company’s internal control over financial reporting. Accordingly, we express no such opinion.
Our audits included performing procedures to assess the risks of material misstatement of the financial statements and financial highlights, whether due to error or fraud, and performing procedures that respond to those risks. Such procedures included examining, on a test basis, evidence regarding the amounts and disclosures in the financial statements and financial highlights. Our procedures included confirmation of securities owned as of October 31, 2018, by correspondence with the custodian. Our audits also included evaluating the accounting principles used and significant estimates made by management, as well as evaluating the overall presentation of the financial statements and financial highlights. We believe that our audits provide a reasonable basis for our opinion.
/s/ DeJoy, Knauf & Blood, LLP
We have served as the auditor of Bullfinch Fund, Inc. - Greater Western New York Series since 2016.
Rochester, New York
December 21, 2018.
GREATER WESTERN NEW YORK SERIES
(A SERIES WITHIN BULLFINCH FUND, INC.)
STATEMENT OF ASSETS AND LIABILITIES
OCTOBER 31, 2018
| ASSETS | | | | |
| | | | | |
| Investments in Securities, at Fair Value, Identified Cost of $834,331 | | $ | 1,650,188 | |
| Cash and Cash Equivalents | | | 200,361 | |
| Accrued Interest and Dividends | | | 2,607 | |
| Prepaid Expenses | | | 1,238 | |
| Total Assets | | $ | 1,854,394 | |
| | | | | |
| LIABILITIES AND NET ASSETS | | | | |
| | | | | |
| LIABILITIES | | | | |
| | | | | |
| Accrued Expenses | | $ | 1,425 | |
| | | | | |
| Due to Investment Adviser | | | 1,859 | |
| | | | | |
| NET ASSETS | | | | |
| | | | | |
| Net Assets (Equivalent to $20.80 per share based on 89,009.347 shares of stock outstanding) | | | 1,851,110 | |
| | | | | |
| Total Liabilities and Net Assets | | $ | 1,854,394 | |
| | | | | |
| COMPOSITION OF NET ASSETS | | | | |
| | | | | |
| Shares of Common Stock - Par Value $.01; 89,009.347 Shares Outstanding | | $ | 1,205,961 | |
| Accumulated Net Investment Loss & Realized Loss from Security Transactions | | | (170,708 | ) |
| Net Unrealized Appreciation on Investments | | | 815,857 | |
| Net Assets at October 31, 2018 | | $ | 1,851,110 | |
The accompanying notes are an integral part of these financial statements.
GREATER WESTERN NEW YORK SERIES (A SERIES WITHIN BULLFINCH FUND, INC.)
SCHEDULE OF INVESTMENTS IN SECURITIES OCTOBER 31, 2018
| | | Historical | |
| | | Shares | | | Cost | | | Value | |
| Level 1 Common Stocks – 89.17% | | | | | | | | | | | | |
| | | | | | | | | | | | | |
| *ASTERISK DENOTES A NON INCOME PRODUCING SECURITY | | | | | | | | | | | | |
| Electrical Equipment - 13.85% | | | | | | | | | | | | |
| Corning, Inc. | | | 2,200 | | | | 26,502 | | | | 70,290 | |
| General Electric Co. | | | 6,750 | | | | 133,100 | | | | 68,175 | |
| Ultralife Corp.* | | | 17,400 | | | | 65,037 | | | | 117,798 | |
| | | | | | | | 224,639 | | | | 256,263 | |
| Medical Products & Supplies – 9.59% | | | | | | | | | | | | |
| Bristol-Myers Squibb Co. | | | 1,150 | | | | 29,276 | | | | 58,121 | |
| Integer Holdings Corp* | | | 850 | | | | 17,417 | | | | 63,299 | |
| Johnson & Johnson | | | 400 | | | | 22,617 | | | | 55,996 | |
| | | | | | | | 69,310 | | | | 177,416 | |
| Aerospace - 9.31% | | | | | | | | | | | | |
| Harris Corporation | | | 500 | | | | 24,989 | | | | 74,355 | |
| Moog, Inc. Class A | | | 637 | | | | 15,976 | | | | 45,577 | |
| Northrop Grumman | | | 200 | | | | 2,294 | | | | 52,390 | |
| | | | | | | | 43,259 | | | | 172,322 | |
| Banking & Finance – 6.98% | | | | | | | | | | | | |
| Community Bank System | | | 1,200 | | | | 23,452 | | | | 70,068 | |
| M&T Bank Corp. | | | 300 | | | | 29,839 | | | | 49,623 | |
| Manning & Napier Inc. | | | 4,800 | | | | 31,165 | | | | 9,408 | |
| | | | | | | | 84,456 | | | | 129,099 | |
| Electronics Components – 5.62% | | | | | | | | | | | | |
| Astronics Corp. Class A* | | | 1,714 | | | | 3,025 | | | | 49,980 | |
| IEC Electronics Corp.* | | | 4,518 | | | | 6,983 | | | | 23,855 | |
| TE Connectivity Ltd. | | | 400 | | | | 10,904 | | | | 30,168 | |
| | | | | | | | 20,912 | | | | 104,003 | |
| Foods & Beverages – 4.31% | | | | | | | | | | | | |
| Constellation Brands, Inc. | | | 400 | | | | 2,509 | | | | 79,692 | |
| | | | | | | | | | | | | |
| Automotive - 4.22% | | | | | | | | | | | | |
| Monro Inc. | | | 1,050 | | | | 12,443 | | | | 78,120 | |
| | | | | | | | | | | | | |
| Telecommunications - 3.91% | | | | | | | | | | | | |
| AT&T Corporation | | | 950 | | | | 33,705 | | | | 29,146 | |
| Frontier Communications* | | | 693 | | | | 42,105 | | | | 3,333 | |
| Verizon Communications | | | 700 | | | | 34,210 | | | | 39,963 | |
| | | | | | | | 110,020 | | | | 72,442 | |
| | | | | | | | | | | | | |
| Railroads - 3.85% | | | | | | | | | | | | |
| Genesee & Wyoming Class A* | | | 900 | | | | 2,522 | | | | 71,307 | |
| | | | | | | | | | | | | |
| Steel – 3.85% | | | | | | | | | | | | |
| Gilbraltar Industries Inc.* | | | 2,000 | | | | 25,111 | | | | 71,280 | |
| | | Historical | |
| | | Shares | | | Cost | | | Value | |
| | | | | | | | | | |
| Level 1 Common Stocks – 89.17% | | | | | | | | | | | | |
| | | | | | | | | | | | | |
| Utilities - Natural Resources - 3.67% | | | | | | | | | | | | |
| National Fuel Gas Co. | | | 1,250 | | | | 50,833 | | | | 67,863 | |
| | | | | | | | | | | | | |
| Commercial Services - 3.45% | | | | | | | | | | | | |
| Paychex, Inc. | | | 975 | | | | 25,852 | | | | 63,853 | |
| | | | | | | | | | | | | |
| Real Estate & Related - 3.05% | | | | | | | | | | | | |
| Life Storage Inc. | | | 600 | | | | 21,796 | | | | 56,496 | |
| | | | | | | | | | | | | |
| Airlines - 2.79% | | | | | | | | | | | | |
| Southwest Airlines Co. | | | 1,050 | | | | 19,813 | | | | 51,555 | |
| | | | | | | | | | | | | |
| Computers - Software – 2.38% | | | | | | | | | | | | |
| Oracle Corp. | | | 900 | | | | 12,070 | | | | 43,956 | |
| | | | | | | | | | | | | |
| Retail - Specialty – 2.22% | | | | | | | | | | | | |
| Fastenal Co. | | | 800 | | | | 13,954 | | | | 41,128 | |
| | | | | | | | | | | | | |
| Metal Fabrication & Hardware – 1.86% | | | | | | | | | | | | |
| Graham Corp. | | | 1,400 | | | | 15,140 | | | | 34,454 | |
| | | | | | | | | | | | | |
| Computers - Services – 1.53% | | | | | | | | | | | | |
| Computer Task Group, Inc.* | | | 6,000 | | | | 33,877 | | | | 28,380 | |
| | | | | | | | | | | | | |
| Environmental Services – 1.40% | | | | | | | | | | | | |
| Ecology & Environment Inc. | | | 2,000 | | | | 25,398 | | | | 25,900 | |
| | | | | | | | | | | | | |
| Instruments – 0.55% | | | | | | | | | | | | |
| Taylor Devices* | | | 877 | | | | 4,394 | | | | 10,261 | |
| | | | | | | | | | | | | |
| Office Equipment – 0.53% | | | | | | | | | | | | |
| Xerox Corp. | | | 350 | | | | 12,742 | | | | 9,755 | |
| | | | | | | | | | | | | |
| Machinery – 0.20% | | | | | | | | | | | | |
| Columbus McKinnon Corp. | | | 100 | | | | 2,344 | | | | 3,673 | |
| | | | | | | | | | | | | |
| Industrial Materials - 0.05% | | | | | | | | | | | | |
| Servotronics, Inc. | | | 100 | | | | 937 | | | | 970 | |
| | | | | | | | | | | | | |
| Total Investments in Securities | | | | | | | 834,331 | | | | 1,650,188 | |
| | | | | | | | | | | | | |
| Level 1 – Cash & Equivalents – 10.83% | | | | | | | | | | |
| | | | | | | | | | | |
| Schwab Gov’t Money Fund – 10.83% | | | | | | | 200,361 | | | | 200,361 | |
| Sweep Shares 7 day Yield .30% | | | | | | | | | | | | |
| | | | | | | | | | | | | |
| Total Invested Assets | | | | | | $ | 1,034,692 | | | $ | 1,850,549 | |
The accompanying notes are an integral part of these financial statements.
GREATER WESTERN NEW YORK SERIES (A SERIES WITHIN BULLFINCH FUND, INC.)
SCHEDULE OF INVESTMENTS IN SECURITIES OCTOBER 31, 2018
Table of Industries
| Industry | | Market Value | | | Percent | |
| Aerospace | | $ | 172,322 | | | | 9.31 | % |
| Airlines | | $ | 51,555 | | | | 2.79 | % |
| Automotive | | $ | 78,120 | | | | 4.22 | % |
| Banking & Finance | | $ | 129,099 | | | | 6.98 | % |
| Commercial Services | | $ | 63,853 | | | | 3.45 | % |
| Computers – Services | | $ | 28,380 | | | | 1.53 | % |
| Computers – Software | | $ | 43,956 | | | | 2.38 | % |
| Electrical Equipment | | $ | 256,263 | | | | 13.85 | % |
| Electronics Components | | $ | 104,003 | | | | 5.62 | % |
| Environmental Services | | $ | 25,900 | | | | 1.40 | % |
| Foods & Beverages | | $ | 79,692 | | | | 4.31 | % |
| Industrial Materials | | $ | 970 | | | | 0.05 | % |
| Instruments | | $ | 10,261 | | | | 0.55 | % |
| Machinery | | $ | 3,673 | | | | 0.20 | % |
| Medical Products & Supplies | | $ | 177,416 | | | | 9.59 | % |
| Metal Fabrication & Hardware | | $ | 34,454 | | | | 1.86 | % |
| Office Equipment | | $ | 9,755 | | | | 0.53 | % |
| Railroads | | $ | 71,307 | | | | 3.85 | % |
| Real Estate & Related | | $ | 56,496 | | | | 3.05 | % |
| Retail – Specialty | | $ | 41,128 | | | | 2.22 | % |
| Steel | | $ | 71,280 | | | | 3.85 | % |
| Telecommunications | | $ | 72,442 | | | | 3.91 | % |
| Utilities – Natural Resources | | $ | 67,863 | | | | 3.67 | % |
| Total Equities | | $ | 1,650,188 | | | | 89.17 | % |
| | | | | | | | | |
| Cash & Equivalents (7 day yield .30%) | | $ | 200,361 | | | | 10.83 | % |
| | | | | | | | | |
| Total Invested Assets | | $ | 1,850,549 | | | | 100.00 | % |
The accompanying notes are an integral part of these financial statements.
GREATER WESTERN NEW YORK SERIES (A SERIES WITHIN BULLFINCH FUND, INC.)
STATEMENT OF OPERATIONS FOR THE YEAR ENDED OCTOBER 31, 2018
| INVESTMENT INCOME: | | | |
| Dividend and Interest Income | | $ | 30,092 | |
| EXPENSES: | | | | |
| Adviser Fees | | | 22,234 | |
| Legal and Professional | | | 2,125 | |
| Registration Fees | | | 1,910 | |
| Custodian Fees | | | 1,438 | |
| Director’s Fees | | | 1,400 | |
| Dues and Subscriptions | | | 1,348 | |
| D&O/E&O | | | 938 | |
| State Taxes | | | 150 | |
| Telephone | | | 118 | |
| Fidelity Bond | | | 104 | |
| Total expense | | | 31,765 | |
| Net investment loss | | | (1,673 | ) |
| REALIZED AND UNREALIZED LOSS ON INVESTMENTS: | | | | |
| Realized loss from securities transactions | | | (29,429 | ) |
| Unrealized depreciation during the period | | | (10,154 | ) |
| Net loss on investments | | | (39,583 | ) |
| CHANGE IN NET ASSETS FROM OPERATIONS | | $ | (41,256 | ) |
GREATER WESTERN NEW YORK SERIES (A SERIES WITHIN BULLFINCH FUND, INC.)
STATEMENTS OF CHANGES IN NET ASSETS
FOR THE YEARS ENDED OCTOBER 31, 2018 AND 2017
| | | October 2018 | | | October 2017 | |
| CHANGE IN NET ASSETS FROM OPERATIONS: | | | | | | | | |
| Net investment loss | | $ | (1,673 | ) | | $ | (40 | ) |
| Net realized gain (loss) from security transactions | | | (29,429 | ) | | | 81,817 | |
| Net change in unrealized appreciation (depreciation) of investments | | | (10,154 | ) | | | 109,870 | |
| Change in net assets from operations | | | (41,256 | ) | | | 191,647 | |
| | | | | | | | | |
| DISTRIBUTIONS TO SHAREHOLDERS: | | | | | | | | |
| | | | | | | | | |
| Distribution of capital gains | | | (81,808 | ) | | | (28,776 | ) |
| Distribution of ordinary income | | | (5,159 | ) | | | 0 | |
| Decrease in net assets from distributions to shareholders | | | (86,967 | ) | | | (28,776 | ) |
| | | | | | | | | |
| CAPITAL SHARE TRANSACTIONS: | | | | | | | | |
| | | | | | | | | |
| Shares Sold | | | 58,063 | | | | 73,642 | |
| Reinvestment of distributions to shareholders | | | 86,967 | | | | 28,776 | |
| Shares Redeemed | | | (118,417 | ) | | | (49,110 | ) |
| Increase in net assets from capital share transactions | | | 26,613 | | | | 53,308 | |
| TOTAL INCREASE (DECREASE) IN NET ASSETS | | | (101,610 | ) | | | 216,179 | |
| | | | | | | | | |
| NET ASSETS: | | | | | | | | |
| Beginning of year | | | 1,952,720 | | | | 1,736,541 | |
| End of year | | $ | 1,851,110 | | | $ | 1,952,720 | |
The accompanying notes are an integral part of these financial statements.
GREATER WESTERN NEW YORK SERIES (A SERIES WITHIN BULLFINCH FUND, INC.)
FINANCIAL HIGHLIGHTS (PER SHARE DATA FOR A SHARE OUTSTANDING)
FOR THE YEARS ENDED OCTOBER 31, 2018, 2017, 2016, 2015 AND 2014
| | | October | | | October | | | October | | | October | | | October | |
| | | 2018 | | | 2017 | | | 2016 | | | 2015 | | | 2014 | |
| | | | | | | | | | | | | | | | |
| NET ASSET VALUE, beginning of year | | $ | 22.23 | | | $ | 20.36 | | | $ | 20.79 | | | $ | 22.41 | | | $ | 20.16 | |
| | | | | | | | | | | | | | | | | | | | | |
| INCOME FROM INVESTMENT OPERATIONS | | | | | | | | | | | | | | | | | | | | |
| Net investment income (loss) | | | (0.02 | ) | | | 0.00 | | | | (0.01 | ) | | | 0.00 | | | | (0.08 | ) |
| Net gain (loss) on securities both realized and unrealized | | | (0.42 | ) | | | 2.21 | | | | (0.29 | ) | | | 0.65 | | | | 2.33 | |
| Total from investment operations | | | (0.44 | ) | | | 2.21 | | | | (0.30 | ) | | | 0.65 | | | | 2.25 | |
| | | | | | | | | | | | | | | | | | | | | |
| DISTRIBUTIONS TO SHAREHOLDERS FROM: | | | | | | | | | | | | | | | | | | | | |
| Distribution of capital gains | | | (0.93 | ) | | | (0.34 | ) | | | (0.07 | ) | | | (2.27 | ) | | | 0.00 | |
| Distribution of ordinary income | | | (0.06 | ) | | | 0.00 | | | | (0.06 | ) | | | 0.00 | | | | 0.00 | |
| Total stock dividend distributions | | | (0.99 | ) | | | (0.34 | ) | | | (0.13 | ) | | | (2.27 | ) | | | 0.00 | |
| | | | | | | | | | | | | | | | | | | | | |
| NET ASSET VALUE, end of year | | $ | 20.80 | | | $ | 22.23 | | | $ | 20.36 | | | $ | 20.79 | | | $ | 22.41 | |
| | | | | | | | | | | | | | | | | | | | | |
| NET ASSETS, end of year | | $ | 1,851,110 | | | $ | 1,952,720 | | | $ | 1,736,541 | | | $ | 1,778,803 | | | $ | 1,774,261 | |
GREATER WESTERN NEW YORK SERIES (A SERIES WITHIN BULLFINCH FUND, INC.)
FINANCIAL HIGHLIGHTS (RATIOS AND SUPPLEMENTAL DATA)
FOR THE YEARS ENDED OCTOBER 31, 2018, 2017, 2016, 2015 AND 2014
| | | October | | | October | | | October | | | October | | | October | |
| | | 2018 | | | 2017 | | | 2016 | | | 2015 | | | 2014 | |
| RATIO OF EXPENSES TO AVERAGE NET ASSETS* | | | 1.61 | % | | | 1.37 | % | | | 1.56 | % | | | 1.54 | % | | | 1.68 | % |
| | | | | | | | | | | | | | | | | | | | |
| RATIO OF NET INVESTMENT INCOME TO AVERAGE NET ASSETS* | | | (0.08 | )% | | | 0.00 | % | | | (0.05 | )% | | | (0.02 | )% | | | (0.38 | )% |
| | | | | | | | | | | | | | | | | | | | | |
| PORTFOLIO TURNOVER RATE* | | | 2.32 | % | | | 2.87 | % | | | 0.16 | % | | | 4.34 | % | | | 13.65 | % |
| TOTAL RETURN | | | (2.15 | )% | | | 10.89 | % | | | (1.45 | )% | | | 2.85 | % | | | 11.16 | % |
* Per share amounts calculated using the average shares method
The accompanying notes are an integral part of these financial highlights.
GREATER WESTERN NEW YORK SERIES (A SERIES WITHIN BULLFINCH FUND, INC.)
NOTES TO FINANCIAL STATEMENTS OCTOBER 31, 2018
NOTE A - SCOPE OF BUSINESS
The Greater Western New York Series (the “Series”) is a series within the Bullfinch Fund, Inc. (the “Fund”), which was organized as a Maryland corporation registered under the Investment Company Act of 1940 as an open-ended non-diversified management investment company. The Fund offers two series of common stock. In addition to the Greater Western New York Series, the Fund also offers the Unrestricted Series.
The investment objective of the Series is to seek capital appreciation through the investment in common stock of companies with an important economic presence in the Greater Western New York Region. The Adviser seeks to achieve this objective by using an asset mix consisting primarily of exchange listed securities and over-the-counter common stocks as well as U.S. Government securities maturing within five years.
NOTE B - SUMMARY OF SIGNIFICANT ACCOUNTING POLICIES
The following is a summary of significant accounting policies followed by the Series in the preparation of its financial statements. These policies are in conformity with accounting principles generally accepted in the United States (“GAAP”). The Series follows the investment company accounting and reporting guidance of the Financial Accounting Standard Board Accounting Standard Codification 946, Financial Services – Investment Companies.
Fair Value Measurements – ASC 820-10 establishes a fair value hierarchy which requires an entity to maximize the use of observable inputs and minimize the use of unobservable inputs when measuring fair value. The standard describes three levels of inputs that may be used to measure fair value:
Level 1: Quoted prices (unadjusted) for identical assets or liabilities in active markets that the entity has the ability to access as of the measurement date.
Level 2: Significant other observable inputs other than Level 1 prices such as quoted prices for similar assets or liabilities; quoted prices in markets that are not active; or other inputs that are observable or can be corroborated by observable market data.
Level 3: Significant unobservable inputs that reflect a reporting entity’s own assumptions about the assumptions that market participants would use in pricing an asset or liability.
The following is a description of the valuation methodologies used for assets measured at fair value:
Cash & Equivalents- Cash consists of amounts deposited in a bank sweep account and is federally insured. The Series has not experienced any losses on such amounts and believes it is not exposed to any significant credit risk on cash.
Security Valuation - The Series records its investments at fair value and is in compliance with FASB ASC 820-10-50. Securities traded on national securities exchanges or the NASDAQ National Market System are valued daily at the closing prices of the securities on those exchanges and securities traded on over-the-counter markets are valued daily at the closing bid prices. Short-term and money market securities are valued at amortized cost, which approximates market value.
ASSETS AT FAIR VALUE AS OF:
| | | 10/31/18 | |
| | | LEVEL 1 | |
| COMMON STOCKS | | $ | 1,650,188 | |
| CASH & EQUIVALENTS | | $ | 200,361 | |
| TOTAL INVESTED ASSETS | | $ | 1,850,549 | |
In cases where market prices are unreliable or not readily available, for example, when trading on securities are halted as permitted by the SEC or when there is no trading volume on an Over-the-Counter security held by the Fund, the Fund relies on fair value pricing provided by the Adviser. In performing its fair value pricing, the Adviser acts under the ultimate supervision of, and follows, the policies of the Board of Directors. The Board of Directors retains the right to determine its own fair value price should it have reason to believe the price provided by the Adviser does not reflect fair value. Valuing securities at fair value involves greater reliance on judgment than securities that have readily available market quotations. There can be no assurance the Fund could obtain the fair value assigned to a security if they were to sell the security at approximately the time at which the Fund determines their net asset value per share.
Series Allocations - Common expenses of the Fund are evenly split between the two series of the Fund unless the Board of Directors approves an alternative allocation of expenses based on management’s estimate.
Income Taxes - It is the policy of the Fund to comply with the requirements of Subchapter M of the Internal Revenue Code (the “Code”) applicable to regulated investment companies and to distribute all of its taxable income to its shareholders. In addition, the Fund intends to distribute an amount sufficient to avoid imposition of any excise tax under Section 4982 of the Code. Therefore, no provision for federal income taxes or excise taxes has been made.
Management has reviewed all open tax years and major tax jurisdictions and concluded that no liability for unrecognized tax benefits should be recorded related to uncertain tax positions taken on returns filed or expected to be taken on a tax return. The tax returns of the Series for the prior three years are open for examination.
Distributions to Shareholders - Distributions to shareholders are recorded on the ex-dividend date. . The Series made a distribution of its capital gains of $28,776 to its shareholders on December 29, 2016 in the form of stock dividends equal to1,336.559 shares of stock. The Series made a distribution of its ordinary income of $5,159 to its shareholders on December 22, 2017 in the form of stock dividends equal to 238.599 shares of stock. The Series made a distribution of its capital gains of $81,808 to its shareholders on December 22, 2017 in the form of stock dividends equal to 3,783.910 shares of stock.
Other - The Series follows industry practice and records security transactions on the trade date. The specific identification method is used for determining gains and losses for financial statement and income tax purposes. Dividend income is recorded on the ex-dividend date.
Use of Estimates - The preparation of financial statements in conformity with generally accepted accounting principles requires management to make estimates and assumptions that affect the amounts reported in the financial statements and accompanying notes. Actual results can differ from those estimates.
Subsequent Events - In accordance with GAAP, the Fund has evaluated the need for disclosures and/or adjustments resulting from subsequent events through December 21, 2018, the date of issuance of these financial statements.
NOTE C – INVESTMENTS
For the year ended October 31, 2018, the Series purchased $82,414 of common stock. During the same period, the Series sold $45,770 of common stock.
At October 31, 2018, the gross unrealized appreciation for all securities totaled $965,025 and the gross unrealized depreciation for all securities totaled $149,168, or a net unrealized appreciation of $815,857. The aggregate cost of securities for federal income tax purposes at October 31, 2017 was $834,331.
NOTE D – RELATED PARTY TRANSACTIONS
Carosa Stanton Asset Management, LLC serves as investment adviser to the Fund pursuant to an investment adviser agreement which was approved by the Fund’s board of directors. Carosa Stanton Asset Management, LLC is a Registered Investment Adviser under the Investment Advisers Act of 1940. The Investment adviser agreement provides that Carosa Stanton Asset Management, LLC, subject to the supervision and approval of the Fund’s board of directors, is responsible for the day-to-day management of the Fund’s portfolio, which includes selecting investments and handling its business affairs.
As compensation for its services to the Fund, the investment adviser receives monthly compensation at an annual rate of 1.25% on the first $1 million of daily average net assets and 1% on that portion of the daily average net assets in excess of $1 million. These fees are reduced by any sub-transfer agent fees incurred by the Fund.
Carosa Stanton Asset Management, LLC has agreed as part of its contract to forego sufficient investment adviser fees to limit total expenses of the Fund to 2% of the first $10 million in average assets and 1.5% of the next $20 million in average assets.
During the year ended October 31, 2018, the Fund paid investment adviser fees of $22,234,
As of October 31, 2018, the Fund had $1,859 included in liabilities, as owed to Carosa Stanton Asset Management, LLC.
Certain officers of the Fund are also officers of Carosa Stanton Asset Management.
NOTE E – REMUNERATION OF DIRECTORS
The Directors are paid a fee of $50 per meeting. They may be reimbursed for travel expenses.
NOTE F – COMMITMENTS AND CONTINGENCIES
The Series indemnifies the Fund’s officers and the Board of Directors for certain liabilities that might arise from their performance of their duties to the Series. Additionally, in the normal course of business the Fund enters into contracts that contain a variety of representations and warranties and which provide for general indemnifications. The Fund’s maximum exposure under these arrangements is unknown, as this would involve future claims that may be made against the Fund that have not yet occurred. However, based on its experience, the Fund expects the risk of loss to be remote.
NOTE G - CAPITAL SHARE TRANSACTIONS
The Fund has authorized 10,000,000 shares of common stock at $0.01 par value per share. These shares are issued under either of the two series of the Fund. Each share has equal dividend, distribution and liquidation rights. Transactions in capital stock of the Series were as follows:
| | | Shares | | | Amount | |
| Balance at October 31, 2016 | | | 85,289.314 | | | $ | 1,126,040 | |
| | | | | | | | | |
| Shares sold during 2017 | | | 3,436.881 | | | | 73,642 | |
| Shares redeemed during 2017 | | | (2,226.220 | ) | | | (49,110 | ) |
| Reinvestment of Distributions, December 29, 2016 | | | 1,336.559 | | | | 28,776 | |
| | | | | | | | | |
| Balance at October 31, 2017 | | | 87,836.534 | | | $ | 1,179,348 | |
| | | | | | | | | |
| Shares sold during 2018 | | | 2,623.024 | | | | 58,063 | |
| Shares redeemed during 2018 | | | (5,472.720 | ) | | | (118,417 | ) |
| Reinvestment of Distributions, December 22, 2017 | | | 4,022.509 | | | | 86,967 | |
| | | | | | | | | |
| Balance at October 31, 2018 | | | 89,009.347 | | | $ | 1,205,961 | |
| ADDITIONAL INFORMATION | | | | | | | | | |
| | | | | | | | | | | | |
| | Beginning | | | Ending | | | | | | | |
| EXPENSE TABLE | | Account Value 5/1/18 | | | Account Value 10/31/18 | | | Annualized Expense Ratio | | | Expenses Paid During Period+ | |
| ACTUAL | | | | | | | | | | | | | | | | |
| Unrestricted Series | | $ | 1,000.00 | | | $ | 991.40 | | | | 1.49 | % | | $ | 7.36 | |
| Greater Western New York Series | | | 1,000.00 | | | | 977.40 | | | | 1.61 | % | | $ | 7.89 | |
| HYPOTHETICAL++ | | | | | | | | | | | | | | | | |
| Unrestricted Series | | | 1,000.00 | | | | 1,025.00 | | | | 1.49 | % | | $ | 7.48 | |
| Greater Western New York Series | | | 1,000.00 | | | | 1,025.00 | | | | 1.61 | % | | $ | 8.08 | |
+ Expenses are equal to each Series’ annualized expense ratio multiplied by the average account value over the period, multiplied by the number of days (181) in the most recent fiscal half-year, then divided by 365.
++ Assumes annual return of 5% before expenses.
All mutual funds have operating expenses. As a shareholder of the Fund, you incur operating expenses including investment advisory fees, regulatory fees and other Fund expenses. Such expenses, which are deducted from the Fund’s gross income, directly reduce the investment return of the Fund. The Fund’s expenses are expressed as a percentage of its average net assets. This figure is known as the expense ratio. The Expense Table is intended to help you understand the ongoing costs (in dollars) of investing in your Fund and to compare these costs with those of other mutual funds. The examples are based on an investment of $1,000 made at the beginning of the period shown and held for the entire period (May 1, 2018 to October 31, 2018).
The Expense Table illustrates your Fund’s costs in two ways.
| | ● | ACTUAL EXPENSES. This section helps you to estimate the actual expenses after fee waivers that would have been paid over the period. The “Ending Account Value” shown is derived from the Fund’s actual return, and “Expenses Paid During Period” shows the dollar amount that would have been paid by an investor who started with $1,000 in the Fund. |
| | | |
| | ● | HYPOTHETICAL EXAMPLE FOR COMPARISON PURPOSES. This section is intended to help you compare your Fund’s costs with those of other mutual funds. It is based on your Fund’s actual expense ratio and assumes that your Fund had an annual return of 5% before expenses during the period shown. In this case - because the return used is not your Fund’s actual return – the results may not be used to estimate your actual ending account value or expenses you paid during this period. The example is useful in making comparisons between your Fund and other funds because the Securities and Exchange Commission (the “SEC”) requires all mutual funds to calculate expenses based on an annual 5% return. You can assess your Fund’s costs by comparing this hypothetical example with the hypothetical examples that appear in shareholder reports of other funds. |
BOARD OF DIRECTORS INFORMATION
The business and affairs of the Fund are managed under the direction of the Fund’s Board of Directors. Information pertaining to the Directors of the Fund are set forth below. The Fund’s SAI includes additional information about the Fund’s Directors, and is available without charge, by calling (585) 624-3150 or 1-888-BULLFINCH. Each director may be contacted by writing to the director c/o Bullfinch Fund, Inc. 3909 Rush Mendon Road, Mendon, New York 14506.
The directors and officers of the Fund are:
| NAME, AGE ADDRESS | | POSITON(S) HELD WITH FUND | | TERM OF OFFICE AND LENGTH OF TIME SERVED IN FUND | | PRINCIPLE OCCUPATION(S) DURING PAST 5 YEARS | | NUMBER OF PORTFOLIOS IN COMPLEX OVERSEEN BY DIRECTOR | | OTHER DIR- RECTORSHIPS HELD BY DIRECTOR |
| INTERESTED PERSONS | | | | | | | | |
| | | | | | | | | |
| Christopher Carosa, 58 2 Lantern Lane Honeoye Falls, New York 14472 | | President; Director; Chairman of Board; Chief Compliance Officer | | Term of Office: N/A Length of Time Served: Since 1997 | | President, Founder Carosa Stanton Asset Management, LLC President, Director and Chairman of the Board, Bullfinch Fund, Inc. | | 2 | | N/A |
| | | | | | | | | | | |
| Betsy Kay Carosa, 58 2 Lantern Lane Honeoye Falls, NY 14472 | | Corporate Secretary | | Term of Office: N/A Length of Time Served: Since 1997 | | Office Manager Carosa Stanton Asset Management, LLC Corporate Secretary, Bullfinch Fund, Inc. | | 2 | | N/A |
| | | | | | | |
| INDEPENDENT DIRECTORS | | | | | | | | |
| | | | | | | | | |
| Thomas M. Doeblin, 59 73 San Gabriel Drive Rochester, NY 14610 | | Director; Audit Committee | | Term of Office: N/A Length of Time Served: Since 2006 | | Teacher Pittsford Mendon High School | | 2 | | N/A |
| | | | | | | | | | | |
| Bryan D. Hickman, 73 6288 Bopple Hill Road Naples, NY 14512 | | Director; Audit Committee | | Term of Office: N/A Length of Time Served: Since 2008 | | Co Founder, Vice Chairman E3 Rochester | | 2 | | N/A |
| | | | | | | | | | | |
| Lois Irwin, 66 33 Oak Meadow Trail Pittsford, NY 14534 | | Director | | Term of Office: N/A Length of Time Served: Since 2006 | | Director of Provider Services ULTRAMOBILE IMAGING | | 2 | | N/A |
| | | | | | | | | | | |
| John P. Lamberton, 58 110 East Center Street #2057 Madison, SD 57042 | | Director | | Term of Office: N/A Length of Time Served: Since 2003 | | Founder, General Partner Cape Bojador Capital Management | | 2 | | N/A |
| | | | | | | | | | | |
| William E.J. Martin, 58 4410 Woodlawn Ave. N Seattle, WA 98103 | | Director | | Term of Office: N/A Length of Time Served: Since 1997 | | Managing Member, Chipman & Martin, LLC | | 2 | | N/A |
| | | | | | | | | | | |
| Michael W. Reynolds, 57 203 Randwood Drive Getzville, NY 14068 | | Director; Audit Committee | | Term of Office: N/A Length of Time Served: Since 2000 | | Marketing Consultant Sole Proprietor | | 2 | | N/A |
PROXY VOTING GUIDELINES
Carosa Stanton Asset Management, LLC, the Fund’s Investment Adviser, is responsible for exercising the voting rights associated with the securities held by the Fund. A description of the policies and procedures used by the Adviser in fulfilling this responsibility and the voting record during the most recent 12 month period ending June 30th is available without charge, upon request, by calling (585) 624-3150 or 1-888-BULLFINCH. The Fund’s Forms N-PX is available on the SEC’s website at http://www.sec.gov. The Fund’s Forms N-PX may also be reviewed and copied at the SEC’s Public Reference Room in Washington DC. Information on the operation of the Public Reference Room may be obtained by calling 1-800-SEC-0330.
QUARTERLY FILING OF PORTFOLIO HOLDINGS
The Fund files its complete schedule of portfolio holdings with the Securities and Exchange Commission (SEC) for the first and third quarters of each fiscal year on Form N-Q. The Fund’s Forms N-Q are available on the SEC’s website at http://www.sec.gov. The Fund’s Forms N-Q may also be reviewed and copied at the SEC’s Public Reference Room in Washington DC. Information on the operation of the Public Reference Room may be obtained by calling 1-800-SEC-0330.
DISCLOSURE REGARDING THE BOARD OF DIRECTORS’ APPROVAL OF THE INVESTMENT ADVISORY CONTRACT
At the Board’s Annual Meeting, the Independent Directors of the Board met separately to discuss the Adviser and reported the conclusions to the Board. In determining whether to renew the Management and Investment Advisory Agreements between the Fund and Carosa Stanton Asset Management, LLC, (the Adviser), the Board of Directors requested, and the Adviser provided information relevant to the Board’s consideration. Among the factors the Board considered were:
| | 1) | Nature, extent and quality of service provided by the Adviser – the Independent Directors noted the unprecedented access they have to the Adviser, the quick responsiveness to requests. |
| | 2) | The overall performance of the Funds relative to the performance of other funds in the Funds’ peer group. |
| | 3) | The Board also considered the fact that Adviser has implemented breakpoints in the Funds’ advisory fee schedule and the Board agreed that this type of fee structure remained reasonable and fair to shareholders. |
| | 4) | They noted the range of investment advisory and administrative services provided by the Adviser to the Fund. |
| | 5) | They also took note of the fact that the Fund is not subject to sales charges or Rule 12b-1 fees. |
| | 6) | The Board also reviewed financial information concerning the Adviser’s brokerage practices, including soft dollar arrangements, and noted that these were reasonable. |
Based upon their review and consideration of these factors and other matters deemed relevant, the Board concluded that the terms of the Investment Management Agreements are fair and reasonable and the Board voted to renew the Agreements.
| | (a) | The registrant has adopted a code of ethics that applies to the registrant’s principal executive officer, its principal financial officer, principal accounting officer, controller, as well as any other officers and persons providing similar functions. This code of ethics is included as Exhibit 11(a)(1). |
| | | |
| | (b) | During the period covered by this report, no amendments were made to the provisions of the code of ethics |
| | | |
| | (c) | During the period covered by this report, no implicit or explicit waivers to the provisions of the code of ethics were granted. |
| Item 3 | - | AUDIT COMMITTEE FINANCIAL EXPERT. |
The registrant’s Board of Directors determined that the registrant does not have an Audit Committee member who possesses all of the attributes required to be an “audit committee financial expert” as defined in instruction 2(b) of Item 3 of Form N-CSR. It was the consensus of the board that, although no one individual Audit Committee member meets the technical definition of an audit committee financial expert, the Committee has sufficient expertise collectively among its members to effectively discharge its duties and that the Committee will engage additional expertise if needed.
| Item 4 | - | PRINCIPAL ACCOUNTANT FEES AND SERVICES. |
The registrant has engaged its principal accountant to perform audit services. “Audit services” refer to performing an audit of the registrant’s annual financial statements or services that are normally provided by the accountant in connection with statutory and regulatory filings or engagements for those fiscal years. “Audit-related services” refer to the assurance and related services by the principal accountant that are reasonably related to the performance of the audit. “Tax services” refer to professional services rendered by the principal accountant for tax compliance, tax advice, and tax planning. The following table details the aggregate fees billed for each of the last two fiscal years for audit fees, audit-related fees, tax fees and other fees by the principal accountant. Since the accounting fees were approved by the Board of Directors in total, the principal accountant has provided an estimate of the split between audit and preparation of the tax filings.
| | | 10/31/2018 | | | 10/31/2017 | |
| | | | | | | |
| Audit Fees | | $ | 12,250 | | | $ | 11,150 | |
| | | | | | | | | |
| Audit-Related Fees | | $ | 0 | | | $ | 0 | |
| Tax Fees | | $ | 2,000 | | | $ | 2,000 | |
| All Other Fees | | $ | 0 | | | $ | 0 | |
The Audit Committee of the registrant’s Board of Directors recommends a principal accountant to perform audit services for the registrant. Each year, the registrant’s Board of Directors vote to approve or disapprove the principal accountant recommended by the Audit Committee for the following year’s accounting work.
| Item 5 | - | AUDIT COMMITTEE OF LISTED REGISTRANTS. |
Not applicable to open-end investment companies.
| Item 6(a) | - | The list of investments is included in the shareholder report. |
| Item 6(b) | - | Not applicable. |
| Item 7 | - | DISCLOSURE OF PROXY VOTING POLICIES AND PROCEDURES FOR CLOSED-END MANAGEMENT INVESTMENT COMPANIES. |
Not applicable to open-end investment companies.
| Item 8 | - | PORTFOLIO MANAGERS OF CLOSED-END MANAGEMENT INVESTMENT COMPANIES. |
Not applicable to open-end investment companies.
| Item 9 | - | PURCHASES OF EQUITY SECURITIES BY CLOSED-END MANAGEMENT INVESTMENT COMPANIES. |
Not applicable to open-end investment companies.
| ITEM 10. | SUBMISSION OF MATTERS TO A VOTE OF SECURITY HOLDERS. |
None.
| ITEM 11. | CONTROLS AND PROCEDURES. |
| Item 11(a) | | -The registrant’s principal executive and principal financial officer has determined that the registrant’s disclosure controls and procedures (as defined in Rule 30a-3(c) under the Investment Company Act of 1940) are effective based on the evaluation of these controls and procedures are effective as of a date within 90 days prior to the filing date of this report. |
| | | |
| Item 11(b) | | -There were no changes in the registrant’s internal control over financial reporting (as defined in Rule 30a-3(d) under the Investment Company Act of 1940) that occurred during the registrant’s last fiscal half-year (the registrant’s second fiscal half-year in the case of an annual report) that has materially affected, or is reasonably likely to materially affect, the registrant’s internal control over financial reporting. |
SIGNATURES
Pursuant to the requirements of the Securities Exchange Act of 1934 and the Investment Company Act of 1940, the registrant has duly caused this report to be signed on its behalf by the undersigned, thereunto duly authorized.
Bullfinch Fund, Inc.
| By: | /s/ Christopher Carosa | |
| | Christopher Carosa, | |
| | President of Bullfinch Fund, Inc. | |
| | | |
| Date: | December 21, 2018 | |
Pursuant to the requirements of the Securities Exchange Act of 1934 and the Investment Company Act of 1940, this report has been signed below by the following persons on behalf of the registrant and in the capacities and on the dates indicated.
| By: | /s/ Christopher Carosa | |
| | Christopher Carosa, | |
| | President of Bullfinch Fund, Inc. | |
| | | |
| Date: | December 21, 2018 | |