UNITED STATES
SECURITIES AND EXCHANGE COMMISSION
Washington, D.C. 20549
FORM N-CSR
CERTIFIED SHAREHOLDER REPORT OF REGISTERED
MANAGEMENT INVESTMENT COMPANIES
Investment Company Act File Number: 811-08207
| T. Rowe Price Tax-Efficient Funds, Inc. |
| (Exact name of registrant as specified in charter) |
| 100 East Pratt Street, Baltimore, MD 21202 |
| (Address of principal executive offices) |
| David Oestreicher |
| 100 East Pratt Street, Baltimore, MD 21202 |
| (Name and address of agent for service) |
Registrant’s telephone number, including area code: (410) 345-2000
Date of fiscal year end: February 28
Date of reporting period: February 28, 2018
 |
| Tax-Efficient Equity Fund | February 28, 2018 |
The views and opinions in this report were current as of February 28, 2018. They are not guarantees of performance or investment results and should not be taken as investment advice. Investment decisions reflect a variety of factors, and the managers reserve the right to change their views about individual stocks, sectors, and the markets at any time. As a result, the views expressed should not be relied upon as a forecast of the fund’s future investment intent. The report is certified under the Sarbanes-Oxley Act, which requires mutual funds and other public companies to affirm that, to the best of their knowledge, the information in their financial reports is fairly and accurately stated in all material respects.
REPORTS ON THE WEB
Sign up for our Email Program, and you can begin to receive updated fund reports and prospectuses online rather than through the mail. Log in to your account at troweprice.com for more information.
Manager’s Letter
Fellow Shareholders
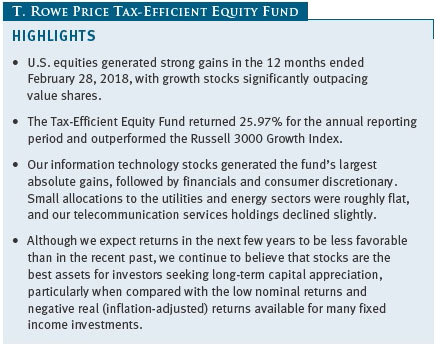
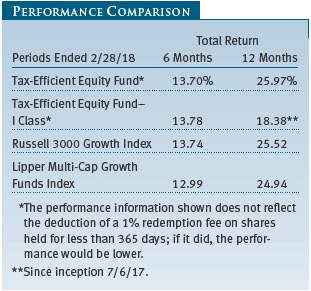
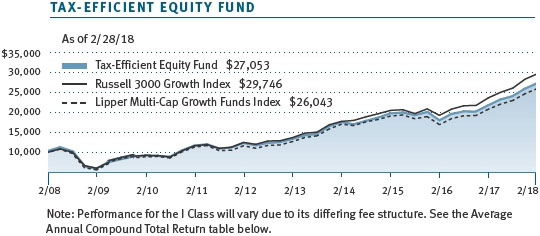
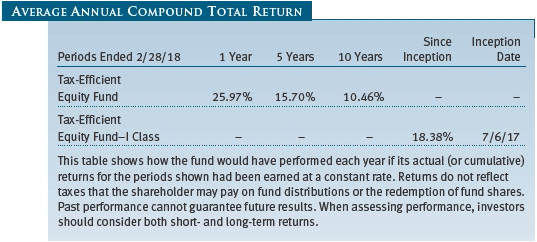
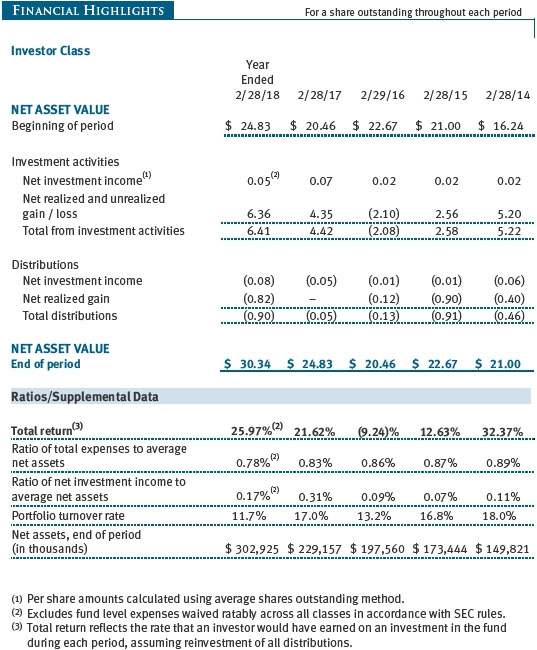
U.S. equities generated strong gains in the 12 months ended February 28, 2018, with larger growth-oriented stocks leading the way. Inflation remained relatively muted despite a recent uptick, the economy continued to grow at a steady pace, and consumer and business confidence were solidly positive. As shown in the Performance Comparison table, the Tax-Efficient Equity Fund gained 13.70% and 25.97% for the 6- and 12-month periods ended February 28, 2018, respectively. Your fund modestly outperformed the Russell 3000 Growth Index and the Lipper Multi-Cap Growth Funds Index for the annual reporting period. (Performance for the I Class will vary due to its different fee structure.)
Most sectors in our portfolio generated positive absolute returns for the 12-month period. Our information technology stocks led results with an exceptional 42% gain, followed by financials (35%) and consumer discretionary (29%). Small allocations to the utilities and energy sectors were roughly flat, while our telecommunication services holdings declined slightly. Stock selection benefited relative results versus the Russell benchmark, while our sector weights detracted modestly.
MARKET ENVIRONMENT
U.S. stocks benefited from moderate economic growth and favorable corporate earnings, and the major equity indexes posted strong gains in the 12-month reporting period. Equities found support later in 2017 amid growing optimism around the passage of important tax reform legislation. The Federal Reserve raised short-term interest rates three times in 2017, but the widely expected hikes started from an extraordinarily low level and did not disrupt equity markets. In December 2017, Congress passed legislation that lowered tax rates for corporations and individuals, and most major stock indexes surged higher on the anticipated benefit to corporate earnings. Equity market returns were relatively subdued early in 2018 as market volatility, which had been historically low for an extended period of time, returned somewhat in late January 2018.
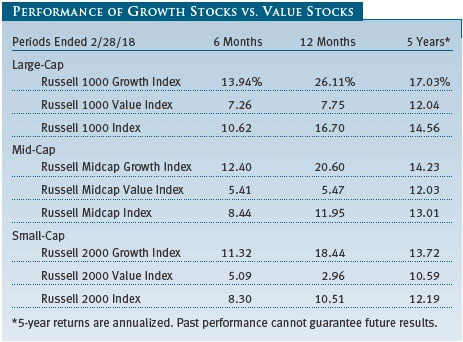
As measured by various Russell indexes, large-cap stocks outperformed mid- and small-caps in the 12-month reporting period. Growth stocks outpaced value shares by wide margins across all market capitalizations. Most sectors in the fund’s benchmark, the Russell 3000 Growth Index, were positive. Information technology, industrials and business services, and consumer discretionary were the strongest sectors. Energy was the lone sector in negative territory for the period as increased production renewed pressure on the global pricing environment.
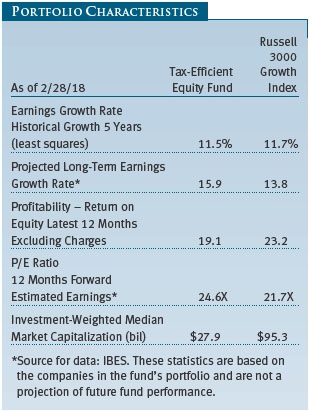
PORTFOLIO CHARACTERISTICS
The Tax-Efficient Equity Fund seeks to generate strong after-tax returns through a buy-and-hold investment approach focused on attractively valued, high-quality growth companies with good business models, strong management, and favorable long-term prospects.
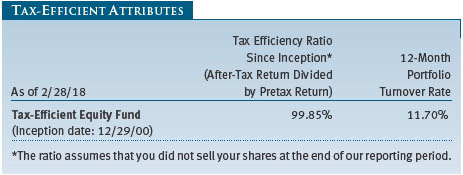
| ● | Tax-Efficiency Ratio: Our 99.85% tax-efficiency ratio shows that the fund has made only minimal distributions since its inception on December 29, 2000. (The fund’s tax-efficiency ratio is calculated by dividing the fund’s after-tax return by its pretax return.) At 11.70%, our turnover is very low when compared with other large-cap growth managers who focus on pretax returns. Our fund’s objective is to maximize after-tax returns, which distinguishes us from almost all other large-cap growth funds. |
| ● | Earnings Growth: The fund’s projected long-term earnings growth rate of 15.9% exceeds the 13.8% rate for the index, while our historical earnings growth rate over the last five years was 11.5% versus 11.7% for the index. Over time, we expect the earnings of our holdings to grow faster than companies in the Russell 3000 Growth Index. |
| ● | Return on Equity: The fund’s 12-month return on equity (ROE) at the end of our reporting period was 19.1%. A consistently high ROE indicates that a company is using its investment dollars to generate earnings growth and is one of the most important factors we consider in our portfolio. |
| ● | Market Capitalization: The fund’s investment-weighted median market capitalization was $27.9 billion versus $95.3 billion for the index, reflecting the fund’s diversified investment approach and its exposure to mid-cap companies, which have outperformed large-caps over the long term. |
PORTFOLIO AND PERFORMANCE REVIEW
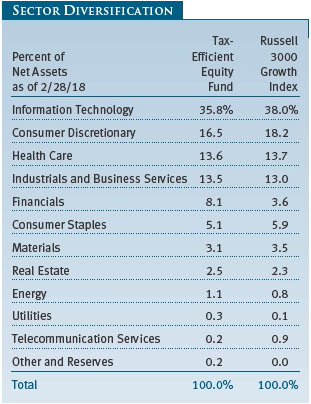
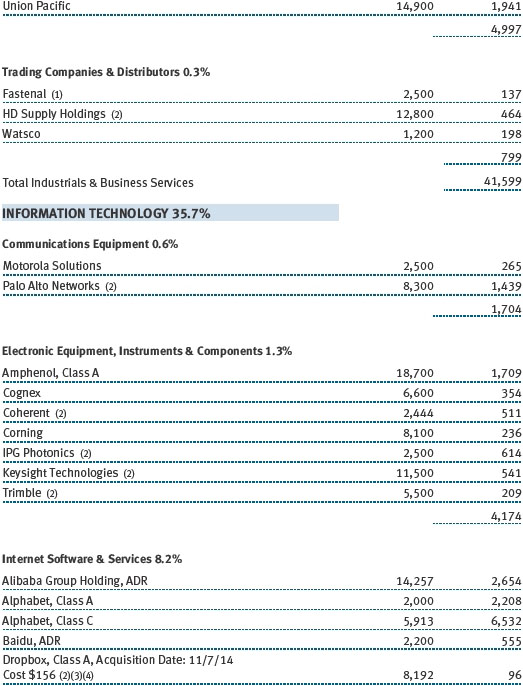
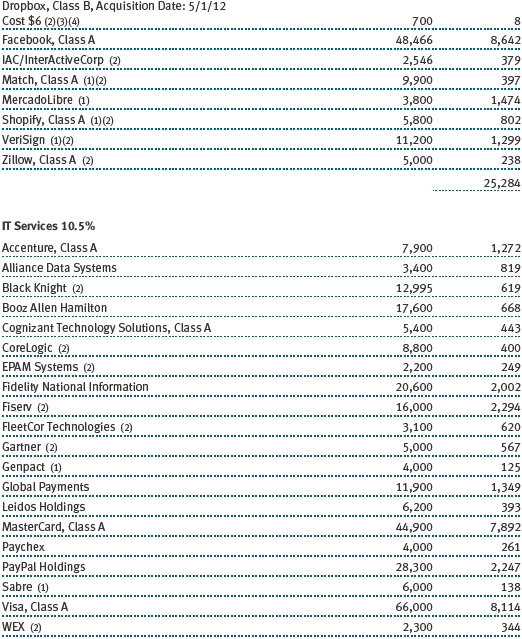
At the end of our reporting period, the fund’s largest sector allocations were information technology, consumer discretionary, health care, and industrials and business services. We had small allocations to energy, telecommunication services, and utilities—sectors that traditionally do not have many of the growth-oriented characteristics that we seek. Financials was our largest overweight allocation relative to our benchmark, while information technology was our largest underweight.
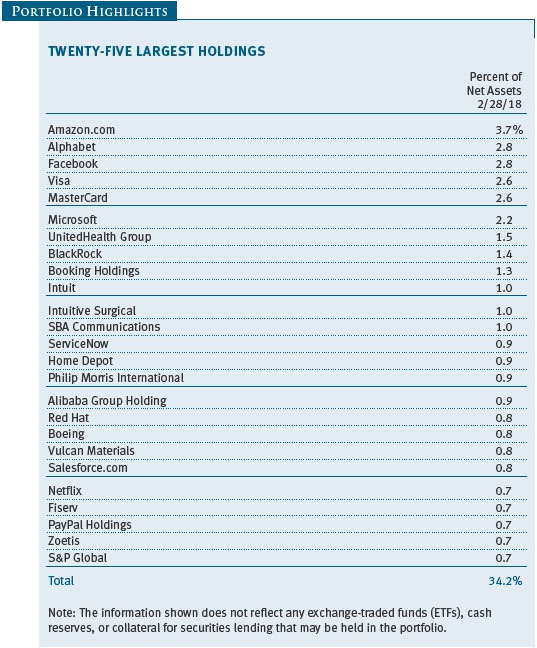
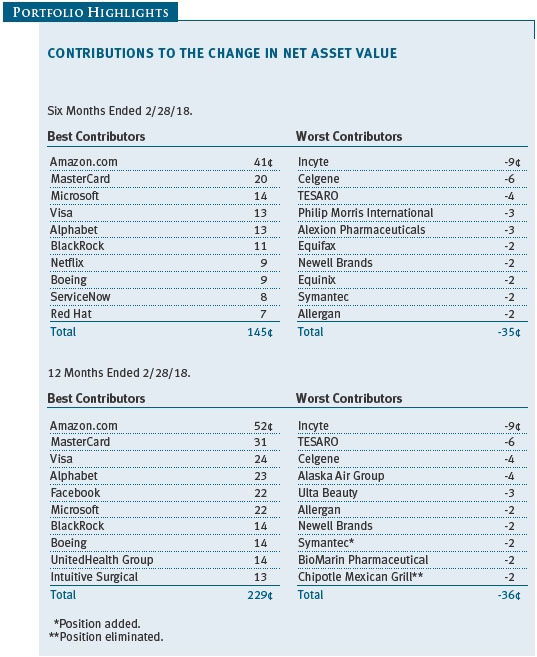
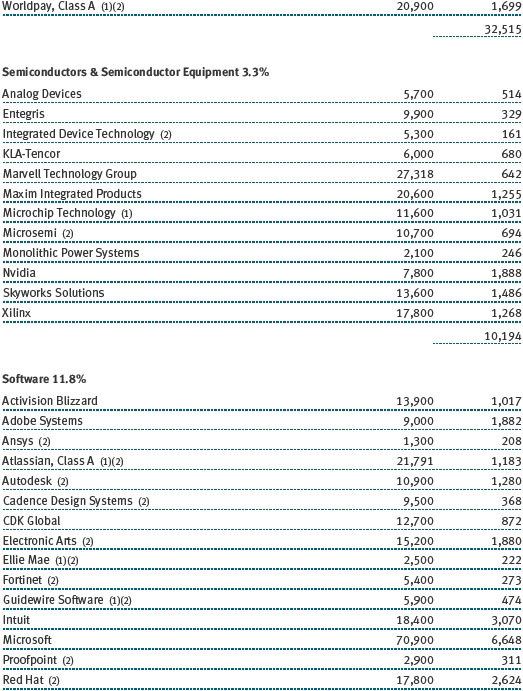
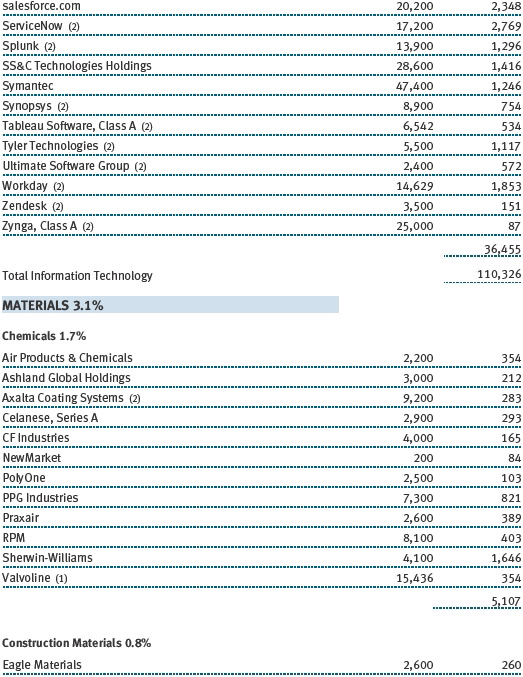
Our holdings in the information technology sector gained more than 40% and were our top absolute performance contributors for the annual period. We have a diversified approach to this sector and favor companies with strong business models operating in industries with high barriers to entry and low risk of commoditization. This is usually a “winner take all” space in which a small number of industry leaders dominate their competitors. As a result, we try to avoid “value traps”—companies with low stock valuations but whose business models face significant challenges from competing products or services. Global software giant Microsoft is one of our largest positions and was among our best contributors. The company’s Office 365 suite and Azure cloud computing services appear to be very well positioned and are experiencing strong year-over-year revenue growth. Open-source software provider Red Hat was another strong contributor, benefiting from its dominant position in Linux operating systems, a fast-growing middleware business, and promising efforts in broader cloud infrastructure. (Please refer to the fund’s portfolio of investments for a complete list of holdings and the amount each represents in the portfolio.)
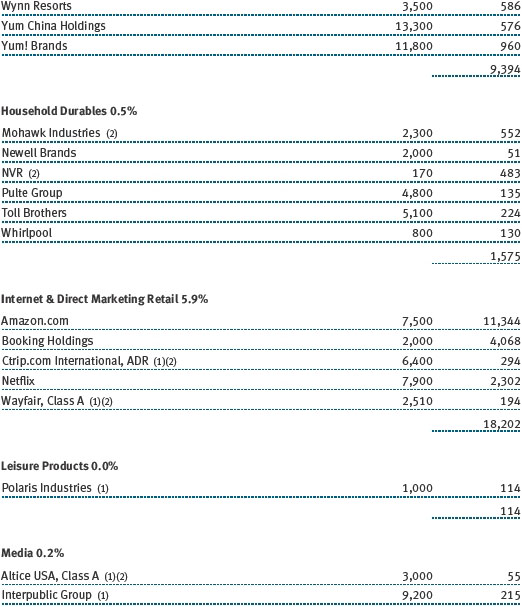
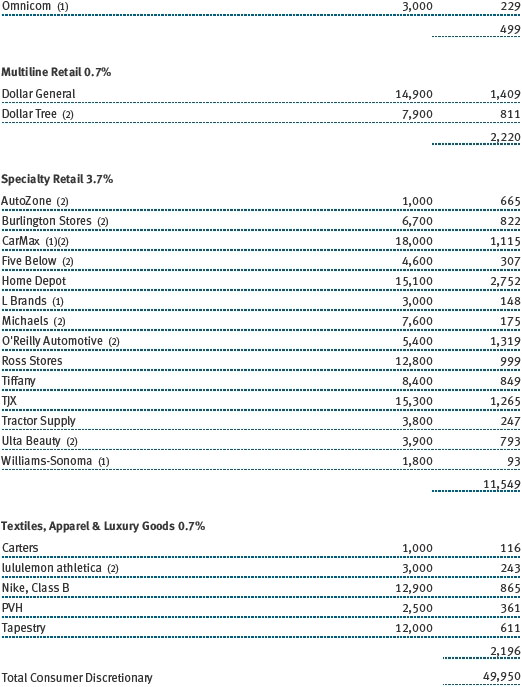
Our consumer discretionary shares advanced more than 28% for the 12-month period. Performance over the second half of the reporting period was notably better than the first half amid growing optimism and subsequent passage of major tax reform in December 2017. The sector includes a number of companies with good business models, excellent cash flow, and other favorable attributes, and we focus on finding leaders within their respective niches. Internet retailer Amazon.com was the fund’s top overall contributor. The company is enjoying strong growth in its core online retail business and is aggressively expanding its presence in an array of retail markets, including food sales. Third-party sales and Amazon Web Services (AWS), which provides cloud computing services, have generated attractive profit margins. Booking Holdings, Netflix, and Home Depot were also solid contributors. L Brands, which owns Victoria’s Secret and Bath & Body Works, detracted from results.
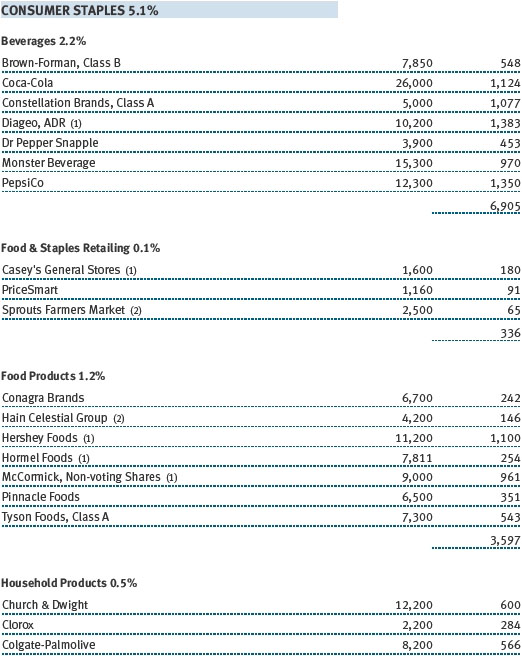
Our consumer staples holdings generated moderate gains for the period. We have a modest allocation to the sector, with a focus on food and beverage companies with leading brands. In the beverage segment, Diageo gained as the company continued to see growth in its global spirits and beer businesses, including an increasing presence in emerging markets with growing appetites for the company’s premium brands. PepsiCo and Constellation Brands, another maker of premium beer, wine, and spirits, were also strong contributors.
OUTLOOK
Equity returns cooled noticeably in early 2018, and volatility has increased from historically low levels. However, this is not entirely unexpected after exceptionally strong results in 2017. Against a backdrop of lower U.S. taxes and synchronized global economic growth, the longer-term outlook for equities is favorable.
While absolute returns in the next few years are not likely to be as favorable as they have been in the last few years, we still believe that stocks are the best assets for investors seeking long-term capital appreciation. Equities currently appear fairly valued overall, but they certainly remain preferable to bonds, which remain challenged by extremely low nominal and negative real (inflation-adjusted) returns for many fixed income investments. The Fed has started to raise interest rates, and although its approach is cautious, it’s safe to say that we remain in a tightening cycle. An environment of higher interest rates will undercut already muted returns for bonds as there is little yield in most core bond strategies to offset expected price declines.
Regardless of whether the market rises, falls, or moves sideways in the coming months, we remain committed to finding and owning high-quality, attractively valued companies that are able to grow earnings consistently.
To help us mitigate risks, we maintain broad diversification, manage position sizes, and remain conscious of both absolute and relative valuations. Our longer investment time horizon gives us an advantage versus other fund managers who trade aggressively and make large taxable distributions to their shareholders. Over time, we believe this approach can generate solid after-tax returns for our investors.
Thank you for your confidence in T. Rowe Price.
Respectfully submitted,

Donald J. Peters
Portfolio manager and chairman of the fund’s Investment Advisory Committee
March 19, 2018
The committee chairman has day-to-day responsibility for managing the portfolio and works with committee members in developing and executing the fund’s investment program.
RISKS OF STOCK INVESTING
The stock market as a whole can decline for many reasons, including adverse political or economic developments here or abroad, changes in investor psychology, or heavy institutional selling. The prospects for an industry or company may deteriorate because of a variety of factors, including disappointing earnings or changes in the competitive environment. In addition, our assessment of companies held in the funds may prove incorrect, resulting in losses or poor performance even in a rising market.
Growth stocks can be volatile for several reasons. Since growth companies usually reinvest a high proportion of their earnings in their own businesses, they may lack the dividends often associated with value stocks that could cushion their decline in a falling market. Also, since investors buy growth stocks because of their expected superior earnings growth, earnings disappointments often result in sharp price declines.
The stocks of mid-cap companies entail greater risk and are usually more volatile than the shares of large companies. Investing in small companies also involves greater risk than is customarily associated with larger companies. Stocks of small companies are subject to more abrupt or erratic price movements than larger company stocks. Small companies often have limited product lines, markets, or financial resources, and their managements may lack depth and experience. Such companies seldom pay significant dividends that could cushion returns in a falling market.
Technology stocks are particularly volatile and subject to greater price swings than the broad market. It is possible that companies whose products and services first appear promising may not succeed over the long term; they may succumb to intense competition or could quickly become obsolete in a rapidly developing marketplace. Earnings projections for developing companies that are not met can result in sharp price declines. This is true even in a generally rising stock market environment.
GLOSSARY
Earnings growth rate: Measures the annualized percent change in earnings per share for a given time period.
Historical growth five years (least squares): The least squares growth calculation attempts to find the “normal” growth rate given a stream of historical growth rates. It searches for the growth rate that best fits the line produced by a stream of growth numbers.
Investment-weighted median market capitalization: The investment-weighted midpoint market capitalization (shares outstanding multiplied by current price) representing a typical security in a portfolio. An investment-weighted median represents the breakpoint where 50% of the values are above and 50% of the values are below based on portfolio weight.
Lipper indexes: Fund benchmarks that consist of a small number (10 to 30) of the largest mutual funds in a particular category as tracked by Lipper Inc.
Market capitalization: The total value of a company’s publicly traded shares.
Price-to-book ratio: A valuation measure that compares a stock’s market price with its book value; i.e., the company’s net worth divided by the number of outstanding shares.
Price-to-earnings (P/E) ratio – 12 months forward: A valuation measure calculated by dividing the price of a stock by the analysts’ forecast of the next 12 months’ expected earnings. The ratio is a measure of how much investors are willing to pay for the company’s future earnings. The higher the P/E ratio, the more investors are paying for a company’s earnings growth in the next 12 months.
Projected earnings growth rate (IBES): A company’s expected earnings-per-share growth rate for a given time period based on the forecast from the Institutional Brokers’ Estimate System, which is commonly referred to as IBES.
Return on equity (ROE) – current fiscal year: A valuation measure calculated by dividing the company’s current fiscal year net income by shareholders’ equity (i.e., the company’s book value). ROE measures how much a company earns on each dollar that common stock investors have put into the company. It indicates how effectively and efficiently a company and its management are using stockholder investments.
Russell 1000 Index: An index that tracks the performance of the 1,000 largest companies in the Russell 3000 Index.
Russell 1000 Growth Index: An index that tracks the performance of large-cap stocks with higher price-to-book ratios and higher forecast growth values.
Russell 1000 Value Index: An index that tracks the performance of large-cap stocks with lower price-to-book ratios and lower forecast growth values.
Russell 2000 Index: An unmanaged index that tracks the stocks of 2,000 small U.S. companies.
Russell 2000 Growth Index: An index that tracks the performance of small-cap stocks with higher price-to-book ratios and higher forecast growth values.
Russell 2000 Value Index: An index that tracks the performance of small-cap stocks with lower price-to-book ratios and lower forecast growth values.
Russell 3000 Index: An index that tracks the performance of the 3,000 largest U.S. companies, representing approximately 98% of the investable U.S. equity market.
Russell 3000 Growth Index: An index that measures the performance of those Russell 3000 companies with higher price-to-book ratios and higher forecast growth values.
Russell Midcap Index: An unmanaged index that tracks the performance of the 800 smallest companies in the Russell 1000 Index.
Russell Midcap Growth Index: An index that tracks the performance of mid-cap stocks with higher price-to-book ratios and higher forecast growth values.
Russell Midcap Value Index: An index that tracks the performance of mid-cap stocks with lower price-to-book ratios and lower forecast growth values.
Note: Russell Investment Group is the source and owner of the trademarks, service marks, and copyrights related to the Russell indexes. Russell® is a trademark of Russell Investment Group.
Performance and Expenses
| Growth of $10,000 |
This chart shows the value of a hypothetical $10,000 investment in the fund over the past 10 fiscal year periods or since inception (for funds lacking 10-year records). The result is compared with benchmarks, which may include a broad-based market index and a peer group average or index. Market indexes do not include expenses, which are deducted from fund returns as well as mutual fund averages and indexes.
| Fund Expense Example |
As a mutual fund shareholder, you may incur two types of costs: (1) transaction costs, such as redemption fees or sales loads, and (2) ongoing costs, including management fees, distribution and service (12b-1) fees, and other fund expenses. The following example is intended to help you understand your ongoing costs (in dollars) of investing in the fund and to compare these costs with the ongoing costs of investing in other mutual funds. The example is based on an investment of $1,000 invested at the beginning of the most recent six-month period and held for the entire period.
Please note that the fund has two share classes: The original share class (Investor Class) charges no distribution and service (12b-1) fee, and the I Class shares are also available to institutionally oriented clients and impose no 12b-1 or administrative fee payment. Each share class is presented separately in the table.
Actual Expenses
The first line of the following table (Actual) provides information about actual account values and expenses based on the fund’s actual returns. You may use the information on this line, together with your account balance, to estimate the expenses that you paid over the period. Simply divide your account value by $1,000 (for example, an $8,600 account value divided by $1,000 = 8.6), then multiply the result by the number on the first line under the heading “Expenses Paid During Period” to estimate the expenses you paid on your account during this period.
Hypothetical Example for Comparison Purposes
The information on the second line of the table (Hypothetical) is based on hypothetical account values and expenses derived from the fund’s actual expense ratio and an assumed 5% per year rate of return before expenses (not the fund’s actual return). You may compare the ongoing costs of investing in the fund with other funds by contrasting this 5% hypothetical example and the 5% hypothetical examples that appear in the shareholder reports of the other funds. The hypothetical account values and expenses may not be used to estimate the actual ending account balance or expenses you paid for the period.
Note: T. Rowe Price charges an annual account service fee of $20, generally for accounts with less than $10,000. The fee is waived for any investor whose T. Rowe Price mutual fund accounts total $50,000 or more; accounts electing to receive electronic delivery of account statements, transaction confirmations, prospectuses, and shareholder reports; or accounts of an investor who is a T. Rowe Price Personal Services or Enhanced Personal Services client (enrollment in these programs generally requires T. Rowe Price assets of at least $250,000). This fee is not included in the accompanying table. If you are subject to the fee, keep it in mind when you are estimating the ongoing expenses of investing in the fund and when comparing the expenses of this fund with other funds.
You should also be aware that the expenses shown in the table highlight only your ongoing costs and do not reflect any transaction costs, such as redemption fees or sales loads. Therefore, the second line of the table is useful in comparing ongoing costs only and will not help you determine the relative total costs of owning different funds. To the extent a fund charges transaction costs, however, the total cost of owning that fund is higher.

The accompanying notes are an integral part of these financial statements.
The accompanying notes are an integral part of these financial statements.
The accompanying notes are an integral part of these financial statements.
The accompanying notes are an integral part of these financial statements.
The accompanying notes are an integral part of these financial statements.
The accompanying notes are an integral part of these financial statements.
| Notes to Financial Statements |
T. Rowe Price Tax-Efficient Funds, Inc. (the corporation) is registered under the Investment Company Act of 1940 (the 1940 Act). The Tax-Efficient Equity Fund (the fund) is a diversified, open-end management investment company established by the corporation. The fund seeks to maximize after-tax growth of capital through investments primarily in common stocks. The fund has two classes of shares: the Tax-Efficient Equity Fund (Investor Class) and the Tax-Efficient Equity Fund–I Class (I Class). I Class shares generally are available only to investors meeting a $1,000,000 minimum investment or certain other criteria. Each class has exclusive voting rights on matters related solely to that class; separate voting rights on matters that relate to both classes; and, in all other respects, the same rights and obligations as the other class.
NOTE 1 - SIGNIFICANT ACCOUNTING POLICIES
Basis of Preparation The fund is an investment company and follows accounting and reporting guidance in the Financial Accounting Standards Board (FASB) Accounting Standards Codification Topic 946 (ASC 946). The accompanying financial statements were prepared in accordance with accounting principles generally accepted in the United States of America (GAAP), including, but not limited to, ASC 946. GAAP requires the use of estimates made by management. Management believes that estimates and valuations are appropriate; however, actual results may differ from those estimates, and the valuations reflected in the accompanying financial statements may differ from the value ultimately realized upon sale or maturity.
Investment Transactions, Investment Income, and Distributions Investment transactions are accounted for on the trade date basis. Income and expenses are recorded on the accrual basis. Realized gains and losses are reported on the identified cost basis. Dividends received from mutual fund investments are reflected as dividend income; capital gain distributions are reflected as realized gain/loss. Dividend income and capital gain distributions are recorded on the ex-dividend date. Income tax-related interest and penalties, if incurred, are recorded as income tax expense. Distributions from REITs are initially recorded as dividend income and, to the extent such represent a return of capital or capital gain for tax purposes, are reclassified when such information becomes available. Income distributions are declared and paid by each class annually. Distributions to shareholders are recorded on the ex-dividend date. A capital gain distribution may also be declared and paid by the fund annually.
Class Accounting Shareholder servicing, prospectus, and shareholder report expenses incurred by each class are charged directly to the class to which they relate. Expenses common to both classes, investment income, and realized and unrealized gains and losses are allocated to the classes based upon the relative daily net assets of each class. To the extent any expenses are waived or reimbursed in accordance with an expense limitation (see Note 5), the waiver or reimbursement is charged to the applicable class or allocated across the classes in the same manner as the related expense.
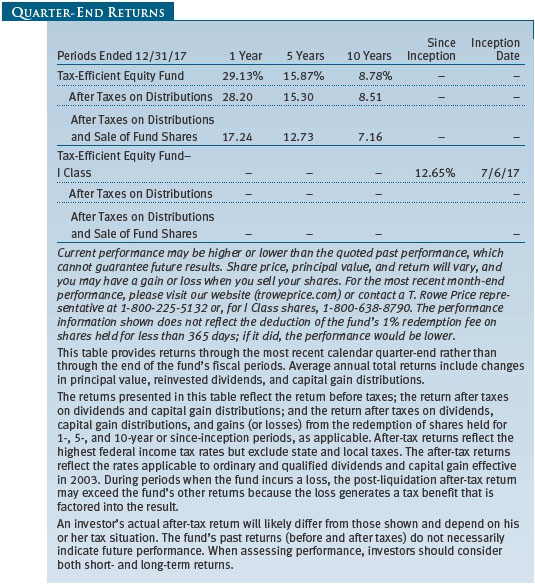
Redemption Fees A 1% fee is assessed on redemptions of fund shares held for less than 365 days to deter short-term trading and to protect the interests of long-term shareholders. Redemption fees are withheld from proceeds that shareholders receive from the sale or exchange of fund shares. The fees are paid to the fund and are recorded as an increase to paid-in capital. The fees may cause the redemption price per share to differ from the net asset value per share.
New Accounting Guidance In March 2017, the FASB issued amended guidance to shorten the amortization period for certain callable debt securities held at a premium. The guidance is effective for fiscal years and interim periods beginning after December 15, 2018. Adoption will have no effect on the fund’s net assets or results of operations.
On August 1, 2017, the fund implemented amendments to Regulation S-X, issued by the Securities and Exchange Commission, which require standardized, enhanced disclosures, particularly related to derivatives, in investment company financial statements. Adoption had no effect on the fund’s net assets or results of operations.
Indemnification In the normal course of business, the fund may provide indemnification in connection with its officers and directors, service providers, and/or private company investments. The fund’s maximum exposure under these arrangements is unknown; however, the risk of material loss is currently considered to be remote.
NOTE 2 - VALUATION
The fund’s financial instruments are valued and each class’s net asset value (NAV) per share is computed at the close of the New York Stock Exchange (NYSE), normally 4 p.m. ET, each day the NYSE is open for business. However, the NAV per share may be calculated at a time other than the normal close of the NYSE if trading on the NYSE is restricted, if the NYSE closes earlier, or as may be permitted by the SEC.
Fair Value The fund’s financial instruments are reported at fair value, which GAAP defines as the price that would be received to sell an asset or paid to transfer a liability in an orderly transaction between market participants at the measurement date. The T. Rowe Price Valuation Committee (the Valuation Committee) is an internal committee that has been delegated certain responsibilities by the fund’s Board of Directors (the Board) to ensure that financial instruments are appropriately priced at fair value in accordance with GAAP and the 1940 Act. Subject to oversight by the Board, the Valuation Committee develops and oversees pricing-related policies and procedures and approves all fair value determinations. Specifically, the Valuation Committee establishes procedures to value securities; determines pricing techniques, sources, and persons eligible to effect fair value pricing actions; oversees the selection, services, and performance of pricing vendors; oversees valuation-related business continuity practices; and provides guidance on internal controls and valuation-related matters. The Valuation Committee reports to the Board and has representation from legal, portfolio management and trading, operations, risk management, and the fund’s treasurer.
Various valuation techniques and inputs are used to determine the fair value of financial instruments. GAAP establishes the following fair value hierarchy that categorizes the inputs used to measure fair value:
Level 1 – quoted prices (unadjusted) in active markets for identical financial instruments that the fund can access at the reporting date
Level 2 – inputs other than Level 1 quoted prices that are observable, either directly or indirectly (including, but not limited to, quoted prices for similar financial instruments in active markets, quoted prices for identical or similar financial instruments in inactive markets, interest rates and yield curves, implied volatilities, and credit spreads)
Level 3 – unobservable inputs
Observable inputs are developed using market data, such as publicly available information about actual events or transactions, and reflect the assumptions that market participants would use to price the financial instrument. Unobservable inputs are those for which market data are not available and are developed using the best information available about the assumptions that market participants would use to price the financial instrument. GAAP requires valuation techniques to maximize the use of relevant observable inputs and minimize the use of unobservable inputs. When multiple inputs are used to derive fair value, the financial instrument is assigned to the level within the fair value hierarchy based on the lowest-level input that is significant to the fair value of the financial instrument. Input levels are not necessarily an indication of the risk or liquidity associated with financial instruments at that level but rather the degree of judgment used in determining those values.
Valuation Techniques Equity securities listed or regularly traded on a securities exchange or in the over-the-counter (OTC) market are valued at the last quoted sale price or, for certain markets, the official closing price at the time the valuations are made. OTC Bulletin Board securities are valued at the mean of the closing bid and asked prices. A security that is listed or traded on more than one exchange is valued at the quotation on the exchange determined to be the primary market for such security. Listed securities not traded on a particular day are valued at the mean of the closing bid and asked prices. Actively traded equity securities listed on a domestic exchange generally are categorized in Level 1 of the fair value hierarchy. OTC Bulletin Board securities, certain preferred securities, and equity securities traded in inactive markets generally are categorized in Level 2 of the fair value hierarchy.
Investments in mutual funds are valued at the mutual fund’s closing NAV per share on the day of valuation and are categorized in Level 1 of the fair value hierarchy. Assets and liabilities other than financial instruments, including short-term receivables and payables, are carried at cost, or estimated realizable value, if less, which approximates fair value.
Thinly traded financial instruments and those for which the above valuation procedures are inappropriate or are deemed not to reflect fair value are stated at fair value as determined in good faith by the Valuation Committee. The objective of any fair value pricing determination is to arrive at a price that could reasonably be expected from a current sale. Financial instruments fair valued by the Valuation Committee are primarily private placements, restricted securities, warrants, rights, and other securities that are not publicly traded.
Subject to oversight by the Board, the Valuation Committee regularly makes good faith judgments to establish and adjust the fair valuations of certain securities as events occur and circumstances warrant. For instance, in determining the fair value of an equity investment with limited market activity, such as a private placement or a thinly traded public company stock, the Valuation Committee considers a variety of factors, which may include, but are not limited to, the issuer’s business prospects, its financial standing and performance, recent investment transactions in the issuer, new rounds of financing, negotiated transactions of significant size between other investors in the company, relevant market valuations of peer companies, strategic events affecting the company, market liquidity for the issuer, and general economic conditions and events. In consultation with the investment and pricing teams, the Valuation Committee will determine an appropriate valuation technique based on available information, which may include both observable and unobservable inputs. The Valuation Committee typically will afford greatest weight to actual prices in arm’s length transactions, to the extent they represent orderly transactions between market participants, transaction information can be reliably obtained, and prices are deemed representative of fair value. However, the Valuation Committee may also consider other valuation methods such as market-based valuation multiples; a discount or premium from market value of a similar, freely traded security of the same issuer; or some combination. Fair value determinations are reviewed on a regular basis and updated as information becomes available, including actual purchase and sale transactions of the issue. Because any fair value determination involves a significant amount of judgment, there is a degree of subjectivity inherent in such pricing decisions, and fair value prices determined by the Valuation Committee could differ from those of other market participants. Depending on the relative significance of unobservable inputs, including the valuation technique(s) used, fair valued securities may be categorized in Level 2 or 3 of the fair value hierarchy.
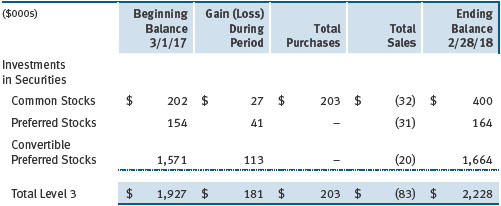
Valuation Inputs The following table summarizes the fund’s financial instruments, based on the inputs used to determine their fair values on February 28, 2018.
There were no material transfers between Levels 1 and 2 during the year ended February 28, 2018.
Following is a reconciliation of the fund’s Level 3 holdings for the year ended February 28, 2018. Gain (loss) reflects both realized and change in unrealized gain/loss on Level 3 holdings during the period, if any, and is included on the accompanying Statement of Operations. The change in unrealized gain/loss on Level 3 instruments held at February 28, 2018, totaled $163,000 for the year ended February 28, 2018.
NOTE 3 - OTHER INVESTMENT TRANSACTIONS
Consistent with its investment objective, the fund engages in the following practices to manage exposure to certain risks and/or to enhance performance. The investment objective, policies, program, and risk factors of the fund are described more fully in the fund’s prospectus and Statement of Additional Information.
Restricted Securities The fund may invest in securities that are subject to legal or contractual restrictions on resale. Prompt sale of such securities at an acceptable price may be difficult and may involve substantial delays and additional costs.
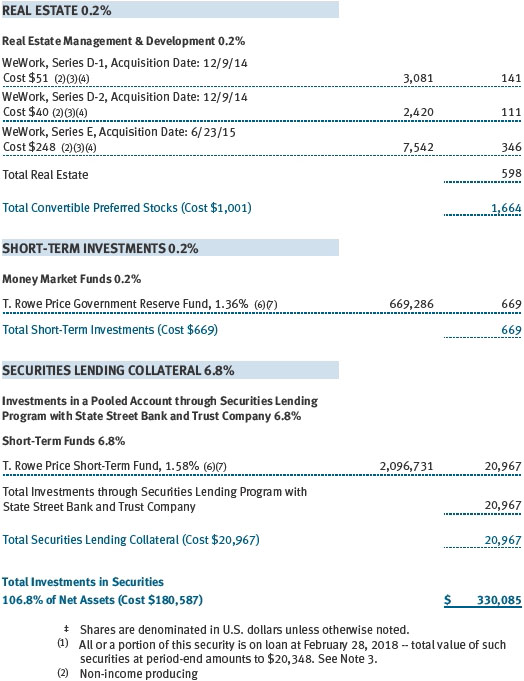
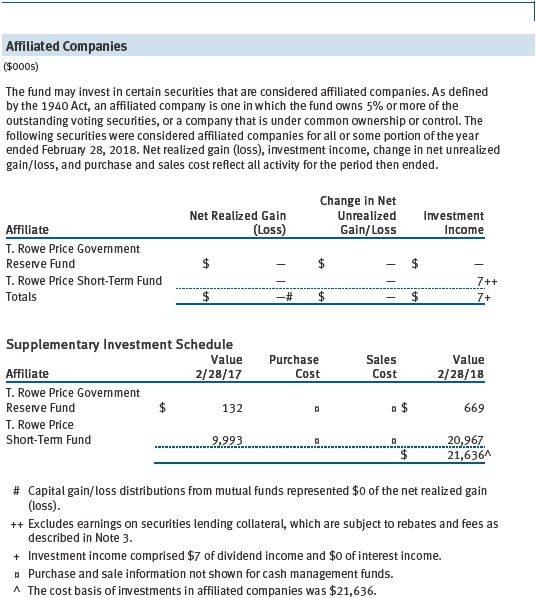
Securities Lending The fund may lend its securities to approved borrowers to earn additional income. Its securities lending activities are administered by a lending agent in accordance with a securities lending agreement. Security loans generally do not have stated maturity dates, and the fund may recall a security at any time. The fund receives collateral in the form of cash or U.S. government securities, valued at 102% to 105% of the value of the securities on loan. Collateral is maintained over the life of the loan in an amount not less than the value of loaned securities; any additional collateral required due to changes in security values is delivered to the fund the next business day. Cash collateral is invested in accordance with investment guidelines approved by fund management. Additionally, the lending agent indemnifies the fund against losses resulting from borrower default. Although risk is mitigated by the collateral and indemnification, the fund could experience a delay in recovering its securities and a possible loss of income or value if the borrower fails to return the securities, collateral investments decline in value, and the lending agent fails to perform. Securities lending revenue consists of earnings on invested collateral and borrowing fees, net of any rebates to the borrower, compensation to the lending agent, and other administrative costs. In accordance with GAAP, investments made with cash collateral are reflected in the accompanying financial statements, but collateral received in the form of securities is not. At February 28, 2018, the value of loaned securities was $20,348,000; the value of cash collateral and related investments was $20,967,000.
Other Purchases and sales of portfolio securities other than short-term securities aggregated $50,138,000 and $31,035,000, respectively, for the year ended February 28, 2018.
NOTE 4 - FEDERAL INCOME TAXES
No provision for federal income taxes is required since the fund intends to continue to qualify as a regulated investment company under Subchapter M of the Internal Revenue Code and distribute to shareholders all of its taxable income and gains. Distributions determined in accordance with federal income tax regulations may differ in amount or character from net investment income and realized gains for financial reporting purposes. Financial reporting records are adjusted for permanent book/tax differences to reflect tax character but are not adjusted for temporary differences.
The fund files U.S. federal, state, and local tax returns as required. The fund’s tax returns are subject to examination by the relevant tax authorities until expiration of the applicable statute of limitations, which is generally three years after the filing of the tax return but which can be extended to six years in certain circumstances. Tax returns for open years have incorporated no uncertain tax positions that require a provision for income taxes.
Reclassifications to paid-in capital relate primarily to nondeductible organizational expenses. Reclassifications between income and gain relate primarily to per-share rounding of distributions. For the year ended February 28, 2018, the following reclassifications were recorded to reflect tax character (there was no impact on results of operations or net assets):
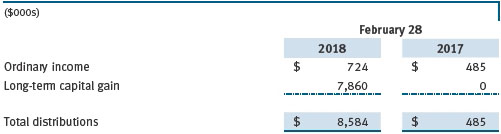
Distributions during the years ended February 28, 2018 and February 28, 2017, were characterized for tax purposes as follows:
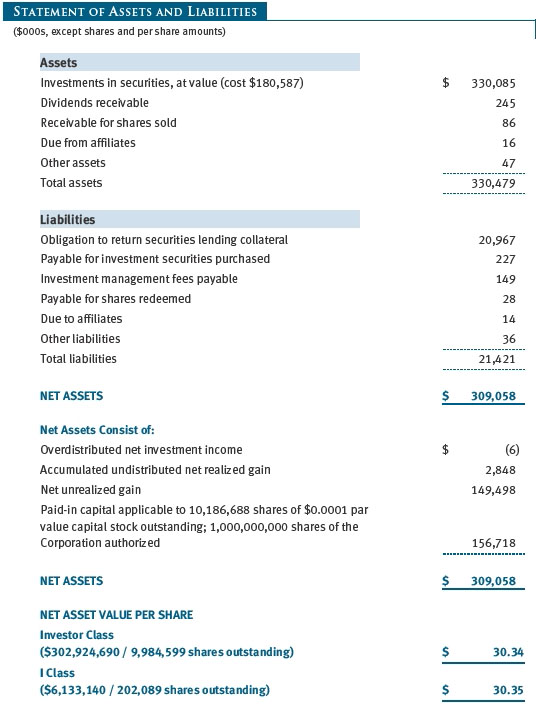
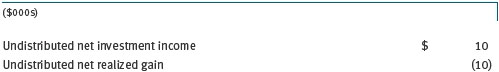
At February 28, 2018, the tax-basis cost of investments and components of net assets were as follows:
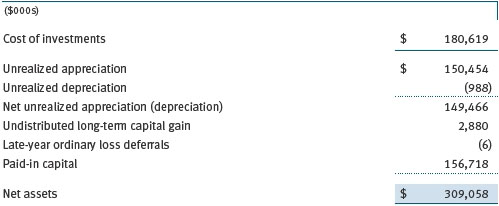
In accordance with federal tax laws applicable to investment companies, all or a portion of losses resulting from (a) net specified losses realized between November 1 and the fund’s fiscal year-end or (b) ordinary losses realized between January 1 and the fund’s fiscal year-end are not recognized for tax purposes until the subsequent year (late-year ordinary loss deferrals); however, such losses are recognized for financial reporting purposes in the year realized.
NOTE 5 - RELATED PARTY TRANSACTIONS
The fund is managed by T. Rowe Price Associates, Inc. (Price Associates), a wholly owned subsidiary of T. Rowe Price Group, Inc. (Price Group). The investment management agreement between the fund and Price Associates provides for an annual investment management fee, which is computed daily and paid monthly. The fee consists of an individual fund fee, equal to 0.35% of the fund’s average daily net assets, and a group fee. The group fee rate is calculated based on the combined net assets of certain mutual funds sponsored by Price Associates (the group) applied to a graduated fee schedule, with rates ranging from 0.48% for the first $1 billion of assets to 0.265% for assets in excess of $650 billion. The fund’s group fee is determined by applying the group fee rate to the fund’s average daily net assets. At February 28, 2018, the effective annual group fee rate was 0.29%.
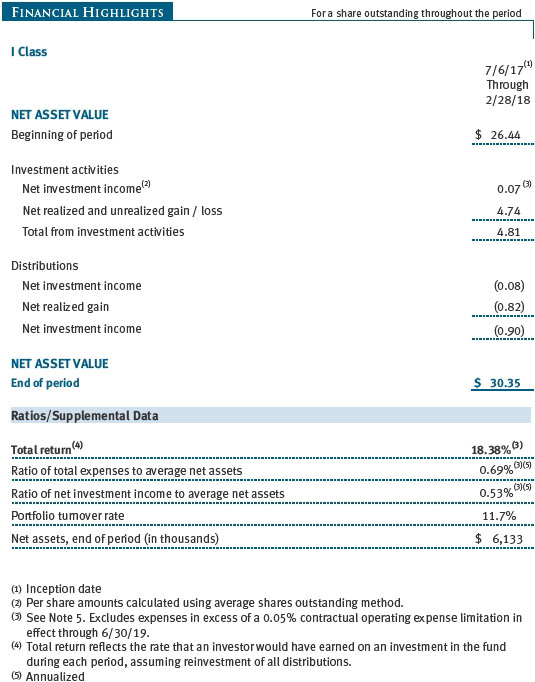
The I Class is subject to an operating expense limitation (I Class limit) pursuant to which Price Associates is contractually required to pay all operating expenses of the I Class, excluding management fees, interest, expenses related to borrowings, taxes, brokerage, and other non-recurring expenses permitted by the investment management agreement, to the extent such operating expenses, on an annualized basis, exceed 0.05% of average net assets. This agreement will continue until June 30,2019, and may be renewed, revised, or revoked only with approval of the fund’s Board. The I Class is required to repay Price Associates for expenses previously paid to the extent the class’s net assets grow or expenses decline sufficiently to allow repayment without causing the class’s operating expenses (after the repayment is taken into account) to exceed both: (1) the expense limitation in place at the time such amounts were paid; and (2) the class’s current expense limitation. However, no repayment will be made more than three years after the date of a payment or waiver.
Pursuant to this agreement, $121,000 of expenses were waived/paid by Price Associates during the year ended February 28, 2018.
In addition, the fund has entered into service agreements with Price Associates and two wholly owned subsidiaries of Price Associates, each an affiliate of the fund (collectively, Price). Price Associates provides certain accounting and administrative services to the fund. T. Rowe Price Services, Inc. provides shareholder and administrative services in its capacity as the fund’s transfer and dividend-disbursing agent. T. Rowe Price Retirement Plan Services, Inc. provides subaccounting and recordkeeping services for certain retirement accounts invested in the Investor Class and I Class. For the year ended February 28, 2018, expenses incurred pursuant to these service agreements were $86,000 for Price Associates; $95,000 for T. Rowe Price Services, Inc.; and less than $1,000 for T. Rowe Price Retirement Plan Services, Inc. The total amount payable at period-end pursuant to these service agreements is reflected as Due to Affiliates on the accompanying Statement of Assets and Liabilities.
The fund may invest its cash reserves in certain open-end management investment companies managed by Price Associates and considered affiliates of the fund: the T. Rowe Price Government Reserve Fund or the T. Rowe Price Treasury Reserve Fund, organized as money market funds, or the T. Rowe Price Short-Term Fund, a short-term bond fund (collectively, the Price Reserve Funds). The Price Reserve Funds are offered as short-term investment options to mutual funds, trusts, and other accounts managed by Price Associates or its affiliates and are not available for direct purchase by members of the public. Cash collateral from securities lending is invested in the T. Rowe Price Short-Term Fund. The Price Reserve Funds pay no investment management fees.
As of February 28, 2018, T. Rowe Price Group, Inc., or its wholly owned subsidiaries owned 9,455 shares of the I Class, representing 5% of the I Class’s net assets.
The fund may participate in securities purchase and sale transactions with other funds or accounts advised by Price Associates (cross trades), in accordance with procedures adopted by the fund’s Board and Securities and Exchange Commission rules, which require, among other things, that such purchase and sale cross trades be effected at the independent current market price of the security. During the year ended February 28, 2018, the fund had no purchases or sales cross trades with other funds or accounts advised by Price Associates.
| Report of Independent Registered Public Accounting Firm |
To the Board of Directors of T. Rowe Price Tax-Efficient Funds, Inc. and
Shareholders of T. Rowe Price Tax-Efficient Equity Fund
Opinion on the Financial Statements
We have audited the accompanying statement of assets and liabilities, including the portfolio of investments, of T. Rowe Price Tax-Efficient Equity Fund (constituting T. Rowe Price Tax-Efficient Funds, Inc., hereafter referred to as the “Fund”) as of February 28, 2018, the related statement of operations for the year ended February 28, 2018, the statement of changes in net assets for each of the two years in the period ended February 28, 2018, including the related notes, and the financial highlights for each of the periods indicated therein (collectively referred to as the “financial statements”). In our opinion, the financial statements present fairly, in all material respects, the financial position of the Fund as of February 28, 2018, the results of its operations for the year then ended, the changes in its net assets for each of the two years in the period ended February 28, 2018 and the financial highlights for each of the periods indicated therein, in conformity with accounting principles generally accepted in the United States of America.
Basis for Opinion
These financial statements are the responsibility of the Fund’s management. Our responsibility is to express an opinion on the Fund’s financial statements based on our audits. We are a public accounting firm registered with the Public Company Accounting Oversight Board (United States) (“PCAOB”) and are required to be independent with respect to the Fund in accordance with the U.S. federal securities laws and the applicable rules and regulations of the Securities and Exchange Commission and the PCAOB.
We conducted our audits of these financial statements in accordance with the standards of the PCAOB. Those standards require that we plan and perform the audit to obtain reasonable assurance about whether the financial statements are free of material misstatement, whether due to error or fraud.
Our audits included performing procedures to assess the risks of material misstatement of the financial statements, whether due to error or fraud, and performing procedures that respond to those risks. Such procedures included examining, on a test basis, evidence regarding the amounts and disclosures in the financial statements. Our audits also included evaluating the accounting principles used and significant estimates made by management, as well as evaluating the overall presentation of the financial statements. Our procedures included confirmation of securities owned as of February 28, 2018 by correspondence with the custodian, transfer agent and brokers; when replies were not received from brokers, we performed other auditing procedures. We believe that our audits provide a reasonable basis for our opinion.
PricewaterhouseCoopers LLP
Baltimore, Maryland
April 18, 2018
We have served as the auditor of one or more investment companies in the T. Rowe Price group of investment companies since 1973.
| Tax Information for the Tax Year Ended 2/28/18 |
We are providing this information as required by the Internal Revenue Code. The amounts shown may differ from those elsewhere in this report because of differences between tax and financial reporting requirements.
The fund’s distributions to shareholders included $7,870,000 from long-term capital gains, subject to a long-term capital gains tax rate of not greater than 20%.
For taxable non-corporate shareholders, $452,000 of the fund’s income represents qualified dividend income subject to a long-term capital gains tax rate of not greater than 20%.
For corporate shareholders, $452,000 of the fund’s income qualifies for the dividends-received deduction.
| Information on Proxy Voting Policies, Procedures, and Records |
A description of the policies and procedures used by T. Rowe Price funds and portfolios to determine how to vote proxies relating to portfolio securities is available in each fund’s Statement of Additional Information. You may request this document by calling 1-800-225-5132 or by accessing the SEC’s website, sec.gov.
The description of our proxy voting policies and procedures is also available on our corporate website. To access it, please visit the following Web page:
https://www3.troweprice.com/usis/corporate/en/utility/policies.html
Scroll down to the section near the bottom of the page that says, “Proxy Voting Policies.” Click on the Proxy Voting Policies link in the shaded box.
Each fund’s most recent annual proxy voting record is available on our website and through the SEC’s website. To access it through T. Rowe Price, visit the website location shown above, and scroll down to the section near the bottom of the page that says, “Proxy Voting Records.” Click on the Proxy Voting Records link in the shaded box.
| How to Obtain Quarterly Portfolio Holdings |
The fund files a complete schedule of portfolio holdings with the Securities and Exchange Commission for the first and third quarters of each fiscal year on Form N-Q. The fund’s Form N-Q is available electronically on the SEC’s website (sec.gov); hard copies may be reviewed and copied at the SEC’s Public Reference Room, 100 F St. N.E., Washington, DC 20549. For more information on the Public Reference Room, call 1-800-SEC-0330.
| About the Fund’s Directors and Officers |
Your fund is overseen by a Board of Directors (Board) that meets regularly to review a wide variety of matters affecting or potentially affecting the fund, including performance, investment programs, compliance matters, advisory fees and expenses, service providers, and business and regulatory affairs. The Board elects the fund’s officers, who are listed in the final table. At least 75% of the Board’s members are independent of T. Rowe Price Associates, Inc. (T. Rowe Price), and its affiliates; “inside” or “interested” directors are employees or officers of T. Rowe Price. The business address of each director and officer is 100 East Pratt Street, Baltimore, Maryland 21202. The Statement of Additional Information includes additional information about the fund directors and is available without charge by calling a T. Rowe Price representative at 1-800-638-5660.
Independent Directors(a)
| Name | ||
| (Year of Birth) | ||
| Year Elected | ||
| [Number of T. Rowe Price | Principal Occupation(s) and Directorships of Public Companies and | |
| Portfolios Overseen] | Other Investment Companies During the Past Five Years | |
| Teresa Bryce Bazemore* | President, Radian Guaranty (2008 to 2017); Member, Bazemore | |
| (1959) | Consulting LLC (2018 to present); Chimera Investment Corporation | |
| 2018 | (2017 to present); Federal Home Loan Bank of Pittsburgh (2017 | |
| [191] | to present) | |
| Ronald J. Daniels* | President, The Johns Hopkins University(b) and Professor, Political | |
| (1959) | Science Department, The Johns Hopkins University (2009 to | |
| 2018 | present); Director, Lyndhurst Holdings (2015 to present) | |
| [191] | ||
| Anthony W. Deering** | Chairman, Exeter Capital, LLC, a private investment firm (2004 to | |
| (1945) | 2017); Director and Advisory Board Member, Deutsche Bank North | |
| 2001 | America (2004 to 2017); Director, Vornado Real Estate Investment | |
| [0] | Trust (2004 to 2012); Director, Under Armour (2008 to 2017); | |
| Director, Brixmor Real Estate Investment Trust (2012 to 2017) | ||
| Bruce W. Duncan | Chief Executive Officer and Director (January 2009 to December | |
| (1951) | 2016), Chairman of the Board (January 2016 to present), and | |
| 2013 | President (January 2009 to September 2016), First Industrial Realty | |
| [191] | Trust, an owner and operator of industrial properties; Chairman | |
| of the Board (2005 to September 2016) and Director (1999 to | ||
| September 2016), Starwood Hotels & Resorts, a hotel and leisure | ||
| company; Director, Boston Properties (May 2016 to present); | ||
| Director, Marriott International, Inc. (September 2016 to present) | ||
| Robert J. Gerrard, Jr. | Advisory Board Member, Pipeline Crisis/Winning Strategies, a | |
| (1952) | collaborative working to improve opportunities for young African | |
| 2012 | Americans (1997 to January 2016) | |
| [191] | ||
| Paul F. McBride | Advisory Board Member, Vizzia Technologies (2015 to present) | |
| (1956) | ||
| 2013 | ||
| [191] | ||
| Cecilia E. Rouse, Ph.D. | Dean, Woodrow Wilson School (2012 to present); Professor and | |
| (1963) | Researcher, Princeton University (1992 to present); Member of | |
| 2012 | National Academy of Education (2010 to present); Director, MDRC, | |
| [191] | a nonprofit education and social policy research organization | |
| (2011 to present); Research Associate of Labor Studies Program | ||
| (2011 to 2015) and Board Member (2015 to present), National | ||
| Bureau of Economic Research (2011 to present); Chair of Committee | ||
| on the Status of Minority Groups in the Economic Profession | ||
| (2012 to present); Vice President, American Economic Association | ||
| (2015 to present) | ||
| John G. Schreiber | Owner/President, Centaur Capital Partners, Inc., a real estate | |
| (1946) | investment company (1991 to present); Cofounder, Partner, | |
| 2001 | and Cochairman of the Investment Committee, Blackstone Real | |
| [191] | Estate Advisors, L.P. (1992 to 2015); Director, General Growth | |
| Properties, Inc. (2010 to 2013); Director, Blackstone Mortgage | ||
| Trust, a real estate finance company (2012 to 2016); Director | ||
| and Chairman of the Board, Brixmor Property Group, Inc. (2013 to | ||
| present); Director, Hilton Worldwide (2013 to present); Director, | ||
| Hudson Pacific Properties (2014 to 2016); Director, Invitation | ||
| Homes (2014 to present) | ||
| Mark R. Tercek | President and Chief Executive Officer, The Nature Conservancy | |
| (1957) | (2008 to present) | |
| 2009 | ||
| [191] | ||
| *Effective January 1, 2018, Ms. Bazemore and Mr. Daniels were elected as independent directors of the Price Funds. | ||
| **Mr. Deering served as an independent director of the Price Funds until November 17, 2017. | ||
(a)All information about the independent directors was current as of December 31, 2017, except for the information provided for Ms. Bazemore and Mr. Daniels, which is current as of January 1, 2018. | ||
(b)William J. Stromberg, president and CEO of T. Rowe Price Group, Inc., which is the parent company of the Price Funds’ investment adviser, has served on the Board of Trustees of The Johns Hopkins University since 2014 and is a member of The Johns Hopkins University Board’s Compensation Committee. | ||
Inside Directors
| Name | ||
| (Year of Birth) | ||
| Year Elected* | ||
| [Number of T. Rowe Price | Principal Occupation(s) and Directorships of Public Companies and | |
| Portfolios Overseen] | Other Investment Companies During the Past Five Years | |
| Edward C. Bernard | Director and Vice President, T. Rowe Price; Vice Chairman of the | |
| (1956) | Board, Director, and Vice President, T. Rowe Price Group, Inc.; | |
| 2006 | Chairman of the Board, Director, and Vice President, T. Rowe Price | |
| [191] | Investment Services, Inc., and T. Rowe Price Services, Inc.; Chairman | |
| of the Board and Director, T. Rowe Price Retirement Plan Services, | ||
| Inc.; Chairman of the Board, Chief Executive Officer, Director, and | ||
| President, T. Rowe Price International and T. Rowe Price Trust | ||
| Company; Chairman of the Board, all funds | ||
| Robert W. Sharps, CFA, CPA | Vice President, T. Rowe Price, T. Rowe Price Group, Inc., and T. Rowe | |
| (1971) | Price Trust Company | |
| 2017 | ||
| [136] | ||
| *Each inside director serves until retirement, resignation, or election of a successor. | ||
Officers
| Name (Year of Birth) | ||
| Position Held With Tax-Efficient Equity Fund | Principal Occupation(s) | |
| Kennard W. Allen (1977) | Vice President, T. Rowe Price and T. Rowe Price | |
| Vice President | Group, Inc. | |
| Ziad Bakri, M.D., CFA (1980) | Vice President, T. Rowe Price and T. Rowe Price | |
| Vice President | Group, Inc. | |
| Darrell N. Braman (1963) | Vice President, Price Hong Kong, Price | |
| Vice President and Secretary | Singapore, T. Rowe Price, T. Rowe Price Group, | |
| Inc., T. Rowe Price International, T. Rowe Price | ||
| Investment Services, Inc., and T. Rowe Price | ||
| Services, Inc. | ||
| Andrew S. Davis (1978) | Vice President, T. Rowe Price and T. Rowe Price | |
| Vice President | Group, Inc. | |
| Gregory Dunham, CFA (1974) | Vice President, T. Rowe Price and T. Rowe Price | |
| Vice President | Group, Inc.; formerly, Analyst, Goldman Sachs | |
| (to 2015) | ||
| Donald J. Easley, CFA (1971) | Vice President, T. Rowe Price and T. Rowe Price | |
| Vice President | Group, Inc. | |
| John R. Gilner (1961) | Chief Compliance Officer and Vice President, | |
| Chief Compliance Officer | T. Rowe Price; Vice President, T. Rowe Price | |
| Group, Inc., and T. Rowe Price Investment | ||
| Services, Inc. | ||
| Paul J. Krug, CPA (1964) | Vice President, T. Rowe Price, T. Rowe Price | |
| Vice President | Group, Inc., and T. Rowe Price Trust Company | |
| Catherine D. Mathews (1963) | Vice President, T. Rowe Price, T. Rowe Price | |
| Treasurer and Vice President | Group, Inc., and T. Rowe Price Trust Company | |
| David Oestreicher (1967) | Director and Vice President, T. Rowe Price | |
| Vice President | Investment Services, Inc., T. Rowe Price | |
| Retirement Plan Services, Inc., T. Rowe | ||
| Price Services, Inc., and T. Rowe Price Trust | ||
| Company; Chief Legal Officer and Vice | ||
| President, T. Rowe Price Group, Inc.; Vice | ||
| President, T. Rowe Price and T. Rowe Price | ||
| International; Vice President, Price Hong Kong | ||
| and Price Singapore | ||
| Donald J. Peters (1959) | Vice President, T. Rowe Price and T. Rowe Price | |
| President | Group, Inc. | |
| John W. Ratzesberger (1975) | Vice President, T. Rowe Price, T. Rowe Price | |
| Vice President | Group, Inc., and T. Rowe Price Trust Company; | |
| formerly, North American Head of Listed | ||
| Derivatives Operation, Morgan Stanley | ||
| (to 2013) | ||
| Shannon H. Rauser (1987) | Employee, T. Rowe Price | |
| Assistant Secretary | ||
| Weijie Si (1983) | Vice President, T. Rowe Price and T. Rowe Price | |
| Vice President | Group, Inc. | |
| Alan Tu (1985) | Vice President, T. Rowe Price and T. Rowe Price | |
| Vice President | Group, Inc.; formerly, intern, T. Rowe Price (to | |
| 2013); student, University of Chicago Booth | ||
| School of Business (to 2014) | ||
| Megan Warren (1968) | Vice President, T. Rowe Price, T. Rowe Price | |
| Vice President | Group, Inc., T. Rowe Price Retirement Plan | |
| Services, Inc., T. Rowe Price Services, Inc., | ||
| and T. Rowe Price Trust Company; formerly, | ||
| Executive Director, JP Morgan Chase (to 2017) | ||
| Mark R. Weigman, CFA, CIC (1962) | Vice President, T. Rowe Price, T. Rowe Price | |
| Vice President | Group, Inc., and T. Rowe Price Trust Company | |
| Unless otherwise noted, officers have been employees of T. Rowe Price or T. Rowe Price International for at least 5 years. | ||
Item 2. Code of Ethics.
The registrant has adopted a code of ethics, as defined in Item 2 of Form N-CSR, applicable to its principal executive officer, principal financial officer, principal accounting officer or controller, or persons performing similar functions. A copy of this code of ethics is filed as an exhibit to this Form N-CSR. No substantive amendments were approved or waivers were granted to this code of ethics during the period covered by this report.
Item 3. Audit Committee Financial Expert.
The registrant’s Board of Directors/Trustees has determined that Mr. Bruce W. Duncan qualifies as an audit committee financial expert, as defined in Item 3 of Form N-CSR. Mr. Duncan is considered independent for purposes of Item 3 of Form N-CSR.
Item 4. Principal Accountant Fees and Services.
(a) – (d) Aggregate fees billed for the last two fiscal years for professional services rendered to, or on behalf of, the registrant by the registrant’s principal accountant were as follows:
Audit fees include amounts related to the audit of the registrant’s annual financial statements and services normally provided by the accountant in connection with statutory and regulatory filings. Audit-related fees include amounts reasonably related to the performance of the audit of the registrant’s financial statements and specifically include the issuance of a report on internal controls and, if applicable, agreed-upon procedures related to fund acquisitions. Tax fees include amounts related to services for tax compliance, tax planning, and tax advice. The nature of these services specifically includes the review of distribution calculations and the preparation of Federal, state, and excise tax returns. All other fees include the registrant’s pro-rata share of amounts for agreed-upon procedures in conjunction with service contract approvals by the registrant’s Board of Directors/Trustees.
(e)(1) The registrant’s audit committee has adopted a policy whereby audit and non-audit services performed by the registrant’s principal accountant for the registrant, its investment adviser, and any entity controlling, controlled by, or under common control with the investment adviser that provides ongoing services to the registrant require pre-approval in advance at regularly scheduled audit committee meetings. If such a service is required between regularly scheduled audit committee meetings, pre-approval may be authorized by one audit committee member with ratification at the next scheduled audit committee meeting. Waiver of pre-approval for audit or non-audit services requiring fees of a de minimis amount is not permitted.
(2) No services included in (b) – (d) above were approved pursuant to paragraph (c)(7)(i)(C) of Rule 2-01 of Regulation S-X.
(f) Less than 50 percent of the hours expended on the principal accountant’s engagement to audit the registrant’s financial statements for the most recent fiscal year were attributed to work performed by persons other than the principal accountant’s full-time, permanent employees.
(g) The aggregate fees billed for the most recent fiscal year and the preceding fiscal year by the registrant’s principal accountant for non-audit services rendered to the registrant, its investment adviser, and any entity controlling, controlled by, or under common control with the investment adviser that provides ongoing services to the registrant were $2,160,000 and $1,840,000, respectively.
(h) All non-audit services rendered in (g) above were pre-approved by the registrant’s audit committee. Accordingly, these services were considered by the registrant’s audit committee in maintaining the principal accountant’s independence.
Item 5. Audit Committee of Listed Registrants.
Not applicable.
Item 6. Investments.
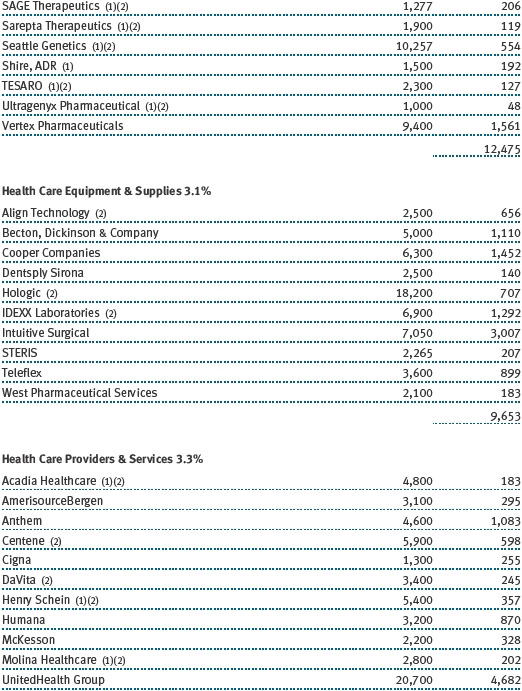
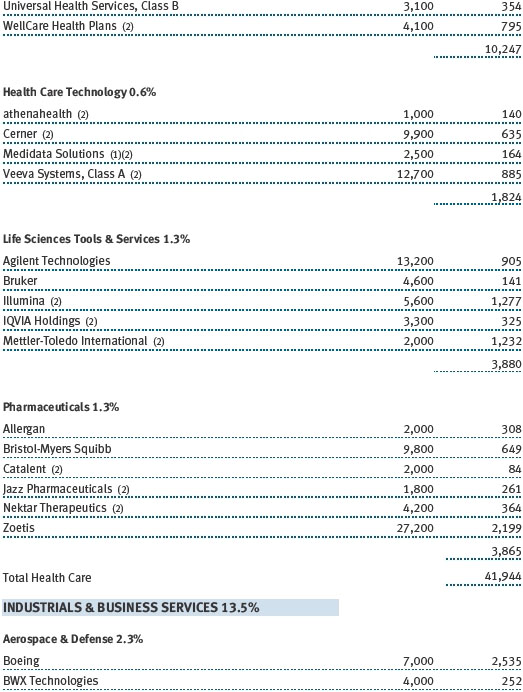
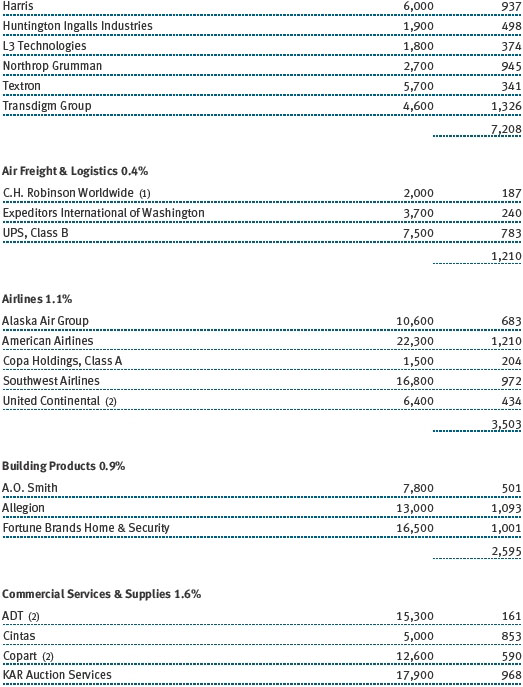
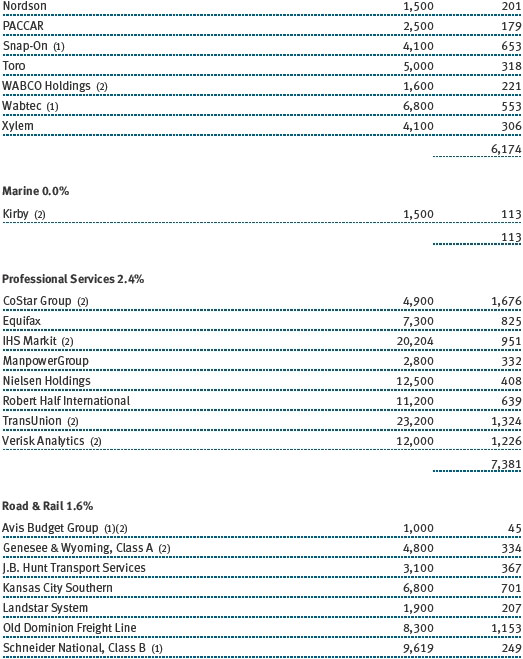
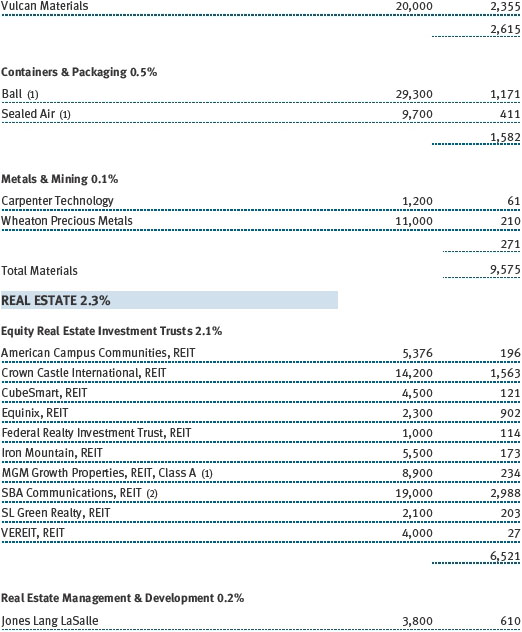
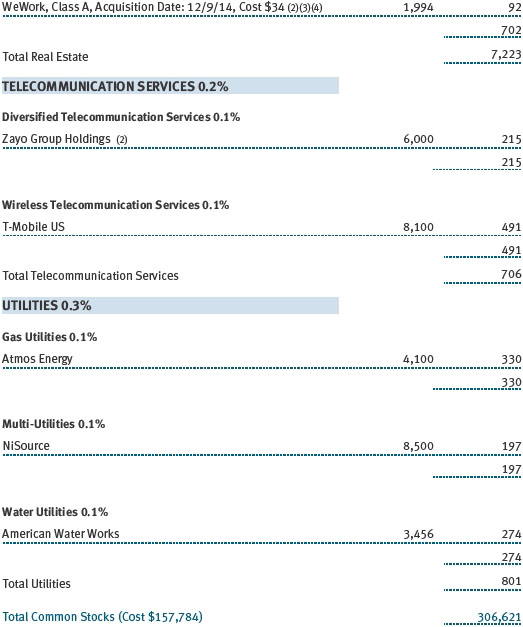
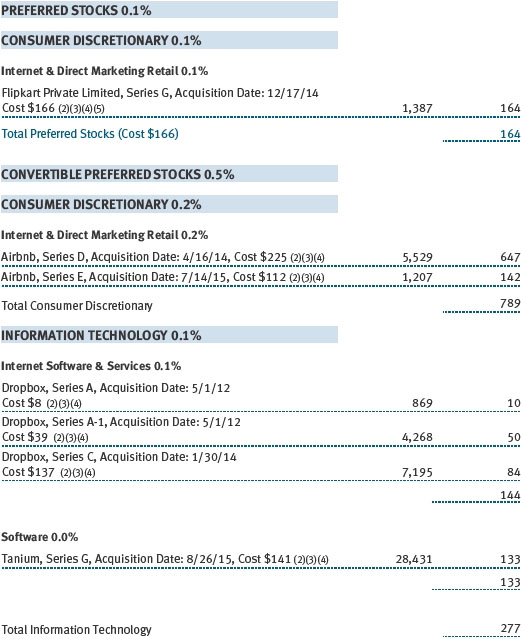
(a) Not applicable. The complete schedule of investments is included in Item 1 of this Form N-CSR.
(b) Not applicable.
Item 7. Disclosure of Proxy Voting Policies and Procedures for Closed-End Management Investment Companies.
Not applicable.
Item 8. Portfolio Managers of Closed-End Management Investment Companies.
Not applicable.
Item 9. Purchases of Equity Securities by Closed-End Management Investment Company and Affiliated Purchasers.
Not applicable.
Item 10. Submission of Matters to a Vote of Security Holders.
Not applicable.
Item 11. Controls and Procedures.
(a) The registrant’s principal executive officer and principal financial officer have evaluated the registrant’s disclosure controls and procedures within 90 days of this filing and have concluded that the registrant’s disclosure controls and procedures were effective, as of that date, in ensuring that information required to be disclosed by the registrant in this Form N-CSR was recorded, processed, summarized, and reported timely.
(b) The registrant’s principal executive officer and principal financial officer are aware of no change in the registrant’s internal control over financial reporting that occurred during the registrant’s second fiscal quarter covered by this report that has materially affected, or is reasonably likely to materially affect, the registrant’s internal control over financial reporting.
Item 12. Exhibits.
(a)(1) The registrant’s code of ethics pursuant to Item 2 of Form N-CSR is attached.
(2) Separate certifications by the registrant's principal executive officer and principal financial officer, pursuant to Section 302 of the Sarbanes-Oxley Act of 2002 and required by Rule 30a-2(a) under the Investment Company Act of 1940, are attached.
(3) Written solicitation to repurchase securities issued by closed-end companies: not applicable.
(b) A certification by the registrant's principal executive officer and principal financial officer, pursuant to Section 906 of the Sarbanes-Oxley Act of 2002 and required by Rule 30a-2(b) under the Investment Company Act of 1940, is attached.
SIGNATURES
Pursuant to the requirements of the Securities Exchange Act of 1934 and the Investment Company Act of 1940, the registrant has duly caused this report to be signed on its behalf by the undersigned, thereunto duly authorized.
T. Rowe Price Tax-Efficient Funds, Inc.
| By | /s/ Edward C. Bernard | |||||
| Edward C. Bernard | ||||||
| Principal Executive Officer | ||||||
| Date | April 18, 2018 | |||||
Pursuant to the requirements of the Securities Exchange Act of 1934 and the Investment Company Act of 1940, this report has been signed below by the following persons on behalf of the registrant and in the capacities and on the dates indicated.
| By | /s/ Edward C. Bernard | |||||
| Edward C. Bernard | ||||||
| Principal Executive Officer | ||||||
| Date | April 18, 2018 | |||||
| By | /s/ Catherine D. Mathews | |||||
| Catherine D. Mathews | ||||||
| Principal Financial Officer | ||||||
| Date | April 18, 2018 | |||||