UNITED STATES
SECURITIES AND EXCHANGE COMMISSION
Washington, D.C. 20549
FORM N-CSR
CERTIFIED SHAREHOLDER REPORT OF REGISTERED
MANAGEMENT INVESTMENT COMPANIES
Investment Company Act File Number: 811-08207
| T. Rowe Price Tax-Efficient Funds, Inc. |
|
| (Exact name of registrant as specified in charter) |
| |
| 100 East Pratt Street, Baltimore, MD 21202 |
|
| (Address of principal executive offices) |
| |
| David Oestreicher |
| 100 East Pratt Street, Baltimore, MD 21202 |
|
| (Name and address of agent for service) |
Registrant’s telephone number, including area code: (410) 345-2000
Date of fiscal year end: February 29
Date of reporting period: February 29, 2020
Item 1. Reports to Shareholders
(a) Report pursuant to Rule 30e-1.
| Tax-Efficient Equity Fund | February 29, 2020 |
| PREFX | Investor Class |
| TEEFX | I Class |
Beginning on January 1, 2021, as permitted by SEC regulations, paper copies of the T. Rowe Price funds’ annual and semiannual shareholder reports will no longer be mailed, unless you specifically request them. Instead, shareholder reports will be made available on the funds’ website (troweprice.com/prospectus), and you will be notified by mail with a website link to access the reports each time a report is posted to the site.
If you already elected to receive reports electronically, you will not be affected by this change and need not take any action. At any time, shareholders who invest directly in T. Rowe Price funds may generally elect to receive reports or other communications electronically by enrolling attroweprice.com/paperlessor, if you are a retirement plan sponsor or invest in the funds through a financial intermediary (such as an investment advisor, broker-dealer, insurance company, or bank), by contacting your representative or your financial intermediary.
You may elect to continue receiving paper copies of future shareholder reports free of charge. To do so, if you invest directly with T. Rowe Price, please call T. Rowe Price as follows: IRA, nonretirement account holders, and institutional investors,1-800-225-5132; small business retirement accounts,1-800-492-7670. If you are a retirement plan sponsor or invest in the T. Rowe Price funds through a financial intermediary, please contact your representative or financial intermediary or follow additional instructions if included with this document. Your election to receive paper copies of reports will apply to all funds held in your account with your financial intermediary or, if you invest directly in the T. Rowe Price funds, with T. Rowe Price. Your election can be changed at any time in the future.
| T. ROWE PRICE TAX-EFFICIENT EQUITY FUND |
|
HIGHLIGHTS
| ■ | The Tax-Efficient Equity Fund produced a solid gain over the last year and outperformed the Lipper Multi-Cap Growth Funds Index. |
| |
| ■ | The fund has made only minimal taxable distributions since its inception nearly 20 years ago. Its tax efficiency from the end of the year 2000 through February 29, 2020, was 99.85%. |
| |
| ■ | The fund is fairly unique given its focus on after-tax returns, whereas other growth portfolio managers focus only on pretax returns. As a result, other mutual funds generally show a material difference between returnsbeforetaxes and returnsaftertaxes—versus the very small difference between your fund’s pretax and after-tax returns. |
| |
| ■ | The outlook for fixed income returns is dismal. Given the low level of nominal yields, investors are facing negative real (inflation-adjusted) yields for all time periods out to 30 years. This is astonishing! While near-term equity market conditions may be challenging, the longer-term prospects for equities remain favorable, and we encourage equity investors to stay the course and maintain a multiyear time horizon. |

Log in to your account attroweprice.comfor more information.
*Certain mutual fund accounts that are assessed an annual account service fee can also save money by switching to e-delivery.
CIO Market Commentary
Dear Shareholder
Global markets produced mixed returns for your fund’s fiscal year, the 12-month period ended February 29, 2020, as optimism over progress in trade negotiations rapidly gave way to concerns about the global economic impact of the coronavirus. The large-cap S&P 500 Index reached record highs before falling back, and bonds also recorded strong results as yields declined. However, smaller-cap stocks lost ground, and a stronger U.S. dollar weighed on returns for U.S. investors in foreign securities.
While the ongoing U.S.-China trade dispute weighed periodically on sentiment, markets were supported in 2019 by accommodative central bank actions. The Federal Reserve delivered three quarter-percentage-point rate cuts and took steps to maintain liquidity in short-term lending markets. Other central banks also acted to address flagging growth, including the European Central Bank, which lowered its benchmark deposit rate deeper into negative territory and restarted its quantitative easing program.
Moreover, despite some setbacks along the way, the U.S. and China signed an initial trade deal in early 2020 that reduced some existing tariffs and canceled the imposition of new ones.
As a result of the improving trade situation and central bank stimulus, recession fears had largely dissipated by the start of the new year. Key U.S. manufacturing indicators showed signs of stabilizing, and the labor market remained strong, with solid payroll gains and an unemployment rate hovering near a 50-year low.
Corporate earnings also showed signs of improvement. According to FactSet, overall earnings for the S&P 500 increased slightly on a year-over-year basis in the fourth quarter of 2019, marking the first rise since late 2018, although results were held back by a plunge in energy sector profits. With this more encouraging economic backdrop, Fed officials seemed satisfied that monetary policy was properly positioned to support continued growth and forecast no additional rate moves in 2020.
However, market sentiment began to shift in January amid news of the coronavirus outbreak in China’s Hubei province. Although the effect was initially muted, with the S&P 500 advancing to a record high on February 19, markets became more volatile as it became clear the virus was spreading globally. South Korea, Italy, Japan, and Iran experienced significant outbreaks, and the S&P 500 quickly lost more than 10% over the final days of the period as concerns grew that the virus could weigh on growth and reduce corporate earnings.
While investors rotated out of stocks, demand for safe-haven securities sparked a rally in longer-term Treasuries. The benchmark 10-year U.S. Treasury note’s yield, which started the 12-month period at 2.73%, tumbled to a record-low 1.13%, and the yield of the 30-year Treasury long bond also reached a new nadir. Yields in many foreign markets, including Germany and Japan, dropped deeper into negative territory. (Bond prices and yields move in opposite directions.)
In the fixed income universe, Treasuries and investment-grade corporate bonds produced the strongest results, but all major bond sectors had positive returns over the past year.
Municipal bonds benefited from a favorable technical environment and produced solid gains. Federal tax reform has lifted demand for tax-exempt income, particularly in states with higher tax rates, while tax-exempt supply has been below longer-term averages as municipalities have increasingly been using the taxable market to refund debt at lower rates. With higher-quality muni yields at record lows, demand for Puerto Rico bonds and other lower-rated but higher-yielding segments of the muni market remained strong.
As we write this letter in early March, the course of the coronavirus outbreak remains highly uncertain, and markets are likely to remain volatile in response to any news about the virus.
Our global team of investment analysts, economists, and portfolio managers is carefully monitoring the situation, and I believe that our disciplined fundamental research and strategic investing approach will continue to serve our shareholders well.
Thank you for your continued confidence in T. Rowe Price.
Sincerely,

Robert Sharps
Group Chief Investment Officer
Management’s Discussion of Fund Performance
INVESTMENT OBJECTIVE
The fund seeks to maximize after-tax growth of capital through investments primarily in common stocks.
FUND COMMENTARY
How did the fund perform in the past 12 months?
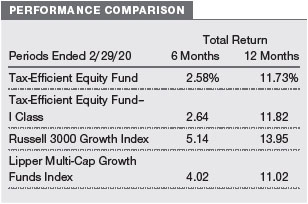
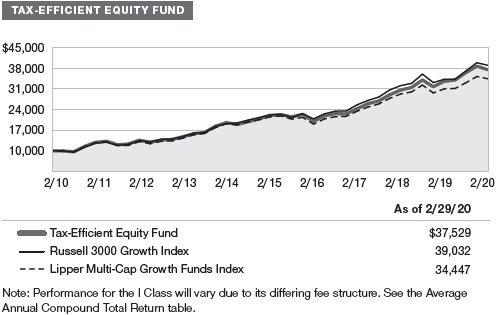
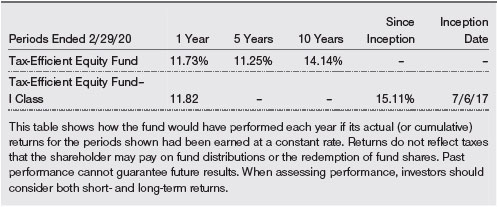
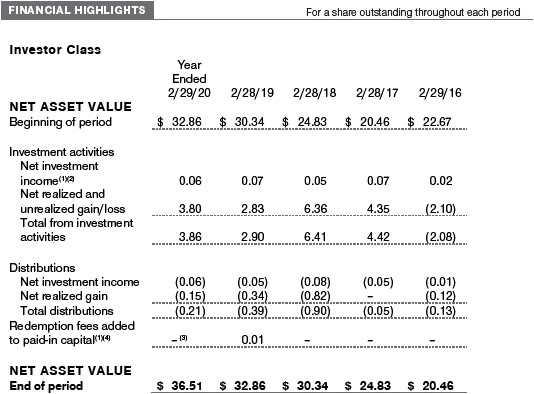
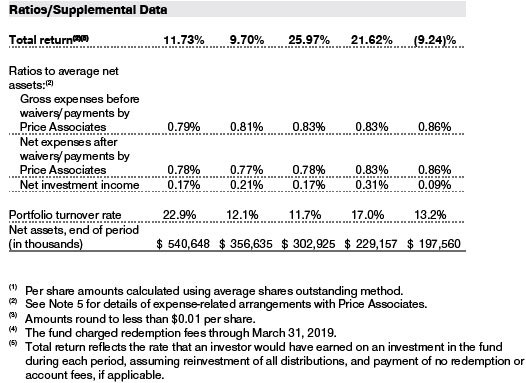
The Tax-Efficient Equity Fund returned 11.73% versus 13.95% for its benchmark, the Russell 3000 Growth Index, and 11.02% for the Lipper Multi-Cap Growth Funds Index. (Performance for the fund’s I Class shares will vary due to a different fee structure. The fund’s I Class shares are designed to be sold to various institutional investors and generally require a minimal initial investment of $1 million.Past performance cannot guarantee future results.)
What factors influenced the fund’s performance?
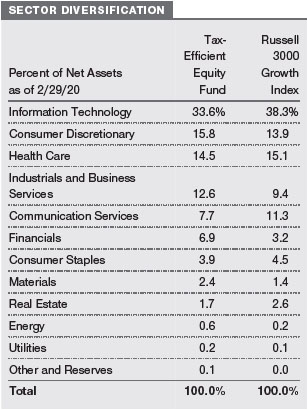
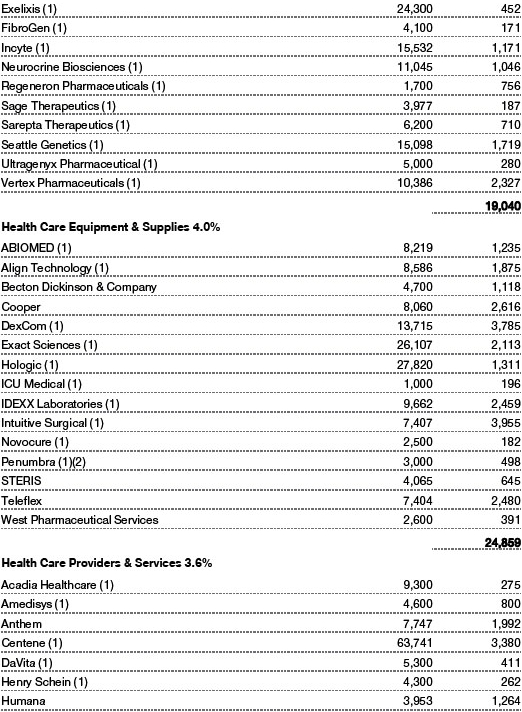
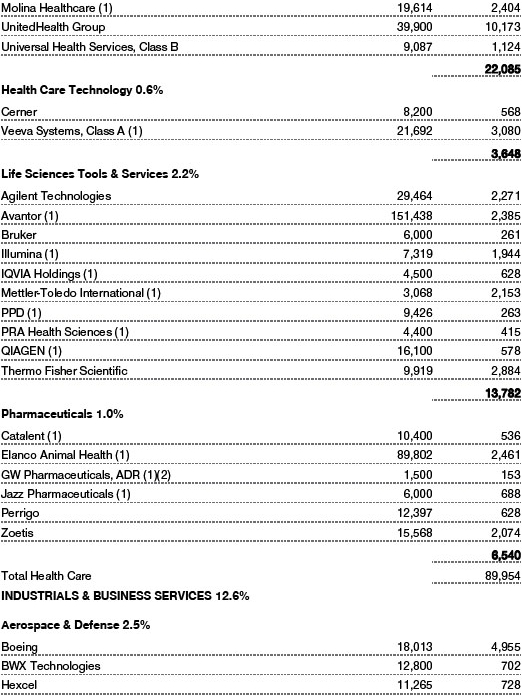
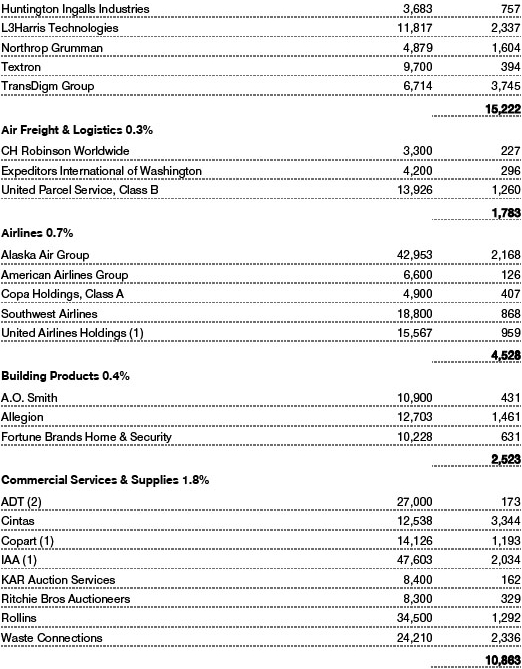
The fund trailed the Russell benchmark over the last year due to our weightings in most sectors, especially an underweight in the robust information technology (IT) sector and an overweight in the industrials and business services sector. Stock selection in aggregate had little impact on our relative results, as the benefits of our stock selection in the industrials and business services sector and, to a lesser extent, the real estate space were offset by our stock choices in IT and, to a lesser extent, in the energy and consumer staples segments.
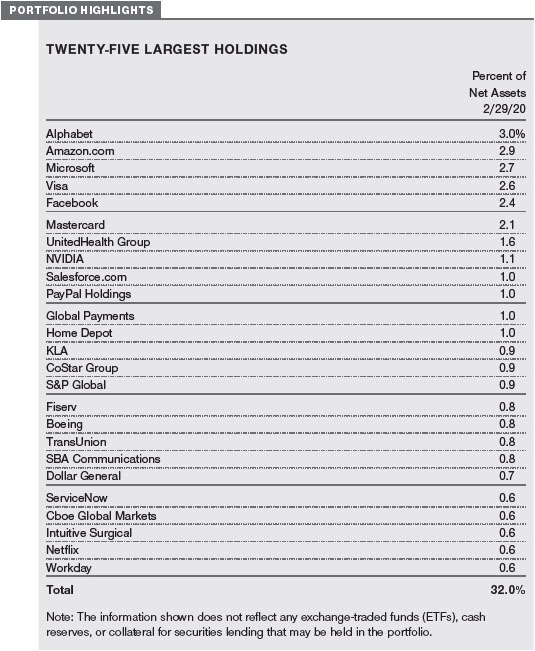
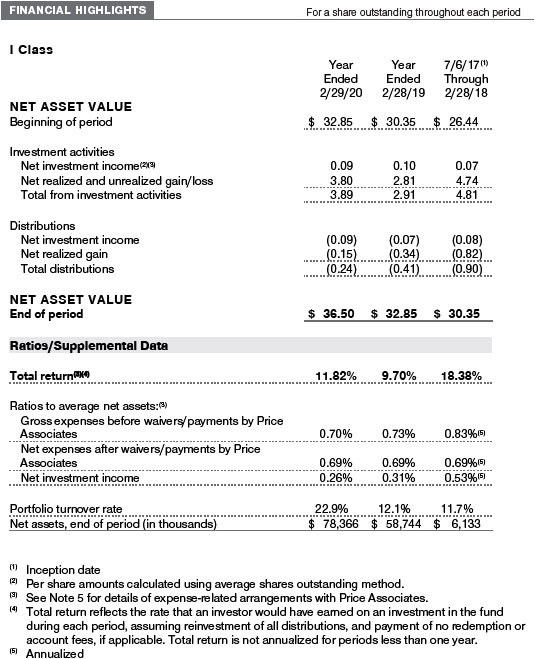
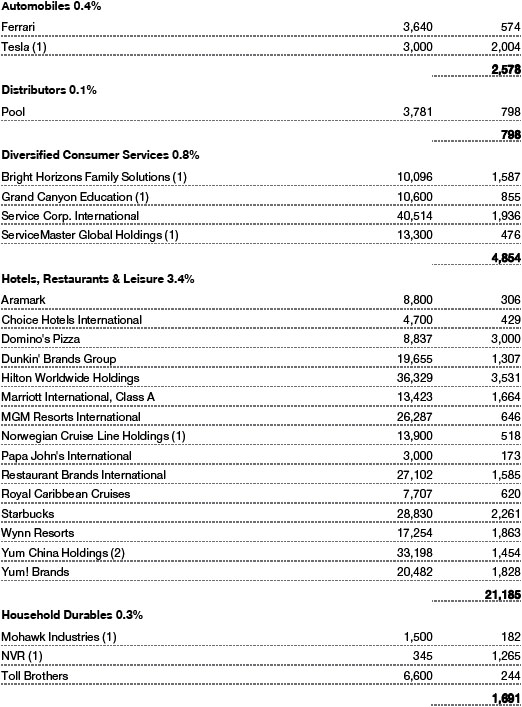
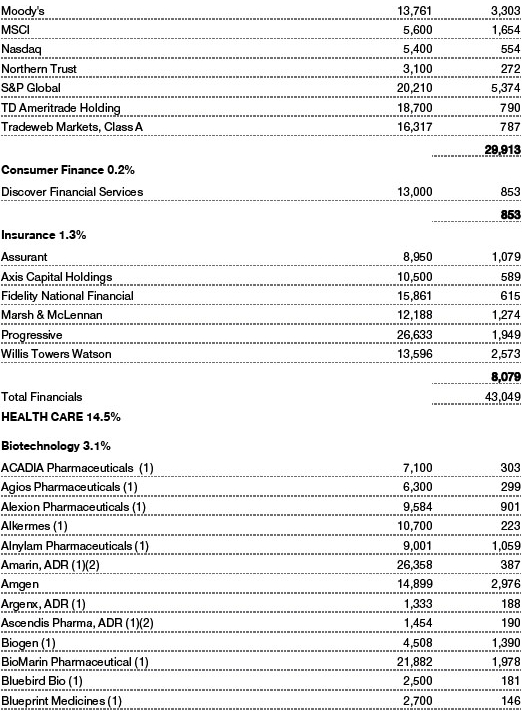
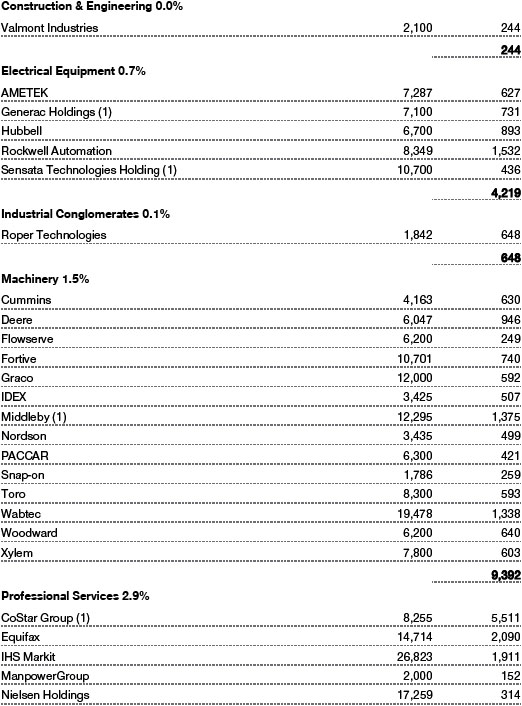
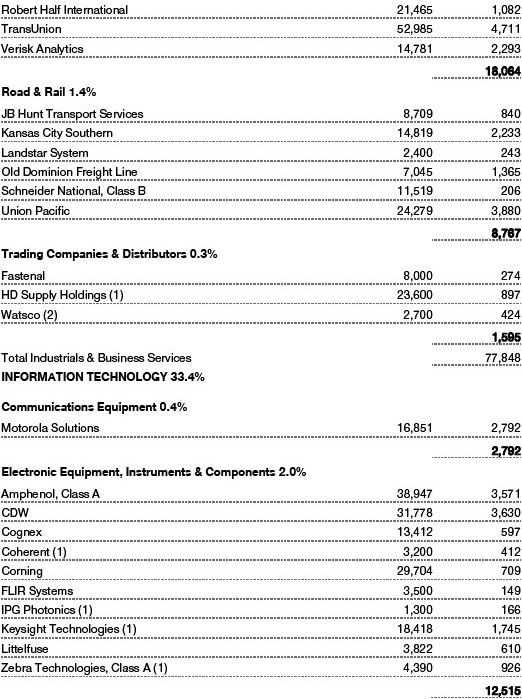
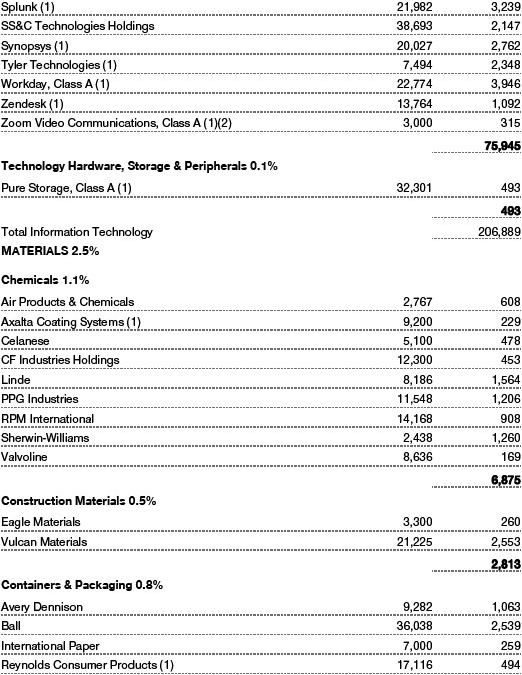
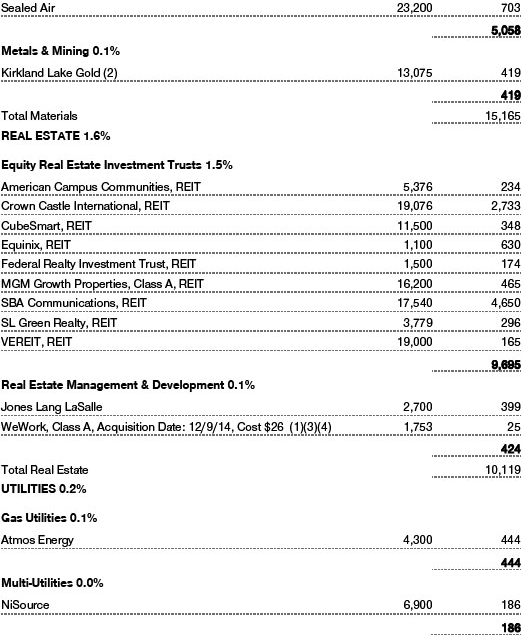
In the industrials and business services sector, fund performance benefited fromCoStar Group, the leading provider of commercial real estate information, analytics, and internet marketing services; credit bureauTransUnion; uniform rental and facility services companyCintas; and aerospace/defense manufacturerTransDigm Group. These are examples of what we seek in the sector: high-quality companies that provide more stable earnings under varying economic conditions. In real estate, which is a very small portion of the portfolio and our benchmark, our stakes in wireless tower operatorsSBA CommunicationsandCrown Castle International—bothof which are organized as real estate investment trusts—produced excellent results. (Please refer to the portfolio of investments for a complete list of holdings and the amount each represents in the portfolio.)
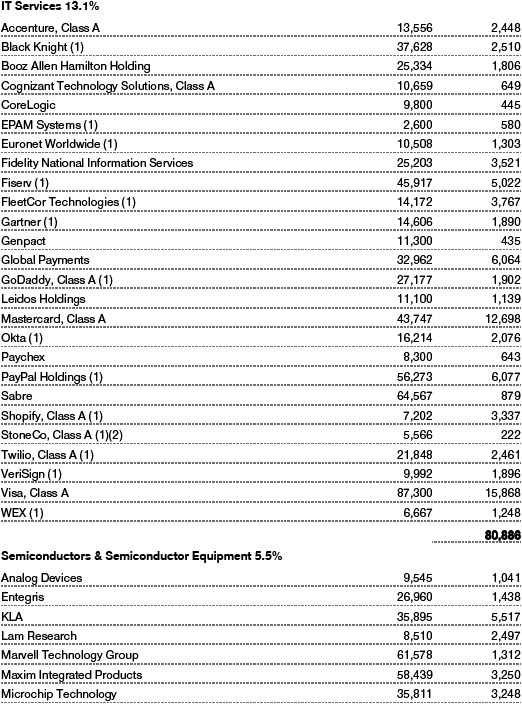
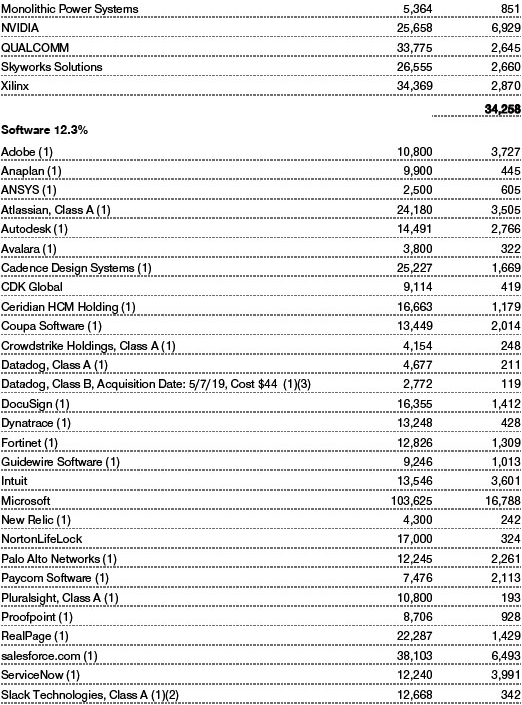
In the information technology sector—which was our largest absolute contributor to performance over the last year, thanks in part to strength in shares ofMicrosoft,Visa, andMastercard—our investments in semiconductor companyXilinxandWorkday, which specializes in cloud-based human capital management and financial management software solutions, underperformed and hurt our relative results. Our approach to the sector is to remain broadly diversified, and we favor companies with strong business models in industries with high barriers to entry and low risk of commoditization.
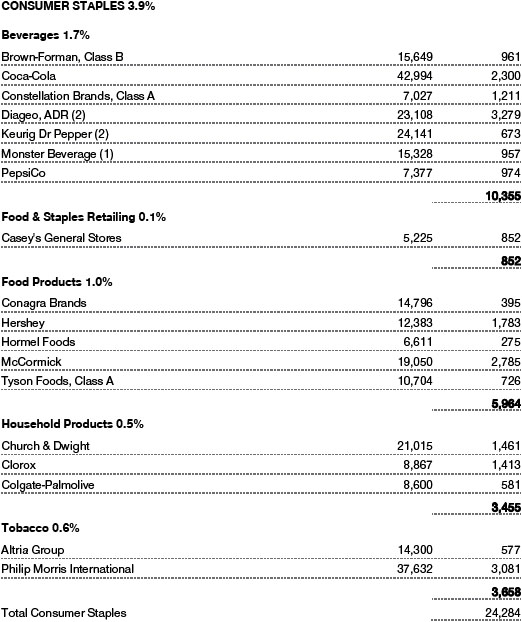
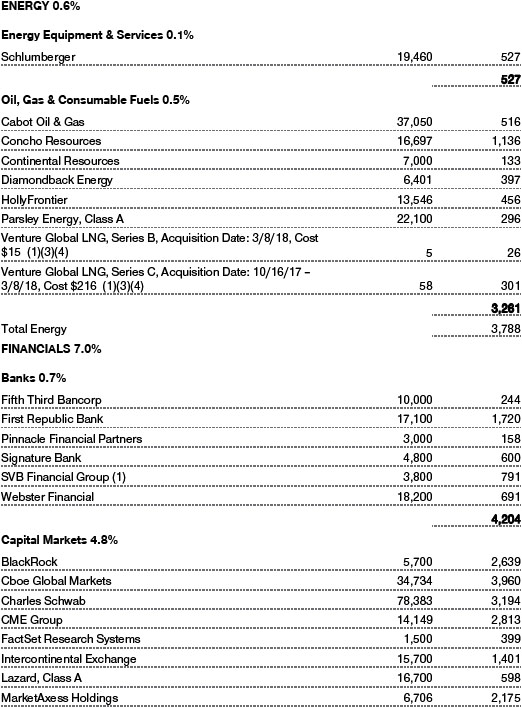
In the energy sector, our stakes in oil and gas producers weighed on our performance. While our sector allocation is very small, we look for energy companies that are adept at finding underlying resources and are well-positioned in the lowest cost basins. In consumer staples, where we believe most companies are mature and fairly valued and where we favor companies with strong brands, our investments in tobacco companyAltria GroupandKeurig Dr Pepperdetracted from our performance. Rival beverage makersCoca-ColaandPepsiCodid well on an absolute basis, however.
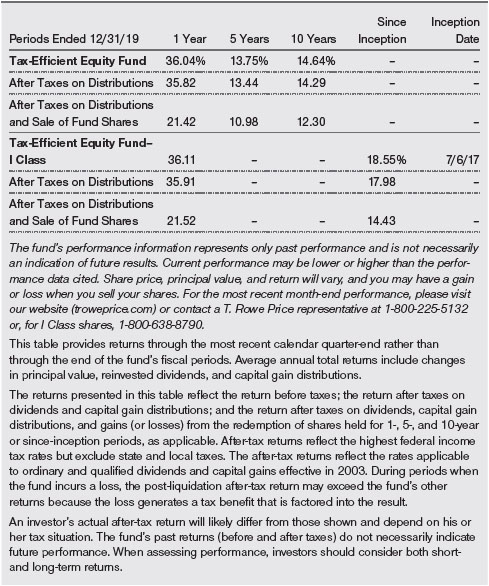
In our pursuit of strong, long-term after-tax returns, the fund has made only minimal taxable distributions since its inception nearly 20 years ago. Its tax efficiency since its inception on December 29, 2000, through February 29, 2020, was 99.85%. (The fund’s tax efficiency ratio is calculated by dividing its after-tax return by its pretax return.)
The fund is fairly unique given its focus on after-tax returns, whereas other growth portfolio managers focus only on pretax returns. To help us minimize taxable events, we keep the portfolio’s turnover rate low; it was 22.9% over the last year, which implies a holding period of about four to five years for a given stock. Other mutual funds may have more significant portfolio turnover every year, which can lead to large annual taxable capital gain distributions to their shareholders. As a result, they generally show a material difference between returnsbeforetaxes and returnsaftertaxes—versus the very small difference between your fund’s pretax and after-tax returns.
How is the fund positioned?
The fund seeks to buy and hold attractively valued, high-quality growth companies with good business models, strong management, and favorable long-term prospects. Our goal is to build and maintain a portfolio that provides strong after-tax returns over time.
Many of the fund’s fundamental characteristics are somewhat similar to those of the Russell 3000 Growth Index. However, the portfolio’s median market capitalization at the end of February was about $29.4 billion versus $124.2 billion for the benchmark, reflecting our preference for mid-cap companies over the largest companies.
Large-cap growth stocks have materially outperformed mid-cap growth companies over the three-year period ended February 29, 2020: The Russell 1000 Growth Index produced an annualized return of 15.67% versus 12.63% for the Russell Midcap Growth Index—a difference of about 300 basis points. Given this uncharacteristic underperformance, we are finding many more opportunities in the mid-cap space versus large-caps, and we believe our tilt toward mid-caps will provide a performance advantage over time.
As of February 29, the 12-month forward price/earnings ratio of the fund’s holdings (25.6) was higher than that of the Russell index (22.6), and the projected long-term earnings growth rate (13.2%) surpassed that of the index (12.1%). The fund’s return on equity (ROE), which measures how effectively and efficiently a company and its management are using stockholder investments, was 22.4% versus 29.4% for the index. While we consider a high ROE to be desirable, we do not necessarily seek companies with the highest ROEs. We prefer businesses with steady and sustainable growth and profitability, rather than companies whose growth and profitability are unsustainably high.
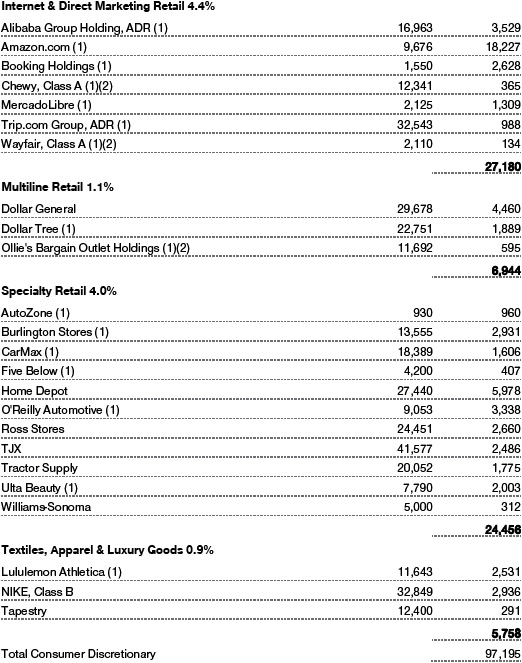
As shown in the Sector Diversification table on page 6, the fund’s information technology allocation at the end of February was the largest in absolute terms, but it is our largest underweight versus the benchmark. This sector has had extraordinary relative performance over the last five years. The tech sector is usually a “winner take all” space, and we try to avoid companies whose business models are challenged by competing products or services. Our communication services allocation was also a significant underweight. Our investments here have historically been concentrated in the entertainment and internet industries. We are underweight some of the largest internet companies.Our most significant sector overweights were in the financials sector, where we look for differentiated companies with high returns on invested capital, and in the industrials and business services segment, where we look for companies that have attractive valuations and are world-class in their respective niches.
What is portfolio management’s outlook?
The U.S. stock market has enjoyed very strong performance over the last decade, but as our reporting period ended, investor sentiment abruptly turned from bullish to bearish due to concerns about the spreading of COVID-19 around the world. This novel coronavirus is unlike anything we have seen in our lifetime, and no one knows how much and how long it will spread or how much economic and health care damage it will ultimately cause.
As we write this report, equity investors are panicking, and U.S. interest rates—which were already very low—are falling closer to 0%. As a result, the outlook for fixed income returns is dismal. Given the low level of nominal yields, investors are facing negative real (inflation-adjusted) yields for all time periods out to 30 years. This is astonishing! We wonder if scared investors realize that going to fixed income for an extended period will result in nominal losses when yields eventually rise or a loss of purchasing power even if ultralow yields stay flat. The capital markets are providing strong incentives to take reasonable risks if one has a multiyear time horizon.
While the longer-term prospects for equities remain favorable, investors should expect near-term equity market conditions to be challenging. Nevertheless, we remain convinced that equities will provide dramatically better long-term performance than fixed income. We also strongly discourage attempts to “time” the market. The probability of getting the buy and sell decisions right approaches zero.
While economic uncertainty is likely to prevail in the months ahead, we will not spend our time trying to determine the depth and magnitude of the downturn. Our focus will remain on our well-established and disciplined investment process of finding and investing in companies with favorable attributes and staying fully invested. We believe that our long-term focus, valuation-sensitivity, quality bias, and risk-awareness have contributed to our favorable long-term performance record and will continue to serve our investors well over time.
The views expressed reflect the opinions of T. Rowe Price as of the date of this report and are subject to change based on changes in market, economic, or other conditions. These views are not intended to be a forecast of future events and are no guarantee of future results.
RISKS OF INVESTING IN THE TAX-EFFICIENT EQUITY FUND
Common stocks generally fluctuate in value more than bonds and may decline significantly over short time periods. There is a chance that stock prices overall will decline because stock markets tend to move in cycles, with periods of rising and falling prices. The value of a stock in which the fund invests may decline due to general weakness in the stock market or because of factors that affect a particular company or industry.
The fund’s focus on large and medium-sized companies subjects the fund to the risks that larger companies may not be able to attain the high growth rates of successful smaller companies, especially during strong economic periods, and that they may be less capable of responding quickly to competitive challenges and industry changes. Because the fund focuses on large and medium-sized companies, its share price could be more volatile than that of a fund that invests only in large companies. Medium-sized companies typically have less experienced management, narrower product lines, more limited financial resources, and less publicly available information than larger companies.
Different investment styles tend to shift in and out of favor depending on market conditions and investor sentiment. The fund’s growth approach to investing could cause it to underperform when compared with other stock funds that employ a different investment style. Growth stocks tend to be more volatile than certain other types of stocks, and their prices may fluctuate more dramatically than the overall stock market. A stock with growth characteristics can have sharp price declines due to decreases in current or expected earnings and may lack dividends that can help cushion its share price in a declining market. In addition, the fund’s attempts at investing in a tax-efficient manner could cause it to underperform similar funds that do not make tax efficiency a primary focus.
BENCHMARK INFORMATION
Note: Frank Russell Company (Russell) is the source and owner of the Russell index data contained or reflected in these materials and all trademarks and copyrights related thereto. Russell® is a registered trademark of Russell. Russellis not responsible for the formatting or configuration of these materials or for any inaccuracy in T. Rowe Price Associates’ presentation thereof.
Note: Lipper, a Thomson Reuters Company, is the source for all Lipper content reflected in these materials. Copyright 2020 © Refinitiv. All rights reserved. Any copying, republication, or redistribution of Lipper content is expressly prohibited without the prior written consent of Lipper. Lipper shall not be liable for any errors or delays in the content, or for any actions taken in reliance thereon.
Note: ©2020, S&P Global Market Intelligence. Reproduction of any information, data, or material, including ratings (“Content”) in any form is prohibited except with the prior written permission of the relevant party. Such party, its affiliates, and suppliers (“Content Providers”) do not guarantee the accuracy, adequacy, completeness, timeliness, or availability of any Content and are not responsible for any errors or omissions (negligent or otherwise), regardless of the cause, or for the results obtained from the use of such Content. In no event shall Content Providers be liable for any damages, costs, expenses, legal fees, or losses (including lost income or lost profit and opportunity costs) in connection with any use of the Content.
GROWTH OF $10,000
This chart shows the value of a hypothetical $10,000 investment in the fund over the past 10 fiscal year periods or since inception (for funds lacking 10-year records). The result is compared with benchmarks, which include a broad-based market index and may also include a peer group average or index. Market indexes do not include expenses, which are deducted from fund returns as well as mutual fund averages and indexes.
AVERAGE ANNUAL COMPOUND TOTAL RETURN
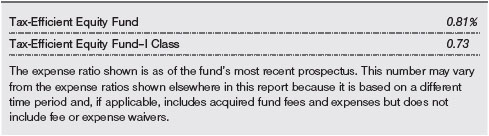
EXPENSE RATIO
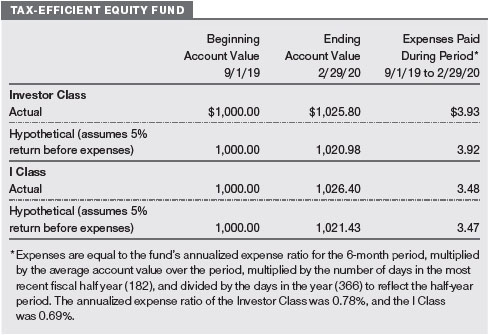
FUND EXPENSE EXAMPLE
As a mutual fund shareholder, you may incur two types of costs: (1) transaction costs, such as redemption fees or sales loads, and (2) ongoing costs, including management fees, distribution and service (12b-1) fees, and other fund expenses. The following example is intended to help you understand your ongoing costs (in dollars) of investing in the fund and to compare these costs with the ongoing costs of investing in other mutual funds. The example is based on an investment of $1,000 invested at the beginning of the most recent six-month period and held for the entire period.
Please note that the fund has two share classes: The original share class (Investor Class) charges no distribution and service (12b-1) fee, and the I Class shares are also available to institutionally oriented clients and impose no 12b-1 or administrative fee payment. Each share class is presented separately in the table.
Actual Expenses
The first line of the following table (Actual) provides information about actual account values and expenses based on the fund’s actual returns. You may use the information on this line, together with your account balance, to estimate the expenses that you paid over the period. Simply divide your account value by $1,000 (for example, an $8,600 account value divided by $1,000 = 8.6), then multiply the result by the number on the first line under the heading “Expenses Paid During Period” to estimate the expenses you paid on your account during this period.
Hypothetical Example for Comparison Purposes
The information on the second line of the table (Hypothetical) is based on hypothetical account values and expenses derived from the fund’s actual expense ratio and an assumed 5% per year rate of return before expenses (not the fund’s actual return). You may compare the ongoing costs of investing in the fund with other funds by contrasting this 5% hypothetical example and the 5% hypothetical examples that appear in the shareholder reports of the other funds. The hypothetical account values and expenses may not be used to estimate the actual ending account balance or expenses you paid for the period.
Note:T. Rowe Price charges an annual account service fee of $20, generally for accounts with less than $10,000. The fee is waived for any investor whose T. Rowe Price mutual fund accounts total $50,000 or more; accounts electing to receive electronic delivery of account statements, transaction confirmations, prospectuses, and shareholder reports; or accounts of an investor who is a T. Rowe Price Personal Services or Enhanced Personal Services client (enrollment in these programs generally requires T. Rowe Price assets of at least $250,000). This fee is not included in the accompanying table. If you are subject to the fee, keep it in mind when you are estimating the ongoing expenses of investing in the fund and when comparing the expenses of this fund with other funds.
You should also be aware that the expenses shown in the table highlight only your ongoing costs and do not reflect any transaction costs, such as redemption fees or sales loads. Therefore, the second line of the table is useful in comparing ongoing costs only and will not help you determine the relative total costs of owning different funds. To the extent a fund charges transaction costs, however, the total cost of owning that fund is higher.
QUARTER-END RETURNS
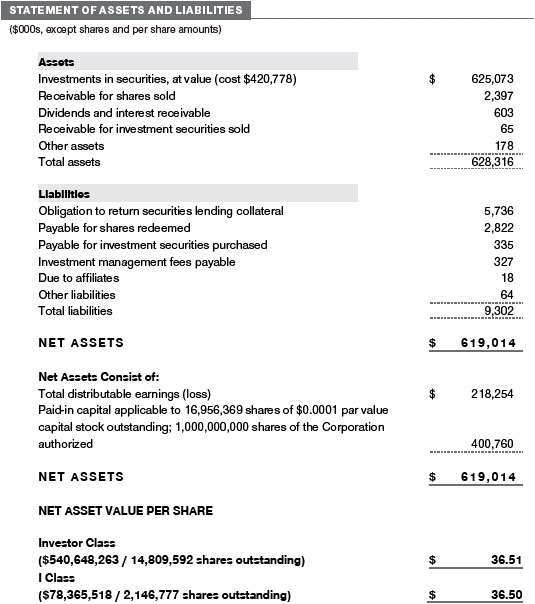
The accompanying notes are an integral part of these financial statements.
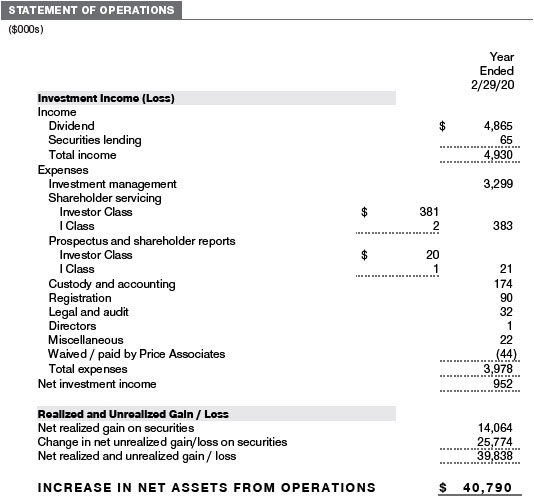
The accompanying notes are an integral part of these financial statements.
February 29, 2020

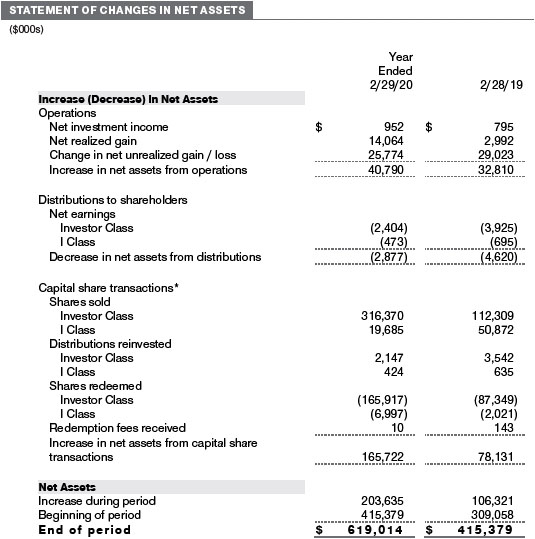
The accompanying notes are an integral part of these financial statements.
February 29, 2020
The accompanying notes are an integral part of these financial statements.
The accompanying notes are an integral part of these financial statements.
The accompanying notes are an integral part of these financial statements.
| NOTES TO FINANCIAL STATEMENTS |
T. Rowe Price Tax-Efficient Equity Fund, Inc. (the corporation) is registered under the Investment Company Act of 1940 (the 1940 Act). The Tax-Efficient Equity Fund (the fund) is a diversified, open-end management investment company established by the corporation. The fund seeks to maximize after-tax growth of capital through investments primarily in common stocks. The fund has two classes of shares: the Tax-Efficient Equity Fund (Investor Class) and the Tax-Efficient Equity Fund–I Class (I Class). I Class shares require a $1 million initial investment minimum, although the minimum generally is waived for retirement plans, financial intermediaries, and certain other accounts. Each class has exclusive voting rights on matters related solely to that class; separate voting rights on matters that relate to both classes; and, in all other respects, the same rights and obligations as the other class.
NOTE 1 - SIGNIFICANT ACCOUNTING POLICIES
Basis of PreparationThe fund is an investment company and follows accounting and reporting guidance in the Financial Accounting Standards Board (FASB)Accounting Standards CodificationTopic 946 (ASC 946). The accompanying financial statements were prepared in accordance with accounting principles generally accepted in the United States of America (GAAP), including, but not limited to, ASC 946. GAAP requires the use of estimates made by management. Management believes that estimates and valuations are appropriate; however, actual results may differ from those estimates, and the valuations reflected in the accompanying financial statements may differ from the value ultimately realized upon sale or maturity.
Investment Transactions, Investment Income, and DistributionsInvestment transactions are accounted for on the trade date basis. Income and expenses are recorded on the accrual basis. Realized gains and losses are reported on the identified cost basis. Income tax-related interest and penalties, if incurred, are recorded as income tax expense. Dividends received from mutual fund investments are reflected as dividend income; capital gain distributions are reflected as realized gain/loss. Dividend income and capital gain distributions are recorded on the ex-dividend date. Distributions from REITs are initially recorded as dividend income and, to the extent such represent a return of capital or capital gain for tax purposes, are reclassified when such information becomes available. Non-cash dividends, if any, are recorded at the fair market value of the asset received. Distributions to shareholders are recorded on the ex-dividend date. Income distributions, if any, are declared and paid by each class annually. A capital gain distribution may also be declared and paid by the fund annually.
Class AccountingShareholder servicing, prospectus, and shareholder report expenses incurred by each class are charged directly to the class to which they relate. Expenses common to both classes, investment income, and realized and unrealized gains and losses are allocated to the classes based upon the relative daily net assets of each class.
Redemption FeesPrior to April 1, 2019, a 1% fee was assessed on redemptions of fund shares held for less than 365 days to deter short-term trading and to protect the interests of long-term shareholders. Redemption fees were withheld from proceeds that shareholders received from the sale or exchange of fund shares. The fees were paid to the fund and were recorded as an increase to paid-in capital. The fees may have caused the redemption price per share to differ from the net asset value per share.
New Accounting GuidanceEffective March 1, 2019, the fund adopted FASB guidance that shortened the amortization period for certain callable debt securities held at a premium. Adoption had no effect on the fund’s net assets or results of operations.
IndemnificationIn the normal course of business, the fund may provide indemnification in connection with its officers and directors, service providers, and/or private company investments. The fund’s maximum exposure under these arrangements is unknown; however, the risk of material loss is currently considered to be remote.
NOTE 2 - VALUATION
The fund’s financial instruments are valued and each class’s net asset value (NAV) per share is computed at the close of the New York Stock Exchange (NYSE), normally 4 p.m. ET, each day the NYSE is open for business. However, the NAV per share may be calculated at a time other than the normal close of the NYSE if trading on the NYSE is restricted, if the NYSE closes earlier, or as may be permitted by the SEC.
Fair ValueThe fund’s financial instruments are reported at fair value, which GAAP defines as the price that would be received to sell an asset or paid to transfer a liability in an orderly transaction between market participants at the measurement date. The T. Rowe Price Valuation Committee (the Valuation Committee) is an internal committee that has been delegated certain responsibilities by the fund’s Board of Directors (the Board) to ensure that financial instruments are appropriately priced at fair value in accordance with GAAP and the 1940 Act. Subject to oversight by the Board, the Valuation Committee develops and oversees pricing-related policies and procedures and approves all fair value determinations. Specifically, the Valuation Committee establishes procedures to value securities; determines pricing techniques, sources, and persons eligible to effect fair value pricing actions; oversees the selection, services,and performance of pricing vendors; oversees valuation-related business continuity practices; and provides guidance on internal controls and valuation-related matters. The Valuation Committee reports to the Board and has representation from legal, portfolio management and trading, operations, risk management, and the fund’s treasurer.
Various valuation techniques and inputs are used to determine the fair value of financial instruments. GAAP establishes the following fair value hierarchy that categorizes the inputs used to measure fair value:
Level 1 – quoted prices (unadjusted) in active markets for identical financial instruments that the fund can access at the reporting date
Level 2 – inputs other than Level 1 quoted prices that are observable, either directly or indirectly (including, but not limited to, quoted prices for similar financial instruments in active markets, quoted prices for identical or similar financial instruments in inactive markets, interest rates and yield curves, implied volatilities, and credit spreads)
Level 3 – unobservable inputs
Observable inputs are developed using market data, such as publicly available information about actual events or transactions, and reflect the assumptions that market participants would use to price the financial instrument. Unobservable inputs are those for which market data are not available and are developed using the best information available about the assumptions that market participants would use to price the financial instrument. GAAP requires valuation techniques to maximize the use of relevant observable inputs and minimize the use of unobservable inputs. When multiple inputs are used to derive fair value, the financial instrument is assigned to the level within the fair value hierarchy based on the lowest-level input that is significant to the fair value of the financial instrument. Input levels are not necessarily an indication of the risk or liquidity associated with financial instruments at that level but rather the degree of judgment used in determining those values.
Valuation TechniquesEquity securities listed or regularly traded on a securities exchange or in the over-the-counter (OTC) market are valued at the last quoted sale price or, for certain markets, the official closing price at the time the valuations are made. OTC Bulletin Board securities are valued at the mean of the closing bid and asked prices. A security that is listed or traded on more than one exchange is valued at the quotation on the exchange determined to be the primary market for such security. Listed securities not traded on a particular day are valued at the mean of the closing bid and asked prices. Actively traded equity securities listed on a domestic exchange generally are categorizedin Level 1 of the fair value hierarchy. OTC Bulletin Board securities, certain preferred securities, and equity securities traded in inactive markets generally are categorized in Level 2 of the fair value hierarchy.
Investments in mutual funds are valued at the mutual fund’s closing NAV per share on the day of valuation and are categorized in Level 1 of the fair value hierarchy. Assets and liabilities other than financial instruments, including short-term receivables and payables, are carried at cost, or estimated realizable value, if less, which approximates fair value.
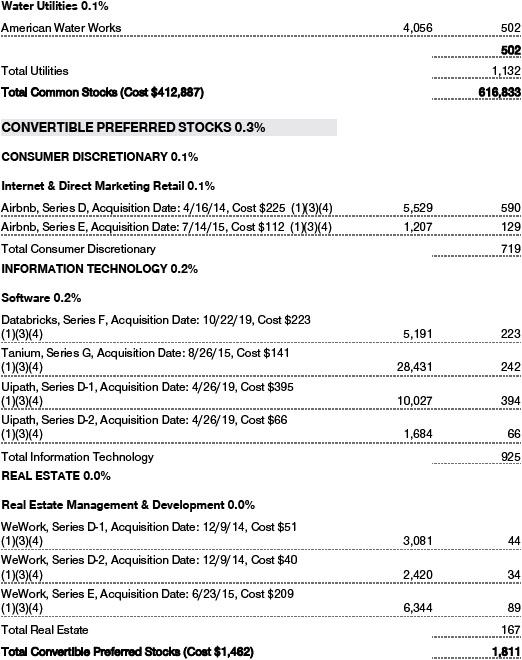
Thinly traded financial instruments and those for which the above valuation procedures are inappropriate or are deemed not to reflect fair value are stated at fair value as determined in good faith by the Valuation Committee. The objective of any fair value pricing determination is to arrive at a price that could reasonably be expected from a current sale. Financial instruments fair valued by the Valuation Committee are primarily private placements, restricted securities, warrants, rights, and other securities that are not publicly traded.
Subject to oversight by the Board, the Valuation Committee regularly makes good faith judgments to establish and adjust the fair valuations of certain securities as events occur and circumstances warrant. For instance, in determining the fair value of an equity investment with limited market activity, such as a private placement or a thinly traded public company stock, the Valuation Committee considers a variety of factors, which may include, but are not limited to, the issuer’s business prospects, its financial standing and performance, recent investment transactions in the issuer, new rounds of financing, negotiated transactions of significant size between other investors in the company, relevant market valuations of peer companies, strategic events affecting the company, market liquidity for the issuer, and general economic conditions and events. In consultation with the investment and pricing teams, the Valuation Committee will determine an appropriate valuation technique based on available information, which may include both observable and unobservable inputs. The Valuation Committee typically will afford greatest weight to actual prices in arm’s length transactions, to the extent they represent orderly transactions between market participants, transaction information can be reliably obtained, and prices are deemed representative of fair value. However, the Valuation Committee may also consider other valuation methods such as market-based valuation multiples; a discount or premium from market value of a similar, freely traded security of the same issuer; or some combination. Fair value determinations are reviewed on a regular basis and updated as information becomes available, including actual purchase and sale transactions of the issue. Because any fair value determination involves a significant amount of judgment, there is a degree of subjectivity inherent in such pricing decisions, and fair value prices determined by the Valuation Committeecould differ from those of other market participants. Depending on the relative significance of unobservable inputs, including the valuation technique(s) used, fair valued securities may be categorized in Level 2 or 3 of the fair value hierarchy.
Valuation InputsThe following table summarizes the fund’s financial instruments, based on the inputs used to determine their fair values on February 29, 2020 (for further detail by category, please refer to the accompanying Portfolio of Investments):
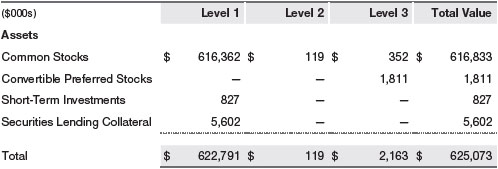
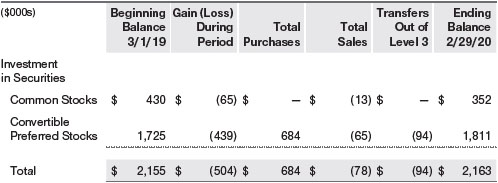
Following is a reconciliation of the fund’s Level 3 holdings for the year ended February 29, 2020. Gain (loss) reflects both realized and change in unrealized gain/loss on Level 3 holdings during the period, if any, and is included on the accompanying Statement of Operations. The change in unrealized gain/loss on Level 3 instruments held at February 29, 2020, totaled $(534,000) for the year ended February 29, 2020. During the year, transfers out of Level 3 were because observable market data became available for the security.
NOTE 3 - OTHER INVESTMENT TRANSACTIONS
Consistent with its investment objective, the fund engages in the following practices to manage exposure to certain risks and/or to enhance performance. The investment objective, policies, program, and risk factors of the fund are described more fully in the fund’s prospectus and Statement of Additional Information.
Restricted SecuritiesThe fund invests in securities that are subject to legal or contractual restrictions on resale. Prompt sale of such securities at an acceptable price may be difficult and may involve substantial delays and additional costs.
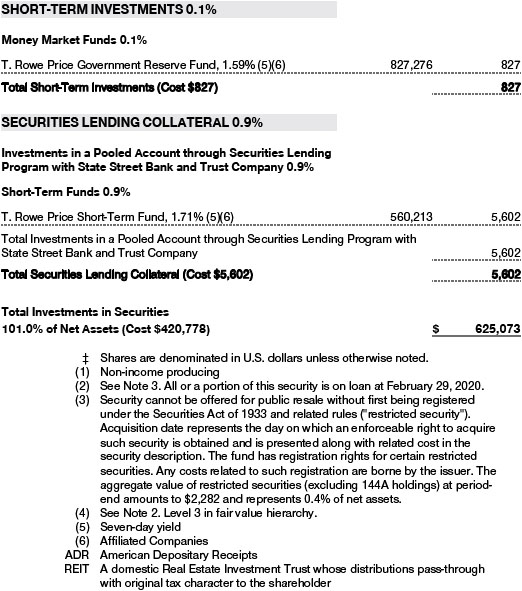
Securities LendingThe fund may lend its securities to approved borrowers to earn additional income. Its securities lending activities are administered by a lending agent in accordance with a securities lending agreement. Security loans generally do not have stated maturity dates, and the fund may recall a security at any time. The fund receives collateral in the form of cash or U.S. government securities. Collateral is maintained over the life of the loan in an amount not less than the value of loaned securities; any additional collateral required due to changes in security values is delivered to the fund the next business day. Cash collateral is invested in accordance with investment guidelines approved by fund management. Additionally, the lending agent indemnifies the fund against losses resulting from borrower default. Although risk is mitigated by the collateral and indemnification, the fund could experience a delay in recovering its securities and a possible loss of income or value if the borrower fails to return the securities, collateral investments decline in value, and the lending agent fails to perform. Securities lending revenue consists of earnings on invested collateral and borrowing fees, net of any rebates to the borrower, compensation to the lending agent, and other administrative costs. In accordance with GAAP, investments made with cash collateral are reflected in the accompanying financial statements, but collateral received in the form of securities is not. At February 29, 2020, the value of loaned securities was $5,505,000; the value of cash collateral and related investments was $5,736,000.
OtherPurchases and sales of portfolio securities other than short-term securities aggregated $282,695,000 and $117,814,000, respectively, for the year ended February 29, 2020.
NOTE 4 - FEDERAL INCOME TAXES
No provision for federal income taxes is required since the fund intends to continue to qualify as a regulated investment company under Subchapter M of the Internal Revenue Code and distribute to shareholders all of its taxable income and gains.Distributions determined in accordance with federal income tax regulations may differ in amount or character from net investment income and realized gains for financial reporting purposes.
The fund files U.S. federal, state, and local tax returns as required. The fund’s tax returns are subject to examination by the relevant tax authorities until expiration of the applicable statute of limitations, which is generally three years after the filing of the tax return but which can be extended to six years in certain circumstances. Tax returns for open years have incorporated no uncertain tax positions that require a provision for income taxes.
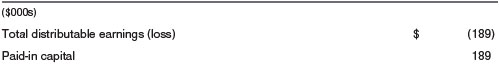
Financial reporting records are adjusted for permanent book/tax differences to reflect tax character but are not adjusted for temporary differences. The permanent book/tax adjustments have no impact on results of operations or net assets and relate primarily to a tax practice that treats a portion of the proceeds from each redemption of capital shares as a distribution of taxable net investment income or realized capital gain. For the year ended February 29, 2020, the following reclassification was recorded:
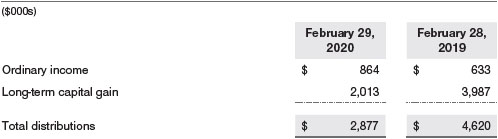
Distributions during the years ended February 29, 2020 and February 28, 2019, were characterized for tax purposes as follows:
At February 29, 2020, the tax-basis cost of investments and components of net assets were as follows:
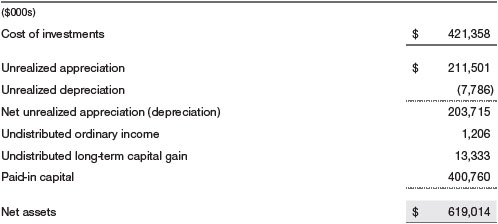
The difference between book-basis and tax-basis net unrealized appreciation (depreciation) is attributable to the deferral of losses from wash sales for tax purposes.
NOTE 5 - RELATED PARTY TRANSACTIONS
The fund is managed by T. Rowe Price Associates, Inc. (Price Associates), a wholly owned subsidiary of T. Rowe Price Group, Inc. (Price Group). The investment management agreement between the fund and Price Associates provides for an annual investment management fee, which is computed daily and paid monthly. The fee consists of an individual fund fee, equal to 0.35% of the fund’s average daily net assets, and a group fee. The group fee rate is calculated based on the combined net assets of certain mutual funds sponsored by Price Associates (the group) applied to a graduated fee schedule, with rates ranging from 0.48% for the first $1 billion of assets to 0.265% for assets in excess of $650 billion. The fund’s group fee is determined by applying the group fee rate to the fund’s average daily net assets. The fee is computed daily and paid monthly. At February 29, 2020, the effective annual group fee rate was 0.29%.
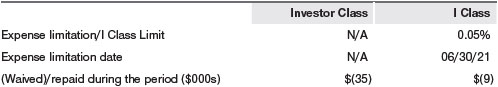
The I Class is subject to an operating expense limitation (I Class Limit) pursuant to which Price Associates is contractually required to pay all operating expenses of the I Class, excluding management fees; interest; expenses related to borrowings, taxes, and brokerage; and other non-recurring expenses permitted by the investment managementagreement, to the extent such operating expenses, on an annualized basis, exceed the I Class Limit. This agreement will continue through the expense limitation date indicated in the table below, and may be renewed, revised, or revoked only with approval of the fund’s Board. The I Class is required to repay Price Associates for expenses previously paid to the extent the class’s net assets grow or expenses decline sufficiently to allow repayment without causing the class’s operating expenses (after the repayment is taken into account) to exceed the lesser of: (1) the I Class Limit in place at the time such amounts were paid; or (2) the current I Class Limit. However, no repayment will be made more than three years after the date of a payment or waiver.
Pursuant to this agreement, expenses were waived/paid by and/or repaid to Price Associates during the year ended February 29, 2020, as indicated in the table below. Including this amount, expenses previously waived/paid by Price Associates in the amount of $6,000 remain subject to repayment by the fund at February 29, 2020.
In addition, the fund has entered into service agreements with Price Associates and a wholly owned subsidiary of Price Associates, each an affiliate of the fund (collectively, Price). Price Associates provides certain accounting and administrative services to the fund. T. Rowe Price Services, Inc. provides shareholder and administrative services in its capacity as the fund’s transfer and dividend-disbursing agent. For the year ended February 29, 2020, expenses incurred pursuant to these service agreements were $74,000 for Price Associates and $126,000 for T. Rowe Price Services, Inc. All amounts due to and due from Price, exclusive of investment management fees payable, are presented net on the accompanying Statement of Assets and Liabilities.
The fund may invest its cash reserves in certain open-end management investment companies managed by Price Associates and considered affiliates of the fund: the T. Rowe Price Government Reserve Fund or the T. Rowe Price Treasury Reserve Fund, organized as money market funds, or the T. Rowe Price Short-Term Fund, a short-term bond fund (collectively, the Price Reserve Funds). The Price Reserve Funds are offered as short-term investment options to mutual funds, trusts, and other accounts managed by Price Associates or its affiliates and are not available for direct purchase by members of the public. Cash collateral from securities lending is invested in the T. Rowe Price Short-Term Fund. The Price Reserve Funds pay no investment management fees.
The fund may participate in securities purchase and sale transactions with other funds or accounts advised by Price Associates (cross trades), in accordance with procedures adopted by the fund’s Board and Securities and Exchange Commission rules, which require, among other things, that such purchase and sale cross trades be effected at the independent current market price of the security. During the year ended February 29, 2020, the fund had no purchases or sales cross trades with other funds or accounts advised by Price Associates.
NOTE 6 - BORROWING
To provide temporary liquidity, the fund may borrow from other T. Rowe Price-sponsored mutual funds under an interfund borrowing program developed and managed by Price Associates. The program permits the borrowing and lending of cash at rates beneficial to both the borrowing and lending funds. Pursuant to program guidelines, loans totaling 10% or more of a borrowing fund’s total assets require collateralization at 102% of the value of the loan; loans of less than 10% are unsecured. During the year ended February 29, 2020, the fund incurred $4,000 in interest expense related to outstanding borrowings on two days in the average amount of $26,250,000 and at an average annual rate of 2.87%. At February 29, 2020, there were no borrowings outstanding.
NOTE 7 - OTHER MATTERS
Early in 2020, the spread of the coronavirus outbreak has emerged as a key theme for global financial markets. The wide variability in outcomes regarding the outbreak has led to higher levels of market uncertainty. Certain areas of the market have been impacted disproportionately by the spread of the virus and the ensuing disruption in global supply chains, especially travel- and manufacturing-dependent industries.
REPORT OF INDEPENDENT REGISTERED PUBLIC ACCOUNTING FIRM
To the Board of Directors of T. Rowe Price Tax-Efficient Funds, Inc. and
Shareholders of T. Rowe Price Tax-Efficient Equity Fund
Opinion on the Financial Statements
We have audited the accompanying statement of assets and liabilities, including the portfolio of investments, of T. Rowe Price Tax-Efficient Equity Fund (constituting T. Rowe Price Tax-Efficient Funds, Inc., referred to hereafter as the “Fund”) as of February 29, 2020, the related statement of operations for the year ended February 29, 2020, the statement of changes in net assets for each of the two years in the period ended February 29, 2019, including the related notes, and the financial highlights for each of the periods indicated therein (collectively referred to as the “financial statements”). In our opinion, the financial statements present fairly, in all material respects, the financial position of the Fund as of February 29, 2020, the results of its operations for the year then ended, the changes in its net assets for each of the two years in the period ended December 31, 2019 and the financial highlights for each of the periods indicated therein, in conformity with accounting principles generally accepted in the United States of America.
Basis for Opinion
These financial statements are the responsibility of the Fund’s management. Our responsibility is to express an opinion on the Fund’s financial statements based on our audits. We are a public accounting firm registered with the Public Company Accounting Oversight Board (United States) (PCAOB) and are required to be independent with respect to the Fund in accordance with the U.S. federal securities laws and the applicable rules and regulations of the Securities and Exchange Commission and the PCAOB.
We conducted our audits of these financial statements in accordance with the standards of the PCAOB. Those standards require that we plan and perform the audit to obtain reasonable assurance about whether the financial statements are free of material misstatement, whether due to error or fraud.
Our audits included performing procedures to assess the risks of material misstatement of the financial statements, whether due to error or fraud, and performing procedures that respond to those risks. Such procedures included examining, on a test basis, evidence regarding the amounts and disclosures in the financial statements. Our audits also included evaluating the accounting principles used and significant estimates made by management, as well as evaluating the overall presentation of the financial statements. Our procedures included confirmation of securities owned as of February 29, 2020 by correspondence with the custodian, transfer agent and brokers; when replies were not received from brokers, we performed other auditing procedures. We believe that our audits provide a reasonable basis for our opinion.
PricewaterhouseCoopers LLP
Baltimore, Maryland
April 20, 2020
We have served as the auditor of one or more investment companies in the T. Rowe Price group of investment companies since 1973.
TAX INFORMATION (UNAUDITED) FOR THE TAX YEAR ENDED 2/29/20
We are providing this information as required by the Internal Revenue Code. The amounts shown may differ from those elsewhere in this report because of differences between tax and financial reporting requirements.
The fund’s distributions to shareholders included:
| ■ | $24,000 from short-term capital gains. |
| |
| ■ | $2,179,000 from long-term capital gains, subject to a long-term capital gains tax rate of not greater than 20%. |
For taxable non-corporate shareholders, $1,938,000 of the fund’s income represents qualified dividend income subject to a long-term capital gains tax rate of not greater than 20%.
For corporate shareholders, $1,938,000 of the fund’s income qualifies for the dividends-received deduction.
INFORMATION ON PROXY VOTING POLICIES, PROCEDURES, AND RECORDS
A description of the policies and procedures used by T. Rowe Price funds and portfolios to determine how to vote proxies relating to portfolio securities is available in each fund’s Statement of Additional Information. You may request this document by calling 1-800-225-5132 or by accessing the SEC’s website, sec.gov.
The description of our proxy voting policies and procedures is also available on our corporate website. To access it, please visit the following Web page:
https://www.troweprice.com/corporate/en/utility/policies.html
Scroll down to the section near the bottom of the page that says, “Proxy Voting Policies.” Click on the Proxy Voting Policies link in the shaded box.
Each fund’s most recent annual proxy voting record is available on our website and through the SEC’s website. To access it through T. Rowe Price, visit the website location shown above, and scroll down to the section near the bottom of the page that says, “Proxy Voting Records.” Click on the Proxy Voting Records link in the shaded box.
HOW TO OBTAIN QUARTERLY PORTFOLIO HOLDINGS
Effective for reporting periods on or after March 1, 2019, a fund, except a money market fund, files a complete schedule of portfolio holdings with the Securities and Exchange Commission (SEC) for the first and third quarters of each fiscal year as an exhibit to its reports on Form N-PORT. Prior to March 1, 2019, a fund, including a money market fund, filed a complete schedule of portfolio holdings with the SEC for the first and third quarters of each fiscal year on Form N-Q. A money market fund files detailed month-end portfolio holdings information on Form N-MFP with the SEC each month and posts a complete schedule of portfolio holdings on its website (troweprice.com) as of each month-end for the previous six months. A fund’s Forms N-PORT, N-MFP, and N-Q are available electronically on the SEC’s website (sec.gov).
ABOUT THE FUND’S DIRECTORS AND OFFICERS
Your fund is overseen by a Board of Directors (Board) that meets regularly to review a wide variety of matters affecting or potentially affecting the fund, including performance, investment programs, compliance matters, advisory fees and expenses, service providers, and business and regulatory affairs. The Board elects the fund’s officers, who are listed in the final table. At least 75% of the Board’s members are considered to be independent, as defined in Section 2(19) of the 1940 Act, of the Boards of T. Rowe Price Associates, Inc. (T. Rowe Price), and its affiliates; “inside” or “interested” directors are employees or officers of T. Rowe Price. The business address of each director and officer is 100 East Pratt Street, Baltimore, Maryland 21202. The Statement of Additional Information includes additional information about the fund directors and is available without charge by calling a T. Rowe Price representative at 1-800-638-5660.
INDEPENDENT DIRECTORS(a)
| Name | | |
| (Year of Birth) | | |
| Year Elected | | |
[Number of T. Rowe Price
Portfolios Overseen] | | Principal Occupation(s) and Directorships of Public Companies and Other Investment Companies During the Past Five Years |
| | | |
Teresa Bryce Bazemore
(1959)
2018
[186] | | President, Radian Guaranty (2008 to 2017); Chief Executive Officer, Bazemore Consulting LLC (2018 to present); Director, Chimera Investment Corporation (2017 to present); Director, Federal Home Loan Bank of Pittsburgh (2017 to February 2019) |
| | | |
Ronald J. Daniels
(1959)
2018
[186] | | President, The Johns Hopkins University(b)and Professor, Political Science Department, The Johns Hopkins University (2009 to present); Director, Lyndhurst Holdings (2015 to present) |
| | | |
Bruce W. Duncan
(1951)
2013
[186] | | Chief Executive Officer and Director (January 2009 to December 2016), Chairman of the Board (January 2016 to present), and President (January 2009 to September 2016), First Industrial Realty Trust, an owner and operator of industrial properties; Chairman of the Board (2005 to September 2016) and Director (1999 to September 2016), Starwood Hotels & Resorts, a hotel and leisure company; Member, Investment Company Institute Board of Governors (2017 to December 2019); Member, Independent Directors Council Governing Board (2017 to December 2019); Senior Advisor, KKR (November 2018 to present); Director, Boston Properties (May 2016 to present); Director, Marriott International, Inc. (September 2016 to present) |
| | | |
Robert J. Gerrard, Jr.
(1952)
2012
[186] | | Advisory Board Member, Pipeline Crisis/Winning Strategies, a collaborative working to improve opportunities for young African Americans (1997 to 2016); Chairman of the Board, all funds (July 2018 to present) |
| | | |
Paul F. McBride
(1956)
2013
[186] | | Advisory Board Member, Vizzia Technologies (2015 to present); Board Member, Dunbar Armored (2012 to 2018) |
| | | |
Cecilia E. Rouse, Ph.D.
(1963)
2012
[186] | | Dean, Woodrow Wilson School (2012 to present); Professor and Researcher, Princeton University (1992 to present); Director, MDRC, a nonprofit education and social policy research organization (2011 to present); Member, National Academy of Education (2010 to present); Research Associate of Labor Studies Program at the National Bureau of Economic Research (2011 to 2015); Board Member, National Bureau of Economic Research (2011 to present); Chair of Committee on the Status of Minority Groups in the Economic Profession of the American Economic Association (2012 to 2018); Vice President (2015 to 2016), Board Member, American Economic Association (2018 to present) |
| | | |
John G. Schreiber
(1946)
2001
[186] | | Owner/President, Centaur Capital Partners, Inc., a real estate investment company (1991 to present); Cofounder, Partner, and Cochairman of the Investment Committee, Blackstone Real Estate Advisors, L.P. (1992 to 2015); Director, Blackstone Mortgage Trust, a real estate finance company (2012 to 2016); Director and Chairman of the Board, Brixmor Property Group, Inc. (2013 to present); Director, Hilton Worldwide (2007 to present); Director, Hudson Pacific Properties (2014 to 2016); Director, Invitation Homes (2014 to 2017); Director, JMB Realty Corporation (1980 to present) |
| | | |
| (a)All information about the independent directors was current as of December 31, 2019, unless otherwise indicated, except for the number of portfolios overseen, which is current as of the date of this report. |
| (b)William J. Stromberg, president and chief executive officer of T. Rowe Price Group, Inc., the parent company of the Price Funds’ investment advisor, has served on the Board of Trustees of Johns Hopkins University since 2014. |
| |
| INSIDE DIRECTORS(a) |
| |
| Name | | |
| (Year of Birth) | | |
| Year Elected | | |
[Number of T. Rowe Price
Portfolios Overseen] | | Principal Occupation(s) and Directorships of Public Companies and Other Investment Companies During the Past Five Years |
| | | |
David Oestreicher
(1967)
2018
[186] | | Chief Legal Officer, Vice President, and Secretary, T. Rowe Price Group, Inc.; Director, Vice President, and Secretary, T. Rowe Price Investment Services, Inc., T. Rowe Price Retirement Plan Services, Inc., T. Rowe Price Services, Inc., and T. Rowe Price Trust Company; Vice President and Secretary, T. Rowe Price, T. Rowe Price Hong Kong (Price Hong Kong), and T. Rowe Price International; Vice President, T. Rowe Price Japan (Price Japan) and T. Rowe Price Singapore (Price Singapore); Principal Executive Officer and Executive Vice President, all funds |
| | | |
Robert W. Sharps, CFA, CPA
(1971)
2017
[135] | | Director and Vice President, T. Rowe Price; Vice President, T. Rowe Price Group, Inc., and T. Rowe Price Trust Company |
| |
| (a)All information about the inside directors was current as of December 31, 2019, unless otherwise indicated, except for the number of portfolios overseen, which is current as of the date of this report. |
| |
| OFFICERS | | |
| |
| Name (Year of Birth) | | |
| Position Held With Tax-Efficient Equity Fund | | Principal Occupation(s) |
| | | |
Kennard W. Allen (1977)
Vice President | | Vice President, T. Rowe Price and T. Rowe Price Group, Inc. |
| | | |
Ziad Bakri, M.D., CFA (1980)
Vice President | | Vice President, T. Rowe Price and T. Rowe Price Group, Inc. |
| | | |
Darrell N. Braman (1963)
Vice President and Secretary | | Vice President, Price Hong Kong, Price Singapore, T. Rowe Price, T. Rowe Price Group, Inc., T. Rowe Price International, T. Rowe Price Investment Services, Inc., and T. Rowe Price Services, Inc. |
| | | |
Andrew S. Davis (1978)
Vice President | | Vice President, T. Rowe Price and T. Rowe Price Group, Inc. |
| | | |
Gregory Dunham, CFA (1974)
Vice President | | Vice President, T. Rowe Price and T. Rowe Price Group, Inc. |
| | | |
Alan S. Dupski, CPA (1982)
Principal Officer, Vice President,
and Treasurer | | Vice President, T. Rowe Price and T. Rowe Price Group, Inc.: formerly, Assistant Chief Accountant, Division of Investment Management, U.S. Securities and Exchange Commission (to 2015) |
| | | |
Donald J. Easley, CFA (1971)
Vice President | | Vice President, T. Rowe Price and T. Rowe Price Group, Inc. |
| | | |
John R. Gilner (1961)
Chief Compliance Officer | | Chief Compliance Officer and Vice President, T. Rowe Price; Vice President, T. Rowe Price Group, Inc., and T. Rowe Price Investment Services, Inc. |
| | | |
Gary J. Greb (1961)
Vice President | | Vice President, T. Rowe Price, T. Rowe Price International, and T. Rowe Price Trust Company |
| | | |
Paul J. Krug, CPA (1964)
Vice President | | Vice President, T. Rowe Price, T. Rowe Price Group, Inc., and T. Rowe Price Trust Company |
| | | |
Donald J. Peters (1959)
President | | Vice President, T. Rowe Price and T. Rowe Price Group, Inc. |
| | | |
Shannon H. Rauser (1987)
Assistant Secretary | | Assistant Vice President, T. Rowe Price |
| | | |
Weijie Si (1983)
Vice President | | Vice President, T. Rowe Price and T. Rowe Price Group, Inc. |
| | | |
Matthew J. Snowling, CFA (1971)
Vice President | | Vice President, T. Rowe Price and T. Rowe Price Group, Inc. |
| | | |
Alan Tu (1985)
Vice President | | Vice President, T. Rowe Price and T. Rowe Price Group, Inc. |
| | | |
Megan Warren (1968)
Vice President | | Vice President, T. Rowe Price, T. Rowe Price Group, Inc., T. Rowe Price Retirement Plan Services, Inc., T. Rowe Price Services, Inc., and T. Rowe Price Trust Company; formerly, Executive Director, JPMorgan Chase (to 2017) |
| | | |
Mark R. Weigman, CFA, CIC (1962)
Vice President | | Vice President, T. Rowe Price, T. Rowe Price Group, Inc., and T. Rowe Price Trust Company |
| | | |
Nina Xu (1987)
Vice President | | Vice President, T. Rowe Price |
| | | |
| Unless otherwise noted, officers have been employees of T. Rowe Price or T. Rowe Price International for at least 5 years. |
Item 1. (b) Notice pursuant to Rule 30e-3.
Not applicable.
Item 2. Code of Ethics.
The registrant has adopted a code of ethics, as defined in Item 2 of Form N-CSR, applicable to its principal executive officer, principal financial officer, principal accounting officer or controller, or persons performing similar functions. A copy of this code of ethics is filed as an exhibit to this Form N-CSR. No substantive amendments were approved or waivers were granted to this code of ethics during the period covered by this report.
Item 3. Audit Committee Financial Expert.
The registrant’s Board of Directors/Trustees has determined that Mr. Bruce W. Duncan qualifies as an audit committee financial expert, as defined in Item 3 of Form N-CSR. Mr. Duncan is considered independent for purposes of Item 3 of Form N-CSR.
Item 4. Principal Accountant Fees and Services.
(a) – (d) Aggregate fees billed for the last two fiscal years for professional services rendered to, or on behalf of, the registrant by the registrant’s principal accountant were as follows:
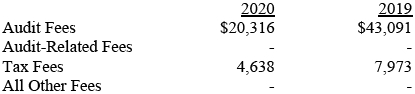
Audit fees include amounts related to the audit of the registrant’s annual financial statements and services normally provided by the accountant in connection with statutory and regulatory filings. Audit-related fees include amounts reasonably related to the performance of the audit of the registrant’s financial statements and specifically include the issuance of a report on internal controls and, if applicable, agreed-upon procedures related to fund acquisitions. Tax fees include amounts related to services for tax compliance, tax planning, and tax advice. The nature of these services specifically includes the review of distribution calculations and the preparation of Federal, state, and excise tax returns. All other fees include the registrant’s pro-rata share of amounts for agreed-upon procedures in conjunction with service contract approvals by the registrant’s Board of Directors/Trustees.
(e)(1) The registrant’s audit committee has adopted a policy whereby audit and non-audit services performed by the registrant’s principal accountant for the registrant, its investment adviser, and any entity controlling, controlled by, or under common control with the investment adviser that provides ongoing services to the registrant require pre-approval in advance at regularly scheduled audit committee meetings. If such a service is required between regularly scheduled audit committee meetings, pre-approval may be authorized by one audit committee member with ratification at the next scheduled audit committee meeting. Waiver of pre-approval for audit or non-audit services requiring fees of a de minimis amount is not permitted.
(2) No services included in (b) – (d) above were approved pursuant to paragraph (c)(7)(i)(C) of Rule 2-01 of Regulation S-X.
(f) Less than 50 percent of the hours expended on the principal accountant’s engagement to audit the registrant’s financial statements for the most recent fiscal year were attributed to work performed by persons other than the principal accountant’s full-time, permanent employees.
(g) The aggregate fees billed for the most recent fiscal year and the preceding fiscal year by the registrant’s principal accountant for non-audit services rendered to the registrant, its investment adviser, and any entity controlling, controlled by, or under common control with the investment adviser that provides ongoing services to the registrant were $3,586,000 and $2,391,000, respectively.
(h) All non-audit services rendered in (g) above were pre-approved by the registrant’s audit committee. Accordingly, these services were considered by the registrant’s audit committee in maintaining the principal accountant’s independence.
Item 5. Audit Committee of Listed Registrants.
Not applicable.
Item 6. Investments.
(a) Not applicable. The complete schedule of investments is included in Item 1 of this Form N-CSR.
(b) Not applicable.
Item 7. Disclosure of Proxy Voting Policies and Procedures for Closed-End Management Investment Companies.
Not applicable.
Item 8. Portfolio Managers of Closed-End Management Investment Companies.
Not applicable.
Item 9. Purchases of Equity Securities by Closed-End Management Investment Company and Affiliated Purchasers.
Not applicable.
Item 10. Submission of Matters to a Vote of Security Holders.
Not applicable.
Item 11. Controls and Procedures.
(a) The registrant’s principal executive officer and principal financial officer have evaluated the registrant’s disclosure controls and procedures within 90 days of this filing and have concluded that the registrant’s disclosure controls and procedures were effective, as of that date, in ensuring that information required to be disclosed by the registrant in this Form N-CSR was recorded, processed, summarized, and reported timely.
(b) The registrant’s principal executive officer and principal financial officer are aware of no change in the registrant’s internal control over financial reporting that occurred during the period covered by this report that has materially affected, or is reasonably likely to materially affect, the registrant’s internal control over financial reporting.
Item 12. Disclosure of Securities Lending Activities for Closed-End Management Investment Companies.
Not applicable.
Item 13. Exhibits.
(a)(1) The registrant’s code of ethics pursuant to Item 2 of Form N-CSR is attached.
(2) Separate certifications by the registrant's principal executive officer and principal financial officer, pursuant to Section 302 of the Sarbanes-Oxley Act of 2002 and required by Rule 30a-2(a) under the Investment Company Act of 1940, are attached.
(3) Written solicitation to repurchase securities issued by closed-end companies: not applicable.
(b) A certification by the registrant's principal executive officer and principal financial officer, pursuant to Section 906 of the Sarbanes-Oxley Act of 2002 and required by Rule 30a-2(b) under the Investment Company Act of 1940, is attached.
SIGNATURES
Pursuant to the requirements of the Securities Exchange Act of 1934 and the Investment Company Act of 1940, the registrant has duly caused this report to be signed on its behalf by the undersigned, thereunto duly authorized.
T. Rowe Price Tax-Efficient Funds, Inc.
| By | | /s/ David Oestreicher |
| | | David Oestreicher |
| | | Principal Executive Officer |
| |
| Date | | April 20, 2020 | | | | |
Pursuant to the requirements of the Securities Exchange Act of 1934 and the Investment Company Act of 1940, this report has been signed below by the following persons on behalf of the registrant and in the capacities and on the dates indicated.
| By | | /s/ David Oestreicher |
| | | David Oestreicher |
| | | Principal Executive Officer |
| |
| Date | | April 20, 2020 | | | | |
| |
| |
| By | | /s/ Alan S. Dupski |
| | | Alan S. Dupski |
| | | Principal Financial Officer |
| |
| Date | | April 20, 2020 | | | | |