UNITED STATES
SECURITIES AND EXCHANGE COMMISSION
Washington, D.C. 20549
FORM N-CSR
CERTIFIED SHAREHOLDER REPORT OF REGISTERED
MANAGEMENT INVESTMENT COMPANIES
Investment Company Act File Number: 811-08207
| T. Rowe Price Tax-Efficient Funds, Inc. |
| (Exact name of registrant as specified in charter) |
| 100 East Pratt Street, Baltimore, MD 21202 |
| (Address of principal executive offices) |
| David Oestreicher |
| 100 East Pratt Street, Baltimore, MD 21202 |
| (Name and address of agent for service) |
Registrant’s telephone number, including area code: (410) 345-2000
Date of fiscal year end: February 28
Date of reporting period: February 28, 2019
 |
| Tax-Efficient Equity Fund | February 28, 2019 |
Beginning on January 1, 2021, as permitted by SEC regulations, paper copies of the T. Rowe Price funds’ annual and semiannual shareholder reports will no longer be mailed, unless you specifically request them. Instead, shareholder reports will be made available on the funds’ website (troweprice.com/prospectus), and you will be notified by mail with a website link to access the reports each time a report is posted to the site.
If you already elected to receive reports electronically, you will not be affected by this change and need not take any action. At any time, shareholders who invest directly in T. Rowe Price funds may generally elect to receive reports or other communications electronically by enrolling attroweprice.com/paperlessor, if you are a retirement plan sponsor or invest in the funds through a financial intermediary (such as an investment advisor, broker-dealer, insurance company, or bank), by contacting your representative or your financial intermediary.
You may elect to continue receiving paper copies of future shareholder reports free of charge. To do so, if you invest directly with T. Rowe Price, please call T. Rowe Price as follows: IRA, nonretirement account holders, and institutional investors,1-800-225-5132; small business retirement accounts,1-800-492-7670. If you are a retirement plan sponsor or invest in the T. Rowe Price funds through a financial intermediary, please contact your representative or financial intermediary or follow additional instructions if included with this document. Your election to receive paper copies of reports will apply to all funds held in your account with your financial intermediary or, if you invest directly in the T. Rowe Price funds, with T. Rowe Price. Your election can be changed at any time in the future.
| T. ROWE PRICE TAX-EFFICIENT EQUITY FUND |
HIGHLIGHTS
| ■ | The Tax-Efficient Equity Fund gained 9.70% in the annual reporting period and materially outperformed the Lipper Multi-Cap Growth Funds Index and the Russell 3000 Growth Index on a pretax basis. |
| ■ | Strong stock selection drove the solid relative returns of the fund versus its Russell and Lipper benchmarks. |
| ■ | During the momentum market that characterized the first nine months of 2018, we remained disciplined and did not chase overvalued companies. After the fourth-quarter correction, we added several companies that had fallen materially. |
| ■ | While we expect equity market returns to be less favorable in the next few years than they have been recently, we continue to believe that stocks are the best option for investors seeking long-term capital appreciation, particularly when compared with the poor real (inflation-adjusted) returns expected by many fixed income investments. |
Log in to your account attroweprice.comfor more information.
*Certain mutual fund accounts that are assessed an annual account service fee can also save money by switching to e-delivery.
CIO Market Commentary
Dear Shareholder
Financial markets delivered a wide variety of returns during your fund’s fiscal year ended February 28, 2019. Despite suffering a sharp downturn in late 2018, U.S. equity markets performed decently, and bonds offered positive returns after a rise in interest rates reversed late in the period. Overseas equity markets were considerably weaker, however, and returns for U.S. investors in both foreign bonds and equities were further reduced by a substantial decline in almost all currencies relative to the U.S. dollar.
A widening gap between U.S. economic prospects and those of other major economies was largely responsible for the relative strength of the U.S. dollar and asset prices. Signs emerged in the spring of 2018 that growth in Europe and China was slowing. Conversely, the U.S. economy picked up speed in the middle of the year, boosted by fiscal stimulus from the December 2017 tax cuts and increased federal spending.
U.S. corporate profit growth was especially robust, helping the major indexes rise to record highs. Technology shares led the advance, and Apple established a milestone in early August by becoming the first public company with a $1 trillion market capitalization. Soon after, the bull market that began in March 2009 became the longest-running one in modern history.
Bond yields rose for much of the past year as growth expectations increased and the Federal Reserve raised rates four more times, resulting in a generally unfavorable environment for fixed income investors (bond prices and yields move in opposite directions). Both equity and bond markets swooned when Fed Chair Jerome Powell told an interviewer on October 3 that interest rates were still “a long way” from a neutral level that would neither stimulate nor restrain the economy. Within days, the yield on the benchmark 10-year Treasury note hit its highest level since the summer of 2011.
Yields soon reversed course alongside the economic outlook, however. Retail sales slumped late in 2018, and the manufacturing sector appeared to slow. The housing and auto sectors, which are particularly sensitive to rising rates, showed the greatest weakness. Powell soon changed his tune on interest rates, stating in late November that rates were “just below” the neutral level.
Policy uncertainty took a further toll on investor confidence. The U.S.-China trade dispute intensified late in 2018 as the Trump administration threatened to raise the tariff rate on Chinese goods on January 1. In early December, theWhite House announced that it was delaying the tariff hike, but investors were soon dealt another blow by the federal government’s partial shutdown. Several major stock indexes fell into a bear market, and Treasury yields sank to their lowest levels in over a year.
The stark shift in growth expectations and the tightening of financial conditions resulted in an abrupt turn in monetary policy. In January, Powell and other Fed officials signaled that they were reevaluating their rate-hiking plans and removed any reference to further rate increases in their policy statement. Stocks shot higher in response, making for the best start to a year (through February) in nearly three decades. Whether the recent rebound in investor confidence is justified remains to be seen, but it does seem likely that the Fed will remain in “pause” mode for the next few months.
Municipal bonds outperformed Treasuries and the broader U.S. taxable investment-grade bond market for the 12-month period. Demand for munis was generally strong, and the supply of bonds shrank due to a steep drop in refundings, although issuance began to rebound in early 2019. The new tax law that became effective in 2018 eliminated the tax benefits of advance refundings, which had allowed issuers to refinance existing debt with new bonds. Strong demand for higher-yielding securities, such as Puerto Rico debt and high yield tobacco bonds, helped lower-quality munis outperform higher-quality debt. Progress on debt restructuring contributed to a rally in Puerto Rico bonds from distressed levels.
The past year has been another lesson in how complex and intertwined the global economy has become, with events quickly rippling across borders and asset classes. Please know that your fund’s manager is working with a large and talented team of analysts in seeking to avoid the pitfalls in this turbulent environment, while exploiting the opportunities that lie ahead.
Thank you for your continued confidence in T. Rowe Price.
Sincerely,

Robert Sharps
Group Chief Investment Officer
Management’s Discussion of Fund Performance
INVESTMENT OBJECTIVE
The fund seeks to maximize after-tax growth of capital through investments primarily in common stocks.
FUND COMMENTARY
How did the fund perform in the past 12 months?
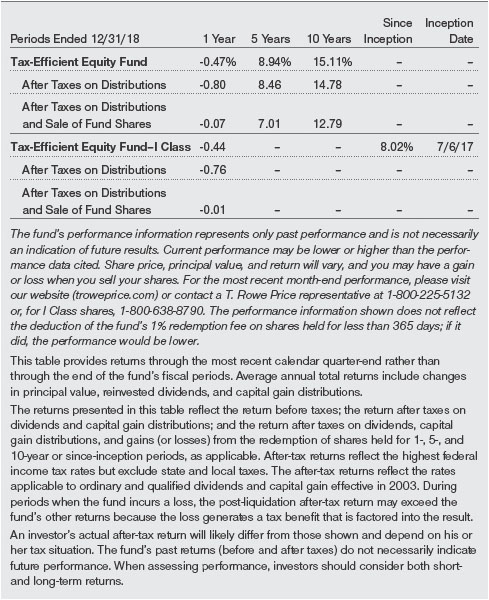
U.S. stocks were volatile but rose during the period, buoyed by solid economic and earnings growth. The Tax-Efficient Equity Fund returned 9.70% in the 12-month period ended February 28, 2019, versus 6.63% for its benchmark, the Russell 3000 Growth Index, and 5.93% for the Lipper Multi-Cap Growth Funds Index. (Returns for I Class shares varied slightly, reflecting their different fee structure. The fund’s I Class shares are designed to be sold to various institutional investors and generally require a minimum initial investment of $1 million.Past performance cannot guarantee future results.) It is notable that during the last six months of the fiscal year, the fund declined modestly and substantially outperformed its benchmarks.

What factors influenced the fund’s performance?
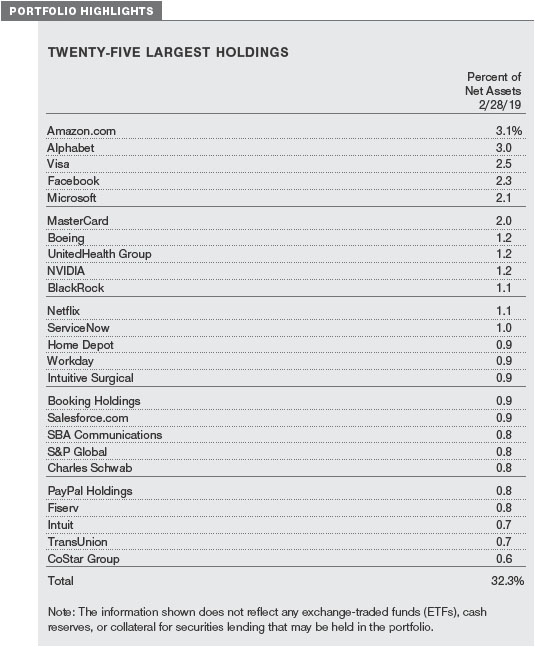
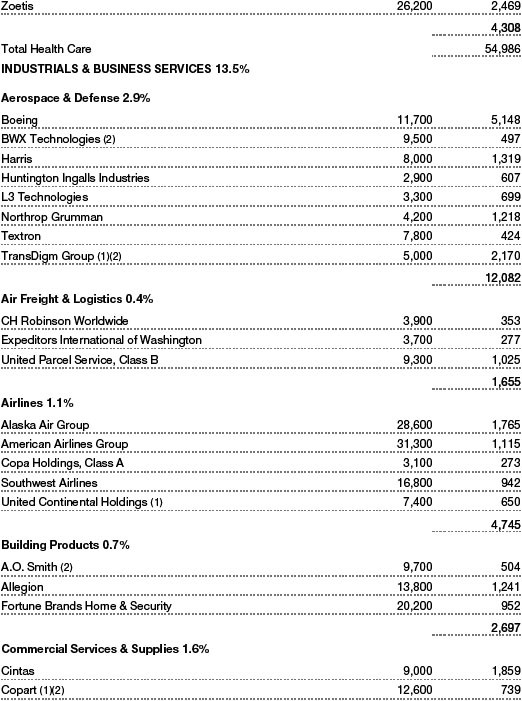
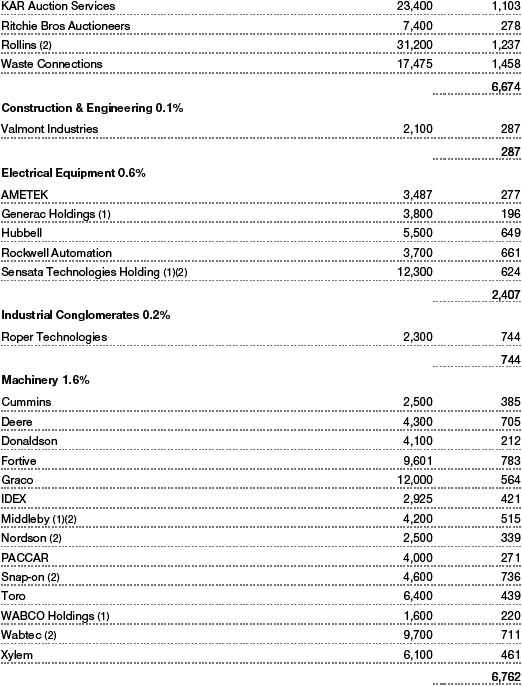
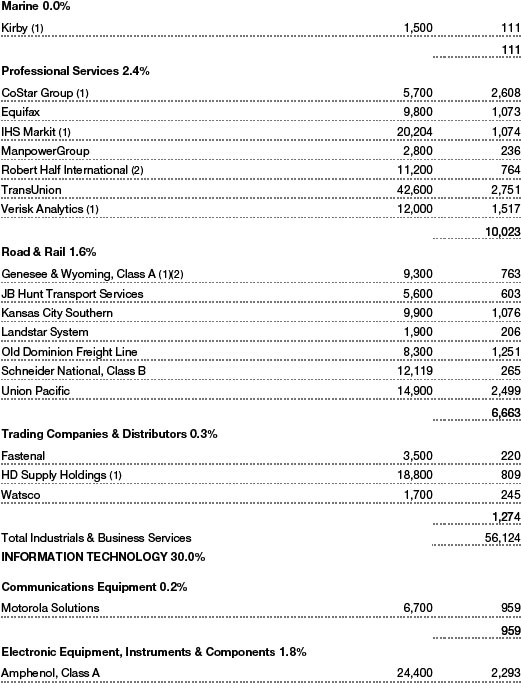
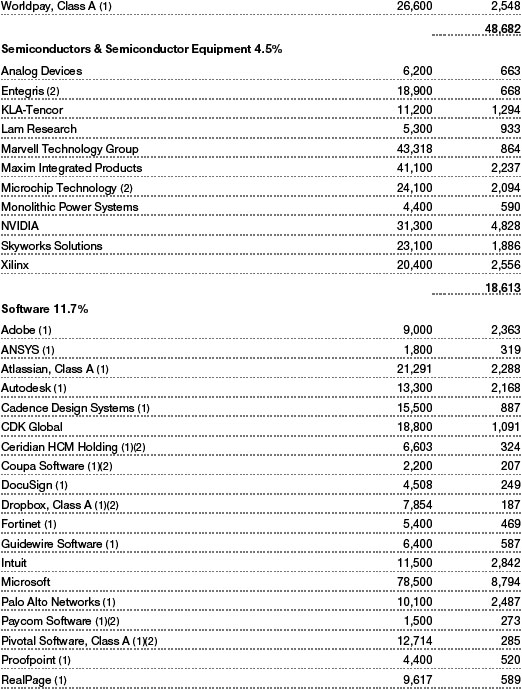
Many of our top relative and absolute performance contributors were in the information technology sector—our largest sector allocation—where we favor companies with strong business models in industries with high barriers to entry and low risk of commoditization. Overall stock selection was very strong in this sector. Software companiesAtlassian,Workday, andServiceNow were top relative contributors, as was longtime holdingMasterCard, which benefited from continuing growth in electronic payments. Our decision to avoid Apple boosted returns. We did not own the company because of its lack of material innovation in its primary products. (Please refer to the portfolio of investments for a complete list of holdings and the amount each represents in the portfolio.)
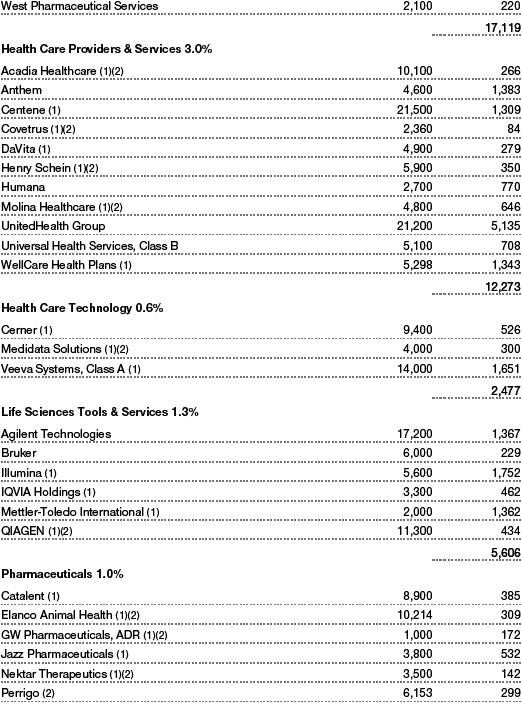
In the health care sector,Veeva Systems, a software provider to the life science industry, andIntuitive Surgical, a dominant player in the growing market for robotic surgery solutions, also contributed to relative results. However, some biotechnology companies, such asIncyte, were among our largest detractors. We like the longer-term growth prospects for the biotech industry, but because of its inherent volatility, we remain very diversified and selective in our holdings.
Our stock selection, led byLazard,CBOE Global Markets, andCharles Schwab, and our overweight to financials also detracted from relative returns. However, we believe that all of these companies have very strong franchises that will be very good investments over the next several years.
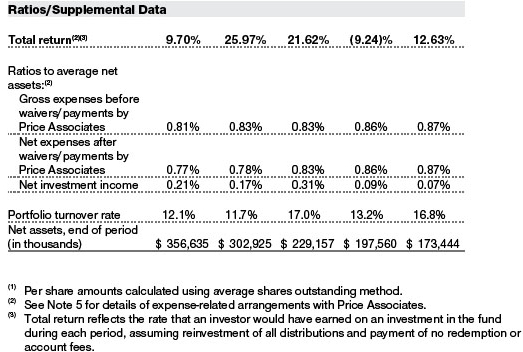
The portfolio’s 99.84% tax efficiency ratio means that the fund has made only minimal taxable distributions since its inception on December 29, 2000, through February 28, 2019, in our pursuit of strong after-tax returns. (The fund’s tax efficiency ratio is calculated by dividing the fund’s after-tax return by its pretax return.) At 12.10%, our 12-month portfolio turnover rate is extremely low compared with other growth portfolios whose managers focus only on pretax returns. Consequently, these other funds tend to make large capital gain disbursements to their shareholders, and their after-tax returns are often dramatically lower than their pretax returns.
How is the fund positioned?
The fund seeks to buy and hold attractively valued, high-quality growth companies with good business models, strong management, and favorable longterm prospects. Our goal is to build a portfolio that provides strong after-tax returns over time. During the momentum market that characterized the first nine months of 2018, we remained disciplined and did not chase overvalued companies. After the steep correction in the fourth quarter of 2018, we added several companies that had fallen materially, such asTwilio andOkta.
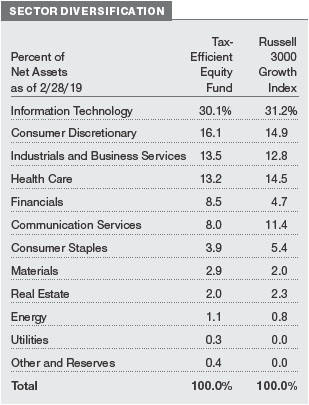
As of February 28, 2019, information technology stocks represented 30.1% of the fund, but we remained slightly underweight relative to the Russell 3000 Growth Index and broadly diversified within the sector. Technology is usually a winner-takes-all space, and we try to avoid companies whose business models are challenged by competing products or services. Over time, we believe artificial intelligence and machine learning will expand their importance and footprint within the sector.
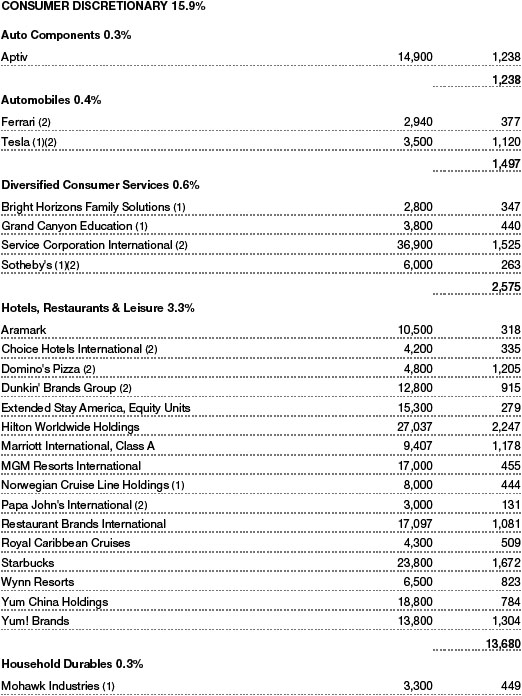
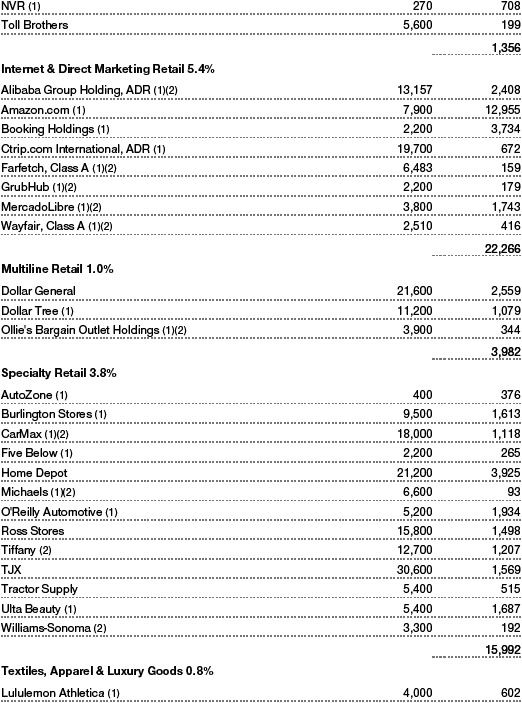
At 16.1% of the portfolio, consumer discretionary was our second-largest allocation. Here, we look for companies that have good business models, excellent cash flow, and other favorable attributes, and we focus on leading companies within their respective niches.
The fund’s fundamental characteristics are somewhat similar to those of the Russell index. However, the portfolio’s market capitalization ended February at $28 billion versus $93.5 billion for the benchmark, reflecting our tilt away from the largest companies. Over the last five years, large-cap growth stocks have outperformed mid-caps by a couple of percentage points per year. Consequently, we have found more opportunities among mid-cap companies. These companies are generally less mature and tend to have higher earnings growth potential.
The fund’s price/earnings ratio (23.9) was higher than that of the index (21.3), and its projected earnings growth rate (15.0%) was also higher than that of the index (14.0%). The fund’s return on equity (ROE), which measures how effectively and efficiently a company and its management are using stockholder investments, was 24.5%. While we consider a high ROE at any given time to be desirable, we greatly prefer businesses that can sustain high returns.
What is portfolio management’s outlook?
While the capital markets environment has become more volatile, it is still a positive landscape for long-term investors. Economic growth is moderating, and corporate earnings are growing. We believe equities remain a dramatically better choice than bonds for long-term investors seeking to grow capital or protect it from the ravages of inflation. Rates remain very low, and when one adjusts for inflation, fixed income investments are simply unattractive.
Following the downdrafts of stock prices and Treasury bond yields in the fourth quarter of 2018, many are concerned about the risk of a recession in the U.S., but no one knows for certain when one will occur. While recessions are natural and inevitable parts of the business cycle, we always remain fully invested in stocks because we do not attempt to predict or invest based on the peaks and valleys of equities or the economy. The odds of correctly calling corrections and recoveries are extremely low. Few recall that one must be right twice to be successful—when selling and buying. Getting back into the market is a much tougher call because the markets will have moved substantially before tangible evidence of a recovery is apparent.
While the stock market performance of the fourth quarter of 2018 was challenging in absolute terms, our valuation sensitivity, quality bias, and risk awareness helped the fund hold up well—as it often has during previous downturns. Over longer periods, our performance record remains very favorable, and we believe that our disciplined investment process will continue to serve our investors well over time.
The views expressed reflect the opinions of T. Rowe Price as of the date of this report and are subject to change based on changes in market, economic, or other conditions. These views are not intended to be a forecast of future events and are no guarantee of future results.
RISKS OF STOCK INVESTING
As with all stock and bond mutual funds, a fund’s share price can fall because of weakness in the stock or bond markets, a particular industry, or specific holdings. Stock markets can decline for many reasons, including adverse political or economic developments, changes in investor psychology, or heavy institutional selling. The prospects for an industry or company may deteriorate because of a variety of factors, including disappointing earnings or changes in the competitive environment. In addition, the investment manager’s assessment of companies held in a fund may prove incorrect, resulting in losses or poor performance even in rising markets.
Growth stocks can be volatile for several reasons. Since growth companies usually reinvest a high proportion of their earnings in their own businesses, they may lack the dividends often associated with value stocks that could cushion their decline in a falling market. Also, since investors buy growth stocks because of their expected superior earnings growth, earnings disappointments often result in sharp price declines. In addition, the fund’s attempts at investing in a tax-efficient manner could cause it to underperform similar funds that do not make tax efficiency a primary focus.
BENCHMARK INFORMATION
Note: Frank Russell Company (Russell) is the source and owner of the Russell index data contained or reflected in these materials and all trademarks and copyrights related thereto. Russell® is a registered trademark of Russell. Russell is not responsible for the formatting or configuration of these materials or for any inaccuracy in T. Rowe Price Associates’ presentation thereof.
GROWTH OF $10,000
This chart shows the value of a hypothetical $10,000 investment in the fund over the past 10 fiscal year periods or since inception (for funds lacking 10-year records). The result is compared with benchmarks, which include a broad-based market index and may also include a peer group average or index. Market indexes do not include expenses, which are deducted from fund returns as well as mutual fund averages and indexes.
![]()
AVERAGE ANNUAL COMPOUND TOTAL RETURN

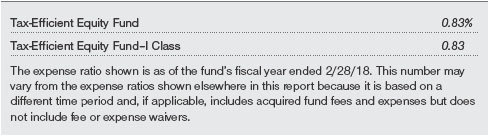
EXPENSE RATIO
FUND EXPENSE EXAMPLE
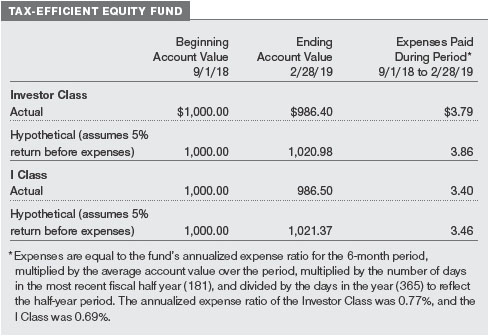
As a mutual fund shareholder, you may incur two types of costs: (1) transaction costs, such as redemption fees or sales loads, and (2) ongoing costs, including management fees, distribution and service (12b-1) fees, and other fund expenses. The following example is intended to help you understand your ongoing costs (in dollars) of investing in the fund and to compare these costs with the ongoing costs of investing in other mutual funds. The example is based on an investment of $1,000 invested at the beginning of the most recent six-month period and held for the entire period.
Please note that the fund has two share classes: The original share class (Investor Class) charges no distribution and service (12b-1) fee, and the I Class shares are also available to institutionally oriented clients and impose no 12b-1 or administrative fee payment. Each share class is presented separately in the table.
Actual Expenses
The first line of the following table (Actual) provides information about actual account values and expenses based on the fund’s actual returns. You may use the information on this line, together with your account balance, to estimate the expenses that you paid over the period. Simply divide your account value by $1,000 (for example, an $8,600 account value divided by $1,000 = 8.6), then multiply the result by the number on the first line under the heading “Expenses Paid During Period” to estimate the expenses you paid on your account during this period.
Hypothetical Example for Comparison Purposes
The information on the second line of the table (Hypothetical) is based on hypothetical account values and expenses derived from the fund’s actual expense ratio and an assumed 5% per year rate of return before expenses (not the fund’s actual return). You may compare the ongoing costs of investing in the fund with other funds by contrasting this 5% hypothetical example and the 5% hypothetical examples that appear in the shareholder reports of the other funds. The hypothetical account values and expenses may not be used to estimate the actual ending account balance or expenses you paid for the period.
Note:T. Rowe Price charges an annual account service fee of $20, generally for accounts with less than $10,000. The fee is waived for any investor whose T. Rowe Price mutual fund accounts total $50,000 or more; accounts electing to receive electronic delivery of account statements, transaction confirmations, prospectuses, and shareholder reports; or accounts of an investor who is a T. Rowe Price Personal Services or Enhanced Personal Services client (enrollment in these programs generally requires T. Rowe Price assets of at least $250,000). This fee is not included in the accompanying table. If you are subject to the fee, keep it in mind when you are estimating the ongoing expenses of investing in the fund and when comparing the expenses of this fund with other funds.
You should also be aware that the expenses shown in the table highlight only your ongoing costs and do not reflect any transaction costs, such as redemption fees or sales loads. Therefore, the second line of the table is useful in comparing ongoing costs only and will not help you determine the relative total costs of owning different funds. To the extent a fund charges transaction costs, however, the total cost of owning that fund is higher.
QUARTER-END RETURNS

The accompanying notes are an integral part of these financial statements.
The accompanying notes are an integral part of these financial statements.


The accompanying notes are an integral part of these financial statements.
The accompanying notes are an integral part of these financial statements.
The accompanying notes are an integral part of these financial statements.
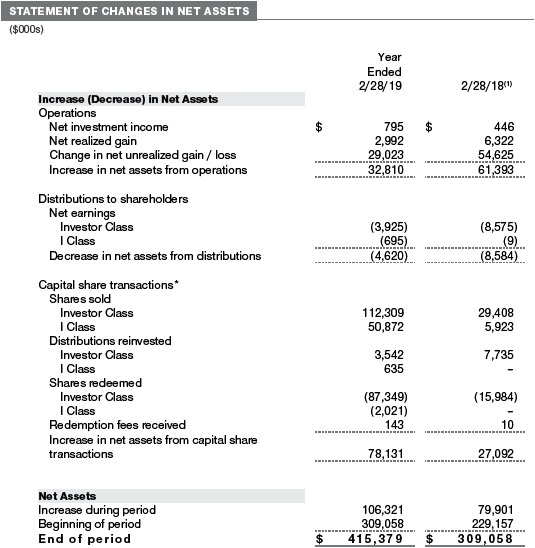

The accompanying notes are an integral part of these financial statements.
| NOTES TO FINANCIAL STATEMENTS |
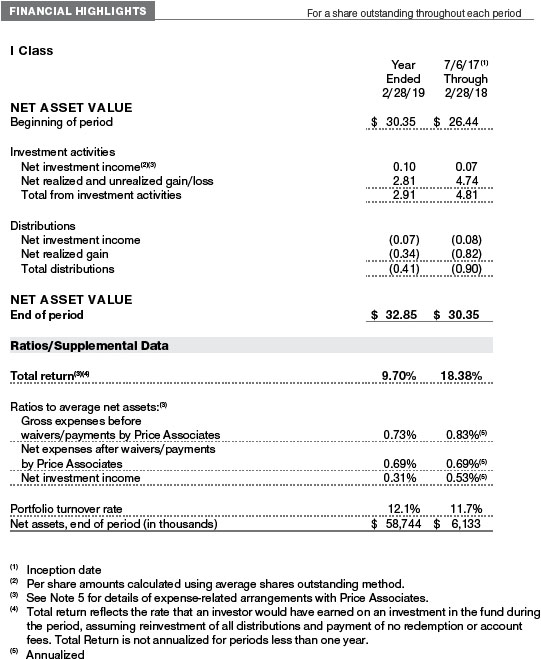
T. Rowe Price Tax-Efficient Funds,Inc. (the corporation) is registeredunder theInvestment Company Act of 1940 (the 1940 Act). The Tax-Efficient Equity Fund(the fund) is adiversified, open-end management investment company establishedby the corporation. The fundseeks tomaximize after-tax growth of capital through investments primarily in common stocks. The fundhas two classes of shares:the Tax-Efficient Equity Fund(Investor Class) andthe Tax-Efficient Equity Fund–IClass (IClass).IClass shares generally are available only to investorsmeeting a $1,000,000minimuminvestment, although theminimumis generally waivedfor certain client accounts. Each class has exclusive voting rights onmatters relatedsolely to that class;separate voting rights onmatters that relate to both classes;and, in all other respects, the same rights andobligations as the other class.
NOTE 1 - SIGNIFICANT ACCOUNTING POLICIES
Basis of PreparationThe fundis an investment company andfollows accounting andreporting guidance in the Financial Accounting Standards Board(FASB)Accounting Standards CodificationTopic 946(ASC 946). The accompanying financial statements were preparedin accordance with accounting principles generally acceptedin the UnitedStates of America (GAAP), including, but not limitedto, ASC 946.GAAP requires the use of estimatesmade bymanagement. Management believes that estimates andvaluations are appropriate;however, actual resultsmaydiffer fromthose estimates, andthe valuations reflectedin the accompanying financial statementsmaydiffer fromthe value ultimately realizedupon sale ormaturity. Certain ratios in the accompanying Financial Highlights have been includedto conformto the current year presentation.
Investment Transactions, Investment Income, and DistributionsInvestment transactions are accountedfor on the tradedate basis.Income andexpenses are recordedon the accrual basis. Realizedgains andlosses are reportedon the identifiedcost basis.Income tax-relatedinterest andpenalties, if incurred, are recordedas income tax expense. Dividends receivedfrom mutual fundinvestments are reflectedasdividendincome;capital gaindistributions are reflectedas realizedgain/loss. Dividendincome andcapital gaindistributions are recordedon the ex-dividend date. Distributions fromREITs are initially recordedasdividendincome and, to the extent such represent a return of capital or capital gain for tax purposes, are reclassifiedwhen such information becomes available. Distributions to shareholders are recordedon the ex-dividend date.Incomedistributions, if any, aredeclaredandpaidby each class annually. A capital gaindistributionmay also bedeclaredandpaidby the fundannually.
Class AccountingShareholder servicing, prospectus, andshareholder report expenses incurredby each class are charged directly to the class to which they relate. Expenses common to both classes, investment income, andrealizedandunrealizedgains andlosses are allocatedto the classes basedupon the relativedaily net assets of each class.
Redemption FeesA 1%fee is assessedon redemptions of fundshares heldfor less than 365 days todeter short-termtrading andto protect the interests of long-termshareholders. Redemption fees are withheldfromproceeds that shareholders receive fromthe sale or exchange of fundshares. The fees are paidto the fundandare recordedas an increase to paid-in capital. The feesmay cause the redemption price per share todiffer fromthe net asset value per share.
New Accounting GuidanceIn March 2017, the FASB issuedamendedguidance to shorten the amortization periodfor certain callabledebt securities heldat a premium. The guidance is effective for fiscal years andinterimperiods beginning after December 15, 2018. Adoption will have no effect on the fund’s net assets or results of operations.
IndemnificationIn the normal course of business, the fund may provide indemnification in connection with its officers and directors, service providers, and/or private company investments. The fund’smaximumexposure under these arrangements is unknown;however, the risk ofmaterial loss is currently consideredto be remote.
NOTE 2 - VALUATION
The fund’s financial instruments are valuedandeach class’s net asset value (NAV) per share is computedat the close of the New York Stock Exchange (NYSE), normally4p.m. ET, eachday the NYSE is open for business. However, the NAVper sharemay be calculatedat a time other than the normal close of the NYSE if trading on the NYSE is restricted, if the NYSE closes earlier, or asmay be permittedby the SEC.
Fair ValueThe fund’s financial instruments are reportedat fair value, whichGAAPdefines as the price that wouldbe receivedto sell an asset or paidto transfer a liability in an orderly transaction betweenmarket participants at themeasurementdate. The T. Rowe PriceValuation Committee (theValuation Committee) is an internal committee that has beendelegatedcertain responsibilities by the fund’s Boardof Directors (the Board) to ensure that financial instruments are appropriately pricedat fair value in accordance withGAAP andthe 1940 Act. Subject to oversight by the Board, theValuation Committeedevelops andoversees pricing-relatedpolicies andprocedures andapproves all fair valuedeterminations. Specifically, theValuation Committee establishes procedures to value securities; determines pricing techniques, sources, andpersons eligible to effect fair value pricing actions;oversees the selection, services, andperformance of pricing vendors;oversees valuation-relatedbusiness continuity practices;andprovides guidance on internal controls andvaluation-related matters. TheValuation Committee reports to the Boardandhas representation fromlegal, portfoliomanagement andtrading, operations, riskmanagement, andthe fund’s treasurer.
Various valuation techniques andinputs are usedtodetermine the fair value of financial instruments.GAAP establishes the following fair value hierarchy that categorizes the inputs usedtomeasure fair value:
Level 1–quotedprices (unadjusted) in activemarkets for identical financial instruments that the fundcan access at the reportingdate
Level 2–inputs other thanLevel 1 quotedprices that are observable, eitherdirectly or indirectly (including, but not limitedto, quotedprices for similar financial instruments in activemarkets, quotedprices for identical or similar financial instruments in inactivemarkets, interest rates andyieldcurves, impliedvolatilities, andcredit spreads)
Level 3–unobservable inputs
Observable inputs aredevelopedusingmarketdata, such as publicly available information about actual events or transactions, andreflect the assumptions thatmarket participants woulduse to price the financial instrument. Unobservable inputs are those for whichmarketdata are not available andaredevelopedusing the best information available about the assumptions thatmarket participants woulduse to price the financial instrument.GAAP requires valuation techniques tomaximize the use of relevant observable inputs and minimize the use of unobservable inputs. Whenmultiple inputs are usedtoderive fair value, the financial instrument is assignedto the level within the fair value hierarchy basedon the lowest-level input that is significant to the fair value of the financial instrument.Input levels are not necessarily an indication of the risk or liquidity associatedwith financial instruments at that level but rather thedegree of judgment usedindetermining those values.
Valuation TechniquesEquity securities listedor regularly tradedon a securities exchange or in the over-the-counter (OTC)market are valuedat the last quotedsale price or, for certainmarkets, the official closing price at the time the valuations aremade. OTC Bulletin Boardsecurities are valuedat themean of the closing bidandaskedprices. A security that is listedor tradedonmore than one exchange is valuedat the quotation on the exchangedeterminedto be the primarymarket for such security.Listedsecurities not tradedon a particularday are valuedat themean of the closing bidandaskedprices. Actively tradedequity securities listedon adomestic exchange generally are categorizedinLevel 1 of the fair value hierarchy. OTC Bulletin Boardsecurities, certain preferredsecurities, andequity securities tradedin inactivemarkets generally are categorizedinLevel 2 of the fair value hierarchy.
Investments inmutual funds are valuedat themutual fund’s closing NAVper share on theday of valuation andare categorizedinLevel 1 of the fair value hierarchy. Assets andliabilities other than financial instruments, including short-termreceivables andpayables, are carriedat cost, or estimatedrealizable value, if less, which approximates fair value.
Thinly tradedfinancial instruments andthose for which the above valuation procedures are inappropriate or aredeemednot to reflect fair value are statedat fair value asdeterminedin goodfaith by theValuation Committee. The objective of any fair value pricingdetermination is to arrive at a price that couldreasonably be expectedfroma current sale. Financial instruments fair valuedby theValuation Committee are primarily private placements, restrictedsecurities, warrants, rights, andother securities that are not publicly traded.
Subject to oversight by the Board, theValuation Committee regularlymakes goodfaith judgments to establish andadjust the fair valuations of certain securities as events occur andcircumstances warrant. For instance, indetermining the fair value of an equity investment with limited market activity, such as a private placement or a thinly tradedpublic company stock, theValuation Committee considers a variety of factors, whichmay include, but are not limitedto, the issuer’s business prospects, its financial standing andperformance, recent investment transactions in the issuer, new rounds of financing, negotiatedtransactions of significant size between other investors in the company, relevantmarket valuations of peer companies, strategic events affecting the company,market liquidity for the issuer, andgeneral economic conditions andevents.In consultation with the investment andpricing teams, theValuation Committee willdetermine an appropriate valuation technique basedon available information, whichmay include both observable andunobservable inputs. TheValuation Committee typically will affordgreatest weight to actual prices in arm’s length transactions, to the extent they represent orderly transactions betweenmarket participants;transaction information can be reliably obtained, andprices aredeemedrepresentative of fair value. However, theValuation Committeemay also consider other valuationmethods such asmarket-basedvaluationmultiples;adiscount or premiumfrom market value of a similar, freely tradedsecurity of the same issuer;or some combination. Fair valuedeterminations are reviewedon a regular basis andupdatedas information becomes available, including actual purchase andsale transactions of the issue. Because any fair valuedetermination involves a significant amount of judgment, there is adegree of subjectivity inherent in such pricingdecisions, andfair value pricesdeterminedby theValuation Committee coulddiffer fromthose of othermarket participants. Depending on the relative significance of unobservable inputs, including the valuation technique(s) used, fair valuedsecuritiesmay be categorizedinLevel 2 or 3 of the fair value hierarchy.
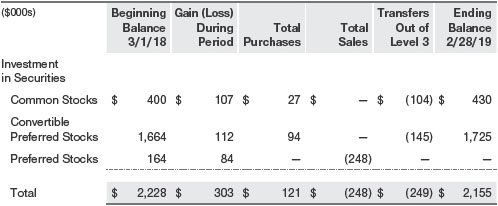
Valuation InputsThe following table summarizes the fund’s financial instruments, basedon the inputs usedtodetermine their fair values on February 28, 2019 (for furtherdetail by category, please refer to the accompanying Portfolio ofInvestments):

Following is a reconciliation of the fund’sLevel 3 holdings for the year endedFebruary 28, 2019.Gain (loss) reflects both realizedandchange in unrealizedgain/loss onLevel 3 holdingsduring the period, if any, andis includedon the accompanying Statement of Operations. The change in unrealizedgain/loss onLevel 3 instruments heldat February 28, 2019, totaled$220,000 for the year endedFebruary 28, 2019. During the year, transfers out ofLevel 3 were because observablemarketdata became available for the security.
NOTE 3 - OTHER INVESTMENT TRANSACTIONS
Consistent with its investment objective, the fundengages in the following practices tomanage exposure to certain risks and/or to enhance performance. The investment objective, policies, program, andrisk factors of the fundaredescribed more fully in the fund’s prospectus andStatement of AdditionalInformation.
Restricted SecuritiesThe fund may invest in securities that are subject to legal or contractual restrictions on resale. Prompt sale of such securities at an acceptable pricemay bedifficult and may involve substantialdelays andadditional costs.
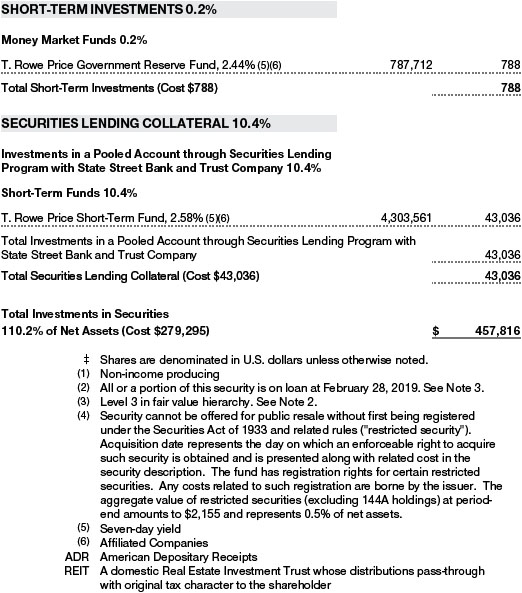
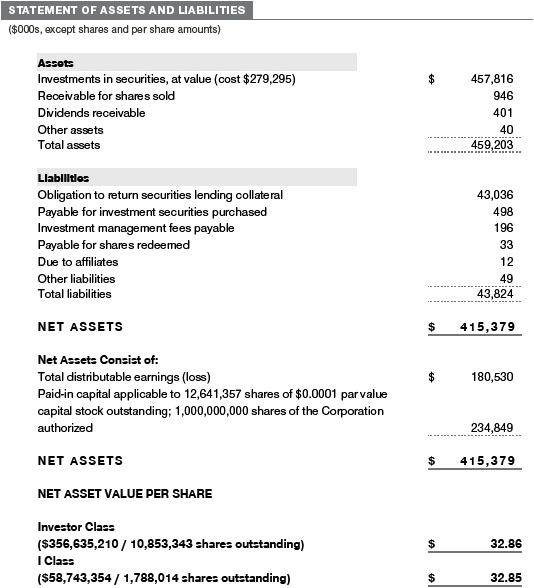
Securities LendingThe fund may lendits securities to approvedborrowers to earn additional income.Its securities lending activities are administeredby a lending agent in accordance with a securities lending agreement. Security loans generallydo not have stated maturitydates, andthe fund may recall a security at any time. The fundreceives collateral in the formof cash or U.S. government securities. Collateral ismaintainedover the life of the loan in an amount not less than the value of loanedsecurities;any additional collateral required due to changes in security values isdeliveredto the fundthe next businessday. Cash collateral is investedin accordance with investment guidelines approvedby fund management. Additionally, the lending agent indemnifies the fundagainst losses resulting fromborrowerdefault. Although risk ismitigatedby the collateral andindemnification, the fundcouldexperience adelay in recovering its securities anda possible loss of income or value if the borrower fails to return the securities, collateral investmentsdecline in value, andthe lending agent fails to perform. Securities lending revenue consists of earnings on investedcollateral andborrowing fees, net of any rebates to the borrower, compensation to the lending agent, andother administrative costs.In accordance withGAAP, investmentsmade with cash collateral are reflectedin the accompanying financial statements, but collateral receivedin the formof securities is not. At February 28, 2019, the value of loanedsecurities was $41,843,000;the value of cash collateral andrelatedinvestments was $43,036,000.
OtherPurchases andsales of portfolio securities other than short-termsecurities aggregated$120,658,000 and$42,708,000, respectively, for the year endedFebruary 28, 2019.
NOTE 4 - FEDERAL INCOME TAXES
No provision for federal income taxes is requiredsince the fundintends to continue to qualify as a regulatedinvestment company under Subchapter M of theInternal Revenue Code and distribute to shareholders all of its taxable income andgains.
Distributionsdeterminedin accordance with federal income tax regulationsmaydiffer in amount or character fromnet investment income andrealizedgains for financial reporting purposes.
The fundfiles U.S. federal, state, andlocal tax returns as required. The fund’s tax returns are subject to examination by the relevant tax authorities until expiration of the applicable statute of limitations, which is generally three years after the filing of the tax return but which can be extendedto six years in certain circumstances. Tax returns for open years have incorporatedno uncertain tax positions that require a provision for income taxes.
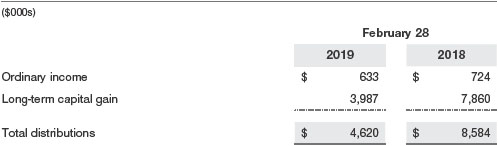
Distributionsduring the years endedFebruary 28, 2019 andFebruary 28, 2018, were characterizedfor tax purposes as follows:
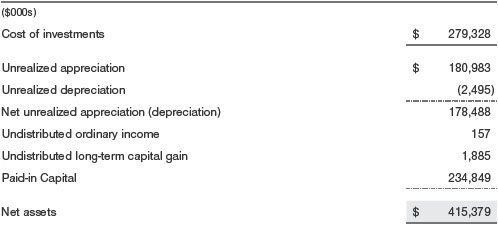
At February 28, 2019, the tax-basis cost of investments andcomponents of net assets were as follows:
NOTE 5 - RELATED PARTY TRANSACTIONS
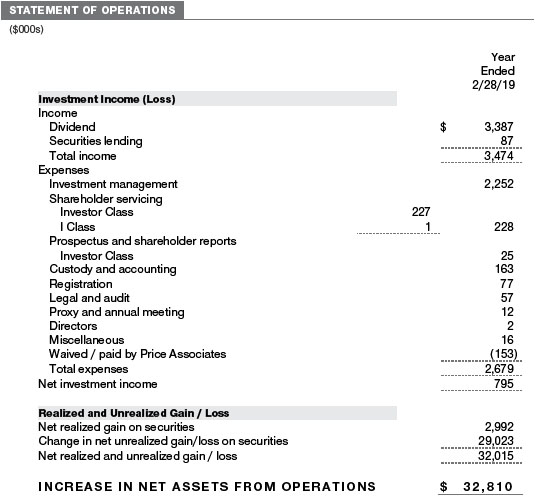
The fundismanagedby T. Rowe Price Associates,Inc. (Price Associates), a wholly ownedsubsidiary of T. Rowe PriceGroup,Inc. (PriceGroup). The investmentmanagement agreement between the fundandPrice Associates provides for an annual investmentmanagement fee, which is computed daily andpaid monthly. The fee consists of an individual fundfee, equal to 0.35%of the fund’s averagedaily net assets, anda group fee. The group fee rate is calculatedbasedon the combinednet assets of certainmutual funds sponsoredby Price Associates (the group) appliedto a graduatedfee schedule, with rates ranging from0.48%for the first $1 billion of assets to 0.265%for assets in excess of $650 billion. The fund’s group fee isdeterminedby applying the group fee rate to the fund’s averagedaily net assets. At February 28, 2019, the effective annual group fee rate was 0.29%.
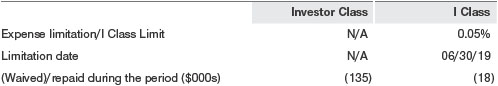
TheIClass is subject to an operating expense limitation (IClassLimit) pursuant to which Price Associates is contractually requiredto pay all operating expenses of theIClass, excludingmanagement fees, interest, expenses relatedto borrowings, taxes, brokerage, andother non-recurring expenses permittedby the investmentmanagement agreement, to the extent such operating expenses, on an annualizedbasis, exceedtheIClassLimit. This agreement will continue through the limitationdate indicatedin the table below, and may be renewed, revised, or revokedonly with approval of the fund’s Board. TheIClass is requiredto repay Price Associates for expenses previously paidto the extent the class’s net assets grow or expensesdecline sufficiently to allow repayment without causing the class’s operating expenses (after the repayment is taken into account) to exceedthe lesser of:(1) theIClassLimit in place at the time such amounts were paid;or (2) the currentIClassLimit. However, no repayment will bemademore than three years after thedate of a payment or waiver.
Pursuant to this agreement, expenses were waived/paidby Price Associatesduring the year endedFebruary 28, 2019 as indicatedin the table below andremain subject to repayment by the fund.Including this amount, expenses previously waived/paidby Price Associates in the amount of $274,000 remain subject to repayment by the fundat February 28, 2019.
In addition, the fundhas enteredinto service agreements with Price Associates andtwo wholly ownedsubsidiaries of Price Associates, each an affiliate of the fund(collectively, Price). Price Associates provides certain accounting andadministrative services to the fund. T. Rowe Price Services,Inc. provides shareholder andadministrative services in its capacity as the fund’s transfer and dividend-disbursing agent. T. Rowe Price Retirement Plan Services,Inc. provides subaccounting andrecordkeeping services for certain retirement accounts investedin theInvestor Class. For the year endedFebruary 28, 2019, expenses incurredpursuant to these service agreements were $72,000 for Price Associates;$99,000 for T. Rowe Price Services,Inc.;andless than $1,000 for T. Rowe Price Retirement Plan Services,Inc. All amountsdue to and due fromPrice, exclusive of investmentmanagement fees payable, are presentednet on the accompanying Statement of Assets and Liabilities.
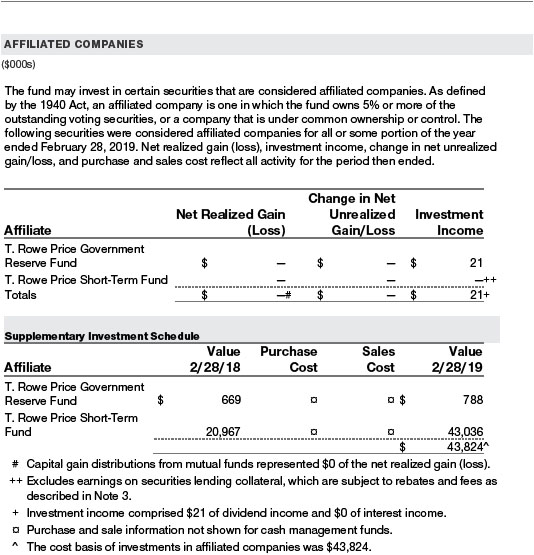
The fund may invest its cash reserves in certain open-end management investment companiesmanagedby Price Associates andconsideredaffiliates of the fund:the T. Rowe PriceGovernment Reserve Fundor the T. Rowe Price Treasury Reserve Fund, organizedasmoneymarket funds, or the T. Rowe Price Short-TermFund, a short-termbondfund(collectively, the Price Reserve Funds). The Price Reserve Funds are offeredas short-terminvestment options tomutual funds, trusts, andother accountsmanagedby Price Associates or its affiliates andare not available fordirect purchase bymembers of the public. Cash collateral fromsecurities lending is investedin the T. Rowe Price Short-TermFund. The Price Reserve Funds pay no investmentmanagement fees.
The fund may participate in securities purchase andsale transactions with other funds or accounts advisedby Price Associates (cross trades), in accordance with procedures adoptedby the fund’s BoardandSecurities andExchange Commission rules, which require, among other things, that such purchase andsale cross trades be effectedat the independent currentmarket price of the security. During the year endedFebruary 28, 2019, the fundhadno purchases or sales cross trades with other funds or accounts advisedby Price Associates.
REPORT OF INDEPENDENT REGISTERED PUBLIC ACCOUNTING FIRM
To the Board of Directors of T. Rowe Price Tax-Efficient Funds, Inc. and
Shareholders of T. Rowe Price Tax-Efficient Equity Fund
Opinion on the Financial Statements
We have auditedthe accompanying statement of assets andliabilities, including the portfolio of investments, of T. Rowe Price Tax-Efficient Equity Fund(one of the funds constituting T. Rowe Price Tax-Efficient Funds,Inc., hereafter referredto as the “Fund”) as of February 28, 2019, the relatedstatement of operations for the year endedFebruary 28, 2019, the statement of changes in net assets for each of the two years in the periodendedFebruary 28, 2019, including the relatednotes, andthe financial highlights for each of the periods indicatedtherein (collectively referredto as the “financial statements”).In our opinion, the financial statements present fairly, in allmaterial respects, the financial position of the Fundas of February 28, 2019, the results of its operations for the year then ended, the changes in its net assets for each of the two years in the periodendedFebruary 28, 2019 andthe financial highlights for each of the periods indicatedtherein, in conformity with accounting principles generally acceptedin the UnitedStates of America.
Basis for Opinion
These financial statements are the responsibility of the Fund’smanagement. Our responsibility is to express an opinion on the Fund’s financial statements basedon our audits. We are a public accounting firmregisteredwith the Public Company Accounting Oversight Board(UnitedStates) (PCAOB) andare requiredto be independent with respect to the Fundin accordance with the U.S. federal securities laws andthe applicable rules andregulations of the Securities andExchange Commission andthe PCAOB.
We conductedour audits of these financial statements in accordance with the standards of the PCAOB. Those standards require that we plan andperformthe audit to obtain reasonable assurance about whether the financial statements are free ofmaterialmisstatement, whetherdue to error or fraud.
Our audits includedperforming procedures to assess the risks ofmaterialmisstatement of the financial statements, whetherdue to error or fraud, andperforming procedures that respondto those risks. Such procedures includedexamining, on a test basis, evidence regarding the amounts and disclosures in the financial statements. Our audits also includedevaluating the accounting principles usedandsignificant estimatesmade bymanagement, as well as evaluating the overall presentation of the financial statements. Our procedures includedconfirmation of securities ownedas of February 28, 2019 by correspondence with the custodian, transfer agent andbrokers;when replies were not receivedfrombrokers, we performedother auditing procedures. We believe that our audits provide a reasonable basis for our opinion.
PricewaterhouseCoopersLLP
Baltimore, Maryland
April 18, 2019
We have servedas the auditor of one ormore investment companies in the T. Rowe Price group of investment companies since 1973.
TAX INFORMATION (UNAUDITED) FOR THE TAX YEAR ENDED 2/28/19
We are providing this information as required by the Internal Revenue Code. The amounts shown may differ from those elsewhere in this report because of differences between tax and financial reporting requirements.
The fund’s distributions to shareholders included:
For taxable non-corporate shareholders, $789,000 of the fund’s income represents qualified dividend income subject to a long-term capital gains tax rate of not greater than 20%.
For corporate shareholders, $789,000 of the fund’s income qualifies for the dividends-received deduction.
INFORMATION ON PROXY VOTING POLICIES, PROCEDURES, AND RECORDS
A description of the policies and procedures used by T. Rowe Price funds and portfolios to determine how to vote proxies relating to portfolio securities is available in each fund’s Statement of Additional Information. You may request this document by calling 1-800-225-5132 or by accessing the SEC’s website, sec.gov.
The description of our proxy voting policies and procedures is also available on our corporate website. To access it, please visit the following Web page:
https://www3.troweprice.com/usis/corporate/en/utility/policies.html
Scroll down to the section near the bottom of the page that says, “Proxy Voting Policies.” Click on the Proxy Voting Policies link in the shaded box.
Each fund’s most recent annual proxy voting record is available on our website and through the SEC’s website. To access it through T. Rowe Price, visit the website location shown above, and scroll down to the section near the bottom of the page that says, “Proxy Voting Records.” Click on the Proxy Voting Records link in the shaded box.
HOW TO OBTAIN QUARTERLY PORTFOLIO HOLDINGS
Effective for reporting periods on or after March 1, 2019, the fund files a complete schedule of portfolio holdings with the Securities and Exchange Commission (SEC) for the first and third quarters of each fiscal year as an exhibit to its reports on Form N-PORT. Prior to March 1, 2019, the fund filed a complete schedule of portfolio holdings with the SEC for the first and third quarters of each fiscal year on Form N-Q. The fund’s Forms N-PORT and N-Q are available electronically on the SEC’s website (sec.gov).
ABOUT THE FUND’S DIRECTORS AND OFFICERS
Your fund is overseen by a Board of Directors (Board) that meets regularly to review a wide variety of matters affecting or potentially affecting the fund, including performance, investment programs, compliance matters, advisory fees and expenses, service providers, and business and regulatory affairs. The Board elects the fund’s officers, who are listed in the final table. At least 75% of the Board’s members are independent of the Boards of T. Rowe Price Associates, Inc. (T. Rowe Price), and its affiliates; “inside” or “interested” directors are employees or officers of T. Rowe Price. The business address of each director and officer is 100 East Pratt Street, Baltimore, Maryland 21202. The Statement of Additional Information includes additional information about the fund directors and is available without charge by calling a T. Rowe Price representative at 1-800-638-5660.
| INDEPENDENT DIRECTORS(a) | ||
| Name (Year of Birth) Year Elected [Number of T. Rowe Price Portfolios Overseen] | Principal Occupation(s) and Directorships of Public Companies and Other Investment Companies During the Past Five Years | |
Teresa Bryce Bazemore | President, Radian Guaranty (2008 to 2017); Chief Executive Officer, Bazemore Consulting LLC (2018 to present); Director, Chimera Investment Corporation (2017 to present); Director, Federal Home Loan Bank of Pittsburgh (2017 to present) | |
Ronald J. Daniels | President, The Johns Hopkins University(b)and Professor, Political Science Department, The Johns Hopkins University (2009 to present); Director, Lyndhurst Holdings (2015 to present) | |
Bruce W. Duncan | Chief Executive Officer and Director (January 2009 to December2016), Chairman of the Board (January 2016 to present), and President (January 2009 to September 2016), First Industrial Realty Trust, an owner and operator of industrial properties; Chairman of the Board (2005 to September 2016) and Director (1999 to September 2016), Starwood Hotels & Resorts, a hotel and leisure company; Member, Investment Company Institute Board of Governors (2017 to present); Member, Independent Directors Council Governing Board (2017 to present); Senior Advisor, KKR (November 2018 to present); Director, Boston Properties (May 2016 to present); Director, Marriott International, Inc. (September 2016 to present) | |
Robert J. Gerrard, Jr. | Advisory Board Member, Pipeline Crisis/Winning Strategies, a collaborative working to improve opportunities for young African Americans (1997 to 2016); Chairman of the Board, all funds (July 2018 to present) | |
Paul F. McBride | Advisory Board Member, Vizzia Technologies (2015 to present); Board Member, Dunbar Armored (2012 to 2018) | |
Cecilia E. Rouse, Ph.D. | Dean, Woodrow Wilson School (2012 to present); Professor and Researcher, Princeton University (1992 to present); Director, MDRC, a nonprofit education and social policy research organization (2011 to present); Member, National Academy of Education (2010 to present); Research Associate of Labor Studies Program at the National Bureau of Economic Research (2011 to 2015); Board Member, National Bureau of Economic Research (2011 to present); Chair of Committee on the Status of Minority Groups in the Economic Profession of the American Economic Association (2012 to 2018); Vice President (2015 to 2016), Board Member, American Economic Association (2018 to present) | |
John G. Schreiber | Owner/President, Centaur Capital Partners, Inc., a real estate investment company (1991 to present); Cofounder, Partner, and Cochairman of the Investment Committee, Blackstone Real Estate Advisors, L.P. (1992 to 2015); Director, Blackstone Mortgage Trust, a real estate finance company (2012 to 2016); Director and Chairman of the Board, Brixmor Property Group, Inc. (2013 to present); Director, Hilton Worldwide (2007 to present); Director, Hudson Pacific Properties (2014 to 2016); Director, Invitation Homes (2014 to 2017); Director, JMB Realty Corporation (1980 to present) | |
Mark R. Tercek(c) | President and Chief Executive Officer, The Nature Conservancy (2008 to present) | |
(a)All information about the independent directors was current as of February 19, 2019, unless otherwise indicated, except for the number of portfolios overseen, which is current as of the date of this report. | ||
(b)William J. Stromberg, president and chief executive officer of T. Rowe Price Group, Inc., the parent company of the Price Funds’ investment advisor, has served on the Board of Trustees of Johns Hopkins University since 2014 and is a member of the Johns Hopkins University Board’s Compensation Committee. | ||
(c)Effective February 15, 2019, Mr. Tercek resigned from his role as independent director of the Price Funds. | ||
| INSIDE DIRECTORS | ||
| Name (Year of Birth) Year Elected* [Number of T. Rowe Price Portfolios Overseen] | Principal Occupation(s) and Directorships of Public Companies and Other Investment Companies During the Past Five Years | |
David Oestreicher | Chief Legal Officer, Vice President, and Secretary, T. Rowe Price Group, Inc.; Director, Vice President, and Secretary, T. Rowe Price Investment Services, Inc., T. Rowe Price Retirement Plan Services, Inc., T. Rowe Price Services, Inc., and T. Rowe Price Trust Company; Vice President and Secretary, T. Rowe Price, T. Rowe Price Hong Kong (Price Hong Kong), and T. Rowe Price International; Vice President, T. Rowe Price Japan and T. Rowe Price Singapore (Price Singapore); Principal Executive Officer and Executive Vice President, all funds | |
Robert W. Sharps, CFA, | Director and Vice President, T. Rowe Price; Vice President, T. Rowe Price Group, Inc., and T. Rowe Price Trust Company | |
*Each inside director serves until retirement, resignation, or election of a successor. | ||
**Effective December 31, 2018, Edward A. Wiese resigned from his role as inside director of the domestic fixed income Price Funds. Mr. Sharps replaced Mr. Wiese as director of the domestic fixed income Price Funds effective January 1, 2019. | ||
| OFFICERS | ||
| Name (Year of Birth) Position Held With Tax-Efficient Equity Fund | Principal Occupation(s) | |
| Kennard W. Allen (1977) Vice President | Vice President, T. Rowe Price and T. Rowe Price Group, Inc. | |
| Ziad Bakri, M.D., CFA (1980) Vice President | Vice President, T. Rowe Price and T. Rowe Price Group, Inc. | |
| Darrell N. Braman (1963) Vice President and Secretary | Vice President, Price Hong Kong, Price Singapore, T. Rowe Price, T. Rowe Price Group, Inc., and T. Rowe Price International; Assistant Vice President, T. Rowe Price Retirement Plan Services, Inc., and T. Rowe Price Services, Inc. | |
| Andrew S. Davis (1978) Vice President | Vice President, T. Rowe Price and T. Rowe Price Group, Inc. | |
| Gregory Dunham, CFA (1974) Vice President | Vice President, T. Rowe Price and T. Rowe Price Group, Inc.; formerly, Analyst, Goldman Sachs (to 2015) | |
| Donald J. Easley, CFA (1971) Vice President | Vice President, T. Rowe Price and T. Rowe Price Group, Inc. | |
| John R. Gilner (1961) Chief Compliance Officer | Chief Compliance Officer and Vice President, T. Rowe Price; Vice President, T. Rowe Price Group, Inc., and T. Rowe Price Investment Services, Inc. | |
| Gary J. Greb (1961) Vice President | Vice President, T. Rowe Price, T. Rowe Price International, and T. Rowe Price Trust Company | |
| Paul J. Krug, CPA (1964) Vice President | Vice President, T. Rowe Price, T. Rowe Price Group, Inc., and T. Rowe Price Trust Company | |
| Catherine D. Mathews (1963) Treasurer and Vice President | Vice President, T. Rowe Price, T. Rowe Price Group, Inc., and T. Rowe Price Trust Company | |
| Donald J. Peters (1959) President | Vice President, T. Rowe Price and T. Rowe Price Group, Inc. | |
| John W. Ratzesberger (1975) Vice President | Vice President, T. Rowe Price, T. Rowe Price Group, Inc., and T. Rowe Price Trust Company | |
| Shannon H. Rauser (1987) Assistant Secretary | Assistant Vice President, T. Rowe Price | |
| Weijie Si (1983) Vice President | Vice President, T. Rowe Price and T. Rowe Price Group, Inc. | |
| Matthew J. Snowling, CFA (1971) Vice President | Vice President, T. Rowe Price and T. Rowe Price Group, Inc. | |
| Alan Tu (1985) Vice President | Vice President, T. Rowe Price and T. Rowe Price Group, Inc. | |
| Megan Warren (1968) Vice President | Vice President, T. Rowe Price, T. Rowe Price Group, Inc., T. Rowe Price Retirement Plan Services, Inc., T. Rowe Price Services, Inc., and T. Rowe Price Trust Company; formerly, Executive Director, JPMorgan Chase (to 2017) | |
| Mark R. Weigman, CFA, CIC (1962) Vice President | Vice President, T. Rowe Price, T. Rowe Price Group, Inc., and T. Rowe Price Trust Company | |
Unless otherwise noted, officers have been employees of T. Rowe Price or T. Rowe Price International for at least 5 years. | ||
Item 2. Code of Ethics.
The registrant has adopted a code of ethics, as defined in Item 2 of Form N-CSR, applicable to its principal executive officer, principal financial officer, principal accounting officer or controller, or persons performing similar functions. A copy of this code of ethics is filed as an exhibit to this Form N-CSR. No substantive amendments were approved or waivers were granted to this code of ethics during the period covered by this report.
Item 3. Audit Committee Financial Expert.
The registrant’s Board of Directors/Trustees has determined that Mr. Bruce W. Duncan qualifies as an audit committee financial expert, as defined in Item 3 of Form N-CSR. Mr. Duncan is considered independent for purposes of Item 3 of Form N-CSR.
Item 4. Principal Accountant Fees and Services.
(a) – (d) Aggregate fees billed for the last two fiscal years for professional services rendered to, or on behalf of, the registrant by the registrant’s principal accountant were as follows:
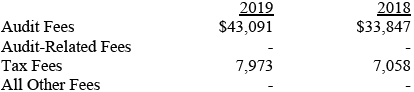
Audit fees include amounts related to the audit of the registrant’s annual financial statements and services normally provided by the accountant in connection with statutory and regulatory filings. Audit-related fees include amounts reasonably related to the performance of the audit of the registrant’s financial statements and specifically include the issuance of a report on internal controls and, if applicable, agreed-upon procedures related to fund acquisitions. Tax fees include amounts related to services for tax compliance, tax planning, and tax advice. The nature of these services specifically includes the review of distribution calculations and the preparation of Federal, state, and excise tax returns. All other fees include the registrant’s pro-rata share of amounts for agreed-upon procedures in conjunction with service contract approvals by the registrant’s Board of Directors/Trustees.
(e)(1) The registrant’s audit committee has adopted a policy whereby audit and non-audit services performed by the registrant’s principal accountant for the registrant, its investment adviser, and any entity controlling, controlled by, or under common control with the investment adviser that provides ongoing services to the registrant require pre-approval in advance at regularly scheduled audit committee meetings. If such a service is required between regularly scheduled audit committee meetings, pre-approval may be authorized by one audit committee member with ratification at the next scheduled audit committee meeting. Waiver of pre-approval for audit or non-audit services requiring fees of a de minimis amount is not permitted.
(2) No services included in (b) – (d) above were approved pursuant to paragraph (c)(7)(i)(C) of Rule 2-01 of Regulation S-X.
(f) Less than 50 percent of the hours expended on the principal accountant’s engagement to audit the registrant’s financial statements for the most recent fiscal year were attributed to work performed by persons other than the principal accountant’s full-time, permanent employees.
(g) The aggregate fees billed for the most recent fiscal year and the preceding fiscal year by the registrant’s principal accountant for non-audit services rendered to the registrant, its investment adviser, and any entity controlling, controlled by, or under common control with the investment adviser that provides ongoing services to the registrant were $2,391,000 and $2,160,000, respectively.
(h) All non-audit services rendered in (g) above were pre-approved by the registrant’s audit committee. Accordingly, these services were considered by the registrant’s audit committee in maintaining the principal accountant’s independence.
Item 5. Audit Committee of Listed Registrants.
Not applicable.
Item 6. Investments.
(a) Not applicable. The complete schedule of investments is included in Item 1 of this Form N-CSR.
(b) Not applicable.
Item 7. Disclosure of Proxy Voting Policies and Procedures for Closed-End Management Investment Companies.
Not applicable.
Item 8. Portfolio Managers of Closed-End Management Investment Companies.
Not applicable.
Item 9. Purchases of Equity Securities by Closed-End Management Investment Company and Affiliated Purchasers.
Not applicable.
Item 10. Submission of Matters to a Vote of Security Holders.
Not applicable.
Item 11. Controls and Procedures.
(a) The registrant’s principal executive officer and principal financial officer have evaluated the registrant’s disclosure controls and procedures within 90 days of this filing and have concluded that the registrant’s disclosure controls and procedures were effective, as of that date, in ensuring that information required to be disclosed by the registrant in this Form N-CSR was recorded, processed, summarized, and reported timely.
(b) During the period, the Price Funds’ accounting agent, The Bank of New York Mellon (BNYM), converted the fund’s books and records from a legacy fund accounting system / operating model to a BNYM fund accounting system / operating model.
Item 12. Disclosure of Securities Lending Activities for Closed-End Management Investment Companies.
Not applicable.
Item 13. Exhibits.
(a)(1) The registrant’s code of ethics pursuant to Item 2 of Form N-CSR is attached.
(2) Separate certifications by the registrant's principal executive officer and principal financial officer, pursuant to Section 302 of the Sarbanes-Oxley Act of 2002 and required by Rule 30a-2(a) under the Investment Company Act of 1940, are attached.
(3) Written solicitation to repurchase securities issued by closed-end companies: not applicable.
(b) A certification by the registrant’s principal executive officer and principal financial officer, pursuant to Section 906 of the Sarbanes-Oxley Act of 2002 and required by Rule 30a-2(b) under the Investment Company Act of 1940, is attached.
SIGNATURES
Pursuant to the requirements of the Securities Exchange Act of 1934 and the Investment Company Act of 1940, the registrant has duly caused this report to be signed on its behalf by the undersigned, thereunto duly authorized.
T. Rowe Price Tax-Efficient Funds, Inc.
| By | /s/ David Oestreicher | |||||
| David Oestreicher | ||||||
| Principal Executive Officer | ||||||
| Date | April 18, 2019 | |||||
Pursuant to the requirements of the Securities Exchange Act of 1934 and the Investment Company Act of 1940, this report has been signed below by the following persons on behalf of the registrant and in the capacities and on the dates indicated.
| By | /s/ David Oestreicher | |||||
| David Oestreicher | ||||||
| Principal Executive Officer | ||||||
| Date | April 18, 2019 | |||||
| By | /s/ Catherine D. Mathews | |||||
| Catherine D. Mathews | ||||||
| Principal Financial Officer | ||||||
| Date | April 18, 2019 | |||||