UNITED STATES
SECURITIES AND EXCHANGE COMMISSION
Washington, D.C. 20549
FORM N-CSR
CERTIFIED SHAREHOLDER REPORT OF REGISTERED MANAGEMENT INVESTMENT COMPANIES
Investment Company Act file number | 811-08231 | ||||||
| |||||||
Spirit of America Investment Fund, Inc. | |||||||
(Exact name of registrant as specified in charter) | |||||||
| |||||||
477 Jericho Turnpike |
|
| |||||
P.O. Box 9006 |
|
| |||||
Syosset, NY |
| 11791-9006 | |||||
(Address of principal executive offices) |
| (Zip code) | |||||
| |||||||
Mr. David Lerner | |||||||
SSH Securities, Inc. | |||||||
477 Jericho Turnpike | |||||||
P.O. Box 9006 | |||||||
Syosset, NY 11791-9006 | |||||||
(Name and address of agent for service) | |||||||
| |||||||
Registrant’s telephone number, including area code: | (516) 390-5555 |
| |||||
| |||||||
Date of fiscal year end: | December 31 |
| |||||
| |||||||
Date of reporting period: | December 31, 2007 |
| |||||
Form N-CSR is to be used by management investment companies to file reports with the Commission not later than 10 days after the transmission to stockholders of any report that is required to be transmitted to stockholders under Rule 30e-1 under the Investment Company Act of 1940 (17 CFR 270.30e-1). The Commission may use the information provided on Form N-CSR in its regulatory, disclosure review, inspection, and policymaking roles.
A registrant is required to disclose the information specified by Form N-CSR, and the Commission will make this information public. A registrant is not required to respond to the collection of information contained in Form N-CSR unless the Form displays a currently valid Office of Management and Budget (“OMB”) control number. Please direct comments concerning the accuracy of the information collection burden estimate and any suggestions for reducing the burden to Secretary, Securities and Exchange Commission, 100 F Street, NE, Washington, DC 20549. The OMB has reviewed this collection of information under the clearance requirements of 44 U.S.C. § 3507.
Item 1. Reports to Stockholders.
The Report to Shareholders is attached herewith.

Message To Our Shareholders | 1 |
|
|
|
|
Management Discussion | 2 |
|
|
|
|
Summary of Portfolio Holdings | 2 |
|
|
|
|
Illustration of Investment | 3 |
|
|
|
|
Disclosure of Fund Expenses | 4 |
|
|
|
|
Schedule of Investments | 5 |
|
|
|
|
Statement of Assets and Liabilities | 6 |
|
|
|
|
Statements of Operations | 7 |
|
|
|
|
Statements of Changes in Net Assets | 8 |
|
|
|
|
Financial Highlights | 9-10 |
|
|
|
|
Notes to Financial Statements | 11-13 |
|
|
|
|
Renewal of Investment Advisory Agreement | 14 |
|
|
| |
Report of Independent Registered Public Accounting Firm | 15 | |
|
| |
Management of the Company | 16 |

SPIRIT OF AMERICA REAL ESTATE INCOME AND GROWTH FUND
MESSAGE TO OUR SHAREHOLDERS
| February 2008 |
Dear Shareholder,
We are very pleased to present you with the annual report for the Spirit of America Real Estate Income and Growth Fund. In order to improve our accounting to shareholders, the Fund has elected to change its fiscal year-end to December 31 to coincide with calendar quarter and year-ends, from our previous fiscal year ended October 31. Aligning the Fund’s reporting dates to coincide with calendar quarter and year-ends should allow more accurate tax allocation reporting and simplified comparability. This updated annual report covers both the two-month period ended December 31, 2007 and the fiscal year ended October 31, 2007, highlighting the period from October 31, 2007 to December 31, 2007.
Following well publicized merger and acquisition activity in the real estate industry, major real estate investment trust (“REIT”) indices reached all-time highs in early 2007. However, by mid-year, credit market turmoil had caused yield spreads to widen, and a steepening of the yield curve. As a result, the scale of leveraged acquisition activity subsequently diminished. While the latest data continue to indicate that commercial property fundamentals remain strong, REIT stocks have pulled back significantly.
The recent decline in financial sector stock valuation, coupled with relatively firm property values, has created opportunity, in our opinion, as some REIT stocks currently trade at a significant discount to our estimates of the net asset value of the underlying real estate. Nonetheless, given the increased volatility in REIT share prices, we have positioned the Spirit of America portfolio defensively. The Fund has significant investments in higher yielding stocks, and concentrations in health care REITs, diversified REITs, as well as triple-net-lease REITs, which we believe to be less sensitive to short-term economic fluctuations.
Our investment philosophy continues to be to seek value in the bricks and mortar of America through REITs that own office buildings, shopping malls, hotels, apartments, and other commercial properties. The goal is to benefit from the cash flow stream generated by the rental of these properties while also participating in potential long-term appreciation of property values.
Statistical studies have shown that including REITs in a diversified investment portfolio has historically improved total return while also reducing risk. Although no one can be assured of future results, in addition to adding to your account, now may be an opportune time to initiate a dollar cost averaging program. This time-tested strategy allows investors to buy more shares when prices are low and less when they are higher, with the goal of achieving a lower average investment cost and higher returns over the long-term.
We are grateful for your continued support, and look forward to your future investment in the Fund.
Sincerely, |
|
|
|
|
|
|
|
David Lerner | Ronald W. Weiss |
President | Portfolio Manager |


Any investment in equity securities is subject to risk and market values may fluctuate with economic conditions, interest rates, civil unrest, natural disasters and other factors. As with any mutual fund, an investor’s shares, when redeemed, may be worth more or less than their original cost. Past performance is no guarantee of future results.
Prospective investors should consider the investment objective, risks and charges and expenses of the Fund carefully before investing. The maximum sales charge on share purchases is 5.25% of the offering price. The Fund’s prospectus contains this and other information about the Fund and may be obtained through your broker or by calling 1-800-452-4892. The prospectus should be read carefully before investing.
1
SPIRIT OF AMERICA REAL ESTATE INCOME AND GROWTH FUND
MANAGEMENT DISCUSSION
DECEMBER 31, 2007
Market Summary
After a protracted period of relative stability, equity markets became notably more volatile in the year ended December 31,2007. The S&P 500 Volatility Index, or VIX, reached levels not seen since early 2003, when the latest bull market began. Contributing to the aforementioned increase in volatility was the sharp decline in financial sector stocks following the realization that sub-prime mortgage related securities would impact profitability. Nonetheless, the S&P 500 Index reached new highs during the year, and delivered a positive return of 5.5%.
REIT Summary
REITs were not immune from the increased volatility in equity markets. The MSCI REIT Index (the “RMS”) reached an all-time high in February. However, by December 31, the RMS had pulled back and it ended the year with a loss of 16.8%. After several years of outperforming the broader market, REITs underperformed the S&P 500 Index by 22.3% in 2007.
Fund Summary
The Fund also reached an all-time high in February. However, it too ended the year lower for the first time since fiscal year 1999. The management team attempted to mitigate losses related to the downturn in the financial sector through defensive positioning. The Fund held no homebuilding or residential mortgage REIT stocks in 2007. Relative to a market capitalization weighted basket of all REIT stocks, the Fund had a higher allocation of health care REITs, triple-net-lease REITs, and diversified REITs, which management believes to be less sensitive to short-term economic fluctuations. The Fund had a lower allocation of industrial REITs, and retail REITs, particularly those that own regional shopping malls. This strategy helped the Fund perform relatively well as the financial sector (which includes REITs) declined, allowing it to outperform its benchmark in the second quarter of 2007. For the two-month period ended December 31, 2007, the Fund returned 0.32% less than the benchmark.
Comparative Returns
The Fund returned (18.98%) in the calendar year ended December 31,2007. This compares to (16.82%) for the RMS. Although shares declined 28.9% in fiscal 2007, the Fund’s total return benefited from a significantly higher than average dividend, which provided a yield of 10.89% in the twelve-month period ended December 31,2007. The sales load adjusted returns for the year ended December 31, 2007 were (23.23%) for the Class A shares, and (24.20%) for the Class B shares.
SUMMARY OF PORTFOLIO HOLDINGS (UNAUDITED)
DECEMBER 31, 2007
The Securities and Exchange Commission (“SEC”) has adopted a requirement that all Funds present their categories of portfolio holdings in a table, chart or graph format in their annual and semi-annual shareholder reports, whether or not a schedule of investments is utilized. The following table, which presents portfolio holdings as a percentage of total market value, is provided in compliance with such requirement.
Sector Diversification (% of market value) |
Health Care (REITs) |
| 23.25 | % | $ | 51,527,081 |
|
Office Space (REITs) |
| 13.26 |
| 29,371,478 |
| |
Apartments (REITs) |
| 12.95 |
| 28,693,056 |
| |
Regional Malls (REITs) |
| 10.02 |
| 22,213,501 |
| |
Hotels (REITs) |
| 9.54 |
| 21,137,863 |
| |
Shopping Centers (REITs) |
| 9.02 |
| 19,995,868 |
| |
Diversified (REITs) |
| 8.68 |
| 19,235,092 |
| |
Net Lease (REITs) |
| 5.38 |
| 11,915,816 |
| |
Industrial (REITs) |
| 4.67 |
| 10,350,625 |
| |
Storage (REITs) |
| 2.30 |
| 5,095,680 |
| |
Manufactured Homes (REITs) |
| 0.93 |
| 2,056,432 |
| |
Total Investments |
| 100.00 | % | $ | 221,592,492 |
|
See accompanying notes to financial statements.
2
SPIRIT OF AMERICA REAL ESTATE INCOME AND GROWTH FUND
ILLUSTRATION OF INVESTMENT (UNAUDITED)
The graph below compares the increase in value of a $10,000 investment in the Spirit of America Real Estate Income and Growth Fund – Class A and Class B with the performance of the MSCI US REIT Index. The values and returns for the Spirit of America Real Estate Income and Growth Fund – Class A include reinvested distributions, and the impact of the maximum sales charge of 5.25% placed on purchases. The values and returns for the Spirit of America Real Estate Income and Growth Fund - Class B include reinvested distributions, and the impact of the contingent deferred sales charge at redemption. The returns shown do not reflect taxes that a shareholder would pay on Fund distributions or on the redemption of Fund shares.
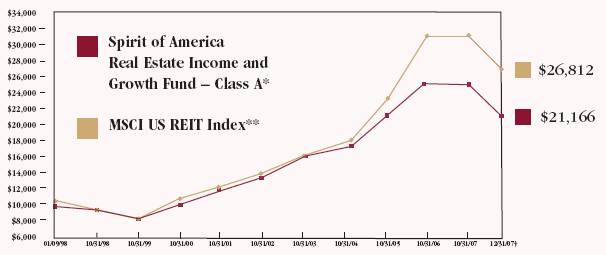
* | Fund commenced operations January 9, 1998. |
** | The MSCI US REIT Index benchmark is based on a start date of December 31, 1997. |
† | Prior to 12/31/07, the Fund had a fiscal year-end of 10/31. |
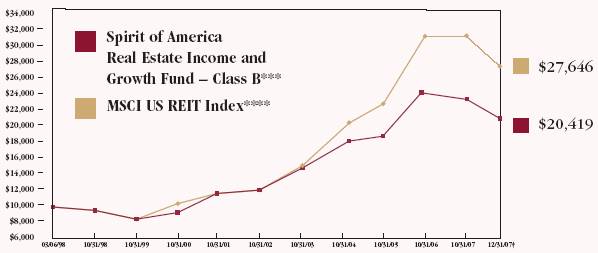
*** | Class B shares commenced operations March 6, 1998. |
**** | The MSCI US REIT Index benchmark is based on a start date of February 28, 1998. |
† | Prior to 12/31/07, the Fund had a fiscal year-end of 10/31. |
The MSCI US REIT Index is an unmanaged index. The MSCI US REIT Index is a free float-adjusted market capitalization weighted index that is comprised of equity Real Estate Investment Trusts (“REITs”) that are included in the MSCI US Investable Market 2500 Index, with the exception of specialty equity REITs that do not generate a majority of their revenue and income from real estate rental and leasing operations. The index represents approximately 85% of the US REIT universe. The performance of an index assumes no transaction costs, taxes, management fees or other expenses. A direct investment in an index is not possible.
Average Annual Total Returns - For the Periods Ended December 31, 2007
|
| Class A Shares |
| Class B Shares |
|
1 Year (with sales charge) |
| (23.23 | )%(a) | (24.20 | )%(b) |
1 Year (without sales charge) |
| (18.98 | )% | (19.58 | )% |
5 Years (with sales charge) |
| 10.71 | %(a) | 9.84 | %(b) |
5 Years (without sales charge) |
| 11.93 | % | 11.15 | % |
Since Inception (with sales charge)(c) |
| 7.81 | %(a) | 7.53 | %(b) |
Since Inception (without sales charge)(c) |
| 8.39 | % | 8.19 | % |
Past performance is not indicative of future results.
(a) |
| Reflects a 5.25% front-end sales charge. |
(b) |
| Reflects a contingent deferred sales charge of 5.75%. |
(c) |
| Inception dates: January 9, 1998 and March 6, 1998 for Class A & B, respectively. |
3
SPIRIT OF AMERICA REAL ESTATE INCOME AND GROWTH FUND
DISCLOSURE OF FUND EXPENSES (UNAUDITED)
FOR THE TWO MONTH PERIOD NOVEMBER 1, 2007 TO DECEMBER 31, 2007
We believe it is important for you to understand the impact of fees regarding your investment. All mutual funds have operating expenses. As a shareholder of the Fund, you incur ongoing costs, which include costs for portfolio management, administrative services, and shareholder reports (like this one), among others. Operating expenses, which are deducted from the Fund’s gross income, directly reduce the investment return of the Fund. The Fund’s expenses are expressed as a percentage of its average net assets. This figure is known as the expense ratio. The following examples are intended to help you understand the ongoing fees (in dollars) of investing in your Fund and to compare these costs with those of other mutual funds. The examples are based on an investment of $1,000 made at the beginning of the period shown and held for the entire period.
Spirit of America Real Estate Income and Growth Fund |
| Beginning |
| Ending Account |
| Expense Ratio |
| Expenses |
| |||
|
|
|
|
|
|
|
|
|
| |||
Actual Fund Return |
|
|
|
|
|
|
|
|
| |||
Class A |
| $ | 1,000.00 |
| $ | 854.70 |
| 1.75 | % | $ | 2.71 |
|
Class B |
| $ | 1,000.00 |
| $ | 853.60 |
| 2.45 | % | $ | 3.79 |
|
|
|
|
|
|
|
|
|
|
| |||
Hypothetical 5% Return |
|
|
|
|
|
|
|
|
| |||
Class A |
| $ | 1,000.00 |
| $ | 1,005.43 |
| 1.75 | % | $ | 2.93 |
|
Class B |
| $ | 1,000.00 |
| $ | 1,004.26 |
| 2.45 | % | $ | 4.10 |
|
This table illustrates your Fund’s costs in two ways:
Actual Fund Return: This section helps you to estimate the actual expenses that you paid over the period. The “Ending Account Value” shown is derived from the Fund’s actual return, the third column shows the period’s annualized expense ratio, and the last column shows the dollar amount that would have been paid by an investor who started with $1,000 in the Fund at the beginning of the period. You may use the information here, together with your account value, to estimate the expenses that you paid over the period.
To do so, simply divide your account value by $1,000 (for example, an $8,600 account value divided by $1,000 = 8.6), then multiply the result by the number in the first line under the heading entitled “Expenses Paid During Period.”
Hypothetical 5% Return: This section is intended to help you compare your Fund’s costs with those of other mutual funds. It assumes that the Fund had a return of 5% before expenses during the period shown, but that the expense ratio is unchanged. In this case, because the return used is not the Fund’s actual return, the results do not apply to your investment. You can assess your Fund’s costs by comparing this hypothetical example with the hypothetical examples that appear in shareholder reports of other funds.
Please note that the expense shown in the table are meant to highlight your ongoing costs only and do not reflect any transactional costs such as sales charges (loads), or redemption fees.
(1) | Annualized, based on the Fund’s most recent two-month period expenses. |
|
|
(2) | Expenses are equal to the Fund’s annualized expense ratio multiplied by the average acount value over the period, multiplied by the number of days in the period, then divided by 365. |
4
SPIRIT OF AMERICA REAL ESTATE INCOME AND GROWTH FUND
SCHEDULE OF INVESTMENTS
DECEMBER 31, 2007
|
| Shares |
| Market Value |
| |
COMMON STOCKS - 99.26% |
|
|
|
|
| |
|
|
|
|
|
| |
Apartments (REITs) - 12.85% |
|
|
|
|
| |
Apartment Investment & Management Co., Class A |
| 214,200 |
| $ | 7,439,166 |
|
Associated Estates Realty Corp. |
| 499,000 |
| 4,710,560 |
| |
Mid-America Apartment Communities, Inc. |
| 219,800 |
| 9,396,450 |
| |
Post Properties, Inc. |
| 151,500 |
| 5,320,680 |
| |
UDR, Inc. |
| 92,000 |
| 1,826,200 |
| |
|
|
|
| 28,693,056 |
| |
Diversified (REITs) - 8.61% |
|
|
|
|
| |
Colonial Properties Trust |
| 323,723 |
| 7,325,851 |
| |
Lexington Realty Trust |
| 634,200 |
| 9,221,268 |
| |
Liberty Property Trust |
| 93,300 |
| 2,687,973 |
| |
|
|
|
| 19,235,092 |
| |
Health Care (REITs) - 23.08% |
|
|
|
|
| |
HCP, Inc. |
| 247,800 |
| 8,618,484 |
| |
Health Care REIT, Inc. |
| 288,000 |
| 12,870,720 |
| |
Healthcare Realty Trust, Inc. |
| 396,700 |
| 10,072,213 |
| |
National Health Investors, Inc. |
| 210,500 |
| 5,872,950 |
| |
Nationwide Health Properties, Inc. |
| 382,400 |
| 11,995,888 |
| |
OMEGA Healthcare Investors, Inc. |
| 59,000 |
| 946,950 |
| |
Senior Housing Properties Trust |
| 50,700 |
| 1,149,876 |
| |
|
|
|
| 51,527,081 |
| |
Hotels (REITs) - 9.47% |
|
|
|
|
| |
Ashford Hospitality Trust, Inc. |
| 1,345,100 |
| 9,671,269 |
| |
Hospitality Properties Trust |
| 310,500 |
| 10,004,310 |
| |
PMC Commercial Trust |
| 135,900 |
| 1,462,284 |
| |
|
|
|
| 21,137,863 |
| |
Industrial (REITs) - 4.64% |
|
|
|
|
| |
First Industrial Realty Trust, Inc. |
| 299,151 |
| 10,350,625 |
| |
|
|
|
|
|
| |
Manufactured Homes (REITs) - 0.92% |
|
|
|
|
| |
Sun Communities, Inc. |
| 97,600 |
| 2,056,432 |
| |
|
|
|
|
|
| |
Net Lease (REITs) - 5.34% |
|
|
|
|
| |
National Retail Properties, Inc. |
| 429,916 |
| 10,051,436 |
| |
Realty Income Corp. |
| 69,000 |
| 1,864,380 |
| |
|
|
|
| 11,915,816 |
| |
Office Space (REITs) - 13.16% |
|
|
|
|
| |
American Financial Realty Trust |
| 636,000 |
| 5,100,720 |
| |
Brandywine Realty Trust |
| 170,500 |
| 3,057,065 |
| |
Highwoods Properties, Inc. |
| 221,500 |
| 6,507,670 |
| |
HRPT Properties Trust |
| 1,285,600 |
| 9,937,688 |
| |
Mack-Cali Realty Corp. |
| 126,600 |
| 4,304,400 |
| |
SL Green Realty Corp. |
| 4,964 |
| 463,935 |
| |
|
|
|
| 29,371,478 |
| |
Regional Malls (REITs) - 9.95% |
|
|
|
|
| |
Glimcher Realty Trust |
| 548,450 |
| 7,837,351 |
| |
Macerich Co. (The) |
| 82,200 |
| 5,841,132 |
| |
Pennsylvania Real Estate Investment Trust |
| 266,694 |
| 7,915,478 |
| |
Simon Property Group, Inc. |
| 6,000 |
| 521,160 |
| |
Taubman Centers, Inc. |
| 2,000 |
| 98,380 |
| |
|
|
|
| 22,213,501 |
| |
Shopping Centers (REITs) - 8.96% |
|
|
|
|
| |
Developers Diversified Realty Corp. |
| 174,604 |
| 6,685,587 |
| |
Equity One, Inc. |
| 181,500 |
| 4,179,945 |
| |
Federal Realty Investment Trust |
| 44,600 |
| 3,663,890 |
| |
Ramco-Gershenson Properties Trust |
| 255,800 |
| 5,466,446 |
| |
|
|
|
| 19,995,868 |
| |
Storage (REITs) - 2.28% |
|
|
|
|
| |
Sovran Self Storage, Inc. |
| 108,800 |
| 4,362,880 |
| |
U-Store-It-Trust |
| 80,000 |
| 732,800 |
| |
|
|
|
| 5,095,680 |
| |
Total Investments - 99.26% |
|
|
| 221,592,492 |
| |
Cash and Other Assets Net of Liabilities - 0.74% |
|
|
| 1,644,724 |
| |
NET ASSETS - 100.00% |
|
|
| $ | 223,237,216 |
|
REITs - Real Estate Investment Trusts |
|
|
|
|
|
* Cost for federal income tax purposes is $201,361,179 and net unrealized appreciation consists of: |
|
|
| ||
| Gross unrealized appreciation |
| $ | 47,335,244 |
|
| Gross unrealized depreciation |
| (27,103,931 | ) | |
| Net unrealized appreciation |
| $ | 20,231,313 |
|
See accompanying notes to financial statements.
5
SPIRIT OF AMERICA REAL ESTATE INCOME AND GROWTH FUND
STATEMENT OF ASSETS AND LIABILITIES
DECEMBER 31, 2007
ASSETS |
|
|
| |
Investments in securities at value (cost $201,361,179) (Note 1) |
| $ | 221,592,492 |
|
Capital stock sold |
| 674,719 |
| |
Dividends and interest |
| 3,711,542 |
| |
Prepaid assets |
| 16,379 |
| |
TOTAL ASSETS |
| 225,995,132 |
| |
|
|
|
| |
LIABILITIES |
|
|
| |
Due to custodian |
| 1,616,648 |
| |
Capital stock redeemed |
| 685,089 |
| |
Advisory fees |
| 191,619 |
| |
Directors’ fees |
| 4,213 |
| |
Distribution expenses (Note 3) |
| 64,115 |
| |
Other accrued expenses |
| 196,232 |
| |
TOTAL LIABILITIES |
| 2,757,916 |
| |
|
|
|
| |
NET ASSETS |
| $ | 223,237,216 |
|
|
|
|
| |
Class A Shares |
|
|
| |
Net assets applicable to 19,057,743 outstanding, $0.001 par value (500,000,000 authorized shares) |
| $ | 215,591,660 |
|
Net asset value and redemption price per Class A Share ($215,591,660 ÷ 19,057,743 shares) |
| $ | 11.31 |
|
Maximum offering price per share ($11.31 ÷ 0.9475) |
| $ | 11.94 |
|
|
|
|
| |
Class B Shares |
|
|
| |
Net assets applicable to 662,759 outstanding, $0.001 par value (500,000,000 authorized shares) |
| $ | 7,645,556 |
|
Net asset value and offering price per Class B Share ($7,645,556 ÷ 662,759 shares) (a) |
| $ | 11.54 |
|
|
|
|
| |
SOURCE OF NET ASSETS |
|
|
| |
At December 31, 2007, net assets consisted of: |
|
|
| |
Paid-in capital |
| $ | 203,005,903 |
|
Net unrealized appreciation on investments |
| 20,231,313 |
| |
NET ASSETS |
| $ | 223,237,216 |
|
(a) Redemption price varies based on length of time held.
See accompanying notes to financial statements.
6
SPIRIT OF AMERICA REAL ESTATE INCOME AND GROWTH FUND
STATEMENTS OF OPERATIONS
|
| For the Two-Month Period |
| For the Year |
| ||
INVESTMENT INCOME |
|
|
|
|
| ||
Dividends |
| $ | 2,195,933 |
| $ | 9,530,953 |
|
Interest |
| 18,765 |
| 200,079 |
| ||
TOTAL INVESTMENT INCOME |
| 2,214,698 |
| 9,731,032 |
| ||
|
|
|
|
|
| ||
EXPENSES |
|
|
|
|
| ||
Investment Advisory fees (Note 3) |
| 385,043 |
| 2,535,519 |
| ||
Distribution fees - Class A (Note 3) |
| 114,872 |
| 749,972 |
| ||
Distribution fees - Class B (Note 3) |
| 14,044 |
| 114,030 |
| ||
Transfer Agent fees |
| 75,794 |
| 459,550 |
| ||
Administration fees |
| 32,348 |
| 205,697 |
| ||
Accounting fees |
| 15,427 |
| 93,828 |
| ||
Insurance expense |
| 13,044 |
| 81,298 |
| ||
Printing expense |
| 8,595 |
| 53,730 |
| ||
Custodian fees |
| 7,144 |
| 43,180 |
| ||
Legal fees |
| 6,628 |
| 41,026 |
| ||
Directors’ fees |
| 4,213 |
| 26,810 |
| ||
Registration fees |
| 3,664 |
| 24,591 |
| ||
Chief Compliance Officer salary |
| 3,139 |
| 18,471 |
| ||
Auditing fees |
| 17,700 |
| 17,698 |
| ||
Other expenses |
| 1,091 |
| 8,076 |
| ||
TOTAL EXPENSES |
| 702,746 |
| 4,473,476 |
| ||
NET INVESTMENT INCOME |
| 1,511,952 |
| 5,257,556 |
| ||
|
|
|
|
|
| ||
REALIZED AND UNREALIZED GAIN (LOSS) ON INVESTMENTS |
|
|
|
|
| ||
Net realized gain from investment transactions and REITs |
| 2,344,375 |
| 24,144,689 |
| ||
Net change in unrealized appreciation/depreciation of investments |
| (41,328,349 | ) | (40,999,806 | ) | ||
Net realized and unrealized loss on investments |
| (38,983,974 | ) | (16,855,117 | ) | ||
|
|
|
|
|
| ||
NET DECREASE IN NET ASSETS RESULTING FROM OPERATIONS |
| $ | (37,472,022 | ) | $ | (11,597,561 | ) |
* The Fund’s fiscal year-end changed from October 31 to December 31, effective December 31, 2007.
See accompanying notes to financial statements.
7
SPIRIT OF AMERICA REAL ESTATE INCOME AND GROWTH FUND
STATEMENTS OF CHANGES IN NET ASSETS
|
| For the Two-Month Period |
| For the Year |
| For the Year |
| |||
OPERATIONS |
|
|
|
|
|
|
| |||
Net investment income |
| $ | 1,511,952 |
| $ | 5,257,556 |
| $ | 2,924,256 |
|
Net realized gain from investment transactions and REITs |
| 2,344,375 |
| 24,144,689 |
| 11,052,522 |
| |||
Net change in unrealized appreciation/depreciation of investments |
| (41,328,349 | ) | (40,999,806 | ) | 35,581,143 |
| |||
Net increase (decrease) in net assets |
| (37,472,022 | ) | (11,597,561 | ) | 49,557,921 |
| |||
|
|
|
|
|
|
|
| |||
DISTRIBUTIONS TO SHAREHOLDERS |
|
|
|
|
|
|
| |||
Distributions from net investment income: |
|
|
|
|
|
|
| |||
Class A |
| (1,476,256 | ) | (5,111,756 | ) | (3,166,795 | ) | |||
Class B |
| (35,696 | ) | (145,800 | ) | (103,283 | ) | |||
Total distributions from net investment income |
| (1,511,952 | ) | (5,257,556 | ) | (3,270,078 | ) | |||
Distributions from realized gains: |
|
|
|
|
|
|
| |||
Class A |
| (16,747,820 | ) | (13,485,130 | ) | (5,796,341 | ) | |||
Class B |
| (587,233 | ) | (607,224 | ) | (317,838 | ) | |||
Total distributions from realized gains |
| (17,335,053 | ) | (14,092,354 | ) | (6,114,179 | ) | |||
Return of capital: |
|
|
|
|
|
|
| |||
Class A |
| (375,899 | ) | — |
| — |
| |||
Class B |
| (13,180 | ) | — |
| — |
| |||
Total distributions from return of capital to shareholders |
| (389,079 | ) | — |
| — |
| |||
Total distributions to shareholders |
| (19,236,084 | ) | (19,349,910 | ) | (9,384,257 | ) | |||
|
|
|
|
|
|
|
| |||
CAPITAL SHARE TRANSACTIONS (Dollar Activity) |
|
|
|
|
|
|
| |||
Shares sold: |
|
|
|
|
|
|
| |||
Class A |
| 7,390,446 |
| 69,674,987 |
| 43,058,314 |
| |||
Class B |
| 81,539 |
| 1,138,084 |
| 803,234 |
| |||
Shares issued from reinvestment of distributions: |
|
|
|
|
|
|
| |||
Class A |
| 15,569,965 |
| 15,183,168 |
| 7,036,297 |
| |||
Class B |
| 529,165 |
| 593,028 |
| 334,553 |
| |||
Shares redeemed: |
|
|
|
|
|
|
| |||
Class A |
| (6,317,655 | ) | (39,128,325 | ) | (43,366,629 | ) | |||
Class B |
| (472,755 | ) | (3,208,731 | ) | (2,527,678 | ) | |||
Increase in net assets derived from capital share transactions (a) |
| 16,780,705 |
| 44,252,211 |
| 5,338,091 |
| |||
Total increase (decrease) in net assets |
| (39,927,401 | ) | 13,304,740 |
| 45,511,755 |
| |||
|
|
|
|
|
|
|
| |||
NET ASSETS |
|
|
|
|
|
|
| |||
Beginning of period |
| 263,164,617 |
| 249,859,877 |
| 204,348,122 |
| |||
End of period |
| $ | 223,237,216 |
| $ | 263,164,617 |
| $ | 249,859,877 |
|
(a)Transactions in capital stock were: |
|
|
|
|
|
|
|
Shares sold: |
|
|
|
|
|
|
|
Class A |
| 574,293 |
| 4,454,157 |
| 2,952,168 |
|
Class B |
| 5,996 |
| 69,628 |
| 53,396 |
|
Shares issued from reinvestment of distributions: |
|
|
|
|
|
|
|
Class A |
| 1,330,766 |
| 988,434 |
| 491,563 |
|
Class B |
| 44,356 |
| 37,796 |
| 23,061 |
|
Shares redeemed: |
|
|
|
|
|
|
|
Class A |
| (439,434 | ) | (2,502,325 | ) | (3,105,141 | ) |
Class B |
| (34,080 | ) | (203,902 | ) | (180,627 | ) |
Increase in shares outstanding |
| 1,481,897 |
| 2,843,788 |
| 234,420 |
|
* The Fund’s fiscal year-end changed from October 31 to December 31, effective December 31, 2007.
See accompanying notes to financial statements.
8
SPIRIT OF AMERICA REAL ESTATE INCOME AND GROWTH FUND
FINANCIAL HIGHLIGHTS
The table below sets forth financial data for one share of beneficial interest outstanding throughout the periods presented.
|
| Class A |
| Class A |
| Class A |
| |||
Net Asset Value, Beginning of Period |
| $ | 14.42 |
| $ | 16.22 |
| $ | 13.47 |
|
|
|
|
|
|
|
|
| |||
Income from Investment Operations: |
|
|
|
|
|
|
| |||
Net investment income |
| 0.08 |
| 0.32 |
| 0.23 |
| |||
Net realized and unrealized gain (loss) on investments |
| (2.14 | ) | (0.94 | ) | 3.16 |
| |||
Total from investment operations |
| (2.06 | ) | (0.62 | ) | 3.39 |
| |||
|
|
|
|
|
|
|
| |||
Less Distributions: |
|
|
|
|
|
|
| |||
Distributions from net investment income |
| (0.08 | ) | (0.32 | ) | (0.23 | ) | |||
Distributions from capital gains |
| (0.95 | ) | (0.86 | ) | (0.41 | ) | |||
Distributions from return of capital |
| (0.02 | ) | — |
| — |
| |||
Total distributions |
| (1.05 | ) | (1.18 | ) | (0.64 | ) | |||
|
|
|
|
|
|
|
| |||
Net Asset Value, End of Period |
| $ | 11.31 |
| $ | 14.42 |
| $ | 16.22 |
|
|
|
|
|
|
|
|
| |||
Total Return(1) |
| (14.53 | )%(2) | (4.09 | )% | 25.86 | % | |||
|
|
|
|
|
|
|
| |||
Ratios/Supplemental Data |
|
|
|
|
|
|
| |||
Net assets, end of period (000) |
| $ | 215,592 |
| $ | 253,674 |
| $ | 237,612 |
|
Ratio of expenses to average net assets: |
|
|
|
|
|
|
| |||
Before expense reimbursement or recapture |
| 1.75 | %(3) | 1.68 | % | 1.71 | % | |||
After expense reimbursement or recapture |
| 1.75 | %(3) | 1.68 | % | 1.71 | % | |||
Ratio of net investment income to average net assets: |
|
|
|
|
|
|
| |||
Before expense reimbursement or recapture |
| 3.82 | %(3) | 2.04 | % | 1.40 | % | |||
After expense reimbursement or recapture |
| 3.82 | %(3) | 2.04 | % | 1.40 | % | |||
Portfolio turnover |
| 0.42 | %(2) | 4.20 | % | 3.10 | % | |||
(1) | Calculation does not reflect sales load. |
(2) | Calculation is not annualized. |
(3) | Calculation is annualized. |
* | The Fund’s fiscal year-end changed from October 31 to December 31, effective December 31, 2007. |
The table below sets forth financial data for one share of beneficial interest outstanding throughout the periods presented.
|
| Class B |
| Class B |
| Class B |
| |||
Net Asset Value, Beginning of Period |
| $ | 14.68 |
| $ | 16.49 |
| $ | 13.69 |
|
|
|
|
|
|
|
|
| |||
Income from Investment Operations: |
|
|
|
|
|
|
| |||
Net investment income |
| 0.06 |
| 0.21 |
| 0.13 |
| |||
Net realized and unrealized gain (loss) on investments |
| (2.17 | ) | (0.95 | ) | 3.21 |
| |||
Total from investment operations |
| (2.11 | ) | (0.74 | ) | 3.34 |
| |||
|
|
|
|
|
|
|
| |||
Less Distributions: |
|
|
|
|
|
|
| |||
Distributions from net investment income |
| (0.06 | ) | (0.21 | ) | (0.13 | ) | |||
Distributions from capital gains |
| (0.95 | ) | (0.86 | ) | (0.41 | ) | |||
Distributions from return of capital |
| (0.02 | ) | — |
| — |
| |||
Total distributions |
| (1.03 | ) | (1.07 | ) | (0.54 | ) | |||
|
|
|
|
|
|
|
| |||
Net Asset Value, End of Period |
| $ | 11.54 |
| $ | 14.68 |
| $ | 16.49 |
|
|
|
|
|
|
|
|
| |||
Total Return(1) |
| (14.64 | )%(2) | (4.78 | )% | 25.02 | % | |||
|
|
|
|
|
|
|
| |||
Ratios/Supplemental Data |
|
|
|
|
|
|
| |||
Net assets, end of period (000) |
| $ | 7,645 |
| $ | 9,491 |
| $ | 12,248 |
|
Ratio of expenses to average net assets: |
|
|
|
|
|
|
| |||
Before expense reimbursement or recapture |
| 2.45 | %(3) | 2.38 | % | 2.41 | % | |||
After expense reimbursement or recapture |
| 2.45 | %(3) | 2.38 | % | 2.41 | % | |||
Ratio of net investment income to average net assets: |
|
|
|
|
|
|
| |||
Before expense reimbursement or recapture |
| 3.12 | %(3) | 1.34 | % | 0.70 | % | |||
After expense reimbursement or recapture |
| 3.12 | %(3) | 1.34 | % | 0.70 | % | |||
Portfolio turnover |
| 0.42 | %(2) | 4.20 | % | 3.10 | % | |||
(1) | Calculation does not reflect CDSC charges. |
(2) | Calculation is not annualized. |
(3) | Calculation is annualized. |
* | The Fund’s fiscal year-end changed from October 31 to December 31, effective December 31, 2007. |
See accompanying notes to financial statements.
9
The table below sets forth financial data for one share of beneficial interest outstanding throughout the periods presented.
|
| Class A |
| Class A |
| Class A |
| |||
Net Asset Value, Beginning of Period |
| $ | 12.90 |
| $ | 10.93 |
| $ | 8.96 |
|
|
|
|
|
|
|
|
| |||
Income from Investment Operations: |
|
|
|
|
|
|
| |||
Net investment income |
| 0.22 |
| 0.20 |
| 0.30 |
| |||
Net realized and unrealized gain on investments |
| 1.00 |
| 2.37 |
| 2.30 |
| |||
Total from investment operations |
| 1.22 |
| 2.57 |
| 2.60 |
| |||
|
|
|
|
|
|
|
| |||
Less Distributions: |
|
|
|
|
|
|
| |||
Distributions from net investment income |
| (0.22 | ) | (0.20 | ) | (0.30 | ) | |||
Distributions from capital gains |
| (0.35 | ) | (0.27 | ) | (0.09 | ) | |||
Distributions from return of capital |
| (0.08 | ) | (0.13 | ) | (0.24 | ) | |||
Total distributions |
| (0.65 | ) | (0.60 | ) | (0.63 | ) | |||
|
|
|
|
|
|
|
| |||
Net Asset Value, End of Period |
| $ | 13.47 |
| $ | 12.90 |
| $ | 10.93 |
|
|
|
|
|
|
|
|
| |||
Total Return(1) |
| 9.59 | % | 24.02 | % | 30.07 | % | |||
|
|
|
|
|
|
|
| |||
Ratios/Supplemental Data |
|
|
|
|
|
|
| |||
Net assets, end of period (000) |
| $ | 192,751 |
| $ | 178,104 |
| $ | 137,410 |
|
Ratio of expenses to average net assets: |
|
|
|
|
|
|
| |||
Before expense reimbursement or recapture |
| 1.71 | % | 1.77 | % | 1.80 | % | |||
After expense reimbursement or recapture |
| 1.71 | % | 1.83 | % | 1.97 | % | |||
Ratio of net investment income to average net assets: |
|
|
|
|
|
|
| |||
Before expense reimbursement or recapture |
| 1.67 | % | 1.75 | % | 3.18 | % | |||
After expense reimbursement or recapture |
| 1.67 | % | 1.69 | % | 3.01 | % | |||
Portfolio turnover |
| 1.02 | % | 4.17 | % | 1.52 | % | |||
(1) Calculation does not reflect sales load.
The table below sets forth financial data for one share of beneficial interest outstanding throughout the periods presented.
|
| Class B |
| Class B |
| Class B |
| |||
Net Asset Value, Beginning of Period |
| $ | 13.11 |
| $ | 11.11 |
| $ | 9.11 |
|
|
|
|
|
|
|
|
| |||
Income from Investment Operations: |
|
|
|
|
|
|
| |||
Net investment income |
| 0.15 |
| 0.12 |
| 0.26 |
| |||
Net realized and unrealized gain on investments |
| 1.01 |
| 2.40 |
| 2.30 |
| |||
Total from investment operations |
| 1.16 |
| 2.52 |
| 2.56 |
| |||
|
|
|
|
|
|
|
| |||
Less Distributions: |
|
|
|
|
|
|
| |||
Distributions from net investment income |
| (0.15 | ) | (0.12 | ) | (0.26 | ) | |||
Distributions from capital gains |
| (0.35 | ) | (0.27 | ) | (0.09 | ) | |||
Distributions from return of capital |
| (0.08 | ) | (0.13 | ) | (0.21 | ) | |||
Total distributions |
| (0.58 | ) | (0.52 | ) | (0.56 | ) | |||
|
|
|
|
|
|
|
| |||
Net Asset Value, End of Period |
| $ | 13.69 |
| $ | 13.11 |
| $ | 11.11 |
|
|
|
|
|
|
|
|
| |||
Total Return(1) |
| 8.83 | % | 23.13 | % | 28.43 | % | |||
|
|
|
|
|
|
|
| |||
Ratios/Supplemental Data |
|
|
|
|
|
|
| |||
Net assets, end of period (000) |
| $ | 11,597 |
| $ | 12,592 |
| $ | 11,983 |
|
Ratio of expenses to average net assets: |
|
|
|
|
|
|
| |||
Before expense reimbursement or recapture |
| 2.41 | % | 2.47 | % | 2.50 | % | |||
After expense reimbursement or recapture |
| 2.41 | % | 2.53 | % | 2.67 | % | |||
Ratio of net investment income to average net assets: |
|
|
|
|
|
|
| |||
Before expense reimbursement or recapture |
| 0.97 | % | 1.05 | % | 2.48 | % | |||
After expense reimbursement or recapture |
| 0.97 | % | 0.99 | % | 2.31 | % | |||
Portfolio turnover |
| 1.02 | % | 4.17 | % | 1.52 | % | |||
(1) Calculation does not reflect CDSC charges.
See accompanying notes to financial statements.
10
SPIRIT OF AMERICA REAL ESTATE INCOME AND GROWTH FUND
NOTES TO FINANCIAL STATEMENTS
DECEMBER 31, 2007
Note 1 - Significant Accounting Policies
Spirit of America Real Estate Income and Growth Fund (the “Fund”), a series of the Spirit of America Investment Fund, Inc. (the “Company”), is an open-end diversified mutual fund registered under the Investment Company Act of 1940, as amended (the “1940 Act”). The Company was incorporated under the laws of Maryland on May 15, 1997. The Fund commenced operations on January 9, 1998.
You will note with this report that the Fund has changed its reporting year to coincide with calendar quarter and year-ends, from our previous fiscal year ended October 31. While this report may physically resemble one that you received just a few months ago, note that it reports on both the two-month period and the full year that ended on December 31, 2007. We recognize that a calendar year-end may provide our shareholders with more consistency with their other holdings as well as ease in comparing performance against other investments.
The Fund seeks current income and growth of capital by investing in equity real estate investment trusts (“REITs”) and the equity securities of real estate industry companies.
The Fund offers two classes of shares (Class A Shares and Class B Shares). Each class of shares has equal rights as to earnings and assets except that each class bears different distribution expenses. Each class of shares has exclusive voting rights with respect to matters that affect just that class. Income, expenses (other than expenses attributable to a specific class), and realized and unrealized gains and losses on investments are allocated to each class of shares based on its relative net assets.
The following is a summary of significant accounting policies consistently followed by the Fund in the preparation of its financial statements. The policies are in conformity with accounting principles generally accepted in the United States of America for investment companies.
A. Security Valuation: The offering price and net asset value per share of each class of the Fund are calculated as of the close of regular trading on the NYSE, currently 4:00 p.m., Eastern Time. The Fund’s securities are valued at the official close or the last reported sales price on the principal exchange on which the security trades, or if no sales price is reported, the mean of the latest bid and asked prices is used. Securities traded over-the-counter are priced at the mean of the latest bid and asked prices. Short-term investments having maturities of 60 days or less are valued at amortized cost, which the Board of Directors (the “Board”) believes represents fair value. Fund securities for which market quotations are not readily available are valued at fair value as determined in good faith under procedures established by and under the supervision of the Board. There were no securities fair valued during the period ended December 31, 2007.
In September 2006, the Financial Accounting Standards Board (“FASB”) issued Statement on Financial Accounting Standards (“SFAS”) No. 157, “Fair Value Measurements.” This standard establishes a single authoritative definition of fair value, sets out a framework for measuring fair value and requires additional disclosures about fair value measurements. SFAS No. 157 applies to fair value measurements already required or permitted by existing standards. SFAS No. 157 is effective for financial statements issued for fiscal years beginning after November 15, 2007 and interim periods within those fiscal years. The changes to current generally accepted accounting principles from the application of SFAS No. 157 relate to the definition of fair value, the methods used to measure fair value, and the expanded disclosures about fair value measurements. As of December 31, 2007, the Fund does not believe the adoption of SFAS No. 157 will impact the financial statement amounts, however, additional disclosures may be required about the inputs used to develop the measurements and the effect of certain of the measurements on changes in net assets for the period.
B. Investment Income and Securities Transactions: Security transactions are accounted for on the date the securities are purchased or sold (trade date). Cost is determined and gains and losses are based on the identified cost basis for both financial statement and federal income tax purposes. Dividend income and distributions to shareholders are reported on the ex-dividend date. Interest income and expenses are accrued daily.
C. Federal Income Taxes: The Fund intends to comply with all requirements of the Internal Revenue Code applicable to regulated investment companies and to distribute substantially all of its taxable income to its shareholders. Therefore, no federal income tax provision is required.
D. Net Asset Value Per Share: The methodology and procedures for determining net asset value are identical for each class of shares, but due to the specific distribution expenses and other costs allocable to each class of shares, the net asset value of each class of shares will vary. Class A Shares are purchased at the offering price per share (which includes a sales load), while Class B Shares are purchased at the net asset value per share.
E. Use of Estimates: In preparing financial statements in conformity with accounting principles generally accepted in the United States of America, management makes estimates and assumptions that affect the reported amounts of assets and liabilities at the date of the financial statements, as well as the reported amounts of revenues and expenses during the reporting period. Actual results could differ from those estimates.
F. Distributions to Shareholders: The Fund intends to distribute substantially all of its net investment income and capital gains to shareholders each year. Normally, income dividends will be paid quarterly. All such distributions are taxable to the shareholders whether received in cash or reinvested in shares. The Fund has made certain investments in REITs which pay distributions to their shareholders based upon available funds from operations. Each REIT reports annually the tax character of its distributions. It is quite common for these distributions to exceed the REIT’s taxable earnings and profits resulting in the excess portion of such distributions being designated as a return of capital or long-term capital gain. The Fund intends to include the gross distributions from such REITs in its distributions to its shareholders; accordingly, a portion of the distributions paid to the Fund and subsequently distributed to shareholders may be characterized as a return of capital or long-term capital gain.
11
Note 2 - Purchases and Sales of Securities
Purchases and proceeds from the sales of securities for the period ended December 31, 2007, excluding short-term investments, were $5,890,358 and $997,366, respectively.
Note 3- Investment Management Fee and Other Transactions with Affiliates
Spirit of America Management Corp. (the “Adviser”) has been retained to act as the Company’s investment adviser pursuant to an Investment Advisory Agreement (the “Advisory Agreement”). The Adviser was incorporated in 1997 and is a registered investment adviser under the Investment Advisers Act of 1940, as amended. Under the Advisory Agreement, the Fund pays the Adviser a monthly fee of 1/12 of 0.97% of the Fund’s average daily net assets. Investment advisory fees for the period ended December 31, 2007 and for the year ended October 31, 2007 were $385,043 and $2,535,519, respectively.
The Adviser has contractually agreed to waive advisory fees and/or reimburse expenses so that the total operating expenses for Class A Shares and Class B Shares will not exceed 1.97%, and 2.67%, respectively, of the average daily net assets of each class through February 25, 2009. For the period ended December 31, 2007 and for the year ended October 31, 2007, there were no advisory fees waived.
Any amounts waived or reimbursed by the Adviser are subject to reimbursement by the Fund within the following three years, provided the Fund is able to make such reimbursement and remain in compliance with the expense limitations as stated above.
The Fund has adopted distribution plans for Class A Shares and Class B Shares pursuant to Rule 12b-1 (each a “Plan”). Each Plan permits the Fund to pay SSH Securities, Inc. (the “Distributor”), a monthly fee of 1/12 of 0.30% and 1/12 of 1.00% from the average daily net assets of Class A Shares and Class B Shares, respectively, for the Distributor’s services and expenses in distributing shares of each class and providing personal services and/or maintaining shareholder accounts. For the period ended December 31, 2007 and for the year ended October 31, 2007, fees paid to the Distributor under the Plan were $114,872 and $749,972 for Class A Shares and $14,044 and $114,030 for Class B Shares, respectively.
The Fund’s Class A Shares are subject to an initial sales charge imposed at the time of purchase, in accordance with the Fund’s current prospectus. For the period ended December 31, 2007 and for the year ended October 31, 2007, sales charges on Class A Shares paid to the Distributor were $413,313 and $3,689,263, respectively. A contingent deferred sales charge (“CDSC”) of 1.00% may be imposed on redemptions of $1 million or more made within one year of purchase on Class A Shares. Certain redemptions of the Fund’s Class B Shares made within seven years of purchase are subject to a CDSC, in accordance with the Fund’s current prospectus. For the period ended December 31, 2007 and for the year ended October 31, 2007, CDSC fees on Class B Shares paid to the Distributor were $8,415 and $37,487, respectively.
Certain Officers and Directors of the Company are “affiliated persons”, as that term is defined in the 1940 Act, of the Adviser or the Distributor. Until December 12, 2007, each Director of the Company who is not an affiliated person of the Adviser or Distributor received a quarterly retainer of $1,000, a $500 meeting fee plus reimbursement for certain travel and other out-of-pocket expenses incurred in connection with attending Board meetings. Effective December 12, 2007, each Director of the Company, who is not an affiliated person of the Adviser or Distributor, receives a quarterly retainer of $1,500, $1,000 for each Board meeting attended, and $500 for each committee meeting attended plus reimbursement for certain travel and other out-of-pocket expenses incurred in connection with attending Board meetings. The Company does not compensate the Officers for the services they provide. There are no Directors’ fees paid to affiliated Directors of the Company. For the period ended December 31, 2007 and for the year ended October 31, 2007, the Fund was allocated $3,139 and $18,471, respectively, of the Chief Compliance Officer fee. In addition, David Lerner Associates, Inc., a registered broker-dealer affiliated with the Adviser and the Distributor, received no brokerage commissions for the period ended December 31, 2007 and for the year ended October 31, 2007.
Note 4 – Concentration Risk
The Fund invests primarily in real estate related securities. A fund that concentrates its investments is subject to greater risk of loss than a fund that has a more diversified portfolio of investments. Investments in real estate and real estate-related equity securities involve risks different from, and in certain cases greater than, the risks presented by equity securities generally. The main risks are those presented by direct ownership of real estate or real estate industry securities, including possible declines in the value of real estate, environmental problems and changes in interest rates. To the extent that assets underlying the Fund’s investments are concentrated geographically, by property type or in certain other respects, the Fund may be subject to these risks to a greater extent. The stocks purchased by the Fund may not appreciate in value as the Adviser anticipates. In addition, if the Fund receives rental income or income from the disposition of real property acquired as a result of a default on securities the Fund owns, its ability to retain its tax status as a regulated investment company may be adversely affected.
Note 5 – Federal Income Taxes
The tax character of distributions paid for the period ended December 31, 2007 and the fiscal years ended October 31, 2007 and October 31, 2006 were as follows:
12/31/2007 Taxable Distributions
|
| Ordinary |
| Net Long-Term |
| Total Taxable |
| Return |
| Total |
| |||||
|
| Income |
| Capital Gains |
| Distributions |
| of Capital |
| Distribution |
| |||||
Class A |
| $ | 1,476,256 |
| $ | 16,747,820 |
| $ | 18,224,076 |
| $ | 375,899 |
| $ | 18,599,975 |
|
Class B |
| 35,696 |
| 587,233 |
| 622,929 |
| 13,180 |
| 636,109 |
| |||||
|
| $ | 1,511,952 |
| $ | 17,335,053 |
| $ | 18,847,005 |
| $ | 389,079 |
| $ | 19,236,084 |
|
12
10/31/2007 Taxable Distributions
|
| Ordinary |
| Net Long-Term |
| Total Taxable |
| |||
|
| Income |
| Capital Gains |
| Distributions |
| |||
Class A |
| $ | 7,712,005 |
| $ | 10,884,881 |
| $ | 18,596,886 |
|
Class B |
| 255,712 |
| 497,312 |
| 753,024 |
| |||
|
| $ | 7,967,717 |
| $ | 11,382,193 |
| $ | 19,349,910 |
|
10/31/2006 Taxable Distributions
|
| Ordinary |
| Net Long-Term |
| Total Taxable |
| ||||||
|
| Income |
| Capital Gains |
| Distributions |
| ||||||
Class A |
| $ | 3,254,551 |
| $ | 5,708,585 |
| $ | 8,963,136 |
| |||
Class B |
| 108,095 |
| 313,026 |
| 421,121 |
| ||||||
|
| $ | 3,362,646 |
| $ | 6,021,611 |
| $ | 9,384,257 |
| |||
Distribution classifications may differ from the Statements of Changes in Net Assets as a result of the treatment of short-term capital gains as ordinary income for tax purposes.
As of December 31, 2007, the components of accumulated distributable earnings for the Fund on a tax basis were as follows:
Unrealized appreciation |
| $ | 20,231,313 |
|
Total Distributable Earnings |
| $ | 20,231,313 |
|
In July 2006, the FASB released FASB Interpretation No. 48 “Accounting for Uncertainty in Income Taxes” (“FIN 48”). FIN 48 provides guidance for how uncertain tax positions should be recognized, measured, presented and disclosed in the financial statements. FIN 48 requires the evaluation of tax positions taken or expected to be taken in the course of preparing the Fund’s tax return to determine whether the tax positions are “more-likely-than-not” of being sustained by the applicable tax authority. Tax positions not deemed to meet the more-likely-than-not threshold would be recorded as a tax benefit or expense in the current year. Adoption of FIN 48 is required no later than the last business day of the first financial statement reporting period for fiscal years beginning after December 15, 2006 and is to be applied to all open tax years (2004-2007) as of the effective date. The Fund’s federal and state income and federal excise tax returns for tax years for which the applicable statutes of limitations have not expired are subject to examination by the Internal Revenue Service and state departments of revenue. Management has implemented FIN 48 and has determined that there is no impact to the financial statements.
Tax Information
(Unaudited)
Qualified Interest Income
For the period ended December 31, 2007, 0.85% of the ordinary distributions paid (net investment income plus short-term capital gain) represent the amount of Qualifying Interest Income as created by The American Jobs Creation Act of 2004.
Qualified Dividend Income
For the period ended December 31, 2007, 0.00% of the distributions paid by the Fund from ordinary income qualifies for a reduced tax rate pursuant to The Jobs and Growth Tax Relief Reconciliation Act of 2003.
Dividends Received Deduction
For the period ended December 31, 2007, 0.00% of the ordinary income distribution qualifies for the dividends received deduction available to corporations.
Qualifying Short-Term Capital Gain
For the period ended December 31, 2007, 0.00% of the ordinary distributions paid (net investment income plus short-term capital gain) represent the amount of Qualifying Short-Term Capital Gain as created by The American Jobs Creation Act of 2004.
Long-Term Capital Gains Dividend
The Fund designates $17,335,053 as long-term capital gain distributions pursuant to section 852(b) (3) of the Internal Revenue Code for the period ended December 31, 2007.
13
SPIRIT OF AMERICA REAL ESTATE INCOME AND GROWTH FUND
RENEWAL OF INVESTMENT ADVISORY AGREEMENT
DECEMBER 31, 2007
Factors Considered by the Directors in Approving the Investment Advisory Agreement
The Investment Company Act of 1940, as amended (the “1940 Act”), requires that the continuance of the Funds’ Investment Advisory Agreement be approved annually both by the Board of Directors and also by a majority of the Directors who are not “interested persons” of the Funds under the 1940 Act (“Independent Directors”) voting separately. The continuance of the Investment Advisory Agreement was most recently considered and approved at a meeting of the Board of Directors called for that purpose and held on December 12, 2007. The Board, including the Independent Directors, determined that the terms of the Investment Advisory Agreement are fair and reasonable and approved the continuance of the Investment Advisory Agreement. The Directors relied on the assistance of counsel to the Funds and to the Independent Directors in making these determinations.
At a meeting on December 12, 2007, which was specifically held to address the continuance of the Investment Advisory Agreement, and at other meetings during the course of the year, the Board, including the Independent Directors, received materials relating to the Funds and Spirit of America Management Corp. (the “Adviser”). These materials included, among other things, the following: (i) information on the investment performance of the Funds and relevant indices over various time periods; (ii) sales and redemption data with respect to the Funds; (iii) the general investment outlook in the markets in which the Funds invest; (iv) arrangements with respect to the distribution of the Funds’ shares; (v) the procedures employed to determine the value of each Fund’s assets; (vi) the allocation of the Funds’ brokerage, the record of compliance with the Funds’ investment policies and restrictions and with the Funds’ Code of Ethics and the structure and responsibilities of the Adviser’s compliance departments; (vii) the profitability of the Funds’ investment advisory business to the Adviser taking into account both advisory fees and any other potential direct or indirect benefits; (viii) information comparing the overall fees and specifically the fees under the Investment Advisory Agreement with the fees paid by other similar mutual funds; (ix) the Form ADV of the Adviser; and (x) information comparing the performance of the Funds with the performance of other similar mutual funds.
In evaluating the Investment Advisory Agreement, the Board, including the Independent Directors, requested, reviewed and considered materials furnished by the Adviser and questioned personnel at the Adviser, including the Funds’ portfolio manager, regarding, among other things, the personnel, operations and financial condition of the Adviser. Among other information, the Board, including the Independent Directors, requested and was provided information regarding:
· The investment performance of each Fund over various time periods both by itself and in relation to relevant indices;
· The fees charged by the Adviser for investment advisory services, as well as other compensation received by the Adviser and its affiliates;
· The waivers of fees and reimbursements of expenses at times by the Adviser under the Operating Expenses Agreement;
· The investment performance, fees and total expenses of mutual funds with similar objectives and strategies managed by other investment advisers;
· The investment management staffing and the experience of the investment advisory, administrative and other personnel providing services to the Funds and the historical quality of the services provided by the Adviser; and
· The profitability to the Adviser of managing and its affiliate distributing the Funds and the methodology in allocating expenses to the management of the Funds.
Counsel to the Independent Directors (“Independent Counsel”) reviewed the legal standards applicable to the Independent Directors under the 1940 Act with respect to the annual approval of investment advisory agreements. Independent Counsel referred the Independent Directors to the “Gartenberg Memorandum” that had been distributed to the Directors prior to the meeting outlining these duties. Specifically, mentioned was that the Independent Directors should focus on the following; (i) the fee structure of the Advisory Agreement, including a comparison of the fees charged with those charged by similar funds, as well as whether any economies of scale were achieved; (ii) the nature and quality of services provided; and (iii) the overall fairness of the Advisory Agreement, including its profitability for the Adviser and DLA. Independent Counsel stated that a Section 15(c) Questionnaire, distributed prior to the Meeting, was drafted to assist the Independent Directors by highlighting the material issues to be focused on by the Adviser in its discussion of the relevant information it would be providing at this Meeting.
The following is a summary of the Board’s discussion and views regarding the factors it considered in evaluating the continuation of the Investment Advisory Agreement:
1. Nature, Extent, and Quality of Services. The Board, including the Independent Directors, considered the nature, quality and extent of advisory, administrative and shareholder services performed by the Adviser, including: regulatory filings and disclosure to shareholders, general oversight of the service providers, coordination of Fund marketing initiatives, review of Fund legal issues, assisting the Board, including the Independent Directors, in their capacity as directors and other services. The Board, including the Independent Directors, noted the increased responsibilities of the Adviser in response to an increasingly regulated industry. The Board, including the Independent Directors, concluded that the services are extensive in nature, that the Adviser delivered solid service to each Fund and that the Adviser is positioned to continue providing such quality of service in the future.
2. Investment Performance of the Funds and the Adviser. The Board, including the Independent Directors, considered short-term and long-term investment performance for the Funds over various periods of time as compared to both relevant indices and the performance of such Funds’ peer groups, and concluded that each Fund was delivering solid performance results, especially over the long-term, consistent with the investment strategies that the Funds pursue.
3. Costs of Services and Profits Realized by the Adviser.
a. | The Directors, including the Independent Directors, considered the information provided by Lipper regarding each Fund’s management fee rate and overall expense ratio relative to industry averages for the Fund’s peer group category and the advisory fees charged by the Adviser to other accounts. The Board viewed favorably the current and historic willingness of the Adviser to limit the overall expense ratios of the Funds. Recognizing that the Funds were higher than the medians in their peer group, the Board nonetheless noted that the fees were still close to the median and that several peer funds had higher fees. |
|
|
b. | Profitability and Costs of Services to the Adviser. The Board, including the Independent Directors, considered estimates of the Adviser’s profitability and costs attributable to the Funds. The Board recognized that increased fixed costs, particularly legal and audit fees in response to increasing regulations, have a greater impact on smaller fund families, such as the Spirit funds, than on larger fund complexes. Given this, the Board recognized that the Funds’ overall expenses compare unfavorably to some funds identified as peers. The Board also considered whether the amount of the Adviser’s profit is a fair profit for the management of the Funds and noted that the Adviser has devoted a large amount of its resources into the Funds over the years. The Board, including the Independent Directors, concluded that the Adviser’s profitability was at a fair and acceptable level, particularly in light of the quality of the services being provided to the Funds, and bore a reasonable relationship to the services rendered. |
4. Extent of Economies of Scale as the Funds Grow. The Board, including the Independent Directors, considered whether there have been economies of scale with respect to the management of the Funds and whether the Funds have appropriately benefited from any economies of scale. Given the size of each Fund, the Board did not believe that significant (if any) economies of scale have been achieved.
5. Whether Fee Levels Reflect Economies of Scale. The Board took into consideration that the Adviser does not currently offer breakpoints in its fees that would otherwise allow investors to benefit directly from economies of scale in the form of lower fees as fund assets grow. However, the Board, including the Independent Directors, did consider enhancements in personnel and services provided to the Funds by the Adviser, without an increase in fees.
6. Other Relevant Considerations.
a. | Personnel and Methods. The Board, including the Independent Directors, reviewed the Adviser’s Form ADV and questioned the Adviser regarding the size, education and experience of the staff of the Adviser, its fundamental research capabilities, approach to recruiting, training and retaining portfolio managers and other research and management personnel, and concluded that these enable them to provide a high level of services to the Funds. The Board also considered the history, reputation, qualifications and background of the Adviser as well as the qualifications if its personnel. |
|
|
b. | The Board, including the Independent Directors, also considered the character and amount of other direct and incidental benefits received by the Adviser and its affiliates from their association with the Funds, including the benefits received by the affiliated distributor. The Board concluded that potential “fall-out” benefits that the Adviser and its affiliates may receive, such as greater name recognition or increased ability to obtain research services (although the Board noted that the Adviser currently does not use soft dollars to obtain research services), appear to be reasonable, and may in some cases benefit the Funds. |
Conclusions. In considering the renewal of the Investment Advisory Agreement, the Board, including the Independent Directors, did not identify any factor as all-important or all-controlling and instead considered the above listed and other factors collectively in light of the Funds’ surrounding circumstances. Each Director gave the weight to each factor that he deemed appropriate in his own judgment. The Board considered the renewal of the Agreement on a Fund-by-Fund basis and determined that the renewal of the Investment Advisory Agreement was in the best interests of the shareholders of each Fund. The Board also determined that the fees charged to each Fund for the services provided were reasonable. Therefore, the Directors, including the Independent Directors, determined that continuance of the Investment Advisory Agreement was in the best interests of each Fund.
14
SPIRIT OF AMERICA REAL ESTATE INCOME AND GROWTH FUND
REPORT OF INDEPENDENT REGISTERED PUBLIC ACCOUNTING FIRM
To the Shareholders and Board of Directors
Spirit of America Investment Fund, Inc.
Syosset, New York
We have audited the accompanying statement of assets and liabilities of Spirit of America Real Estate Income and Growth Fund (“Fund”), a series of shares of beneficial interest in Spirit of America Investment Fund, Inc., including the schedule of investments as of December 31, 2007, and the related statement of operations, the statements of changes in net assets and the financial highlights for the periods indicated thereon. These financial statements and financial highlights are the responsibility of the Fund’s management. Our responsibility is to express an opinion on those financial statements and financial highlights based on our audits.
We conducted our audits in accordance with the standards of the Public Company Accounting Oversight Board (United States). Those standards require that we plan and perform the audit to obtain reasonable assurance about whether the financial statements and financial highlights are free of material misstatement. The Fund is not required to have, nor were we engaged to perform, an audit of the Fund’s internal control over financial reporting. Our audits included consideration of internal control over financial reporting as a basis for designing audit procedures that are appropriate in the circumstances, but not for the purpose of expressing an opinion on the effectiveness of its internal control over financial reporting. Accordingly, we express no such opinion. An audit also includes examining, on a test basis, evidence supporting the amounts and disclosures in the financial statements, assessing the accounting principles used and significant estimates made by management, as well as evaluating the overall financial statement presentation. Our procedures included confirmation of securities owned as of December 31, 2007, by correspondence with the custodian. We believe that our audits provide a reasonable basis for our opinion.
In our opinion, the financial statements and financial highlights referred to above present fairly, in all material respects, the financial position of Spirit of America Real Estate Income and Growth Fund as of December 31, 2007, the results of its operations, the changes in its net assets and the financial highlights for the periods indicated thereon, in conformity with accounting principles generally accepted in the United States of America.
TAIT, WELLER & BAKER LLP
Philadelphia, Pennsylvania
February 25, 2008
15
SPIRIT OF AMERICA REAL ESTATE INCOME AND GROWTH FUND
MANAGEMENT OF THE COMPANY
(UNAUDITED)
Information pertaining to the Directors and Officers of the Company is set forth below. The Statement of Additional Information includes additional information about the Directors and is available without charge, upon request, by calling 516-390-5565.
Name, Address and (Age) |
| Term of Office(1) |
| Principal Occupation(s) |
| Number of Portfolios |
| Other Directorships |
INTERESTED DIRECTORS |
|
|
|
|
|
|
|
|
David Lerner(2) (71) |
| Since 1998 |
| President and founder, David Lerner Associates, Inc., a registered broker-dealer; President, Spirit of America Management Corp., the Company’s investment adviser; and Chief Executive Officer and President of SSH Securities, Inc., the Company’s Distributor. |
| 3 |
| Director of Spirit of America Management Corp., the Company’s investment adviser; Director of SSH Securities, Inc., the Company’s Distributor; Director of David Lerner Associates, Inc., a registered broker-dealer. |
|
|
|
|
|
|
|
|
|
Daniel Lerner(2) (46) |
| Since 1998 |
| Senior Vice President, Investment Counselor with David Lerner Associates, Inc., a registered broker-dealer, since September 2000. Previously: Broker with Prudential Securities from February 2000 to July 2000; Broker with Bear Stearns from January 1999 to May 1999; Vice President of SSH Securities, Inc., the Company’s Distributor and Senior Vice President. |
| 3 |
| Director of David Lerner Associates, Inc., a registered broker-dealer. |
|
|
|
|
|
|
|
|
|
INDEPENDENT DIRECTORS |
|
|
|
|
|
|
|
|
Allen Kaufman (71) |
| Since 1998 |
| President and Chief Executive Officer of K.G.K. Agency, Inc., a property and casualty insurance agency, since 1963. |
| 3 |
| Director of K.G.K. Agency, Inc., a property and casualty insurance agency. |
|
|
|
|
|
|
|
|
|
Stanley S. Thune (71) c/o 477 Jericho Turnpike Syosset, New York 11791 Director |
| Since 1998 |
| President and Chief Executive Officer, Freight Management Systems, Inc., a third party logistics management company, since 1994; private investor. |
| 3 |
| Director of Freight Management Systems, Inc. |
|
|
|
|
|
|
|
|
|
Richard Weinberger (71) c/o 477 Jericho Turnpike Syosset, New York 11791 Director |
| Since 2005 |
| Of Counsel to Ballon Stoll Bader & Nadler, P.C., a mid-sized law firm, since January 2005; Shareholder, Ballon Stoll Bader & Nadler, P.C., January 2000 to December 2004. |
| 3 |
| None. |
|
|
|
|
|
|
|
|
|
OFFICERS |
|
|
|
|
|
|
|
|
David Lerner |
|
|
|
|
|
|
|
|
|
|
|
|
|
|
|
|
|
Alan P. Chodosh (54) Syosset, New York 11791 |
| Since 2003 |
| Executive Vice President and Chief Financial Officer of David Lerner Associates, Inc. since June 1997. |
| N/A |
| N/A |
|
|
|
|
|
|
|
|
|
Joseph Pickard (47) 477 Jericho Turnpike Syosset, New York 11791 Chief Compliance Officer
|
| Since 2007 |
| Chief Compliance Officer of Spirit of America Investment Fund, Inc. and Spirit of America Management Corp. since July 2007; Counsel to the Interested Directors of Spirit of America Investment Fund, Inc. since July 2002; General Counsel of David Lerner Associates, Inc. since July 2002. |
| N/A |
| N/A |
(1) | Each Director serves for an indefinite term, until his successor is elected. |
(2) | David Lerner is an “interested” Director, as defined in the 1940 Act, by reason of his positions with the Adviser and Distributor, and Daniel Lerner is an “interested” Director by reason of his position with the Distributor. Daniel Lerner is the son of David Lerner. |
16
Proxy Voting Information
The Company’s Statement of Additional Information (“SAI”) containing a description of the policies and procedures that the Spirit of America Real Estate Income and Growth Fund uses to determine how to vote proxies relating to portfolio securities, along with the Company’s proxy voting record relating to portfolio securities held during the 12-month period ended June 30, 2007, are available (i) without charge, upon request, by calling (516) 390-5565; and (ii) on the SEC’s website at http://www.sec.gov
Information on Form N-Q
The Company will file its complete schedule of portfolio holdings with the SEC for the first and third quarters of each fiscal year on Form N-Q within sixty days after the end of the period. The Company’s Forms N-Q will be available on the SEC’s website at http://www.sec.gov, and may be reviewed and copied at the SEC’s Public Reference Room in Washington, DC. Information on the operation of the Public Reference Room may be obtained by calling 1-800-SEC-0330.
©Copyright 2008 Spirit of America

Investment Adviser
Spirit of America Management Corp.
P.O. Box 9006
Syosset, NY 11791-9006
Distributor
SSH Securities, Inc.
P.O. Box 9006
Syosset, NY 11791-9006
Shareholder Services
PFPC Inc.
760 Moore Road
King of Prussia, PA 19406
Custodian
PFPC Trust Company
8800 Tinicum Boulevard, 4th Floor
Philadelphia, PA 19153
Independent Registered Public Accounting Firm
Tait Weller & Baker LLP
1818 Market Street, Suite 2400
Philadelphia, PA 19103
Counsel
Blank Rome LLP
405 Lexington Avenue
New York, NY 10174
For Additional Information about the Spirit of America Real Estate Income and Growth Fund, call (800) 452-4892 or
(610) 382-7819. This report is submitted for the general information of the shareholders of the Fund. It is not authorized for distribution to prospective investors in the Fund unless preceded or accompanied by an effective Prospectus which includes details regarding the Fund’s objectives, policies, expenses, and other information.
©Copyright 2008 Spirit of America | SOAR-ARD07 |

Message To Our Shareholders | 1 |
|
|
|
|
Management Discussion | 2 |
|
|
|
|
Summary of Portfolio Holdings | 2 |
|
|
|
|
Illustration of Investment | 3 |
|
|
|
|
Disclosure of Fund Expenses | 4 |
|
|
|
|
Schedule of Investments | 5-6 |
|
|
|
|
Statement of Assets and Liabilities | 7 |
|
|
|
|
Statements of Operations | 8 |
|
|
|
|
Statements of Changes in Net Assets | 9 |
|
|
|
|
Financial Highlights | 10 |
|
|
|
|
Notes to Financial Statements | 11-13 |
|
|
|
|
Renewal of Investment Advisory Agreement | 14 | |
|
| |
Report of Independent Registered Public Accounting Firm | 15 | |
|
| |
Management of the Company | 16 | |
|
| |
| ||

SPIRIT OF AMERICA LARGE CAP VALUE FUND
MESSAGE TO OUR SHAREHOLDERS
February 2008
Dear Shareholder,
We are very pleased to send you a copy of the annual report for the Spirit of America Large Cap Value Fund. In order to improve our accounting to shareholders, the Fund has elected to change its fiscal year-end to December 31 to coincide with calendar quarter and year-ends, from our previous fiscal year ended October 31. This updated annual report covers both the two-month period ended December 31, 2007 and the fiscal year ended October 31, 2007, highlighting the period from October 31, 2007 to December 31, 2007.
At Spirit of America, we conduct our research from the top down. After first identifying the larger economic trends, we then search for sectors which we believe are poised to benefit from those trends, and invest in the companies with the most solid fundamentals.
Market volatility has been causing share prices to bounce around more than usual, providing an opportunity for those managers with a watchful eye on their lists of stocks to buy. With our large cash balance, we have the advantage to deploy capital when the overall market is experiencing one of its swings, which we believe are short-term in nature. We believe that investing in sound companies at good prices will help enhance the long-term returns of the Fund, and the current market environment is providing us with this opportunity.
Although no one can be assured of future results, in addition to adding to your account, now may be an opportune time to initiate a dollar cost averaging program. This time-tested strategy allows investors to buy more shares when prices are low and less when they are higher, with the goal of achieving a lower average investment cost and higher returns over the long-term.
We look forward to your continued investment in the Fund.
Sincerely,
|
|
|
David Lerner |
| Donna J. Mackay, CFA |
President |
| Portfolio Manager |

Any investment in equity securities is subject to risk and market values may fluctuate with economic conditions, interest rates, civil unrest and other factors, which will affect its market value. As with any mutual fund, an investor’s shares, when redeemed, may be worth more or less than their original cost. Past performance is no guarantee of future results.
Prospective investors should consider the investment objective, risks and charges and expenses of the Fund carefully before investing. The maximum sales charge on share purchases is 5.25% of the offering price. The Fund’s prospectus contains this and other information about the Fund and may be obtained through your broker or by calling 1-800-452-4892. The prospectus should be read carefully before investing.
1
SPIRIT OF AMERICA LARGE CAP VALUE FUND
MANAGEMENT DISCUSSION
DECEMBER 31, 2007
Return Summary
The Spirit of America Large Cap Value Fund, SOAVX (the “Fund”), had a total return of (2.30%) for the two months ended 12/31/07, while its benchmark, the S&P 500 Index, returned (4.85%) for the same period. In addition, for the full year 12/31/06 – 12/31/07, the Fund had a total return of 8.33% versus the S&P 500 return of 5.49%. The sales load adjusted returns for the two-month period and the year are (7.43%) and 2.62% respectively.
Market Summary
2007 has been a challenging time for the market, as bad news in the credit and housing markets continues to dominate, leaving almost no investment immune to selling pressure. This crisis of confidence in the financial markets will continue until financial institutions come clean and give full disclosure of their liabilities. No one knows for certain what the ultimate impact will be from the credit crunch, and news could get worse before it gets better. Armed with these expectations, the Spirit of America Large Cap Value Fund has taken prudent measures to effectively manage the Fund’s assets, such as reducing exposure to the financial sector and maintaining a higher than average cash balance.
Fund Summary
The Fund’s ability to diversify across and within the ten main economic sectors of the market has aided in the achievement of positive returns during this volatile year. With a top-down approach and careful monitoring of the markets, the Fund attempts to avoid those areas which could be detrimental to returns. For instance, the Fund correctly anticipated the problems that developed within the financial sector and reduced its exposure far in advance of the malaise that began in midsummer. Another positive for returns has been the Fund’s underweighting in the consumer discretionary sector, which has also been under pressure all year.
The Fund continues to have an over-weight in the defensive sectors of consumer staples and health care, favoring those companies with a history of stable earnings and dividends. An increased level of investment in the technology sector has also contributed to returns, as the sector is reaping the benefits of a new product cycle. This is the first time since 2003 that the sector has outpaced the S&P 500 Index, and the Fund is positioned benefit from the potential for further growth in 2008.
Exposure to the energy sector has been a positive influence on returns throughout the year, and the Fund has slowly raised its weighting to 10% of assets. Year-to-date, this sector remains the top performer of all sectors, as it continues to benefit from strong demand in an environment of supply constraints.
The industrial sector has provided mixed returns, as the potential for a slowdown in the U.S. economy has tempered enthusiasm for investment in this area. However, given the expanding presence in international markets by diversified companies, the impact of any domestic weakness has so far been limited. The Fund invests in companies with diversified operations and large international exposure.
SUMMARY OF PORTFOLIO HOLDINGS (UNAUDITED)
DECEMBER 31, 2007
The Securities and Exchange Commission (“SEC”) has adopted a requirement that all Funds present their categories of portfolio holdings in a table, chart or graph format in their annual and semi-annual shareholder reports, whether or not a schedule of investments is utilized. The following table, which presents portfolio holdings as a percentage of total market value, is provided in compliance with such requirement.
Sector Diversification (% of market value)
Health Care |
| 20.52 | % | $ | 11,560,671 |
|
Information Technology |
| 19.58 |
| 11,028,760 |
| |
Consumer Staples |
| 16.29 |
| 9,173,849 |
| |
Energy |
| 12.21 |
| 6,879,604 |
| |
Industrials |
| 11.92 |
| 6,716,660 |
| |
Financials |
| 8.81 |
| 4,960,488 |
| |
Telecommunication Services |
| 3.88 |
| 2,184,500 |
| |
Utilities |
| 3.05 |
| 1,715,759 |
| |
Consumer Discretionary |
| 2.02 |
| 1,135,605 |
| |
Materials |
| 1.72 |
| 969,330 |
| |
Total Investments |
| 100.00 | % | $ | 56,325,226 |
|
See accompanying notes to financial statements.
2
SPIRIT OF AMERICA LARGE CAP VALUE FUND
ILLUSTRATION OF INVESTMENT
(UNAUDITED)
The graph below compares the increase in value of a $10,000 investment in the Spirit of America Large Cap Value Fund with the performance of the S&P 500 Index. The values and returns for the Spirit of America Large Cap Value Fund include reinvested distributions and the impact of the maximum sales charge of 5.25% placed on purchases. The returns shown do not reflect taxes that a shareholder would pay on Fund distributions or on the redemption of Fund shares.
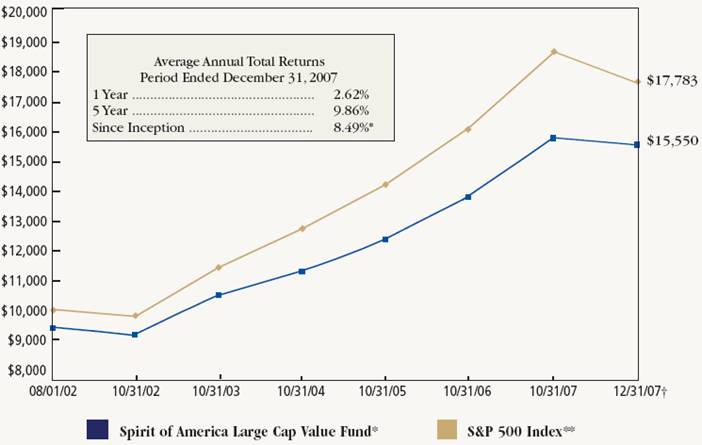
Past performance is not indicative of future results.
* | Fund commenced operations August 1, 2002. |
** | The S&P 500 Index benchmark is based on a start date of July 31, 2002. |
† | Prior to 12/31/07, the Fund had a fiscal year-end of 10/31. |
|
|
The S&P 500 Index is an unmanaged capitalization-weighted index of 500 stocks designed to measure the performance of the broad domestic economy through changes in the aggregate market value of 500 stocks representing all major industries. The performance of an index assumes no transaction costs, taxes, management fees or other expenses. A direct investment in an index is not possible. | |
3
SPIRIT OF AMERICA LARGE CAP VALUE FUND
DISCLOSURE OF FUND EXPENSES (UNAUDITED)
FOR THE TWO MONTH PERIOD NOVEMBER 1, 2007 TO DECEMBER 31, 2007
We believe it is important for you to understand the impact of fees regarding your investment. All mutual funds have operating expenses. As a shareholder of the Fund, you incur ongoing costs, which include costs for portfolio management, administrative services, and shareholder reports (like this one), among others. Operating expenses, which are deducted from the Fund’s gross income, directly reduce the investment return of the Fund. The Fund’s expenses are expressed as a percentage of its average net assets. This figure is known as the expense ratio. The following examples are intended to help you understand the ongoing fees (in dollars) of investing in your Fund and to compare these costs with those of other mutual funds. The examples are based on an investment of $1,000 made at the beginning of the period shown and held for the entire period.
|
| Beginning |
|
|
|
|
| Expenses |
| |||
|
| Account Value |
| Ending Account |
| Expense Ratio |
| Paid During |
| |||
|
| 11/01/07 |
| Value 12/31/07 |
| (1) |
| Period (2) |
| |||
Spirit of America Large Cap Value Fund |
|
|
|
|
|
|
|
|
| |||
|
|
|
|
|
|
|
|
|
| |||
Actual Fund Return |
| $ | 1,000.00 |
| $ | 977.00 |
| 1.97 | % | $ | 3.25 |
|
|
|
|
|
|
|
|
|
|
| |||
Hypothetical 5% Return |
| $ | 1,000.00 |
| $ | 1,005.06 |
| 1.97 | % | $ | 3.30 |
|
This table illustrates your Fund’s costs in two ways:
Actual Fund Return: This section helps you to estimate the actual expenses that you paid over the period. The “Ending Account Value” shown is derived from the Fund’s actual return, the third column shows the period’s annualized expense ratio, and the last column shows the dollar amount that would have been paid by an investor who started with $1,000 in the Fund at the beginning of the period. You may use the information here, together with your account value, to estimate the expenses that you paid over the period.
To do so, simply divide your account value by $1,000 (for example, an $8,600 account value divided by $1,000 = 8.6), then multiply the result by the number in the first line under the heading entitled “Expenses Paid During Period.”
Hypothetical 5% Return: This section is intended to help you compare your Fund’s costs with those of other mutual funds. It assumes that the Fund had a return of 5% before expenses during the period shown, but that the expense ratio is unchanged. In this case, because the return used is not the Fund’s actual return, the results do not apply to your investment. You can assess your Fund’s costs by comparing this hypothetical example with the hypothetical examples that appear in shareholder reports of other funds.
Please note that the expense shown in the table are meant to highlight your ongoing costs only and do not reflect any transactional costs such as sales charges (loads), or redemption fees.
(1) | Annualized, based on the Fund’s most recent two-month period expenses. |
|
|
(2) | Expenses are equal to the Fund’s annualized expense ratio multiplied by the average account value over the period, multiplied by the number of days in the period, then divided by 365. |
4
SPIRIT OF AMERICA LARGE CAP VALUE FUND
SCHEDULE OF INVESTMENTS
DECEMBER 31, 2007
|
| Shares |
| Market Value |
| |
COMMON STOCKS - 85.20% |
|
|
|
|
| |
|
|
|
|
|
| |
Consumer Discretionary - 1.72% |
|
|
|
|
| |
Best Buy Co., Inc. |
| 10,000 |
| $ | 526,500 |
|
Starwood Hotels & Resorts Worldwide, Inc. |
| 3,500 |
| 154,105 |
| |
Target Corp. |
| 9,100 |
| 455,000 |
| |
|
|
|
| 1,135,605 |
| |
|
|
|
|
|
| |
Consumer Staples - 13.88% |
|
|
|
|
| |
Altria Group, Inc. |
| 32,100 |
| 2,426,118 |
| |
Colgate-Palmolive Co. |
| 7,600 |
| 592,496 |
| |
PepsiCo, Inc. |
| 16,000 |
| 1,214,400 |
| |
Procter & Gamble Co. (The) |
| 31,147 |
| 2,286,813 |
| |
Walgreen Co. |
| 33,000 |
| 1,256,640 |
| |
Wal-Mart Stores, Inc. |
| 29,400 |
| 1,397,382 |
| |
|
|
|
| 9,173,849 |
| |
|
|
|
|
|
| |
Energy - 10.41% |
|
|
|
|
| |
Apache Corp. |
| 10,000 |
| 1,075,400 |
| |
ConocoPhillips |
| 20,000 |
| 1,766,000 |
| |
Devon Energy Corp. |
| 9,000 |
| 800,190 |
| |
Noble Corp. |
| 18,000 |
| 1,017,180 |
| |
Schlumberger, Ltd. |
| 14,100 |
| 1,387,017 |
| |
Spectra Energy Corp. |
| 12,900 |
| 333,078 |
| |
Transocean, Inc. |
| 3,498 |
| 500,739 |
| |
|
|
|
| 6,879,604 |
| |
|
|
|
|
|
| |
Financials - 7.50% |
|
|
|
|
| |
American Express Co. |
| 20,000 |
| 1,040,400 |
| |
Bank of America Corp. |
| 25,007 |
| 1,031,789 |
| |
First Industrial Realty Trust, Inc. REIT |
| 10,000 |
| 346,000 |
| |
Host Hotels & Resorts, Inc. REIT |
| 22,142 |
| 377,299 |
| |
JPMorgan Chase & Co. |
| 20,000 |
| 873,000 |
| |
Nationwide Health Properties, Inc. REIT |
| 10,000 |
| 313,700 |
| |
optionsXpress Holdings, Inc. |
| 20,000 |
| 676,400 |
| |
Wells Fargo &Co. |
| 10,000 |
| 301,900 |
| |
|
|
|
| 4,960,488 |
| |
|
|
|
|
|
| |
Health Care - 17.49% |
|
|
|
|
| |
Abbott Laboratories |
| 25,000 |
| 1,403,750 |
| |
Amgen, Inc.* |
| 10,000 |
| 464,400 |
| |
CIGNA Corp. |
| 20,000 |
| 1,074,600 |
| |
Covidien, Ltd. |
| 6,000 |
| 265,740 |
| |
Johnson & Johnson |
| 15,300 |
| 1,020,510 |
| |
Medco Health Solutions, Inc.* |
| 14,000 |
| 1,419,600 |
| |
Pfizer, Inc. |
| 17,000 |
| 386,410 |
| |
Schering-Plough Corp. |
| 32,000 |
| 852,480 |
| |
UnitedHealth Group, Inc. |
| 50,000 |
| 2,910,000 |
| |
Wyeth |
| 39,900 |
| 1,763,181 |
| |
|
|
|
| 11,560,671 |
| |
|
|
|
|
|
| |
Industrials - 10.16% |
|
|
|
|
| |
3M Co. |
| 20,000 |
| 1,686,400 |
| |
Caterpillar, Inc. |
| 23,000 |
| 1,668,880 |
| |
General Electric Co. |
| 76,000 |
| 2,817,320 |
| |
Tyco International, Ltd. |
| 6,000 |
| 237,900 |
| |
United Technologies Corp. |
| 4,000 |
| 306,160 |
| |
|
|
|
| 6,716,660 |
| |
See accompanying notes to financial statements.
5
|
| Shares |
| Market Value |
| |
Information Technology - 16.68% |
|
|
|
|
| |
Accenture Ltd., Class A |
| 40,000 |
| $ | 1,441,200 |
|
Cisco Systems, Inc.* |
| 60,000 |
| 1,624,200 |
| |
EMC Corp.* |
| 70,000 |
| 1,297,100 |
| |
Hewlett-Packard Co. |
| 30,000 |
| 1,514,400 |
| |
Microsoft Corp. |
| 58,000 |
| 2,064,800 |
| |
Motorola, Inc. |
| 37,000 |
| 593,480 |
| |
Nokia Oyj, ADR |
| 20,000 |
| 767,800 |
| |
Texas Instruments, Inc. |
| 45,000 |
| 1,503,000 |
| |
Tyco Electronics, Ltd. |
| 6,000 |
| 222,780 |
| |
|
|
|
| 11,028,760 |
| |
|
|
|
|
|
| |
Materials - 1.47% |
|
|
|
|
| |
Newmont Mining Corp. |
| 15,000 |
| 732,450 |
| |
Nucor Corp. |
| 4,000 |
| 236,880 |
| |
|
|
|
| 969,330 |
| |
Telecommunication Services - 3.30% |
|
|
|
|
| |
Verizon Communications, Inc. |
| 50,000 |
| 2,184,500 |
| |
|
|
|
|
|
| |
Utilities - 2.59% |
|
|
|
|
| |
American Electric Power Co., Inc. |
| 11,300 |
| 526,128 |
| |
Consolidated Edison, Inc. |
| 13,700 |
| 669,245 |
| |
Duke Energy Corp. |
| 25,800 |
| 520,386 |
| |
|
|
|
| 1,715,759 |
| |
|
|
|
|
|
| |
Total Investments - 85.20% |
|
|
| 56,325,226 |
| |
Cash and Other Assets Net of Liabilities - 14.80% |
|
|
| 9,786,379 |
| |
NET ASSETS - 100.00% |
|
|
| $ | 66,111,605 |
|
ADR - American Depository Receipt |
|
|
|
|
| |
REIT - Real Estate Investment Trust |
|
|
|
|
| |
* | Non-income-producing security. |
|
|
| ||
** | Cost for federal income tax purposes is $46,326,157, and net unrealized appreciation consists of: |
|
|
| ||
Gross unrealized appreciation |
|
|
| $ | 11,212,462 |
|
Gross unrealized depreciation |
|
|
| (1,213,393 | ) | |
Net unrealized appreciation |
|
|
| $ | 9,999,069 |
|
See accompanying notes to financial statements.
6
SPIRIT OF AMERICA LARGE CAP VALUE FUND
STATEMENT OF ASSETS AND LIABILITIES
DECEMBER 31, 2007
ASSETS |
|
|
| |
Investments in securities at value (cost $46,326,157) (Note 1) |
| $ | 56,325,226 |
|
Cash |
| 9,868,447 |
| |
Capital stock sold |
| 213,587 |
| |
Dividends and interest |
| 122,056 |
| |
Prepaid assets |
| 10,083 |
| |
TOTAL ASSETS |
| 66,539,399 |
| |
|
|
|
| |
LIABILITIES |
|
|
| |
Capital stock redeemed |
| 273,932 |
| |
Advisory fees |
| 50,405 |
| |
Transfer agent fees |
| 23,313 |
| |
Distribution expense (Note 3) |
| 16,826 |
| |
Director’s fees |
| 1,165 |
| |
Other accrued expenses |
| 62,153 |
| |
TOTAL LIABILITIES |
| 427,794 |
| |
|
|
|
| |
NET ASSETS |
|
|
| |
Net assets applicable to 4,626,678 outstanding, $0.001 par value (500,000,000 authorized shares) |
| $ | 66,111,605 |
|
Net asset value and redemption price per share ($66,111,605 ÷ 4,626,678 shares) |
| $ | 14.29 |
|
Maximum offering price per share ($14.29 ÷ 0.9475) |
| $ | 15.08 |
|
|
|
|
| |
SOURCE OF NET ASSETS |
|
|
| |
At December 31, 2007, net assets consisted of: |
|
|
| |
Paid-in capital |
| $ | 56,084,983 |
|
Accumulated net realized gain on investments |
| 27,553 |
| |
Net unrealized appreciation on investments |
| 9,999,069 |
| |
NET ASSETS |
| $ | 66,111,605 |
|
See accompanying notes to financial statements.
7
SPIRIT OF AMERICA LARGE CAP VALUE FUND
STATEMENTS OF OPERATIONS
|
| For the Two-Month Period |
| For the Year |
| ||
INVESTMENT INCOME |
|
|
|
|
| ||
Dividends |
| $ | 176,472 |
| $ | 978,091 |
|
Interest |
| 60,790 |
| 241,624 |
| ||
TOTAL INVESTMENT INCOME |
| 237,262 |
| 1,219,715 |
| ||
|
|
|
|
|
| ||
EXPENSES |
|
|
|
|
| ||
Investment Advisory fees (Note 3) |
| 105,695 |
| 538,148 |
| ||
Distribution fees (Note 3) |
| 32,689 |
| 166,437 |
| ||
Transfer Agent fees |
| 22,003 |
| 136,915 |
| ||
Administration fees |
| 15,063 |
| 80,272 |
| ||
Accounting fees |
| 9,474 |
| 53,345 |
| ||
Printing expense |
| 3,577 |
| 25,821 |
| ||
Insurance expense |
| 2,485 |
| 12,522 |
| ||
Custodian fees |
| 2,321 |
| 13,001 |
| ||
Auditing fees |
| 13,500 |
| 13,914 |
| ||
Legal fees |
| 1,823 |
| 8,878 |
| ||
Directors’ fees |
| 1,165 |
| 5,875 |
| ||
Registration fees |
| 1,072 |
| 6,495 |
| ||
Chief Compliance Officer salary |
| 861 |
| 3,529 |
| ||
Other expenses |
| 509 |
| 4,508 |
| ||
TOTAL EXPENSES |
| 212,237 |
| 1,069,660 |
| ||
Recovery of past waived fees (Note 3) |
| 2,423 |
| 23,281 |
| ||
NET EXPENSES |
| 214,660 |
| 1,092,941 |
| ||
NET INVESTMENT INCOME |
| 22,602 |
| 126,774 |
| ||
|
|
|
|
|
| ||
REALIZED AND UNREALIZED GAIN (LOSS) ON INVESTMENTS |
|
|
|
|
| ||
Net realized gain from investment transactions |
| 62,742 |
| 3,841,273 |
| ||
Net change in unrealized appreciation/depreciation of investments |
| (1,634,387 | ) | 3,043,126 |
| ||
Net realized and unrealized gain (loss) on investments |
| (1,571,645 | ) | 6,884,399 |
| ||
|
|
|
|
|
| ||
NET INCREASE (DECREASE) IN NET ASSETS RESULTING FROM OPERATIONS |
| $ | (1,549,043 | ) | $ | 7,011,173 |
|
* The Fund’s fiscal year-end changed from October 31 to December 31, effective December 31, 2007.
See accompanying notes to financial statements.
8
SPIRIT OF AMERICA LARGE CAP VALUE FUND
STATEMENTS OF CHANGES IN NET ASSETS
|
| For the Two-Month Period |
| For the Year |
| For the Year |
| |||
OPERATIONS |
|
|
|
|
|
|
| |||
Net investment income |
| $ | 22,602 |
| $ | 126,774 |
| $ | 106,574 |
|
Net realized gain from investment transactions |
| 62,742 |
| 3,841,273 |
| 1,853,845 |
| |||
Net change in unrealized appreciation/depreciation of investments |
| (1,634,387 | ) | 3,043,126 |
| 3,264,555 |
| |||
Net increase (decrease) in net assets |
| (1,549,043 | ) | 7,011,173 |
| 5,224,974 |
| |||
|
|
|
|
|
|
|
| |||
DISTRIBUTIONS TO SHAREHOLDERS |
|
|
|
|
|
|
| |||
Distributions from net investment income |
| (22,602 | ) | (126,954 | ) | (106,574 | ) | |||
Distributions from realized gains |
| (3,861,978 | ) | (1,857,162 | ) | (386,302 | ) | |||
Total distributions to shareholders |
| (3,884,580 | ) | (1,984,116 | ) | (492,876 | ) | |||
|
|
|
|
|
|
|
| |||
CAPITAL SHARE TRANSACTIONS (Dollar Activity) |
|
|
|
|
|
|
| |||
Shares sold |
| 2,737,326 |
| 20,490,635 |
| 11,344,469 |
| |||
Shares issued from reinvestment of distributions |
| 3,708,855 |
| 1,890,589 |
| 468,423 |
| |||
Shares redeemed |
| (1,387,477 | ) | (7,110,966 | ) | (10,703,075 | ) | |||
Increase in net assets derived from capital share transactions (a) |
| 5,058,704 |
| 15,270,258 |
| 1,109,817 |
| |||
Total increase (decrease) in net assets |
| (374,919 | ) | 20,297,315 |
| 5,841,915 |
| |||
|
|
|
|
|
|
|
| |||
NET ASSETS |
|
|
|
|
|
|
| |||
Beginning of period |
| 66,486,524 |
| 46,189,209 |
| 40,347,294 |
| |||
End of period |
| $ | 66,111,605 |
| $ | 66,486,524 |
| $ | 46,189,209 |
|
(a) Transactions in capital stock were: |
|
|
|
|
|
|
|
Shares sold |
| 181,252 |
| 1,392,101 |
| 842,925 |
|
Shares issued from reinvestment of distributions |
| 255,080 |
| 133,923 |
| 35,788 |
|
Shares redeemed |
| (93,321 | ) | (487,427 | ) | (813,612 | ) |
Increase in shares outstanding |
| 343,011 |
| 1,038,597 |
| 65,101 |
|
* The Fund’s fiscal year-end changed from October 31 to December 31, effective December 31, 2007.
See accompanying notes to financial statements.
9
SPIRIT OF AMERICA LARGE CAP VALUE FUND
FINANCIAL HIGHLIGHTS
The table below sets forth financial data for one share of beneficial interest outstanding throughout the periods presented.
|
| For the Two-Month |
| For the |
| For the |
| For the |
| For the |
| For the |
| ||||||
|
| Period Ended |
| Year Ended |
| Year Ended |
| Year Ended |
| Year Ended |
| Year Ended |
| ||||||
|
| December 31, 2007* |
| October 31, 2007 |
| October 31, 2006 |
| October 31, 2005 |
| October 31, 2004 |
| October 31, 2003 |
| ||||||
Net Asset Value, Beginning of Period |
| $ | 15.52 |
| $ | 14.23 |
| $ | 12.69 |
| $ | 11.74 |
| $ | 11.09 |
| $ | 9.63 |
|
|
|
|
|
|
|
|
|
|
|
|
|
|
| ||||||
Income from Investment Operations: |
|
|
|
|
|
|
|
|
|
|
|
|
| ||||||
Net investment income |
| 0.01 |
| 0.03 |
| 0.04 |
| 0.09 |
| 0.04 |
| 0.07 |
| ||||||
Net realized and unrealized gain (loss) on investments |
| (0.35 | ) | 1.84 |
| 1.67 |
| 0.98 |
| 0.68 |
| 1.51 |
| ||||||
Total from investment operations |
| (0.34 | ) | 1.87 |
| 1.71 |
| 1.07 |
| 0.72 |
| 1.58 |
| ||||||
|
|
|
|
|
|
|
|
|
|
|
|
|
| ||||||
Less Distributions: |
|
|
|
|
|
|
|
|
|
|
|
|
| ||||||
Distributions from net investment income |
| (0.01 | ) | (0.03 | ) | (0.04 | ) | (0.09 | ) | (0.04 | ) | (0.08 | ) | ||||||
Distributions from capital gains |
| (0.88 | ) | (0.55 | ) | (0.13 | ) | (0.03 | ) | (0.01 | ) | — |
| ||||||
Distributions from return of capital |
| — |
| — |
| — |
| — |
| (0.02 | ) | (0.04 | ) | ||||||
Total distributions |
| (0.89 | ) | (0.58 | ) | (0.17 | ) | (0.12 | ) | (0.07 | ) | (0.12 | ) | ||||||
|
|
|
|
|
|
|
|
|
|
|
|
|
| ||||||
Net Asset Value, End of Period |
| $ | 14.29 |
| $ | 15.52 |
| $ | 14.23 |
| $ | 12.69 |
| $ | 11.74 |
| $ | 11.09 |
|
|
|
|
|
|
|
|
|
|
|
|
|
|
| ||||||
Total Return(1) |
| (2.30 | )%(2) | 13.56 | % | 13.52 | % | 9.07 | % | 6.48 | % | 16.47 | % | ||||||
|
|
|
|
|
|
|
|
|
|
|
|
|
| ||||||
Ratios/Supplemental Data |
|
|
|
|
|
|
|
|
|
|
|
|
| ||||||
Net assets, end of period (000) |
| $ | 66,112 |
| $ | 66,487 |
| $ | 46,189 |
| $ | 40,347 |
| $ | 35,826 |
| $ | 17,279 |
|
Ratio of expenses to average net assets: |
|
|
|
|
|
|
|
|
|
|
|
|
| ||||||
Before expense reimbursement or recapture |
| 1.95 | %(3) | 1.93 | % | 2.07 | % | 1.96 | % | 2.03 | % | 2.65 | % | ||||||
After expense reimbursement or recapture |
| 1.97 | %(3) | 1.97 | % | 1.97 | % | 1.97 | % | 1.97 | % | 1.97 | % | ||||||
Ratio of net investment income to average net assets: |
|
|
|
|
|
|
|
|
|
|
|
|
| ||||||
Before expense reimbursement or recapture |
| 0.23 | %(3) | 0.27 | % | 0.16 | % | 0.71 | % | 0.35 | % | 0.12 | % | ||||||
After expense reimbursement or recapture |
| 0.21 | %(3) | 0.23 | % | 0.26 | % | 0.70 | % | 0.41 | % | 0.80 | % | ||||||
Portfolio turnover |
| — |
| 22.14 | % | 14.37 | % | 15.37 | % | — |
| — |
| ||||||
(1) | Calculation does not reflect sales load. |
(2) | Calculation is not annualized. |
(3) | Calculation is annualized. |
* | The Fund’s fiscal year-end changed from October 31 to December 31, effective December 31, 2007. |
See accompanying notes to financial statements.
10
SPIRIT OF AMERICA LARGE CAP VALUE FUND
NOTES TO FINANCIAL STATEMENTS
DECEMBERR 31, 2007
Note 1 - Significant Accounting Policies
Spirit of America Large Cap Value Fund (the “Fund”), a series of Spirit of America Investment Fund, Inc. (the “Company”), is an open-end diversified mutual fund registered under the Investment Company Act of 1940, as amended (the “1940 Act”). The Company was incorporated under the laws of Maryland on May 15, 1997. The Fund commenced operations on August 1, 2002.The Fund seeks capital appreciation with a secondary objective of current income by investing in equity securities in the large cap value segment of the U.S. equity market. The Fund offers one class of shares.
You will note with this report that the Fund has changed its reporting year to coincide with calendar quarter and year-ends, from our previous fiscal year ended October 31. While this report may physically resemble one that you received just a few months ago, note that it reports on both the two-month period and the full year that ended on December 31, 2007. We recognize that a calendar year-end may provide our shareholders with more consistency with their other holdings as well as ease in comparing performance against other investments.
The following is a summary of significant accounting policies consistently followed by the Fund in the preparation of its financial statements. The policies are in conformity with accounting principles generally accepted in the United States of America for investment companies.
A. Security Valuation: The offering price and net asset value per share for the Fund are calculated as of the close of regular trading on the NYSE, currently 4:00 p.m., Eastern Time. The Fund’s securities are valued at the official close or the last reported sales price on the principal exchange on which the security trades, or if no sales price is reported, the mean of the latest bid and asked prices is used. Securities traded over-the-counter are priced at the mean of the latest bid and asked prices. Short-term investments having a maturity of 60 days or less are valued at amortized cost, which the Board of Directors (the “Board”) believes represents fair value. Fund securities for which market quotations are not readily available are valued at fair value as determined in good faith under procedures established by and under the supervision of the Board. There were no securities fair valued during the period ended December 31, 2007.
In September 2006, the Financial Accounting Standards Board (“FASB”) issued Statement on Financial Accounting Standards (“SFAS”) No. 157, “Fair Value Measurements.” This standard establishes a single authoritative definition of fair value, sets out a framework for measuring fair value and requires additional disclosures about fair value measurements. SFAS No. 157 applies to fair value measurements already required or permitted by existing standards. SFAS No. 157 is effective for financial statements issued for fiscal years beginning after November 15, 2007 and interim periods within those fiscal years. The changes to current generally accepted accounting principles from the application of SFAS No. 157 relate to the definition of fair value, the methods used to measure fair value, and the expanded disclosures about fair value measurements. As of December 31, 2007, the Fund does not believe the adoption of SFAS No. 157 will impact the financial statement amounts, however, additional disclosures may be required about the inputs used to develop the measurements and the effect of certain of the measurements on changes in net assets for the period.
B. Investment Income and Securities Transactions: Security transactions are accounted for on the date the securities are purchased or sold (trade date). Cost is determined and gains and losses are based on the identified cost basis for both financial statement and federal income tax purposes. Dividend income and distributions to shareholders are reported on the ex-dividend date. Interest income and expenses are accrued daily.
C. Federal Income Taxes: The Fund intends to comply with all requirements of the Internal Revenue Code applicable to regulated investment companies and to distribute substantially all of its taxable income to its shareholders. Therefore, no federal income tax provision is required.
D. Use of Estimates: In preparing financial statements in conformity with accounting principles generally accepted in the United States of America, management makes estimates and assumptions that affect the reported amounts of assets and liabilities at the date of the financial statements, as well as the reported amounts of revenues and expenses during the reporting period. Actual results could differ from those estimates.
E. Distributions to Shareholders: The Fund intends to distribute substantially all of its net investment income and capital gains to shareholders each year. Normally, income distributions will be paid quarterly. Capital gains, if any, will be distributed annually in December. All such distributions are taxable to the shareholders whether received in cash or reinvested in shares.A portion of the distributions paid to the Fund and subsequently distributed to shareholders may be characterized as a return of capital, long-term capital gain or short-term capital gain. The Fund has made certain investments in real estate investment trusts
11
(“REITs”) which pay distributions to their shareholders based upon available funds from operations. It is quite common for these distributions to exceed the REIT’s taxable earnings and profits resulting in the excess portion of such distributions being designated as a return of capital or long-term capital gain. The Fund intends to include the gross distributions from such REITs in its distributions to its shareholders; accordingly, a portion of the distributions paid to the Fund and subsequently distributed to shareholders may be re-characterized as a return of capital.
Note 2 - Purchases and Sales of Securities
Purchases and proceeds from sales of securities for the period ended December 31, 2007, excluding short-term investments, were $1,670,113 and $0, respectively.
Note 3 - Investment Management Fee and Other Transactions with Affiliates
Spirit of America Management Corp. (the “Adviser”) has been retained to act as the Company’s investment adviser pursuant to an Investment Advisory Agreement (the “Advisory Agreement”). The Adviser was incorporated in 1997 and is a registered investment adviser under the Investment Advisers Act of 1940, as amended. Under the Advisory Agreement, the Fund pays the Adviser a monthly fee of 1/12 of 0.97% of the Fund’s average daily net assets. Investment advisory fees for the period ended December 31, 2007 and the year ended October 31, 2007 were $105,695 and $538,148, respectively.
The Adviser has contractually agreed to waive advisory fees and/or reimburse expenses so that the total operating expenses will not exceed 1.97% of the average daily net assets of the Fund through February 25, 2009. For the period ended December 31, 2007 and the year ended October 31, 2007, there were no advisory fees waived.
Any amounts waived or reimbursed by the Adviser are subject to reimbursement by the Fund within the following three years, provided the Fund is able to make such reimbursement and remain in compliance with the expense limitation as stated above. For the period ended December 31, 2007 and the year ended October 31, 2007, the Fund reimbursed the Adviser $2,423 and $23,281, respectively, of expenses previously waived. The balance of recoverable expenses to the Adviser at December 31, 2007 and the year ended October 31, 2007 was $34,022 and $36,445, respectively, expiring in 2009.
The Fund has adopted a plan of distribution pursuant to Rule 12b-1 (the “Plan”). The Plan permits the Fund to pay SSH Securities, Inc. (the “Distributor”) a monthly fee of 1/12 of 0.30% of the Funds average daily net assets for the Distributor’s services and expenses in distributing shares of the Fund and providing personal services and/or maintaining shareholder accounts. For the period ended December 31, 2007 and the year ended October 31, 2007, fees paid to the Distributor under the Plan were $32,689 and $166,437, respectively.
The Fund’s shares are subject to an initial sales charge imposed at the time of purchase, in accordance with the Fund’s current prospectus. For the period ended December 31, 2007 and the year ended October 31, 2007, sales charges received by the Distributor were $156,190 and $1,050,910, respectively. A contingent deferred sales charge of 1.00% may be imposed on redemptions of $1 million or more made within one year of purchase.
Certain Officers and Directors of the Company are “affiliated persons”, as that term is defined in the 1940 Act, of the Adviser or the Distributor. Until December 12, 2007, each Director of the Company who is not an affiliated person of the Adviser or Distributor received a quarterly retainer of $1,000, a $500 meeting fee plus reimbursement for certain travel and other out-of-pocket expenses incurred in connection with attending Board meetings. Effective December 12, 2007, each Director of the Company, who is not an affiliated person of the Adviser or Distributor, receives a quarterly retainer of $1,500, $1,000 for each Board meeting attended, and $500 for each committee meeting attended plus reimbursement for certain travel and other out-of-pocket expenses incurred in connection with attending Board meetings. The Company does not compensate the Officers for the services they provide. There are no Directors’ fees paid to affiliated Directors of the Company. For the period ended December 31, 2007 and the year ended October 31, 2007, the Fund was allocated $861 and $3,529, respectively, of the Chief Compliance Officer fee. In addition, David Lerner Associates, Inc., a registered broker-dealer affiliated with the Adviser and the Distributor, received no brokerage commissions for the period ended December 31, 2007.
Note 4 - Federal Income Taxes
The tax character of distributions paid for period ended December 31, 2007 and the fiscal years ended October 31, 2007 and October 31, 2006 were as follows:
12/31/2007 Taxable Distributions
Ordinary |
| Net Long-Term |
| Total Taxable |
| |||
Income |
| Capital Gains |
| Distributions |
| |||
$ | 178,988 |
| $ | 3,705,592 |
| $ | 3,884,580 |
|
12
10/31/2007 Taxable Distributions
Ordinary |
| Net Long-Term |
| Total Taxable |
| |||
Income |
| Capital Gains |
| Distributions |
| |||
$ | 147,457 |
| $ | 1,836,659 |
| $ | 1,984,116 |
|
10/31/2006 Taxable Distributions
Ordinary |
| Net Long-Term |
| Total Taxable |
| |||
Income |
| Capital Gains |
| Distributions |
| |||
$ | 106,574 |
| $ | 386,302 |
| $ | 492,876 |
|
Distribution classifications may differ from the Statements of Changes in Net Assets as a result of the treatment of short-term capital gains as ordinary income for tax purposes.
As of December 31, 2007, the components of accumulated distributable earnings for the Fund on a tax basis were as follows:
Accumulated net investment income |
| $ | 22,100 |
|
Accumulated net realized gain on investments |
| 5,453 |
| |
Unrealized appreciation |
| 9,999,069 |
| |
Total Distributable Earnings |
| $ | 10,026,622 |
|
In July 2006, the FASB released FASB Interpretation No. 48 “Accounting for Uncertainty in Income Taxes” (“FIN 48”). FIN 48 provides guidance for how uncertain tax positions should be recognized, measured, presented and disclosed in the financial statements. FIN 48 requires the evaluation of tax positions taken or expected to be taken in the course of preparing the Fund’s tax return to determine whether the tax positions are “more-likely-than-not” of being sustained by the applicable tax authority. Tax positions not deemed to meet the more-likely-than-not threshold would be recorded as a tax benefit or expense in the current year. Adoption of FIN 48 is required no later than the last business day of the first financial statement reporting period for fiscal years beginning after December 15, 2006 and is to be applied to all open tax years (2004-2007) as of the effective date. The Fund’s federal and state income and federal excise tax returns for tax years for which applicable statutes of limitations have not expired are subject to examination by the Internal Revenue Service and state departments of revenue. Management has implemented FIN 48 and has determined that there is no impact to the financial statements.
Tax Information (Unaudited)
Qualified Interest Income
For the period ended December 31, 2007, 9.20% of the ordinary distributions paid (net investment income plus short-term capital gain) represent the amount of Qualifying Interest Income as created by The American Jobs Creation Act of 2004.
Qualified Dividend Income
For the period ended December 31, 2007, 100% of the distributions paid by the Fund from ordinary income qualifies for a reduced tax rate pursuant to The Jobs and Growth Tax Relief Reconciliation Act of 2003.
Dividends Received Deduction
For the period ended December 31, 2007, 100% of the ordinary income distribution qualifies for the dividends received deduction available to corporations.
Qualifying Short-Term Capital Gain
For the period ended December 31, 2007, 87.37% of the ordinary distributions paid (net investment income plus short-term capital gain) represent the amount of Qualifying Short-Term Capital Gain as created by The American Jobs Creation Act of 2004.
Long-Term Capital Gain Dividends
The Fund designates $3,705,592 as long-term capital gain distributions pursuant to section 852(b)(3) of the Internal Revenue Code for the period ended December 31, 2007.
13
SPIRIT OF AMERICA LARGE CAP VALUE FUND
RENEWAL OF INVESTMENT ADVISORY AGREEMENT
DECEMBER 31, 2007
Factors Considered by the Directors in Approving the Investment Advisory Agreement
The Investment Company Act of 1940, as amended (the “1940 Act”), requires that the continuance of the Funds’ Investment Advisory Agreement be approved annually both by the Board of Directors and also by a majority of the Directors who are not “interested persons” of the Funds under the 1940 Act (“Independent Directors”) voting separately. The continuance of the Investment Advisory Agreement was most recently considered and approved at a meeting of the Board of Directors called for that purpose and held on December 12, 2007. The Board, including the Independent Directors, determined that the terms of the Investment Advisory Agreement are fair and reasonable and approved the continuance of the Investment Advisory Agreement. The Directors relied on the assistance of counsel to the Funds and to the Independent Directors in making these determinations.
At a meeting on December 12, 2007, which was specifically held to address the continuance of the Investment Advisory Agreement, and at other meetings during the course of the year, the Board, including the Independent Directors, received materials relating to the Funds and Spirit of America Management Corp. (the “Adviser”). These materials included, among other things, the following: (i) information on the investment performance of the Funds and relevant indices over various time periods; (ii) sales and redemption data with respect to the Funds; (iii) the general investment outlook in the markets in which the Funds invest; (iv) arrangements with respect to the distribution of the Funds’ shares; (v) the procedures employed to determine the value of each Fund’s assets; (vi) the allocation of the Funds’ brokerage, the record of compliance with the Funds’ investment policies and restrictions and with the Funds’ Code of Ethics and the structure and responsibilities of the Adviser’s compliance departments; (vii) the profitability of the Funds’ investment advisory business to the Adviser taking into account both advisory fees and any other potential direct or indirect benefits;(viii) information comparing the overall fees and specifically the fees under the Investment Advisory Agreement with the fees paid by other similar mutual funds; (ix) the Form ADV of the Adviser; and (x) information comparing the performance of the Funds with the performance of other similar mutual funds.
In evaluating the Investment Advisory Agreement, the Board, including the Independent Directors, requested, reviewed and considered materials furnished by the Adviser and questioned personnel at the Adviser, including the Funds’ portfolio manager, regarding, among other things, the personnel, operations and financial condition of the Adviser. Among other information, the Board, including the Independent Directors, requested and was provided information regarding:
· The investment performance of each Fund over various time periods both by itself and in relation to relevant indices;
· The fees charged by the Adviser for investment advisory services, as well as other compensation received by the Adviser and its affiliates;
· The waivers of fees and reimbursements of expenses at times by the Adviser under the Operating Expenses Agreement;
· The investment performance, fees and total expenses of mutual funds with similar objectives and strategies managed by other investment advisers;
· The investment management staffing and the experience of the investment advisory, administrative and other personnel providing services to the Funds and the historical quality of the services provided by the Adviser; and
· The profitability to the Adviser of managing and its affiliate distributing the Funds and the methodology in allocating expenses to the management of the Funds.
Counsel to the Independent Directors (“Independent Counsel”) reviewed the legal standards applicable to the Independent Directors under the 1940 Act with respect to the annual approval of investment advisory agreements. Independent Counsel referred the Independent Directors to the “Gartenberg Memorandum” that had been distributed to the Directors prior to the meeting outlining these duties. Specifically, mentioned was that the Independent Directors should focus on the following; (i) the fee structure of the Advisory Agreement, including a comparison of the fees charged with those charged by similar funds, as well as whether any economies of scale were achieved; (ii) the nature and quality of services provided; and (iii) the overall fairness of the Advisory Agreement, including its profitability for the Adviser and DLA. Independent Counsel stated that a Section 15(c) Questionnaire, distributed prior to the Meeting, was drafted to assist the Independent Directors by highlighting the material issues to be focused on by the Adviser in its discussion of the relevant information it would be providing at this Meeting.
The following is a summary of the Board’s discussion and views regarding the factors it considered in evaluating the continuation of the Investment Advisory Agreement:
1. Nature, Extent, and Quality of Services. The Board, including the Independent Directors, considered the nature, quality and extent of advisory, administrative and shareholder services performed by the Adviser, including: regulatory filings and disclosure to shareholders, general oversight of the service providers, coordination of Fund marketing initiatives, review of Fund legal issues, assisting the Board, including the Independent Directors, in their capacity as directors and other services. The Board, including the Independent Directors, noted the increased responsibilities of the Adviser in response to an increasingly regulated industry. The Board, including the Independent Directors, concluded that the services are extensive in nature, that the Adviser delivered solid service to each Fund and that the Adviser is positioned to continue providing such quality of service in the future.
2. Investment Performance of the Funds and the Adviser. The Board, including the Independent Directors, considered short-term and long-term investment performance for the Funds over various periods of time as compared to both relevant indices and the performance of such Funds’ peer groups, and concluded that each Fund was delivering solid performance results, especially over the long-term, consistent with the investment strategies that the Funds pursue.
3. Costs of Services and Profits Realized by the Adviser.
a. | The Directors, including the Independent Directors, considered the information provided by Lipper regarding each Fund’s management fee rate and overall expense ratio relative to industry averages for the Fund’s peer group category and the advisory fees charged by the Adviser to other accounts. The Board viewed favorably the current and historic willingness of the Adviser to limit the overall expense ratios of the Funds. Recognizing that the Funds were higher than the medians in their peer group, the Board nonetheless noted that the fees were still close to the median and that several peer funds had higher fees. |
b. | Profitability and Costs of Services to the Adviser. The Board, including the Independent Directors, considered estimates of the Adviser’s profitability and costs attributable to the Funds. The Board recognized that increased fixed costs, particularly legal and audit fees in response to increasing regulations, have a greater impact on smaller fund families, such as the Spirit funds, than on larger fund complexes. Given this, the Board recognized that the Funds’ overall expenses compare unfavorably to some funds identified as peers. The Board also considered whether the amount of the Adviser’s profit is a fair profit for the management of the Funds and noted that the Adviser has devoted a large amount of its resources into the Funds over the years. The Board, including the Independent Directors, concluded that the Adviser’s profitability was at a fair and acceptable level, particularly in light of the quality of the services being provided to the Funds, and bore a reasonable relationship to the services rendered. |
4. Extent of Economies of Scale as the Funds Grow. The Board, including the Independent Directors, considered whether there have been economies of scale with respect to the management of the Funds and whether the Funds have appropriately benefited from any economies of scale. Given the size of each Fund, the Board did not believe that significant (if any) economies of scale have been achieved.
5. Whether Fee Levels Reflect Economies of Scale. The Board took into consideration that the Adviser does not currently offer breakpoints in its fees that would otherwise allow investors to benefit directly from economies of scale in the form of lower fees as fund assets grow. However, the Board, including the Independent Directors, did consider enhancements in personnel and services provided to the Funds by the Adviser, without an increase in fees.
6. Other Relevant Considerations.
a. | Personnel and Methods. The Board, including the Independent Directors, reviewed the Adviser’s Form ADV and questioned the Adviser regarding the size, education and experience of the staff of the Adviser, its fundamental research capabilities, approach to recruiting, training and retaining portfolio managers and other research and management personnel, and concluded that these enable them to provide a high level of services to the Funds. The Board also considered the history, reputation, qualifications and background of the Adviser as well as the qualifications if its personnel. |
b. | The Board, including the Independent Directors, also considered the character and amount of other direct and incidental benefits received by the Adviser and its affiliates from their association with the Funds, including the benefits received by the affiliated distributor. The Board concluded that potential “fall-out” benefits that the Adviser and its affiliates may receive, such as greater name recognition or increased ability to obtain research services (although the Board noted that the Adviser currently does not use soft dollars to obtain research services), appear to be reasonable, and may in some cases benefit the Funds. |
Conclusions. In considering the renewal of the Investment Advisory Agreement, the Board, including the Independent Directors, did not identify any factor as all-important or all-controlling and instead considered the above listed and other factors collectively in light of the Funds’ surrounding circumstances. Each Director gave the weight to each factor that he deemed appropriate in his own judgment. The Board considered the renewal of the Agreement on a Fund-by-Fund basis and determined that the renewal of the Investment Advisory Agreement was in the best interests of the shareholders of each Fund. The Board also determined that the fees charged to each Fund for the services provided were reasonable. Therefore, the Directors, including the Independent Directors, determined that continuance of the Investment Advisory Agreement was in the best interests of each Fund.
14
SPIRIT OF AMERICA LARGE CAP VALUE FUND
REPORT OF INDEPENDENT REGISTERED PUBLIC ACCOUNTING FIRM
To the Shareholders and Board of Directors
Spirit of America Investment Fund, Inc.
Syosset, New York
We have audited the accompanying statement of assets and liabilities of Spirit of America Large Cap Value Fund (“Fund”), a series of shares of beneficial interest in Spirit of America Investment Fund, Inc., including the schedule of investments as of December 31, 2007, and the related statement of operations, the statements of changes in net assets and the financial highlights for the periods indicated thereon. These financial statements and financial highlights are the responsibility of the Fund’s management. Our responsibility is to express an opinion on those financial statements and financial highlights based on our audits.
We conducted our audits in accordance with the standards of the Public Company Accounting Oversight Board (United States). Those standards require that we plan and perform the audit to obtain reasonable assurance about whether the financial statements and financial highlights are free of material misstatement. The Fund is not required to have, nor were we engaged to perform, an audit of the Fund’s internal control over financial reporting. Our audits included consideration of internal control over financial reporting as a basis for designing audit procedures that are appropriate in the circumstances, but not for the purpose of expressing an opinion on the effectiveness of its internal control over financial reporting. Accordingly, we express no such opinion. An audit also includes examining, on a test basis, evidence supporting the amounts and disclosures in the financial statements, assessing the accounting principles used and significant estimates made by management, as well as evaluating the overall financial statement presentation. Our procedures included confirmation of securities owned as of December 31, 2007, by correspondence with custodian. We believe that our audits provide a reasonable basis for our opinion.
In our opinion, the financial statements and financial highlights referred to above present fairly, in all material respects, the financial position of Spirit of America Large Cap Value Fund as of December 31, 2007, the results of its operations, the changes in its net assets and the financial highlights for the periods indicated thereon, in conformity with accounting principles generally accepted in the United States of America.
TAIT, WELLER & BAKER LLP
Philadelphia, Pennsylvania
February 25, 2008
15
SPIRIT OF AMERICA LARGE CAP VALUE FUND
MANAGEMENT OF THE COMPANY
(UNAUDITED)
Information pertaining to the Directors and Officers of the Company is set forth below. The Statement of Additional Information includes additional information about the Directors and is available without charge, upon request, by calling 516-390-5565.
Name, Address and (Age) |
| Term of Office(1) |
| Principal Occupation(s) |
| Number of Portfolios |
| Other Directorships |
|
|
|
|
|
|
|
|
|
INTERESTED DIRECTORS |
|
|
|
|
|
|
|
|
|
|
|
|
|
|
|
|
|
David Lerner (2) (71) |
| Since 1998 |
| President and founder, David Lerner Associates, Inc., a registered broker-dealer; President, Spirit of America Management Corp., the Company’s investment adviser; and Chief Executive Officer and President of SSH Securities, Inc., the Company’s Distributor. |
| 3 |
| Director of Spirit of America Management Corp., the Company’s investment adviser; Director of SSH Securities, Inc., the Company’s Distributor; Director of David Lerner Associates, Inc., a registered broker-dealer. |
|
|
|
|
|
|
|
|
|
Daniel Lerner (2) (46) |
| Since 1998 |
| Senior Vice President, Investment Counselor with David Lerner Associates, Inc., a registered broker-dealer, since September 2000. Previously: Broker with Prudential Securities from February 2000 to July 2000; Broker with Bear Stearns from January 1999 to May 1999; Vice President of SSH Securities, Inc., the Company’s Distributor and Senior Vice President. |
| 3 |
| Director of David Lerner Associates, Inc., a registered broker-dealer. |
|
|
|
|
|
|
|
|
|
INDEPENDENT DIRECTORS |
|
|
|
|
|
| ||
|
|
|
|
|
|
|
|
|
Allen Kaufman (71) |
| Since 1998 |
| President and Chief Executive Officer of K.G.K. Agency, Inc., a property and casualty insurance agency, since 1963. |
| 3 |
| Director of K.G.K. Agency, Inc., a property and casualty insurance agency. |
|
|
|
|
|
|
|
|
|
Stanley S. Thune (71) |
| Since 1998 |
| President and Chief Executive Officer, Freight Management Systems, Inc., a third party logistics management company, since 1994; private investor. |
| 3 |
| Director of Freight Management Systems, Inc. |
|
|
|
|
|
|
|
|
|
Richard Weinberger (71) |
| Since 2005 |
| Of Counsel to Ballon Stoll Bader & Nadler, P.C., a mid-sized law firm, since January 2005; Shareholder, Ballon Stoll Bader & Nadler, P.C., January 2000 to December 2004. |
| 3 |
| None. |
|
|
|
|
|
|
|
|
|
OFFICERS |
|
|
|
|
|
|
|
|
|
|
|
|
|
|
|
|
|
David Lerner |
|
|
|
|
|
|
|
|
|
|
|
|
|
|
|
|
|
Alan P. Chodosh (54) |
| Since 2005 |
| Executive Vice President and Chief Financial Officer of David Lerner Associates, Inc. since June 1997. |
| N/A |
| N/A |
|
|
|
|
|
|
|
|
|
Joseph Pickard (47) |
| Since 2007 |
| Chief Compliance Officer of Spirit of America Investment Fund, Inc. and Spirit of America Management Corp. since July 2007; Counsel to the Interested Directors of Spirit of America Investment Fund, Inc. since July 2002; General Counsel of David Lerner Associates, Inc. since July 2002. |
| N/A |
| N/A |
(1) | Each Director serves for an indefinite term, until his successor is elected. |
(2) | David Lerner is an “interested” Director, as defined in the 1940 Act, by reason of his positions with the Adviser and Distributor, and Daniel Lerner is an “interested” Director by reason of his position with the Distributor. Daniel Lerner is the son of David Lerner. |
16
Proxy Voting Information
The Company’s Statement of Additional Information (“SAI”) containing a description of the policies and procedures that the Spirit of America Large Cap Value Fund uses to determine how to vote proxies relating to portfolio securities, along with the Company’s proxy voting record relating to portfolio securities held during the 12-month period ended June 30, 2007, are available (i) without charge, upon request, by calling (516) 390-5565; and (ii) on the SEC’s website at http://www.sec.gov.
Information on Form N-Q
The Company will file its complete schedule of portfolio holdings with the SEC for the first and third quarters of each fiscal year on Form N-Q within sixty days after the end of the period. The Company’s Forms N-Q will be available on the SEC’s website at http://www.sec.gov, and may be reviewed and copied at the SEC’s Public Reference Room in Washington, DC. Information on the operation of the Public Reference Room may be obtained by calling 1-800-SEC-0330.
©Copyright 2008 Spirit of America

Investment Adviser
Spirit of America Management Corp. P.O. Box 9006
Syosset, NY 11791-9006
Distributor
SSH Securities, Inc.
P.O. Box 9006
Syosset, NY 11791-9006
Shareholder Services
PFPC Inc.
760 Moore Road
King of Prussia, PA 19406
Custodian
PFPC Trust Company
8800 Tinicum Boulevard, 4th Floor Philadelphia, PA 19153
Independent Registered Public Accounting Firm
Tait Weller & Baker LLP
1818 Market Street, Suite 2400
Philadelphia, PA 19103
Counsel
Blank Rome LLP
405 Lexington Avenue
New York, NY 10174
For Additional Information about the Spirit of America Large Cap Value Fund, call (800) 452-4892 or (610) 382-7819. This report is submitted for the general information of the shareholders of the Fund. It is not authorized for distribution to prospective investors in the Fund unless preceded or accompanied by an effective Prospectus which includes details regarding the Fund’s objectives, policies, expenses, and other information.
©Copyright 2008 Spirit of America |
| SOAV-ARD07 |
Item 2. Code of Ethics.
(a) The registrant, as of the end of the period covered by this report, has adopted a code of ethics that applies to the registrant’s principal executive officer, principal financial officer, principal accounting officer or controller, or persons performing similar functions, regardless of whether these individuals are employed by the registrant or a third party.
(b) Not applicable.
(c) There have been no amendments, during the period covered by this report, to a provision of the code of ethics that applies to the registrant’s principal executive officer, principal financial officer, principal accounting officer or controller, or persons performing similar functions, regardless of whether these individuals are employed by the registrant or a third party, and that relates to any element of the code of ethics description.
(d) The registrant has not granted any waivers, including an implicit waiver, from a provision of the code of ethics that applies to the registrant’s principal executive officer, principal financial officer, principal accounting officer or controller, or persons performing similar functions, regardless of whether these individuals are employed by the registrant or a third party, that relates to one or more of the items set forth in paragraph (b) of this item’s instructions.
(e) Not applicable.
(f) The registrant’s code of ethics is incorporated by reference to Exhibit (a)(1) to the registrant’s form N-CSR filed with the Securities and Exchange Commission on January 7, 2005 (Accession No. 0001047469-05-000347).
Item 3. Audit Committee Financial Expert.
Registrant’s Board of Directors has determined that it does not have an “audit committee financial expert” serving on its audit committee. While Registrant believes that each of the members of its audit committee has sufficient knowledge of accounting principles and financial statements to serve on the audit committee, none has the requisite experience to qualify as an “audit committee financial expert”; as such term is defined by the Securities and Exchange Commission.
Item 4. Principal Accountant Fees and Services.
Audit Fees
(a) The aggregate fees billed for professional services rendered by the principal accountant for the audit of the registrant’s annual financial statements or services that are normally provided by the accountant in connection with statutory and regulatory filings or engagements for fiscal years ended October 31, 2006 and October 31, 2007 and the two month period ended December 31, 2007 are $29,200, $31,200 and $31,200, respectively.
Audit-Related Fees
(b) The aggregate fees billed for assurance and related services by the principal accountant that are reasonably related to the performance of the audit of the registrant’s financial statements and are not reported under paragraph (a) of this Item for fiscal years ended October 31, 2006 and October 31, 2007 and the two month period ended December 31, 2007 are $0, $0 and $0, respectively.
Tax Fees
(c) The aggregate fees billed for professional services rendered by the principal accountant for tax compliance, tax advice, and tax planning for fiscal years ended October 31, 2006 and October 31, 2007 and the two month period ended December 31, 2007 are $0, $0 and $0, respectively.
All Other Fees
(d) The aggregate fees billed for products and services provided by the principal accountant, other than the services reported in paragraphs (a) through (c) of this Item are for fiscal years ended October 31, 2006 and October 31, 2007 and the two month period ended December 31, 2007 are $0, $0 and $0, respectively.
(e)(1) Disclose the audit committee’s pre-approval policies and procedures described in paragraph (c)(7) of Rule 2-01 of Regulation S-X.
Pre-Approval of Audit and Permitted Non-Audit Services Provided to the Company
Pre-Approval Requirements. The Committee shall pre-approve all auditing services and permissible non-audit services (e.g., tax services) to be provided to the Company by the Auditor, including the fees therefor. The Committee may delegate to one or more of its members the authority to grant pre-approvals. In connection with such delegation, the Committee shall establish pre-approval policies and procedures, including the requirement that the decisions of any member to whom authority is delegated under this section (B) shall be presented to the full Committee at each of its scheduled meetings.
De Minimis Exception to Pre-Approval: Pre-approval for a permitted non-audit service shall not be required if:
a. the aggregate amount of all such non-audit services is not more than 5% of the total revenues paid by the Company to the Auditor in the fiscal year in which the non-audit services are provided;
b. such services were not recognized by the Company at the time of the engagement to be non-audit services; and
c. such services are promptly brought to the attention of the Committee and approved prior to the completion of the audit by the Committee or by one or more members of the Committee to whom authority to grant such approvals has been delegated by the Committee.
Additionally, the Committee shall pre-approve the Auditor’s engagements for non-audit services with the Adviser and any affiliate of the Adviser that provides ongoing services to the Company in accordance with the foregoing, if the engagement relates directly to the operations and financial reporting of the Company, unless the aggregate amount of all services provided constitutes no more than 5% of the total amount of revenues paid to the Auditor by the Company, the Adviser and any affiliate of the Adviser that provides ongoing services to the Company during the fiscal year in which the services are provided that would have to be pre-approved by the Committee pursuant to this paragraph (without regard to this exception).
(e)(2) The percentage of services described in each of paragraphs (b) through (d) of this Item that were approved by the audit committee pursuant to paragraph (c)(7)(i)(C) of Rule 2-01 of Regulation S-X are as follows:
(b) N/A
(c) N/A
(d) N/A
(f) The percentage of hours expended on the principal accountant’s engagement to audit the registrant’s financial statements for the most recent fiscal year that were attributed to work performed by persons other than the principal accountant’s full-time, permanent employees was less than fifty percent.
(g) The aggregate non-audit fees billed by the registrant’s accountant for services rendered to the registrant, and rendered to the registrant’s investment adviser (not including any sub-adviser whose role is primarily portfolio management and is subcontracted with or overseen by another investment adviser), and any entity controlling, controlled by, or under common control with the adviser that provides ongoing services to the registrant for fiscal years ended October 31, 2006 and October 31, 2007 and the two month period ended December 31, 2007 are $0, $0 and $0, respectively.
(h) The registrant’s audit committee of the board of directors has considered whether the provision of non-audit services that were rendered to the registrant’s investment adviser (not including any sub-adviser whose role is primarily portfolio management and is subcontracted with or overseen by another investment adviser), and any entity controlling, controlled by, or under common control with the investment adviser that provides ongoing services to the registrant that were not pre-approved pursuant to paragraph (c)(7)(ii) of Rule 2-01 of Regulation S-X is compatible with maintaining the principal accountant’s independence.
Item 5. Audit Committee of Listed registrants.
Not applicable.
Item 6. Schedule of Investments.
Schedule of Investments in securities of unaffiliated issuers as of the close of the reporting period is included as part of the report to shareholders filed under Item 1 of this form.
Item 7. Disclosure of Proxy Voting Policies and Procedures for Closed-End Management Investment Companies.
Not applicable.
Item 8. Portfolio Managers of Closed-End Management Investment Companies.
Not applicable.
Item 9. Purchases of Equity Securities by Closed-End Management Investment Company and Affiliated Purchasers.
Not applicable.
Item 10. Submission of Matters to a Vote of Security Holders.
There have been no material changes to the procedures by which the shareholders may recommend nominees to the registrant’s board of directors, where those changes were implemented after the registrant last provided disclosure in response to the requirements of Item 407(c)(2)(iv) of Regulation S-K (17 CFR 229.407) (as required by Item 22(b)(15) of Schedule 14A (17 CFR 240.14a-101)), or this Item.
Item 11. Controls and Procedures.
(a) The registrant’s principal executive and principal financial officers, or persons performing similar functions, have concluded that the registrant’s disclosure controls and procedures (as defined in Rule 30a-3(c) under the Investment Company Act of 1940, as amended (the “1940 Act”) (17 CFR 270.30a-3(c))) are effective, as of a date within 90 days of the filing date of the report that includes the disclosure required by this paragraph, based on their evaluation of these controls and procedures required by Rule 30a-3(b) under the 1940 Act (17 CFR 270.30a-3(b)) and Rules 13a-15(b) or 15d-15(b) under the Securities Exchange Act of 1934, as amended (17 CFR 240.13a-15(b) or 240.15d-15(b)).
(b) There were no changes in the registrant’s internal control over financial reporting (as defined in Rule 30a-3(d) under the 1940 Act (17 CFR 270.30a-3(d)) that occurred during the registrant’s
second fiscal quarter of the period covered by this report that has materially affected, or is reasonably likely to materially affect, the registrant’s internal control over financial reporting.
Item 12. Exhibits.
(a)(1) | Not applicable. |
|
|
(a)(2) | Certifications pursuant to Rule 30a-2(a) under the 1940 Act and Section 302 of the Sarbanes-Oxley Act of 2002 are attached hereto. |
|
|
(a)(3) | Not applicable. |
|
|
(b) | Certifications pursuant to Rule 30a-2(b) under the 1940 Act and Section 906 of the Sarbanes-Oxley Act of 2002 are attached hereto. |
SIGNATURES
Pursuant to the requirements of the Securities Exchange Act of 1934 and the Investment Company Act of 1940, the registrant has duly caused this report to be signed on its behalf by the undersigned, thereunto duly authorized.
(registrant) |
|
| Spirit of America Investment Fund, Inc. | ||
|
| ||||
By (Signature and Title)* |
| /s/ David Lerner | |||
|
| David Lerner, Principal Executive Officer | |||
|
| (principal executive officer) | |||
| |||||
Date |
| March 5, 2008 | |||
Pursuant to the requirements of the Securities Exchange Act of 1934 and the Investment Company Act of 1940, this report has been signed below by the following persons on behalf of the registrant and in the capacities and on the dates indicated.
By (Signature and Title)* |
| /s/ David Lerner | |||||
|
| David Lerner, Principal Executive Officer | |||||
|
| (principal executive officer) | |||||
|
| ||||||
Date |
| March 5, 2008 | |||||
|
| ||||||
|
| ||||||
By (Signature and Title)* |
| /s/ Alan Chodosh | |||||
|
| Alan Chodosh, Principal Financial Officer | |||||
|
| (principal financial officer) | |||||
|
| ||||||
Date |
| March 5, 2008 | |||||
* Print the name and title of each signing officer under his or her signature.