UNITED STATES
SECURITIES AND EXCHANGE COMMISSION
Washington, D.C. 20549
FORM N-CSR
CERTIFIED SHAREHOLDER REPORT OF REGISTERED
MANAGEMENT INVESTMENT COMPANIES
Investment Company Act file number | 811-08231 |
Spirit of America Investment Fund, Inc.
| (Exact name of registrant as specified in charter) |
477 Jericho Turnpike P.O. Box 9006 Syosset, NY 11791-9006 |
| (Address of principal executive offices) (Zip code) |
Mr. David Lerner
David Lerner Associates
477 Jericho Turnpike
P.O. Box 9006
Syosset, NY 11791-9006
| (Name and address of agent for service) |
Registrant’s telephone number, including area code: (516) 390-5565
Date of fiscal year end: December 31
Date of reporting period: December 31, 2008
Form N-CSR is to be used by management investment companies to file reports with the Commission not later than 10 days after the transmission to stockholders of any report that is required to be transmitted to stockholders under Rule 30e-1 under the Investment Company Act of 1940 (17 CFR 270.30e-1). The Commission may use the information provided on Form N-CSR in its regulatory, disclosure review, inspection, and policymaking roles.
A registrant is required to disclose the information specified by Form N-CSR, and the Commission will make this information public. A registrant is not required to respond to the collection of information contained in Form N-CSR unless the Form displays a currently valid Office of Management and Budget (“OMB”) control number. Please direct comments concerning the accuracy of the information collection burden estimate and any suggestions for reducing the burden to Secretary, Securities and Exchange Commission, 100 F Street, NE, Washington, DC 20549. The OMB has reviewed this collection of information under the clearance requirements of 44 U.S.C. § 3507.
| Item 1. | Reports to Stockholders. |
The Report to Shareholders is attached herewith.

MESSAGE TO OUR SHAREHOLDERS
Dear Shareholder,
We are very pleased to send you a copy of the annual report for The Spirit of America High Yield Tax Free Bond Fund (the “Fund”). The Fund began operations on February 29th, 2008.
We are excited to be able to share this report with you as the Fund’s first year ends. The year has shown strong and steady growth for the Fund and we look forward to continued inflows and further development of the Fund in the year to come.
We remain committed to our philosophy of pursuing an optimal balance between yield and risk by utilizing our many years of experience in the municipal bond market. Our goal is to continue seeking high current income that is exempt from federal income tax, while employing a relatively conservative approach to investing in the high yield sector of the municipal market.
We have been proud to watch the increasing number of investors in the Fund throughout its first year. We appreciate your support of our Fund and look forward to your future investment in the Spirit of America High Yield Tax Free Bond Fund.
Thank you for being a part of the Spirit of America Family of Funds.
Sincerely,
 |
David Lerner President |  |
William Mason Portfolio Manager |


Any investment in debt securities is subject to risk and market values may fluctuate with economic conditions, interest rates, civil unrest and other factors, which will affect its market value. As with any mutual fund, an investor’s shares, when redeemed, may be worth more or less than their original cost. Past performance is no guarantee of future results.
Prospective investors should consider the investment objective, risks and charges and expenses of the Fund carefully before investing. The maximum sales charge on share purchases is 4.75% of the offering price. The Fund’s prospectus contains this and other information about the Fund and may be obtained through your broker or by calling 1-800-452-4892. The prospectus should be read carefully before investing.
| HIGH YIELD TAX FREE BOND FUND | 1 | |||
| MANAGEMENT DISCUSSION | ||||||
Introduction
The Spirit of America High Yield Tax Free Bond Fund, SOAMX, (the“Fund”) is proud to be completing a strong first year. The Fund’s objective is to maintain current income that is exempt from federal income tax. The emphasis of the Fund is in the high yield section of the municipal market. We are pursuing a balance between yield and risk.
As a high yield bond fund, the mandate allows the Fund to invest in lower rated securities; however we have kept our focus on investing in bonds in the “Baa3”/“BBB-” range and higher. Our plan is to continue with this relatively conservative approach to investing in the high yield municipal market.
In keeping with this philosophy, the Fund has been able to maintain attractive yields without venturing into the speculative, below investment grade, segment of the high yield municipal market. As of December 31, 2008, 99.7% of the portfolio was investment grade, with over 50% rated “A” or better.
Overview
High yield municipal bonds are typically issued by government entities to finance economic or industrial development projects, as well as housing, healthcare and environmental projects. Other high yield municipals are issued to finance such things as airport terminals, charter schools, and projects related to utilities. In addition, a large number of bonds have been issued by local governments in anticipation of revenues owed by the tobacco industry. |
The interest payments are usually covered by a special tax or revenue from the project, and the bonds are often backed by hard assets or mortgage income associated with the project. High yield municipals may also be issued to finance private projects that benefit the community, such as waste remediation or public utilities. In those cases the debt is usually backed and paid for by a corporation. As with the broader municipal market, high yield municipal bonds provide income that is exempt from federal, and sometimes state, income taxes.
One of the Fund’s goals has been to diversify with respect to location and sector. As of December 31, 2008, the Fund consisted of 71 different positions varied across 23 states and 1 territory. The holdings range throughout 13 sectors of the market, including areas such as, hospitals, higher education, industrial development and transportation. Also, while it certainly has not been a primary goal of the Fund, we have been able to maintain a percentage of our bonds in states and territories which have a tax exemption in New York, New Jersey and Connecticut, where most of our clients reside.
Game Plan
The game plan of the Fund has remained consistent from the beginning. This Fund does not make decisions based on complicated algorithms. We are not a quant fund. We are not a hedge fund. In the Fund, technology works for us and we do not work for technology. We do not receive buy signals from computer generated model. |
| 2 | SPIRIT OF AMERICA | |||
MANAGEMENT DISCUSSION (CONT.)
We invest the old fashioned way – hard work, intensive research, intuitive decisions. Our decisions are based on experience. The Portfolio Manager and his assistants have combined, over 62 years experience on Wall Street and are able to utilize their bond trading experience to expose value in the market. This is a Fund that seeks to employ conservative trading and investing techniques, albeit with high yielding securities.
Summary
The Fund continues to grow at a steady and healthy pace. During its first year, the Fund saw inflows of $30.8 million through December 31, 2008, while outflows remained minimal, totaling $1.2 million through December 31, 2008. We expect continued growth in assets under management in the future.
Our plan is to proceed with the same strategy that we have utilized since the Fund’s inception. We will continue to seek out municipal bonds that provide a balance between credit risk and the potential to offer high current income and consistently attractive yields.
Summary of Portfolio Holdings
(Unaudited)
The Securities and Exchange Commission (“SEC”) has adopted a requirement that all Funds present their categories of portfolio holdings in a table, chart or graph format in their annual and semi-annual shareholder reports, whether or not a schedule of investments is utilized. The following table, which presents portfolio holdings as a percentage of total market value, is provided in compliance with such requirement.
Spirit of America High Yield Tax Free Bond Fund
| December 31, 2008 |
Puerto Rico
|
15.46
|
%
|
$
|
3,384,860
| ||
Texas
| 9.94
|
|
| 2,175,554
| ||
New York
| 8.69
|
|
| 1,903,030
| ||
Ohio
| 8.23
|
|
| 1,800,988
| ||
Louisiana
| 6.10
|
|
| 1,334,250
| ||
North Dakota
| 5.88
|
|
| 1,287,390
| ||
New Jersey
| 5.35
|
|
| 1,170,480
| ||
Michigan
| 5.02
|
|
| 1,098,374
| ||
California
| 4.80
|
|
| 1,050,122
| ||
Colorado
| 4.57
|
|
| 999,471
| ||
Pennsylvania
| 3.89
|
|
| 851,054
| ||
Illinois
| 3.52
|
|
| 771,287
| ||
Kentucky
| 3.33
|
|
| 729,652
| ||
Indiana
| 2.91
|
|
| 635,870
| ||
Wisconsin
| 2.79
|
|
| 610,752
| ||
Florida
| 2.72
|
|
| 595,778
| ||
Connecticut
| 1.92
|
|
| 421,100
| ||
Georgia
| 1.16
|
|
| 254,135
| ||
Tennessee
| 0.82
|
|
| 179,736
| ||
Iowa
| 0.75
|
|
| 163,885
| ||
Arizona
| 0.74
|
|
| 162,078
| ||
New Hampshire
| 0.71
|
|
| 155,952
| ||
Maryland
| 0.50
|
|
| 109,052
| ||
Nevada
| 0.20
|
|
| 42,925
| ||
Total Investments
| 100.00
| %
| $
| 21,887,775
| ||
| HIGH YIELD TAX FREE BOND FUND | 3 | |||
ILLUSTRATION OF INVESTMENT (UNAUDITED)
The graph below compares the increase in value of a $10,000 investment in the Fund with the performance of the Barclays Capital Municipal Bond Index. The values and returns for the Fund include reinvested distributions, and the impact of the maximum sales charge of 4.75% placed on purchases. The returns shown do not reflect taxes that a shareholder would pay on Fund distributions or on the redemption of Fund shares.
Aggregate Total Returns
| For the Periods Ended December 31, 2008 | ||
| Shares | ||
3 Months (with sales charge)
| (17.07%)a
| |
3 Months (without sales charge)
| (12.97%)
| |
6 Months (with sales charge)
| (24.28%)a
| |
6 Months (without sales charge)
| (20.52%)
| |
Since Inception (with sales charge)b
| (23.86%)a
| |
Past performance is not indicative of future results.
a Reflects a 4.75% front-end sales charge.
b Inception date: February 29, 2008.
Growth of $10,000
(includes one-time 4.75% maximum sales charge and reinvestment of all distributions)
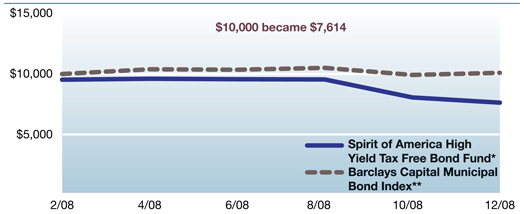
* Fund commenced operations February 29, 2008.
** The Barclays Capital Municipal Bond Index benchmark is based on a start date of February 29, 2008.
The Barclays Capital Municipal Bond Index is an unmanaged index. The performance of an index assumes no transaction costs, taxes, management fees or other expenses. A direct investment in an index is not possible.
| 4 | SPIRIT OF AMERICA | |||
DISCLOSURE OF FUND EXPENSES (UNAUDITED)
FOR THE PERIOD JULY 1, 2008 TO DECEMBER 31, 2008
| We believe it is important for you to understand the impact of fees regarding your investment. All mutual funds have operating expenses. As a shareholder of the Fund, you incur ongoing costs, which include costs for portfolio management, administrative services, and shareholder reports (like this one), among others. Operating expenses, which are deducted from the Fund’s gross income, directly reduce the investment return of the Fund. | The Fund’s expenses are expressed as a percentage of its average net assets. This figure is known as the expense ratio. The following examples are intended to help you understand the ongoing fees (in dollars) of investing in your Fund and to compare these costs with those of other mutual funds. The examples are based on an investment of $1,000 made at the beginning of the period shown and held for the entire period. |
Spirit of America High Yield Tax Free Bond Fund
| Beginning Account Value 7/1/08 | Ending Account Value 12/31/08 | Expense Ratio(1) | Expenses Paid During Period(2) | |||||||
Actual Fund Return | $1,000.00 | $ 794.80 | 0.30% | $1.35 | ||||||
Hypothetical 5% Return
| $1,000.00
| $1,023.63
| 0.30%
| $1.53
|
This table illustrates your Fund’s costs in two ways:
Actual Fund Return: This section helps you to estimate the actual expenses that you paid over the period. The “Ending Account Value” shown is derived from the Fund’s actual return, the third column shows the period’s annualized expense ratio, and the last column shows the dollar amount that would have been paid by an investor who started with $1,000 in the Fund at the beginning of the period. You may use the information here, together with your account value, to estimate the expenses that you paid over the period.
To do so, simply divide your account value by $1,000 (for example, an $8,600 account value divided by $1,000 = 8.6), then multiply the result by the number in the first line under the heading entitled “Expenses Paid During Period.” | Hypothetical 5% Return: This section is intended to help you compare your Fund’s costs with those of other mutual funds. It assumes that the Fund had a return of 5% before expenses during the period shown, but that the expense ratio is unchanged. In this case, because the return used is not the Fund’s actual return, the results do not apply to your investment. You can assess your Fund’s costs by comparing this hypothetical example with the hypothetical examples that appear in shareholder reports of other funds.
Please note that the expenses shown in the table are meant to highlight your ongoing costs only and do not reflect any transactional costs such as sales charges (loads), or redemption fees.
(1) Annualized, based on the Fund’s most recent half-year expenses.
(2) Expenses are equal to the Fund’s annualized expense ratio multiplied by the average account value over the period, multiplied by the number of days in the period, then divided by 366. |
| HIGH YIELD TAX FREE BOND FUND | 5 | |||
| SCHEDULE OF INVESTMENTS | DECEMBER | 31, 2008 |
| Principal Amount | Market Value | |||||
| Municipal Bonds 95.27% | ||||||
| Arizona 0.71% | ||||||
Pima County Industrial Development Authority, Refunding | $ | 250,000 | $ | 162,078 | ||
| California 4.57% | ||||||
Hesperia Public Financing Authority, Miscellaneous Purposes | 500,000 | 357,450 | ||||
Turlock California, Hospital Improvements Certificate of | 250,000 | 145,460 | ||||
Turlock California, Hospital Improvements Certificate of | 250,000 | 145,587 | ||||
University of California Regents Medical Center, University & | 500,000 | 401,625 | ||||
| 1,050,122 | ||||||
| Colorado 4.35% | ||||||
Colorado Educational & Cultural Facilities Authority, School | 250,000 | 230,292 | ||||
Colorado Educational & Cultural Facilities Authority, School | 250,000 | 232,468 | ||||
Montrose Memorial Hospital, Hospital Improvements Revenue | 500,000 | 345,635 | ||||
Public Authority for Colorado Energy, Natural Gas Utility | 240,000 | 191,076 | ||||
| 999,471 | ||||||
| Connecticut 1.83% | ||||||
Connecticut State Development Authority, Refunding Revenue | 250,000 | 187,625 | ||||
Connecticut State Health & Educational Facility Authority, | 250,000 | 233,475 | ||||
| 421,100 | ||||||
See accompanying notes to financial statements.
| 6 | SPIRIT OF AMERICA | |||
| SCHEDULE OF INVESTMENTS (CONT.) | DECEMBER | 31, 2008 |
| Principal Amount | Market Value | |||||
| Florida 2.59% | ||||||
Halifax Hospital Medical Center, Refunding Revenue Bonds, | $ | 250,000 | $ | 229,098 | ||
Hillsborough County Industrial Development Authority, School | 250,000 | 147,860 | ||||
Miami-Dade County Educational Facilities Authority, | 250,000 | 218,820 | ||||
| 595,778 | ||||||
| Georgia 1.11% | ||||||
Coffee County Hospital Authority, Refunding Revenue Bonds, | 250,000 | 186,535 | ||||
Main Street Natural Gas, Inc., Natural Gas Utility | 270,000 | 35,100 | ||||
Main Street Natural Gas, Inc., Natural Gas Utility | 250,000 | 32,500 | ||||
| 254,135 | ||||||
| Illinois 3.36% | ||||||
Illinois Finance Authority, Hospital Improvements Revenue | 250,000 | 190,795 | ||||
Illinois Finance Authority, Hospital Improvements Revenue | 250,000 | 192,423 | ||||
Illinois Finance Authority, Refunding Revenue Bonds, | 500,000 | 388,070 | ||||
| 771,288 | ||||||
| Indiana 2.77% | ||||||
Indiana Health & Educational Facilities Financing Authority, | 1,000,000 | 635,870 | ||||
| Iowa 0.71% | ||||||
Iowa Higher Education Loan Authority, Refunding Revenue | 250,000 | 163,885 | ||||
| HIGH YIELD TAX FREE BOND FUND | 7 | |||
| SCHEDULE OF INVESTMENTS (CONT.) | DECEMBER | 31, 2008 |
| Principal Amount | Market Value | |||||
| Kentucky 3.18% | ||||||
Kentucky Economic Development Finance Authority, | $ | 750,000 | $ | 729,652 | ||
| Louisiana 5.81% | ||||||
Parish of St. John Baptist, Industrial Improvements Revenue | 2,250,000 | 1,334,250 | ||||
| Maryland 0.47% | ||||||
Maryland Health & Higher Educational Facilities Authority, | 150,000 | 109,051 | ||||
| Michigan 4.78% | ||||||
Cesar Chavez Academy, Inc., School Improvements Certificate | 185,000 | 134,029 | ||||
Crossroads Charter Academy, Refunding Revenue Bonds, | 250,000 | 151,800 | ||||
Kent Hospital Finance Authority, Refunding Revenue Bonds, | 500,000 | 309,600 | ||||
Michigan Public Educational Facilities Authority, School | 500,000 | 339,695 | ||||
Michigan Tobacco Settlement Finance Authority, Refunding | 250,000 | 163,250 | ||||
| 1,098,374 | ||||||
| Nevada 0.19% | ||||||
Reno, Hospital Improvements Revenue Bonds, Callable | 50,000 | 42,925 | ||||
| New Hampshire 0.68% | ||||||
New Hampshire Health & Education Facilities Authority, | 250,000 | 155,952 | ||||
| New Jersey 5.10% | ||||||
Jersey City Municipal Utilities Authority, Refunding Revenue | 250,000 | 242,028 | ||||
| 8 | SPIRIT OF AMERICA | |||
| SCHEDULE OF INVESTMENTS (CONT.) | DECEMBER | 31, 2008 |
| Principal Amount | Market Value | |||||
| New Jersey (cont.) | ||||||
New Jersey Economic Development Authority, Economic | $ | 500,000 | $ | 433,340 | ||
New Jersey Health Care Facilities Financing Authority, | 100,000 | 81,808 | ||||
Tobacco Settlement Financing Corp., Refunding Revenue | 850,000 | 413,304 | ||||
| 1,170,480 | ||||||
| New York 8.28% | ||||||
Metropolitan Transportation Authority, Refunding Revenue | 250,000 | 239,962 | ||||
Metropolitan Transportation Authority, Refunding Revenue | 500,000 | 501,695 | ||||
New York City Industrial Development Agency, Recreational | 250,000 | 172,138 | ||||
New York City Industrial Development Agency, Recreational | 250,000 | 165,398 | ||||
New York City Industrial Development Agency, Recreational | 100,000 | 61,612 | ||||
New York State Dormitory Authority, Hospital Improvements | 650,000 | 572,065 | ||||
New York State Dormitory Authority, Hospital Improvements | 250,000 | 190,160 | ||||
| 1,903,030 | ||||||
| North Dakota 5.60% | ||||||
Grand Forks, Hospital Improvements Revenue Bonds, | 1,500,000 | 1,287,390 | ||||
| Ohio 7.84% | ||||||
Buckeye Tobacco Settlement Financing Authority, | 2,500,000 | 1,501,700 | ||||
| HIGH YIELD TAX FREE BOND FUND | 9 | |||
| SCHEDULE OF INVESTMENTS (CONT.) | DECEMBER | 31, 2008 |
| Principal Amount | Market Value | |||||
| Ohio (cont.) | ||||||
Buckeye Tobacco Settlement Financing Authority, | $ | 550,000 | $ | 299,288 | ||
| 1,800,988 | ||||||
| Pennsylvania 3.70% | ||||||
City of Philadelphia, Public Improvements, General Obligation | 750,000 | 785,700 | ||||
Pennsylvania Higher Educational Facilities Authority, University | 100,000 | 65,354 | ||||
| 851,054 | ||||||
| Puerto Rico 14.73% | ||||||
Commonwealth of Puerto Rico, Public Improvements, General | 350,000 | 300,699 | ||||
Commonwealth of Puerto Rico, Public Improvements, General | 500,000 | 389,135 | ||||
Commonwealth of Puerto Rico, Public Improvements, General | 250,000 | 195,830 | ||||
Commonwealth of Puerto Rico, Public Improvements, General | 250,000 | 185,132 | ||||
Commonwealth of Puerto Rico, Refunding Bonds, General | 500,000 | 452,090 | ||||
Commonwealth of Puerto Rico, Refunding Bonds, General | 250,000 | 201,767 | ||||
Puerto Rico Aqueduct & Sewer Authority, Water & Utility | 125,000 | 101,614 | ||||
Puerto Rico Electric Power Authority, Electric Light & Power | 500,000 | 457,060 | ||||
Puerto Rico Electric Power Authority, Electric Light & Power | 250,000 | 174,962 | ||||
| 10 | SPIRIT OF AMERICA | |||
| SCHEDULE OF INVESTMENTS (CONT.) | DECEMBER | 31, 2008 |
| Principal Amount | Market Value | |||||
| Puerto Rico (cont.) | ||||||
Puerto Rico Highway & Transportation Authority, Highway | $ | 250,000 | $ | 198,055 | ||
Puerto Rico Public Buildings Authority, Economic | 210,000 | 185,382 | ||||
Puerto Rico Public Buildings Authority, Public Improvements Revenue | 600,000 | 435,816 | ||||
Puerto Rico Public Buildings Authority, Refunding Revenue | 125,000 | 107,318 | ||||
| 3,384,860 | ||||||
| Tennessee 0.78% | ||||||
Tennessee Energy Acquisition Corp., Natural Gas Utility | 265,000 | 179,736 | ||||
| Texas 9.47% | ||||||
Garza County Public Facility Corp., Public Improvements | 250,000 | 189,163 | ||||
North Texas Tollway Authority, Refunding Revenue Bonds, | 200,000 | 173,104 | ||||
North Texas Tollway Authority, Refunding Revenue Bonds, | 500,000 | 451,070 | ||||
North Texas Tollway Authority, Refunding Revenue Bonds, | 500,000 | 423,565 | ||||
Texas Municipal Gas Acquisition & Supply Corp. I, Natural | 600,000 | 472,848 | ||||
Texas State Public Finance Authority, Refunding Revenue | 900,000 | 465,804 | ||||
| 2,175,554 | ||||||
| Wisconsin 2.66% | ||||||
Wisconsin Health & Educational Facilities Authority, Hospital | 350,000 | 263,014 | ||||
Wisconsin Health & Educational Facilities Authority, Hospital | 100,000 | 52,558 | ||||
| HIGH YIELD TAX FREE BOND FUND | 11 | |||
| SCHEDULE OF INVESTMENTS (CONT.) | DECEMBER | 31, 2008 |
| Principal Amount | Market Value | |||||
| Wisconsin (cont.) | ||||||
Wisconsin Health & Educational Facilities Authority, | $500,000 | $295,180 | ||||
| 610,752 | ||||||
| Total Investments — 95.27% | ||||||
(Cost $27,713,609***) | 21,887,775 | |||||
| Cash and Other Assets Net of Liabilities — 4.73% | 1,086,288 | |||||
| NET ASSETS — 100.00% | $22,974,063 | |||||
ACA - Insured by ACA Financial Guaranty Corp. | ||||||
AMBAC - Insured by AMBAC Indemnity Corp. | ||||||
FGIC - Insured by Financial Guaranty Insurance Corp. | ||||||
FSA - Financial Security Assurance | ||||||
LOC - Letter of Credit | ||||||
MBIA - Insured by MBIA. | ||||||
OID - Original Issue Discount | ||||||
XLCA - Insured by XL Capital Assurance. | ||||||
* Security in default. | ||||||
** Non-income producing security. | ||||||
*** The aggregate cost for federal income tax purposes is $27,713,609, and net | ||||||
Gross unrealized appreciation | $ | 231,997 | ||||
Gross unrealized depreciation | (6,057,831 | ) | ||||
Net unrealized depreciation | $ | (5,825,834 | ) | |||
| 12 | SPIRIT OF AMERICA | |||
| STATEMENT OF ASSETS AND LIABILITIES | DECEMBER | 31, 2008 |
| ASSETS | |||
Investments in securities at value (cost $27,713,609) (Note 1) | $21,887,775 | ||
Cash | 1,532,339 | ||
Receivable for Fund shares sold | 40,584 | ||
Dividends and interest receivable | 400,032 | ||
Receivable from adviser | 14,956 | ||
Prepaid expenses | 12,518 | ||
TOTAL ASSETS | 23,888,204 | ||
LIABILITIES | |||
Payable for Fund shares redeemed | 102,429 | ||
Payable for investments purchased | 744,825 | ||
Payable for distributions to shareholders | 26,272 | ||
Payable for distribution fees (Note 3) | 2,868 | ||
Other accrued expenses | 37,747 | ||
TOTAL LIABILITIES | 914,141 | ||
NET ASSETS
| $22,974,063 | ||
Net assets applicable to 3,026,379 shares outstanding, $0.001 par value | $22,974,063 | ||
Net asset value and redemption price per share | $7.59 | ||
Maximum offering price per share ($7.59 ÷ 0.9525) | $7.97 | ||
SOURCE OF NET ASSETS | |||
At December 31, 2008, net assets consisted of: | |||
Paid-in capital | $28,983,183 | ||
Accumulated net realized loss on investments | (183,286 | ) | |
Net unrealized depreciation on investments | (5,825,834 | ) | |
NET ASSETS | $22,974,063 | ||
See accompanying notes to financial statements.
| HIGH YIELD TAX FREE BOND FUND | 13 | |||
STATEMENTS OF OPERATIONS
| For the Period Ended December 31, 2008* | |||||
| INVESTMENT INCOME | |||||
Interest | $ 829,854 | ||||
TOTAL INVESTMENT INCOME | 829,854 | ||||
EXPENSES | |||||
Investment Advisory fees (Note 3) | 74,138 | ||||
Distribution fees (Note 3) | 18,535 | ||||
Accounting fees | 32,965 | ||||
Administration fees | 20,349 | ||||
Auditing fees | 14,500 | ||||
Chief Compliance Officer salary | 1,304 | ||||
Custodian fees | 4,334 | ||||
Directors’ fees | 2,203 | ||||
Legal fees | 5,174 | ||||
Printing expense | 17,455 | ||||
Registration fees | 2,930 | ||||
Transfer Agent fees | 30,218 | ||||
Other expenses | 3,242 | ||||
TOTAL EXPENSES | 227,347 | ||||
Fees waived and reimbursed by Adviser (Note 3) | (190,278 | ) | |||
NET EXPENSES | 37,069 | ||||
NET INVESTMENT INCOME | 792,785 | ||||
REALIZED AND UNREALIZED LOSS ON INVESTMENTS | |||||
Net realized loss from investment transactions | (183,286 | ) | |||
Net change in unrealized depreciation of investments | (5,825,834 | ) | |||
Net realized and unrealized loss on investments | (6,009,120 | ) | |||
NET DECREASE IN NET ASSETS RESULTING FROM OPERATIONS | $(5,216,335 | ) | |||
| * | The Fund commenced operations on February 29, 2008. |
See accompanying notes to financial statements.
| 14 | SPIRIT OF AMERICA | |||
| STATEMENT OF CHANGES IN NET ASSETS |
| For the Period Ended December 31, 2008* | |||||
| OPERATIONS | |||||
Net investment income | $ 792,785 | ||||
Net realized loss from investment transactions | (183,286 | ) | |||
Net change in unrealized depreciation of | (5,825,834 | ) | |||
Net decrease resulting from operations | (5,216,335 | ) | |||
DISTRIBUTIONS TO SHAREHOLDERS | |||||
Distributions from net investment income | (792,785 | ) | |||
Total distributions to shareholders | (792,785 | ) | |||
CAPITAL SHARE TRANSACTIONS (Dollar Activity) | |||||
Shares sold | 29,604,234 | ||||
Shares issued from reinvestment of distributions | 540,192 | ||||
Shares redeemed | (1,161,243 | ) | |||
Increase in net assets derived from capital share | 28,983,183 | ||||
Total increase in net assets | 22,974,063 | ||||
NET ASSETS | |||||
Beginning of period | — | ||||
End of period | $22,974,063 | ||||
(a) Transactions in capital stock were: | |||||
Shares sold | 3,106,513 | ||||
Shares issued from reinvestment of distributions | 62,838 | ||||
Shares redeemed | (142,972 | ) | |||
Increase in shares outstanding | 3,026,379 | ||||
| * | The Fund commenced operations on February 29, 2008. |
See accompanying notes to financial statements.
| HIGH YIELD TAX FREE BOND FUND | 15 | |||
| FINANCIAL HIGHLIGHTS |
The table below sets forth financial data for one share of beneficial interest outstanding throughout the period presented.
| For the Period Ended December 31, 2008* | ||
| Net Asset Value, Beginning of Period | $ 10.00 | |
Income from Investment Operations: | ||
Net investment income | 0.471 | |
Net realized and unrealized loss on investments | (2.41) | |
Total from investment operations | (1.94) | |
Less Distributions: | ||
Distributions from net investment income | (0.47) | |
Total distributions
| (0.47) | |
| Net Asset Value, End of Period | $ 7.59 | |
| Total Return2,3 | (20.05%) | |
| Ratios/Supplemental Data | ||
Net assets, end of period (000) | $22,974 | |
Ratio of expenses to average net assets: | ||
Before expense reimbursement or recapture | 1.84%4 | |
After expense reimbursement or recapture | 0.30%4 | |
Ratio of net investment income to average net assets | 6.42%4 | |
Portfolio turnover | 6.63%2 |
| 1 | Calculated based on the average number of shares outstanding during the period. |
| 2 | Calculation is not annualized. |
| 3 | Calculation does not reflect sales load. |
| 4 | Calculation is annualized. |
| * | The Fund commenced operations on February 29, 2008. |
See accompanying notes to financial statements.
| 16 | SPIRIT OF AMERICA | |||
| NOTES TO FINANCIAL STATEMENTS | DECEMBER | 31, 2008 |
Note 1 - Significant Accounting Policies Spirit of America High Yield Tax Free Bond Fund (the “Fund”), a series of Spirit of America Investment Fund, Inc. (the “Company”), is an open-end non-diversified mutual fund registered under the Investment Company Act of 1940, as amended (the “1940 Act”). The Company was incorporated under the laws of Maryland on May 15, 1997. The Fund commenced operations on February 29, 2008. The Fund seeks high current income that is exempt from federal income tax, investing at least 80% of its assets in municipal bonds. The Fund offers one class of shares.
The following is a summary of significant accounting policies consistently followed by the Fund in the preparation of its financial statements. The policies are in conformity with accounting principles generally accepted in the United States of America for investment companies.
A. Security Valuation: The offering price and net asset value (“NAV”) per share for the Fund are calculated as of the close of regular trading on the New York Stock Exchange (“NYSE”), currently 4:00 p.m., Eastern Time on each day the NYSE is open for trading. The Fund’s securities are valued at the official close or the last reported sales price on the principal exchange on which the security trades, or if no sales price is reported, the mean of the latest bid and asked prices is used. Securities traded over-the-counter are priced at the mean of the latest bid and asked prices. Short-term investments having a maturity of 60 days or less are valued at amortized cost, which the Board of Directors (the “Board”) believes | represents fair value. Fund securities for which market quotations are not readily available are valued at fair value as determined in good faith under procedures established by and under the supervision of the Board.
In September 2006, the Financial Accounting Standards Board (“FASB”) issued Statement of Financial Accounting Standards No. 157, “Fair Value Measurements” (“FAS 157”), which is effective for fiscal years beginning after November 15, 2007. FAS 157 clarifies the definition of fair value for financial reporting, establishes a framework for measuring fair value and requires additional disclosures about the use of fair value measurements. The Fund adopted FAS 157 as of February 29, 2008. The three levels of the fair value hierarchy under FAS 157 are described below:
• Level 1 – quoted prices in active markets for identical securities
• Level 2 – other significant observable inputs (including quoted prices for similar securities, interest rates, prepayment speeds, credit risk, etc.)
• Level 3 – significant unobservable inputs (including the Fund’s own assumptions in determining the fair value of investments)
The inputs or methodology used for valuing securities are not necessarily an indication of the risk associated with investing in those securities. |
| HIGHYIELD TAX FREE BOND FUND | 17 | |||
| NOTES TO FINANCIAL STATEMENTS (CONT.) | DECEMBER | 31, 2008 |
The summary of inputs used to value the Fund’s net assets as of December 31, 2008 is as follows:
High Yield Tax Free Bond Fund | ||||
| Valuation Inputs | |||
Level 1 - Quoted Prices | $ | — | |
Level 2 - Other Significant Observable Inputs | 21,887,775 | ||
Level 3 - Significant Unobservable Inputs | — | ||
| Total Market Value of Investments | $ | 21,887,775 |
B. Investment Income and Securities Transactions: Security transactions are accounted for on the date the securities are purchased or sold (trade date). Cost is determined and gains and losses are based on the identified cost basis for both financial statement and federal income tax purposes. Dividend income and distributions to shareholders are reported on the ex-dividend date. Interest income and expenses are accrued daily.
C. Federal Income Taxes: The Fund intends to comply with all requirements of the Internal Revenue Code applicable to regulated investment companies and to distribute substantially all of its taxable income to its shareholders. Therefore, no federal income tax provision is required.
D. Use of Estimates: In preparing financial statements in conformity with accounting principles generally accepted in the United States of America, management makes estimates and assumptions that affect the reported amounts of assets and liabilities at the date of the financial statements, as well as the reported amounts of revenues and expenses during the reporting period. Actual results could differ from those estimates.
E. Distributions to Shareholders: The Fund intends to distribute substantially all of its net investment income and capital gains to shareholders each year. Normally, income distributions will be declared daily and paid monthly. Capital gains, if any, will be | distributed annually in December, but may be distributed more frequently if deemed advisable by the Board. All such distributions are taxable to the shareholders whether received in cash or reinvested in shares.
Note 2 - Purchases and Sales of Securities Purchases and proceeds from sales of securities for the period ended December 31, 2008, excluding short-term investments, were $28,716,257 and $910,898, respectively.
Note 3 - Investment Management Fee and Other Transactions with Affiliates Spirit of America Management Corp. (the “Adviser”) has been retained to act as the Company’s investment adviser pursuant to an Investment Advisory Agreement (the “Advisory Agreement”). The Adviser was incorporated in 1997 and is a registered investment adviser under the Investment Advisers Act of 1940, as amended. Under the Advisory Agreement, the Fund pays the Adviser a monthly fee of 1/12 of 0.60% of the Fund’s average daily net assets. Investment advisory fees for the period ended December 31, 2008 were $74,138.
The Adviser has contractually agreed to waive advisory fees and/or reimburse expenses so that the total operating expenses will not exceed 0.90% of the average daily net assets of the Fund through April 30, 2010. The Adviser voluntarily agreed to waive .60% of advisory fees through December 31, 2008. For the period ended December 31, 2008, the Adviser reimbursed the Fund $116,140. |
| 18 | SPIRIT OF AMERICA | |||
| NOTES TO FINANCIAL STATEMENTS (CONT.) | DECEMBER | 31, 2008 |
Any amounts waived or reimbursed by the Adviser are subject to reimbursement by the Fund within the following three years, provided the Fund is able to make such reimbursement and remain in compliance with the expense limitation as stated above. The balance of recoverable expenses to the Adviser at December 31, 2008 was $116,140 , expiring in 2011.
The Fund has adopted a plan of distribution pursuant to Rule 12b-1 (the “Plan”). The Plan permits the Fund to pay David Lerner Associates, Inc. (the “Distributor”) a monthly fee of 1/12 of 0.15% of the Funds average daily net assets for the Distributor’s services and expenses in distributing shares of the Fund and providing personal services and/or maintaining shareholder accounts. Prior to December 31, 2008, SSH Securities, Inc. (“SSH”) served as the Fund’s distributor. For the period ended December 31, 2008, fees paid to SSH under the Plan were $18,535.
The Fund’s shares are subject to an initial sales charge imposed at the time of purchase, in accordance with the Fund’s current prospectus. For the period ended December 31, 2008, sales charges received by SSH were $1,355,794. A contingent deferred sales charge (“CDSC”) of 1.00% may be imposed on redemptions of $1 million or more made within one year of purchase. For the period ended December 31, 2008, CDSC fees paid to SSH were $152.
Certain Officers and Directors of the Company are “affiliated persons”, as that term is defined in the 1940 Act, of the Adviser or the Distributor. Each Director of the Company, who is not an affiliated person of | the Adviser or Distributor, receives a quarterly retainer of $1,500, $1,000 for each Board meeting attended, and $500 for each committee meeting attended plus reimbursement for certain travel and other out-of-pocket expenses incurred in connection with attending Board meetings. The Company does not compensate the Officers for the services they provide. There are no Directors’ fees paid to affiliated Directors of the Company. For the period ended December 31, 2008, the Fund was allocated $1,304 of the Chief Compliance Officer’s salary.
Note 4 – Concentration and Other Risks The Fund is non-diversified such that the Fund may invest a larger percentage of its assets in a given security than a diversified fund.
The Fund’s performance could be adversely affected by interest rate risk, which is the possibility that overall bond prices will decline because of rising interest rates. Interest rate risk is expected to be high for the Fund because it invests mainly in long-term bonds, whose prices are much more sensitive to interest fluctuations than are the prices of short-term bonds.
The Fund may be affected by credit risk, which is the possibility that the issuer of a bond will fail to pay interest and principal in a timely manner, or that negative perceptions of the issuer’s ability to make such payments will cause the price of that bond to decline. This risk may be greater to the extent that the Fund may invest in junk bonds.
The Fund may be affected by credit risk of lower grade securities, which is the possibility that municipal securities rated below investment grade, or unrated of similar quality, (frequently called “junk bonds”), may be subject to greater price fluctuations and risks of loss of income and principal than investment-grade municipal securities. Securities that are (or that have fallen) below |
| HIGH YIELD TAX FREE BOND FUND | 19 | |||
NOTES TO FINANCIAL STATEMENTS (CONT.) | DECEMBER | 31, 2008 |
| investment- grade have a greater risk that the issuers may not meet their debt obligations. These types of securities are generally considered speculative in relation to the issuer’s ongoing ability to make principal and interest payments. During periods of rising interest rates or economic downturn, the trading market for these securities may not be active and may reduce the Fund’s ability to sell these securities at an acceptable price. If the issuer of | securities is in default in payment of interest or principal, the Fund may lose its entire investment in those securities.
Other risks include income risk, liquidity risk, municipal project specific risk, municipal lease obligation risk, zero coupon securities risk, market risk, manager risk, taxability risk, state-specific risk and exchange traded funds risk. | |||||
Note 5 – Federal Income Taxes The tax character of distributions paid during the period ending December 31, 2008 were as follows: | ||||||
Tax Basis Distributions | ||||||
Ordinary Income | Tax Exempt Income | Net Long-Term Capital Gains | Total Distributions | |||||||
12/31/2008 | $89,797 | $702,988 | $0 | $792,785 |
Distribution classifications may differ from the Statement of Changes in Net Assets as a result of the treatment of short-term capital gains as ordinary income for tax purposes.
As of December 31, 2008, the components of accumulated distributable earnings for the Fund on a tax basis were as follows: |
of the Fund. As of and during the period ended December 31, 2008, the Fund did not have a liability for any unrecognized tax benefits. The Fund recognizes interest and
penalties, if any, related to unrecognized tax benefits as income tax expense in the Statement of Operations. During the period, the Fund did not incur any interest or penalties. The Fund’s taxable year 2008 remains subject to examination by the Internal Revenue Service. |
Capital Loss Carryforward | $ | (121,045 | ) |
Tax Information (Unaudited) For each item, it is the intention of the Fund to designate the maximum amount permitted under the Internal Revenue Code and the regulations thereunder. | ||||||
Deferred Post-October Losses | (62,241 | ) | ||||||||
Unrealized depreciation | (5,825,834 | ) | ||||||||
Total Distributable Earnings | $ | (6,009,120 | ) | |||||||
At December 31, 2008, the Fund had net capital loss carryforwards for federal income tax purposes of $121,045, which are available to reduce future required distributions of net capital gains to shareholders through 2016.
The Fund has adopted the provisions of FASB Interpretation No. 48 (“FIN 48”), Accounting for Uncertainty in Income Taxes. The implementation of FIN 48 resulted in no material liability for unrecognized tax benefits and no material change to the beginning NAV | Exempt Interest Dividends For the period ended December 31, 2008, in accordance with the Internal Revenue Code 852 (b)(5), the Fund qualifies to designate $702,988 as exempt-interest dividends. Shareholders may treat these distributions as excludable from gross income per Internal Revenue Code 103(a). |
| 20 | SPIRIT OF AMERICA | |||
REPORT OF INDEPENDENT REGISTERED PUBLIC ACCOUNTING FIRM | ||||||
To the Board of Directors
Spirit of America Investment Fund, Inc. and the Shareholders of
Spirit of America High Yield Tax Free Bond Fund
Syosset, New York
We have audited the accompanying statement of assets and liabilities of Spirit of America High Yield Tax Free Bond Fund (“Fund”), a series of shares of beneficial interest in Spirit of America Investment Fund, Inc., including the schedule of investments as of December 31, 2008, and the related statement of operations, the statement of changes in net assets, and the financial highlights for the period from February 29, 2008 (commencement of operations) to December 31, 2008. These financial statements and financial highlights are the responsibility of the Fund’s management. Our responsibility is to express an opinion on those financial statements and financial highlights based on our audit.
We conducted our audit in accordance with the standards of the Public Company Accounting Oversight Board (United States). Those standards require that we plan and perform the audit to obtain reasonable assurance about whether the financial statements and financial highlights are free of material misstatement. The Fund is not required to have, nor were we engaged to perform, an audit of the Fund’s internal control over financial reporting. Our audit included consideration of internal control over financial reporting as a basis for designing | audit procedures that are appropriate in the circumstances, but not for the purpose of expressing an opinion on the effectiveness of its internal control over financial reporting. Accordingly, we express no such opinion. An audit also includes examining, on a test basis, evidence supporting the amounts and disclosures in the financial statements, assessing the accounting principles used and significant estimates made by management, as well as evaluating the overall financial statement presentation. Our procedures included confirmation of securities owned as of December 31, 2008, by correspondence with custodian and brokers. We believe that our audit provides a reasonable basis for our opinion.
In our opinion, the financial statements and financial highlights referred to above present fairly, in all material respects, the financial position of Spirit of America High Yield Tax Free Bond Fund as of December 31, 2008, the results of its operations, the changes in its net assets and the financial highlights for the period February 29, 2008 (commencement of operations) to December 31, 2008 in conformity with accounting principles generally accepted in the United States of America.
TAIT, WELLER & BAKER LLP
Philadelphia, Pennsylvania February 23, 2009 |
HIGH YIELD TAX FREE BOND FUND | 21 | |||
| APPROVAL OF THE INVESTMENT ADVISORY AGREEMENT | DECEMBER | 31, 2008 |
| Approval of the Investment Advisory Agreement (Unaudited) |
The Investment Company Act of 1940, as amended (the “1940 Act”), requires that the continuance of a registered management investment company’s investment advisory agreement be approved annually by both the board of directors and also by a majority of its directors who are not parties to the investment advisory agreement or “interested persons” (as defined by the 1940 Act) of any such party (the “Independent Directors”). On November 12, 2008, the Board of Directors (the “Board” or “Directors”) of Spirit of America Investment Fund, Inc. (the “Company”) met in person (the “Meeting”) to, among other things, review and consider the approval of the Investment Advisory Agreement (the “Advisory Agreement”) by and between Spirit of America Management Corp. (the “Adviser”) and the Company, on behalf of Spirit of America Real Estate Income and Growth Fund, Spirit of America Large Cap Value Fund and Spirit of America High Yield Tax Free Bond Fund (collectively, the “Funds”). At the Meeting, the Board, including the Independent Directors, voting separately, approved the Advisory Agreement after determining that the Adviser’s compensation, pursuant to the terms of the Advisory Agreement, would be fair and reasonable and concluded that the approval of the Advisory Agreement would be in the best interest of the Income Fund’s shareholders. The Board’s approval was based on consideration and evaluation of the information and material provided to the Board and a variety of specific factors discussed at the Meeting and at prior meetings of the Board, including the factors described below.
As part of the approval process and oversight of the advisory relationship, counsel to the Independent Directors (“Independent Counsel”) sent an information request letter to the Adviser seeking certain relevant | information and the Directors received, for their review in advance of the Meeting, the Adviser’s responses. In addition, the Directors were provided with the opportunity to request any additional materials. In advance of the Meeting, the Board, including the Independent Directors, requested and received materials provided by the Adviser and Independent Counsel, including, among other things, the following: (i) information on the investment performance of the Funds and relevant indices over various time periods; (ii) sales and redemption data with respect to the Funds; (iii) the general investment outlook in the markets in which the Funds invest; (iv) arrangements with respect to the distribution of the Funds’ shares; (v) the procedures employed to determine the value of each Fund’s assets; (vi) the allocation of the Funds’ brokerage, the record of compliance with the Funds’ investment policies and restrictions and with the Funds’ Code of Ethics and the structure and responsibilities of the Adviser’s compliance departments; (vii) the profitability of the Funds’ investment advisory business to the Adviser taking into account both advisory fees and any other potential direct or indirect benefits; (viii) information comparing the overall fees and specifically the fees under the Investment Advisory Agreement with the fees paid by other similar mutual funds; (ix) the Form ADV of the Adviser; and (x) information comparing the performance of the Funds with the performance of other similar mutual funds; and (xi) a memorandum from Independent Counsel regarding the responsibilities of the Board related to the approval of the Advisory Agreement.
In evaluating the Advisory Agreement, the Board, including the Independent Directors, requested, reviewed and considered materials furnished by the Adviser and questioned personnel of the Adviser, including the Funds’ |
| 22 | SPIRIT OF AMERICA | |||
| APPROVAL OF THE INVESTMENT ADVISORY AGREEMENT (CONT.) | DECEMBER | 31, 2008 |
portfolio managers, regarding, among other things, the personnel, operations and financial condition of the Adviser. Among other information, the Board, including the Independent Directors, requested and was provided information regarding:
• The investment performance of each Fund over various time periods both by itself and in relation to relevant indices;
• The fees charged by the Adviser for investment advisory services, as well as other compensation received by the Adviser and its affiliates;
• The waivers of fees and reimbursements of expenses at times by the Adviser under the Operating Expenses Agreement;
• The investment performance, fees and total expenses of mutual funds with similar objectives and strategies managed by other investment advisers;
• The investment management staffing and the experience of the investment advisory, administrative and other personnel providing services to the Funds and the historical quality of the services provided by the Adviser; and
• The profitability to the Adviser of managing and its affiliate distributing the Funds and the methodology in allocating expenses to the management of the Funds. | At the Meeting, Independent Counsel referred the Directors to the “Gartenberg Memorandum” which had been distributed to each Director in advance of the Meeting, outlining the legal standards applicable to the Independent Directors under the 1940 Act with respect to the approval of the continuation of investment advisory agreements. In addition, the Independent Directors were provided with the opportunity to meet with Independent Counsel, in executive session, outside the presence of Company management and participate in a question and answer session with the Adviser.
The following is a summary of the Board’s discussion and views regarding the factors it considered in evaluating the continuation of the Investment Advisory Agreement:
1. Nature, Extent, and Quality of Services.
The Board, including the Independent Directors, considered the nature, quality and extent of advisory, administrative and shareholder services performed by the Adviser, including: regulatory filings and disclosure to shareholders, general oversight of the service providers, coordination of Fund marketing initiatives, review of Fund legal issues, assisting the Board, including the Independent Directors, in their capacity as directors and other services. The Board, including the Independent Directors, noted the increased responsibilities of the Adviser in response to an |
| HIGH YIELD TAX FREE BOND FUND | 23 | |||
| APPROVAL OF THE INVESTMENT ADVISORY AGREEMENT (CONT.) | DECEMBER 31, 2008 |
increasingly regulated industry. The Board, including the Independent Directors, concluded that the services are extensive in nature, that the Adviser delivered a high level of service to each Fund and that the Adviser is positioned to continue providing such quality of service in the future.
2. Investment Performance of the Funds and the Adviser.
The Board, including the Independent Directors, considered short-term and long-term investment performance for the Funds over various periods of time as compared to both relevant indices and the performance of such Funds’ peer groups, and concluded that each Fund was delivering reasonable performance results, especially over the long-term, consistent with the investment strategies that the Funds pursue.
3. Costs of Services and Profits Realized by the Adviser.
a. The Board, including the Independent Directors, considered the information provided by Lipper Inc. regarding each Fund’s management fee rate and overall expense ratio relative to industry averages for the Fund’s peer group category and the advisory fees charged by the Adviser to other accounts. The Board viewed favorably the current and historic willingness of the Adviser to limit the overall expense ratios of the Funds. Recognizing that the fees paid by the Funds were higher than the medians in their peer groups, the Board nonetheless noted that the fees were still close to the median and that several peer funds had higher fees.
b. Profitability and Costs of Services to the Adviser. The Board, including the Independent Directors, considered estimates of the Adviser’s profitability and costs attributable to the Funds. The Board recognized that | increased fixed costs, particularly legal and audit fees in response to increasing regulations, have a greater impact on smaller fund families, such as the Funds, than on larger fund complexes. Given this, the Board recognized that the Funds’ overall expenses compare unfavorably to some funds identified as peers. The Board also considered whether the amount of the Adviser’s profit is a fair profit for the management of the Funds and noted that the Adviser has devoted a large amount of its resources into the Funds over the years. The Board, including the Independent Directors, concluded that the Adviser’s profitability was at a fair and acceptable level, particularly in light of the quality of the services being provided to the Funds, and bore a reasonable relationship to the services rendered.
4. Extent of Economies of Scale as the Funds Grow.
The Board, including the Independent Directors, considered whether there have been economies of scale with respect to the management of the Funds and whether the Funds have appropriately benefited from any economies of scale. Given the size of each Fund, the Board did not believe that significant (if any) economies of scale have been achieved.
5. Whether Fee Levels Reflect Economies of Scale.
The Board took into consideration that the Adviser does not currently offer breakpoints in its fees that would otherwise allow investors to benefit directly from economies of scale in the form of lower fees as fund assets grow. However, the Board, including the Independent Directors, did consider enhancements in personnel and services provided to the Funds by the Adviser, without an increase in fees. The Board also noted that |
| 24 | SPIRIT OF AMERICA | |||
APPROVAL OF THE INVESTMENT ADVISORY AGREEMENT (CONT.) | DECEMBER 31, 2008 |
few of the Funds’ peers offered breakpoints despite having significantly more assets under management.
6. Other Relevant Considerations.
a. Personnel and Methods. The Board, including the Independent Directors, reviewed the Adviser’s Form ADV and questioned the Adviser regarding the size, education and experience of the staff of the Adviser, its fundamental research capabilities, approach to recruiting, training and retaining portfolio managers and other research and management personnel, and concluded that these enable them to provide a high level of service to the Funds. The Board also considered the history, reputation, qualifications and background of the Adviser as well as the qualifications if its personnel.
b. The Board, including the Independent Directors, also considered the character and amount of other direct and incidental benefits received by the Adviser and its affiliates from their association with the Funds, including the benefits received by the affiliated distributor. The Board concluded that potential “fall-out” benefits that the Adviser and its affiliates may receive, such as greater name recognition or increased ability to obtain research services (although the Board noted that the Adviser currently does not use soft dollars to obtain research services), appear to be reasonable, and may in some cases benefit the Funds. | Conclusions. In considering the renewal of the Investment Advisory Agreement, the Board, including the Independent Directors, did not identify any factor as all-important or all-controlling and instead considered the above listed and other factors collectively in light of the Funds’ surrounding circumstances. Each Director gave the weight to each factor that he deemed appropriate in his own judgment. The Board considered the renewal of the Investment Advisory Agreement on a Fund-by-Fund basis and determined that the renewal of the Investment Advisory Agreement was in the best interests of the shareholders of each Fund. The Board also determined that the fees charged to each Fund for the services provided were reasonable. Therefore, the Board, including the Independent Directors, determined that continuance of the Investment Advisory Agreement was in the best interests of each Fund. |
| HIGH YIELD TAX FREE BOND FUND | 25 | |||
MANAGEMENT OF THE COMPANY (UNAUDITED)
Information pertaining to the Directors and Officers of the Company is set forth below. The Statement of Additional Information includes additional information about the Directors and is available without charge, upon request, by calling 516-390-5565.
Name, Address and (Age) Position(s) with the Company | Term of Office1 of Time Served | Principal Occupation(s) During Past Five Years | Number of Portfolios in Fund Complex Overseen by Director | Other Directorships Held by Director | ||||
INTERESTED DIRECTORS | ||||||||
David Lerner2 (72) 477 Jericho Turnpike Syosset, New York 11791 Director, Chairman of the Board, President | Since 1998 | President and founder, David Lerner Associates, Inc., a registered broker-dealer; President, Spirit of America Management Corp., the Company’s investment adviser; and Chief Executive Officer and President of SSH Securities, Inc., the Company’s Distributor. | 4 | Director of Spirit of America Management Corp., the Company’s investment adviser; Director of David Lerner Associates, Inc., a registered broker-dealer and the Company’s Distributor. | ||||
Daniel Lerner2 (47) 477 Jericho Turnpike Syosset, New York 11791 Director | Since 1998 | Senior Vice President, Investment Counselor with David Lerner Associates, Inc., a registered broker-dealer, since September 2000. Previously: Broker with Prudential Securities from February 2000 to July 2000; Broker with Bear Stearns from January 1999 to May 1999; Vice President of SSH Securities, Inc., the Company’s Distributor and Senior Vice President. | 4 | Director of David Lerner Associates, Inc., a registered broker-dealer and the Company’s Distributor. | ||||
INDEPENDENT DIRECTORS | ||||||||
Allen Kaufman (72) c/o 477 Jericho Turnpike Syosset, New York 11791 Director | Since 1998 | President and Chief Executive Officer of K.G.K. Agency, Inc., a property and casualty insurance agency, since 1963. | 4 | Director of K.G.K. Agency, Inc., a property and casualty insurance agency. | ||||
Stanley S. Thune (72) c/o 477 Jericho Turnpike Syosset, New York 11791 Director | Since 1998 | President and Chief Executive Officer, Freight Management Systems, Inc., a third party logistics management company, since 1994; private investor. | 4 | Director of Freight Management Systems, Inc. | ||||
Richard Weinberger (72) c/o 477 Jericho Turnpike Syosset, New York 11791 Director | Since 2005 | Of Counsel to Ballon Stoll Bader & Nadler, P.C., a mid-sized law firm, since January 2005; Shareholder, Ballon Stoll Bader & Nadler, P.C., January 2000 to December 2004. | 4 | None. | ||||
OFFICERS | ||||||||
David Lerner President (see biography above) | ||||||||
Alan P. Chodosh (55) 477 Jericho Turnpike Syosset, New York 11791 Treasurer and Secretary | Since 2003 (Treasurer) Since 2005 (Secretary) | Executive Vice President and Chief Financial Officer of David Lerner Associates, Inc. since June 1997. | N/A | N/A | ||||
Joseph Pickard (48) 477 Jericho Turnpike Syosset, New York 11791 Chief Compliance Officer | Since 2007 | Chief Compliance Officer of Spirit of America Investment Fund, Inc. and Spirit of America Management Corp. since July 2007; Counsel to the Interested Directors of Spirit of America Investment Fund, Inc. since July 2002; General Counsel of David Lerner Associates, Inc. since July 2002. | N/A | N/A | ||||
| 1 | Each Director serves for an indefinite term, until his successor is elected. |
| 2 | David Lerner is an “interested” Director, as defined in the 1940 Act, by reason of his positions with the Adviser and Distributor, and Daniel Lerner is an “interested” Director by reason of his position with the Distributor. Daniel Lerner is the son of David Lerner. |
| 26 | SPIRIT OF AMERICA | |||


MESSAGE TO OUR SHAREHOLDERS
Dear Shareholder,
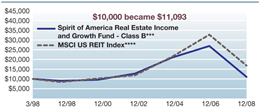
We are very pleased to present you with the annual report for the Spirit of America Real Estate Income and Growth Fund (the “Fund”). There is no question that 2008 was fraught with challenges. Nonetheless, we view the current REIT landscape as providing numerous opportunities, and are therefore optimistic about prospects for a successful 2009.
Throughout 2008, declines in single family housing values continued to grab national headlines. Although we remain of the view that there is limited correlation between residential real estate fundamentals and those of the commercial real estate investment trusts (REITs) in which the Fund invests, negative investor sentiment toward real estate in general has undoubtedly pressured REIT share prices. Perhaps more importantly, the rapid deterioration of credit markets caused shares of REITs with near term debt maturities to be disproportionately impacted.
Although REITs, as measured by the MSCI US REIT Index (RMS), ended 2008 in
negative territory, in our opinion, the recent stock market dislocation has led to a tremendous opportunity for the Fund to invest in REIT shares at very attractive prices. According to our analysis, the decline in the industry stock valuation, coupled with relatively firm property values, has caused some REIT shares to trade at a significant discount to estimates of the underlying real estate value.
Our investment philosophy continues to be to seek value in the bricks and mortar of America through real estate investment trusts that own office buildings, shopping malls, hotels, apartments, and other commercial properties. We are very optimistic about the performance of recent investments made by the Fund, and look forward to 2009.
We are grateful for your support, and look forward to your continued investment in the Spirit of America Real Estate Income and Growth Fund.
Sincerely,
 |
David Lerner President |

 |
Raymond Mathis Portfolio Manager |

Any investment in equity securities is subject to risk and market values may fluctuate with economic conditions, interest rates, civil unrest, natural disasters and other factors. As with any mutual fund, an investor’s shares, when redeemed, may be worth more or less than their original cost. Past performance is no guarantee of future results.
Prospective investors should consider the investment objective, risks and charges and expenses of the Fund carefully before investing. The maximum sales charge on share purchases is 5.25% of the offering price. The Fund’s prospectus contains this and other information about the Fund and may be obtained through your broker or by calling 1-800-452-4892. The prospectus should be read carefully before investing.
| REAL ESTATE INCOME AND GROWTH FUND | 1 | |||
| MANAGEMENT DISCUSSION | ||||||
Economic Summary Nominal GDP was positive in the first half of 2008, driven largely by increased export volumes. However, we noted that growth had not managed to outpace inflation, which was surging. By the third quarter of 2008, rising prices finally tipped the economy into recession as GDP registered -0.5%. With personal saving rate running well below historical averages, credit markets could not withstand this stress. Several major financial institutions, including banks, government sponsored enterprises, and investment banks, were forced into receivership, or bankruptcy. Preliminary readings indicate fourth quarter 2008 GDP declined at a 3.8% annual rate. Home building, auto manufacturers, and several industries within the financial sector continued to weigh on economic growth, joined by lower exports.
Market Summary Equity market volatility remained at elevated levels throughout 2008, culminating in a all-time high reading of 89.53 on the Volatility Index in October. Contributing to the volatility was the sharp decline in financial sector stock as banks, brokerages, and mortgage companies continued the process of writing down of sub-prime mortgages and related derivative securities. This weakness in mortgage related securities spilled over into the insurance industry, and has impacted the government chartered Fannie Mae and Freddie Mac. As a result, the financial sector was the worst performer in 2008, providing a negative return of nearly 57%. |
REIT Summary Despite the fact that equity REITs have little or no exposure to the subprime mortgage situation which engulfed the financial sector, REITs were not immune from the financial sector’s decline. In 2008, REITs, as measured by the RMS, posted a total return of -37.97%, underperforming the S&P 500 Index. Real estate is a credit sensitive industry, and many of the publicly traded REITs in the RMS rely on mortgages or bonds as a source of capital. We believe investors’ concerns over the availability of credit, may have contributed to the underperformance of REIT shares.
Fund Summary The Fund also declined with the financial sector and REIT stocks. The management team attempted to mitigate losses related to the downturn in the financial sector through defensive positioning. The Fund held no homebuilding stocks in the fiscal year. Relative to a market capitalization weighted basket of all REIT stocks, the Fund was overweight healthcare REITs, triple-net-lease REITs, and diversified REITs in the first half of the year, which management believes to be less sensitive to short-term economic fluctuations. In the second half of 2008, the Fund increased its cash position as an additional defensive measure.
Comparitive Returns The Fund returned -48.46% for the year ended December 31, 2008. This compares to -37.97% for the RMS. The sales load adjusted returns for the year were -51.18% for the Class A shares, and –51.74% for the Class B shares. |
| 2 | SPIRIT OF AMERICA | |||
MANAGEMENT DISCUSSION (CONT.)
Summary of Portfolio Holdings (Unaudited) The Securities and Exchange Commission (“SEC”) has adopted a requirement that all Funds present their categories of portfolio holdings in a table, chart or graph format in their annual and semi-annual shareholder reports, whether or not a schedule of investments is utilized. The following table, which presents portfolio holdings as a percentage of total market value, is provided in compliance with such requirement. |
Spirit of America
Real Estate Income and Growth Fund
| December 31, 2008 | ||||||||
Apartments (REITs)
| 21.03
| %
| $
| 22,804,037
| ||||
Office Space (REITs)
| 12.27
|
|
| 13,311,325
| ||||
Shopping Centers (REITs)
| 11.99
|
|
| 13,001,775
| ||||
Storage (REITs)
| 8.65
|
|
| 9,386,480
| ||||
Health Care (REITs)
| 8.60
|
|
| 9,324,301
| ||||
Diversified (REITs)
| 8.23
|
|
| 8,925,377
| ||||
Mortgage (REITs)
| 8.18
|
|
| 8,870,600
| ||||
Regional Malls (REITs)
| 7.28
|
|
| 7,892,444
| ||||
Hotels (REITs)
| 6.55
|
|
| 7,100,714
| ||||
Industrial (REITs)
| 3.85
|
|
| 4,178,144
| ||||
Net Lease (REITs)
| 3.37
|
|
| 3,660,551
| ||||
Total Investments
| 100.00
| %
| $
| 108,455,748
| ||||
| REAL ESTATE INCOME AND GROWTH FUND | 3 | |||
ILLUSTRATION OF INVESTMENT (UNAUDITED)
| The graphs shown compare the increase in value of a $10,000 investment in the Spirit of America Real Estate Income and Growth Fund – Class A and Class B with the performance of the MSCI US REIT Index. The values and returns for the Spirit of America Real Estate Income and Growth Fund – Class A include reinvested distributions, and the impact of the maximum sales charge of 5.25% placed on purchases. The values and returns for the Spirit of America Real Estate Income and Growth Fund - Class B include reinvested distributions, and the impact of the contingent deferred sales charge at redemption. The returns shown do not reflect taxes that a shareholder would pay on Fund distributions or on the redemption of Fund shares. | Class A Shares Growth of $10,000 (includes one-time 5.25% maximum sales charge and reinvestment of all distributions)
** The MSCI US REIT Index benchmark is based on a start date of December 31, 1997. |

Average Annual Total Returns | Class B Shares Growth of $10,000 (includes a contingent deferred sales charge at the time of redemption of 5.75%)
****The MSCI US REIT Index benchmark is based on a start date of February 28, 1998. | |||||||||
| For the Periods Ended December 31, 2008 | ||||||||||
Class A Shares |
Class B Shares | |||||||||
1 Year (with sales charge) |
(51.18%)a |
(51.53%)b | ||||||||
1 Year (without sales charge) |
(48.46%) |
(48.80%) | ||||||||
5 Years (with sales charge) |
(8.57%)a |
(8.48%)b | ||||||||
5 Years (without sales charge) |
(7.58%)
|
(8.22%)
| ||||||||
Since Inception
| .80%a
| .96% b
| ||||||||
Past performance is not indicative of future results. a Reflects a 5.25% front-end sales charge. b Reflects a contingent deferred sales charge of 5.75%. c Inception dates: January 9, 1998 and March 6, 1998 for Class A & B, respectively. | ||||||||||||
The Morgan Stanley Capital International (“MSCI”) US REIT Index is an unmanaged index. The MSCI US REIT Index is a free float-adjusted market capitalization weighted index that is comprised of equity Real Estate Investment Trusts (“REITs”) that are included in the MSCI US Investable Market 2500 Index, with the exception of specialty equity REITs that do not generate a majority of their revenue and income from real estate rental and leasing operations. The index represents approximately 85% of the US REIT universe. The performance of an index assumes no transaction costs, taxes, management fees or other expenses. A direct investment in an index is not possible.
| 4 | SPIRIT OF AMERICA | |||
DISCLOSURE OF FUND EXPENSES (UNAUDITED)
FOR THE SIX MONTH PERIOD JULY 1, 2008 TO DECEMBER 31, 2008
| ||||||
| We believe it is important for you to understand the impact of fees regarding your investment. All mutual funds have operating expenses. As a shareholder of the Fund, you incur ongoing costs, which include costs for portfolio management, administrative services, and shareholder reports (like this one), among others. Operating expenses, which are deducted from the Fund’s gross income, directly reduce the investment return of the Fund. | The Fund’s expenses are expressed as a percentage of its average net assets. This figure is known as the expense ratio. The following examples are intended to help you understand the ongoing fees (in dollars) of investing in your Fund and to compare these costs with those of other mutual funds. The examples are based on an investment of $1,000 made at the beginning of the period shown and held for the entire period. | |||||
Spirit of America Real Estate Income and Growth Fund
| Beginning Account Value 7/1/08 | Ending Account Value 12/31/08 | Expense Ratio(1) | Expenses Paid During Period(2) | |||||||
Actual Fund Return | ||||||||||
Class A | $1,000.00 | $ 553.20 | 1.99% | $ 7.77 | ||||||
Class B | $1,000.00 | $ 551.90 | 2.68% | $10.45 | ||||||
Hypothetical 5% Return | ||||||||||
Class A | $1,000.00 | $1,015.13 | 1.99% | $10.08 | ||||||
Class B | $1,000.00 | $1,011.66 | 2.68% | $13.55 | ||||||
This table illustrates your Fund’s costs in two ways:
Actual Fund Return: This section helps you to estimate the actual expenses that you paid over the period. The “Ending Account Value” shown is derived from the Fund’s actual return, the third column shows the period’s annualized expense ratio, and the last column shows the dollar amount that would have been paid by an investor who started with $1,000 in the Fund at the beginning of the period. You may use the information here, together with your account value, to estimate the expenses that you paid over the period.
To do so, simply divide your account value by $1,000 (for example, an $8,600 account value divided by $1,000 = 8.6), then multiply the result by the number in the first line under the heading entitled “Expenses Paid During Period.” | Hypothetical 5% Return: This section is intended to help you compare your Fund’s costs with those of other mutual funds. It assumes that the Fund had a return of 5% before expenses during the period shown, but that the expense ratio is unchanged. In this case, because the return used is not the Fund’s actual return, the results do not apply to your investment. You can assess your Fund’s costs by comparing this hypothetical example with the hypothetical examples that appear in shareholder reports of other funds.
Please note that the expenses shown in the table are meant to highlight your ongoing costs only and do not reflect any transactional costs such as sales charges (loads), or redemption fees.
(1) Annualized, based on the Fund’s most recent half- year expenses. (2) Expenses are equal to the Fund’s annualized expense ratio multiplied by the average account value over the period, multiplied by the number of days in the period, then divided by 366. |
| REAL ESTATE INCOME AND GROWTH FUND | 5 | |||
SCHEDULE OF INVESTMENTS | DECEMBER 31, 2008 |
| Shares | Market Value | |||||
Common Stocks 95.01% | ||||||
Apartments (REITs) 19.98% | ||||||
Apartment Investment & Management Co., Class A |
70,653 |
$ 816,039 | ||||
Associated Estates Realty Corp. | 100,000 | 913,000 | ||||
AvalonBay Communities, Inc. | 64,694 | 3,919,163 | ||||
Colonial Properties Trust | 119,587 | 996,160 | ||||
Equity Residential | 217,549 | 6,487,311 | ||||
Essex Property Trust, Inc. | 11,700 | 897,975 | ||||
Mid-America Apartment Communities, Inc. | 103,837 | 3,858,583 | ||||
Post Properties, Inc. | 35,000 | 577,500 | ||||
UDR, Inc. | 314,598 | 4,338,306 | ||||
22,804,037 | ||||||
Diversified (REITs) 7.82% | ||||||
Lexington Realty Trust |
401,777 |
2,008,885 | ||||
Liberty Property Trust | 25,000 | 570,750 | ||||
Vornado Realty Trust | 105,149 | 6,345,742 | ||||
8,925,377 | ||||||
Health Care (REITs) 8.17% | ||||||
Cogdell Spencer, Inc. |
22,950 |
214,812 | ||||
HCP, Inc. | 190,000 | 5,276,300 | ||||
Healthcare Realty Trust, Inc. | 84,994 | 1,995,659 | ||||
National Health Investors, Inc. | 50,200 | 1,376,986 | ||||
Senior Housing Properties Trust | 25,700 | 460,544 | ||||
9,324,301 | ||||||
Hotels (REITs) 6.22% | ||||||
Ashford Hospitality Trust, Inc. |
648,999 |
746,349 | ||||
FelCor Lodging Trust, Inc. | 1,234,684 | 2,271,818 | ||||
Host Hotels & Resorts, Inc. | 422,100 | 3,195,297 | ||||
LaSalle Hotel Properties | 35,000 | 386,750 | ||||
Strategic Hotels & Resorts, Inc. | 40,000 | 67,200 | ||||
Sunstone Hotel Investors, Inc. | 70,000 | 433,300 | ||||
7,100,714 | ||||||
Industrial (REITs) 3.66% | ||||||
First Industrial Realty Trust, Inc. |
61,284 |
462,694 | ||||
ProLogis | 267,491 | 3,715,450 | ||||
4,178,144 | ||||||
Mortgage (REITs) 7.77% | ||||||
Annaly Capital Management, Inc. |
558,954 |
8,870,600 | ||||
Net Lease (REITs) 3.21% | ||||||
National Retail Properties, Inc. |
140,224 |
2,410,451 | ||||
Realty Income Corp. | 54,000 | 1,250,100 | ||||
3,660,551 | ||||||
See accompanying notes to financial statements.
| 6 | SPIRIT OF AMERICA | |||
SCHEDULE OF INVESTMENTS (CONT.) | DECEMBER 31, 2008 |
| Shares | Market Value | |||
Office Space (REITs) 11.66% | ||||
BioMed Realty Trust, Inc. |
35,000 |
$ 410,200 | ||
Boston Properties, Inc. | 93,285 | 5,130,675 | ||
Brandywine Realty Trust | 35,547 | 274,067 | ||
Mack-Cali Realty Corp. | 176,090 | 4,314,205 | ||
SL Green Realty Corp. | 122,864 | 3,182,178 | ||
13,311,325 | ||||
Regional Malls (REITs) 6.91% | ||||
Glimcher Realty Trust |
254,002 |
713,746 | ||
Macerich Co. (The) | 77,000 | 1,398,320 | ||
Pennsylvania Real Estate Investment Trust | 40,000 | 298,000 | ||
Simon Property Group, Inc. | 103,188 | 5,482,378 | ||
7,892,444 | ||||
Shopping Centers (REITs) 11.39% | ||||
Equity One, Inc. |
156,500 |
2,770,050 | ||
Federal Realty Investment Trust | 41,000 | 2,545,280 | ||
Kimco Realty Corp. | 192,478 | 3,518,498 | ||
Tanger Factory Outlet Centers, Inc. | 22,300 | 838,926 | ||
Weingarten Realty Investors | 160,900 | 3,329,021 | ||
13,001,775 | ||||
Storage (REITs) 8.22% | ||||
Public Storage |
68,801 |
5,469,680 | ||
Sovran Self Storage, Inc. | 108,800 | 3,916,800 | ||
9,386,480 | ||||
Total Investments — 95.01% | ||||
(Cost $185,945,427*) | 108,455,748 | |||
Cash and Other Assets Net of Liabilities — 4.99% | 5,695,740 | |||
NET ASSETS — 100.00% |
$ 114,151,488 | |||
REITs - Real Estate Investment Trusts
| * | Aggregate cost for federal income tax purposes is $186,114,230, and net unrealized depreciation consists of: |
Gross unrealized appreciation | $ 5,678,404 | ||
Gross unrealized depreciation | (83,336,886 | ) | |
Net unrealized depreciation |
$(77,658,482 |
) |
| REAL ESTATE INCOME AND GROWTH FUND | 7 | |||
SCHEDULE OF ASSETS AND LIABILITIES | DECEMBER 31, 2008 |
ASSETS | ||||
Investments in securities at value (cost $185,945,427) (Note 1) |
$ |
108,455,748 |
| |
Cash | 4,141,823 | |||
Dividends and interest receivable | 1,667,885 | |||
Receivable for Fund shares sold | 493,766 | |||
Prepaid expenses | 20,913 | |||
TOTAL ASSETS |
|
114,780,135 |
| |
LIABILITIES | ||||
Payable for Fund shares redeemed |
|
410,564 |
| |
Payable for investment advisory fees | 85,001 | |||
Payable for distribution fees | 27,946 | |||
Payable for transfer agent fees | 32,319 | |||
Other accrued expenses | 72,817 | |||
TOTAL LIABILITIES |
|
628,647 |
| |
NET ASSETS |
$ |
114,151,488 |
| |
Class A Shares | ||||
Net assets applicable to 20,654,855 shares outstanding, $0.001 par value | $ | 111,160,484 | ||
Net asset value and redemption price per Class A Share | $ | 5.38 | ||
Maximum offering price per share ($5.38 ÷ 0.9475) |
$ |
5.68 |
| |
Class B Shares | ||||
Net assets applicable to 546,158 shares outstanding, $0.001 par value | $ | 2,991,004 | ||
Net asset value and redemption price per Class B Share | $ | 5.48 | ||
SOURCE OF NET ASSETS | ||||
At December 31, 2008, net assets consisted of: | ||||
Paid-in capital | $ | 208,825,623 | ||
Accumulated net realized loss on investments and written options | (17,184,456 | ) | ||
Net unrealized depreciation on investments | (77,489,679 | ) | ||
NET ASSETS |
$ |
114,151,488 |
| |
| (a) Redemption price varies based on length of time held. | ||||
See accompanying notes to financial statements.
| 8 | SPIRIT OF AMERICA | |||
STATEMENT OF OPERATIONS
For the Year Ended | ||
INVESTMENT INCOME | ||
Dividends |
$ 9,872,967 | |
Interest | 32,802 | |
TOTAL INVESTMENT INCOME |
9,905,769 | |
EXPENSES | ||
Investment Advisory fees (Note 3) |
1,882,519 | |
Distribution fees - Class A (Note 3) | 563,783 | |
Distribution fees - Class B (Note 3) | 61,464 | |
Accounting fees | 91,706 | |
Administration fees | 171,438 | |
Auditing fees | 18,700 | |
Chief Compliance Officer salary | 17,440 | |
Custodian fees | 44,485 | |
Directors’ fees | 31,438 | |
Insurance expense | 75,570 | |
Legal fees | 85,593 | |
Printing expense | 104,114 | |
Registration fees | 17,956 | |
Transfer Agent fees | 449,318 | |
Other expenses | 16,664 | |
TOTAL EXPENSES |
3,632,188 | |
NET INVESTMENT INCOME |
6,273,581 | |
REALIZED AND UNREALIZED GAIN (LOSS) ON INVESTMENTS AND WRITTEN OPTIONS | ||
Net realized loss from investment transactions and REITs |
(15,405,838) | |
Net realized gain from written options | 115,628 | |
Net change in unrealized appreciation/depreciation of investments | (97,720,992) | |
Net realized and unrealized loss on investments and written options |
(113,011,202) | |
NET DECREASE IN NET ASSETS RESULTING FROM | ||
OPERATIONS | $(106,737,621) |
See accompanying notes to financial statements.
| REAL ESTATE INCOME AND GROWTH FUND | 9 | |||
STATEMENTS OF CHANGES IN NET ASSETS
For the Year Ended | For the Two-Month Period Ended December 31, 2007* | For the Year Ended October 31, 2007 | ||||||||
OPERATIONS | ||||||||||
Net investment income |
$ 6,273,581 |
$ 1,511,952 |
$ 5,257,556 | |||||||
Net realized gain/(loss) from investment transactions, REITs and written options | (15,290,210) | 2,344,375 | 24,144,689 | |||||||
Net change in unrealized appreciation/depreciation of investments | (97,720,992) | (41,328,349) | (40,999,806) | |||||||
Net decrease in net assets |
(106,737,621) |
(37,472,022) |
(11,597,561) | |||||||
DISTRIBUTIONS TO SHAREHOLDERS | ||||||||||
Distributions from net investment income: | ||||||||||
Class A | (6,111,095) | (1,476,256) | (5,111,756) | |||||||
Class B | (162,486) | (35,696) | (145,800) | |||||||
Total distributions from net investment income |
(6,273,581) |
(1,511,952) |
(5,257,556) | |||||||
Distributions from realized gains: | ||||||||||
Class A | (1,845,096) | (16,747,820) | (13,485,130) | |||||||
Class B | (49,150) | (587,233) | (607,224) | |||||||
Total distributions from realized gains |
(1,894,246) |
(17,335,053) |
(14,092,354) | |||||||
Return of capital: | ||||||||||
Class A | (1,635,398) | (375,899) | — | |||||||
Class B | (43,564) | (13,180) | — | |||||||
Total distributions from return of capital to shareholders |
(1,678,962) |
(389,079) |
— | |||||||
Total distributions to shareholders |
(9,846,789) |
(19,236,084) |
(19,349,910) | |||||||
CAPITAL SHARE TRANSACTIONS (Dollar Activity) | ||||||||||
Shares sold: | ||||||||||
Class A | 31,547,671 | 7,390,446 | 69,674,987 | |||||||
Class B | 388,496 | 81,539 | 1,138,084 | |||||||
Shares issued from reinvestment of distributions: | ||||||||||
Class A | 7,863,601 | 15,569,965 | 15,183,168 | |||||||
Class B | 193,619 | 529,165 | 593,028 | |||||||
Shares redeemed: | ||||||||||
Class A | (30,778,953) | (6,317,655) | (39,128,325) | |||||||
Class B | (1,715,752) | (472,755) | (3,208,731) | |||||||
Increase in net assets derived from capital share transactions (a) | 7,498,682 | 16,780,705 | 44,252,211 | |||||||
Total increase (decrease) in net assets |
(109,085,728) |
(39,927,401) |
13,304,740 | |||||||
NET ASSETS | ||||||||||
Beginning of period |
223,237,216 |
263,164,617 |
249,859,877 | |||||||
End of period |
$ 114,151,488 |
$223,237,216 |
$263,164,617 | |||||||
| 10 | SPIRIT OF AMERICA | |||
STATEMENTS OF CHANGES IN NET ASSETS (CONT.)
For the Year Ended | For the Two-Month Period Ended December 31, 2007* | For the Year Ended | ||||
(a) Transactions in capital stock were: | ||||||
Shares sold: | ||||||
Class A | 3,503,493 | 574,293 | 4,454,157 | |||
Class B | 35,341 | 5,996 | 69,628 | |||
Shares issued from reinvestment of distributions: | ||||||
Class A | 1,317,200 | 1,330,766 | 988,434 | |||
Class B | 31,463 | 44,356 | 37,796 | |||
Shares redeemed: | ||||||
Class A | (3,223,581) | (439,434) | (2,502,325) | |||
Class B | (183,405) | (34,080) | (203,902) | |||
Increase in shares outstanding |
1,480,511 |
1,481,897 |
2,843,788 |
* The Fund’s fiscal year-end changed from October 31 to December 31, effective December 31, 2007.
See accompanying notes to financial statements.
| REAL ESTATE INCOME AND GROWTH FUND | 11 | |||
FINANCIAL HIGHLIGHTS
The table below sets forth financial data for one share of beneficial interest outstanding throughout the periods presented. | Class A For the Year Ended December 31, 2008 | Class A For the Two-Month | ||
Net Asset Value, Beginning of Period |
$ 11.31 |
$ 14.42 | ||
Income from Investment Operations: | ||||
Net investment income | 0.321 | 0.08 | ||
Net realized and unrealized gain (loss) on investments | (5.77) | (2.14) | ||
Total from investment operations | (5.45) | (2.06) | ||
Less Distributions: | ||||
Distributions from net investment income | (0.31) | (0.08) | ||
Distributions from capital gains | (0.09) | (0.95) | ||
Distributions from return of capital | (0.08) | (0.02) | ||
Total distributions
| (0.48)
| (1.05)
| ||
Net Asset Value, End of Period |
$ 5.38 |
$ 11.31 | ||
Total Return2 | (48.46)% | (14.53)%3 | ||
Ratios/Supplemental Data | ||||
Net assets, end of period (000) | $111,160 | $215,592 | ||
Ratio of expenses to average net assets: | ||||
Before expense reimbursement or recapture | 1.85% | 1.75%4 | ||
After expense reimbursement or recapture | 1.85% | 1.75%4 | ||
Ratio of net investment income to average net assets | 3.26% | 3.82%4 | ||
Portfolio turnover | 80.23% | 0.42%3 | ||
Class B For the Year Ended December 31, 2008 | Class B For the Two-Month | |||
Net Asset Value, Beginning of Period | $ 11.54 | $ 14.68 | ||
Income from Investment Operations: | ||||
Net investment income | 0.251 | 0.06 | ||
Net realized and unrealized gain (loss) on investments | (5.84) | (2.17) | ||
Total from investment operations | (5.59) | (2.11) | ||
Less Distributions: | ||||
Distributions from net investment income | (0.29) | (0.06) | ||
Distributions from capital gains | (0.10) | (0.95) | ||
Distributions from return of capital | (0.08) | (0.02) | ||
Total distributions
| (0.47)
| (1.03)
| ||
Net Asset Value, End of Period | $ 5.48 | $ 11.54 | ||
Total Return5 | (48.80)% | (14.64)%3 | ||
Ratios/Supplemental Data | ||||
Net assets, end of period (000) | $ 2,991 | $ 7,645 | ||
Ratio of expenses to average net assets: | ||||
Before expense reimbursement or recapture | 2.54% | 2.45%4 | ||
After expense reimbursement or recapture | 2.54% | 2.45%4 | ||
Ratio of net investment income to average net assets | 2.46% | 3.12%4 | ||
Portfolio turnover | 80.23% | 0.42%3 | ||
1 Calculated based on the average number of shares outstanding during the period. 2 Calculation does not reflect sales load. 3 Calculation is not annualized. 4 Calculation is annualized. 5 Calculation does not reflect CDSC charges. * The Fund’s fiscal year-end changed from October 31 to December 31, effective December 31, 2007. | ||||
See accompanying notes to financial statements.
| 12 | SPIRIT OF AMERICA | |||
FINANCIAL HIGHLIGHTS (CONT.)
Class A For the Year Ended October 31, 2007
| Class A For the Year Ended October 31, 2006
| Class A For the Year Ended October 31, 2005
| Class A For the Year Ended October 31, 2004
| |||
$ 16.22
| $ 13.47
| $ 12.90
| $ 10.93
| |||
| 0.32 | 0.23 | 0.22 | 0.20 | |||
| (0.94) | 3.16 | 1.00 | 2.37 | |||
(0.62)
| 3.39
| 1.22
| 2.57
| |||
| (0.32) | (0.23) | (0.22) | (0.20) | |||
| (0.86) | (0.41) | (0.35) | (0.27) | |||
| — | — | (0.08) | (0.13) | |||
(1.18)
| (0.64)
| (0.65)
| (0.60)
| |||
| $ 14.42 | $ 16.22 | $ 13.47 | $ 12.90 | |||
| (4.09)% | 25.86% | 9.59% | 24.02% |
| $253,674 | $237,612 | $192,751 | $178,104 | |||
| 1.68% | 1.71% | 1.71% | 1.77% | |||
| 1.68% | 1.71% | 1.71% | 1.83% | |||
| 2.04% | 1.40% | 1.67% | 1.69% | |||
| 4.20% | 3.10% | 1.02% | 4.17% | |||
Class B ��For the Year Ended October 31, 2007 | Class B For the Year Ended October 31, 2006 | Class B For the Year Ended October 31, 2005 | Class B For the Year Ended October 31, 2004 | |||
$ 16.49
| $ 13.69
| $ 13.11
| $ 11.11
| |||
| 0.21 | 0.13 | 0.15 | 0.12 | |||
| (0.95) | 3.21 | 1.01 | 2.40 | |||
(0.74)
| 3.34
| 1.16
| 2.52
| |||
| (0.21) | (0.13) | (0.15) | (0.12) | |||
| (0.86) | (0.41) | (0.35) | (0.27) | |||
| - | - | (0.08) | (0.13) | |||
(1.07)
| (0.54)
| (0.58)
| (0.52)
| |||
| $ 14.68 | $ 16.49 | $ 13.69 | $ 13.11 | |||
| (4.78)% | 25.02% | 8.83% | 23.13% | |||
| $ 9,491 | $ 12,248 | $ 11,597 | $ 12,592 | |||
| 2.38% | 2.41% | 2.41% | 2.47% | |||
| 2.38% | 2.41% | 2.41% | 2.53% | |||
| 1.34% | 0.70% | 0.97% | 0.99% | |||
| 4.20% | 3.10% | 1.02% | 4.17% | |||
See accompanying notes to financial statements.
| REAL ESTATE INCOME AND GROWTH FUND | 13 | |||
NOTES TO FINANCIAL STATEMENTS | DECEMBER 31, 2008 |
Note 1 - Significant Accounting Policies Spirit of America Real Estate Income and Growth Fund (the “Fund”), a series of the Spirit of America Investment Fund, Inc. (the “Company”), is an open-end diversified mutual fund registered under the Investment Company Act of 1940, as amended (the “1940 Act”). The Company was incorporated under the laws of Maryland on May 15, 1997. The Fund commenced operations on January 9, 1998.
The Fund changed its fiscal year-end from October 31 to December 31, effective beginning with the period ended December 31, 2007.
The Fund seeks current income and growth of capital by investing in equity real estate investment trusts (“REITs”) and the equity securities of real estate industry companies.
The Fund offers two classes of shares (Class A Shares and Class B Shares). Each class of shares has equal rights as to earnings and assets except that each class bears different distribution expenses. Each class of shares has exclusive voting rights with respect to matters that affect just that class. Income, expenses (other than expenses attributable to a specific class), and realized and unrealized gains and losses on investments are allocated to each class of shares based on its relative net assets.
The following is a summary of significant accounting policies consistently followed by the Fund in the preparation of its financial statements. The policies are in conformity with accounting principles generally accepted in the United States of America for investment companies.
A. Security Valuation: The offering price and net asset value (“NAV”) per share of each class of the Fund are calculated as of the close of regular trading on the New York Stock Exchange (“NYSE”), currently 4:00 p.m., Eastern Time on each day the NYSE is open | for trading. The Fund’s securities are valued at the official close or the last reported sales price on the principal exchange on which the security trades, or if no sales price is reported, the mean of the latest bid and asked prices is used. Securities traded over-the-counter are priced at the mean of the latest bid and asked prices. Short-term investments having maturities of 60 days or less are valued at amortized cost, which the Board of Directors (the “Board”) believes represents fair value. Fund securities for which market quotations are not readily available are valued at fair value as determined in good faith under procedures established by and under the supervision of the Board.
In September 2006, the Financial Accounting Standards Board (“FASB”) issued Statement of Financial Accounting Standards No. 157, “Fair Value Measurements” (“FAS 157”), which is effective for fiscal years beginning after November 15, 2007. FAS 157 clarifies the definition of fair value for financial reporting, establishes a framework for measuring fair value and requires additional disclosures about the use of fair value measurements. The Fund adopted FAS 157 as of January 1, 2008. The three levels of the fair value hierarchy under FAS 157 are described below:
| |||||||||||
| • | Level 1 | – | quoted prices in active markets for identical securities
| |||||||||
| • | Level 2 | – | other significant observable inputs (including quoted prices for similar securities, interest rates, prepayment speeds, credit risk, etc.)
| |||||||||
| • | Level 3 | – | significant unobservable inputs (including the Fund’s own assumptions in determining the fair value of investments) | |||||||||
The inputs or methodology used for valuing securities are not necessarily an indication of the risk associated with investing in those securities. | ||||||||||||
| 14 | SPIRIT OF AMERICA | |||
NOTES TO FINANCIAL STATEMENTS (CONT.) | DECEMBER 31, 2008 |
The summary of inputs used to value the Fund’s net assets as of December 31, 2008 is as follows:
| Real Estate Income and Growth Fund | |||||
Valuation Inputs | |||||
| Level 1 - Quoted Prices | $ | 108,455,748 | |||
| Level 2 - Other Significant Observable Inputs | — | ||||
| Level 3 - Significant Unobservable Inputs | — | ||||
Total Market Value of Investments | $ | 108,455,748 | |||
B. Investment Income and Securities Transactions: Security transactions are accounted for on the date the securities are purchased or sold (trade date). Cost is determined and gains and losses are based on the identified cost basis for both financial statement and federal income tax purposes. Dividend income and distributions to shareholders are reported on the ex-dividend date. Interest income and expenses are accrued daily.
C. Option Contracts: An option contract gives the buyer the right, but not the obligation, to buy (call) or sell (put) an underlying item at a fixed exercise price on a certain date or during a specified period. The cost of securities acquired through the exercise of a call option is increased by the premiums paid. The proceeds from securities sold through the exercise of a purchased put option are decreased by the premiums paid. Investments in options contracts requires the Fund to fair value or mark-to market the options on a daily basis, which reflects the change in the market value of the contracts at the close of each day’s trading. The cost of options that expire | unexercised are treated by the Fund, on expiration date, as realized losses on investments.
When the Fund writes an option, an amount equal to the premium received by the Fund is recorded as a liability and is subsequently adjusted to the current fair value of the option written. Premiums received from writing options that expire unexercised are treated by the Fund, on the expiration date, as realized gains from investments. The difference between the premium and the amount paid on effecting a closing purchase transaction, including brokerage commissions, is also treated as a realized gain, or, if the premium is less than the amount paid for the closing purchase transaction, as a realized loss. If a call option is exercised, the premium is added to the proceeds from the sale of the underlying security in determining whether the Fund has a realized gain or loss. If a put option is exercised, the premium reduces the cost basis of the securities purchased by the Fund. The Fund, as writer of an option, bears the market risk of an unfavorable change in the price of the security underlying the written option. |
| REAL ESTATE INCOME AND GROWTH FUND | 15 | |||
NOTES TO FINANCIAL STATEMENTS (CONT.) | DECEMBER 31, 2008 |
| Real Estate Income and Growth Fund | |||||
| Number of Contracts | Premiums Received | ||||
Options outstanding at December 31, 2007 | — | $ | — | ||
Options written | 2,129 | 149,366 | |||
Options expired | (1,697) | (115,628) | |||
Options exercised | (432) | (33,738) | |||
Options outstanding at December 31, 2008 | — | $ | — | ||
D. Federal Income Taxes: The Fund intends to comply with all requirements of the Internal Revenue Code applicable to regulated investment companies and to distribute substantially all of its taxable income to its shareholders. Therefore, no federal income tax provision is required.
E. Net Asset Value Per Share: The methodology and procedures for determining NAV are identical for each class of shares, but due to the specific distribution expenses and other costs allocable to each class of shares, the NAV of each class of shares will vary. Class A Shares are purchased at the offering price per share (which includes a sales load), while Class B Shares are purchased at the net asset value per share.
F. Use of Estimates: In preparing financial statements in conformity with accounting principles generally accepted in the United States of America, management makes estimates and assumptions that affect the reported amounts of assets and liabilities at the date of the financial statements, as well as the reported amounts of revenues and expenses during the reporting period. Actual results could differ from those estimates.
G. Distributions to Shareholders: The Fund intends to distribute substantially all of its net investment income and capital gains to shareholders each year. Normally, income distributions will be paid quarterly. Capital gains, if any, will bet distributed annually in December, but may be distributed more | frequently if deemed advisable by the Board. All such distributions are taxable to the shareholders whether received in cash or reinvested in shares. The Fund has made certain investments in REITs which pay distributions to their shareholders based upon available funds from operations. Each REIT reports annually the tax character of its distributions. It is quite common for these distributions to exceed the REIT’s taxable earnings and profits resulting in the excess portion of such distributions being designated as a return of capital or long-term capital gain. The Fund intends to include the gross distributions from such REITs in its distributions to its shareholders; accordingly, a portion of the distributions paid to the Fund and subsequently distributed to shareholders may be re-characterized. The final determination of the amount of the Fund’s return of capital distribution for the period will be made after the end of each calendar year.
H. New Accounting Pronouncement: In March 2008, Statement of Financial Accounting Standards No. 161, Disclosures about Derivative Instruments and Hedging Activities (SFAS 161) was issued. SFAS 161 is intended to improve financial reporting for derivative instruments by requiring enhanced discloser that enables investors to understand how and why an entity uses derivatives, how derivatives are accounted for, and how derivative instruments affect an entity’s results of operations and financial position. SFAS 161 is effective for fiscal years and interim periods |
| 16 | SPIRIT OF AMERICA | |||
NOTES TO FINANCIAL STATEMENTS (CONT.) | DECEMBER 31, 2008 |
beginning after November 15, 2008. The impact on the Fund’s financial statements disclosures is currently being assessed.
Note 2 - Purchases and Sales of Securities Purchases and proceeds from the sales of securities for the year ended December 31, 2008, excluding short-term investments, were $157,740,699 and $153,996,331, respectively.
Note 3 - Investment Management Fee and Other Transactions with Affiliates Spirit of America Management Corp. (the “Adviser”) has been retained to act as the Company’s investment adviser pursuant to an Investment Advisory Agreement (the “Advisory Agreement”). The Adviser was incorporated in 1997 and is a registered investment adviser under the Investment Advisers Act of 1940, as amended. Under the Advisory Agreement, the Fund pays the Adviser a monthly fee of 1/12 of 0.97% of the Fund’s average daily net assets. Investment advisory fees for the year ended December 31, 2008 were $1,882,519.
The Adviser has contractually agreed to waive advisory fees and/or reimburse expenses so that the total operating expenses for Class A Shares and Class B Shares will not exceed 1.97%, and 2.67%, respectively, of the average daily net assets of each class through April 30, 2010. For the year ended December 31, 2008, there were no advisory fees waived.
Any amounts waived or reimbursed by the Adviser are subject to reimbursement by the Fund within the following three years, provided the Fund is able to make such reimbursement and remain in compliance with the expense limitations as stated above.
The Fund has adopted distribution plans for Class A Shares and Class B Shares pursuant to Rule 12b-1 (each a “Plan”). Each Plan permits the Fund to pay David Lerner Associates, Inc. (the “Distributor”), a monthly fee of 1/12 of 0.30% and 1/12 of 1.00% from the average | daily net assets of Class A Shares and Class B Shares, respectively, for the Distributor’s services and expenses in distributing shares of each class and providing personal services and/or maintaining shareholder accounts. Prior to December 31, 2008, SSH Securities, Inc. (“SSH”) served as the Fund’s distributor. For the year ended December 31, 2008, fees paid to SSH under the Plan were $563,783 for Class A Shares and $61,464 for Class B Shares.
The Fund’s Class A Shares are subject to an initial sales charge imposed at the time of purchase, in accordance with the Fund’s current prospectus. For the year ended December 31, 2008, sales charges on Class A Shares paid to SSH were $1,561,022. A contingent deferred sales charge (“CDSC”) of 1.00% may be imposed on redemptions of $1 million or more made within one year of purchase on Class A Shares. Certain redemptions of the Fund’s Class B Shares made within seven years of purchase are subject to a CDSC, in accordance with the Fund’s current prospectus. For the year ended December 31, 2008, CDSC fees on Class B Shares paid to SSH were $26,878.
Certain Officers and Directors of the Company are “affiliated persons”, as that term is defined in the 1940 Act, of the Adviser or the Distributor. Each Director of the Company, who is not an affiliated person of the Adviser or Distributor, receives a quarterly retainer of $1,500, $1,000 for each Board meeting attended, and $500 for each committee meeting attended plus reimbursement for certain travel and other out-of-pocket expenses incurred in connection with attending Board meetings. The Company does not compensate the Officers for the services they provide. There are no Directors’ fees paid to affiliated Directors of the Company. For the year ended December 31, 2008, the Fund was allocated $17,440 of the Chief Compliance Officer’s salary. |
| REAL ESTATE INCOME AND GROWTH FUND | 17 | |||
NOTES TO FINANCIAL STATEMENTS (CONT.) | DECEMBER 31, 2008 |
Note 4 – Concentration Risk The Fund invests primarily in real estate related securities. A fund that concentrates its investments is subject to greater risk of loss than a fund that has a more diversified portfolio of investments. Investments in real estate and real estate-related equity securities involve risks different from, and in certain cases greater than, the risks presented by equity securities generally. The main risks are those presented by direct ownership of real estate or real estate industry securities, including possible declines in the value of real estate, environmental problems and changes in | interest rates. To the extent that assets underlying the Fund’s investments are concentrated geographically, by property type or in certain other respects, the Fund may be subject to these risks to a greater extent. The stocks purchased by the Fund may not appreciate in value as the Adviser anticipates. In addition, if the Fund receives rental income or income from the disposition of real property acquired as a result of a default on securities the Fund owns, its ability to retain its tax status as a regulated investment company may be adversely affected. | |||||||||||||
Note 5 – Federal Income Taxes The tax character of distributions paid for the year ended December 31, 2008, and the period ended December 31, 2007 and the fiscal year ended October 31, 2007 were as follows: | ||||||||||||||
| Taxable Distributions | ||||||||||
Ordinary Income | Net Long-Term Capital Gains | Total Taxable Distributions | Return of Capital | Total Distribution | ||||||
12/31/2008 | ||||||||||
Class A | $ 6,111,095 | $ 1,845,096 | $ 7,956,191 | $ 1,635,398 | $ 9,591,589 | |||||
Class B | 162,486 | 49,150 | 211,636 | 43,564 | 255,200 | |||||
| $ 6,273,581 | $ 1,894,246 | $ 8,167,827 | $ 1,678,962 | $ 9,846,789 | ||||||
12/31/2007 | ||||||||||
Class A | $ 1,476,256 | $ 16,747,820 | $ 18,224,076 | $ 375,899 | $ 18,599,975 | |||||
Class B | 35,696 | 587,233 | 622,929 | 13,180 | 636,109 | |||||
| $ 1,511,952 | $ 17,335,053 | $ 18,847,005 | $ 389,079 | $ 19,236,084 | ||||||
10/31/2007 | ||||||||||
Class A | $ 7,712,005 | $ 10,884,881 | $ 18,596,886 | |||||||
Class B | 255,712 | 497,312 | 753,024 | |||||||
| $ 7,967,717 | $ 11,382,193 | $ 19,349,910 | ||||||||
| Distribution classifications may differ from the Statements of Changes in Net Assets as a result of the treatment of short-term capital gains as ordinary income for tax purposes. | Deferred Post October Losses | (17,015,653 | ) | ||||||||||||
| Unrealized depreciation | (77,658,482 | ) | |||||||||||||
Total Distributable Earnings | $(94,674,135 | ) | |||||||||||||
As of December 31, 2008, the components of accumulated distributable earnings for the Fund on a tax basis were as follows: |
The difference between book and tax unrealized depreciation is attributable to wash sales. |
| |||||||||||||
| 18 | SPIRIT OF AMERICA | |||
NOTES TO FINANCIAL STATEMENTS (CONT.) | DECEMBER 31, 2008 |
The Fund has adopted the provisions of FASB Interpretation No. 48 (“FIN 48”), Accounting for Uncertainty in Income Taxes. The implementation of FIN 48 resulted in no material liability for unrecognized tax benefits and no material change to the beginning NAV of the Fund. As of and during the year ended December 31, 2008, the Fund did not have a liability for any unrecognized tax benefits. The Fund recognizes interest and penalties, if any, related to unrecognized tax benefits as income tax expense in the Statement of Operations. During the period, the Fund did not incur any interest or penalties. The Fund’s taxable years 2005 to 2008 remain subject to examination by the Internal Revenue Service.
Note 6 – Reclassification: Permanent differences, incurred during the year ended December 31, 2008, resulting from differences in book and tax accounting have been reclassified at year end to undistributed net investment income, accumulated realized gain (loss) and paid-in-capital as follows: | Tax Information (Unaudited) For each item, it is the intention of the Fund to designate the maximum amount permitted under the Internal Revenue Code and the regulations thereunder.
Qualified Dividend Income For the year ended December 31, 2008, 2.89% of the distributions paid by the Fund from ordinary income qualifies for a reduced tax rate pursuant to The Jobs and Growth Tax Relief Reconciliation Act of 2003.
Long-Term Capital Gain Dividends The Fund designates $1,894,246 as long-term capital gain distributions pursuant to section 852(b)(3) of the Internal Revenue Code for the year ended December 31, 2008. |
Increase (Decrease) | |||||||
Paid-In-Capital | $(1,678,962 | ) | |||||
Undistributed Net Investment Income | 3,573,208 | ||||||
Accumulated Net Realized (Loss) | (1,894,246 | ) | |||||
| REAL ESTATE INCOME AND GROWTH FUND | 19 | |||
REPORT OF INDEPENDENT REGISTERED PUBLIC ACCOUNTING FIRM
To the Board of Directors Spirit of America Investment Fund, Inc. and the Shareholders of Spirit of America Real Estate Income and Growth Fund Syosset, New York | ||||||
We have audited the accompanying statement of assets and liabilities of Spirit of America Real Estate Income and Growth Fund (“Fund”), a series of shares of beneficial interest in Spirit of America Investment Fund, Inc., including the schedule of investments as of December 31, 2008, and the related statement of operations for the year ended, the statements of changes in net assets for the year then ended, for the two months in the period ended December 31, 2007, and for the year ended October 31, 2007 and the financial highlights for the year then ended, for the two months in the period ended December 31, 2007 and for each of the four years in the period ended October 31, 2007. These financial statements and financial highlights are the responsibility of the Fund’s management. Our responsibility is to express an opinion on those financial statements and financial highlights based on our audits.
We conducted our audits in accordance with the standards of the Public Company Accounting Oversight Board (United States). Those standards require that we plan and perform the audit to obtain reasonable assurance about whether the financial statements and financial highlights are free of material misstatement. The Fund is not required to have, nor were we engaged to perform, an audit of the Fund’s internal |
control over financial reporting. Our audits included consideration of internal control over financial reporting as a basis for designing audit procedures that are appropriate in the circumstances, but not for the purpose of expressing an opinion on the effectiveness of its internal control over financial reporting. Accordingly, we express no such opinion. An audit also includes examining, on a test basis, evidence supporting the amounts and disclosures in the financial statements, assessing the accounting principles used and significant estimates made by management, as well as evaluating the overall financial statement presentation. Our procedures included confirmation of securities owned as of December 31, 2008, by correspondence with custodian. We believe that our audits provide a reasonable basis for our opinion.
In our opinion, the financial statements and financial highlights referred to above present fairly, in all material respects, the financial position of Spirit of America Real Estate Income and Growth Fund as of December 31, 2008, the results of its operations for the year then ended, and the changes in its net assets and the financial highlights for the periods indicated above, in conformity with accounting principles generally accepted in the United States of America.
TAIT, WELLER & BAKER LLP
Philadelphia, Pennsylvania February 23, 2009 | |||||
| 20 | SPIRIT OF AMERICA | |||
| APPROVAL OF THE INVESTMENT ADVISORY AGREEMENT | DECEMBER 31, 2008 |
Approval of the Investment Advisory Agreement (Unaudited)
The Investment Company Act of 1940, as amended (the “1940 Act”), requires that the continuance of a registered management investment company’s investment advisory agreement be approved annually by both the board of directors and also by a majority of its directors who are not parties to the investment advisory agreement or “interested persons” (as defined by the 1940 Act) of any such party (the “Independent Directors”). On November 12, 2008, the Board of Directors (the “Board” or “Directors”) of Spirit of America Investment Fund, Inc. (the “Company”) met in person (the “Meeting”) to, among other things, review and consider the approval of the Investment Advisory Agreement (the “Advisory Agreement”) by and between Spirit of America Management Corp. (the “Adviser”) and the Company, on behalf of Spirit of America Real Estate Income and Growth Fund, Spirit of America Large Cap Value Fund and Spirit of America High Yield Tax Free Bond Fund (collectively, the “Funds”). At the Meeting, the Board, including the Independent Directors, voting separately, approved the Advisory Agreement after determining that the Adviser’s compensation, pursuant to the terms of the Advisory Agreement, would be fair and reasonable and concluded that the approval of the Advisory Agreement would be in the best interest of the Income Fund’s shareholders. The Board’s approval was based on consideration and evaluation of the information and material provided to the Board and a variety of specific factors discussed at the Meeting and at prior meetings of the Board, including the factors described below.
As part of the approval process and oversight of the advisory relationship, counsel to the Independent Directors (“Independent Counsel”) sent an information request letter to the Adviser seeking certain relevant | information and the Directors received, for their review in advance of the Meeting, the Adviser’s responses. In addition, the Directors were provided with the opportunity to request any additional materials. In advance of the Meeting, the Board, including the Independent Directors, requested and received materials provided by the Adviser and Independent Counsel, including, among other things, the following: (i) information on the investment performance of the Funds and relevant indices over various time periods; (ii) sales and redemption data with respect to the Funds; (iii) the general investment outlook in the markets in which the Funds invest; (iv) arrangements with respect to the distribution of the Funds’ shares; (v) the procedures employed to determine the value of each Fund’s assets; (vi) the allocation of the Funds’ brokerage, the record of compliance with the Funds’ investment policies and restrictions and with the Funds’ Code of Ethics and the structure and responsibilities of the Adviser’s compliance departments; (vii) the profitability of the Funds’ investment advisory business to the Adviser taking into account both advisory fees and any other potential direct or indirect benefits; (viii) information comparing the overall fees and specifically the fees under the Investment Advisory Agreement with the fees paid by other similar mutual funds; (ix) the Form ADV of the Adviser; and (x) information comparing the performance of the Funds with the performance of other similar mutual funds; and (xi) a memorandum from Independent Counsel regarding the responsibilities of the Board related to the approval of the Advisory Agreement.
In evaluating the Advisory Agreement, the Board, including the Independent Directors, requested, reviewed and considered materials furnished by the Adviser and questioned personnel of the Adviser, including the Funds’ |
| REAL ESTATE INCOME AND GROWTH FUND | 21 | |||
APPROVAL OF THE INVESTMENT ADVISORY AGREEMENT (CONT.) | DECEMBER 31, 2008 |
| portfolio managers, regarding, among other things, the personnel, operations and financial condition of the Adviser. Among other information, the Board, including the Independent Directors, requested and was provided information regarding: | At the Meeting, Independent Counsel referred the Directors to the “Gartenberg Memorandum” which had been distributed to each Director in advance of the Meeting, outlining the legal standards applicable to the Independent Directors under the 1940 Act with respect to the approval of the continuation of investment advisory agreements. In addition, the Independent Directors were provided with the opportunity to meet with Independent Counsel, in executive session, outside the presence of Company management and participate in a question and answer session with the Adviser.
The following is a summary of the Board’s discussion and views regarding the factors it considered in evaluating the continuation of the Investment Advisory Agreement:
1. Nature, Extent, and Quality of Services.
The Board, including the Independent Directors, considered the nature, quality and extent of advisory, administrative and shareholder services performed by the Adviser, including: regulatory filings and disclosure to shareholders, general oversight of the service providers, coordination of Fund marketing initiatives, review of Fund legal issues, assisting the Board, including the Independent Directors, in their capacity as directors and other services. The Board, including the Independent Directors, noted the increased responsibilities of the Adviser in response to an | |||||||
• |
The investment performance of each Fund over various time periods both by itself and in relation to relevant indices; | |||||||
• |
The fees charged by the Adviser for investment advisory services, as well as other compensation received by the Adviser and its affiliates; | |||||||
• |
The waivers of fees and reimbursements of expenses at times by the Adviser under the Operating Expenses Agreement; | |||||||
• |
The investment performance, fees and total expenses of mutual funds with similar objectives and strategies managed by other investment advisers; | |||||||
• |
The investment management staffing and the experience of the investment advisory, administrative and other personnel providing services to the Funds and the historical quality of the services provided by the Adviser; and | |||||||
• |
The profitability to the Adviser of managing and its affiliate distributing the Funds and the methodology in allocating expenses to the management of the Funds. | |||||||
| 22 | SPIRIT OF AMERICA | |||
APPROVAL OF THE INVESTMENT ADVISORY AGREEMENT (CONT.) | DECEMBER 31, 2008 |
increasingly regulated industry. The Board, including the Independent Directors, concluded that the services are extensive in nature, that the Adviser delivered a high level of service to each Fund and that the Adviser is positioned to continue providing such quality of service in the future.
2. Investment Performance of the Funds and the Adviser.
The Board, including the Independent Directors, considered short-term and long-term investment performance for the Funds over various periods of time as compared to both relevant indices and the performance of such Funds’ peer groups, and concluded that each Fund was delivering reasonable performance results, especially over the long-term, consistent with the investment strategies that the Funds pursue.
3. Costs of Services and Profits Realized by the Adviser.
a. The Board, including the Independent Directors, considered the information provided by Lipper Inc. regarding each Fund’s management fee rate and overall expense ratio relative to industry averages for the Fund’s peer group category and the advisory fees charged by the Adviser to other accounts. The Board viewed favorably the current and historic willingness of the Adviser to limit the overall expense ratios of the Funds. Recognizing that the fees paid by the Funds were higher than the medians in their peer groups, the Board nonetheless noted that the fees were still close to the median and that several peer funds had higher fees.
b. Profitability and Costs of Services to the Adviser. The Board, including the Independent Directors, considered estimates of the Adviser’s profitability and costs attributable to the Funds. The Board recognized that | increased fixed costs, particularly legal and audit fees in response to increasing regulations, have a greater impact on smaller fund families, such as the Funds, than on larger fund complexes. Given this, the Board recognized that the Funds’ overall expenses compare unfavorably to some funds identified as peers. The Board also considered whether the amount of the Adviser’s profit is a fair profit for the management of the Funds and noted that the Adviser has devoted a large amount of its resources into the Funds over the years. The Board, including the Independent Directors, concluded that the Adviser’s profitability was at a fair and acceptable level, particularly in light of the quality of the services being provided to the Funds, and bore a reasonable relationship to the services rendered.
4. Extent of Economies of Scale as the Funds Grow.
The Board, including the Independent Directors, considered whether there have been economies of scale with respect to the management of the Funds and whether the Funds have appropriately benefited from any economies of scale. Given the size of each Fund, the Board did not believe that significant (if any) economies of scale have been achieved.
5. Whether Fee Levels Reflect Economies of Scale.
The Board took into consideration that the Adviser does not currently offer breakpoints in its fees that would otherwise allow investors to benefit directly from economies of scale in the form of lower fees as fund assets grow. However, the Board, including the Independent Directors, did consider enhancements in personnel and services provided to the Funds by the Adviser, without an increase in fees. The Board also noted that |
| REAL ESTATE INCOME AND GROWTH FUND | 23 | |||
APPROVAL OF THE INVESTMENT ADVISORY AGREEMENT (CONT.) | DECEMBER 31, 2008 |
few of the Funds’ peers offered breakpoints despite having significantly more assets under management.
6. Other Relevant Considerations.
a. Personnel and Methods. The Board, including the Independent Directors, reviewed the Adviser’s Form ADV and questioned the Adviser regarding the size, education and experience of the staff of the Adviser, its fundamental research capabilities, approach to recruiting, training and retaining portfolio managers and other research and management personnel, and concluded that these enable them to provide a high level of service to the Funds. The Board also considered the history, reputation, qualifications and background of the Adviser as well as the qualifications if its personnel.
b. The Board, including the Independent Directors, also considered the character and amount of other direct and incidental benefits received by the Adviser and its affiliates from their association with the Funds, including the benefits received by the affiliated distributor. The Board concluded that potential “fall-out” benefits that the Adviser and its affiliates may receive, such as greater name recognition or increased ability to obtain research services (although the Board noted that the Adviser currently does not use soft dollars to obtain research services), appear to be reasonable, and may in some cases benefit the Funds. | Conclusions. In considering the renewal of the Investment Advisory Agreement, the Board, including the Independent Directors, did not identify any factor as all-important or all-controlling and instead considered the above listed and other factors collectively in light of the Funds’ surrounding circumstances. Each Director gave the weight to each factor that he deemed appropriate in his own judgment. The Board considered the renewal of the Investment Advisory Agreement on a Fund-by-Fund basis and determined that the renewal of the Investment Advisory Agreement was in the best interests of the shareholders of each Fund. The Board also determined that the fees charged to each Fund for the services provided were reasonable. Therefore, the Board, including the Independent Directors, determined that continuance of the Investment Advisory Agreement was in the best interests of each Fund. |
| 24 | SPIRIT OF AMERICA | |||
MANAGEMENT OF THE COMPANY (UNAUDITED)
Information pertaining to the Directors and Officers of the Company is set forth below. The Statement of Additional Information includes additional information about the Directors and is available without charge, upon request, by calling 516-390-5565.
Name, Address and (Age) Position(s) with the Company | Term of Office1 of Time Served | Principal Occupation(s) During Past Five Years | Number of Portfolios in Fund Complex Overseen by Director | Other Directorships Held by Director | ||||
| INTERESTED DIRECTORS | ||||||||
David Lerner2 (72) 477 Jericho Turnpike Syosset, New York 11791 Director, Chairman of the Board, President | Since 1998 | President and founder, David Lerner Associates, Inc., a registered broker-dealer; President, Spirit of America Management Corp., the Company’s investment adviser; and Chief Executive Officer and President of SSH Securities, Inc., the Company’s Distributor. | 4 | Director of Spirit of America Management Corp., the Company’s investment adviser; Director of David Lerner Associates, Inc., a registered broker-dealer and the Company’s Distributor. | ||||
Daniel Lerner2 (47) 477 Jericho Turnpike Syosset, New York 11791 Director | Since 1998 | Senior Vice President, Investment Counselor with David Lerner Associates, Inc., a registered broker-dealer, since September 2000. Previously: Broker with Prudential Securities from February 2000 to July 2000; Broker with Bear Stearns from January 1999 to May 1999; Vice President of SSH Securities, Inc., the Company’s Distributor and Senior Vice President. | 4 | Director of David Lerner Associates, Inc., a registered broker-dealer and the Company’s Distributor. | ||||
| INDEPENDENT DIRECTORS | ||||||||
Allen Kaufman (72) c/o 477 Jericho Turnpike Syosset, New York 11791 Director | Since 1998 | President and Chief Executive Officer of K.G.K. Agency, Inc., a property and casualty insurance agency, since 1963. | 4 | Director of K.G.K. Agency, Inc., a property and casualty insurance agency. | ||||
Stanley S. Thune (72) c/o 477 Jericho Turnpike Syosset, New York 11791 Director | Since 1998 | President and Chief Executive Officer, Freight Management Systems, Inc., a third party logistics management company, since 1994; private investor. | 4 | Director of Freight Management Systems, Inc. | ||||
Richard Weinberger (72) c/o 477 Jericho Turnpike Syosset, New York 11791 Director | Since 2005 | Of Counsel to Ballon Stoll Bader & Nadler, P.C., a mid-sized law firm, since January 2005; Shareholder, Ballon Stoll Bader & Nadler, P.C., January 2000 to December 2004. | 4 | None. | ||||
| OFFICERS | ||||||||
| David Lerner | ||||||||
| President | ||||||||
| (see biography above) | ||||||||
Alan P. Chodosh (55) 477 Jericho Turnpike Syosset, New York 11791 Treasurer and Secretary | Since 2003 (Treasurer) Since 2005 (Secretary) | Executive Vice President and Chief Financial Officer of David Lerner Associates, Inc. since June 1997. | N/A | N/A | ||||
Joseph Pickard (48) 477 Jericho Turnpike Syosset, New York 11791 Chief Compliance Officer | Since 2007 | Chief Compliance Officer of Spirit of America Investment Fund, Inc. and Spirit of America Management Corp. since July 2007; Counsel to the Interested Directors of Spirit of America Investment Fund, Inc. since July 2002; General Counsel of David Lerner Associates, Inc. since July 2002. | N/A | N/A | ||||
| 1 | Each Director serves for an indefinite term, until his successor is elected. |
| 2 | David Lerner is an “interested” Director, as defined in the 1940 Act, by reason of his positions with the Adviser and Distributor, and Daniel Lerner is an “interested” Director by reason of his position with the Distributor. Daniel Lerner is the son of David Lerner. |
| REAL ESTATE INCOME AND GROWTH FUND | 25 | |||


MESSAGE TO OUR SHAREHOLDERS
Dear Shareholder,
We are very pleased to send you a copy of the annual report for the Spirit of America Large Cap Value Fund (the “Fund”).
At Spirit of America, we take a comprehensive approach to investing. We evaluate economic trends, we then analyze sectors that could benefit from those trends, and finally, invest in companies with strong fundamentals.
Recent market activity has been providing numerous opportunities to pick up stocks at historical low valuations. We believe that investing in sound companies with reasonable valuations will help enhance the long-term returns of the Fund.
During the fourth quarter of 2008, the Fund was upgraded by Morningstar to a 4-star rating from a 2-star rating.*
We have been proud to watch the increasing number of investors in the Fund throughout its history. We appreciate your support of our Fund and look forward to your future investment in the Spirit of America Large Cap Value Fund.
Sincerely,
|
David Lerner President |  |
William Mason Portfolio Manager |


Any investment in equity securities is subject to risk and market values may fluctuate with economic conditions, interest rates, civil unrest and other factors, which will affect its market value. As with any mutual fund, an investor’s shares, when redeemed, may be worth more or less than their original cost. Past performance is no guarantee of future results.
*Morningstar lists the Value Fund’s category as “Large Blend” and ranks 2,250 other funds in this catagory. The rating change was effective October 31, 2008. A fund’s Morningstar rating is relative to other offerings that operate within the same category and takes into consideration how the fund has balanced risk and return in the past. Past performance is no guarantee of future results.
Prospective investors should consider the investment objective, risks and charges and expenses of the Fund carefully before investing. The maximum sales charge on share purchases is 5.25% of the offering price. The Fund’s prospectus contains this and other information about the Fund and may be obtained through your broker or by calling 1-800-452-4892. The prospectus should be read carefully before investing.
| LARGE CAP VALUE FUND | 1 | |||
| MANAGEMENT DISCUSSION | ||||||
Return Summary The Spirit of America Large Cap Value Fund, SOAVX (the “Fund”), had a total return of -30.81% for the 2008 calendar year, outperforming its benchmark, the S&P 500 Index, which returned -36.99% for the same period. The sales load adjusted return for the Fund was -34.43%, outperforming its benchmark by 2.56%.
Market Summary Performance in 2008 exhibited the worst peak-to-trough declines since 1970 for the market and the majority of sectors, with only consumer staples and healthcare declining less than their historical averages. Financials more than doubled their average bear market decline.
Fears that the U.S. economic and financial crisis would spread globally dominated the equity and commodity markets during the third quarter of 2008. Energy markets were pressured lower by the deteriorating global GDP to result in significantly lower oil and gas demand. Downward revisions to global growth forecasts are probably the reason why the U.S. dollar has rebounded from its trough in April. The dollar’s rise has triggered the weakness in commodities, which are generally denominated in U.S. dollars.
The demand side of the economy was lackluster as the reading on home sales, housing starts and durable goods orders showed weak growth. In addition, real consumer spending declined in both June and July, suggesting a deeper slump in consumer recession. |
The federal government is now the only sector that is not in fast retreat. Not surprisingly, the Federal Reserve cut rates pretty much to zero in December and we believe this move will help thaw credit and stimulate economic growth.
Fund Summary The Fund remained diversified within the 10 main sectors of the S&P 500 Index. However, it was defensively positioned by overweighting the staples sector and underweighting the financial and technology sectors. The Fund’s cash position was approximately 18% at the end of the third quarter and down to approximately 8% by year end.
The largest contributor to the Fund’s return was its large cash position, which provided 5.86% of the Fund’s outperformance vs. the S&P 500. The second largest contributor to the Fund’s return was the underweighting in the financial sector. Out performance from the financial sector was 3.14%. Many of the financial institutions faced insolvency. Fortunately, the Fund did not own these names as they imploded.
The third largest contributor to the Fund’s performance came from the staples sector, which contributed 89 basis points to performance. The Fund overweighted companies that posted stable earnings, were able to raise prices in this recessionary environment and those that had overall strong balance sheets.
The Fund continues to invest in companies with strong fundamentals such as low debt levels, strong cash flows, stable earnings and with low or reasonable valuations. |
| 2 | SPIRIT OF AMERICA | |||
| MANAGEMENT DISCUSSION (CONT.) |
Summary of Portfolio Holdings (Unaudited) The Securities and Exchange Commission (“SEC”) has adopted a requirement that all Funds present their categories of portfolio holdings in a table, chart or graph format in their annual and semi-annual shareholder reports, whether or not a schedule of investments is utilized. The following table, which presents portfolio holdings as a percentage of total market value, is provided in compliance with such requirement. |
Spirit of America Large Cap Value Fund
| December 31, 2008 | ||||||||
Consumer Staples
| 21.76
| %
| $
| 8,851,710
| ||||
Health Care
| 16.77
|
|
| 6,822,693
| ||||
Information Technology
| 13.15
|
|
| 5,348,450
| ||||
Energy
| 12.39
|
|
| 5,041,728
| ||||
Industrials
| 8.39
|
|
| 3,415,416
| ||||
Utilities
| 7.26
|
|
| 2,955,529
| ||||
Consumer Discretionary | 6.22
|
|
| 2,529,079
| ||||
Financials
| 5.62
|
|
| 2,286,934
| ||||
Telecommunication Services
| 4.41
|
|
| 1,794,750
| ||||
Materials
| 4.03
|
|
| 1,641,618
| ||||
Total Investments
| 100.00
| %
| $
| 40,687,907
| ||||
| LARGE CAP VALUE FUND | 3 | |||
ILLUSTRATION OF INVESTMENT (UNAUDITED)
| The graph below compares the increase in value of a $10,000 investment in the Spirit of America Large Cap Value Fund with the performance of the S&P 500 Index. The values and returns for the Spirit of America Large Cap Value Fund include reinvested distributions, and the impact of the maximum sales charge of 5.25% placed on purchases. The returns shown do not reflect taxes that a shareholder would pay on Fund distributions or on the redemption of Fund shares. | Average Annual Total Returns | |||||||
| For the Periods Ended December 31, 2008 | ||||||||
Shares | ||||||||
1 Year (with sales charge)
| (34.43%)a
| |||||||
1 Year (without sales charge)
| (30.81%)
| |||||||
5 Years (with sales charge)
| (1.75%)a
| |||||||
5 Years (without sales charge)
| (0.69%)
| |||||||
Since Inception (with sales charge)b
| 1.15%a
| |||||||
Past performance is not indicative of future results. a Reflects a 5.25% front-end sales charge. b Inception date: August 1, 2002. | ||||||||
Growth of $10,000
(includes one-time 5.25% maximum sales charge and reinvestment of all distributions)
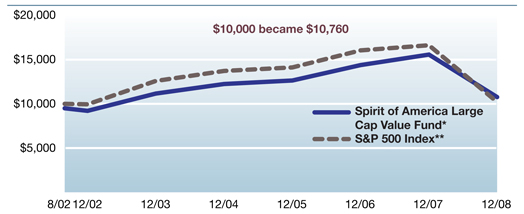
* Fund commenced operations August 1, 2002.
** The S&P 500 Index benchmark is based on a start date of July 31, 2002.
The S&P 500 Index is an unmanaged capitalization-weighted index of 500 stocks designed to measure the performance of the broad domestic economy through changes in the aggregate market value of 500 stocks representing all major industries. The performance of an index assumes no transaction costs, taxes, management fees or other expenses. A direct investment in an index is not possible.
| 4 | SPIRIT OF AMERICA | |||
DISCLOSURE OF FUND EXPENSES (UNAUDITED) FOR THE SIX MONTH PERIOD JULY 1, 2008 TO DECEMBER 31, 2008
| ||||||
| We believe it is important for you to understand the impact of fees regarding your investment. All mutual funds have operating expenses. As a shareholder of the Fund, you incur ongoing costs, which include costs for portfolio management, administrative services, and shareholder reports (like this one), among others. Operating expenses, which are deducted from the Fund’s gross income, directly reduce the investment return of the Fund. | The Fund’s expenses are expressed as a percentage of its average net assets. This figure is known as the expense ratio. The following examples are intended to help you understand the ongoing fees (in dollars) of investing in your Fund and to compare these costs with those of other mutual funds. The examples are based on an investment of $1,000 made at the beginning of the period shown and held for the entire period. | |||||
Spirit of America Large Cap Value Fund
| Beginning Account Value 7/1/08 | Ending Account Value 12/31/08 | Expense Ratio(1) | Expenses Paid During Period(2) | |||||||||
Actual Fund Return | $1,000.00 | $ 771.80 | 1.97% | $8.77 | ||||||||
Hypothetical 5% Return | $1,000.00 | $1,015.23 | 1.97% | $9.98 |
This table illustrates your Fund’s costs in two ways:
Actual Fund Return: This section helps you to estimate the actual expenses that you paid over the period. The “Ending Account Value” shown is derived from the Fund’s actual return, the third column shows the period’s annualized expense ratio, and the last column shows the dollar amount that would have been paid by an investor who started with $1,000 in the Fund at the beginning of the period. You may use the information here, together with your account value, to estimate the expenses that you paid over the period.
To do so, simply divide your account value by $1,000 (for example, an $8,600 account value divided by $1,000 = 8.6), then multiply the result by the number in the first line under the heading entitled “Expenses Paid During Period.” | Hypothetical 5% Return: This section is intended to help you compare your Fund’s costs with those of other mutual funds. It assumes that the Fund had a return of 5% before expenses during the period shown, but that the expense ratio is unchanged. In this case, because the return used is not the Fund’s actual return, the results do not apply to your investment. You can assess your Fund’s costs by comparing this hypothetical example with the hypothetical examples that appear in shareholder reports of other funds.
Please note that the expenses shown in the table are meant to highlight your ongoing costs only and do not reflect any transactional costs such as sales charges (loads), or redemption fees.
(1) Annualized, based on the Fund’s most recent half-year expenses. (2) Expenses are equal to the Fund’s annualized expense ratio multiplied by the average account value over the period, multiplied by the number of days in the period, then divided by 366. |
| LARGE CAP VALUE FUND | 5 | |||
SCHEDULE OF INVESTMENTS | DECEMBER 31, 2008 |
| Shares | Market Value | |||||
Common Stocks 91.61% | ||||||
Consumer Discretionary 5.69% | ||||||
Apollo Group, Inc., Class A* |
3,700 |
$ 283,494 | ||||
Comcast Corp., Class A | 27,700 | 467,576 | ||||
Home Depot, Inc. (The) | 12,500 | 287,750 | ||||
Lowe’s Cos., Inc. | 8,700 | 187,224 | ||||
McDonald’s Corp. | 9,000 | 559,710 | ||||
Newell Rubbermaid, Inc. | 36,000 | 352,080 | ||||
NIKE, Inc., Class B | 3,000 | 153,000 | ||||
Walt Disney Co. (The) | 10,500 | 238,245 | ||||
2,529,079 | ||||||
Consumer Staples 19.93% | ||||||
Altria Group, Inc. |
25,700 |
387,042 | ||||
Diageo plc, ADR | 10,200 | 578,748 | ||||
General Mills, Inc. | 7,300 | 443,475 | ||||
Kroger Co. (The) | 30,500 | 805,505 | ||||
Molson Coors Brewing Co., Class B | 17,800 | 870,776 | ||||
PepsiCo, Inc. | 16,000 | 876,320 | ||||
Philip Morris International, Inc. | 40,000 | 1,740,400 | ||||
Procter & Gamble Co. (The) | 17,000 | 1,050,940 | ||||
Sara Lee Corp. | 46,000 | 450,340 | ||||
Wal-Mart Stores, Inc. | 29,400 | 1,648,164 | ||||
8,851,710 | ||||||
Energy 11.35% | ||||||
Apache Corp. |
2,500 |
186,325 | ||||
Chevron Corp. | 15,250 | 1,128,042 | ||||
ConocoPhillips | 20,000 | 1,036,000 | ||||
Devon Energy Corp. | 5,000 | 328,550 | ||||
Energy Transfer Partners L.P. | 16,470 | 560,145 | ||||
Exxon Mobil Corp. | 9,300 | 742,419 | ||||
Noble Corp. | 18,000 | 397,620 | ||||
Schlumberger, Ltd. | 10,575 | 447,640 | ||||
Transocean, Ltd.* | 4,550 | 214,987 | ||||
5,041,728 | ||||||
Financials 5.15% | ||||||
Annaly Capital Management, Inc. REIT |
48,750 |
773,663 | ||||
Bank of America Corp. | 12,500 | 176,000 | ||||
JPMorgan Chase & Co. | 21,100 | 665,283 | ||||
Merrill Lynch & Co., Inc. | 24,300 | 282,852 | ||||
Wells Fargo & Co. | 13,200 | 389,136 | ||||
2,286,934 | ||||||
Health Care 15.36% | ||||||
Abbott Laboratories |
25,000 |
1,334,250 | ||||
Amgen, Inc.* | 10,000 | 577,500 | ||||
Covidien, Ltd. | 6,000 | 217,440 | ||||
See accompanying notes to financial statements.
| 6 | SPIRIT OF AMERICA | |||
| SCHEDULE OF INVESTMENTS (CONT.) | DECEMBER 31, 2008 |
| Shares | Market Value | |||
| Health Care (cont.) | ||||
Gilead Sciences, Inc.* | 7,000 | $ 357,980 | ||
Johnson & Johnson | 16,560 | 990,785 | ||
Medco Health Solutions, Inc.* | 25,000 | 1,047,750 | ||
Pfizer, Inc. | 42,000 | 743,820 | ||
Quest Diagnostics, Inc. | 12,000 | 622,920 | ||
Wyeth | 24,800 | 930,248 | ||
| 6,822,693 | ||||
Industrials 7.69% | ||||
3M Co. | 15,000 | 863,100 | ||
Caterpillar, Inc. | 12,000 | 536,040 | ||
Delta Air Lines, Inc.* | 63,125 | 723,412 | ||
Foster Wheeler, Ltd.* | 12,800 | 299,264 | ||
General Electric Co. | 38,000 | 615,600 | ||
Tyco International, Ltd. | 17,500 | 378,000 | ||
| 3,415,416 | ||||
Information Technology 12.04% | ||||
Accenture, Ltd., Class A | 25,000 | 819,750 | ||
Apple, Inc.* | 2,800 | 238,980 | ||
Cisco Systems, Inc.* | 60,000 | 978,000 | ||
EMC Corp.* | 80,000 | 837,600 | ||
Hewlett-Packard Co. | 20,000 | 725,800 | ||
Microsoft Corp. | 58,000 | 1,127,520 | ||
Texas Instruments, Inc. | 40,000 | 620,800 | ||
| 5,348,450 | ||||
Materials 3.70% | ||||
Alcoa, Inc. | 14,300 | 161,018 | ||
Du Pont (E.I.) de Nemours & Co. | 22,000 | 556,600 | ||
Nucor Corp. | 20,000 | 924,000 | ||
| 1,641,618 | ||||
Telecommunication Services 4.04% | ||||
AT&T, Inc. | 3,500 | 99,750 | ||
Verizon Communications, Inc. | 50,000 | 1,695,000 | ||
| 1,794,750 | ||||
Utilities 6.66% | ||||
Ameren Corp. | 24,987 | 831,068 | ||
American Electric Power Co., Inc. | 24,000 | 798,720 | ||
Consolidated Edison, Inc. | 18,700 | 727,991 | ||
Progress Energy, Inc. | 15,000 | 597,750 | ||
| 2,955,529 | ||||
Total Investments — 91.61% | ||||
(Cost $46,854,965**) | 40,687,907 | |||
Cash and Other Assets Net of Liabilities — 8.39% | 3,728,525 | |||
| NET ASSETS — 100.00% | $44,416,432 |
| LARGE CAP VALUE FUND | 7 | |||
| SCHEDULE OF INVESTMENTS (CONT.) | DECEMBER 31, 2008 |
| ADR - American Depository Receipt |
| REIT - Real Estate Investment Trust |
| * Non-income producing security. |
** Aggregate cost for federal income tax purposes is $47,339,841 and net unrealized depreciation consists of: |
| Gross unrealized appreciation | $ 2,770,547 | ||
| Gross unrealized depreciation | (9,422,481 | ) | |
| Net unrealized depreciation | $(6,651,934 | ) | |
| 8 | SPIRIT OF AMERICA | |||
| STATEMENT OF ASSETS AND LIABILITIES | DECEMBER 31, 2008 |
| ASSETS | |||
Investments in securities at value (cost $46,854,965) (Note 1) | $ 40,687,907 | ||
Cash | 3,427,442 | ||
Dividends and interest receivable | 107,557 | ||
Receivable for Fund shares sold | 116,083 | ||
Receivable for investments sold | 192,698 | ||
Prepaid expenses | 9,591 | ||
TOTAL ASSETS | 44,541,278 | ||
LIABILITIES | |||
Payable for Fund shares redeemed | 37,124 | ||
Payable for investment advisory fees | 25,672 | ||
Payable for distribution fees (Note 3) | 10,983 | ||
Payable for audit fees | 14,500 | ||
Payable for transfer agent fees | 10,288 | ||
Payable for printing fees | 11,150 | ||
Other accrued expenses | 15,129 | ||
TOTAL LIABILITIES | 124,846 | ||
NET ASSETS
| $ 44,416,432 | ||
Net assets applicable to 4,518,179 shares outstanding, $0.001 par value | $ 44,416,432 | ||
Net asset value and redemption price per share | $ 9.83 | ||
Maximum offering price per share ($9.83 ÷ 0.9475) | $ 10.37 | ||
SOURCE OF NET ASSETS | |||
At December 31, 2008, net assets consisted of: | |||
Paid-in capital | $ 55,016,191 | ||
Undistributed net investment income | 46,554 | ||
Accumulated net realized loss on investments and written options | (4,479,256 | ) | |
Net unrealized depreciation on investments | (6,167,057 | ) | |
NET ASSETS | $44,416,432 | ||
See accompanying notes to financial statements.
| LARGE CAP VALUE FUND | 9 | |||
STATEMENT OF OPERATIONS
For the Year Ended | ||
| INVESTMENT INCOME | ||
Dividends (net of foreign taxes withheld of $2,341) | $ 1,319,116 | |
Interest | 117,901 | |
| TOTAL INVESTMENT INCOME | 1,437,017 | |
| EXPENSES | ||
Investment Advisory fees (Note 3) | 551,925 | |
Distribution fees (Note 3) | 170,699 | |
Accounting fees | 54,689 | |
Administration fees | 81,082 | |
Auditing fees | 14,500 | |
Chief Compliance Officer salary | 5,256 | |
Custodian fees | 15,145 | |
Directors’ fees | 9,759 | |
Insurance expense | 24,865 | |
Legal fees | 21,353 | |
Printing expense | 41,807 | |
Registration fees | 10,033 | |
Transfer Agent fees | 142,161 | |
Other expenses | 12,992 | |
| TOTAL EXPENSES | 1,156,266 | |
Fees waived by Adviser (Note 3) | (35,345) | |
| NET EXPENSES | 1,120,921 | |
| NET INVESTMENT INCOME | 316,096 | |
REALIZED AND UNREALIZED GAIN (LOSS) ON INVESTMENTS AND WRITTEN OPTIONS | ||
Net realized loss from investment transactions | (4,551,351) | |
Net realized gain from written options | 72,095 | |
Net change in unrealized appreciation/depreciation of investments | (16,166,127) | |
Net realized and unrealized loss on investments and written options | (20,645,383) | |
| NET DECREASE IN NET ASSETS RESULTING FROM OPERATIONS | $(20,329,287) | |
See accompanying notes to financial statements.
| 10 | SPIRIT OF AMERICA | |||
STATEMENTS OF CHANGES IN NET ASSETS
For the Year Ended | For the Two-Month Period Ended December 31, 2007* | For the Year Ended October 31, 2007 | ||||
| OPERATIONS | ||||||
Net investment income | $ 316,096 | $ 22,602 | $ 126,774 | |||
Net realized gain/(loss) from investment transactions and written options | (4,479,256) | 62,742 | 3,841,273 | |||
Net change in unrealized appreciation/depreciation of investments | (16,166,127) | (1,634,387) | 3,043,126 | |||
Net increase (decrease) resulting from operations | (20,329,287) | (1,549,043) | 7,011,173 | |||
| DISTRIBUTIONS TO SHAREHOLDERS | ||||||
Distributions from net investment income | (300,073) | (22,602) | (126,954) | |||
Distributions from realized gains | (5,577) | (3,861,978) | (1,857,162) | |||
Total distributions to shareholders | (305,650) | (3,884,580) | (1,984,116) | |||
| CAPITAL SHARE TRANSACTIONS (Dollar Activity) | ||||||
Shares sold | 9,619,661 | 2,737,326 | 20,490,635 | |||
Shares issued from reinvestment of distributions | 291,782 | 3,708,855 | 1,890,589 | |||
Shares redeemed | (10,971,679) | (1,387,477) | (7,110,966) | |||
Increase/(decrease) in net assets derived from capital share transactions (a) | (1,060,236) | 5,058,704 | 15,270,258 | |||
Total increase (decrease) in net assets | (21,695,173) | (374,919) | 20,297,315 | |||
| NET ASSETS | ||||||
Beginning of period | 66,111,605 | 66,486,524 | 46,189,209 | |||
End of period | $ 44,416,432 | $66,111,605 | $66,486,524 | |||
Undistributed net investment income | $ 46,554 | $ — | $ — | |||
| (a) Transactions in capital stock were: | ||||||
Shares sold | 770,303 | 181,252 | 1,392,101 | |||
Shares issued from reinvestment of distributions | 25,678 | 255,080 | 133,923 | |||
Shares redeemed | (904,480) | (93,321) | (487,427) | |||
Increase (decrease) in shares outstanding | (108,499) | 343,011 | 1,038,597 | |||
| * | The Fund’s fiscal year-end changed from October 31 to December 31, effective December 31, 2007. |
See accompanying notes to financial statements.
| LARGE CAP VALUE FUND | 11 | |||
FINANCIAL HIGHLIGHTS
The table below sets forth financial data for one share of beneficial interest outstanding throughout the periods presented.
| For the Year Ended 12/31/08 | For the Two-Month Period Ended 12/31/07* | For the Year Ended 10/31/07 | For the Year Ended 10/31/06 | For the Year Ended 10/31/05 | For the Year Ended 10/31/04 | |||||||
Net Asset Value, Beginning of | $ 14.29 | $ 15.52 | $ 14.23 | $ 12.69 | $ 11.74 | $ 11.09 | ||||||
Income from Investment Operations: | ||||||||||||
Net investment income | 0.071 | 0.01 | 0.03 | 0.04 | 0.09 | 0.04 | ||||||
Net realized and unrealized gain (loss) on investments | (4.46) | (0.35) | 1.84 | 1.67 | 0.98 | 0.68 | ||||||
Total from investment operations | (4.39) | (0.34) | 1.87 | 1.71 | 1.07 | 0.72 | ||||||
Less Distributions: | ||||||||||||
Distributions from net investment | (0.07) | (0.01) | (0.03) | (0.04) | (0.09) | (0.04) | ||||||
Distributions from capital gains | (0.00)2 | (0.88) | (0.55) | (0.13) | (0.03) | (0.01) | ||||||
Distributions from return of capital | — | — | — | — | — | (0.02) | ||||||
Total distributions
| (0.07) | (0.89) | (0.58) | (0.17) | (0.12) | (0.07) | ||||||
Net Asset Value, | $ 9.83 | $ 14.29 | $ 15.52 | $ 14.23 | $ 12.69 | $ 11.74 | ||||||
Total Return3 | (30.81%) | (2.30%)4 | 13.56% | 13.52% | 9.07% | 6.48% | ||||||
Ratios/Supplemental Data | ||||||||||||
Net assets, end of period (000) | $44,416 | $66,112 | $66,487 | $46,189 | $40,347 | $35,826 | ||||||
Ratio of expenses to average net | ||||||||||||
Before expense waiver, | 2.03% | 1.95%5 | 1.93% | 2.07% | 1.96% | 2.03% | ||||||
After expense waiver, reimbursement | 1.97% | 1.97%5 | 1.97% | 1.97% | 1.97% | 1.97% | ||||||
Ratio of net investment income to average net assets | 0.56% | 0.21%5 | 0.23% | 0.26% | 0.70% | 0.41% | ||||||
Portfolio turnover | 44.76% | — | 22.14% | 14.37% | 15.37% | — | ||||||
1 | Calculated based on the average number of shares outstanding during the period. |
2 | Amount represents less than $0.01 per share. |
3 | Calculation does not reflect sales load. |
4 | Calculation is not annualized. |
5 | Calculation is annualized. |
* | The Fund’s fiscal year-end changed from October 31 to December 31, effective December 31, 2007. |
See accompanying notes to financial statements.
| 12 | SPIRIT OF AMERICA | |||
| NOTES TO FINANCIAL STATEMENTS | DECEMBER 31, 2008 |
Note 1 - Significant Accounting Policies Spirit of America Large Cap Value Fund (the “Fund”), a series of Spirit of America Investment Fund, Inc. (the “Company”), is an open-end diversified mutual fund registered under the Investment Company Act of 1940, as amended (the “1940 Act”). The Company was incorporated under the laws of Maryland on May 15,1997. The Fund commenced operations on August 1, 2002. The Fund seeks capital appreciation with a secondary objective of current income by investing in equity securities in the large cap value segment of the U.S. equity market. The Fund offers one class of shares.
The Fund changed its fiscal year-end from October 31 to December 31, effective beginning with the period ended December 31, 2007.
The following is a summary of significant accounting policies consistently followed by the Fund in the preparation of its financial statements. The policies are in conformity with accounting principles generally accepted in the United States of America for investment companies.
A. Security Valuation: The offering price and net asset value (“NAV”) per share for the Fund are calculated as of the close of regular trading on the New York Stock Exchange (“NYSE”), currently 4:00 p.m., Eastern Time on each day the NYSE is open for trading. The Fund’s securities are valued at the official close or the last reported sales price on the principal exchange on which the security trades, or if no sales price is reported, the mean of the latest bid and asked prices is used. Securities traded over-the-counter are priced at the mean of the latest bid and asked prices. Short-term | investments having a maturity of 60 days or less are valued at amortized cost, which the Board of Directors (the “Board”) believes represents fair value. Fund securities for which market quotations are not readily available are valued at fair value as determined in good faith under procedures established by and under the supervision of the Board.
In September 2006, the Financial Accounting Standards Board (“FASB”) issued Statement of Financial Accounting Standards No. 157, “Fair Value Measurements” (“FAS 157”), which is effective for fiscal years beginning after November 15, 2007. FAS 157 clarifies the definition of fair value for financial reporting, establishes a framework for measuring fair value and requires additional disclosures about the use of fair value measurements. The Fund adopted FAS 157 as of January 1, 2008. The three levels of the fair value hierarchy under FAS 157 are described below:
| |||||||
• Level 1 | – | quoted prices in active markets for identical securities
| ||||||
• Level 2 | – | other significant observable inputs (including quoted prices for similar securities, interest rates, prepayment speeds, credit risk, etc.)
| ||||||
• Level 3 | – | significant unobservable inputs (including the Fund’s own assumptions in determining the fair value of investments) | ||||||
The inputs or methodology used for valuing securities are not necessarily an indication of the risk associated with investing in those securities. | ||||||||
| LARGE CAP VALUE FUND | 13 | |||
| NOTES TO FINANCIAL STATEMENTS (CONT.) | DECEMBER 31, 2008 |
The summary of inputs used to value the Fund’s net assets as of December 31, 2008 is as follows:
| ||
| Large Cap Value Fund | ||
Valuation Inputs | ||
| Level 1 - Quoted Prices | $40,687,907 | |
| Level 2 - Other Significant Observable Inputs | — | |
| Level 3 - Significant Unobservable Inputs | — | |
Total Market Value of Investments | $40,687,907 | |
B. Investment Income and Securities Transactions: Security transactions are accounted for on the date the securities are purchased or sold (trade date). Cost is determined and gains and losses are based on the identified cost basis for both financial statement and federal income tax purposes. Dividend income and distributions to shareholders are reported on the ex-dividend date. Interest income and expenses are accrued daily.
C. Option Contracts: An option contract gives the buyer the right, but not the obligation, to buy (call) or sell (put) an underlying item at a fixed exercise price on a certain date or during a specified period. The cost of securities acquired through the exercise of a call option is increased by the premiums paid. The proceeds from securities sold through the exercise of a purchased put option are decreased by the premiums paid. Investments in options contracts requires the Fund to fair value or mark-to market the options on a daily basis, which reflects the change in the market value of the contracts at the close of each day’s trading. The cost of options that expire | unexercised are treated by the Fund, on expiration date, as realized losses on investments.
When the Fund writes an option, an amount equal to the premium received by the Fund is recorded as a liability and is subsequently adjusted to the current fair value of the option written. Premiums received from writing options that expire unexercised are treated by the Fund, on the expiration date, as realized gains from investments. The difference between the premium and the amount paid on effecting a closing purchase transaction, including brokerage commissions, is also treated as a realized gain, or, if the premium is less than the amount paid for the closing purchase transaction, as a realized loss. If a call option is exercised, the premium is added to the proceeds from the sale of the underlying security in determining whether the Fund has a realized gain or loss. If a put option is exercised, the premium reduces the cost basis of the securities purchased by the Fund. The Fund, as writer of an option, bears the market risk of an unfavorable change in the price of the security underlying the written option. |
| 14 | SPIRIT OF AMERICA | |||
| NOTES TO FINANCIAL STATEMENTS (CONT.) | DECEMBER 31, 2008 |
| Large Cap Value Fund | ||||||
Number of |
Premiums | |||||
| Options outstanding at December 31, 2007 | — | $ — | ||||
Options written | 645 | 94,920 | ||||
Options expired | (545) | (72,095) | ||||
Options exercised | (100) | (22,825) | ||||
Options outstanding at December 31, 2008 | — | $ — | ||||
D. Federal Income Taxes: The Fund intends to comply with all requirements of the Internal Revenue Code applicable to regulated investment companies and to distribute substantially all of its taxable income to its shareholders. Therefore, no federal income tax provision is required.
E. Use of Estimates: In preparing financial statements in conformity with accounting principles generally accepted in the United States of America, management makes estimates and assumptions that affect the reported amounts of assets and liabilities at the date of the financial statements, as well as the reported amounts of revenues and expenses during the reporting period. Actual results could differ from those estimates.
F. Distributions to Shareholders: The Fund intends to distribute substantially all of its net investment income and capital gains to shareholders each year. Normally, income distributions will be paid quarterly. Capital gains, if any, will be distributed annually in December, but may be distributed more frequently if deemed advisable by the Board. All such distributions are taxable to the shareholders whether received in cash or reinvested in shares. A portion of the distributions paid to the Fund and subsequently distributed to shareholders may be characterized as a return of capital, long-term capital gain or short-term capital gain. The Fund has made certain investments in real estate investment trusts (“REITs”) which pay distributions to their shareholders | based upon available funds from operations. It is quite common for these distributions to exceed the REIT’s taxable earnings and profits resulting in the excess portion of such distributions being designated as a return of capital or long-term capital gain. The Fund intends to include the gross distributions from such REITs in its distributions to its shareholders; accordingly, a portion of the distributions paid to the Fund and subsequently distributed to shareholders may be re-characterized. The final determination of the amount of the Fund’s return of capital distribution for the period will be made after the end of each calendar year.
G. New Accounting Pronouncement: In March 2008, Statement of Financial Accounting Standards No. 161, Disclosures about Derivative Instruments and Hedging Activities (SFAS 161) was issued. SFAS 161 is intended to improve financial reporting for derivative instruments by requiring enhanced discloser that enables investors to understand how and why an entity uses derivatives, how derivatives are accounted for, and how derivative instruments affect an entity’s results of operations and financial position. SFAS 161 is effective for fiscal years and interim periods beginning after November 15, 2008. The impact on the Fund’s financial statements disclosures is currently being assessed. |
| LARGE CAP VALUE FUND | 15 | |||
| NOTES TO FINANCIAL STATEMENTS (CONT.) | DECEMBER 31, 2008 |
Note 2 - Purchases and Sales of Securities Purchases and proceeds from sales of securities for the year ended December 31, 2008, excluding short-term investments, were $27,063,506 and $21,947,792, respectively.
Note 3 - Investment Management Fee and Other Transactions with Affiliates Spirit of America Management Corp. (the “Adviser”) has been retained to act as the Company’s investment adviser pursuant to an Investment Advisory Agreement (the “Advisory Agreement”). The Adviser was incorporated in 1997 and is a registered investment adviser under the Investment Advisers Act of 1940, as amended. Under the Advisory Agreement, the Fund pays the Adviser a monthly fee of 1/12 of 0.97% of the Fund’s average daily net assets. Investment advisory fees for the year ended December 31, 2008 were $551,925.
The Adviser has contractually agreed to waive advisory fees and/or reimburse expenses so that the total operating expenses will not exceed 1.97% of the average daily net assets of the Fund through April 30, 2010. For the year ended December 31, 2008, the Adviser waived advisory fees of $35,345.
Any amounts waived or reimbursed by the Adviser are subject to reimbursement by the Fund within the following three years, provided the Fund is able to make such reimbursement and remain in compliance with the expense limitation as stated above. The balance of recoverable expenses to the Adviser at December 31, 2008 was $69,367. Of this balance, $22,773 will expire in 2009, $11,249 in 2010 and $35,345 in 2011.
The Fund has adopted a plan of distribution pursuant to Rule 12b-1 (the “Plan”). The Plan permits the Fund to pay David Lerner Associates, Inc. (the “Distributor”) a monthly fee of 1/12 of 0.30% of the Funds average daily net assets for the Distributor’s services and expenses in distributing shares of the Fund | and providing personal services and/or maintaining shareholder accounts. Prior to December 31, 2008, SSH Securities, Inc. (“SSH”) served as the Fund’s distributor. For the year ended December 31, 2008, fees paid to SSH under the Plan were $170,699.
The Fund’s shares are subject to an initial sales charge imposed at the time of purchase, in accordance with the Fund’s current prospectus. For the year ended December 31, 2008, sales charges received by SSH were $474,714. A contingent deferred sales charge of 1.00% may be imposed on redemptions of $1 million or more made within one year of purchase.
Certain Officers and Directors of the Company are “affiliated persons”, as that term is defined in the 1940 Act, of the Adviser or the Distributor. Each Director of the Company, who is not an affiliated person of the Adviser or Distributor, receives a quarterly retainer of $1,500, $1,000 for each Board meeting attended, and $500 for each committee meeting attended plus reimbursement for certain travel and other out-of-pocket expenses incurred in connection with attending Board meetings. The Company does not compensate the Officers for the services they provide. There are no Directors’ fees paid to affiliated Directors of the Company. For the year ended December 31, 2008, the Fund was allocated $5,256 of the Chief Compliance Officer’s salary. |
| 16 | SPIRIT OF AMERICA | |||
| NOTES TO FINANCIAL STATEMENTS (CONT.) | DECEMBER 31, 2008 |
Note 4 – Federal Income Taxes The tax character of distributions paid for the year ended December 31, 2008, the period ended December 31, 2007 and the fiscal year ended October 31, 2007 were as follows: | ||||||
| Taxable Distributions | ||||||||||
Ordinary |
Net Long-Term |
Total Taxable | ||||||||
12/31/2008 | $300,081 | $ 5,569 | $ 305,650 | |||||||
12/31/2007 | $178,988 | $3,705,592 | $3,884,580 | |||||||
10/31/2007 | $147,457 | $1,836,659 | $1,984,116 | |||||||
Distribution classifications may differ from the Statements of Changes in Net Assets as a result of the treatment of short-term capital gains as ordinary income for tax purposes. | benefits as income tax expense in the Statement of Operations. During the period, the Fund did not incur any interest or penalties. The Fund’s taxable years 2005 to 2008 remain subject to examination by the Internal Revenue Service.
Note 5 – Reclassification Permanent differences, incurred during the year ended December 31, 2008, resulting from differences in book and tax accounting have been reclassified at year end to undistributed net investment income, accumulated realized gain (loss) and paid-in-capital as follows: | |||||||||
| As of December 31, 2008, the components of accumulated distributable earnings for the Fund on a tax basis were as follows: | ||||||||||
Accumulated net |
Increase (Decrease) | |||||||||
Investment income | $ 46,554 | Paid-In-Capital | $ (8,555) | |||||||
Capital Loss Carryforward | (2,591,937) | Undistributed Net Investment Income | 30,531 | |||||||
Deferred Post-October Losses | (1,402,443) | Accumulated Net Realized (Loss) | (21,976) | |||||||
Unrealized depreciation | (6,651,933) | |||||||||
Total Distributable | $(10,599,759) | |||||||||
At December 31, 2008, the Fund had net capital loss carryforwards for federal income tax purposes of $2,591,937, which are available to reduce future required distributions of net capital gains to shareholders through 2016.
The Fund has adopted the provisions of FASB Interpretation No. 48 (“FIN 48”), Accounting for Uncertainty in Income Taxes. The implementation of FIN 48 resulted in no material liability for unrecognized tax benefits and no material change to the beginning net asset value of the Fund. As of and during the year ended December 31, 2008, the Fund did not have a liability for any unrecognized tax benefits. The Fund recognizes interest and penalties, if any, related to unrecognized tax | ||||||||||
| LARGE CAP VALUE FUND | 17 | |||
| NOTES TO FINANCIAL STATEMENTS (CONT.) | DECEMBER 31, 2008 |
Tax Information (Unaudited) For each item, it is the intention of the Fund to designate the maximum amount permitted under the Internal Revenue Code and the regulations thereunder.
Qualified Dividend Income For the year ended December 31, 2008, 100% of the distributions paid by the Fund from ordinary income qualifies for a reduced tax rate pursuant to The Jobs and Growth Tax Relief Reconciliation Act of 2003.
Dividends Received Deduction For the year ended December 31, 2008, 100% of the ordinary income distribution qualifies for the Dividends Received Deduction available to corporations.
Long-Term Capital Gain Dividends The Fund designates $5,569 as long-term capital gain distributions pursuant to section 852(b)(3) of the Internal Revenue Code for the year ended December 31, 2008. |
| 18 | SPIRIT OF AMERICA | |||
| REPORT OF INDEPENDENT REGISTERED PUBLIC ACCOUNTING FIRM |
To the Board of Directors Spirit of America Investment Fund, Inc. and the Shareholders of Spirit of America Large Cap Value Fund Syosset, New York
| ||||||
We have audited the accompanying statement of assets and liabilities of Spirit of America Large Cap Value Fund (“Fund”), a series of shares of beneficial interest in Spirit of America Investment Fund, Inc., including the schedule of investments as of December 31, 2008, and the related statement of operations for the year ended, the statement of changes in net assets for the year then ended, for the two months in the period ended December 31, 2007, and for the year ended October 31, 2007 and the financial highlights for the year then ended, for the two months in the period ended December 31, 2007 and for each of the four years in the period ended October 31, 2007. These financial statements and financial highlights are the responsibility of the Fund’s management. Our responsibility is to express an opinion on those financial statements and financial highlights based on our audits.
We conducted our audits in accordance with the standards of the Public Company Accounting Oversight Board (United States). Those standards require that we plan and perform the audit to obtain reasonable assurance about whether the financial statements and financial highlights are free of material misstatement. The Fund is not required to have, nor were we engaged to perform, an audit of the Fund’s internal | control over financial reporting. Our audits included consideration of internal control over financial reporting as a basis for designing audit procedures that are appropriate in the circumstances, but not for the purpose of expressing an opinion on the effectiveness of its internal control over financial reporting. Accordingly, we express no such opinion. An audit also includes examining, on a test basis, evidence supporting the amounts and disclosures in the financial statements, assessing the accounting principles used and significant estimates made by management, as well as evaluating the overall financial statement presentation. Our procedures included confirmation of securities owned as of December 31, 2008, by correspondence with custodian. We believe that our audits provide a reasonable basis for our opinion.
In our opinion, the financial statements and financial highlights referred to above present fairly, in all material respects, the financial position of Spirit of America Large Cap Value Fund as of December 31, 2008, the results of its operations for the year then ended, and the changes in its net assets and the financial highlights for the periods indicated above, in conformity with accounting principles generally accepted in the United States of America.
TAIT, WELLER & BAKER LLP
Philadelphia, Pennsylvania February 23, 2009 | |||||
| LARGE CAP VALUE FUND | 19 | |||
| APPROVAL OF THE INVESTMENT ADVISORY AGREEMENT | DECEMBER 31, 2008 |
Approval of the Investment Advisory Agreement (Unaudited)
| ||||||
The Investment Company Act of 1940, as amended (the “1940 Act”), requires that the continuance of a registered management investment company’s investment advisory agreement be approved annually by both the board of directors and also by a majority of its directors who are not parties to the investment advisory agreement or “interested persons” (as defined by the 1940 Act) of any such party (the “Independent Directors”). On November 12, 2008, the Board of Directors (the “Board” or “Directors”) of Spirit of America Investment Fund, Inc. (the “Company”) met in person (the “Meeting”) to, among other things, review and consider the approval of the Investment Advisory Agreement (the “Advisory Agreement”) by and between Spirit of America Management Corp. (the “Adviser”) and the Company, on behalf of Spirit of America Real Estate Income and Growth Fund, Spirit of America Large Cap Value Fund and Spirit of America High Yield Tax Free Bond Fund (collectively, the “Funds”). At the Meeting, the Board, including the Independent Directors, voting separately, approved the Advisory Agreement after determining that the Adviser’s compensation, pursuant to the terms of the Advisory Agreement, would be fair and reasonable and concluded that the approval of the Advisory Agreement would be in the best interest of the Income Fund’s shareholders. The Board’s approval was based on consideration and evaluation of the information and material provided to the Board and a variety of specific factors discussed at the Meeting and at prior meetings of the Board, including the factors described below.
As part of the approval process and oversight of the advisory relationship, counsel to the Independent Directors (“Independent Counsel”) sent an information request letter to the Adviser seeking certain relevant | information and the Directors received, for their review in advance of the Meeting, the Adviser’s responses. In addition, the Directors were provided with the opportunity to request any additional materials. In advance of the Meeting, the Board, including the Independent Directors, requested and received materials provided by the Adviser and Independent Counsel, including, among other things, the following: (i) information on the investment performance of the Funds and relevant indices over various time periods; (ii) sales and redemption data with respect to the Funds; (iii) the general investment outlook in the markets in which the Funds invest; (iv) arrangements with respect to the distribution of the Funds’ shares; (v) the procedures employed to determine the value of each Fund’s assets; (vi) the allocation of the Funds’ brokerage, the record of compliance with the Funds’ investment policies and restrictions and with the Funds’ Code of Ethics and the structure and responsibilities of the Adviser’s compliance departments; (vii) the profitability of the Funds’ investment advisory business to the Adviser taking into account both advisory fees and any other potential direct or indirect benefits; (viii) information comparing the overall fees and specifically the fees under the Investment Advisory Agreement with the fees paid by other similar mutual funds; (ix) the Form ADV of the Adviser; and (x) information comparing the performance of the Funds with the performance of other similar mutual funds; and (xi) a memorandum from Independent Counsel regarding the responsibilities of the Board related to the approval of the Advisory Agreement.
In evaluating the Advisory Agreement, the Board, including the Independent Directors, requested, reviewed and considered materials furnished by the Adviser and questioned personnel of the Adviser, including the Funds’ | |||||
| 20 | SPIRIT OF AMERICA | |||
APPROVAL OF THE INVESTMENT ADVISORY AGREEMENT (CONT.) | DECEMBER 31, 2008 |
| portfolio managers, regarding, among other things, the personnel, operations and financial condition of the Adviser. Among other information, the Board, including the Independent Directors, requested and was provided information regarding: | At the Meeting, Independent Counsel referred the Directors to the “Gartenberg Memorandum” which had been distributed to each Director in advance of the Meeting, outlining the legal standards applicable to the Independent Directors under the 1940 Act with respect to the approval of the continuation of investment advisory agreements. In addition, the Independent Directors were provided with the opportunity to meet with Independent Counsel, in executive session, outside the presence of Company management and participate in a question and answer session with the Adviser.
The following is a summary of the Board’s discussion and views regarding the factors it considered in evaluating the continuation of the Investment Advisory Agreement:
1. Nature, Extent, and Quality of Services.
The Board, including the Independent Directors, considered the nature, quality and extent of advisory, administrative and shareholder services performed by the Adviser, including: regulatory filings and disclosure to shareholders, general oversight of the service providers, coordination of Fund marketing initiatives, review of Fund legal issues, assisting the Board, including the Independent Directors, in their capacity as directors and other services. The Board, including the Independent Directors, noted the increased responsibilities of the Adviser in response to an | |||||||
• |
The investment performance of each Fund over various time periods both by itself and in relation to relevant indices; | |||||||
• |
The fees charged by the Adviser for investment advisory services, as well as other compensation received by the Adviser and its affiliates; | |||||||
• |
The waivers of fees and reimbursements of expenses at times by the Adviser under the Operating Expenses Agreement; | |||||||
• |
The investment performance, fees and total expenses of mutual funds with similar objectives and strategies managed by other investment advisers; | |||||||
• |
The investment management staffing and the experience of the investment advisory, administrative and other personnel providing services to the Funds and the historical quality of the services provided by the Adviser; and | |||||||
• |
The profitability to the Adviser of managing and its affiliate distributing the Funds and the methodology in allocating expenses to the management of the Funds. | |||||||
| LARGE CAP VALUE FUND | 21 | |||
APPROVAL OF THE INVESTMENT ADVISORY AGREEMENT (CONT.) | DECEMBER 31, 2008 |
increasingly regulated industry. The Board, including the Independent Directors, concluded that the services are extensive in nature, that the Adviser delivered a high level of service to each Fund and that the Adviser is positioned to continue providing such quality of service in the future.
2. Investment Performance of the Funds and the Adviser.
The Board, including the Independent Directors, considered short-term and long-term investment performance for the Funds over various periods of time as compared to both relevant indices and the performance of such Funds’ peer groups, and concluded that each Fund was delivering reasonable performance results, especially over the long-term, consistent with the investment strategies that the Funds pursue.
3. Costs of Services and Profits Realized by the Adviser.
a. The Board, including the Independent Directors, considered the information provided by Lipper Inc. regarding each Fund’s management fee rate and overall expense ratio relative to industry averages for the Fund’s peer group category and the advisory fees charged by the Adviser to other accounts. The Board viewed favorably the current and historic willingness of the Adviser to limit the overall expense ratios of the Funds. Recognizing that the fees paid by the Funds were higher than the medians in their peer groups, the Board nonetheless noted that the fees were still close to the median and that several peer funds had higher fees.
b. Profitability and Costs of Services to the Adviser. The Board, including the Independent Directors, considered estimates of the Adviser’s profitability and costs attributable to the Funds. The Board recognized that | increased fixed costs, particularly legal and audit fees in response to increasing regulations, have a greater impact on smaller fund families, such as the Funds, than on larger fund complexes. Given this, the Board recognized that the Funds’ overall expenses compare unfavorably to some funds identified as peers. The Board also considered whether the amount of the Adviser’s profit is a fair profit for the management of the Funds and noted that the Adviser has devoted a large amount of its resources into the Funds over the years. The Board, including the Independent Directors, concluded that the Adviser’s profitability was at a fair and acceptable level, particularly in light of the quality of the services being provided to the Funds, and bore a reasonable relationship to the services rendered.
4. Extent of Economies of Scale as the Funds Grow.
The Board, including the Independent Directors, considered whether there have been economies of scale with respect to the management of the Funds and whether the Funds have appropriately benefited from any economies of scale. Given the size of each Fund, the Board did not believe that significant (if any) economies of scale have been achieved.
5. Whether Fee Levels Reflect Economies of Scale.
The Board took into consideration that the Adviser does not currently offer breakpoints in its fees that would otherwise allow investors to benefit directly from economies of scale in the form of lower fees as fund assets grow. However, the Board, including the Independent Directors, did consider enhancements in personnel and services provided to the Funds by the Adviser, without an increase in fees. The Board also noted that |
| 22 | SPIRIT OF AMERICA | |||
APPROVAL OF THE INVESTMENT ADVISORY AGREEMENT (CONT.) | DECEMBER 31, 2008 |
few of the Funds’ peers offered breakpoints despite having significantly more assets under management.
6. Other Relevant Considerations.
a. Personnel and Methods. The Board, including the Independent Directors, reviewed the Adviser’s Form ADV and questioned the Adviser regarding the size, education and experience of the staff of the Adviser, its fundamental research capabilities, approach to recruiting, training and retaining portfolio managers and other research and management personnel, and concluded that these enable them to provide a high level of service to the Funds. The Board also considered the history, reputation, qualifications and background of the Adviser as well as the qualifications if its personnel.
b. The Board, including the Independent Directors, also considered the character and amount of other direct and incidental benefits received by the Adviser and its affiliates from their association with the Funds, including the benefits received by the affiliated distributor. The Board concluded that potential “fall-out” benefits that the Adviser and its affiliates may receive, such as greater name recognition or increased ability to obtain research services (although the Board noted that the Adviser currently does not use soft dollars to obtain research services), appear to be reasonable, and may in some cases benefit the Funds. | Conclusions. In considering the renewal of the Investment Advisory Agreement, the Board, including the Independent Directors, did not identify any factor as all-important or all-controlling and instead considered the above listed and other factors collectively in light of the Funds’ surrounding circumstances. Each Director gave the weight to each factor that he deemed appropriate in his own judgment. The Board considered the renewal of the Investment Advisory Agreement on a Fund-by-Fund basis and determined that the renewal of the Investment Advisory Agreement was in the best interests of the shareholders of each Fund. The Board also determined that the fees charged to each Fund for the services provided were reasonable. Therefore, the Board, including the Independent Directors, determined that continuance of the Investment Advisory Agreement was in the best interests of each Fund. |
| LARGE CAP VALUE FUND | 23 | |||
MANAGEMENT OF THE COMPANY (UNAUDITED)
Information pertaining to the Directors and Officers of the Company is set forth below. The Statement of Additional Information includes additional information about the Directors and is available without charge, upon request, by calling 516-390-5565.
Name, Address and (Age) Position(s) with the Company | Term of Office1 of Time Served | Principal Occupation(s) During Past Five Years | Number of Portfolios Overseen by Director | Other Directorships Held by Director | ||||
| INTERESTED DIRECTORS | ||||||||
David Lerner2 (72) 477 Jericho Turnpike Syosset, New York 11791 Director, Chairman of the Board, President | Since 1998 | President and founder, David Lerner Associates, Inc., a registered broker-dealer; President, Spirit of America Management Corp., the Company’s investment adviser; and Chief Executive Officer and President of SSH Securities, Inc., the Company’s Distributor. | 4 | Director of Spirit of America Management Corp., the Company’s investment adviser; Director of David Lerner Associates, Inc., a registered broker-dealer and the Company’s Distributor. | ||||
Daniel Lerner2 (47) 477 Jericho Turnpike Syosset, New York 11791 Director | Since 1998 | Senior Vice President, Investment Counselor with David Lerner Associates, Inc., a registered broker-dealer, since September 2000. Previously: Broker with Prudential Securities from February 2000 to July 2000; Broker with Bear Stearns from January 1999 to May 1999; Vice President of SSH Securities, Inc., the Company’s Distributor and Senior Vice President. | 4 | Director of David Lerner Associates, Inc., a registered broker-dealer and the Company’s Distributor. | ||||
| INDEPENDENT DIRECTORS | ||||||||
Allen Kaufman (72) c/o 477 Jericho Turnpike Syosset, New York 11791 Director | Since 1998 | President and Chief Executive Officer of K.G.K. Agency, Inc., a property and casualty insurance agency, since 1963. | 4 | Director of K.G.K. Agency, Inc., a property and casualty insurance agency. | ||||
Stanley S. Thune (72) c/o 477 Jericho Turnpike Syosset, New York 11791 Director | Since 1998 | President and Chief Executive Officer, Freight Management Systems, Inc., a third party logistics management company, since 1994; private investor. | 4 | Director of Freight Management Systems, Inc. | ||||
Richard Weinberger (72) c/o 477 Jericho Turnpike Syosset, New York 11791 Director | Since 2005 | Of Counsel to Ballon Stoll Bader & Nadler, P.C., a mid-sized law firm, since January 2005; Shareholder, Ballon Stoll Bader & Nadler, P.C., January 2000 to December 2004. | 4 | None. | ||||
| OFFICERS | ||||||||
David Lerner President (see biography above) | ||||||||
Alan P. Chodosh (55) 477 Jericho Turnpike Syosset, New York 11791 Treasurer and Secretary | Since 2003 (Treasurer) Since 2005 (Secretary) | Executive Vice President and Chief Financial Officer of David Lerner Associates, Inc. since June 1997. | N/A | N/A | ||||
Joseph Pickard (48) 477 Jericho Turnpike Syosset, New York 11791 Chief Compliance Officer | Since 2007 | Chief Compliance Officer of Spirit of America Investment Fund, Inc. and Spirit of America Management Corp. since July 2007; Counsel to the Interested Directors of Spirit of America Investment Fund, Inc. since July 2002; General Counsel of David Lerner Associates, Inc. since July 2002. | N/A | N/A | ||||
| 1 | Each Director serves for an indefinite term, until his successor is elected. |
| 2 | David Lerner is an “interested” Director, as defined in the 1940 Act, by reason of his positions with the Adviser and Distributor, and Daniel Lerner is an “interested” Director by reason of his position with the Distributor. Daniel Lerner is the son of David Lerner. |
| 24 | SPIRIT OF AMERICA | |||


| Item 2. | Code of Ethics. |
| (a) | The registrant, as of the end of the period covered by this report, has adopted a code of ethics that applies to the registrant’s principal executive officer, principal financial officer, principal accounting officer or controller, or persons performing similar functions, regardless of whether these individuals are employed by the registrant or a third party. |
| (b) | Not applicable. |
| (c) | There have been no amendments, during the period covered by this report, to a provision of the code of ethics that applies to the registrant’s principal executive officer, principal financial officer, principal accounting officer or controller, or persons performing similar functions, regardless of whether these individuals are employed by the registrant or a third party, and that relates to any element of the code of ethics description. |
| (d) | The registrant has not granted any waivers, including an implicit waiver, from a provision of the code of ethics that applies to the registrant’s principal executive officer, principal financial officer, principal accounting officer or controller, or persons performing similar functions, regardless of whether these individuals are employed by the registrant or a third party, that relates to one or more of the items set forth in paragraph (b) of this item’s instructions. |
| (e) | Not applicable. |
| (f) | The registrant’s code of ethics—filed herewith. |
| Item 3. | Audit Committee Financial Expert. |
Registrant’s Board of Directors has determined that it does not have an “audit committee financial expert” serving on its audit committee. While Registrant believes that each of the members of its audit committee has sufficient knowledge of accounting principles and financial statements to serve on the audit committee, none has the requisite experience to qualify as an “audit committee financial expert”; as such term is defined by the Securities and Exchange Commission.
| Item 4. | Principal Accountant Fees and Services. |
Audit Fees
| (a) | The aggregate fees billed for each of the last two fiscal years for professional services rendered by the principal accountant for the audit of the registrant’s annual financial statements or services that are normally provided by the accountant in connection with statutory and regulatory filings or engagements for fiscal years ended October 31, 2007, December 31, 2007 and December 31, 2008 are $31,200, $31,200 and $47,700, respectively. |
Audit-Related Fees
| (b) | The aggregate fees billed for assurance and related services by the principal accountant that are reasonably related to the performance of the audit of the registrant’s financial statements and are not reported under paragraph (a) of this Item for fiscal years ended October 31, 2007, December 31, 2007 and December 31, 2008 are $0, $0 and $0, respectively. |
Tax Fees
| (c) | The aggregate fees billed for professional services rendered by the principal accountant for tax compliance, tax advice, and tax planning for fiscal years ended October 31, 2007, December 31, 2007 and December 31, 2008 are $0, $0 and $0, respectively. |
All Other Fees
| (d) | The aggregate fees billed for products and services provided by the principal accountant, other than the services reported in paragraphs (a) through (c) of this Item for fiscal years ended October 31, 2007, December 31, 2007 and December 31, 2008 are $0, $0 and $0, respectively. |
| (e)(1) | Disclose the audit committee’s pre-approval policies and procedures described in paragraph (c)(7) of Rule 2-01 of Regulation S-X. |
Pre-Approval of Audit and Permitted Non-Audit Services Provided to the Company
Pre-Approval Requirements. The Committee shall pre-approve all auditing services and permissible non-audit services (e.g., tax services) to be provided to the Company by the Auditor, including the fees therefor. The Committee may delegate to one or more of its members the authority to grant pre-approvals. In connection with such delegation, the Committee shall establish pre-approval policies and procedures, including the requirement that the decisions of any member to whom authority is delegated under this section (B) shall be presented to the full Committee at each of its scheduled meetings.
De Minimis Exception to Pre-Approval: Pre-approval for a permitted non-audit service shall not be required if:
| a. | the aggregate amount of all such non-audit services is not more than 5% of the total revenues paid by the Company to the Auditor in the fiscal year in which the non-audit services are provided; |
| b. | such services were not recognized by the Company at the time of the engagement to be non-audit services; and |
| c. | such services are promptly brought to the attention of the Committee and approved prior to the completion of the audit by the Committee or by one or more members of the Committee to whom authority to grant such approvals has been delegated by the Committee. |
Additionally, the Committee shall pre-approve the Auditor’s engagements for non-audit services with the Adviser and any affiliate of the Adviser that provides ongoing services to the Company in accordance with the foregoing, if the engagement relates directly to the operations and financial reporting of the Company, unless the aggregate amount of all services provided constitutes no more than 5% of the total amount of revenues paid to the Auditor by the Company, the Adviser and any affiliate of the Adviser that provides ongoing services to the Company during the fiscal year in which the services are provided that would have to be pre-approved by the Committee pursuant to this paragraph (without regard to this exception).
| (e)(2) | The percentage of services described in each of paragraphs (b) through (d) of this Item that were approved by the audit committee pursuant to paragraph (c)(7)(i)(C) of Rule 2-01 of Regulation S-X are as follows: |
| (b) | N/A |
| (c) | N/A |
| (d) | N/A |
| (f) | The percentage of hours expended on the principal accountant’s engagement to audit the registrant’s financial statements for the most recent fiscal year that were attributed to work performed by persons other than the principal accountant’s full-time, permanent employees was 0%. |
| (g) | The aggregate non-audit fees billed by the registrant’s accountant for services rendered to the registrant, and rendered to the registrant’s investment adviser (not including any sub-adviser whose role is primarily portfolio management and is subcontracted with or overseen by another investment adviser), and any entity controlling, controlled by, or under common control with the adviser that provides ongoing services to the registrant for fiscal years ended October 31, 2007, December 31, 2007 and December 31, 2008 are $0, $0 and $0, respectively. |
| (h) | The registrant’s audit committee of the board of directors has considered whether the provision of non-audit services that were rendered to the registrant’s investment adviser (not including any sub-adviser whose role is primarily portfolio management and is subcontracted with or overseen by another investment adviser), and any entity controlling, controlled by, or under common control with the investment adviser that provides ongoing services to the registrant that were not pre-approved pursuant to paragraph (c)(7)(ii) of Rule 2-01 of Regulation S-X is compatible with maintaining the principal accountant’s independence. |
| Item 5. | Audit Committee of Listed registrants. |
Not applicable.
| Item 6. | Investments. |
| (a) | Schedule of Investments in securities of unaffiliated issuers as of the close of the reporting period is included as part of the report to shareholders filed under Item 1 of this form. |
| (b) | Not applicable. |
| Item 7. | Disclosure of Proxy Voting Policies and Procedures for Closed-End Management Investment Companies. |
Not applicable.
| Item 8. | Portfolio Managers of Closed-End Management Investment Companies. |
Not applicable.
| Item 9. | Purchases of Equity Securities by Closed-End Management Investment Company and Affiliated Purchasers. |
Not applicable.
| Item 10. | Submission of Matters to a Vote of Security Holders. |
There have been no material changes to the procedures by which the shareholders may recommend nominees to the registrant’s board of directors, where those changes were implemented after the registrant last provided disclosure in response to the requirements of Item 407(c)(2)(iv) of Regulation S-K (17 CFR 229.407) (as required by Item 22(b)(15) of Schedule 14A (17 CFR 240.14a-101)), or this Item.
| Item 11. | Controls and Procedures. |
| (a) | The registrant’s principal executive and principal financial officers, or persons performing similar functions, have concluded that the registrant’s disclosure controls and procedures (as defined in Rule 30a-3(c) under the Investment Company Act of 1940, as amended (the “1940 Act”) (17 CFR 270.30a-3(c))) are effective, as of a date within 90 days of the filing date of the report that includes the disclosure required by this paragraph, based on their evaluation of these controls and procedures required by Rule 30a-3(b) under the 1940 Act (17 CFR 270.30a-3(b)) and Rules 13a-15(b) or 15d-15(b) under the Securities Exchange Act of 1934, as amended (17 CFR 240.13a-15(b) or 240.15d-15(b)). |
| (b) | There were no changes in the registrant’s internal control over financial reporting (as defined in Rule 30a-3(d) under the 1940 Act (17 CFR 270.30a-3(d)) that occurred during the registrant’s second fiscal quarter of the period covered by this report that has materially affected, or is reasonably likely to materially affect, the registrant’s internal control over financial reporting. |
| Item 12. | Exhibits. |
| (a)(1) | Financial Officer Code of Ethics. |
| (a)(2) | Certifications pursuant to Rule 30a-2(a) under the 1940 Act and Section 302 of the Sarbanes-Oxley Act of 2002 are attached hereto. |
| (a)(3) | Not applicable. |
| (b) | Certifications pursuant to Rule 30a-2(b) under the 1940 Act and Section 906 of the Sarbanes-Oxley Act of 2002 are attached hereto. |
| (c) | A copy of the Registrant’s notices to shareholders pursuant to Rule 19(a) under the 1940 Act, which accompanied distributors paid pursuant to the Registrant’s Managed Distribution Plan, are filed herewith, as required by the terms of the Fund’s exemptive order. |
SIGNATURES
Pursuant to the requirements of the Securities Exchange Act of 1934 and the Investment Company Act of 1940, the registrant has duly caused this report to be signed on its behalf by the undersigned, thereunto duly authorized.
| (registrant) | Spirit of America Investment Fund, Inc. |
| By (Signature and Title)* | /s/ David Lerner | |
| David Lerner, Principal Executive Officer | ||
| (principal executive officer) | ||
| Date | 2/26/09 |
Pursuant to the requirements of the Securities Exchange Act of 1934 and the Investment Company Act of 1940, this report has been signed below by the following persons on behalf of the registrant and in the capacities and on the dates indicated.
| By (Signature and Title)* | /s/ David Lerner | |
| David Lerner, Principal Executive Officer | ||
| (principal executive officer) |
| Date | 2/26/09 |
| By (Signature and Title)* | /s/ Alan Chodosh | |
| Alan Chodosh, Principal Financial Officer | ||
| (principal financial officer) | ||
| Date | 2/26/09 |
* | Print the name and title of each signing officer under his or her signature. |