UNITED STATES
SECURITIES AND EXCHANGE COMMISSION
Washington, D.C. 20549
FORM N-CSR
CERTIFIED SHAREHOLDER REPORT OF REGISTERED
MANAGEMENT INVESTMENT COMPANIES
Investment Company Act file number 811-08243
Direxion Funds
(Exact name of registrant as specified in charter)
33 Whitehall Street, 10th Floor
New York, NY 10004
(Address of principal executive offices) (Zip code)
Daniel D. O’Neill
33 Whitehall Street, 10th floor
New York, NY 10004
(Name and address of agent for service)
646-572-3390
Registrant’s telephone number, including area code
Date of fiscal year end: October 31, 2011
Date of reporting period: October 31, 2011
Item 1. Report to Stockholders.

ANNUAL REPORT OCTOBER 31, 2011
33 Whitehall Street, 10th Floor New York, New York 10004 (800) 851-0511
Commodity Trends Strategy Fund (Consolidated)
Currency Trends Strategy Fund
(formerly Financial Trends Strategy Fund)
Direxion/Wilshire Dynamic Fund
Direxion Long/Short Global IPO Fund

Help Preserve the Environment – Go Green!
Go paperless with Direxion e-Delivery – a service allowing shareholders to reduce clutter with full online access to regulatory documents. Begin the preservation process with e-delivery.
With Direxion e-Delivery you can:
| | • | | Receive email notifications when your most recent shareholder communications are available for review. |
| | • | | Access prospectuses, annual reports and semiannual reports online. |
It’s easy to enroll:
| 1. | | Visit www.direxionfunds.com/edelivery |
| 2. | | Follow the simple enrollment instructions |
If you have questions about Direxion e-Delivery services, contact one of our shareholder representatives at 800-851-0511.

Table of Contents
LETTERTO SHAREHOLDERS
Dear Shareholders,
This Annual Report covers the Direxion/Wilshire Dynamic Fund (the “Dynamic Fund”), the Commodity Trends Strategy Fund, the Currency Trends Strategy Fund and the Direxion Long/Short Global IPO Fund (“Global IPO Fund”) for the period of November 1, 2010 to October 31, 2011 (the “Annual Period”). During the Annual Period, the DJ Industrial Average Index returned 10.33%, the S&P 500 Index returned 7.98% the Barclay Capital Aggregate Bond Index returned 5.00% and the NASDAQ-100 Index returned 12.08%.
As we continue to endure a slow and painful recovery, it is evident Western economies will not emerge from the global financial crisis in the same fashion as past recessions. Through global collaboration, governments are seeking innovative ways to stimulate economic growth; although, with global interest rates at all time lows, options are limited for the debt-laden West. Growth in the United States continues at a very sluggish pace and unemployment remains high, 9.0% at period end. Manufacturing levels are unfortunately low, as the Western consumer continues the personal deleveraging process.
Since last fiscal year, the European economic situation has deteriorated dramatically. As we know, much of the same credit related concerns facing the U.S. are shared by our European counterparts. It has become evident the less industrious nations in the European Union (Greece, Spain, Portugal, Italy, etc.) will struggle to stay within the European Union given current levels of debt. That said, it has been up to their stronger-funded partners like France and Germany to dictate the terms of their economic future. The discussion surrounding a breakup of the Euro has become a very real possibility, as it would afford these debt strapped countries increased flexibility in order to stave off default.
China’s growth has continued to outpace the rest of the developed global economies. While the Chinese have produced significant economic growth, their developing economic counterparts like India, Russia and Brazil also continue to post strong growth numbers. Despite the Western economic outlook, United States government bond yields are breaking record lows, signaling there is still significant interest in U.S. debt.
The Dynamic Fund uses built-in tactical strategies to attempt to capitalize on short-term market inefficiencies, designed for investors seeking to outperform a traditional strategic (long-term only) asset allocation approach. The Dynamic Fund seeks capital appreciation. To achieve its investment objective, the Dynamic Fund combines a strategic asset allocation with a “tactical overlay” to position the Dynamic Fund defensively or aggressively, depending upon the outlook of the Wilshire Associates Incorporated (the “Sub-Adviser”). Under normal circumstances, the Dynamic Fund is managed by the Rafferty Asset Management, LLC (“Rafferty” or the “Adviser”) pursuant to the Sub-Adviser’s traditional asset allocation model. This model allocates approximately 60% of the Dynamic Fund’s total assets to equity securities and 40% to fixed income securities, with a tactical overlay to increase or decrease the Dynamic Fund’s risk exposure based on the Sub-adviser’s outlook for the market. The Sub-Adviser’s tactical model evaluates asset class allocations on a monthly basis. In response to market conditions, the Sub-Adviser may recommend that the Adviser rebalance the Dynamic Fund’s portfolio, use short positions and/or employ leverage in its tactical allocations.
The Dynamic Fund Investor Class returned 3.17% as compared to a total net return of 1.76% from the MSCI World Index, 5.00% for the Barclays Capital Aggregate Bond Index and 3.06% for a composite of the two.
Equity and fixed income markets both domestically and abroad were extremely choppy over the one year period ending November 2011. Macro themes dominated during the period as conflict in the Middle East, the nuclear situation in Japan, a downgrade of U.S. Treasury securities and more led investors to make frequent shifts between risk-on and risk-off modes. Broadly speaking, the Dynamic Fund was modestly underweight both U.S. and international equities during the Annual Period due to a noticeable rise in market volatility in the U.S. and the continued compression of future growth prospects in the European region. The Fund was modestly overweight U.S. investment grade debt, TIPS and high yield for much of the Annual Period which proved beneficial as fixed income offered downside protection as markets sold-off. Towards the end of the Annual Period, the Fund shifted towards a modestly overweight position in commodities after having a neutral weight in this asset class for most of the period. Correlations across asset classes tend to increase during higher volatility market environments, thus limiting the effectiveness of risk diversification.
The Commodity Trends Strategy Fund, the Currency Trends Strategy Fund and the Direxion Long/Short Global IPO Fund incorporate long/short, tactical strategies with exposure to alternative asset classes.
The performance data quoted represents past performance; past performance does not guarantee future results. The investment return and principal value of an investment will fluctuate and an investor’s shares, when redeemed, may be worth more or less than their original cost. Current performance may be higher or lower than the performance data quoted. To obtain performance data current to the most recent month-end, please call, toll-free, 1-800-851-0511 or visit www.direxionfunds.com.
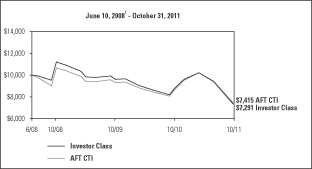
The Commodity Trends Strategy Fund seeks investment results comparable to the performance of the AFT Commodity Trends Indicator (“AFT CTI”). The Commodity Trends Strategy Fund Investor Class returned -16.52% The AFT CTI itself declined -14.04%.
The Annual Period proved to be a challenging time for long/short commodity strategies. Lack of sustainable trends in commodity prices has adversely impacted performance of the Commodity Trend Strategies Fund as the Fund sought to benefit from directional price trends. The Fund was positioned overweight long through the majority of the first half of the Annual Period, which helped performance as most commodities traded higher. Most notably, the Fund was long crude oil, which was up 32.52% over the first six months of the Annual Period. Despite the strong performance over the first half of the Annual Period, the Fund struggled to retain those gains. This was due to long positions in grains like wheat and corn, which sold off precipitously in September and October based on a perceived slowdown in demand from the developing world. These types of whipsawing markets make it difficult for a trend-following approach such as the Fund follows.
The Currency Trends Strategy Fund seeks investment results comparable to the performance of the AFT FX Trends Indicator (“AFT FXTI”). Prior to September 1, 2011, the Currency Trends Strategy Fund was named the Financial Trends Strategy Fund and it sought investment results comparable to the AFT Financial Trends Indicator (“AFT FTI”). The Currency Trends Strategy Fund Investor Class returned -7.02%, the AFT FXTI returned -3.49% and the AFT FTI itself returned -3.33%.
The Annual Period proved difficult for currency trend following strategies. Volatility in the currency markets was the major global theme of the year with the risk on/risk off trader mentality hurting trend followers. Tensions in Europe, and general concerns about global economic growth potential caused wild fluctuations in currency prices. Most notably, investors sent the U.S. Dollar on a rollercoaster ride, trading much lower as compared to the major G10 countries through the first half of the Annual Period, and subsequently rallying into the end of the period. September and October were notably tough months for the Currency Trends Strategy Fund, erasing all accumulated gains on the year finishing -6.53% over the two month period. Emerging Market currencies fared best over the Annual Period with the South African Rand and the Mexican Peso finishing positive 13.73% and 8.15%, respectively. Developed Market currencies like the Yen and Swiss Franc fared the worst, closing the period down -2.77% and -10.73%, respectively against the dollar. The U.S. Dollar strengthened in the month of September, largely due to the flight to safety as a result of the continued Euro zone crisis. The Fund was predominantly positioned to benefit if the U.S. Dollar weakened, negatively impacting the Fund’s performance during that period.
The Global IPO Fund seeks capital appreciation through a risk-controlled portfolio. To achieve its investment objective, the Fund utilizes three components to implement its global long/short initial public offering (“IPO”) investment strategy. The first component is a long position in the IPOX Global Sequential Portfolio, which is an index of securities that recently went public (the “Long Component”). The second component is a short position in board based market indexes (the “Short Component”). The IPO Fund is currently invested in three broad based market indexes and gains this exposure by investing in other ETFs. The three broad based market indexes are the MSCI Emerging Markets Index, the MSCI US Board Market Index and the FTSE China 25 Index. The final component is participation in IPOs. For every one dollar that is invested in the Long Component, the IPO Fund invests 35% to 100% of that amount in the Short Component.
The Global IPO Fund Investor Class returned -11.76%. The portion of the portfolio that invests in the IPOX Global Long/Short Index returned -6.73% for the Annual Period. The Annual Period was a tale of two IPO markets. The first half of the year was very active, with the IPO calendar seeing record issuances, as the fears of a sputtering economy began to abate. Issuances came to a screeching halt in early August as the capital markets were presenting less favorable outlooks for companies looking to go public and capital became scarce. It is worth noting that the Fund participated in 128 initial public offerings over the Annual Period. Top performers in IPOs that the Fund participated in included: The Fresh Market (TFM), GNC Holdings (GNC), SodaStream (SODA) and Linkedin (LNKD). The fund was able to participate in the majority of IPOs that came to market over the period. The Fund’s hedge (shorting component) provided some protection during the significant downdrafts in the equity markets of Q3. However, this was not enough to offset the difficult performance period of the global IPO markets, led by the broader equity market selloff. Towards the end of the Annual Period, the Fund changed its hedging techniques to provide a more comprehensive hedge of the global equity markets. This hedge has proven to be more effective since initiation.
Looking ahead to 2012, in the spirit of our continued commitment to our shareholders, we have reassessed the Funds in order to provide an improved risk/return profiles to our shareholders. Effective February 1, 2012, the Commodity Trends Strategy Fund will change its underlying index to the Auspice Broad Commodity Index, a rules-based, long/flat commodity
The performance data quoted represents past performance; past performance does not guarantee future results. The investment return and principal value of an investment will fluctuate and an investor’s shares, when redeemed, may be worth more or less than their original cost. Current performance may be higher or lower than the performance data quoted. To obtain performance data current to the most recent month-end, please call, toll-free, 1-800-851-0511 or visit www.direxionfunds.com.
index. Our focus is to provide shareholders access to commodities while mitigating downside risk. A long/flat approach will allow the Fund to take advantage of higher commodity prices and at the same time shift into a cash position of an individual commodity that shows a downward trend in price. The Fund will be renamed the Direxion Commodity Indexed Strategy Fund.
Effective February 1, 2012, the Currency Trends Strategy Fund will begin to seek 150% of the calendar month performance of the AFT FXTI, while implementing a strategic overlay to maintain the Fund’s exposure to the AFT FXTI between 145% and 155%. This change will provide our shareholders with the potential for an improved return profile while keeping the overall risk characteristics within our expectation for the currency asset class. Currencies, as an asset class, generally exhibit low levels of volatility providing the opportunity to employ leverage. Finally, the Global IPO Fund will change the index used as the Long Component of its investment strategy. Effective February 1, 2012, the index used as the Long Component will be the FTSE Renaissance Global IPO Index. Though the Fund’s investment objective remains to provide a long/short approach to IPO investing, this change in index will help to provide better access to IPOs in a timely fashion and broader diversification of global IPO stocks.
As further testament to our commitment to our shareholders, we are lowering the annual expenses incurred in each Fund effective February 1, 2012. By reducing the costs incurred, we believe our shareholders will be better positioned to achieve long-tern success in our strategies.
Also please note that effective February 1, 2012, each Fund will start selling Class A shares and the existing Investor Class shareholders will have their shares converted to Class A shares (load waived).
As always, we thank you for using the Direxion Funds and we look forward to our mutual success.
Best Regards,
| | |
 | |  |
Daniel O’Neill Chief Investment Officer | | Patrick Rudnick Principal Financial Officer |
The performance data quoted represents past performance; past performance does not guarantee future results. The investment return and principal value of an investment will fluctuate and an investor’s shares, when redeemed, may be worth more or less than their original cost. Current performance may be higher or lower than the performance data quoted. To obtain performance data current to the most recent month-end, please call, toll-free, 1-800-851-0511 or visit www.direxionfunds.com.
The total annual fund operating expense ratios of the Direxion/Wilshire Dynamic Fund Investor Class, Commodity Trends Strategy Fund Investor Class, Currency Trends Strategy Fund Investor Class and the Direxion Long/Short Global IPO Fund Investor Class is 1.58%, 1.75%, 1.77% and 1.90%, respectively, net of any fee, waivers or expense reimbursements.*
An investment in any of the Direxion Funds is subject to a number of risks that could affect the value of its shares. It is important that investors closely review and understand these risks before making an investment. An investor should consider the investment objectives, risks, charges and expenses of the Direxion Funds carefully before investing. The prospectus contains this and other information about the Direxion Funds. To obtain a prospectus, please call the Direxion Funds at 1-800-851-0511 or visit www.direxionfunds.com. The prospectus should be read carefully before investing.
Distributed by: Rafferty Capital Markets, LLC.
Date of First Use: December 22, 2011
* The total annual fund operating expense ratios include Acquired Fund Fees and Expenses, indirect fees and expenses that the Funds incur that are required to be disclosed. Without Acquired Fund Fees and Expenses, total annual operating expense ratios of the Direxion/Wilshire Dynamic Fund Investor Class, Commodity Trends Strategy Fund Investor Class, Currency Trends Strategy Fund Investor Class and the Direxion Long/Short Global IPO Fund Investor Class is 1.40%, 1.74%, 1.75% and 1.79%, respectively.
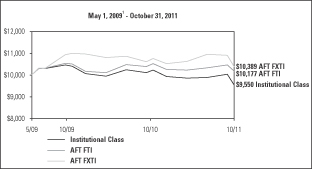
Commodity Trends Strategy Fund (Consolidated)
Performance Summary (Unaudited)
Investor Class
Institutional Class
C Class
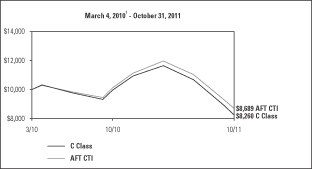
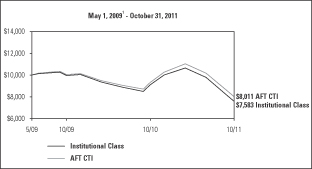
This chart illustrates the performance of a hypothetical $10,000 investment made on the Fund’s inception, and is not intended to imply any future performance. The returns shown do not reflect the deduction of taxes that a shareholder would pay on fund distributions of the redemption of fund shares. The performance of the Alpha Financial Technologies Commodity Trends Indicator (“AFT CTI”), the Fund’s benchmark, does not reflect the deduction of fees associated with a mutual fund, such as investment management fees. Investors cannot invest directly in an index, although they can invest in its underlying securities.
The Fund may impose a 1.00% redemption fee on Investor Class and Institutional Class shares redeemed (through sales or exchanges) within 90 days of the date of purchase. Performance data does not reflect the redemption fee. If reflected, total returns would be reduced.
The Fund imposes a 1.00% contingent deferred sales charge of the net amount of the redemption of C Class shares if redeemed within 12 months of purchase.
The performance data shown represents past performance and does not guarantee future results.
| | | | | | | | | | | | |
| | | Average Annual Total Return2 | |
| | | 1 Year | | | 3 Year | | | Since Inception | |
Investor Class | | | (16.52 | )% | | | (13.38 | )% | | | (8.89 | )% |
AFT CTI | | | (14.04 | )% | | | (11.37 | )% | | | (8.44 | )% |
| | | | | | | | |
| | | Average Annual Total Return2 | |
| | | 1 Year | | | Since Inception | |
Institutional Class | | | (16.38 | )% | | | (10.46 | )% |
AFT CTI | | | (14.04 | )% | | | (8.48 | )% |
| | | | | | | | |
| | | Average Annual Total Return2 | |
| | | 1 Year | | | Since Inception | |
C Class3 | | | (17.04 | )% | | | (10.88 | )% |
AFT CTI | | | (14.04 | )% | | | (8.12 | )% |
Market Exposure
| | | | |
Investment Type | | %
Net Assets | |
Common Stocks | | | 0.0% | |
Swap Contracts | | | 100.9% | |
| | | | |
Total Exposure | | | 100.9% | |
| | | | |
“Market Exposure” includes the value of total investments (including the contract value of any derivatives) and excludes any short-term investments and cash equivalents divided by Net Assets.
| 1 | Commencement of operations. |
| 2 | As of October 31, 2011. |
| 3 | These returns do not include the contingent deferred sales charge. Had this sales charge been included the 1 year total return would be (17.87)%. |
Currency Trends Strategy Fund
Performance Summary (Unaudited)
Investor Class
Institutional Class
C Class
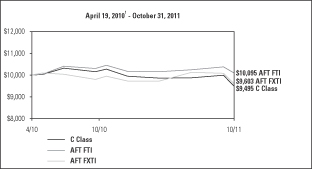
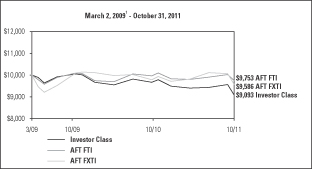
This chart illustrates the performance of a hypothetical $10,000 investment made on the Fund’s inception, and is not intended to imply any future performance. The returns shown do not reflect the deduction of taxes that a shareholder would pay on fund distributions of the redemption of fund shares. The performance of the Alpha Financial Technologies Financial Trends Indicator (“AFT FTI”) and the Alpha Financial Technologies FX Trends Indicator (“AFT FXTI”), the Fund’s benchmark, does not reflect the deduction of fees associated with a mutual fund, such as investment management fees. Investors cannot invest directly in an index, although they can invest in its underlying securities.
The Fund may impose a 1.00% redemption fee on Investor Class and Institutional Class shares redeemed (through sales or exchanges) within 90 days of the date of purchase. Performance data does not reflect the redemption fee. If reflected, total returns would be reduced.
The Fund imposes a 1.00% contingent deferred sales charge of the net amount of the redemption of C Class shares if redeemed within 12 months of purchase.
The performance data shown represents past performance and does not guarantee future results.
| | | | | | | | |
| | | Average Annual Total Return2 | |
| | | 1 Year | | | Since Inception | |
Investor Class | | | (7.02 | )% | | | (3.50 | )% |
AFT FTI3 | | | (3.33 | )% | | | (0.93 | )% |
AFT FXTI3 | | | (3.49 | )% | | | (1.57 | )% |
| | | | | | | | |
| | | Average Annual Total Return2 | |
| | | 1 Year | | | Since Inception | |
Institutional Class | | | (6.63 | )% | | | (1.82 | )% |
AFT FTI3 | | | (3.33 | )% | | | 0.71 | % |
AFT FXTI3 | | | (3.49 | )% | | | 1.54 | % |
| | | | | | | | |
| | | Average Annual Total Return2 | |
| | | 1 Year | | | Since Inception | |
C Class4 | | | (7.52 | )% | | | (3.32 | )% |
AFT FTI3 | | | (3.33 | )% | | | 0.62 | % |
AFT FXTI3 | | | (3.49 | )% | | | (2.60 | )% |
Market Exposure
| | | | |
Investment Type | | %
Net Assets | |
Swap Contracts | | | 99.6% | |
| | | | |
Total Exposure | | | 99.6% | |
| | | | |
“Market Exposure” includes the value of total investments (including the contract value of any derivatives) and excludes any short-term investments and cash equivalents divided by Net Assets.
| 1 | Commencement of operations. |
| 2 | As of October 31, 2011. |
| 3 | On September 1, 2011, the AFT FXTI replaced the AFT FTI as benchmark. |
| 4 | These returns do not include the contingent deferred sales charge. Had this sales charge been included the 1 year total return would be (8.44)%. |
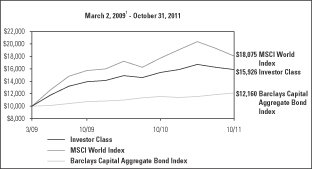
Direxion/Wilshire Dynamic Fund
Performance Summary (Unaudited)
Investor Class
C Class
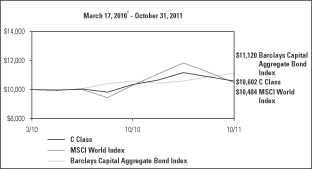
This chart illustrates the performance of a hypothetical $10,000 investment made on the Fund’s inception, and is not intended to imply any future performance. The returns shown do not reflect the deduction of taxes that a shareholder would pay on fund distributions of the redemption of fund shares. The performance of the MSCI World Index and Barclays Capital Aggregate Bond Index do not reflect the deduction of fees associated with a mutual fund, such as investment management fees. Investors cannot invest directly in an index, although they can invest in its underlying securities.
The Fund may impose a 1.00% redemption fee on Investor Class shares redeemed (through sales or exchanges) within 90 days of the date of purchase. Performance data does not reflect the redemption fee. If reflected, total returns would be reduced.
The Fund imposes a 1.00% contingent deferred sales charge of the net amount of the redemption of C Class shares if redeemed within 12 months of purchase.
The performance data shown represents past performance and does not guarantee future results.
| | | | | | | | |
| | | Average Annual Total Return2 | |
| | | 1 Year | | | Since Inception | |
Investor Class | | | 3.17 | % | | | 19.07 | % |
MSCI World Index | | | 1.76 | % | | | 24.86 | % |
Barclays Capital Aggregate Bond Index | | | 5.00 | % | | | 7.61 | % |
| | | | | | | | |
| | | Average Annual Total Return2 | |
| | | 1 Year | | | Since Inception | |
C Class3 | | | 2.40 | % | | | 3.66 | % |
MSCI World Index | | | 1.76 | % | | | 2.95 | % |
Barclays Capital Aggregate Bond Index | | | 5.00 | % | | | 6.75 | % |
Market Exposure
| | | | |
Investment Type | | %
Net Assets | |
Investment Companies | | | 31.3% | |
Swap Contracts | | | 68.7% | |
| | | | |
Total Exposure | | | 100.0% | |
| | | | |
“Market Exposure” includes the value of total investments (including the contract value of any derivatives) and excludes any short-term investments and cash equivalents divided by Net Assets.
| 1 | Commencement of operations. |
| 2 | As of October 31, 2011. |
| 3 | These returns do not include the contingent deferred sales charge. Had this sales charge been included the 1 year total return would be 1.38%. |
Direxion Long/Short Global IPO Fund
Performance Summary (Unaudited)
Investor Class
C Class
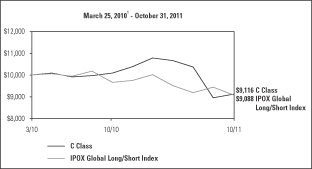
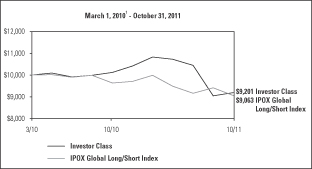
This chart illustrates the performance of a hypothetical $10,000 investment made on the Fund’s inception, and is not intended to imply any future performance. The returns shown do not reflect the deduction of taxes that a shareholder would pay on fund distributions of the redemption of fund shares. The performance of the IPOX Global Long/Short Index does not reflect the deduction of fees associated with a mutual fund, such as investment management fees. Investors cannot invest directly in an index, although they can invest in its underlying securities.
The Fund may impose a 1.00% redemption fee on Investor Class shares redeemed (through sales or exchanges) within 90 days of the date of purchase. Performance data does not reflect the redemption fee. If reflected, total returns would be reduced.
The Fund imposes a 1.00% contingent deferred sales charge of the net amount of the redemption of C Class shares if redeemed within 12 months of purchase.
The performance data shown represents past performance and does not guarantee future results.
| | | | | | | | |
| | | Average Annual Total Return2 | |
| | | 1 Year | | | Since Inception | |
Investor Class | | | (11.76 | )% | | | (4.87 | )% |
IPOX Global Long/Short Index | | | (6.73 | )% | | | (5.73 | )% |
| | | | | | | | |
| | | Average Annual Total Return2 | |
| | | 1 Year | | | Since Inception | |
C Class3 | | | (12.29 | )% | | | (5.61 | )% |
IPOX Global Long/Short Index | | | (6.73 | )% | | | (5.79 | )% |
Market Exposure
| | | | |
Investment Type | | %
Net Assets | |
Common Stocks | | | 51.8% | |
Swap Contracts | | | (10.5)% | |
| | | | |
Total Exposure | | | 41.3% | |
| | | | |
“Market Exposure” includes the value of total investments (including the contract value of any derivatives) and excludes any short-term investments and cash equivalents divided by Net Assets.
| 1 | Commencement of operations. |
| 3 | These returns do not include the contingent deferred sales charge. Had this sales charge been included the 1 year total return would be (13.17)%. |
| | |
| | |
| 10 | | DIREXION ANNUAL REPORT |
Expense Example
October 31, 2011 (Unaudited)
As a shareholder of a mutual fund, you incur two types of costs: (1) transaction costs, including sales charges (loads) on purchase payments, reinvested dividends, or other distributions; redemption fees; and exchange fees; and (2) ongoing costs, including management fees; distribution and/or service fees; and other fund expenses. This example is intended to help you understand your ongoing costs (in dollars) of investing in a fund and to compare costs with the ongoing costs of investing in other mutual funds.
The example is based on an investment of $1,000 invested at the beginning of the period and held the entire period (May 1, 2011 — October 31, 2011).
Actual Expenses
The first line of the table below provides information about actual account values and actual expenses. You will be charged a redemption fee equal to 1.00% of the net amount of the redemption if you redeem Investor Class or Institutional Class shares of the Fund that have been held for less than 90 days. You may be charged a contingent deferred sales charge of 1.00% of the net amount of the redemption if you redeem Class C shares of the Fund within 12 months of purchase. You may use the information in this line, together with the amount you invested, to estimate the expenses that you paid over the period. Simply divide your account value by $1,000 (for example, an $8,600 account value divided by $1,000 = 8.6), then multiply the result by the number in the first line under the heading entitled “Expenses Paid During Period” to estimate the expenses you paid on your count during this period.
Hypothetical Example for Comparison Purposes
The second line of the table below provides information about hypothetical account values and hypothetical expenses based on the Funds’ actual expense ratios and an assumed rate of return of 5% per year before expenses, which is not the Funds’ actual return. The hypothetical account values and expenses may not be used to estimate the actual ending account balance or expenses you paid for the period. You may use this information to compare the ongoing costs of investing in the Funds and other funds. To do so, compare this 5% hypothetical example with the 5% hypothetical examples that appear in the shareholder reports of the other funds.
Please note that the expenses shown in the table are meant to highlight your ongoing costs only and do not reflect any transactional costs, such as wire transfers, redemption fees, sales charges (loads), returned checks or stop payment orders. Therefore, the second line of the table is useful in comparing ongoing costs only, and will not help you determine the relative costs of owning different funds. In addition, if these transactional costs were included, your costs would have been higher.
| | |
| |
| DIREXION ANNUAL REPORT | | 11 |
Expense Example Tables
October 31, 2011 (Unaudited)
| | | | | | | | | | | | | | | | |
| | | Expense
Ratio1 | | | Beginning
Account Value
May 1, 2011 | | | Ending
Account Value
October 31, 2011 | | | Expenses
Paid During
Period2 | |
Commodity Trends Strategy Fund Investor Class | | | | | | | | | | | | | | | | |
Based on actual fund return | | | 1.74 | % | | $ | 1,000.00 | | | $ | 693.30 | | | $ | 7.43 | |
Based on hypothetical 5% return | | | 1.74 | % | | | 1,000.00 | | | | 1,016.43 | | | | 8.84 | |
Commodity Trends Strategy Fund Institutional Class | | | | | | | | | | | | | | | | |
Based on actual fund return | | | 1.24 | % | | | 1,000.00 | | | | 693.70 | | | | 5.29 | |
Based on hypothetical 5% return | | | 1.24 | % | | | 1,000.00 | | | | 1,018.95 | | | | 6.31 | |
Commodity Trends Strategy Fund Class C | | | | | | | | | | | | | | | | |
Based on actual fund return | | | 2.24 | % | | | 1,000.00 | | | | 691.10 | | | | 9.55 | |
Based on hypothetical 5% return | | | 2.24 | % | | | 1,000.00 | | | | 1,013.91 | | | | 11.37 | |
Currency Trends Strategy Fund Investor Class | | | | | | | | | | | | | | | | |
Based on actual fund return | | | 1.75 | % | | | 1,000.00 | | | | 959.20 | | | | 8.64 | |
Based on hypothetical 5% return | | | 1.75 | % | | | 1,000.00 | | | | 1,016.38 | | | | 8.89 | |
Currency Trends Strategy Fund Institutional Class | | | | | | | | | | | | | | | | |
Based on actual fund return | | | 1.25 | % | | | 1,000.00 | | | | 961.00 | | | | 6.18 | |
Based on hypothetical 5% return | | | 1.25 | % | | | 1,000.00 | | | | 1,018.90 | | | | 6.36 | |
Currency Trends Strategy Fund Class C | | | | | | | | | | | | | | | | |
Based on actual fund return | | | 2.25 | % | | | 1,000.00 | | | | 956.20 | | | | 11.09 | |
Based on hypothetical 5% return | | | 2.25 | % | | | 1,000.00 | | | | 1,013.86 | | | | 11.42 | |
Direxion/Wilshire Dynamic Fund Investor Class | | | | | | | | | | | | | | | | |
Based on actual fund return | | | 1.40 | % | | | 1,000.00 | | | | 953.20 | | | | 6.89 | |
Based on hypothetical 5% return | | | 1.40 | % | | | 1,000.00 | | | | 1,018.15 | | | | 7.12 | |
Direxion/Wilshire Dynamic Fund Class C | | | | | | | | | | | | | | | | |
Based on actual fund return | | | 2.05 | % | | | 1,000.00 | | | | 949.40 | | | | 10.07 | |
Based on hypothetical 5% return | | | 2.05 | % | | | 1,000.00 | | | | 1,014.87 | | | | 10.41 | |
Direxion Long/Short Global IPO Fund Investor Class | | | | | | | | | | | | | | | | |
Based on actual fund return | | | 1.79 | % | | | 1,000.00 | | | | 847.10 | | | | 8.33 | |
Based on hypothetical 5% return | | | 1.79 | % | | | 1,000.00 | | | | 1,016.18 | | | | 9.10 | |
Direxion Long/Short Global IPO Fund Class C | | | | | | | | | | | | | | | | |
Based on actual fund return | | | 2.29 | % | | | 1,000.00 | | | | 844.30 | | | | 10.65 | |
Based on hypothetical 5% return | | | 2.29 | % | | | 1,000.00 | | | | 1,013.66 | | | | 11.62 | |
| 2 | Expenses are equal to the Fund’s annualized expense ratio, multiplied by the average account value over the period, multiplied by the number of days in the most recent fiscal half-year/period, then divided by 365. |
Allocation of Portfolio Holdings
October 31, 2011 (Unaudited)
| | | | | | | | | | | | | | | | | | | | |
| | | Cash* | | | Common Stock | | | Investment
Companies | | | Swaps | | | Total | |
Commodity Trends Strategy Fund (Consolidated) | | | 129 | % | | | — | | | | — | | | | (29 | %) | | | 100 | % |
Currency Trends Strategy Fund | | | 107 | % | | | — | | | | — | | | | (7 | %) | | | 100 | % |
Direxion/Wilshire Dynamic Fund | | | 67 | % | | | — | | | | 31 | % | | | 2 | % | | | 100 | % |
Direxion Long/Short Global IPO Fund | | | 64 | % | | | 52 | % | | | — | | | | (16 | %) | | | 100 | % |
| * | Cash, cash equivalents and other assets less liabilities. |
| | |
| | |
| 12 | | DIREXION ANNUAL REPORT |
Commodity Trends Strategy Fund (Consolidated)
Schedule of Investments
October 31, 2011
No reportable investments.
| | | | | | |
| | TOTAL INVESTMENTS
(Cost $—) - 0.0% | | $ | — | |
| | Other Assets in Excess of
Liabilities - 100.0%(a) | | | 92,354,402 | |
| | | | | | |
| | TOTAL NET ASSETS - 100.0% | | $ | 92,354,402 | |
| | | | | | |
Percentages are stated as a percent of net assets.
| (a) | $50,181,637 of cash is pledged as collateral for swap contracts. |
Commodity Trends Strategy Fund (Consolidated)
Long Equity Swap Contracts
October 31, 2011
| | | | | | | | | | | | | | | | | | | | | | |
Counterparty | | Reference Index | | Number of
Contracts | | | Notional
Amount | | | Interest Rate
Paid | | | Termination
Date | | | Unrealized
Depreciation | |
Bank of America Merrill Lynch | | AFT Commodity Trends Indicator | | | 40,805 | | | $ | 78,767,524 | | | | (1.23 | %) | | | 1/23/2012 | | | $ | (16,353,058 | ) |
Bank of America Merrill Lynch | | AFT Commodity Trends Indicator | | | 1,895 | | | | 3,999,701 | | | | (1.23 | %) | | | 4/2/2012 | | | | (1,095,235 | ) |
Bank of America Merrill Lynch | | AFT Commodity Trends Indicator | | | 1,188 | | | | 2,500,455 | | | | (1.23 | %) | | | 4/26/2012 | | | | (677,723 | ) |
Bank of America Merrill Lynch | | AFT Commodity Trends Indicator | | | 1,174 | | | | 2,499,387 | | | | (1.23 | %) | | | 5/7/2012 | | | | (697,379 | ) |
Bank of America Merrill Lynch | | AFT Commodity Trends Indicator | | | 515 | | | | 1,098,083 | | | | (1.23 | %) | | | 5/8/2012 | | | | (307,414 | ) |
Bank of America Merrill Lynch | | AFT Commodity Trends Indicator | | | 2,107 | | | | 4,498,487 | | | | (1.23 | %) | | | 5/14/2012 | | | | (1,262,927 | ) |
Bank of America Merrill Lynch | | AFT Commodity Trends Indicator | | | 7,179 | | | | 14,999,802 | | | | (1.23 | %) | | | 6/11/2012 | | | | (3,961,396 | ) |
Bank of America Merrill Lynch | | AFT Commodity Trends Indicator | | | 1,980 | | | | 3,999,422 | | | | (1.23 | %) | | | 7/27/2012 | | | | (947,720 | ) |
Bank of America Merrill Lynch | | AFT Commodity Trends Indicator | | | 2,615 | | | | 4,998,259 | | | | (1.23 | %) | | | 8/13/2012 | | | | (964,398 | ) |
Credit Suisse International | | AFT Commodity Trends Indicator | | | 1,387 | | | | 2,999,457 | | | | (0.99 | %) | | | 5/17/2012 | | | | (865,827 | ) |
| | | | | | | | | | | | | | | | | | | | | | |
| | | | | 60,845 | | | $ | 120,360,577 | | | | | | | | | | | $ | (27,133,077 | ) |
| | | | | | | | | | | | | | | | | | | | | | |
The accompanying notes are an integral part of these financial statements.
| | |
| |
| DIREXION ANNUAL REPORT | | 13 |
Currency Trends Strategy Fund
Schedule of Investments
October 31, 2011
No reportable investments.
| | | | | | |
| | TOTAL INVESTMENTS
(Cost $—) - 0.0% | | $ | — | |
| | Other Assets in Excess of
Liabilities - 100.0%(a) | | | 17,849,246 | |
| | | | | | |
| | TOTAL NET ASSETS - 100.0% | | $ | 17,849,246 | |
| | | | | | |
Percentages are stated as a percent of net assets.
| (a) | $3,784,000 of cash is pledged as collateral for swap contracts. |
Currency Trends Strategy Fund
Long Equity Swap Contracts
October 31, 2011
| | | | | | | | | | | | | | | | | | | | | | |
Counterparty | | Reference Index | | Number of
Contracts | | | Notional
Amount | | | Interest Rate
Paid | | | Termination
Date | | | Unrealized
Depreciation | |
Bank of America Merrill Lynch | | AFT FX Trends Index | | | 6,872 | | | $ | 18,000,000 | | | | (1.23 | %) | | | 10/1/2012 | | | $ | (1,129,778 | ) |
Bank of America Merrill Lynch | | AFT FX Trends Index | | | 368 | | | | 950,548 | | | | (1.23 | %) | | | 11/5/2012 | | | | (46,039 | ) |
| | | | | | | | | | | | | | | | | | | | | | |
| | | | | 7,240 | | | $ | 18,950,548 | | | | | | | | | | | $ | (1,175,817 | ) |
| | | | | | | | | | | | | | | | | | | | | | |
The accompanying notes are an integral part of these financial statements.
| | |
| | |
| 14 | | DIREXION ANNUAL REPORT |
Direxion/Wilshire Dynamic Fund
Schedule of Investments
October 31, 2011
| | | | | | | | |
Shares | | | | | Value | |
| INVESTMENT COMPANIES - 31.3% | | | | |
| | 5,957 | | | iShares Barclays TIPS Bond Fund | | $ | 693,931 | |
| | 11,411 | | | iShares MSCI Emerging Markets Index Fund | | | 465,569 | |
| | 82,266 | | | iShares MSCI Japan Index Fund | | | 772,478 | |
| | 8,040 | | | iShares MSCI Pacific ex-Japan Index Fund | | | 343,147 | |
| | 61,904 | | | iShares MSCI United Kingdom Index Fund | | | 1,032,559 | |
| | 5,510 | | | iShares Russell 2000 Growth Index Fund | | | 468,405 | |
| | 5,410 | | | iShares Russell 2000 Value Index Fund | | | 353,165 | |
| | 34,887 | | | iShares S&P Europe 350 Index Fund | | | 1,249,652 | |
| | 13,807 | | | iShares S&P GSCI Commodity Indexed Trust | | | 459,635 | |
| | 18,027 | | | SPDR Barclays Capital High Yield Bond ETF | | | 702,512 | |
| | 7,403 | | | SPDR Barclays Capital International Treasury Bond ETF | | | 452,397 | |
| | 3,828 | | | SPDR Dow Jones REIT ETF | | | 247,633 | |
| | | | | | | | |
| | | | TOTAL INVESTMENT COMPANIES
(Cost $6,237,222) | | $ | 7,241,083 | |
| | | | | | | | |
| | | | TOTAL INVESTMENTS
(Cost $6,237,222) - 31.3% | | $ | 7,241,083 | |
| | | | Other Assets in Excess of
Liabilities - 68.7%(a) | | | 15,923,678 | |
| | | | | | | | |
| | | | TOTAL NET ASSETS - 100.0% | | $ | 23,164,761 | |
| | | | | | | | |
Percentages are stated as a percent of net assets.
| (a) | $2,360,000 of cash is pledged as collateral for swap contracts. |
Direxion/Wilshire Dynamic Fund
Long Equity Swap Contracts
October 31, 2011
| | | | | | | | | | | | | | | | | | | | | | |
Counterparty | | Reference Entity | | Number of
Contracts | | | Notional
Amount | | | Interest Rate
Paid | | | Termination
Date | | | Unrealized
Appreciation/
(Depreciation) | |
Credit Suisse Capital, LLC | | iShares Barclays Aggregate Bond Fund | | | 76,717 | | | $ | 8,185,758 | | | | (0.49 | %) | | | 3/13/2012 | | | $ | 368,879 | |
Credit Suisse Capital, LLC | | iShares Russell 1000 Growth Index Fund | | | 62,865 | | | | 3,631,508 | | | | (0.49 | %) | | | 3/13/2012 | | | | 53,368 | |
Credit Suisse Capital, LLC | | iShares Russell 1000 Value Index Fund | | | 57,518 | | | | 3,728,507 | | | | (0.49 | %) | | | 3/13/2012 | | | | (64,519 | ) |
| | | | | | | | | | | | | | | | | | | | | | |
| | | | | 197,100 | | | $ | 15,545,773 | | | | | | | | | | | $ | 357,728 | |
| | | | | | | | | | | | | | | | | | | | | | |
The accompanying notes are an integral part of these financial statements.
| | |
| |
| DIREXION ANNUAL REPORT | | 15 |
Direxion Long/Short Global IPO Fund
Schedule of Investments
October 31, 2011
| | | | | | | | |
Shares | | | | | Value | |
| COMMON STOCKS - 51.8% | |
| Administrative and Support Services - 0.9% | |
| | 3,000 | | | HomeAway, Inc.(a) | | $ | 99,150 | |
| | | | | | | | |
| Air Transportation - 1.5% | |
| | 100,000 | | | Grupo Aeromexico SAB de CV (Mexico)(a) | | | 173,707 | |
| | | | | | | | |
| Amusement, Gambling and Recreation Industries - 2.7% | |
| | 110,000 | | | MGM China Holdings Ltd. (China)(a) (Restricted Security, acquired on 5/27/11 & 7/19/11, cost $222,879) | | | 172,742 | |
| | 20,000 | | | T4F Entretenimento SA (Brazil)(a) | | | 134,549 | |
| | | | | | | | |
| | | | | | | 307,291 | |
| | | | | | | | |
| Apparel Manufacturing - 1.4% | |
| | 800,000 | | | Milan Station Holdings Ltd. (China) | | | 159,613 | |
| | | | | | | | |
| Chemical Manufacturing - 3.9% | |
| | 852,500 | | | China NT Pharma Group Co. Ltd. (China)(a) (Restricted Security, acquired on 4/14/11, cost $502,738) | | | 126,194 | |
| | 25,000 | | | Phosagro OAO GDR (Russia)(a) | | | 310,000 | |
| | | | | | | | |
| | | | | | | 436,194 | |
| | | | | | | | |
| Clothing and Clothing Accessories Stores - 3.3% | |
| | 1,500,000 | | | Hongguo International Holdings Ltd. (China)(a) (Restricted Security, acquired on 9/19/11, cost $447,202) | | | 366,852 | |
| | | | | | | | |
| Computer and Electronic Product Manufacturing - 2.3% | |
| | 10,000 | | | Skullcandy, Inc.(a) | | | 157,500 | |
| | 5,000 | | | Ubiquiti Networks, Inc.(a) | | | 104,950 | |
| | | | | | | | |
| | | | | | | 262,450 | |
| | | | | | | | |
| Credit Intermediation and Related Activities - 3.0% | |
| | 10,000 | | | Bank Gospodarki Zywnosciowej SA (Poland)(a) | | | 140,694 | |
| | 100,000 | | | CITIC Securities Co. Ltd. (China)(a) (Restricted Security, acquired on 9/28/11, cost $172,288) | | | 199,258 | |
| | | | | | | | |
| | | | | | | 339,952 | |
| | | | | | | | |
| Crop Production - 0.9% | |
| | 10,000 | | | Adecoagro SA ADR (Brazil)(a) | | | 97,200 | |
| | | | | | | | |
| Educational Services - 2.6% | |
| | 25,000 | | | Abril Educacao SA (Brazil)(a) | | | 290,940 | |
| | | | | | | | |
| Food and Beverage Stores - 1.2% | |
| | 2,500 | | | Teavana Holdings, Inc.(a) | | | 57,150 | |
| | 100,000 | | | Tenfu Cayman Holdings Co. Ltd. (China)(a) (Restricted Security, acquired on 9/21/11, cost $77,777) | | | 73,242 | |
| | | | | | | | |
| | | | | | | 130,392 | |
| | | | | | | | |
| Food Manufacturing - 1.6% | |
| | 25,000 | | | International Meal Co. Holdings (Brazil)(a) | | | 165,274 | |
| | 15,000 | | | Norway Royal Salmon AS (Norway) | | | 20,120 | |
| | | | | | | | |
| | | | | | | 185,394 | |
| | | | | | | | |
| | | | | | | | |
Shares | | | | | Value | |
| Heavy and Civil Engineering Construction - 0.7% | |
| | 5,000 | | | KiOR, Inc.(a) | | $ | 82,650 | |
| | | | | | | | |
| Hospitals - 0.4% | |
| | 4,900 | | | Vanguard Health Systems, Inc.(a) | | | 47,628 | |
| | | | | | | | |
| Insurance Carriers and Related Activities - 0.3% | |
| | 3,000 | | | Gjensidige Forsikring ASA (Norway) | | | 32,968 | |
| | | | | | | | |
| Merchant Wholesalers, Durable Goods - 1.0% | |
| | 10,000 | | | Wesco Aircraft Holdings, Inc.(a) | | | 112,900 | |
| | | | | | | | |
| Mining (Except Oil and Gas) - 3.1% | |
| | 248,000 | | | China Hanking Holdings Ltd. (China)(a) Restricted Security, acquired on 9/27/11, cost $80,637) | | | 75,018 | |
| | 500,000 | | | IRC Limited (China)(a) (Restricted Security, acquired on 10/15/10,
cost $117,196) | | | 77,232 | |
| | 75,000 | | | Nickel Asia Corp. (Philippines) | | | 33,916 | |
| | 5,000 | | | Royal Bafokeng Platinum Ltd. (South Africa)(a) | | | 35,284 | |
| | 10,000 | | | SunCoke Energy, Inc.(a) | | | 126,200 | |
| | | | | | | | |
| | | | | | | 347,650 | |
| | | | | | | | |
| Miscellaneous Store Retailers - 0.7% | |
| | 40,000 | | | Parkson Retail Asia Ltd. (Singapore)(a) | | | 29,965 | |
| | 150,000 | | | Puregold Price Club, Inc. (Phillipines)(a) | | | 43,556 | |
| | | | | | | | |
| | | | | | | 73,521 | |
| | | | | | | | |
| Oil and Gas Extraction - 4.9% | |
| | 75,000 | | | Bumi Armada Berhad (Malaysia)(a) (Restricted Security, acquired on 7/8/11, cost $76,266) | | | 91,428 | |
| | 350,000 | | | Hilong Holdings Ltd. (China) (Restricted Security, acquired on 4/21/11,
cost $117,347) | | | 71,633 | |
| | 25,000 | | | Lone Pine Resources, Inc. (Canada)(a) | | | 188,250 | |
| | 9,300 | | | VOC Energy Trust | | | 207,111 | |
| | | | | | | | |
| | | | | | | 558,422 | |
| | | | | | | | |
| Other Information Services - 2.1% | |
| | 1,500 | | | LinkedIn Corp.(a) | | | 134,850 | |
| | 14,300 | | | Taomee Holdings Ltd. ADR (China)(a) | | | 90,519 | |
| | 1,000 | | | Tudou Holdings Ltd. ADR (China)(a) | | | 16,400 | |
| | | | | | | | |
| | | | | | | 241,769 | |
| | | | | | | | |
| Primary Metal Manufacturing - 3.8% | | | | |
| | 14,237 | | | AMAG Austria Metall AG (Austria)(a) | | | 307,316 | |
| | 690,000 | | | China Kingstone Mining Holdings Ltd. (China)(a) (Restricted Security, acquired on 3/11/11, cost $201,344) | | | 124,343 | |
| | | | | | | | |
| | | | | | | 431,659 | |
| | | | | | | | |
| Rail Transportation - 1.0% | | | | |
| | 13,000 | | | TransContainer OAO ADR (Russia) | | | 117,000 | |
| | | | | | | | |
| Real Estate - 1.6% | | | | |
| | 15,000 | | | STAG Industrial, Inc. | | | 161,100 | |
| | 500 | | | Zillow, Inc.(a) | | | 14,845 | |
| | | | | | | | |
| | | | | | | 175,945 | |
| | | | | | | | |
The accompanying notes are an integral part of these financial statements.
| | |
| | |
| 16 | | DIREXION ANNUAL REPORT |
Direxion Long/Short Global IPO Fund
Schedule of Investments
October 31, 2011
| | | | | | | | |
Shares | | �� | | | Value | |
| Rental & Leasing Services - 0.3% | | | | |
| | 1,500 | | | Air Lease Corp.(a) | | $ | 33,495 | |
| | | | | | | | |
| Sporting Goods, Hobby, Book, and Music Stores - 2.3% | |
| | 60,000 | | | Holdsport Ltd. (South Africa)(a) | | | 257,073 | |
| | | | | | | | |
| Support Activities for Transportation - 0.3% | | | | |
| | 50,000 | | | Hutchison Port Holdings Trust ADR (Singapore) | | | 33,500 | |
| | | | | | | | |
| Transportation Equipment Manufacturing - 3.4% | |
| | 17,500 | | | Autometal SA (Brazil) | | | 137,607 | |
| | 10,000 | | | Williams F1 (United Kingdom)(a) | | | 242,147 | |
| | | | | | | | |
| | | | | | | 379,754 | |
| | | | | | | | |
| Utilities - 0.6% | | | | |
| | 250,000 | | | Huaneng Renewables Corp. Ltd.
(China)(a) (Restricted Security, acquired on 6/3/11, cost $81,160) | | | 68,221 | |
| | | | | | | | |
| | | | TOTAL COMMON STOCKS
(Cost $7,371,962) | | $ | 5,843,290 | |
| | | | | | | | |
| | | | TOTAL INVESTMENTS
(Cost $7,371,962) - 51.8% | | $ | 5,843,290 | |
| | | | Other Assets in Excess of
Liabilities - 48.2%(b) | | | 5,437,345 | |
| | | | | | | | |
| | | | TOTAL NET ASSETS - 100.0% | | $ | 11,280,635 | |
| | | | | | | | |
Percentages are stated as a percent of net assets.
| (b) | $5,500,000 of cash is pledged as collateral for swap contracts. |
Concentration By Country
| | | | |
Country | | %
of Investments | |
China | | | 27.8 | |
United States of America | | | 22.9 | |
Brazil | | | 14.1 | |
Russia | | | 7.3 | |
Austria | | | 5.3 | |
South Africa | | | 5.0 | |
United Kingdom | | | 4.1 | |
Canada | | | 3.2 | |
Mexico | | | 3.0 | |
Poland | | | 2.4 | |
Malaysia | | | 1.6 | |
Philippines | | | 1.3 | |
Singapore | | | 1.1 | |
Norway | | | 0.9 | |
The accompanying notes are an integral part of these financial statements.
| | |
| |
| DIREXION ANNUAL REPORT | | 17 |
Direxion Long/Short Global IPO Fund
Long Equity Swap Contracts
October 31, 2011
| | | | | | | | | | | | | | | | | | | | | | |
Counterparty | | Reference Index | | Number of
Contracts | | | Notional
Amount | | | Interest Rate
Paid | | | Termination
Date | | | Unrealized
Depreciation | |
Credit Suisse Capital, LLC | | IPOX Global L/S (USD/TR) | | | 12,650 | | | $ | 7,394,931 | | | | (0.64 | %) | | | 10/29/2012 | | | $ | (1,229,869 | ) |
| | | | | | | | | | | | | | | | | | | | | | |
Direxion Long/Short Global IPO Fund
Short Equity Swap Contracts
October 31, 2011
| | | | | | | | | | | | | | | | | | | | | | |
Counterparty | | Reference Entity | | Number of
Contracts | | | Notional
Amount | | | Interest Rate
(Paid) Received | | | Termination
Date | | | Unrealized
Depreciation | |
Credit Suisse Capital, LLC | | iShares FTSE/Xinhua China 25 Index Fund | | | 10,000 | | | $ | 321,236 | | | | (1.26 | %) | | | 10/26/2012 | | | $ | (39,859) | |
Credit Suisse Capital, LLC | | Vanguard MSCI Emerging Markets ETF | | | 80,500 | | | | 2,989,977 | | | | 0.14 | % | | | 10/26/2012 | | | | (349,570) | |
Credit Suisse Capital, LLC | | Vanguard Total Stock Market ETF | | | 56,500 | | | | 3,489,987 | | | | (0.21 | %) | | | 10/2/2012 | | | | (160,334) | |
| | | | | | | | | | | | | | | | | | | | | | |
| | | | | 147,000 | | | $ | 6,801,200 | | | | | | | | | | | $ | (549,763) | |
| | | | | | | | | | | | | | | | | | | | | | |
The accompanying notes are an integral part of these financial statements.
| | |
| | |
| 18 | | DIREXION ANNUAL REPORT |
Statements of Assets and Liabilities
October 31, 2011
| | | | | | | | | | | | | | | | |
| | | Commodity Trends
Strategy Fund
(Consolidated) | | | Currency Trends
Strategy Fund | | | Direxion/Wilshire
Dynamic Fund | | | Direxion
Long/Short
Global IPO
Fund | |
Assets: | | | | | | | | | | | | | | | | |
Investments, at fair value (Note 2) | | $ | — | | | $ | — | | | $ | 7,241,083 | | | $ | 5,843,290 | |
Cash | | | 70,248,858 | | | | 15,577,201 | | | | 13,361,658 | | | | 1,755,624 | |
Receivables: | | | | | | | | | | | | | | | | |
Fund shares sold | | | 136,621 | | | | 2,957 | | | | 240,004 | | | | 4,602 | |
Investment securities sold | | | — | | | | — | | | | 807 | | | | — | |
Deposits at brokers for swaps | | | 50,181,637 | | | | 3,784,000 | | | | 2,360,000 | | | | 5,500,000 | |
Unrealized appreciation on swaps | | | — | | | | — | | | | 422,247 | | | | — | |
Dividends and interest | | | 1,420 | | | | — | | | | — | | | | 5,310 | |
Other assets | | | 28 | | | | — | | | | — | | | | — | |
| | | | | | | | | | | | | | | | |
Total assets | | | 120,568,564 | | | | 19,364,158 | | | | 23,625,799 | | | | 13,108,826 | |
| | | | | | | | | | | | | | | | |
Liabilities: | | | | | | | | | | | | | | | | |
Payables: | | | | | | | | | | | | | | | | |
Fund shares redeemed | | | 208,100 | | | | 32,730 | | | | 11,134 | | | | — | |
Investment securities purchased | | | — | | | | — | | | | 57,518 | | | | 30,264 | |
Deposits from brokers for swaps | | | — | | | | 280,000 | | | | 300,000 | | | | | |
Due to brokers for swaps | | | 729,788 | | | | — | | | | — | | | | — | |
Unrealized depreciation on swaps | | | 27,133,077 | | | | 1,175,817 | | | | 64,519 | | | | 1,779,632 | |
Accrued investment advisory fees | | | 75,140 | | | | 13,047 | | | | 14,135 | | | | 7,520 | |
Accrued operating services fees | | | 34,326 | | | | 6,147 | | | | 5,654 | | | | 5,415 | |
Accrued distribution expense | | | 17,857 | | | | 3,642 | | | | 5,712 | | | | 2,853 | |
Accrued shareholder servicing fees | | | 15,874 | | | | 3,482 | | | | 2,366 | | | | 2,507 | |
Other liabilities | | | — | | | | 47 | | | | — | | | | — | |
| | | | | | | | | | | | | | | | |
Total liabilities | | | 28,214,162 | | | | 1,514,912 | | | | 461,038 | | | | 1,828,191 | |
| | | | | | | | | | | | | | | | |
Net Assets | | $ | 92,354,402 | | | $ | 17,849,246 | | | $ | 23,164,761 | | | $ | 11,280,635 | |
| | | | | | | | | | | | | | | | |
Net Assets Consist Of: | | | | | | | | | | | | | | | | |
Capital stock | | $ | 119,487,479 | | | $ | 19,025,063 | | | $ | 21,439,567 | | | $ | 14,427,230 | |
Undistributed net investment income | | | — | | | | — | | | | — | | | | — | |
Undistributed net realized gain | | | — | | | | — | | | | 363,605 | | | | 162,088 | |
Net unrealized appreciation (depreciation) on: | | | | | | | | | | | | | | | | |
Investments | | | — | | | | — | | | | 1,003,861 | | | | (1,528,672 | ) |
Foreign Currency | | | — | | | | — | | | | — | | | | (379 | ) |
Swaps | | | (27,133,077 | ) | | | (1,175,817 | ) | | | 357,728 | | | | (1,779,632 | ) |
| | | | | | | | | | | | | | | | |
Total Net Assets | | $ | 92,354,402 | | | $ | 17,849,246 | | | $ | 23,164,761 | | | $ | 11,280,635 | |
| | | | | | | | | | | | | | | | |
Investor Class: | | | | | | | | | | | | | | | | |
Net assets | | $ | 60,639,227 | | | $ | 15,660,200 | | | $ | 19,183,887 | | | $ | 9,492,304 | |
Shares outstanding (unlimited shares of beneficial interest authorized, no par value) | | | 2,856,904 | | | | 574,094 | | | | 436,362 | | | | 356,127 | |
Net asset value, redemption and offering price per share | | $ | 21.23 | | | $ | 27.28 | | | $ | 43.96 | | | $ | 26.65 | |
| | | | | | | | | | | | | | | | |
Institutional Class: | | | | | | | | | | | | | | | | |
Net assets | | $ | 26,772,448 | | | $ | 1,613,049 | | | | | | | | | |
Shares outstanding (unlimited shares of beneficial interest authorized, no par value) | | | 1,257,256 | | | | 58,472 | | | | | | | | | |
Net asset value, redemption and offering price per share | | $ | 21.29 | | | $ | 27.59 | | | | | | | | | |
| | | | | | | | | | | | | | | | |
Class C: | | | | | | | | | | | | | | | | |
Net assets | | $ | 4,942,727 | | | $ | 575,997 | | | $ | 3,980,874 | | | $ | 1,788,331 | |
Shares outstanding (unlimited shares of beneficial interest authorized, no par value) | | | 235,029 | | | | 21,295 | | | | 91,523 | | | | 67,718 | |
Net asset value, redemption and offering price per share | | $ | 21.03 | | | $ | 27.05 | | | $ | 43.50 | | | $ | 26.41 | |
| | | | | | | | | | | | | | | | |
Cost of Investments | | $ | — | | | $ | — | | | $ | 6,237,222 | | | $ | 7,371,962 | |
| | | | | | | | | | | | | | | | |
The accompanying notes are an integral part of these financial statements.
| | |
| |
| DIREXION ANNUAL REPORT | | 19 |
Statements of Operations
For the Year Ended October 31, 2011
| | | | | | | | | | | | | | | | |
| | | Commodity
Trends Strategy
Fund
(Consolidated) | | | Currency
Trends Strategy
Fund | | | Direxion/Wilshire
Dynamic Fund | | | Direxion
Long/Short
Global IPO
Fund | |
Investment income: | | | | | | | | | | | | | | | | |
Dividend income (net of foreign withholding tax of $-, $-, $-, $1,417, respectively) | | $ | — | | | $ | — | | | $ | 243,887 | | | $ | 42,826 | |
Interest income | | | 73,742 | | | | 8,636 | | | | 6,114 | | | | 2,837 | |
| | | | | | | | | | | | | | | | |
Total investment income | | | 73,742 | | | | 8,636 | | | | 250,001 | | | | 45,663 | |
| | | | | | | | | | | | | | | | |
Expenses: | | | | | | | | | | | | | | | | |
Investment advisory fees | | | 1,243,936 | | | | 149,538 | | | | 167,232 | | | | 140,505 | |
Operating services fees | | | 570,597 | | | | 70,371 | | | | 66,893 | | | | 105,608 | |
Distribution expenses - Investor Class | | | 277,806 | | | | 37,292 | | | | 48,394 | | | | 39,223 | |
Distribution expenses - Class C | | | 25,012 | | | | 3,623 | | | | 22,051 | | | | 22,836 | |
Shareholder servicing fees - Investor Class | | | 277,806 | | | | 37,292 | | | | 21,315 | | | | 39,223 | |
Shareholder servicing fees - Class C | | | 8,339 | | | | 1,208 | | | | 7,351 | | | | 7,612 | |
| | | | | | | | | | | | | | | | |
Total expenses | | | 2,403,496 | | | | 299,324 | | | | 333,236 | | | | 355,007 | |
| | | | | | | | | | | | | | | | |
Net investment loss | | | (2,329,754 | ) | | | (290,688 | ) | | | (83,235 | ) | | | (309,344 | ) |
| | | | | | | | | | | | | | | | |
Realized and unrealized gain (loss) on investments: | | | | | | | | | | | | | | | | |
Net realized gain (loss) on: | | | | | | | | | | | | | | | | |
Investments | | | 13,474 | | | | — | | | | 69,173 | | | | 2,117,920 | |
Foreign Currency | | | — | | | | — | | | | — | | | | (5,453 | ) |
Futures | | | (111,535 | ) | | | — | | | | — | | | | (16,059 | ) |
Swaps | | | (11,294,217 | ) | | | 536,089 | | | | 759,925 | | | | (1,806,839 | ) |
| | | | | | | | | | | | | | | | |
| | | (11,392,278 | ) | | | 536,089 | | | | 829,098 | | | | 289,569 | |
| | | | | | | | | | | | | | | | |
Capital gain distributions from regulated investment companies | | | — | | | | — | | | | 12,770 | | | | — | |
| | | | | | | | | | | | | | | | |
Change in unrealized appreciation (depreciation) on: | | | | | | | | | | | | | | | | |
Investments | | | — | | | | — | | | | (279,118 | ) | | | (1,728,582 | ) |
Foreign Currency | | | — | | | | — | | | | — | | | | (65 | ) |
Futures | | | — | | | | — | | | | — | | | | 3,263 | |
Swaps | | | (13,735,465 | ) | | | (1,646,665 | ) | | | (64,755 | ) | | | (1,504,080 | ) |
| | | | | | | | | | | | | | | | |
| | | (13,735,465 | ) | | | (1,646,665 | ) | | | (343,873 | ) | | | (3,229,464 | ) |
| | | | | | | | | | | | | | | | |
Net realized and unrealized gain (loss) on investments | | | (25,127,743 | ) | | | (1,110,576 | ) | | | 497,995 | | | | (2,939,895 | ) |
| | | | | | | | | | | | | | | | |
Net increase (decrease) in net assets resulting from operations | | $ | (27,457,497 | ) | | $ | (1,401,264 | ) | | $ | 414,760 | | | $ | (3,249,239 | ) |
| | | | | | | | | | | | | | | | |
The accompanying notes are an integral part of these financial statements.
| | |
| | |
| 20 | | DIREXION ANNUAL REPORT |
Statements of Changes in Net Assets
| | | | | | | | | | | | | | | | |
| | | Commodity Trends Strategy Fund
(Consolidated) | | | Currency Trends Strategy Fund | |
| | | Year Ended
October 31, 2011 | | | Year Ended
October 31, 2010 | | | Year Ended
October 31, 2011 | | | Year Ended
October 31, 2010 | |
Increase (Decrease) in net assets from: | | | | | | | | | | | | | | | | |
Operations: | | | | | | | | | | | | | | | | |
Net investment loss | | $ | (2,329,754 | ) | | $ | (3,692,980 | ) | | $ | (290,688 | ) | | $ | (504,593 | ) |
Net realized gain (loss) on investments | | | (11,392,278 | ) | | | (40,266,560 | ) | | | 536,089 | | | | (363,809 | ) |
Change in net unrealized appreciation (depreciation) on investments | | | (13,735,465 | ) | | | 8,553,537 | | | | (1,646,665 | ) | | | (313,697 | ) |
| | | | | | | | | | | | | | | | |
Net increase (decrease) in net assets resulting from operations | | | (27,457,497 | ) | | | (35,406,003 | ) | | | (1,401,264 | ) | | | (1,182,099 | ) |
| | | | | | | | | | | | | | | | |
Distributions to shareholders: | | | | | | | | | | | | | | | | |
Net investment income | | | | | | | | | | | | | | | | |
Investor Class Shares | | | — | | | | (7,144,922 | ) | | | — | | | | — | |
Institutional Class Shares | | | — | | | | (1,200,358 | ) | | | — | | | | — | |
C Class Shares | | | — | | | | — | | | | — | | | | — | |
Return of capital | | | | | | | | | | | | | | | | |
Investor Class Shares | | | — | | | | (63 | ) | | | — | | | | — | |
Institutional Class Shares | | | — | | | | — | | | | — | | | | — | |
C Class Shares | | | — | | | | — | | | | — | | | | — | |
| | | | | | | | | | | | | | | | |
Total distributions to shareholders | | | — | | | | (8,345,343 | ) | | | — | | | | — | |
| | | | | | | | | | | | | | | | |
Capital share transactions: | | | | | | | | | | | | | | | | |
Total increase (decrease) in net assets from net change in capital share transactions(a) | | | (28,843,527 | ) | | | (152,108,839 | ) | | | 158,644 | | | | (24,608,660 | ) |
| | | | | | | | | | | | | | | | |
Total decrease in net assets | | | (56,301,024 | ) | | | (195,860,185 | ) | | | (1,242,620 | ) | | | (25,790,759 | ) |
| | | | | | | | | | | | | | | | |
Net assets: | | | | | | | | | | | | | | | | |
Beginning of year | | | 148,655,426 | | | | 344,515,611 | | | | 19,091,866 | | | | 44,882,625 | |
| | | | | | | | | | | | | | | | |
End of year | | $ | 92,354,402 | | | $ | 148,655,426 | | | $ | 17,849,246 | | | $ | 19,091,866 | |
| | | | | | | | | | | | | | | | |
Undistributed net investment income, end of year | | $ | — | | | $ | — | | | $ | — | | | $ | — | |
| | | | | | | | | | | | | | | | |
| (a) | Summary of capital share transactions is as follows: |
| | | | | | | | | | | | | | | | | | | | | | | | | | | | | | | | |
| | | Commodity Trends Strategy Fund (Consolidated) | | | Currency Trends Strategy Fund | |
| | | Year Ended
October 31, 2011 | | | Year Ended
October 31, 2010 | | | Year Ended
October 31, 2011 | | | Year Ended
October 31, 2010 | |
| | | Shares | | | Value | | | Shares | | | Value | | | Shares | | | Value | | | Shares | | | Value | |
Shares sold | | | | | | | | | | | | | | | | | | | | | | | | | | | | | | | | |
Investor Class Shares | | | 2,349,211 | | | $ | 65,443,177 | | | | 3,844,292 | | | $ | 101,129,983 | | | | 394,645 | | | $ | 11,305,671 | | | | 864,429 | | | $ | 25,258,477 | |
Institutional Class Shares | | | 1,040,233 | | | | 29,858,469 | | | | 1,248,893 | | | | 32,715,850 | | | | 4,658 | | | | 133,710 | | | | 181,938 | | | | 5,399,506 | |
C Class Shares | | | 276,389 | | | | 7,684,245 | | | | 14,688 | | | | 362,965 | | | | 10,051 | | | | 285,130 | | | | 12,789 | | | | 373,186 | |
Shares issued in reinvestment of distributions | | | | | | | | | | | | | | | | | | | | | | | | | | | | | | | | |
Investor Class Shares | | | — | | | | — | | | | 254,406 | | | | 6,937,656 | | | | — | | | | — | | | | — | | | | — | |
Institutional Class Shares | | | — | | | | — | | | | 6,835 | | | | 185,908 | | | | — | | | | — | | | | — | | | | — | |
C Class Shares | | | — | | | | — | | | | — | | | | — | | | | — | | | | — | | | | — | | | | — | |
Shares redeemed | | | | | | | | | | | | | | | | | | | | | | | | | | | | | | | | |
Investor Class Shares | | | (4,484,411 | ) | | | (115,304,011 | ) | | | (9,814,027 | ) | | | (251,084,512 | ) | | | (336,582 | ) | | | (9,591,301 | ) | | | (1,226,315 | ) | | | (35,920,012 | ) |
Institutional Class Shares | | | (620,205 | ) | | | (15,217,088 | ) | | | (1,666,841 | ) | | | (42,356,689 | ) | | | (67,248 | ) | | | (1,932,317 | ) | | | (677,251 | ) | | | (19,718,549 | ) |
C Class Shares | | | (56,048 | ) | | | (1,308,319 | ) | | | — | | | | — | | | | (1,502 | ) | | | (42,249 | ) | | | (43 | ) | | | (1,268 | ) |
| | | | | | | | | | | | | | | | | | | | | | | | | | | | | | | | |
Net increase (decrease) | | | (1,494,831 | ) | | $ | (28,843,527 | ) | | | (6,111,754 | ) | | $ | (152,108,839 | ) | | | 4,022 | | | $ | 158,644 | | | | (844,453 | ) | | $ | (24,608,660 | ) |
| | | | | | | | | | | | | | | | | | | | | | | | | | | | | | | | |
The accompanying notes are an integral part of these financial statements.
| | |
| |
| DIREXION ANNUAL REPORT | | 21 |
Statements of Changes in Net Assets
| | | | | | | | | | | | | | | | |
| | | Direxion/Wilshire Dynamic Fund | | | Direxion Long/Short Global IPO Fund | |
| | | Year Ended
October 31, 2011 | | | Year Ended
October 31, 2010 | | | Year Ended
October 31, 2011 | | | March 1, 20101 to
October 31, 2010 | |
Increase (Decrease) in net assets from: | | | | | | | | | | | | | | | | |
Operations: | | | | | | | | | | | | | | | | |
Net investment loss | | $ | (83,235 | ) | | $ | (53,025 | ) | | $ | (309,344 | ) | | $ | (55,257 | ) |
Net realized gain on investments | | | 829,098 | | | | 1,254,698 | | | | 289,569 | | | | 423,985 | |
Capital gain distributions from regulated investment companies | | | 12,770 | | | | 4,187 | | | | — | | | | — | |
Change in net unrealized appreciation (depreciation) on investments | | | (343,873 | ) | | | 288,995 | | | | (3,229,464 | ) | | | (79,219 | ) |
| | | | | | | | | | | | | | | | |
Net increase (decrease) in net assets resulting from operations | | | 414,760 | | | | 1,494,855 | | | | (3,249,239 | ) | | | 289,509 | |
| | | | | | | | | | | | | | | | |
Distributions to shareholders: | | | | | | | | | | | | | | | | |
Net investment income | | | | | | | | | | | | | | | | |
Investor Class Shares | | | — | | | | (33,999 | ) | | | — | | | | — | |
C Class Shares | | | — | | | | — | | | | — | | | | — | |
Net realized gain | | | | | | | | | | | | | | | | |
Investor Class Shares | | | (986,952 | ) | | | (366,106 | ) | | | (306,675 | ) | | | — | |
C Class Shares | | | (115,303 | ) | | | — | | | | (99,048 | ) | | | — | |
| | | | | | | | | | | | | | | | |
Total distributions to shareholders | | | (1,102,255 | ) | | | (400,105 | ) | | | (405,723 | ) | | | — | |
| | | | | | | | | | | | | | | | |
Capital share transactions: | | | | | | | | | | | | | | | | |
Total increase in net assets from net change in capital share transactions(a) | | | 6,410,410 | | | | 3,040,336 | | | | 7,654,306 | | | | 6,991,782 | |
| | | | | | | | | | | | | | | | |
Total increase in net assets | | | 5,722,915 | | | | 4,135,086 | | | | 3,999,344 | | | | 7,281,291 | |
| | | | | | | | | | | | | | | | |
Net assets: | | | | | | | | | | | | | | | | |
Beginning of year/period | | | 17,441,846 | | | | 13,306,760 | | | | 7,281,291 | | | | — | |
| | | | | | | | | | | | | | | | |
End of year/period | | $ | 23,164,761 | | | $ | 17,441,846 | | | $ | 11,280,635 | | | $ | 7,281,291 | |
| | | | | | | | | | | | | | | | |
Undistributed (Accumulated) net investment income (loss), end of year/period | | $ | — | | | $ | — | | | $ | — | | | $ | (13,799 | ) |
| | | | | | | | | | | | | | | | |
| (a) | Summary of capital share transactions is as follows: |
| | | | | | | | | | | | | | | | | | | | | | | | | | | | | | | | |
| | | Direxion/Wilshire Dynamic Fund | | | Direxion Long/Short Global IPO Fund | |
| | | Year Ended
October 31, 2011 | | | Year Ended
October 31, 2010 | | | Year Ended
October 31, 2011 | | | March 1, 20101 to
October 31, 2010 | |
| | | Shares | | | Value | | | Shares | | | Value | | | Shares | | | Value | | | Shares | | | Value | |
Shares sold | | | | | | | | | | | | | | | | | | | | | | | | | | | | | | | | |
Investor Class Shares | | | 424,404 | | | $ | 18,943,076 | | | | 180,436 | | | $ | 7,739,497 | | | | 811,514 | | | $ | 25,261,889 | | | | 194,639 | | | $ | 5,834,271 | |
C Class Shares | | | 52,092 | | | | 2,292,961 | | | | 42,585 | | | | 1,835,884 | | | | 74,862 | | | | 2,335,944 | | | | 67,553 | | | | 2,017,519 | |
Shares issued in reinvestment of distributions | | | | | | | | | | | | | | | | | | | | | | | | | | | | | | | | |
Investor Class Shares | | | 21,826 | | | | 943,974 | | | | 9,428 | | | | 395,619 | | | | 9,256 | | | | 289,056 | | | | — | | | | — | |
C Class Shares | | | 2,637 | | | | 113,575 | | | | — | | | | — | | | | 3,114 | | | | 96,878 | | | | — | | | | — | |
Shares redeemed | | | | | | | | | | | | | | | | | | | | | | | | | | | | | | | | |
Investor Class Shares | | | (354,742 | ) | | | (15,629,685 | ) | | | (163,691 | ) | | | (6,929,286 | ) | | | (630,674 | ) | | | (18,096,808 | ) | | | (28,608 | ) | | | (841,794 | ) |
C Class Shares | | | (5,759 | ) | | | (253,491 | ) | | | (32 | ) | | | (1,378 | ) | | | (77,200 | ) | | | (2,232,653 | ) | | | (611 | ) | | | (18,214 | ) |
| | | | | | | | | | | | | | | | | | | | | | | | | | | | | | | | |
Net increase | | | 140,458 | | | $ | 6,410,410 | | | | 68,726 | | | $ | 3,040,336 | | | | 190,872 | | | $ | 7,654,306 | | | | 232,973 | | | $ | 6,991,782 | |
| | | | | | | | | | | | | | | | | | | | | | | | | | | | | | | | |
| 1 | Commencement of operations. |
The accompanying notes are an integral part of these financial statements.
| | |
| | |
| 22 | | DIREXION ANNUAL REPORT |
Financial Highlights
October 31, 2011
| | | | | | | | | | | | | | | | | | | | | | | | | | | | | | | | | | | | | | | | | | | | | | | | | | | | | | | | | | | | | | | | |
| | | | | | | | | | | | | | | | | | | | | | | | | | | | | | | | | | | | | | | RATIOS TO AVERAGE NET ASSETS | |
| Year/Period | | Net Asset
Value,
Beginning
of Year/
Period | | | Net
Investment
Income
(Loss)3 | | | Net
Realized
and
Unrealized
Gain
(Loss) on
Investments | | | Net
Increase
(Decrease) in
Net Asset
Value
Resulting
from
Operations | | | Dividends
from Net
Investment
Income | | | Distributions
from
Realized
Capital
Gains | | | Return of
Capital
Distribution | | | Total
Distributions | | | Redemption
Fees Paid to Fund | | | Net
Asset
Value, End of
Year/
Period | | | Total
Return4 | | | Net
Assets,
End of
Year/
Period
(,000) | | | Total
Expenses1 | | | Net
Expenses1 | | | Net Investment
Income
(Loss) After
Expense
Reimbursement/
Recoupment1 | | | Portfolio
Turnover
Rate5 | |
Commodity Trends Strategy Fund (Consolidated) | | | | | | | | | | | | | | | | | | | | | | | | | | | | | | | | | | | | | | | | | | | | | | | | | | | | | | | | | | | | | | | | |
Investor Class Shares | | | | | | | | | | | | | | | | | | | | | | | | | | | | | | | | | | | | | | | | | | | | | | | | | | | | | | | | | | | | | | | | |
Year Ended October 31, 2011 | | $ | 25.43 | | | $ | (0.46 | ) | | $ | (3.77 | ) | | $ | (4.23 | ) | | $ | — | | | $ | — | | | $ | — | | | $ | — | | | $ | 0.03 | | | $ | 21.23 | | | | (16.52% | ) | | $ | 60,639 | | | | 1.74% | | | | 1.74% | | | | (1.69% | ) | | | 0% | |
Year ended October 31, 2010 | | | 28.81 | | | | (0.43 | ) | | | (2.19 | ) | | | (2.62 | ) | | | (0.77 | ) | | | — | | | | — | 6 | | | (0.77 | ) | | | 0.01 | | | | 25.43 | | | | (9.24% | ) | | | 126,967 | | | | 1.78% | | | | 1.78% | | | | (1.66% | ) | | | 0% | |
May 1, 2009 to October 31, 2009 | | | 29.42 | | | | (0.25 | ) | | | (0.37 | ) | | | (0.62 | ) | | | — | | | | — | | | | — | | | | — | | | | 0.01 | | | | 28.81 | | | | (2.07% | )2 | | | 308,482 | | | | 2.01% | | | | 1.93% | | | | (1.68% | ) | | | 0% | 2 |
June 10, 20088 to
April 30, 2009 | | | 30.00 | | | | (0.34 | ) | | | (0.21 | ) | | | (0.55 | ) | | | — | | | | — | | | | (0.08 | ) | | | (0.08 | ) | | | 0.05 | | | | 29.42 | | | | (1.73% | )2 | | | 363,818 | | | | 2.02% | | | | 2.00% | | | | (1.22% | ) | | | 0% | 2 |
Institutional Class Shares | | | | | | | | | | | | | | | | | | | | | | | | | | | | | | | | | | | | | | | | | | | | | | | | | | | | | | | | | | | | | | | | |
Year Ended October 31, 2011 | | | 25.46 | | | | (0.32 | ) | | | (3.85 | ) | | | (4.17 | ) | | | — | | | | — | | | | — | | | | — | | | | — | 6 | | | 21.29 | | | | (16.38% | ) | | | 26,772 | | | | 1.24% | | | | 1.24% | | | | (1.19% | ) | | | 0% | |
Year ended October 31, 2010 | | | 28.87 | | | | (0.30 | ) | | | (2.24 | ) | | | (2.54 | ) | | | (0.87 | ) | | | — | | | | — | | | | (0.87 | ) | | | — | 6 | | | 25.46 | | | | (8.98% | ) | | | 21,317 | | | | 1.27% | | | | 1.27% | | | | (1.16% | ) | | | 0% | |
May 1, 20098
to October 31, 2009 | | | 28.98 | | | | (0.18 | ) | | | 0.07 | | | | (0.11 | ) | | | — | | | | — | | | | — | | | | — | | | | — | 6 | | | 28.87 | | | | (0.38% | )2 | | | 36,034 | | | | 1.48% | | | | 1.44% | | | | (1.21% | ) | | | 0% | 2 |
Class C Shares | | | | | | | | | | | | | | | | | | | | | | | | | | | | | | | | | | | | | | | | | | | | | | | | | | | | | | | | | | | | | | | | |
Year Ended October 31, 2011 | | | 25.35 | | | | (0.57 | ) | | | (3.75 | ) | | | (4.32 | ) | | | — | | | | — | | | | — | | | | — | | | | — | 6 | | | 21.03 | | | | (17.04% | )7 | | | 4,943 | | | | 2.24% | | | | 2.24% | | | | (2.20% | ) | | | 0% | |
March 4, 20108 to October 31, 2010 | | | 25.46 | | | | (0.33 | ) | | | 0.22 | | | | (0.11 | ) | | | — | | | | — | | | | — | | | | — | | | | — | | | | 25.35 | | | | (0.43% | )2 | | | 372 | | | | 2.24% | | | | 2.24% | | | | (2.10% | ) | | | 0% | 2 |
Currency Trends Strategy Fund | | | | | | | | | | | | | | | | | | | | | | | | | | | | | | | | | | | | | | | | | | | | | | | | | | | | | | | | | | | | | | | | |
Investor Class Shares | | | | | | | | | | | | | | | | | | | | | | | | | | | | | | | | | | | | | | | | | | | | | | | | | | | | | | | | | | | | | | | | |
Year Ended October 31, 2011 | | | 29.34 | | | | (0.48 | ) | | | (1.60 | ) | | | (2.08 | ) | | | — | | | | — | | | | — | | | | — | | | | 0.02 | | | | 27.28 | | | | (7.02% | ) | | | 15,660 | | | | 1.75% | | | | 1.75% | | | | (1.70% | ) | | | 0% | |
Year ended October 31, 2010 | | | 30.01 | | | | (0.49 | ) | | | (0.20 | ) | | | (0.69 | ) | | | — | | | | — | | | | — | | | | — | | | | 0.02 | | | | 29.34 | | | | (2.23% | ) | | | 15,142 | | | | 1.78% | | | | 1.78% | | | | (1.69% | ) | | | 0% | |
March 2, 20098 to October 31, 2009 | | | 30.00 | | | | (0.33 | ) | | | 0.30 | | | | (0.03 | ) | | | — | | | | — | | | | — | | | | — | | | | 0.04 | | | | 30.01 | | | | 0.03% | 2 | | | 26,343 | | | | 2.23% | | | | 1.90% | | | | (1.69% | ) | | | 0% | 2 |
Institutional Class Shares | | | | | | | | | | | | | | | | | | | | | | | | | | | | | | | | | | | | | | | | | | | | | | | | | | | | | | | | | | | | | | | | |
Year Ended October 31, 2011 | | | 29.55 | | | | (0.34 | ) | | | (1.62 | ) | | | (1.96 | ) | | | — | | | | — | | | | — | | | | — | | | | — | | | | 27.59 | | | | (6.63% | ) | | | 1,613 | | | | 1.25% | | | | 1.25% | | | | (1.19% | ) | | | 0% | |
Year ended October 31, 2010 | | | 30.08 | | | | (0.36 | ) | | | (0.17 | ) | | | (0.53 | ) | | | — | | | | — | | | | — | | | | — | | | | — | 6 | | | 29.55 | | | | (1.76% | ) | | | 3,577 | | | | 1.29% | | | | 1.29% | | | | (1.21% | ) | | | 0% | |
May 1, 20098 to October 31, 2009 | | | 28.89 | | | | (0.18 | ) | | | 1.37 | | | | 1.19 | | | | — | | | | — | | | | — | | | | — | | | | — | 6 | | | 30.08 | | | | 4.12% | 2 | | | 18,539 | | | | 1.58% | | | | 1.40% | | | | (1.23% | ) | | | 0% | 2 |
Class C Shares | | | | | | | | | | | | | | | | | | | | | | | | | | | | | | | | | | | | | | | | | | | | | | | | | | | | | | | | | | | | | | | | |
Year Ended October 31, 2011 | | | 29.25 | | | | (0.62 | ) | | | (1.58 | ) | | | (2.20 | ) | | | — | | | | — | | | | — | | | | — | | | | — | | | | 27.05 | | | | (7.52% | )7 | | | 576 | | | | 2.25% | | | | 2.25% | | | | (2.21% | ) | | | 0% | |
April 19, 20108 to October 31, 2010 | | | 28.49 | | | | (0.33 | ) | | | 1.09 | | | | 0.76 | | | | — | | | | — | | | | — | | | | — | | | | — | | | | 29.25 | | | | 2.67% | 2 | | | 373 | | | | 2.25% | | | | 2.25% | | | | (2.13% | ) | | | 0% | 2 |
Direxion/Wilshire Dynamic Fund | | | | | | | | | | | | | | | | | | | | | | | | | | | | | | | | | | | | | | | | | | | | | | | | | | | | | | | | | | | | | | | | |
Investor Class Shares | | | | | | | | | | | | | | | | | | | | | | | | | | | | | | | | | | | | | | | | | | | | | | | | | | | | | | | | | | | | | | | | |
Year Ended October 31, 2011 | | | 45.03 | | | | (0.13 | ) | | | 1.46 | | | | 1.33 | | | | — | | | | (2.46 | ) | | | — | | | | (2.46 | ) | | | 0.06 | | | | 43.96 | | | | 3.17% | | | | 19,184 | | | | 1.41% | | | | 1.41% | | | | (0.28% | ) | | | 151% | |
Year ended October 31, 2010 | | | 41.75 | | | | (0.14 | ) | | | 4.60 | | | | 4.46 | | | | (0.10 | ) | | | (1.09 | ) | | | — | | | | (1.19 | ) | | | 0.01 | | | | 45.03 | | | | 10.92% | | | | 15,531 | | | | 1.55% | | | | 1.55% | | | | (0.33% | ) | | | 107% | |
March 2, 20098 to October 31, 2009 | | | 30.00 | | | | 0.09 | | | | 11.65 | | | | 11.74 | | | | — | | | | — | | | | — | | | | — | | | | 0.01 | | | | 41.75 | | | | 39.17% | 2 | | | 13,307 | | | | 2.09% | | | | 1.55% | | | | 0.34% | | | | 105% | 2 |
Class
C Shares | | | | | | | | | | | | | | | | | | | | | | | | | | | | | | | | | | | | | | | | | | | | | | | | | | | | | | | | | | | | | | | | |
Year Ended October 31, 2011 | | | 44.90 | | | | (0.42 | ) | | | 1.48 | | | | 1.06 | | | | — | | | | (2.46 | ) | | | — | | | | (2.46 | ) | | | — | | | | 43.50 | | | | 2.40% | 7 | | | 3,981 | | | | 2.05% | | | | 2.05% | | | | (0.97% | ) | | | 151% | |
March 17, 20108 to October 31, 2010 | | | 43.37 | | | | (0.34 | ) | | | 1.87 | | | | 1.53 | | | | — | | | | — | | | | — | | | | — | | | | — | | | | 44.90 | | | | 3.53% | 2 | | | 1,911 | | | | 2.05% | | | | 2.05% | | | | (1.26% | ) | | | 107% | 2 |
Direxion Long/Short Global IPO Fund | | | | | | | | | | | | | | | | | | | | | | | | | | | | | | | | | | | | | | | | | | | | | | | | | | | | | | | | | | | | | | | | |
Investor Class Shares | | | | | | | | | | | | | | | | | | | | | | | | | | | | | | | | | | | | | | | | | | | | | | | | | | | | | | | | | | | | | | | | |
Year Ended October 31, 2011 | | | 31.28 | | | | (0.47 | ) | | | (3.08 | ) | | | (3.55 | ) | | | — | | | | (1.12 | ) | | | — | | | | (1.12 | ) | | | 0.04 | | | | 26.65 | | | | (11.76% | ) | | | 9,492 | | | | 1.81% | | | | 1.81% | | | | (1.56% | ) | | | 329% | |
March 1, 20108 to October 31, 2010 | | | 30.00 | | | | (0.34 | ) | | | 1.61 | | | | 1.27 | | | | — | | | | — | | | | — | | | | — | | | | 0.01 | | | | 31.28 | | | | 4.27% | 2 | | | 5,193 | | | | 1.90% | | | | 1.90% | | | | (1.71% | ) | | | 365% | 2 |
Class C Shares | | | | | | | | | | | | | | | | | | | | | | | | | | | | | | | | | | | | | | | | | | | | | | | | | | | | | | | | | | | | | | | | |
Year Ended October 31, 2011 | | | 31.19 | | | | (0.63 | ) | | | (3.03 | ) | | | (3.66 | ) | | | — | | | | (1.12 | ) | | | — | | | | (1.12 | ) | | | — | | | | 26.41 | | | | (12.29% | )7 | | | 1,788 | | | | 2.32% | | | | 2.32% | | | | (2.10% | ) | | | 329% | |
March 25, 20108 to October 31, 2010 | | | 30.01 | | | | (0.39 | ) | | | 1.57 | | | | 1.18 | | | | — | | | | — | | | | — | | | | — | | | | — | | | | 31.19 | | | | 3.93% | 2 | | | 2,088 | | | | 2.40% | | | | 2.40% | | | | (2.20% | ) | | | 365% | 2 |
| 3 | Net investment income (loss) per share represents net investment income (loss) divided by the daily average shares of beneficial interest outstanding throughout each period. |
| 4 | All returns reflect reinvested dividends, if any, but do not reflect the impact of taxes. |
| 5 | Portfolio turnover is calculated without regard to short-term securities having a maturity of less than one year. Investments in options, swaps, and futures contracts and repurchase agreements are deemed short-term securities. |
| 6 | Amount is less than $0.005. |
| 7 | These returns do not include the contingent deferred sales charge. |
| 8 | Commencement of operations. |
| | |
| |
| DIREXION ANNUAL REPORT | | 23 |
Direxion Funds
NOTES TO THE FINANCIAL STATEMENTS
October 31, 2011
Direxion Funds (the “Trust”) was organized as a Massachusetts Business Trust on June 6, 1997 and is registered under the Investment Company Act of 1940, as amended (the “1940 Act”), as an open-end management investment company issuing its shares in series, each series representing a distinct portfolio with its own investment objective and policies. The Trust currently has 27 series of which 4 are included in this report: Commodity Trends Strategy Fund, Currency Trends Strategy Fund, Direxion/Wilshire Dynamic Fund and Direxion Long/Short Global IPO Fund (each a “Fund” and collectively, the “Funds”). Prior to September 1, 2011, the Currency Trends Strategy Fund was named the Financial Trends Strategy Fund. Each Fund is a non-diversified series of the Trust pursuant to the 1940 Act. The Commodity Trends Strategy Fund and Currency Trends Strategy Fund offer Investor, Institutional and C Class shares. The Direxion/Wilshire Dynamic Fund and the Direxion Long/Short Global IPO Fund offer both an Investor and C Class of shares. Investor Class shares are sold by the Funds directly without the services of a Financial Advisor. Institutional Class shares are sold by Financial Advisors that provide services to the Funds. C Class shares are offered primarily by authorized securities brokers and other financial intermediaries. C Class shares may be subject to a contingent deferred sales charge for one year. Income, expenses (other than expenses attributable to a specific class) and realized and unrealized gains or losses on investments are allocated to each class of shares based on its relative net assets.
The Commodity Trends Strategy Fund seeks investment results generally comparable to the performance of the Alpha Financial Technologies Commodity Trends Indicator (“AFT CTI”). The AFT CTI is an index that seeks to benefit from trends (in either direction) in the commodity futures markets. The Fund invests in a combination of commodity-linked derivatives and fixed income securities indirectly through its wholly-owned subsidiary (“Subsidiary”) in order to track the returns of the AFT CTI within the limitation of the federal tax requirements applicable to regulated investment companies.
The Currency Trends Strategy Fund seeks investment results comparable to the performance of the Alpha Financial Technologies FX Trends Index (“AFT FXTI”). The AFT FXTI is an index which reflects price movements across eleven foreign currency components. The Fund will attempt to achieve the same weightings among the Euro, Japanese Yen, Swiss Franc, Brazilian Real, British Pound, Canadian Dollar, Mexican Peso, Australian Dollar, New Zealand Dollar, Norwegian Krone and South African Rand as the AFT FXTI, but may not, at all times, invest in the same underlying securities or derivatives. Like the AFT FXTI, the Fund’s investments in each sector will be positioned long or short depending upon price trends within that sector. The Fund repositions its portfolio holdings following each month-end in accordance with the rebalancing of the AFT FXTI. Prior to September 1, 2011, the Currency Trends Strategy Fund was named the Financial Trends Strategy Fund and it sought investment results comparable to the Alpha Financial Trends Indicator.
The objective of the Direxion/Wilshire Dynamic Fund is to seek capital appreciation by combining a strategic asset allocation with a “tactical overlay” to position the Fund defensively or aggressively, depending upon the outlook of Wilshire Associates Incorporated, the Fund’s subadviser (“Subadviser”). Under normal circumstances, the Fund is managed by the Adviser pursuant to the Subadviser’s traditional asset allocation model which allocates approximately 60% of the Fund’s total assets to equity securities and 40% to fixed income securities, with a tactical overlay to increase or decrease the Fund’s risk exposure based on the Subadviser’s outlook for the market.
The objective of the Direxion Long/Short Global IPO Fund is to seek capital appreciation by investing at least 80% of its net assets in equity securities issued in connection with IPOs and spin-offs of domestic and foreign issuers, including issuers in emerging markets, and financial instruments that provide exposure to these IPOs. The Fund’s investments in IPOs will be positioned long or short, depending on IPOX® Capital Management, LLC’s, its subadviser, outlook for an IPO.
| 2. | | SIGNIFICANT ACCOUNTING POLICIES |
The following is a summary of significant accounting policies consistently followed by the Funds in the preparation of their financial statements. These policies are in conformity with U.S. generally accepted accounting principles (“GAAP”).
a) Investment Valuation – The Net Asset Value (“NAV”) of each Fund is determined daily, Monday through Friday, as of the close of regular trading on the New York Stock Exchange (“NYSE”), each day the NYSE is open for business. The value of all portfolio securities and other assets held by a Fund will be determined as of the time a Fund calculates its NAV, 4:00 p.m.
| | |
| | |
| 24 | | DIREXION ANNUAL REPORT |
Eastern Time (“Valuation Time”). Equity securities and exchange traded funds (“ETFs”) are valued at their last sales price, or if not available, at the average of the last bid and ask prices. Investments in open-end mutual funds are valued at their respective quoted NAVs on the valuation dates. Futures are valued at the settlement price established on the exchange on which they are traded, if that settlement price reflects trading prior to the Valuation Time. If the settlement price established by the exchange reflects trading after the Valuation Time, then the last sales price prior to Valuation Time will be used. Options are valued at the composite price, using the National Best Bid and Offer quotes (“NBBO”). NBBO consists of the highest bid price and lowest ask price across any of the exchanges on which an option is quoted. Specifically, composite pricing looks at the last trades on the exchanges where the options are traded. If there are no trades for the option on a given business day, the composite pricing calculates the mean of the highest bid and lowest ask price across the exchanges where the option is traded. Over-the-counter securities are valued at the average of the last bid and ask prices. Securities primarily traded on the NASDAQ National Market are valued using the NASDAQ Official Closing Price. Swap contracts are valued using the closing price of the underlying reference entity or the closing value of the underlying reference index. Short-term debt securities with a maturity of 60 days or less and money market securities are valued using the amortized cost method. Other debt securities are valued by using the mean prices provided by the Fund’s pricing service or, if such services are unavailable, by a pricing matrix method. Securities for which reliable market quotations are not readily available, the Funds’ pricing service does not provide a valuation for such securities, the Fund’s pricing service provides valuation that in the judgment of Rafferty Asset Management, LLC (the “Adviser”) does not represent fair value, or the Fund or Adviser believes the market price is stale will be fair valued as determined by the Adviser under the supervision of the Board of Trustees. Additionally, the Adviser will monitor developments in the marketplace for significant events that may affect the value of those securities whose closing prices were established before the Valuation Time.
b) Foreign Currency Translation – Investments securities and other assets and liabilities denominated in foreign currencies are translated in to U.S. dollar amounts at the date of valuation. Purchases and sales of investment securities and income and expense items denominated in foreign currencies are translated into U.S. dollar amounts on the respective dates of such transactions.
The Funds do not isolate that portion of the results of operations resulting from changes in foreign exchange rates on investments from the fluctuations arising from changes in market prices of securities held. Such fluctuations are included with the net realized and unrealized gain or loss from investments.
The Funds report net realized foreign currency gains or losses that arise from currency gains or losses realized between the trade and settlement dates on securities transactions and the difference between the amounts of dividends and foreign withholding taxes recorded on the Fund’s books and the U.S. dollar equivalent of the amounts actually received or paid. Net unrealized foreign currency gains and losses arise from changes in the fair values of assets and liabilities, other than investments in securities at fiscal period end, resulting from changes in exchange rates.
c) Repurchase Agreements – Each Fund may enter into repurchase agreements with institutions that are members of the Federal Reserve System or securities dealers who are members of a national securities exchange or are primary dealers in U.S. government securities. In connection with transactions in repurchase agreements, it is the Trust’s policy that the Fund receives, as collateral, cash and/or securities (primarily U.S. government securities) whose fair value, including accrued interest, at all times will be at least equal to 100% of the amount invested by the Fund in each repurchase agreement. If the seller defaults, and the value of the collateral declines, realization of the collateral by the Fund may be delayed or limited. The Funds were not invested in repurchase agreements at October 31, 2011.
d) Swap Contracts – Each Fund may enter into equity swap contacts. Standard equity swap contracts are between two parties that agree to exchange the returns (or differentials in rates of return) earned or realized on particular predetermined investments or instruments. The gross amount to be exchanged is calculated with respect to a “notional amount” (i.e. the return on or increase in value of a particular dollar amount invested in a specific entity or “basket” of securities representing a particular index or industry sector). A Fund does not offset the fair value amounts of the swap contract and the related collateral on the Statement of Assets and Liabilities arising from swap contracts executed with the same counterparty. The Fund’s obligations are accrued daily and offset by any amounts owed to the Fund.
In a “long” equity swap agreement, the counterparty will generally agree to pay the Fund the amount, if any, by which the notional amount of swap contract would have increased in value if the Fund had been invested in the particular securities, plus dividends that would have been received on those securities. The Fund will agree to pay the counterparty a floating rate of interest (e.g., a LIBOR based rate) on the notional amount of the swap contract plus the amount, if any, by which the notional amount would have decreased in value had it been invested in such securities plus, in certain instances,
| | |
| |
| DIREXION ANNUAL REPORT | | 25 |
commissions or trading spreads on the notional amounts. Thus, the return on the swap contract should be the gain or loss on the notional amount plus dividends on the securities less the interest and commission paid by the Fund on the notional amount. However, in certain instances, market factors such as the interest rate environment and the demand to borrow the securities underlying the swap agreement can cause a scenario in which the counterparty will pay the Fund interest. Payments may be made at the conclusion of the contract or periodically during its term. Swap contracts do not include the delivery of securities by the Funds to the counterparty. The net amount of the excess, if any, of the Fund’s obligations owed over its entitlement with respect to each swap is accrued on a daily basis and an amount of cash or liquid assets having an aggregate net asset value at least equal to such accrued excess is maintained in a segregated account. Until a swap contract is settled in cash, the gain or loss on the notional amount plus dividends on the securities less the interest paid by the Fund on the notional amount are recorded as “unrealized gains or losses on swaps” and when cash is exchanged, the gain or loss is recorded as “realized gains or losses on swaps.”
Each Fund may enter into swap contracts that provide the opposite return of the particular benchmark or security (“short” the index or security). The operations are similar to that of the swaps disclosed above except that the counterparty pays interest to the Fund on the notional amount outstanding and the dividends on the underlying securities reduce the return of the swap. However, in certain instances, market factors such as the interest rate environment and the demand to borrow the securities underlying the swap agreement can cause a scenario in which the Fund pays the counterparty interest. These amounts are netted with any unrealized appreciation or depreciation to determine the value of the swap. The Funds will typically enter into equity swap agreements to obtain leverage in order to meet their objectives.
The Funds collateralize swap agreements with cash and certain securities as indicated on the Schedule of Investments of each of the Funds, respectively. Such collateral is held for the benefit of the counterparty in a segregated account at the Custodian to protect the counterparty against non-payment by a Fund. The Funds do not net collateral. In the event of a default by the counterparty, the Funds will seek return of this collateral and may incur certain costs exercising their rights with respect to the collateral. Amounts expected to be owed to the Funds are regularly collateralized either directly with the Funds or in a segregated account at the Custodian.
A Fund bears the risk of loss of the amount expected to be received under a swap agreement in the event of the default or bankruptcy of swap agreement counterparty to the extent that posted collateral is insufficient. A Fund will enter into swap agreements only with large, well-capitalized and established financial institutions. The creditworthiness of each of the firms that is a party to a swap agreement is monitored by the Adviser. The financial statements of these counterparties are available by accessing the SEC’s website, at www.sec.gov. Swap contracts are subject to credit risk. Credit risk is where the financial condition of an issuer of a security or instrument may cause it to default or become unable to play interest or principal due on the security. The counterparty to a swap contract might default on its obligations. In addition, the Funds have agreements with certain counterparties with which it trades swap contracts that contain credit risk-related contingent features that could be triggered subject to certain circumstances. Such circumstances included agreed upon net asset value and performance-based thresholds. The maximum exposure to in the Funds in regard to potential counterparty default and credit-risk related contingent features at October 31, 2011 is as follows:
| | | | | | | | | | | | | | | | | | | | | | | | |
| | | Commodity Trends Strategy Fund (Consolidated) | | | Currency Trends Strategy Fund | |
Counterparty | | Fair Value of
Swap Contracts | | | Collateral for
Swap Contracts | | | Maximum Credit
Risk Exposure | | | Fair Value of
Swap Contracts | | | Collateral for
Swap Contracts | | | Maximum Credit
Risk Exposure | |
Bank of America Merrill Lynch | | $ | (26,267,250 | ) | | $ | 27,850,000 | | | $ | 1,582,750 | | | $ | (1,175,817 | ) | | $ | 3,784,000 | | | $ | 2,608,183 | |
Credit Suisse International | | | (865,827 | ) | | | 22,331,637 | | | | 21,465,810 | | | | — | | | | — | | | | — | |
| | | | | | | | | | | | | | | | | | | | | | | | |
Total | | $ | (27,133,077 | ) | | $ | 50,181,637 | | | $ | 23,048,560 | | | $ | (1,175,817 | ) | | $ | 3,784,000 | | | $ | 2,608,183 | |
| | | | | | | | | | | | | | | | | | | | | | | | |
| | | | | | | | | | | | | | | | | | | | | | | | |
| | | Direxion/Wilshire Dynamic Fund | | | Direxion Long/Short Global IPO Fund | |
Counterparty | | Fair Value of
Swap Contracts | | | Collateral for
Swap Contracts | | | Maximum Credit
Risk Exposure | | | Fair Value of
Swap Contracts | | | Collateral for
Swap Contracts | | | Maximum Credit
Risk Exposure | |
Credit Suisse Capital, LLC | | $ | 357,728 | | | $ | 2,360,000 | | | $ | 2,717,728 | | | $ | (1,779,632 | ) | | $ | 5,500,000 | | | $ | 3,720,368 | |
| | | | | | | | | | | | | | | | | | | | | | | | |
e) Short Positions – Each Fund may engage in short sale transactions. For financial statement purposes, an amount equal to the settlement amount is included in the Statement of Assets and Liabilities as an asset and an offsetting liability. The amount of the liability is subsequently marked-to-market to reflect the fair value of the short position. Subsequent fluctuations in the market prices of short securities may require purchasing the securities at prices which may differ from
| | |
| | |
| 26 | | DIREXION ANNUAL REPORT |
the fair value reflected on the Statement of Assets and Liabilities. The Fund is liable to the buyer for any dividends payable on securities while those securities are in a short position. As collateral for its short positions, the Fund is required under the 1940 Act to maintain assets consisting of cash, cash equivalents or liquid securities equal to the market value of the securities sold short. This collateral is required to be adjusted daily. The Funds were not invested in short positions at October 31, 2011.
f) Stock Index Futures Contracts and Options on Futures Contracts – Each Fund may purchase and sell stock index futures contracts and options on such futures contracts. A Fund may use futures contracts to gain exposure to, or hedge against changes in the values of equities, interest rates or foreign currencies. Upon entering into a contract, the Fund deposits and maintains as collateral such initial margin as required by the exchange on which the transaction is effected. Pursuant to the contract, the Fund agrees to receive from or pay to the broker an amount of cash equal to the daily fluctuation in value of the contract. Such receipts or payments are known as “variation margin” and are recorded by the Fund as unrealized gains and losses. When the contract is closed, the Fund records a realized gain or loss equal to the difference between the value of the contract at the time it was opened and the value at the time it was closed. As collateral for futures contracts, the Fund is required under the 1940 Act to maintain assets consisting of cash, cash equivalents or liquid securities. This collateral is required to be adjusted daily to reflect the market value of the purchase obligation for long futures contracts or the market value of the instrument underlying the contract, but not less than the market price at which the futures contract was established, for short futures contracts. The Funds were not invested in options on futures contracts at October 31, 2011.
g) Risks of Options, Futures Contracts, Options on Futures Contracts and Short Positions – The risks inherent in the use of options, futures contracts, options on futures contracts and short positions include 1) adverse changes in the fair value of such instruments; 2) imperfect correlation between the price of options and futures contracts and options thereon and movements in the price of the underlying securities, index or futures contracts; 3) the possible absence of a liquid secondary market for any particular instrument at any time; 4) the possible need to defer closing out certain positions to avoid adverse tax consequences; and 5) the possible nonperformance by the counterparty under the terms of the contract. The Funds designate cash, cash equivalents and liquid securities as collateral for written options, futures contracts, options on futures contracts and short positions.
h) Risks of Investing in Foreign Securities – Investments in foreign securities involve greater risks than investing in domestic securities. As a result, the Funds’ returns and net asset values may be affected to a large degree by fluctuations in currency exchange rates, political, diplomatic or economic conditions and regulatory requirements in other countries. The laws and accounting, auditing, and financial reporting standards in foreign countries typically are not as strict as they are in the U.S., and there may be less public information available about foreign companies. Investments in foreign emerging markets present a greater risk than investing in foreign issuers in general. The risk of political or social upheaval is greater in emerging markets. In addition, there may be risks of an economy’s dependence on revenues from particular commodities, currency transfer restrictions, a limited number of potential buyers for such securities and delays and disruption in securities settlement procedures.
i) Risks of Investing Commodity-Linked Derivatives – The Commodity Trends Strategy Fund, through its investment in the Subsidiary, will hold commodity-linked derivatives. Commodity-linked derivatives provide exposure, which may include long and/or short exposure, to the investment returns of physical commodities that trade in the commodities markets without investing directly in physical commodities. The value of a commodity-linked derivative investment typically is based upon the price movements of a physical commodity (such as heating oil, precious metals, livestock, or agricultural products), a commodity futures contract or commodity index, or some other readily measurable economic variable. The value of commodity-linked derivative instruments may be affected by changes in overall market movements, volatility of the underlying benchmark, changes in interest rates, or factors affecting a particular industry or commodity, such as drought, floods, weather, livestock disease, embargoes, tariffs and international economic, political and regulatory developments. The value of commodity-linked derivatives will rise or fall in response to changes in the underlying commodity or related index. Investments in commodity-linked derivatives may be subject to greater volatility than non-derivative based investments. A highly liquid secondary market may not exist for certain commodity-linked derivatives, and there can be no assurance that one will develop.
j) Basis for Consolidation for the Commodity Trends Strategy Fund – The Commodity Trends Strategy Fund may invest in up to 25% of its total assets in its Subsidiary. The Subsidiary, which is organized under the laws of the Cayman Islands, is wholly-owned and controlled by the Commodity Trends Strategy Fund. The Subsidiary acts as an investment vehicle in order to enter into certain investments for the Commodity Trends Strategy Fund consistent with the Commodity Trends Strategy
| | |
| |
| DIREXION ANNUAL REPORT | | 27 |
Fund’s investment objectives and policies specified in its prospectus and statement of additional information. As of October 31, 2011 net assets of the Commodity Trends Strategy Fund were $92,354,402, of which $22,317,053, or approximately 24.2%, represented the Commodity Trends Strategy Fund’s ownership of all issued shares and voting rights of the Subsidiary.
k) Security Transactions – Investment transactions are recorded on trade date. The Funds determine the gain or loss realized from investment transactions by comparing the identified cost, which is the same basis used for federal income tax purposes, with the net sales proceeds.
l) Federal Income Taxes – Each Fund intends to comply with the requirements of Subchapter M of the Internal Revenue Code necessary to qualify as a regulated investment company and to make the requisite distributions of income and capital gains to its shareholders sufficient to relieve it from all or substantially all federal income taxes and excise taxes. No provision for federal income taxes has been made.
m) Income and Expenses – Dividend income is recorded on the ex-dividend date. Dividends on foreign securities are recorded as soon as the information becomes available to the Fund. Interest income, including amortization of premium and discount, and dividends received from money market funds, is recognized on an accrual basis. Expenses are charged to the Funds daily. Expenses are computed based on each Fund’s respective daily net assets. For an additional discussion on expenses refer to Note 4. Income and expenses are allocated to each class of shares based upon relative net assets.
n) Distributions to Shareholders – Each Fund generally pays dividends from net investment income and distributes net realized capital gains, if any, at least annually. Income and capital gain distributions are determined in accordance with income tax regulations which may differ from GAAP. Certain Funds also utilize earnings and profits distributed to shareholders on redemptions of shares as part of the dividends paid deduction. Distributions to shareholders are recorded on the ex-dividend date.
The tax character of distributions during the years ended October 31, 2011 and October 31, 2010, were as follows:
| | | | | | | | | | | | | | | | |
| | | Commodity Trends
Strategy Fund (Consolidated) | | | Currency Trends
Strategy Fund | |
| | | Year Ended
October 31,
2011 | | | Year Ended
October 31,
2010 | | | Year Ended
October 31,
2011 | | | Year Ended
October 31,
2010 | |
Distributions paid from: | | | | | | | | | | | | | | | | |
Ordinary Income | | | $— | | | $ | 8,345,280 | | | | $— | | | $ | — | |
Long-term capital gains | | | — | | | | — | | | | — | �� | | | — | |
Return of Capital | | | — | | | | 63 | | | | — | | | | — | |
| | | | | | | | | | | | | | | | |
Total distributions paid | | | $— | | | $ | 8,345,343 | | | | $— | | | $ | — | |
| | | | | | | | | | | | | | | | |
| | | | | | | | | | | | | | | | |
| | |
| | | Direxion/Wilshire
Dynamic Fund | | | Direxion Long/Short
Global IPO Fund | |
| | | Year Ended
October 31,
2011 | | | Year Ended
October 31,
2010 | | | Year Ended
October 31,
2011 | | | Period Ended
October 31,
20101 | |
Distributions paid from: | | | | | | | | | | | | | | | | |
Ordinary Income | | $ | 1,055,538 | | | $ | 400,105 | | | $ | 405,723 | | | $ | — | |
Long-term capital gains | | | 46,717 | | | | — | | | | — | | | | — | |
Return of Capital | | | — | | | | — | | | | — | | | | — | |
| | | | | | | | | | | | | | | | |
Total distributions paid | | $ | 1,102,255 | | | $ | 400,105 | | | $ | 405,723 | | | $ | — | |
| | | | | | | | | | | | | | | | |
| 1 | Commenced operations on March 1, 2010. |
| | |
| | |
| 28 | | DIREXION ANNUAL REPORT |
The Funds are designating as long-term capital gain dividends, pursuant to Internal Revenue Code 852(b)(3), the amount necessary to reduce the earnings and profits of the Funds related to net capital gain to zero for the tax year ended October 31, 2011. To the extent necessary to fully distribute such capital gains, the Funds also designate earnings and profits distributed to shareholders on the redemption of shares.
As of October 31, 2011, the components of distributable earnings of the Funds on a tax basis were as follows:
| | | | | | | | | | | | | | | | |
| | | Commodity Trends
Strategy Fund
(Consolidated) | | | Currency Trends
Strategy Fund | | | Direxion/Wilshire
Dynamic Fund | | | Direxion
Long/
Short
Global
IPO Fund | |
Tax cost of investments | | $
| —
|
| | $ | — | | | $ | 6,415,154 | | | $ | 7,371,962 | |
Gross unrealized appreciation | | | — | | | | — | | | | 1,481,878 | | | | 222,826 | |
Gross unrealized depreciation | | | — | | | | — | | | | (655,949 | ) | | | (1,751,498 | ) |
| | | | | | | | | | | | | | | | |
Net unrealized appreciation/(depreciation) | | $ | — | | | $ | — | | | $ | 825,929 | | | $ | (1,528,672 | ) |
| | | | | | | | | | | | | | | | |
Undistributed ordinary income | | | — | | | | — | | | | 476,850 | | | | — | |
Undistributed long-term capital gain | | | — | | | | — | | | | 84,847 | | | | 415,167 | |
| | | | | | | | | | | | | | | | |
Total distributable earnings | | | — | | | | — | | | | 561,697 | | | | 415,167 | |
| | | | | | | | | | | | | | | | |
Other accumulated gain/(loss) | | | (27,133,077 | ) | | | (1,175,817 | ) | | | 337,568 | | | | (2,033,090 | ) |
| | | | | | | | | | | | | | | | |
Total accumulated earnings/(loss) | | $ | (27,133,077 | ) | | $ | (1,175,817 | ) | | $ | 1,725,194 | | | $ | (3,146,595 | ) |
| | | | | | | | | | | | | | | | |
The difference between book cost of investments and tax cost of investments is attributable primarily to the tax deferral of losses on wash sales. Other accumulated gain/(loss) is generally comprised of or unrealized gain/(loss) on derivative positions.
On the Statement of Assets and Liabilities, the following adjustments were made for permanent tax differences between accounting net investment income and realized gains and losses under GAAP and taxr reporting:
| | | | | | | | | | | | |
| | | Net Investment
Income (Loss) | | | Realized
Gain (Loss) | | | Capital Stock | |
Commodity Trends Strategy Fund (Consolidated) | | $ | 2,329,754 | | | $ | 11,392,278 | | | $ | (13,722,032 | ) |
Currency Trends Strategy Fund | | | 290,688 | | | | (141,201 | ) | | | (149,487 | ) |
Direxion/Wilshire Dynamic Fund | | | 83,235 | | | | (374,346 | ) | | | 291,111 | |
Direxion Long/Short Global IPO Fund | | | 323,143 | | | | (103,675 | ) | | | (219,468 | ) |
Net investment income and realized gains and losses for federal income tax purposes may differ from that reported on the financial statements because of permanent book-to-tax differences. GAAP requires that permanent differences in net investment income and realized gains and losses due to differences between financial reporting and tax reporting be reclassified between various components of net assets. The permanent differences primarily relate to net operating losses and dividends on redemption adjustments with differing book and tax methods.
At October 31, 2011 the Funds had no capital loss carryforwards. During the year ended October 31, 2011, the Currency Trends Strategy Fund utilized $379,957 of prior year capital loss carryforward.
The Funds follow authoritative financial reporting rules regarding recognition and measurement of tax positions taken or expected to be taken on a tax return. The Funds have reviewed all open tax years and concluded that there is no effect to the Fund’s financial positions or results of operations and no tax liability resulting from unrecognized tax benefits relating to uncertain income tax position taken or expected to be taken on a tax return. Open tax years are those years that are open for examination by the relevant income taxing authority. As of October 31, 2011, open Federal and state income tax years include the tax years ended April 30, 2009 and October 31, 2009, October 31, 2010 and October 31, 2011. The Funds have no examination in progress. The Funds are also not aware of any tax positions for which it is reasonably possible that the total amounts of unrecognized tax expense will significantly change in twelve months.
| | |
| |
| DIREXION ANNUAL REPORT | | 29 |
On December 22, 2010, the Regulated Investment Company Modernization Act of 2010 (the “Act”) was enacted, which changed various technical rules governing the tax treatment of regulated investment companies. The changes are generally effective for taxable years beginning after the date of enactment. One of the more prominent changes addresses capital loss carryforwards. Under the Act, each fund will be permitted to carry forward capital losses incurred in taxable years beginning after the date of enactment for an unlimited period. However, any losses incurred during those future taxable years will be required to be utilized prior to the losses incurred in pre-enactment taxable years, which carry an expiration date. As a result of this ordering rule, pre-enactment capital los carryforwards may be more likely to expire unused. Additionally, post-enactment capital loss carryforwards will retain their character as either short-term or long-term capital losses rather than being considered all short-term as permitted under previous regulation.
o) Guarantees and Indemnifications – In the ordinary course of business, the Funds enter into contracts that contain a variety of indemnification provisions pursuant to which the Funds agree to indemnify third parties upon occurrence of specified events. The Fund’s maximum exposure relating to these indemnification agreements is unknown. However, the Funds have not had prior claims or losses in connection with these provisions and believe the risk of loss is remote.
p) Use of Estimates – The preparation of financial statements in conformity with GAAP requires management to make estimates and assumptions that affect the reported amounts of assets and liabilities and disclosure of contingent assets and liabilities at the date of the financial statements and the reported amounts of revenues and expenses during the reporting period. Actual results could differ from those estimates.
| 3. | | INVESTMENT TRANSACTIONS |
During the year ended October 31, 2011, the aggregate purchases and sales of investments (excluding short-term investments, options, swaps and futures contracts) were:
| | | | | | | | | | | | | | | | |
| | | Commodity Trends
Strategy Fund
(Consolidated) | | | Currency Trends
Strategy Fund | | | Direxion/Wilshire
Dynamic Fund | | | Direxion
Long/Short
Global IPO
Fund | |
Purchases | | $ | — | | | $ | — | | | $ | 13,196,197 | | | $ | 23,449,269 | |
Sales | | | — | | | | — | | | | 11,767,547 | | | | 20,732,246 | |
The Funds had no purchases or sales of long-term U.S. Government securities during the year ended October 31, 2011.
| 4. | | INVESTMENT ADVISORY AND OTHER AGREEMENTS |
Investment Advisory Fees: The Funds have entered into an investment advisory agreement with the Adviser. The Adviser receives a fee of 0.85% for the Commodity Trends Strategy Fund and Currency Trends Strategy Fund and 0.75% for the Direxion/Wilshire Dynamic Fund and Direxion Long/Short Global IPO Fund, respectively, computed daily and payable monthly, as applied to each Fund’s average daily net assets. In addition, the Adviser has entered into sub-advisory agreements with Wilshire Associates Incorporated for the Direxion/Wilshire Dynamic Fund and with IPOX® Capital Management, LLC for the Direxion Long/Short Global IPO Fund whereby each subadviser will direct the investment activities of their respective Funds. The Adviser pays out of the management fees it receives from these funds, a fee for these sub-advisory services.
Operating Services Agreement: The Funds have entered into an Operating Services Agreement (the “Agreement”) with the Adviser. Under the Agreement, the Adviser will be responsible for all expenses of the Trust except the following: management fees, distribution and/or service fees, acquired fund fees, taxes, leverage interest, dividends or interest on short positions, other interest expenses, brokerage commission and other extraordinary expenses outside the typical day-to-day operations of the Funds. In consideration for the services rendered pursuant to the Agreement, the Funds will pay to the Adviser, as compensation for the services provided by the Adviser under the Agreement, a monthly fee of 0.39% for the Commodity Trends Strategy Fund, 0.40% for the Currency Trends Strategy Fund and 0.30% for the Direxion/Wilshire Dynamic Fund, calculated on an annualized basis on the average net assets of each Fund. Effective March 1, 2011, the monthly fee paid from the Direxion Long/Short Global IPO Fund to the Adviser decreased from 0.65% to 0.54%, calculated on an annualized basis on the average net assets of the fund.
| | |
| | |
| 30 | | DIREXION ANNUAL REPORT |
Distribution Expenses: Shares of the Funds are subject to an annual 12b-1 fee of up to 1.00% of a Fund’s average daily net assets. The Investor Class shares of the Funds currently pay a 12b-1 fee of 0.25% of the Fund’s Investor Class average daily net assets. The Class C shares of the Funds pay a 12b-1 fee of 0.75% of the Fund’s Class C average daily net assets. The Institutional Class shares of the Funds do not pay a 12b-1 fee.
Shareholder Servicing Fees: The Board of Trustees has also authorized the Fund’s Investor Class and Class C shares, with the exception of the Direxion/Wilshire Dynamic Fund’s Investor Class, to pay a shareholder servicing fee of 0.25% of the Fund’s Investor Class and Class C average daily net assets. Effective December 2, 2010, the shareholder servicing fee of the Direxion/Wilshire Dynamic Fund’s Investor Class decreased from 0.25% to 0.10% of its net assets. The Trust, on behalf of each Fund, pays the fee to financial institutions and other persons who provide services and maintain shareholder accounts. The Institutional Class shares of the Funds do not pay a shareholder servicing fee.
Rafferty Capital Markets, LLC (the “Distributor”) serves as principal underwriter of the Funds and acts as the Funds’ distributor in a continuous public offering of the Funds’ shares. The Distributor is an affiliate of the Adviser.
| 5. | | VALUATION MEASUREMENTS |
The Funds follow authoritative fair valuation accounting standards which establish an authoritative definition of fair value and set out a hierarchy for measuring fair value. These standards require additional disclosures about the various inputs and valuation techniques used to develop the measurements of fair value and a discussion in changes in valuation techniques and related inputs during the period. These inputs are summarized in the three broad levels below:
Level 1 – Quoted prices in active markets for identical securities,
Level 2 – Evaluated price based on other significant observable inputs (including quoted prices for similar securities, interest rates, prepayment speeds, credit risk, etc.)
Level 3 – Significant unobservable inputs (including the Fund’s own assumptions in determining fair value of investments)
The inputs or methodology used for valuing securities are not an indication of the credit risk associated with investing in those securities.
The follow is a summary of the inputs used to value the Fund’s net assets as of October 31, 2011:
| | | | | | | | | | | | | | |
| | | Commodity Trends Strategy Fund (Consolidated) | |
| | | Level 1 | | Level 2 | | | Level 3 | | | Total | |
Other Financial Instruments* | | $— | | $ | (27,133,077 | ) | | $ | — | | | $ | (27,133,077 | ) |
| |
| | | Currency Trends Strategy Fund | |
| | | Level 1 | | Level 2 | | | Level 3 | | | Total | |
Other Financial Instruments* | | $— | | $ | (1,175,817 | ) | | $ | — | | | $ | (1,175,817 | ) |
| |
| | | Direxion/Wilshire Dynamic Fund | |
| | | Level 1 | | Level 2 | | | Level 3 | | | Total | |
Investment Companies — Equity | | $5,392,243 | | $ | — | | | $ | — | | | $ | 5,392,243 | |
Investment Companies — Fixed Income | | $1,848,840 | | $ | — | | | $ | — | | | $ | 1,848,840 | |
Other Financial Instruments* | | $— | | $ | 357,728 | | | $ | — | | | $ | 357,728 | |
| |
| | | Direxion Long/Short Global IPO Fund | |
| | | Level 1 | | Level 2 | | | Level 3 | | | Total | |
Equity Securities | | $5,843,290 | | $ | — | | | $ | — | | | $ | 5,843,290 | |
Other Financial Instruments* | | $— | | $ | (1,779,632 | ) | | $ | — | | | $ | (1,779,632 | ) |
For further detail on each asset class, see Schedule of Investments.
| * | Other financial instruments are derivative instruments not reflected in the Schedule of Investments, such as swap contracts. Swap contracts are valued at the unrealized appreciation (depreciation) on the instrument. |
| | |
| |
| DIREXION ANNUAL REPORT | | 31 |
The Funds follow authoritative accounting standards which improve disclosure about fair value measurements. These standards require additional disclosures regarding fair value measurements. Specifically, these standards require reporting entities to disclose a) the input and valuation techniques used to measure fair value for both recurring and nonrecurring fair value measurements, for Level 2 or Level 3 positions, b) transfers between all levels (including Level 1 and Level 2) will be required to be disclosed on a gross basis (i.e. transfers out must be disclosed separately from transfers in) as well as the reason(s) for the transfers and c) purchases and sales must be shown on a gross basis in the Level 3 rollforward rather than as one net number.
There were no significant transfers between Level 1 and Level 2 securities during the year ended October 31, 2011. There were no Level 3 securities held by the Funds during the year ended October 31, 2011. It is the Funds’ policy to recognize transfers into Level 3 at the value as of the beginning of the period.
| 6. | | ADDITIONAL DISCLOSURES ABOUT DERIVATIVE INSTRUMENTS |
The Funds follow authoritative standards of accounting for derivative instruments which establish disclosure requirements for derivative instruments. These standards improve financial reporting for derivative instruments by requiring enhanced disclosures that enables investors to understand how and why a fund uses derivatives instruments, how derivatives instruments are accounted for and how derivative instruments affect a fund’s financial position and results of operations.
The Funds use derivative instruments as part of their principal investment strategy to achieve their investment objective. For additional discussion on the risks associated with derivative instruments refer to Note 2. As of October 31, 2011, the Funds were invested in equity swap contracts.
At October 31, 2011, the fair value of derivatives instruments were as follows:
| | | | | | | | | | | | | | | | | | |
| Asset Derivatives1 | |
| | | | | Commodity Risk | | | Currency Risk | | | Equity Risk | | | Total | |
Direxion/Wilshire Dynamic Fund | | Swap Contracts | | $ | — | | | $ | — | | | $ | 422,247 | | | $ | 422,247 | |
| | Total | | $ | — | | | $ | — | | | $ | 422,247 | | | $ | 422,247 | |
| 1 | Statement of Assets and Liabilities location: Unrealized appreciation on swaps. |
| | | | | | | | | | | | | | | | | | |
| Liability Derivatives1 | |
| | | | | Commodity Risk | | | Currency Risk | | | Equity Risk | | | Total | |
Commodity Trends Strategy Fund (Consolidated) | | Swap Contracts | | $ | 27,133,077 | | | $ | — | | | $ | — | | | $ | 27,133,077 | |
| | Total | | $ | 27,133,077 | | | $ | — | | | $ | — | | | $ | 27,133,077 | |
Currency Trends Strategy Fund | | Swap Contracts | | $ | — | | | $ | 1,175,817 | | | $ | — | | | $ | 1,175,817 | |
| | Total | | $ | — | | | $ | 1,175,817 | | | $ | — | | | $ | 1,175,817 | |
Direxion/Wilshire Dynamic Fund | | Swap Contracts | | $ | — | | | $ | — | | | $ | 64,519 | | | $ | 64,519 | |
| | Total | | $ | — | | | $ | — | | | $ | 64,519 | | | $ | 64,519 | |
Direxion Long/Short Global IPO Fund | | Swap Contracts | | $ | — | | | $ | — | | | $ | 1,779,632 | | | $ | 1,779,632 | |
| | Total | | $ | — | | | $ | — | | | $ | 1,779,632 | | | $ | 1,779,632 | |
| 1 | Statement of Assets and Liabilities location: Unrealized depreciation on swaps. |
Transactions in derivative instruments during the year ended October 31, 2011, were as follows:
| | | | | | | | | | | | | | | | | | |
| | | | | Commodity risk | | | Currency risk | | | Equity
risk | | | Total | |
Commodity Trends Strategy Fund (Consolidated) | | Realized gain (loss)1 | | | | | | | | | | | | | | | | |
| | Put options | | $ | 2,881 | | | $ | — | | | $ | — | | | $ | 2,881 | |
| | Futures contracts | | | (111,535 | ) | | | — | | | | — | | | | (111,535 | ) |
| | Swap Contracts | | | (11,294,217 | ) | | | — | | | | — | | | | (11,294,217 | ) |
| | Total realized gain (loss) | | $ | (11,402,871 | ) | | $ | — | | | $ | — | | | $ | (11,402,871 | ) |
| | Change in unrealized appreciation (depreciation)2 | | | | | | | | | | | | | | | | |
| | Swap Contracts | | $ | (13,735,465 | ) | | $ | — | | | $ | — | | | $ | (13,735,465 | ) |
| | Total change in unrealized appreciation (depreciation) | | $ | (13,735,465 | ) | | $ | — | | | $ | — | | | $ | (13,735,465 | ) |
| | |
| | |
| 32 | | DIREXION ANNUAL REPORT |
| | | | | | | | | | | | | | | | | | |
| | | | | Commodity risk | | | Currency risk | | | Equity risk | | | Total | |
Currency Trends Strategy Fund | | Realized gain (loss)1 | | | | | | | | | | | | | | | | |
| | Swap Contracts | | $ | — | | | $ | 536,089 | | | $ | — | | | $ | 536,089 | |
| | Total realized gain (loss) | | $ | — | | | $ | 536,089 | | | $ | — | | | $ | 536,089 | |
| | Change in unrealized appreciation (depreciation)2 | | | | | | | | | | | | | | | | |
| | Swap Contracts | | $ | — | | | $ | (1,646,665 | ) | | $ | — | | | $ | (1,646,665 | ) |
| | Total change in unrealized appreciation (depreciation) | | $ | — | | | $ | (1,646,665 | ) | | $ | — | | | $ | (1,646,665 | ) |
Direxion/Wilshire Dynamic Fund | | Realized gain (loss)1 | | | | | | | | | | | | | | | | |
| | Swap Contracts | | $ | — | | | $ | — | | | $ | 759,925 | | | $ | 759,925 | |
| | Total realized gain (loss) | | $ | — | | | $ | — | | | $ | 759,925 | | | $ | 759,925 | |
| | Change in unrealized appreciation (depreciation)2 | | | | | | | | | | | | | | | | |
| | Swap Contracts | | $ | — | | | $ | — | | | $ | (64,755 | ) | | $ | (64,755 | ) |
| | Total change in unrealized appreciation (depreciation) | | $ | — | | | $ | — | | | $ | (64,755 | ) | | $ | (64,755 | ) |
Direxion Long/Short Global IPO Fund | | Realized gain (loss)1 | | | | | | | | | | | | | | | | |
| | Futures contracts | | $ | — | | | $ | — | | | $ | (16,059 | ) | | $ | (16,059 | ) |
| | Swap Contracts | | | — | | | | — | | | | (1,806,839 | ) | | | (1,806,839 | ) |
| | Total realized gain (loss) | | $ | — | | | $ | — | | | $ | (1,822,898 | ) | | $ | (1,822,898 | ) |
| | Change in unrealized appreciation (depreciation)2 | | | | | | | | | | | | | | | | |
| | Futures contracts | | $ | — | | | $ | — | | | $ | 3,263 | | | $ | 3,263 | |
| | Swap Contracts | | | — | | | | — | | | | (1,504,080 | ) | | | (1,504,080 | ) |
| | Total change in unrealized appreciation (depreciation) | | $ | — | | | $ | — | | | $ | (1,500,817 | ) | | $ | (1,500,817 | ) |
| 1 | Statement of Operations location: Net realized gain (loss) on investments, futures, and/or swaps. |
| 2 | Statement of Operations location: Change in unrealized appreciation (depreciation) on futures and/or swaps. |
For the year ended October 31, 2011, the quarterly average gross notional amounts of the derivatives held by the Funds were as follows:
| | | | | | | | | | | | | | | | |
| | | Long Put Option
Contracts | | | Long Equity Swaps
Contracts | | | Short Equity Swaps
Contracts | | | Short Futures
Contracts | |
Commodity Trends Strategy Fund (Consolidated) | | $ | 103,684 | | | $ | 145,971,120 | | | $ | — | | | $ | — | |
Currency Trends Strategy Fund | | | — | | | | 18,003,057 | | | | — | | | | — | |
Direxion/Wilshire Dynamic Fund | | | — | | | | 14,781,868 | | | | — | | | | — | |
Direxion Long/Short Global IPO Fund | | | — | | | | 15,936,859 | | | | 14,257,189 | | | | 1,321,280 | |
The Commodity Trends Strategy Fund and the Currency Trends Strategy Fund utilize this volume of derivatives in order to track meet the investment objective of tracking comparable results to the performance of the CTI and FXTI, respectively. The Direxion/Wilshire Dynamic Fund uses its investments in derivatives to tactically tilt the strategic allocation of its investment strategy. The Direxion Long/Short Global Fund uses its investments in derivatives to obtain exposure to IPOs. The Direxion Long/Short Global Fund’s volume of swap contracts was consistent throughout the year while its volume of futures contracts shifts as a hedge to the overall portfolio’s position in IPOs.
| 7. | | NEW ACCOUNTING PRONOUNCEMENT |
In April 2011, FASB issued an update intended to improve the accounting for repurchase and other similar agreements. Specifically, the update modifies the criteria for determining when these agreements would be accounted for as financing transactions (secured borrowings/lending agreements) as opposed to sale (purchase) transactions with commitments to repurchase (resell). At this time, management is evaluating the implications of this guidance and the impact it will have to the financial statements or footnote disclosures, if any.
In May 2011, FASB issued an update to improve the comparability of fair value measurements presented and disclosed in financial statements prepared in accordance with GAAP and International Financial Reporting Standards. This update will require reporting entities to discloses the following information for fair value measurements categorized within Level 3 of
| | |
| |
| DIREXION ANNUAL REPORT | | 33 |
the fair value hierarchy: quantitative information about unobservable inputs used in the fair value measurement, the valuation processes used by the reporting entity and a narrative description of the sensitivity of the fair value measurement to changes in unobservable inputs and the interrelationships between those unobservable inputs. In addition, the update will require reporting entities to make disclosure about amounts and reason for all transfers in and out of Level 1 and Level 2 fair value measurements. The new and revised disclosures are effective for interim and annual reporting periods beginning after December 15, 2011. At this time, management is evaluating the implications of this update and the impact it will have to the financial statements or footnote disclosures, if any.
Effective November 1, 2011, the Board of Trustees of the Trust, based upon the recommendation of the Adviser, has approved the removal of IPOX® Capital Management, LLC as investment subadviser to the Direxion Long/Short Global IPO Fund. Effective November 1, 2011, the Adviser will assume full day-to-day responsibility for managing the Fund’s asset allocations and will continue to manage the Fund as described in the prospectus.
Effective February 1, 2012, the Commodity Trends Strategy Fund will change its benchmark from the AFT CTI to the Auspice Broad Commodity Index. In connection with the change of its benchmark, the Commodity Trends Strategy Fund will change its name to the Direxion Commodity Indexed Strategy Fund. The Direxion Commodity Indexed Strategy Fund will seek investment results that track the performance of the Auspice Broad Commodity Index.
Effective February 1, 2012, the Currency Trends Strategy Fund will change its name to the Direxion Currency Trends Strategy Plus Fund. The Direxion Currency Trends Strategy Plus Fund will seek investment results of 150% of the calendar month performance of the AFT FXTI.
The Board of Trustees approved, based on the Adviser’s recommendation, the conversion of the Funds’ Investor Class shares to Class A shares. On February 1, 2012, each Fund will begin selling Class A shares and will automatically convert all its outstanding Investor Class shares to Class A shares. A sales load of 5.50% will be imposed on purchases of Class A shares; however, any shareholder in the Investor Class whose shares are converted to Class A shares will not have to pay this sales load. Effective February 1, 2012, the 1.00% redemption fee currently imposed on Investor Class and Institutional Class shares redeemed within 90 days of purchase will change to a 1.00% redemption fee imposed on Class A and Institutional Class shares redeemed within 30 days of purchase.
Additionally, effective February 1, 2012, the Class C shares of the Funds will increase their distribution expenses from 0.75% to 1.00% of each Fund’s respective Class C average net assets, but the Funds will no longer charge a shareholder servicing fee in any of the share classes. Also, effective February 1, 2012, the monthly fee the Funds pay to the Adviser under the Operating Services Agreement will decrease from 0.39% to 0.16% for the Direxion Commodity Indexed Strategy Fund, from 0.40% to 0.25% for the Direxion Currency Trends Strategy Plus Fund, from 0.30% to 0.16% for the Direxion/Wilshire Dynamic Fund, and from 0.54% to 0.32% for the Direxion Long/Short Global IPO Fund calculated on an annualized basis on the average net assets of each Fund.
The Funds have adopted authoritative standards of accounting for and disclosure of events that occur after the balance sheet date but before financial statements are issued or are available to be issued. These standards require the Funds to recognize in the financial statements the effects of all recognized subsequent events that provide additional evidence about conditions that existed at the date of the balance sheet. For nonrecognized subsequent events that must be disclosed to keep the financial statements from being misleading, the Funds are required to disclose the nature of the event as well as an estimate of its financial effect, or a statement that such an estimate cannot be made. The Funds have evaluated subsequent events through the issuance of the Funds’ financial statements and have determined there is no impact to the Funds’ financial statements.
| | |
| | |
| 34 | | DIREXION ANNUAL REPORT |
DIREXION FUNDS
REPORTOF INDEPENDENT REGISTERED PUBLIC ACCOUNTING FIRM
To the Board of Trustees and Shareholders of Direxion Funds:
We have audited the accompanying statements of assets and liabilities of the Commodity Trends Strategy Fund (Consolidated), Currency Trends Strategy Fund (formerly Financial Trends Strategy Fund), Direxion/Wilshire Dynamic Fund, and Direxion Long/Short Global IPO Fund (four of the series of the Direxion Funds) (the “Funds”), including the schedules of investments, as of October 31, 2011, and the related statements of operations for the year then ended, the statements of changes in net assets for each of the two years in the period then ended, and the financial highlights for each of the periods indicated therein. These financial statements and financial highlights are the responsibility of the Funds’ management. Our responsibility is to express an opinion on these financial statements and financial highlights based on our audits.
We conducted our audits in accordance with the standards of the Public Company Accounting Oversight Board (United States). Those standards require that we plan and perform the audit to obtain reasonable assurance about whether the financial statements and financial highlights are free of material misstatement. We were not engaged to perform an audit of the Funds’ internal control over financial reporting. Our audits included consideration of internal control over financial reporting as a basis for designing audit procedures that are appropriate in the circumstances, but not for the purpose of expressing an opinion on the effectiveness of the Funds’ internal control over financial reporting. Accordingly, we express no such opinion. An audit also includes examining, on a test basis, evidence supporting the amounts and disclosures in the financial statements and financial highlights, assessing the accounting principles used and significant estimates made by management, and evaluating the overall financial statement presentation. Our procedures included confirmation of securities owned as of October 31, 2011 by correspondence with the custodian and brokers. We believe that our audits provide a reasonable basis for our opinion.
In our opinion, the financial statements and financial highlights referred to above present fairly, in all material respects, the financial position of the above mentioned four of the series of Direxion Funds at October 31, 2011, the results of their operations for the year then ended, the changes in their net assets for each of the two years in the period then ended, and the financial highlights for each of the periods indicated therein, in conformity with U.S. generally accepted accounting principles.

New York, New York
December 22, 2011
| | |
| |
| DIREXION ANNUAL REPORT | | 35 |
ADDITIONAL INFORMATION
(UNAUDITED)
For the year ended October 31, 2011, certain dividends paid by the Funds may be subject to a maximum rate of 15%, as provided for by the Jobs and Growth Tax Relief Reconciliation Act of 2003. The amount of dividends declared from ordinary income designated as qualified income was 25.30% for the Direxion/Wilshire Dynamic Fund and 0% for the Direxion Long/Short Global IPO Fund.
For corporate shareholders, the amount of ordinary income distributions qualifying for the corporate dividends received deduction for the year ended October 31, 2011 was 25.30% for the Direxion/Wilshire Dynamic Fund and 0% for the Direxion Long/Short Global IPO Fund.
In an effort to decrease costs, the Funds intend to reduce the number of duplicate prospectuses, Annual and Semi-Annual Reports, proxy statements and other similar documents you receive by sending only one copy of each to those addresses shared by two or more accounts and to shareholders we reasonably believe are from the same family or household. Householding begins once you have signed your account application. After such time, if you would like to discontinue householding for your accounts, please call toll-free at (800) 851-0511 to request individual copies of these documents. Once the Funds receive notice to stop householding, we will begin sending individual copies thirty days after receiving your request. This policy does not apply to account statements.
| | |
| | |
| 36 | | DIREXION ANNUAL REPORT |
INVESTMENT ADVISORYAND SUBADVISORY AGREEMENTS APPROVALS (UNAUDITED)
Provided below is a summary of certain of the factors the Board considered at its August 17, 2011 Board meeting in renewing: (1) the Advisory Agreement between Rafferty Asset Management (“Rafferty”) and the Direxion Funds (the “Trust”), on behalf of the Commodity Trends Strategy Fund, Currency Trends Strategy Fund (formerly Financial Trends Strategy Fund), Direxion/Wilshire Dynamic Fund and Direxion Long/Short Global IPO Fund, each a series of the Trust; and (2) the Subadvisory Agreement between Rafferty and Wilshire Associates Incorporated (“Wilshire”) on behalf of the Direxion/Wilshire Dynamic Fund. Each series of the Trust is referred to herein as a “Fund” and collectively as the “Funds.”
The Board did not identify any particular information that was most relevant to its consideration to approve each Advisory or Subadvisory Agreement (each an “Agreement” and collectively, the “Agreements”) and each Trustee may have afforded different weight to the various factors. In determining whether to approve the continuance of the Agreements, the Board considered the best interests of each Fund separately. In addition, the Board noted that the Trustees have considered various reports and information provided throughout the year at their regular Board meetings and otherwise. While the Agreements for all of the Funds were considered at the same Board meeting, the Board considered each Fund’s investment advisory and subadvisory relationship separately.
In each instance, the Board considered, among others, the following factors: (1) the nature and quality of the services provided; (2) the investment performance of the Fund; (3) the profitability of the advisory business to Rafferty or Wilshire; (4) the extent to which economies of scale have been taken into account in setting fee schedules; (5) whether fee levels reflect these economies of scale, if any, for the benefit of Fund shareholders; (6) comparisons of services and fees with contracts entered into by Rafferty and, in certain cases, Wilshire, with other clients (such as pension funds and other institutional investors), if any; and (7) other benefits derived or anticipated to be derived and identified by Rafferty or Wilshire from its relationship with the Funds.
Nature, Extent and Quality of Services Provided. The Board reviewed the nature, extent and quality of the services provided under the Advisory Agreement by Rafferty. The Board noted that Rafferty has provided services to the Trust since its inception and has developed an expertise in managing the Funds. The Board also noted that Rafferty trades efficiently with low commission schedules, which helps improve performance results. The Board considered Rafferty’s representation that it has the financial resources and appropriate staffing to manage the Funds and meet its expense reimbursement obligations, if any. The Board also considered that Rafferty utilizes the services of an independent compliance consulting firm and that reports from the chief compliance officer are provided to the Board at its regularly scheduled quarterly Board meetings. The Board considered that Rafferty oversees all aspects of the operation of the Funds, including oversight of the Funds’ service providers and Wilshire. Based on these and other considerations, the Board determined that, in the exercise of its business judgment, the nature, extent and quality of the services provided by Rafferty to the Funds under the Agreement and Wilshire under the Subadvisory Agreement were fair and reasonable.
Performance of the Funds. The Board evaluated the performance of each Fund relative to: (1) its benchmark index for year-to-date, one-year and since inception periods ended June 30, 2011, where applicable; and (2) the average performance of the relevant Morningstar peer fund universe for monthly and annual periods ended June 30, 2011.
With respect to the Commodity Trends Strategy Fund, the Board considered management’s description of the performance of the Morningstar universe of commodities funds. The Board also considered that, as of June 30, 2011, the Fund outperformed the average of its relevant Morningstar peer funds for the three-year period, but underperformed for the year-to-date and one-year periods. In this regard, the Board noted that it recently approved a change in the investment strategy for the Fund that Rafferty expects will improve the Fund’s relative performance during periods of market volatility.
With respect to the Financial Trends Strategy Fund, the Board considered management’s description of the performance of the Morningstar universe of financial funds. The Board also considered that as of June 30, 2011, the Fund underperformed the average of its relevant Morningstar peer funds for all periods presented. In this regard, the Board noted that it recently approved a change to the underlying index and investment strategy for the Fund that Rafferty expects will improve the long-term relative performance of the Fund.
With respect to the Direxion Long/Short Global IPO Fund, the Board considered management’s description of the performance of the Morningstar universe of long/short equity funds. The Board also considered that as of June 30, 2011, the Fund underperformed the average of its relevant Morningstar peer funds for all periods presented. In this regard, the Board noted that it recently approved a change to the Fund’s investment strategy and portfolio management team that Rafferty expects will improve the relative performance of the Fund.
| | |
| |
| DIREXION ANNUAL REPORT | | 37 |
With respect to the Direxion/Wilshire Dynamic Fund, the Board considered management’s description of the performance of the Morningstar universe of moderate allocation funds. The Board also considered that as of June 30, 2011, the Fund underperformed the average of its relevant Morningstar peer funds for all periods presented. In this regard, the Board noted that the Fund commenced operations in March 2009 and it is reasonable to permit the Fund to establish a longer performance record for purposes of evaluating performance.
Costs of Services Provided to the Funds and Profits Realized. The Board considered the overall fees paid to Rafferty on an annual basis since each Fund’s commencement of operations, including any fee waivers and recoupment of fees previously waived. The Board also considered advisory fees charged by, and total expense ratios of, comparable fund groups. The Board considered the fees that Rafferty charges for the services that it provides to a pooled trading vehicle for domestic hedge funds. The Board considered that Rafferty contractually agreed to limit the total expenses for the most recent and upcoming fiscal years for each Fund via fee waivers and/or expense limitations. The Board also considered the overall profitability of Rafferty’s investment business and its representation that it does not allocate internal costs and assess profitability with respect to its services to individual Funds.
In considering the fees paid by Rafferty to Wilshire, the Board noted that Wilshire provides subadvisory services to different clients at different fee rates, depending on the types of services that Wilshire provides to a subadvisory client. With respect to the Direxion/Wilshire Dynamic Fund, the Board considered Wilshire’s profits or losses for its services. Based on these considerations, the Board determined that, in the exercise of its business judgment, the costs of the services provided and the profits realized under the Agreements were fair and reasonable.
Economies of Scale. The Board considered Rafferty’s representation that it believes that asset levels at this time are not sufficient to achieve economies of scale or warrant a reduction in fee rates or the addition of breakpoints. Rafferty noted that it was continuing to work on its sales and marketing efforts to raise additional assets. Based on these and other considerations, the Board determined that, in the exercise of its business judgment, the reduction in fee rates or additions of breakpoints were not necessary at this time.
Other Benefits. The Board considered Rafferty’s representation that its relationship with the Funds has permitted Rafferty to attract business to its non-mutual fund account. The Board also considered that Rafferty’s overall business with brokerage firms helps to lower commission rates and provide better execution for Fund portfolio transactions. In addition, the Board considered that Wilshire benefits from increased recognition in the marketplace due to the co-branded Direxion/Wilshire Dynamic Fund. Based on these and other considerations, the Board determined that, in the exercise of its business judgment, the benefits were fair and reasonable.
Conclusion. Based on, but not limited to, the above considerations and determinations, the Board determined that the Agreements for the Funds were fair and reasonable in light of the services to be performed, fees, expenses and such other matters as the Board considered relevant in the exercise of its business judgment. On this basis, the Board unanimously voted in favor of the continuance of the Agreements.
| | |
| | |
| 38 | | DIREXION ANNUAL REPORT |
Direxion Funds
TRUSTEES AND OFFICERS
The business affairs of the Funds are managed by or under the direction of the Board of Trustees. Information pertaining to the Trustees and Officers of the Funds is set below. The SAI includes additional information about the Funds’ Trustees and Officers and is available without charge, upon request by calling 1-800-851-0511.
| | | | | | | | | | |
|
|
Interested Trustees |
Name, Address and Age | | Position(s)
Held with
Fund | | Term of Office
and Length of
Time Served | | Principal Occupation(s) During Past Five Years | | # of Portfolios
in Direxion
Family of
Investment
Companies
Overseen by
Trustee(2) | | Other Trusteeships/
Directorships Held
by Trustee |
Lawrence C. Rafferty(1)
Age: 69 | | Chairman of the Board of Trustees | | Lifetime of Trust until removal or resignation; Since 1997 | | Chairman and Chief Executive Officer of Rafferty, 1997-present; Chief Executive Officer of Rafferty Companies, LLC, 1996-present; Chief Executive Officer of Rafferty Capital Markets, Inc., 1995-present. | | 28 | | Board of Trustees, Fairfield University; Board of Directors, St. Vincent’s Services; Executive Committee, Metropolitan Golf Association |
|
|
Non-Interested Trustees |
Name, Address and Age | | Position(s)
Held with
Fund | | Term of Office
and Length of
Time Served | | Principal Occupation(s) During Past Five Years | | # of Portfolios
in Direxion
Family of
Investment
Companies
Overseen by
Trustee(2) | | Other Trusteeships/
Directorships Held
by Trustee |
Daniel J. Byrne
Age: 67 | | Trustee | | Lifetime of Trust until removal or resignation; Since 1997 | | President and Chief Executive Officer of Byrne Securities Florida Inc. (formerly, Byrne Securities Inc.), 1992-present. | | 162 | | None. |
|
Gerald E. Shanley III
Age: 67 | | Trustee | | Lifetime of Trust until removal or resignation; Since 1997 | | Retired, Since 2002; Business Consultant, 1985-present; Trustee of Trust Under Will of Charles S. Payson, 1987-present; C.P.A., 1979-present. | | 162 | | None. |
|
John Weisser
Age: 69 | | Trustee | | Lifetime of Trust until removal or resignation; Since 2007 | | Retired, Since 1995; Salomon Brothers, Inc, 1971-1995, most recently as Managing Director. | | 162 | | Director, MainStay VP Fund Series, The MainStay Funds, The MainStay Funds Trust; Director ICAP Funds, Inc; Director, Eclipse Funds, Inc., Eclipse Funds; (66 Funds Total) |
|
| (1) | | Mr. Rafferty is affiliated with Rafferty. Mr. Rafferty is the Chairman and Chief Executive Officer of Rafferty and owns a beneficial interest in Rafferty. |
| (2) | | The Direxion Family of Investment Companies consists of the Direxion Funds which currently offers for sale to the public 27 portfolios, the Direxion Insurance Trust which currently offers for sale 1 portfolio and the Direxion Shares ETF Trust which currently offers for sale to the public 52 of the 134 funds currently registered with the SEC. |
| | |
| |
| DIREXION ANNUAL REPORT | | 39 |
Direxion Funds
TRUSTEES AND OFFICERS
| Principal | | Officers of the Trust |
The officers of the Trust conduct and supervise its daily business. Unless otherwise noted, an individual’s business address is 33 Whitehall Street, 10th Floor, New York, New York 10004. As of the date of this report, the officers of the Trust, their ages, their business address and their principal occupations during the past five years are as follows:
| | | | | | | | | | |
Name, Address and Age | | Position(s)
Held with
Fund | | Term of Office
and Length of
Time Served | | Principal Occupation(s) During Past Five Years | | # of Portfolios
in the Direxion
Family of
Investment
Companies
Overseen by
Trustee(2) | | Other Trusteeships/
Directorships Held
by Trustee |
Daniel D. O’Neill(1)
Age: 43 | | President; Chief Operating Officer and Chief Investment Officer | | One Year; Since 1999 One Year; Since 2006 | | Managing Director of Rafferty, 1999-present. | | 134 | | N/A |
|
Christopher Lewis
Age: 41 | | Chief Compliance Officer | | One Year; Since 2009 | | Director, Alaric Compliance Services, LLC, 2009 – present; Partner, Thacher Proffitt & Wood LLP, 2004-2008; Partner, Simmons & Simmons, 2002-2004. | | N/A | | N/A |
|
Patrick J. Rudnick
777 East Wisconsin Avenue
Milwaukee, WI 53202
Age: 38 | |
Principal Financial Officer and Treasurer | | One Year; Since 2010 | | Vice President, U.S. Bancorp Fund Services, LLC, since 2006; formerly, Manager, PricewaterhouseCoopers LLP (1999-2006). | | N/A | | N/A |
|
Angela Brickl
Age: 35 | | Secretary3 | | One Year; Since 2011 | | Vice President, Rafferty Asset Management, LLC, since October 2010; Summer Associate at Skadden, Arps, Slate, Meagher & Flom, LLP, May – August 2009; Summer Associate at Foley & Lardner, LLP, May – August 2008; Vice President, U.S. Bancorp Fund Services, LLC, November 2003 – August 2007. | | N/A | | N/A |
|
| (1) | | Mr. O’Neill serves as Chairman of the Board of Trustees of the Direxion Shares ETF Trust. |
| (2) | | The Direxion Family of Investment Companies consists of the Direxion Funds which currently offers for sale to the public 27 portfolios, the Direxion Insurance Trust which currently offers for sale 1 portfolio and the Direxion Shares ETF Trust which currently offers for sale to the public 52 of the 134 funds currently registered with the SEC. |
| (3) | | Ms. Brickl replaced Eric W. Falkeis as Secretary effective August 17, 2011. |
| | |
| | |
| 40 | | DIREXION ANNUAL REPORT |
THIS PAGE INTENTIONALLY LEFT BLANK
THIS PAGE INTENTIONALLY LEFT BLANK
PRIVACY NOTICE
At the Direxion Funds, we are committed to protecting your privacy. To open and service your Direxion accounts, we collect and maintain certain nonpublic personal information about you, such as your address, phone number, social security number, purchases, sales, account balances, bank account information and other personal financial information. We collect this information from the following sources:
| | • | | Account applications or other forms on which you provide information, |
| | • | | Mail, e-mail, the telephone and our website, and |
| | • | | Your transactions and account inquiries with us. |
We safeguard the personal information that you have entrusted to us in the following ways:
| | • | | As a general policy, only those employees who maintain your account and respond to your requests for additional services have access to your account information. |
| | • | | We maintain physical, electronic, and procedural safeguards to insure the security of your personal information and to prevent unauthorized access to your information. |
We do not disclose any nonpublic personal information about you or our former shareholders to anyone, except as permitted or required by law. In the course of conducting business and maintaining your account we may share shareholder information, as allowed by law, with our affiliated companies and with other service providers, including financial intermediaries, custodians, transfer agents and marketing consultants. Those companies are contractually bound to use that information only for the services for which we hired them. They are not permitted to use or share our shareholders’ nonpublic personal information for any other purpose. There also may be times when we provide information to federal, state or local authorities as required by law.
In the event that you hold fund shares of Direxion through a financial intermediary, including, but not limited to, a broker-dealer, bank, or trust company, the privacy policy of your financial intermediary would govern how your nonpublic personal information would be shared with nonaffiliated third parties.
For questions about our policy, please contact us at (800) 851-0511.
This page is not a part of the annual report.
ANNUAL REPORT OCTOBER 31, 2011
33 Whitehall Street, 10th Floor New York, New York 10004 (800) 851-0511
Investment Adviser
Rafferty Asset Management, LLC
33 Whitehall St. 10th Floor
New York, NY 10004
Administrator, Transfer Agent, Dividend Paying Agent & Shareholding Servicing Agent
U.S. Bancorp Fund Services, LLC
P.O. Box 1993
Milwaukee, WI 53201-1993
Custodian
U.S. Bank, N.A.
1555 RiverCenter Dr., Suite 302
Milwaukee, WI 53212
Independent Registered Public Accounting Firm
Ernst & Young LLP
5 Times Square
New York, NY 10036
Distributor
Rafferty Capital Markets, LLC
59 Hilton Avenue
Garden City, NY 11530
The Fund’s Proxy Voting Policies are available without charge by calling 1-800-851-0511, or by accessing the SEC’s website, at www.sec.gov.
The actual voting records relating to portfolio securities during the most recent period ended June 30 (starting with the year ended June 30, 2005) is available without charge by calling 1-800-851-0511 or by accessing the SEC’s website at www.sec.gov.
The Fund files complete schedules of portfolio holdings with the SEC on Form N-Q. The Form N-Q is available without change, upon request, by calling 1-800-851-0511, or by accessing the SEC’s website, at www.sec.gov.
This report has been prepared for shareholders and may be distributed to others only if preceded or accompanied by a current prospectus.
The registrant has adopted a code of ethics that applies to the registrant’s principal executive officer and principal financial officer. The registrant has not made any amendments to its code of ethics during the period covered by this report. The registrant has not granted any waivers from any provisions of the code of ethics during the period covered by this report. A copy of the registrant’s Code of Ethics is filed herewith.
| Item 3. | Audit Committee Financial Expert. |
The registrant’s board of trustees has determined that there is at least one audit committee financial expert serving on its audit committee. Gerald E. Shanley III is the “audit committee financial expert” and is considered to be “independent” as each term is defined in Item 3 of Form N-CSR.
| Item 4. | Principal Accountant Fees and Services. |
The registrant has engaged its principal accountant to perform audit services, audit-related services, tax services and other services during the past fiscal year. “Audit services” refer to performing an audit of the registrant’s annual financial statements or services that are normally provided by the accountant in connection with statutory and regulatory filings or engagements for the fiscal year. “Audit-related services” refer to the assurance and related services by the principal accountant that are reasonably related to the performance of the audit. “Tax services” refer to professional services rendered by the principal accountant for tax compliance, tax advice, and tax planning, including assessment of FIN 48 for the Funds and additional tax research. There were no “Other services” provided by the principal accountant. The following table details the aggregate fees billed or expected to be billed for each of the last fiscal year for audit fees, audit-related fees, tax fees and other fees by the principal accountant. The table presents aggregate fees billed to the registrant and reflected in the financial statements of the report to shareholders.
| | | | | | | | |
| | | FYE 10/31/2011 | | | FYE 10/31/2010 | |
Audit Fees | | $ | 89,200 | | | $ | 89,200 | |
Audit-Related Fees | | | — | | | | — | |
Tax Fees | | | 20,000 | | | | 20,000 | |
All Other Fees | | | — | | | | — | |
The audit committee has adopted pre-approval policies and procedures that require the audit committee to pre-approve all audit and non-audit services of the registrant, including services provided to any entity affiliated with the registrant.
The percentages of fees billed by Ernst & Young LLP applicable to non-audit services pursuant to waiver of pre-approval requirement were as follows:
| | | | | | | | |
| | | FYE 10/31/2011 | | | FYE 10/31/2010 | |
Audit-Related Fees | | | 0 | % | | | 0 | % |
Tax Fees | | | 0 | % | | | 0 | % |
All Other Fees | | | 0 | % | | | 0 | % |
All of the principal accountant’s hours spent on auditing the registrant’s financial statements were attributed to work performed by full-time permanent employees of the principal accountant. (If more than 50 percent of the accountant’s hours were spent to audit the registrant’s financial statements for the fiscal year, state how many hours were attributed to work performed by persons other than the principal accountant’s full-time, permanent employees.)
The following table indicates the non-audit fees billed or expected to be billed by the registrant’s accountant for services to the registrant and to the registrant’s investment adviser (and any other controlling entity, etc.—not sub-adviser) for the last year. The audit committee of the board of trustees has considered whether the provision of non-audit services that were rendered to the registrant’s investment adviser is compatible with maintaining the principal accountant’s independence and has concluded that the provision of such non-audit services by the accountant has not compromised the accountant’s independence.
| | | | | | | | |
Non-Audit Related Fees | | FYE 10/31/2011 | | | FYE 10/31/2010 | |
Registrant | | | None | | | | None | |
Registrant’s Investment Adviser | | | None | | | | None | |
| Item 5. | Audit Committee of Listed Registrants. |
Not applicable to registrants who are not listed issuers (as defined in Rule 10A-3 under the Securities Exchange Act of 1934).
| Item 6. | Schedule of Investments. |
Schedule of Investments is included as part of the report to shareholders filed under Item 1 of this Form.
| Item 7. | Disclosure of Proxy Voting Policies and Procedures for Closed-End Management Investment Companies. |
Not applicable to open-end investment companies.
| Item 8. | Portfolio Managers of Closed-End Management Investment Companies. |
Not applicable to open-end investment companies.
| Item 9. | Purchases of Equity Securities by Closed-End Management Investment Company and Affiliated Purchasers. |
Not applicable to open-end investment companies.
| Item 10. | Submission of Matters to a Vote of Security Holders. |
There have been no material changes to the procedures by which shareholders may recommend nominees to the registrant’s board of directors/trustees.
| Item 11. | Controls and Procedures. |
| (a) | The Registrant’s President and Principal Financial Officer have reviewed the Registrant’s disclosure controls and procedures (as defined in Rule 30a-3(c) under the Investment Company Act of 1940 (the “Act”)) as of a date within 90 days of the filing of this report, as required by Rule 30a-3(b) under the Act and Rules 13a-15(b) or 15d-15(b) under the Securities Exchange Act of 1934. Based on their review, such officers have concluded that the disclosure controls and procedures are effective in ensuring that information required to be disclosed in this report is appropriately recorded, processed, summarized and reported and made known to them by others within the Registrant and by the Registrant’s service provider. |
| (b) | There were no changes in the Registrant’s internal control over financial reporting (as defined in Rule 30a-3(d) under the Act) that occurred during the second fiscal quarter of the period covered by this report that has materially affected, or is reasonably likely to materially affect, the Registrant’s internal control over financial reporting. |
| (a) | (1) Any code of ethics or amendment thereto, that is subject of the disclosure required by Item 2, to the extent that the registrant intends to satisfy Item 2 requirements through filing an exhibit. Filed herewith. |
(2) Certifications pursuant to Section 302 of the Sarbanes-Oxley Act of 2002. Filed herewith.
(3) Any written solicitation to purchase securities under Rule 23c-1 under the Act sent or given during the period covered by the report by or on behalf of the registrant to 10 or more persons. Not applicable to open-end investment companies.
| (b) | Certification pursuant to Section 906 of the Sarbanes-Oxley Act of 2002. Furnished herewith. |
SIGNATURES
Pursuant to the requirements of the Securities Exchange Act of 1934 and the Investment Company Act of 1940, the registrant has duly caused this report to be signed on its behalf by the undersigned, thereunto duly authorized.
| | |
| (Registrant) Direxion Funds |
| |
| By (Signature and Title)* | | /s/ Daniel D. O’Neill |
| | Daniel D. O’Neill, President |
|
| Date December 28, 2011 |
Pursuant to the requirements of the Securities Exchange Act of 1934 and the Investment Company Act of 1940, this report has been signed below by the following persons on behalf of the registrant and in the capacities and on the dates indicated.
| | |
| By (Signature and Title)* | | /s/ Daniel D. O’Neill |
| | Daniel D. O’Neill, President |
|
| Date December 28, 2011 |
| | |
| By (Signature and Title)* | | /s/ Patrick J. Rudnick |
| | Patrick J. Rudnick, Principal Financial Officer |
|
| Date December 28, 2011 |
| * | Print the name and title of each signing officer under his or her signature. |