UNITED STATES
SECURITIES AND EXCHANGE COMMISSION
Washington, D.C. 20549
FORM N-CSR
CERTIFIED SHAREHOLDER REPORT OF REGISTERED
MANAGEMENT INVESTMENT COMPANIES
Investment Company Act file number 811-08243
Direxion Funds
(Exact name of registrant as specified in charter)
1301 Avenue of the Americas (6th Ave.), 35th Floor
New York, NY 10019
(Address of principal executive offices) (Zip code)
Daniel D. O’Neill
1301 Avenue of the Americas (6th Ave.), 35th Floor
New York, NY 10019
(Name and address of agent for service)
Registrant’s telephone number, including area code 646-572-3390
Date of fiscal year end: August 31, 2012
Date of reporting period: August 31, 2012
Item 1. Report to Stockholders.

ANNUAL REPORT AUGUST 31, 2012
1301 Avenue of the Americas (6th Ave.), 35th Floor New York, New York 10019 (800) 851-0511 www.direxionfunds.com
| | |
| BULL FUNDS | | BEAR FUNDS |
|
| DOMESTIC EQUITY INDEX FUNDS |
Direxion Monthly Small Cap Bull 2X Fund (DXRLX) Direxion Monthly S&P 500® Bull 2X Fund (DXSLX) Direxion Monthly NASDAQ-100® Bull 2X Fund (DXQLX) | | Direxion Monthly Small Cap Bear 2X Fund (DXRSX) Direxion Monthly S&P 500® Bear 2X Fund (DXSSX) |
|
| FIXED INCOME FUNDS |
Direxion Monthly 10 Year Note Bull 2X Fund (DXKLX) Dynamic HY Bond Fund (PDHYX) | | Direxion Monthly 10 Year Note Bear 2X Fund (DXKSX) |
|
| SPECIALTY FUNDS |
Direxion Monthly Commodity Bull 2X Fund (DXCLX) |
|
| INTERNATIONAL FUNDS |
Direxion Monthly Emerging Markets Bull 2X Fund (DXELX) Direxion Monthly China Bull 2X Fund (DXHLX) Direxion Monthly Latin America Bull 2X Fund (DXZLX) |
|
MONEY MARKET FUNDS |
| U.S. Government Money Market Fund (DXMXX) |
Table of Contents

Help Preserve the Environment – Go Green!
Go paperless with Direxion e-Delivery – a service allowing shareholders to reduce clutter with full online access to regulatory documents. Begin the preservation process with e-delivery.
With Direxion e-Delivery you can:
| | • | | Receive email notifications when your most recent shareholder communications are available for review. |
| | • | | Access prospectuses, annual reports and semiannual reports online. |
It’s easy to enroll:
| 1. | | Visit www.direxionfunds.com/edelivery |
| 2. | | Follow the simple enrollment instructions |
If you have questions about Direxion e-Delivery services, contact one of our shareholder representatives at 800-851-0511.

LETTERTO SHAREHOLDERS
Dear Shareholders,
This Annual Report covers thirteen of the Direxion Funds (the “Funds”). For the Direxion Monthly Small Cap Bull 2X Fund, Direxion Monthly Small Cap Bear 2X Fund, Direxion Monthly 10 Year Note Bull 2X Fund, Direxion Monthly 10 Year Note Bear 2X Fund, Dynamic HY Bond Fund, Direxion Monthly Commodity Bull 2X Fund, Direxion Monthly Emerging Markets Bull 2X Fund, Direxion Monthly China Bull 2X Fund and the U.S. Government Money Market Fund the report covers the period from September 1, 2011 to August 31, 2012 (the “Annual Period”). For the Direxion Monthly NASDAQ-100 Bull 2X Fund, Direxion Monthly S&P 500 Bull 2X Fund, Direxion Monthly S&P 500 Bear 2X Fund and Direxion Monthly Latin America Bull 2X Fund, the report covers the period of May 1, 2012 to August 31, 2012 (the “Shortened Period”), as these four Funds have changed their fiscal year to coincide with the aforementioned funds. During the Annual Period broad equity markets were strong, as the S&P 500 Index gained approximately 18%. Heightened levels of volatility characterized the early phase of the period as markets struggled to regain solid footing after the U.S. Government debt ceiling crisis in August 2011. However, concerns abated and markets rallied from December into the Spring. Although fears related to the ongoing sovereign debt crisis in Europe re-emerged causing equity markets to pull back from their highs during April and May. Markets again rallied late in the period as the U.S. Federal Reserve (“the Fed”) stood by its easy money policy and pledged to retain very low interest rates for an extended period of time. The U.S. Dollar was strong throughout the period, although opposing pressures – both from the Fed domestically and the European macro-environment abroad – added volatility to foreign exchange markets. Oil was volatile throughout the period, as structural changes sweeping across Northern Africa and the Middle East drove prices up, while concerns over global economic growth held prices back. The price for a barrel of oil rose as high as $110 in March 2012 after seeing lows of $75 in October 2011, before trading in the high $70 range again in the early summer 2012, and then settling at $95 per barrel at the end of the period.
Fund Operational Review:
Except for the Dynamic HY Bond Fund and the U.S. Government Money Market Fund, the Funds are leveraged and seek to provide a calendar month return of 200% or -200% of the calendar month performance of a particular benchmark (“Leveraged Funds”). The term “calendar month” refers to the period from the close of the markets on the last business day of a given calendar month, until the close of the markets on the last business day of the subsequent calendar month. The Funds seek calendar month leveraged investment results which should not be equated with seeking a leveraged goal for shorter than a calendar month. An investor who purchases shares on a day other than the last business day of a calendar month will generally receive more, or less, than 200% exposure to the target index, depending on the performance of the target index. If a Fund’s shares are held through the end of a calendar month or months, the Fund’s performance is likely to deviate from the multiple of the benchmark performance for the longer period. Similarly, the return for investors investing for periods less than a calendar month, or for a period different than the calendar month, will likely deviate from the multiple of the benchmark performance for such shorter periods. The Funds are not suitable for all investors and should be utilized only by sophisticated investors who understand leverage risk, consequences of seeking calendar month leverage investment results and intend to actively monitor and manage their investments.
The Funds with the word “Bull” in their name attempt to provide investment results that correlate to 200% of the return of an index or benchmark, meaning the Bull Funds attempt to move in the same direction as the target index or benchmark. The Fund with the word “Bear” in its name attempts to provide investment results that correlate to -200% of the return of an index or benchmark, meaning that the Bear Fund attempts to move in the opposite or inverse direction of the target index or benchmark.
In seeking to achieve each Leveraged Fund’s calendar month investment objective, Rafferty Asset Management (“Rafferty” or the “Adviser”) uses statistical and quantitative analysis to determine the investments each Fund makes and the techniques it employs. Rafferty relies upon a pre-determined model to generate orders resulting in repositioning each Fund’s investments in accordance with its calendar month investment objective. Using this approach, Rafferty determines the type, quantity and mix of investment positions it believes in combination should produce calendar month returns consistent with a Fund’s objective. As a consequence, if a Leveraged Fund is performing as designed, the return of the index or benchmark will dictate the return for that Fund. Each Leveraged Fund pursues its investment objective regardless of market conditions and does not take defensive positions.
Each Leveraged Fund has a clearly articulated goal which requires the Fund to seek economic exposure in excess of its net assets. To meet its objectives, each Leveraged Fund invests in some combination of financial instruments so it generates economic exposure consistent with the Fund’s investment objective. Financial instruments may include ETFs, stock index futures contracts, options on securities and stock indices and swap agreements. Each Leveraged Fund invests significantly in swap agreements. Rafferty uses these types of investments to produce economically “leveraged” investment results.
Leveraging allows Rafferty to generate a greater positive or negative return than what would be generated on the invested capital without leverage, thus changing small market movements into larger changes in the value of the investments of a Fund.
The Funds may use certain investment techniques, including investments in derivatives, which may be considered aggressive. Investments in derivatives in general are subject to market risks that may cause their prices to fluctuate over time. Additionally, such instruments may experience potentially dramatic price changes (losses) and imperfect correlations between the price of the contract and the underlying security or index which will increase the volatility of the Funds and may involve a small investment of cash relative to the magnitude of the risk assumed. The use of derivatives may expose the Funds to additional risks that they would not be subject to if they invested directly in the securities underlying those derivatives. The use of derivatives may result in larger losses or smaller gains than otherwise would be the case.
The discussion below relates to the performance of the Funds for their respective Period. The Leveraged Funds seek to provide calendar month returns which are a multiple — positive or negative — of the calendar month performance of a particular benchmark. The performance of the Leveraged Funds for their respective Period is important for understanding whether these Funds meet their investment goals. A Leveraged Fund meeting its calendar month investment objective should have performance for the Period similar to the performance indicated by models based on the calendar month returns of the relevant benchmark for the Period. Direxion maintains models indicating the expected performance of each Fund in light of the path of the relevant benchmark. The models, and a description of how they work, are available on the Direxion website (www.direxionfunds.com) under Tools/Tracking Center. The models do not take into account the size of a Fund, the Fund’s expense ratio or any transaction fees associated with creating a Fund’s portfolio. A brief comparison of the actual returns versus the expected returns for each of the Funds in this Annual Report follows.
Fund Performance Review:
The Direxion Monthly Small Cap Bull 2X Fund and the Direxion Monthly Small Cap Bear 2X Fund seek to provide 200% and -200% of the calendar month return of the Russell 2000 Index. The Russell 2000 Index measures the performance of the small-cap segment of the U.S. equity universe and is comprised of the smallest 2000 companies in the Russell 3000 Index, representing approximately 10% of the total market capitalization of that index. It includes approximately 2000 of the smallest securities based on a combination of their market cap and current index membership. For the Annual Period, the Russell 2000 Index returned 13.40%. Given the calendar month investment objectives of the Funds and the path dependency of returns for longer periods, the annual return of the index alone should not generate expectations of annual performance of the Funds. The Direxion Monthly Small Cap Bull 2X Fund returned 20.67%, while the model indicated an expected return of 22.58%. The Direxion Monthly Small Cap Bear 2X Fund returned -36.01%, while the model indicated an expected return of -33.66%
The Direxion Monthly 10 Year Note Bull 2X Fund and the Direxion Monthly 10 Year Note Bear 2X Fund seek to provide 200% and -200% of the calendar month return of the NYSE Arca Current 10 Year Treasury Index. The NYSE Arca Current 10 Year U.S. Treasury Index is a one-security index comprised of the most recently issued 10-Year Treasury Note. Notes eligible for inclusion must be U.S. dollar-denominated Treasury notes with a fixed rate, non-zero coupon that are non-callable with a maturity of 10 years at issuance. For the Annual Period, the NYSE Arca Current 10 Year Treasury Index returned 9.48%. Given the calendar month investment objectives of the Funds and the path dependency of returns for longer periods, the annual return of the index alone should not generate expectations of annual performance of the Funds. The Direxion Monthly 10 Year Note Bull 2X Fund returned 15.02%, while the model indicated an expected return of 19.31%. The Direxion Monthly 10 Year Note Bear 2X Fund returned -20.57%, while the model indicated an expected return of -17.79%
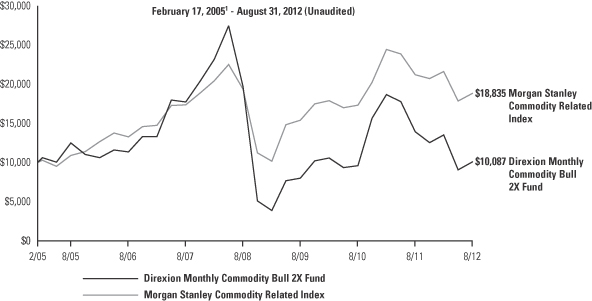
The Direxion Monthly Commodity Bull 2X Fund seeks to provide 200% of the calendar month return of the Morgan Stanley Commodity Related Index. The Morgan Stanley Commodity Related Index is an equal-dollar weighted index of 20 stocks involved in commodity-related industries such as energy, non-ferrous metals, agricultural and forest products. For the Annual Period, the Morgan Stanley Commodity Related Index returned -11.24% (-9.64% inclusive of dividends). Given the calendar month investment objectives of the Fund and the path dependency of returns for longer periods, the annual return of the index alone should not generate expectations of annual performance of the Fund. The Direxion Monthly Commodity Bull 2X Fund returned -27.66%, while the model indicated an expected return of -27.62%.
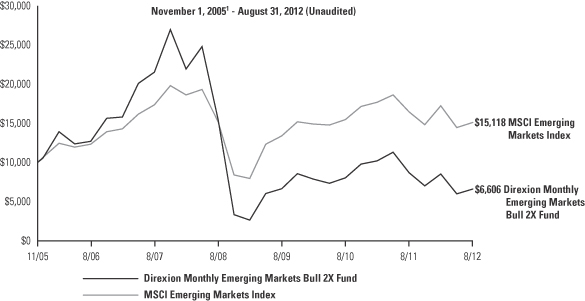
The Direxion Monthly Emerging Markets Bull 2X Fund seeks to provide 200% of the calendar month return of the MSCI Emerging Markets Index. The MSCI Emerging Markets Index is a free float-adjusted market capitalization index that is designed to measure equity market performance in the global emerging markets. For the Annual Period, the MSCI
The performance data quoted represents past performance; past performance does not guarantee future results. The investment return and principal value of an investment will fluctuate and an investor’s shares, when redeemed, may be worth more or less than their original cost. Current performance may be higher or lower than the performance data quoted.
Emerging Markets Index returned -8.31% (-5.53% inclusive of dividends). Given the calendar month investment objectives of the Fund and the path dependency of returns for longer periods, the annual return of the index alone should not generate expectations of annual performance of the Fund. The Direxion Monthly Emerging Markets Bull 2X Fund returned -24.29%, while the model indicated an expected return of -20.27%
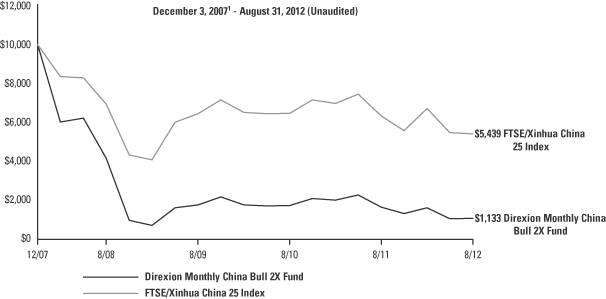
The Direxion Monthly China Bull 2X Fund seeks to provide 200% of the calendar month return of the FTSE/Xinhua China 25 Index. The FTSE/Xinhua China 25 Index consists of 25 of the largest and most liquid companies available to international investors traded on the Hong Kong Stock Exchange. The Index is weighted based on the total market value of each company so that companies with higher total market values generally have a higher representation in the Index. For the Annual Period, the FTSE/Xinhua China 25 Index returned -14.54% (-11.42% inclusive of dividends). Given the calendar month investment objectives of the Fund and the path dependency of returns for longer periods, the annual return of the index alone should not generate expectations of annual performance of the Fund. The Direxion Monthly China Bull 2X Fund returned -33.60%, while the model indicated an expected return of -32.13%
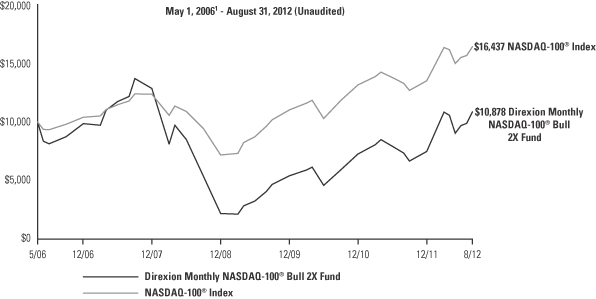
The Direxion Monthly NASDAQ-100 Bull 2X Fund sought to provide 200% of the calendar month return of the NASDAQ-100 Index. The NASDAQ-100 Index is a capitalization-weighted index composed of 100 of the largest non-financial domestic and international companies listed on the National Market tier of the NASDAQ National Market. All companies listed on the index have an average daily trading volume of at least 200,000 shares. For the Shortened Period, the NASDAQ-100 Index returned 1.78%. Given the calendar month investment objectives of the Fund and the path dependency of returns for longer periods, the return of the index alone should not generate expectations of performance of the Fund. The Direxion Monthly NASDAQ-100 Bull 2X Fund returned 2.81%, while the model indicated and expected return of 3.64%.
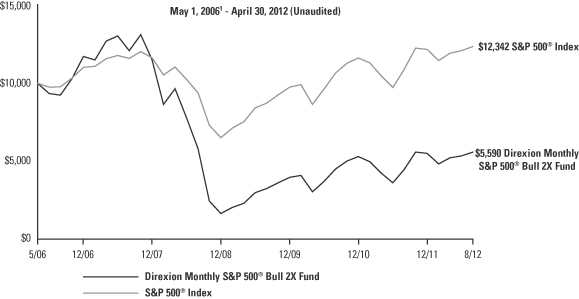
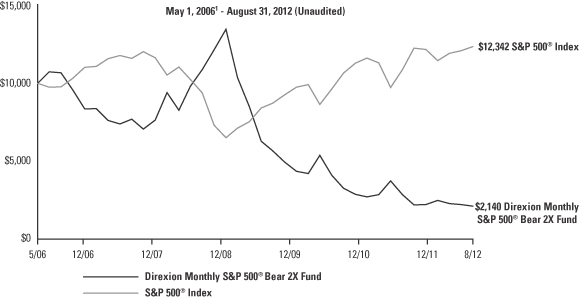
The Direxion Monthly S&P 500 Bull 2X Fund and the Direxion Monthly S&P 500 Bear 2X Fund sought to provide 200% and -200% of the calendar month return of the S&P 500 Index, respectively. The S&P 500 Index is a capitalization-weighted index composed of 500 common stocks. Standard & Poor’s selects the 500 stocks comprising the S&P 500 Index on the basis of market values and industry diversification. For the Shortened Period, the S&P 500 Index returned 1.45%. Given the calendar month investment objectives of the Funds and the path dependency of returns for longer periods, the return of the Index alone should not generate expectations of performance of the Funds. The Direxion Monthly S&P 500 Bull 2X Fund returned 1.39%, while the model indicated an expected return of 2.28%. The Direxion Monthly S&P 500 Bear 2X Fund returned -5.14%, while the model indicated an expected return of -4.57%.
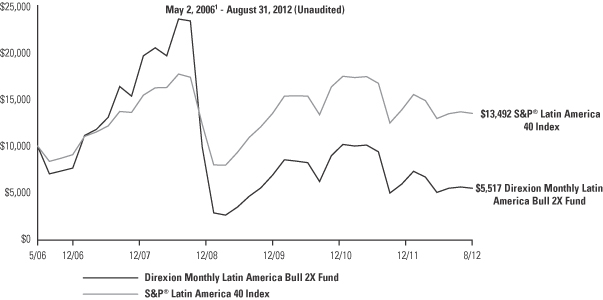
The Direxion Monthly Latin America Bull 2X Fund sought to provide 200% of the calendar month return of the S&P Latin America 40 Index. The S&P Latin America 40 Index includes highly liquid securities from major economic sectors of the Mexican and South American equity markets. Companies from Mexico, Brazil, Argentina and Chile are represented in this index. Representing approximately 70% of each country’s market capitalization, this index provides coverage of the large cap, liquid constituents of each key country in Latin America. For the Shortened Period, the S&P Latin America 40 Index returned -9.03%. Given the calendar month investment objectives of the Fund and the path dependency of returns for longer periods, the return of the Index alone should not generate expectations of performance of the Fund. The Direxion Monthly Latin America Bull 2X Fund returned -17.99%, while the model indicated an expected return of -16.78%.
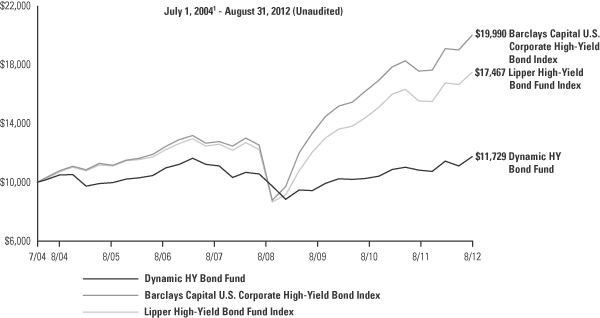
The Dynamic HY Bond Fund seeks to maximize total return (income plus capital appreciation) by investing primarily in debt instruments with an emphasis on lower-quality debt. The Fund utilizes investments in high yield Exchange Traded Funds (ETFs) as a means of obtaining liquid exposure to the domestic high yield debt market, and retains the flexibility to invest in physical bonds as well as derivatives and financial instruments linked to lower rated fixed income securities. Typically, the Fund will have 85-100% of the portfolio invested in such high yield ETFs. High-yielding securities performed well during the Annual Period as yields remained robust relative to returns on treasury securities as the Barclays Capital U.S. Corporate High Yield Bond Index gained 13.89% for the Annual Period. Defaults remained low, as prices were supported by investment flows into the high yield asset class, and appetite for new debt issuance was strong. Investors sought higher rates of return while money-market yields remained historically low in a reflection of the Federal Reserve’s maintenance of extremely low interest rates. The Dynamic HY Bond Fund returned 8.41% during the period. This return was aided by a limited use of investments in derivatives. However, the Fund’s use of a limited number of high yield ETFs in its portfolio as well as maintaining a cash holding of approximately 5-10% during the Annual Period caused the Fund to return slightly less than the broader Barclays Capital U.S. Corporate High Yield Total Return Index.
The U.S. Government Money Market Fund is a short-term vehicle providing a useful service for those participating in our mutual fund product offerings. For the Annual Period, the U.S. Government Money Market Fund returned 0.07%.
The performance data quoted represents past performance; past performance does not guarantee future results. The investment return and principal value of an investment will fluctuate and an investor’s shares, when redeemed, may be worth more or less than their original cost. Current performance may be higher or lower than the performance data quoted.
As always, we thank you for using the Direxion Funds and we look forward to our mutual success.
Best Regards,
| | |
 | |  |
Daniel O’Neill Chief Investment Officer | | Patrick Rudnick Principal Financial Officer |
The performance data quoted represents past performance; past performance does not guarantee future results. The investment return and principal value of an investment will fluctuate and an investor’s shares, when redeemed, may be worth more or less than their original cost. Current performance may be higher or lower than the performance data quoted.
An investment in any of the Direxion Funds is subject to a number of risks that could affect the value of its shares. It is important that investors closely review and understand these risks before making an investment. An investor should consider the investment objectives, risks, charges and expenses of the Direxion Funds carefully before investing. The prospectus contains this and other information about the Direxion Funds. To obtain a prospectus, please call the Direxion Funds at 1-800-851-0511 or visit www.direxionfunds.com. The prospectus should be read carefully before investing.
There is no guarantee the Funds will achieve their objective. Investing in funds that track an index may be more volatile than investing in broadly diversified funds. The use of leverage by a Fund means the Funds are riskier than alternatives which do not use leverage.
The views in this report were those of the Adviser as of August 31, 2012 and may not reflect their views on the date this report is first published or anytime thereafter. These views are intended to assist shareholders of the Fund in understanding their investments in the Fund and do not constitute investment advice.
To obtain performance data current to the most recent month-end, please call toll-free, 1.800.851.0511, or visit www.direxionfunds.com.
The total annual fund operating expense ratios of the Direxion Monthly Small Cap Bull 2X Fund, Direxion Monthly Small Cap Bear 2X Fund, Direxion Monthly 10 Year Note Bull 2X Fund, Direxion Monthly 10 Year Note Bear 2X Fund, Dynamic HY Bond Fund, Direxion Monthly Commodity Bull 2X Fund, Direxion Monthly Emerging Markets Bull 2X Fund, Direxion Monthly China Bull 2X Fund, Direxion Monthly NASDAQ-100 Bull 2X Fund, Direxion Monthly S&P 500 Bull 2X Fund, Direxion Monthly S&P 500 Bear 2X Fund, and Direxion Monthly Latin America Bull 2X Fund are 1.96%, 1.98%, 1.97%, 1.97%, 1.86%, 2.00%, 2.01%, 1.97%, 1.92%, 1.92%, 1.91% and 1.94% respectively, net of any fee, waivers or expense reimbursements.*
Distributed by: Rafferty Capital Markets, LLC
Date of First Use: October 26, 2012
*The total annual fund operating expense ratios include Acquired Fund Fees and Expenses, indirect fees and expenses that the Funds incur that are required to be disclosed. Without Acquired Fund Fees and Expenses, total annual fund operating expense ratios would be 1.90% for each Fund except the Dynamic HY Bond Fund. The total annual fund operating expense ratio of the Dynamic HY Bond Fund would be 1.60%.
MANAGEMENT DISCUSSION & ANALYSIS
Rafferty Asset Management, LLC (“Rafferty” or “Adviser”), the investment adviser to the Direxion Funds, uses a number of investment techniques in order to achieve the stated goal for each Fund. The following discussion and analysis applies to the Direxion Monthly Small Cap Bull 2X Fund, Direxion Monthly Small Cap Bear 2X Fund, Direxion Monthly 10 Year Note Bull 2X Fund, Direxion Monthly 10 Year Note Bear 2X Fund, Direxion Commodity Bull 2X Fund, Direxion Monthly Emerging Markets Bull 2X Fund and Direxion Monthly China Bull 2X Fund for the timeframe of September 1, 2011 to August 31, 2012 (the “Annual Period”). This discussion and analysis also applies to the Direxion Monthly NASDAQ-100 Bull 2X Fund, Direxion Monthly S&P 500 Bull 2X Fund, Direxion Monthly S&P 500 Bear 2X Fund and Direxion Latin America Bull 2X Fund for the timeframe of May 1, 2012 to August 31, 2012 (the “Shortened Period”). The Bull Funds magnify the returns of their respective indexes for a calendar month period and the Bear Funds inversely magnify the returns of their respective indexes for a calendar month period. Rafferty primarily uses statistical and quantitative analysis to determine the investments each Fund makes and the techniques it employs.
No Fund attempts, or should be expected to, provide returns which are a multiple of the return of the benchmark for periods other than a calendar month. A “calendar month” refers to the period from the close of markets on the last business day of a given month until the close of the markets on the last business day of the subsequent month.
Factors Affecting Fund Performance:
| | • | | Benchmark Performance: The calendar month performance of each Fund’s benchmark index, and the factors and market conditions implicitly affecting that index, are the primary factors driving Fund performance. Given the calendar month goals, the series of calendar month index returns are most important. The market conditions affecting the benchmark indexes during the past year are described below. |
| | • | | Leverage: Each Fund seeks calendar month investment results (before fees and expenses) of either 200% (for the Bull Funds) or -200% (for the Bear Funds) of the performance of its respective underlying index. The use of leverage magnifies a Fund’s gains or losses and increases the investment’s risk and volatility. |
| | • | | Volatility and Compounding: The goal of leveraged funds is to provide a multiple of the calendar month returns of an underlying index. Over periods longer or shorter than a calendar month, a Fund should not be expected to provide its respective multiple of the return of the underlying index. Due to the effects of compounding — a universal mathematical concept applying to all investments — returns of the Funds over longer periods will differ from the Fund’s calendar month stated goal. Periods of high-volatility lacking a clear trend hurt a Fund’s performance, while trending low-volatility markets enhance a Fund’s performance. |
| | • | | Cost of Financing: In order to attain leveraged exposure, a Bull Fund incurs a cost of LIBOR1 plus a spread, and a Bear Fund receives LIBOR minus a spread as applied to the borrowed portion of the Fund’s exposure. Financing costs create a drag on a Bull Fund’s performance. Because LIBOR is very low, a Bear Fund receives a negligible amount of financing, or in the case of hard-to-borrow shares, might pay to finance its short position. |
| | • | | Equity Dividends: A Bull Fund’s performance is positively impacted by equity and index dividends, as the Funds receive those payments. A Bear Fund’s performance is negatively impacted, as they are obligated to pay the dividends. |
| | • | | Fees, Expenses, and Transaction Costs: Fees and expenses are listed in each Fund’s prospectus and may be larger than many traditional index funds’ fees, causing a greater negative impact on Fund performance. Transactions costs are not included in the expense ratio of the Funds. Transaction costs can be higher due to the Fund’s use of leverage, significant purchase and redemption activity by Fund shareholders; or trading securities that are comparatively less liquid. |
Market Conditions Affecting Fund Performance:
A general review of economic conditions, market events and index performance for the period is described below.
Economy:
This Annual Period saw a trending rally in broad domestic markets across the board, starting with improved investor sentiment through the beginning of 2012, followed by a continued uptrend in the latter part of Q3. With the end of the Annual Period came improved jobs numbers, the initiation of a third phase of Quantitative Easing, and the extension of Operation Twist through the end of 2012. The U.S. Economy grew +1.7% over the first half of 2012. Through the latter half of
| 1 | London Inter-Bank Offer Rate. The interest rate that the banks charge each other for loans (usually in Eurodollars). This rate is applicable to the short-term international interbank market, and applies to very large loans borrowed for anywhere from one day to five years. |
this Annual Period, consumer spending held up reasonably well (+2.5% in Q1, +1.5% in Q2), but investor spending started to show its weakness.
In Europe, the Central Banks continued to try to establish a foundation for growth. In February, Europe avoided the risk of a short-term Greek default, and also completed a second round of a long-term refinancing operation with the injection of low interest rate funding to Eurozone banks. European equities and the Euro lagged behind oil and commodities gains through this period as concerns over the Eurozone returned to center stage. This Annual Period also saw continuously weak economic data from China.
Index Performance:
Over the Annual Period, Rafferty managed Funds of four different categories of indexes — broad market, international, fixed income and commodity.
With volatility remaining at low levels throughout the majority of 2012, domestic broad market indexes brought positive returns over the Annual Period year. Five of Direxion’s leveraged Funds track broad market indexes; the index returns for the period are below. Due to the trending nature of the benchmark performances, the effects of compounding on these Funds were not as noticeable as it would have been had the benchmarks been more volatile.
Russell 2000 Index: 13.40% (for Annual Period)
S&P 500 Index: 1.45% (for Shortened Period)
NASDAQ-100 Index: 1.78% (for Shortened Period)
Rafferty managed two Funds benchmarked to a fixed income index — The NYSE Arca Current 10 Year U.S. Treasury Index. The NYSE Arca Current 10 Year U.S. Treasury Index is a one-security index comprised of the most recently issued 10-Year Treasury Note. Notes eligible for inclusion must be U.S. dollar-denominated Treasury notes with a fixed rate, non-zero coupon that are non-callable with a maturity of 10 years at issuance. The index return for the Annual Period is below. The U.S. Dollar Index showed a steady climb of 9.03% through the Annual Period, but the effects of compounding on these funds were not as pronounced as it would have been had the benchmark been more volatile.
NYSE Arca Current 10 Year U.S. Treasury Index: 9.48%
Rafferty managed one Fund benchmarked to a commodities index — Morgan Stanley® Commodity Related Index. Morgan Stanley® Commodity Related Index is an equal-dollar weighted index of 20 stocks involved in commodity-related industries such as energy, non-ferrous metals, agriculture, and forest products. The index return for the Annual Period is below. The recent weather-related supply squeeze in agricultural goods, and slow global growth in industrial metals over this past Annual Period, led the way for the decline in commodity-related industries.
Morgan Stanley Commodity Related Index: -11.24%
Rafferty managed three Funds benchmarked to an international index. The index returns are below. Emerging markets bounced back from a low point in late 2011, with a year-over-year decline of roughly -5.6 %. However, investor sentiment still stands for Emerging Markets to outperform Developed Markets in terms of economic growth for the near future. Growth concerns for China were significant, as exports to developed countries weakened substantially. The decline in the S&P Latin America 40 Index can be explained by the approximately 50% geographic allocation in Brazil. The global slowdown has intensified rising labor costs and monetary tightening in Brazil, resulting in a sharp decline in growth.
MSCI Emerging Markets Index: -8.31% (for Annual Period)
FTSE/Xinhua China 25 Index: -14.54% (for Annual Period)
S&P Latin America 40 Index: -9.03% (for Shortened Period)
Index Volatility:
Market volatility trended downward fairly steadily throughout the Annual Period with the Chicago Board Options Exchange Market Volatility Index (the “VIX”) ending down roughly 45%. The VIX Index hit a peak on October 3, 2011 at 45.45, a large drop to 14.26 in late March, and an Annual Period low of 13.45 in mid-August. Lower volatility positively
impacts a Fund’s performance as described in the previous section. The volatility of each Index used as a benchmark for the Funds is below:
| | | | | | | | |
Benchmark | | One-Year
Return | | | Annualized
Volatility | |
Russell 2000 Index | | | 13.40 | % | | | 22.75 | % |
S&P 500 Index | | | 18.00 | % | | | 16.53 | % |
NASDAQ-100 Index | | | 23.70 | % | | | 18.38 | % |
NYSE Arca Current 10 Year U.S. Treasury Index | | | 9.48 | % | | | 6.65 | % |
Morgan Stanley Commodity Related Index | | | -11.24 | % | | | 29.13 | % |
MSCI Emerging Markets Index | | | -8.31 | % | | | 23.28 | % |
FTSE/Xinhua China 25 Index | | | -14.54 | % | | | 34.78 | % |
S&P Latin America 40 Index | | | -10.61 | % | | | 31.86 | % |
Rafferty does not invest the assets of the Funds based on its view of the investment merit of a particular security, instrument or company. In addition, each Fund pursues its investment objective regardless of market conditions and does not take defensive positions.
The views of this report were those of the Adviser as of August 31, 2012 and may not reflect their views on the date this report is first published or anytime thereafter. These views are intended to assist shareholders of the Fund in understanding their investments in the Fund and do not constitute investment advice.
| | |
| | |
| 10 | | DIREXION ANNUAL REPORT |
Direxion Monthly Small Cap Bull 2X Fund
Performance Summary
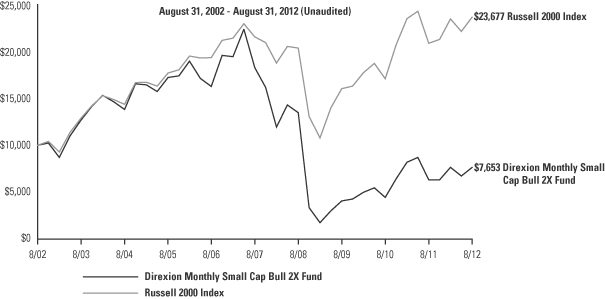
Investment Objective: Seeks monthly investment results, before fees and expenses, of 200% of the price performance of the Russell 2000 Index.
| | | | | | | | | | | | | | | | |
| | | Average Annual Total Return1 | |
| | | 1 Year | | | 3 Years | | | 5 Years | | | 10 Years | |
Direxion Monthly Small Cap Bull 2X Fund | | | 20.67 | % | | | 23.12 | % | | | (15.98 | )% | | | (2.64 | )% |
| | | | |
Russell 2000 Index | | | 13.40 | % | | | 13.89 | % | | | 1.90 | % | | | 9.00 | % |
The Fund seeks calendar month leveraged investment results. An investor who purchases shares on a day other than the last business day of the calendar month will generally receive more, or less, than 200% (or -200%) exposure to its index. Other factors such as fees and expenses, high portfolio turnover, transaction costs, significant purchases and redemption activity by Fund shareholders and/or a temporary lack of liquidity in the markets for the securities held by the Fund may also cause the Fund’s investment results to vary from its stated objective.
This chart illustrates the performance of a hypothetical $10,000 investment made ten years ago, and is not intended to imply any future performance. The returns shown do not reflect the deduction of taxes that a shareholder would pay on fund distributions of the redemption of fund shares. The performance of the Russell 2000 Index does not reflect the deduction of fees associated with a mutual fund, such as investment management fees. Investors cannot invest directly in an index, although they can invest in its underlying securities. During the period shown, Rafferty Asset Management, LLC waived and/or reimbursed fees for various expenses. Had these waivers and/or reimbursements not been in effect, performance would have been lower.
The performance data shown represents past performance and does not guarantee future results.
Market Exposure1
| | | | |
Investment Type | | %
Net Assets | |
Swap Contracts | | | 200.4% | |
| | | | |
Total Exposure | | | 200.4% | |
| | | | |
“Market Exposure” includes the value of total investments (including the contract value of any derivatives) and excludes any short-term investments and cash equivalents divided by Net Assets.
| | |
| |
| DIREXION ANNUAL REPORT | | 11 |
Direxion Monthly Small Cap Bear 2X Fund
Performance Summary
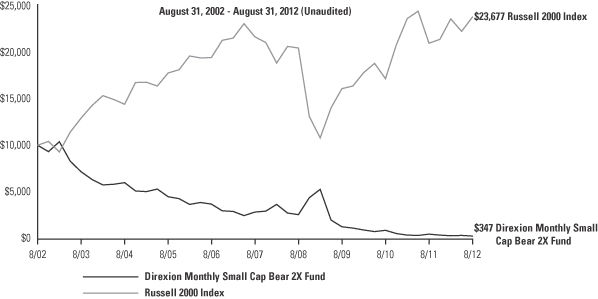
Investment Objective: Seeks monthly investment results, before fees and expenses, of 200% of the inverse of the price performance of the Russell 2000 Index.
| | | | | | | | | | | | | | | | |
| | | Average Annual Total Return1 | |
| | | 1 Year | | | 3 Years | | | 5 Years | | | 10 Years | |
Direxion Monthly Small Cap Bear 2X Fund | | | (36.01 | )% | | | (36.26 | )% | | | (34.52 | )% | | | (28.55 | )% |
| | | | |
Russell 2000 Index | | | 13.40 | % | | | 13.89 | % | | | 1.90 | % | | | 9.00 | % |
The Fund seeks calendar month leveraged investment results. An investor who purchases shares on a day other than the last business day of the calendar month will generally receive more, or less, than 200% (or -200%) exposure to its index. Other factors such as fees and expenses, high portfolio turnover, transaction costs, significant purchases and redemption activity by Fund shareholders and/or a temporary lack of liquidity in the markets for the securities held by the Fund may also cause the Fund’s investment results to vary from its stated objective.
This chart illustrates the performance of a hypothetical $10,000 investment made ten years ago, and is not intended to imply any future performance. The returns shown do not reflect the deduction of taxes that a shareholder would pay on fund distributions of the redemption of fund shares. The performance of the Russell 2000 Index does not reflect the deduction of fees associated with a mutual fund, such as investment management fees. Investors cannot invest directly in an index, although they can invest in its underlying securities. During the period shown, Rafferty Asset Management, LLC waived and/or reimbursed fees for various expenses. Had these waivers and/or reimbursements not been in effect, performance would have been lower.
The performance data shown represents past performance and does not guarantee future results.
Market Exposure1
| | | | |
Investment Type | | %
Net Assets | |
Swap Contracts | | | (200.6)% | |
| | | | |
Total Exposure | | | (200.6)% | |
| | | | |
“Market Exposure” includes the value of total investments (including the contract value of any derivatives) and excludes any short-term investments and cash equivalents divided by Net Assets.
| | |
| | |
| 12 | | DIREXION ANNUAL REPORT |
Direxion Monthly 10 Year Bull 2X Fund
Performance Summary
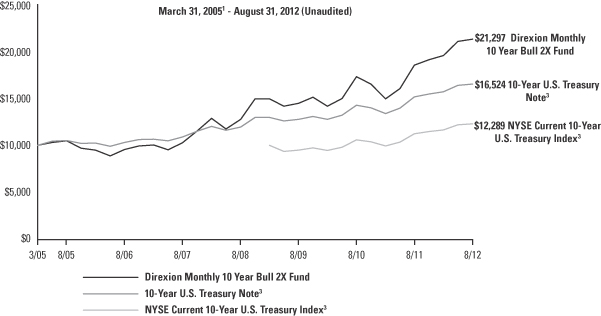
Investment Objective: The Direxion Monthly 10 Year Note Bull 2X Fund seeks monthly investment results, before fees and expenses, of 200% of the performance of the NYSE Current 10-Year U.S. Treasury Index.
| | | | | | | | | | | | | | | | |
| | | Average Annual Total Return2 | |
| | | 1 Year | | | 3 Years | | | 5 Years | | | Since
Inception | |
Direxion Monthly 10 Year Bull 2X Fund | | | 15.02 | % | | | 13.72 | % | | | 15.64 | % | | | 10.73 | % |
| | | | |
10-Year U.S. Treasury Note3 | | | 9.14 | % | | | 8.95 | % | | | 8.67 | % | | | 7.00 | % |
| | | | |
NYSE Current 10-Year U.S. Treasury Index3 | | | 9.48 | % | | | 9.01 | % | | | N/A | | | | N/A | |
The Fund seeks calendar month leveraged investment results. An investor who purchases shares on a day other than the last business day of the calendar month will generally receive more, or less, than 200% (or -200%) exposure to its index. Other factors such as fees and expenses, high portfolio turnover, transaction costs, significant purchases and redemption activity by Fund shareholders and/or a temporary lack of liquidity in the markets for the securities held by the Fund may also cause the Fund’s investment results to vary from its stated objective.
This chart illustrates the performance of a hypothetical $10,000 investment made on the Fund’s inception, and is not intended to imply any future performance. The returns shown do not reflect the deduction of taxes that a shareholder would pay on fund distributions of the redemption of fund shares. The performance of the NYSE Current 10-Year U.S. Treasury Index does not reflect the deduction of fees associated with a mutual fund, such as investment management fees. Investors cannot invest directly in an index, although they can invest in its underlying securities. During the period shown, Rafferty Asset Management, LLC waived and/or reimbursed fees for various expenses. Had these waivers and/or reimbursements not been in effect, performance would have been lower.
The performance data shown represents past performance and does not guarantee future results.
Market Exposure2
| | | | |
Investment Type | | %
Net Assets | |
Swap Contracts | | | 199.7% | |
| | | | |
Total Exposure | | | 199.7% | |
| | | | |
“Market Exposure” includes the value of total investments (including the contract value of any derivatives) and excludes any short-term investments and cash equivalents divided by Net Assets.
| 1 | Commencement of operations. |
| 3 | On August 31, 2009, the NYSE Current 10-Year U.S. Treasury Index replaced the 10-Year U.S. Treasury Note as benchmark. The NYSE Current 10-Year U.S. Treasury Index commenced operations on April 2, 2009. The average annual return for the period from April 2, 2009 to August 31, 2012 was 6.21%. |
| | |
| |
| DIREXION ANNUAL REPORT | | 13 |
Direxion Monthly 10 Year Bear 2X Fund
Performance Summary
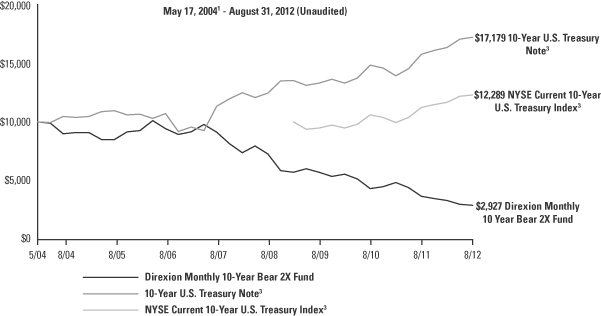
Investment Objective: The Direxion Monthly 10 Year Note Bear 2X Fund seeks monthly investment results, before fees and expenses, of 200% of the inverse of the performance of the NYSE Current 10-Year U.S. Treasury Index.
| | | | | | | | | | | | | | | | |
| | | Average Annual Total Return2 | |
| | | 1 Year | | | 3 Years | | | 5 Years | | | Since
Inception | |
Direxion Monthly 10 Year Bear 2X Fund | | | (20.57 | )% | | | (20.03 | )% | | | (20.35 | )% | | | (13.77 | )% |
| | | | |
10-Year U.S. Treasury Note3 | | | 9.14 | % | | | 8.95 | % | | | 8.67 | % | | | 6.74 | % |
| | | | |
NYSE Current 10-Year U.S. Treasury Index3 | | | 9.48 | % | | | 9.01 | % | | | N/A | | | | 6.21 | % |
The Fund seeks calendar month leveraged investment results. An investor who purchases shares on a day other than the last business day of the calendar month will generally receive more, or less, than 200% (or -200%) exposure to its index. Other factors such as fees and expenses, high portfolio turnover, transaction costs, significant purchases and redemption activity by Fund shareholders and/or a temporary lack of liquidity in the markets for the securities held by the Fund may also cause the Fund’s investment results to vary from its stated objective.
This chart illustrates the performance of a hypothetical $10,000 investment made on the Fund’s inception, and is not intended to imply any future performance. The returns shown do not reflect the deduction of taxes that a shareholder would pay on fund distributions of the redemption of fund shares. The performance of the NYSE Current 10-Year U.S. Treasury Index does not reflect the deduction of fees associated with a mutual fund, such as investment management fees. Investors cannot invest directly in an index, although they can invest in its underlying securities. During the period shown, Rafferty Asset Management, LLC waived and/or reimbursed fees for various expenses. Had these waivers and/or reimbursements not been in effect, performance would have been lower.
The performance data shown represents past performance and does not guarantee future results.
Market Exposure2
| | | | |
Investment Type | | %
Net Assets | |
Swap Contracts | | | (200.2 | )% |
| | | | |
Total Exposure | | | (200.2 | )% |
| | | | |
“Market Exposure” includes the value of total investments (including the contract value of any derivatives) and excludes any short-term investments and cash equivalents divided by Net Assets.
| 1 | Commencement of operations. |
| 3 | On August 31, 2009, the NYSE Current 10-Year U.S. Treasury Index replaced the 10-Year U.S. Treasury Note as benchmark. The NYSE Current 10-Year U.S. Treasury Index commenced operations on April 2, 2009. The average annual return for the period from April 2, 2009 to August 31, 2012 was 6.21%. |
| | |
| | |
| 14 | | DIREXION ANNUAL REPORT |
Dynamic HY Bond Fund
Performance Summary
Investment Objective: Seeks to maximize total return by investing primarily in high-yield debt instruments, commonly referred to as “junk bonds”, and derivatives of such instruments.
| | | | | | | | | | | | | | | | |
| | | Average Annual Total Return2 | |
| | | 1 Year | | | 3 Year | | | 5 Year | | | Since
Inception | |
Dynamic HY Bond Fund | | | 8.41 | % | | | 7.56 | % | | | 0.90 | % | | | 1.97 | % |
| | | | |
Barclays Capital U.S. Corporate High-Yield Bond Index | | | 13.89 | % | | | 14.47 | % | | | 9.60 | % | | | 8.85 | % |
| | | | |
Lipper High-Yield Bond Fund Index | | | 12.53 | % | | | 13.20 | % | | | 7.00 | % | | | 7.07 | % |
This chart illustrates the performance of a hypothetical $10,000 investment made on the Fund’s inception, and is not intended to imply any future performance. The returns shown do not reflect the deduction of taxes that a shareholder would pay on fund distributions of the redemption of fund shares. The performance of the Barclays Capital U.S. Corporate High-Yield Bond Index and the Lipper High-Yield Bond Fund Index does not reflect the deduction of fees associated with a mutual fund, such as investment management fees. Investors cannot invest directly in an index, although they can invest in its underlying securities. During the period shown, Rafferty Asset Management, LLC waived and/or reimbursed fees for various expenses. Had these waivers and/or reimbursements not been in effect, performance would have been lower.
The performance data shown represents past performance and does not guarantee future results.
Market Exposure2
| | | | |
Investment Type | | %
Net Assets | |
Investment Companies | | | 95.0% | |
| | | | |
Total Exposure | | | 95.0% | |
| | | | |
“Market Exposure” includes the value of total investments (including the contract value of any derivatives) and excludes any short-term investments and cash equivalents divided by Net Assets.
| 1 | Commencement of operations. |
| | |
| |
| DIREXION ANNUAL REPORT | | 15 |
Direxion Monthly Commodity Bull 2X Fund
Performance Summary
Investment Objective: Seeks monthly investment results, before fees and expenses, of 200% of the price performance of the Morgan Stanley Commodity Related Equity Index.
| | | | | | | | | | | | | | | | |
| | | Average Annual Total Return2 | |
| | | 1 Year | | | 3 Years | | | 5 Years | | | Since
Inception | |
Direxion Monthly Commodity Bull 2X Fund | | | (27.66 | )% | | | 7.91 | % | | | (10.67 | )% | | | 0.12 | % |
| | | | |
Morgan Stanley Commodity Related Index | | | (11.24 | )% | | | 2.50 | % | | | 1.62 | % | | | 8.76 | % |
The Fund seeks calendar month leveraged investment results. An investor who purchases shares on a day other than the last business day of the calendar month will generally receive more, or less, than 200% (or -200%) exposure to its index. Other factors such as fees and expenses, high portfolio turnover, transaction costs, significant purchases and redemption activity by Fund shareholders and/or a temporary lack of liquidity in the markets for the securities held by the Fund may also cause the Fund’s investment results to vary from its stated objective.
This chart illustrates the performance of a hypothetical $10,000 investment made on the Fund’s inception, and is not intended to imply any future performance. The returns shown do not reflect the deduction of taxes that a shareholder would pay on fund distributions of the redemption of fund shares. The performance of the Morgan Stanley Commodity Related Index does not reflect the deduction of fees associated with a mutual fund, such as investment management fees. Investors cannot invest directly in an index, although they can invest in its underlying securities. During the period shown, Rafferty Asset Management, LLC waived and/or reimbursed fees for various expenses. Had these waivers and/or reimbursements not been in effect, performance would have been lower.
The performance data shown represents past performance and does not guarantee future results.
Market Exposure2
| | | | |
Investment Type | | %
Net Assets | |
Swap Contracts | | | 200.1% | |
| | | | |
Total Exposure | | | 200.1% | |
| | | | |
“Market Exposure” includes the value of total investments (including the contract value of any derivatives) and excludes any short-term investments and cash equivalents divided by Net Assets.
| 1 | Commencement of operations. |
| | |
| | |
| 16 | | DIREXION ANNUAL REPORT |
Direxion Monthly Emerging Markets Bull 2X Fund
Performance Summary
Investment Objective: Seeks monthly investment results, before fees and expenses, of 200% of the price performance of the MSCI Emerging Markets Index.
| | | | | | | | | | | | | | | | |
| | | Average Annual Total Return2 | |
| | | 1 Year | | | 3 Year | | | 5 Year | | | Since
Inception | |
Direxion Monthly Emerging Markets Bull 2X Fund | | | (24.29 | )% | | | (0.30 | )% | | | (21.05 | )% | | | (5.89 | )% |
| | | | |
MSCI Emerging Markets Index | | | (8.31 | )% | | | 4.11 | % | | | (2.71 | )% | | | 6.24 | % |
The Fund seeks calendar month leveraged investment results. An investor who purchases shares on a day other than the last business day of the calendar month will generally receive more, or less, than 200% (or -200%) exposure to its index. Other factors such as fees and expenses, high portfolio turnover, transaction costs, significant purchases and redemption activity by Fund shareholders and/or a temporary lack of liquidity in the markets for the securities held by the Fund may also cause the Fund’s investment results to vary from its stated objective.
This chart illustrates the performance of a hypothetical $10,000 investment made on the Fund’s inception, and is not intended to imply any future performance. The returns shown do not reflect the deduction of taxes that a shareholder would pay on fund distributions of the redemption of fund shares. The performance of the MSCI Emerging Markets Index does not reflect the deduction of fees associated with a mutual fund, such as investment management fees. Investors cannot invest directly in an index, although they can invest in its underlying securities. During the period shown, Rafferty Asset Management, LLC waived and/or reimbursed fees for various expenses. Had these waivers and/or reimbursements not been in effect, performance would have been lower.
The performance data shown represents past performance and does not guarantee future results.
Market Exposure2
| | | | |
Investment Type | | %
Net Assets | |
Swap Contracts | | | 199.9% | |
| | | | |
Total Exposure | | | 199.9% | |
| | | | |
“Market Exposure” includes the value of total investments (including the contract value of any derivatives) and excludes any short-term investments and cash equivalents divided by Net Assets.
| 1 | Commencement of operations. |
| | |
| |
| DIREXION ANNUAL REPORT | | 17 |
Direxion Monthly China Bull 2X Fund
Performance Summary
Investment Objective: Seeks monthly investment results, before fees and expenses, of 200% of the price performance of the FTSE/Xinhua China 25 Index.
| | | | | | | | | | | | |
| | | Average Annual Total Return2 | |
| | | 1 Year | | | 3 Year | | | Since
Inception | |
Direxion Monthly China Bull 2X Fund | | | (33.60 | )% | | | (14.59 | )% | | | (36.81 | )% |
| | | |
FTSE/Xinhua China 25 Index | | | (14.54 | )% | | | (5.66 | )% | | | (12.03 | )% |
The Fund seeks calendar month leveraged investment results. An investor who purchases shares on a day other than the last business day of the calendar month will generally receive more, or less, than 200% (or -200%) exposure to its index. Other factors such as fees and expenses, high portfolio turnover, transaction costs, significant purchases and redemption activity by Fund shareholders and/or a temporary lack of liquidity in the markets for the securities held by the Fund may also cause the Fund’s investment results to vary from its stated objective.
This chart illustrates the performance of a hypothetical $10,000 investment made on the Fund’s inception, and is not intended to imply any future performance. The returns shown do not reflect the deduction of taxes that a shareholder would pay on fund distributions of the redemption of fund shares. The performance of the FTSE/Xinhua China 25 Index does not reflect the deduction of fees associated with a mutual fund, such as investment management fees. Investors cannot invest directly in an index, although they can invest in its underlying securities. During the period shown, Rafferty Asset Management, LLC waived and/or reimbursed fees for various expenses. Had these waivers and/or reimbursements not been in effect, performance would have been lower.
The performance data shown represents past performance and does not guarantee future results.
Market Exposure2
| | | | |
Investment Type | | %
Net Assets | |
Swap Contracts | | | 200.0% | |
| | | | |
Total Exposure | | | 200.0% | |
| | | | |
“Market Exposure” includes the value of total investments (including the contract value of any derivatives) and excludes any short-term investments and cash equivalents divided by Net Assets.
| 1 | Commencement of operations. |
| | |
| | |
| 18 | | DIREXION ANNUAL REPORT |
Direxion Monthly NASDAQ-100® Bull 2X Fund
Performance Summary
Investment Objective: Seeks monthly investment results, before fees and expenses, of 200% of the price performance of the NASDAQ-100® Index.
| | | | | | | | | | | | | | | | | | | | |
| | | Average Annual Total Return2 | |
| | | 4 Month3 | | | 1 Year4 | | | 3 Year5 | | | 5 Year6 | | | Since
Inception | |
Direxion Monthly NASDAQ-100® Bull 2X Fund | | | 2.81 | % | | | 47.81 | % | | | 38.62 | % | | | (2.25 | )% | | | 1.34 | % |
| | | | | |
NASDAQ-100® Index | | | 1.78 | % | | | 23.70 | % | | | 19.48 | % | | | 6.87 | % | | | 8.16 | % |
The Fund seeks calendar month leveraged investment results which should not be equated with seeking a leveraged goal for shorter than a calendar month. An investor who purchases shares on a day other than the last business day of a calendar month will generally receive more, or less, than 200% exposure to the target index, depending on the performance of the target index.
This chart illustrates the performance of a hypothetical $10,000 investment made on the Fund’s inception, and is not intended to imply any future performance. The returns shown do not reflect the deduction of taxes that a shareholder would pay on fund distributions of the redemption of fund shares. The performance of the NASDAQ-100® Index does not reflect the deduction of fees associated with a mutual fund, such as investment management fees. Investors cannot invest directly in an index, although they can invest in its underlying securities.
The performance data shown represents past performance and does not guarantee future results.
Market Exposure2
| | | | |
Investment Type | | %
Net Assets | |
Swap Contracts | | | 199.9% | |
| | | | |
Total Exposure | | | 199.9% | |
| | | | |
“Market Exposure” includes the value of total investments (including the contract value of any derivatives) and excludes any short-term investments and cash equivalents divided by Net Assets.
| 1 | Commencement of operations. |
| 3 | Represents the period of May 1, 2012 to August 31, 2012 and is not annualized. |
| 4 | Represents the period of August 31, 2011 to August 31, 2012. |
| 5 | Represents the period of August 31, 2009 to August 31, 2012. |
| 6 | Represents the period of August 31, 2007 to August 31, 2012. |
| | |
| |
| DIREXION ANNUAL REPORT | | 19 |
Direxion Monthly S&P 500® Bull 2X Fund
Performance Summary
Investment Objective: Seeks monthly investment results, before fees and expenses, of 200% of the price performance of the S&P 500® Index.
| | | | | | | | | | | | | | | | | | | | |
| | | Average Annual Total Return2 | |
| | | 4 Month3 | | | 1 Year4 | | | 3 Year5 | | | 5 Year6 | | | Since
Inception | |
Direxion Monthly S&P 500® Bull 2X Fund | | | 1.39 | % | | | 31.73 | % | | | 22.99 | % | | | (14.28 | )% | | | (8.77 | )% |
| | | | | |
S&P 500® Index | | | 1.45 | % | | | 18.00 | % | | | 13.62 | % | | | 1.28 | % | | | 3.38 | % |
The Fund seeks calendar month leveraged investment results which should not be equated with seeking a leveraged goal for shorter than a calendar month. An investor who purchases shares on a day other than the last business day of a calendar month will generally receive more, or less, than 200% exposure to the target index, depending on the performance of the target index.
This chart illustrates the performance of a hypothetical $10,000 investment made on the Fund’s inception, and is not intended to imply any future performance. The returns shown do not reflect the deduction of taxes that a shareholder would pay on fund distributions of the redemption of fund shares. The performance of the S&P 500® Index does not reflect the deduction of fees associated with a mutual fund, such as investment management fees. Investors cannot invest directly in an index, although they can invest in its underlying securities.
The performance data shown represents past performance and does not guarantee future results.
Market Exposure2
| | | | |
Investment Type | | %
Net Assets | |
Swap Contracts | | | 199.8% | |
| | | | |
Total Exposure | | | 199.8% | |
| | | | |
“Market Exposure” includes the value of total investments (including the contract value of any derivatives) and excludes any short-term investments and cash equivalents divided by Net Assets.
| 1 | Commencement of operations. |
| 3 | Represents the period of May 1, 2012 to August 31, 2012 and is not annualized. |
| 4 | Represents the period of August 31, 2011 to August 31, 2012. |
| 5 | Represents the period of August 31, 2009 to August 31, 2012. |
| 6 | Represents the period of August 31, 2007 to August 31, 2012. |
| | |
| | |
| 20 | | DIREXION ANNUAL REPORT |
Direxion Monthly S&P 500® Bear 2X Fund
Performance Summary
Investment Objective: Seeks monthly investment results, before fees and expenses, of 200% of the inverse of the price performance of the S&P 500® Index.
| | | | | | | | | | | | | | | | | | | | |
| | | Average Annual Total Return2 | |
| | | 4 Month3 | | | 1 Year4 | | | 3 Year5 | | | 5 Year6 | | | Since
Inception | |
Direxion Monthly S&P 500® Bear 2X Fund | | | (5.14 | )% | | | (35.33 | )% | | | (30.23 | )% | | | (22.59 | )% | | | (21.60 | )% |
| | | | | |
S&P 500® Index | | | 1.45 | % | | | 18.00 | % | | | 13.62 | % | | | 1.28 | % | | | 3.38 | % |
The Fund seeks calendar month leveraged investment results which should not be equated with seeking a leveraged goal for shorter than a calendar month. An investor who purchases shares on a day other than the last business day of a calendar month will generally receive more, or less, than 200% exposure to the target index, depending on the performance of the target index.
This chart illustrates the performance of a hypothetical $10,000 investment made on the Fund’s inception, and is not intended to imply any future performance. The returns shown do not reflect the deduction of taxes that a shareholder would pay on fund distributions of the redemption of fund shares. The performance of the S&P 500® Index does not reflect the deduction of fees associated with a mutual fund, such as investment management fees. Investors cannot invest directly in an index, although they can invest in its underlying securities.
The performance data shown represents past performance and does not guarantee future results.
Market Exposure2
| | | | |
Investment Type | | %
Net Assets | |
Swap Contracts | | | (200.4 | )% |
| | | | |
Total Exposure | | | (200.4 | )% |
| | | | |
“Market Exposure” includes the value of total investments (including the contract value of any derivatives) and excludes any short-term investments and cash equivalents divided by Net Assets.
| 1 | Commencement of operations. |
| 3 | Represents the period of May 1, 2012 to August 31, 2012 and is not annualized. |
| 4 | Represents the period of August 31, 2011 to August 31, 2012. |
| 5 | Represents the period of August 31, 2009 to August 31, 2012. |
| 6 | Represents the period of August 31, 2007 to August 31, 2012. |
| | |
| |
| DIREXION ANNUAL REPORT | | 21 |
Direxion Monthly Latin America Bull 2X Fund
Performance Summary
Investment Objective: Seeks monthly investment results, before fees and expenses, of 200% of the price performance of the S&P® Latin America 40 Index.
| | | | | | | | | | | | | | | | | | | | |
| | | Average Annual Total Return2 | |
| | | 4 Month3 | | | 1 Year4 | | | 3 Year5 | | | 5 Year6 | | | Since
Inception | |
Direxion Monthly Latin America Bull 2X Fund | | | (17.99 | )% | | | (28.44 | )% | | | (0.31 | )% | | | (18.47 | )% | | | (8.97 | )% |
| | | | | |
S&P® Latin America 40 Index | | | (9.03 | )% | | | (10.61 | )% | | | 3.87 | % | | | (0.15 | )% | | | 4.84 | % |
The Fund seeks calendar month leveraged investment results which should not be equated with seeking a leveraged goal for shorter than a calendar month. An investor who purchases shares on a day other than the last business day of a calendar month will generally receive more, or less, than 200% exposure to the target index, depending on the performance of the target index.
This chart illustrates the performance of a hypothetical $10,000 investment made on the Fund’s inception, and is not intended to imply any future performance. The returns shown do not reflect the deduction of taxes that a shareholder would pay on fund distributions of the redemption of fund shares. The performance of the S&P® Latin America 40 Index does not reflect the deduction of fees associated with a mutual fund, such as investment management fees. Investors cannot invest directly in an index, although they can invest in its underlying securities.
The performance data shown represents past performance and does not guarantee future results.
Market Exposure2
| | | | |
Investment Type | | %
Net Assets | |
Swap Contracts | | | 201.0% | |
| | | | |
Total Exposure | | | 201.0% | |
| | | | |
“Market Exposure” includes the value of total investments (including the contract value of any derivatives) and excludes any short-term investments and cash equivalents divided by Net Assets.
| 1 | Commencement of operations. |
| 3 | Represents the period of May 1, 2012 to August 31, 2012 and is not annualized. |
| 4 | Represents the period of August 31, 2011 to August 31, 2012. |
| 5 | Represents the period of August 31, 2009 to August 31, 2012. |
| 6 | Represents the period of August 31, 2007 to August 31, 2012. |
| | |
| | |
| 22 | | DIREXION ANNUAL REPORT |
Expense Example
August 31, 2012 (Unaudited)
As a shareholder of a mutual fund, you incur two types of costs: (1) transaction costs, including sales charges (loads) on purchase payments, reinvested dividends, or other distributions; redemption fees and exchange fees; and (2) ongoing costs, including management fees; distribution and/or service fees; and other fund expenses. This example is intended to help you understand your ongoing costs (in dollars) of investing in a fund and to compare costs with the ongoing costs of investing in other mutual funds.
The example is based on an investment of $1,000 invested at the beginning of the period and held the entire period (March 1, 2012 — August 31, 2012).
Actual Expenses
The first line of the table below provides information about actual account values and actual expenses. You may use the information in this line, together with the amount you invested, to estimate the expenses that you paid over the period. Simply divide your account value by $1,000 (for example, an $8,600 account value divided by $1,000 = 8.6), then multiply the result by the number in the first line under the heading entitled “Expenses Paid During Period” to estimate the expenses you paid on your account during this period.
Hypothetical Example for Comparison Purposes
The second line of the table below provides information about hypothetical account values and hypothetical expenses based on the Funds’ actual expense ratios and an assumed rate of return of 5% per year before expenses, which is not the Funds’ actual return. The hypothetical account values and expenses may not be used to estimate the actual ending account balance or expenses you paid for the period. You may use this information to compare the ongoing costs of investing in the Funds and other funds. To do so, compare this 5% hypothetical example with the 5% hypothetical examples that appear in the shareholder reports of the other funds.
Please note that the expenses shown in the table are meant to highlight your ongoing costs only and do not reflect any transactional costs, such as wire transfers, returned checks or stop payment orders. Therefore, the second line of the table is useful in comparing ongoing costs only, and will not help you determine the relative costs of owning different funds. In addition, if these transactional costs were included, your costs would have been higher.
| | |
| |
| DIREXION ANNUAL REPORT | | 23 |
Expense Example Table
August 31, 2012 (Unaudited)
| | | | | | | | | | | | | | | | |
| | | Expense
Ratio1 | | | Beginning
Account Value
March 1, 2012 | | | Ending
Account Value
August 31, 2012 | | | Expenses
Paid During
Period2 | |
Direxion Monthly Small Cap Bull 2X Fund | | | | | | | | | | | | | | | | |
Based on actual fund return | | | 1.90 | % | | $ | 1,000.00 | | | $ | 1,000.70 | | | $ | 9.56 | |
Based on hypothetical 5% return | | | 1.90 | % | | | 1,000.00 | | | | 1,015.59 | | | | 9.63 | |
Direxion Monthly Small Cap Bear 2X Fund | | | | | | | | | | | | | | | | |
Based on actual fund return | | | 1.90 | % | | | 1,000.00 | | | | 939.70 | | | | 9.26 | |
Based on hypothetical 5% return | | | 1.90 | % | | | 1,000.00 | | | | 1,015.59 | | | | 9.63 | |
Direxion Monthly 10 Year Note Bull 2X Fund | | | | | | | | | | | | | | | | |
Based on actual fund return | | | 1.90 | % | | | 1,000.00 | | | | 1,090.00 | | | | 9.98 | |
Based on hypothetical 5% return | | | 1.90 | % | | | 1,000.00 | | | | 1,015.59 | | | | 9.63 | |
Direxion Monthly 10 Year Note Bear 2X Fund | | | | | | | | | | | | | | | | |
Based on actual fund return | | | 1.90 | % | | | 1,000.00 | | | | 877.00 | | | | 8.96 | |
Based on hypothetical 5% return | | | 1.90 | % | | | 1,000.00 | | | | 1,015.59 | | | | 9.63 | |
Dynamic HY Bond Fund | | | | | | | | | | | | | | | | |
Based on actual fund return | | | 1.60 | % | | | 1,000.00 | | | | 1,026.70 | | | | 8.15 | |
Based on hypothetical 5% return | | | 1.60 | % | | | 1,000.00 | | | | 1,017.09 | | | | 8.11 | |
Direxion Monthly Commodity Bull 2X Fund | | | | | | | | | | | | | | | | |
Based on actual fund return | | | 1.90 | % | | | 1,000.00 | | | | 745.30 | | | | 8.34 | |
Based on hypothetical 5% return | | | 1.90 | % | | | 1,000.00 | | | | 1,015.59 | | | | 9.63 | |
Direxion Monthly Emerging Markets Bull 2X Fund | | | | | | | | | | | | | | | | |
Based on actual fund return | | | 1.90 | % | | | 1,000.00 | | | | 771.50 | | | | 8.46 | |
Based on hypothetical 5% return | | | 1.90 | % | | | 1,000.00 | | | | 1,015.59 | | | | 9.63 | |
Direxion Monthly China Bull 2X Fund | | | | | | | | | | | | | | | | |
Based on actual fund return | | | 1.90 | % | | | 1,000.00 | | | | 680.10 | | | | 8.02 | |
Based on hypothetical 5% return | | | 1.90 | % | | | 1,000.00 | | | | 1,015.59 | | | | 9.63 | |
U.S. Government Money Market Fund | | | | | | | | | | | | | | | | |
Based on actual fund return | | | 0.00 | % | | | 1,000.00 | | | | 1,000.50 | | | | — | |
Based on hypothetical 5% return | | | 0.00 | % | | | 1,000.00 | | | | 1,025.14 | | | | — | |
Direxion Monthly NASDAQ-100® Bull 2X Fund | | | | | | | | | | | | | | | | |
Based on actual fund return | | | 1.90 | % | | | 1,000.00 | | | | 1,102.90 | | | | 10.04 | |
Based on hypothetical 5% return | | | 1.90 | % | | | 1,000.00 | | | | 1,015.59 | | | | 9.63 | |
Direxion Monthly S&P 500® Bull 2X Fund | | | | | | | | | | | | | | | | |
Based on actual fund return | | | 1.90 | % | | | 1,000.00 | | | | 1,061.80 | | | | 9.85 | |
Based on hypothetical 5% return | | | 1.90 | % | | | 1,000.00 | | | | 1,015.59 | | | | 9.63 | |
Direxion Monthly S&P 500® Bear 2X Fund | | | | | | | | | | | | | | | | |
Based on actual fund return | | | 1.90 | % | | | 1,000.00 | | | | 894.60 | | | | 9.05 | |
Based on hypothetical 5% return | | | 1.90 | % | | | 1,000.00 | | | | 1,015.59 | | | | 9.63 | |
Direxion Monthly Latin America Bull 2X Fund | | | | | | | | | | | | | | | | |
Based on actual fund return | | | 1.90 | % | | | 1,000.00 | | | | 719.00 | | | | 8.21 | |
Based on hypothetical 5% return | | | 1.90 | % | | | 1,000.00 | | | | 1,015.59 | | | | 9.63 | |
| 2 | Expenses are equal to the Fund’s annualized expense ratio, multiplied by the average account value over the period, multiplied by the number of days in the period of March 1, 2012 to August 31, 2012, then divided by 366. |
| | |
| | |
| 24 | | DIREXION ANNUAL REPORT |
Allocation of Portfolio Holdings
August 31, 2012 (Unaudited)
| | | | | | | | | | | | | | | | |
| | | Cash* | | | Investment
Companies | | | Swaps | | | Total | |
Direxion Monthly Small Cap Bull 2X Fund | | | 99 | % | | | — | | | | 1 | % | | | 100 | % |
Direxion Monthly Small Cap Bear 2X Fund | | | 105 | % | | | — | | | | (5 | %) | | | 100 | % |
Direxion Monthly 10 Year Note Bull 2X Fund | | | 99 | % | | | — | | | | 1 | % | | | 100 | % |
Direxion Monthly 10 Year Note Bear 2X Fund | | | 102 | % | | | — | | | | (2 | %) | | | 100 | % |
Dynamic HY Bond Fund | | | 5 | % | | | 95 | % | | | — | | | | 100 | % |
Direxion Monthly Commodity Bull 2X Fund | | | 103 | % | | | — | | | | (3 | %) | | | 100 | % |
Direxion Monthly Emerging Markets Bull 2X Fund | | | 104 | % | | | — | | | | (4 | %) | | | 100 | % |
Direxion Monthly China Bull 2X Fund | | | 108 | % | | | — | | | | (8 | %) | | | 100 | % |
U.S. Government Money Market Fund | | | 100 | % | | | — | | | | — | | | | 100 | % |
Direxion Monthly NASDAQ-100® Bull 2X Fund | | | 100 | % | | | — | | | | 0 | %** | | | 100 | % |
Direxion Monthly S&P 500® Bull 2X Fund | | | 99 | % | | | — | | | | 1 | % | | | 100 | % |
Direxion Monthly S&P 500® Bear 2X Fund | | | 103 | % | | | — | | | | (3 | %) | | | 100 | % |
Direxion Monthly Latin America Bull 2X Fund | | | 126 | % | | | — | | | | (26 | %) | | | 100 | % |
| * | Cash, cash equivalents and other assets less liabilities. |
| ** | Percentage is less than 0.5%. |
| | |
| |
| DIREXION ANNUAL REPORT | | 25 |
Direxion Monthly Small Cap Bull 2X Fund
Schedule of Investments
August 31, 2012
No reportable investments.
| | | | | | |
| | | | | Value | |
| | TOTAL INVESTMENTS
(Cost $0) - 0.0% | | $ | — | |
| | Other Assets in Excess of
Liabilities - 100.0%(a) | | | 7,080,012 | |
| | | | | | |
| | TOTAL NET ASSETS - 100.0% | | $ | 7,080,012 | |
| | | | | | |
Percentages are stated as a percent of net assets.
| (a) | $1,620,000 of cash is pledged as collateral for swap contracts. |
Long Equity Swap Contracts
August 31, 2012
| | | | | | | | | | | | | | | | | | | | | | |
Counterparty | | Reference Index | | Number of
Contracts | | | Notional
Amount | | | Interest Rate
Received | | | Termination
Date | | | Unrealized
Appreciation | |
Credit Suisse Capital, LLC | | Russell 2000 Index | | | 17,435 | | | $ | 14,079,881 | | | | 0.16 | % | | | 7/9/2013 | | | $ | 106,005 | |
| | | | | | | | | | | | | | | | | | | | | | |
The accompanying notes are an integral part of these financial statements.
| | |
| | |
| 26 | | DIREXION ANNUAL REPORT |
Direxion Monthly Small Cap Bear 2X Fund
Schedule of Investments
August 31, 2012
No reportable investments.
| | | | | | |
| | | | | Value | |
| | TOTAL INVESTMENTS
(Cost $0) - 0.0% | | $ | — | |
| | Other Assets in Excess of
Liabilities - 100.0%(a) | | | 23,039,632 | |
| | | | | | |
| | TOTAL NET ASSETS - 100.0% | | $ | 23,039,632 | |
| | | | | | |
Percentages are stated as a percent of net assets.
| (a) | $6,090,000 of cash is pledged as collateral for swap contracts. |
Short Equity Swap Contracts
August 31, 2012
| | | | | | | | | | | | | | | | | | | | | | |
Counterparty | | Reference Index | | Number of
Contracts | | | Notional
Amount | | | Interest Rate
Paid | | | Termination
Date | | | Unrealized
Depreciation | |
Credit Suisse Capital, LLC | | Russell 2000 Index | | | 56,751 | | | $ | 45,148,176 | | | | (0.76 | %) | | | 6/21/2013 | | | $ | (1,065,026 | ) |
| | | | | | | | | | | | | | | | | | | | | | |
The accompanying notes are an integral part of these financial statements.
| | |
| |
| DIREXION ANNUAL REPORT | | 27 |
Direxion Monthly 10 Year Note Bull 2X Fund
Schedule of Investments
August 31, 2012
No reportable investments.
| | | | | | |
| | | | | Value | |
| | TOTAL INVESTMENTS
(Cost $0) - 0.0% | | $ | — | |
| | Other Assets in Excess of
Liabilities - 100.0%(a) | | | 38,219,951 | |
| | | | | | |
| | TOTAL NET ASSETS - 100.0% | | $ | 38,219,951 | |
| | | | | | |
Percentages are stated as a percent of net assets.
| (a) | $11,080,000 of cash is pledged as collateral for swap contracts. |
Long Equity Swap Contracts
August 31, 2012
| | | | | | | | | | | | | | | | | | | | | | |
Counterparty | | Reference Entity | | Number of
Contracts | | | Notional
Amount | | | Interest Rate
Received | | | Termination
Date | | | Unrealized
Appreciation | |
Credit Suisse Capital, LLC | | iShares Barclays 7-10 Year Treasury Bond Fund | | | 699,847 | | | $ | 75,875,301 | | | | 0.01 | % | | | 9/3/2013 | | | $ | 442,436 | |
| | | | | | | | | | | | | | | | | | | | | | |
The accompanying notes are an integral part of these financial statements.
| | |
| | |
| 28 | | DIREXION ANNUAL REPORT |
Direxion Monthly 10 Year Note Bear 2X Fund
Schedule of Investments
August 31, 2012
No reportable investments.
| | | | | | |
| | | | | Value | |
| | TOTAL INVESTMENTS
(Cost $0) - 0.0% | | $ | — | |
| | Other Assets in Excess of
Liabilities - 100.0%(a) | | | 10,286,374 | |
| | | | | | |
| | TOTAL NET ASSETS - 100.0% | | $ | 10,286,374 | |
| | | | | | |
Percentages are stated as a percent of net assets.
| (a) | $4,385,000 of cash is pledged as collateral for swap contracts. |
Short Equity Swap Contracts
August 31, 2012
| | | | | | | | | | | | | | | | | | | | | | |
Counterparty | | Reference Entity | | Number of
Contracts | | | Notional
Amount | | | Interest Rate
Paid | | | Termination
Date | | | Unrealized
Depreciation | |
Credit Suisse Capital, LLC | | iShares Barclays 7-10 Year Treasury Bond Fund | | | 188,975 | | | $ | 20,443,200 | | | | (0.51 | %) | | | 9/3/2013 | | | $ | (155,221 | ) |
| | | | | | | | | | | | | | | | | | | | | | |
The accompanying notes are an integral part of these financial statements.
| | |
| |
| DIREXION ANNUAL REPORT | | 29 |
Dynamic HY Bond Fund
Schedule of Investments
August 31, 2012
| | | | | | | | |
Shares | | | | | Value | |
| INVESTMENT COMPANIES - 95.0% | |
| | 391,667 | | | iShares iBoxx $ High Yield Corporate Bond Fund | | $ | 36,162,614 | |
| | 70,500 | | | iShares iBoxx $ Investment Grade Corporate Bond Fund | | | 8,518,515 | |
| | 899,528 | | | SPDR Barclays Capital High Yield
Bond ETF | | | 36,107,054 | |
| | | | | | | | |
| | | | TOTAL INVESTMENT COMPANIES
(Cost $78,020,687) | | $ | 80,788,183 | |
| | | | | | | | |
| | | | TOTAL INVESTMENTS
(Cost $78,020,687) - 95.0% | | $ | 80,788,183 | |
| | | | Other Assets in Excess of
Liabilities - 5.0% | | | 4,288,331 | |
| | | | | | | | |
| | | | TOTAL NET ASSETS - 100.0% | | $ | 85,076,514 | |
| | | | | | | | |
Percentages are stated as a percent of net assets.
The accompanying notes are an integral part of these financial statements.
| | |
| | |
| 30 | | DIREXION ANNUAL REPORT |
Direxion Monthly Commodity Bull 2X Fund
Schedule of Investments
August 31, 2012
No reportable investments.
| | | | | | |
| | | | | Value | |
| | TOTAL INVESTMENTS
(Cost $0) - 0.0% | | $ | — | |
| | Other Assets in Excess of
Liabilities - 100.0%(a) | | | 14,701,844 | |
| | | | | | |
| | TOTAL NET ASSETS - 100.0% | | $ | 14,701,844 | |
| | | | | | |
Percentages are stated as a percent of net assets.
| (a) | $6,540,000 of cash is held as collateral for swap contracts. |
Long Equity Swap Contracts
August 31, 2012
| | | | | | | | | | | | | | | | | | | | | | |
Counterparty | | Reference Index | | Number of
Contracts | | | Notional
Amount | | | Interest Rate
Paid | | | Termination
Date | | | Unrealized
Appreciation/
(Depreciation) | |
Bank of America Merrill Lynch | | Morgan Stanley Commodity Related Equity Index | | | 2,380 | | | $ | 2,179,635 | | | | (0.72 | %) | | | 4/5/2013 | | | $ | (230,781 | ) |
Bank of America Merrill Lynch | | Morgan Stanley Commodity Related Equity Index | | | 180 | | | | 161,851 | | | | (0.72 | %) | | | 4/8/2013 | | | | (15,482 | ) |
Bank of America Merrill Lynch | | Morgan Stanley Commodity Related Equity Index | | | 3,815 | | | | 3,451,587 | | | | (0.72 | %) | | | 4/12/2013 | | | | (349,422 | ) |
Bank of America Merrill Lynch | | Morgan Stanley Commodity Related Equity Index | | | 30 | | | | 27,285 | | | | (0.72 | %) | | | 4/22/2013 | | | | (2,899 | ) |
Bank of America Merrill Lynch | | Morgan Stanley Commodity Related Equity Index | | | 320 | | | | 284,406 | | | | (0.70 | %) | | | 4/22/2013 | | | | (24,257 | ) |
Bank of America Merrill Lynch | | Morgan Stanley Commodity Related Equity Index | | | 25 | | | | 22,555 | | | | (0.70 | %) | | | 4/26/2013 | | | | (2,231 | ) |
Bank of America Merrill Lynch | | Morgan Stanley Commodity Related Equity Index | | | 190 | | | | 168,265 | | | | (0.70 | %) | | | 5/3/2013 | | | | (13,755 | ) |
Bank of America Merrill Lynch | | Morgan Stanley Commodity Related Equity Index | | | 290 | | | | 249,963 | | | | (0.70 | %) | | | 5/6/2013 | | | | (14,103 | ) |
Bank of America Merrill Lynch | | Morgan Stanley Commodity Related Equity Index | | | 280 | | | | 238,207 | | | | (0.70 | %) | | | 5/9/2013 | | | | (10,469 | ) |
Bank of America Merrill Lynch | | Morgan Stanley Commodity Related Equity Index | | | 150 | | | | 125,892 | | | | (0.70 | %) | | | 5/13/2013 | | | | (3,957 | ) |
Bank of America Merrill Lynch | | Morgan Stanley Commodity Related Equity Index | | | 490 | | | | 414,706 | | | | (0.68 | %) | | | 5/20/2013 | | | | (16,368 | ) |
Bank of America Merrill Lynch | | Morgan Stanley Commodity Related Equity Index | | | 110 | | | | 91,715 | | | | (0.68 | %) | | | 5/23/2013 | | | | (2,275 | ) |
Bank of America Merrill Lynch | | Morgan Stanley Commodity Related Equity Index | | | 5,860 | | | | 4,928,544 | | | | (0.68 | %) | | | 5/24/2013 | | | | (164,375 | ) |
Bank of America Merrill Lynch | | Morgan Stanley Commodity Related Equity Index | | | 40 | | | | 34,049 | | | | (0.68 | %) | | | 5/28/2013 | | | | (1,544 | ) |
Bank of America Merrill Lynch | | Morgan Stanley Commodity Related Equity Index | | | 1,095 | | | | 925,392 | | | | (0.68 | %) | | | 6/3/2013 | | | | (35,499 | ) |
Bank of America Merrill Lynch | | Morgan Stanley Commodity Related Equity Index | | | 150 | | | | 122,641 | | | | (0.68 | %) | | | 6/4/2013 | | | | (737 | ) |
Bank of America Merrill Lynch | | Morgan Stanley Commodity Related Equity Index | | | 390 | | | | 318,356 | | | | (0.68 | %) | | | 6/7/2013 | | | | (1,429 | ) |
Bank of America Merrill Lynch | | Morgan Stanley Commodity Related Equity Index | | | 70 | | | | 57,410 | | | | (0.68 | %) | | | 6/10/2013 | | | | (551 | ) |
Bank of America Merrill Lynch | | Morgan Stanley Commodity Related Equity Index | | | 80 | | | | 62,257 | | | | (0.72 | %) | | | 6/24/2013 | | | | 2,673 | |
Bank of America Merrill Lynch | | Morgan Stanley Commodity Related Equity Index | | | 435 | | | | 336,335 | | | | (0.72 | %) | | | 7/1/2013 | | | | 16,562 | |
The accompanying notes are an integral part of these financial statements.
| | |
| |
| DIREXION ANNUAL REPORT | | 31 |
Direxion Monthly Commodity Bull 2X Fund
Long Equity Swap Contracts (Continued)
August 31, 2012
| | | | | | | | | | | | | | | | | | | | | | |
Counterparty | | Reference Index | | Number of
Contracts | | | Notional
Amount | | | Interest Rate
Paid | | | Termination
Date | | | Unrealized
Appreciation/
(Depreciation) | |
Bank of America Merrill Lynch | | Morgan Stanley Commodity Related Equity Index | | | 135 | | | $ | 102,100 | | | | (0.72 | %) | | | 7/5/2013 | | | $ | 7,441 | |
Bank of America Merrill Lynch | | Morgan Stanley Commodity Related Equity Index | | | 335 | | | | 258,975 | | | | (0.72 | %) | | | 7/8/2013 | | | | 12,840 | |
Bank of America Merrill Lynch | | Morgan Stanley Commodity Related Equity Index | | | 365 | | | | 284,444 | | | | (0.72 | %) | | | 7/15/2013 | | | | 11,571 | |
Bank of America Merrill Lynch | | Morgan Stanley Commodity Related Equity Index | | | 3,950 | | | | 3,123,337 | | | | (0.72 | %) | | | 7/19/2013 | | | | 80,047 | |
Bank of America Merrill Lynch | | Morgan Stanley Commodity Related Equity Index | | | 580 | | | | 436,885 | | | | (0.70 | %) | | | 7/22/2013 | | | | 33,560 | |
Bank of America Merrill Lynch | | Morgan Stanley Commodity Related Equity Index | | | 1,880 | | | | 1,402,272 | | | | (0.70 | %) | | | 7/25/2013 | | | | 122,693 | |
Bank of America Merrill Lynch | | Morgan Stanley Commodity Related Equity Index | | | 110 | | | | 82,089 | | | | (0.70 | %) | | | 7/26/2013 | | | | 7,140 | |
Bank of America Merrill Lynch | | Morgan Stanley Commodity Related Equity Index | | | 855 | | | | 668,778 | | | | (0.70 | %) | | | 7/29/2013 | | | | 24,825 | |
Bank of America Merrill Lynch | | Morgan Stanley Commodity Related Equity Index | | | 80 | | | | 62,641 | | | | (0.70 | %) | | | 8/2/2013 | | | | 2,257 | |
Bank of America Merrill Lynch | | Morgan Stanley Commodity Related Equity Index | | | 340 | | | | 269,535 | | | | (0.70 | %) | | | 8/5/2013 | | | | 6,300 | |
Bank of America Merrill Lynch | | Morgan Stanley Commodity Related Equity Index | | | 595 | | | | 464,246 | | | | (0.70 | %) | | | 8/6/2013 | | | | 18,483 | |
Bank of America Merrill Lynch | | Morgan Stanley Commodity Related Equity Index | | | 60 | | | | 46,514 | | | | (0.70 | %) | | | 8/9/2013 | | | | 2,163 | |
Bank of America Merrill Lynch | | Morgan Stanley Commodity Related Equity Index | | | 690 | | | | 525,318 | | | | (0.70 | %) | | | 8/12/2013 | | | | 34,211 | |
Bank of America Merrill Lynch | | Morgan Stanley Commodity Related Equity Index | | | 45 | | | | 34,339 | | | | (0.70 | %) | | | 8/16/2013 | | | | 2,154 | |
Bank of America Merrill Lynch | | Morgan Stanley Commodity Related Equity Index | | | 20 | | | | 15,422 | | | | (0.70 | %) | | | 8/19/2013 | | | | 796 | |
Bank of America Merrill Lynch | | Morgan Stanley Commodity Related Equity Index | | | 85 | | | | 64,207 | | | | (0.68 | %) | | | 8/26/2013 | | | | 4,725 | |
Bank of America Merrill Lynch | | Morgan Stanley Commodity Related Equity Index | | | 4,380 | | | | 3,427,768 | | | | (0.68 | %) | | | 8/30/2013 | | | | 122,879 | |
Bank of America Merrill Lynch | | Morgan Stanley Commodity Related Equity Index | | | 140 | | | | 113,186 | | | | (0.68 | %) | | | 9/13/2013 | | | | 232 | |
Bank of America Merrill Lynch | | Morgan Stanley Commodity Related Equity Index | | | 160 | | | | 128,769 | | | | (0.68 | %) | | | 9/16/2013 | | | | 694 | |
Bank of America Merrill Lynch | | Morgan Stanley Commodity Related Equity Index | | | 155 | | | | 126,133 | | | | (0.68 | %) | | | 9/17/2013 | | | | (568 | ) |
Bank of America Merrill Lynch | | Morgan Stanley Commodity Related Equity Index | | | 50 | | | | 40,779 | | | | (0.68 | %) | | | 9/20/2013 | | | | (294 | ) |
Bank of America Merrill Lynch | | Morgan Stanley Commodity Related Equity Index | | | 80 | | | | 65,845 | | | | (0.68 | %) | | | 9/23/2013 | | | | (1,067 | ) |
Bank of America Merrill Lynch | | Morgan Stanley Commodity Related Equity Index | | | 250 | | | | 203,806 | | | | (0.67 | %) | | | 9/24/2013 | | | | (1,356 | ) |
Bank of America Merrill Lynch | | Morgan Stanley Commodity Related Equity Index | | | 4,500 | | | | 3,651,211 | | | | (0.67 | %) | | | 9/30/2013 | | | | (8,699 | ) |
| | | | | | | | | | | | | | | | | | | | | | |
| | | | | 36,220 | | | $ | 29,799,650 | | | | | | | | | | | $ | (387,872 | ) |
| | | | | | | | | | | | | | | | | | | | | | |
The accompanying notes are an integral part of these financial statements.
| | |
| | |
| 32 | | DIREXION ANNUAL REPORT |
Direxion Monthly Emerging Markets Bull 2X Fund
Schedule of Investments
August 31, 2012
No reportable investments.
| | | | | | |
| | | | | Value | |
| | TOTAL INVESTMENTS
(Cost $0) - 0.0% | | $ | — | |
| | Other Assets in Excess of
Liabilities - 100.0%(a) | | | 38,012,444 | |
| | | | | | |
| | TOTAL NET ASSETS - 100.0% | | $ | 38,012,444 | |
| | | | | | |
Percentages are stated as a percent of net assets.
| (a) | $19,020,000 of cash is pledged as collateral for swap contracts. |
Long Equity Swap Contracts
August 31, 2012
| | | | | | | | | | | | | | | | | | | | | | |
Counterparty | | Reference Entity | | Number of
Contracts | | | Notional
Amount | | | Interest Rate
Paid | | | Termination
Date | | | Unrealized
Depreciation | |
Bank of America Merrill Lynch | | iShares MSCI Emerging Markets Index Fund | | | 1,753,778 | | | $ | 70,125,788 | | | | (1.09 | %) | | | 9/18/2013 | | | $ | (1,288,888 | ) |
Bank of America Merrill Lynch | | iShares MSCI Emerging Markets Index Fund | | | 41,680 | | | | 1,693,973 | | | | (1.09 | %) | | | 10/16/2013 | | | | (57,343 | ) |
Bank of America Merrill Lynch | | iShares MSCI Emerging Markets Index Fund | | | 140,368 | | | | 5,570,279 | | | | (1.08 | %) | | | 10/16/2013 | | | | (57,012 | ) |
| | | | | | | | | | | | | | | | | | | | | | |
| | | | | 1,935,826 | | | $ | 77,390,040 | | | | | | | | | | | $ | (1,403,243 | ) |
| | | | | | | | | | | | | | | | | | | | | | |
The accompanying notes are an integral part of these financial statements.
| | |
| |
| DIREXION ANNUAL REPORT | | 33 |
Direxion Monthly China Bull 2X Fund
Schedule of Investments
August 31, 2012
No reportable investments.
| | | | | | |
| | | | | Value | |
| | TOTAL INVESTMENTS
(Cost $0) - 0.0% | | $ | — | |
| | Other Assets in Excess of
Liabilities - 100.0%(a) | | | 5,576,463 | |
| | | | | | |
| | TOTAL NET ASSETS - 100.0% | | $ | 5,576,463 | |
| | | | | | |
Percentages are stated as a percent of net assets.
| (a) | $3,950,000 of cash is pledged as collateral for swap contracts. |
Long Equity Swap Contracts
August 31, 2012
| | | | | | | | | | | | | | | | | | | | | | |
Counterparty | | Reference Entity | | Number of
Contracts | | | Notional
Amount | | | Interest Rate
Received | | | Termination
Date | | | Unrealized
Depreciation | |
Credit Suisse Capital, LLC | | iShares FTSE/Xinhua China 25 Index Fund | | | 337,257 | | | $ | 11,617,457 | | | | 0.26 | % | | | 8/16/2013 | | | $ | (462,066 | ) |
| | | | | | | | | | | | | | | | | | | | | | |
The accompanying notes are an integral part of these financial statements.
| | |
| | |
| 34 | | DIREXION ANNUAL REPORT |
U.S. Government Money Market Fund
Schedule of Investments
August 31, 2012
| | | | | | | | |
Shares | | | | | Value | |
| SHORT TERM INVESTMENTS - 97.7% | |
| MONEY MARKET FUNDS - 97.7% | |
| | 17,829,834 | | | Goldman Sachs Financial Square Federal Fund, 0.04%(a) | | $ | 17,829,834 | |
| | | | | | | | |
| | | | TOTAL SHORT TERM INVESTMENTS
(Cost $17,829,834) | | $ | 17,829,834 | |
| | | | | | | | |
| | | | TOTAL INVESTMENTS
(Cost $17,829,834) - 97.7% | | $ | 17,829,834 | |
| | | | Other Assets in Excess of
Liabilities - 2.3% | | | 420,395 | |
| | | | | | | | |
| | | | TOTAL NET ASSETS - 100.0% | | $ | 18,250,229 | |
| | | | | | | | |
Percentages are stated as a percent of net assets.
| (a) | Represents annualized seven-day yield at August 31, 2012. |
The accompanying notes are an integral part of these financial statements.
| | |
| |
| DIREXION ANNUAL REPORT | | 35 |
Direxion Monthly NASDAQ-100® Bull 2X Fund
Schedule of Investments
August 31, 2012
No reportable investments.
| | | | | | |
| | | | | Value | |
| | TOTAL INVESTMENTS
(Cost $0) - 0.0% | | $ | — | |
| | Other Assets in Excess of
Liabilities - 100.0%(a) | | | 26,411,820 | |
| | | | | | |
| | TOTAL NET ASSETS - 100.0% | | $ | 26,411,820 | |
| | | | | | |
Percentages are stated as a percent of net assets.
| (a) | $5,810,000 of cash is pledged as collateral for swap contracts. |
Long Equity Swap Contracts
August 31, 2012
| | | | | | | | | | | | | | | | | | | | | | |
Counterparty | | Reference Index | | Number of
Contracts | | | Notional
Amount | | | Interest Rate
Paid | | | Termination
Date | | | Unrealized
Appreciation | |
Credit Suisse Capital, LLC | | NASDAQ-100® Index | | | 19,047 | | | $ | 52,699,032 | | | | (0.19 | %) | | | 8/16/2013 | | | $ | 107,415 | |
| | | | | | | | | | | | | | | | | | | | | | |
The accompanying notes are an integral part of these financial statements.
| | |
| | |
| 36 | | DIREXION ANNUAL REPORT |
Direxion Monthly S&P 500® Bull 2X Fund
Schedule of Investments
August 31, 2012
No reportable investments.
| | | | | | |
| | | | | Value | |
| | TOTAL INVESTMENTS
(Cost $0) - 0.0% | | $ | — | |
| | Other Assets in Excess of
Liabilities - 100.0%(a) | | | 15,531,110 | |
| | | | | | |
| | TOTAL NET ASSETS - 100.0% | | $ | 15,531,110 | |
| | | | | | |
Percentages are stated as a percent of net assets.
| (a) | $3,610,000 of cash is pledged as collateral for swap contracts. |
Long Equity Swap Contracts
August 31, 2012
| | | | | | | | | | | | | | | | | | | | | | |
Counterparty | | Reference Index | | Number of
Contracts | | | Notional
Amount | | | Interest Rate
Paid | | | Termination
Date | | | Unrealized
Appreciation | |
Credit Suisse Capital, LLC | | S&P 500® Index | | | 22,017 | | | $ | 30,878,672 | | | | (0.29 | %) | | | 8/9/2013 | | | $ | 146,290 | |
| | | | | | | | | | | | | | | | | | | | | | |
The accompanying notes are an integral part of these financial statements.
| | |
| |
| DIREXION ANNUAL REPORT | | 37 |
Direxion Monthly S&P 500® Bear 2X Fund
Schedule of Investments
August 31, 2012
No reportable investments.
| | | | | | |
| | | | | Value | |
| | TOTAL INVESTMENTS
(Cost $0) - 0.0% | | $ | — | |
| | Other Assets in Excess of
Liabilities - 100.0%(a) | | | 10,980,820 | |
| | | | | | |
| | TOTAL NET ASSETS - 100.0% | | $ | 10,980,820 | |
| | | | | | |
Percentages are stated as a percent of net assets.
| (a) | $2,560,000 of cash is pledged as collateral for swap contracts. |
Short Equity Swap Contracts
August 31, 2012
| | | | | | | | | | | | | | | | | | | | | | |
Counterparty | | Reference Index | | Number of
Contracts | | | Notional
Amount | | | Interest Rate
Received | | | Termination
Date | | | Unrealized
Depreciation | |
Credit Suisse Capital, LLC | | S&P 500® Index | | | 15,614 | | | $ | 21,693,279 | | | | 0.04 | % | | | 7/5/2013 | | | $ | (315,294 | ) |
| | | | | | | | | | | | | | | | | | | | | | |
The accompanying notes are an integral part of these financial statements.
| | |
| | |
| 38 | | DIREXION ANNUAL REPORT |
Direxion Monthly Latin America Bull 2X Fund
Schedule of Investments
August 31, 2012
No reportable investments.
| | | | | | |
| | | | | Value | |
| | TOTAL INVESTMENTS
(Cost $0) - 0.0% | | $ | — | |
| | Other Assets in Excess of
Liabilities - 100.0%(a) | | | 27,129,783 | |
| | | | | | |
| | TOTAL NET ASSETS - 100.0% | | $ | 27,129,783 | |
| | | | | | |
Percentages are stated as a percent of net assets.
| (a) | $15,310,000 of cash is pledged as collateral for swap contracts. |
Long Equity Swap Contracts
August 31, 2012
| | | | | | | | | | | | | | | | | | | | | | |
Counterparty | | Reference Entity | | Number of
Contracts | | | Notional
Amount | | | Interest Rate
Paid | | | Termination
Date | | | Unrealized
Appreciation/
(Depreciation) | |
Bank of America Merrill Lynch | | iShares S&P® Latin America 40 Index Fund | | | 851,894 | | | $ | 42,151,715 | | | | (1.19 | %) | | | 4/1/2013 | | | $ | (6,429,512 | ) |
Bank of America Merrill Lynch | | iShares S&P® Latin America 40 Index Fund | | | 2,500 | | | | 123,300 | | | | (1.19 | %) | | | 4/2/2013 | | | | (18,474 | ) |
Bank of America Merrill Lynch | | iShares S&P® Latin America 40 Index Fund | | | 2,700 | | | | 127,952 | | | | (1.19 | %) | | | 4/8/2013 | | | | (14,701 | ) |
Bank of America Merrill Lynch | | iShares S&P® Latin America 40 Index Fund | | | 6,900 | | | | 330,988 | | | | (1.19 | %) | | | 4/9/2013 | | | | (41,536 | ) |
Bank of America Merrill Lynch | | iShares S&P® Latin America 40 Index Fund | | | 2,800 | | | | 135,015 | | | | (1.19 | %) | | | 4/12/2013 | | | | (17,538 | ) |
Bank of America Merrill Lynch | | iShares S&P® Latin America 40 Index Fund | | | 3,300 | | | | 159,125 | | | | (1.19 | %) | | | 4/15/2013 | | | | (20,664 | ) |
Bank of America Merrill Lynch | | iShares S&P® Latin America 40 Index Fund | | | 2,775 | | | | 132,185 | | | | (1.19 | %) | | | 4/22/2013 | | | | (15,719 | ) |
Bank of America Merrill Lynch | | iShares S&P® Latin America 40 Index Fund | | | 12,690 | | | | 618,127 | | | | (1.19 | %) | | | 4/26/2013 | | | | (85,532 | ) |
Bank of America Merrill Lynch | | iShares S&P® Latin America 40 Index Fund | | | 16,000 | | | | 769,484 | | | | (1.19 | %) | | | 4/29/2013 | | | | (97,861 | ) |
Bank of America Merrill Lynch | | iShares S&P® Latin America 40 Index Fund | | | 9,400 | | | | 442,828 | | | | (1.19 | %) | | | 4/30/2013 | | | | (48,162 | ) |
Bank of America Merrill Lynch | | iShares S&P® Latin America 40 Index Fund | | | 1,560 | | | | 73,194 | | | | (1.19 | %) | | | 5/6/2013 | | | | (7,678 | ) |
Bank of America Merrill Lynch | | iShares S&P® Latin America 40 Index Fund | | | 13,630 | | | | 626,015 | | | | (1.19 | %) | | | 5/13/2013 | | | | (53,356 | ) |
Bank of America Merrill Lynch | | iShares S&P® Latin America 40 Index Fund | | | 7,020 | | | | 320,808 | | | | (1.19 | %) | | | 5/20/2013 | | | | (25,805 | ) |
Bank of America Merrill Lynch | | iShares S&P® Latin America 40 Index Fund | | | 8,700 | | | | 396,277 | | | | (1.19 | %) | | | 5/23/2013 | | | | (30,630 | ) |
Bank of America Merrill Lynch | | iShares S&P® Latin America 40 Index Fund | | | 20,880 | | | | 950,833 | | | | (1.19 | %) | | | 5/28/2013 | | | | (73,128 | ) |
Bank of America Merrill Lynch | | iShares S&P® Latin America 40 Index Fund | | | 4,965 | | | | 227,244 | | | | (1.19 | %) | | | 6/3/2013 | | | | (18,495 | ) |
Bank of America Merrill Lynch | | iShares S&P® Latin America 40 Index Fund | | | 670 | | | | 29,901 | | | | (1.19 | %) | | | 6/4/2013 | | | | (1,726 | ) |
Bank of America Merrill Lynch | | iShares S&P® Latin America 40 Index Fund | | | 19,830 | | | | 868,591 | | | | (1.19 | %) | | | 6/10/2013 | | | | (34,577 | ) |
Bank of America Merrill Lynch | | iShares S&P® Latin America 40 Index Fund | | | 8,755 | | | | 376,278 | | | | (1.19 | %) | | | 6/11/2013 | | | | (7,974 | ) |
Bank of America Merrill Lynch | | iShares S&P® Latin America 40 Index Fund | | | 3,630 | | | | 151,546 | | | | (1.19 | %) | | | 6/14/2013 | | | | 1,181 | |
Bank of America Merrill Lynch | | iShares S&P® Latin America 40 Index Fund | | | 9,970 | | | | 397,427 | | | | (1.19 | %) | | | 6/17/2013 | | | | 22,178 | |
Bank of America Merrill Lynch | | iShares S&P® Latin America 40 Index Fund | | | 6,390 | | | | 253,159 | | | | (1.19 | %) | | | 6/18/2013 | | | | 15,790 | |
Bank of America Merrill Lynch | | iShares S&P® Latin America 40 Index Fund | | | 375 | | | | 14,883 | | | | (1.19 | %) | | | 6/21/2013 | | | | 901 | |
Bank of America Merrill Lynch | | iShares S&P® Latin America 40 Index Fund | | | 5,270 | | | | 212,601 | | | | (1.19 | %) | | | 7/1/2013 | | | | 9,271 | |
Bank of America Merrill Lynch | | iShares S&P® Latin America 40 Index Fund | | | 3,127 | | | | 123,416 | | | | (1.19 | %) | | | 7/5/2013 | | | | 8,263 | |
Bank of America Merrill Lynch | | iShares S&P® Latin America 40 Index Fund | | | 3,942 | | | | 159,178 | | | | (1.19 | %) | | | 7/8/2013 | | | | 6,838 | |
Bank of America Merrill Lynch | | iShares S&P® Latin America 40 Index Fund | | | 1,210 | | | | 48,168 | | | | (1.19 | %) | | | 7/11/2013 | | | | 2,794 | |
Bank of America Merrill Lynch | | iShares S&P® Latin America 40 Index Fund | | | 8,863 | | | | 365,672 | | | | (1.19 | %) | | | 7/18/2013 | | | | 7,666 | |
Bank of America Merrill Lynch | | iShares S&P® Latin America 40 Index Fund | | | 19,410 | | | | 806,857 | | | | (1.19 | %) | | | 7/22/2013 | | | | (1,604 | ) |
Bank of America Merrill Lynch | | iShares S&P® Latin America 40 Index Fund | | | 5,710 | | | | 224,962 | | | | (1.19 | %) | | | 7/25/2013 | | | | 11,974 | |
Bank of America Merrill Lynch | | iShares S&P® Latin America 40 Index Fund | | | 75,972 | | | | 3,110,690 | | | | (1.19 | %) | | | 7/29/2013 | | | | 42,140 | |
Bank of America Merrill Lynch | | iShares S&P® Latin America 40 Index Fund | | | 850 | | | | 36,056 | | | | (1.19 | %) | | | 8/5/2013 | | | | (778 | ) |
Bank of America Merrill Lynch | | iShares S&P® Latin America 40 Index Fund | | | 10,649 | | | | 434,949 | | | | (1.19 | %) | | | 8/12/2013 | | | | 7,156 | |
Bank of America Merrill Lynch | | iShares S&P® Latin America 40 Index Fund | | | 420 | | | | 17,211 | | | | (1.19 | %) | | | 8/23/2013 | | | | 232 | |
Bank of America Merrill Lynch | | iShares S&P® Latin America 40 Index Fund | | | 8,530 | | | | 347,411 | | | | (1.19 | %) | | | 8/26/2013 | | | | 6,852 | |
Bank of America Merrill Lynch | | iShares S&P® Latin America 40 Index Fund | | | 18,660 | | | | 798,061 | | | | (1.19 | %) | | | 8/27/2013 | | | | (22,998 | ) |
Bank of America Merrill Lynch | | iShares S&P® Latin America 40 Index Fund | | | 46,018 | | | | 1,942,278 | | | | (1.19 | %) | | | 8/30/2013 | | | | (30,733 | ) |
Bank of America Merrill Lynch | | iShares S&P® Latin America 40 Index Fund | | | 4,325 | | | | 179,610 | | | | (1.19 | %) | | | 9/4/2013 | | | | 75 | |
Bank of America Merrill Lynch | | iShares S&P® Latin America 40 Index Fund | | | 9,260 | | | | 402,798 | | | | (1.19 | %) | | | 9/10/2013 | | | | (17,993 | ) |
Bank of America Merrill Lynch | | iShares S&P® Latin America 40 Index Fund | | | 11,020 | | | | 473,955 | | | | (1.19 | %) | | | 9/13/2013 | | | | (15,994 | ) |
Bank of America Merrill Lynch | | iShares S&P® Latin America 40 Index Fund | | | 3,140 | | | | 134,199 | | | | (1.19 | %) | | | 9/16/2013 | | | | (3,704 | ) |
The accompanying notes are an integral part of these financial statements.
| | |
| |
| DIREXION ANNUAL REPORT | | 39 |
Direxion Monthly Latin America Bull 2X Fund
Long Equity Swap Contracts (Continued)
August 31, 2012
| | | | | | | | | | | | | | | | | | | | | | |
Counterparty | | Reference Entity | | Number of
Contracts | | | Notional
Amount | | | Interest Rate
Paid | | | Termination
Date | | | Unrealized
Appreciation/
(Depreciation) | |
Bank of America Merrill Lynch | | iShares S&P® Latin America 40 Index Fund | | | 2,995 | | | $ | 129,769 | | | | (1.19 | %) | | | 9/17/2013 | | | $ | (5,280 | ) |
Bank of America Merrill Lynch | | iShares S&P® Latin America 40 Index Fund | | | 6,260 | | | | 268,733 | | | | (1.19 | %) | | | 9/23/2013 | | | | (8,513 | ) |
Bank of America Merrill Lynch | | iShares S&P® Latin America 40 Index Fund | | | 12,380 | | | | 525,884 | | | | (1.18 | %) | | | 9/23/2013 | | | | (11,193 | ) |
Bank of America Merrill Lynch | | iShares S&P® Latin America 40 Index Fund | | | 27,250 | | | | 1,134,055 | | | | (1.18 | %) | | | 9/30/2013 | | | | (1,000 | ) |
| | | | | | | | | | | | | | | | | | | | | | |
| | | | | 1,302,595 | | | $ | 61,553,388 | | | | | | | | | | | $ | (7,019,547 | ) |
| | | | | | | | | | | | | | | | | | | | | | |
The accompanying notes are an integral part of these financial statements.
| | |
| | |
| 40 | | DIREXION ANNUAL REPORT |
Statements of Assets and Liabilities
August 31, 2012
| | | | | | | | | | | | | | | | |
| | | Direxion Monthly
Small Cap Bull
2X Fund | | | Direxion Monthly
Small Cap Bear
2X Fund | | | Direxion Monthly
10 Year Note Bull
2X Fund | | | Direxion Monthly
10 Year Note Bear
2X Fund | |
Assets: | | | | | | | | | | | | | | | | |
Investments, at market value (Note 2) | | $ | — | | | $ | — | | | $ | — | | | $ | — | |
Cash | | | 5,581,682 | | | | 18,037,657 | | | | 25,267,796 | | | | 6,093,128 | |
Receivables: | | | | | | | | | | | | | | | | |
Fund shares sold | | | 68,933 | | | | 483,579 | | | | 1,651,336 | | | | 4,315,773 | |
Deposits at broker for swaps | | | 1,620,000 | | | | 6,090,000 | | | | 11,080,000 | | | | 4,385,000 | |
Unrealized appreciation on swaps | | | 106,005 | | | | — | | | | 442,436 | | | | — | |
| | | | | | | | | | | | | | | | |
Total assets | | | 7,376,620 | | | | 24,611,236 | | | | 38,441,568 | | | | 14,793,901 | |
| | | | | | | | | | | | | | | | |
Liabilities: | | | | | | | | | | | | | | | | |
Payables: | | | | | | | | | | | | | | | | |
Fund shares redeemed | | | 284,033 | | | | 181,692 | | | | 156,336 | | | | 4,217,964 | |
Due to broker for swaps | | | 769 | | | | 289,405 | | | | — | | | | 116,874 | |
Unrealized depreciation on swaps | | | — | | | | 1,065,026 | | | | — | | | | 155,221 | |
Accrued investment advisory fees | | | 4,661 | | | | 14,004 | | | | 25,768 | | | | 6,889 | |
Accrued operating services fees | | | 4,039 | | | | 12,136 | | | | 22,332 | | | | 5,971 | |
Accrued distribution expense | | | 1,553 | | | | 4,668 | | | | 8,589 | | | | 2,296 | |
Accrued shareholder servicing fees | | | 1,553 | | | | 4,668 | | | | 8,589 | | | | 2,296 | |
Other liabilities | | | — | | | | 5 | | | | 3 | | | | 16 | |
| | | | | | | | | | | | | | | | |
Total liabilities | | | 296,608 | | | | 1,571,604 | | | | 221,617 | | | | 4,507,527 | |
| | | | | | | | | | | | | | | | |
Net Assets | | $ | 7,080,012 | | | $ | 23,039,632 | | | $ | 38,219,951 | | | $ | 10,286,374 | |
| | | | | | | | | | | | | | | | |
Net Assets Consist Of: | | | | | | | | | | | | | | | | |
Capital stock | | | 12,495,712 | | | | 67,735,121 | | | | 37,514,755 | | | | 33,590,926 | |
Accumulated net investment loss | | | (115,411 | ) | | | (202,072 | ) | | | — | | | | (352,491 | ) |
Undistributed (Accumulated) net realized gain (loss) | | | (5,406,294 | ) | | | (43,428,391 | ) | | | 262,760 | | | | (22,796,840 | ) |
Net unrealized appreciation (depreciation) on: | | | | | | | | | | | | | | | | |
Swaps | | | 106,005 | | | | (1,065,026 | ) | | | 442,436 | | | | (155,221 | ) |
| | | | | | | | | | | | | | | | |
Total Net Assets | | $ | 7,080,012 | | | $ | 23,039,632 | | | $ | 38,219,951 | | | $ | 10,286,374 | |
| | | | | | | | | | | | | | | | |
Calculation of Net Asset Value Per Share: | | | | | | | | | | | | | | | | |
Net assets | | $ | 7,080,012 | | | $ | 23,039,632 | | | $ | 38,219,951 | | | $ | 10,286,374 | |
Shares outstanding (unlimited shares of beneficial interest authorized, no par value) | | | 154,517 | | | | 3,013,821 | | | | 1,062,443 | | | | 1,849,186 | |
Net asset value, redemption and offering price per share | | $ | 45.82 | | | $ | 7.64 | | | $ | 35.97 | | | $ | 5.56 | |
| | | | | | | | | | | | | | | | |
Cost of Investments | | $ | — | | | $ | — | | | $ | — | | | $ | — | |
| | | | | | | | | | | | | | | | |
The accompanying notes are an integral part of these financial statements.
| | |
| |
| DIREXION ANNUAL REPORT | | 41 |
Statements of Assets and Liabilities
August 31, 2012
| | | | | | | | | | | | |
| | | Dynamic HY
Bond Fund | | | Direxion Monthly
Commodity Bull
2X Fund | | | Direxion Monthly
Emerging Markets Bull
2X Fund | |
Assets: | | | | | | | | | | | | |
Investments, at market value (Note 2) | | $ | 80,788,183 | | | $ | — | | | $ | — | |
Cash | | | 4,266,444 | | | | 8,090,492 | | | | 17,461,198 | |
Receivables: | | | | | | | | | | | | |
Fund shares sold | | | 397,476 | | | | 65,805 | | | | 1,027,716 | |
Deposits at broker for swaps | | | — | | | | 6,540,000 | | | | 19,020,000 | |
Due from broker for swaps | | | — | | | | 840,000 | | | | 2,440,000 | |
Unrealized appreciation on swaps | | | — | | | | 514,246 | | | | — | |
Dividends and interest | | | — | | | | 135 | | | | 63 | |
| | | | | | | | | | | | |
Total assets | | | 85,452,103 | | | | 16,050,678 | | | | 39,948,977 | |
| | | | | | | | | | | | |
Liabilities: | | | | | | | | | | | | |
Payables: | | | | | | | | | | | | |
Fund shares redeemed | | | 167,832 | | | | 17,359 | | | | 431,989 | |
Due to broker for swaps | | | — | | | | 405,147 | | | | 39,302 | |
Unrealized depreciation on swaps | | | — | | | | 902,118 | | | | 1,403,243 | |
Accrued investment advisory fees | | | 77,909 | | | | 9,557 | | | | 24,424 | |
Accrued operating services fees | | | 64,924 | | | | 8,283 | | | | 21,167 | |
Accrued distribution expense | | | 32,462 | | | | 3,185 | | | | 8,141 | |
Accrued shareholder servicing fees | | | 32,462 | | | | 3,185 | | | | 8,141 | |
Other liabilities | | | — | | | | — | | | | 126 | |
| | | | | | | | | | | | |
Total liabilities | | | 375,589 | | | | 1,348,834 | | | | 1,936,533 | |
| | | | | | | | | | | | |
Net Assets | | $ | 85,076,514 | | | $ | 14,701,844 | | | $ | 38,012,444 | |
| | | | | | | | | | | | |
Net Assets Consist Of: | | | | | | | | | | | | |
Capital stock | | | 97,533,968 | | | | 43,634,506 | | | | 74,779,734 | |
Undistributed (Accumulated) net investment income (loss) | | | 1,162,413 | | | | (219,175 | ) | | | (271,151 | ) |
Accumulated net realized loss | | | (16,387,363 | ) | | | (28,325,615 | ) | | | (35,092,896 | ) |
Net unrealized appreciation (depreciation) on: | | | | | | | | | | | | |
Investments | | | 2,767,496 | | | | — | | | | — | |
Swaps | | | — | | | | (387,872 | ) | | | (1,403,243 | ) |
| | | | | | | | | | | | |
Total Net Assets | | $ | 85,076,514 | | | $ | 14,701,844 | | | $ | 38,012,444 | |
| | | | | | | | | | | | |
Calculation of Net Asset Value Per Share: | | | | | | | | | | | | |
Net assets | | $ | 85,076,514 | | | $ | 14,701,844 | | | $ | 38,012,444 | |
Shares outstanding (unlimited shares of beneficial interest
authorized, no par value) | | | 5,834,173 | | | | 317,569 | | | | 843,980 | |
Net asset value, redemption and offering price per share | | $ | 14.5824 | | | $ | 46.29 | | | $ | 45.04 | |
| | | | | | | | | | | | |
Cost of Investments | | $ | 78,020,687 | | | $ | — | | | $ | — | |
| | | | | | | | | | | | |
The accompanying notes are an integral part of these financial statements.
| | |
| | |
| 42 | | DIREXION ANNUAL REPORT |
Statements of Assets and Liabilities
August 31, 2012
| | | | | | | | |
| | | Direxion Monthly
China Bull
2X Fund | | | U.S. Government
Money Market
Fund | |
Assets: | | | | | | | | |
Investments, at market value (Note 2) | | $ | — | | | $ | 17,829,834 | |
Cash | | | 3,557,457 | | | | — | |
Receivables: | | | | | | | | |
Fund shares sold | | | 110,076 | | | | 504,111 | |
Deposits at broker for swaps | | | 3,950,000 | | | | — | |
Due from Adviser | | | — | | | | 12,227 | |
Dividends and interest | | | — | | | | 94 | |
Other receivables | | | — | | | | 56 | |
| | | | | | | | |
Total assets | | | 7,617,533 | | | | 18,346,322 | |
| | | | | | | | |
Liabilities: | | | | | | | | |
Payables: | | | | | | | | |
Fund shares redeemed | | | 1,404,040 | | | | 83,866 | |
Due to broker for swaps | | | 165,175 | | | | — | |
Unrealized depreciation on swaps | | | 462,066 | | | | — | |
Accrued investment advisory fees | | | 3,864 | | | | — | |
Accrued operating services fees | | | 3,349 | | | | 7,860 | |
Accrued distribution expense | | | 1,288 | | | | — | |
Accrued shareholder servicing fees | | | 1,288 | | | | 4,367 | |
| | | | | | | | |
Total liabilities | | | 2,041,070 | | | | 96,093 | |
| | | | | | | | |
Net Assets | | $ | 5,576,463 | | | $ | 18,250,229 | |
| | | | | | | | |
Net Assets Consist Of: | | | | | | | | |
Capital stock | | | 16,766,580 | | | | 18,250,836 | |
Undistributed (Accumulated) net investment income (loss) | | | (82,222 | ) | | | 20 | |
Accumulated net realized loss | | | (10,645,829 | ) | | | (627 | ) |
Net unrealized depreciation on: | | | | | | | | |
Swaps | | | (462,066 | ) | | | — | |
| | | | | | | | |
Total Net Assets | | $ | 5,576,463 | | | $ | 18,250,229 | |
| | | | | | | | |
Calculation of Net Asset Value Per Share: | | | | | | | | |
Net assets | | $ | 5,576,463 | | | $ | 18,250,229 | |
Shares outstanding (unlimited shares of beneficial interest authorized, no par value) | | | 204,925 | | | | 18,250,258 | |
Net asset value, redemption and offering price per share | | $ | 27.21 | | | $ | 1.00 | |
| | | | | | | | |
Cost of Investments | | $ | — | | | $ | 17,829,834 | |
| | | | | | | | |
The accompanying notes are an integral part of these financial statements.
| | |
| |
| DIREXION ANNUAL REPORT | | 43 |
Statements of Assets and Liabilities
August 31, 2012
| | | | | | | | | | | | | | | | |
| | | Direxion Monthly
NASDAQ-100® Bull
2X Fund | | | Direxion Monthly
S&P 500® Bull
2X Fund | | | Direxion Monthly
S&P 500® Bear
2X Fund | | | Direxion Monthly
Latin America Bull
2X Fund | |
Assets: | | | | | | | | | | | | | | | | |
Investments, at market value (Note 2) | | $ | — | | | $ | — | | | $ | — | | | $ | — | |
Cash | | | 21,457,433 | | | | 11,337,158 | | | | 8,541,164 | | | | 11,718,482 | |
Receivables: | | | | | | | | | | | | | | | | |
Fund shares sold | | | 2,173,096 | | | | 3,367,207 | | | | 245,813 | | | | 265,337 | |
Deposits at broker for swaps | | | 5,810,000 | | | | 3,610,000 | | | | 2,560,000 | | | | 15,310,000 | |
Due from broker for swaps | | | 3,830 | | | | 18,107 | | | | — | | | | 7,150,000 | |
Unrealized appreciation on swaps | | | 107,415 | | | | 146,290 | | | | — | | | | 143,311 | |
Dividends and interest | | | — | | | | — | | | | — | | | | 649 | |
| | | | | | | | | | | | | | | | |
Total assets | | | 29,551,774 | | | | 18,478,762 | | | | 11,346,977 | | | | 34,587,779 | |
| | | | | | | | | | | | | | | | |
Liabilities: | | | | | | | | | | | | | | | | |
Payables: | | | | | | | | | | | | | | | | |
Fund shares redeemed | | | 2,857,100 | | | | 2,893,261 | | | | 2,109 | | | | 154,117 | |
Due to broker for swaps | | | — | | | | — | | | | 30,626 | | | | 95,572 | |
Deposits from broker for swaps | | | 240,000 | | | | 30,000 | | | | — | | | | — | |
Unrealized depreciation on swaps | | | — | | | | — | | | | 315,294 | | | | 7,162,858 | |
Accrued investment advisory fees | | | 16,866 | | | | 9,593 | | | | 7,135 | | | | 17,904 | |
Accrued operating services fees | | | 14,702 | | | | 8,378 | | | | 6,237 | | | | 15,609 | |
Accrued distribution expense | | | 5,622 | | | | 3,198 | | | | 2,378 | | | | 5,968 | |
Accrued shareholder servicing fees | | | 5,622 | | | | 3,198 | | | | 2,378 | | | | 5,968 | |
Other liabilities | | | 42 | | | | 24 | | | | — | | | | — | |
| | | | | | | | | | | | | | | | |
Total liabilities | | | 3,139,954 | | | | 2,947,652 | | | | 366,157 | | | | 7,457,996 | |
| | | | | | | | | | | | | | | | |
Net Assets | | $ | 26,411,820 | | | $ | 15,531,110 | | | $ | 10,980,820 | | | $ | 27,129,783 | |
| | | | | | | | | | | | | | | | |
Net Assets Consist Of: | | | | | | | | | | | | | | | | |
Capital stock | | | 36,252,903 | | | | 16,696,360 | | | | 57,992,773 | | | | 205,659,942 | |
Undistributed net investment income | | | — | | | | — | | | | — | | | | — | |
Accumulated net realized loss | | | (9,948,498 | ) | | | (1,311,540 | ) | | | (46,696,659 | ) | | | (171,510,612 | ) |
Net unrealized appreciation (depreciation) on: | | | | | | | | | | | | | | | | |
Swaps | | | 107,415 | | | | 146,290 | | | | (315,294 | ) | | | (7,019,547 | ) |
| | | | | | | | | | | | | | | | |
Total Net Assets | | $ | 26,411,820 | | | $ | 15,531,110 | | | $ | 10,980,820 | | | $ | 27,129,783 | |
| | | | | | | | | | | | | | | | |
Calculation of Net Asset Value Per Share: | | | | | | | | | | | | | | | | |
Net assets | | $ | 26,411,820 | | | $ | 15,531,110 | | | $ | 10,980,820 | | | $ | 27,129,783 | |
Shares outstanding (unlimited shares of beneficial interest authorized, no par value) | | | 220,698 | | | | 331,910 | | | | 550,785 | | | | 735,525 | |
Net asset value, redemption and offering price per share | | $ | 119.67 | | | $ | 46.79 | | | $ | 19.94 | | | $ | 36.88 | |
| | | | | | | | | | | | | | | | |
Cost of Investments | | $ | — | | | $ | — | | | $ | — | | | $ | — | |
| | | | | | | | | | | | | | | | |
The accompanying notes are an integral part of these financial statements.
| | |
| | |
| 44 | | DIREXION ANNUAL REPORT |
Statements of Operations
For the Year Ended August 31, 2012
| | | | | | | | | | | | | | | | |
| | | Direxion Monthly
Small Cap Bull
2X Fund | | | Direxion Monthly
Small Cap Bear
2X Fund | | | Direxion Monthly
10 Year Note Bull
2X Fund | | | Direxion Monthly
10 Year Note Bear
2X Fund | |
Investment Income: | | | | | | | | | | | | | | | | |
Interest income | | $ | 4,015 | | | $ | 6,930 | | | $ | 22,349 | | | $ | 10,670 | |
| | | | | | | | | | | | | | | | |
Total investment income | | | 4,015 | | | | 6,930 | | | | 22,349 | | | | 10,670 | |
| | | | | | | | | | | | | | | | |
Expenses: | | | | | | | | | | | | | | | | |
Investment advisory fees | | | 68,521 | | | | 103,782 | | | | 359,188 | | | | 203,471 | |
Operating services fees | | | 59,385 | | | | 89,945 | | | | 311,297 | | | | 176,342 | |
Distribution expenses | | | 22,840 | | | | 34,594 | | | | 119,730 | | | | 67,824 | |
Shareholder servicing fees | | | 22,840 | | | | 34,594 | | | | 119,730 | | | | 67,824 | |
| | | | | | | | | | | | | | | | |
Total expenses before excise taxes | | | 173,586 | | | | 262,915 | | | | 909,945 | | | | 515,461 | |
Excise taxes | | | — | | | | 10 | | | | — | | | | 1 | |
| | | | | | | | | | | | | | | | |
Total expenses | | | 173,586 | | | | 262,925 | | | | 909,945 | | | | 515,462 | |
| | | | | | | | | | | | | | | | |
Net investment loss | | | (169,571 | ) | | | (255,995 | ) | | | (887,596 | ) | | | (504,792 | ) |
| | | | | | | | | | | | | | | | |
Realized and unrealized gain (loss) on investments: | | | | | | | | | | | | | | | | |
Net realized gain (loss) on: | | | | | | | | | | | | | | | | |
Investments | | | 1,532 | | | | 146 | | | | — | | | | — | |
Swaps | | | 2,075,235 | | | | (2,139,442 | ) | | | 3,761,694 | | | | (6,591,938 | ) |
Contributions by affiliates (Note 4) | | | — | | | | — | | | | 11,406 | | | | — | |
| | | | | | | | | | | | | | | | |
| | | 2,076,767 | | | | (2,139,296 | ) | | | 3,773,100 | | | | (6,591,938 | ) |
| | | | | | | | | | | | | | | | |
Change in net unrealized appreciation (depreciation) on: | | | | | | | | | | | | | | | | |
Swaps | | | 114,982 | | | | (418,001 | ) | | | 393,379 | | | | 588,776 | |
| | | | | | | | | | | | | | | | |
Net realized and unrealized gain (loss) on investments | | | 2,191,749 | | | | (2,557,297 | ) | | | 4,166,479 | | | | (6,003,162 | ) |
| | | | | | | | | | | | | | | | |
Net increase (decrease) in net assets resulting from operations | | $ | 2,022,178 | | | $ | (2,813,292 | ) | | $ | 3,278,883 | | | $ | (6,507,954 | ) |
| | | | | | | | | | | | | | | | |
The accompanying notes are an integral part of these financial statements.
| | |
| |
| DIREXION ANNUAL REPORT | | 45 |
Statements of Operations
For the Year Ended August 31, 2012
| | | | | | | | | | | | |
| | | Dynamic HY
Bond Fund | | | Direxion Monthly
Commodity Bull
2X Fund | | | Direxion Monthly
Emerging Markets Bull
2X Fund | |
Investment Income: | | | | | | | | | | | | |
Dividend income | | $ | 12,280,485 | | | $ | — | | | $ | — | |
Interest income | | | 13,790 | | | | 8,252 | | | | 6,087 | |
| | | | | | | | | | | | |
Total investment income | | | 12,294,275 | | | | 8,252 | | | | 6,087 | |
| | | | | | | | | | | | |
Expenses: | | | | | | | | | | | | |
Investment advisory fees | | | 1,477,298 | | | | 138,094 | | | | 146,249 | |
Operating services fees | | | 984,864 | | | | 119,681 | | | | 126,749 | |
Distribution expenses | | | 492,432 | | | | 46,031 | | | | 48,750 | |
Shareholder servicing fees | | | 492,432 | | | | 46,031 | | | | 48,750 | |
| | | | | | | | | | | | |
Total expenses before reimbursement | | | 3,447,026 | | | | 349,837 | | | | 370,498 | |
Less: Expenses waived by Adviser | | | (295,459 | ) | | | — | | | | — | |
| | | | | | | | | | | | |
Total expenses | | | 3,151,567 | | | | 349,837 | | | | 370,498 | |
| | | | | | | | | | | | |
| | | | | | | | | | | — | |
| | | | | | | | | | | | |
Net investment income (loss) | | | 9,142,708 | | | | (341,585 | ) | | | (364,411 | ) |
| | | | | | | | | | | | |
Realized and unrealized gain (loss) on investments | | | | | | | | | | | | |
Net realized gain (loss) on: | | | | | | | | | | | | |
Investments | | | (7,331,324 | ) | | | — | | | | — | |
Swaps | | | 895,998 | | | | (13,348,158 | ) | | | 2,065,512 | |
Contributions by affiliates (Note 4) | | | 17,211 | | | | — | | | | — | |
| | | | | | | | | | | | |
| | | (6,418,115 | ) | | | (13,348,158 | ) | | | 2,065,512 | |
| | | | | | | | | | | | |
Capital gain distributions from regulated investment companies | | | 864,902 | | | | — | | | | — | |
| | | | | | | | | | | | |
Change in net unrealized appreciation (depreciation) on: | | | | | | | | | | | | |
Investments | | | 2,698,530 | | | | — | | | | — | |
Swaps | | | 1,307 | | | | 6,044,907 | | | | (2,683,119 | ) |
| | | | | | | | | | | | |
| | | 2,699,837 | | | | 6,044,907 | | | | (2,683,119 | ) |
| | | | | | | | | | | | |
Net realized and unrealized loss on investments | | | (2,853,376 | ) | | | (7,303,251 | ) | | | (617,607 | ) |
| | | | | | | | | | | | |
Net increase (decrease) in net assets resulting from operations | | $ | 6,289,332 | | | $ | (7,644,836 | ) | | $ | (982,018 | ) |
| | | | | | | | | | | | |
The accompanying notes are an integral part of these financial statements.
| | |
| | |
| 46 | | DIREXION ANNUAL REPORT |
Statements of Operations
For the Year Ended August 31, 2012
| | | | | | | | |
| | | Direxion Monthly
China Bull
2X Fund | | | U.S. Government
Money Market
Fund | |
Investment Income: | | | | | | | | |
Interest income | | $ | 2,112 | | | $ | 15,210 | |
| | | | | | | | |
Total investment income | | | 2,112 | | | | 15,210 | |
| | | | | | | | |
Expenses: | | | | | | | | |
Investment advisory fees | | | 48,985 | | | | 119,401 | |
Operating services fees | | | 42,453 | | | | 107,460 | |
Distribution expenses | | | 16,328 | | | | — | |
Shareholder servicing fees | | | 16,328 | | | | 59,700 | |
| | | | | | | | |
Total expenses before reimbursement and excise taxes | | | 124,094 | | | | 286,561 | |
Excise taxes | | | — | | | | 20 | |
Less: Expenses waived by Adviser | | | — | | | | (286,581 | ) |
| | | | | | | | |
Total expenses | | | 124,094 | | | | — | |
| | | | | | | | |
Net investment income (loss) | | | (121,982 | ) | | | 15,210 | |
| | | | | | | | |
Realized and unrealized gain (loss) on investments | | | | | | | | |
Net realized loss on: | | | | | | | | |
Swaps | | | (2,444,667 | ) | | | — | |
| | | | | | | | |
Change in net unrealized depreciation on: | | | | | | | | |
Swaps | | | (703,271 | ) | | | — | |
| | | | | | | | |
Net realized and unrealized loss on investments | | | (3,147,938 | ) | | | — | |
| | | | | | | | |
Net increase (decrease) in net assets resulting from operations | | $ | (3,269,920 | ) | | $ | 15,210 | |
| | | | | | | | |
The accompanying notes are an integral part of these financial statements.
| | |
| |
| DIREXION ANNUAL REPORT | | 47 |
Statements of Operations
| | | | | | | | | | | | | | | | |
| | | Direxion Monthly
NASDAQ-100
Bull 2X Fund | | | Direxion Monthly
NASDAQ-100
Bull 2X Fund | | | Direxion Monthly
S&P 500 Bull
2X Fund | | | Direxion Monthly
S&P 500 Bull
2X Fund | |
| | | Period of
May 1, 2012 to
August 31, 2012 | | | Year Ended
May 1, 2011 to
April 30, 2012 | | | Period of
May 1, 2012 to
August 31, 2012 | | | Year Ended
May 1, 2011 to
April 30, 2012 | |
Investment Income: | | | | | | | | | | | | | | | | |
Interest income | | $ | 5,698 | | | $ | 5,456 | | | $ | 3,703 | | | $ | 4,455 | |
| | | | | | | | | | | | | | | | |
Total investment income | | | 5,698 | | | | 5,456 | | | | 3,703 | | | | 4,455 | |
| | | | | | | | | | | | | | | | |
Expenses: | | | | | | | | | | | | | | | | |
Investment advisory fees | | | 63,618 | | | | 133,388 | | | | 42,477 | | | | 131,342 | |
Operating services fees | | | 55,136 | | | | 115,603 | | | | 36,813 | | | | 113,830 | |
Distribution expenses | | | 21,206 | | | | 44,462 | | | | 14,159 | | | | 43,781 | |
Shareholder servicing fees | | | 21,206 | | | | 44,462 | | | | 14,159 | | | | 43,781 | |
| | | | | | | | | | | | | | | | |
Total expenses before excise taxes | | | 161,166 | | | | 337,915 | | | | 107,608 | | | | 332,734 | |
Excise taxes | | | — | | | | — | | | | — | | | | 37,041 | |
| | | | | | | | | | | | | | | | |
Total expenses | | | 161,166 | | | | 337,915 | | | | 107,608 | | | | 369,775 | |
| | | | | | | | | | | | | | | | |
Net investment loss | | | (155,468 | ) | | | (332,459 | ) | | | (103,905 | ) | | | (365,320 | ) |
| | | | | | | | | | | | | | | | |
Realized and unrealized gain (loss) on investments: | | | | | | | | | | | | | | | | |
Net realized gain (loss) on: | | | | | | | | | | | | | | | | |
Swaps | | | 234,489 | | | | 3,089,029 | | | | 768,673 | | | | (564,412 | ) |
| | | | | | | | | | | | | | | | |
Change in net unrealized appreciation (depreciation) on: | | | | | | | | | | | | | | | | |
Swaps | | | 390,683 | | | | (907,925 | ) | | | (315,999 | ) | | | 232,912 | |
| | | | | | | | | | | | | | | | |
Net realized and unrealized gain (loss) on investments | | | 625,172 | | | | 2,181,104 | | | | 452,674 | | | | (331,500 | ) |
| | | | | | | | | | | | | | | | |
Net increase (decrease) in net assets resulting from operations | | $ | 469,704 | | | $ | 1,848,645 | | | $ | 348,769 | | | $ | (696,820 | ) |
| | | | | | | | | | | | | | | | |
The accompanying notes are an integral part of these financial statements.
| | |
| | |
| 48 | | DIREXION ANNUAL REPORT |
Statements of Operations
| | | | | | | | | | | | | | | | |
| | | Direxion Monthly
S&P 500 Bear
2X Fund | | | Direxion Monthly
S&P 500 Bear
2X Fund | | | Direxion Monthly
Latin America Bull
2X Fund | | | Direxion Monthly
Latin America Bull
2X Fund | |
| | | Period of
May 1, 2012 to
August 31, 2012 | | | Year Ended
May 1, 2011 to
April 30, 2012 | | | Period of
May 1, 2012 to
August 31, 2012 | | | Year Ended
May 1, 2011 to
April 30, 2012 | |
Investment Income: | | | | | | | | | | | | | | | | |
Interest income | | $ | 3,153 | | | $ | 4,427 | | | $ | 7,751 | | | $ | 13,931 | |
| | | | | | | | | | | | | | | | |
Total investment income | | | 3,153 | | | | 4,427 | | | | 7,751 | | | | 13,931 | |
| | | | | | | | | | | | | | | | |
Expenses: | | | | | | | | | | | | | | | | |
Investment advisory fees | | | 35,585 | | | | 138,175 | | | | 69,367 | | | | 318,335 | |
Operating services fees | | | 30,840 | | | | 119,751 | | | | 60,118 | | | | 275,891 | |
Distribution expenses | | | 11,862 | | | | 46,058 | | | | 23,122 | | | | 106,112 | |
Shareholder servicing fees | | | 11,862 | | | | 46,058 | | | | 23,122 | | | | 106,112 | |
| | | | | | | | | | | | | | | | |
Total expenses | | | 90,149 | | | | 350,042 | | | | 175,729 | | | | 806,450 | |
| | | | | | | | | | | | | | | | |
Net investment loss | | | (86,996 | ) | | | (345,615 | ) | | | (167,978 | ) | | | (792,519 | ) |
| | | | | | | | | | | | | | | | |
Realized and unrealized gain (loss) on investments: | | | | | | | | | | | | | | | | |
Net realized loss on: | | | | | | | | | | | | | | | | |
Swaps | | | (176,378 | ) | | | (8,003,534 | ) | | | (4,262,436 | ) | | | (14,849,182 | ) |
| | | | | | | | | | | | | | | | |
Change in net unrealized appreciation (depreciation) on: | | | | | | | | | | | | | | | | |
Swaps | | | (242,310 | ) | | | 605,172 | | | | (1,539,906 | ) | | | (6,705,157 | ) |
| | | | | | | | | | | | | | | | |
Net realized and unrealized loss on investments | | | (418,688 | ) | | | (739,862 | ) | | | (5,802,342 | ) | | | (21,554,339 | ) |
| | | | | | | | | | | | | | | | |
Net decrease in net assets resulting from operations | | $ | (505,684 | ) | | $ | (7,743,977 | ) | | $ | (5,970,320 | ) | | $ | (22,346,858 | ) |
| | | | | | | | | | | | | | | | |
The accompanying notes are an integral part of these financial statements.
| | |
| |
| DIREXION ANNUAL REPORT | | 49 |
Statements of Changes in Net Assets
| | | | | | | | | | | | | | | | |
| | | Direxion Monthly Small Cap
Bull 2X Fund | | | Direxion Monthly Small Cap
Bear 2X Fund | |
| | | Year Ended
August 31, 2012 | | | Year Ended
August 31, 2011 | | | Year Ended
August 31, 2012 | | | Year Ended
August 31, 2011 | |
Increase (Decrease) in net assets from: | | | | | | | | | | | | | | | | |
Operations | | | | | | | | | | | | | | | | |
Net investment loss | | $ | (169,571 | ) | | $ | (232,952 | ) | | $ | (255,995 | ) | | $ | (231,656 | ) |
Net realized gain (loss) on investments | | | 2,076,767 | | | | 1,487,721 | | | | (2,139,296 | ) | | | (10,403,682 | ) |
Change in net unrealized appreciation (depreciation) on investments | | | 114,982 | | | | 1,010,966 | | | | (418,001 | ) | | | (1,318,898 | ) |
| | | | | | | | | | | | | | | | |
Net increase (decrease) in net assets resulting from operations | | | 2,022,178 | | | | 2,265,735 | | | | (2,813,292 | ) | | | (11,954,236 | ) |
| | | | | | | | | | | | | | | | |
Distributions to shareholders: | | | | | | | | | | | | | | | | |
Total distributions to shareholders | | | — | | | | — | | | | — | | | | — | |
| | | | | | | | | | | | | | | | |
Capital share transactions: | | | | | | | | | | | | | | | | |
Net increase (decrease) in net assets resulting from net change in capital share transactions(a) | | | (3,947,289 | ) | | | 229,319 | | | | 18,013,285 | | | | (12,503,212 | ) |
| | | | | | | | | | | | | | | | |
Total increase (decrease) in net assets | | | (1,925,111 | ) | | | 2,495,054 | | | | 15,199,993 | | | | (24,457,448 | ) |
| | | | | | | | | | | | | | | | |
Net assets: | | | | | | | | | | | | | | | | |
Beginning of year | | | 9,005,123 | | | | 6,510,069 | | | | 7,839,639 | | | | 32,297,087 | |
| | | | | | | | | | | | | | | | |
End of year | | $ | 7,080,012 | | | $ | 9,005,123 | | | $ | 23,039,632 | | | $ | 7,839,639 | |
| | | | | | | | | | | | | | | | |
Accumulated net investment loss, end of year | | $ | (115,411 | ) | | $ | — | | | $ | (202,072 | ) | | $ | — | |
| | | | | | | | | | | | | | | | |
| (a) | Summary of capital share transactions is as follows: |
| | | | | | | | | | | | | | | | | | | | | | | | | | | | | | | | |
| | | Direxion Monthly Small Cap Bull 2X Fund | | | Direxion Monthly Small Cap Bear 2X Fund | |
| | | Year Ended
August 31, 2012 | | | Year Ended
August 31, 2011 | | | Year Ended
August 31, 2012 | | | Year Ended
August 31, 2011 | |
| | | Shares | | | Value | | | Shares | | | Value | | | Shares | | | Value | | | Shares | | | Value | |
Shares sold | | | 1,548,183 | | | $ | 61,462,661 | | | | 2,699,537 | | | $ | 117,569,055 | | | | 15,729,347 | | | $ | 145,273,826 | | | | 8,006,105 | | | $ | 91,300,806 | |
Shares redeemed | | | (1,630,822 | ) | | | (65,409,950 | ) | | | (2,705,483 | ) | | | (117,339,736 | ) | | | (13,371,997 | ) | | | (127,260,541 | ) | | | (8,899,067 | ) | | | (103,804,018 | ) |
| | | | | | | | | | | | | | | | | | | | | | | | | | | | | | | | |
Net increase (decrease) | | | (82,639 | ) | | $ | (3,947,289 | ) | | | (5,946 | ) | | $ | 229,319 | | | | 2,357,350 | | | $ | 18,013,285 | | | | (892,962 | ) | | $ | (12,503,212 | ) |
| | | | | | | | | | | | | | | | | | | | | | | | | | | | | | | | |
The accompanying notes are an integral part of these financial statements.
| | |
| | |
| 50 | | DIREXION ANNUAL REPORT |
Statements of Changes in Net Assets
| | | | | | | | | | | | | | | | |
| | | Direxion Monthly 10 year Note
Bull 2X Fund | | | Direxion Monthly 10 Year Note
Bear 2X Fund | |
| | | Year Ended
August 31, 2012 | | | Year Ended
August 31, 2011 | | | Year Ended
August 31, 2012 | | | Year Ended
August 31, 2011 | |
Increase (Decrease) in net assets from: | | | | | | | | | | | | | | | | |
Operations | | | | | | | | | | | | | | | | |
Net investment loss | | $ | (887,596 | ) | | $ | (487,256 | ) | | $ | (504,792 | ) | | $ | (487,727 | ) |
Net realized gain (loss) on investments | | | 3,773,100 | | | | (214,751 | ) | | | (6,591,938 | ) | | | (3,682,466 | ) |
Change in net unrealized appreciation (depreciation) on investments | | | 393,379 | | | | (562,542 | ) | | | 588,776 | | | | 172,302 | |
| | | | | | | | | | | | | | | | |
Net increase (decrease) in net assets resulting from operations | | | 3,278,883 | | | | (1,264,549 | ) | | | (6,507,954 | ) | | | (3,997,891 | ) |
| | | | | | | | | | | | | | | | |
Distributions to shareholders: | | | | | | | | | | | | | | | | |
Net realized gain | | | (39,145 | ) | | | (1,866,265 | ) | | | — | | | | — | |
| | | | | | | | | | | | | | | | |
Total distributions to shareholders | | | (39,145 | ) | | | (1,866,265 | ) | | | — | | | | — | |
| | | | | | | | | | | | | | | | |
Capital share transactions: | | | | | | | | | | | | | | | | |
Net increase (decrease) in net assets resulting from net change in capital share transactions(a) | | | 2,567,210 | | | | (913,290 | ) | | | (239,821 | ) | | | 5,008,512 | |
| | | | | | | | | | | | | | | | |
Total increase (decrease) in net assets | | | 5,806,948 | | | | (4,044,104 | ) | | | (6,747,775 | ) | | | 1,010,621 | |
| | | | | | | | | | | | | | | | |
Net assets: | | | | | | | | | | | | | | | | |
Beginning of year | | | 32,413,003 | | | | 36,457,107 | | | | 17,034,149 | | | | 16,023,528 | |
| | | | | | | | | | | | | | | | |
End of year | | $ | 38,219,951 | | | $ | 32,413,003 | | | $ | 10,286,374 | | | $ | 17,034,149 | |
| | | | | | | | | | | | | | | | |
Accumulated net investment loss, end of year | | $ | — | | | $ | — | | | $ | (352,491 | ) | | $ | — | |
| | | | | | | | | | | | | | | | |
| (a) | Summary of capital share transactions is as follows: |
| | | | | | | | | | | | | | | | | | | | | | | | | | | | | | | | |
| | | Direxion Monthly 10 Year Note Bull 2X Fund | | | Direxion Monthly 10 Year Note Bear 2X Fund | |
| | | Year Ended
August 31, 2012 | | | Year Ended
August 31, 2011 | | | Year Ended
August 31, 2012 | | | Year Ended
August 31, 2011 | |
| | | Shares | | | Value | | | Shares | | | Value | | | Shares | | | Value | | | Shares | | | Value | |
Shares sold | | | 15,725,630 | | | $ | 534,495,790 | | | | 11,568,331 | | | $ | 318,926,935 | | | | 54,429,718 | | | $ | 341,022,283 | | | | 27,400,569 | | | $ | 234,195,774 | |
Shares issued in reinvestment of distributions | | | 1,162 | | | | 38,505 | | | | 72,030 | | | | 1,843,981 | | | | — | | | | — | | | | — | | | | — | |
Shares redeemed | | | (15,699,523 | ) | | | (531,967,085 | ) | | | (11,760,040 | ) | | | (321,684,206 | ) | | | (55,015,231 | ) | | | (341,262,104 | ) | | | (26,904,068 | ) | | | (229,187,262 | ) |
| | | | | | | | | | | | | | | | | | | | | | | | | | | | | | | | |
Net increase (decrease) | | | 27,269 | | | $ | 2,567,210 | | | | (119,679 | ) | | $ | (913,290 | ) | | | (585,513 | ) | | $ | (239,821 | ) | | | 496,501 | | | $ | 5,008,512 | |
| | | | | | | | | | | | | | | | | | | | | | | | | | | | | | | | |
The accompanying notes are an integral part of these financial statements.
| | |
| |
| DIREXION ANNUAL REPORT | | 51 |
Statements of Changes in Net Assets
| | | | | | | | | | | | | | | | |
| | | Dynamic HY Bond Fund | | | Direxion Monthly Commodity
Bull 2X Fund | |
| | | Year Ended
August 31, 2012 | | | Year Ended
August 31, 2011 | | | Year Ended
August 31, 2012 | | | Year Ended
August 31, 2011 | |
Increase (Decrease) in net assets from: | | | | | | | | | | | | | | | | |
Operations | | | | | | | | | | | | | | | | |
Net investment income (loss) | | $ | 9,142,708 | | | $ | 4,405,294 | | | $ | (341,585 | ) | | $ | (821,172 | ) |
Net realized gain (loss) on investments | | | (6,418,115 | ) | | | (9,430,116 | ) | | | (13,348,158 | ) | | | 12,588,640 | |
Capital gain distributions from regulated investment companies | | | 864,902 | | | | 305,018 | | | | — | | | | — | |
Change in net unrealized appreciation (depreciation) on investments | | | 2,699,837 | | | | 116,713 | | | | 6,044,907 | | | | (2,937,558 | ) |
| | | | | | | | | | | | | | | | |
Net increase (decrease) in net assets resulting from operations | | | 6,289,332 | | | | (4,603,091 | ) | | | (7,644,836 | ) | | | 8,829,910 | |
| | | | | | | | | | | | | | | | |
Distributions to shareholders: | | | | | | | | | | | | | | | | |
Net investment income | | | (7,997,506 | ) | | | (5,101,501 | ) | | | — | | | | — | |
| | | | | | | | | | | | | | | | |
Total distributions to shareholders | | | (7,997,506 | ) | | | (5,101,501 | ) | | | — | | | | — | |
| | | | | | | | | | | | | | | | |
Capital share transactions: | | | | | | | | | | | | | | | | |
Net increase (decrease) in net assets resulting from net change in capital share transactions(a) | | | 81,232,904 | | | | 7,548,647 | | | | (4,672,056 | ) | | | (2,779,728 | ) |
| | | | | | | | | | | | | | | | |
Total increase (decrease) in net assets | | | 79,524,730 | | | | (2,155,945 | ) | | | (12,316,892 | ) | | | 6,050,182 | |
| | | | | | | | | | | | | | | | |
Net assets: | | | | | | | | | | | | | | | | |
Beginning of year | | | 5,551,784 | | | | 7,707,729 | | | | 27,018,736 | | | | 20,968,554 | |
| | | | | | | | | | | | | | | | |
End of year | | $ | 85,076,514 | | | $ | 5,551,784 | | | $ | 14,701,844 | | | $ | 27,018,736 | |
| | | | | | | | | | | | | | | | |
Undistributed (Accumulated) net investment income (loss), end of year | | $ | 1,162,413 | | | $ | — | | | $ | (219,175 | ) | | $ | — | |
| | | | | | | | | | | | | | | | |
| (a) | Summary of capital share transactions is as follows: |
| | | | | | | | | | | | | | | | | | | | | | | | | | | | | | | | |
| | | Dynamic HY Bond Fund | | | Direxion Monthly Commodity Bull 2X Fund | |
| | | Year Ended
August 31, 2012 | | | Year Ended
August 31, 2011 | | | Year Ended
August 31, 2012 | | | Year Ended
August 31, 2011 | |
| | | Shares | | | Value | | | Shares | | | Value | | | Shares | | | Value | | | Shares | | | Value | |
Shares sold | | | 79,841,383 | | | $ | 1,135,945,545 | | | | 90,023,773 | | | $ | 1,305,961,643 | | | | 727,058 | | | $ | 37,669,698 | | | | 2,325,535 | | | $ | 171,616,528 | |
Shares issued in reinvestment of distributions | | | 557,120 | | | | 7,839,972 | | | | 347,156 | | | | 5,058,580 | | | | — | | | | — | | | | — | | | | — | |
Shares redeemed | | | (74,962,909 | ) | | | (1,062,552,613 | ) | | | (90,520,095 | ) | | | (1,303,471,576 | ) | | | (831,749 | ) | | | (42,341,754 | ) | | | (2,378,908 | ) | | | (174,396,256 | ) |
| | | | | | | | | | | | | | | | | | | | | | | | | | | | | | | | |
Net increase (decrease) | | | 5,435,594 | | | $ | 81,232,904 | | | | (149,166 | ) | | $ | 7,548,647 | | | | (104,691 | ) | | $ | (4,672,056 | ) | | | (53,373 | ) | | $ | (2,779,728 | ) |
| | | | | | | | | | | | | | | | | | | | | | | | | | | | | | | | |
The accompanying notes are an integral part of these financial statements.
| | |
| | |
| 52 | | DIREXION ANNUAL REPORT |
Statements of Changes in Net Assets
| | | | | | | | | | | | | | | | |
| | | Direxion Monthly Emerging Markets
Bull 2X Fund | | | Direxion Monthly China
Bull 2X Fund | |
| | | Year Ended
August 31, 2012 | | | Year Ended
August 31, 2011 | | | Year Ended
August 31, 2012 | | | Year Ended
August 31, 2011 | |
Increase (Decrease) in net assets from: | | | | | | | | | | | | | | | | |
Operations | | | | | | | | | | | | | | | | |
Net investment loss | | $ | (364,411 | ) | | $ | (875,356 | ) | | $ | (121,982 | ) | | $ | (172,817 | ) |
Net realized gain (loss) on investments | | | 2,065,512 | | | | (7,195,495 | ) | | | (2,444,667 | ) | | | (2,142,572 | ) |
Change in net unrealized appreciation (depreciation) on investments | | | (2,683,119 | ) | | | 3,384,783 | | | | (703,271 | ) | | | 1,519,970 | |
| | | | | | | | | | | | | | | | |
Net decrease in net assets resulting from operations | | | (982,018 | ) | | | (4,686,068 | ) | | | (3,269,920 | ) | | | (795,419 | ) |
| | | | | | | | | | | | | | | | |
Distributions to shareholders: | | | | | | | | | | | | | | | | |
Total distributions to shareholders | | | — | | | | — | | | | — | | | | — | |
| | | | | | | | | | | | | | | | |
Capital share transactions: | | | | | | | | | | | | | | | | |
Net increase (decrease) in net assets resulting from net change in capital share transactions(a) | | | 21,078,838 | | | | (7,339,945 | ) | | | 1,898,913 | | | | (3,447,696 | ) |
| | | | | | | | | | | | | | | | |
Total increase (decrease) in net assets | | | 20,096,820 | | | | (12,026,013 | ) | | | (1,371,007 | ) | | | (4,243,115 | ) |
| | | | | | | | | | | | | | | | |
Net assets: | | | | | | | | | | | | | | | | |
Beginning of year | | | 17,915,624 | | | | 29,941,637 | | | | 6,947,470 | | | | 11,190,585 | |
| | | | | | | | | | | | | | | | |
End of year | | $ | 38,012,444 | | | $ | 17,915,624 | | | $ | 5,576,463 | | | $ | 6,947,470 | |
| | | | | | | | | | | | | | | | |
Accumulated net investment loss, end of year | | $ | (271,151 | ) | | $ | — | | | $ | (82,222 | ) | | $ | — | |
| | | | | | | | | | | | | | | | |
| (a) | Summary of capital share transactions is as follows: |
| | | | | | | | | | | | | | | | | | | | | | | | | | | | | | | | |
| | | Direxion Monthly Emerging Markets Bull 2X Fund | | | Direxion Monthly China Bull 2X Fund | |
| | | Year Ended
August 31, 2012 | | | Year Ended
August 31, 2011 | | | Year Ended
August 31, 2012 | | | Year Ended
August 31, 2011 | |
| | | Shares | | | Value | | | Shares | | | Value | | | Shares | | | Value | | | Shares | | | Value | |
Shares sold | | | 6,084,225 | | | $ | 292,864,204 | | | | 7,170,909 | | | $ | 511,679,262 | | | | 2,035,570 | | | $ | 65,280,456 | | | | 3,008,292 | | | $ | 149,791,787 | |
Shares issued in reinvestment of distributions | | | — | | | | — | | | | — | | | | — | | | | — | | | | — | | | | — | | | | — | |
Shares redeemed | | | (5,541,399 | ) | | | (271,785,366 | ) | | | (7,415,421 | ) | | | (519,019,207 | ) | | | (2,000,198 | ) | | | (63,381,543 | ) | | | (3,099,884 | ) | | | (153,239,483 | ) |
| | | | | | | | | | | | | | | | | | | | | | | | | | | | | | | | |
Net increase (decrease) | | | 542,826 | | | $ | 21,078,838 | | | | (244,512 | ) | | $ | (7,339,945 | ) | | | 35,372 | | | $ | 1,898,913 | | | | (91,592 | ) | | $ | (3,447,696 | ) |
| | | | | | | | | | | | | | | | | | | | | | | | | | | | | | | | |
The accompanying notes are an integral part of these financial statements.
| | |
| |
| DIREXION ANNUAL REPORT | | 53 |
Statements of Changes in Net Assets
| | | | | | | | |
| | | U.S. Government Money
Market Fund | |
| | | Year Ended
August 31, 2012 | | | Year Ended
August 31, 2011 | |
Increase (Decrease) in net assets from: | | | | | | | | |
Operations | | | | | | | | |
Net investment income | | $ | 15,210 | | | $ | 16,485 | |
Net realized gain on investments | | | — | | | | — | |
Change in net unrealized appreciation (depreciation) on investments | | | — | | | | — | |
| | | | | | | | |
Net increase in net assets resulting from operations | | | 15,210 | | | | 16,485 | |
| | | | | | | | |
Distributions to shareholders: | | | | | | | | |
Net investment income | | | (15,801 | ) | | | (32,003 | ) |
| | | | | | | | |
Total distributions to shareholders | | | (15,801 | ) | | | (32,003 | ) |
| | | | | | | | |
Capital share transactions: | | | | | | | | |
Net decrease in net assets resulting from net change in capital share transactions(a) | | | (1,847,355 | ) | | | (40,626,953 | ) |
| | | | | | | | |
Total decrease in net assets | | | (1,847,946 | ) | | | (40,642,471 | ) |
| | | | | | | | |
Net assets: | | | | | | | | |
Beginning of year | | | 20,098,175 | | | | 60,740,646 | |
| | | | | | | | |
End of year | | $ | 18,250,229 | | | $ | 20,098,175 | |
| | | | | | | | |
Undistributed net investment income, end of year | | $ | 20 | | | $ | 591 | |
| | | | | | | | |
| (a) | Summary of capital share transactions is as follows: |
| | | | | | | | | | | | | | | | |
| | | U.S. Government Money Market Fund | |
| | | Year Ended
August 31, 2012 | | | Year Ended
August 31, 2011 | |
| | | Shares | | | Value | | | Shares | | | Value | |
Shares sold | | | 466,887,084 | | | $ | 466,887,672 | | | | 410,148,612 | | | $ | 410,164,130 | |
Shares issued in reinvestment of distributions | | | 12,089 | | | | 12,089 | | | | 25,220 | | | | 25,220 | |
Shares redeemed | | | (468,747,114 | ) | | | (468,747,116 | ) | | | (450,816,299 | ) | | | (450,816,303 | ) |
| | | | | | | | | | | | | | | | |
Net decrease | | | (1,847,941 | ) | | $ | (1,847,355 | ) | | | (40,642,467 | ) | | $ | (40,626,953 | ) |
| | | | | | | | | | | | | | | | |
The accompanying notes are an integral part of these financial statements.
| | |
| | |
| 54 | | DIREXION ANNUAL REPORT |
Statements of Changes in Net Assets
| | | | | | | | | | | | |
| | | Direxion Monthly NASDAQ-100® Bull 2X Fund | |
| | | May 1, 2012 to
August 31, 2012 | | | Year Ended
April 30, 2012 | | | Year Ended
April 30, 2011 | |
Increase (Decrease) in net assets from: | | | | | | | | | | | | |
Operations | | | | | | | | | | | | |
Net investment loss | | $ | (155,468 | ) | | $ | (332,459 | ) | | $ | (336,402 | ) |
Net realized gain on investments | | | 234,489 | | | | 3,089,029 | | | | 2,007,879 | |
Change in net unrealized appreciation (depreciation) on investments | | | 390,683 | | | | (907,925 | ) | | | 2,104,219 | |
| | | | | | | | | | | | |
Net increase in net assets resulting from operations | | | 469,704 | | | | 1,848,645 | | | | 3,775,696 | |
| | | | | | | | | | | | |
Distributions to shareholders: | | | | | | | | | | | | |
Total distributions to shareholders | | | — | | | | — | | | | — | |
| | | | | | | | | | | | |
Capital share transactions: | | | | | | | | | | | | |
Net increase (decrease) in net assets resulting from net change in capital share transactions(a) | | | (3,298,988 | ) | | | 5,992,068 | | | | (9,891,815 | ) |
| | | | | | | | | | | | |
Total increase (decrease) in net assets | | | (2,829,284 | ) | | | 7,840,713 | | | | (6,116,119 | ) |
| | | | | | | | | | | | |
Net assets: | | | | | | | | | | | | |
Beginning of year/period | | | 29,241,104 | | | | 21,400,391 | | | | 27,516,510 | |
| | | | | | | | | | | | |
End of year/period | | $ | 26,411,820 | | | $ | 29,241,104 | | | $ | 21,400,391 | |
| | | | | | | | | | | | |
Accumulated net investment loss, end of year/period | | $ | — | | | $ | (135,210 | ) | | $ | — | |
| | | | | | | | | | | | |
| (a) | Summary of capital share transactions is as follows: |
| | | | | | | | | | | | | | | | | | | | | | | | |
| | | Direxion Monthly NASDAQ-100® Bull 2X Fund | |
| | | May 1, 2012 to
August 31, 2012 | | | Year Ended
April 30, 2012 | | | Year Ended
April 30, 2011 | |
| | | Shares | | | Value | | | Shares | | | Value | | | Shares | | | Value | |
Shares sold | | | 245,073 | | | $ | 26,709,387 | | | | 984,596 | | | $ | 94,275,537 | | | | 1,077,641 | | | $ | 76,940,514 | |
Shares issued in reinvestment of distributions | | | — | | | | — | | | | — | | | | — | | | | | | | | — | |
Shares redeemed | | | (275,583 | ) | | | (30,008,375 | ) | | | (962,469 | ) | | | (88,283,469 | ) | | | (1,254,087 | ) | | | (86,832,329 | ) |
| | | | | | | | | | | | | | | | | | | | | | | | |
Net increase (decrease) | | | (30,510 | ) | | $ | (3,298,988 | ) | | | 22,127 | | | $ | 5,992,068 | | | | (176,446 | ) | | $ | (9,891,815 | ) |
| | | | | | | | | | | | | | | | | | | | | | | | |
The accompanying notes are an integral part of these financial statements.
| | |
| |
| DIREXION ANNUAL REPORT | | 55 |
Statements of Changes in Net Assets
| | | | | | | | | | | | |
| | | Direxion Monthly S&P 500® Bull 2X Fund | |
| | | May 1, 2012 to
August 31, 2012 | | | Year Ended
April 30, 2012 | | | Year Ended
April 30, 2011 | |
Increase (Decrease) in net assets from: | | | | | | | | | | | | |
Operations | | | | | | | | | | | | |
Net investment loss | | $ | (103,905 | ) | | $ | (365,320 | ) | | $ | (333,944 | ) |
Net realized gain (loss) on investments | | | 768,673 | | | | (564,412 | ) | | | 4,764,550 | |
Change in net unrealized appreciation (depreciation) on investments | | | (315,999 | ) | | | 232,912 | | | | 880,274 | |
| | | | | | | | | | | | |
Net increase (decrease) in net assets resulting from operations | | | 348,769 | | | | (696,820 | ) | | | 5,310,880 | |
| | | | | | | | | | | | |
Distributions to shareholders: | | | | | | | | | | | | |
Net realized gain | | | — | | | | (1,704,431 | ) | | | — | |
| | | | | | | | | | | | |
Total distributions to shareholders | | | — | | | | (1,704,431 | ) | | | — | |
| | | | | | | | | | | | |
Capital share transactions: | | | | | | | | | | | | |
Net increase (decrease) in net assets resulting from net change in capital share transactions(a) | | | (4,527,984 | ) | | | 1,876,936 | | | | (1,932,851 | ) |
| | | | | | | | | | | | |
Total increase (decrease) in net assets | | | (4,179,215 | ) | | | (524,315 | ) | | | 3,378,029 | |
| | | | | | | | | | | | |
Net assets: | | | | | | | | | | | | |
Beginning of year/period | | | 19,710,325 | | | | 20,234,640 | | | | 16,856,611 | |
| | | | | | | | | | | | |
End of year/period | | $ | 15,531,110 | | | $ | 19,710,325 | | | $ | 20,234,640 | |
| | | | | | | | | | | | |
Accumulated net investment loss, end of year/period | | $ | — | | | $ | (94,280 | ) | | $ | — | |
| | | | | | | | | | | | |
| (a) | Summary of capital share transactions is as follows: |
| | | | | | | | | | | | | | | | | | | | | | | | |
| | | Direxion Monthly S&P 500® Bull 2X Fund | |
| | | May 1, 2012 to
August 31, 2012 | | | Year Ended
April 30, 2012 | | | Year Ended
April 30, 2011 | |
| | | Shares | | | Value | | | Shares | | | Value | | | Shares | | | Value | |
Shares sold | | | 990,683 | | | $ | 42,578,837 | | | | 5,773,534 | | | $ | 246,300,783 | | | | 8,271,415 | | | $ | 319,411,380 | |
Shares issued in reinvestment of distributions | | | — | | | | — | | | | 40,502 | | | | 1,628,656 | | | | — | | | | — | |
Shares redeemed | | | (1,085,898 | ) | | | (47,106,821 | ) | | | (5,795,885 | ) | | | (246,052,503 | ) | | | (8,303,118 | ) | | | (321,344,231 | ) |
| | | | | | | | | | | | | | | | | | | | | | | | |
Net increase (decrease) | | | (95,215 | ) | | $ | (4,527,984 | ) | | | 18,151 | | | $ | 1,876,936 | | | | (31,703 | ) | | $ | (1,932,851 | ) |
| | | | | | | | | | | | | | | | | | | | | | | | |
The accompanying notes are an integral part of these financial statements.
| | |
| | |
| 56 | | DIREXION ANNUAL REPORT |
Statements of Changes in Net Assets
| | | | | | | | | | | | |
| | | Direxion Monthly S&P 500® Bear 2X Fund | |
| | | May 1, 2012 to
August 31, 2012 | | | Year Ended
April 30, 2012 | | | Year Ended
April 30, 2011 | |
Increase (Decrease) in net assets from: | | | | | | | | | | | | |
Operations | | | | | | | | | | | | |
Net investment loss | | $ | (86,996 | ) | | $ | (345,615 | ) | | $ | (394,862 | ) |
Net realized loss on investments | | | (176,378 | ) | | | (8,003,534 | ) | | | (13,473,346 | ) |
Change in net unrealized appreciation (depreciation) on investments | | | (242,310 | ) | | | 605,172 | | | | 650,087 | |
| | | | | | | | | | | | |
Net decrease in net assets resulting from operations | | | (505,684 | ) | | | (7,743,977 | ) | | | (13,218,121 | ) |
| | | | | | | | | | | | |
Distributions to shareholders: | | | | | | | | | | | | |
Total distributions to shareholders | | | — | | | | — | | | | — | |
| | | | | | | | | | | | |
Capital share transactions: | | | | | | | | | | | | |
Net increase (decrease) in net assets resulting from net change in capital share
transactions(a) | | | (1,829,145 | ) | | | 11,194,170 | | | | 12,915,610 | |
| | | | | | | | | | | | |
Total increase (decrease) in net assets | | | (2,334,829 | ) | | | 3,450,193 | | | | (302,511 | ) |
| | | | | | | | | | | | |
Net assets: | | | | | | | | | | | | |
Beginning of year/period | | | 13,315,649 | | | | 9,865,456 | | | | 10,167,967 | |
| | | | | | | | | | | | |
End of year/period | | $ | 10,980,820 | | | $ | 13,315,649 | | | $ | 9,865,456 | |
| | | | | | | | | | | | |
Accumulated net investment loss, end of year/period | | $ | — | | | $ | (85,123 | ) | | $ | — | |
| | | | | | | | | | | | |
| (a) | Summary of capital share transactions is as follows: |
| | | | | | | | | | | | | | | | | | | | | | | | |
| | | Direxion Monthly S&P 500® Bear 2X Fund | |
| | | May 1, 2012 to
August 31, 2012 | | | Year Ended
April 30, 2012 | | | Year Ended
April 30, 2011 | |
| | | Shares | | | Value | | | Shares | | | Value | | | Shares | | | Value | |
Shares sold | | | 2,370,033 | | | $ | 51,858,718 | | | | 7,987,660 | | | $ | 225,455,973 | | | | 8,338,624 | | | $ | 321,978,656 | |
Shares issued in reinvestment of distributions | | | — | | | | — | | | | — | | | | — | | | | — | | | | — | |
Shares redeemed | | | (2,452,655 | ) | | | (53,687,863 | ) | | | (7,741,656 | ) | | | (214,261,803 | ) | | | (8,209,082 | ) | | | (309,063,046 | ) |
| | | | | | | | | | | | | | | | | | | | | | | | |
Net increase (decrease) | | | (82,622 | ) | | $ | (1,829,145 | ) | | | 246,004 | | | $ | 11,194,170 | | | | 129,542 | | | $ | 12,915,610 | |
| | | | | | | | | | | | | | | | | | | | | | | | |
The accompanying notes are an integral part of these financial statements.
| | |
| |
| DIREXION ANNUAL REPORT | | 57 |
Statements of Changes in Net Assets
| | | | | | | | | | | | |
| | | Direxion Monthly Latin America Bull 2X Fund | |
| | | May 1, 2012 to
August 31, 2012 | | | Year Ended
April 30, 2012 | | | Year Ended
April 30, 2011 | |
Increase (Decrease) in net assets from: | | | | | | | | | | | | |
Operations | | | | | | | | | | | | |
Net investment loss | | $ | (167,978 | ) | | $ | (792,519 | ) | | $ | (1,446,519 | ) |
Net realized gain (loss) on investments | | | (4,262,436 | ) | | | (14,849,182 | ) | | | 7,338,475 | |
Change in net unrealized appreciation (depreciation) on investments | | | (1,539,906 | ) | | | (6,705,157 | ) | | | 7,158,847 | |
| | | | | | | | | | | | |
Net increase (decrease) in net assets resulting from operations | | | (5,970,320 | ) | | | (22,346,858 | ) | | | 13,050,803 | |
| | | | | | | | | | | | |
Distributions to shareholders: | | | | | | | | | | | | |
Total distributions to shareholders | | | — | | | | — | | | | — | |
| | | | | | | | | | | | |
Capital share transactions: | | | | | | | | | | | | |
Net decrease in net assets resulting from net change in capital share transactions (a) | | | (1,239,843 | ) | | | (11,662,564 | ) | | | (47,751,073 | ) |
| | | | | | | | | | | | |
Total decrease in net assets | | | (7,210,163 | ) | | | (34,009,422 | ) | | | (34,700,270 | ) |
| | | | | | | | | | | | |
Net assets: | | | | | | | | | | | | |
Beginning of year/period | | | 34,339,946 | | | | 68,349,368 | | | | 103,049,638 | |
| | | | | | | | | | | | |
End of year/period | | $ | 27,129,783 | | | $ | 34,339,946 | | | $ | 68,349,368 | |
| | | | | | | | | | | | |
Accumulated net investment loss, end of year/period | | $ | — | | | $ | (233,871 | ) | | $ | — | |
| | | | | | | | | | | | |
| (a) | Summary of capital share transactions is as follows: |
| | | | | | | | | | | | | | | | | | | | | | | | |
| | | Direxion Monthly Latin America Bull 2X Fund | |
| | | May 1, 2012 to
August 31, 2012 | | | Year Ended
April 30, 2012 | | | Year Ended
April 30, 2011 | |
| | | Shares | | | Value | | | Shares | | | Value | | | Shares | | | Value | |
Shares sold | | | 271,300 | | | $ | 9,991,022 | | | | 949,900 | | | $ | 45,634,808 | | | | 2,472,219 | | | $ | 141,217,775 | |
Shares issued in reinvestment of distributions | | | — | | | | — | | | | — | | | | — | | | | — | | | | — | |
Shares redeemed | | | (299,432 | ) | | | (11,230,865 | ) | | | (1,195,236 | ) | | | (57,297,372 | ) | | | (3,329,911 | ) | | | (188,968,848 | ) |
| | | | | | | | | | | | | | | | | | | | | | | | |
Net decrease | | | (28,132 | ) | | $ | (1,239,843 | ) | | | (245,336 | ) | | $ | (11,662,564 | ) | | | (857,692 | ) | | $ | (47,751,073 | ) |
| | | | | | | | | | | | | | | | | | | | | | | | |
The accompanying notes are an integral part of these financial statements.
| | |
| | |
| 58 | | DIREXION ANNUAL REPORT |
Financial Highlights
| | | | | | | | | | | | | | | | | | | | | | | | | | | | | | | | | | | | | | | | | | | | | | | | | | | | | | | | | | | | | | | | | | | | |
| | | | | | | | | | | | | | | | | | | | | | | | | | | | | | | | | | | | RATIOS TO AVERAGE NET ASSETS | |
| | | Net Asset
Value,
Beginning
of Year/
Period | | | Net
Investment
Income
(Loss)2 | | | Net
Realized
and
Unrealized Gain
(Loss) on Investments | | | Net
Increase
(Decrease)
in
Net Asset Value
Resulting
from
Operations | | | Dividends
from Net
Investment Income | | | Distributions from Realized Capital
Gains | | | Return of Capital Distribution | | | Total Distributions | | | Net
Asset Value, End of Year/
Period | | | Total Return3 | | | Net
Assets, End of Year/
Period (,000) | | | Including Short
Dividends | | | Excluding
Short Dividends | | | Net Investment Income
(Loss) After
Expense Reimbursement/ Recoupment1 | | | Portfolio Turnover Rate4 | |
| | | | | | | | | | | | | Total Expenses1 | | | Net Expenses1 | | | Total Expenses1 | | | Net Expenses1 | | | |
Direxion Monthly Small Cap Bull 2X Fund | |
Year ended August 31, 2012 | | $ | 37.97 | | | $ | (0.76 | ) | | $ | 8.61 | | | $ | 7.85 | | | $ | — | | | $ | — | | | $ | — | | | $ | — | | | $ | 45.82 | | | | 20.67% | | | $ | 7,080 | | | | — | | | | — | | | | 1.90% | | | | 1.90% | | | | (1.86% | ) | | | 0% | |
Year ended August 31, 2011 | | | 26.78 | | | | (0.81 | ) | | | 12.00 | | | | 11.19 | | | | — | | | | — | | | | — | | | | — | | | | 37.97 | | | | 41.78% | | | | 9,005 | | | | — | | | | — | | | | 1.90% | | | | 1.90% | | | | (1.84% | ) | | | 0% | |
Year ended August 31, 2010 | | | 24.54 | | | | (0.57 | ) | | | 2.81 | | | | 2.24 | | | | — | | | | — | | | | — | | | | — | | | | 26.78 | | | | 9.13% | | | | 6,510 | | | | — | | | | — | | | | 1.90% | | | | 1.90% | | | | (1.80% | ) | | | 0% | |
Year ended August 31, 2009 | | | 80.66 | | | | (0.25 | ) | | | (55.87 | ) | | | (56.12 | ) | | | — | | | | — | | | | — | | | | — | | | | 24.54 | | | | (69.58% | ) | | | 14,559 | | | | — | | | | — | | | | 2.16% | | | | 1.89% | | | | (1.31% | ) | | | 0% | |
Year ended August 31, 2008 | | | 120.08 | | | | 1.10 | | | | (31.22 | ) | | | (30.12 | ) | | | (9.30 | ) | | | — | | | | — | | | | (9.30 | ) | | | 80.66 | | | | (26.31% | ) | | | 5,653 | | | | — | | | | — | | | | 2.50% | | | | 1.75% | | | | 1.24% | | | | 723% | |
Direxion Monthly Small Cap Bear 2X Fund | |
Year ended August 31, 2012 | | | 11.94 | | | | (0.16 | ) | | | (4.14 | ) | | | (4.30 | ) | | | — | | | | — | | | | — | | | | — | | | | 7.64 | | | | (36.01% | ) | | | 23,040 | | | | — | | | | — | | | | 1.90% | | | | 1.90% | | | | (1.85% | ) | | | 0% | |
Year ended August 31, 2011 | | | 20.84 | | | | (0.22 | ) | | | (8.68 | ) | | | (8.90 | ) | | | — | | | | — | | | | — | | | | — | | | | 11.94 | | | | (42.71% | ) | | | 7,840 | | | | — | | | | — | | | | 1.90% | | | | 1.88% | | | | (1.80% | )5 | | | 0% | |
Year ended August 31, 2010 | | | 29.50 | | | | (0.35 | ) | | | (8.31 | ) | | | (8.66 | ) | | | — | | | | — | | | | — | | | | — | | | | 20.84 | | | | (29.36% | ) | | | 32,297 | | | | — | | | | — | | | | 1.90% | | | | 1.90% | | | | (1.78% | ) | | | 0% | |
Year ended August 31, 2009 | | | 102.00 | | | | (0.80 | ) | | | (2.50 | ) | | | (3.30 | ) | | | (8.20 | ) | | | — | | | | (61.00 | ) | | | (69.20 | ) | | | 29.50 | | | | (48.97% | ) | | | 5,055 | | | | — | | | | — | | | | 2.20% | | | | 1.86% | | | | (1.18% | ) | | | 0% | |
Year ended August 31, 2008 | | | 116.10 | | | | 1.70 | | | | (11.60 | ) | | | (9.90 | ) | | | (4.20 | ) | | | — | | | | — | | | | (4.20 | ) | | | 102.00 | | | | (8.95% | ) | | | 13,365 | | | | — | | | | — | | | | 2.27% | | | | 1.75% | | | | 1.39% | | | | 0% | |
Direxion Monthly 10 Year Note Bull 2X Fund | |
Year ended August 31, 2012 | | | 31.31 | | | | (0.64 | ) | | | 5.34 | | | | 4.70 | | | | — | | | | (0.04 | ) | | | — | | | | (0.04 | ) | | | 35.97 | | | | 15.02% | 11 | | | 38,220 | | | | — | | | | — | | | | 1.90% | | | | 1.90% | | | | (1.85% | ) | | | 0% | |
Year ended August 31, 2011 | | | 31.57 | | | | (0.51 | ) | | | 2.29 | | | | 1.78 | | | | — | | | | (2.04 | ) | | | — | | | | (2.04 | ) | | | 31.31 | | | | 7.07% | | | | 32,413 | | | | — | | | | — | | | | 1.90% | | | | 1.90% | | | | (1.83% | ) | | | 0% | |
Year ended August 31, 2010 | | | 27.36 | | | | (0.44 | ) | | | 5.57 | | | | 5.13 | | | | — | | | | (0.92 | ) | | | — | | | | (0.92 | ) | | | 31.57 | | | | 19.41% | | | | 36,457 | | | | — | | | | — | | | | 1.90% | | | | 1.90% | | | | (1.63% | ) | | | 1,445% | |
Year ended August 31, 2009 | | | 24.14 | | | | 0.23 | | | | 2.99 | | | | 3.22 | | | | — | | | | — | | | | — | | | | — | | | | 27.36 | | | | 13.34% | | | | 24,451 | | | | — | | | | — | | | | 1.73% | | | | 1.77% | | | | 0.88% | | | | 2,327% | |
Year ended August 31, 2008 | | | 20.12 | | | | 0.40 | | | | 4.35 | | | | 4.75 | | | | (0.11 | ) | | | (0.62 | ) | | | — | | | | (0.73 | ) | | | 24.14 | | | | 24.07% | | | | 28,555 | | | | — | | | | — | | | | 1.77% | | | | 1.75% | | | | 1.70% | | | | 2,086% | |
Direxion Monthly 10 Year Note Bear 2X Fund | |
Year ended August 31, 2012 | | | 7.00 | | | | (0.12 | ) | | | (1.32 | ) | | | (1.44 | ) | | | — | | | | — | | | | — | | | | — | | | | 5.56 | | | | (20.57% | ) | | | 10,286 | | | | — | | | | — | | | | 1.90% | | | | 1.90% | | | | (1.86% | ) | | | 0% | |
Year ended August 31, 2011 | | | 8.27 | | | | (0.16 | ) | | | (1.11 | ) | | | (1.27 | ) | | | — | | | | — | | | | — | | | | — | | | | 7.00 | | | | (15.36% | ) | | | 17,034 | | | | — | | | | — | | | | 1.90% | | | | 1.90% | | | | (1.83% | ) | | | 0% | |
Year ended August 31, 2010 | | | 10.89 | | | | (0.20 | )6 | | | (2.42 | ) | | | (2.62 | ) | | | — | | | | — | | | | — | | | | — | | | | 8.27 | | | | (24.06% | ) | | | 16,024 | | | | 2.04% | | | | 2.04% | | | | 1.90% | | | | 1.90% | | | | (1.94% | )7 | | | 0% | |
Year ended August 31, 2009 | | | 13.82 | | | | (0.76 | )6 | | | (2.17 | ) | | | (2.93 | ) | | | — | | | | — | | | | — | | | | — | | | | 10.89 | | | | (21.20% | ) | | | 15,721 | | | | 7.23% | | | | 7.18% | | | | 1.85% | | | | 1.80% | | | | (6.78% | )7 | | | 0% | |
Year ended August 31, 2008 | | | 17.57 | | | | (0.31 | )6 | | | (3.26 | ) | | | (3.57 | ) | | | (0.04 | ) | | | — | | | | (0.14 | ) | | | (0.18 | ) | | | 13.82 | | | | (20.46% | ) | | | 37,471 | | | | 8.02% | | | | 7.88% | | | | 1.89% | | | | 1.75% | | | | (2.09% | )7 | | | 0% | |
Dynamic HY Bond Fund | |
Year ended August 31, 2012 | | | 13.93 | | | | 0.6559 | | | | 0.4901 | | | | 1.1460 | | | | (0.4936 | ) | | | — | | | | — | | | | (0.4936 | ) | | | 14.5824 | | | | 8.41% | 12 | | | 85,077 | | | | — | | | | — | | | | 1.75% | | | | 1.60% | | | | 4.64% | 8 | | | 508% | |
Year ended August 31, 2011 | | | 14.07 | | | | 0.35 | | | | 0.41 | | | | 0.76 | | | | (0.90 | ) | | | — | | | | — | | | | (0.90 | ) | | | 13.93 | | | | 5.48% | | | | 5,552 | | | | — | | | | — | | | | 1.86% | | | | 1.84% | | | | 2.34% | 8 | | | 995% | |
Year ended August 31, 2010 | | | 13.53 | | | | (0.26 | ) | | | 1.45 | | | | 1.19 | | | | (0.65 | ) | | | — | | | | — | | | | (0.65 | ) | | | 14.07 | | | | 8.82% | | | | 7,708 | | | | — | | | | — | | | | 1.85% | | | | 1.85% | | | | (1.74% | ) | | | 0% | |
Year ended August 31, 2009 | | | 16.38 | | | | (0.17 | )9 | | | (1.57 | ) | | | (1.74 | ) | | | (1.11 | ) | | | — | | | | — | | | | (1.11 | ) | | | 13.53 | | | | (10.73% | ) | | | 29,206 | | | | 1.75% | | | | 1.73% | | | | 1.75% | | | | 1.73% | | | | (1.24% | )10 | | | 889% | |
Year ended August 31, 2008 | | | 18.67 | | | | 0.32 | | | | (1.38 | ) | | | (1.06 | ) | | | (1.23 | ) | | | — | | | | — | | | | (1.23 | ) | | | 16.38 | | | | (5.85% | ) | | | 25,924 | | | | — | | | | — | | | | 1.74% | | | | 1.74% | | | | 1.80% | | | | 241% | |
| 2 | Net investment income (loss) per share represents net investment income (loss) divided by the daily average shares of beneficial interest outstanding throughout each period. |
| 3 | All returns reflect reinvested dividends, if any, but do not reflect the impact of taxes. |
| 4 | Portfolio turnover is calculated without regard to short-term securities having a maturity of less than one year. Investments in swaps and futures contracts and repurchase agreements are deemed short-term securities. The Fund’s aggressive investment strategy may result in significant portfolio turnover to take advantage of anticipated changes in market conditions. |
| 5 | Net investment income (loss) ratio before expense reimbursement for the year ended August 31, 2011 was (1.82%). |
| 6 | Net investment income (loss) before interest on short positions for the years ended August 31, 2010, 2009 and 2008 were $(0.18), $0.05 and $0.59, respectively. |
| 7 | Net investment income (loss) ratio included interest on short positions. The ratio excluding interest on short positions for the years ended August 31, 2010, 2009 and 2008 were (1.81%), (1.40%) and 4.04%, respectively. |
| 8 | Net investment income (loss) ratio before expense reimbursement/recoupment for the year ended August 31, 2012 and August 31, 2011 was 4.49% and 2.32%, respectively. |
| 9 | Net investment income (loss) before interest on short positions for the year ended August 31, 2009 was $(0.17). |
| 10 | Net investment income (loss) ratio included interest on short positions. The ratio excluding interest on short positions for the year ended August 31, 2009 was (1.24)%. |
| 11 | The Adviser made a contribution due to tracking error. If the contribution had not been made, the total return would have been 0.03% lower. |
| 12 | The Adviser made a contribution due to tracking error. If the contribution had not been made, the total return would have been 0.02% lower. |
| | |
| |
| DIREXION ANNUAL REPORT | | 59 |
Financial Highlights
| | | | | | | | | | | | | | | | | | | | | | | | | | | | | | | | | | | | | | | | | | | | | | | | | | | | | | | | | | | | | | | | | | | | |
| | | | | | | | | | | | | | | | | | | | | | | | | | | | | | | | | | | | RATIOS TO AVERAGE NET ASSETS | |
| | | Net Asset
Value,
Beginning
of Year/
Period | | | Net
Investment
Income
(Loss)2 | | | Net
Realized
and
Unrealized Gain
(Loss) on Investments | | | Net
Increase
(Decrease)
in
Net Asset Value
Resulting
from
Operations | | | Dividends
from Net
Investment Income | | | Distributions from Realized Capital
Gains | | | Return of Capital Distribution | | | Total Distributions | | | Net
Asset Value, End of Year/
Period | | | Total Return3 | | | Net
Assets, End of Year/
Period (,000) | | | Including Short
Dividends | | | Excluding
Short Dividends | | | Net Investment Income
(Loss) After
Expense Reimbursement/ Recoupment1 | | | Portfolio Turnover Rate4 | |
| | | | | | | | | | | | | Total Expenses1 | | | Net Expenses1 | | | Total Expenses1 | | | Net Expenses1 | | | |
Direxion Monthly Commodity Bull 2X Fund | |
Year ended August 31, 2012 | | $ | 63.99 | | | $ | (0.96 | ) | | $ | (16.74 | ) | | $ | (17.70 | ) | | $ | — | | | $ | — | | | $ | — | | | $ | — | | | $ | 46.29 | | | | (27.66% | ) | | $ | 14,702 | | | | — | | | | — | | | | 1.90% | | | | 1.90% | | | | (1.86% | ) | | | 0% | |
Year ended August 31, 2011 | | | 44.09 | | | | (1.32 | ) | | | 21.22 | | | | 19.90 | | | | — | | | | — | | | | — | | | | — | | | | 63.99 | | | | 45.13% | | | | 27,019 | | | | — | | | | — | | | | 1.90% | | | | 1.90% | | | | (1.84% | ) | | | 0% | |
Year ended August 31, 2010 | | | 36.85 | | | | (0.87 | ) | | | 8.11 | | | | 7.24 | | | | — | | | | — | | | | — | | | | — | | | | 44.09 | | | | 19.65% | | | | 20,969 | | | | — | | | | — | | | | 1.90% | | | | 1.90% | | | | (1.80% | ) | | | 0% | |
Year ended August 31, 2009 | | | 90.21 | | | | (0.32 | ) | | | (53.04 | ) | | | (53.36 | ) | | | — | | | | — | | | | — | | | | — | | | | 36.85 | | | | (59.15% | ) | | | 20,152 | | | | — | | | | — | | | | 1.96% | | | | 1.88% | | | | 1.07% | | | | 30% | |
Year ended August 31, 2008 | | | 96.06 | | | | 0.39 | | | | 10.68 | | | | 11.07 | | | | (16.44 | ) | | | (0.48 | ) | | | — | | | | (16.92 | ) | | | 90.21 | | | | 10.93% | | | | 43,081 | | | | — | | | | — | | | | 1.78% | | | | 1.75% | | | | 0.35% | | | | 168% | |
Direxion Monthly Emerging Markets Bull 2X Fund | |
Year ended August 31, 2012 | | | 59.49 | | | | (0.90 | ) | | | (13.55 | ) | | | (14.45 | ) | | | — | | | | — | | | | — | | | | — | | | | 45.04 | | | | (24.29% | ) | | | 38,012 | | | | — | | | | — | | | | 1.90% | | | | 1.90% | | | | (1.87% | ) | | | 0% | |
Year ended August 31, 2011 | | | 54.87 | | | | (1.34 | ) | | | 5.96 | | | | 4.62 | | | | — | | | | — | | | | — | | | | — | | | | 59.49 | | | | 8.42% | | | | 17,916 | | | | — | | | | — | | | | 1.90% | | | | 1.90% | | | | (1.84% | ) | | | 0% | |
Year ended August 31, 2010 | | | 45.45 | | | | (1.06 | ) | | | 10.48 | | | | 9.42 | | | | — | | | | — | | | | — | | | | — | | | | 54.87 | | | | 20.73% | | | | 29,942 | | | | — | | | | — | | | | 1.90% | | | | 1.90% | | | | (1.83% | ) | | | 241% | |
Year ended August 31, 2009 | | | 106.45 | | | | (0.44 | ) | | | (60.42 | ) | | | (60.86 | ) | | | — | | | | — | | | | (0.14 | ) | | | (0.14 | ) | | | 45.45 | | | | (57.08% | ) | | | 24,028 | | | | — | | | | — | | | | 1.89% | | | | 1.89% | | | | (1.34% | ) | | | 1,643% | |
Year ended August 31, 2008 | | | 194.45 | | | | 1.45 | | | | (38.75 | ) | | | (37.30 | ) | | | (1.80 | ) | | | (22.15 | ) | | | (26.75 | ) | | | (50.70 | ) | | | 106.45 | | | | (27.82% | ) | | | 22,290 | | | | — | | | | — | | | | 1.75% | | | | 1.75% | | | | 0.85% | | | | 2,796% | |
Direxion Monthly China Bull 2X Fund | |
Year ended August 31, 2012 | | | 40.98 | | | | (0.60 | ) | | | (13.17 | ) | | | (13.77 | ) | | | — | | | | — | | | | — | | | | — | | | | 27.21 | | | | (33.60% | ) | | | 5,576 | | | | — | | | | — | | | | 1.90% | | | | 1.90% | | | | (1.87% | ) | | | 0% | |
Year ended August 31, 2011 | | | 42.85 | | | | (0.93 | ) | | | (0.94 | ) | | | (1.87 | ) | | | — | | | | — | | | | — | | | | — | | | | 40.98 | | | | (4.36% | ) | | | 6,947 | | | | — | | | | — | | | | 1.90% | | | | 1.90% | | | | (1.83% | ) | | | 0% | |
Year ended August 31, 2010 | | | 43.69 | | | | (0.88 | ) | | | 0.04 | | | | (0.84 | ) | | | — | | | | — | | | | — | | | | — | | | | 42.85 | | | | (1.92% | ) | | | 11,191 | | | | — | | | | — | | | | 1.90% | | | | 1.90% | | | | (1.80% | ) | | | 0% | |
Year ended August 31, 2009 | | | 100.92 | | | | (0.53 | ) | | | (56.60 | ) | | | (57.13 | ) | | | (0.09 | ) | | | — | | | | (0.01 | ) | | | (0.10 | ) | | | 43.69 | | | | (56.58% | ) | | | 14,453 | | | | — | | | | — | | | | 2.14% | | | | 1.90% | | | | (1.54% | ) | | | 3,606% | |
December 3, 20077 to August 31, 2008 | | | 240.00 | | | | 0.48 | | | | (139.56 | ) | | | (139.08 | ) | | | — | | | | — | | | | — | | | | — | | | | 100.92 | | | | (57.95% | )8 | | | 6,295 | | | | — | | | | — | | | | 2.81% | | | | 1.75% | | | | 0.46% | | | | 2,204% | 8 |
U.S. Government Money Market Fund | |
Year ended August 31, 2012 | | | 1.00 | | | | — | 5 | | | — | | | | — | 5 | | | — | 5 | | | — | | | | — | | | | — | 5 | | | 1.00 | | | | 0.07% | | | | 18,250 | | | | — | | | | — | | | | 1.20% | | | | 0.00% | | | | 0.06% | 6 | | | 0% | |
Year ended August 31, 2011 | | | 1.00 | | | | — | 5 | | | — | | | | — | 5 | | | — | 5 | | | — | | | | — | | | | — | 5 | | | 1.00 | | | | 0.10% | | | | 20,098 | | | | — | | | | — | | | | 1.20% | | | | 0.04% | | | | 0.06% | 6 | | | 0% | |
Year ended August 31, 2010 | | | 1.00 | | | | — | 5 | | | — | | | | — | 5 | | | — | 5 | | | — | | | | — | | | | — | 5 | | | 1.00 | | | | 0.06% | | | | 60,741 | | | | — | | | | — | | | | 1.20% | | | | 0.05% | | | | 0.06% | | | | 0% | |
Year ended August 31, 2009 | | | 1.00 | | | | — | 5 | | | — | | | | — | 5 | | | — | 5 | | | — | | | | — | | | | — | 5 | | | 1.00 | | | | 0.23% | | | | 49,355 | | | | — | | | | — | | | | 1.29% | | | | 0.64% | | | | 0.24% | | | | 0% | |
Year ended August 31, 2008 | | | 1.00 | | | | 0.02 | | | | — | | | | 0.02 | | | | (0.02 | ) | | | — | | | | — | | | | (0.02 | ) | | | 1.00 | | | | 2.23% | | | | 91,270 | | | | — | | | | — | | | | 1.10% | | | | 0.99% | | | | 1.91% | | | | 0% | |
| 2 | Net investment income (loss) per share represents net investment income (loss) divided by the daily average shares of beneficial interest outstanding throughout each period. |
| 3 | All returns reflect reinvested dividends, if any, but do not reflect the impact of taxes. |
| 4 | Portfolio turnover is calculated without regard to short-term securities having a maturity of less than one year. Investments in swaps and futures contracts and repurchase agreements are deemed short-term securities. The Fund’s aggressive investment strategy may result in significant portfolio turnover to take advantage of anticipated changes in market conditions. |
| 5 | Amount is less than $0.01 per share. |
| 6 | Net investment income (loss) ratio before expense reimbursement for the year ended August 31, 2012 and August 31, 2011 was (1.14%) and (1.10%), respectively. |
| 7 | Commencement of operations. |
| | |
| | |
| 60 | | DIREXION ANNUAL REPORT |
Financial Highlights
| | | | | | | | | | | | | | | | | | | | | | | | | | | | | | | | | | | | | | | | | | | | | | | | | | | | | | | | | | | | | | | | | | | | |
| | | | | | | | | | | | | | | | | | | | | | | | | | | | | | | | | | | | RATIOS TO AVERAGE NET ASSETS | |
| | | Net Asset
Value,
Beginning
of Year/
Period | | | Net
Investment
Income
(Loss)2 | | | Net
Realized
and
Unrealized
Gain
(Loss) on
Investments | | | Net
Increase
(Decrease)
in
Net Asset
Value
Resulting
from
Operations | | | Dividends
from Net
Investment
Income | | | Distributions
from
Realized
Capital
Gains | | | Return of
Capital
Distribution | | | Total
Distributions | | | Net
Asset
Value, End of
Year/
Period | | | Total
Return3 | | | Net
Assets,
End of
Year/
Period
(,000) | | | Including Short
Dividends | | | Excluding
Short Dividends | | | Net
Investment
Income
(Loss)
After
Expense Reimbursement/
Recoupment1 | | | Portfolio
Turnover
Rate4 | |
| | | | | | | | | | | | | Total
Expenses1 | | | Net
Expenses1 | | | Total
Expenses1 | | | Net
Expenses1 | | | |
Direxion Monthly NASDAQ-100® Bull 2X Fund | |
Period ended August 31, 20126 | | $ | 116.40 | | | $ | (0.66 | ) | | $ | 3.93 | | | $ | 3.27 | | | $ | — | | | $ | — | | | $ | — | | | $ | — | | | $ | 119.67 | | | | 2.81% | 5 | | $ | 26,412 | | | | — | | | | — | | | | 1.90% | | | | 1.90% | | | | (1.83% | ) | | | 0% | 5 |
Year ended April 30, 2012 | | | 93.42 | | | | (1.73 | ) | | | 24.71 | | | | 22.98 | | | | — | | | | — | | | | — | | | | — | | | | 116.40 | | | | 24.60% | | | | 29,241 | | | | — | | | | — | | | | 1.90% | | | | 1.90% | | | | (1.87% | ) | | | 0% | |
Year ended April 30, 2011 | | | 67.85 | | | | (1.28 | ) | | | 26.85 | | | | 25.57 | | | | — | | | | — | | | | — | | | | — | | | | 93.42 | | | | 37.69% | | | | 21,400 | | | | — | | | | — | | | | 1.90% | | | | 1.90% | | | | (1.80% | ) | | | 0% | |
Year ended April 30, 2010 | | | 31.57 | | | | (0.88 | ) | | | 37.16 | | | | 36.28 | | | | — | | | | — | | | | — | | | | — | | | | 67.85 | | | | 114.92% | | | | 27,517 | | | | — | | | | — | | | | 1.95% | | | | 1.91% | | | | (1.77% | ) | | | 0% | |
Year ended April 30, 2009 | | | 112.07 | | | | (0.15 | ) | | | (79.02 | ) | | | (79.17 | ) | | | — | | | | (1.31 | ) | | | (0.02 | ) | | | (1.33 | ) | | | 31.57 | | | | (70.49% | ) | | | 26,156 | | | | — | | | | — | | | | 1.93% | | | | 1.81% | | | | (0.38% | ) | | | 83% | |
Year ended April 30, 2008 | | | 144.55 | | | | 3.08 | | | | (15.54 | ) | | | (12.46 | ) | | | (7.07 | ) | | | (12.95 | ) | | | — | | | | (20.02 | ) | | | 112.07 | | | | (11.69% | ) | | | 21,530 | | | | — | | | | — | | | | 2.35% | | | | 1.75% | | | | 2.22% | | | | 28% | |
Direxion Monthly S&P 500® Bull 2X Fund | |
Period ended August 31, 20126 | | | 46.15 | | | | (0.27 | ) | | | 0.91 | | | | 0.64 | | | | — | | | | — | | | | — | | | | — | | | | 46.79 | | | | 1.39% | 5 | | | 15,531 | | | | — | | | | — | | | | 1.90% | | | | 1.90% | | | | (1.83% | ) | | | 0% | 5 |
Year ended April 30, 2012 | | | 49.48 | | | | (0.89 | ) | | | 2.06 | | | | 1.17 | | | | — | | | | (4.50 | ) | | | — | | | | (4.50 | ) | | | 46.15 | | | | 3.94% | | | | 19,710 | | | | — | | | | — | | | | 2.11% | | | | 2.11% | | | | (2.09% | ) | | | 0% | |
Year ended April 30, 2011 | | | 38.25 | | | | (0.69 | ) | | | 11.92 | | | | 11.23 | | | | — | | | | — | | | | — | | | | — | | | | 49.48 | | | | 29.36% | | | | 20,235 | | | | — | | | | — | | | | 1.90% | | | | 1.90% | | | | (1.81% | ) | | | 0% | |
Year ended April 30, 2010 | | | 19.37 | | | | (0.44 | ) | | | 19.32 | | | | 18.88 | | | | — | | | | — | | | | — | | | | — | | | | 38.25 | | | | 97.47% | | | | 16,857 | | | | — | | | | — | | | | 1.93% | | | | 1.87% | | | | (1.67% | ) | | | 0% | |
Year ended April 30, 2009 | | | 90.05 | | | | (0.21 | ) | | | (70.46 | ) | | | (70.67 | ) | | | — | | | | — | | | | (0.01 | ) | | | (0.01 | ) | | | 19.37 | | | | (78.48% | ) | | | 42,611 | | | | — | | | | — | | | | 1.81% | | | | 1.85% | | | | (0.95% | ) | | | 578% | |
Year ended April 30, 2008 | | | 119.40 | | | | 2.50 | | | | (31.00 | ) | | | (28.50 | ) | | | — | | | | — | | | | (0.85 | ) | | | (0.85 | ) | | | 90.05 | | | | (23.97% | ) | | | 19,608 | | | | — | | | | — | | | | 2.46% | | | | 1.75% | | | | 2.35% | | | | 190% | |
Direxion Monthly S&P 500® Bear 2X Fund | |
Period ended August 31, 20126 | | | 21.02 | | | | (0.14 | ) | | | (0.94 | ) | | | (1.08 | ) | | | — | | | | — | | | | — | | | | — | | | | 19.94 | | | | (5.14% | )5 | | | 10,981 | | | | — | | | | — | | | | 1.90% | | | | 1.90% | | | | (1.83% | ) | | | 0% | 5 |
Year ended April 30, 2012 | | | 25.47 | | | | (0.51 | ) | | | (3.94 | ) | | | (4.45 | ) | | | — | | | | — | | | | — | | | | — | | | | 21.02 | | | | (17.47% | ) | | | 13,316 | | | | — | | | | — | | | | 1.90% | | | | 1.90% | | | | (1.88% | ) | | | 0% | |
Year ended April 30, 2011 | | | 39.43 | | | | (0.68 | ) | | | (13.28 | ) | | | (13.96 | ) | | | — | | | | — | | | | — | | | | — | | | | 25.47 | | | | (35.40% | ) | | | 9,865 | | | | — | | | | — | | | | 1.90% | | | | 1.90% | | | | (1.79% | ) | | | 0% | |
Year ended April 30, 2010 | | | 96.60 | | | | (0.95 | ) | | | (56.22 | ) | | | (57.17 | ) | | | — | | | | — | | | | — | | | | — | | | | 39.43 | | | | (59.18% | ) | | | 10,168 | | | | — | | | | — | | | | 1.98% | | | | 1.91% | | | | (1.75% | ) | | | 0% | |
Year ended April 30, 2009 | | | 80.25 | | | | (0.75 | ) | | | 22.65 | | | | 21.90 | | | | (5.55 | ) | | | — | | | | — | | | | (5.55 | ) | | | 96.60 | | | | 25.39% | | | | 26,885 | | | | — | | | | — | | | | 1.93% | | | | 1.80% | | | | (0.66% | ) | | | 195% | |
Year ended April 30, 2008 | | | 73.90 | | | | 1.70 | | | | 4.65 | | | | 6.35 | | | | — | | | | — | | | | — | | | | — | | | | 80.25 | | | | 8.59% | | | | 8,996 | | | | — | | | | — | | | | 2.44% | | | | 1.75% | | | | 2.10% | | | | 168% | |
Direxion Monthly Latin America Bull 2X Fund | |
Period ended August 31, 20126 | | | 44.97 | | | | (0.23 | ) | | | (7.86 | ) | | | (8.09 | ) | | | — | | | | — | | | | — | | | | — | | | | 36.88 | | | | (17.99% | )5 | | | 27,130 | | | | — | | | | — | | | | 1.90% | | | | 1.90% | | | | (1.81% | ) | | | 0% | 5 |
Year ended April 30, 2012 | | | 67.74 | | | | (0.91 | ) | | | (21.86 | ) | | | (22.77 | ) | | | — | | | | — | | | | — | | | | — | | | | 44.97 | | | | (33.61% | ) | | | 34,340 | | | | — | | | | — | | | | 1.90% | | | | 1.90% | | | | (1.87% | ) | | | 0% | |
Year ended April 30, 2011 | | | 55.20 | | | | (1.02 | ) | | | 13.56 | | | | 12.54 | | | | — | | | | — | | | | — | | | | — | | | | 67.74 | | | | 22.72% | | | | 68,349 | | | | — | | | | — | | | | 1.90% | | | | 1.90% | | | | (1.79% | ) | | | 0% | |
Year ended April 30, 2010 | | | 23.45 | | | | (0.84 | ) | | | 32.59 | | | | 31.75 | | | | — | | | | — | | | | — | | | | — | | | | 55.20 | | | | 135.39% | | | | 103,050 | | | | — | | | | — | | | | 1.90% | | | | 1.91% | | | | (1.83% | ) | | | 0% | |
Year ended April 30, 2009 | | | 177.90 | | | | 0.30 | | | | (151.98 | ) | | | (151.68 | ) | | | (0.32 | ) | | | — | | | | (2.45 | ) | | | (2.77 | ) | | | 23.45 | | | | (85.09% | ) | | | 44,601 | | | | — | | | | — | | | | 1.82% | | | | 1.75% | | | | 0.41% | | | | 120% | |
Year ended April 30, 2008 | | | 120.80 | | | | 0.90 | | | | 86.60 | | | | 87.50 | | | | (20.30 | ) | | | (10.10 | ) | | | — | | | | (30.40 | ) | | | 177.90 | | | | 79.77% | | | | 283,141 | | | | — | | | | — | | | | 1.64% | | | | 1.67% | | | | 0.57% | | | | 521% | |
| 2 | Net investment income (loss) per share represents net investment income (loss) divided by the daily average shares of beneficial interest outstanding throughout each period. |
| 3 | All returns reflect reinvested dividends, if any, but do not reflect the impact of taxes. |
| 4 | Portfolio turnover is calculated without regard to short-term securities having a maturity of less than one year. Investments in swaps and futures contracts and repurchase agreements are deemed short-term securities. The Fund’s aggressive investment strategy may result in significant portfolio turnover to take advantage of anticipated changes in market conditions. |
| 6 | Represents the period from May 1, 2012 to August 31, 2012. |
| | |
| |
| DIREXION ANNUAL REPORT | | 61 |
Direxion Funds
NOTES TO THE FINANCIAL STATEMENTS
August 31, 2012
Direxion Funds (the “Trust”) was organized as a Massachusetts Business Trust on June 6, 1997 and is registered under the Investment Company Act of 1940, as amended (the “1940 Act”), as an open-end management investment company issuing its shares in series, each series representing a distinct portfolio with its own investment objective and policies. The Trust currently has 23 series, of which 13 are included in this report: Direxion Monthly Small Cap Bull 2X Fund, Direxion Monthly Small Cap Bear 2X Fund, Direxion Monthly 10 Year Note Bull 2X Fund, Direxion Monthly 10 Year Note Bear 2X Fund, Dynamic HY Bond Fund, Direxion Monthly Commodity Bull 2X Fund, Direxion Monthly Emerging Markets Bull 2X Fund, Direxion Monthly China Bull 2X Fund, U.S. Government Money Market Fund, Direxion Monthly NASDAQ-100® Bull 2X Fund, Direxion Monthly S&P 500® Bull 2X Fund, Direxion Monthly S&P 500® Bear 2X Fund, and Direxion Monthly Latin America Bull 2X Fund (each a “Fund” and collectively, the “Funds”). Each Fund (other than the U.S. Government Money Market Fund) is a non-diversified series of the Trust pursuant to the 1940 Act. The 13 Funds included in this report offer only an Investor Class of shares. Effective May 1, 2012, the Direxion Monthly NASDAQ-100® Bull 2X Fund, Direxion Monthly S&P 500® Bull 2X Fund, Direxion Monthly S&P 500® Bear 2X Fund, and Direxion Monthly Latin America Bull 2X Fund fiscal year-end reporting dated moved from April 30 to August 31.
With the exception of the Dynamic HY Bond Fund and U.S. Government Money Market Fund, the Funds’ investment objectives are to seek monthly investment results, before fees and expenses, that correspond to the calendar month performance of a particular index or benchmark. The Funds with the word “Bull” in their name attempt to provide investment results that correlate positively to the return of an index or benchmark. The Funds with the word “Bear” in their name attempt to provide investment results that correlate negatively to the return of an index or benchmark.
| | | | | | |
| Fund | | Index or Benchmark | | Monthly Target | |
Direxion Monthly Small Cap Bull 2X Fund Direxion Monthly Small Cap Bear 2X Fund | | Russell 2000 Index | |
| 200
-200 | %
% |
Direxion Monthly 10 Year Note Bull 2X Fund Direxion Monthly 10 Year Note Bear 2X Fund | | NYSE Current 10-Year Note Treasury Index | |
| 200
-200 | %
% |
Direxion Monthly Commodity Bull 2X Fund | | Morgan Stanley Commodity Related Index | | | 200 | % |
Direxion Monthly Emerging Markets Bull 2X Fund | | MSCI Emerging Markets Index | | | 200 | % |
Direxion Monthly China Bull 2X Fund | | FTSE/Xinhua China 25 Index | | | 200 | % |
Direxion Monthly NASDAQ-100® Bull 2X Fund | | NASDAQ-100® Index | | | 200 | % |
Direxion Monthly S&P 500® Bull 2X Fund Direxion Monthly S&P 500® Bear 2X Fund | | S&P 500® Index | |
| 200
-200 | %
% |
Direxion Monthly Latin America Bull 2X Fund | | S&P® Latin America 40 Index | | | 200 | % |
The Dynamic HY Bond Fund seeks to maximize total return (income plus capital appreciation) by investing primarily in high-yield debt instruments, commonly referred to as “junk bonds”, and derivatives of such instruments, including derivatives that isolate the credit component of such junk bonds and do not provide general interest rate exposure. The U.S. Government Money Market Fund seeks to provide security of principal, current income and liquidity.
| 2. | | SIGNIFICANT ACCOUNTING POLICIES |
The following is a summary of significant accounting policies consistently followed by the Funds in the preparation of their financial statements. These policies are in conformity with U.S. generally accepted accounting principles (“GAAP”).
a) Investment Valuation – The Net Asset Value (“NAV”) of each Fund is determined daily, Monday through Friday, as of the close of regular trading on the New York Stock Exchange (“NYSE”), each day the NYSE is open for business. The value of all portfolio securities and other assets held by a Fund will be determined as of the time a Fund calculates its NAV, 4:00 p.m. Eastern Time (“Valuation Time”). Equity securities, exchange-traded funds and over-the-counter securities are valued at their last sales price, or if not available, at the average of the last bid and ask prices. Securities primarily traded on the NASDAQ
| | |
| | |
| 62 | | DIREXION ANNUAL REPORT |
National Market are valued using the NASDAQ Official Closing Price. Investments in open-end mutual funds are valued at their respective quoted NAV on the valuation dates. Futures contracts are valued at the settlement price established on the exchange on which they are traded, if that settlement price reflects trading prior to the Valuation Time. If the settlement price established by the exchange reflects trading after the Valuation Time, then the last sales price prior to Valuation Time will be used. Swap contracts are valued using the closing price of the underlying reference entity or the closing value of the underlying reference index. Short-term debt securities with an original maturity of 60 days or less and money market securities are valued using the amortized cost method. Other debt securities are valued by using the mean prices provided by the Funds’ pricing service or, if such prices are unavailable, by a matrix pricing method. Securities for which reliable market quotations are not readily available, the Funds’ pricing service does not provide a valuation for such securities, the Funds’ pricing service provides valuation that in the judgment of Rafferty Asset Management, LLC (the “Adviser”) does not represent fair value, or the Fund or Adviser believes the market price is stale are fair valued as determined by the Adviser under the supervision of the Board of Trustees. Additionally, the Adviser will monitor developments in the marketplace for significant events that may affect the value of those securities whose closing prices were established before the Valuation Time.
b) Repurchase Agreements – Each Fund may enter into repurchase agreements with institutions that are members of the Federal Reserve System or securities dealers who are members of a national securities exchange or are primary dealers in U.S. government securities. In connection with transactions in repurchase agreements, it is the Trust’s policy that the Fund receives, as collateral, cash and/or securities (primarily U.S. government securities) whose fair value, including accrued interest, at all times will be at least equal to 100% of the amount invested by the Fund in each repurchase agreement including accrued interest. If the seller defaults, and the value of the collateral declines, realization of the collateral by the Fund may be delayed or limited. The Funds follow authoritative standards of accounting for repurchase agreements, which modify the criteria for determining effective control of transferred assets and as a result certain repurchase agreements may now be accounted for as secured borrowings. During the period ended August 31, 2012, the Funds did not enter into transactions that were deemed secured borrowings. The Funds were not invested in repurchase agreements at August 31, 2012.
c) Swap Contracts – Each Fund, other than the U.S. Government Money Market Fund, may enter into equity swap contacts. Standard equity swap contracts are between two parties that agree to exchange the returns (or differentials in rates of return) earned or realized on particular predetermined investments or instruments. The gross amount to be exchanged is calculated with respect to a “notional amount” (i.e. the return on or increase in value of a particular dollar amount invested in a “basket” of securities representing a particular index or industry sector). The Funds enter into master netting agreements with the counterparty. These agreements calculate the obligations of the parties on a “net basis”. Consequently, a Fund’s current obligations under a swap agreement generally will be equal to the net amount to be paid or received under the agreement based on the relative value of the positions held by each party. The Fund’s obligations are accrued daily and offset by any amounts owed to the Fund. However, the Funds do not offset the fair value amounts of the swap contract and the related collateral on the Statement of Assets and Liabilities arising from swap contracts executed with the same counterparty under such master netting agreements.
In a “long” equity swap agreement, the counterparty will generally agree to pay the Fund the amount, if any, by which the notional amount of the swap contract would have increased in value if the Fund had been invested in the particular securities, plus dividends that would have been received on those securities. The Fund will agree to pay the counterparty a floating rate of interest on the notional amount of the swap contract plus the amount, if any, by which the notional amount would have decreased in value had it been invested in such securities plus, in certain instances, commissions or trading spreads on the notional amounts. Thus, the return on the swap contract should be the gain or loss on the notional amount plus dividends on the securities less the interest paid by the Fund on the notional amount. However, in certain instances, market factors such as the interest rate environment and the demand to borrow the securities underlying the swap agreement can cause a scenario in which the counterparty will pay the Fund interest. Payments may be made at the conclusion of the contract or periodically during its term. Swap contracts do not include the delivery of securities. The net amount of the excess, if any, of the Fund’s obligations over its entitlement with respect to each swap is accrued on a daily basis and an amount of cash or liquid assets, having an aggregate net asset value at least equal to such accrued excess is maintained in a segregated account. Until a swap contract is settled in cash, the gain or loss on the notional amount plus dividends on the securities less the interest paid by the Fund on the notional amount are recorded as “unrealized gains or losses on swaps” and when cash is exchanged, the gain or loss is recorded as “realized gains or losses on swaps”.
Each Fund, other than the U.S. Government Money Market Fund, may enter into swap contracts that provide the opposite return of the particular benchmark or security (“short” the index or security). The operations are similar to that of the swaps disclosed above except that the counterparty pays interest to the Fund on the notional amount outstanding and the dividends on the
| | |
| |
| DIREXION ANNUAL REPORT | | 63 |
underlying securities reduce the return of the swap. However, in certain instances, market factors such as the interest rate environment and the demand to borrow the securities underlying the swap agreement can cause a scenario in which the Fund pays the counterparty interest. These amounts are netted with any unrealized appreciation or depreciation to determine the value of the swap. The Funds will typically enter into equity swap agreements to obtain leverage in order to meet their objectives.
The Funds collateralize swap agreements with cash and certain securities as indicated on the Schedule of Investments of each of the Funds, respectively. Such collateral is held for the benefit of the counterparty in a segregated account at the Custodian to protect the counterparty against non-payment by a Fund. The Funds do not net collateral on the Statements of Assets and Liabilities. In the event of a default by the counterparty, the Funds will seek return of this collateral and may incur certain costs exercising their rights with respect to the collateral. Amounts expected to be owed to the Funds are collateralized daily directly to Funds while amounts expected to be owed to the counterparty are collateralized daily in a segregated account at the Custodian.
In the event of the counterparty’s default, bankruptcy or any other event for which the counterparty can not meet its obligations, a Fund bears the risk of loss equal to the amount of the daily appreciation owed to the Fund. This obligation represents the daily gain accrued to the Fund from the close of business day prior to this event to the day on which this event occurs and the counterparty can no longer meet its obligations. A Fund will enter into swap agreements only with large, well-capitalized and established financial institutions. The creditworthiness of each of the firms that is a party to a swap agreement is monitored by the Adviser. Shareholders may obtain swap counterparty financial statements at www.sec.gov. Swap contracts are subject to credit risk. Credit risk is where the financial condition of an issuer of a security or instrument may cause it to default or become unable to pay interest or principal due on the security. The counterparty to a swap contract might default on its obligations. In addition, the Funds have agreements with certain counterparties with which it trades swap contracts that contain credit risk-related contingent features that could be triggered subject to certain circumstances. Such circumstances include agreed upon net asset value and performance-based thresholds. The maximum exposure to the Fund in regard to potential counterparty default and credit-risk related contingent features at August 31, 2012 is as follows:
| | | | | | | | | | | | | | | | | | | | | | | | |
| | | Direxion Monthly Small Cap Bull 2X Fund | | | Direxion Monthly Small Cap Bear 2X Fund | |
Counterparty | | Fair Value of
Swap Contracts | | | Collateral for
Swap Contracts | | | Maximum Credit
Risk Exposure | | | Fair Value of
Swap Contracts | | | Collateral for
Swap Contracts | | | Maximum Credit
Risk Exposure | |
Credit Suisse Capital, LLC | | $ | 106,005 | | | $ | 1,620,000 | | | $ | 1,726,005 | | | $ | (1,065,026 | ) | | $ | 6,090,000 | | | $ | 5,024,974 | |
| | | | | | | | | | | | | | | | | | | | | | | | |
| | | | | | | | | | | | | | | | | | | | | | | | |
| | | Direxion Monthly 10 Year Note Bull 2X Fund | | | Direxion Monthly 10 Year Note Bear 2X Fund | |
Counterparty | | Fair Value of
Swap Contracts | | | Collateral for
Swap Contracts | | | Maximum Credit
Risk Exposure | | | Fair Value of
Swap Contracts | | | Collateral for
Swap Contracts | | | Maximum Credit
Risk Exposure | |
Credit Suisse Capital, LLC | | $ | 442,436 | | | $ | 11,080,000 | | | $ | 11,522,436 | | | $ | (155,221 | ) | | $ | 4,385,000 | | | $ | 4,229,779 | |
| | | | | | | | | | | | | | | | | | | | | | | | |
| | | | | | | | | | | | | | | | | | | | | | | | |
| | | Dynamic HY Bond Fund | | | Direxion Monthly Commodity Bull 2X Fund | |
Counterparty | | Fair Value of
Swap Contracts | | | Collateral for
Swap Contracts | | | Maximum Credit
Risk Exposure | | | Fair Value of
Swap Contracts | | | Collateral for
Swap Contracts | | | Maximum Credit
Risk Exposure | |
Bank of America Merrill Lynch | | $ | — | | | $ | — | | | $ | — | | | $ | (387,872 | ) | | $ | 6,540,000 | | | $ | 6,152,128 | |
| | | | | | | | | | | | | | | | | | | | | | | | |
| | | | | | | | | | | | | | | | | | | | | | | | |
| | | Direxion Monthly Emerging Markets Bull
2X Fund | | | Direxion Monthly China Bull 2X Fund | |
Counterparty | | Fair Value of
Swap Contracts | | | Collateral for
Swap Contracts | | | Maximum Credit
Risk Exposure | | | Fair Value of
Swap Contracts | | | Collateral for
Swap Contracts | | | Maximum Credit
Risk Exposure | |
Bank of America Merrill Lynch | | $ | (1,403,243 | ) | | $ | 19,020,000 | | | $ | 17,616,757 | | | $ | — | | | $ | — | | | $ | — | |
Credit Suisse Capital, LLC | | | — | | | | — | | | | — | | | | (462,066 | ) | | | 3,950,000 | | | | 3,487,934 | |
| | | | | | | | | | | | | | | | | | | | | | | | |
Total | | $ | (1,403,243 | ) | | $ | 19,020,000 | | | $ | 17,616,757 | | | $ | (462,066 | ) | | $ | 3,950,000 | | | $ | 3,487,934 | |
| | | | | | | | | | | | | | | | | | | | | | | | |
| | | | | | | | | | | | | | | | | | | | | | | | |
| | | Direxion Monthly NASDAQ-100® Bull 2X Fund | | | Direxion Monthly S&P 500® Bull 2X Fund | |
Counterparty | | Fair Value of
Swap Contracts | | | Collateral for
Swap Contracts | | | Maximum Credit
Risk Exposure | | | Fair Value of
Swap Contracts | | | Collateral for
Swap Contracts | | | Maximum Credit
Risk Exposure | |
Credit Suisse Capital, LLC | | $ | 107,415 | | | $ | 5,810,000 | | | $ | 5,917,415 | | | $ | 146,290 | | | $ | 3,610,000 | | | $ | 3,756,290 | |
| | | | | | | | | | | | | | | | | | | | | | | | |
| | |
| | |
| 64 | | DIREXION ANNUAL REPORT |
| | | | | | | | | | | | | | | | | | | | | | | | |
| | | Direxion Monthly S&P 500® Bear 2X Fund | | | Direxion Monthly Latin America Bull 2X Fund | |
Counterparty | | Fair Value of
Swap Contracts | | | Collateral for
Swap Contracts | | | Maximum Credit
Risk Exposure | | | Fair Value of
Swap Contracts | | | Collateral for
Swap Contracts | | | Maximum Credit
Risk Exposure | |
Bank of America Merrill Lynch | | $ | — | | | $ | — | | | $ | — | | | $ | (7,019,547 | ) | | $ | 15,310,000 | | | $ | 8,290,453 | |
Credit Suisse Capital, LLC | | | (315,294 | ) | | | 2,560,000 | | | | 2,244,706 | | | | — | | | | — | | | | — | |
| | | | | | | | | | | | | | | | | | | | | | | | |
Total | | $ | (315,294 | ) | | $ | 2,560,000 | | | $ | 2,244,706 | | | $ | (7,019,547 | ) | | $ | 15,310,000 | | | $ | 8,290,453 | |
| | | | | | | | | | | | | | | | | | | | | | | | |
d) Short Positions – The Direxion Monthly Small Cap Bear 2X Fund, Direxion Monthly 10 Year Note Bear 2X Fund, Dynamic HY Bond Fund, and Direxion Monthly S&P 500® Bear 2X Fund may engage in short sale transactions. The Direxion Monthly Small Cap Bull 2X Fund can only engage in short sales “against the box”. In this instance a security can only be sold short if a long position is held on the same security. For financial statement purposes, an amount equal to the settlement amount is included in the Statement of Assets and Liabilities as an asset and an equivalent liability. The amount of the liability is subsequently marked-to-market to reflect the current value of the short position. Subsequent fluctuations in the market prices of short securities may require purchasing the securities at prices which may differ from the market value reflected on the Statement of Assets and Liabilities. The Fund is liable to the buyer for any dividends payable on securities while those securities are in a short position. As collateral for its short positions, the Fund is required under the 1940 Act to maintain assets consisting of cash, cash equivalents or liquid securities equal to the market value of the securities sold short. This collateral is required to be adjusted daily. The Funds held no securities sold short at August 31, 2012.
e) Stock Index Futures Contracts and Options on Futures Contracts – Each Fund, other than the U.S. Government Money Market Fund, may purchase and sell stock index futures contracts and options on such futures contracts. A Fund may use futures contracts to gain exposure to, or hedge against changes in the values of equities, interest rates or foreign currencies. Upon entering into a contract, the Fund deposits and maintains as collateral such initial margin as required by the exchange on which the transaction is effected. Pursuant to the contract, the Fund agrees to receive from or pay to the broker an amount of cash equal to the daily fluctuation in value of the contract. Such receipts or payments are known as “variation margin” and are recorded by the Fund as unrealized gains and losses. When the contract is closed, the Fund records a realized gain or loss equal to the difference between the value of the contract at the time it was opened and the value at the time it was closed. As collateral for futures contracts, the Fund is required under the 1940 Act to maintain assets consisting of cash, cash equivalents or liquid securities. This collateral is required to be adjusted daily to reflect the market value of the purchase obligation for long futures contracts or the market value of the instrument underlying the contract, but not less than the market price at which the futures contract was established, for short futures contracts. The Funds were not invested in futures contracts at August 31, 2012.
f) Risks of Options, Futures Contracts, Options on Futures Contracts and Short Positions – The risks inherent in the use of options, futures contracts, options on futures contracts and short positions include 1) adverse changes in the value of such instruments; 2) imperfect correlation between the price of options and futures contracts and options thereon and movements in the price of the underlying securities, index or futures contracts; 3) the possible absence of a liquid secondary market for any particular instrument at any time; 4) the possible need to defer closing out certain positions to avoid adverse tax consequences; and 5) the possible nonperformance by the counterparty under the terms of the contract. The Funds designate cash, cash equivalents and liquid securities as collateral for written options, futures contracts, options on futures contracts and short positions. The Funds were not invested in options, futures contracts, or options on futures contracts at August 31, 2012.
g) Risks of Investing in Foreign Securities – Investments in foreign securities involve greater risks than investing in domestic securities. As a result, the Funds’ returns and net asset values may be affected to a large degree by fluctuations in currency exchange rates, political, diplomatic or economic conditions and regulatory requirements in other countries. The laws and accounting, auditing, and financial reporting standards in foreign countries typically are not as strict as they are in the U.S., and there may be less public information available about foreign companies. Investments in foreign emerging markets present a greater risk than investing in foreign issuers in general. The risk of political or social upheaval is greater in emerging markets. In addition, there may be risks of an economy’s dependence on revenues from particular commodities, currency transfer restrictions, a limited number of buyers for such securities and delays and disruptions in securities settlement procedures.
h) Security Transactions – Investment transactions are recorded on trade date. The Funds determine the gain or loss realized from investment transactions by comparing the identified cost, which is the same basis used for federal income tax purposes, with the net sales proceeds.
| | |
| |
| DIREXION ANNUAL REPORT | | 65 |
i) Federal Income Taxes – Each Fund intends to comply with the requirements of Subchapter M of the Internal Revenue Code necessary to qualify as a regulated investment company and to make the requisite distributions of income and capital gains to its shareholders sufficient to relieve it from all or substantially all federal income taxes and excise taxes. No provision for federal income taxes has been made.
j) Income and Expenses – Dividend income is recorded on the ex-dividend date. Interest income, including amortization of premium and discount, and dividends received from money market funds, is recognized on an accrual basis. Expenses are charged to the Funds daily. Expenses are computed based on each Fund’s respective daily net assets. For additional discussion on expenses refer to Note 4.
k) Distributions to Shareholders – Each Fund, other than the U.S. Government Money Market Fund, generally pays dividends from net investment income and distributes net realized capital gains, if any, at least annually. The U.S. Government Money Market Fund ordinarily will declare dividends from net investment income on a daily basis and distribute those dividends monthly. Income and capital gain distributions are determined in accordance with income tax regulations, which may differ from GAAP. Certain Funds also utilize earnings and profits distributed to shareholders on redemptions of shares as part of the dividends paid deduction. Distributions to shareholders are recorded on the ex-dividend date.
The tax character of distributions during the period ended August 31, 2012 and the years ended August 31, 2011 and April 30, 2012 were as follows:
| | | | | | | | | | | | | | | | | | | | | | | | |
| | | Direxion Monthly Small Cap
Bull 2X Fund | | | Direxion Monthly Small Cap
Bear 2X Fund | | | Direxion Monthly 10 Year Note
Bull 2X Fund | |
| | | Year Ended
August 31,
2012 | | | Year Ended
August 31,
2011 | | | Year Ended
August 31,
2012 | | | Year Ended
August 31,
2011 | | | Year Ended
August 31,
2012 | | | Year Ended
August 31,
2011 | |
Distributions paid from: | | | | | | | | | | | | | | | | | | | | | | | | |
Ordinary Income | | | $— | | | | $— | | | | $— | | | | $— | | | | $39,145 | | | | $1,824,320 | |
Long-term capital gains | | | — | | | | — | | | | — | | | | — | | | | — | | | | 41,945 | |
Return of capital | | | — | | | | — | | | | — | | | | — | | | | — | | | | — | |
| | | | | | | | | | | | | | | | | | | | | | | | |
Total distributions paid | | | $— | | | | $— | | | | $— | | | | $— | | | | $39,145 | | | | $1,866,265 | |
| | | | | | | | | | | | | | | | | | | | | | | | |
| | | |
| | | Direxion Monthly 10 Year Note
Bear 2X Fund | | | Dynamic HY Bond
Fund | | | Direxion Monthly Commodity
Bull 2X Fund | |
| | | Year Ended
August 31,
2012 | | | Year Ended
August 31,
2011 | | | Year Ended
August 31,
2012 | | | Year Ended
August 31,
2011 | | | Year Ended
August 31,
2012 | | | Year Ended
August 31,
2011 | |
Distributions paid from: | | | | | | | | | | | | | | | | | | | | | | | | |
Ordinary Income | | | $— | | | | $— | | | | $7,997,506 | | | | $5,101,501 | | | | $— | | | | $— | |
Long-term capital gains | | | — | | | | — | | | | — | | | | — | | | | — | | | | — | |
Return of capital | | | — | | | | — | | | | — | | | | — | | | | — | | | | — | |
| | | | | | | | | | | | | | | | | | | | | | | | |
Total distributions paid | | | $— | | | | $— | | | | $7,997,506 | | | | $5,101,501 | | | | $— | | | | $— | |
| | | | | | | | | | | | | | | | | | | | | | | | |
| | | |
| | | Direxion Monthly Emerging Markets
Bull 2X Fund | | | Direxion Monthly China
Bull 2X Fund | | | U.S. Government Money
Market Fund | |
| | | Year Ended
August 31,
2012 | | | Year Ended
August 31,
2011 | | | Year Ended
August 31,
2012 | | | Year Ended
August 31,
2011 | | | Year Ended
August 31,
2012 | | | Year Ended
August 31,
2011 | |
Distributions paid from: | | | | | | | | | | | | | | | | | | | | | | | | |
Ordinary Income | | | $— | | | | $— | | | | $— | | | | $— | | | | $15,801 | | | | $32,003 | |
Long-term capital gains | | | — | | | | — | | | | — | | | | — | | | | — | | | | — | |
Return of capital | | | — | | | | — | | | | — | | | | — | | | | — | | | | — | |
| | | | | | | | | | | | | | | | | | | | | | | | |
Total distributions paid | | | $— | | | | $— | | | | $— | | | | $— | | | | $15,801 | | | | $32,003 | |
| | | | | | | | | | | | | | | | | | | | | | | | |
| | |
| | |
| 66 | | DIREXION ANNUAL REPORT |
| | | | | | | | | | | | | | | | |
| | |
| | | Direxion Monthly NASDAQ-100®
Bull 2X Fund | | | Direxion Monthly S&P 500®
Bull 2X Fund | |
| | | Period Ended
August 31,
20121 | | | Year Ended
April 30,
2012 | | | Period Ended
August 31,
20121 | | | Year Ended
April 30,
2012 | |
Distributions paid from: | | | | | | | | | | | | | | | | |
Ordinary Income | | $ | — | | | $ | — | | | $ | — | | | $ | 1,704,431 | |
Long-term capital gains | | | — | | | | — | | | | — | | | | — | |
Return of capital | | | — | | | | — | | | | — | | | | — | |
| | | | | | | | | | | | | | | | |
Total distributions paid | | $ | — | | | $ | — | | | $ | — | | | $ | 1,704,431 | |
| | | | | | | | | | | | | | | | |
| | |
| | | Direxion Monthly S&P 500®
Bear 2X Fund | | | Direxion Monthly Latin America
Bull 2X Fund | |
| | | Period Ended
August 31,
20121 | | | Year Ended
April 30,
2012 | | | Period Ended
August 31,
20121 | | | Year Ended
April 30,
2012 | |
Distributions paid from: | | | | | | | | | | | | | | | | |
Ordinary Income | | $ | — | | | $ | — | | | $ | — | | | | $— | |
Long-term capital gains | | | — | | | | — | | | | — | | | | — | |
Return of capital | | | — | | | | — | | | | — | | | | — | |
| | | | | | | | | | | | | | | | |
Total distributions paid | | $ | — | | | $ | — | | | $ | — | | | | $— | |
| | | | | | | | | | | | | | | | |
| 1 | Effective May 1, 2012, the Fund’s fiscal year end changed from April 30 to August 31. |
The Funds are designating as long-term capital gain dividends, pursuant to Internal Revenue Code Section 852(b)(3), the amount necessary to reduce the earnings and profits of the Fund related to net capital gain to zero for the tax year ended August 31, 2012. To the extent necessary to fully distribute such capital gains, the Funds also designate earnings and profits distributed to shareholders on the redemption of shares.
As of August 31, 2012, the components of distributable earnings of the Funds on a tax basis were as follows:
| | | | | | | | | | | | | | | | | | | | |
| | | Direxion Monthly
Small Cap Bull
2X Fund | | | Direxion Monthly
Small Cap Bear
2X Fund | | | Direxion Monthly
10 Year Note Bull
2X Fund | | | Direxion Monthly
10 Year Note Bear
2X Fund | | | Dynamic
HY Bond
Fund | |
Tax cost of investments | | $ | — | | | $ | — | | | $ | — | | | $ | — | | | $ | 79,667,472 | |
Gross unrealized appreciation | | | — | | | | — | | | | — | | | | — | | | | 2,767,496 | |
Gross unrealized depreciation | | | — | | | | — | | | | — | | | | — | | | | (1,646,785 | ) |
| | | | | | | | | | | | | | | | | | | | |
Net unrealized appreciation/(depreciation) | | $ | — | | | $ | — | | | $ | — | | | $ | — | | | $ | 1,120,711 | |
| | | | | | | | | | | | | | | | | | | | |
Undistributed ordinary income | | | — | | | | — | | | | 880,073 | | | | — | | | | 1,162,413 | |
Undistributed long-term capital gain | | | — | | | | — | | | | 105,895 | | | | — | | | | — | |
| | | | | | | | | | | | | | | | | | | | |
Total distributable earnings | | | — | | | | — | | | | 985,968 | | | | — | | | | 1,162,413 | |
| | | | | | | | | | | | | | | | | | | | |
Other accumulated loss | | | (5,415,700 | ) | | | (44,695,489 | ) | | | (280,772 | ) | | | (23,304,552 | ) | | | (14,740,578 | ) |
| | | | | | | | | | | | | | | | | | | | |
Total accumulated earnings/(loss) | | $ | (5,415,700 | ) | | $ | (44,695,489 | ) | | $ | 705,196 | | | $ | (23,304,552 | ) | | $ | (12,457,454 | ) |
| | | | | | | | | | | | | | | | | | | | |
| | |
| |
| DIREXION ANNUAL REPORT | | 67 |
| | | | | | | | | | | | | | | | | | | | |
| | | Direxion Monthly
Commodity Bull
2X Fund | | | Direxion Monthly
Emerging Markets Bull
2X Fund | | | Direxion Monthly
China Bull
2X Fund | | | U.S. Government
Money Market Fund | | | Direxion Monthly
NASDAQ-100® Bull
2X Fund | |
Tax cost of investments | | $ | — | | | $ | — | | | $ | — | | | $ | 17,829,834 | | | $ | — | |
Gross unrealized appreciation | | | — | | | | — | | | | — | | | | — | | | | — | |
Gross unrealized depreciation | | | — | | | | — | | | | — | | | | — | | | | — | |
| | | | | | | | | | | | | | | | | | | | |
Net unrealized appreciation/(depreciation) | | $ | — | | | $ | — | | | $ | — | | | $ | — | | | $ | — | |
| | | | | | | | | | | | | | | | | | | | |
Undistributed ordinary income | | | — | | | | — | | | | — | | | | 20 | | | | — | |
Undistributed long-term
capital gain | | | — | | | | — | | | | — | | | | — | | | | — | |
| | | | | | | | | | | | | | | | | | | | |
Total distributable earnings | | | — | | | | — | | | | — | | | | 20 | | | | — | |
| | | | | | | | | | | | | | | | | | | | |
Other accumulated loss | | | (28,932,662 | ) | | | (36,767,290 | ) | | | (11,190,117 | ) | | | (627 | ) | | | (9,841,083 | ) |
| | | | | | | | | | | | | | | | | | | | |
Total accumulated
earnings/(loss) | | $ | (28,932,662 | ) | | $ | (36,767,290 | ) | | $ | (11,190,117 | ) | | $ | (607 | ) | | $ | (9,841,083 | ) |
| | | | | | | | | | | | | | | | | | | | |
| | | | | |
| | | | | | | | | Direxion Monthly
S&P 500® Bull
2X Fund | | | Direxion Monthly
S&P 500® Bear 2X
Fund | | | Direxion Monthly
Latin America Bull
2X Fund | |
Tax cost of investments | | | | | | | | | | $ | — | | | $ | — | | | $ | — | |
Gross unrealized appreciation | | | | | | | | — | | | | — | | | | — | |
Gross unrealized depreciation | | | | | | | | — | | | | — | | | | — | |
| | | | | | | | | | | | | | | | | | | | |
Net unrealized appreciation/(depreciation) | | | | | | | $ | — | | | $ | — | | | $ | — | |
| | | | | | | | | | | | | | | | | | | | |
Undistributed ordinary income | | | | | | | | 205,543 | | | | — | | | | — | |
Undistributed long-term capital gain | | | | | | | | 63,323 | | | | — | | | | — | |
| | | | | | | | | | | | | | | | | | | | |
Total distributable earnings | | | | | | | | 268,866 | | | | — | | | | — | |
| | | | | | | | | | | | | | | | | | | | |
Other accumulated loss | | | | | | | | (1,434,116 | ) | | | (47,011,953 | ) | | | (178,530,159 | ) |
| | | | | | | | | | | | | | | | | | | | |
Total accumulated earnings/(loss) | | | | | | | $ | (1,165,250 | ) | | $ | (47,011,953 | ) | | $ | (178,530,159 | ) |
| | | | | | | | | | | | | | | | | | | | |
The difference between book cost of investments and tax cost of investments is attributable primarily to the tax deferral of losses on wash sales. Other accumulated gain/ (loss) is generally comprised of capital loss carryforwards, qualified late year loss deferrals and/or unrealized gain/ (loss) on derivative positions.
On the Statement of Assets and Liabilities, the following adjustments were made for permanent tax differences between accounting for net investment income and realized gains and losses under GAAP and tax reporting:
| | | | | | | | | | | | |
| | | Net Investment
Income | | | Realized
Gain (Loss) | | | Capital
Stock | |
Direxion Monthly Small Cap Bull 2X Fund | | | 54,160 | | | | — | | | | (54,160 | ) |
Direxion Monthly Small Cap Bear 2X Fund | | | 53,923 | | | | 8,346,591 | | | | (8,400,514 | ) |
Direxion Monthly 10 Year Note Bull 2X Fund | | | 887,596 | | | | (2,973,034 | ) | | | 2,085,438 | |
Direxion Monthly 10 Year Note Bear 2X Fund | | | 152,301 | | | | — | | | | (152,301 | ) |
Dynamic HY Bond Fund | | | 17,211 | | | | (17,211 | ) | | | — | |
Direxion Monthly Commodity Bull 2X Fund | | | 122,410 | | | | — | | | | (122,410 | ) |
Direxion Monthly Emerging Markets Bull 2X Fund | | | 93,260 | | | | — | | | | (93,260 | ) |
Direxion Monthly China Bull 2X Fund | | | 39,760 | | | | — | | | | (39,760 | ) |
U.S. Government Money Market Fund | | | 20 | | | | — | | | | (20 | ) |
Direxion Monthly NASDAQ-100® Bull 2X Fund | | | 290,678 | | | | — | | | | (290,678 | ) |
Direxion Monthly S&P 500® Bull 2X Fund | | | 198,185 | | | | (249,602 | ) | | | 51,417 | |
Direxion Monthly S&P 500® Bear 2X Fund | | | 172,119 | | | | — | | | | (172,119 | ) |
Direxion Monthly Latin America Bull 2X Fund | | | 401,849 | | | | — | | | | (401,849 | ) |
| | |
| | |
| 68 | | DIREXION ANNUAL REPORT |
Net investment income and realized gains and losses for federal income tax purposes may differ from that reported on the financial statements because of permanent book-to-tax differences. GAAP requires that permanent differences in net investment income and realized gains and losses due to differences between financial reporting and tax reporting be reclassified between various components of net assets. The permanent differences primarily relate to net operating losses, excise taxes, expired capital loss carryforwards and dividends on redemption adjustments with differing book and tax methods.
In order to meet certain excise tax distribution requirements, the Funds are required to measure and distribute annually, net capital gains realized during a twelve month period ending October 31 and net investment income earned during a twelve month period ending December 31. In connection with this, the Funds are permitted for tax purposes to defer into their next fiscal year qualified late year losses. Qualified late year capital losses are any net capital losses incurred between November 1 and the end of their fiscal year, August 31, 2012. Qualified late year ordinary losses are specified losses generally incurred between January 1 and the end of their fiscal year, August 31, 2012.
At August 31, 2012, the following Funds deferred, on a tax basis, qualified late year losses of:
| | | | | | | | |
| | | Late Year
Ordinary Losses | | | Post-October
Capital Losses | |
Direxion Monthly Small Cap Bull 2X Fund | | $ | (115,411 | ) | | $ | (1,992,133 | ) |
Direxion Monthly Small Cap Bear 2X Fund | | | (202,072 | ) | | | — | |
Direxion Monthly 10 Year Note Bull 2X Fund | | | — | | | | — | |
Direxion Monthly 10 Year Note Bear 2X Fund | | | (352,491 | ) | | | (17,034,616 | ) |
Dynamic HY Bond Fund | | | — | | | | (5,304,568 | ) |
Direxion Monthly Commodity Bull 2X Fund | | | (219,175 | ) | | | (1,578,415 | ) |
Direxion Monthly Emerging Markets Bull 2X Fund | | | (271,151 | ) | | | (7,564,290 | ) |
Direxion Monthly China Bull 2X Fund | | | (82,222 | ) | | | (2,340,684 | ) |
U.S. Government Money Market Fund | | | — | | | | — | |
Direxion Monthly NASDAQ-100® Bull 2X Fund | | | — | | | | — | |
Direxion Monthly S&P 500® Bull 2X Fund | | | — | | | | — | |
Direxion Monthly S&P 500® Bear 2X Fund | | | — | | | | — | |
Direxion Monthly Latin America Bull 2X Fund | | | — | | | | — | |
Under current law, the Funds may carry forward net capital losses indefinitely to use to offset capital gains realized in future years. Previous law limited the carry forward of capital losses to the eight tax years following the year the capital loss was realized. If a Fund has capital losses that are subject to current law and also has capital losses subject to prior law, the losses realized under current law will be utilized to offset capital gains before any of the losses governed by prior law can be used. As a result of these ordering rules, capital losses realized under previous law may be more likely to expire unused. Capital losses realized under current law will carry forward retaining their classification as long-term or short-term losses; as compared to under prior law in which all capital losses were carried forward as short term capital losses.
| | |
| |
| DIREXION ANNUAL REPORT | | 69 |
At August 31, 2012, the following Funds had capital loss carryforwards on a tax basis of:
| | | | | | | | | | | | | | | | | | | | | | | | | | | | | | | | | | | | |
| | | Capital Losses Expiring | |
| | | 8/31/2013 | | | 8/31/2014 | | | 8/31/2015 | | | 8/31/2016 | | | 8/31/2017 | | | 8/31/2018 | | | 8/31/2019 | | | Unlimited ST | | | Unlimited LT | |
Direxion Monthly Small Cap Bull 2X Fund | | $ | — | | | $ | — | | | $ | — | | | $ | — | | | $ | — | | | $ | — | | | $ | — | | | $ | — | | | $ | — | |
Direxion Monthly Small Cap Bear 2X Fund | | | (4,667,388 | ) | | | (883,969 | ) | | | (5,310,686 | ) | | | (6,570,886 | ) | | | — | | | | (3,873,693 | ) | | | (5,087,146 | ) | | | (9,582,083 | ) | | | — | |
Direxion Monthly 10 Year Note Bull 2X Fund | | | — | | | | — | | | | — | | | | — | | | | — | | | | — | | | | — | | | | — | | | | — | |
Direxion Monthly 10 Year Note Bear 2X Fund | | | — | | | | — | | | | — | | | | (941,855 | ) | | | (2,717,991 | ) | | | (1,976,123 | ) | | | — | | | | (4,822 | ) | | | — | |
Dynamic HY Bond Fund | | | — | | | | — | | | | — | | | | — | | | | — | | | | — | | | | — | | | | (9,436,010 | ) | | | — | |
Direxion Monthly Commodity Bull 2X Fund | | | — | | | | — | | | | — | | | | — | | | | — | | | | (9,895,898 | ) | | | — | | | | (4,695,573 | ) | | | (1,656,463 | ) |
Direxion Monthly Emerging Markets Bull 2X Fund | | | — | | | | — | | | | — | | | | — | | | | (6,688,903 | ) | | | (1,727,140 | ) | | | — | | | | — | | | | (9,956,231 | ) |
Direxion Monthly China Bull 2X Fund | | | — | | | | — | | | | — | | | | — | | | | (1,208,734 | ) | | | — | | | | — | | | | — | | | | — | |
U.S. Government Money Market Fund | | | (189 | ) | | | (356 | ) | | | (82 | ) | | | — | | | | — | | | | — | | | | — | | | | — | | | | — | |
Direxion Monthly NASDAQ-100® Bull 2X Fund | | | — | | | | — | | | | — | | | | (9,634,901 | ) | | | — | | | | — | | | | — | | | | — | | | | — | |
Direxion Monthly S&P 500® Bull 2X Fund | | | — | | | | — | | | | — | | | | — | | | | — | | | | — | | | | — | | | | — | | | | — | |
Direxion Monthly S&P 500® Bear 2X Fund | | | — | | | | — | | | | — | | | | — | | | | (18,781,801 | ) | | | (4,649,215 | ) | | | — | | | | (17,154,960 | ) | | | — | |
Direxion Monthly Latin America Bull 2X Fund | | | — | | | | — | | | | — | | | | — | | | | (148,741,363 | ) | | | — | | | | — | | | | (8,283,569 | ) | | | (5,250,738 | ) |
| | | | | | | | | |
| | | | | | | | | | | | | | | | | | | | | | | | | | | 8/31/2012 | |
Capital Loss Utilized: | | | | | | | | | | | | | | | | | | | | | | | | | | | | | | | | | | | | |
Direxion Monthly Small Cap Bull 2X Fund | | | | | | | | | | | | | | | | | | | | | | | | | | | | | | | | | | $ | 310,769 | |
Direxion Monthly NASDAQ-100® Bull 2X Fund | | | | | | | | | | | | | | | | | | | | | | | | | | | | | | | | | | | 537,707 | |
Direxion Monthly Latin America Bull 2X Fund | | | | | | | | | | | | | | | | | | | | | | | | | | | | | | | | | | | 816,372 | |
| | | | | | | | | |
Capital Loss Expired: | | | | | | | | | | | | | | | | | | | | | | | | | | | | | | | | | | | | |
Direxion Monthly Small Cap Bear 2X Fund | | | | | | | | | | | | | | | | | | | | | | | | | | | | | | | | | | $ | 8,346,591 | |
To the extent that the Funds realize future net capital gains, those gains will be offset by any unused capital loss carryover.
The Funds follow authoritative financial reporting rules regarding recognition and measurement of tax positions taken or expected to be taken on a tax return. The Funds have reviewed all open tax years and concluded that there is no effect to the Funds’ financial positions or results of operations and no tax liability resulting from unrecognized tax benefits relating to uncertain income tax position taken or expected to be taken on a tax return. Open tax years are those years that are open for examination by the relevant income taxing authority. As of August 31, 2012, open Federal and state income tax years include the tax years ended August 2009 to August 2012 and April 2009 to April 2012. The Funds have no examination in progress. The Funds are also not aware of any tax positions for which it is reasonably possible that the total amounts of unrecognized tax expense will significantly change in the next twelve months.
l) Guarantees and Indemnifications – In the ordinary course of business, the Funds enter into contracts that contain a variety of indemnification provisions pursuant to which the Funds agree to indemnify third parties upon occurrence of specified events. The Fund’s maximum exposure relating to these indemnification agreements is unknown. However, the Funds have not had prior claims or losses in connection with these provisions and believe the risk of loss is remote.
| | |
| | |
| 70 | | DIREXION ANNUAL REPORT |
m) Use of Estimates – The preparation of financial statements in conformity with GAAP requires management to make estimates and assumptions that affect the reported amounts of assets and liabilities and disclosure of contingent assets and liabilities at the date of the financial statements and the reported amounts of revenues and expenses during the reporting period. Actual results could differ from those estimates.
| 3. | | INVESTMENT TRANSACTIONS |
During the year ended August 31, 2012, the aggregate purchases and sales of investments (excluding short-term investments, swaps and futures contracts) in the Dynamic HY Bond Fund were $950,920,616 and $870,234,268, respectively. There were no purchases and sales as defined above in any of the other Funds.
There were no purchases or sales of long-term U.S. government securities in the Funds during the year ended August 31, 2012.
| 4. | | INVESTMENT ADVISORY AND OTHER AGREEMENTS |
Investment Advisory Agreement: The Funds have entered into an investment advisory agreement with the Adviser. The Adviser earns a fee, computed daily and payable monthly, applied to each Fund’s average daily net assets at the annual rates presented below:
| | | | |
Direxion Monthly Small Cap Bull 2X Fund | | | 0.75 | % |
Direxion Monthly Small Cap Bear 2X Fund | | | 0.75 | % |
Direxion Monthly 10 Year Note Bull 2X Fund | | | 0.75 | % |
Direxion Monthly 10 Year Note Bear 2X Fund | | | 0.75 | % |
Dynamic HY Bond Fund | | | 0.75 | % |
Direxion Monthly Commodity Bull 2X Fund | | | 0.75 | % |
Direxion Monthly Emerging Markets Bull 2X Fund | | | 0.75 | % |
Direxion Monthly China Bull 2X Fund | | | 0.75 | % |
U.S. Government Money Market Fund | | | 0.50 | % |
Direxion Monthly NASDAQ-100® Bull 2X Fund | | | 0.75 | % |
Direxion Monthly S&P 500® Bull 2X Fund | | | 0.75 | % |
Direxion Monthly S&P 500® Bear 2X Fund | | | 0.75 | % |
Direxion Monthly Latin America Bull 2X Fund | | | 0.75 | % |
Effective September 1, 2011, the Adviser has contractually agreed to waive a portion of this investment advisory fee of the Dynamic HY Bond Fund at an annual rate of 0.15% of the Fund’s average daily net assets through June 1, 2013. The Adviser may not recoup these waived fees in the future.
Operating Services Agreement: The Funds have entered into an Operating Services Agreement (the “Agreement”) with the Adviser. Under the Agreement, the Adviser will be responsible for all expenses of the Trust except the following: management fees, distribution and/or service fees, acquired fund fees, taxes, leverage interest, dividends or interest on short positions, other interest expenses, brokerage commission and other extraordinary expenses outside the typical day-to-day operations of the Funds.
In consideration for the services rendered pursuant to the Agreement, the Funds will pay to the Adviser, as compensation for the services provided by the Adviser under the Agreement, a monthly fee. The monthly fee is calculated on an annualized basis on the average net assets of each Fund and the below amount:
| | | | |
Direxion Monthly Small Cap Bull 2X Fund | | | 0.65 | % |
Direxion Monthly Small Cap Bear 2X Fund | | | 0.65 | % |
Direxion Monthly 10 Year Note Bull 2X Fund | | | 0.65 | % |
Direxion Monthly 10 Year Note Bear 2X Fund | | | 0.65 | % |
Dynamic HY Bond Fund | | | 0.50 | % |
Direxion Monthly Commodity Bull 2X Fund | | | 0.65 | % |
Direxion Monthly Emerging Markets Bull 2X Fund | | | 0.65 | % |
Direxion Monthly Emerging Markets Bear 2X Fund | | | 0.65 | % |
Direxion Monthly China Bull 2X Fund | | | 0.65 | % |
| | |
| |
| DIREXION ANNUAL REPORT | | 71 |
| | | | |
U.S. Government Money Market Fund | | | 0.45 | % |
Direxion Monthly NASDAQ-100® Bull 2X Fund | | | 0.65 | % |
Direxion Monthly S&P 500® Bull 2X Fund | | | 0.65 | % |
Direxion Monthly S&P 500® Bear 2X Fund | | | 0.65 | % |
Direxion Monthly Latin America Bull 2X Fund | | | 0.65 | % |
Under the Agreement, the Adviser may continue to waive expenses of the U.S. Government Money Market Fund in order to maintain a positive yield to its investors, which is necessitated by the overall decline of yields of the underlying securities of the U.S. Government Money Market Fund. The Advisor is able to recover these waived expenses for the three previous years if the yield provided to its investors maintains a level of 0.50%. Waived expenses of the U.S. Government Money Market Fund subject to potential recovery are as follows:
| | | | |
Expiring in: | | | Amount | |
2013 | | $ | 496,533 | |
2014 | | $ | 347,143 | |
2015 | | $ | 286,581 | |
| | | | |
Total | | $ | 1,130,257 | |
| | | | |
Distribution Expenses: Shares of the Funds, except for shares of the Dynamic HY Bond Fund and U.S. Government Money Market Fund, are subject to an annual 12b-1 fee of up to 1.00% of a Fund’s average daily net assets. The Dynamic HY Bond Fund is subject to an annual Rule 12b-1 fee of up to 0.40% of the Fund’s average daily net assets. The U.S. Government Money Market Fund is not authorized to pay 12b-1 fees. The Funds, except the U.S. Government Money Market Fund, currently pay a 12b-1 fee of 0.25% of the Fund’s average daily net assets.
Shareholder Servicing Fees: The Board of Trustees has also authorized each Fund’s shares to incur a shareholder servicing fee of 0.25% of each Fund’s average daily net assets. The Trust, on behalf of each Fund, pays the fee to financial institutions and other persons who provide services and maintain shareholder accounts.
Rafferty Capital Markets, LLC (the “Distributor”) serves as principal underwriter of the Funds and acts as the Funds’ distributor in a continuous public offering of the Funds’ shares. The Distributor is an affiliate of the Adviser.
During the period ended August 31, 2012, the Adviser contributed $11,406 to Direxion Monthly 10 Year Note Bull 2X Fund and $17,211 to Dynamic HY Bond Fund. These contributions were made so that these Funds could more closely track the performance of their respective benchmarks. These contributions are reflected on the Statements of Operations as Contributions from Affiliates and the effect of these contributions is presented on the Financial Highlights.
| 5. | | VALUATION MEASUREMENTS |
The Funds follow authoritative fair valuation accounting standards, which establish an authoritative definition of fair value and set out a hierarchy for measuring fair value. These standards require additional disclosures about the various inputs and valuation techniques used to develop the measurements of fair value and a discussion of changes in valuation techniques and related inputs during the period. These inputs are summarized in the three broad levels below:
Level 1 – Quoted prices in active markets for identical securities
Level 2 – Evaluated price based on other significant observable inputs (including quoted prices for similar securities, interest rates, prepayment speeds, credit risk, etc.)
Level 3 – Significant unobservable inputs (including the Fund’s own assumptions in determining fair value of investments)
The inputs or methodology used for valuing securities are not an indication of the credit risk associated with investing in those securities.
| | |
| | |
| 72 | | DIREXION ANNUAL REPORT |
The follow is a summary of the inputs used to value the Funds’ net assets as of August 31, 2012:
| | | | | | | | | | | | | | |
| | | Direxion Monthly Small Cap Bull 2X Fund | |
Asset Class | | Level 1 | | Level 2 | | | Level 3 | | | Total | |
Other Financial Instruments* | | $— | | $ | 106,005 | | | $ | — | | | $ | 106,005 | |
| |
| | | Direxion Monthly Small Cap Bear 2X Fund | |
Asset Class | | Level 1 | | Level 2 | | | Level 3 | | | Total | |
Other Financial Instruments* | | $— | | $ | (1,065,026 | ) | | $ | — | | | $ | (1,065,026 | ) |
| |
| | | Direxion Monthly 10 Year Note Bull 2X Fund | |
Asset Class | | Level 1 | | Level 2 | | | Level 3 | | | Total | |
Other Financial Instruments* | | $— | | $ | 442,436 | | | $ | — | | | $ | 442,436 | |
| |
| | | Direxion Monthly 10 Year Note Bear 2X Fund | |
Asset Class | | Level 1 | | Level 2 | | | Level 3 | | | Total | |
Other Financial Instruments* | | $— | | $ | (155,221 | ) | | $ | — | | | $ | (155,221 | ) |
| |
| | | Dynamic HY Bond Fund | |
Asset Class | | Level 1 | | Level 2 | | | Level 3 | | | Total | |
Investment Companies-Fixed Income | | $80,788,183 | | | $— | | | $ | — | | | $ | 80,788,183 | |
| |
| | | Direxion Monthly Commodity Bull 2X Fund | |
Asset Class | | Level 1 | | Level 2 | | | Level 3 | | | Total | |
Other Financial Instruments* | | $— | | $ | (387,872 | ) | | $ | — | | | $ | (387,872 | ) |
| |
| | | Direxion Monthly Emerging Markets Bull 2X Fund | |
Asset Class | | Level 1 | | Level 2 | | | Level 3 | | | Total | |
Other Financial Instruments* | | $— | | $ | (1,403,243 | ) | | $ | — | | | $ | (1,403,243 | ) |
| |
| | | Direxion Monthly China Bull 2X Fund | |
Asset Class | | Level 1 | | Level 2 | | | Level 3 | | | Total | |
Other Financial Instruments* | | $— | | $ | (462,066 | ) | | $ | — | | | $ | (462,066 | ) |
| |
| | | U.S. Government Money Market Fund | |
Asset Class | | Level 1 | | Level 2 | | | Level 3 | | | Total | |
Short-Term Investments | | $17,829,834 | | | $— | | | $ | — | | | $ | 17,829,834 | |
| |
| | | Direxion Monthly NASDAQ-100® Bull 2X Fund | |
Asset Class | | Level 1 | | Level 2 | | | Level 3 | | | Total | |
Other Financial Instruments* | | $— | | $ | 107,415 | | | $ | — | | | $ | 107,415 | |
| |
| | | Direxion Monthly S&P 500® Bull 2X Fund | |
Asset Class | | Level 1 | | Level 2 | | | Level 3 | | | Total | |
Other Financial Instruments* | | $— | | $ | 146,290 | | | $ | — | | | $ | 146,290 | |
| |
| | | Direxion Monthly S&P 500® Bear 2X Fund | |
Asset Class | | Level 1 | | Level 2 | | | Level 3 | | | Total | |
Other Financial Instruments* | | $— | | $ | (315,294 | ) | | $ | — | | | $ | (315,294 | ) |
| |
| | | Direxion Monthly Latin America Bull 2X Fund | |
Asset Class | | Level 1 | | Level 2 | | | Level 3 | | | Total | |
Other Financial Instruments* | | $— | | $ | (7,019,547 | ) | | $ | — | | | $ | (7,019,547 | ) |
|
| For further detail on each asset class, see Schedule of Investments. | |
|
* Other financial instruments include swap contracts, which are valued at the unrealized appreciation (depreciation) on the instrument. | |
| | |
| |
| DIREXION ANNUAL REPORT | | 73 |
The Funds also follow authoritative accounting standards which require additional disclosure regarding fair value measurements. Specifically, these standards require reporting entities to disclose a) the input and valuation techniques used to measure fair value for both recurring and nonrecurring fair value measurements, for Level 2 or Level 3 positions, b) transfers between all levels (including Level 1 and Level 2) on a gross basis (i.e. transfers out must be disclosed separately from transfers in) as well as the reason(s) for the transfers and c) purchases and sales on a gross basis in the Level 3 rollforward rather than as one net number. Additionally, reporting entities are required to disclose quantitative information about unobservable inputs used in the fair value measurements categorized within Level 3 of the fair value hierarchy.
There were no transfers between Level 1 and Level 2 securities during the period ended August 31, 2012. There were no Level 3 securities held by the Funds during the year ended August 31, 2011 and the period ended August 31, 2012. It is the Funds’ policy to recognize transfers into Level 3 at the value as of the beginning of the period.
| 6. | | ADDITIONAL DISCLOSURES ABOUT DERIVATIVE INSTRUMENTS |
The Funds follow authoritative standards of accounting for derivative instruments which establish disclosure requirements for derivative instruments. These standards improve financial reporting for derivative instruments by requiring enhanced disclosures that enable investors to understand how and why a fund uses derivatives instruments, how derivatives instruments are accounted for and how derivative instruments affect a fund’s financial position and results of operations.
The Funds use derivative instruments as part of their principal investment strategy to achieve their investment objective. For additional discussion on the risks associated with derivative instruments refer to Note 2. As of August 31, 2012, the Funds were invested in equity swap contracts.
At August 31, 2012, the fair value of derivatives instruments, by primary risk, were as follows:
| | | | | | | | | | | | | | | | | | | | | | |
| Asset derivatives1 | |
| | | | | Interest rate risk | | | Commodities risk | | | Credit risk | | | Equity risk | | | Total | |
Direxion Monthly Small Cap
Bull 2X Fund | | Swap contracts | | $ | — | | | $ | — | | | $ | — | | | $ | 106,005 | | | $ | 106,005 | |
Direxion Monthly 10 Year Note
Bull 2X Fund | | Swap contracts | | | 442,436 | | | | — | | | | — | | | | — | | | | 442,436 | |
Direxion Monthly Commodity
Bull 2X Fund | | Swap contracts | | | — | | | | 514,246 | | | | — | | | | — | | | | 514,246 | |
Direxion Monthly NASDAQ-100®
Bull 2X Fund | | Swap contracts | | | — | | | | — | | | | — | | | | 107,415 | | | | 107,415 | |
Direxion Monthly S&P 500®
Bull 2X Fund | | Swap contracts | | | — | | | | — | | | | — | | | | 146,290 | | | | 146,290 | |
Direxion Monthly Latin America
Bull 2X Fund | | Swap contracts | | | — | | | | — | | | | — | | | | 143,311 | | | | 143,311 | |
| 1 | Statement of Assets and Liabilities location: Unrealized appreciation on swaps. |
| | | | | | | | | | | | | | | | | | | | | | |
| Liability derivatives1 | |
| | | | | Interest rate risk | | | Commodities risk | | | Credit risk | | | Equity risk | | | Total | |
Direxion Monthly Small Cap
Bear 2X Fund | | Swap contracts | | $ | — | | | $ | — | | | $ | — | | | $ | 1,065,026 | | | $ | 1,065,026 | |
Direxion Monthly 10 Year Note
Bear 2X Fund | | Swap contracts | | | 155,221 | | | | — | | | | — | | | | — | | | | 155,221 | |
Direxion Monthly Commodity
Bull 2X Fund | | Swap contracts | | | — | | | | 902,118 | | | | — | | | | — | | | | 902,118 | |
Direxion Monthly Emerging Markets Bull 2X Fund | | Swap contracts | | | — | | | | — | | | | — | | | | 1,403,243 | | | | 1,403,243 | |
Direxion Monthly China
Bull 2X Fund | | Swap contracts | | | — | | | | — | | | | — | | | | 462,066 | | | | 462,066 | |
Direxion Monthly S&P 500®
Bear 2X Fund | | Swap contracts | | | — | | | | — | | | | — | | | | 315,294 | | | | 315,294 | |
Direxion Monthly Latin America
Bull 2X Fund | | Swap contracts | | | — | | | | — | | | | — | | | | 7,162,858 | | | | 7,162,858 | |
| 1 | Statement of Assets and Liabilities location: Unrealized depreciation on swaps. |
| | |
| | |
| 74 | | DIREXION ANNUAL REPORT |
Transactions in derivative instruments during the period ended August 31, 2012, by primary risk, were as follows:
| | | | | | | | | | | | | | | | | | | | | | |
| | | | | Interest rate risk | | | Commodities risk | | | Credit risk | | | Equity risk | | | Total | |
Direxion Monthly Small Cap Bull 2X Fund | | Net Realized gain (loss)1 | | | | | | | | | | | | | | | | | | | | |
| | Swap contracts | | $ | — | | | $ | — | | | $ | — | | | $ | 2,075,235 | | | $ | 2,075,235 | |
| | Change in net unrealized
appreciation (depreciation)2 | | | | | | | | | | | | | | | | | | | | |
| | Swap contracts | | | — | | | | — | | | | — | | | | 114,982 | | | | 114,982 | |
Direxion Monthly Small Cap Bear 2X Fund | | Net Realized gain (loss)1 | | | | | | | | | | | | | | | | | | | | |
| | Swap contracts | | | — | | | | — | | | | — | | | | (2,139,442 | ) | | | (2,139,442 | ) |
| | Change in net unrealized
appreciation (depreciation)2 | | | | | | | | | | | | | | | | | | | | |
| | Swap contracts | | | — | | | | — | | | | — | | | | (418,001 | ) | | | (418,001 | ) |
Direxion Monthly 10 Year Note Bull 2X Fund | | Net Realized gain (loss)1 | | | | | | | | | | | | | | | | | | | | |
| | Swap contracts | | | 3,761,694 | | | | — | | | | — | | | | — | | | | 3,761,694 | |
| | Change in net unrealized appreciation (depreciation)2 | | | | | | | | | | | | | | | | | | | | |
| | Swap contracts | | | 393,379 | | | | — | | | | — | | | | — | | | | 393,379 | |
Direxion Monthly 10 Year Note Bear 2X Fund | | Net Realized gain (loss)1 | | | | | | | | | | | | | | | | | | | | |
| | Swap contracts | | | (6,591,938 | ) | | | — | | | | — | | | | — | | | | (6,591,938 | ) |
| | Change in net unrealized appreciation (depreciation)2 | | | | | | | | | | | | | | | | | | | | |
| | Swap contracts | | | 588,776 | | | | — | | | | — | | | | — | | | | 588,776 | |
Dynamic HY Bond Fund | | Net Realized gain (loss)1 | | | | | | | | | | | | | | | | | | | | |
| | Swap contracts | | | 872,310 | | | | — | | | | 23,688 | | | | — | | | | 895,998 | |
| | Change in net unrealized appreciation (depreciation)2 | | | | | | | | | | | | | | | | | | | | |
| | Swap contracts | | | 1,307 | | | | — | | | | — | | | | — | | | | 1,307 | |
Direxion Monthly Commodity Bull 2X Fund | | Net Realized gain (loss)1 | | | | | | | | | | | | | | | | | | | | |
| | Swap contracts | | | — | | | | (13,348,158 | ) | | | — | | | | — | | | | (13,348,158 | ) |
| | Change in net unrealized appreciation (depreciation)2 | | | | | | | | | | | | | | | | | | | | |
| | Swap contracts | | | — | | | | 6,044,907 | | | | — | | | | — | | | | 6,044,907 | |
Direxion Monthly Emerging Markets Bull 2X Fund | | Net Realized gain (loss)1 | | | | | | | | | | | | | | | | | | | | |
| | Swap contracts | | | — | | | | — | | | | — | | | | 2,065,512 | | | | 2,065,512 | |
| | Change in net unrealized appreciation (depreciation)2 | | | | | | | | | | | | | | | | | | | | |
| | Swap contracts | | | — | | | | — | | | | — | | | | (2,683,119 | ) | | | (2,683,119 | ) |
Direxion Monthly China
Bull 2X Fund | | Net Realized gain (loss)1 | | | | | | | | | | | | | | | | | | | | |
| | Swap contracts | | | — | | | | — | | | | — | | | | (2,444,667 | ) | | | (2,444,667 | ) |
| | Change in net unrealized appreciation (depreciation)2 | | | | | | | | | | | | | | | | | | | | |
| | Swap contracts | | | — | | | | — | | | | — | | | | (703,271 | ) | | | (703,271 | ) |
Direxion Monthly
NASDAQ-100® Bull 2X Fund | | Net Realized gain (loss)1 | | | | | | | | | | | | | | | | | | | | |
| | Swap contracts | | | — | | | | — | | | | — | | | | 234,489 | | | | 234,489 | |
| | Change in net unrealized appreciation (depreciation)2 | | | | | | | | | | | | | | | | | | | | |
| | Swap contracts | | | — | | | | — | | | | — | | | | 390,683 | | | | 390,683 | |
Direxion Monthly S&P 500®
Bull 2X Fund | | Net Realized gain (loss)1 | | | | | | | | | | | | | | | | | | | | |
| | Swap contracts | | | — | | | | — | | | | — | | | | 768,673 | | | | 768,673 | |
| | Change in net unrealized appreciation (depreciation)2 | | | | | | | | | | | | | | | | | | | | |
| | Swap contracts | | | — | | | | — | | | | — | | | | (315,999 | ) | | | (315,999 | ) |
Direxion Monthly S&P 500®
Bear 2X Fund | | Net Realized gain (loss)1 | | | | | | | | | | | | | | | | | | | | |
| | Swap contracts | | | — | | | | — | | | | — | | | | (176,378 | ) | | | (176,378 | ) |
| | Change in net unrealized appreciation (depreciation)2 | | | | | | | | | | | | | | | | | | | | |
| | Swap contracts | | | — | | | | — | | | | — | | | | (242,310 | ) | | | (242,310 | ) |
| | |
| |
| DIREXION ANNUAL REPORT | | 75 |
| | | | | | | | | | | | | | | | | | | | | | |
| | | | | Interest rate risk | | | Commodities risk | | | Credit risk | | | Equity risk | | | Total | |
Direxion Monthly Latin America Bull 2X Fund | | Net Realized gain (loss)1 | | | | | | | | | | | | | | | | | | | | |
| | Swap contracts | | $ | — | | | $ | — | | | $ | — | | | $ | (4,262,436 | ) | | $ | (4,262,436 | ) |
| | Change in net unrealized
appreciation (depreciation)2 | | | | | | | | | | | | | | | | | | | | |
| | Swap contracts | | $ | — | | | $ | — | | | $ | — | | | $ | (1,539,906 | ) | | $ | (1,539,906 | ) |
| 1 | Statement of Operations location: Net realized gain (loss) on swaps. |
| 2 | Statement of Operations location: Change in unrealized appreciation (depreciation) on swaps. |
For the period ended August 31, 2012, the volume of the derivatives held by the Funds were as follows:
| | | | | | | | |
| | | Quarterly average gross notional amounts | |
| | | Long Equity Swaps
Contracts | | | Short Equity Swaps
Contracts | |
Direxion Monthly Small Cap Bull 2X Fund | | $ | 18,017,745 | | | $ | — | |
Direxion Monthly Small Cap Bear 2X Fund | | | — | | | | 27,776,669 | |
Direxion Monthly 10 Year Note Bull 2X Fund | | | 64,810,864 | | | | — | |
Direxion Monthly 10 Year Note Bear 2X Fund | | | — | | | | 44,064,735 | |
Dynamic HY Bond Fund | | | 8,234,969 | | | | — | |
Direxion Monthly Commodity Bull 2X Fund | | | 41,872,244 | | | | — | |
Direxion Monthly Emerging Markets Bull 2X Fund | | | 46,002,984 | | | | — | |
Direxion Monthly China Bull 2X Fund | | | 13,996,804 | | | | — | |
U.S. Government Money Market Fund | | | — | | | | — | |
Direxion Monthly NASDAQ-100® Bull 2X Fund | | | 52,520,101 | | | | — | |
Direxion Monthly S&P 500® Bull 2X Fund | | | 35,063,961 | | | | — | |
Direxion Monthly S&P 500® Bear 2X Fund | | | — | | | | 29,284,810 | |
Direxion Monthly Latin America Bull 2X Fund | | | 66,188,784 | | | | — | |
The Funds, with the exception of the Dynamic HY Bond Fund, utilize this volume of derivatives in order to obtain leverage in order to meet their investment objectives of 200% (or -200%) calendar month performance of their respective index. The Dynamic HY Bond Fund utilized derivatives to obtain exposure to high-yield instruments during the first half of the year.
The Funds follow authoritative standards for accounting for and disclosure of events that occur after the Statements of Assets and Liabilities date but before financial statements are issued or are available to be issued. These standards require the Funds to recognize in the financial statements the effects of all recognized subsequent events that provide additional evidence about conditions that existed at the date of the Statements of Assets and Liabilities. For nonrecognized subsequent events that must be disclosed to keep the financial statements from being misleading, the Funds are required to disclose the nature of the event as well as an estimate of its financial effect, or a statement that such an estimate cannot be made. The Funds have evaluated subsequent events through the issuance of the Funds’ financial statements and have determined there is no impact to the Funds’ financial statements.
| | |
| | |
| 76 | | DIREXION ANNUAL REPORT |
Direxion Funds
Report of Independent Registered Public Accounting Firm
To the Board of Trustees and Shareholders of Direxion Funds:
We have audited the accompanying statements of assets and liabilities of the Direxion Monthly Small Cap Bull 2X Fund, Direxion Monthly Small Cap Bear 2X Fund, Direxion Monthly 10 Year Note Bull 2X Fund, Direxion Monthly 10 Year Note Bear 2X Fund, Dynamic HY Bond Fund, Direxion Monthly Commodity Bull 2X Fund, Direxion Monthly Emerging Markets Bull 2X Fund, Direxion Monthly China Bull 2X Fund, U.S. Government Money Market Fund, Direxion Monthly S&P 500 Bull 2X Fund, Direxion Monthly S&P 500 Bear 2X Fund, Direxion Monthly NASDAQ 100 Bull 2X Fund, and Direxion Monthly Latin America Bull 2X Fund (thirteen of the series of the Direxion Funds) (the “Funds”), including the schedules of investments, as of August 31, 2012, and the related statements of operations , the statements of changes in net assets, and the financial highlights for each of the periods indicated therein. These financial statements and financial highlights are the responsibility of the Funds’ management. Our responsibility is to express an opinion on these financial statements and financial highlights based on our audits.
We conducted our audits in accordance with the standards of the Public Company Accounting Oversight Board (United States). Those standards require that we plan and perform the audit to obtain reasonable assurance about whether the financial statements and financial highlights are free of material misstatement. We were not engaged to perform an audit of the Funds’ internal control over financial reporting. Our audits included consideration of internal control over financial reporting as a basis for designing audit procedures that are appropriate in the circumstances, but not for the purpose of expressing an opinion on the effectiveness of the Funds’ internal control over financial reporting. Accordingly, we express no such opinion. An audit also includes examining, on a test basis, evidence supporting the amounts and disclosures in the financial statements and financial highlights, assessing the accounting principles used and significant estimates made by management, and evaluating the overall financial statement presentation. Our procedures included confirmation of securities owned as of August 31, 2012, by correspondence with the custodian and brokers. We believe that our audits provide a reasonable basis for our opinion.
In our opinion, the financial statements and financial highlights referred to above present fairly, in all material respects, the financial position of the above mentioned thirteen of the series of Direxion Funds at August 31, 2012, the results of their operations, the changes in their net assets, and the financial highlights for each of the periods indicated therein, in conformity with U.S. generally accepted accounting principles.

October 26, 2012
New York, New York
| | |
| |
| DIREXION ANNUAL REPORT | | 77 |
Additional Information
(Unaudited)
For the period ended August 31, 2012, certain dividends paid by the Funds may be subject to a maximum rate of 15%, as provided for by the Jobs and Growth Tax Relief Reconciliation Act of 2003. The amount of dividends declared from ordinary income designated as qualified income was 0.00% for the Direxion Monthly 10 Year Note Bull 2X Fund and the Dynamic HY Bond Fund.
For corporate shareholders, the amount of ordinary income distributions qualifying for the corporate dividends received deduction for the period ended August 31, 2012 was 0.00% for the Direxion Monthly 10 Year Note Bull 2X Fund and the Dynamic HY Bond Fund.
HOUSEHOLDING
In an effort to decrease costs, the Funds intend to reduce the number of duplicate prospectuses, Annual and Semi-Annual Reports, proxy statements and other similar documents you receive by sending only one copy of each to those addresses shared by two or more accounts and to shareholders we reasonably believe are from the same family or household. Householding begins once you have signed your account application. After such time, if you would like to discontinue householding for your accounts, please call toll-free at (800) 851-0511 to request individual copies of these documents. Once the Funds receive notice to stop householding, we will begin sending individual copies thirty days after receiving your request. This policy does not apply to account statements.
| | |
| | |
| 78 | | DIREXION ANNUAL REPORT |
Investment Advisory Agreements Approvals (Unaudited)
Provided below is a summary of certain of the factors the Board considered at its August 15, 2012 Board meeting in renewing the Advisory Agreement between Rafferty Asset Management (“Rafferty”) and the Direxion Funds (the “Trust”), on behalf of the Direxion Monthly China Bull 2X Fund, Direxion Monthly Commodity Bull 2X Fund, Direxion Monthly Emerging Markets Bull 2X Fund, Direxion Monthly Latin America Bull 2X Fund, Direxion Monthly NASDAQ-100® Bull 2X Fund, Direxion Monthly S&P 500® Bull 2X Fund, Direxion Monthly S&P 500® Bear 2X Fund, Direxion Monthly Small Cap Bull 2X Fund, Direxion Monthly Small Cap Bear 2X Fund, Direxion Monthly 10 Year Note Bull 2X Fund, Direxion Monthly 10 Year Note Bear 2X Fund, Dynamic HY Bond Fund and U.S. Government Money Market Fund, each a series of the Trust. Each series of the Trust is referred to herein as a “Fund” and collectively as the “Funds.” The Funds directly managed by Rafferty using a leveraged strategy are referred to as the “Leveraged Index Funds.” The Funds directly managed by Rafferty other than the leveraged-index Funds are referred to as the “Non-Leveraged Funds.”
The Board did not identify any particular information that was most relevant to its consideration to approve the Advisory Agreement (“Agreement”) and each Trustee may have afforded different weight to the various factors. In determining whether to approve the continuance of the Agreement, the Board considered the best interests of each Fund separately. In addition, the Board noted that the Trustees had considered various reports and information provided throughout the year at their regular Board meetings and otherwise, and that the Independent Board members had met separately on August 7, 2012, to consider these specific contract renewals. While the Agreement for all of the Funds was considered at the same Board meeting, the Board considered each Fund’s investment advisory relationship separately.
In each instance, the Board considered, among others, the following factors: (1) the nature and quality of the services provided; (2) the investment performance of the Fund; (3) the profitability of the advisory business to Rafferty; (4) the extent to which economies of scale have been taken into account in setting fee schedules; (5) whether fee levels reflect these economies of scale, if any, for the benefit of Fund shareholders; (6) comparisons of services and fees with contracts entered into by Rafferty with other clients (such as pension funds and other institutional investors); and (7) other benefits derived or anticipated to be derived and identified by Rafferty from its relationship with the Funds.
Nature, Extent and Quality of Services Provided. The Board reviewed the nature, extent and quality of the services provided or to be provided under the Agreement by Rafferty. The Board noted that Rafferty has provided services to the Trust since its inception and has developed an expertise in managing the Funds, particularly those using a leveraged strategy. The Board considered Rafferty’s representation that it has the financial resources and appropriate staffing to manage the Funds and meet its expense reimbursement obligations, if any. The Board also considered that Rafferty utilizes the services of an independent compliance consulting firm and that reports from the chief compliance officer are provided to the Board at its regularly scheduled quarterly Board meetings. The Board considered that Rafferty oversees all aspects of the operation of the Funds, including oversight of the Funds’ service providers. Based on these and other considerations, the Board determined that, in the exercise of its business judgment, the nature, extent and quality of the services provided by Rafferty to the Funds under the Agreement were fair and reasonable.
Performance of the Funds. The Board considered quarterly reports throughout the year related to the performance of the Leveraged Index Funds. In addition, the Board evaluated the performance of the Leveraged Index Funds relative to: (1) performance models for the year-to-date and since-inception periods ended June 30, 2012; and (2) market indices for the year-to-date and since-inception periods ended June 30, 2012. The Board considered Rafferty’s explanation that the Leveraged Index Funds’ performance is more appropriately compared to the models than to the market indices. The Board also considered Rafferty’s explanation that the Leveraged Index Funds are difficult to categorize with other Lipper and Morningstar peer group funds because the Leveraged Index Funds seek calendar month investment results that are leveraged and the Lipper and Morningstar peer group funds generally do not.
The Board noted Rafferty’s explanation that the performance of a Leveraged Index Fund and its model typically will differ materially from the performance of the Fund’s benchmark index because the benchmark index’s performance does not reflect the effects of a leveraged investment strategy or the impact of compounding on a Fund’s monthly performance. In addition, the Board noted Rafferty’s representation that the underperforming Leveraged Index Funds generally underperformed their models due to a combination of factors (collectively, the “Factors”), most notably: (1) that a Leveraged Index Fund’s performance will be adversely affected by fund expenses and cash flows into and out of the Fund, which are not factors that impact the performance of the Funds’ models and benchmark indices; (2) tracking differences between the swap contracts or other investment companies held by certain of the Leveraged Index Funds and the
| | |
| |
| DIREXION ANNUAL REPORT | | 79 |
securities included in their benchmark indices; and (3) price deviations between the time when Rafferty rebalanced the Leveraged Index Funds’ portfolios and the close of the markets. The Board noted that the Funds’ models are not affected by these price deviations.
The Board also evaluated the performance of each Non-Leveraged Fund relative to: (1) its benchmark index for year-to-date, one-year, three-year, five-year, ten-year and since inception periods ended June 30, 2012, where applicable; and (2) the average performance of the relevant Morningstar peer fund universe for monthly and annual periods ended June 30, 2012.
Leveraged Index Funds:
With respect to the Direxion Monthly Commodity Bull 2X Fund, the Board considered that the Fund performed consistent with its model performance for the relevant periods ended June 30, 2012.
With respect to the Direxion Monthly China Bull 2X Fund, Direxion Monthly Emerging Markets Bull 2X Fund, Direxion Monthly Latin America Bull 2X Fund, Direxion Monthly NASDAQ-100® Bull 2X Fund, Direxion Monthly S&P 500® Bull 2X Fund, Direxion Monthly S&P 500® Bear 2X Fund, Direxion Monthly Small Cap Bull 2X Fund, Direxion Monthly Small Cap Bear 2X Fund, Direxion Monthly 10 Year Note Bull 2X Fund and Direxion Monthly 10 Year Note Bear 2X Fund, the Board considered that each Fund underperformed its model for the relevant periods ended June 30, 2012. The Board noted Rafferty’s representation that each Fund underperformed its model primarily due to the previously discussed Factors.
Non-Leveraged Funds:
With respect to the Dynamic HY Bond Fund, the Board considered management’s description of the performance of the Morningstar universe of high yield bond funds. The Board also considered that as of June 30, 2012, the Fund underperformed the average of its relevant Morningstar peer funds for all periods presented. In this regard, the Board noted that, partly in response to the underperformance of the Fund, the portfolio manager and investment strategies for the Fund were changed in October 2010 and that the Fund’s relative investment performance had improved since that time. The Board noted Rafferty’s representation that the Fund does not limit how often investors may buy or sell shares of the Fund and that the Fund may experience large shareholder redemptions. The Board also noted Rafferty’s representation that the Fund seeks to provide investors in the Fund long exposure to the high yield market by investing the Fund’s assets in instruments, including derivative securities, which provide long exposure to the high yield market with sufficient liquidity to meet the frequent redemptions which are required by the shareholders in the Fund. The Board also noted Rafferty’s representation that the construction of a liquid portfolio and the use of derivatives that provide credit exposure absent interest rate exposure mean that the Fund’s performance should not be expected to mimic the performance of the broader high yield market.
With respect to the U.S. Government Money Market Fund, the Board considered management’s description of the performance of the Morningstar universe of taxable money market funds. The Board also considered that as of June 30, 2012, the Fund outperformed the average of its relevant Morningstar peer funds for the year-to-date, one-year and three-year periods, but underperformed for the five-year and ten-year periods.
Costs of Services Provided to the Funds and Profits Realized. The Board considered the overall fees paid to Rafferty on an annual basis since each Fund’s commencement of operations, including any fee waivers and recoupment of fees previously waived. With respect to the Leveraged Index Funds, the Board also considered advisory fees charged by, and total expense ratios of, comparable fund groups. In this regard, management advised the Board that the advisory fee rates for each of the Leveraged Index Funds is similar to or, in some cases lower than, the advisory fee rates for the comparable fund groups. The Board also considered that the total expense ratios for the Leveraged Index Funds are generally higher than comparable funds. However, Rafferty indicated that the comparable fund groups have higher asset levels, which account in part for their lower total expense ratios. The Board also considered the fees that Rafferty charges for the services that it provides to a pooled trading vehicle for domestic hedge funds.
With respect to the Dynamic HY Bond Fund, the Board considered that the Fund’s total expense ratio and advisory fee rate were above the median of its relevant Morningstar fund universe. In this regard, the Board noted that, as of September 1, 2011, Rafferty, at the Board’s request, contractually agreed to 0.15% waiver of its advisory fee to reduce the Fund’s expense ratio.
| | |
| | |
| 80 | | DIREXION ANNUAL REPORT |
With respect to the U.S. Government Money Market Fund, the Board considered that the Fund’s advisory fee rate is higher than the median of the relevant Morningstar fund universe. In this regard, the Board noted that Rafferty agreed to a contractual waiver of its management fee in order to reduce the total operating expenses of the Fund. The Board also noted that Rafferty has waived all other expenses for the Fund.
The Board considered that Rafferty contractually agreed to limit the total expenses for the most recent and upcoming fiscal years for each Leveraged Index Fund and Non-Leveraged Fund via fee waivers and/or expense limitations. The Board also considered the overall profitability of Rafferty’s investment business and its representation that it does not allocate internal costs and assess profitability with respect to its services to individual Funds. Based on these considerations, the Board determined that, in the exercise of its business judgment, the costs of the services provided and the profits realized under the Agreement were fair and reasonable.
Economies of Scale. The Board considered Rafferty’s representation that it believes that asset levels at this time are not sufficient to achieve economies of scale or warrant a reduction in fee rates or the addition of breakpoints. Rafferty noted that it was continuing to work on its sales and marketing efforts to raise additional assets. Based on these and other considerations, the Board determined that, in the exercise of its business judgment, the reduction in fee rates or additions of breakpoints were not necessary at this time.
Other Benefits. The Board considered Rafferty’s representation that its relationship with the Funds may help to facilitate Rafferty’s ability to attract business to its non-mutual fund account. The Board also considered that Rafferty’s overall business with brokerage firms helps to lower commission rates and provide better execution for Fund portfolio transactions. Based on these and other considerations, the Board determined that, in the exercise of its business judgment, the benefits were fair and reasonable.
Conclusion. Based on, but not limited to, the above considerations and determinations, the Board determined that the Agreement for the Funds was fair and reasonable in light of the services to be performed, fees, expenses and such other matters as the Board considered relevant in the exercise of its business judgment. On this basis, the Board unanimously voted in favor of the continuance of the Agreement.
| | |
| |
| DIREXION ANNUAL REPORT | | 81 |
Direxion Funds
TRUSTEES AND OFFICERS
The business affairs of the Funds are managed by or under the direction of the Board of Trustees. Information pertaining to the Trustees and Officers of the Funds is set below. The SAI includes additional information about the Funds’ Trustees and Officers and is available without charge, upon request by calling 1-800-851-0511.
| | | | | | | | | | |
|
|
Interested Trustees |
Name, Address and Age | | Position(s)
Held with
Fund | | Term of Office
and Length of
Time Served | | Principal Occupation(s) During Past Five Years | | # of Portfolios in Direxion Family of
Investment
Companies
Overseen by
Trustee(2) | | Other Trusteeships/
Directorships Held
by Trustee |
Lawrence C. Rafferty(1)
Age: 70 | | Chairman of the Board of Trustees | | Lifetime of Trust until removal or resignation; Since 1997 | | Chairman and Chief Executive Officer of Rafferty, 1997-present; Chief Executive Officer of Rafferty Companies, LLC, 1996-present; Chief Executive Officer of Rafferty Capital Markets, Inc., 1995-present. | | 23 | | Board of Trustees, Fairfield University; Board of Directors, St. Vincent’s Services; Executive Committee, Metropolitan Golf Association |
|
|
Non-Interested Trustees |
Name, Address and Age | | Position(s)
Held with
Fund | | Term of Office
and Length of
Time Served | | Principal Occupation(s) During Past Five Years | | # of Portfolios
in Direxion
Family of
Investment
Companies
Overseen by
Trustee(2) | | Other Trusteeships/
Directorships Held
by Trustee |
Daniel J. Byrne
Age: 68 | | Trustee | | Lifetime of Trust until removal or resignation; Since 1997 | | President and Chief Executive Officer of Byrne Securities Florida Inc. (formerly, Byrne Securities Inc.), 1992-present. | | 141 | | None. |
|
Gerald E. Shanley III
Age: 68 | | Trustee | | Lifetime of Trust until removal or resignation; Since 1997 | | Retired, Since 2002; Business Consultant, 1985-present; Trustee of Trust Under Will of Charles S. Payson, 1987-present; C.P.A., 1979-present. | | 141 | | None. |
|
John Weisser
Age: 70 | | Trustee | | Lifetime of Trust until removal or resignation; Since 2007 | | Retired, Since 1995; Salomon Brothers, Inc, 1971-1995, most recently as Managing Director. | | 141 | | Director, MainStay VP Fund Series, The MainStay Funds, The MainStay Funds Trust; Director ICAP Funds, Inc; Director, Eclipse Funds, Inc., Eclipse Funds; (66 Funds Total) |
|
| (1) | | Mr. Rafferty is affiliated with Rafferty. Mr. Rafferty is the Chairman and Chief Executive Officer of Rafferty and owns a beneficial interest in Rafferty. |
| (2) | | The Direxion Family of Investment Companies consists of the Direxion Funds which currently offers for sale to the public 23 portfolios, the Direxion Insurance Trust which currently offers for sale 1 portfolio and the Direxion Shares ETF Trust which currently offers for sale to the public 47 of the 117 funds currently registered with the SEC. |
| | |
| | |
| 82 | | DIREXION ANNUAL REPORT |
Direxion Funds
TRUSTEES AND OFFICERS
Principal Officers of the Trust
The officers of the Trust conduct and supervise its daily business. Unless otherwise noted, an individual’s business address is 1301 Avenue of the Americas, 35th Floor, New York, New York 10019. As of the date of this report, the officers of the Trust, their ages, their business address and their principal occupations during the past five years are as follows:
| | | | | | | | | | |
Name, Address and Age | | Position(s) Held with Fund | | Term of Office and Length of Time Served | | Principal Occupation(s) During Past Five Years | | # of Portfolios in the Direxion Family of
Investment
Companies
Overseen by
Trustee(2) | | Other Trusteeships/ Directorships Held by Trustee |
Daniel D. O’Neill(1)
Age: 44 | | President; | | One Year;
Since 1999 | | Managing Director of Rafferty, 1999-present. | | 117 | | N/A |
| | Chief Operating Officer and Chief Investment Officer | | One Year;
Since 2006 | | | | | | |
|
Christopher Lewis
Age: 42 | | Chief Compliance Officer(3) | | One Year;
Since 2009 | | Director, Alaric Compliance Services, LLC, 2009– present; Partner, Thacher Proffitt & Wood LLP, 2004-2008; Partner, Simmons & Simmons, 2002-2004. | | N/A | | N/A |
|
Patrick J. Rudnick
777 East Wisconsin Avenue Milwaukee, WI 53202
Age: 39 | | Principal Financial Officer and Treasurer | | One Year; Since 2010 | | Vice President, U.S. Bancorp Fund Services, LLC, since 2006; formerly, Manager, PricewaterhouseCoopers LLP (1999-2006). | | N/A | | N/A |
|
Angela Brickl
Age: 36 | | Secretary(3) | | One Year;
Since 2011 | | Vice President, Rafferty Asset Management, LLC, since October 2010; Summer Associate at Skadden, Arps, Slate, Meagher & Flom, LLP, May – August 2009; Summer Associate at Foley & Lardner, LLP, May – August 2008; Vice President, U.S. Bancorp Fund Services, LLC, November 2003 – August 2007. | | N/A | | N/A |
|
| (1) | | Mr. O’Neill serves as Chairman of the Board of Trustees of the Direxion Shares ETF Trust. |
| (2) | | The Direxion Family of Investment Companies consists of the Direxion Funds which currently offers for sale to the public 23 portfolios, the Direxion Insurance Trust which currently offers for sale 1 portfolio and the Direxion Shares ETF Trust which currently offers for sale to the public 47 of the 117 funds currently registered with the SEC. |
| (3) | | Effective September 1, 2012, Ms. Brickl replaced Mr. Lewis as Chief Compliance Officer. |
| | |
| |
| DIREXION ANNUAL REPORT | | 83 |
THIS PAGE INTENTIONALLY LEFT BLANK
THIS PAGE INTENTIONALLY LEFT BLANK
THIS PAGE INTENTIONALLY LEFT BLANK
PRIVACY NOTICE
At the Direxion Funds, we are committed to protecting your privacy. To open and service your Direxion accounts, we collect and maintain certain nonpublic personal information about you, such as your address, phone number, social security number, purchases, sales, account balances, bank account information and other personal financial information. We collect this information from the following sources:
| | • | | Account applications or other forms on which you provide information, |
| | • | | Mail, e-mail, the telephone and our website, and |
| | • | | Your transactions and account inquiries with us. |
We safeguard the personal information that you have entrusted to us in the following ways:
| | • | | As a general policy, only those employees who maintain your account and respond to your requests for additional services have access to your account information. |
| | • | | We maintain physical, electronic, and procedural safeguards to insure the security of your personal information and to prevent unauthorized access to your information. |
We do not disclose any nonpublic personal information about you or our former shareholders to anyone, except as permitted or required by law. In the course of conducting business and maintaining your account we may share shareholder information, as allowed by law, with our affiliated companies and with other service providers, including financial intermediaries, custodians, transfer agents and marketing consultants. Those companies are contractually bound to use that information only for the services for which we hired them. They are not permitted to use or share our shareholders’ nonpublic personal information for any other purpose. There also may be times when we provide information to federal, state or local authorities as required by law.
In the event that you hold fund shares of Direxion through a financial intermediary, including, but not limited to, a broker-dealer, bank, or trust company, the privacy policy of your financial intermediary would govern how your nonpublic personal information would be shared with nonaffiliated third parties.
For questions about our policy, please contact us at (800) 851-0511.
This page is not a part of the annual report.
ANNUAL REPORT AUGUST 31, 2012
1301 Avenue of the Americas (6th Ave.), 35th Floor New York, New York 10019 (800) 851-0511 www.direxionfunds.com
Investment Adviser
Rafferty Asset Management, LLC
1301 Avenue of the Americas (6th Ave.), 35th Floor
New York, NY 10019
Administrator, Transfer Agent, Dividend Paying Agent & Shareholding Servicing Agent
U.S. Bancorp Fund Services, LLC
P.O. Box 1993
Milwaukee, WI 53201-1993
Custodian
U.S. Bank, N.A.
1555 RiverCenter Dr., Suite 302
Milwaukee, WI 53212
Independent Registered Public Accounting Firm
Ernst & Young LLP
5 Times Square
New York, NY 10036
Distributor
Rafferty Capital Markets, LLC
1010 Franklin Ave., 3rd Floor
Garden City, NY 11530
The Fund’s Proxy Voting Policies are available without charge by calling 1-800-851-0511, or by accessing the SEC’s website, at www.sec.gov.
The actual voting records relating to portfolio securities during the most recent period ended June 30 (starting with the year ended June 30, 2005) is available without charge by calling 1-800-851-0511 or by accessing the SEC’s website at www.sec.gov.
The Fund files complete schedules of portfolio holdings with the SEC on Form N-Q. The Form N-Q is available without change, upon request, by calling 1-800-851-0511, or by accessing the SEC’s website, at www.sec.gov.
This report has been prepared for shareholders and may be distributed to others only if preceded or accompanied by a current prospectus.

ANNUAL REPORT AUGUST 31, 2012
Evolution Managed Bond Fund
Evolution All-Cap Equity Fund
Evolution Market Leaders Fund
Evolution Alternative Investment Fund
1301 Avenue of the Americas (6th Ave.), 35th Floor
New York, New York 10019
(800) 851-0511
Table of Contents

Help Preserve the Environment – Go Green!
Go paperless with Direxion e-Delivery – a service allowing shareholders to reduce clutter with full online access to regulatory documents. Begin the preservation process with e-delivery.
With Direxion e-Delivery you can:
| | • | | Receive email notifications when your most recent shareholder communications are available for review. |
| | • | | Access prospectuses, annual reports and semiannual reports online. |
It’s easy to enroll:
| 1. | | Visit www.direxionfunds.com/edelivery |
| 2. | | Follow the simple enrollment instructions |
If you have questions about Direxion e-Delivery services, contact one of our shareholder representatives at 800-851-0511.

LETTERSTO SHAREHOLDERS
Dear Shareholders,
This Annual Report for the Evolution Funds covers the period from September 1, 2011 to August 31, 2012 (the “Annual Period”). This report covers the Evolution Managed Bond Fund, Evolution All-Cap Equity Fund, Evolution Market Leaders Fund and Evolution Alternative Investment Fund. Flexible Plan Investments, Ltd. serves as the sub-advisor to the Evolution Funds. During the Annual Period broad equity markets were strong, as the S&P 500 Index gained approximately 18%. Heightened levels of volatility characterized the early phase of the period as markets struggled to regain solid footing after the U.S. Government debt ceiling crisis in August 2011. However, concerns abated and markets rallied from December into the Spring. Although fears related to the ongoing sovereign debt crisis in Europe re-emerged causing equity markets to pull back from their highs during April and May. Markets again rallied late in the period as the U.S. Federal Reserve (“the Fed”) stood by its easy money policy and pledged to retain very low interest rates for an extended period of time. The U.S. Dollar was strong throughout the period, although opposing pressures – both from the Fed domestically and the European macro-environment abroad – added volatility to foreign exchange markets. Oil was volatile throughout the period, as structural changes sweeping across Northern Africa and the Middle East drove prices up, while concerns over global economic growth held prices back. The price for a barrel of oil rose as high as $110 in March 2012 after seeing lows of $75 in October 2011, before trading in the high $70 range again in the early summer 2012, and then settling at $95 per barrel at the end of the period.
Equities:
The Annual Period saw strong equity returns due to a perceived, improving global economy, as well as continuous European Central Bank and Fed actions. At the end of 2011 and into the first quarter of 2012, equities were supported by encouraging signs that the U.S. economy had turned a corner. Jobless claims had dropped to a four-year low, and both corporate earnings and housing starts figures continued to show upside. The second quarter of 2012 saw the only downtrend during the Annual Period, as Europe led global equities in a substantial drop, underperforming against bonds and the safe-haven of the U.S. Dollar. With a continued rally in equities through the end of this Annual Period, investors will look towards the upcoming U.S. Presidential election to be a test of where market risk appetite for equities truly lies.
Fixed Income:
Interest rates remained at record lows. The Fed stood strong on low interest rates in an attempt to stimulate the economy and help revive the housing market. As a result, low long-term interest rates have sparked rising housing-start figures throughout 2012.
The Evolution Managed Bond Fund is benchmarked to the Barclays Capital U.S. Aggregate Bond Index. The Fund returned 4.74% during the Annual Period, as compared to the benchmark’s return of 5.78%. The Fund outperformed its benchmark for the first month, and then fell below in October 2011, due in part to its decrease in 1-3 Month U.S. T-Bill holdings. The underperformance gap widened to 1.59% in March 2012 due to the Fund’s long position in 7-10 Year U.S. Treasuries, which materially underperformed the broad bond market in March.
The Evolution All-Cap Equity Fund is benchmarked to the S&P 500 Index. The Fund declined -6.62% during the Annual Period, while the benchmark index returned 18.00%. The Fund strives to take advantage of strategic allocations to different areas of the market capitalization structure. Generally, the managers attempt to take advantage of cyclical rotations in equities from micro-cap stocks to mega-cap stocks. The Fund also uses a tactical overlay strategy, using equity index futures in an attempt to isolate the portfolio’s selection of securities compared to the broader market, or take advantage of short-term trends. The portfolio’s combination of equity-index hedge timing and security selection, especially in October 2011, caused the Fund to fall behind its benchmark by almost 10% – a difference not made up throughout the remainder of the Annual Period. From November 2011 through the end of April 2012, as the S&P 500 Index rallied, the Fund maintained short positions in either, or both the Russell 2000 Index and the S&P 500 Index, contributing to underperformance.
The Evolution Market Leaders Fund is benchmarked to the Wilshire 5000 Total Market Index. The Fund returned 3.11% during the Annual Period, as compared to the benchmark return of 16.92%. The Fund tracked rather closely to its benchmark throughout the last part of 2011, with performance lagging behind beginning in 2012. The Fund’s underperformance can be partly attributed to its allocations to fixed income throughout various parts of the year, along with some large allocations to cash, causing the Fund to miss out on potential gains during what was a generally bullish period for broad equity indexes.
The performance data quoted represents past performance; past performance does not guarantee future results. The investment return and principal value of an investment will fluctuate and an investor’s shares, when redeemed, may be worth more or less than their original cost. Current performance may be higher or lower than the performance data quoted.
The Evolution Alternative Investment Fund is benchmarked to the S&P 500 Index. The Fund returned 6.15% during the Annual Period, underperforming the S&P 500 which had an 18.00% total return. The Fund started the Annual Period invested in cash and equity index futures in an attempt to stave off draw-downs in a period of high volatility. This strategy aided the Fund beating the benchmark index early in the Annual Period. However, the Fund maintained this heavy cash position in late 2011 and early in 2012, causing the Fund to return less than its benchmark as the market rallied into the Spring. The Fund invests in sector-based ETFs to take advantage of strategic sector rotation, which hindered performance in the volatile market environment versus the broader S&P 500 Index.
As always, we thank you for using the Direxion Funds and we look forward to our mutual success.
Best Regards,
| | |
 | |  |
Daniel O’Neill Direxion Funds | | Jerry Wagner Flexible Plan Investments, Ltd. |
The performance data quoted represents past performance; past performance does not guarantee future results. The investment return and principal value of an investment will fluctuate and an investor’s shares, when redeemed, may be worth more or less than their original cost. Current performance may be higher or lower than the performance data quoted.
An investment in any of the Direxion Funds is subject to a number of risks that could affect the value of its shares. It is important that investors closely review and understand these risks before making an investment. An investor should consider the investment objectives, risks, charges and expenses of the Direxion Funds carefully before investing. The prospectus contains this and other information about the Direxion Funds. To obtain a prospectus, please call the Direxion Funds at 1-800-851-0511 or visit www.direxionfunds.com. The prospectus should be read carefully before investing.
The views in this report were those of the Adviser as of August 31, 2012 and may not reflect their views on the date this report is first published or anytime thereafter. These views are intended to assist shareholders of the Fund in understanding their investments in the Fund and do not constitute investment advice.
To obtain performance data current to the most recent month-end, please call, toll-free, 1-800-851-0511 or visit www.direxionfunds.com.
The total annual fund operating expense ratio of the Managed Bond Fund, All-Cap Equity Fund, Market Leaders Fund and the Alternative Investment Fund is 1.86%, 1.71%, 1.93% and 2.59% respectively, net of any fee, waivers or expense reimbursements.
The total annual fund operating expense ratios include Acquired Fund Fees and Expenses, indirect fees and expenses that the Funds incur that are required to be disclosed. Without Acquired Fund Fees and Expenses, total annual operating expense ratio would be 1.62% for the Managed Bond Fund, All-Cap Equity Fund, Market Leaders Fund and the Alternative Investment Fund.
Distributed by: Rafferty Capital Markets, LLC
Date of First Use: October 26, 2012
Evolution Managed Bond Fund
Performance Summary
Investment Objective: Seeks the highest appreciation on an annual basis consistent with a high tolerance for risk.
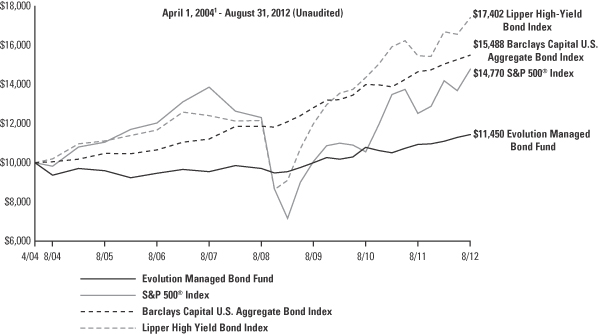
| | | | | | | | | | | | | | | | |
| | | Average Annual Total Return2 | |
| | | 1 Year | | | 3 Year | | | 5 Year | | | Since
Inception | |
Evolution Bond Fund | | | 4.74 | % | | | 4.59 | % | | | 3.71 | % | | | 1.62 | % |
| | | | |
S&P 500® Index | | | 18.00 | % | | | 13.62 | % | | | 1.28 | % | | | 4.74 | % |
| | | | |
Lipper High Yield Bond Index | | | 12.53 | % | | | 13.20 | % | | | 7.00 | % | | | 6.80 | % |
| | | | |
Barclays Capital U.S. Aggregate Bond Index | | | 5.78 | % | | | 6.51 | % | | | 6.66 | % | | | 5.34 | % |
This chart illustrates the performance of a hypothetical $10,000 investment made at the Fund’s inception, and is not intended to imply any future performance. The returns shown do not reflect the deduction of taxes that a shareholder would pay on fund distributions or the redemption of fund shares. The performance of the S&P 500® Index, Lipper High Yield Bond Index and Barclays Capital U.S. Aggregate Bond Index does not reflect the deduction of fees associated with a mutual fund, such as investment management fees. Investors cannot invest directly in an index, although they can invest in its underlying securities. During the period shown, Rafferty Asset Management, LLC waived and/or reimbursed fees for various expenses. Had these waivers and/or reimbursements not been in effect, performance would have been lower.
The performance data shown represents past performance and does not guarantee future results.
Market Exposure2
| | | | |
Investment Type | | %
Net Assets | |
Investment Companies | | | 97.1% | |
Futures Contracts | | | (5.0)% | |
| | | | |
Total Exposure | | | 92.1% | |
| | | | |
“Market Exposure” includes the value of total investments (including the contract value of any derivatives) and excludes any short-term investments and cash equivalents divided by Net Assets.
| 1 | Commencement of operations. |
Evolution All-Cap Equity Fund
Performance Summary
Investment Objective: Seeks high appreciation on an annual basis consistent with a high tolerance for risk.

| | | | | | | | | | | | | | | | |
| | | Average Annual Total Return2 | |
| | | 1 Year | | | 3 Year | | | 5 Year | | | Since
Inception | |
Evolution All-Cap Equity Fund | | | (6.62 | )% | | | (4.34 | )% | | | (8.86 | )% | | | (2.22 | )% |
| | | | |
S&P 500® Index | | | 18.00 | % | | | 13.62 | % | | | 1.28 | % | | | 4.74 | % |
This chart illustrates the performance of a hypothetical $10,000 investment made at the Fund’s inception, and is not intended to imply any future performance. The returns shown do not reflect the deduction of taxes that a shareholder would pay on fund distributions or the redemption of fund shares. The performance of the S&P 500® Index does not reflect the deduction of fees associated with a mutual fund, such as investment management fees. Investors cannot invest directly in an index, although they can invest in its underlying securities. During the period shown, Rafferty Asset Management, LLC waived and/or reimbursed fees for various expenses. Had these waivers and/or reimbursements not been in effect, performance would have been lower.
The performance data shown represents past performance and does not guarantee future results.
Market Exposure2
| | | | |
Investment Type | | %
Net Assets | |
Common Stock | | | 82.3% | |
Investment Companies | | | 7.5% | |
| | | | |
Total Exposure | | | 89.8% | |
| | | | |
“Market Exposure” includes the value of total investments (including the contract value of any derivatives) and excludes any short-term investments and cash equivalents divided by Net Assets.
| 1 | Commencement of operations. |
Evolution Market Leaders Fund
Performance Summary
Investment Objective: Seeks high appreciation on an annual basis consistent with a high tolerance for risk.
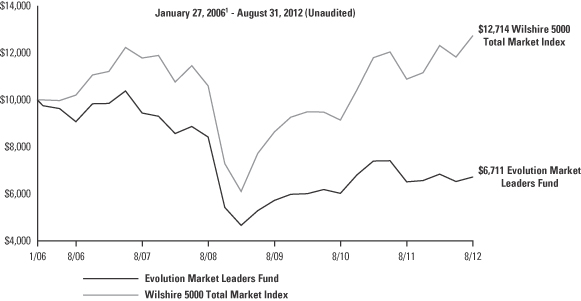
| | | | | | | | | | | | | | | | |
| | | Average Annual Total Return2 | |
| | | 1 Year | | | 3 Year | | | 5 Year | | | Since
Inception | |
Evolution Market Leaders Fund | | | 3.11 | % | | | 5.46 | % | | | (6.58 | )% | | | (5.87 | )% |
| | | | |
Wilshire 5000 Total Market Index | | | 16.92 | % | | | 13.76 | % | | | 1.54 | % | | | 3.71 | % |
This chart illustrates the performance of a hypothetical $10,000 investment made at the Fund’s inception, and is not intended to imply any future performance. The returns shown do not reflect the deduction of taxes that a shareholder would pay on fund distributions or the redemption of fund shares. The performance of the Wilshire 5000 Total Market Index does not reflect the deduction of fees associated with a mutual fund, such as investment management fees. Investors cannot invest directly in an index, although they can invest in its underlying securities. During the period shown, Rafferty Asset Management, LLC waived and/or reimbursed fees for various expenses. Had these waivers and/or reimbursements not been in effect, performance would have been lower.
The performance data shown represents past performance and does not guarantee future results.
Market Exposure2
| | | | |
Investment Type | | %
Net Assets | |
Investment Companies | | | 99.1% | |
| | | | |
Total Exposure | | | 99.1% | |
| | | | |
“Market Exposure” includes the value of total investments (including the contract value of any derivatives) and excludes any short-term investments and cash equivalents divided by Net Assets.
| 1 | Commencement of operations. |
Evolution Alternative Investment Fund
Performance Summary
Investment Objective: Seeks high total return on an annual basis consistent with a high tolerance for risk.
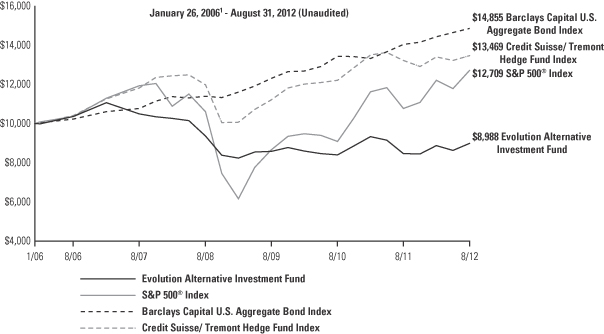
| | | | | | | | | | | | | | | | |
| | | Average Annual Total Return2 | |
| | | 1 Year | | | 3 Year | | | 5 Year | | | Since
Inception | |
Evolution Alternative Investment Fund | | | 6.15 | % | | | 1.55 | % | | | (3.05 | )% | | | (1.60 | )% |
| | | | |
S&P 500® Index | | | 18.00 | % | | | 13.62 | % | | | 1.28 | % | | | 3.70 | % |
| | | | |
Barclays Capital U.S. Aggregate Bond Index | | | 5.78 | % | | | 6.51 | % | | | 6.66 | % | | | 6.18 | % |
| | | | |
Credit Suisse/Tremont Hedge Fund Index | | | 1.90 | % | | | 6.31 | % | | | 2.67 | % | | | 4.61 | % |
This chart illustrates the performance of a hypothetical $10,000 investment made at the Fund’s inception, and is not intended to imply any future performance. The returns shown do not reflect the deduction of taxes that a shareholder would pay on fund distributions or the redemption of fund shares. The performance of the S&P 500® Index, the Barclays Capital U.S. Aggregate Bond Index and the Credit Suisse/Tremont Hedge Fund Index does not reflect the deduction of fees associated with a mutual fund, such as investment management fees. Investors cannot invest directly in an index, although they can invest in its underlying securities. During the period shown, Rafferty Asset Management, LLC waived and/or reimbursed fees for various expenses. Had these waivers and/or reimbursements not been in effect, performance would have been lower.
The performance data shown represents past performance and does not guarantee future results.
Market Exposure2
| | | | |
Investment Type | | %
Net Assets | |
Investment Companies | | | 89.4% | |
Futures Contracts | | | 14.9% | |
| | | | |
Total Exposure | | | 104.3% | |
| | | | |
“Market Exposure” includes the value of total investments (including the contract value of any derivatives) and excludes any short-term investments and cash equivalents divided by Net Assets.
| 1 | Commencement of operations. |
Expense Example
August 31, 2012 (Unaudited)
As a shareholder of a mutual fund, you incur two types of costs: (1) transaction costs, including sales charges (loads) on purchase payments, reinvested dividends, or other distributions; redemption fees and exchange fees; and (2) ongoing costs, including management fees; distribution and/or service fees; and other fund expenses. This example is intended to help you understand your ongoing costs (in dollars) of investing in a fund and to compare costs with the ongoing costs of investing in other mutual funds.
The example is based on an investment of $1,000 invested at the beginning of the period and held the entire period (March 1, 2012 — August 31, 2012).
Actual Expenses
The first line of the table below provides information about actual account values and actual expenses. You may use the information in this line, together with the amount you invested, to estimate the expenses that you paid over the period. Simply divide your account value by $1,000 (for example, an $8,600 account value divided by $1,000 = 8.6), then multiply the result by the number in the first line under the heading entitled “Expenses Paid During Period” to estimate the expenses you paid on your account during this period.
Hypothetical Example for Comparison Purposes
The second line of the table below provides information about hypothetical account values and hypothetical expenses based on the Funds’ actual expense ratios and an assumed rate of return of 5% per year before expenses, which is not the Funds’ actual return. The hypothetical account values and expenses may not be used to estimate the actual ending account balance or expenses you paid for the period. You may use this information to compare the ongoing costs of investing in the Funds and other funds. To do so, compare this 5% hypothetical example with the 5% hypothetical examples that appear in the shareholder reports of the other funds.
Please note that the expenses shown in the table are meant to highlight your ongoing costs only and do not reflect any transactional costs, such as wire transfers, returned checks or stop payment orders. Therefore, the second line of the table is useful in comparing ongoing costs only, and will not help you determine the relative costs of owning different funds. In addition, if these transactional costs were included, your costs would have been higher.
| | |
| | |
| 10 | | DIREXION ANNUAL REPORT |
Expense Example Table
August 31, 2012 (Unaudited)
| | | | | | | | | | | | | | | | |
| | | Expense
Ratio1 | | | Beginning
Account Value
March 1, 2012 | | | Ending
Account Value
August 31, 2012 | | | Expenses
Paid During
Period2 | |
Evolution Managed Bond Fund | | | | | | | | | | | | | | | | |
Based on actual fund return | | | 1.63 | % | | $ | 1,000.00 | | | $ | 1,031.20 | | | $ | 8.32 | |
Based on hypothetical 5% return | | | 1.63 | % | | | 1,000.00 | | | | 1,016.94 | | | | 8.26 | |
Evolution All-Cap Equity Fund | | | | | | | | | | | | | | | | |
Based on actual fund return | | | 1.62 | % | | | 1,000.00 | | | | 931.10 | | | | 7.86 | |
Based on hypothetical 5% return | | | 1.62 | % | | | 1,000.00 | | | | 1,016.99 | | | | 8.21 | |
Evolution Market Leaders Fund | | | | | | | | | | | | | | | | |
Based on actual fund return | | | 1.62 | % | | | 1,000.00 | | | | 982.90 | | | | 8.07 | |
Based on hypothetical 5% return | | | 1.62 | % | | | 1,000.00 | | | | 1,016.99 | | | | 8.21 | |
Evolution Alternative Investment Fund | | | | | | | | | | | | | | | | |
Based on actual fund return | | | 1.62 | % | | | 1,000.00 | | | | 1,013.10 | | | | 8.20 | |
Based on hypothetical 5% return | | | 1.62 | % | | | 1,000.00 | | | | 1,016.99 | | | | 8.21 | |
| 2 | Expenses are equal to the Fund’s annualized expense ratio, multiplied by the average account value over the period, multiplied by the number of days in the most recent fiscal half-year/period, then divided by 366. |
Allocation of Portfolio Holdings
August 31, 2012 (Unaudited)
| | | | | | | | | | | | | | | | | | | | |
| | | Cash* | | | Common Stock | | | Investment
Companies | | | Futures | | | Total | |
Evolution Managed Bond Fund | | | 3 | % | | | — | | | | 97 | % | | | 0 | %** | | | 100 | % |
Evolution All-Cap Equity Fund | | | 10 | % | | | 82 | % | | | 8 | % | | | — | | | | 100 | % |
Evolution Market Leaders Fund | | | 1 | % | | | — | | | | 99 | % | | | — | | | | 100 | % |
Evolution Alternative Investment Fund | | | 11 | % | | | — | | | | 89 | % | | | 0 | %** | | | 100 | % |
| * | Cash, cash equivalents and other assets less liabilities. |
| ** | Percentage is less than 0.5%. |
| | |
| |
| DIREXION ANNUAL REPORT | | 11 |
Evolution Managed Bond Fund
Schedule of Investments
August 31, 2012
| | | | | | | | |
Shares | | | | | Value | |
| INVESTMENT COMPANIES - 97.1% | |
| | 14,399 | | | AllianceBernstein Global High Income Fund, Inc. | | $ | 226,064 | |
| | 17,594 | | | BlackRock Corporate High Yield
Fund VI, Inc. | | | 228,018 | |
| | 20,194 | | | BlackRock Credit Allocation Fund, Inc. | | | 228,596 | |
| | 15,129 | | | BlackRock Floating Rate Income Strategies Fund, Inc. | | | 229,961 | |
| | 55,254 | | | iShares Barclays 1-3 Year Treasury Bond Fund | | | 4,669,516 | |
| | 23,305 | | | iShares Barclays 3-7 Year Treasury Bond Fund | | | 2,885,625 | |
| | 26,506 | | | iShares Barclays 7-10 Year Treasury Bond Fund | | | 2,888,889 | |
| | 37,962 | | | iShares Barclays 20+ Year Treasury Bond Fund | | | 4,848,507 | |
| | 36,945 | | | iShares Barclays Aggregate Bond Fund | | | 4,151,510 | |
| | 33,900 | | | iShares Barclays Short Treasury Bond Fund | | | 3,736,797 | |
| | 8,539 | | | iShares Barclays Treasury Inflation Protected Securities Fund | | | 1,034,414 | |
| | 117,400 | | | iShares iBoxx $ High Yield Corporate Bond Fund | | | 10,839,542 | |
| | 14,900 | | | iShares iBoxx $ Investment Grade Corporate Bond Fund | | | 1,800,367 | |
| | 30,028 | | | iShares S&P National AMT-Free Bond Fund | | | 3,352,026 | |
| | | | | | | | |
Shares | | | | | Value | |
| | 29,528 | | | MFS Charter Income Trust | | $ | 294,394 | |
| | 40,237 | | | MFS Government Markets Income Trust | | | 293,730 | |
| | 34,853 | | | MFS Intermediate Income Trust | | | 229,681 | |
| | 45,900 | | | PIMCO Total Return ETF | | | 4,942,512 | |
| | 39,960 | | | Putnam Premier Income Trust | | | 228,172 | |
| | 100,000 | | | SPDR Barclays Capital International Treasury Bond ETF | | | 6,045,000 | |
| | 13,126 | | | Templeton Emerging Markets Income Fund | | | 223,273 | |
| | 150,075 | | | Vanguard Total Bond Market ETF | | | 12,783,388 | |
| | 14,457 | | | Wells Fargo Advantage Multi-Sector Income Fund | | | 234,059 | |
| | 10,690 | | | Western Asset Emerging Markets Debt Fund, Inc. | | | 229,728 | |
| | 21,899 | | | Western Asset High Income Fund II | | | 229,282 | |
| | 17,442 | | | Western Asset/Claymore Inflation-Linked Opportunities & Income Fund | | | 233,374 | |
| | | | | | | | |
| | | | TOTAL INVESTMENT COMPANIES
(Cost $62,388,639) | | $ | 67,086,425 | |
| | | | | | | | |
| | | | TOTAL INVESTMENTS
(Cost $62,388,639) - 97.1% | | $ | 67,086,425 | |
| | | | Other Assets in Excess of
Liabilities - 2.9% | | | 1,989,162 | |
| | | | | | | | |
| | | | TOTAL NET ASSETS - 100.0% | | $ | 69,075,587 | |
| | | | | | | | |
Percentages are stated as a percent of net assets.
Short Futures Contracts
August 31, 2012
| | | | | | | | |
Contracts | | | | | Unrealized
Depreciation | |
| | 23 | | | U.S. Long Bond Index Future
Expiring Sept. 2012 (Underlying Face Amount at Market Value $3,461,500) | | $ | (43,942 | ) |
| | | | | | | | |
The accompanying notes are an integral part of these financial statements.
| | |
| | |
| 12 | | DIREXION ANNUAL REPORT |
Evolution All-Cap Equity Fund
Schedule of Investments
August 31, 2012
| | | | | | | | |
Shares | | | | | Value | |
| COMMON STOCKS - 82.3% | |
| Administrative and Support Services - 2.1% | |
| | 2,029 | | | Ctrip.com International, Ltd. ADR(a) | | $ | 32,728 | |
| | 2,208 | | | Portfolio Recovery Associates, Inc.(a) | | | 221,573 | |
| | | | | | | | |
| | | | | | | 254,301 | |
| | | | | | | | |
| Air Transportation - 0.2% | |
| | 694 | | | Alaska Air Group, Inc.(a) | | | 23,284 | |
| | | | | | | | |
| Ambulatory Health Care Services - 1.9% | |
| | 8,492 | | | Bio-Reference Laboratories, Inc.(a) | | | 221,811 | |
| | | | | | | | |
| Apparel Manufacturing - 4.2% | |
| | 3,791 | | | Under Armour, Inc. Class A(a) | | | 220,674 | |
| | 4,327 | | | UniFirst Corp. | | | 274,808 | |
| | | | | | | | |
| | | | | | | 495,482 | |
| | | | | | | | |
| Beverage and Tobacco Product Manufacturing - 0.2% | |
| | 238 | | | Anheuser-Busch InBev NV ADR (Belgium) | | | 20,035 | |
| | | | | | | | |
| Chemical Manufacturing - 9.6% | |
| | 408 | | | AstraZeneca plc ADR (United Kingdom) | | | 19,090 | |
| | 7,783 | | | Medifast, Inc.(a) | | | 217,068 | |
| | 321 | | | Novartis AG ADR (Switzerland) | | | 18,942 | |
| | 8,007 | | | Rentech Nitrogen Partners LP | | | 271,998 | |
| | 1,313 | | | Sanofi ADR | | | 53,767 | |
| | 18,123 | | | Shuffle Master, Inc.(a) | | | 274,926 | |
| | 4,808 | | | The Mosaic Co. | | | 278,431 | |
| | 115 | | | United Therapeutics Corp.(a) | | | 6,224 | |
| | | | | | | | |
| | | | | | | 1,140,446 | |
| | | | | | | | |
| Clothing and Clothing Accessories Stores - 0.1% | |
| | 291 | | | Collective Brands, Inc.(a) | | | 6,297 | |
| | | | | | | | |
| Computer and Electronic Product Manufacturing - 4.5% | |
| | 257 | | | Corelogic, Inc.(a) | | | 6,322 | |
| | 5,543 | | | Cubic Corp. | | | 279,866 | |
| | 2,454 | | | OYO Geospace Corp.(a) | | | 224,762 | |
| | 3,374 | | | Research In Motion Ltd.(a) | | | 22,572 | |
| | 94 | | | Stratasys, Inc.(a) | | | 6,078 | |
| | | | | | | | |
| | | | | | | 539,600 | |
| | | | | | | | |
| Construction of Buildings - 0.1% | |
| | 465 | | | PulteGroup, Inc.(a) | | | 6,361 | |
| | 190 | | | Toll Brothers, Inc.(a) | | | 6,217 | |
| | | | | | | | |
| | | | | | | 12,578 | |
| | | | | | | | |
| Credit Intermediation and Related Activities - 5.1% | |
| | 2,037 | | | Banco Bradesco S.A. ADR (Brazil) | | | 33,447 | |
| | 6,758 | | | Bank of the Ozarks, Inc. | | | 216,932 | |
| | 1,353 | | | BOK Financial Corp. | | | 77,892 | |
| | 2,043 | | | Itau Unibanco Holding S.A. ADR (Brazil) | | | 32,300 | |
| | 553 | | | HDFC Bank Ltd. ADR (India) | | | 18,570 | |
| | 340 | | | ViewPoint Financial Group, Inc. | | | 6,266 | |
| | 2,973 | | | World Acceptance Corp.(a) | | | 217,029 | |
| | | | | | | | |
| | | | | | | 602,436 | |
| | | | | | | | |
| Data Processing, Hosting and Related Services - 0.1% | |
| | 195 | | | AOL, Inc.(a) | | | 6,566 | |
| | | | | | | | |
| Educational Services - 0.2% | |
| | 2,421 | | | Bridgepoint Education, Inc.(a) | | | 23,871 | |
| | | | | | | | |
| | | | | | | | |
Shares | | | | | Value | |
| Electrical Equipment, Appliance, and Component
Manufacturing - 1.4% |
|
| | 4,328 | | | EnerSys(a) | | $ | 161,218 | |
| | | | | | | | |
| Food Manufacturing - 1.4% | |
| | 9,662 | | | Darling International, Inc.(a) | | | 160,582 | |
| | | | | | | | |
| General Merchandise Stores - 2.3% | | | | |
| | 2,794 | | | Costco Wholesale Corp. | | | 273,449 | |
| | | | | | | | |
| Health and Personal Care Stores - 2.3% | |
| | 5,034 | | | Vitamin Shoppe, Inc.(a) | | | 269,873 | |
| | | | | | | | |
| Hospitals - 0.2% | |
| | 3,389 | | | Health Management Associates, Inc.(a) | | | 25,960 | |
| | | | | | | | |
| Insurance Carriers and Related Activities - 0.7% | |
| | 1,725 | | | Assured Guaranty Ltd. | | | 22,770 | |
| | 60 | | | Everest Re Group, Ltd. | | | 6,220 | |
| | 334 | | | Fidelity National Financial, Inc. Class A | | | 6,292 | |
| | 327 | | | First American Financial Corp. | | | 6,301 | |
| | 994 | | | Lincoln National Corp. | | | 23,081 | |
| | 827 | | | Protective Life Corp. | | | 23,363 | |
| | | | | | | | |
| | | | | | | 88,027 | |
| | | | | | | | |
| Machinery Manufacturing - 2.4% | |
| | 332 | | | ASML Holding NV ADR (Netherlands) | | | 18,848 | |
| | 4,147 | | | Lindsay Corp. | | | 271,048 | |
| | | | | | | | |
| | | | | | | 289,896 | |
| | | | | | | | |
| Merchant Wholesalers, Durable Goods - 0.2% | |
| | 2,121 | | | American Axle & Manufacturing
Holdings, Inc.(a) | | | 23,692 | |
| | | | | | | | |
| Merchant Wholesalers, Nondurable Goods - 0.2% | |
| | 9,244 | | | SUPERVALU, Inc. | | | 22,001 | |
| | | | | | | | |
| Mining (except Oil and Gas) - 0.5% | |
| | 1,007 | | | AngloGold Ashanti Ltd. ADR (South Africa) | | | 32,123 | |
| | 1,967 | | | Vale S.A. ADR (Brazil) | | | 32,200 | |
| | | | | | | | |
| | | | | | | 64,323 | |
| | | | | | | | |
| Miscellaneous Manufacturing - 1.4% | |
| | 5,625 | | | Hanger, Inc.(a) | | | 160,931 | |
| | | | | | | | |
| Nonstore Retailers - 0.1% | |
| | 123 | | | IAC/InteractiveCorp | | | 6,376 | |
| | | | | | | | |
| Oil and Gas Extraction - 0.2% | |
| | 974 | | | Stone Energy Corp.(a) | | | 22,918 | |
| | | | | | | | |
| Paper Manufacturing - 0.2% | |
| | 326 | | | Domtar Corp. | | | 23,615 | |
| | | | | | | | |
| Petroleum and Coal Products Manufacturing - 5.4% | |
| | 805 | | | BP plc ADR (United Kingdom) | | | 33,858 | |
| | 4,018 | | | Exxon Mobil Corp. | | | 350,771 | |
| | 6,072 | | | HollyFrontier Corp. | | | 244,641 | |
| | 130 | | | Marathon Petroleum Corp. | | | 6,728 | |
| | 232 | | | Western Refining, Inc. | | | 6,489 | |
| | | | | | | | |
| | | | | | | 642,487 | |
| | | | | | | | |
| Pipeline Transportation - 0.1% | |
| | 73 | | | Plains All American Pipeline LP | | | 6,317 | |
| | | | | | | | |
| Primary Metal Manufacturing - 0.1% | |
| | 290 | | | Worthington Industries, Inc. | | | 6,061 | |
| | | | | | | | |
The accompanying notes are an integral part of these financial statements.
| | |
| |
| DIREXION ANNUAL REPORT | | 13 |
Evolution All-Cap Equity Fund
Schedule of Investments
August 31, 2012
| | | | | | | | |
Shares | | | | | Value | |
| COMMON STOCKS (continued) | |
| Printing and Related Support Activities - 0.2% | |
| | 2,058 | | | R.R. Donnelley & Sons Co. | | $ | 22,597 | |
| | | | | | | | |
| Professional, Scientific, and Technical Services - 1.8% | |
| | 7,864 | | | GP Strategies Corp.(a) | | | 157,673 | |
| | 114 | | | Solarwinds, Inc.(a) | | | 6,256 | |
| | 1,113 | | | Unisys Corp.(a) | | | 23,518 | |
| | 4,740 | | | United Online, Inc. | | | 23,605 | |
| | | | | | | | |
| | | | | | | 211,052 | |
| | | | | | | | |
| Publishing Industries (except Internet) - 3.4% | |
| | 1,538 | | | Gannett Co., Inc. | | | 23,470 | |
| | 9,866 | | | Mentor Graphics Corp.(a) | | | 163,085 | |
| | 7,748 | | | Retalix Ltd. (Spain)(a) | | | 158,834 | |
| | 828 | | | SAP AG ADR (Germany) | | | 54,366 | |
| | | | | | | | |
| | | | | | | 399,755 | |
| | | | | | | | |
| Rail Transportation - 2.0% | |
| | 3,376 | | | CSX Corp. | | | 75,825 | |
| | 1,057 | | | Norfolk Southern Corp. | | | 76,590 | |
| | 230 | | | RailAmerica, Inc.(a) | | | 6,302 | |
| | 628 | | | Union Pacific Corp. | | | 76,264 | |
| | | | | | | | |
| | | | | | | 234,981 | |
| | | | | | | | |
| Rental and Leasing Services - 0.4% | |
| | 1,476 | | | Avis Budget Group, Inc.(a) | | | 24,236 | |
| | 645 | | | Rent-A-Center, Inc. | | | 22,756 | |
| | | | | | | | |
| | | | | | | 46,922 | |
| | | | | | | | |
| Sporting Goods, Hobby, Musical Instrument, and Book
Stores - 1.9% |
|
| | 3,885 | | | Hibbett Sports, Inc.(a) | | | 225,485 | |
| | | | | | | | |
| Support Activities for Transportation - 2.3% | |
| | 8,152 | | | Forward Air Corp. | | | 274,070 | |
| | | | | | | | |
| Telecommunications - 3.8% | |
| | 771 | | | America Movil SAB de C.V. ADR (Mexico) | | | 19,730 | |
| | 10,285 | | | Blucora, Inc.(a) | | | 158,492 | |
| | 688 | | | BT Group plc ADR (United Kingdom) | | | 23,729 | |
| | 971 | | | China Mobile Ltd. ADR (China) | | | 52,133 | |
| | 5,561 | | | j2 Global, Inc. | | | 163,883 | |
| | 2,675 | | | Telefonica S.A. ADR (Spain) | | | 33,598 | |
| | | | | | | | |
| | | | | | | 451,565 | |
| | | | | | | | |
| | | | | | | | |
Shares | | | | | Value | |
| Transportation Equipment Manufacturing - 0.5% | |
| | 584 | | | LeapFrog Enterprises, Inc.(a) | | $ | 6,331 | |
| | 1,566 | | | Tata Motors Ltd. ADR (India) | | | 33,074 | |
| | 558 | | | TRW Automotive Holdings Corp.(a) | | | 24,390 | |
| | | | | | | | |
| | | | | | | 63,795 | |
| | | | | | | | |
| Utilities - 18.6% | |
| | 4,921 | | | American Electric Power Co., Inc. | | | 211,554 | |
| | 8,218 | | | Avista Corp. | | | 208,737 | |
| | 382 | | | Cia de Saneamento Basico do Estado de Sao Paulo ADR (Brazil) | | | 32,512 | |
| | 5,100 | | | Cleco Corp. | | | 208,743 | |
| | 3,572 | | | DTE Energy Co. | | | 208,605 | |
| | 3,057 | | | Entergy Corp. | | | 208,121 | |
| | 5,020 | | | IDACORP, Inc. | | | 208,079 | |
| | 7,188 | | | PPL Corp. | | | 210,824 | |
| | 6,555 | | | Public Service Enterprise Group, Inc. | | | 207,531 | |
| | 3,125 | | | Sempra Energy | | | 206,875 | |
| | 4,990 | | | The Laclede Group, Inc. | | | 210,827 | |
| | 2,022 | | | Wisconsin Energy Corp. | | | 76,755 | |
| | | | | | | | |
| | | | | | | 2,199,163 | |
| | | | | | | | |
| | | | TOTAL COMMON STOCKS
(Cost $9,741,715) | | $ | 9,723,888 | |
| | | | | | | | |
| INVESTMENT COMPANIES - 7.5% | |
| | 938 | | | iShares Barclays 20+ Year Treasury Bond Fund | | $ | 119,801 | |
| | 5,402 | | | iShares MSCI Pacific ex-Japan Index Fund | | | 234,339 | |
| | 19,210 | | | PowerShares S&P 500 Low Volatility Portfolio | | | 533,270 | |
| | | | | | | | |
| | | | TOTAL INVESTMENTS COMPANIES
(Cost $866,534) | | $ | 887,410 | |
| | | | | | | | |
| | | | TOTAL INVESTMENTS
(Cost $10,608,249) - 89.8% | | $ | 10,611,298 | |
| | | | Other Assets in Excess of
Liabilities - 10.2% | | | 1,209,982 | |
| | | | | | | | |
| | | | TOTAL NET ASSETS - 100.0% | | $ | 11,821,280 | |
| | | | | | | | |
Percentages are stated as a percent of net assets.
The accompanying notes are an integral part of these financial statements.
| | |
| | |
| 14 | | DIREXION ANNUAL REPORT |
Evolution Market Leaders Fund
Schedule of Investments
August 31, 2012
| | | | | | | | |
Shares | | | | | Value | |
| INVESTMENT COMPANIES - 99.1% | |
| | 123,600 | | | Consumer Staples Select Sector SPDR Fund | | $ | 4,382,856 | |
| | 503,700 | | | First Trust Morningstar Dividend Leaders Index Fund | | | 9,494,745 | |
| | 18,900 | | | First Trust NYSE Arca Biotechnology Index Fund(a) | | | 824,040 | |
| | 245,800 | | | Guggenheim Multi-Asset Income
Index ETF | | | 5,466,592 | |
| | 86,900 | | | Guggenheim Russell Top 50 ETF | | | 9,095,823 | |
| | 247,500 | | | iShares Dow Jones U.S. Home Construction Index Fund | | | 4,497,075 | |
| | 57,000 | | | iShares Dow Jones U.S. Real Estate Index Fund | | | 3,740,910 | |
| | 228,700 | | | iShares Dow Jones
U.S. Telecommunications Sector Index Fund | | | 5,511,670 | |
| | 365,700 | | | iShares FTSE NAREIT Mortgage Plus Capped Index Fund | | | 5,489,157 | |
| | 74,400 | | | iShares FTSE NAREIT Residential Plus Capped Index Fund | | | 3,642,326 | |
| | 47,000 | | | iShares Morningstar Large Core Index Fund | | | 3,794,310 | |
| | 107,000 | | | iShares Morningstar Large Growth Index Fund | | | 8,334,230 | |
| | 23,300 | | | iShares Morningstar Small Growth Index Fund | | | 2,156,695 | |
| | 6,100 | | | iShares Nasdaq Biotechnology Index Fund | | | 831,918 | |
| | 58,900 | | | iShares Russell Midcap Value Index Fund | | | 2,823,077 | |
| | 94,900 | | | iShares Russell Top 200 Growth Index Fund | | | 3,349,970 | |
| | 85,500 | | | iShares S&P 100 Index Fund | | | 5,558,355 | |
| | 162,200 | | | iShares S&P 500 Growth Index Fund | | | 12,419,654 | |
| | | | | | | | |
Shares | | | | | Value | |
| | 92,800 | | | iShares S&P Global Telecommunications Sector Index Fund | | $ | 5,516,960 | |
| | 56,300 | | | iShares S&P SmallCap 600 Growth Index Fund | | | 4,648,128 | |
| | 32,900 | | | iShares S&P SmallCap 600 Index Fund | | | 2,484,937 | |
| | 16,400 | | | Market Vectors Biotech ETF(a) | | | 835,580 | |
| | 192,400 | | | PowerShares Dynamic Large Cap Growth Portfolio | | | 3,574,792 | |
| | 193,000 | | | PowerShares High Yield Equity Dividend Achievers Portfolio | | | 1,823,850 | |
| | 182,000 | | | PowerShares QQQ Trust | | | 12,405,120 | |
| | 66,100 | | | SPDR S&P 500 Growth ETF | | | 4,379,786 | |
| | 22,800 | | | SPDR S&P 600 Small Cap ETF | | | 1,660,752 | |
| | 26,800 | | | SPDR S&P 600 Small Cap Growth ETF | | | 3,326,416 | |
| | 9,300 | | | SPDR S&P Biotech ETF(a) | | | 823,329 | |
| | 189,100 | | | SPDR S&P Homebuilders ETF | | | 4,460,869 | |
| | 87,000 | | | Vanguard High Dividend Yield ETF | | | 4,309,110 | |
| | 55,900 | | | Vanguard REIT ETF | | | 3,730,207 | |
| | 20,500 | | | Vanguard S&P 500 Growth ETF | | | 1,404,250 | |
| | 46,700 | | | Vanguard Small-Cap ETF | | | 3,639,798 | |
| | 78,400 | | | Vanguard Telecommunication Services ETF | | | 5,553,072 | |
| | 171,400 | | | WisdomTree Equity Income Fund | | | 7,956,388 | |
| | 32,600 | | | WisdomTree MidCap Dividend Fund | | | 1,832,120 | |
| | | | | | | | |
| | | | TOTAL INVESTMENT COMPANIES
(Cost $161,637,344) | | $ | 165,778,867 | |
| | | | | | | | |
| | | | TOTAL INVESTMENTS
(Cost $161,637,344) - 99.1% | | $ | 165,778,867 | |
| | | | Other Assets in Excess of
Liabilities - 0.9% | | | 1,575,270 | |
| | | | | | | | |
| | | | TOTAL NET ASSETS - 100.0% | | $ | 167,354,137 | |
| | | | | | | | |
Percentages are stated as a percent of net assets.
The accompanying notes are an integral part of these financial statements.
| | |
| |
| DIREXION ANNUAL REPORT | | 15 |
Evolution Alternative Investment Fund
Schedule of Investments
August 31, 2012
| | | | | | | | |
Shares | | | | | Value | |
| INVESTMENT COMPANIES - 89.4% | |
| | 44,520 | | | American Century Long-Short Market Neutral Fund(a) | | $ | 464,347 | |
| | 12,200 | | | Consumer Discretionary Select Sector SPDR Fund | | | 555,710 | |
| | 17,200 | | | Consumer Staples Select Sector SPDR Fund | | | 609,912 | |
| | 52,160 | | | Diamond Hill Long-Short Fund(a) | | | 918,534 | |
| | 94,329 | | | DWS Disciplined Market Neutral Fund(a) | | | 895,185 | |
| | 131,101 | | | DWS Enhanced Commodity Strategy Fund | | | 454,921 | |
| | 30,000 | | | EGShares Brazil Infrastructure Index Fund | | | 639,600 | |
| | 8,000 | | | First Trust Consumer Discretionary AlphaDEX Fund | | | 172,640 | |
| | 13,500 | | | First Trust Consumer Staples AlphaDEX Fund | | | 324,810 | |
| | 7,000 | | | First Trust Health Care AlphaDEX Fund | | | 218,050 | |
| | 44,200 | | | First Trust ISE Water Index Fund | | | 1,030,744 | |
| | 40,451 | | | First Trust Specialty Finance & Financial Opportunities Fund | | | 318,754 | |
| | 25,453 | | | Gateway Fund | | | 698,185 | |
| | 63,711 | | | Grant Park Managed Futures Strategy Fund(a) | | | 623,730 | |
| | 12,400 | | | Guggenheim S&P Global Water Index ETF | | | 260,152 | |
| | 63,719 | | | Harbor Commodity Real Return Strategy Fund | | | 477,257 | |
| | 20,393 | | | Hundredfold Select Alternative Fund | | | 482,096 | |
| | 83,865 | | | Invesco Balanced-Risk Allocation Fund | | | 1,083,534 | |
| | 23,200 | | | iPath S&P 500 Dynamic VIX ETN(a) | | | 1,298,968 | |
| | 9,200 | | | iShares Diversified Alternatives Trust(a) | | | 466,992 | |
| | 8,400 | | | iShares Dow Jones U.S. Consumer Services Sector Index Fund | | | 707,532 | |
| | 3,400 | | | iShares Dow Jones U.S. Financial Services Index Fund | | | 181,764 | |
| | 4,800 | | | iShares Dow Jones U.S. Healthcare Providers Index Fund | | | 320,064 | |
| | 54,500 | | | iShares Dow Jones U.S. Home Construction Index Fund | | | 990,265 | |
| | 6,600 | | | iShares Dow Jones U.S. Medical Devices Index Fund | | | 432,036 | |
| | 3,900 | | | iShares Dow Jones U.S. Pharmaceuticals Index Fund | | | 339,144 | |
| | 31,800 | | | iShares Dow Jones U.S. Regional Banks Index Fund | | | 786,096 | |
| | 28,100 | | | iShares Dow Jones U.S. Telecommunications Sector Index Fund | | | 677,210 | |
| | 60,600 | | | iShares FTSE NAREIT Mortgage Plus Capped Index Fund | | | 909,606 | |
| | 3,900 | | | iShares MSCI Austrailia Index Fund | | | 91,533 | |
| | 2,200 | | | iShares MSCI Israel Capped Investable Market Index Fund | | | 81,356 | |
| | 9,600 | | | iShares MSCI Malaysia Market Index Fund | | | 139,488 | |
| | 3,900 | | | iShares MSCI Mexico Investable Market Index Fund | | | 239,382 | |
| | 4,900 | | | iShares MSCI Poland Investable Market Index Fund | | | 119,511 | |
| | | | | | | | |
Shares | | | | | Value | |
| | 27,800 | | | iShares MSCI Singapore Market Index Fund | | $ | 365,014 | |
| | 5,100 | | | iShares MSCI Thailand Investable Market Index Fund | | | 360,315 | |
| | 11,800 | | | iShares MSCI Turkey Investable Market Index Fund | | | 657,614 | |
| | 2,300 | | | iShares NASDAQ Biotechnology Index Fund | | | 313,674 | |
| | 9,200 | | | iShares S&P 500 Index Fund | | | 1,305,296 | |
| | 21,900 | | | iShares S&P Developed ex-U.S. Property Index Fund | | | 716,349 | |
| | 6,000 | | | iShares S&P Emerging Markets Infrastructure Index Fund | | | 192,480 | |
| | 8,900 | | | iShares S&P Global Financials Sector Index Fund | | | 358,492 | |
| | 3,500 | | | iShares S&P Global Healthcare Sector Index Fund | | | 216,965 | |
| | 30,100 | | | iShares S&P Global Infrastructure Index Fund | | | 1,036,945 | |
| | 2,900 | | | iShares S&P Global Telecommunications Sector Index Fund | | | 172,405 | |
| | 13,000 | | | iShares S&P North American Technology-Multimedia Networking Index Fund | | | 341,770 | |
| | 6,770 | | | Market Vectors Biotech ETF(a) | | | 344,932 | |
| | 2,000 | | | Market Vectors Brazil Small Cap ETF | | | 78,400 | |
| | 11,000 | | | Market Vectors Pharmaceutical ETF(a) | | | 436,315 | |
| | 4,700 | | | Market Vectors Russia ETF | | | 127,135 | |
| | 87,951 | | | MutualHedge Frontier Legends Fund | | | 884,792 | |
| | 22,049 | | | Permanent Portfolio | | | 1,065,633 | |
| | 69,232 | | | PIMCO Commodity Real Return Strategy Fund | | | 476,318 | |
| | 44,700 | | | PowerShares Dynamic Media Portfolio | | | 709,836 | |
| | 9,700 | | | PowerShares Dynamic Pharmaceuticals Portfolio | | | 324,756 | |
| | 6,500 | | | PowerShares Dynamic Retail Portfolio | | | 164,970 | |
| | 4,700 | | | PowerShares Dynamic Software Portfolio(a) | | | 128,028 | |
| | 76,800 | | | PowerShares Global Water Portfolio | | | 1,297,152 | |
| | 8,100 | | | Proshares Ultra Short China 25(a) | | | 226,006 | |
| | 2,400 | | | Proshares Ultra Short Semiconductors(a) | | | 91,536 | |
| | 7,600 | | | Proshares Ultra Short Technology(a) | | | 613,548 | |
| | 37,406 | | | Schooner Fund | | | 893,253 | |
| | 9,700 | | | Schwab U.S. REIT ETF | | | 300,409 | |
| | 10,020 | | | Sierra Core Retirement Fund | | | 235,578 | |
| | 2,300 | | | SPDR Dow Jones REIT ETF | | | 170,315 | |
| | 13,200 | | | SPDR FTSE/Macquarie Global Infrastructure 100 ETF | | | 523,908 | |
| | 3,400 | | | SPDR S&P Biotech ETF(a) | | | 301,002 | |
| | 41,600 | | | SPDR S&P Homebuilders ETF | | | 981,344 | |
| | 7,300 | | | SPDR S&P Insurance ETF | | | 304,410 | |
| | 9,300 | | | SPDR S&P Regional Banking ETF | | | 258,447 | |
| | 9,800 | | | SPDR S&P Retail ETF | | | 600,054 | |
| | 56,632 | | | TFS Market Neutral Fund | | | 868,165 | |
| | 4,400 | | | Technology Select Sector SPDR Fund | | | 134,156 | |
| | 5,500 | | | Vanguard Consumer Discretionary ETF | | | 399,850 | |
| | 4,300 | | | Vanguard Consumer Staples ETF | | | 387,645 | |
| | 4,000 | | | Vanguard Financials ETF | | | 128,240 | |
| | 5,900 | | | Vanguard Global ex-U.S. Real Estate
Index ETF | | | 299,425 | |
| | 1,800 | | | Vanguard Information Technology ETF | | | 130,734 | |
The accompanying notes are an integral part of these financial statements.
| | |
| | |
| 16 | | DIREXION ANNUAL REPORT |
Evolution Alternative Investment Fund
Schedule of Investments
August 31, 2012
| | | | | | | | |
Shares | | | | | Value | |
| INVESTMENT COMPANIES (continued) | |
| | 2,000 | | | Vanguard REIT ETF | | $ | 133,460 | |
| | 26,800 | | | WisdomTree Global ex-US Real Estate Fund | | | 752,544 | |
| | | | | | | | |
| | | | TOTAL INVESTMENT COMPANIES
(Cost $37,441,702) - 89.4% | | $ | 38,818,723 | |
| | | | | | | | |
| | | | TOTAL INVESTMENTS
(Cost $37,441,702) - 89.4% | | $ | 38,818,723 | |
| | | | Other Assets in Excess of
Liabilities - 10.6% | | | 4,599,712 | |
| | | | | | | | |
| | | | TOTAL NET ASSETS - 100.0% | | $ | 43,418,435 | |
| | | | | | | | |
Percentages are stated as a percent of net assets.
Long Futures Contracts
August 31, 2012
| | | | | | | | |
Contracts | | | | | Unrealized
Appreciation | |
| | 117 | | | E-Mini NASDAQ-100® Futures | | | | |
| | | | Expiring September 2012 (Underlying Face Amount at Market Value $6,487,065) | | $ | 156,198 | |
| | | | | | | | |
The accompanying notes are an integral part of these financial statements.
| | |
| |
| DIREXION ANNUAL REPORT | | 17 |
Statements of Assets and Liabilities
August 31, 2012
| | | | | | | | |
| | | Evolution Managed
Bond Fund | | | Evolution All-Cap
Equity Fund | |
Assets: | | | | | | | | |
Investments, at market value (Note 2) | | $ | 67,086,425 | | | $ | 10,611,298 | |
Cash | | | 1,774,561 | | | | 1,129,353 | |
Receivables: | | | | | | | | |
Fund shares sold | | | 7,640 | | | | 930 | |
Investment securities sold | | | 1,397,403 | | | | 109,938 | |
Deposits at broker for futures | | | 95,565 | | | | — | |
Dividends and interest | | | 13,005 | | | | 26,525 | |
| | | | | | | | |
Total assets | | | 70,374,599 | | | | 11,878,044 | |
| | | | | | | | |
Liabilities: | | | | | | | | |
Payables: | | | | | | | | |
Fund shares redeemed | | | 18,862 | | | | — | |
Investment securities purchased | | | 1,136,301 | | | | 38,738 | |
Due to broker for futures | | | 23,719 | | | | — | |
Variation margin | | | 20,125 | | | | — | |
Accrued investment advisory fees | | | 47,058 | | | | 8,248 | |
Accrued operating services fees | | | 24,206 | | | | 3,830 | |
Accrued distribution expense | | | 18,074 | | | | 4,925 | |
Accrued shareholder servicing fees | | | 10,667 | | | | 1,023 | |
| | | | | | | | |
Total liabilities | | | 1,299,012 | | | | 56,764 | |
| | | | | | | | |
Net Assets | | $ | 69,075,587 | | | $ | 11,821,280 | |
| | | | | | | | |
Net Assets Consist Of: | | | | | | | | |
Capital stock | | $ | 65,975,380 | | | $ | 33,543,557 | |
Undistributed net investment income | | | 134,094 | | | | 6,186 | |
Accumulated net realized loss | | | (1,687,731 | ) | | | (21,731,512 | ) |
Net unrealized appreciation (depreciation) on: | | | | | | | | |
Investments | | | 4,697,786 | | | | 3,049 | |
Futures | | | (43,942 | ) | | | — | |
| | | | | | | | |
Total Net Assets | | $ | 69,075,587 | | | $ | 11,821,280 | |
| | | | | | | | |
Calculation of Net Asset Value Per Share: | | | | | | | | |
Net assets | | $ | 69,075,587 | | | $ | 11,821,280 | |
Shares outstanding (unlimited shares of beneficial interest authorized, no par value) | | | 3,806,572 | | | | 910,578 | |
Net asset value, redemption and offering price per share | | $ | 18.15 | | | $ | 12.98 | |
| | | | | | | | |
Cost of Investments | | $ | 62,388,639 | | | $ | 10,608,249 | |
| | | | | | | | |
The accompanying notes are an integral part of these financial statements.
| | |
| | |
| 18 | | DIREXION ANNUAL REPORT |
Statements of Assets and Liabilities
August 31, 2012
| | | | | | | | |
| | | Evolution Market
Leaders Fund | | | Evolution Alternative
Investment Fund | |
Assets: | | | | | | | | |
Investments, at market value (Note 2) | | $ | 165,778,867 | | | $ | 38,818,723 | |
Cash | | | 1,761,642 | | | | 4,501,650 | |
Receivables: | | | | | | | | |
Fund shares sold | | | 47,199 | | | | 5,359 | |
Investment securities sold | | | 9,982,913 | | | | 2,732,554 | |
Deposits at broker for futures | | | — | | | | 75,410 | |
Due from broker for futures | | | — | | | | 158,590 | |
Variation margin | | | — | | | | 43,290 | |
| | | | | | | | |
Total assets | | | 177,570,621 | | | | 46,335,576 | |
| | | | | | | | |
Liabilities: | | | | | | | | |
Payables: | | | | | | | | |
Due to custodian | | | 250 | | | | — | |
Fund shares redeemed | | | 24,035 | | | | 15,571 | |
Investment securities purchased | | | 9,954,073 | | | | 2,842,285 | |
Accrued investment advisory fees | | | 113,419 | | | | 29,685 | |
Accrued operating services fees | | | 59,045 | | | | 15,085 | |
Accrued distribution expense | | | 39,366 | | | | 10,017 | |
Accrued shareholder servicing fees | | | 26,296 | | | | 4,498 | |
| | | | | | | | |
Total liabilities | | | 10,216,484 | | | | 2,917,141 | |
| | | | | | | | |
Net Assets | | $ | 167,354,137 | | | $ | 43,418,435 | |
| | | | | | | | |
Net Assets Consist Of: | | | | | | | | |
Capital stock | | $ | 164,906,589 | | | $ | 49,915,347 | |
Undistributed net investment income | | | — | | | | 72,703 | |
Accumulated net realized loss | | | (1,693,975 | ) | | | (8,102,834 | ) |
Net unrealized appreciation (depreciation) on: | | | | | | | | |
Investments | | | 4,141,523 | | | | 1,377,021 | |
Futures | | | — | | | | 156,198 | |
| | | | | | | | |
Total Net Assets | | $ | 167,354,137 | | | $ | 43,418,435 | |
| | | | | | | | |
Calculation of Net Asset Value Per Share: | | | | | | | | |
Net assets | | $ | 167,354,137 | | | $ | 43,418,435 | |
Shares outstanding (unlimited shares of beneficial interest authorized, no par value) | | | 12,632,330 | | | | 2,675,040 | |
Net asset value, redemption and offering price per share | | $ | 13.25 | | | $ | 16.23 | |
| | | | | | | | |
Cost of Investments | | $ | 161,637,344 | | | $ | 37,441,702 | |
| | | | | | | | |
The accompanying notes are an integral part of these financial statements.
| | |
| |
| DIREXION ANNUAL REPORT | | 19 |
Statements of Operations
For the Year Ended August 31, 2012
| | | | | | | | |
| | | Evolution Managed
Bond Fund | | | Evolution All-Cap
Equity Fund | |
Investment Income: | | | | | | | | |
Dividend income (net of foreign withholding tax of $- and $532, respectively) | | $ | 2,013,650 | | | $ | 266,256 | |
Interest income | | | 1,594 | | | | 1,126 | |
| | | | | | | | |
Total investment income | | | 2,015,244 | | | | 267,382 | |
| | | | | | | | |
Expenses: | | | | | | | | |
Investment advisory fees | | | 734,487 | | | | 156,442 | |
Operating services fees | | | 331,581 | | | | 70,361 | |
Distribution expenses | | | 183,622 | | | | 39,111 | |
Shareholder servicing fees | | | 110,173 | | | | 23,466 | |
| | | | | | | | |
Total expenses before interest and expenses waived | | | 1,359,863 | | | | 289,380 | |
Interest on line of credit | | | 11,268 | | | | 354 | |
Less: Expenses waived by Adviser | | | (89,157 | ) | | | (19,649 | ) |
| | | | | | | | |
Total expenses | | | 1,281,974 | | | | 270,085 | |
| | | | | | | | |
Net investment income (loss) | | | 733,270 | | | | (2,703 | ) |
| | | | | | | | |
Realized and unrealized gain (loss) on investments: | | | | | | | | |
Net realized gain (loss) on: | | | | | | | | |
Investments | | | 2,440,515 | | | | (867,755 | ) |
Futures | | | 410,643 | | | | (198,490 | ) |
Contributions by affiliates (Note 4) | | | — | | | | 3,772 | |
| | | | | | | | |
| | | 2,851,158 | | | | (1,062,473 | ) |
| | | | | | | | |
Capital gain distributions from regulated investment companies | | | 192,322 | | | | 1,563 | |
| | | | | | | | |
Change in net unrealized appreciation (depreciation) on: | | | | | | | | |
Investments | | | 534,596 | | | | (437,621 | ) |
Futures | | | (50,874 | ) | | | 9,912 | |
| | | | | | | | |
| | | 483,722 | | | | (427,709 | ) |
| | | | | | | | |
Net realized and unrealized gain (loss) on investments | | | 3,527,202 | | | | (1,488,619 | ) |
| | | | | | | | |
Net increase (decrease) in net assets resulting from operations | | $ | 4,260,472 | | | $ | (1,491,322 | ) |
| | | | | | | | |
The accompanying notes are an integral part of these financial statements.
| | |
| | |
| 20 | | DIREXION ANNUAL REPORT |
Statements of Operations
For the Year Ended August 31, 2012
| | | | | | | | |
| | | Evolution Market
Leaders Fund | | | Evolution Alternative
Investment Fund | |
Investment Income: | | | | | | | | |
Dividend income (net of foreign withholding tax of $- and $19, respectively) | | $ | 2,289,244 | | | $ | 716,433 | |
Interest income | | | 12,579 | | | | 5,274 | |
| | | | | | | | |
Total investment income | | | 2,301,823 | | | | 721,707 | |
| | | | | | | | |
Expenses: | | | | | | | | |
Investment advisory fees | | | 1,509,141 | | | | 452,699 | |
Operating services fees | | | 668,134 | | | | 199,885 | |
Distribution expenses | | | 377,285 | | | | 113,175 | |
Shareholder servicing fees | | | 226,371 | | | | 67,905 | |
| | | | | | | | |
Total expenses before interest and expenses waived | | | 2,780,931 | | | | 833,664 | |
Interest on line of credit | | | 2,935 | | | | 649 | |
Less: Expenses waived by Adviser | | | (216,093 | ) | | | (66,159 | ) |
| | | | | | | | |
Total expenses | | | 2,567,773 | | | | 768,154 | |
| | | | | | | | |
Net investment loss | | | (265,950 | ) | | | (46,447 | ) |
| | | | | | | | |
Realized and unrealized gain (loss) on investments: | | | | | | | | |
Net realized gain on: | | | | | | | | |
Investments | | | 2,632,243 | | | | 115,585 | |
Futures | | | — | | | | 1,839,595 | |
Swaps | | | — | | | | 27,433 | |
Contributions by affiliates (Note 4) | | | — | | | | 45,396 | |
| | | | | | | | |
| | | 2,632,243 | | | | 2,028,009 | |
| | | | | | | | |
Capital gain distributions from regulated investment companies | | | — | | | | 96,470 | |
| | | | | | | | |
Change in net unrealized appreciation on: | | | | | | | | |
Investments | | | 2,137,948 | | | | 961,681 | |
Futures | | | — | | | | 168,044 | |
| | | | | | | | |
| | | 2,137,948 | | | | 1,129,725 | |
| | | | | | | | |
Net realized and unrealized gain on investments | | | 4,770,191 | | | | 3,254,204 | |
| | | | | | | | |
Net increase in net assets resulting from operations | | $ | 4,504,241 | | | $ | 3,207,757 | |
| | | | | | | | |
The accompanying notes are an integral part of these financial statements.
| | |
| |
| DIREXION ANNUAL REPORT | | 21 |
Statements of Changes in Net Assets
| | | | | | | | | | | | | | | | |
| | | Evolution Managed Bond Fund | | | Evolution All-Cap Equity Fund | |
| | | Year Ended
August 31, 2012 | | | Year Ended
August 31, 2011 | | | Year Ended
August 31, 2012 | | | Year Ended
August 31, 2011 | |
Increase (Decrease) in net assets from: | | | | | | | | | | | | | | | | |
Operations: | | | | | | | | | | | | | | | | |
Net investment income (loss) | | $ | 733,270 | | | $ | 980,697 | | | $ | (2,703 | ) | | $ | (175,840 | ) |
Net realized gain (loss) on investments | | | 2,851,158 | | | | 137,911 | | | | (1,062,473 | ) | | | 325,471 | |
Capital gain distributions from regulated investment companies | | | 192,322 | | | | 238,086 | | | | 1,563 | | | | — | |
Change in net unrealized appreciation (depreciation) on investments | | | 483,722 | | | | 84,901 | | | | (427,709 | ) | | | 286,381 | |
| | | | | | | | | | | | | | | | |
Net increase (decrease) in net assets resulting from operations | | | 4,260,472 | | | | 1,441,595 | | | | (1,491,322 | ) | | | 436,012 | |
| | | | | | | | | | | | | | | | |
Distributions to shareholders: | | | | | | | | | | | | | | | | |
Net investment income | | | (1,262,242 | ) | | | (911,640 | ) | | | — | | | | — | |
| | | | | | | | | | | | | | | | |
Total distributions to shareholders | | | (1,262,242 | ) | | | (911,640 | ) | | | — | | | | — | |
| | | | | | | | | | | | | | | | |
Capital share transactions: | | | | | | | | | | | | | | | | |
Net increase (decrease) in net assets resulting from net change in capital share transactions(a) | | | 2,935,155 | | | | 9,853,046 | | | | (7,132,367 | ) | | | 8,654,112 | |
| | | | | | | | | | | | | | | | |
Total increase (decrease) in net assets | | | 5,933,385 | | | | 10,383,001 | | | | (8,623,689 | ) | | | 9,090,124 | |
| | | | | | | | | | | | | | | | |
Net assets: | | | | | | | | | | | | | | | | |
Beginning of year | | | 63,142,202 | | | | 52,759,201 | | | | 20,444,969 | | | | 11,354,845 | |
| | | | | | | | | | | | | | | | |
End of year | | $ | 69,075,587 | | | $ | 63,142,202 | | | $ | 11,821,280 | | | $ | 20,444,969 | |
| | | | | | | | | | | | | | | | |
Undistributed net investment income, end of year | | $ | 134,094 | | | $ | 573,365 | | | $ | 6,186 | | | $ | — | |
| | | | | | | | | | | | | | | | |
| (a) | Summary of capital share transactions is as follows: |
| | | | | | | | | | | | | | | | | | | | | | | | | | | | | | | | |
| | | Evolution Managed Bond Fund | | | Evolution All-Cap Equity Fund | |
| | | Year Ended
August 31, 2012 | | | Year Ended
August 31, 2011 | | | Year Ended
August 31, 2012 | | | Year Ended
August 31, 2011 | |
| | | Shares | | | Value | | | Shares | | | Value | | | Shares | | | Value | | | Shares | | | Value | |
| | | | | | | | | | | | | | | | | | | | | | | | | | | | | | | | |
Shares sold | | | 13,277,179 | | | $ | 234,926,811 | | | | 8,332,132 | | | $ | 142,306,590 | | | | 1,138,362 | | | $ | 15,474,078 | | | | 2,407,735 | | | $ | 36,266,754 | |
Shares issued in reinvestment of distributions | | | 71,589 | | | | 1,262,232 | | | | 54,021 | | | | 911,640 | | | | — | | | | — | | | | — | | | | — | |
Shares redeemed | | | (13,141,151 | ) | | | (233,253,888 | ) | | | (7,795,613 | ) | | | (133,365,184 | ) | | | (1,698,370 | ) | | | (22,606,445 | ) | | | (1,880,397 | ) | | | (27,612,642 | ) |
| | | | | | | | | | | | | | | | | | | | | | | | | | | | | | | | |
Net increase (decrease) | | | 207,617 | | | $ | 2,935,155 | | | | 590,540 | | | $ | 9,853,046 | | | | (560,008 | ) | | $ | (7,132,367 | ) | | | 527,338 | | | $ | 8,654,112 | |
| | | | | | | | | | | | | | | | | | | | | | | | | | | | | | | | |
The accompanying notes are an integral part of these financial statements.
| | |
| | |
| 22 | | DIREXION ANNUAL REPORT |
Statements of Changes in Net Assets
| | | | | | | | | | | | | | | | |
| | | Evolution Market Leaders Fund | | | Evolution Alternative
Investment Fund | |
| | | Year Ended
August 31, 2012 | | | Year Ended
August 31, 2011 | | | Year Ended
August 31, 2012 | | | Year Ended
August 31, 2011 | |
Increase (Decrease) in net assets from: | | | | | | | | | | | | | | | | |
Operations: | | | | | | | | | | | | | | | | |
Net investment loss | | $ | (265,950 | ) | | $ | (939,360 | ) | | $ | (46,447 | ) | | $ | (432,839 | ) |
Net realized gain (loss) on investments | | | 2,632,243 | | | | 555,858 | | | | 2,028,009 | | | | (587,003 | ) |
Capital gain distributions from regulated investment companies | | | — | | | | 306,237 | | | | 96,470 | | | | 437,775 | |
Change in net unrealized appreciation (depreciation) on investments | | | 2,137,948 | | | | 4,002,000 | | | | 1,129,725 | | | | (555,052 | ) |
| | | | | | | | | | | | | | | | |
Net increase (decrease) in net assets resulting from operations | | | 4,504,241 | | | | 3,924,735 | | | | 3,207,757 | | | | (1,137,119 | ) |
| | | | | | | | | | | | | | | | |
Distributions to shareholders: | | | | | | | | | | | | | | | | |
Net investment income | | | — | | | | (242,010 | ) | | | — | | | | — | |
| | | | | | | | | | | | | | | | |
Total distributions to shareholders | | | — | | | | (242,010 | ) | | | — | | | | — | |
| | | | | | | | | | | | | | | | |
Capital share transactions: | | | | | | | | | | | | | | | | |
Net increase (decrease) in net assets resulting from net change in capital share transactions(a) | | | 29,881,409 | | | | 35,700,458 | | | | (1,571,852 | ) | | | 10,794,891 | |
| | | | | | | | | | | | | | | | |
Total increase in net assets | | | 34,385,650 | | | | 39,383,183 | | | | 1,635,905 | | | | 9,657,772 | |
| | | | | | | | | | | | | | | | |
Net assets: | | | | | | | | | | | | | | | | |
Beginning of year | | | 132,968,487 | | | | 93,585,304 | | | | 41,782,530 | | | | 32,124,758 | |
| | | | | | | | | | | | | | | | |
End of year | | $ | 167,354,137 | | | $ | 132,968,487 | | | $ | 43,418,435 | | | $ | 41,782,530 | |
| | | | | | | | | | | | | | | | |
Undistributed net investment income, end of year | | $ | — | | | $ | — | | | $ | 72,703 | | | $ | — | |
| | | | | | | | | | | | | | | | |
| (a) | Summary of capital share transactions is as follows: |
| | | | | | | | | | | | | | | | | | | | | | | | | | | | | | | | |
| | | Evolution Market Leaders Fund | | | Evolution Alternative Investment Fund | |
| | | Year Ended
August 31, 2012 | | | Year Ended
August 31, 2011 | | | Year Ended
August 31, 2012 | | | Year Ended
August 31, 2011 | |
| | | Shares | | | Value | | | Shares | | | Value | | | Shares | | | Value | | | Shares | | | Value | |
Shares sold | | | 21,180,265 | | | $ | 277,289,289 | | | | 11,322,168 | | | $ | 158,854,601 | | | | 5,405,430 | | | $ | 84,721,995 | | | | 4,757,580 | | | $ | 77,961,447 | |
Shares issued in reinvestment of distributions | | | — | | | | — | | | | 17,176 | | | | 242,010 | | | | — | | | | — | | | | — | | | | — | |
Shares redeemed | | | (18,894,813 | ) | | | (247,407,880 | ) | | | (8,843,764 | ) | | | (123,396,153 | ) | | | (5,462,885 | ) | | | (86,293,847 | ) | | | (4,146,064 | ) | | | (67,166,556 | ) |
| | | | | | | | | | | | | | | | | | | | | | | | | | | | | | | | |
Net increase (decrease) | | | 2,285,452 | | | $ | 29,881,409 | | | | 2,495,580 | | | $ | 35,700,458 | | | | (57,455 | ) | | $ | (1,571,852 | ) | | | 611,516 | | | $ | 10,794,891 | |
| | | | | | | | | | | | | | | | | | | | | | | | | | | | | | | | |
The accompanying notes are an integral part of these financial statements.
| | |
| |
| DIREXION ANNUAL REPORT | | 23 |
Financial Highlights
August 31, 2012
| | | | | | | | | | | | | | | | | | | | | | | | | | | | | | | | | | | | | | | | | | | | | | | | | | | | | | | | | | | | |
| | | | | | | | | | | | | | | | | | | | | | | | | | | | | | | | | | | | Ratios to Average Net Assets | |
| | | Net Asset
Value,
Beginning
of Year/Period | | | Net
Investment
Income (Loss)2 | | | Net Realized
and
Unrealized
Gain (Loss) on
Investments | | | Net Increase
(Decrease) in
Net Asset
Value Resulting
from Operations | | | Dividends
from Net
Investment
Income | | | Distributions
from
Realized
Capital Gains | | | Return of
Capital
Distribution | | | Total
Distributions | | | Net Asset
Value,
End of
Year/Period | | | Total
Return3 | | | Net Assets,
End of
Year/Period
(,000) | | | Total
Expenses1 | | | Net
Expenses1 | | | Net Investment
Income (Loss)
After Expense
Reimbursement/
Recoupment1 | | | Portfolio
Turnover
Rate4 | |
Evolution Managed Bond Fund | |
Year Ended August 31, 2012 | | $ | 17.54 | | | $ | 0.18 | | | $ | 0.64 | | | $ | 0.82 | | | $ | (0.21 | ) | | $ | — | | | $ | — | | | $ | (0.21 | ) | | $ | 18.15 | | | | 4.74% | | | $ | 69,076 | | | | 1.87% | | | | 1.75% | | | | 1.00% | | | | 496% | |
Year ended August 31, 2011 | | | 17.54 | | | | 0.25 | | | | (0.02 | ) | | | 0.23 | | | | (0.23 | ) | | | — | | | | — | | | | (0.23 | ) | | | 17.54 | | | | 1.36% | | | | 63,142 | | | | 1.91% | | | | 1.91% | | | | 1.48% | | | | 506% | |
Year ended August 31, 2010 | | | 16.57 | | | | 0.34 | | | | 0.93 | | | | 1.27 | | | | (0.30 | ) | | | — | | | | — | | | | (0.30 | ) | | | 17.54 | | | | 7.78% | | | | 52,759 | | | | 1.91% | | | | 1.91% | | | | 2.02% | | | | 390% | |
Year ended August 31, 2009 | | | 16.41 | | | | 0.37 | | | | 0.12 | | | | 0.49 | | | | (0.33 | ) | | | — | | | | — | | | | (0.33 | ) | | | 16.57 | | | | 3.04% | | | | 47,765 | | | | 1.88% | | | | 1.87% | | | | 2.32% | | | | 425% | |
Year ended August 31, 2008 | | | 16.83 | | | | 0.59 | | | | (0.30 | ) | | | 0.29 | | | | (0.71 | ) | | | — | | | | — | | | | (0.71 | ) | | | 16.41 | | | | 1.78% | | | | 26,242 | | | | 1.90% | | | | 1.75% | | | | 3.51% | | | | 439% | |
Evolution All-Cap Equity Fund | |
Year Ended August 31, 2012 | | | 13.90 | | | | — | | | | (0.92 | ) | | | (0.92 | ) | | | — | | | | — | | | | — | | | | — | | | | 12.98 | | | | (6.62% | )5 | | | 11,821 | | | | 1.85% | | | | 1.73% | | | | (0.01% | ) | | | 1,542% | |
Year ended August 31, 2011 | | | 12.04 | | | | (0.14 | ) | | | 2.00 | | | | 1.86 | | | | — | | | | — | | | | — | | | | — | | | | 13.90 | | | | 15.45% | | | | 20,445 | | | | 1.90% | | | | 1.90% | | | | (0.96% | ) | | | 1,415% | |
Year ended August 31, 2010 | | | 14.83 | | | | (0.09 | ) | | | (2.70 | ) | | | (2.79 | ) | | | — | | | | — | | | | — | | | | — | | | | 12.04 | | | | (18.81% | ) | | | 11,355 | | | | 1.90% | | | | 1.90% | | | | (0.65% | ) | | | 1,677% | |
Year ended August 31, 2009 | | | 18.55 | | | | (0.07 | ) | | | (3.65 | ) | | | (3.72 | ) | | | — | | | | — | | | | — | | | | — | | | | 14.83 | | | | (20.05% | ) | | | 43,472 | | | | 1.87% | | | | 1.85% | | | | (0.48% | ) | | | 1,977% | |
Year ended August 31, 2008 | | | 24.31 | | | | (0.06 | ) | | | (1.96 | ) | | | (2.02 | ) | | | — | | | | (3.74 | ) | | | — | | | | (3.74 | ) | | | 18.55 | | | | (10.07% | ) | | | 35,137 | | | | 1.84% | | | | 1.75% | | | | (0.27% | ) | | | 1,374% | |
Evolution Market Leaders Fund | |
Year Ended August 31, 2012 | | | 12.85 | | | | (0.02 | ) | | | 0.42 | | | | 0.40 | | | | — | | | | — | | | | — | | | | — | | | | 13.25 | | | | 3.11% | | | | 167,354 | | | | 1.84% | | | | 1.70% | | | | (0.18% | ) | | | 1,315% | |
Year ended August 31, 2011 | | | 11.92 | | | | (0.11 | ) | | | 1.07 | | | | 0.96 | | | | (0.03 | ) | | | — | | | | — | | | | (0.03 | ) | | | 12.85 | | | | 8.04% | | | | 132,968 | | | | 1.90% | | | | 1.90% | | | | (0.76% | ) | | | 781% | |
Year ended August 31, 2010 | | | 11.35 | | | | (0.04 | ) | | | 0.64 | | | | 0.60 | | | | (0.03 | ) | | | — | | | | — | | | | (0.03 | ) | | | 11.92 | | | | 5.29% | | | | 93,585 | | | | 1.90% | | | | 1.90% | | | | (0.33% | ) | | | 1,239% | |
Year ended August 31, 2009 | | | 16.68 | | | | (0.02 | ) | | | (5.31 | ) | | | (5.33 | ) | | | — | | | | — | | | | — | | | | — | | | | 11.35 | | | | (31.95% | ) | | | 45,077 | | | | 1.95% | | | | 1.90% | | | | (0.16% | ) | | | 1,697% | |
Year ended August 31, 2008 | | | 18.80 | | | | 0.07 | | | | (2.10 | ) | | | (2.03 | ) | | | (0.06 | ) | | | — | | | | (0.03 | ) | | | (0.09 | ) | | | 16.68 | | | | (10.86% | ) | | | 17,298 | | | | 1.96% | | | | 1.75% | | | | 0.38% | | | | 1,191% | |
Evolution Alternative Investment Fund | |
Year Ended August 31, 2012 | | | 15.29 | | | | (0.02 | ) | | | 0.96 | | | | 0.94 | | | | — | | | | — | | | | — | | | | — | | | | 16.23 | | | | 6.15% | 6 | | | 43,418 | | | | 1.84% | | | | 1.70% | | | | (0.10% | ) | | | 1,095% | |
Year ended August 31, 2011 | | | 15.15 | | | | (0.15 | ) | | | 0.29 | | | | 0.14 | | | | — | | | | — | | | | — | | | | — | | | | 15.29 | | | | 0.92% | | | | 41,783 | | | | 1.90% | | | | 1.90% | | | | (0.95% | ) | | | 1,073% | |
Year ended August 31, 2010 | | | 15.52 | | | | (0.10 | ) | | | (0.25 | ) | | | (0.35 | ) | | | (0.02 | ) | | | — | | | | — | | | | (0.02 | ) | | | 15.15 | | | | (2.26% | ) | | | 32,125 | | | | 1.90% | | | | 1.90% | | | | (0.66% | ) | | | 879% | |
Year ended August 31, 2009 | | | 17.63 | | | | (0.02 | ) | | | (1.47 | ) | | | (1.49 | ) | | | (0.62 | ) | | | — | | | | — | | | | (0.62 | ) | | | 15.52 | | | | (8.35% | ) | | | 20,102 | | | | 1.99% | | | | 1.90% | | | | (0.10% | ) | | | 785% | |
Year ended August 31, 2008 | | | 20.48 | | | | 0.45 | | | | (2.60 | ) | | | (2.15 | ) | | | (0.06 | ) | | | (0.64 | ) | | | — | | | | (0.70 | ) | | | 17.63 | | | | (10.77% | ) | | | 25,037 | | | | 1.89% | | | | 1.75% | | | | 2.32% | | | | 777% | |
| 2 | Net investment income (loss) per share represents net investment income (loss) divided by the daily average shares of beneficial interest outstanding throughout each period. |
| 3 | All returns reflect reinvested dividends, if any, but do not reflect the impact of taxes. |
| 4 | Portfolio turnover is calculated without regard to short-term securities having a maturity of less than one year. Investments in swaps and futures contracts and repurchase agreements are deemed short-term securities. The Fund’s aggressive investment strategy may result in significant portfolio turnover to take advantage of anticipated changes in market conditions. |
| 5 | The Adviser made a contribution due to a trading error. The total return would not be affected had the contribution not been made. |
| 6 | The Adviser made a contribution due to a trading error. If the contribution had not been made, the total return would have been 0.13% lower. |
| | |
| | |
| 24 | | DIREXION ANNUAL REPORT |
Direxion Funds
NOTES TO THE FINANCIAL STATEMENTS
August 31, 2012
Direxion Funds (the “Trust”) was organized as a Massachusetts Business Trust on June 6, 1997 and is registered under the Investment Company Act of 1940, as amended (the “1940 Act”), as an open-end management investment company issuing its shares in series, each series representing a distinct portfolio with its own investment objective and policies. The Trust currently has 23 series in operation of which four are included in this report, the Evolution Managed Bond Fund, the Evolution All-Cap Equity Fund, the Evolution Market Leaders Fund and the Evolution Alternative Investment Fund (each a “Fund” and collectively, the “Funds”). Each Fund is a “non-diversified” series of the Trust pursuant to the 1940 Act.
The Evolution Managed Bond Fund seeks high appreciation on an annual basis consistent with a high tolerance for risk by investing at least 80% of its assets (plus any borrowing for investment purposes) in fixed-income securities indirectly through securities that invest in or are a derivative of fixed-income securities, including exchange traded funds (ETFs), unit investment trusts and closed-end and open-end investment companies. The Evolution All-Cap Equity Fund seeks high appreciation on an annual basis consistent with a high tolerance for risk by investing at least 80% of its net assets (plus any borrowing for investment purposes) in equity securities either directly through individual stocks and American Depository Receipts (ADRs) or indirectly through securities that invest in or are a derivative of equity securities. The Evolution Market Leaders Fund seeks high appreciation on an annual basis consistent with a high tolerance for risk by typically investing primarily in equity securities either directly or indirectly through individual stocks and ADRs or indirectly through securities that invest in or are a derivative of equity securities. The Evolution Alternative Investment Fund seeks high total return on an annual basis with the S&P 500® Index consistent with a high tolerance for risk by investing primarily in securities, including dividend-paying equities or interest bearing fixed income securities, having a low or negative correlation with the S&P 500® Index (collectively, “alternative securities”) or indirectly through securities that invest in or are a derivative of alternative securities.
| 2. | | SIGNIFICANT ACCOUNTING POLICIES |
The following is a summary of significant accounting policies consistently followed by the Funds in the preparation of their financial statements. These policies are in conformity with U.S. generally accepted accounting principles (“GAAP”).
a) Investment Valuation – The Net Asset Value (“NAV”) of each Fund is determined daily, Monday through Friday, as of the close of regular trading on the New York Stock Exchange (“NYSE”), each day the NYSE is open for business. The value of all portfolio securities and other assets held by a Fund will be determined as of the time a Fund calculates its NAV, 4:00 p.m. Eastern Time (“Valuation Time”). Equity securities and ETFs are valued at their last sales price, or if not available, at the average of the last bid and ask prices. Investments in open-end mutual funds are valued at their respective quoted NAVs on the valuation dates. Futures contracts are valued at the settlement price established on the exchange on which they are traded, if that settlement price reflects trading prior to the Valuation Time. If the settlement price established by the exchange reflects trading after the Valuation Time, then the last sales price prior to Valuation Time will be used. Securities primarily traded on the NASDAQ National Market are valued using the NASDAQ Official Closing Price. Swap contracts are valued using the closing price of the underlying reference entity. Short-term debt securities with a maturity of 60 days or less and money market securities are valued using the amortized cost method. Other debt securities are valued by the Fund’s pricing service by using the mean prices or, if such prices are unavailable, by a matrix pricing method. Securities for which reliable market quotations are not readily available, the Funds’ pricing service does not provide a valuation for such securities, the Fund’s pricing service provides valuation that in the judgment of Rafferty Asset Management, LLC (the “Adviser”) does not represent fair value, or the Fund or Adviser believes the market price is stale will be fair valued as determined by the Adviser under the supervision of the Board of Trustees. Additionally, the Adviser will monitor developments in the marketplace for significant events that may affect the value of those securities whose closing prices were established before the Valuation Time.
b) Repurchase Agreements – Each Fund may enter into repurchase agreements with institutions that are members of the Federal Reserve System or securities dealers who are members of a national securities exchange or are primary dealers in U.S. government securities. In connection with transactions in repurchase agreements, it is the Trust’s policy that the Fund receives, as collateral, cash and/or securities (primarily U.S. government securities) whose fair value, including accrued
| | |
| |
| DIREXION ANNUAL REPORT | | 25 |
interest, at all times will be at least equal to 100% of the amount invested by the Fund in each repurchase agreement. If the seller defaults, and the value of the collateral declines, realization of the collateral by the Fund may be delayed or limited. The Funds follow authoritative standards of accounting for repurchase agreements which modify the criteria for determining effective control of transferred assets and as a result certain repurchase agreements may now be accounted for as secured borrowings. During the year ended August 31, 2012, the Funds did not enter into transactions that were deemed secured borrowings. The Funds were not invested in repurchase agreements at August 31, 2012.
c) Swap Contracts – Each Fund may enter into equity swap contacts. Standard equity swap contracts are between two parties that agree to exchange the returns (or differentials in rates of returns) earned or realized on particular predetermined investments or instruments. The gross amount to be exchanged is calculated with respect to a “notional amount” (i.e. the return on or increase in value of a particular dollar amount invested in a “basket” of securities representing a particular index or industry sector). The Funds enter into netting agreements with the counterparty. These agreements calculate the obligations of the parties on a “net basis”. The Funds do not offset the fair value amounts of the swap contract and the related collateral on the Statement of Assets and Liabilities arising from swap contracts executed with the same counterparty under such netting agreements. The Funds’ obligations are accrued daily (offset by any amounts owed to the Funds).
In a “long” swap agreement, the counterparty will generally agree to pay the Fund the amount, if any, by which the notional amount of the swap contract would have increased in value if the Fund had been invested in the particular securities, plus dividends that would have been received on those securities. The Fund will agree to pay the counterparty a floating rate of interest on the notional amount of the swap contract plus the amount, if any, by which the notional amount would have decreased in value had it been invested in such securities plus, in certain instances, commissions or trading spreads on the notional amount. Thus, the return on the swap contract should be the gain or loss on the notional amount plus dividends on the securities less the interest paid by the Fund on the notional amount. However, in certain instances, market factors such as the interest rate environment and the demand to borrow the securities underlying the swap agreement can cause a scenario in which the counterparty will pay the Fund interest. Payments may be made at the conclusion of the contract or periodically during its term. Swap contracts do not include the delivery of securities. The net amount of the excess, if any, of the Fund’s obligations over its entitlement with respect to each swap is accrued on a daily basis and an amount of cash or liquid assets, having an aggregate net asset value at least equal to such accrued excess is maintained in a segregated account. Until a swap contract is settled in cash, the gain or loss on the notional amount plus dividends on the securities less the interest paid by the Fund on the notional amount are recorded as “unrealized gains or losses on swaps” and when cash is exchanged, the gain or loss is recorded as “realized gains or losses on swaps”.
Each Fund may enter into swap contracts that provide the opposite return of the particular benchmark or security (“short” the index or security). The operations are similar to that of the swaps disclosed above except that the counterparty pays interest to the Fund on the notional amount outstanding and the dividends on the underlying securities reduce the return of the swap. However, in certain instances, market factors such as the interest rate environment and the demand to borrow the securities underlying the swap agreement can cause a scenario in which the Fund pays the counterparty interest. These amounts are netted with any unrealized appreciation or depreciation to determine the value of the swap.
The Funds collateralize swap agreements with cash and certain securities as indicated on the Schedule of Investments of each of the Funds, respectively. Such collateral is held for the benefit of the counterparty in a segregated account at the Custodian to protect the counterparty against non-payment by a Fund. The Funds do not net collateral on the Statements of Assets and Liabilities. In the event of a default by the counterparty, the Funds will seek return of this collateral and may incur certain costs exercising their rights with respect to the collateral. Amounts expected to be owed to the Funds are collateralized daily directly to Funds while amounts expected to be owed to the counterparty are collateralized daily in a segregated account at the Custodian.
In the event of the counterparty’s default, bankruptcy or any other event for which the counterparty can not meet its obligations, a Fund bears the risk of loss equal to the amount of the daily appreciation owed to the Fund. This obligation represents the daily gain accrued to the Fund from the close of business day prior to this event to the day on which this event occurs and the counterparty can no longer meet its obligations. A Fund will enter into swap agreements only with large, well-capitalized and established financial institutions. The creditworthiness of each of the firms that is a party to a swap agreement is monitored by the Adviser. Shareholders may obtain swap counterparty financial statements at www.sec.gov. Swap contracts are subject to credit risk. Credit risk is where the financial condition of an issuer of a security or instrument may cause it to default or become unable to pay interest or principal due on the security. The counterparty to a swap contract might default on its obligations. In addition, the Funds have agreements with certain
| | |
| | |
| 26 | | DIREXION ANNUAL REPORT |
counterparties with which it trades swap contracts that contain credit risk-related contingent features that could be triggered subject to certain circumstances. Such circumstances included agreed upon net asset value and performance-based thresholds.
The Funds were not invested in swap contracts at August 31, 2012.
d) Short Positions – Each Fund may engage in short sale transactions. For financial statement purposes, an amount equal to the settlement amount is included in the Statement of Assets and Liabilities as an asset and an equivalent liability. The amount of the liability is subsequently marked-to-market to reflect the current value of the short position. Subsequent fluctuations in the market prices of short positions may require purchasing the securities at prices which may differ from the market value reflected on the Statement of Assets and Liabilities. The Fund is liable to the buyer for any dividends payable on securities while those securities are in a short position. As collateral for its short positions, the Fund is required under the 1940 Act to maintain assets consisting of cash, cash equivalents or liquid securities equal to the market value of the securities sold short. This collateral is required to be adjusted daily. The Funds were not invested in short positions at August 31, 2012.
e) Stock Index Futures Contracts and Options on Futures Contracts – Each Fund may purchase and sell stock index futures contracts and options on such futures contracts. A Fund may use futures contracts to gain exposure to, or hedge against changes in the values of equities, interest rates or foreign currencies. Upon entering into a contract, the Fund deposits and maintains as collateral such initial margin as required by the exchange on which the transaction is effected. Pursuant to the contract, the Fund agrees to receive from or pay to the broker an amount of cash equal to the daily fluctuation in value of the contract. Such receipts or payments are known as “variation margin” and are recorded by the Fund as unrealized gains and losses. When the contract is closed, the Fund records a realized gain or loss equal to the difference between the value of the contract at the time it was opened and the value at the time it was closed. As collateral for futures contracts, the Fund is required under the 1940 Act to maintain assets consisting of cash, cash equivalents or liquid securities. This collateral is required to be adjusted daily to reflect the market value of the purchase obligation for long futures contracts or the market value of the instrument underlying the contract, but not less than the market price at which the futures contract was established, for short futures contracts. The Funds were not invested in options on futures contracts at August 31, 2012.
f) Risks of Options, Futures Contracts, Options on Futures Contracts and Short Positions – The risks inherent in the use of options, futures contracts, options on futures contracts and short positions include 1) adverse changes in the value of such instruments; 2) imperfect correlation between the price of options and futures contracts and options thereon and movements in the price of the underlying securities, index or futures contracts; 3) the possible absence of a liquid secondary market for any particular instrument at any time; 4) the possible need to defer closing out certain positions to avoid adverse tax consequences; and 5) the possible nonperformance by the counterparty under the terms of the contract. The Funds designate all cash, cash equivalents and liquid securities as collateral for written options, futures contracts, options on futures contracts and short positions. The Funds were not invested in options or options on futures contracts at August 31, 2012. The Evolution Managed Bond Fund was invested in short futures contracts, and the Evolution Alternative Investment Fund was invested in long futures contracts, at August 31, 2012.
g) Risks of Investing in Foreign Securities – Investments in foreign securities involve greater risks than investing in domestic securities. As a result, the Funds’ returns and net asset values may be affected to a large degree by fluctuations in currency exchange rates, political, diplomatic or economic conditions and regulatory requirements in other countries. The laws and accounting, auditing, and financial reporting standards in foreign countries typically are not as strict as they are in the U.S., and there may be less public information available about foreign companies. Investments in foreign emerging markets present a greater risk than investing in foreign issuers in general. The risk of political or social upheaval is greater in emerging markets. In addition, there may be risks of an economy’s dependence on revenues from particular commodities, currency transfer restrictions, a limited number of buyers for such securities and delays and disruptions in securities settlement procedures.
h) Security Transactions – Investment transactions are recorded on trade date. The Funds determine the gain or loss realized from investment transactions by comparing the identified cost, which is the same basis used for federal income tax purposes, with the net sales proceeds.
i) Federal Income Taxes – Each Fund intends to comply with the requirements of Subchapter M of the Internal Revenue Code necessary to qualify as a regulated investment company and to make the requisite distributions of income and capital gains to its shareholders sufficient to relieve it from all or substantially all federal income taxes and excise taxes. No provision for federal income taxes has been made.
| | |
| |
| DIREXION ANNUAL REPORT | | 27 |
j) Income and Expenses – Dividend income is recorded on the ex-dividend date. Interest income, including amortization of premium and discount, and dividends received from money market funds, is recognized on an accrual basis. Expenses are charged to the Funds daily. Expenses are computed based on each Fund’s respective daily net assets. For additional discussion on expenses refer to Note 4.
k) Distributions to Shareholders – Each Fund generally pays dividends from net investment income and distributes net realized capital gains, if any, at least annually. Income and capital gain distributions are determined in accordance with income tax regulations, which may differ from GAAP. Certain Funds also utilize earnings and profits distributed to shareholders on redemptions of shares as part of the dividends paid deduction. Distributions to shareholders are recorded on the ex-dividend date.
The tax character of distributions for the Funds during the years ended August 31, 2012 and August 31, 2011 were as follows:
| | | | | | | | | | | | | | | | |
| | | Evolution Managed Bond Fund | | | Evolution All-Cap Equity
Fund | |
| | | Year Ended
August 31,
2012 | | | Year Ended
August 31,
2011 | | | Year Ended
August 31,
2012 | | | Year Ended
August 31,
2011 | |
Distributions paid from: | | | | | | | | | | | | | | | | |
Ordinary Income | | $ | 1,262,242 | | | $ | 911,640 | | | $ | — | | | $ | — | |
Long-Term Capital Gains | | | — | | | | — | | | | — | | | | — | |
Return of Capital | | | — | | | | — | | | | — | | | | — | |
| | | | | | | | | | | | | | | | |
Total Distributions paid | | $ | 1,262,242 | | | $ | 911,640 | | | $ | — | | | $ | — | |
| | | | | | | | | | | | | | | | |
| | | | | | | | | | | | | | | | |
| | | Evolution Market Leaders Fund | | | Evolution Alternative Investment Fund | |
| | | Year Ended
August 31, 2012 | | | Year Ended
August 31, 2011 | | | Year Ended
August 31, 2012 | | | Year Ended
August 31, 2011 | |
Distributions paid from: | | | | | | | | | | | | | | | | |
Ordinary Income | | $ | — | | | $ | 242,010 | | | $ | — | | | $ | — | |
Long-Term Capital Gains | | | — | | | | — | | | | — | | | | — | |
Return of Capital | | | — | | | | — | | | | — | | | | — | |
| | | | | | | | | | | | | | | | |
Total Distributions paid | | $ | — | | | $ | 242,010 | | | $ | — | | | $ | — | |
| | | | | | | | | | | | | | | | |
The Funds are designating as long-term capital gain dividends, pursuant to Internal Revenue Code 852(b)(3), the amount necessary to reduce the earnings and profits of the Funds related to net capital gain to zero for the tax year ended August 31, 2012. To the extent necessary to fully distribute such capital gains, the Funds also designate earnings and profits distributed to shareholders on the redemption of shares.
As of August 31, 2012, the components of distributable earnings of the Funds on a tax basis were as follows:
| | | | | | | | | | | | | | | | |
| | | Evolution Managed
Bond Fund | | | Evolution All-Cap
Equity Fund | | | Evolution Market
Leaders Fund | | | Evolution Alternative
Investment Fund | |
Tax cost of investments | | $ | 63,447,561 | | | $ | 10,735,022 | | | $ | 163,412,487 | | | $ | 38,253,712 | |
Gross unrealized appreciation | | | 4,697,786 | | | | 190,145 | | | | 4,313,976 | | | | 1,482,422 | |
Gross unrealized depreciation | | | (1,058,922 | ) | | | (313,869 | ) | | | (1,947,596 | ) | | | (917,411 | ) |
| | | | | | | | | | | | | | | | |
Net unrealized appreciation/(depreciation) | | $ | 3,638,864 | | | $ | (123,724 | ) | | $ | 2,366,380 | | | $ | 565,011 | |
| | | | | | | | | | | | | | | | |
Undistributed ordinary income | | | 134,094 | | | | 6,186 | | | | 12,983 | | | | 72,703 | |
Undistributed long-term capital gain | | | — | | | | — | | | | 68,185 | | | | — | |
| | | | | | | | | | | | | | | | |
Total distributable earnings | | | 134,094 | | | | 6,186 | | | | 81,168 | | | | 72,703 | |
| | | | | | | | | | | | | | | | |
Other accumulated loss | | | (672,751 | ) | | | (21,604,739 | ) | | | — | | | | (7,180,022 | ) |
| | | | | | | | | | | | | | | | |
Total accumulated earnings/(loss) | | $ | 3,100,207 | | | $ | (21,722,277 | ) | | $ | 2,447,548 | | | $ | (6,542,308 | ) |
| | | | | | | | | | | | | | | | |
| | |
| | |
| 28 | | DIREXION ANNUAL REPORT |
The difference between book cost of investments and tax cost of investments is attributable primarily to the tax deferral of losses on wash sales. Other accumulated gain/(loss) is generally comprised of capital loss carryforwards, qualified late year loss deferrals and/or unrealized gain/(loss) on derivative positions.
On the Statement of Assets and Liabilities, the following adjustments were made for permanent tax differences between accounting for net investment income and realized gain and losses under GAAP and tax reporting:
| | | | | | | | | | | | |
| | | Net Investment
Income | | | Realized
Loss | | | Capital
Stock | |
Evolution Managed Bond Fund | | $ | 89,701 | | | $ | (89,703 | ) | | $ | 2 | |
Evolution All-Cap Equity Fund | | | 8,889 | | | | (49,117 | ) | | | 40,228 | |
Evolution Market Leaders Fund | | | 265,950 | | | | (1,463,409 | ) | | | 1,197,459 | |
Evolution Alternative Investment Fund | | | 119,150 | | | | (119,150 | ) | | | — | |
Net investment income and realized gains and losses for federal income tax purposes may differ from that reported on the financial statements because of permanent book-to-tax differences. GAAP requires that permanent differences in net investment income and realized gains and losses due to differences between financial reporting and tax reporting be reclassified between various components of net assets. The permanent differences primarily relate to net operating losses, dividend reclasses, PFIC sale adjustments and dividends on redemption adjustments with differing book and tax methods.
In order to meet certain excise tax distribution requirements, the Funds are required to measure and distribute annually, net capital gains realized during a twelve month period ending October 31 and net investment income earned during a twelve month period ending December 31. In connection with this, the Funds are permitted for tax purposes to defer into their next fiscal year qualified late year losses. Qualified late year capital losses are any net capital losses incurred between November 1 and the end of their fiscal year, August 31, 2012. Qualified late year ordinary losses are specified losses generally incurred between January 1 and the end of their fiscal year, August 31, 2012.
At August 31, 2012, the following Funds deferred, on a tax basis, qualified late year losses of:
| | | | |
| | | Post-October
Capital Losses | |
Evolution Managed Bond Fund | | $ | — | |
Evolution All-Cap Equity Fund | | | (1,330,999 | ) |
Evolution Market Leaders Fund | | | — | |
Evolution Alternative Investment Fund | | | — | |
Under current law, the Funds may carry forward net capital losses indefinitely to use to offset capital gains realized in future years. Previous law limited the carry forward of capital losses to the eight tax years following the year the capital loss was realized. If a Fund has capital losses that are subject to current law and also has capital losses subject to prior law, the losses realized under current law will be utilized to offset capital gains before any of the losses governed by prior law can be used. As a result of these ordering rules, capital losses realized under previous law may be more likely to expire unused. Capital losses realized under current law will carry forward retaining their classification as long-term or short-term losses; as compared to under prior law in which all capital losses were carried forward as short term capital losses.
At August 31, 2012, the following Funds had capital loss carryforwards on a tax basis of:
| | | | | | | | | | | | | | | | | | | | |
| | | Capital Losses Expiring | |
| | | 8/31/2016 | | | 8/31/2017 | | | 8/31/2018 | | | 8/31/2019 | | | ST Indefinite | |
Evolution Managed Bond Fund | | $ | — | | | $ | (672,751 | ) | | $ | — | | | $ | — | | | $ | — | |
Evolution All-Cap Equity Fund | | | (3,893,085 | ) | | | (8,377,957 | ) | | | (4,229,896 | ) | | | (2,414,502 | ) | | | (1,358,300 | ) |
Evolution Market Leaders Fund | | | — | | | | — | | | | — | | | | — | | | | — | |
Evolution Alternative Investment Fund | | | (311,556 | ) | | | (6,768,541 | ) | | | — | | | | (99,925 | ) | | | — | |
| | | | | | | | | | | | | | | | | | | | |
Capital Loss Utilized in Current Year: | | | | | | | | | | | | | | | | | | | | |
Evolution Managed Bond Fund | | $ | 2,444,581 | | | | | | | | | | | | | | | | | |
Evolution Alternative Investment Fund | | | 720,026 | | | | | | | | | | | | | | | | | |
| | |
| |
| DIREXION ANNUAL REPORT | | 29 |
To the extent that the Funds realize future net capital gains, those gains will be offset by any unused capital loss carryover.
The Funds follow authoritative financial reporting rules regarding recognition and measurement of tax positions taken or expected to be taken on a tax return. The Funds have reviewed all open tax years and concluded that there is no effect to the Funds’ financial positions or results of operations and no tax liability resulting from unrecognized tax benefits relating to uncertain income tax position taken or expected to be taken on a tax return. Open tax years are those years that are open for examination by the relevant income taxing authority. As of August 31, 2012, open Federal and state income tax years include the tax years ended August 31, 2009, August 31, 2010, August 31, 2011 and August 31, 2012. The Funds have no examination in progress. The Funds are also not aware of any tax positions for which it is reasonably possible that the total amounts of unrecognized tax expense will significantly change in the next twelve months.
l) Credit Facility – U.S. Bank, N.A. (“U.S. Bank”) has made available to the Funds a credit facility pursuant to a Line of Credit Agreement (“Line of Credit”) for meeting redemption requests. The following Funds utilized the Line of Credit during the year ended August 31, 2012:
| | | | | | | | | | | | | | | | | | | | | | |
| | | Available Borrowing
(Lesser of 33 1/3% of
Fund's Net Assets or) | | | Outstanding
Balance as of
August 31, 2012 | | | Maximum Amount
Outstanding during the
Year Ended
August 31, 2012 | | | Average
Daily
Balance | | | Interest
Expense | | | Borrowings Charged Interest At |
Evolution Managed Bond Fund | | $ | 13,000,000 | | | $ | — | | | $ | 13,000,000 | | | $ | 403,068 | | | $ | 11,268 | | | Prime Rate less 1/2% |
Evolution All-Cap Equity Fund | | | 2,500,000 | | | | — | | | | 2,500,000 | | | | 12,667 | | | | 354 | | | Prime Rate less 1/2% |
Evolution Market Leaders Fund | | | 22,000,000 | | | | — | | | | 11,259,000 | | | | 104,973 | | | | 2,935 | | | Prime Rate less 1/2% |
Evolution Alternative Investment Fund | | | 8,500,000 | | | | — | | | | 8,500,000 | | | | 23,224 | | | | 649 | | | Prime Rate less 1/2% |
m) Guarantees and Indemnifications – In the ordinary course of business, the Funds enter into contracts that contain a variety of indemnification provisions pursuant to which the Funds agree to indemnify third parties upon occurrence of specified events. The Funds’ maximum exposure relating to these indemnification agreements is unknown. However, the Funds have not had prior claims or losses in connection with these provisions and believe the risk of loss is remote.
n) Use of Estimates – The preparation of financial statements in conformity with GAAP requires management to make estimates and assumptions that affect the reported amounts of assets and liabilities and disclosure of contingent assets and liabilities at the date of the financial statements and the reported amounts of revenues and expenses during the reporting period. Actual results could differ from those estimates.
| 3. | | INVESTMENT TRANSACTIONS |
During the year ended August 31, 2012, the aggregate purchases and sales of investments (excluding short-term investments, swaps and futures contracts) were:
| | | | | | | | |
| | | Purchases | | | Sales | |
Evolution Managed Bond Fund | | $ | 352,915,877 | | | $ | 350,443,542 | |
Evolution All-Cap Equity Fund | | | 213,634,157 | | | | 217,622,719 | |
Evolution Market Leaders Fund | | | 1,756,316,779 | | | | 1,678,138,907 | |
Evolution Alternative Investment Fund | | | 390,898,881 | | | | 366,088,219 | |
| | |
| | |
| 30 | | DIREXION ANNUAL REPORT |
| 4. | | INVESTMENT ADVISORY AND OTHER AGREEMENTS |
Investment Advisory Agreement: The Funds have entered into an investment advisory agreement with the Adviser. The Adviser earns a fee, computed daily and payable monthly, applied to each Fund’s average daily net assets at the annual rates presented below:
| | | | |
Evolution Managed Bond Fund | | | 1.00 | % |
Evolution All-Cap Equity Fund | | | 1.00 | % |
Evolution Market Leaders Fund | | | 1.00 | % |
Evolution Alternative Investment Fund | | | 1.00 | % |
Effective December 29, 2011, the Adviser has contractually agreed to waive a portion of each Fund’s investment advisory fees at an annual rate of 0.20% of the Fund’s average daily net assets through February 1, 2013. In addition, the Adviser has entered into sub-advisory agreements relating to the Funds whereby the sub-advisor, Flexible Plan Investments, Ltd., will direct investment activities of the Funds. The Adviser pays, out of the management fees it receives from the Funds, a fee for these sub-advisory services.
Operating Services Agreement: The Funds have entered into an Operating Services Agreement (the “Agreement”) with the Adviser. Under the Agreement, the Adviser will be responsible for all expenses of the Trust except the following: management fees, distribution and/or service fees, acquired fund fees, taxes, leverage interest, dividends or interest on short positions, other interest expenses, brokerage commission and other extraordinary expenses outside the typical day-to-day operations of the Funds.
In consideration for the services rendered pursuant to the Agreement, the Funds will pay to the Adviser, as compensation for the services provided by the Adviser under the Agreement, a monthly fee. The monthly fee is calculated on an annualized basis on the average net assets of each Fund and the below amount:
| | | | |
Evolution Managed Bond Fund | | | 0.42 | % |
Evolution All-Cap Equity Fund | | | 0.42 | % |
Evolution Market Leaders Fund | | | 0.42 | % |
Evolution Alternative Investment Fund | | | 0.42 | % |
These amounts were lowered from 0.50% to 0.42% effective December 29, 2011.
Distribution Expenses: Shares of the Funds are subject to an annual Rule 12b-1 fee equal to 0.25% of the average daily net assets.
Shareholder Servicing Fees: The Board has also authorized each Fund’s shares to pay a shareholder servicing fee of 0.15% of each Fund’s average daily net assets. The Trust, on behalf of each Fund, pays the fee to financial institutions and other persons who provide services for and maintain shareholder accounts.
Rafferty Capital Markets, LLC (the “Distributor”) serves as principal underwriter of the Funds, and acts as the Funds’ distributor in a continuous public offering of the Funds’ shares. There were no Rule 12b-1 fees retained by the Distributor for the year ended August 31, 2012. The Distributor is an affiliate of the Adviser.
During the year ended August 31, 2012, the Adviser contributed $3,772 to the Evolution All-Cap Equity Fund due to a trading error and $45,396 to the Evolution Alternative Investment Fund due to a trading error. These contributions are reflected on the respective Statement of Operations as Contributions from Affiliates and the effects of these contributions are presented on the Financial Highlights.
| 5. | | VALUATION MEASUREMENTS |
The Funds follow authoritative fair valuation accounting standards, which establish an authoritative definition of fair value and set out a hierarchy for measuring fair value. These standards require additional disclosures about the various inputs and valuation techniques used to develop the measurements of fair value and a discussion in changes in valuation techniques and related inputs during the period. These inputs are summarized in the three broad levels listed below:
Level 1 – Quoted prices in active markets for identical securities
| | |
| |
| DIREXION ANNUAL REPORT | | 31 |
Level 2 – Evaluated price based on other significant observable inputs (including quoted prices for similar securities, interest rates, prepayment speeds, credit risk, etc.)
Level 3 – Significant unobservable inputs (including the Fund’s own assumptions in determining fair value of investments)
The inputs or methodology used for valuing securities are not an indication of the credit risk associated with investing in those securities.
The follow is a summary of the inputs used to value the Funds’ net assets as of August 31, 2012:
| | | | | | | | | | | | | | |
| | | Evolution Managed Bond Fund | |
Asset Class | | Level 1 | | Level 2 | | | Level 3 | | | Total | |
Investment Companies — Fixed Income | | $67,086,425 | | | $— | | | $ | — | | | $ | 67,086,425 | |
Other Financial Instruments* | | (43,942) | | | — | | | | — | | | | (43,942 | ) |
| |
| | | Evolution All-Cap Equity Fund | |
Asset Class | | Level 1 | | Level 2 | | | Level 3 | | | Total | |
Equity Securities | | $9,723,888 | | | $— | | | $ | — | | | $ | 9,723,888 | |
Investment Companies — Equity | | 767,609 | | | — | | | | — | | | | 767,609 | |
Investment Companies — Fixed Income | | 119,801 | | | — | | | | — | | | | 119,801 | |
| |
| | | Evolution Market Leaders Fund | |
Asset Class | | Level 1 | | Level 2 | | | Level 3 | | | Total | |
Investment Companies — Equity | | $165,778,867 | | | $— | | | $ | — | | | $ | 165,778,867 | |
| |
| | | Evolution Alternative Investment Fund | |
Asset Class | | Level 1 | | Level 2 | | | Level 3 | | | Total | |
Investment Companies — Equity | | $38,818,723 | | | $— | | | $ | — | | | $ | 38,818,723 | |
Other Financial Instruments* | | 156,198 | | | — | | | | — | | | | 156,198 | |
For further detail on each asset class, see the Schedule of Investments.
| * | Other financial instruments include futures contracts, which are valued at the unrealized appreciation (depreciation) on the instrument. |
The Funds also follow authoritative accounting standards which require additional disclosure regarding fair value measurements. Specifically, these standards require reporting entities to disclose a) the input and valuation techniques used to measure fair value for both recurring and nonrecurring fair value measurements, for Level 2 or Level 3 positions, b) transfers between all levels (including Level 1 and Level 2) on a gross basis (i.e. transfers out must be disclosed separately from transfers in) as well as the reason(s) for the transfers and c) purchases and sales on a gross basis in the Level 3 rollforward rather than as one net number. Additionally, reporting entities are required to disclose quantitiative information about unobservable inputs used in the fair value measurements categorized within Level 3 of the fair value hierarchy.
There were no transfers between Level 1 and Level 2 securities during the year ended August 31, 2012. The Funds held no Level 3 securities during the years ended August 31, 2011 and August 31, 2012. It is the Funds’ policy to recognize transfers into Level 3 at the value as of the beginning of the period.
| 6. | | ADDITIONAL DISCLOSURES ABOUT DERIVATIVE INSTRUMENTS |
The Funds follow authoritative standards of accounting for derivative instruments which establish disclosure requirements for derivative instruments. These standards improve financial reporting for derivative instruments by requiring enhanced disclosures that enables investors to understand how and why a fund uses derivatives instruments, how derivatives instruments are accounted for and how derivative instruments affect a fund’s financial position and results of operations.
The Funds use derivative instruments as part of their principal investment strategy to achieve their investment objective. For additional discussion on the risks associated with derivative instruments refer to Note 2. As of August 31, 2012, the Evolution Managed Bond Fund and Evolution Alternative Investment Fund were invested in futures contracts.
| | |
| | |
| 32 | | DIREXION ANNUAL REPORT |
At August 31, 2012, the fair value of derivatives instruments were as follows:
| | | | | | | | | | | | | | |
| Asset Derivatives1 | |
| | | | | Interest Rate Risk | | | Equity Risk | | | Total | |
Evolution Alternative Investment Fund | | Futures contracts* | | $ | — | | | $ | 156,198 | | | $ | 156,198 | |
| 1 | Statement of Assets and Liabilities location: Variation margin receivable. |
| * | Cumulative appreciation (depreciation) of futures contracts as reported in the Schedule of Investments. |
Only current day's variation margin, if any, is reported within the Statement of Assets and Liabilities.
| | | | | | | | | | | | | | |
| Liability Derivatives1 | |
| | | | | Interest Rate Risk | | | Equity Risk | | | Total | |
Evolution Managed Bond Fund | | Futures contracts* | | $ | 43,942 | | | $ | — | | | $ | 43,942 | |
| 1 | Statement of Assets and Liabilities location: Variation margin payable. |
| * | Cumulative appreciation (depreciation) of futures contracts as reported in the Schedule of Investments. |
Only current day's variation margin, if any, is reported within the Statement of Assets and Liabilities.
Transactions in derivative instruments during the year ended August 31, 2012, were as follows:
| | | | | | | | | | | | | | |
| | | | | Interest rate risk | | | Equity risk | | | Total | |
Evolution Managed Bond Fund | | Net Realized gain (loss)1 | | | | | | | | | | | | |
| | Futures contracts | | $ | 410,643 | | | $ | — | | | $ | 410,643 | |
| | Change in net unrealized appreciation (depreciation)2 | | | | | | | | | | | | |
| | Futures contracts | | | (50,874 | ) | | | — | | | | (50,874 | ) |
Evolution All-Cap Equity Fund | | Net Realized gain (loss)1 | | | | | | | | | | | | |
| | Futures contracts | | | — | | | | (198,490 | ) | | | (198,490 | ) |
| | Change in net unrealized appreciation (depreciation)2 | | | | | | | | | | | | |
| | Futures contracts | | | — | | | | 9,912 | | | | 9,912 | |
Evolution Alternative Investment Fund | | Net Realized gain (loss)1 | | | | | | | | | | | | |
| | Futures contracts | | | | | | | 1,839,595 | | | | 1,839,595 | |
| | Swap contracts | | | — | | | | 27,433 | | | | 27,433 | |
| | Total realized gain (loss) | | | — | | | | 1,867,028 | | | | 1,867,028 | |
| | Change in net unrealized appreciation (depreciation)2 | | | | | | | | | | | | |
| | Futures contracts | | | | | | | 168,044 | | | | 168,044 | |
| 1 | Statement of Operations location: Net realized gain (loss) on futures and swaps. |
| 2 | Statement of Operations location: Change in unrealized appreciation (depreciation) on futures. |
For the year ended August 31, 2012, the volume of the derivatives held by the Funds were as follows:
| | | | | | | | |
| | | Quarterly average gross notional amounts | |
| | | Long Futures
Contracts | | | Short Futures
Contracts | |
Evolution Managed Bond Fund | | $ | 1,173,216 | | | $ | 1,833,790 | |
Evolution All-Cap Equity Fund | | | 385,806 | | | | 2,385,684 | |
Evolution Alternative Investment Fund | | | 3,642,665 | | | | 1,996,888 | |
| | |
| |
| DIREXION ANNUAL REPORT | | 33 |
The Funds utilized this volume of derivatives as a substitute for investing in comparable positions in underlying securities and/or as a means to limit exposures of the Funds’ position. During the year ended August 31, 2012, the Evolution Managed Bond Fund and the Evolution Alternative Investment Fund maintained a consistent volume of its investments in futures contracts. These investments in futures contracts shifted between long and short contracts as market conditions dictated. The Evolution All-Cap Equity Fund held short futures contracts towards the first half of the year. Additionally, the Evolution Alternative Investment Fund invested in short equity swap contracts. This volume of swaps was minimal during the year ended August 31, 2012.
The Funds follow authoritative standards of accounting for and disclosure of events that occur after the Statements of Assets and Liabilities date but before financial statements are issued or are available to be issued. These standards require the Funds to recognize in the financial statements the effects of all recognized subsequent events that provide additional evidence about conditions that existed at the date of the Statements of Assets and Liabilities. For nonrecognized subsequent events that must be disclosed to keep the financial statements from being misleading, the Funds are required to disclose the nature of the event as well as an estimate of its financial effect, or a statement that such an estimate cannot be made. The Funds have evaluated subsequent events through the issuance of the Funds’ financial statements and have determined there is no impact to the Funds’ financial statements.
| | |
| | |
| 34 | | DIREXION ANNUAL REPORT |
Direxion Funds
Report of Independent Registered Public Accounting Firm
To the Board of Trustees and Shareholders of Direxion Funds:
We have audited the accompanying statements of assets and liabilities of the Evolution Managed Bond Fund, Evolution All-Cap Equity Fund, Evolution Market Leaders Fund, and Evolution Alternative Investment Fund (four of the series of the Direxion Funds) (the “Funds”), including the schedules of investments, as of August 31, 2012, and the related statements of operations for the year then ended, the statements of changes in net assets for each of the two years in the period then ended, and the financial highlights for each of the five years in the period then ended. These financial statements and financial highlights are the responsibility of the Funds’ management. Our responsibility is to express an opinion on these financial statements and financial highlights based on our audits.
We conducted our audits in accordance with the standards of the Public Company Accounting Oversight Board (United States). Those standards require that we plan and perform the audit to obtain reasonable assurance about whether the financial statements and financial highlights are free of material misstatement. We were not engaged to perform an audit of the Funds’ internal control over financial reporting. Our audits included consideration of internal control over financial reporting as a basis for designing audit procedures that are appropriate in the circumstances, but not for the purpose of expressing an opinion on the effectiveness of the Funds’ internal control over financial reporting. Accordingly, we express no such opinion. An audit also includes examining, on a test basis, evidence supporting the amounts and disclosures in the financial statements and financial highlights, assessing the accounting principles used and significant estimates made by management, and evaluating the overall financial statement presentation. Our procedures included confirmation of securities owned as of August 31, 2012, by correspondence with the custodian and brokers or by other appropriate auditing procedures where replies from brokers were not received. We believe that our audits provide a reasonable basis for our opinion.
In our opinion, the financial statements and financial highlights referred to above present fairly, in all material respects, the financial position of the above mentioned Funds at August 31, 2012, the results of their operations for the year then ended, the changes in their net assets for each of the two years in the period then ended, and the financial highlights for each of the five years in the period then ended, in conformity with U.S. generally accepted accounting principles.

New York, New York
October 26, 2012
| | |
| |
| DIREXION ANNUAL REPORT | | 35 |
Additional Information
(Unaudited)
For the year ended August 31, 2012, certain dividends paid by the Funds may be subject to a maximum rate of 15%, as provided for by the Jobs and Growth Tax Relief Reconciliation Act of 2003. The amount of dividends declared from ordinary income designated as qualified income was 0% for the Evolution Managed Bond Fund.
For corporate shareholders, the amount of ordinary income distributions qualifying for the corporate dividends received deduction for the year ended August 31, 2012 was 0% for the Evolution Managed Bond Fund.
HOUSEHOLDING
In an effort to decrease costs, the Funds intend to reduce the number of duplicate prospectuses, Annual and Semi-Annual Reports, proxy statements and other similar documents you receive by sending only one copy of each to those addresses shared by two or more accounts and to shareholders we reasonably believe are from the same family or household. Householding begins once you have signed your account application. After such time, if you would like to discontinue householding for your accounts, please call toll-free at (800) 851-0511 to request individual copies of these documents. Once the Funds receive notice to stop householding, we will begin sending individual copies thirty days after receiving your request. This policy does not apply to account statements.
| | |
| | |
| 36 | | DIREXION ANNUAL REPORT |
Investment Advisory and Subadvisory Agreements Approvals (Unaudited)
Provided below is a summary of certain of the factors the Board considered at its August 15, 2012 Board meeting in renewing, as applicable: (1) the Advisory Agreement between Rafferty Asset Management (“Rafferty”) and the Direxion Funds (the “Trust”), on behalf of the Evolution All-Cap Equity Fund, Evolution Alternative Investment Fund, Evolution Managed Bond Fund and Evolution Market Leaders Fund (each a “Fund” and collectively, the “Funds”), each a series of the Trust; and (2) the Subadvisory Agreement between Rafferty and Flexible Plan Investments, Inc. (“Flexible”) on behalf of the Funds. The Board did not identify any particular information that was most relevant to its consideration to approve the Advisory or Subadvisory Agreement (each an “Agreement” and collectively, the “Agreements”) and each Trustee may have afforded different weight to the various factors.
In determining whether to approve the continuance of the Agreements, the Board considered the best interests of each Fund separately. In addition, the Board noted that the Trustees had considered various reports and information provided throughout the year at their regular Board meetings and otherwise, and that the Independent Board members had met separately on August 7, 2012, to consider these specific contract renewals. While the Agreements for all of the Funds were considered at the same Board meeting, the Board considered each Fund’s investment advisory and subadvisory relationship separately. In each instance, the Board considered, among others, the following factors: (1) the nature and quality of the services provided; (2) the investment performance of the Fund; (3) the profitability of the advisory business to Rafferty or Flexible, if such information was provided; (4) the extent to which economies of scale have been taken into account in setting fee schedules; (5) whether fee levels reflect these economies of scale, if any, for the benefit of Fund shareholders; (6) comparisons of services and fees with contracts entered into by Rafferty and Flexible with other clients (such as pension funds and other institutional investors), if any; and (7) other benefits derived or anticipated to be derived and identified by Rafferty or Flexible from its relationship with the Funds.
Nature, Extent and Quality of Services Provided. The Board reviewed the nature, extent and quality of the services provided or to be provided under the Advisory Agreement by Rafferty. The Board noted that Rafferty has provided services to the Trust since its inception and has developed an expertise in managing the Funds. The Board also noted that Rafferty trades efficiently with low commission schedules, which helps improve performance results. The Board considered Rafferty’s representation that it has the financial resources and appropriate staffing to manage the Funds and meet its expense reimbursement obligations, if any. The Board also considered that Rafferty utilizes the services of an independent compliance consulting firm and that reports from the chief compliance officer are provided to the Board at its regularly scheduled quarterly Board meetings. The Board considered that Rafferty oversees all aspects of the operation of the Funds, including oversight of the Funds’ service providers and Flexible. Regarding the Subadvisory Agreement with Flexible, the Board noted that Flexible utilizes the Funds as the primary investments for its separate account clients. Based on these and other considerations, the Board determined that, in the exercise of its business judgment, the nature, extent and quality of the services provided by Rafferty and Flexible to the Funds under the Agreements were fair and reasonable.
Performance of the Funds. The Board evaluated the performance of each Fund relative to: (1) its benchmark index for year-to-date, one-year and since inception periods ended June 30, 2012, where applicable; and (2) the average performance of the relevant Morningstar peer fund universe for monthly and annual periods ended June 30, 2012.
With respect to the Evolution All-Cap Equity Fund, the Board considered management’s description of the performance of the Morningstar universe of long/short equity funds. The Board also considered that as of June 30, 2012, the Fund underperformed the average of its relevant Morningstar peer funds for all periods presented. In this regard, the Board noted Flexible’s representation that the Fund’s long-term underperformance was in part due to unusually high market volatility in the third quarter of 2011 which led to defensive fund basket selections that caused the Fund to underperform in fourth quarter of 2011 and the first quarter of 2012.
With respect to the Evolution Alternative Investment Fund, the Board considered management’s description of the performance of the Morningstar universe of multi-alternative funds. The Board also considered that as of June 30, 2012, the Fund outperformed the average of its relevant Morningstar peer funds for the year-to-date and one-year periods, but underperformed for the three-year and five-year periods. In this regard, the Board noted Flexible’s representation that the Fund’s overweighting in the energy alternatives and other growth-focused sectors can be attributed to losses experienced during the third quarter of 2011. The Board also noted Flexible’s representation that, as a result of such issues, Flexible has added an additional hedge to the Fund portfolio which improved the Fund’s performance in the first quarter of 2012.
| | |
| |
| DIREXION ANNUAL REPORT | | 37 |
With respect to the Evolution Managed Bond Fund, the Board considered management’s description of the performance of the Morningstar universe of intermediate-term bond funds. The Board also considered that as of June 30, 2012, the Fund outperformed the average of its relevant Morningstar peer funds for the year-to-date and one-year periods, but underperformed for the three-year and five-year periods. In this regard, the Board noted Flexible’s representation that the Fund’s underperformance was in part due to the Fund’s reliance on strong trends in the bond market which did not materialize over the last year.
With respect to the Evolution Market Leaders Fund, the Board considered management’s description of the performance of the Morningstar universe of world-stock funds. The Board also considered that as of June 30, 2012, the Fund underperformed the average of its relevant Morningstar peer funds for all periods presented. In this regard, the Board noted Flexible’s representation that the Fund’s underperformance was in part due to the fact that market volatility was not conducive to the Fund’s asset class and sector methodology resulting in its underperformance.
Costs of Services Provided to the Funds and Profits Realized. The Board considered the overall fees paid to Rafferty on an annual basis since each Fund’s commencement of operations, including any fee waivers and recoupment of fees previously waived. The Board also considered the fees that Rafferty charges for the services that it provides to a pooled trading vehicle for domestic hedge funds. In addition, the Board considered the overall profitability of Rafferty’s investment business and its representation that it does not allocate internal costs and assess profitability with respect to its services to individual Funds. Based on these considerations, the Board determined that, in the exercise of its business judgment, the costs of the services provided and the profits realized under the Advisory Agreement were fair and reasonable.
In considering the fees paid by Rafferty to Flexible, the Board noted that the Evolution Funds are offered to Flexible’s clients in wrap account advisory programs. The Board also noted that, in some cases, Flexible uses the fees it receives from the Funds to reduce the asset-based fees that it charges clients for providing investment advisory services. In addition, the Board discussed management fee waivers for the Funds implemented by Rafferty at the Board’s request. Based on these considerations, the Board determined that, in the exercise of its business judgment, the costs of the services provided and the profits realized under the Agreements were fair and reasonable.
Economies of Scale. The Board considered Rafferty’s representation that it believes that asset levels at this time are not sufficient to achieve economies of scale or warrant a reduction in fee rates or the addition of breakpoints. Based on these and other considerations, the Board determined that, in the exercise of its business judgment, the reduction in fee rates or additions of breakpoints were not necessary at this time.
Other Benefits. The Board considered Rafferty’s representation that its relationship with the Funds may help to facilitate Rafferty’s ability to attract business to its non-mutual fund account. The Board also considered that Rafferty’s overall business with brokerage firms helps to lower commission rates and provide better execution for Fund portfolio transactions. In addition, the Board considered that Flexible has greater access to certain trust platforms due to its subadvisory services to the Funds. Based on these and other considerations, the Board determined that, in the exercise of its business judgment, the benefits were fair and reasonable.
Conclusion. Based on, but not limited to, the above considerations and determinations, the Board determined that the Agreements for the Funds were fair and reasonable in light of the services to be performed, fees, expenses and such other matters as the Board considered relevant in the exercise of its business judgment. On this basis, the Board unanimously voted in favor of the continuance of the Agreements.
| | |
| | |
| 38 | | DIREXION ANNUAL REPORT |
Direxion Funds
TRUSTEES AND OFFICERS
The business affairs of the Funds are managed by or under the direction of the Board of Trustees. Information pertaining to the Trustees and Officers of the Funds is set below. The SAI includes additional information about the Funds’ Trustees and Officers and is available without charge, upon request by calling 1-800-851-0511.
| | | | | | | | | | |
| | | | | |
Interested Trustees | | | | | | | | | | |
Name, Address and Age | | Position(s)
Held with
Fund | | Term of Office
and Length of
Time Served | | Principal Occupation(s)
During Past Five Years | | # of Portfolios
in Direxion
Family of
Investment
Companies
Overseen by
Trustee(2) | | Other Trusteeships/
Directorships Held
by Trustee |
Lawrence C. Rafferty(1)
Age: 70 | | Chairman of the Board of Trustees | | Lifetime of Trust until removal or resignation; Since 1997 | | Chairman and Chief Executive Officer of Rafferty, 1997-present; Chief Executive Officer of Rafferty Companies, LLC, 1996-present; Chief Executive Officer of Rafferty Capital Markets, Inc., 1995-present. | | 23 | | Board of Trustees, Fairfield University; Board of Directors, St. Vincent’s Services; Executive Committee, Metropolitan Golf Association |
|
|
Non-Interested Trustees |
Name, Address and Age | | Position(s)
Held with
Fund | | Term of Office
and Length of
Time Served | | Principal Occupation(s)
During Past Five Years | | # of Portfolios
in Direxion
Family of
Investment
Companies
Overseen by
Trustee(2) | | Other Trusteeships/
Directorships Held
by Trustee |
Daniel J. Byrne
Age: 68 | | Trustee | | Lifetime of Trust until removal or resignation; Since 1997 | | President and Chief Executive Officer of Byrne Securities Florida Inc. (formerly, Byrne Securities Inc.), 1992 – present. | | 141 | | None. |
|
Gerald E. Shanley III
Age: 68 | | Trustee | | Lifetime of Trust until removal or resignation; Since 1997 | | Retired, Since 2002; Business Consultant, 1985 – present; Trustee of Trust Under Will of Charles S. Payson, 1987-present; C.P.A., 1979 – present. | | 141 | | None. |
|
John Weisser
Age: 70 | | Trustee | | Lifetime of Trust until removal or resignation; Since 2007 | | Retired, Since 1995; Salomon Brothers, Inc, 1971-1995, most recently as Managing Director. | | 141 | | Director, MainStay VP Fund Series, The MainStay Funds, The MainStay Funds Trust; Director ICAP Funds, Inc; Director, Eclipse Funds, Inc., Eclipse Funds; (66 Funds Total) |
|
| (1) | | Mr. Rafferty is affiliated with Rafferty. Mr. Rafferty is the Chairman and Chief Executive Officer of Rafferty and owns a beneficial interest in Rafferty. |
| (2) | | The Direxion Family of Investment Companies consists of the Direxion Funds which currently offers for sale to the public 23 portfolios, the Direxion Insurance Trust which currently offers for sale 1 portfolio and the Direxion Shares ETF Trust which currently offers for sale to the public 47 of the 117 funds currently registered with the SEC. |
| | |
| |
| DIREXION ANNUAL REPORT | | 39 |
Direxion Funds
TRUSTEES AND OFFICERS
Principal Officers of the Trust
The officers of the Trust conduct and supervise its daily business. Unless otherwise noted, an individual’s business address is 1301 Avenue of the Americas, 35th Floor, New York, New York 10019. As of the date of this report, the officers of the Trust, their ages, their business address and their principal occupations during the past five years are as follows:
| | | | | | | | | | |
Name, Address and Age | | Position(s)
Held with
Fund | | Term of Office
and Length of
Time Served | | Principal Occupation(s)
During Past Five Years | | # of Portfolios
in the Direxion
Family of
Investment
Companies
Overseen by
Trustee(2) | | Other Trusteeships/
Directorships Held
by Trustee |
Daniel D. O’Neill(1)
Age: 44 | | President; Chief Operating Officer and Chief Investment Officer | | One Year; Since 1999 One Year; Since 2006 | | Managing Director of Rafferty, 1999-present. | | 117 | | N/A |
| | | | | | | | | | |
Christopher Lewis
Age: 42 | | Chief Compliance Officer(3) | | One Year; Since 2009 | | Director, Alaric Compliance Services, LLC, 2009 – present; Partner, Thacher Proffitt & Wood LLP, 2004-2008; Partner, Simmons & Simmons, 2002-2004. | | N/A | | N/A |
| | | | | | | | | | |
Patrick J. Rudnick
777 East Wisconsin
Avenue Milwaukee, WI 53202
Age: 39 | | Principal Financial Officer and Treasurer | | One Year; Since 2010 | | Vice President, U.S. Bancorp Fund Services, LLC, since 2006; formerly, Manager, PricewaterhouseCoopers LLP (1999-2006). | | N/A | | N/A |
| | | | | | | | | | |
Angela Brickl
Age: 36 | | Secretary(3) | | One Year; Since 2011 | | Vice President, Rafferty Asset Management, LLC, since October 2010; Summer Associate at Skadden, Arps, Slate, Meagher & Flom, LLP, May – August 2009; Summer Associate at Foley & Lardner, LLP, May – August 2008; Vice President, U.S. Bancorp Fund Services, LLC, November 2003 – August 2007. | | N/A | | N/A |
| | | | | | | | | | |
| (1) | Mr. O’Neill serves as Chairman of the Board of Trustees of the Direxion Shares ETF Trust. |
| (2) | The Direxion Family of Investment Companies consists of the Direxion Funds which currently offers for sale to the public 23 portfolios, the Direxion Insurance Trust which currently offers for sale 1 portfolio and the Direxion Shares ETF Trust which currently offers for sale to the public 47 of the 117 funds currently registered with the SEC. |
| (3) | Effective September 1, 2012, Ms. Brickl replaced Mr. Lewis as Chief Compliance Officer. |
| | |
| | |
| 40 | | DIREXION ANNUAL REPORT |
THIS PAGE INTENTIONALLY LEFT BLANK
THIS PAGE INTENTIONALLY LEFT BLANK
PRIVACY NOTICE
At the Direxion Funds, we are committed to protecting your privacy. To open and service your Direxion accounts, we collect and maintain certain nonpublic personal information about you, such as your address, phone number, social security number, purchases, sales, account balances, bank account information and other personal financial information. We collect this information from the following sources:
| | • | | Account applications or other forms on which you provide information, |
| | • | | Mail, e-mail, the telephone and our website, and |
| | • | | Your transactions and account inquiries with us. |
We safeguard the personal information that you have entrusted to us in the following ways:
| | • | | As a general policy, only those employees who maintain your account and respond to your requests for additional services have access to your account information. |
| | • | | We maintain physical, electronic, and procedural safeguards to insure the security of your personal information and to prevent unauthorized access to your information. |
We do not disclose any nonpublic personal information about you or our former shareholders to anyone, except as permitted or required by law. In the course of conducting business and maintaining your account we may share shareholder information, as allowed by law, with our affiliated companies and with other service providers, including financial intermediaries, custodians, transfer agents and marketing consultants. Those companies are contractually bound to use that information only for the services for which we hired them. They are not permitted to use or share our shareholders’ nonpublic personal information for any other purpose. There also may be times when we provide information to federal, state or local authorities as required by law.
In the event that you hold fund shares of Direxion through a financial intermediary, including, but not limited to, a broker-dealer, bank, or trust company, the privacy policy of your financial intermediary would govern how your nonpublic personal information would be shared with nonaffiliated third parties.
For questions about our policy, please contact us at (800) 851-0511.
This page is not a part of the annual report.
ANNUAL REPORT AUGUST 31, 2012
Advisor
Rafferty Asset Management, LLC
1301 Avenue of the Americas (6th Ave.), 35th Floor
New York, NY 10019
Sub-Advisor
Flexible Plan Investments, Ltd.
3883 Telegraph Road
Bloomfield Hills, MI 48302
Administrator, Transfer Agent, Dividend Paying Agent & Shareholding Servicing Agent
U.S. Bancorp Fund Services, LLC
P.O. Box 1993
Milwaukee, WI 53201-1993
Custodian
U.S. Bank, N.A.
1555 RiverCenter Dr., Suite 302
Milwaukee, WI 53212
Independent Registered Public Accounting Firm
Ernst & Young LLP
5 Times Square
New York, NY 10036
Distributor
Rafferty Capital Markets, LLC
1010 Franklin Ave., 3rd Floor
Garden City, NY 11530
The Fund’s Proxy Voting Policies are available without charge by calling 1-800-851-0511, or by accessing the SEC’s website, at www.sec.gov.
The actual voting records relating to portfolio securities during the most recent period ended June 30 (starting with the year ended June 30, 2005) is available without charge by calling 1-800-851-0511 or by accessing the SEC’s website at www.sec.gov.
The Fund files complete schedules of portfolio holdings with the SEC on Form N-Q. The Form N-Q is available without charge, upon request, by calling 1-800-851-0511, or by accessing the SEC’s website, at www.sec.gov.
This report has been prepared for shareholders and may be distributed to others only if preceded or accompanied by a current prospectus.

ANNUAL REPORT AUGUST 31, 2012
HCM Freedom Fund
1301 Avenue of the Americas (6th Ave.), 35th Floor
New York, New York 10019
(800) 851-0511
Table of Contents

Help Preserve the Environment – Go Green!
Go paperless with Direxion e-Delivery – a service allowing shareholders to reduce clutter with full online access to regulatory documents. Begin the preservation process with e-delivery.
With Direxion e-Delivery you can:
| | • | | Receive email notifications when your most recent shareholder communications are available for review. |
| | • | | Access prospectuses, annual reports and semiannual reports online. |
It’s easy to enroll:
| 1. | | Visit www.direxionfunds.com/edelivery |
| 2. | | Follow the simple enrollment instructions |
If you have questions about Direxion e-Delivery services, contact one of our shareholder representatives at 800-851-0511.

LETTERSTO SHAREHOLDERS
Dear Shareholders,
This Annual Report for the HCM Freedom Fund covers the period from September 1, 2011 to August 31, 2012 (the “Annual Period”). Horizon Capital Management, Inc. serves as the sub-advisor to the Fund. During the Annual Period broad equity markets were strong, as the S&P 500 Index gained approximately 18%. Heightened levels of volatility characterized the early phase of the period as markets struggled to regain solid footing after the U.S. Government debt ceiling crisis in August 2011. However, concerns abated and markets rallied from December into the Spring. Although fears related to the ongoing sovereign debt crisis in Europe re-emerged causing equity markets to pull back from their highs during April and May. Markets again rallied late in the period as the U.S. Federal Reserve (“the Fed”) stood by its easy money policy and pledged to retain very low interest rates for an extended period of time. The U.S. Dollar was strong throughout the period, although opposing pressures – both from the Fed domestically and the European macro-environment abroad – added volatility to foreign exchange markets. Oil was volatile throughout the period, as structural changes sweeping across Northern Africa and the Middle East drove prices up, while concerns over global economic growth held prices back. The price for a barrel of oil rose as high as $110 in March 2012 after seeing lows of $75 in October 2011, before trading in the high $70 range again in the early summer 2012, and then settling at $95 per barrel at the end of the period.
Equities:
The Annual Period saw strong equity returns due to a perceived, improving global economy, as well as continuous European Central Bank and Fed actions. At the end of 2011 and into the first quarter of 2012, equities were supported by encouraging signs that the U.S. economy had turned a corner. Jobless claims had dropped to a four-year low, and both corporate earnings and housing starts figures continued to show upside. The second quarter of 2012 saw the only downtrend during the Annual Period, as Europe led global equities in a substantial drop, underperforming against bonds and the safe-haven of the U.S. Dollar. With a continued rally in equities through the end of this Annual Period, investors will look towards the upcoming U.S. Presidential election to be a test of where market risk appetite for equities truly lies.
Fixed Income:
Interest rates remained at record lows. The Fed stood strong on low interest rates in an attempt to stimulate the economy and help revive the housing market. As a result, low long-term interest rates have sparked rising housing-start figures throughout 2012.
The HCM Freedom Fund is benchmarked to the S&P 500 Index. The Fund returned 4.92% during the Annual Period, as compared to the benchmark’s return of 18.00%. The portfolio management team has taken a reserved view on the economy as a whole. As a result, the Fund followed a large cash position near year-end 2011 with positions in low-risk, fixed-income type instruments, seeking capital appreciation and low volatility. In addition, the Fund utilized equity index futures in an attempt to capitalize on short-term trends in the marketplace though these positions adversely impacted performance.
As always, we thank you for using the Direxion Funds and we look forward to our mutual success.
Best Regards,
| | | | |
 | |  | |  |
Daniel O’Neill Chief Investment Officer | | Dexter Lyons Horizon Capital Management, Inc. | | Mark Thomas Horizon Capital Management, Inc. |
The performance data quoted represents past performance; past performance does not guarantee future results. The investment return and principal value of an investment will fluctuate and an investor’s shares, when redeemed, may be worth more or less than their original cost. Current performance may be higher or lower than the performance data quoted.
An investment in any of the Direxion Funds is subject to a number of risks that could affect the value of its shares. It is important that investors closely review and understand these risks before making an investment. An investor should consider the investment objectives, risks, charges and expenses of the Direxion Funds carefully before investing. The prospectus contains this and other information about the Direxion Funds. To obtain a prospectus, please call the Direxion Funds at 1-800-851-0511 or visit www.direxionfunds.com. The prospectus should be read carefully before investing.
The views in this report were those of the Adviser as of August 31, 2012 and may not reflect their views on the date this report is first published or anytime thereafter. These views are intended to assist shareholders of the Fund in understanding their investments in the Fund and do not constitute investment advice.
To obtain performance data current to the most recent month-end, please call, toll-free, 1-800-851-0511 or visit www.direxionfunds.com.
The total annual fund operating expense ratio of the HCM Freedom Fund, net of any fee, waivers or expense reimbursements is 2.93%.
The total annual fund operating expense ratios include Acquired Fund Fees and Expenses, indirect fees and expenses that the Funds incur that are required to be disclosed. Without Acquired Fund Fees and Expenses, total annual operating expense ratio would be 2.35%.
Distributed by: Rafferty Capital Markets, LLC
Date of First Use: October 26, 2012
HCM Freedom Fund
Performance Summary
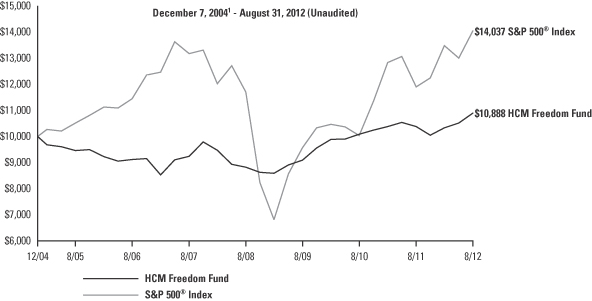
| | | | | | | | | | | | | | | | |
| | | Average Annual Total Return2 | |
| | | 1 Year | | | 3 Year | | | 5 Year | | | Since
Inception | |
HCM Freedom Fund | | | 4.92 | % | | | 6.21 | % | | | 3.35 | % | | | 1.11 | % |
| | | | |
S&P 500® Index | | | 18.00 | % | | | 13.62 | % | | | 1.28 | % | | | 4.48 | % |
This chart illustrates the performance of a hypothetical $10,000 investment made on the Fund’s inception, and is not intended to imply any future performance. The returns shown do not reflect the deduction of taxes that a shareholder would pay on fund distributions of the redemption of fund shares. The performance of the S&P 500® Index does not reflect the deduction of fees associated with a mutual fund, such as investment management fees. Investors cannot invest directly in an index, although they can invest in its underlying securities.
The performance data shown represents past performance and does not guarantee future results.
Market Exposure2
| | | | |
Investment Type | | %
Net Assets | |
Investment Companies | | | 99.2% | |
| | | | |
Total Exposure | | | 99.2% | |
| | | | |
“Market Exposure” includes the value of total investments (including the contract value of any derivatives) and excludes any short-term investments and cash equivalents divided by Net Assets.
| 1 | Commencement of operations. |
Expense Example
August 31, 2012 (Unaudited)
As a shareholder of a mutual fund, you incur two types of costs: (1) transaction costs, including sales charges (loads) on purchase payments, reinvested dividends, or other distributions; redemption fees and exchange fees; and (2) ongoing costs, including management fees; distribution and/or service fees; and other fund expenses. This example is intended to help you understand your ongoing costs (in dollars) of investing in a fund and to compare costs with the ongoing costs of investing in other mutual funds.
The Example is based on an investment of $1,000 invested at the beginning of the period and held the entire period (March 1, 2012 — August 31, 2012).
Actual Expenses
The first line of the table below provides information about actual account values and actual expenses. You may use the information in this line, together with the amount you invested, to estimate the expenses that you paid over the period. Simply divide your account value by $1,000 (for example, an $8,600 account value divided by $1,000 = 8.6), then multiply the result by the number in the first line under the heading entitled “Expenses Paid During Period” to estimate the expenses you paid on your account during this period.
Hypothetical Example for Comparison Purposes
The second line of the table below provides information about hypothetical account values and hypothetical expenses based on the Funds’ actual expense ratios and an assumed rate of return of 5% per year before expenses, which is not the Funds’ actual return. The hypothetical account values and expenses may not be used to estimate the actual ending account balance or expenses you paid for the period. You may use this information to compare the ongoing costs of investing in the Funds and other funds. To do so, compare this 5% hypothetical example with the 5% hypothetical examples that appear in the shareholder reports of the other funds.
Please note that the expenses shown in the table are meant to highlight your ongoing costs only and do not reflect any transactional costs, such as wire transfers, returned checks or stop payment orders. Therefore, the second line of the table is useful in comparing ongoing costs only, and will not help you determine the relative costs of owning different funds. In addition, if these transactional costs were included, your costs would have been higher.
Expense Example Table
August 31, 2012 (Unaudited)
| | | | | | | | | | | | | | | | |
| | | Expense
Ratio1 | | | Beginning
Account Value
March 1, 2012 | | | Ending
Account Value
August 31, 2012 | | | Expenses
Paid During
Period2 | |
HCM Freedom Fund | | | | | | | | | | | | | | | | |
Based on actual fund return | | | 2.35 | % | | $ | 1,000.00 | | | $ | 1,054.10 | | | $ | 12.13 | |
Based on hypothetical 5% return | | | 2.35 | % | | | 1,000.00 | | | | 1,013.32 | | | | 11.89 | |
| 2 | Expenses are equal to the Fund’s annualized expense ratio, multiplied by the average account value over the period, multiplied by the number of days in the period of March 1, 2012 to August 31, 2012, then divided by 366. |
Allocation of Portfolio Holdings
August 31, 2012 (Unaudited)
| | | | | | | | | | | | |
| | | Cash* | | | Investment
Companies | | | Total | |
HCM Freedom Fund | | | 1 | % | | | 99 | % | | | 100 | % |
| * | Cash, cash equivalents and other assets less liabilities. |
HCM Freedom Fund
Schedule of Investments
August 31, 2012
| | | | | | | | |
Shares | | | | | Value | |
| INVESTMENT COMPANIES - 99.2% | |
| | 1,221,741 | | | Nuveen High Yield Municipal Bond Fund | | $ | 20,622,995 | |
| | 516,546 | | | Oppenheimer AMT-Free Municipals | | | 3,729,464 | |
| | | | | | | | |
| | | | TOTAL INVESTMENT COMPANIES (Cost $23,228,743) | | $ | 24,352,459 | |
| | | | | | | | |
| | | | TOTAL INVESTMENTS
(Cost $23,228,743) - 99.2% | | $ | 24,352,459 | |
| | | | Other Assets in Excess of
Liabilities - 0.8% | | | 193,938 | |
| | | | | | | | |
| | | | TOTAL NET ASSETS - 100.0% | | $ | 24,546,397 | |
| | | | | | | | |
Percentages are stated as a percent of net assets.
The accompanying notes are an integral part of these financial statements.
Statement of Assets and Liabilities
August 31, 2012
| | | | |
| | | HCM Freedom
Fund | |
Assets: | | | | |
Investments, at market value (Note 2) | | $ | 24,352,459 | |
Cash | | | 144,438 | |
Receivables: | | | | |
Dividends | | | 103,848 | |
| | | | |
Total assets | | | 24,600,745 | |
| | | | |
Liabilities: | | | | |
Payables: | | | | |
Fund shares redeemed | | | 5,000 | |
Accrued investment advisory fees | | | 20,999 | |
Accrued distribution expense | | | 16,799 | |
Accrued operating services fees | | | 11,550 | |
| | | | |
Total liabilities | | | 54,348 | |
| | | | |
Net Assets | | $ | 24,546,397 | |
| | | | |
Net Assets Consist Of: | | | | |
Capital stock | | | 42,481,952 | |
Undistributed net investment income | | | 356,285 | |
Accumulated net realized loss | | | (19,415,556 | ) |
Net unrealized appreciation on: | | | | |
Investments | | | 1,123,716 | |
| | | | |
Total Net Assets | | $ | 24,546,397 | |
| | | | |
Calculation of Net Asset Value Per Share: | | | | |
Net Assets | | $ | 24,546,397 | |
Shares outstanding (unlimited shares of beneficial interest authorized, no par value) | | | 1,554,811 | |
Net asset value, redemption and offering price per share | | $ | 15.79 | |
| | | | |
Cost of Investments | | $ | 23,228,743 | |
| | | | |
The accompanying notes are an integral part of these financial statements.
| | |
| | |
| 10 | | DIREXION ANNUAL REPORT |
Statement of Operations
For the Year Ended August 31, 2012
| | | | |
| | | HCM Freedom
Fund | |
Investment Income: | | | | |
Dividend income | | $ | 955,307 | |
Interest income | | | 2,353 | |
| | | | |
Total investment income | | | 957,660 | |
| | | | |
Expenses: | | | | |
Investment advisory fees | | | 255,816 | |
Distribution expenses | | | 204,653 | |
Operating services fees | | | 140,699 | |
| | | | |
Total expenses | | | 601,168 | |
| | | | |
Net investment income | | | 356,492 | |
| | | | |
Realized and unrealized gain (loss) on investments: | | | | |
Net realized gain (loss) on: | | | | |
Investments | | | 70,028 | |
Futures | | | (354,199 | ) |
Swaps | | | (56,775 | ) |
| | | | |
| | | (340,946 | ) |
| | | | |
Change in net unrealized appreciation on: | | | | |
Investments | | | 1,123,716 | |
Swaps | | | 60,474 | |
| | | | |
| | | 1,184,190 | |
| | | | |
Net realized and unrealized gain on investments | | | 843,244 | |
| | | | |
Net increase in net assets resulting from operations | | $ | 1,199,736 | |
| | | | |
The accompanying notes are an integral part of these financial statements.
| | |
| |
| DIREXION ANNUAL REPORT | | 11 |
Statement of Changes in Net Assets
| | | | | | | | |
| | | HCM Freedom Fund | |
| | | Year Ended
August 31, 2012 | | | Year Ended
August 31, 2011 | |
Increase (Decrease) in net assets from: | | | | | | | | |
Operations | | | | | | | | |
Net investment income | | $ | 356,492 | | | $ | 455,574 | |
Net realized gain (loss) on investments | | | (340,946 | ) | | | 773,890 | |
Capital gain distributions from regulated investment companies | | | — | | | | 47,131 | |
Change in net unrealized appreciation (depreciation) on investments | | | 1,184,190 | | | | (477,845 | ) |
| | | | | | | | |
Net increase in net assets resulting from operations | | | 1,199,736 | | | | 798,750 | |
| | | | | | | | |
Distributions to shareholders: | | | | | | | | |
Net investment income | | | (152,356 | ) | | | (862,997 | ) |
| | | | | | | | |
Total distributions to shareholders | | | (152,356 | ) | | | (862,997 | ) |
| | | | | | | | |
Capital share transactions: | | | | | | | | |
Net decrease in net assets resulting from net change in capital share transactions(a) | | | (2,849,177 | ) | | | (1,526,530 | ) |
| | | | | | | | |
Total decrease in net assets | | | (1,801,797 | ) | | | (1,590,777 | ) |
| | | | | | | | |
Net assets: | | | | | | | | |
Beginning of year | | | 26,348,194 | | | | 27,938,971 | |
| | | | | | | | |
End of year | | $ | 24,546,397 | | | $ | 26,348,194 | |
| | | | | | | | |
Undistributed net investment income, end of year | | $ | 356,285 | | | $ | 152,149 | |
| | | | | | | | |
| (a) | Summary of capital share transactions is as follows: |
| | | | | | | | | | | | | | | | |
| | | HCM Freedom Fund | |
| | | Year Ended
August 31, 2012 | | | Year Ended
August 31, 2011 | |
| | | Shares | | | Value | | | Shares | | | Value | |
Shares sold | | | 53,181 | | | $ | 787,382 | | | | 105,255 | | | $ | 1,615,292 | |
Shares issued in reinvestment of distributions | | | 9,991 | | | | 145,268 | | | | 55,417 | | | | 822,386 | |
Shares redeemed | | | (248,921 | ) | | | (3,781,827 | ) | | | (259,160 | ) | | | (3,964,208 | ) |
| | | | | | | | | | | | | | | | |
Net decrease | | | (185,749 | ) | | $ | (2,849,177 | ) | | | (98,488 | ) | | $ | (1,526,530 | ) |
| | | | | | | | | | | | | | | | |
The accompanying notes are an integral part of these financial statements.
| | |
| | |
| 12 | | DIREXION ANNUAL REPORT |
Financial Highlights
| | | | | | | | | | | | | | | | | | | | | | | | | | | | | | | | | | | | | | | | | | | | | | | | | | | | | | | | | | | | |
| | | | | | | | | | | | | | | | | | | | | | | | | | | | | | | | | | | | RATIOS TO AVERAGE NET ASSETS | |
| Year/Period | | Net Asset
Value,
Beginning
of Year/Period | | | Net
Investment
Income
(Loss)2 | | | Net Realized
and
Unrealized
Gain (Loss) on
Investments | | | Net Increase
(Decrease) in
Net Asset
Value Resulting
from Operations | | | Dividends
from Net
Investment
Income | | | Distributions
from
Realized
Capital Gains | | | Return of
Capital
Distribution | | | Total
Distributions | | | Net Asset
Value, End of
Year/Period | | | Total
Return3 | | | Net Assets,
End of
Year/Period
(,000) | | | Total
Expenses1 | | | Net
Expenses1 | | | Net Investment
Income (Loss)
After Expense
Reimbursement/
Recoupment1 | | | Portfolio
Turnover
Rate4 | |
| | | | | | | | | | | | | | | |
HCM Freedom Fund | |
Year ended August 31, 2012 | | $ | 15.14 | | | $ | 0.21 | | | $ | 0.53 | | | $ | 0.74 | | | $ | (0.09 | ) | | $ | — | | | $ | — | | | $ | (0.09 | ) | | $ | 15.79 | | | | 4.92% | | | $ | 24,546 | | | | 2.35% | | | | 2.35% | | | | 1.39% | | | | 434% | |
Year ended August 31, 2011 | | | 15.19 | | | | 0.25 | | | | 0.18 | | | | 0.43 | | | | (0.48 | ) | | | — | | | | — | | | | (0.48 | ) | | | 15.14 | | | | 2.88% | | | | 26,348 | | | | 2.35% | | | | 2.35% | | | | 1.65% | | | | 249% | |
Year ended August 31, 2010 | | | 14.47 | | | | 1.08 | | | | 0.50 | | | | 1.58 | | | | (0.86 | ) | | | — | | | | — | | | | (0.86 | ) | | | 15.19 | | | | 11.16% | | | | 27,939 | | | | 2.35% | | | | 2.35% | | | | 7.20% | | | | 468% | |
Year ended August 31, 2009 | | | 14.68 | | | | 0.01 | | | | 0.40 | | | | 0.41 | | | | (0.62 | ) | | | — | | | | — | | | | (0.62 | ) | | | 14.47 | | | | 2.83% | | | | 25,209 | | | | 2.42% | | | | 2.43% | | | | 0.05% | | | | 1,311% | |
Year ended August 31, 2008 | | | 17.46 | | | | 0.06 | | | | (0.70 | ) | | | (0.64 | ) | | | (2.14 | ) | | | — | | | | — | | | | (2.14 | ) | | | 14.68 | | | | (4.43% | ) | | | 25,517 | | | | 2.50% | | | | 2.45% | | | | 0.35% | | | | 2,886% | |
| 2 | Net investment income (loss) per share represents net investment income (loss) divided by the daily average shares of beneficial interest outstanding throughout each period. |
| 3 | All returns reflect reinvested dividends, if any, but do not reflect the impact of taxes. |
| 4 | Portfolio turnover is calculated without regard to short-term securities having a maturity of less than one year. Investments in swaps and futures contracts and repurchase agreements are deemed short-term securities. The Fund’s aggressive investment strategy may result in significant portfolio turnover to take advantage of anticipated changes in market conditions. |
| | |
| |
| DIREXION ANNUAL REPORT | | 13 |
Direxion Funds
NOTES TO THE FINANCIAL STATEMENTS
August 31, 2012
Direxion Funds (the “Trust”) was organized as a Massachusetts Business Trust on June 6, 1997 and is registered under the Investment Company Act of 1940, as amended (the “1940 Act”), as an open-end management investment company issuing its shares in series, each series representing a distinct portfolio with its own investment objective and policies. The Trust currently has 23 series of which 1 is included in this report: HCM Freedom Fund (the “Fund”). The Fund is a “non-diversified” series of the Trust pursuant to the 1940 Act.
The HCM Freedom Fund’s objective is long-term capital appreciation with lower volatility than the overall market by employing a dynamic asset allocation strategy. The Fund has great flexibility in deciding in what to invest and when to invest, and may invest in a broad range of equity and fixed income securities, both domestically and internationally, as well as derivative instruments of these securities.
| 2. | | SIGNIFICANT ACCOUNTING POLICIES |
The following is a summary of significant accounting policies consistently followed by the Fund in the preparation of its financial statements. These policies are in conformity with U.S. generally accepted accounting principles (“GAAP”).
a) Investment Valuation – The Net Asset Value (“NAV”) of the Fund is determined daily, Monday through Friday, as of the close of regular trading on the New York Stock Exchange (“NYSE”), each day the NYSE is open for business. The value of all portfolio securities and other assets held by the Fund is determined as of the time the Fund calculates its NAV, 4:00 p.m. Eastern Time (“Valuation Time”). Equity securities and exchange-traded funds are valued at their last sales price, or if not available, at the average of the last bid and ask prices. Investments in open-end mutual funds are valued at their respective quoted NAV on the valuation dates. Futures contracts are valued at the settlement price established on the exchange on which they are traded, if that settlement price reflects trading prior to the Valuation Time. If the settlement price established by the exchange reflects trading after the Valuation Time, then the last sales price prior to Valuation Time will be used. Over-the-counter securities are valued at the average of the last bid and ask prices. Securities primarily traded on the NASDAQ National Market are valued using the NASDAQ Official Closing Price. Swap contracts are valued using the closing price of the underlying reference entity or the closing value of the underlying reference index. Short-term debt securities with a maturity of 60 days or less at time of purchase and money market securities are valued using the amortized cost method. Other debt securities are valued by the Fund’s pricing service using the mean prices or, if such prices are unavailable, by a matrix pricing method. Securities for which reliable market quotations are not readily available, the Fund’s pricing service does not provide a valuation for such securities, the Fund’s pricing service provides valuation that in the judgment of Rafferty Asset Management, LLC (the “Adviser”) does not represent fair value, or the Fund or Adviser believes the market price is stale will be fair valued as determined by the Adviser under the supervision of the Board of Trustees. Additionally, the Adviser will monitor developments in the marketplace for significant events that may affect the value of those securities whose closing prices were established before the Valuation Time.
b) Repurchase Agreements – The Fund may enter into repurchase agreements with institutions that are members of the Federal Reserve System or securities dealers who are members of a national securities exchange or are primary dealers in U.S. government securities. In connection with transactions in repurchase agreements, it is the Trust’s policy that the Fund receives, as collateral, cash and/or securities (primarily U.S. government securities) whose fair value, including accrued interest, at all times will be at least equal to 100% of the amount invested by the Fund in each repurchase agreement. If the seller defaults, and the value of the collateral declines, realization of the collateral by the Fund may be delayed or limited. The Fund follows authoritative standards of accounting for repurchase agreements, which modify the criteria for determining effective control of transferred assets and as a result certain repurchase agreements may now be accounted for as secured borrowings. During the year ended August 31, 2012, the Funds did not enter into transactions that were deemed secured borrowings. The Fund was not invested in repurchase agreements at August 31, 2012.
c) Swap Contracts – The Fund may enter into equity swap contacts. Standard equity swap contracts are between two parties that agree to exchange the returns (or differentials in rates of return) earned or realized on particular predetermined investments or instruments. The gross amount to be exchanged is calculated with respect to a “notional
| | |
| | |
| 14 | | DIREXION ANNUAL REPORT |
amount” (i.e. the return on or increase in value of a particular dollar amount invested in a “basket” of securities representing a particular index or industry sector). The Fund enters into netting agreements with the counterparty. These agreements calculate the obligations of the parties on a “net basis”. The Fund does not offset the fair value amounts of the swap contract and the related collateral on the Statement of Assets and Liabilities arising from swap contracts executed with the same counterparty under such netting agreements. The Fund’s obligations are accrued daily (offset by any amounts owed to the Fund). The Fund was not invested in equity swap contracts at August 31, 2012.
In a “long” equity swap agreement, the counterparty will generally agree to pay the Fund the amount, if any, by which the notional amount of swap contract would have increased in value if the Fund had been invested in the particular securities, plus dividends that would have been received on those securities. The Fund will agree to pay the counterparty a floating rate of interest (e.g., a LIBOR based rate) on the notional amount of the swap contract plus the amount, if any, by which the notional amount would have decreased in value had it been invested in such securities plus, in certain instances, commissions or trading spreads on the notional amounts. Thus, the return on the swap contract should be the gain or loss on the notional amount plus dividends on the securities less the interest and commission paid by the Fund on the notional amount. However, in certain instances, market factors such as the interest rate environment and the demand to borrow the securities underlying the swap agreement can cause a scenario in which the counterparty will pay the Fund interest. Payments may be made at the conclusion of the contract or periodically during its term. Swap contracts do not include the delivery of securities by the Fund to the counterparty. The net amount of the excess, if any, of the Fund’s obligations over its entitlement with respect to each swap is accrued on a daily basis and an amount of cash or liquid assets having an aggregate net asset value at least equal to such accrued excess is maintained in a segregated account. Until a swap contract is settled in cash, the gain or loss on the notional amount plus dividends on the securities less the interest paid by the Fund on the notional amount are recorded as “unrealized gains or losses on swaps” and when cash is exchanged, the gain or loss is recorded as “realized gains or losses on swaps.”
The Fund collateralizes swap agreements with cash and certain securities as indicated on the Schedule of Investments of the Fund. Such collateral is held for the benefit of the counterparty in a segregated account at the Custodian to protect the counterparty against non-payment by the Fund. The Fund does not net collateral on the Statement of Assets & Liabilities. In the event of a default by the counterparty, the Fund will seek return of this collateral and may incur certain costs exercising their rights with respect to the collateral. Amounts expected to be owed to the Fund are collateralized daily directly to Funds while amounts expected to be owed to the counterparty are collateralized daily in a segregated account at the Custodian.
In the event of the counterparty’s default, bankruptcy or any other event for which the counterparty can not meet its obligations, the Fund bears the risk of loss equal to the amount of the daily appreciation owed to the Fund. This obligation represents the daily gain accrued to the Fund from the close of business day prior to this event to the day on which this event occurs and the counterparty can no longer meet its obligations. The Fund will enter into swap agreements only with large, well-capitalized and established financial institutions. The creditworthiness of each of the firms that is a party to a swap agreement is monitored by the Adviser. Shareholders may obtain swap counterparty financial statements at www.sec.gov. Swap contracts are subject to credit risk. Credit risk is where the financial condition of an issuer of a security or instrument may cause it to default or become unable to pay interest or principal due on the security. The counterparty to a swap contract might default on its obligations. In addition, the Fund has agreements with certain counterparties with which it trades swap contracts that contain credit risk-related contingent features that could be triggered subject to certain circumstances. Such circumstances included agreed upon net asset value and performance-based thresholds.
The Fund was not invested in swap contracts at August 31, 2012.
d) Short Positions – The Fund may engage in short sale transactions. For financial statement purposes, an amount equal to the settlement amount is included in the Statement of Assets and Liabilities as an asset and an equivalent liability. The amount of the liability is subsequently marked-to-market to reflect the current value of the short position. Subsequent fluctuations in the market prices of short positions may require purchasing the securities at prices which may differ from the market value reflected on the Statement of Assets and Liabilities. The Fund is liable to the buyer for any dividends payable on securities while those securities are in a short position. As collateral for its short positions, the Fund is required under the 1940 Act to maintain assets consisting of cash, cash equivalents or liquid securities equal to the market value of the securities sold short. This collateral is required to be adjusted daily. The Fund was not invested in short positions at August 31, 2012.
e) Stock Index Futures Contracts and Options on Futures Contracts – The Fund may purchase and sell stock index futures contracts and options on such futures contracts. The Fund may use futures contracts to gain exposure to, or hedge against, changes in the value of equities, interest rates or foreign countries. Upon entering into a contract, the Fund deposits and maintains as collateral such initial margin as required by the exchange on which the transaction is effected.
| | |
| |
| DIREXION ANNUAL REPORT | | 15 |
Pursuant to the contract, the Fund agrees to receive from or pay to the broker an amount of cash equal to the daily fluctuation in the value of the contract. Such receipts or payments are known as “variation margin” and are recorded by the Fund as unrealized gains and losses. When the contract is closed, the Fund records a realized gain or loss equal to the difference between the value of the contract at the time it was opened and the value at the time it was closed. As collateral for futures contracts, the Fund is required under the 1940 Act to maintain assets consisting of cash, cash equivalents or liquid securities. This collateral is required to be adjusted daily to reflect the market value of the purchase obligation for long futures contracts or the market value of the instrument underlying the contract, but not less than the market price at which the futures contract was established, for short futures contracts. The Fund was not invested in stock index futures contracts or options on futures contracts at August 31, 2012.
f) Risks of Options, Futures Contracts, Options on Futures Contracts and Short Positions – The risks inherent in the use of options, futures contracts, options on futures contracts and short positions include 1) adverse changes in the value of such instruments; 2) imperfect correlation between the price of options and futures contracts and options thereon and movements in the price of the underlying securities, index or futures contracts; 3) the possible absence of a liquid secondary market for any particular instrument at any time; 4) the possible need to defer closing out certain positions to avoid adverse tax consequences; and 5) the possible nonperformance by the counterparty under the terms of the contract. The Fund designates all cash, cash equivalents and liquid securities as collateral for written options, futures contracts, options on futures contracts and short positions.
g) Security Transactions – Investment transactions are recorded on the trade date. The Fund determines the gain or loss realized from the investment transactions by comparing the identified cost, which is the same basis used for federal income tax purposes, with the net sales proceeds.
h) Federal Income Taxes – The Fund intends to comply with the requirements of Subchapter M of the Internal Revenue Code necessary to qualify as a regulated investment company and to make the requisite distributions of income and capital gains to its shareholders sufficient to relieve it from all or substantially all federal income taxes and excise taxes. No provision for federal income taxes has been made.
i) Income and Expenses – Dividend income is recorded on the ex-dividend date. Interest income, including amortization of premium and discount, and dividends received from money market funds, is recognized on an accrual basis. Expenses are charged to the Fund daily. Expenses are computed based on the Fund’s respective daily net assets. For additional discussion on expenses refer to Note 4.
j) Distributions to Shareholders – The Fund generally pays dividends from net investment income and distributes net realized capital gains, if any, at least annually. Income and capital gain distributions are determined in accordance with income tax regulations, which may differ from GAAP. Distributions to shareholders are recorded on the ex-dividend date.
The Fund paid ordinary income distributions of $152,356 during the year ended August 31, 2012 and $862,997 for the year ended August 31, 2011.
The Fund may designate as long-term capital gain dividends, pursuant to Internal Revenue Code 852(b)(3), the amount necessary to reduce the earnings and profits of the Fund related to net capital gain to zero for the tax year ended August 31, 2012. To the extent necessary to fully distribute such capital gains, the Fund also designates earnings and profits distributed to shareholders on the redemption of shares.
As of August 31, 2012, the components of distributable earnings of the Fund on a tax basis was as follows:
| | | | |
| | | HCM Freedom Fund | |
Tax cost of investments | | $ | 23,228,743 | |
Gross unrealized appreciation | | | 1,123,716 | |
Gross unrealized depreciation | | | — | |
| | | | |
Net unrealized appreciation | | $ | 1,123,716 | |
| | | | |
Undistributed ordinary income | | | 356,285 | |
Undistributed long-term capital gain | | | — | |
| | | | |
Total distributable earnings | | | 356,285 | |
| | | | |
Other accumulated loss | | | (19,415,556 | ) |
| | | | |
Total accumulated loss | | $ | (17,935,555 | ) |
| | | | |
| | |
| | |
| 16 | | DIREXION ANNUAL REPORT |
Other accumulated gain/ (loss) is generally comprised of capital loss carryforwards.
On the Statement of Assets and Liabilities, there were no adjustments were made for permanent tax differences between accounting for net investment income and realized gain and losses under GAAP and tax reporting:
Net investment income and realized gains and losses for federal income tax purposes may differ from that reported on the financial statements because of permanent book-to-tax differences. GAAP requires that permanent differences in net investment income and realized gains and losses due to differences between financial reporting and tax reporting be reclassified between various components of net assets.
Under current law, the Fund may carry forward net capital losses indefinitely to use to offset capital gains realized in future years. Previous law limited the carry forward of capital losses to the eight tax years following the year the capital loss was realized. If the Fund has capital losses that are subject to current law and also has capital losses subject to prior law, the losses realized under current law will be utilized to offset capital gains before any of the losses governed by prior law can be used. As a result of these ordering rules, capital losses realized under previous law may be more likely to expire unused. Capital losses realized under current law will carry forward retaining their classification as long-term or short-term losses; as compared to under prior law in which all capital losses were carried forward as short term capital losses.
At August 31, 2012, the Fund had capital loss carryforwards on a tax basis of:
| | | | | | | | | | | | | | | | | | | | | | | | |
| Capital Losses Expiring | |
| | | 8/31/2014 | | | 8/31/2015 | | | 8/31/2016 | | | 8/31/2017 | | | Indefinite ST | | | Indefinite LT | |
HCM Freedom Fund | | | (6,321,052 | ) | | | (5,679,579 | ) | | | (1,637,612 | ) | | | (5,404,099 | ) | | | (128,427 | ) | | | (244,787 | ) |
To the extent the Fund realizes future net capital gains, those gains will be offset by any unused capital loss carryover.
The Fund follows authoritative financial reporting rules regarding recognition and measurement of tax positions taken or expected to be taken on a tax return. The Fund has reviewed all open tax years and concluded that there is no effect to the Fund’s financial positions or results of operations and no tax liability resulting from unrecognized tax benefits relating to uncertain income tax position taken or expected to be taken on a tax return. Open tax years are those years that are open for examination by the relevant income taxing authority. As of August 31, 2012, open Federal and state income tax years include the tax years ended August 2009 to August 2012. The Fund has no examination in progress. The Fund is also not aware of any tax positions for which it is reasonably possible that the total amounts of unrecognized tax expense will significantly change in the next twelve months.
k) Guarantees and Indemnifications – In the ordinary course of business, the Fund enters into contracts that contain a variety of indemnification provisions pursuant to which the Fund agrees to indemnify third parties upon the occurrence of specified events. The Fund’s maximum exposure relating to these indemnification agreements is unknown. However, the Fund has not had prior claims or losses in connection with these provisions and believes the risk of loss is remote.
l) Use of Estimates – The preparation of financial statements in conformity with GAAP requires management to make estimates and assumptions that affect the reported amounts of assets and liabilities and disclosure of contingent assets and liabilities at the date of the financial statements and the reported amounts of revenues and expenses during the reporting period. Actual results could differ from those estimates.
| 3. | | INVESTMENT TRANSACTIONS |
During the year ended August 31, 2012, the aggregate purchases and sales of investments (excluding short-term investments, swaps and futures contracts) were $98,217,113 and $75,058,398 respectively.
| | |
| |
| DIREXION ANNUAL REPORT | | 17 |
| 4. | | INVESTMENT ADVISORY AND OTHER AGREEMENTS |
Investment Advisory Agreement: The Fund has entered into an investment advisory agreement with the Adviser. The Adviser earns a fee, computed daily and payable monthly, applied to the Fund’s average daily net assets at an annual rate of 1.00%.
In addition, the Adviser has entered into sub-advisory agreements with Horizon Capital Management, Inc. whereby the sub-advisor will direct investment activities of the Fund. The Adviser pays, out of the management fees it receives from the Fund, a fee for these sub-advisory services.
Operating Services Agreement: The Fund has entered into an Operating Service Agreement (the “Agreement”) with the Adviser. Under the Agreement, the Adviser will be responsible for all expenses of the Trust except the following: management fees, distribution and/or service fees, acquired fund fees, taxes, leverage interest, dividends or interest on short positions, other interest expenses, brokerage commission and other extraordinary expenses outside the typical day-to-day operations of the Fund. In consideration for the services rendered pursuant to the Agreement, the Fund will pay to the Adviser, as compensation for the services provided by the Adviser under the Agreement, a monthly fee of 0.55%. The monthly fee is calculated on an annualized basis on the average net assets of the Fund.
Distribution Expenses: Shares of the Fund are subject to an annual Rule 12b-1 fee of 0.80% for the Fund’s average daily net assets.
Rafferty Capital Markets, LLC (the “Distributor”) serves as principal underwriter of the Fund and acts as the Fund’s distributor in a continuous public offering of the Fund’s shares. There were no Rule 12b-1 fees retained by the Distributor for the year ended August 31, 2012. The Distributor is an affiliate of the Adviser.
| 5. | | VALUATION MEASUREMENTS |
The Fund follows authoritative fair valuation accounting standards which establish an authoritative definition of fair value and set out a hierarchy for measuring fair value. These standards require additional disclosures about the various inputs and valuation techniques used to develop the measurements of fair value and a discussion in changes in valuation techniques and related inputs during the period. These inputs are summarized in the three broad levels listed below:
Level 1 – Quoted prices in active markets for identical securities
Level 2 – Evaluated price based on other significant observable inputs (including quoted prices for similar securities, interest rates, prepayment speeds, credit risk, etc.)
Level 3 – Significant unobservable inputs (including the Fund’s own assumptions in determining fair value of investments)
The inputs or methodology used for valuing securities are not an indication of the credit risk associated with investing in those securities.
The following is a summary of the inputs used to value the Fund’s net assets as of August 31, 2012:
| | | | | | | | | | | | | | |
| | | HCM Freedom Fund | |
Asset Class | | Level 1 | | Level 2 | | | Level 3 | | | Total | |
Investment Companies - Fixed Income | | $24,352,459 | | $ | — | | | $ | — | | | $ | 24,352,459 | |
For further detail on each asset class, see Schedule of Investments.
The Fund follows authoritative accounting standards which improve disclosure about fair value measurements. These standards require additional disclosure regarding fair value measurements. Specifically, these standards require reporting entities to disclose a) the input and valuation techniques used to measure fair value for both recurring and nonrecurring fair value measurements, for Level 2 or Level 3 positions, b) transfers between all levels (including Level 1 and Level 2) will be required to be disclosed on a gross basis (i.e. transfers out must be disclosed separately from transfers in) as well as the reason(s) for the transfers and c) purchases and sales must be shown on a gross basis in Level 3 rollforward rather than as one net number. Additionally, reporting entities are required to disclose quantitative information about unobservable inputs used in the fair value measurements categorized within Level 3 of the fair value hierarchy.
| | |
| | |
| 18 | | DIREXION ANNUAL REPORT |
There were no transfers between Level 1 and Level 2 securities during the year ended August 31, 2012. The Fund held no Level 3 securities during the years ended August 31, 2011 and August 31, 2012. It is the Fund’s policy to recognize transfers into Level 3 at the value as of the beginning of the period.
| 6. | | ADDITIONAL DISCLOSURES ABOUT DERIVATIVE INSTRUMENTS |
The Fund follows authoritative standards of accounting for derivative instruments which establish disclosure requirements for derivative instruments. These standards improve financial reporting for derivative instruments by requiring enhanced disclosures that enables investors to understand how and why a fund uses derivatives instruments, how derivatives instruments are accounted for and how derivative instruments affect a fund’s financial position and results of operations.
The Fund uses derivative instruments as part of its principal investment strategy to achieve its investment objective. For additional discussion on the risks associated with derivative instruments refer to Note 2.
At August 31, 2012, no derivatives instruments were held in the Fund.
Transactions in derivative instruments during the year ended August 31, 2012, were as follows:
| | | | | | | | | | | | | | | | | | | | | | |
| | | | | Credit risk | | | Currency risk | | | Interest rate risk | | | Equity risk | | | Total | |
HCM Freedom Fund | | Net Realized gain (loss)1 | | | | | | | | | | | | | | | | | | | | |
| | Swap contracts | | $ | (6,657 | ) | | $ | (7,947 | ) | | $ | 4,880 | | | $ | (47,051 | ) | | $ | (56,775 | ) |
| | Futures contracts | | | — | | | | — | | | | — | | | | (354,199 | ) | | | (354,199 | ) |
| | Total realized gain (loss) | | $ | (6,657 | ) | | $ | (7,947 | ) | | $ | 4,880 | | | $ | (401,250 | ) | | $ | (410,974 | ) |
| | Change in net unrealized appreciation (depreciation)2 | | | | | | | | | | | | | | | | | | | | |
| | Swap contracts | | $ | — | | | $ | — | | | $ | — | | | $ | 60,474 | | | $ | 60,474 | |
| 1 | Statement of Operations location: Net unrealized gain (loss) on futures and swaps. |
| 2 | Statement of Operations location: Change in unrealized appreciation (depreciation) on swaps. |
For the year ended August 31, 2012, the volume of the derivatives held by the Fund was as follows:
| | | | | | | | |
| | | Quarterly average gross notional amount | |
| | | Long Equity Swaps
Contracts | | | Short Equity Swaps
Contracts | |
HCM Freedom Fund | | $ | 40,332 | | | $ | 60,009 | |
The Fund utilizes this volume of derivatives as a substitute for investing in comparable positions in underlying securities and/or as a means to limit exposure of the Fund’s position. During the year ended August 31, 2012, the Fund invested in short equity swap contracts towards the beginning of the period while investing in long equity swap contracts towards the middle part of the year. Additionally, the Fund invested in short futures contracts. This volume of futures contracts was minimal during the year ended August 31, 2012.
The Fund follows authoritative standards for accounting for and disclosure of events that occur after the Statement of Assets and Liabilities date but before financial statements are issued or are available to be issued. These standards require the Fund to recognize in the financial statements the effects of all recognized subsequent events that provide additional evidence about conditions that existed at the date of the Statement of Assets and Liabilities. For nonrecognized subsequent events that must be disclosed to keep the financial statements from being misleading, the Fund is required to disclose the nature of the event as well as an estimate of its financial effect, or a statement that such an estimate cannot be made. The Fund has evaluated subsequent events through the issuance of the Fund’s financial statements and has determined there is no impact to the Fund’s financial statements.
| | |
| |
| DIREXION ANNUAL REPORT | | 19 |
Direxion Funds
Report of Independent Registered Public Accounting Firm
To the Board of Trustees and Shareholders of Direxion Funds:
We have audited the accompanying statement of assets and liabilities of the HCM Freedom Fund (one of the series of the Direxion Funds) (the “Fund”), including the schedule of investments, as of August 31, 2012, and the related statement of operations for the year then ended, the statement of changes in net assets for each of the two years in the period then ended, and the financial highlights for each of the five years in the period then ended. These financial statements and financial highlights are the responsibility of the Fund’s management. Our responsibility is to express an opinion on these financial statements and financial highlights based on our audit.
We conducted our audits in accordance with the standards of the Public Company Accounting Oversight Board (United States). Those standards require that we plan and perform the audit to obtain reasonable assurance about whether the financial statements and financial highlights are free of material misstatement. We were not engaged to perform an audit of the Fund’s internal control over financial reporting. Our audits included consideration of internal control over financial reporting as a basis for designing audit procedures that are appropriate in the circumstances, but not for the purpose of expressing an opinion on the effectiveness of the Fund’s internal control over financial reporting. Accordingly, we express no such opinion. An audit also includes examining, on a test basis, evidence supporting the amounts and disclosures in the financial statements and financial highlights, assessing the accounting principles used and significant estimates made by management, and evaluating the overall financial statement presentation. Our procedures included confirmation of securities owned as of August 31, 2012, by correspondence with the custodian and brokers. We believe that our audits provide a reasonable basis for our opinion.
In our opinion, the financial statements and financial highlights referred to above present fairly, in all material respects, the financial position of the HCM Freedom Fund at August 31, 2012, the results of its operations for the year then ended, the changes in its net assets for each of the two years in the period then ended, and the financial highlights for each of the five years in the period then ended, in conformity with U.S. generally accepted accounting principles.

New York, New York
October 26, 2012
| | |
| | |
| 20 | | DIREXION ANNUAL REPORT |
Additional Information
(Unaudited)
For the year ended August 31, 2012, certain dividends paid by the Funds may be subject to a maximum rate of 15%, as provided for by the Jobs and Growth Tax Relief Reconciliation Act of 2003. The amount of dividends declared from ordinary income designated as qualified income was 0.17% for the Fund.
For corporate shareholders, the amount of ordinary income distributions qualifying for the corporate dividends received deduction for the year ended August 31, 2012 was 0.17% for the Fund.
HOUSEHOLDING
In an effort to decrease costs, the Funds intend to reduce the number of duplicate prospectuses, Annual and Semi-Annual Reports, proxy statements and other similar documents you receive by sending only one copy of each to those addresses shared by two or more accounts and to shareholders we reasonably believe are from the same family or household. Householding begins once you have signed your account application. After such time, if you would like to discontinue householding for your accounts, please call toll-free at (800) 851-0511 to request individual copies of these documents. Once the Funds receive notice to stop householding, we will begin sending individual copies thirty days after receiving your request. This policy does not apply to account statements.
| | |
| |
| DIREXION ANNUAL REPORT | | 21 |
Investment Advisory and Subadvisory Agreements Approvals (Unaudited)
Provided below is a summary of certain of the factors the Board considered at its August 15, 2012 Board meeting in renewing, as applicable: (1) the Advisory Agreement between Rafferty Asset Management (“Rafferty”) and the Direxion Funds (the “Trust”), on behalf of the HCM Freedom Fund, a series of the Trust (“Fund”); and (2) the Subadvisory Agreement between Rafferty and Horizon Capital Management, Inc. (“Horizon”) on behalf of the Fund. The Board did not identify any particular information that was most relevant to its consideration to approve the Advisory or Subadvisory Agreement (each an “Agreement” and collectively, the “Agreements”) and each Trustee may have afforded different weight to the various factors. In determining whether to approve the continuance of the Agreements, the Board noted that the Trustees had considered various reports and information provided throughout the year at their regular Board meetings and otherwise, and that the Independent Board members had met separately on August 7, 2012, to consider these specific contract renewals.
The Board considered, among others, the following factors: (1) the nature and quality of the services provided; (2) the investment performance of the Fund; (3) the profitability of the advisory business to Rafferty or Horizon, if such information was provided; (4) the extent to which economies of scale have been taken into account in setting fee schedules; (5) whether fee levels reflect these economies of scale, if any, for the benefit of Fund shareholders; (6) comparisons of services and fees with contracts entered into by Rafferty and Horizon with other clients (such as pension funds and other institutional investors), if any; and (7) other benefits derived or anticipated to be derived and identified by Rafferty or Horizon from its relationship with the Fund.
Nature, Extent and Quality of Services Provided. The Board reviewed the nature, extent and quality of the services provided or to be provided under the Advisory Agreement by Rafferty. The Board noted that Rafferty has provided services to the Trust since its inception and has developed an expertise in managing the Fund. The Board also noted that Rafferty trades efficiently with low commission schedules, which helps improve performance results. The Board considered Rafferty’s representation that it has the financial resources and appropriate staffing to manage the Fund and meet its expense reimbursement obligations, if any. The Board also considered that Rafferty utilizes the services of an independent compliance consulting firm and that reports from the chief compliance officer are provided to the Board at its regularly scheduled quarterly Board meetings. The Board considered that Rafferty oversees all aspects of the operation of the Fund, including oversight of the Fund’s service providers and Horizon. Regarding the Subadvisory Agreement with Horizon, the Board noted that Horizon utilizes the Fund as the primary investment for its separate account clients. Based on these and other considerations, the Board determined that, in the exercise of its business judgment, the nature, extent and quality of the services provided by Rafferty and Horizon to the Fund under the Agreements were fair and reasonable.
Performance of the Funds. The Board evaluated the performance of the Fund relative to: (1) its benchmark index for year-to-date, one-year and since inception periods ended June 30, 2012; and (2) the average performance of the relevant Morningstar peer fund universe for monthly and annual periods ended June 30, 2012. The Board considered management’s description of the performance of the Morningstar universe of large growth funds. The Board also considered that as of June 30, 2012, the Fund outperformed the average of its relevant Morningstar peer funds for the year-to-date and three-year periods, but underperformed for the one-year and five-year periods. In this regard, the Board noted Horizon’s representation that the Fund’s underperformance was in part due to its investments in sectors that underperformed as compared to the sectors selected by its peer group funds.
Costs of Services Provided to the Funds and Profits Realized. The Board considered the overall fees paid to Rafferty on an annual basis since the Fund’s commencement of operations, including any fee waivers and recoupment of fees previously waived. The Board also considered the fees that Rafferty charges for the services that it provides to a pooled trading vehicle for domestic hedge funds. In addition, the Board considered the overall profitability of Rafferty’s investment business and its representation that it does not allocate internal costs and assess profitability with respect to its services to individual Funds. Based on these considerations, the Board determined that, in the exercise of its business judgment, the costs of the services provided and the profits realized under the Advisory Agreement were fair and reasonable.
In considering the fees paid by Rafferty to Horizon, the Board considered the representation that the current expense ratio of the Fund is lower compared to the total cost of investing when the Fund was part of the wrap account advisory programs. The Board also considered that Horizon did not provide comparable subadvisory services to any other client. The Board considered Horizon’s profits or losses for its services. In this regard, the Board in part noted Horizon’s pre-tax profits with respect to the services it provided to the Fund. Based on these considerations, the Board determined that, in
| | |
| | |
| 22 | | DIREXION ANNUAL REPORT |
the exercise of its business judgment, the costs of the services provided and the profits realized under the Agreements were fair and reasonable.
Economies of Scale. The Board considered Rafferty’s representation that it believes that asset levels at this time are not sufficient to achieve economies of scale or warrant a reduction in fee rates or the addition of breakpoints. Based on these and other considerations, the Board determined that, in the exercise of its business judgment, the reduction in fee rates or additions of breakpoints were not necessary at this time.
Other Benefits. The Board considered Rafferty’s representation that its relationship with the Fund may help to facilitate Rafferty’s ability to attract business to its non-mutual fund account. The Board also considered that Rafferty’s overall business with brokerage firms helps to lower commission rates and provide better execution for Fund portfolio transactions. In addition, the Board considered that Horizon represented that it realized no benefits other than its direct compensation. Based on these and other considerations, the Board determined that, in the exercise of its business judgment, the benefits were fair and reasonable.
Conclusion. Based on, but not limited to, the above considerations and determinations, the Board determined that the Agreements for the Fund were fair and reasonable in light of the services to be performed, fees, expenses and such other matters as the Board considered relevant in the exercise of its business judgment. On this basis, the Board unanimously voted in favor of the continuance of the Agreements.
| | |
| |
| DIREXION ANNUAL REPORT | | 23 |
Direxion Funds
TRUSTEES AND OFFICERS
The business affairs of the Funds are managed by or under the direction of the Board of Trustees. Information pertaining to the Trustees and Officers of the Funds is set below. The SAI includes additional information about the Funds’ Trustees and Officers and is available without charge, upon request by calling 1-800-851-0511.
| | | | | | | | | | |
|
|
Interested Trustees |
Name, Address and Age | | Position(s)
Held with
Fund | | Term of Office
and Length of
Time Served | | Principal Occupation(s) During Past Five Years | | # of Portfolios
in Direxion
Family of
Investment
Companies
Overseen by
Trustee(2) | | Other Trusteeships/
Directorships Held
by Trustee |
Lawrence C. Rafferty(1)
Age: 70 | | Chairman of the Board of Trustees | | Lifetime of Trust until removal or resignation; Since 1997 | | Chairman and Chief Executive Officer of Rafferty, 1997-present; Chief Executive Officer of Rafferty Companies, LLC, 1996-present; Chief Executive Officer of Rafferty Capital Markets, Inc., 1995-present. | | 23 | | Board of Trustees, Fairfield University; Board of Directors, St. Vincent’s Services; Executive Committee, Metropolitan Golf Association |
|
|
| Non-Interested Trustees |
Name, Address and Age | | Position(s)
Held with
Fund | | Term of Office
and Length of
Time Served | | Principal Occupation(s) During Past Five Years | | # of Portfolios
in Direxion
Family of
Investment
Companies
Overseen by
Trustee(2) | | Other Trusteeships/
Directorships Held
by Trustee |
Daniel J. Byrne
Age: 68 | | Trustee | | Lifetime of Trust until removal or resignation; Since 1997 | | President and Chief Executive Officer of Byrne Securities Florida Inc. (formerly, Byrne Securities Inc.), 1992-present. | | 141 | | None. |
|
Gerald E. Shanley III
Age: 68 | | Trustee | | Lifetime of Trust until removal or resignation; Since 1997 | | Retired, Since 2002; Business Consultant, 1985-present; Trustee of Trust Under Will of Charles S. Payson, 1987-present; C.P.A., 1979-present. | | 141 | | None. |
|
John Weisser
Age: 70 | | Trustee | | Lifetime of Trust until removal or resignation; Since 2007 | | Retired, Since 1995; Salomon Brothers, Inc, 1971-1995, most recently as Managing Director. | | 141 | | Director, MainStay VP Fund Series, The MainStay Funds, The MainStay Funds Trust; Director ICAP Funds, Inc; Director, Eclipse Funds, Inc., Eclipse Funds; (66 Funds Total) |
|
| (1) | | Mr. Rafferty is affiliated with Rafferty. Mr. Rafferty is the Chairman and Chief Executive Officer of Rafferty and owns a beneficial interest in Rafferty. |
| (2) | | The Direxion Family of Investment Companies consists of the Direxion Funds which currently offers for sale to the public 23 portfolios, the Direxion Insurance Trust which currently offers for sale 1 portfolio and the Direxion Shares ETF Trust which currently offers for sale to the public 47 of the 117 funds currently registered with the SEC. |
| | |
| | |
| 24 | | DIREXION ANNUAL REPORT |
Direxion Funds
TRUSTEES AND OFFICERS
Principal Officers of the Trust
The officers of the Trust conduct and supervise its daily business. Unless otherwise noted, an individual’s business address is 1301 Avenue of the Americas, 35th Floor, New York, New York 10019. As of the date of this report, the officers of the Trust, their ages, their business address and their principal occupations during the past five years are as follows:
| | | | | | | | | | |
Name, Address and Age | | Position(s)
Held with
Fund | | Term of Office
and Length of
Time Served | | Principal Occupation(s) During Past Five Years | | # of Portfolios
in the Direxion
Family of
Investment
Companies
Overseen by
Trustee(2) | | Other Trusteeships/
Directorships Held
by Trustee |
Daniel D. O’Neill(1)
Age: 44 | | President; | | One Year; Since 1999 | | Managing Director of Rafferty, 1999-present. | | 117 | | N/A |
| | Chief Operating Officer and Chief Investment Officer | | One Year; Since 2006 | | | | | | |
|
Christopher Lewis
Age: 42 | | Chief Compliance Officer(3) | | One Year; Since 2009 | | Director, Alaric Compliance Services, LLC, 2009 – present; Partner, Thacher Proffitt & Wood LLP, 2004-2008; Partner, Simmons & Simmons, 2002-2004. | | N/A | | N/A |
|
Patrick J. Rudnick
777 East Wisconsin Avenue
Milwaukee, WI 53202
Age: 39 | | Principal Financial Officer and Treasurer | | One Year; Since 2010 | | Vice President, U.S. Bancorp Fund Services, LLC, since 2006; formerly, Manager, PricewaterhouseCoopers LLP (1999-2006). | | N/A | | N/A |
|
Angela Brickl
Age: 36 | | Secretary(3) | | One Year; Since 2011 | | Vice President, Rafferty Asset Management, LLC, since October 2010; Summer Associate at Skadden, Arps, Slate, Meagher & Flom, LLP, May – August 2009; Summer Associate at Foley & Lardner, LLP, May – August 2008; Vice President, U.S. Bancorp Fund Services, LLC, November 2003 – August 2007. | | N/A | | N/A |
|
| (1) | | Mr. O’Neill serves as Chairman of the Board of Trustees of the Direxion Shares ETF Trust. |
| (2) | | The Direxion Family of Investment Companies consists of the Direxion Funds which currently offers for sale to the public 23 portfolios, the Direxion Insurance Trust which currently offers for sale 1 portfolio and the Direxion Shares ETF Trust which currently offers for sale to the public 47 of the 117 funds currently registered with the SEC. |
| (3) | | Effective September 1, 2012, Ms. Brickl replaced Mr. Lewis as Chief Compliance Officer. |
| | |
| |
| DIREXION ANNUAL REPORT | | 25 |
THIS PAGE INTENTIONALLY LEFT BLANK
PRIVACY NOTICE
At the Direxion Funds, we are committed to protecting your privacy. To open and service your Direxion accounts, we collect and maintain certain nonpublic personal information about you, such as your address, phone number, social security number, purchases, sales, account balances, bank account information and other personal financial information. We collect this information from the following sources:
| | • | | Account applications or other forms on which you provide information, |
| | • | | Mail, e-mail, the telephone and our website, and |
| | • | | Your transactions and account inquiries with us. |
We safeguard the personal information that you have entrusted to us in the following ways:
| | • | | As a general policy, only those employees who maintain your account and respond to your requests for additional services have access to your account information. |
| | • | | We maintain physical, electronic, and procedural safeguards to insure the security of your personal information and to prevent unauthorized access to your information. |
We do not disclose any nonpublic personal information about you or our former shareholders to anyone, except as permitted or required by law. In the course of conducting business and maintaining your account we may share shareholder information, as allowed by law, with our affiliated companies and with other service providers, including financial intermediaries, custodians, transfer agents and marketing consultants. Those companies are contractually bound to use that information only for the services for which we hired them. They are not permitted to use or share our shareholders’ nonpublic personal information for any other purpose. There also may be times when we provide information to federal, state or local authorities as required by law.
In the event that you hold fund shares of Direxion through a financial intermediary, including, but not limited to, a broker-dealer, bank, or trust company, the privacy policy of your financial intermediary would govern how your nonpublic personal information would be shared with nonaffiliated third parties.
For questions about our policy, please contact us at (800) 851-0511.
This page is not a part of the annual report.
ANNUAL REPORT AUGUST 31, 2012
Advisor
Rafferty Asset Management, LLC
1301 Avenue of the Americas (6th Ave.), 35th Floor
New York, NY 10019
Sub-Advisor
HCM Sub-Advisor
Horizon Capital Management, Inc.
106 Valerie Drive
Lafayette, LA 70508-6008
Administrator, Transfer Agent, Dividend Paying Agent & Shareholding Servicing Agent
U.S. Bancorp Fund Services, LLC
P.O. Box 1993
Milwaukee, WI 53201-1993
Custodian
U.S. Bank, N.A.
1555 RiverCenter Dr., Suite 302
Milwaukee, WI 53212
Independent Registered Public Accounting Firm
Ernst & Young LLP
5 Times Square
New York, NY 10036
Distributor
Rafferty Capital Markets, LLC
1010 Franklin Ave., 3rd Floor
Garden City, NY 11530
The Fund’s Proxy Voting Policies are available without charge by calling 1-800-851-0511, or by accessing the SEC’s website, at www.sec.gov.
The actual voting records relating to portfolio securities during the most recent period ended June 30 (starting with the year ended June 30, 2005) is available without charge by calling 1-800-851-0511 or by accessing the SEC’s website at www.sec.gov.
The Fund files complete schedules of portfolio holdings with the SEC on Form N-Q. The Form N-Q is available without charge, upon request, by calling 1-800-851-0511, or by accessing the SEC’s website, at www.sec.gov.
This report has been prepared for shareholders and may be distributed to others only if preceded or accompanied by a current prospectus.
Item 2. Code of Ethics.
The registrant has adopted a code of ethics that applies to the registrant’s principal executive officer and principal financial officer. The registrant has not made any amendments to its code of ethics during the period covered by this report. The registrant has not granted any waivers from any provisions of the code of ethics during the period covered by this report. A copy of the registrant’s Code of Ethics is filed herewith.
Item 3. Audit Committee Financial Expert.
The registrant’s board of trustees has determined that there is at least one audit committee financial expert serving on its audit committee. Gerald E. Shanley III is the “audit committee financial expert” and is considered to be “independent” as each term is defined in Item 3 of Form N-CSR.
Item 4. Principal Accountant Fees and Services.
The registrant has engaged its principal accountant to perform audit services, audit-related services, tax services and other services during the past fiscal year. “Audit services” refer to performing an audit of the registrant’s annual financial statements or services that are normally provided by the accountant in connection with statutory and regulatory filings or engagements for the fiscal year. “Audit-related services” refer to the assurance and related services by the principal accountant that are reasonably related to the performance of the audit. “Tax services” refer to professional services rendered by the principal accountant for tax compliance, tax advice, and tax planning, including assessment of FIN 48 for the Funds and additional tax research. There were no “Other services” provided by the principal accountant. The following table details the aggregate fees billed or expected to be billed for each of the last fiscal year for audit fees, audit-related fees, tax fees and other fees by the principal accountant. The table presents aggregate fees billed to the registrant and reflected in the financial statements of the report to shareholders.
| | | | | | | | |
| | | FYE 8/31/2012 | | | FYE 8/31/2011 | |
Audit Fees | | $ | 353,200 | | | $ | 414,200 | |
Audit-Related Fees | | | — | | | | — | |
Tax Fees | | $ | 100,000 | | | $ | 105,000 | |
All Other Fees | | | — | | | | — | |
The audit committee has adopted pre-approval policies and procedures that require the audit committee to pre-approve all audit and non-audit services of the registrant, including services provided to any entity affiliated with the registrant.
The percentages of fees billed by Ernst & Young LLP applicable to non-audit services pursuant to waiver of pre-approval requirement were as follows:
| | | | |
| | | FYE 8/31/2012 | | FYE 8/31/2011 |
Audit-Related Fees | | 0% | | 0% |
Tax Fees | | 0% | | 0% |
All Other Fees | | 0% | | 0% |
All of the principal accountant’s hours spent on auditing the registrant’s financial statements were attributed to work performed by full-time permanent employees of the principal accountant. (If more than 50 percent of the accountant’s hours were spent to audit the registrant’s financial statements for the fiscal year, state how many hours were attributed to work performed by persons other than the principal accountant’s full-time, permanent employees.)
The following table indicates the non-audit fees billed or expected to be billed by the registrant’s accountant for services to the registrant and to the registrant’s investment adviser (and any other controlling entity, etc.—not sub-adviser) for the last year. The audit committee of the board of trustees has considered whether the provision of non-audit services that were rendered to the registrant’s investment adviser is compatible with maintaining the principal accountant’s independence and has concluded that the provision of such non-audit services by the accountant has not compromised the accountant’s independence.
| | | | |
Non-Audit Related Fees | | FYE 8/31/2012 | | FYE 8/31/2011 |
Registrant | | None | | None |
Registrant’s Investment Adviser | | None | | None |
Item 5. Audit Committee of Listed Registrants.
Not applicable to registrants who are not listed issuers (as defined in Rule 10A-3 under the Securities Exchange Act of 1934).
Item 6. Schedule of Investments.
Schedule of Investments is included as part of the report to shareholders filed under Item 1 of this Form.
Item 7. Disclosure of Proxy Voting Policies and Procedures for Closed-End Management Investment Companies.
Not applicable to open-end investment companies.
Item 8. Portfolio Managers of Closed-End Management Investment Companies.
Not applicable to open-end investment companies.
Item 9. Purchases of Equity Securities by Closed-End Management Investment Company and Affiliated Purchasers.
Not applicable to open-end investment companies.
Item 10. Submission of Matters to a Vote of Security Holders.
There have been no material changes to the procedures by which shareholders may recommend nominees to the registrant’s board of directors/trustees.
Item 11. Controls and Procedures.
| (a) | The Registrant’s President and Principal Financial Officer have reviewed the Registrant’s disclosure controls and procedures (as defined in Rule 30a-3(c) under the Investment Company Act of 1940 (the “Act”)) as of a date within 90 days of the filing of this report, as required by Rule 30a-3(b) under the Act and Rules 13a-15(b) or 15d-15(b) under the Securities Exchange Act of 1934. Based on their review, such officers have concluded that the disclosure controls and procedures are effective in ensuring that information required to be disclosed in this report is appropriately recorded, processed, summarized and reported and made known to them by others within the Registrant and by the Registrant’s service provider. |
| (b) | There were no changes in the Registrant’s internal control over financial reporting (as defined in Rule 30a-3(d) under the Act) that occurred during the second fiscal quarter of the period covered by this report that has materially affected, or is reasonably likely to materially affect, the Registrant’s internal control over financial reporting. |
Item 12. Exhibits.
| (a) | (1) Any code of ethics or amendment thereto, that is subject of the disclosure required by Item 2, to the extent that the registrant intends to satisfy Item 2 requirements through filing an exhibit. Filed herewith. |
| | (2) | Certifications pursuant to Section 302 of the Sarbanes-Oxley Act of 2002. Filed herewith. |
| | (3) | Any written solicitation to purchase securities under Rule 23c-1 under the Act sent or given during the period covered by the report by or on behalf of the registrant to 10 or more persons. Not applicable to open-end investment companies. |
| (b) | Certification pursuant to Section 906 of the Sarbanes-Oxley Act of 2002. Furnished herewith. |
SIGNATURES
Pursuant to the requirements of the Securities Exchange Act of 1934 and the Investment Company Act of 1940, the registrant has duly caused this report to be signed on its behalf by the undersigned, thereunto duly authorized.
| | | | |
| (Registrant) | | Direxion Funds |
| | |
| | | | |
| |
By (Signature and Title)* | | /s/ Daniel D. O’Neill |
| | | | Daniel D. O’Neill, President |
Pursuant to the requirements of the Securities Exchange Act of 1934 and the Investment Company Act of 1940, this report has been signed below by the following persons on behalf of the registrant and in the capacities and on the dates indicated.
| | | | |
| |
By (Signature and Title)* | | /s/ Daniel D. O’Neill |
| | | | Daniel D. O’Neill, President |
| | | | |
| |
By (Signature and Title)* | | /s/ Patrick J. Rudnick |
| | | | Patrick J. Rudnick, Principal Financial Officer |
| * | Print the name and title of each signing officer under his or her signature. |