UNITED STATES
SECURITIES AND EXCHANGE COMMISSION
Washington, D.C. 20549
FORM N-CSR
CERTIFIED SHAREHOLDER REPORT OF REGISTERED
MANAGEMENT INVESTMENT COMPANIES
Investment Company Act file number 811-08243
(Exact name of registrant as specified in charter)
|
33 Whitehall Street, 10th Floor New York, NY 10004 |
(Address of principal executive offices zip code)
|
Daniel D. O’Neill 33 Whitehall Street, 10th floor New York, NY 10004 |
(Name and address of agent for service)
Registrant’s telephone number, including area code 646-572-3390
Date of fiscal year end: April 30, 2012
Date of reporting period: April 30, 2012
Item 1. Report to Stockholders.

ANNUAL REPORT APRIL 30, 2012
1301 Avenue of the Americas (6th Ave.), 35th Floor New York, New York 10019
(800) 851-0511 www.direxionfunds.com
| | |
| BULL FUNDS | | BEAR FUNDS |
|
| DOMESTIC EQUITY INDEX FUNDS |
Direxion Monthly NASDAQ-100® Bull 2X Fund (DXQLX) Direxion Monthly S&P 500® Bull 2X Fund (DXSLX) | | Direxion Monthly S&P 500® Bear 2X Fund (DXSSX) |
|
| INTERNATIONAL FUNDS |
| Direxion Monthly Latin America Bull 2X Fund (DXZLX) | | |
Table of Contents

Help Preserve the Environment – Go Green!
Go paperless with Direxion e-Delivery – a service allowing shareholders to reduce clutter with full online access to regulatory documents. Begin the preservation process with e-delivery.
With Direxion e-Delivery, you can:
| | • | | Receive email notifications when your most recent shareholder communications are available for review. |
| | • | | Access prospectuses, annual reports and semiannual reports online. |
It’s easy to enroll:
| 1. | | Visit www.direxionfunds.com/edelivery |
| 2. | | Follow the simple enrollment instructions |
If you have questions about Direxion e-Delivery services, contact one of our shareholder representatives at 800-851-0511.

LETTERTO SHAREHOLDERS
Dear Shareholders,
This Annual Report for the Direxion Funds (the “Funds”) covers the period from May 1, 2011 to April 30, 2012 (the “Annual Period”).
Fund Operational Review:
The Funds are leveraged and seek to provide a calendar month return of 200% or -200% of the calendar month performance of a particular benchmark. The term “calendar month” refers to the period from the close of the markets on the last business day of a given calendar month, until the close of the markets on the last business day of the subsequent calendar month. The Funds seek calendar month leveraged investment results which should not be equated with seeking a leveraged goal for shorter than a calendar month. An investor who purchases shares on a day other than the last business day of a calendar month will generally receive more, or less, than 200% exposure to the target index, depending on the performance of the target index. If a Fund’s shares are held through the end of a calendar month or months, the Fund’s performance is likely to deviate from the multiple of the benchmark performance for the longer period. Similarly, the return for investors investing for periods less than a calendar month, or for a period different than the calendar month, will likely deviate from the multiple of the benchmark performance for such shorter period. The Funds are not suitable for all investors and should be utilized only by sophisticated investors who understand leverage risk, consequences of seeking calendar month leverage investment results and intend to actively monitor and manage their investments.
The Funds with the word “Bull” in their name attempt to provide investment results that correlate to 200% of the return of an index or benchmark, meaning the Bull Funds attempt to move in the same direction as the target index or benchmark. The Fund with the word “Bear” in its name attempts to provide investment results that correlate to -200% of the return of an index or benchmark, meaning that the Bear Fund attempts to move in the opposite or inverse direction of the target index or benchmark.
In seeking to achieve each Fund’s calendar month investment objective, Rafferty Asset Management (“Rafferty” or the “Adviser”) uses statistical and quantitative analysis to determine the investments each Fund makes and the techniques it employs. Rafferty relies upon a pre-determined model to generate orders resulting in repositioning each Fund’s investments in accordance with its calendar month investment objective. Using this approach, Rafferty determines the type, quantity and mix of investment positions it believes in combination should produce calendar month returns consistent with a Fund’s objective. As a consequence, if a Fund is performing as designed, the return of the index or benchmark will dictate the return for that Fund. Each Fund pursues its investment objective regardless of market conditions and does not take defensive positions.
Each Fund has a clearly articulated goal which requires the Fund to seek economic exposure in excess of its net assets. To meet its objectives, each Fund invests in some combination of financial instruments so it generates economic exposure consistent with the Fund’s investment objective. These financial instruments include derivatives. Each Fund invests significantly in derivatives, including swap agreements. Rafferty uses these types of investments to produce economically “leveraged” investment results. Leveraging allows Rafferty to generate a greater positive or negative return than what would be generated on the invested capital without leverage, thus changing small market movements into larger changes in the value of the investments of a Fund.
The Funds may use certain investment techniques, including investments in derivatives, which may be considered aggressive. Investments in derivatives in general are subject to market risks that may cause their prices to fluctuate over time. Additionally, such instruments may experience potentially dramatic price changes (losses) and imperfect correlations between the price of the contract and the underlying security or index which will increase the volatility of the Funds and may involve a small investment of cash relative to the magnitude of the risk assumed. The use of derivatives may expose the Funds to additional risks that they would not be subject to if they invested directly in the securities underlying those derivatives. The use of derivatives may result in larger losses or smaller gains than otherwise would be the case.
Because each Fund seeks calendar month investment results of its relevant benchmark, a comparison of the return of the Fund to the relevant benchmark tells you little about whether a Fund has met its investment objective. To determine if the Funds have met their calendar month investment goals, Direxion maintains models indicating the expected performance of each Fund in light of the path of the relevant benchmark. The models, and a description of how they work, are available on the Direxion website (www.direxionfunds.com) under Tools/Tracking Center. The models do not take into account the size of a Fund, the Fund’s expense ratio or any transaction fees associated with creating a Fund’s portfolio. A brief comparison of the actual returns versus the expected returns for each of the Funds in this Annual Report follows.
Fund Performance Review:
The discussion below relates to the performance of the Funds for the Annual Period.
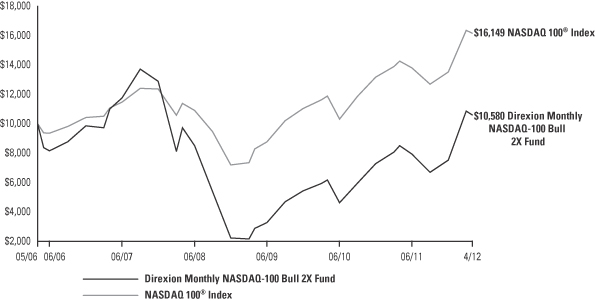
The Direxion Monthly NASDAQ-100 Bull 2X Fund sought to provide 200% of the calendar month return of the NASDAQ-100 Index. The NASDAQ-100 Index is a capitalization-weighted index composed of 100 of the largest non-financial domestic and international companies listed on the National Market tier of the NASDAQ National Market. All companies listed on the index have an average daily trading volume of at least 200,000 shares. For the Annual Period, the NASDAQ-100 Index returned 13.29%. Given the calendar month investment objectives of the Fund and the path dependency of returns for longer periods, the annual return of the index alone should not generate expectations of annual performance of the Fund. The Direxion Monthly NASDAQ-100 Bull 2X Fund returned 24.60%, while the model indicated and expected return of 27.47%.
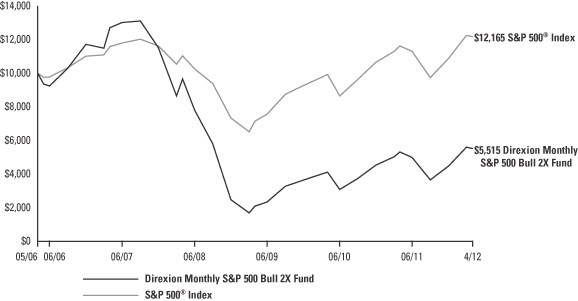
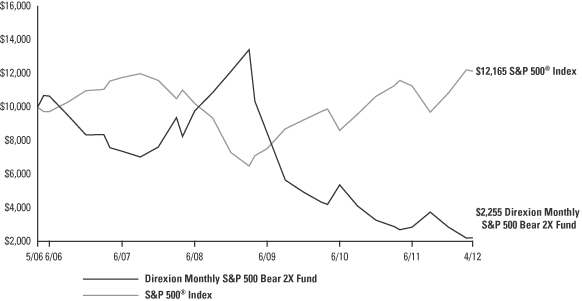
The Direxion Monthly S&P 500 Bull 2X Fund and the Direxion Monthly S&P 500 Bear 2X Fund sought to provide 200% and -200% of the calendar month return of the S&P 500 Index, respectively. The S&P 500 Index is a capitalization-weighted index composed of 500 common stocks. Standard & Poor’s selects the 500 stocks comprising the S&P 500 Index on the basis of market values and industry diversification. For the Annual Period, the S&P 500 Index returned 4.76%. Given the calendar month investment objectives of the Funds and the path dependency of returns for longer periods, the annual return of the Index alone should not generate expectations of annual performance of the Funds. The Direxion Monthly S&P 500 Bull 2X Fund returned 3.94%, while the model indicated an expected return of 7.10%. The Direxion Monthly S&P 500 Bear 2X Fund returned -17.47%, while the model indicated an expected return of -15.90%.
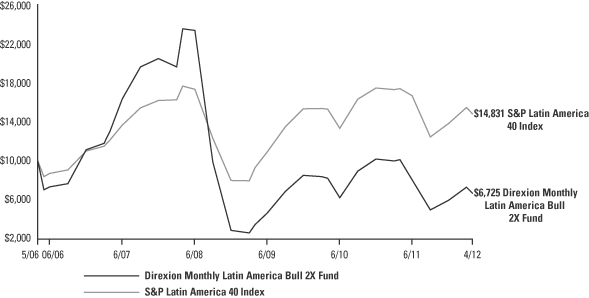
The Direxion Monthly Latin America Bull 2X Fund sought to provide 200% of the calendar month return of the S&P Latin America 40 Index. The S&P Latin America 40 Index includes highly liquid securities from major economic sectors of the Mexican and South American equity markets. Companies from Mexico, Brazil, Argentina and Chile are represented in this index. Representing approximately 70% of each country’s market capitalization, this index provides coverage of the large cap, liquid constituents of each key country in Latin America. For the Annual Period, the S&P Latin America 40 Index returned -14.82%. Given the calendar month investment objectives of the Fund and the path dependency of returns for longer periods, the annual return of the Index alone should not generate expectations of annual performance of the Fund. The Direxion Monthly Latin America Bull 2X Fund returned -33.61%, while the model indicated an expected return of -29.45%.
As always, we thank you for using the Direxion Funds and we look forward to our mutual success.
Regards,
| | |
 | |  |
Daniel O’Neill Chief Investment Officer | | Patrick Rudnick Principal Financial Officer |
The performance data quoted represents past performance; past performance does not guarantee future results. The investment return and principal value of an investment will fluctuate and an investor’s shares, when redeemed, may be worth more or less than their original cost. Current performance may be higher or lower than the performance data quoted. To obtain performance data current to the most recent month-end, please call, toll-free, 1-800-851-0511 or visit www.direxionfunds.com. The prospectus should be read carefully before investing.
There is no guarantee the Funds will achieve their objective. Investing in funds that track an index may be more volatile than investing in broadly diversified funds. The use of leverage by a Fund means the Funds are riskier than alternatives which do not use leverage.
The views in this report were those of the Adviser as of April 30, 2012 and may not reflect their views on the date this report is first published or anytime thereafter. These views are intended to assist shareholders of the Fund in understanding their investments in the Fund and do not constitute investment advice.
The total annual fund operating expense of the Direxion Monthly NASDAQ-100 Bull 2X Fund , Direxion Monthly S&P 500 Bull 2X Fund, Direxion Monthly S&P 500 Bear 2X Fund and Direxion Monthly Latin America Bull 2X Fund is 1.93%, 1.93%, 1.92% and 1.91% respectively, net of any fee, waivers or expense reimbursements.1
An investment in any of the Direxion Funds is subject to a number of risks that could affect the value of its shares. It is important that investors closely review and understand these risks before making an investment. An investor should consider the investment objectives, risks, charges and expenses of the Direxion Funds carefully before investing. The prospectus contains this and other information about the Direxion Funds.
Distributed by: Rafferty Capital Markets, LLC
Date of First Use: June 21, 2012
| 1 | The total annual fund operating expense ratios include Acquired Fund Fees and Expenses, indirect fees and expenses the Funds incur that are required to be disclosed. Without Acquired Fund Fees and Expenses, total annual operating expense ratio would be 1.90% for each of the Funds. |
MANAGEMENT DISCUSSION & ANALYSIS
Rafferty Asset Management, LLC (“Rafferty” or “Adviser”), the investment adviser to the Direxion Funds (the “Funds”), uses a number of investment techniques in order to achieve the stated goal for each Fund. The Bull Funds magnify the returns of their respective indexes for a calendar month period, and the Bear Fund inversely magnifies the returns of their respective indexes for a calendar month period. Rafferty primarily uses statistical and quantitative analysis to determine the investments each Fund makes and the techniques it employs.
No Fund attempts, or should be expected to, provide returns which are a multiple of the return of the benchmark for periods other than a calendar month. A “calendar month” refers to the period from the close of markets on the last business day of a given month until the close of the markets on the last business day of the subsequent month.
Factors Affecting Fund Performance:
| | • | | Benchmark Performance: The calendar month performance of each Fund’s benchmark index, and the factors and market conditions implicitly affecting that index, are the primary factors driving Fund performance. Given the calendar month goals, the series of calendar month index returns are most important. The market conditions that affected the benchmark indexes during the past year are described below. |
| | • | | Leverage: Each Fund seeks calendar month investment results (before fees and expenses) of either 200% (for the Bull Funds) or -200% (for the Bear Fund) of the performance of its respective underlying index. The use of leverage magnifies a Fund’s gains or losses and increases the investment’s risk and volatility. |
| | • | | Volatility and Compounding: The goal of leveraged funds is to provide a multiple of the calendar month returns of an underlying index. Over periods longer or shorter than a calendar month, a Fund should not be expected to provide its respective multiple of the return of the underlying index. Due to the effects of compounding, a universal mathematical concept that applies to all investments, returns of the Funds over longer periods will differ from the Fund’s calendar month stated goal. Periods of high volatility lacking a clear trend hurt a Fund’s performance; while trending, low volatility markets enhance a Fund’s performance. |
| | • | | Cost of Financing: In order to attain leveraged exposure, a Bull Fund incurs a cost of LIBOR1 plus a spread, and a Bear Fund receives LIBOR minus a spread as applied to the borrowed portion of the Fund’s exposure. Financing costs create a drag on a Bull Fund’s performance. Because LIBOR is very low, a Bear Fund receives a negligible amount of financing, or in the case of hard-to-borrow shares, might pay to finance its short position. |
| | • | | Equity Dividend: A Bull Fund’s performance is positively impacted by equity and index dividends, as the Funds receive those payments. A Bear Fund’s performance is negatively impacted, as they are obligated to pay the dividends. |
| | • | | Fees, Expenses, and Transaction Costs: Fees and expenses are listed in each Fund’s prospectus and may be larger than many traditional index funds’ fees which cause a greater negative impact on Fund performance. Transactions costs are not included in the expense ratio of the Funds. Transaction costs can be higher due to the Fund’s use of leverage, significant purchase and redemption activity by Fund shareholders, or trading securities that are comparatively less liquid. |
Market Conditions Affecting Fund Performance:
A general review of economic conditions, market events and index performance for the period is described below.
Economy:
With the Euro crisis continuing to weigh heavily on investors’ minds, the stability of the global economy has been wavering for some time. The U.S. Dollar has bounced in and out of favor throughout the year, often dependent upon major headlines across both Europe and Asia. Investors appear to be struggling with a flight to safety as Euro bailouts and austerity measures appear to do little aside from placating in the short-term. The Bond Buyback Program (or “Operation Twist”) mentioned in Direxion’s last report is due to expire in June; and with Federal Reserve Bank of Atlanta CEO Dennis Lockhart leaning heavily on further monetary actions being necessary, an extension is very likely. The Federal Reserve has maintained that interest rates will remain low, and their target rate of inflation remains at 2%. It has also insinuated in recent discussions it is “ready to act”, and that additional measures may be necessary to maintain current levels, but have thus far been unwilling to outline a distinct plan.
| 1 | London Inter-Bank Offer Rate: The interest rate that the banks charge each other for loans (usually in Eurodollars). This rate is applicable to the short-term international interbank market, and applies to very large loans borrowed for anywhere from one day to five years. |
The continued uncertainty in Europe has driven Spot Gold in U.S. Dollar-terms to new highs, breaking through previous records ($1,900.20 per ounce in September 2011). Although U.S. Banks remain heavily exposed to the European crisis, the CBOE Market Volatility Index (“VIX Index”) has dropped 50.68%. Commodities have been mixed, with inventory reports and weather and draught warnings both bolstering and plaguing various crops across the board. The upcoming Greek election will continue to weigh heavily on the European Union and global economy as a whole. Greece’s ability to elect a government may provide them some much needed leeway from the European Union.
Index Performance:
Over the fiscal year, Rafferty managed Funds of two different categories of indexes – broad market and international.
With the continued trend of reduced volatility seen through April 2012 supporting the market, investors appear to have regained some faith in the stock market. The returns from the S&P 500 and NASDAQ-100 Indexes are supportive of stronger investor sentiment. There are three Funds tracking broad market indexes; the index returns for the period are below. Due to upward trends seen in these indexes for the given time period, the effects of compounding associated with products seeking leveraged and inverse calendar month returns were somewhat mitigated.
Equity markets showed a strong rally through the first quarter and April 2012, as the U.S. continues to show resiliency against slowing growth throughout the world, and especially against the lack of a definitive solution for the debt crisis in Europe. Despite improving jobs figures, unemployment across global economies remains above acceptable levels. The S&P 500 Index boasted its strongest first quarter since 1998 and gave little back in April; however, these gains are representative of the recovery from bear market territory rather than reaching newer highs. This growing faith is indicative of a shifting trend out of fixed income and money market investments, back into equities. The returns for the S&P 500 and NASDAQ-100 Indexes for the fiscal year ended April 30, 2012 were:
S&P 500 Index: 4.76%
NASDAQ-100 Index: 13.29%
One of the Funds tracks an international index: the S&P Latin America 40 Index. The economies in Latin America began to slow near the end of 2011, and continued through the beginning of 2012. For Brazil, Argentina and Mexico, the slowdown in exports and production has come to light. Further, the rampant news of blunted growth in China is especially relevant for these Latin American economies, as investors have learned how closely tied Latin American economies are to China’s well-being. However, despite these factors, the Latin American economies appear to be headed towards overall recovery, and continue to avoid signs of recession. The unemployment rate has remained low and real wages are on an uptrend. Middle- and upper-income classes continue to grow, and the establishment of a more robust automobile market in Latin American countries should support further growth. The return of the S&P Latin America 40 Index for the fiscal year ended April 30, 2012 was:
S&P Latin America 40 Index: -14.82%
Index Volatility:
The VIX Index represents a measure of the market’s expectation of stock market volatility over the next 30 day period. A higher level measured by the VIX Index represents a higher expected change in the S&P 500 Index. For the fiscal year ended April 30, 2012, the VIX Index rose 16.27%. The VIX Index opened the fiscal year at a level of 14.75 and then spent much of August through October above the 35 level. The VIX Index closed at 17.15 on April 30, 2012, marking a steady decline from the start of November 2011 Overall, higher levels of volatility have a negative impact on a fund’s performance, as described in the introduction above. Please find the annualized volatilities of each index used as a benchmark for the Funds below:
| | | | | | | | |
Benchmark | | One-Year
Return1 | | | Annualized
Volatility1 | |
NASDAQ-100 Index | | | 13.29 | % | | | 23.68 | % |
S&P 500 Index | | | 4.76 | % | | | 23.31 | % |
S&P Latin America 40 Index | | | -14.82 | % | | | 29.21 | % |
| 1 | The above figures are for the period 05/1/2011 through 4/30/2012 |
Rafferty does not invest the assets of the Funds based on its view of the investment merit of a particular security, instrument or company. In addition, each Fund pursues its investment objective regardless of market conditions and does not take defensive positions.
The views of this report were those of the Adviser as of April 30, 2012 and may not reflect their views on the date this report is first published or anytime thereafter. These views are intended to assist shareholders of the Fund in understanding their investments in the Fund and do not constitute investment advice.
Direxion Monthly NASDAQ-100 Bull 2X Fund
May 1, 20061 - April 30, 2012 (Unaudited)
| | | | | | | | | | | | | | | | |
| | | Average Annual Total Return2 | |
| | | 1 Year | | | 3 Year | | | 5 Year | | | Since
Inception | |
Direxion Monthly NASDAQ-100 Bull 2X Fund | | | 24.60 | % | | | 54.49 | % | | | (0.80 | )% | | | 0.94 | % |
| | | | |
NASDAQ-100® Index | | | 13.29 | % | | | 25.01 | % | | | 7.84 | % | | | 8.32 | % |
The Fund seeks calendar month leveraged investment results which should not be equated with seeking a leveraged goal for shorter than a calendar month. An investor who purchases shares on a day other than the last business day of a calendar month will generally receive more, or less, than 200% exposure to the target index, depending on the performance of the target index.
This chart illustrates the performance of a hypothetical $10,000 investment made on the Fund’s inception, and is not intended to imply any future performance. The returns shown do not reflect the deduction of taxes that a shareholder would pay on fund distributions of the redemption of fund shares. The performance of the NASDAQ-100® Index does not reflect the deduction of fees associated with a mutual fund, such as investment management fees. Investors cannot invest directly in an index, although they can invest in its underlying securities.
The performance data shown represents past performance and does not guarantee future results.
Market Exposure
| | | | |
Investment Type | | %
Net Assets | |
Swap Contracts | | | 199.9% | |
| | | | |
Total Exposure | | | 199.9% | |
| | | | |
“Market Exposure” includes the value of total investments (including the contract value of any derivatives) and excludes any short-term investments and cash equivalents divided by Net Assets.
| 1 | Commencement of operations. |
Direxion Monthly S&P 500 Bull 2X Fund
May 1, 20061 - April 30, 2012 (Unaudited)
| | | | | | | | | | | | | | | | |
| | | Average Annual Total Return2 | |
| | | 1 Year | | | 3 Year | | | 5 Year | | | Since
Inception | |
Direxion Monthly S&P 500 Bull 2X Fund | | | 3.94 | % | | | 38.50 | % | | | (15.36 | )% | | | (9.45 | )% |
| | | | |
S&P 500® Index | | | 4.76 | % | | | 19.46 | % | | | 1.01 | % | | | 3.32 | % |
The Fund seeks calendar month leveraged investment results which should not be equated with seeking a leveraged goal for shorter than a calendar month. An investor who purchases shares on a day other than the last business day of a calendar month will generally receive more, or less, than 200% exposure to the target index, depending on the performance of the target index.
This chart illustrates the performance of a hypothetical $10,000 investment made on the Fund’s inception, and is not intended to imply any future performance. The returns shown do not reflect the deduction of taxes that a shareholder would pay on fund distributions of the redemption of fund shares. The performance of the S&P 500® Index does not reflect the deduction of fees associated with a mutual fund, such as investment management fees. Investors cannot invest directly in an index, although they can invest in its underlying securities.
The performance data shown represents past performance and does not guarantee future results.
Market Exposure
| | | | |
Investment Type | | %
Net Assets | |
Swap Contracts | | | 200.2% | |
| | | | |
Total Exposure | | | 200.2% | |
| | | | |
“Market Exposure” includes the value of total investments (including the contract value of any derivatives) and excludes any short-term investments and cash equivalents divided by Net Assets.
| 1 | Commencement of operations. |
Direxion Monthly S&P 500 Bear 2X Fund
May 1, 20061 - April 30, 2012 (Unaudited)
| | | | | | | | | | | | | | | | |
| | | Average Annual Total Return2 | |
| | | 1 Year | | | 3 Year | | | 5 Year | | | Since
Inception | |
Direxion Monthly S&P 500 Bear 2X Fund | | | (17.47 | )% | | | (39.85 | )% | | | (21.59 | )% | | | (21.99 | )% |
| | | | |
S&P 500® Index | | | 4.76 | % | | | 19.46 | % | | | 1.01 | % | | | 3.32 | % |
The Fund seeks calendar month leveraged investment results which should not be equated with seeking a leveraged goal for shorter than a calendar month. An investor who purchases shares on a day other than the last business day of a calendar month will generally receive more, or less, than 200% exposure to the target index, depending on the performance of the target index.
This chart illustrates the performance of a hypothetical $10,000 investment made on the Fund’s inception, and is not intended to imply any future performance. The returns shown do not reflect the deduction of taxes that a shareholder would pay on fund distributions of the redemption of fund shares. The performance of the S&P 500® Index does not reflect the deduction of fees associated with a mutual fund, such as investment management fees. Investors cannot invest directly in an index, although they can invest in its underlying securities.
The performance data shown represents past performance and does not guarantee future results.
Market Exposure
| | | | |
Investment Type | | %
Net Assets | |
Swap Contracts | | | (200.2)% | |
| | | | |
Total Exposure | | | (200.2)% | |
| | | | |
“Market Exposure” includes the value of total investments (including the contract value of any derivatives) and excludes any short-term investments and cash equivalents divided by Net Assets.
| 1 | Commencement of operations. |
Direxion Monthly Latin America Bull 2X Fund
May 2, 20061 - April 30, 2012 (Unaudited)
| | | | | | | | | | | | | | | | |
| | | Average Annual Total Return2 | |
| | | 1 Year | | | 3 Year | | | 5 Year | | | Since
Inception | |
Direxion Monthly Latin America Bull 2X Fund | | | (33.61 | )% | | | 24.26 | % | | | (12.46 | )% | | | (6.40 | )% |
| | | | |
S&P Latin America 40 Index | | | (14.82 | )% | | | 16.68 | % | | | 4.06 | % | | | 6.79 | % |
The Fund seeks calendar month leveraged investment results which should not be equated with seeking a leveraged goal for shorter than a calendar month. An investor who purchases shares on a day other than the last business day of a calendar month will generally receive more, or less, than 200% exposure to the target index, depending on the performance of the target index.
This chart illustrates the performance of a hypothetical $10,000 investment made on the Fund’s inception, and is not intended to imply any future performance. The returns shown do not reflect the deduction of taxes that a shareholder would pay on fund distributions of the redemption of fund shares. The performance of the S&P Latin America 40 Index does not reflect the deduction of fees associated with a mutual fund, such as investment management fees. Investors cannot invest directly in an index, although they can invest in its underlying securities.
The performance data shown represents past performance and does not guarantee future results.
Market Exposure
| | | | |
Investment Type | | %
Net Assets | |
Swap Contracts | | | 199.8% | |
| | | | |
Total Exposure | | | 199.8% | |
| | | | |
“Market Exposure” includes the value of total investments (including the contract value of any derivatives) and excludes any short-term investments and cash equivalents divided by Net Assets.
| 1 | Commencement of operations. |
Expense Example
April 30, 2012 (Unaudited)
As a shareholder of a mutual fund, you incur two types of costs: (1) transaction costs, including sales charges (loads) on purchase payments, reinvested dividends, or other distributions; redemption fees; and exchange fees; and (2) ongoing costs, including management fees; distribution and/or service fees; and other fund expenses. This example is intended to help you understand your ongoing costs (in dollars) of investing in a fund and to compare costs with the ongoing costs of investing in other mutual funds.
The example is based on an investment of $1,000 invested at the beginning of the period and held the entire period (November 1, 2011 — April 30, 2012).
Actual Expenses
The first line of the table below provides information about actual account values and actual expenses. You may use the information in this line, together with the amount you invested, to estimate the expenses that you paid over the period. Simply divide your account value by $1,000 (for example, an $8,600 account value divided by $1,000 = 8.6), then multiply the result by the number in the first line under the heading entitled “Expenses Paid During Period” to estimate the expenses you paid on your account during this period.
Hypothetical Example for Comparison Purposes
The second line of the table below provides information about hypothetical account values and hypothetical expenses based on the Funds’ actual expense ratios and an assumed rate of return of 5% per year before expenses, which is not the Funds’ actual return. The hypothetical account values and expenses may not be used to estimate the actual ending account balance or expenses you paid for the period. You may use this information to compare the ongoing costs of investing in the Funds and other funds. To do so, compare this 5% hypothetical example with the 5% hypothetical examples that appear in the shareholder reports of the other funds.
Please note that the expenses shown in the table are meant to highlight your ongoing costs only and do not reflect any transactional costs, such as wire transfers, returned checks or stop payment orders. Therefore, the second line of the table is useful in comparing ongoing costs only, and will not help you determine the relative costs of owning different funds. In addition, if these transactional costs were included, your costs would have been higher.
| | |
| | |
| 10 | | DIREXION ANNUAL REPORT |
Expense Example Tables
April 30, 2012 (Unaudited)
| | | | | | | | | | | | | | | | |
| | | Expense
Ratio1 | | | Beginning
Account Value
November 1, 2011 | | | Ending
Account Value
April 30, 2012 | | | Expenses
Paid During
Period2 | |
Direxion Monthly NASDAQ-100 Bull 2X Fund | | | | | | | | | | | | | | | | |
Based on actual fund return | | | 1.90 | % | | $ | 1,000.00 | | | $ | 1,314.10 | | | $ | 10.93 | |
Based on hypothetical 5% return | | | 1.90 | % | | | 1,000.00 | | | | 1,015.41 | | | | 9.52 | |
Direxion Monthly S&P 500 Bull 2X Fund | | | | | | | | | | | | | | | | |
Based on actual fund return | | | 2.36 | % | | | 1,000.00 | | | | 1,246.80 | | | | 13.18 | |
Based on hypothetical 5% return | | | 2.36 | % | | | 1,000.00 | | | | 1,013.13 | | | | 11.81 | |
Direxion Monthly S&P 500 Bear 2X Fund | | | | | | | | | | | | | | | | |
Based on actual fund return | | | 1.90 | % | | | 1,000.00 | | | | 767.20 | | | | 8.35 | |
Based on hypothetical 5% return | | | 1.90 | % | | | 1,000.00 | | | | 1,015.41 | | | | 9.52 | |
Direxion Monthly Latin America Bull 2X Fund | | | | | | | | | | | | | | | | |
Based on actual fund return | | | 1.90 | % | | | 1,000.00 | | | | 1,007.20 | | | | 9.48 | |
Based on hypothetical 5% return | | | 1.90 | % | | | 1,000.00 | | | | 1,015.41 | | | | 9.52 | |
| 2 | Expenses are equal to the Fund’s annualized expense ratio, multiplied by the average account value over the period, multiplied by the number of days in the most recent fiscal half-year/period, then divided by 366. |
Allocation of Portfolio Holdings
April 30, 2012 (Unaudited)
| | | | | | | | | | | | |
| | | Cash* | | | Swaps | | | Total | |
Direxion Monthly NASDAQ-100 Bull 2X Fund | | | 101 | % | | | (1 | %) | | | 100 | % |
Direxion Monthly S&P 500 Bull 2X Fund | | | 98 | % | | | 2 | % | | | 100 | % |
Direxion Monthly S&P 500 Bear 2X Fund | | | 101 | % | | | (1 | %) | | | 100 | % |
Direxion Monthly Latin America Bull 2X Fund | | | 116 | % | | | (16 | %) | | | 100 | % |
| * | Cash, cash equivalents and other assets less liabilities. |
| | |
| |
| DIREXION ANNUAL REPORT | | 11 |
Direxion Monthly NASDAQ-100 Bull 2X Fund
Schedule of Investments
April 30, 2012
No reportable investments.
| | | | | | |
| | | | | Value | |
| | TOTAL INVESTMENTS
(Cost $0) - 0.0% | | $ | — | |
| | Other Assets in Excess of
Liabilities - 100.0%(a) | | | 29,241,104 | |
| | | | | | |
| | TOTAL NET ASSETS - 100.0% | | $ | 29,241,104 | |
| | | | | | |
Percentages are stated as a percent of net assets.
| (a) | $5,900,000 of cash is pledged as collateral for swap contracts. |
Direxion Monthly NASDAQ-100 Bull 2X Fund
Long Equity Swap Contracts
April 30, 2012
| | | | | | | | | | | | | | | | | | | | | | |
Counterparty | | Reference Index | | Number of
Contracts | | | Notional
Amount | | | Interest Rate
Paid | | | Termination
Date | | | Unrealized
Depreciation | |
Credit Suisse Capital, LLC | | NASDAQ-100 Index | | | 21,452 | | | $ | 58,730,133 | | | | (0.19 | %) | | | 2/11/2013 | | | $ | (283,268 | ) |
| | | | | | | | | | | | | | | | | | | | | | |
The accompanying notes are an integral part of these financial statements.
| | |
| | |
| 12 | | DIREXION ANNUAL REPORT |
Direxion Monthly S&P 500 Bull 2X Fund
Schedule of Investments
April 30, 2012
No reportable investments.
| | | | | | |
| | | | | Value | |
| | TOTAL INVESTMENTS
(Cost $0) - 0.0% | | $ | — | |
| | Other Assets in Excess of
Liabilities - 100.0%(a) | | | 19,710,325 | |
| | | | | | |
| | TOTAL NET ASSETS - 100.0% | | $ | 19,710,325 | |
| | | | | | |
Percentages are stated as a percent of net assets.
| (a) | $3,520,000 of cash is pledged as collateral for swap contracts. |
Direxion Monthly S&P 500 Bull 2X Fund
Long Equity Swap Contracts
April 30, 2012
| | | | | | | | | | | | | | | | | | | | | | |
Counterparty | | Reference Index | | Number of
Contracts | | | Notional
Amount | | | Interest Rate
Paid | | | Termination
Date | | | Unrealized
Appreciation | |
Credit Suisse Capital, LLC | | S&P 500 Index | | | 28,200 | | | $ | 38,988,681 | | | | (0.24 | %) | | | 2/11/2013 | | | $ | 462,289 | |
| | | | | | | | | | | | | | | | | | | | | | |
The accompanying notes are an integral part of these financial statements.
| | |
| |
| DIREXION ANNUAL REPORT | | 13 |
Direxion Monthly S&P 500 Bear 2X Fund
Schedule of Investments
April 30, 2012
No reportable investments.
| | | | | | |
| | | | | Value | |
| | TOTAL INVESTMENTS
(Cost $0) - 0.0% | | $ | — | |
| | Other Assets in Excess of
Liabilities - 100.0%(a) | | | 13,315,649 | |
| | | | | | |
| | TOTAL NET ASSETS - 100.0% | | $ | 13,315,649 | |
| | | | | | |
Percentages are stated as a percent of net assets.
| (a) | $2,950,000 of cash is pledged as collateral for swap contracts. |
Direxion Monthly S&P 500 Bear 2X Fund
Short Equity Swap Contracts
April 30, 2012
| | | | | | | | | | | | | | | | | | | | | | |
Counterparty | | Reference Index | | Number of
Contracts | | | Notional
Amount | | | Interest Rate
Received | | | Termination
Date | | | Unrealized
Depreciation | |
Credit Suisse Capital, LLC | | S&P 500 Index | | | 19,052 | | | $ | 26,583,937 | | | | 0.09 | % | | | 12/21/2012 | | | $ | (72,984 | ) |
| | | | | | | | | | | | | | | | | | | | | | |
The accompanying notes are an integral part of these financial statements.
| | |
| | |
| 14 | | DIREXION ANNUAL REPORT |
Direxion Monthly Latin America Bull 2X Fund
Schedule of Investments
April 30, 2012
No reportable investments.
| | | | | | |
| | | | | Value | |
| | TOTAL INVESTMENTS
(Cost $0) - 0.0% | | $ | — | |
| | Other Assets in Excess of
Liabilities - 100.0%(a) | | | 34,339,946 | |
| | | | | | |
| | TOTAL NET ASSETS - 100.0% | | $ | 34,339,946 | |
| | | | | | |
Percentages are stated as a percent of net assets.
| (a) | $19,270,000 of cash is pledged as collateral for swap contracts. |
Direxion Monthly Latin America Bull 2X Fund
Long Equity Swap Contracts
April 30, 2012
| | | | | | | | | | | | | | | | | | | | | | |
Counterparty | | Reference Entity | | Number of
Contracts | | | Notional
Amount | | | Interest Rate
Paid | | | Termination
Date | | | Unrealized
Appreciation/
(Depreciation) | |
Bank of America Merrill Lynch | | iShares S&P Latin America 40 Index Fund | | | 1,391,919 | | | $ | 68,872,152 | | | | (1.19 | %) | | | 4/1/2013 | | | $ | (5,340,123 | ) |
Bank of America Merrill Lynch | | iShares S&P Latin America 40 Index Fund | | | 2,500 | | | | 123,300 | | | | (1.19 | %) | | | 4/2/2013 | | | | (9,174 | ) |
Bank of America Merrill Lynch | | iShares S&P Latin America 40 Index Fund | | | 2,700 | | | | 127,952 | | | | (1.19 | %) | | | 4/8/2013 | | | | (4,678 | ) |
Bank of America Merrill Lynch | | iShares S&P Latin America 40 Index Fund | | | 6,900 | | | | 330,988 | | | | (1.19 | %) | | | 4/9/2013 | | | | (15,908 | ) |
Bank of America Merrill Lynch | | iShares S&P Latin America 40 Index Fund | | | 2,800 | | | | 135,015 | | | | (1.19 | %) | | | 4/12/2013 | | | | (7,135 | ) |
Bank of America Merrill Lynch | | iShares S&P Latin America 40 Index Fund | | | 3,300 | | | | 159,125 | | | | (1.19 | %) | | | 4/15/2013 | | | | (8,404 | ) |
Bank of America Merrill Lynch | | iShares S&P Latin America 40 Index Fund | | | 2,775 | | | | 132,185 | | | | (1.19 | %) | | | 4/22/2013 | | | | (5,416 | ) |
Bank of America Merrill Lynch | | iShares S&P Latin America 40 Index Fund | | | 12,690 | | | | 618,127 | | | | (1.19 | %) | | | 4/26/2013 | | | | (38,361 | ) |
Bank of America Merrill Lynch | | iShares S&P Latin America 40 Index Fund | | | 16,000 | | | | 769,484 | | | | (1.19 | %) | | | 4/29/2013 | | | | (38,427 | ) |
Bank of America Merrill Lynch | | iShares S&P Latin America 40 Index Fund | | | 9,400 | | | | 442,828 | | | | (1.19 | %) | | | 4/30/2013 | | | | (13,283 | ) |
Bank of America Merrill Lynch | | iShares S&P Latin America 40 Index Fund | | | 1,560 | | | | 73,194 | | | | (1.19 | %) | | | 5/6/2013 | | | | (1,891 | ) |
Bank of America Merrill Lynch | | iShares S&P Latin America 40 Index Fund | | | 13,630 | | | | 626,015 | | | | (1.19 | %) | | | 5/13/2013 | | | | (2,848 | ) |
Bank of America Merrill Lynch | | iShares S&P Latin America 40 Index Fund | | | 7,020 | | | | 320,808 | | | | (1.19 | %) | | | 5/20/2013 | | | | 202 | |
Bank of America Merrill Lynch | | iShares S&P Latin America 40 Index Fund | | | 8,700 | | | | 396,277 | | | | (1.19 | %) | | | 5/23/2013 | | | | 1,595 | |
Bank of America Merrill Lynch | | iShares S&P Latin America 40 Index Fund | | | 20,880 | | | | 950,833 | | | | (1.19 | %) | | | 5/28/2013 | | | | 4,210 | |
| | | | | | | | | | | | | | | | | | | | | | |
| | | | | 1,502,774 | | | $ | 74,078,283 | | | | | | | | | | | $ | (5,479,641 | ) |
| | | | | | | | | | | | | | | | | | | | | | |
The accompanying notes are an integral part of these financial statements.
| | |
| |
| DIREXION ANNUAL REPORT | | 15 |
Statements of Assets and Liabilities
April 30, 2012
| | | | | | | | | | | | | | | | |
| | | Direxion Monthly
NASDAQ-100 Bull
2X Fund | | | Direxion Monthly
S&P 500 Bull
2X Fund | | | Direxion Monthly
S&P 500 Bear
2X Fund | | | Direxion Monthly
Latin America Bull
2X Fund | |
Assets: | | | | | | | | | | | | | | | | |
Cash | | $ | 23,219,848 | | | $ | 13,446,254 | | | $ | 11,218,491 | | | $ | 15,469,489 | |
Receivables: | | | | | | | | | | | | | | | | |
Fund shares sold | | | 589,032 | | | | 2,915,480 | | | | 74,240 | | | | 252,534 | |
Deposits at broker for swaps | | | 5,900,000 | | | | 3,520,000 | | | | 2,950,000 | | | | 19,270,000 | |
Due from broker for swaps | | | 6,629 | | | | — | | | | — | | | | 5,012,983 | |
Unrealized appreciation on swaps | | | — | | | | 462,289 | | | | — | | | | 6,007 | |
Dividends and interest | | | — | | | | — | | | | — | | | | 570 | |
| | | | | | | | | | | | | | | | |
Total Assets | | | 29,715,509 | | | | 20,344,023 | | | | 14,242,731 | | | | 40,011,583 | |
| | | | | | | | | | | | | | | | |
Liabilities: | | | | | | | | | | | | | | | | |
Payables: | | | | | | | | | | | | | | | | |
Due to custodian | | | — | | | | — | | | | — | | | | 223 | |
Fund shares redeemed | | | 140,898 | | | | 6,374 | | | | 804,790 | | | | 129,806 | |
Due to broker for swaps | | | — | | | | — | | | | 27,877 | | | | — | |
Deposits from broker for swaps | | | — | | | | 600,000 | | | | — | | | | — | |
Unrealized depreciation on swaps | | | 283,268 | | | | — | | | | 72,984 | | | | 5,485,648 | |
Accrued investment advisory fees | | | 19,801 | | | | 10,771 | | | | 8,455 | | | | 22,090 | |
Accrued operating services fees | | | 17,161 | | | | 9,335 | | | | 7,328 | | | | 19,144 | |
Accrued distribution expense | | | 6,600 | | | | 3,590 | | | | 2,818 | | | | 7,363 | |
Accrued shareholder servicing fees | | | 6,600 | | | | 3,590 | | | | 2,818 | | | | 7,363 | |
Other liabilities | | | 77 | | | | 38 | | | | 12 | | | | — | |
| | | | | | | | | | | | | | | | |
Total liabilities | | | 474,405 | | | | 633,698 | | | | 927,082 | | | | 5,671,637 | |
| | | | | | | | | | | | | | | | |
Net Assets | | $ | 29,241,104 | | | $ | 19,710,325 | | | $ | 13,315,649 | | | $ | 34,339,946 | |
| | | | | | | | | | | | | | | | |
Net Assets Consist Of: | | | | | | | | | | | | | | | | |
Capital stock | | $ | 39,842,569 | | | $ | 21,172,927 | | | $ | 59,994,037 | | | $ | 207,301,634 | |
Accumulated net investment loss | | | (135,210 | ) | | | (94,280 | ) | | | (85,123 | ) | | | (233,871 | ) |
Accumulated net realized loss | | | (10,182,987 | ) | | | (1,830,611 | ) | | | (46,520,281 | ) | | | (167,248,176 | ) |
Net unrealized appreciation (depreciation) on swaps | | | (283,268 | ) | | | 462,289 | | | | (72,984 | ) | | | (5,479,641 | ) |
| | | | | | | | | | | | | | | | |
Total Net Assets | | $ | 29,241,104 | | | $ | 19,710,325 | | | $ | 13,315,649 | | | $ | 34,339,946 | |
| | | | | | | | | | | | | | | | |
Calculation of Net Assets Value Per Share: | | | | | | | | | | | | | | | | |
Net assets | | $ | 29,241,104 | | | $ | 19,710,325 | | | $ | 13,315,649 | | | $ | 34,339,946 | |
Shares outstanding (unlimited shares of beneficial interest authorized, no par value) | | | 251,208 | | | | 427,125 | | | | 633,407 | | | | 763,657 | |
Net asset value, redemption and offering price per share | | $ | 116.40 | | | $ | 46.15 | | | $ | 21.02 | | | $ | 44.97 | |
| | | | | | | | | | | | | | | | |
The accompanying notes are an integral part of these financial statements.
| | |
| | |
| 16 | | DIREXION ANNUAL REPORT |
Statements of Operations
For the Year Ended April 30, 2012
| | | | | | | | | | | | | | | | |
| | | Direxion Monthly
NASDAQ-100 Bull
2X Fund | | | Direxion Monthly
S&P 500 Bull
2X Fund | | | Direxion Monthly
S&P 500 Bear
2X Fund | | | Direxion Monthly
Latin America Bull
2X Fund | |
Investment income: | | | | | | | | | | | | | | | | |
Interest income | | $ | 5,456 | | | $ | 4,455 | | | $ | 4,427 | | | $ | 13,931 | |
| | | | | | | | | | | | | | | | |
Total investment income | | | 5,456 | | | | 4,455 | | | | 4,427 | | | | 13,931 | |
| | | | | | | | | | | | | | | | |
Expenses: | | | | | | | | | | | | | | | | |
Investment advisory fees | | | 133,388 | | | | 131,342 | | | | 138,175 | | | | 318,335 | |
Operating services fees | | | 115,603 | | | | 113,830 | | | | 119,751 | | | | 275,891 | |
Distribution expenses | | | 44,462 | | | | 43,781 | | | | 46,058 | | | | 106,112 | |
Shareholder servicing fees | | | 44,462 | | | | 43,781 | | | | 46,058 | | | | 106,112 | |
| | | | | | | | | | | | | | | | |
Total expenses before excise taxes | | | 337,915 | | | | 332,734 | | | | 350,042 | | | | 806,450 | |
Excise taxes | | | — | | | | 37,041 | | | | — | | | | — | |
| | | | | | | | | | | | | | | | |
Total expenses | | | 337,915 | | | | 369,775 | | | | 350,042 | | | | 806,450 | |
| | | | | | | | | | | | | | | | |
Net investment loss | | | (332,459 | ) | | | (365,320 | ) | | | (345,615 | ) | | | (792,519 | ) |
| | | | | | | | | | | | | | | | |
Realized and unrealized gain (loss) on investments: | | | | | | | | | | | | | | | | |
Net realized gain (loss) on swaps | | | 3,089,029 | | | | (564,412 | ) | | | (8,003,534 | ) | | | (14,849,182 | ) |
| | | | | | | | | | | | | | | | |
Change in unrealized appreciation (depreciation) on swaps | | | (907,925 | )�� | | | 232,912 | | | | 605,172 | | | | (6,705,157 | ) |
| | | | | | | | | | | | | | | | |
Net realized and unrealized gain (loss) on investments | | | 2,181,104 | | | | (331,500 | ) | | | (7,398,362 | ) | | | (21,554,339 | ) |
| | | | | | | | | | | | | | | | |
Net increase (decrease) in net assets resulting from operations | | $ | 1,848,645 | | | $ | (696,820 | ) | | $ | (7,743,977 | ) | | $ | (22,346,858 | ) |
| | | | | | | | | | | | | | | | |
The accompanying notes are an integral part of these financial statements.
| | |
| |
| DIREXION ANNUAL REPORT | | 17 |
Statements of Changes in Net Assets
| | | | | | | | | | | | | | | | |
| | | Direxion Monthly NASDAQ-
100 Bull 2X Fund | | | Direxion Monthly S&P 500
Bull 2X Fund | |
| | | Year Ended
April 30, 2012 | | | Year Ended
April 30, 2011 | | | Year Ended
April 30, 2012 | | | Year Ended
April 30, 2011 | |
Increase (Decrease) in net assets from: | | | | | | | | | | | | | | | | |
Operations | | | | | | | | | | | | | | | | |
Net investment loss | | $ | (332,459 | ) | | $ | (336,402 | ) | | $ | (365,320 | ) | | $ | (333,944 | ) |
Net realized gain (loss) on investments | | | 3,089,029 | | | | 2,007,879 | | | | (564,412 | ) | | | 4,764,550 | |
Change in net unrealized appreciation (depreciation) on investments | | | (907,925 | ) | | | 2,104,219 | | | | 232,912 | | | | 880,274 | |
| | | | | | | | | | | | | | | | |
Net increase (decrease) in net assets resulting from operations | | | 1,848,645 | | | | 3,775,696 | | | | (696,820 | ) | | | 5,310,880 | |
| | | | | | | | | | | | | | | | |
Distributions to shareholders: | | | | | | | | | | | | | | | | |
Net realized gain | | | — | | | | — | | | | (1,704,431 | ) | | | — | |
| | | | | | | | | | | | | | | | |
Capital share transactions: | | | | | | | | | | | | | | | | |
Net increase (decrease) in net assets resulting from net change in capital share transactions(a) | | | 5,992,068 | | | | (9,891,815 | ) | | | 1,876,936 | | | | (1,932,851 | ) |
| | | | | | | | | | | | | | | | |
Total increase (decrease) in net assets | | | 7,840,713 | | | | (6,116,119 | ) | | | (524,315 | ) | | | 3,378,029 | |
| | | | | | | | | | | | | | | | |
Net assets: | | | | | | | | | | | | | | | | |
Beginning of year | | | 21,400,391 | | | | 27,516,510 | | | | 20,234,640 | | | | 16,856,611 | |
| | | | | | | | | | | | | | | | |
End of year | | $ | 29,241,104 | | | $ | 21,400,391 | | | $ | 19,710,325 | | | $ | 20,234,640 | |
| | | | | | | | | | | | | | | | |
Accumulated net investment loss, end of year | | $ | (135,210 | ) | | $ | — | | | $ | (94,280 | ) | | $ | — | |
| | | | | | | | | | | | | | | | |
| (a) | Summary of capital share transactions is as follows: |
| | | | | | | | | | | | | | | | | | | | | | | | | | | | | | | | |
| | | Direxion Monthly NASDAQ-100 Bull 2X Fund | | | Direxion Monthly S&P 500 Bull 2X Fund | |
| | | Year Ended
April 30, 2012 | | | Year Ended
April 30, 2011 | | | Year Ended
April 30, 2012 | | | Year Ended
April 30, 2011 | |
| | | Shares | | | Value | | | Shares | | | Value | | | Shares | | | Value | | | Shares | | | Value | |
Shares sold | | | 984,596 | | | $ | 94,275,537 | | | | 1,077,641 | | | $ | 76,940,514 | | | | 5,773,534 | | | $ | 246,300,783 | | | | 8,271,415 | | | $ | 319,411,380 | |
Shares issued in reinvestment of distributions | | | — | | | | — | | | | | | | | — | | | | 40,502 | | | | 1,628,656 | | | | — | | | | — | |
Shares redeemed | | | (962,469 | ) | | | (88,283,469 | ) | | | (1,254,087 | ) | | | (86,832,329 | ) | | | (5,795,885 | ) | | | (246,052,503 | ) | | | (8,303,118 | ) | | | (321,344,231 | ) |
| | | | | | | | | | | | | | | | | | | | | | | | | | | | | | | | |
Net increase (decrease) | | | 22,127 | | | $ | 5,992,068 | | | | (176,446 | ) | | $ | (9,891,815 | ) | | | 18,151 | | | $ | 1,876,936 | | | | (31,703 | ) | | $ | (1,932,851 | ) |
| | | | | | | | | | | | | | | | | | | | | | | | | | | | | | | | |
The accompanying notes are an integral part of these financial statements.
| | |
| | |
| 18 | | DIREXION ANNUAL REPORT |
Statements of Changes in Net Assets
| | | | | | | | | | | | | | | | |
| | | Direxion Monthly S&P 500
Bear 2X Fund | | | Direxion Monthly Latin
America Bull 2X Fund | |
| | | Year Ended
April 30, 2012 | | | Year Ended
April 30, 2011 | | | Year Ended
April 30, 2012 | | | Year Ended
April 30, 2011 | |
Increase (Decrease) in net assets from: | | | | | | | | | | | | | | | | |
Operations | | | | | | | | | | | | | | | | |
Net investment loss | | $ | (345,615 | ) | | $ | (394,862 | ) | | $ | (792,519 | ) | | $ | (1,446,519 | ) |
Net realized gain (loss) on investments | | | (8,003,534 | ) | | | (13,473,346 | ) | | | (14,849,182 | ) | | | 7,338,475 | |
Change in net unrealized appreciation (depreciation) on investments | | | 605,172 | | | | 650,087 | | | | (6,705,157 | ) | | | 7,158,847 | |
| | | | | | | | | | | | | | | | |
Net increase (decrease) in net assets resulting from operations | | | (7,743,977 | ) | | | (13,218,121 | ) | | | (22,346,858 | ) | | | 13,050,803 | |
| | | | | | | | | | | | | | | | |
Capital share transactions: | | | | | | | | | | | | | | | | |
Net increase (decrease) in net assets resulting from net change in capital share transactions(a) | | | 11,194,170 | | | | 12,915,610 | | | | (11,662,564 | ) | | | (47,751,073 | ) |
| | | | | | | | | | | | | | | | |
Total increase (decrease) in net assets | | | 3,450,193 | | | | (302,511 | ) | | | (34,009,422 | ) | | | (34,700,270 | ) |
| | | | | | | | | | | | | | | | |
Net assets: | | | | | | | | | | | | | | | | |
Beginning of year | | | 9,865,456 | | | | 10,167,967 | | | | 68,349,368 | | | | 103,049,638 | |
| | | | | | | | | | | | | | | | |
End of year | | $ | 13,315,649 | | | $ | 9,865,456 | | | $ | 34,339,946 | | | $ | 68,349,368 | |
| | | | | | | | | | | | | | | | |
Accumulated net investment loss, end of year | | $ | (85,123 | ) | | $ | — | | | $ | (233,871 | ) | | $ | — | |
| | | | | | | | | | | | | | | | |
| (a) | Summary of capital share transactions is as follows: |
| | | | | | | | | | | | | | | | | | | | | | | | | | | | | | | | |
| | | Direxion Monthly S&P 500 Bear 2X Fund | | | Direxion Monthly Latin America Bull 2X Fund | |
| | | Year Ended
April 30, 2012 | | | Year Ended
April 30, 2011 | | | Year Ended
April 30, 2012 | | | Year Ended
April 30, 2011 | |
| | | Shares | | | Value | | | Shares | | | Value | | | Shares | | | Value | | | Shares | | | Value | |
Shares sold | | | 7,987,660 | | | $ | 225,455,973 | | | | 8,338,624 | | | $ | 321,978,656 | | | | 949,900 | | | $ | 45,634,808 | | | | 2,472,219 | | | $ | 141,217,775 | |
Shares redeemed | | | (7,741,656 | ) | | | (214,261,803 | ) | | | (8,209,082 | ) | | | (309,063,046 | ) | | | (1,195,236 | ) | | | (57,297,372 | ) | | | (3,329,911 | ) | | | (188,968,848 | ) |
| | | | | | | | | | | | | | | | | | | | | | | | | | | | | | | | |
Net increase (decrease) | | | 246,004 | | | $ | 11,194,170 | | | | 129,542 | | | $ | 12,915,610 | | | | (245,336 | ) | | $ | (11,662,564 | ) | | | (857,692 | ) | | $ | (47,751,073 | ) |
| | | | | | | | | | | | | | | | | | | | | | | | | | | | | | | | |
The accompanying notes are an integral part of these financial statements.
| | |
| |
| DIREXION ANNUAL REPORT | | 19 |
Financial Highlights
| | | | | | | | | | | | | | | | | | | | | | | | | | | | | | | | | | | | | | | | | | | | | | | | | | | | | | | | | | | | |
| | | | | | | | | | | | | | | | | | | | | | | | | | | | | | | | | | | | RATIOS TO AVERAGE NET ASSETS | |
| | | Net Asset
Value,
Beginning
of Year/Period | | | Net
Investment
Income
(Loss)2 | | | Net Realized
and
Unrealized
Gain (Loss) on
Investments | | | Net Increase
(Decrease) in
Net Asset
Value Resulting
from Operations | | | Dividends
from Net
Investment
Income | | | Distributions
from
Realized
Capital Gains | | | Return of
Capital
Distribution | | | Total
Distributions | | | Net Asset
Value,
End of
Year/Period | | | Total
Return | | | Net Assets,
End of
Year/Period
(,000) | | | Total
Expenses1 | | | Net
Expenses1 | | | Net
Investment
Income (Loss)
After Expense
Reimbursement/
Recoupment1 | | | Portfolio
Turnover
Rate3 | |
Direxion Monthly NASDAQ-100 Bull 2X Fund | | | | | | | | | | | | | | | | | | | | | | | | | | | | | | | | | | | | | | | | | | | | | | | | | | | | | | | | | | | | |
Year Ended April 30, 2012 | | $ | 93.42 | | | $ | (1.73 | ) | | $ | 24.71 | | | $ | 22.98 | | | $ | — | | | $ | — | | | $ | — | | | $ | — | | | $ | 116.40 | | | | 24.60% | | | $ | 29,241 | | | | 1.90% | | | | 1.90% | | | | (1.87% | ) | | | 0% | |
Year ended April 30, 2011 | | | 67.85 | | | | (1.28 | ) | | | 26.85 | | | | 25.57 | | | | — | | | | — | | | | — | | | | — | | | | 93.42 | | | | 37.69% | | | | 21,400 | | | | 1.90% | | | | 1.90% | | | | (1.80% | ) | | | 0% | |
Year ended April 30, 2010 | | | 31.57 | | | | (0.88 | ) | | | 37.16 | | | | 36.28 | | | | — | | | | — | | | | — | | | | — | | | | 67.85 | | | | 114.92% | | | | 27,517 | | | | 1.95% | | | | 1.91% | | | | (1.77% | ) | | | 0% | |
Year ended April 30, 2009 | | | 112.07 | | | | (0.15 | ) | | | (79.02 | ) | | | (79.17 | ) | | | — | | | | (1.31 | ) | | | (0.02 | ) | | | (1.33 | ) | | | 31.57 | | | | (70.49% | ) | | | 26,156 | | | | 1.93% | | | | 1.81% | | | | (0.38% | ) | | | 83% | |
Year ended April 30, 2008 | | | 144.55 | | | | 3.08 | | | | (15.54 | ) | | | (12.46 | ) | | | (7.07 | ) | | | (12.95 | ) | | | — | | | | (20.02 | ) | | | 112.07 | | | | (11.69% | ) | | | 21,530 | | | | 2.35% | | | | 1.75% | | | | 2.22% | | | | 28% | |
Direxion Monthly S&P 500 Bull 2X Fund | | | | | | | | | | | | | | | | | | | | | | | | | | | | | | | | | | | | | | | | | | | | | | | | | | | | | | | | | | | | |
Year Ended April 30, 2012 | | $ | 49.48 | | | | (0.89 | ) | | | 2.06 | | | | 1.17 | | | | — | | | | (4.50 | ) | | | — | | | | (4.50 | ) | | | 46.15 | | | | 3.94% | | | | 19,710 | | | | 2.11% | | | | 2.11% | | | | (2.09% | ) | | | 0% | |
Year ended April 30, 2011 | | | 38.25 | | | | (0.69 | ) | | | 11.92 | | | | 11.23 | | | | — | | | | — | | | | — | | | | — | | | | 49.48 | | | | 29.36% | | | | 20,235 | | | | 1.90% | | | | 1.90% | | | | (1.81% | ) | | | 0% | |
Year ended April 30, 2010 | | | 19.37 | | | | (0.44 | ) | | | 19.32 | | | | 18.88 | | | | — | | | | — | | | | — | | | | — | | | | 38.25 | | | | 97.47% | | | | 16,857 | | | | 1.93% | | | | 1.87% | | | | (1.67% | ) | | | 0% | |
Year ended April 30, 2009 | | | 90.05 | | | | (0.21 | ) | | | (70.46 | ) | | | (70.67 | ) | | | — | | | | — | | | | (0.01 | ) | | | (0.01 | ) | | | 19.37 | | | | (78.48% | ) | | | 42,611 | | | | 1.81% | | | | 1.85% | | | | (0.95% | ) | | | 578% | |
Year ended April 30, 2008 | | | 119.40 | | | | 2.50 | | | | (31.00 | ) | | | (28.50 | ) | | | — | | | | — | | | | (0.85 | ) | | | (0.85 | ) | | | 90.05 | | | | (23.97% | ) | | | 19,608 | | | | 2.46% | | | | 1.75% | | | | 2.35% | | | | 190% | |
Direxion Monthly S&P 500 Bear 2X Fund | | | | | | | | | | | | | | | | | | | | | | | | | | | | | | | | | | | | | | | | | | | | | | | | | | | | | | | | | | | | |
Year Ended April 30, 2012 | | $ | 25.47 | | | | (0.51 | ) | | | (3.94 | ) | | | (4.45 | ) | | | — | | | | — | | | | — | | | | — | | | | 21.02 | | | | (17.47% | ) | | | 13,316 | | | | 1.90% | | | | 1.90% | | | | (1.88% | ) | | | 0% | |
Year ended April 30, 2011 | | | 39.43 | | | | (0.68 | ) | | | (13.28 | ) | | | (13.96 | ) | | | — | | | | — | | | | — | | | | — | | | | 25.47 | | | | (35.40% | ) | | | 9,865 | | | | 1.90% | | | | 1.90% | | | | (1.79% | ) | | | 0% | |
Year ended April 30, 2010 | | | 96.60 | | | | (0.95 | ) | | | (56.22 | ) | | | (57.17 | ) | | | — | | | | — | | | | — | | | | — | | | | 39.43 | | | | (59.18% | ) | | | 10,168 | | | | 1.98% | | | | 1.91% | | | | (1.75% | ) | | | 0% | |
Year ended April 30, 2009 | | | 80.25 | | | | (0.75 | ) | | | 22.65 | | | | 21.90 | | | | (5.55 | ) | | | — | | | | — | | | | (5.55 | ) | | | 96.60 | | | | 25.39% | | | | 26,885 | | | | 1.93% | | | | 1.80% | | | | (0.66% | ) | | | 195% | |
Year ended April 30, 2008 | | | 73.90 | | | | 1.70 | | | | 4.65 | | | | 6.35 | | | | — | | | | — | | | | — | | | | — | | | | 80.25 | | | | 8.59% | | | | 8,996 | | | | 2.44% | | | | 1.75% | | | | 2.10% | | | | 168% | |
Direxion Monthly Latin America Bull 2X Fund | | | | | | | | | | | | | | | | | | | | | | | | | | | | | | | | | | | | | | | | | | | | | | | | | | | | | | | | | | | | |
Year Ended April 30, 2012 | | $ | 67.74 | | | | (0.91 | ) | | | (21.86 | ) | | | (22.77 | ) | | | — | | | | — | | | | — | | | | — | | | | 44.97 | | | | (33.61% | ) | | | 34,340 | | | | 1.90% | | | | 1.90% | | | | (1.87% | ) | | | 0% | |
Year ended April 30, 2011 | | | 55.20 | | | | (1.02 | ) | | | 13.56 | | | | 12.54 | | | | — | | | | — | | | | — | | | | — | | | | 67.74 | | | | 22.72% | | | | 68,349 | | | | 1.90% | | | | 1.90% | | | | (1.79% | ) | | | 0% | |
Year ended April 30, 2010 | | | 23.45 | | | | (0.84 | ) | | | 32.59 | | | | 31.75 | | | | — | | | | — | | | | — | | | | — | | | | 55.20 | | | | 135.39% | | | | 103,050 | | | | 1.90% | | | | 1.91% | | | | (1.83% | ) | | | 0% | |
Year ended April 30, 2009 | | | 177.90 | | | | 0.30 | | | | (151.98 | ) | | | (151.68 | ) | | | (0.32 | ) | | | — | | | | (2.45 | ) | | | (2.77 | ) | | | 23.45 | | | | (85.09% | ) | | | 44,601 | | | | 1.82% | | | | 1.75% | | | | 0.41% | | | | 120% | |
Year ended April 30, 2008 | | | 120.80 | | | | 0.90 | | | | 86.60 | | | | 87.50 | | | | (20.30 | ) | | | (10.10 | ) | | | — | | | | (30.40 | ) | | | 177.90 | | | | 79.77% | | | | 283,141 | | | | 1.64% | | | | 1.67% | | | | 0.57% | | | | 521% | |
| 2 | Net investment income (loss) per share represents net investment income (loss) divided by the daily average shares of beneficial interest outstanding throughout each period. |
| 3 | Portfolio turnover is calculated without regard to short-term securities having a maturity of less than one year. Investments in swaps, futures contracts and repurchase agreements are deemed short-term securities. |
| | |
| | |
| 20 | | DIREXION ANNUAL REPORT |
Direxion Funds
Notes to the Financial Statements
April 30, 2012
Direxion Funds (the “Trust”) was organized as a Massachusetts Business Trust on June 6, 1997 and is registered under the Investment Company Act of 1940, as amended (the “1940 Act”), as an open-end management investment company issuing its shares in series, each series representing a distinct portfolio with its own investment objective and policies. The Trust currently has 24 series of which 4 are included in this report: Direxion Monthly NASDAQ-100 Bull 2X Fund, Direxion Monthly S&P 500 Bull 2X Fund, Direxion Monthly S&P 500 Bear 2X Fund, and the Direxion Monthly Latin America Bull 2X Fund (each, a “Fund” and together, the “Funds”). Each Fund is a non-diversified series of the Trust pursuant to the 1940 Act. On March 15, 2012, the Direxion Monthly NASDAQ-100 Bear 2X Fund, the Direxion Monthly Dollar Bull 2X Fund and the Direxion Monthly Dollar Bear 2X closed to investors and on March 30, 2012 these 3 Funds were liquidated and terminated. The 4 Funds included in this report offer only Investor Class of shares.
The Funds’ investment objectives are to seek investment results, before fees and expenses, that correspond to the calendar month performance of a particular index or benchmark. The Direxion Monthly NASDAQ-100 Bull 2X Fund, Direxion Monthly S&P 500 Bull 2X Fund and the Direxion Monthly Latin America Bull 2X Fund attempt to provide investment results that correlate positively to the return of an index. The Direxion Monthly S&P 500 Bear 2X Fund attempts to provide investment results that correlate negatively to the return of an index.
| | | | | | |
| Fund | | Index | | Monthly Target | |
Direxion Monthly NASDAQ-100 Bull 2X Fund | | NASDAQ-100® Index | | | 200 | % |
Direxion Monthly S&P 500 Bull 2X Fund Direxion Monthly S&P 500 Bear 2X Fund | | S&P 500® Index | |
| 200
-200 | %
% |
Direxion Monthly Latin America Bull 2X Fund | | S&P® Latin America 40 Index | | | 200 | % |
| 2. | | SIGNIFICANT ACCOUNTING POLICIES |
The following is a summary of significant accounting policies consistently followed by the Funds in the preparation of their financial statements. These policies are in conformity with U.S. generally accepted accounting principles (“GAAP”).
a) Investment Valuation – The Net Asset Value (“NAV”) of each Fund is determined daily, Monday through Friday, as of the close of regular trading on the New York Stock Exchange (“NYSE”), each day the NYSE is open for business. The value of all portfolio securities and other assets held by a Fund will be determined as of the time a Fund calculates its NAV, 4:00 p.m. Eastern Time (“Valuation Time”). Equity securities, exchange-traded funds and over-the-counter securities are valued at their last sales price, or if not available, at the average of the last bid and ask prices. Investments in open-end mutual funds are valued at their respective quoted NAV on the valuation dates. Futures contracts are valued at the settlement price established on the exchange on which they are traded, if that settlement price reflects trading prior to the Valuation Time. If the settlement price established by the exchange reflects trading after the Valuation Time, then the last sales price prior to Valuation Time will be used. Securities primarily traded on the NASDAQ National Market are valued using the NASDAQ Official Closing Price. Swap contracts are valued using the closing price of the underlying reference entity or the closing value of the underlying reference index. Short-term debt securities with a maturity of 60 days or less and money market securities are valued using the amortized cost method. Other debt securities are valued by using the mean prices provided by the Fund’s pricing service or, if such prices are unavailable, by a matrix pricing method. Securities for which reliable market quotations are not readily available, the Funds’ pricing service does not provide a valuation for such securities, the Fund’s pricing service provides valuation that in the judgment of Rafferty Asset Management, LLC (the “Adviser”) does not represent fair value, or the Fund or Adviser believes the market price is stale will be fair valued as determined by the Adviser under the supervision of the Board of Trustees. Additionally, the Adviser will monitor developments in the marketplace for significant events that may affect the value oft hose securities whose closing prices were established before the Valuation Time.
b) Repurchase Agreements – Each Fund may enter into repurchase agreements with institutions that are members of the Federal Reserve System or securities dealers who are members of a national securities exchange or are primary dealers in U.S. government securities. In connection with transactions in repurchase agreements, it is the Trust’s policy that the Fund
| | |
| |
| DIREXION ANNUAL REPORT | | 21 |
receives, as collateral, cash and/or securities (primarily U.S. government securities) whose fair value, including accrued interest, at all times will be at least equal to 100% of the amount invested by the Fund in each repurchase agreement. If the seller defaults, and the value of the collateral declines, realization of the collateral by the Fund may be delayed or limited. The Funds were not invested in repurchase agreements at April 30, 2012.
c) Swap Contracts – Each Fund may enter into equity swap contacts. Standard equity swap contracts are between two parties that agree to exchange the returns (or differentials in rates of return) earned or realized on particular predetermined investments or instruments. The gross amount to be exchanged is calculated with respect to a “notional amount” (i.e. the return on or increase in value of a particular dollar amount invested in a “basket” of securities representing a particular index or industry sector). The Funds enter into master netting agreements with the counterparty. These agreements calculate the obligations of the parties on a “net basis”. Consequently, a Fund’s current obligations under a swap agreement generally will be equal to the net amount to be paid or received under the agreement based on the relative value of the positions held by each party. The Fund’s obligations are accrued daily and offset by any amounts owed to the Fund. However, the Funds do not offset the fair value amounts of the swap contract and the related collateral on the Statement of Assets and Liabilities arising from swap contracts executed with the same counterparty under such master netting agreements. The Funds were invested in equity swap contracts at April 30, 2012.
In a “long” equity swap agreement, the counterparty will generally agree to pay the Fund the amount, if any, by which the notional amount of swap contract would have increased in value if the Fund had been invested in the particular securities, plus dividends that would have been received on those securities. The Fund will agree to pay the counterparty a floating rate of interest on the notional amount of the swap contract plus the amount, if any, by which the notional amount would have decreased in value had it been invested in such securities plus, in certain instances, commissions or trading spreads on the notional amounts. Thus, the return on the swap contract should be the gain or loss on the notional amount plus dividends on the securities less the interest paid by the Fund on the notional amount. However, in certain instances, market factors such as the interest rate environment and the demand to borrow the securities underlying the swap agreement can cause a scenario in which the counterparty will pay the Fund interest. Payments may be made at the conclusion of the contract or periodically during its term. Swap contracts do not include the delivery of securities. The net amount of the excess, if any, of the Fund’s obligations over its entitlement with respect to each swap is accrued on a daily basis and an amount of cash or liquid assets, having an aggregate net asset value at least equal to such accrued excess is maintained in a segregated account. Until a swap contract is settled in cash, the gain or loss on the notional amount plus dividends on the securities less the interest paid by the Fund on the notional amount are recorded as “unrealized gains or losses on swaps” and when cash is exchanged, the gain or loss is recorded as “realized gains or losses on swaps”.
Each Fund may enter into swap contracts that provide the opposite return of the particular benchmark or security (“short” the index or security). The operations are similar to that of the swaps disclosed above except that the counterparty pays interest to the Fund on the notional amount outstanding and the dividends on the underlying securities reduce the return of the swap. However, in certain instances, market factors such as the interest rate environment and the demand to borrow the securities underlying the swap agreement can cause a scenario in which the Fund pays the counterparty interest. These amounts are netted with any unrealized appreciation or depreciation to determine the value of the swap. The Funds will typically enter into equity swap agreements to obtain leverage in order to meet their objectives.
The Funds collateralize swap agreements with cash and certain securities as indicated on the Schedule of Investments of each of the Funds, respectively. Such collateral is held for the benefit of the counterparty in a segregated account at the Custodian to protect the counterparty against non-payment by the Funds. The Funds do not net collateral. In the event of a default by the counterparty, the Funds will seek return of this collateral and may incur certain costs exercising their rights with respect to the collateral. Amounts expected to be owed to the Funds are regularly collateralized either directly with the Funds or in a segregated account at the Custodian.
A Fund bears the risk of loss of the amount expected to be received under a swap agreement in the event of the default or bankruptcy of swap agreement counterparty to the extent that posted collateral is insufficient. A Fund will enter into swap agreements only with large, well-capitalized and established financial institutions. The creditworthiness of each of the firms that is counterparty to a swap agreement is monitored by the Adviser. The financial statements of these counterparties are available by accessing the SEC’s website, at www.sec.gov. Swap contracts are subject to credit risk. Credit risk is where the financial condition of an issuer of a security or instrument may cause it to default or become unable to pay interest or principal due on the security. The counterparty to a swap contract might default on its obligations. In addition, the Funds have agreements with certain counterparties with which it trades swap contracts that contain credit risk-related contingent features that could be triggered subject to certain circumstances. Such circumstances include
| | |
| | |
| 22 | | DIREXION ANNUAL REPORT |
agreed upon net asset value and performance-based thresholds. The maximum exposure to the Funds in regard to potential counterparty default and credit-risk related contingent features at April 30, 2012 is as follows:
| | | | | | | | | | | | | | | | | | | | | | | | |
| | | Direxion Monthly NASDAQ-100 Bull 2X Fund | | | Direxion Monthly S&P 500 Bull 2X Fund | |
Counterparty | | Fair Value of
Swap Contracts | | | Collateral for
Swap Contracts | | | Maximum Credit
Risk Exposure | | | Fair Value of
Swap Contracts | | | Collateral for
Swap Contracts | | | Maximum Credit
Risk Exposure | |
Credit Suisse Capital, LLC | | $ | (283,268 | ) | | $ | 5,900,000 | | | $ | 5,616,732 | | | $ | 462,289 | | | $ | 3,520,000 | | | $ | 3,982,289 | |
| | | | | | | | | | | | | | | | | | | | | | | | |
| | | Direxion Monthly S&P 500 Bear 2X Fund | | | Direxion Monthly Latin America Bull 2X Fund | |
Counterparty | | Fair Value of
Swap Contracts | | | Collateral for
Swap Contracts | | | Maximum Credit
Risk Exposure | | | Fair Value of
Swap Contracts | | | Collateral for
Swap Contracts | | | Maximum Credit
Risk Exposure | |
Bank of America Merrill Lynch | | $ | — | | | $ | — | | | $ | — | | | $ | (5,479,641 | ) | | $ | 19,270,000 | | | $ | 13,790,359 | |
Credit Suisse Capital, LLC | | | (72,984 | ) | | | 2,950,000 | | | $ | 2,877,016 | | | | — | | | | — | | | $ | — | |
| | | | | | | | | | | | | | | | | | | | | | | | |
| | $ | (72,984 | ) | | $ | 2,950,000 | | | $ | 2,877,016 | | | $ | (5,479,641 | ) | | $ | 19,270,000 | | | $ | 13,790,359 | |
| | | | | | | | | | | | | | | | | | | | | | | | |
d) Short Positions – Each Fund may engage in short sale transactions. For financial statement purposes, an amount equal to the settlement amount is included in the Statement of Assets and Liabilities as an asset and an offsetting liability. The amount of the liability is subsequently marked-to-market to reflect the fair value of the short position. Subsequent fluctuations in the market prices of short securities may require purchasing the securities at prices which may differ from the fair value reflected on the Statement of Assets and Liabilities. The Fund is liable to the buyer for any dividends payable on securities while those securities are in a short position. As collateral for its short positions, the Fund is required under the 1940 Act to maintain assets consisting of cash, cash equivalents or liquid securities equal to the market value of the securities sold short. This collateral is required to be adjusted daily. The Funds held no securities sold short at April 30, 2012.
e) Stock Index Futures Contracts and Options on Futures Contracts – Each Fund may purchase and sell stock index futures contracts and options on such futures contracts. A Fund may use futures contracts to gain exposure to, or hedge against changes in the values of equities, interest rates or foreign currencies. Upon entering into a contract, the Fund deposits and maintains as collateral such initial margin as required by the exchange on which the transaction is effected. Pursuant to the contract, the Fund agrees to receive from or pay to the broker an amount of cash equal to the daily fluctuation in value of the contract. Such receipts or payments are known as “variation margin” and are recorded by the Fund as unrealized gains and losses. When the contract is closed, the Fund records a realized gain or loss equal to the difference between the value of the contract at the time it was opened and the value at the time it was closed. As collateral for futures contracts, the Fund is required under the 1940 Act to maintain assets consisting of cash, cash equivalents or liquid securities. This collateral is required to be adjusted daily to reflect the market value of the purchase obligation for long futures contracts or the market value of the instrument underlying the contract, but not less than the market price at which the futures contract was established, for short futures contracts. The Funds were not invested in futures contracts or options on futures contracts at April 30, 2012.
f) Risks of Options, Futures Contracts, Options on Futures Contracts and Short Positions – The risks inherent in the use of options, futures contracts, options on futures contracts and short positions include 1) adverse changes in the fair value of such instruments; 2) imperfect correlation between the price of options and futures contracts and options thereon and movements in the price of the underlying securities, index or futures contracts; 3) the possible absence of a liquid secondary market for any particular instrument at any time; 4) the possible need to defer closing out certain positions to avoid adverse tax consequences; and 5) the possible nonperformance by the counterparty under the terms of the contract. The Funds designate cash, cash equivalents and liquid securities as collateral for written options, futures contracts, options on futures contracts and short positions.
g) Risks of Investing in Foreign Securities – Investments in foreign securities involve greater risks than investing in domestic securities. As a result, the Funds’ returns and net asset values may be affected to a large degree by fluctuations in currency exchange rates, political, diplomatic or economic conditions and regulatory requirements in other countries. The laws and accounting, auditing, and financial reporting standards in foreign countries typically are not as strict as they are in the U.S., and there may be less public information available about foreign companies. Investments in foreign emerging markets present a greater risk than investing in foreign issuers in general. The risk of political or social upheaval is greater in emerging markets. In addition, there may be risks of an economy’s dependence on revenues from particular commodities, currency transfer restrictions, a limited number of buyers for such securities and delays and disruptions in securities settlement procedures.
| | |
| |
| DIREXION ANNUAL REPORT | | 23 |
h) Security Transactions – Investment transactions are recorded on trade date. The Funds determine the gain or loss realized from investment transactions by comparing the identified cost, which is the same basis used for federal income tax purposes, with the net sales proceeds.
i) Federal Income Taxes – Each Fund intends to comply with the requirements of Subchapter M of the Internal Revenue Code necessary to qualify as a regulated investment company and to make the requisite distributions of income and capital gains to its shareholders sufficient to relieve it from all or substantially all federal income taxes and excise taxes. No provision for federal income taxes has been made.
j) Income and Expenses – Dividend income is recorded on the ex-dividend date. Interest income, including amortization of premium and discount, and dividends received from money market funds, is recognized on an accrual basis. Expenses are charged to the Funds daily. Expenses are computed based on each Fund’s respective daily net assets. For additional discussion on expenses refer to Note 4.
k) Distributions to Shareholders – Each Fund generally pays dividends from net investment income and distributes net realized capital gains, if any, at least annually. Income and capital gain distributions are determined in accordance with income tax regulations which may differ from GAAP. Certain Funds also utilize earnings and profits distributed to shareholders on redemptions of shares as part of the dividends paid deduction. Distributions to shareholders are recorded on the ex-dividend date.
The Direxion Monthly S&P 500 Bull 2X Fund paid ordinary income distributions of $1,704,431 during the year ended April 30, 2012. No other Funds paid distributions during the years ended April 30, 2012 and April 30, 2011.
The Funds are designating as long-term capital gain dividends, pursuant to Internal Revenue Code 852(b)(3), the amount necessary to reduce the earnings and profits of the Funds related to net capital gain to zero for the tax year ended April 30, 2012. To the extent necessary to fully distribute such capital gains, the Funds also designate earnings and profits distributed to shareholders on the redemption of shares.
As of April 30, 2012, the components of distributable earnings of the Funds on a tax basis were as follows:
| | | | | | | | | | | | | | | | |
| | | Direxion Monthly
NASDAQ-100
Bull 2X Fund | | | Direxion Monthly
S&P 500
Bull 2X Fund | | | Direxion Monthly
S&P 500
Bear 2X Fund | | | Direxion Monthly
Latin America
Bull 2X Fund | |
Tax cost of investments | | $ | — | | | $ | — | | | $ | — | | | $ | — | |
Gross unrealized appreciation | | | — | | | | — | | | | — | | | | — | |
Gross unrealized depreciation | | | — | | | | — | | | | — | | | | — | |
| | | | | | | | | | | | | | | | |
Net unrealized appreciation/(depreciation) | | | — | | | | — | | | | — | | | | — | |
| | | | | | | | | | | | | | | | |
Undistributed ordinary income | | | — | | | | — | | | | — | | | | — | |
Undistributed long-term capital gain | | | — | | | | — | | | | — | | | | — | |
| | | | | | | | | | | | | | | | |
Total distributable earnings | | | — | | | | — | | | | — | | | | — | |
| | | | | | | | | | | | | | | | |
Other accumulated gain/(loss) | | | (10,601,465 | ) | | | (1,462,602 | ) | | | (46,678,388 | ) | | | (172,961,688 | ) |
| | | | | | | | | | | | | | | | |
Total accumulated earnings/(loss) | | $ | (10,601,465 | ) | | $ | (1,462,602 | ) | | $ | (46,678,388 | ) | | $ | (172,961,688 | ) |
| | | | | | | | | | | | | | | | |
Other accumulated gain/ (loss) is generally comprised of capital loss carryforwards, qualified late year loss deferrals and/or unrealized gain/ (loss) on derivative positions.
On the Statement of Assets and Liabilities, the following adjustments were made for permanent tax differences between accounting for net investment income and realized gains and losses under GAAP and tax reporting:
| | | | | | | | | | | | |
| | | Net Investment
Income (Loss) | | | Realized
Gain (Loss) | | | Capital
Stock | |
Direxion Monthly NASDAQ-100 Bull 2X Fund | | $ | 197,249 | | | $ | — | | | $ | (197,249 | ) |
Direxion Monthly S&P 500 Bull 2X Fund | | | 271,040 | | | | (945,200 | ) | | | 674,160 | |
Direxion Monthly S&P 500 Bear 2X Fund | | | 260,492 | | | | — | | | | (260,492 | ) |
Direxion Monthly Latin America Bull 2X Fund | | | 558,648 | | | | — | | | | (558,648 | ) |
| | |
| | |
| 24 | | DIREXION ANNUAL REPORT |
Net investment income and realized gains and losses for federal income tax purposes may differ from that reported on the financial statements because of permanent book-to-tax differences. GAAP requires that permanent differences in net investment income and realized gains and losses due to differences between financial reporting and tax reporting be reclassified between various components of net assets. The permanent differences primarily relate to net operating losses and dividends on redemption adjustments with differing book and tax methods.
In order to meet certain excise tax distributions requirements, the Funds are required to measure and distribute annually, net capital gains realized during a twelve month period ending October 31 and net investment income earned during a twelve month period ending December 31. In connection with this, the Funds are permitted for tax purposes to defer into their next fiscal year qualified late year losses. Qualified late year capital losses are any net capital losses incurred between November 1 and the end of their fiscal year, April 30, 2012. Qualified late year ordinary losses are specified losses generally incurred between January 1 and the end of their fiscal year, April 30, 2012.
At April 30, 2012, the following funds deferred, on a tax basis, qualified late year losses of:
| | | | | | | | |
| | | Late Year
Ordinary Losses | | | Post-October
Capital Losses | |
Direxion Monthly NASDAQ-100 Bull 2X Fund | | $ | (135,210 | ) | | $ | — | |
Direxion Monthly S&P 500 Bull 2X Fund | | | (94,280 | ) | | | — | |
Direxion Monthly S&P 500 Bear 2X Fund | | | (85,123 | ) | | | (8,524,237 | ) |
Direxion Monthly Latin America Bull 2X Fund | | | (233,871 | ) | | | (349,888 | ) |
On December 22, 2010, the Regulated Investment Company Modernization Act of 2010 (the “Act”) was enacted, which changed various technical rules governing the tax treatment of regulated investment companies. The changes are generally effective for taxable years beginning after the date of enactment. One of the more prominent changes addresses capital loss carryforwards. Under the Act, each fund will be permitted to carry forward capital losses incurred in taxable years beginning after the date of enactment for an unlimited period. However, any losses incurred during those future taxable years will be required to be utilized prior to the losses incurred in pre-enactment taxable years, which carry an expiration date. As a result of this ordering rule, pre-enactment capital loss carryforwards may be more likely to expire unused. Additionally, post-enactment capital loss carryforwards will retain their character as either short-term or long-term capital losses rather than being considered all short-term as permitted under previous regulation.
At April 30, 2012 the following funds had capital loss carryforwards on a tax basis of:
| | | | | | | | | | | | | | | | | | | | |
| | | Expires | |
| | | | | | | | | | | | Unlimited | |
| | | 4/30/2017 | | | 4/30/2018 | | | 4/30/2019 | | | ST | | | LT | |
Direxion Monthly NASDAQ-100 Bull 2X Fund | | $ | (10,172,608 | ) | | $ | — | | | $ | — | | | $ | — | | | $ | — | |
Direxion Monthly S&P 500 Bull 2X Fund | | | — | | | | — | | | | — | | | | — | | | | — | |
Direxion Monthly S&P 500 Bear 2X Fund | | | — | | | | (18,781,801 | ) | | | (4,649,215 | ) | | | (6,277,618 | ) | | | — | |
Direxion Monthly Latin America Bull 2X Fund | | | (148,741,363 | ) | | | — | | | | — | | | | (9,099,941 | ) | | | (1,148,784 | ) |
Direxion Monthly NASDAQ-100 Bull 2X Fund utilized $2,032,808 of prior year capital loss carryover in the current year.
To the extent that the Funds realize future net capital gains, those gains will be offset by any unused capital loss carryover.
The Funds follow authoritative financial reporting rules regarding recognition and measurement of tax positions taken or expected to be taken on a tax return. The Funds have reviewed all open tax years and concluded that there is no effect to the Fund’s financial positions or results of operations and no tax liability resulting from unrecognized tax benefits relating to uncertain income tax position taken or expected to be taken on a tax return. Open tax years are those years that are open for examination by the relevant income taxing authority. As of April 30, 2012, open Federal and state income tax years include the tax years ended April 30, 2009, April 30, 2010, April 30, 2011, and April 30, 2012. The Funds have no examinations in progress. The Funds are also not aware of any tax positions for which it is reasonably possible that the total amounts of unrecognized tax expense will significantly change in twelve months.
| | |
| |
| DIREXION ANNUAL REPORT | | 25 |
l) Guarantees and Indemnifications – In the ordinary course of business, the Funds enter into contracts that contain a variety of indemnification provisions pursuant to which the Funds agree to indemnify third parties upon occurrence of specified events. The Funds’ maximum exposure relating to these indemnification agreements is unknown. However, the Funds have not had prior claims or losses in connection with these provisions and believe the risk of loss is remote.
m) Use of Estimates – The preparation of financial statements in conformity with GAAP requires management to make estimates and assumptions that affect the reported amounts of assets and liabilities and disclosure of contingent assets and liabilities at the date of the financial statements and the reported amounts of revenues and expenses during the reporting period. Actual results could differ from those estimates.
| 3. | | INVESTMENT TRANSACTIONS |
During the year ended April 30, 2012, the Funds had no purchases and sales of investments (excluding short-term investments and swap contracts). Additionally, there were no purchases or sales of long-term U.S. government securities during the year ended April 30, 2012.
| 4. | | INVESTMENT ADVISORY AND OTHER AGREEMENTS |
Investment Advisory Fees: The Funds have entered into an investment advisory agreement with the Adviser. The Adviser receives a fee of 0.75%, computed daily and payable monthly, as applied to each Fund’s average daily net assets.
Operating Services Agreement: The Funds have entered into an Operating Services Agreement (the “Agreement”) with the Adviser. Under the Agreement, the Adviser will be responsible for all expenses of the Trust except the following: management fees, distribution and/or service fees, acquired fund fees, taxes, leverage interest, dividends or interest on short positions, other interest expenses, brokerage commission and other extraordinary expenses outside the typical day-to-day operations of the Funds. In consideration for the services rendered pursuant to the Agreement, the Funds will pay to the Adviser, as compensation for the services provided by the Adviser under the Agreement, a monthly fee of 0.65%, calculated on an annualized basis on the average net assets of each Fund.
Distribution Expenses: Shares of the Funds are subject to an annual 12b-1 fee of up to 1.00% of a Fund’s average daily net assets. The Funds currently pay a 12b-1 fee of 0.25% of the Fund’s average daily net assets.
Shareholder Servicing Fees: The Board of Trustees has also authorized each Fund’s shares to pay a shareholder servicing fee of 0.25% of each Fund’s average daily net assets. The Trust, on behalf of each Fund, pays the fee to financial institutions and other persons who provide services and maintain shareholder accounts.
Rafferty Capital Markets, LLC (the “Distributor”) serves as principal underwriter of the Funds and acts as the Funds’ distributor in a continuous public offering of the Funds’ shares. The Distributor is an affiliate of the Adviser.
| 5. | | VALUATION MEASUREMENTS |
The Funds follow authoritative fair valuation accounting standards which establish an authoritative definition of fair value and set out a hierarchy for measuring fair value. These standards require additional disclosures about the various inputs and valuation techniques used to develop the measurements of fair value and a discussion in changes in valuation techniques and related inputs during the period. These inputs are summarized in the three broad levels below:
Level 1 – Quoted prices in active markets for identical securities,
Level 2 – Evaluated price based on other significant observable inputs (including quoted prices for similar securities, interest rates, prepayment speeds, credit risk, etc.)
Level 3 – Significant unobservable inputs (including the Fund’s own assumptions in determining fair value of investments)
The inputs or methodology used for valuing securities are not an indication of the credit risk associated with investing in those securities.
| | |
| | |
| 26 | | DIREXION ANNUAL REPORT |
The follow is a summary of the inputs used to value the Fund’s net assets as of April 30, 2012:
| | | | | | | | | | | | | | |
| | | Direxion Monthly NASDAQ-100 Bull 2X Fund | |
| | | Level 1 | | Level 2 | | | Level 3 | | | Total | |
Other Financial Instruments* | | $— | | $ | (283,268 | ) | | $ | — | | | $ | (283,268 | ) |
| |
| | | Direxion Monthly S&P 500 Bull 2X Fund | |
| | | Level 1 | | Level 2 | | | Level 3 | | | Total | |
Other Financial Instruments* | | $— | | $ | 462,289 | | | $ | — | | | $ | 462,289 | |
| |
| | | Direxion Monthly S&P 500 Bear 2X Fund | |
| | | Level 1 | | Level 2 | | | Level 3 | | | Total | |
Other Financial Instruments* | | $— | | $ | (72,984 | ) | | $ | — | | | $ | (72,984 | ) |
| |
| | | Direxion Monthly Latin America Bull 2X Fund | |
| | | Level 1 | | Level 2 | | | Level 3 | | | Total | |
Other Financial Instruments* | | $— | | $ | (5,479,641 | ) | | $ | — | | | $ | (5,479,641 | ) |
| * | Other financial instruments are derivative instruments not reflected in the Schedule of Investments, such as swap contracts. Swap contracts are valued at the unrealized appreciation (depreciation) on the instrument. |
The Funds follow authoritative accounting standards which improve disclosure about fair value measurements. These standards require additional disclosure regarding fair value measurements. Specifically, these standards require reporting entities to disclose a) the input and valuation techniques used to measure fair value for both recurring and nonrecurring fair value measurements, for Level 2 or Level 3 positions, b) transfers between all levels (including Level 1 and Level 2) will be required to be disclosed on a gross basis (i.e. transfers out must be disclosed separately from transfers in) as well as the reason(s) for the transfers and c) purchases and sales must be shown on a gross basis in Level 3 rollforward rather than as one net number.
There were no transfers between Level 1 and Level 2 securities during the year ended April 30, 2012. There were no Level 3 securities held by the Funds during the years ended April 30, 2011 and April 30, 2012. It is the Funds’ policy to recognize transfers into Level 3 at the value as of the beginning of the period.
| 6. | | ADDITIONAL DISCLOSURES ABOUT DERIVATIVE INSTRUMENTS |
The Funds follow authoritative standards of accounting for derivative instruments which establish disclosure requirements for derivative instruments. These standards improve financial reporting for derivative instruments by requiring enhanced disclosures that enable investors to understand how and why a fund uses derivatives instruments, how derivatives instruments are accounted for and how derivative instruments affect a fund’s financial position and results of operations.
The Funds use derivative instruments as part of their principal investment strategy to achieve their investment objectives of calendar month leveraged investment results of each Fund’s respective index. For additional discussion on the risks associated with derivative instruments refer to Note 2. As of April 30, 2012, the Funds were invested in equity swap contracts.
At April 30, 2012, the fair value of derivatives instruments were as follows:
| | | | | | |
| Asset derivatives1 | |
| | | | | Equity risk | |
Direxion Monthly S&P 500 Bull 2X Fund | | Swap contracts | | $ | 462,289 | |
Direxion Monthly Latin America Bull 2X Fund | | Swap contracts | | $ | 6,007 | |
| 1 | Statement of Assets and Liabilities location: Unrealized appreciation on swaps. |
| | |
| |
| DIREXION ANNUAL REPORT | | 27 |
| | | | | | |
| Liability derivatives1 | |
| | | | | Equity risk | |
Direxion Monthly NASDAQ-100 Bull 2X Fund | | Swap contracts | | $ | 283,268 | |
Direxion Monthly S&P 500 Bear 2X Fund | | Swap contracts | | $ | 72,984 | |
Direxion Monthly Latin America Bull 2X Fund | | Swap contracts | | $ | 5,485,648 | |
| 1 | Statement of Assets and Liabilities location: Unrealized depreciation on swaps. |
Transactions in derivative instruments during the year ended April 30, 2012, were as follows:
| | | | | | |
| | | | | Equity risk | |
Direxion Monthly NASDAQ-100 Bull 2X Fund | | Realized gain (loss)1 | | | | |
| | Swap contracts | | $ | 3,089,029 | |
| | Change in unrealized appreciation (depreciation)2 | | | | |
| | Swap contracts | | $ | (907,925 | ) |
Direxion Monthly S&P 500 Bull 2X Fund | | Realized gain (loss)1 | | | | |
| | Swap contracts | | $ | (564,412 | ) |
| | Change in unrealized appreciation (depreciation)2 | | | | |
| | Swap contracts | | $ | 232,912 | |
Direxion Monthly S&P 500 Bear 2X Fund | | Realized gain (loss)1 | | | | |
| | Swap contracts | | $ | (8,003,534 | ) |
| | Change in unrealized appreciation (depreciation)2 | | | | |
| | Swap contracts | | $ | 605,172 | |
Direxion Monthly Latin America Bull 2X Fund | | Realized gain (loss)1 | | | | |
| | Swap contracts | | $ | (14,849,182 | ) |
| | Change in unrealized appreciation (depreciation)2 | | | | |
| | Swap contracts | | $ | (6,705,157 | ) |
| 1 | Statement of Operations location: Net realized gain (loss) on swaps. |
| 2 | Statement of Operations location: Change in unrealized appreciation (depreciation) on swaps. |
For the year ended April 30, 2012, the volume of the derivatives held by the Funds was as follows:
| | | | | | | | |
| | | Long Equity Swaps
Contracts | | | Short Equity Swaps
Contracts | |
Direxion Monthly NASDAQ-100 Bull 2X Fund | | $ | 39,000,383 | | | $ | — | |
Direxion Monthly S&P 500 Bull 2X Fund | | | 36,215,286 | | | | — | |
Direxion Monthly S&P 500 Bear 2X Fund | | | — | | | | 29,406,546 | |
Direxion Monthly Latin America Bull 2X Fund | | | 97,360,943 | | | | — | |
The Funds utilize this volume of derivatives in order to obtain leverage in order to meet the investment objectives of 200% (or -200%) calendar month performance of their respective index.
| 7. | | NEW ACCOUNTING PRONOUNCEMENT |
In April 2011, FASB issued an update intended to improve the accounting for repurchase and other similar agreements. Specifically, the update modifies the criteria for determining when these agreements would be accounted for as financing transactions (secured borrowings/lending agreements) as opposed to sale (purchase) transactions with commitments to repurchase (resell). This update is effective for interim and annual reporting periods beginning after December 15, 2011. At this time, management is evaluating the implications of this guidance and the impact it will have to the financial statements or footnote disclosures, if any.
In May 2011, FASB issued an update to improve the comparability of fair value measurements presented and disclosed in financial statements prepared in accordance with GAAP and International Financial Reporting Standards. This update will require reporting entities to discloses the following information for fair value measurements categorized within Level 3 of
| | |
| | |
| 28 | | DIREXION ANNUAL REPORT |
the fair value hierarchy: quantitative information about unobservable inputs used in the fair value measurement, the valuation processes used by the reporting entity and a narrative description of the sensitivity of the fair value measurement to changes in unobservable inputs and the interrelationships between those unobservable inputs. In addition, the update will require reporting entities to make disclosure about amounts and reason for all transfers in and out of Level 1 and Level 2 fair value measurements. The new and revised disclosures are effective for interim and annual reporting periods beginning after December 15, 2011. At this time, management is evaluating the implications of this update and the impact it will have to the financial statements or footnote disclosures, if any.
The Funds follow authoritative standards for accounting for and disclosure of events that occur after the balance sheet date but before financial statements are issued or are available to be issued. These standards require the Funds to recognize in the financial statements the effects of all recognized subsequent events that provide additional evidence about conditions that existed at the date of the balance sheet. For nonrecognized subsequent events that must be disclosed to keep the financial statements from being misleading, the Funds are required to disclose the nature of the event as well as an estimate of its financial effect, or a statement that such an estimate cannot be made. The Funds have evaluated subsequent events through the issuance of the Funds’ financial statements and have determined there is no impact to the Funds’ financial statements.
The Board of Trustees of the Funds, per Management’s recommendation, approved a change to the reporting period of the Funds. Effective May 1, 2012, the Funds’ fiscal year end became August 31.
| | |
| |
| DIREXION ANNUAL REPORT | | 29 |
DIREXION FUNDS
REPORTOF INDEPENDENT REGISTERED PUBLIC ACCOUNTING FIRM
To the Board of Trustees and Shareholders of Direxion Funds:
We have audited the accompanying statements of assets and liabilities of Direxion Monthly NASDAQ-100 Bull 2X Fund, Direxion Monthly S&P 500 Bull 2X Fund, Direxion Monthly S&P 500 Bear 2X Fund, and Direxion Monthly Latin America Bull 2X Fund, (four of the series of the Direxion Funds) (the “Funds”), including the schedules of investments, as of April 30, 2012, and the related statements of operations, the statements of changes in net assets for each of the two years in the period then ended, and the financial highlights for each of the five years in the period then ended. These financial statements and financial highlights are the responsibility of the Funds’ management. Our responsibility is to express an opinion on these financial statements and financial highlights based on our audits.
We conducted our audits in accordance with the standards of the Public Company Accounting Oversight Board (United States). Those standards require that we plan and perform the audit to obtain reasonable assurance about whether the financial statements and financial highlights are free of material misstatement. We were not engaged to perform an audit of the Funds’ internal control over financial reporting. Our audits included consideration of internal control over financial reporting as a basis for designing audit procedures that are appropriate in the circumstances, but not for the purpose of expressing an opinion on the effectiveness of the Funds’ internal control over financial reporting. Accordingly, we express no such opinion. An audit also includes examining, on a test basis, evidence supporting the amounts and disclosures in the financial statements and financial highlights, assessing the accounting principles used and significant estimates made by management, and evaluating the overall financial statement presentation. Our procedures included confirmation of securities owned as of April 30, 2012, by correspondence with the custodian and brokers. We believe that our audits provide a reasonable basis for our opinion.
In our opinion, the financial statements and financial highlights referred to above present fairly, in all material respects, the financial position of the above-mentioned four of the series of Direxion Funds at April 30, 2012, the results of their operations, the changes in their net assets for each of the two years in the period then ended, and the financial highlights for each of the five years in the period then ended, in conformity with U.S. generally accepted accounting principles.

June 21, 2012
New York, New York
| | |
| | |
| 30 | | DIREXION ANNUAL REPORT |
ADDITIONAL INFORMATION
For the year ended April 30, 2012, certain dividends paid by the Funds may be subject to a maximum rate of 15%, as provided for by the Jobs and Growth Tax Relief Reconciliation Act of 2003. The amount of dividends declared from ordinary income designated as qualified income was 0% for the Direxion Monthly S&P 500 Bull 2X Fund.
For corporate shareholders, the amount of ordinary income distributions qualifying for the corporate dividends received deduction for the year ended April 30, 2012 was 0% for the Direxion Monthly S&P 500 Bull 2X Fund.
HOUSEHOLDING
In an effort to decrease costs, the Funds intend to reduce the number of duplicate prospectuses, Annual and Semi-Annual Reports, proxy statements and other similar documents you receive by sending only one copy of each to those addresses shared by two or more accounts and to shareholders we reasonably believe are from the same family or household. Householding begins once you have signed your account application. After such time, if you would like to discontinue householding for your accounts, please call toll-free at (800) 851-0511 to request individual copies of these documents. Once the Funds receive notice to stop householding, we will begin sending individual copies thirty days after receiving your request. This policy does not apply to account statements.
| | |
| |
| DIREXION ANNUAL REPORT | | 31 |
Direxion Funds
TRUSTEES AND OFFICERS
The business affairs of the Funds are managed by or under the direction of the Board of Trustees. Information pertaining to the Trustees and Officers of the Funds is set below. The SAI includes additional information about the Funds’ Trustees and Officers and is available without charge, upon request by calling 1-800-851-0511.
| | | | | | | | | | |
|
|
Interested Trustees |
Name, Address and Age | | Position(s)
Held with
Fund | | Term of Office
and Length of
Time Served | | Principal Occupation(s)
During Past Five Years | | # of Portfolios
in Direxion
Family of
Investment
Companies
Overseen by
Trustee(2) | | Other Trusteeships/
Directorships Held
by Trustee |
Lawrence C. Rafferty(1)
Age: 69 | | Chairman of the Board of Trustees | | Lifetime of Trust until removal or resignation; Since 1997 | | Chairman and Chief Executive Officer of Rafferty, 1997-present; Chief Executive Officer of Rafferty Companies, LLC, 1996-present; Chief Executive Officer of Rafferty Capital Markets, Inc., 1995-present. | | 25 | | Board of Trustees, Fairfield University; Board of Directors, St. Vincent’s Services; Executive Committee, Metropolitan Golf Association |
|
|
Non-Interested Trustees |
Name, Address and Age | | Position(s)
Held with
Fund | | Term of Office
and Length of
Time Served | | Principal Occupation(s)
During Past Five Years | | # of Portfolios
in Direxion
Family of
Investment
Companies
Overseen by
Trustee(2) | | Other Trusteeships/
Directorships Held
by Trustee |
Daniel J. Byrne
Age: 68 | | Trustee | | Lifetime of Trust until removal or resignation; Since 1997 | | President and Chief Executive Officer of Byrne Securities Florida Inc. (formerly, Byrne Securities Inc.), 1992-present. | | 159 | | None. |
|
Gerald E. Shanley III
Age: 68 | | Trustee | | Lifetime of Trust until removal or resignation; Since 1997 | | Retired, Since 2002; Business Consultant, 1985-present; Trustee of Trust Under Will of Charles S. Payson, 1987-present; C.P.A., 1979-present. | | 159 | | None. |
|
John Weisser
Age: 70 | | Trustee | | Lifetime of Trust until removal or resignation; Since 2007 | | Retired, Since 1995; Salomon Brothers, Inc, 1971-1995, most recently as Managing Director. | | 159 | | Director, MainStay VP Fund Series, The MainStay Funds, The MainStay Funds Trust; Director ICAP Funds, Inc; Director, Eclipse Funds, Inc., Eclipse Funds; (66 Funds Total) |
|
| (1) | | Mr. Rafferty is affiliated with Rafferty. Mr. Rafferty is the Chairman and Chief Executive Officer of Rafferty and owns a beneficial interest in Rafferty. |
| (2) | | The Direxion Family of Investment Companies consists of the Direxion Funds which currently offers for sale to the public 24 portfolios, the Direxion Insurance Trust which currently offers for sale 1 portfolio and the Direxion Shares ETF Trust which currently offers for sale to the public 56 of the 134 funds currently registered with the SEC. |
| | |
| | |
| 32 | | DIREXION ANNUAL REPORT |
Direxion Funds
TRUSTEES AND OFFICERS
Principal Officers of the Trust
The officers of the Trust conduct and supervise its daily business. Unless otherwise noted, an individual’s business address is 1301 Avenue of the Americas, 35th Floor, New York, New York 10019. As of the date of this report, the officers of the Trust, their ages, their business address and their principal occupations during the past five years are as follows:
| | | | | | | | | | |
Name, Address and Age | | Position(s)
Held with
Fund | | Term of Office
and Length of
Time Served | | Principal Occupation(s)
During Past Five Years | | # of Portfolios
in the Direxion
Family of
Investment
Companies
Overseen by
Trustee(2) | | Other Trusteeships/
Directorships Held
by Trustee |
Daniel D. O’Neill(1)
Age: 44 | | President; Chief Operating Officer and Chief Investment Officer | | One Year; Since 1999 One Year; Since 2006 | | Managing Director of Rafferty, 1999-present. | | 134 | | N/A |
|
Christopher Lewis
Age: 41 | | Chief Compliance Officer | | One Year; Since 2009 | | Director, Alaric Compliance Services, LLC, 2009– present; Partner, Thacher Proffitt & Wood LLP, 2004-2008; Partner, Simmons & Simmons, 2002-2004. | | N/A | | N/A |
|
Patrick J. Rudnick
777 East
Wisconsin Avenue Milwaukee, WI 53202
Age: 38 | |
Principal Financial Officer and Treasurer | |
One Year; Since 2010 | |
Vice President, U.S. Bancorp Fund Services, LLC, since 2006; formerly, Manager, PricewaterhouseCoopers LLP (1999-2006). | |
N/A | |
N/A |
|
Angela Brickl
Age: 36 | | Secretary3 | | One Year; Since 2011 | | Vice President, Rafferty Asset Management, LLC, since October 2010; Summer Associate at Skadden, Arps, Slate, Meagher & Flom, LLP, May – August 2009; Summer Associate at Foley & Lardner, LLP, May – August 2008; Vice President, U.S. Bancorp Fund Services, LLC, November 2003 – August 2007. | | N/A | | N/A |
|
| (1) | | Mr. O’Neill serves as Chairman of the Board of Trustees of the Direxion Shares ETF Trust. |
| (2) | | The Direxion Family of Investment Companies consists of the Direxion Funds which currently offers for sale to the public 24 portfolios, the Direxion Insurance Trust which currently offers for sale 1 portfolio and the Direxion Shares ETF Trust which currently offers for sale to the public 56 of the 134 funds currently registered with the SEC. |
| (3) | | Ms. Brickl replaced Eric W. Falkeis as Secretary effective August 17, 2011. |
| | |
| |
| DIREXION ANNUAL REPORT | | 33 |
THIS PAGE INTENTIONALLY LEFT BLANK
THIS PAGE INTENTIONALLY LEFT BLANK
THIS PAGE INTENTIONALLY LEFT BLANK
PRIVACY NOTICE
At the Direxion Funds, we are committed to protecting your privacy. To open and service your Direxion accounts, we collect and maintain certain nonpublic personal information about you, such as your address, phone number, social security number, purchases, sales, account balances, bank account information and other personal financial information. We collect this information from the following sources:
| | • | | Account applications or other forms on which you provide information, |
| | • | | Mail, e-mail, the telephone and our website, and |
| | • | | Your transactions and account inquiries with us. |
We safeguard the personal information that you have entrusted to us in the following ways:
| | • | | As a general policy, only those employees who maintain your account and respond to your requests for additional services have access to your account information. |
| | • | | We maintain physical, electronic, and procedural safeguards to insure the security of your personal information and to prevent unauthorized access to your information. |
We do not disclose any nonpublic personal information about you or our former shareholders to anyone, except as permitted or required by law. In the course of conducting business and maintaining your account we may share shareholder information, as allowed by law, with our affiliated companies and with other service providers, including financial intermediaries, custodians, transfer agents and marketing consultants. Those companies are contractually bound to use that information only for the services for which we hired them. They are not permitted to use or share our shareholders’ nonpublic personal information for any other purpose. There also may be times when we provide information to federal, state or local authorities as required by law.
In the event that you hold fund shares of Direxion through a financial intermediary, including, but not limited to, a broker-dealer, bank, or trust company, the privacy policy of your financial intermediary would govern how your nonpublic personal information would be shared with nonaffiliated third parties.
For questions about our policy, please contact us at (800) 851-0511.
This page is not a part of the annual report.
ANNUAL REPORT APRIL 30, 2012
1301 Avenue of the Americas (6th Ave.), 35th Floor New York, New York 10019
(800) 851-0511 www.direxionfunds.com
Investment Adviser
Rafferty Asset Management, LLC
1301 Avenue of the Americas (6th Ave.), 35th Floor
New York, NY 10019
Administrator, Transfer Agent, Dividend Paying Agent & Shareholding Servicing Agent
U.S. Bancorp Fund Services, LLC
P.O. Box 1993
Milwaukee, WI 53201-1993
Custodian
U.S. Bank, N.A.
1555 RiverCenter Dr., Suite 302
Milwaukee, WI 53212
Independent Registered Public Accounting Firm
Ernst & Young LLP
5 Times Square
New York, NY 10036
Distributor
Rafferty Capital Markets, LLC
1010 Franklin Avenue, 3rd Floor
Garden City, NY 11530
The Fund’s Proxy Voting Policies are available without charge by calling 1-800-851-0511, or by accessing the SEC’s website, at www.sec.gov.
The actual voting records relating to portfolio securities during the most recent period ended June 30 (starting with the year ended June 30, 2005) is available without charge by calling 1-800-851-0511 or by accessing the SEC’s website at www.sec.gov.
The Fund files complete schedules of portfolio holdings with the SEC on Form N-Q. The Form N-Q is available without change, upon request, by calling 1-800-851-0511, or by accessing the SEC’s website, at www.sec.gov.
This report has been prepared for shareholders and may be distributed to others only if preceded or accompanied by a current prospectus.
Item 2. Code of Ethics.
The registrant has adopted a code of ethics that applies to the registrant’s principal executive officer and principal financial officer. The registrant has not made any amendments to its code of ethics during the period covered by this report. The registrant has not granted any waivers from any provisions of the code of ethics during the period covered by this report. A copy of the registrant’s Code of Ethics is filed herewith.
Item 3. Audit Committee Financial Expert.
The registrant’s board of trustees has determined that there is at least one audit committee financial expert serving on its audit committee. Gerald E. Shanley III is the “audit committee financial expert” and is considered to be “independent” as each term is defined in Item 3 of Form N-CSR.
Item 4. Principal Accountant Fees and Services.
The registrant has engaged its principal accountant to perform audit services, audit-related services, tax services and other services during the past fiscal year. “Audit services” refer to performing an audit of the registrant’s annual financial statements or services that are normally provided by the accountant in connection with statutory and regulatory filings or engagements for the fiscal year. “Audit-related services” refer to the assurance and related services by the principal accountant that are reasonably related to the performance of the audit. “Tax services” refer to professional services rendered by the principal accountant for tax compliance, tax advice, and tax planning, including assessment of FIN 48 for the Funds and additional tax research. There were no “Other services” provided by the principal accountant. The following table details the aggregate fees billed or expected to be billed for each of the last fiscal year for audit fees, audit-related fees, tax fees and other fees by the principal accountant. The table presents aggregate fees billed to the registrant and reflected in the financial statements of the report to shareholders.
| | | | | | | | |
| | | FYE 4/30/12 | | | FYE 4/30/11 | |
Audit Fees | | $ | 87,200 | | | $ | 152,600 | |
Audit-Related Fees | | | — | | | | — | |
Tax Fees | | $ | 35,000 | | | $ | 35,000 | |
All Other Fees | | | — | | | | — | |
The audit committee has adopted pre-approval policies and procedures that require the audit committee to pre-approve all audit and non-audit services of the registrant, including services provided to any entity affiliated with the registrant.
The percentages of fees billed by Ernst & Young LLP applicable to non-audit services pursuant to waiver of pre-approval requirement were as follows:
| | | | | | | | |
| | | FYE 4/30/12 | | | FYE 4/30/11 | |
Audit-Related Fees | | | 0 | % | | | 0 | % |
Tax Fees | | | 0 | % | | | 0 | % |
All Other Fees | | | 0 | % | | | 0 | % |
All of the principal accountant’s hours spent on auditing the registrant’s financial statements were attributed to work performed by full-time permanent employees of the principal accountant. (If more than 50 percent of the accountant’s hours were spent to audit the registrant’s financial statements for the fiscal year, state how many hours were attributed to work performed by persons other than the principal accountant’s full-time, permanent employees.)
The following table indicates the non-audit fees billed or expected to be billed by the registrant’s accountant for services to the registrant and to the registrant’s investment adviser (and any other controlling entity, etc.—not sub-adviser) for the last year. The audit committee of the board of trustees has considered whether the provision of non-audit services that were rendered to the registrant’s investment adviser is compatible with maintaining the principal accountant’s independence and has concluded that the provision of such non-audit services by the accountant has not compromised the accountant’s independence.
| | | | | | | | |
Non-Audit Related Fees | | FYE 4/30/12 | | | FYE 4/30/11 | |
Registrant | | | None | | | | None | |
Registrant’s Investment Adviser | | | None | | | | None | |
Item 5. Audit Committee of Listed Registrants.
Not applicable to registrants who are not listed issuers (as defined in Rule 10A-3 under the Securities Exchange Act of 1934).
Item 6. Schedule of Investments.
Schedule of Investments is included as part of the report to shareholders filed under Item 1 of this Form.
Item 7. Disclosure of Proxy Voting Policies and Procedures for Closed-End Management Investment Companies.
Not applicable to open-end investment companies.
Item 8. Portfolio Managers of Closed-End Management Investment Companies.
Not applicable to open-end investment companies.
Item 9. Purchases of Equity Securities by Closed-End Management Investment Company and Affiliated Purchasers.
Not applicable to open-end investment companies.
Item 10. Submission of Matters to a Vote of Security Holders.
There have been no material changes to the procedures by which shareholders may recommend nominees to the registrant’s board of directors/trustees.
Item 11. Controls and Procedures.
| (a) | The Registrant’s President and Principal Financial Officer have reviewed the Registrant’s disclosure controls and procedures (as defined in Rule 30a-3(c) under the Investment Company Act of 1940 (the “Act”)) as of a date within 90 days of the filing of this report, as required by Rule 30a-3(b) under the Act and Rules 13a-15(b) or 15d-15(b) under the Securities Exchange Act of 1934. Based on their review, such officers have concluded that the disclosure controls and procedures are effective in ensuring that information required to be disclosed in this report is appropriately recorded, processed, summarized and reported and made known to them by others within the Registrant and by the Registrant’s service provider. |
| (b) | There were no changes in the Registrant’s internal control over financial reporting (as defined in Rule 30a-3(d) under the Act) that occurred during the second fiscal quarter of the period covered by this report that has materially affected, or is reasonably likely to materially affect, the Registrant’s internal control over financial reporting. |
Item 12. Exhibits.
| (a) | (1) Any code of ethics or amendment thereto, that is subject of the disclosure required by Item 2, to the extent that the registrant intends to satisfy Item 2 requirements through filing an exhibit. Filed herewith. |
(2) Certifications pursuant to Section 302 of the Sarbanes-Oxley Act of 2002. Filed herewith.
(3) Any written solicitation to purchase securities under Rule 23c-1 under the Act sent or given during the period covered by the report by or on behalf of the registrant to 10 or more persons. Not applicable to open-end investment companies.
| (b) | Certification pursuant to Section 906 of the Sarbanes-Oxley Act of 2002. Furnished herewith. |
SIGNATURES
Pursuant to the requirements of the Securities Exchange Act of 1934 and the Investment Company Act of 1940, the registrant has duly caused this report to be signed on its behalf by the undersigned, thereunto duly authorized.
| | |
(Registrant) Direxion Funds |
| |
By (Signature and Title)* | | /s/ Daniel D. O’Neill |
| | Daniel D. O’Neill, President |
Date June 27, 2012
Pursuant to the requirements of the Securities Exchange Act of 1934 and the Investment Company Act of 1940, this report has been signed below by the following persons on behalf of the registrant and in the capacities and on the dates indicated.
| | |
| |
By (Signature and Title)* | | /s/ Daniel D. O’Neill |
| | Daniel D. O’Neill, President |
Date June 27, 2012
| | |
| |
By (Signature and Title)* | | /s/ Patrick J. Rudnick |
| | Patrick J. Rudnick, Principal Financial Officer |
Date June 27, 2012
| * | Print the name and title of each signing officer under his or her signature. |