Table of Contents
UNITED STATES
SECURITIES AND EXCHANGE COMMISSION
WASHINGTON, D.C. 20549
FORM N-CSR
CERTIFIED SHAREHOLDER REPORT OF REGISTERED
MANAGEMENT INVESTMENT COMPANIES
811-08411
(Investment Company Act file number)
James Advantage Funds
(Exact name of registrant as specified in charter)
1349 Fairground Road
Xenia, Ohio 45385
(Address of principal executive offices) (Zip code)
Barry R. James
P.O. Box 8
Alpha, Ohio 45301
(Name and address of agent for service)
Registrant’s telephone number, including area code: (937) 426-7640
Date of fiscal year end: June 30
Date of reporting period: July 1, 2011 – December 31, 2011
Table of Contents
Item 1. Reports to Stockholders.
Table of Contents


James Balanced: Golden Rainbow Fund
James Small Cap Fund
James Mid Cap Fund
James Micro Cap Fund
James Long-Short Fund
Table of Contents
| 1 | ||||
| 3 | ||||
| 6 | ||||
| 7 | ||||
Schedule of Investments | ||||
| 8 | ||||
| 15 | ||||
| 18 | ||||
| 20 | ||||
| 22 | ||||
| 24 | ||||
| 26 | ||||
| 27 | ||||
Financial Highlights | ||||
| 33 | ||||
| 34 | ||||
| 35 | ||||
| 36 | ||||
| 37 | ||||
| 38 | ||||
| 39 | ||||
| 45 | ||||
Table of Contents
James Advantage Funds | Shareholder Letter | |
| December 31, 2011 (Unaudited) |
LETTER TO THE SHAREHOLDERS OF THE JAMES ADVANTAGE FUND
2011 was an extremely volatile year dominated by a weak U.S. economy showing scant signs of a recovery and looming disaster in Europe as Greece and other debt-laden countries struggled to stave off default. The S&P 500 eked out a paltry 2.11 percent gain, while the small cap Index, the Russell 2000, lost 4.18 percent on the year. However, the markets were anything but placid despite the somnolent returns. The market rallied early in the year; for the first four months of 2011 the S&P enjoyed a total return of over 9 percent and the Russell 2000 gained 10.78 percent. Then, the ensuing sell-off ran through September, one of the worst months on record for stocks; the S&P 500 lost over 16 percent and the Russell 2000 lost over 25 percent. Fortunately a strong fourth quarter pushed prices up about 11.80 percent on the S&P and 15 percent on the Russell 2000. All of this, just to close about where we started the year!
The Funds maintained their strategies through these tumultuous periods. The retail shares of the Golden Rainbow rose 4.77 percent for the year and the Institutional shares advanced by 5.02 percent. The Small Cap Fund posted a striking 10.43 percent gain and achieved wide recognition. The James Mid Cap Fund posted a loss of 2.15 percent and the Micro Cap Fund lost 6.57 percent. Both of those performances were better than the Funds’ benchmarks, which were down 2.43 percent and 9.27 percent respectively. The Long Short Fund was not in operation for the full year.
The Markets Over the Past Six Months
Over the last six months of 2011, the S&P 500 fell 3.69 percent, the Russell 2000 dropped by 9.77 percent, the Russell Micro Cap Index lost 11.99 percent and the Mid Cap S&P 400 shed 8.40 percent. Bonds fared better; the Barclays Intermediate Government/Credit Index rose 3.25%.
The U.S. dollar was equally volatile. Over the last six months of 2011 it rose 10.62 percent versus the euro and 5.02 percent versus the Australian dollar. The Japanese yen did rise versus the U.S. dollar by 4.75 percent, as Japan repatriated currency to help rebuild following the earthquake and tsunami in March.
Given heavy exports to the European Union from the United States, as well as China and most other major economies, events in Europe should have a major impact on other economies. Bumping from one crisis to another in Europe was a major cause of the volatility in global stock, bond and currency markets.
Investment Goals and Objectives
Preservation of capital and income are the two primary objectives of The James Balanced: Golden Rainbow Fund. The Fund’s investments in municipal bonds and longer term U.S. Treasury Bonds helped to meet both of those objectives in 2011. The Fund’s management is pleased that, even with interest rates at historic lows, the Golden Rainbow paid out a dividend every quarter, and supplemented income needs of shareholders with a capital gains dividend in December.
The James Small Cap Fund, the Mid Cap Fund, the Long-Short Fund and the Micro Cap Fund seek long term capital appreciation as their primary objective. These funds look for stocks the adviser believes to be undervalued, using its proprietary research to glean through a database of over 8,500 stocks. While each Fund is looking in a different segment of the stock market, and the Long-Short Fund employs a short-selling strategy at times, the basic research is the same. The adviser prides itself on its own research and does not buy outside research. These funds do not seek to pay dividends, but will distribute net income when it is earned through dividends or other sources.
Investment Philosophy
Since 1972, James Investment Research, Inc., adviser to the James Advantage Funds, has embraced conservative principles of investing. Experience has taught us that stocks with strong earnings growth, low valuations and relative strength are more likely to outperform the broad stock market over time, and we have found that preserving capital in down markets is very important in achieving long term growth. Our independent research is generally free of Wall Street hype and allows us to take a different path. We have found this to be very helpful where preservation of capital is a major goal, and also in avoiding economic sectors and industries at the center of a financial crisis.
Strategy for Meeting Fund Objectives
When the Adviser’s risk research indicates that the risk in the stock market is low and that opportunities for stocks to move higher are great, the Fund’s portfolio managers will increase the allocation to common stocks in the James Balanced: Golden Rainbow Fund. Of course, a balanced fund will always hold both bonds and stocks, and the Golden Rainbow normally will not fall below 25% in its allocation to either stocks or bonds. We are pleased that our research correctly predicted a rally in long term U.S. Treasury bonds in 2011, just as many other fund managers were predicting quite the opposite. The adviser to the Fund prepared a special study with that prediction, which is available on the James Advantage Fund website, along with the other special studies from the adviser.
Past performance does not guarantee future results. The performance data quoted represents past performance and current returns may be lower or higher. The investment return and principal value will fluctuate so that an investor’s shares, when redeemed, may be worth more or less than the original cost. These performance figures do not reflect the deduction of taxes that a shareholder would pay on fund distributions or the redemption of Fund shares. Please call 1-800-995-2637 for most recent month-end performance information.
Semi-Annual Report | December 31, 2011 | 1 |
Table of Contents
Shareholder Letter | James Advantage Funds | |
| December 31, 2011 (Unaudited) |
The Small Cap Fund, the Mid Cap Fund, the Micro Cap Fund and the Long-Short Fund use the same proprietary research, but concentrate on separate strategies that include market capitalization niches for the first three funds and a 130-30 strategy for the Long-Short Fund (described below). The Adviser’s Research staff is actively working on ranking stocks and on top-down analysis designed to gauge the direction of the U.S. economy as well as the global economy. The Adviser often identifies the risk levels in the broad stock market through its research, which then helps Fund managers adjust the Fund holdings accordingly. If the research points towards a decline in economic activity and in stock prices, all the funds will prefer defensive stocks, such as utilities, health care and non-cyclicals, while still retaining the Adviser’s strategy of seeking out bargain stocks. In addition, the Golden Rainbow Fund will increase its holdings in bonds and reduce exposure to common equities. Stocks the Adviser considers to be bargains generally have low value ratios, such as price earnings and price to cash, but also generally have strong earnings and relative strength. The Adviser has found this strategy to be very useful over the long run.
All of the Funds in the James Advantage Funds family employ a disciplined SELL strategy, eliminating securities that lose their value traits or otherwise fall out of favor due to macro-economic changes, management changes or similar events. The Adviser’s staff regularly monitors all of the Fund’s holdings and employs multiple screens to detect changes in a company profile. Still, as you will see in the Financial Highlights report, the Funds’ turnover ratios are low by most industry standards.
Fund Performance
Over the last six months of 2011 all of the James Advantage Funds, with the exception of the new Long-Short Fund, outperformed their indexes across the board: the retail shares of the Golden Rainbow Fund rose 1.23 percent and the Institutional shares rose 1.36 percent. The Fund’s blended index is 25% S&P 500, 25% Russell 2000 and 50% Barclays Intermediate Gov/Credit Index, which returned a negative 1.47 percent, while the S&P 500 returned a negative 3.69 percent. The Small Cap Fund lost 1.69 percent, but the Russell 2000 dropped 9.77 percent. The James Mid Cap Fund lost 7.65 percent, but the S&P 400, the Mid Cap benchmark Index, lost 8.40 percent, and the Micro Cap Fund lost 9.08 percent while its benchmark, the Russell Micro Cap Index, lost 11.99 percent. The excess performance by the Golden Rainbow Fund was due to an allocation to long term Treasury Bonds and the strong success of the firm’s proprietary stock research , which produced superior stock selection strategies over the time period. The stock research process was also a major factor in the excess returns of the other Funds.
The James Long-Short Fund is our newest addition to the James Advantage Fund family. The James Long-Short Fund commenced operations in May 2011 and is still a relatively small fund in terms of net assets. The Fund was brought out by the Adviser in May and uses a strategy sometimes known as a 130-30 strategy where it can borrow money to be leveraged when very bullish and it can also borrow stocks to sell short when the Fund managers believe the stock market will retreat. The Fund may also invest in bonds and can even sell bonds short. Clearly this is a much more aggressive strategy than the Balanced: Golden Rainbow Fund and investors should carefully consider the additional risks.
Expectations for the Future
2012 will see more volatility, focused on a subdued U.S. economy and a recession in Europe. The latter may weigh heavily on the US economy if problems in Greece continue to grow and then spill over into Italy and other larger, more important economies. Stocks are not cheap, but bullish investors appear to be underinvested in stocks and overinvested in bonds. We intend to be active this year – this is probably not a good time to embrace a long term buy and hold strategy. However, we believe there will be good opportunities to make money on bonds and on stocks.
Thomas L. Mangan
Chief Financial Officer
The statements and opinions expressed are those of the author and are as of the date of this report. All information is historical and not indicative of future results and subject to change. It should not be assumed that an investment in the securities mentioned will be profitable in the future. This information is not a recommendation to buy or sell.
You should carefully consider the investment objectives, potential risks, management fees, and charges and expenses of the Fund before investing.
The Fund’s prospectus contains this and other information about the Fund, and should be read carefully before investing. You may obtain a current copy of the Fund’s prospectus by calling 1-800-995-2637.
Past performance is no guarantee of future results. The investment return and principal value of an investment in the Fund will fluctuate so that an investor’s shares, when redeemed, may be worth more or less than their original cost.
| 2 | www.jamesfunds.com |
Table of Contents
James Advantage Funds | Growth of $10,000 Charts | |
| December 31, 2011 (Unaudited) |
Comparison of the Change in Value of a $10,000 Investment in the James Balanced: Golden Rainbow Fund – Retail Class
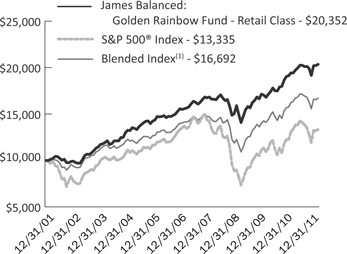
James Balanced: Golden Rainbow Fund, S&P 500® Index and Blended Index Average Annual Total Returns
| 1 Year | 5 Years | 10 Years | Since Inception(2) | |||||||||||
James Balanced: Golden Rainbow – Retail Class | 4.77 | % | 5.61 | % | 7.36 | % | 8.24% | |||||||
S&P 500® Index | 2.11 | % | -0.25 | % | 2.92 | % | 8.22% | |||||||
Russell 2000® Index | -4.18 | % | 0.15 | % | 5.62 | % | 9.00% | |||||||
Barclays Capital Intermediate Government/Credit Index | 5.80 | % | 5.88 | % | 5.20 | % | 6.34% | |||||||
Blended Index(1) | 2.80 | % | 3.54 | % | 5.26 | % | 7.94% | |||||||
James Balanced: Golden Rainbow - Institutional Class | 5.02 | % | N/A | N/A | 15.05% | |||||||||
S&P500® Index | 2.11 | % | N/A | N/A | 25.54% | |||||||||
Russell 2000® Index | -4.18 | % | N/A | N/A | 29.81% | |||||||||
Barclays Capital Intermediate Government/Credit Index | 5.80 | % | N/A | N/A | 6.19% | |||||||||
Blended Index(1) | 2.80 | % | N/A | N/A | 17.17% | |||||||||
| (1) | The Blended Index is comprised of a 25% weighting in the S&P 500® Index, a 25% weighting in the Russell 2000® Index and a 50% weighting in the Barclays Capital Intermediate Government/Credit Index. |
| (2) | Retail Class inception was July 1, 1991. Institutional Class inception was March 2, 2009. |
The total annual operating expense ratio as stated in the fee table of the most recent prospectus, dated November 1, 2011, was 1.13% for the Retail Class and 0.88% for the Institutional Class. | ||||
Comparison of the Change in Value of a $10,000 Investment in the James Small Cap Fund
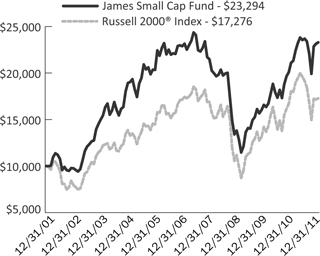
James Small Cap Fund and Russell 2000® Index Average Annual Total Returns
| 1 Year | 5 Years | 10 Years | ||||
James Small Cap Fund | 10.43% | 0.35% | 8.82% | |||
Russell 2000® Index | -4.18% | 0.15% | 5.62% |
The total annual operating expense ratio as stated in the fee table of the most recent prospectus, dated November 1, 2011, was 1.50%. |
Past performance does not guarantee future results. The performance data quoted represents past performance and current returns may be lower or higher. The investment return and principal value will fluctuate so that an investor’s shares, when redeemed, may be worth more or less than the original cost. These performance figures do not reflect the deduction of taxes that a shareholder would pay on fund distributions or the redemption of Fund shares. Please call 1-800-995-2637 for most recent month-end performance information.
Mid, Small and Micro Cap investing involve greater risk not associated with investing in more established companies, such as greater price volatility, business risk, less liquidity and increased competitive threat.
The S&P 500® Index, Russell 2000 Index, Barclay’s Capital Intermediate Government/Credit Index, S&P Mid Cap 400 Index, and Russell Micro Cap Index are widely recognized unmanaged indices of security prices and are representative of a broader market and range of securities than is found in the Fund’s portfolio. The Index returns do not reflect the deduction of expenses, which have been deducted from the Fund’s returns. The Index returns assume reinvestment of all distributions and do not reflect the deduction of taxes and fees. Individuals cannot invest directly in any Index; however, an individual can invest in exchange traded funds or other investment vehicles that attempt to track the performance of a benchmark index.
The S&P 500® Index is an unmanaged index of 500 common stocks chosen for market size, liquidity and industry group representation.
The Russell 2000® Index is a widely recognized, unmanaged index comprised of the 2,000 smallest U.S. domiciled publicly-traded common stocks of the Russell 3000 Index, which represents approximately 8% of the total market capitalization of the Russell 3000 Index, an unmanaged index of the 3,000 largest U.S. domiciled publicly-traded common stocks by market capitalization.
The Barclays Capital Intermediate Government/Credit Index measures the performance of U.S. Dollar denominated U.S. Treasuries, government related and investment grade U.S. corporate securities that have a remaining maturity of greater than one year and less than ten years.
Semi-Annual Report | December 31, 2011 | 3 |
Table of Contents
| Growth of $10,000 Charts | James Advantage Funds | |
December 31, 2011 (Unaudited) |
Comparison of the Change in Value of a $10,000 Investment in the James Mid Cap Fund
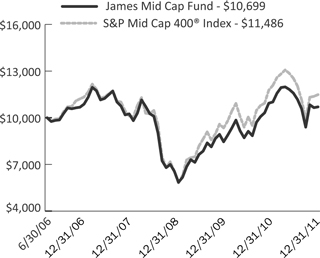
James Mid Cap Fund and S&P Mid Cap 400® Index Average Annual Total Returns
| 1 Year | 5 Year | Since Inception(1) | ||||||||||
James Mid Cap Fund | -2.15 | % | 0.23 | % | 1.24 | % | ||||||
S&P 400® Mid Cap Index | -2.43 | % | 1.38 | % | 2.55 | % | ||||||
| (1) | Fund inception was June 30, 2006. |
The total annual operating expense ratio as stated in the fee table of the most recent prospectus, dated November 1, 2011, was 1.50%. |
Comparison of the Change in Value of a $10,000 Investment in the James Micro Cap Fund
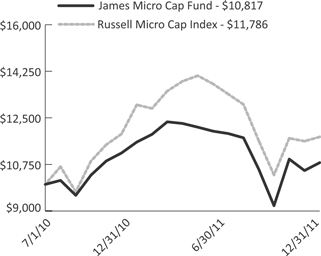
James Micro Cap Fund and Russell Micro Cap Index Average Annual Total Returns
| 1 Year | Since Inception(1) | |||||||
James Micro Cap Fund | -6.57 | % | 5.44 | % | ||||
Russell Micro Cap Index | -9.27 | % | 11.56 | % | ||||
| (1) | Fund inception was July 1, 2010. |
The total annual operating expense ratio as stated in the fee |
Past performance does not guarantee future results. The performance data quoted represents past performance and current returns may be lower or higher. The investment return and principal value will fluctuate so that an investor’s shares, when redeemed, may be worth more or less than the original cost. These performance figures do not reflect the deduction of taxes that a shareholder would pay on fund distributions or the redemption of Fund shares. Please call 1-800-995-2637 for most recent month-end performance information.
The Mid-Cap fund invests in stocks of mid-cap companies which tend to be more volatile and can be less liquid than stocks of large-cap companies. Diversification does not guarantee a profit or protect against loss. Current and future portfolio holdings are subject to risk.
Mid, Small and Micro Cap investing involve greater risk not associated with investing in more established companies, such as greater price volatility, business risk, less liquidity and increased competitive threat.
The S&P 500® Index, Russell 2000 Index, Barclay’s Capital Intermediate Government/Credit Index, S&P Mid Cap 400 Index, and Russell Micro Cap Index are widely recognized unmanaged indices of security prices and are representative of a broader market and range of securities than is found in the Fund’s portfolio. The Index returns do not reflect the deduction of expenses, which have been deducted from the Fund’s returns. The Index returns assume reinvestment of all distributions and do not reflect the deduction of taxes and fees. Individuals cannot invest directly in any Index; however, an individual can invest in exchange traded funds or other investment vehicles that attempt to track the performance of a benchmark index.
The S&P Mid Cap 400 Value is a recognized, unmanaged index of mid cap stocks considered to be Value stocks using Standard and Poor’s methodology.
The Russell Microcap Index measures the performance of the microcap segment of the U.S. equity market. It makes up less than 3% of the U.S. equity market. It includes 1000 of the smallest securities in the small-cap Russell 2000© Index based on a combination of their market cap and current index membership and it includes the next 1,000 securities.
| 4 | www.jamesfunds.com |
Table of Contents
| James Advantage Funds | Growth of $10,000 Charts | |
| December 31, 2011 (Unaudited) |
Comparison of the Change in Value of a $10,000 Investment in the James Long-Short Fund
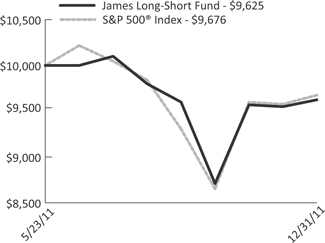
James Long-Short Fund and S&P 500® Index
Cumulative Total Returns
| Since Inception(1) | ||
James Long-Short Fund | -3.75% | |
S&P 500® Index | -3.24% |
| (1) | Fund inception was May 23, 2011. |
The total annual operating expense ratio as stated in the fee table of the most recent prospectus, dated November 1, 2011, was 1.75%. |
Past performance does not guarantee future results. The performance data quoted represents past performance and current returns may be lower or higher. The investment return and principal value will fluctuate so that an investor’s shares, when redeemed, may be worth more or less than the original cost. These performance figures do not reflect the deduction of taxes that a shareholder would pay on fund distributions or the redemption of Fund shares. Please call 1-800-995-2637 for most recent month-end performance information.
Short selling incurs significant additional risk; theoretically, stocks sold short have unlimited upside risk potential. In addition, this strategy depends on the Adviser’s ability to correctly identify undervalued and overvalued stocks, and that the stock markets are reasonable and efficient. Periods of extreme volatility may harm the performance of this product. The Long-Short Fund may have a high portfolio turnover rate. A high portfolio turnover rate can result in increased brokerage commission costs and may expose taxable shareholders to potentially larger current tax liability.
The S&P 500® Index, Russell 2000 Index, Barclay’s Capital Intermediate Government/Credit Index, S&P Mid Cap 400 Index, and Russell Micro Cap Index are widely recognized unmanaged indices of security prices and are representative of a broader market and range of securities than is found in the Fund’s portfolio. The Index returns do not reflect the deduction of expenses, which have been deducted from the Fund’s returns. The Index returns assume reinvestment of all distributions and do not reflect the deduction of taxes and fees. Individuals cannot invest directly in any Index; however, an individual can invest in exchange traded funds or other investment vehicles that attempt to track the performance of a benchmark index.
The S&P 500® Index is an unmanaged index of 500 common stocks chosen for market size, liquidity and industry group representation.
Semi-Annual Report | December 31, 2011 | 5 |
Table of Contents
| James Advantage Funds | ||
December 31, 2011 (Unaudited) |
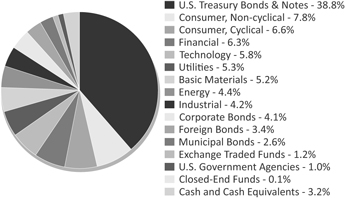
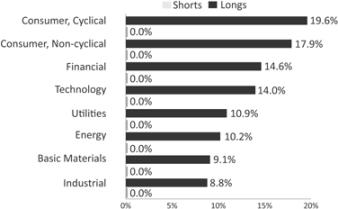
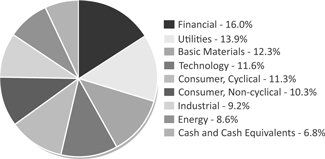
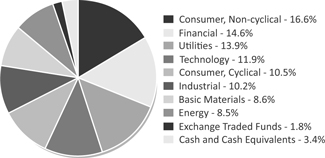
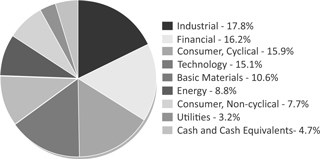
The illustrations below provide the industry sectors for the James Balanced: Golden Rainbow Fund, James Small Cap Fund, James Mid Cap Fund, James Micro Cap Fund, and James Long-Short Fund.
James Balanced: Golden Rainbow Fund - Industry Sector Allocation (% of Net Assets)
James Long-Short Fund - Industry Sector Allocation (% of Net Assets)
(Cash, Cash Equivalents and Other Assets in Excess of Liabilities not included)
James Small Cap Fund - Industry Sector Allocation
(% of Net Assets)
James Mid Cap Fund - Industry Sector Allocation
(% of Net Assets)
James Micro Cap Fund - Industry Sector Allocation
(% of Net Assets)
| 6 | www.jamesfunds.com |
Table of Contents
James Advantage Funds | Disclosure of Fund Expenses | |
| December 31, 2011 (Unaudited) |
Example. As a shareholder of a Fund, you incur two types of costs: (1) transaction costs, including reinvested dividends or other distributions, and redemption fees; and (2) ongoing costs, including management fees, distribution (12b-1) fees, and other Fund expenses. This example is intended to help you understand your ongoing costs (in dollars) of investing in the Funds and to compare these costs with the ongoing costs of investing in other mutual funds.
The example is based on an investment of $1,000 invested at the beginning of the period and held for the entire period July 1, 2011 through December 31, 2011.
Actual Expenses. The first line of the table below provides information about actual account values and actual expenses. You may use the information in this line, together with the amount you invested, to estimate the expenses that you paid over the period. Simply divide your account value by $1,000 (for example, an $8,600 account value divided by $1,000 = 8.6), then multiply the result by the number in the first line under the heading “Expense Paid During Period” to estimate the expenses you paid on your account during this period.
Hypothetical Example for Comparison Purposes. The second line of the table below provides information about hypothetical account values and hypothetical expenses based on a Fund’s actual expense ratio and an assumed rate of return of 5% per year before expenses, which is not the Fund’s actual returns. The hypothetical account values and expenses may not be used to estimate the actual ending account balance or expenses you paid for the period. You may use this information to compare the ongoing costs of investing in a Fund and other mutual funds. To do so, compare this 5% hypothetical example with the 5% hypothetical examples that appear in the shareholder reports of the other funds.
Please note that expenses shown in the table are meant to highlight and help you compare ongoing costs only. The calculations assume no shares were bought or sold during the period. Your actual costs may have been higher or lower, depending on the amount of your investment and the timing of any purchases or redemptions.
Net Expense Ratio Annualized December 31, 2011(a) | Beginning Account Value | Ending Account Value December 31, 2011 | Expense Paid During | |||||||||||||||||
James Balanced: Golden Rainbow Fund |
| |||||||||||||||||||
Retail Class Actual | 1.08 | % | $ | 1,000.00 | $ | 1,012.30 | $ | 5.46 | ||||||||||||
Retail Class Hypothetical (5% return before expenses) | 1.08 | % | $ | 1,000.00 | $ | 1,019.71 | $ | 5.48 | ||||||||||||
Institutional Class Actual | 0.83 | % | $ | 1,000.00 | $ | 1,013.60 | $ | 4.20 | ||||||||||||
Institutional Class Hypothetical (5% return before expenses) | 0.83 | % | $ | 1,000.00 | $ | 1,020.96 | $ | 4.22 | ||||||||||||
James Small Cap Fund |
| |||||||||||||||||||
Actual | 1.50 | % | $ | 1,000.00 | $ | 983.10 | $ | 7.48 | ||||||||||||
Hypothetical (5% return before expenses) | 1.50 | % | $ | 1,000.00 | $ | 1,017.60 | $ | 7.61 | ||||||||||||
James Mid Cap Fund |
| |||||||||||||||||||
Actual | 1.50 | % | $ | 1,000.00 | $ | 923.50 | $ | 7.25 | ||||||||||||
Hypothetical (5% return before expenses) | 1.50 | % | $ | 1,000.00 | $ | 1,017.60 | $ | 7.61 | ||||||||||||
James Micro Cap Fund |
| |||||||||||||||||||
Actual | 1.50 | % | $ | 1,000.00 | $ | 908.30 | $ | 7.20 | ||||||||||||
Hypothetical (5% return before expenses) | 1.50 | % | $ | 1,000.00 | $ | 1,017.60 | $ | 7.61 | ||||||||||||
James Long-Short Fund |
| |||||||||||||||||||
Actual | 1.86 | % | $ | 1,000.00 | $ | 953.00 | $ | 9.13 | ||||||||||||
Hypothetical (5% return before expenses) | 1.86 | % | $ | 1,000.00 | $ | 1,015.79 | $ | 9.42 | ||||||||||||
| (a) | Annualized, based on the Fund’s most recent fiscal half year expenses. |
| (b) | Expenses are equal to the Fund’s annualized expense ratio multiplied by the average account value over the period, multiplied by the number of days in the most recent fiscal half year (184), divided by 366. Note the expense example is typically based on a six-month period. |
Semi-Annual Report | December 31, 2011 | 7 |
Table of Contents
Schedule of Investments | James Balanced: Golden Rainbow Fund | |
December 31, 2011 (Unaudited) |
| Shares or Principal Amount | Value | |||||
COMMON STOCKS-45.6% | ||||||
| Basic Materials-5.2% | ||||||
170,000 | Barrick Gold Corp. | $7,692,500 | ||||
372,000 | Buckeye Technologies, Inc. | 12,439,680 | ||||
68,000 | Cabot Corp. | 2,185,520 | ||||
33,000 | CF Industries Holdings, Inc. | 4,784,340 | ||||
45,000 | E.I. du Pont de Nemours & Co. | 2,060,100 | ||||
40,000 | FMC Corp. | 3,441,600 | ||||
161,000 | Innophos Holdings, Inc. | 7,818,160 | ||||
70,000 | Innospec, Inc.* | 1,964,900 | ||||
12,000 | KapStone Paper and Packaging Corp.* | 188,880 | ||||
110,000 | Newmont Mining Corp. | 6,601,100 | ||||
291,040 | PolyOne Corp. | 3,361,512 | ||||
100,000 | PPG Industries, Inc. | 8,349,000 | ||||
45,000 | Terra Nitrogen Co. LP | 7,542,450 | ||||
|
| |||||
| 68,429,742 | ||||||
|
| |||||
| Consumer, Cyclical-6.6% | ||||||
85,000 | Alaska Air Group, Inc.* | 6,382,650 | ||||
7,500 | AutoZone, Inc.* | 2,437,275 | ||||
55,000 | Big Lots, Inc.* | 2,076,800 | ||||
145,200 | The Cato Corp., Class A | 3,513,840 | ||||
98,900 | DineEquity, Inc.* | 4,174,569 | ||||
60,000 | DIRECTV, Class A* | 2,565,600 | ||||
199,070 | Dollar Tree, Inc.* | 16,544,708 | ||||
530,000 | Ford Motor Co.* | 5,702,800 | ||||
378,300 | Macy’s, Inc. | 12,173,694 | ||||
131,300 | Moody’s Corp. | 4,422,184 | ||||
9,900 | PetSmart, Inc. | 507,771 | ||||
110,400 | RR Donnelley & Sons Co. | 1,593,072 | ||||
940,200 | Sinclair Broadcast Group, Inc., Class A | 10,652,466 | ||||
16,800 | Target Corp. | 860,496 | ||||
163,500 | Viacom, Inc., Class A | 8,719,455 | ||||
95,000 | Viacom, Inc., Class B | 4,313,950 | ||||
|
| |||||
| 86,641,330 | ||||||
|
| |||||
| Consumer, Non-cyclical-7.8% | ||||||
233,000 | Archer-Daniels-Midland Co. | 6,663,800 | ||||
315,000 | Bridgepoint Education, Inc.* | 7,245,000 | ||||
173,600 | Corn Products International, Inc. | 9,129,624 | ||||
100,000 | Darling International, Inc.* | 1,329,000 | ||||
150,000 | Eli Lilly & Co. | 6,234,000 | ||||
190,000 | Forest Laboratories, Inc.* | 5,749,400 | ||||
140,000 | Fresh Del Monte Produce, Inc. | 3,501,400 | ||||
377,000 | Hi-Tech Pharmacal Co., Inc.* | 14,661,530 | ||||
157,000 | LifePoint Hospitals, Inc.* | 5,832,550 | ||||
155,000 | Merck & Co., Inc. | 5,843,500 | ||||
100,000 | Mylan, Inc.* | 2,146,000 | ||||
476,000 | Pfizer, Inc. | 10,300,640 | ||||
4,800 | Seaboard Corp.* | 9,772,800 | ||||
80,000 | Tupperware Brands Corp. | 4,477,600 | ||||
125,000 | UnitedHealth Group, Inc. | 6,335,000 | ||||
44,675 | WellPoint, Inc. | 2,959,719 | ||||
|
| |||||
| 102,181,563 | ||||||
|
| |||||
| 8 | www.jamesfunds.com |
Table of Contents
| James Balanced: Golden Rainbow Fund | Schedule of Investments | |
| December 31, 2011 (Unaudited) |
| Shares or Principal Amount | Value | |||||
| Energy-4.4% | ||||||
81,500 | Apache Corp. | $7,382,270 | ||||
113,670 | Chevron Corp. | 12,094,488 | ||||
93,500 | Devon Energy Corp. | 5,797,000 | ||||
114,500 | Exxon Mobil Corp. | 9,705,020 | ||||
312,244 | HollyFrontier Corp. | 7,306,510 | ||||
93,760 | Pioneer Southwest Energy Partners LP | 2,452,761 | ||||
315,000 | Tesoro Corp.* | 7,358,400 | ||||
302,000 | W&T Offshore, Inc. | 6,405,420 | ||||
|
| |||||
| 58,501,869 | ||||||
|
| |||||
| Financial-5.1% | ||||||
280,000 | Advance America Cash Advance Centers, Inc. | 2,506,000 | ||||
230,000 | American Financial Group, Inc. | 8,484,700 | ||||
180,000 | AmTrust Financial Services, Inc. | 4,275,000 | ||||
240,000 | Annaly Capital Management, Inc., REIT | 3,830,400 | ||||
486,000 | Brookfield Office Properties, Inc. | 7,601,040 | ||||
137,000 | CBL & Associates Properties, Inc., REIT | 2,150,900 | ||||
213,000 | EZCORP, Inc., Class A* | 5,616,810 | ||||
261,000 | FBL Financial Group, Inc., Class A | 8,879,220 | ||||
352,600 | First Industrial Realty Trust, Inc., REIT* | 3,607,098 | ||||
59,000 | Home Properties, Inc., REIT | 3,396,630 | ||||
80,000 | Nelnet, Inc., Class A | 1,957,600 | ||||
59,000 | Post Properties, Inc., REIT | 2,579,480 | ||||
316,060 | Rent-A-Center, Inc. | 11,694,220 | ||||
|
| |||||
| 66,579,098 | ||||||
|
| |||||
| Financials-1.3% | ||||||
231,000 | Capital One Financial Corp. | 9,768,990 | ||||
200,000 | Fifth Third Bancorp | 2,544,000 | ||||
605,000 | KeyCorp | 4,652,450 | ||||
|
| |||||
| 16,965,440 | ||||||
|
| |||||
| Industrial-3.9% | ||||||
31,000 | AGCO Corp.* | 1,332,070 | ||||
67,000 | Amerco, Inc. | 5,922,800 | ||||
303,000 | American Axle & Manufacturing Holdings, Inc.* | 2,996,670 | ||||
20,000 | Ampco-Pittsburgh Corp. | 386,800 | ||||
280,000 | CSX Corp. | 5,896,800 | ||||
88,000 | Cummins, Inc. | 7,745,760 | ||||
19,200 | Deere & Co. | 1,485,120 | ||||
23,110 | Greif, Inc., Class A | 1,052,660 | ||||
3,500 | Jarden Corp. | 104,580 | ||||
122,000 | Littelfuse, Inc. | 5,243,560 | ||||
382,000 | Sturm Ruger & Co., Inc. | 12,781,720 | ||||
55,000 | Timken Co. | 2,129,050 | ||||
151,500 | TRW Automotive Holdings Corp.* | 4,938,900 | ||||
|
| |||||
| 52,016,490 | ||||||
|
| |||||
| Industrials-0.2% | ||||||
66,000 | Eaton Corp. | 2,872,980 | ||||
|
| |||||
| 2,872,980 | ||||||
|
| |||||
Semi-Annual Report | December 31, 2011 | 9 |
Table of Contents
Schedule of Investments | James Balanced: Golden Rainbow Fund | |
December 31, 2011 (Unaudited) |
| Shares or Principal Amount | Value | |||||
| Technology-5.8% | ||||||
398,000 | Amkor Technology, Inc.* | $1,735,280 | ||||
122,000 | Arrow Electronics, Inc.* | 4,564,020 | ||||
120,000 | Avnet, Inc.* | 3,730,800 | ||||
14,000 | Biogen Idec, Inc.* | 1,540,700 | ||||
296,910 | Deluxe Corp. | 6,757,672 | ||||
141,700 | Electronics for Imaging, Inc.* | 2,019,225 | ||||
50,000 | Hewlett-Packard Co. | 1,288,000 | ||||
146,000 | Integrated Silicon Solution, Inc.* | 1,334,440 | ||||
214,000 | Intel Corp. | 5,189,500 | ||||
75,000 | International Business Machines Corp. | 13,791,000 | ||||
174,000 | Intersections, Inc. | 1,929,660 | ||||
75,000 | Kulicke & Soffa Industries, Inc.* | 693,750 | ||||
62,000 | Lexmark International, Inc., Class A | 2,050,340 | ||||
13,800 | Newport Corp.* | 187,818 | ||||
61,840 | Northrop Grumman Corp. | 3,616,403 | ||||
47,500 | SYNNEX Corp.* | 1,446,850 | ||||
288,840 | Triumph Group, Inc. | 16,882,698 | ||||
239,500 | Western Digital Corp.* | 7,412,525 | ||||
|
| |||||
| 76,170,681 | ||||||
|
| |||||
Utilities-5.3% | ||||||
115,000 | American Electric Power Co., Inc. | 4,750,650 | ||||
240,000 | AT&T, Inc. | 7,257,600 | ||||
337,000 | BCE, Inc. | 14,042,790 | ||||
20,000 | Chesapeake Utilities Corp. | 867,000 | ||||
100,000 | Cleco Corp. | 3,810,000 | ||||
82,840 | DTE Energy Co. | 4,510,638 | ||||
75,600 | Edison International | 3,129,840 | ||||
142,000 | El Paso Electric Co. | 4,918,880 | ||||
143,000 | Exelon Corp. | 6,201,910 | ||||
20,000 | Genie Energy Ltd., Class B | 158,600 | ||||
100,000 | IDACORP, Inc. | 4,241,000 | ||||
42,000 | NorthWestern Corp. | 1,503,180 | ||||
100,000 | OGE Energy Corp. | 5,671,000 | ||||
265,000 | Portland General Electric Co. | 6,701,850 | ||||
980,000 | Vonage Holdings Corp.* | 2,401,000 | ||||
|
| |||||
| 70,165,938 | ||||||
|
| |||||
TOTAL COMMON STOCKS | ||||||
(Cost $514,202,096) | 600,525,131 | |||||
|
| |||||
CLOSED-END FUNDS-0.1% | ||||||
11,500 | Nuveen Ohio Quality Income Municipal Fund, Inc. | 192,050 | ||||
50,000 | Nuveen Premium Income Municipal Fund 2 | 746,000 | ||||
|
| |||||
| 938,050 | ||||||
|
| |||||
TOTAL CLOSED-END FUNDS | ||||||
(Cost $835,119) | 938,050 | |||||
|
| |||||
| 10 | www.jamesfunds.com |
Table of Contents
James Balanced: Golden Rainbow Fund | Schedule of Investments | |
| December 31, 2011 (Unaudited) |
| Shares or Principal Amount | Value | |||||
EXCHANGE TRADED FUNDS-1.2% | ||||||
58,000 | iShares® Cohen & Steers Realty Majors Index Fund | $4,072,760 | ||||
45,000 | iShares® MSCI Canada Index Fund | 1,197,000 | ||||
20,000 | iShares® MSCI Chile Investable Market Index Fund | 1,154,200 | ||||
10,000 | iShares® MSCI Indonesia Investable Market Index Fund | 293,100 | ||||
32,900 | iShares® MSCI New Zealand Investable Market Index Fund | 906,724 | ||||
30,000 | iShares® MSCI Russia Capped Index Fund | 627,300 | ||||
193,000 | iShares® MSCI Singapore Index Fund | 2,090,190 | ||||
19,000 | iShares® MSCI South Korea Index Fund | 992,940 | ||||
27,000 | iShares® MSCI Turkey Index Fund | 1,110,780 | ||||
10,000 | iShares® S&P® National Municipal Bond Fund | 1,082,500 | ||||
65,000 | iShares® Silver Trust Index Fund* | 1,751,100 | ||||
|
| |||||
| 15,278,594 | ||||||
|
| |||||
TOTAL EXCHANGE TRADED FUNDS | ||||||
|
| |||||
(Cost $15,749,275) | 15,278,594 | |||||
|
| |||||
PREFERRED STOCKS-0.0%(a) | ||||||
Financial-0.0%(a) | ||||||
8,000 | General Electric Capital Corp., 6.000% | 206,960 | ||||
Utilities-0.0%(a) | ||||||
5,000 | AT&T, Inc., 6.375% | 133,750 | ||||
TOTAL PREFERRED STOCKS | ||||||
|
| |||||
(Cost $329,056) | 340,710 | |||||
|
| |||||
CORPORATE BONDS-4.1% | ||||||
Basic Materials-0.5% | ||||||
$5,000,000 | E.I. du Pont de Nemours & Co., 2.750%, 4/1/16 | 5,284,820 | ||||
1,500,000 | E.I. du Pont de Nemours & Co., 5.750%, 3/15/19 | 1,818,348 | ||||
|
| |||||
| 7,103,168 | ||||||
|
| |||||
Consumer, Cyclical-0.3% | ||||||
785,000 | McDonald’s Corp., 5.700%, 2/1/39 | 1,015,729 | ||||
2,000,000 | Wal-Mart Stores, Inc., 5.250%, 9/1/35 | 2,387,902 | ||||
|
| |||||
| 3,403,631 | ||||||
|
| |||||
Consumer, Non-cyclical-0.3% | ||||||
3,000,000 | The Hershey Co., 4.125%, 12/1/20 | 3,354,570 | ||||
Financial-1.4% | ||||||
3,000,000 | Countrywide Financial Corp., 5.800%, 6/7/12 | 3,006,411 | ||||
4,000,000 | General Electric Capital Corp., 1.028%, 2/6/14(b) | 3,929,424 | ||||
2,000,000 | General Electric Capital Corp., 6.875%, 1/10/39 | 2,391,888 | ||||
5,000,000 | Morgan Stanley & Co., 3.450%, 11/2/15 | 4,604,265 | ||||
5,000,000 | U.S. Bancorp, 2.250%, 3/13/12 | 5,020,085 | ||||
|
| |||||
| 18,952,073 | ||||||
|
| |||||
Government-0.4% | ||||||
5,000,000 | United States Department of Housing and Urban Development, 2.050%, 8/1/19 | 5,028,885 | ||||
Industrial-0.2% | ||||||
1,000,000 | Caterpillar, Inc., 7.900%, 12/15/18 | 1,331,303 | ||||
1,000,000 | Caterpillar, Inc., 8.250%, 12/15/38 | 1,648,015 | ||||
|
| |||||
| 2,979,318 | ||||||
|
| |||||
Semi-Annual Report | December 31, 2011 | 11 |
Table of Contents
Schedule of Investments | James Balanced: Golden Rainbow Fund | |
December 31, 2011 (Unaudited) |
| Shares or Principal Amount | Value | |||||
Technology-1.0% | ||||||
$5,000,000 | Hewlett-Packard Co., 3.750%, 12/1/20 | $4,933,510 | ||||
3,000,000 | International Business Machines Corp., 1.950%, 7/22/16 | 3,088,155 | ||||
3,700,000 | Microsoft Corp., 5.200%, 6/1/39 | 4,572,131 | ||||
|
| |||||
| 12,593,796 | ||||||
|
| |||||
TOTAL CORPORATE BONDS | ||||||
|
| |||||
(Cost $49,905,827) | 53,415,441 | |||||
|
| |||||
U.S. GOVERNMENT AGENCIES-1.0% | ||||||
| GNMA -Mortgage Backed Securities-1.0% | ||||||
1,940,961 | 4.000%, 7/15/25, Pool #745185 | 2,085,265 | ||||
1,545,096 | 4.500%, 1/15/40, Pool #723606 | 1,685,459 | ||||
9,453,818 | 4.000%, 12/20/40, Pool #4882 | 10,130,059 | ||||
|
| |||||
| 13,900,783 | ||||||
|
| |||||
TOTAL U.S. GOVERNMENT AGENCIES | ||||||
(Cost $13,190,223) | 13,900,783 | |||||
|
| |||||
U.S. TREASURY BONDS & NOTES-38.8% | ||||||
| U.S. Treasury Bonds-7.7% | ||||||
35,000,000 | 3.125%, 5/15/21 | 39,060,560 | ||||
3,000,000 | 2.125%, 8/15/21 | 3,075,468 | ||||
53,000,000 | 3.500%, 2/15/39 | 59,500,768 | ||||
|
| |||||
| 101,636,796 | ||||||
|
| |||||
| U.S. Treasury Inflation Indexed Notes-3.8% | ||||||
15,417,050 | 2.500%, 7/15/16 | 17,834,397 | ||||
12,430,005 | 1.625%, 1/15/18 | 14,155,638 | ||||
15,709,161 | 1.375%, 1/15/20 | 17,880,214 | ||||
|
| |||||
| 49,870,249 | ||||||
|
| |||||
| U.S. Treasury Notes-27.3% | ||||||
49,300,000 | 3.875%, 2/15/13 | 51,329,780 | ||||
50,000,000 | 1.125%, 6/15/13 | 50,662,100 | ||||
35,000,000 | 2.625%, 12/31/14 | 37,332,435 | ||||
20,000,000 | 2.000%, 1/31/16 | 21,106,240 | ||||
15,000,000 | 1.000%, 9/30/16 | 15,159,375 | ||||
48,000,000 | 4.625%, 2/15/17 | 56,970,000 | ||||
15,400,000 | 3.500%, 2/15/18 | 17,560,805 | ||||
100,000,000 | 2.750%, 2/15/19 | 109,523,400 | ||||
|
| |||||
| 359,644,135 | ||||||
|
| |||||
TOTAL U.S. TREASURY BONDS & NOTES | ||||||
(Cost $472,923,562) | 511,151,180 | |||||
|
| |||||
FOREIGN BONDS-3.4% | ||||||
| Australia Government-0.9% | ||||||
AUD 10,000,000 | 5.250%, 3/15/19 | 11,363,901 | ||||
| Canada Government-0.9% | ||||||
CAD 5,000,000 | 3.750%, 6/1/19 | 5,616,000 | ||||
CAD 5,000,000 | 3.500%, 6/1/20 | 5,539,436 | ||||
|
| |||||
| 11,155,436 | ||||||
|
| |||||
| International Bank for Reconstruction & Development-0.3% | ||||||
TRY 8,000,000 | 10.250%, 8/24/12 | 4,241,320 | ||||
| Netherlands Government-0.3% | ||||||
EUR 3,000,000 | 4.000%, 7/15/19 | 4,430,984 | ||||
| 12 | www.jamesfunds.com |
Table of Contents
James Balanced: Golden Rainbow Fund | Schedule of Investments | |
| December 31, 2011 (Unaudited) |
| Shares or Principal Amount | Value | |||||
| Norway Government-0.3% | ||||||
NOK 21,000,000 | 4.500%, 5/22/19 | $4,035,430 | ||||
| Sweden Government-0.7% | ||||||
SEK 52,000,000 | 5.000%, 12/1/20 | 9,729,944 | ||||
TOTAL FOREIGN BONDS | ||||||
|
| |||||
(Cost $41,391,452) | 44,957,015 | |||||
|
| |||||
MUNICIPAL BONDS-2.6% | ||||||
| California-0.1% | ||||||
$ 1,000,000 | Citrus Community College District General Obligation Unlimited Bonds, Series B, 4.750%, 6/1/31 | 1,037,580 | ||||
| Colorado-0.1% | ||||||
1,000,000 | Adams County School District No. 14 General Obligation Unlimited Bonds, 5.000%, 12/1/26 | 1,083,930 | ||||
| Florida-0.1% | ||||||
1,000,000 | Florida State Board of Education Cap Outlay General Obligation Bonds, Series D, 5.000%, 6/1/38 | 1,076,660 | ||||
| Georgia-0.2% | ||||||
3,000,000 | State of Georgia General Obligation Unlimited Bonds, Series B, 4.500%, 1/1/29 | 3,309,660 | ||||
| Illinois-0.1% | ||||||
500,000 | Kane & DeKalb Counties Community Unit School District No. 302 Kaneland General Obligation Unlimited Bonds (School Building), 5.500%, 2/1/28 | 555,470 | ||||
1,000,000 | Village of Bolingbrook General Obligation Unlimited Bonds, 5.000%, 1/1/37 | 1,052,240 | ||||
|
| |||||
| 1,607,710 | ||||||
|
| |||||
| Louisiana-0.1% | ||||||
1,000,000 | East Baton Rouge Sewerage Commission Revenue Bonds, Series A, 5.125%, 2/1/29 | 1,104,300 | ||||
| Massachusetts-0.1% | ||||||
1,000,000 | Commonwealth of Massachusetts General Obligation Limited Bonds, Series C, 5.250%, 8/1/22 | 1,181,540 | ||||
| Michigan-0.1% | ||||||
1,000,000 | Marysville Public School District General Obligation Unlimited Bonds (School Building & Site), 5.000%, 5/1/32 | 1,047,950 | ||||
| Ohio-1.0% | ||||||
4,620,000 | Columbus City School District Taxable Facilities & Improvement Build America Bonds, Series B, 6.150%, 12/1/33 | 4,974,216 | ||||
1,100,000 | Miamisburg City School District General Obligation Unlimited Bonds (School Facilities Construction & Improvement), 5.000%, 12/1/33 | 1,167,804 | ||||
500,000 | Mount Healthy City School District General Obligation Unlimited Bonds (School Improvement), 5.000%, 12/1/26 | 547,495 | ||||
1,000,000 | Ohio State University General Recipients Revenue Bonds, 4.910%, 6/1/40 | 1,132,320 | ||||
1,000,000 | Ohio State University General Recipients Revenue Bonds, Series A, 5.000%, 12/1/28 | 1,116,610 | ||||
500,000 | Springboro Community City School District General Obligation Unlimited Bonds, 5.250%, 12/1/23 | 611,915 | ||||
1,000,000 | State of Ohio General Obligation Unlimited Bonds, Series A, 5.375%, 9/1/28 | 1,121,790 | ||||
2,000,000 | State of Ohio General Obligation Unlimited Bonds, Series B, 5.000%, 2/1/22 | 2,165,800 | ||||
|
| |||||
| 12,837,950 | ||||||
|
| |||||
Semi-Annual Report | December 31, 2011 | 13 |
Table of Contents
Schedule of Investments | James Balanced: Golden Rainbow Fund | |
December 31, 2011 (Unaudited) |
| Shares or Principal Amount | Value | |||||
| Texas-0.7% | ||||||
$1,000,000 | Friendswood Independent School District General Obligation Unlimited Bonds (Schoolhouse), 5.000%, 2/15/37 | $1,066,540 | ||||
1,000,000 | Judson Independent School District General Obligation Unlimited Bonds (School Building), 5.000%, 2/1/37 | 1,058,640 | ||||
500,000 | Lamar Consolidated Independent School District General Obligation Unlimited Bonds (Schoolhouse), 5.000%, 2/15/38 | 531,675 | ||||
5,335,000 | Port of Houston Authority, 5.000%, 10/1/35 | 5,852,708 | ||||
1,000,000 | Tyler Independent School District General Obligation Unlimited Bonds (School Building), 5.000%, 2/15/34 | 1,075,010 | ||||
|
| |||||
| 9,584,573 | ||||||
|
| |||||
TOTAL MUNICIPAL BONDS | ||||||
(Cost $31,683,828) | 33,871,853 | |||||
|
| |||||
TOTAL INVESTMENT SECURITIES-96.8% | ||||||
(Cost $1,140,210,438) | 1,274,378,757 | |||||
OTHER ASSETS IN EXCESS OF LIABILITIES-3.2% | 41,821,372 | |||||
|
| |||||
NET ASSETS-100.0% | $1,316,200,129 | |||||
|
| |||||
| * | Non-income producing security. |
| (a) | Less than 0.05% of Net Assets |
| (b) | Variable rate security. Interest rate disclosed is that which is in effect at December 31, 2011. |
AUD - Australian Dollar
CAD - Canadian Dollar
EUR - Euro
GNMA - Government National Mortgage Association
LP - Limited Partnership
Ltd. - Limited
MSCI - Morgan Stanley Capital International
NOK - Norwegian Krone
REIT - Real Estate Investment Trust
S&P - Standard & Poor’s
SEK - Swedish Krona
TRY - New Turkish Lira
| Foreign Bonds Securities Allocation | ||
% of net assets | ||
Asia - Pacific | 0.9% | |
Europe | 1.3% | |
Europe - Euro | 0.3% | |
North America | 0.9% | |
| ||
| 3.4% | ||
| ||
See Notes to Financial Statements.
| 14 | www.jamesfunds.com |
Table of Contents
| James Small Cap Fund | Schedule of Investments | |
| December 31, 2011 (Unaudited) |
| Shares | Value | |||||
COMMON STOCKS-93.2% | ||||||
| Basic Materials-12.3% | ||||||
319,905 | Boise, Inc. | $ | 2,277,724 | |||
135,845 | Buckeye Technologies, Inc. | 4,542,657 | ||||
29,810 | Fuwei Films Holdings Co., Ltd.* | 35,772 | ||||
47,600 | The Goodyear Tire & Rubber Co.* | 674,492 | ||||
1,390 | Great Northern Iron Ore Properties | 153,247 | ||||
126,140 | Innophos Holdings, Inc. | 6,125,358 | ||||
47,655 | Innospec, Inc.* | 1,337,676 | ||||
35,841 | Material Sciences Corp.* | 292,463 | ||||
9,725 | Mercer International, Inc.* | 59,323 | ||||
11,664 | Neenah Paper, Inc. | 260,340 | ||||
17,810 | Rock-Tenn Co., Class A | 1,027,637 | ||||
6,065 | Universal Stainless & Alloy* | 226,588 | ||||
|
| |||||
| 17,013,277 | ||||||
|
| |||||
| Consumer, Cyclical-11.3% | ||||||
15,980 | Carrols Restaurant Group, Inc.* | 184,889 | ||||
61,180 | The Cato Corp., Class A | 1,480,556 | ||||
55,225 | Cumulus Media, Inc., Class A* | 184,451 | ||||
8,708 | Destination Maternity Corp. | 145,598 | ||||
63,310 | Domino’s Pizza, Inc.* | 2,149,374 | ||||
9,885 | Dorman Products, Inc.* | 365,053 | ||||
4,025 | Flexsteel Industries, Inc. | 55,706 | ||||
21,390 | Friedman Industries, Inc. | 223,525 | ||||
16,445 | PC Connection, Inc. | 182,375 | ||||
114,490 | Polaris Industries, Inc. | 6,409,150 | ||||
17,485 | Rocky Brands, Inc.* | 157,715 | ||||
327,475 | Sinclair Broadcast Group, Inc., Class A | 3,710,292 | ||||
5,460 | Susser Holdings Corp.* | 123,505 | ||||
28,490 | Town Sports International Holdings, Inc.* | 209,402 | ||||
|
| |||||
| 15,581,591 | ||||||
|
| |||||
| Consumer, Non-cyclical-10.3% | ||||||
116,645 | Bridgepoint Education, Inc.* | 2,682,835 | ||||
19,060 | Carriage Services, Inc. | 106,736 | ||||
45,170 | Darling International, Inc.* | 600,309 | ||||
32,860 | Dusa Pharmaceuticals, Inc.* | 143,927 | ||||
95,500 | Elizabeth Arden, Inc.* | 3,537,320 | ||||
47,820 | Helen of Troy, Ltd.* | 1,468,074 | ||||
60,110 | Hi-Tech Pharmacal Co., Inc.* | 2,337,678 | ||||
75,575 | LifePoint Hospitals, Inc.* | 2,807,611 | ||||
45,055 | Metropolitan Health Networks, Inc.* | 336,561 | ||||
30,560 | Sciclone Pharmaceuticals, Inc.* | 131,103 | ||||
|
| |||||
| 14,152,154 | ||||||
|
| |||||
| Energy-8.6% | ||||||
8,010 | Adams Resources & Energy, Inc. | 232,130 | ||||
78,910 | Gulfport Energy Corp.* | 2,323,899 | ||||
17,021 | Mitcham Industries, Inc.* | 371,739 | ||||
117,315 | Pioneer Southwest Energy Partners LP | 3,068,960 | ||||
3,580 | REX American Resources Corp.* | 79,154 | ||||
171,455 | Star Gas Partners LP | 834,986 | ||||
84,390 | Sunoco Logistics Partners LP | 3,324,966 | ||||
21,270 | TGC Industries, Inc.* | 151,868 | ||||
71,155 | W&T Offshore, Inc. | 1,509,198 | ||||
|
| |||||
| 11,896,900 | ||||||
|
| |||||
Semi-Annual Report | December 31, 2011 | 15 |
Table of Contents
Schedule of Investments | James Small Cap Fund | |
December 31, 2011 (Unaudited) |
| Shares | Value | |||||
| Financial-16.0% | ||||||
352,580 | Advance America Cash Advance Centers, Inc. | $3,155,591 | ||||
164,975 | American Financial Group, Inc. | 6,085,928 | ||||
2,695 | Arlington Asset Investment Corp., Class A | 57,484 | ||||
51,849 | Capital Trust, Inc., Class A, REIT* | 116,660 | ||||
56,470 | Crawford & Co., Class B | 347,855 | ||||
9,370 | Enterprise Financial Services Corp. | 138,676 | ||||
14,905 | ePlus, Inc.* | 421,513 | ||||
69,350 | EZCORP, Inc., Class A* | 1,828,759 | ||||
35,980 | FBL Financial Group, Inc., Class A | 1,224,040 | ||||
13,720 | MainSource Financial Group, Inc. | 121,148 | ||||
35,130 | Nelnet, Inc., Class A | 859,631 | ||||
11,995 | Nicholas Financial, Inc. | 153,776 | ||||
174,105 | Rent-A-Center, Inc. | 6,441,885 | ||||
21,818 | Southside Bancshares, Inc. | 472,578 | ||||
11,810 | West Bancorporation, Inc. | 113,140 | ||||
7,700 | World Acceptance Corp.* | 565,950 | ||||
|
| |||||
| 22,104,614 | ||||||
|
| |||||
| Industrial-9.2% | ||||||
51,755 | Alamo Group, Inc. | 1,393,762 | ||||
14,270 | Amerco, Inc. | 1,261,468 | ||||
7,310 | CAI International, Inc.* | 113,013 | ||||
22,006 | Coleman Cable, Inc.* | 191,452 | ||||
20,765 | Littelfuse, Inc. | 892,480 | ||||
9,850 | Miller Industries, Inc. | 154,940 | ||||
11,315 | Park-Ohio Holdings Corp.* | 201,860 | ||||
7,245 | Sparton Corp.* | 61,582 | ||||
6,415 | Standex International Corp. | 219,136 | ||||
164,247 | Sturm Ruger & Co., Inc. | 5,495,705 | ||||
137,760 | Trimas Corp.* | 2,472,792 | ||||
11,174 | UFP Technologies, Inc.* | 165,040 | ||||
|
| |||||
| 12,623,230 | ||||||
|
| |||||
| Technology-11.6% | ||||||
42,330 | Brightpoint, Inc.* | 455,471 | ||||
295,008 | CGI Group, Inc., Class A* | 5,560,901 | ||||
7,420 | Communications Systems, Inc. | 104,325 | ||||
26,820 | Datalink Corp.* | 221,533 | ||||
11,175 | DDi Corp. | 104,263 | ||||
98,635 | Deluxe Corp. | 2,244,933 | ||||
6,145 | Formula Systems 1985, Ltd., Sponsored ADR | 91,560 | ||||
9,320 | Intersections, Inc. | 103,359 | ||||
123,300 | Majesco Entertainment Co.* | 300,852 | ||||
23,785 | Nova Measuring Instruments, Ltd.* | 175,295 | ||||
32,100 | RTI Biologics, Inc.* | 142,524 | ||||
14,600 | SYNNEX Corp.* | 444,716 | ||||
5,330 | Tessco Technologies, Inc. | 73,661 | ||||
97,855 | Triumph Group, Inc. | 5,719,625 | ||||
20,460 | USA Mobility, Inc. | 283,780 | ||||
|
| |||||
| 16,026,798 | ||||||
|
| |||||
| 16 | www.jamesfunds.com |
Table of Contents
| James Small Cap Fund | Schedule of Investments | |
| December 31, 2011 (Unaudited) |
| Shares | Value | |||||
| Utilities-13.9% | ||||||
96,140 | Cleco Corp. | $3,662,934 | ||||
116,285 | El Paso Electric Co. | 4,028,112 | ||||
27,190 | HickoryTech Corp. | 301,265 | ||||
35,040 | The Laclede Group, Inc. | 1,418,069 | ||||
75,255 | NorthWestern Corp. | 2,693,376 | ||||
5,840 | Otter Tail Corp. | 128,597 | ||||
90,950 | PNM Resources, Inc. | 1,658,019 | ||||
90,405 | Portland General Electric Co. | 2,286,342 | ||||
39,860 | UIL Holdings Corp. | 1,409,848 | ||||
678,490 | Vonage Holdings Corp.* | 1,662,301 | ||||
|
| |||||
| 19,248,863 | ||||||
|
| |||||
TOTAL COMMON STOCKS | ||||||
(Cost $105,113,535) | 128,647,427 | |||||
|
| |||||
TOTAL INVESTMENT SECURITIES-93.2% | ||||||
(Cost $105,113,535) | 128,647,427 | |||||
OTHER ASSETS IN EXCESS OF LIABILITIES-6.8% | 9,455,170 | |||||
|
| |||||
NET ASSETS-100.0% | $138,102,597 | |||||
|
| |||||
| * | Non-income producing security. |
ADR - American Depositary Receipt
LP - Limited Partnership
Ltd. - Limited
REIT - Real Estate Investment Trust
See Notes to Financial Statements.
Semi-Annual Report | December 31, 2011 | 17 |
Table of Contents
Schedule of Investments | James Mid Cap Fund | |
December 31, 2011 (Unaudited) |
| Shares | Value | |||||
COMMON STOCKS-94.8% | ||||||
| Basic Materials-8.6% | ||||||
4,125 | Domtar Corp. | $329,835 | ||||
2,575 | FMC Corp. | 221,553 | ||||
2,075 | Innophos Holdings, Inc. | 100,762 | ||||
15,500 | PolyOne Corp. | 179,025 | ||||
8,000 | Silver Wheaton Corp. | 231,680 | ||||
|
| |||||
| 1,062,855 | ||||||
|
| |||||
| Consumer, Cyclical-10.5% | ||||||
4,125 | Alaska Air Group, Inc.* | 309,746 | ||||
3,100 | The Childrens Place Retail Stores, Inc.* | 164,672 | ||||
7,225 | Dollar Tree, Inc.* | 600,470 | ||||
15,500 | RR Donnelley & Sons Co. | 223,665 | ||||
|
| |||||
| 1,298,553 | ||||||
|
| |||||
| Consumer, Non-cyclical-16.6% | ||||||
10,325 | Bridgepoint Education, Inc.* | 237,475 | ||||
4,125 | Corn Products International, Inc. | 216,934 | ||||
10,325 | LifePoint Hospitals, Inc.* | 383,574 | ||||
8,000 | Ruddick Corp. | 341,120 | ||||
125 | Seaboard Corp.* | 254,500 | ||||
7,225 | Tupperware Brands Corp. | 404,383 | ||||
10,325 | Tyson Foods, Inc., Class A | 213,108 | ||||
|
| |||||
| 2,051,094 | ||||||
|
| |||||
| Energy-8.5% | ||||||
4,125 | Cimarex Energy Co. | 255,338 | ||||
8,250 | HollyFrontier Corp. | 193,050 | ||||
9,300 | Tesoro Corp.* | 217,248 | ||||
10,325 | W&T Offshore, Inc. | 218,993 | ||||
4,125 | World Fuel Services Corp. | 173,167 | ||||
|
| |||||
| 1,057,796 | ||||||
|
| |||||
| Financial-14.6% | ||||||
8,775 | American Financial Group, Inc. | 323,710 | ||||
12,900 | Brookfield Office Properties, Inc. | 201,756 | ||||
4,125 | Home Properties, Inc., REIT | 237,476 | ||||
11,350 | Nelnet, Inc., Class A | 277,734 | ||||
13,425 | Rent-A-Center, Inc. | 496,725 | ||||
3,625 | RLI Corp. | 264,118 | ||||
|
| |||||
| 1,801,519 | ||||||
|
| |||||
| Industrial-10.2% | ||||||
7,225 | AGCO Corp.* | 310,458 | ||||
2,100 | Amerco, Inc. | 185,640 | ||||
7,750 | Jarden Corp. | 231,570 | ||||
6,700 | Timken Co. | 259,357 | ||||
8,250 | TRW Automotive Holdings Corp.* | 268,950 | ||||
|
| |||||
| 1,255,975 | ||||||
|
| |||||
| Technology-11.9% | ||||||
34,525 | Amkor Technology, Inc.* | 150,529 | ||||
7,750 | Arrow Electronics, Inc.* | 289,928 | ||||
| 18 | www.jamesfunds.com |
Table of Contents
| James Mid Cap Fund | Schedule of Investments | |
| December 31, 2011 (Unaudited) |
| Shares | Value | |||||
| Technology (continued) | ||||||
15,500 | AVX Corp. | $197,780 | ||||
13,950 | Deluxe Corp. | 317,502 | ||||
14,450 | Fairchild Semiconductor International, Inc.* | 173,978 | ||||
3,100 | Lexmark International, Inc., Class A | 102,517 | ||||
4,125 | Triumph Group, Inc. | 241,106 | ||||
|
| |||||
| 1,473,340 | ||||||
|
| |||||
| Utilities-13.9% | ||||||
15,550 | CMS Energy Corp. | 343,344 | ||||
4,975 | DTE Energy Co. | 270,889 | ||||
3,625 | Energen Corp. | 181,250 | ||||
8,250 | NorthWestern Corp. | 295,268 | ||||
10,325 | Portland General Electric Co. | 261,119 | ||||
7,225 | Southwest Gas Corp. | 306,990 | ||||
25,825 | Vonage Holdings Corp.* | 63,271 | ||||
|
| |||||
| 1,722,131 | ||||||
|
| |||||
TOTAL COMMON STOCKS (Cost $10,340,434) | 11,723,263 | |||||
|
| |||||
EXCHANGE TRADED FUNDS-1.8% | ||||||
3,100 | iShares® Cohen & Steers Realty Majors Index Fund | 217,682 | ||||
|
| |||||
TOTAL EXCHANGE TRADED FUNDS (Cost $217,510) | 217,682 | |||||
|
| |||||
TOTAL INVESTMENT SECURITIES-96.6% (Cost $10,557,944) | 11,940,945 | |||||
OTHER ASSETS IN EXCESS OF LIABILITIES-3.4% | 421,863 | |||||
|
| |||||
NET ASSETS-100.0% | $12,362,808 | |||||
|
| |||||
| * | Non-income producing security. |
REIT - Real Estate Investment Trust
See Notes to Financial Statements.
Semi-Annual Report | December 31, 2011 | 19 |
Table of Contents
| Schedule of Investments | James Micro Cap Fund | |
December 31, 2011 (Unaudited) |
| Shares | Value | |||||
COMMON STOCKS-95.3% | ||||||
| Basic Materials-10.6% | ||||||
28,510 | Fuwei Films Holdings Co., Ltd.* | $34,212 | ||||
1,000 | Great Northern Iron Ore Properties | 110,250 | ||||
30,277 | Material Sciences Corp.* | 247,060 | ||||
8,630 | Mercer International, Inc.* | 52,643 | ||||
9,885 | Neenah Paper, Inc. | 220,633 | ||||
5,040 | Universal Stainless & Alloy* | 188,295 | ||||
|
| |||||
| 853,093 | ||||||
|
| |||||
| Consumer, Cyclical-15.9% | ||||||
13,460 | Carrols Restaurant Group, Inc.* | 155,732 | ||||
47,180 | Cumulus Media, Inc., Class A* | 157,581 | ||||
7,528 | Destination Maternity Corp. | 125,868 | ||||
3,345 | Flexsteel Industries, Inc. | 46,295 | ||||
17,910 | Friedman Industries, Inc. | 187,160 | ||||
14,615 | PC Connection, Inc. | 162,080 | ||||
18,213 | Rocky Brands, Inc.* | 164,281 | ||||
4,682 | Susser Holdings Corp.* | 105,907 | ||||
24,020 | Town Sports International Holdings, Inc.* | 176,547 | ||||
|
| |||||
| 1,281,451 | ||||||
|
| |||||
| Consumer, Non-cyclical-7.7% | ||||||
17,041 | Carriage Services, Inc. | 95,429 | ||||
27,760 | Dusa Pharmaceuticals, Inc.* | 121,589 | ||||
39,595 | Metropolitan Health Networks, Inc.* | 295,775 | ||||
25,780 | Sciclone Pharmaceuticals, Inc.* | 110,596 | ||||
|
| |||||
| 623,389 | ||||||
|
| |||||
| Energy-8.8% | ||||||
6,800 | Adams Resources & Energy, Inc. | 197,064 | ||||
14,421 | Mitcham Industries, Inc.* | 314,955 | ||||
3,080 | REX American Resources Corp.* | 68,099 | ||||
17,960 | TGC Industries, Inc.* | 128,234 | ||||
|
| |||||
| 708,352 | ||||||
|
| |||||
| Financial-16.2% | ||||||
43,820 | Capital Trust, Inc., Class A, REIT* | 98,595 | ||||
45,936 | Crawford & Co., Class B | 282,966 | ||||
7,860 | Enterprise Financial Services Corp. | 116,328 | ||||
15,930 | ePlus, Inc.* | 450,500 | ||||
12,300 | MainSource Financial Group, Inc. | 108,609 | ||||
9,862 | Nicholas Financial, Inc. | 126,431 | ||||
12,820 | West Bancorporation, Inc. | 122,816 | ||||
|
| |||||
| 1,306,245 | ||||||
|
| |||||
| Industrial-17.8% | ||||||
22,626 | A.T. Cross Co., Class A* | 255,221 | ||||
5,798 | CAI International, Inc.* | 89,637 | ||||
18,950 | Coleman Cable, Inc.* | 164,865 | ||||
8,285 | Miller Industries, Inc. | 130,323 | ||||
9,520 | Park-Ohio Holdings Corp.* | 169,837 | ||||
7,245 | Sparton Corp.* | 61,583 | ||||
5,465 | Standex International Corp. | 186,684 | ||||
6,090 | Sturm Ruger & Co., Inc. | 203,771 | ||||
11,604 | UFP Technologies, Inc.* | 171,391 | ||||
| 1,433,312 | ||||||
| 20 | www.jamesfunds.com |
Table of Contents
| James Micro Cap Fund | Schedule of Investments | |
| December 31, 2011 (Unaudited) |
| Shares | Value | |||||
| Technology-15.1% | ||||||
6,260 | Communications Systems, Inc. | $88,016 | ||||
22,640 | Datalink Corp.* | 187,006 | ||||
3,430 | DDi Corp. | 32,002 | ||||
11,495 | Formula Systems 1985, Ltd., Sponsored ADR | 171,276 | ||||
13,980 | Intersections, Inc. | 155,038 | ||||
104,280 | Majesco Entertainment Co.* | 254,443 | ||||
19,730 | Nova Measuring Instruments, Ltd.* | 145,410 | ||||
27,100 | RTI Biologics, Inc.* | 120,324 | ||||
4,460 | Tessco Technologies, Inc. | 61,637 | ||||
|
| |||||
| 1,215,152 | ||||||
|
| |||||
| Utilities-3.2% | ||||||
22,960 | HickoryTech Corp. | 254,397 | ||||
|
| |||||
| 254,397 | ||||||
|
| |||||
TOTAL COMMON STOCKS (Cost $7,051,200) | 7,675,391 | |||||
|
| |||||
TOTAL INVESTMENT SECURITIES-95.3% (Cost $7,051,200) | 7,675,391 | |||||
OTHER ASSETS IN EXCESS OF LIABILITIES-4.7% | 382,144 | |||||
|
| |||||
NET ASSETS-100.0% | $8,057,535 | |||||
|
| |||||
| * | Non-income producing security. |
ADR - American Depositary Receipt
Ltd. - Limited
REIT - Real Estate Investment Trust
See Notes to Financial Statements.
Semi-Annual Report | December 31, 2011 | 21 |
Table of Contents
| Schedule of Investments | James Long-Short Fund | |
December 31, 2011 (Unaudited) |
| Shares | Value | |||||
COMMON STOCKS-105.1% | ||||||
| Basic Materials-9.1% | ||||||
9,795 | Buckeye Technologies, Inc.(a) | $327,545 | ||||
3,125 | Freeport-McMoRan Copper & Gold, Inc.(a) | 114,969 | ||||
4,995 | Innophos Holdings, Inc.(a) | 242,557 | ||||
|
| |||||
| 685,071 | ||||||
|
| |||||
| Consumer, Cyclical-19.6% | ||||||
610 | Alaska Air Group, Inc.*(a) | 45,805 | ||||
875 | AutoZone, Inc.*(a) | 284,349 | ||||
3,720 | Dollar Tree, Inc.*(a) | 309,169 | ||||
1,500 | Fred’s, Inc., Class A | 21,870 | ||||
7,740 | Moody’s Corp.(a) | 260,683 | ||||
23,805 | Sinclair Broadcast Group, Inc., Class A(a) | 269,711 | ||||
4,730 | Viacom, Inc., Class A(a) | 252,251 | ||||
500 | Wal-Mart Stores, Inc. | 29,880 | ||||
|
| |||||
| 1,473,718 | ||||||
|
| |||||
| Consumer, Non-cyclical-17.9% | ||||||
4,130 | Corn Products International, Inc.(a) | 217,197 | ||||
4,895 | Eli Lilly & Co.(a) | 203,436 | ||||
4,945 | Helen of Troy, Ltd.*(a) | 151,812 | ||||
3,500 | Hi-Tech Pharmacal Co., Inc.*(a) | 136,115 | ||||
9,595 | Pfizer, Inc.(a) | 207,636 | ||||
4,655 | UnitedHealth Group, Inc.(a) | 235,915 | ||||
2,965 | WellPoint, Inc.(a) | 196,431 | ||||
|
| |||||
| 1,348,542 | ||||||
|
| |||||
| Energy-10.2% | ||||||
710 | Apache Corp.(a) | 64,312 | ||||
2,625 | Chevron Corp.(a) | 279,300 | ||||
5,160 | HollyFrontier Corp.(a) | 120,744 | ||||
3,840 | Tesoro Corp.*(a) | 89,702 | ||||
9,975 | W&T Offshore, Inc.(a) | 211,570 | ||||
|
| |||||
| 765,628 | ||||||
|
| |||||
| Financial-9.6% | ||||||
32,990 | Advance America Cash Advance Centers, Inc.(a) | 295,260 | ||||
2,415 | Brookfield Office Properties, Inc.(a) | 37,771 | ||||
2,620 | CBL & Associates Properties, Inc., REIT(a) | 41,134 | ||||
4,045 | EZCORP, Inc., Class A*(a) | 106,667 | ||||
2,835 | PNC Financial Services Group, Inc.(a) | 163,494 | ||||
3,550 | Southside Bancshares, Inc.(a) | 76,893 | ||||
|
| |||||
| 721,219 | ||||||
|
| |||||
| Financials-5.0% | ||||||
6,660 | Capital One Financial Corp.(a) | 281,651 | ||||
7,310 | Fifth Third Bancorp(a) | 92,983 | ||||
|
| |||||
| 374,634 | ||||||
|
| |||||
| Industrial-8.8% | ||||||
1,820 | Amerco, Inc.(a) | 160,888 | ||||
1,450 | Cummins, Inc.(a) | 127,629 | ||||
2,920 | Littelfuse, Inc.(a) | 125,502 | ||||
| 22 | www.jamesfunds.com |
Table of Contents
| James Long-Short Fund | Schedule of Investments | |
| December 31, 2011 (Unaudited) |
| Shares | Value | |||||
| Industrial (continued) | ||||||
4,000 | Sturm Ruger & Co., Inc.(a) | $133,840 | ||||
1,100 | Timken Co.(a) | 42,581 | ||||
2,220 | TRW Automotive Holdings Corp.*(a) | 72,372 | ||||
|
| |||||
| 662,812 | ||||||
|
| |||||
| Technology-14.0% | ||||||
5,510 | Brightpoint, Inc.*(a) | 59,288 | ||||
13,820 | Deluxe Corp.(a) | 314,543 | ||||
34,365 | Integrated Silicon Solution, Inc.*(a) | 314,096 | ||||
3,500 | Intel Corp.(a) | 84,875 | ||||
7,510 | Kulicke & Soffa Industries, Inc.*(a) | 69,467 | ||||
1,155 | Lockheed Martin Corp.(a) | 93,440 | ||||
2,910 | Newport Corp.*(a) | 39,605 | ||||
5,220 | Symantec Corp.*(a) | 81,693 | ||||
|
| |||||
| 1,057,007 | ||||||
|
| |||||
| Utilities-10.9% | ||||||
5,495 | BCE, Inc.(a) | 228,977 | ||||
1,610 | DTE Energy Co.(a) | 87,664 | ||||
5,510 | Exelon Corp.(a) | 238,969 | ||||
8,465 | Portland General Electric Co.(a) | 214,080 | ||||
21,645 | Vonage Holdings Corp.*(a) | 53,030 | ||||
|
| |||||
| 822,720 | ||||||
|
| |||||
TOTAL COMMON STOCKS | ||||||
(Cost $7,844,056) | 7,911,351 | |||||
|
| |||||
TOTAL INVESTMENT SECURITIES-105.1% | ||||||
(Cost $7,844,056) | 7,911,351 | |||||
OTHER LIABILITIES IN EXCESS OF ASSETS-(5.1)%(a) | (381,287 | ) | ||||
|
| |||||
NET ASSETS-100.0% | $ | 7,530,064 | ||||
|
| |||||
| * | Non-income producing security. |
| (a) | Security position is either entirely or partially held in a segregated account as collateral for line of credit aggregating a total market value of $5,405,886 and cash equivalents of $152,560. |
Ltd.- Limited
REIT - Real Estate Investment Trust
See Notes to Financial Statements.
Semi-Annual Report | December 31, 2011 | 23 |
Table of Contents
| James Advantage Funds | ||
December 31, 2011 (Unaudited) |
| James Balanced: Golden Rainbow Fund | James Small Cap Fund | James Mid Cap Fund | James Micro Cap Fund | James Long-Short Fund | |||||||||||||||
ASSETS: | ||||||||||||||||||||
Investment securities: | ||||||||||||||||||||
At cost | $ | 1,140,210,438 | $ | 105,113,535 | $ | 10,557,944 | $ | 7,051,200 | $ | 7,844,056 | ||||||||||
|
|
|
|
|
|
|
|
|
| |||||||||||
At value | $ | 1,274,378,757 | $ | 128,647,427 | $ | 11,940,945 | $ | 7,675,391 | $ | 7,911,351 | ||||||||||
Cash | 34,217,962 | 11,524,564 | 770,529 | 350,340 | 152,560 | |||||||||||||||
Dividends and interest receivable | 7,001,850 | 144,038 | 20,356 | 6,763 | 10,655 | |||||||||||||||
Receivable for securities sold | 2,858,083 | 42,091 | – | 233,277 | – | |||||||||||||||
Receivable for capital shares sold | 7,390,554 | 1,125,552 | – | – | – | |||||||||||||||
Other assets | 71,357 | – | – | – | – | |||||||||||||||
Total Assets | 1,325,918,563 | 141,483,672 | 12,731,830 | 8,265,771 | 8,074,566 | |||||||||||||||
LIABILITIES: | ||||||||||||||||||||
Loan payable | – | – | – | – | 436,000 | |||||||||||||||
Payable for capital shares redeemed | 588,156 | 19,691 | – | – | – | |||||||||||||||
Payable for securities purchased | 7,877,447 | 3,197,790 | 354,961 | 199,315 | 99,085 | |||||||||||||||
Payable due to broker | – | – | – | – | 1,141 | |||||||||||||||
Accrued expenses: | ||||||||||||||||||||
Management fees | 762,089 | 135,875 | 11,498 | 8,902 | 6,688 | |||||||||||||||
12b-1 distribution and service fees | 228,980 | 27,444 | 2,532 | – | 1,569 | |||||||||||||||
Trustees’ fees | 2,227 | 207 | 26 | 19 | �� | 19 | ||||||||||||||
Other payables | 259,535 | 68 | 5 | – | – | |||||||||||||||
Total Liabilities | 9,718,434 | 3,381,075 | 369,022 | 208,236 | 544,502 | |||||||||||||||
Net Assets | $ | 1,316,200,129 | $ | 138,102,597 | $ | 12,362,808 | $ | 8,057,535 | $ | 7,530,064 | ||||||||||
NET ASSETS CONSIST OF: | ||||||||||||||||||||
Paid-in capital | $ | 1,182,578,959 | $ | 161,891,549 | $ | 11,232,522 | $ | 8,129,171 | $ | 8,071,695 | ||||||||||
Accumulated net investment income/(loss) | 368,040 | (125,279) | 4,652 | 539 | 1,167 | |||||||||||||||
Accumulated net realized loss on investments, securities sold short and translation of assets and liabilities denominated in foreign currency | (899,394) | (47,197,565) | (257,367) | (696,366) | (610,093) | |||||||||||||||
Net unrealized appreciation on investments, securities sold short and translation of assets and liabilities denominated in foreign currency | 134,152,524 | 23,533,892 | 1,383,001 | 624,191 | 67,295 | |||||||||||||||
Net Assets | $ | 1,316,200,129 | $ | 138,102,597 | $ | 12,362,808 | $ | 8,057,535 | $ | 7,530,064 | ||||||||||
See Notes to Financial Statements.
| 24 | www.jamesfunds.com |
Table of Contents
James Advantage Funds | Statements of Assets and Liabilities | |
| December 31, 2011 (Unaudited) |
| James Balanced: Golden Rainbow Fund | James Small Cap Fund | James Mid Cap Fund | James Micro Cap Fund | James Long-Short Fund | ||||||||||||||||
PRICING OF RETAIL CLASS SHARES(a): |
| |||||||||||||||||||
Net assets | $ | 1,112,294,304 | $ | 138,102,597 | $ | 12,362,808 | $ | 8,057,535 | $ | 7,530,064 | ||||||||||
Shares of beneficial interest outstanding (unlimited number of shares authorized, no par) | 54,306,776 | 5,891,920 | 1,186,265 | 748,658 | 783,261 | |||||||||||||||
Net assets value, offering price and redemption price per share | $ | 20.48 | $ | 23.44 | $ | 10.42 | $ | 10.76 | $ | 9.61 | ||||||||||
PRICING OF INSTITUTIONAL CLASS SHARES: | ||||||||||||||||||||
Net assets | $ | 203,905,825 | N/A | N/A | N/A | N/A | ||||||||||||||
Shares of beneficial interest outstanding (unlimited number of shares authorized, no par) | 9,985,177 | N/A | N/A | N/A | N/A | |||||||||||||||
Net assets value, offering price and redemption price per share | $ | 20.42 | N/A | N/A | N/A | N/A | ||||||||||||||
| (a) | James Small Cap Fund, James Mid Cap Fund, James Micro Cap Fund and James Long-Short Fund do not have a share class and will be presented as Retail Class shares throughout this semi-annual report for financial reporting presentation purposes only. |
See Notes to Financial Statements.
Semi-Annual Report | December 31, 2011 | 25 |
Table of Contents
| James Advantage Funds | ||
For the Six Months Ended December 31, 2011 (Unaudited) |
| James Balanced: Golden Rainbow Fund | James Small Cap Fund | James Mid Cap Fund | James Micro Cap Fund | James Long-Short Fund | ||||||||||||||||
INVESTMENT INCOME: | ||||||||||||||||||||
Dividends (Net of withholding taxes of $71,960, $223, $687, $295 and $861, respectively) | $ | 5,862,483 | $ | 928,220 |
| $ | 130,354 | $ | 68,298 | $ | 89,554 | |||||||||
Interest | 7,894,811 | 67 | – | 6 | 163 | |||||||||||||||
Other income | 247,262 | 905 | – | – | – | |||||||||||||||
Total Investment Income | 14,004,556 | 929,192 | 130,354 | 68,304 | 89,717 | |||||||||||||||
EXPENSES: | ||||||||||||||||||||
Management fees | 4,125,041 | 614,878 | 69,777 | 58,404 | 45,003 | |||||||||||||||
12b-1 distribution and service fees -Retail Class | 1,251,068 | 124,281 | 15,225 | – | 10,268 | |||||||||||||||
Dividend and interest expense on securities sold short | – | – | – | – | 14,855 | |||||||||||||||
Administration fee | 379,622 | – | – | – | – | |||||||||||||||
Interest expense | – | – | – | – | 85 | |||||||||||||||
Custodian fees | 59,581 | – | – | – | – | |||||||||||||||
Professional fees | 82,993 | – | – | – | – | |||||||||||||||
Trustee fees | 8,547 | 6,527 | 6,346 | 6,339 | 6,339 | |||||||||||||||
Registration fees | 87,261 | – | – | – | – | |||||||||||||||
Shareholder report printing and mailing | 63,035 | – | – | – | – | |||||||||||||||
Other expenses | 28,711 | – | – | – | – | |||||||||||||||
Total Expenses | 6,085,859 | 745,686 | 91,348 | 64,743 | 76,550 | |||||||||||||||
Net Investment Income | 7,918,697 | 183,506 | 39,006 | 3,561 | 13,167 | |||||||||||||||
REALIZED AND UNREALIZED GAIN/(LOSS) ON INVESTMENTS: |
| |||||||||||||||||||
Net realized gain/(loss) from: | (693,037) | 957,626 | 305,752 | (693,793) | (959,832) | |||||||||||||||
Security transactions | (693,037) | 957,626 | 305,752 | (693,793) | (959,832) | |||||||||||||||
Securities sold short | – | – | – | – | 350,083 | |||||||||||||||
Foreign currency transactions | (82,882) | – | – | – | – | |||||||||||||||
Net change in unrealized appreciation/(depreciation) on investments | 10,292,749 | 597,762 | (1,425,094) | (381,190) | (149,649) | |||||||||||||||
Net change in unrealized appreciation on securities sold short | – | – | – | – | 112,016 | |||||||||||||||
Net change in unrealized depreciation on foreign currency translation | (22,253) | – | – | – | – | |||||||||||||||
Net Realized and Unrealized Gain/(Loss) on Investments | 9,494,577 | 1,555,388 | (1,119,342) | (1,074,983) | (647,382) | |||||||||||||||
Net Increase/(Decrease) in Net Assets Resulting from Operations | $ | 17,413,274 | $ | 1,738,894 | $ | (1,080,336 | ) | $ | (1,071,422) | $ | (634,215) | |||||||||
See Notes to Financial Statements.
| 26 | www.jamesfunds.com |
Table of Contents
James Balanced: Golden Rainbow Fund | Statements of Changes in Net Assets | |
| December 31, 2011 (Unaudited) |
| For the Six Months Ended December 31, 2011 (Unaudited) | For the Year Ended June 30, 2011 | |||||||
FROM OPERATIONS: | ||||||||
Net investment income | $ | 7,918,697 | $ | 10,987,360 | ||||
Net realized gain/(loss) from security transactions and foreign currency transactions | (775,919) | 29,817,361 | ||||||
Net change in unrealized appreciation on investments and foreign currency translation | 10,270,496 | 67,441,210 | ||||||
Net Increase in net assets resulting from operations | 17,413,274 | 108,245,931 | ||||||
FROM DISTRIBUTIONS TO SHAREHOLDERS: | ||||||||
Retail Class: | ||||||||
Dividends from net investment income | (6,253,760) | (9,200,356) | ||||||
From net realized gain on investments | (15,647,688) | (5,605,358) | ||||||
Institutional Class: | ||||||||
Dividends from net investment income | (1,412,458) | (1,681,618) | ||||||
Dividends from net realized gain on investments | (2,791,260) | (647,555) | ||||||
Decrease in net assets from distributions to shareholders | (26,105,166) | (17,134,887) | ||||||
FROM CAPITAL SHARE TRANSACTIONS: | ||||||||
Retail Class Shares: | ||||||||
Proceeds from shares sold | 314,413,175 | 412,093,247 | ||||||
Net asset value of shares issued in reinvestment of distributions to shareholders | 20,681,970 | 14,012,602 | ||||||
Payments for shares redeemed | (152,498,411) | (142,784,534) | ||||||
Net increase in net assets from Retail Class capital share transactions | 182,596,734 | 283,321,315 | ||||||
Institutional Class Shares: | ||||||||
Proceeds from shares sold | 85,244,161 | 75,940,296 | ||||||
Net asset value of shares issued in reinvestment of distributions to shareholders | 2,514,876 | 1,372,732 | ||||||
Payments for shares redeemed | (14,030,257) | (16,355,839) | ||||||
Net increase in net assets from Institutional Class capital share transactions | 73,728,780 | 60,957,189 | ||||||
Total Increase in Net Assets | 247,633,622 | 435,389,548 | ||||||
NET ASSETS: | ||||||||
Beginning of period | 1,068,566,507 | 633,176,959 | ||||||
End of period | $ | 1,316,200,129 | $ | 1,068,566,507 | ||||
| ||||||||
Accumulated Net Investment Income | $ | 368,040 | $ | 115,561 | ||||
See Notes to Financial Statements.
Semi-Annual Report | December 31, 2011 | 27 |
Table of Contents
| Statements of Changes in Net Assets | James Balanced: Golden Rainbow Fund | |
| For the Six Months Ended December 31, 2011 (Unaudited) | For the Year Ended | |||||||
SUMMARY OF CAPITAL SHARE ACTIVITY: | ||||||||
Retail Class Shares: | ||||||||
Shares sold | 15,436,846 | 20,626,826 | ||||||
Shares issued in reinvestment of distributions to shareholders | 1,018,987 | 697,794 | ||||||
Shares redeemed | (7,544,667) | (7,175,417) | ||||||
Net increase in shares outstanding | 8,911,166 | 14,149,203 | ||||||
Shares outstanding, beginning of period | 45,395,610 | 31,246,407 | ||||||
Shares outstanding, end of period | 54,306,776 | 45,395,610 | ||||||
Institutional Class Shares: | ||||||||
Shares sold | 4,201,684 | 3,784,441 | ||||||
Shares issued in reinvestment of distributions to shareholders | 124,153 | 68,068 | ||||||
Shares redeemed | (691,314) | (813,206) | ||||||
Net increase in shares outstanding | 3,634,523 | 3,039,303 | ||||||
Shares outstanding, beginning of period | 6,350,654 | 3,311,351 | ||||||
Shares outstanding, end of period | 9,985,177 | 6,350,654 | ||||||
See Notes to Financial Statements.
| 28 | www.jamesfunds.com |
Table of Contents
James Small Cap Fund | Statements of Changes in Net Assets | |
For the Six Months Ended | For the Year Ended | |||||||
FROM OPERATIONS: | ||||||||
Net investment income | $ | 183,506 | $ | 175,856 | ||||
Net realized gain from security transactions | 957,626 | 11,460,628 | ||||||
Net change in unrealized appreciation on investments | 597,762 | 11,746,072 | ||||||
Net Increase in net assets resulting from operations | 1,738,894 | 23,382,556 | ||||||
FROM DISTRIBUTIONS TO SHAREHOLDERS: | ||||||||
Retail Class: | ||||||||
Dividends from net investment income | (159,999) | (120,000) | ||||||
Decrease in net assets from distributions to shareholders | (159,999) | (120,000) | ||||||
FROM CAPITAL SHARE TRANSACTIONS: | ||||||||
Retail Class Shares: | ||||||||
Proceeds from shares sold | 69,606,209 | 20,729,996 | ||||||
Net asset value of shares issued in reinvestment of distributions to shareholders | 148,123 | 116,325 | ||||||
Payments for shares redeemed | (14,735,443) | (28,046,892) | ||||||
Net increase/(decrease) in net assets from Retail Class capital share transactions | 55,018,889 | (7,200,571) | ||||||
Total Increase in Net Assets | 56,597,784 | 16,061,985 | ||||||
NET ASSETS: | ||||||||
Beginning of period | 81,504,813 | 65,442,828 | ||||||
End of period | $ | 138,102,597 | $ | 81,504,813 | ||||
Accumulated Net Investment Loss | $ | (125,279) | $ | (148,786) | ||||
SUMMARY OF CAPITAL SHARE ACTIVITY: | ||||||||
Retail Class Shares: | ||||||||
Shares sold | 3,144,297 | 992,906 | ||||||
Shares issued in reinvestment of distributions to shareholders | 6,268 | 5,446 | ||||||
Shares redeemed | (672,316) | (1,322,978) | ||||||
Net increase/(decrease) in shares outstanding | 2,478,249 | (324,626) | ||||||
Shares outstanding, beginning of period | 3,413,671 | 3,738,297 | ||||||
Shares outstanding, end of period | 5,891,920 | 3,413,671 | ||||||
See Notes to Financial Statements.
Semi-Annual Report | December 31, 2011 | 29 |
Table of Contents
Statements of Changes in Net Assets | James Mid Cap Fund | |
For the Six Months Ended | For the Year Ended | |||||||
FROM OPERATIONS: | ||||||||
Net investment income | $ | 39,006 | $ | 17,133 | ||||
Net realized gain from security transactions | 305,752 | 1,078,644 | ||||||
Net change in unrealized appreciation/(depreciation) on investments | (1,425,094) | 2,428,716 | ||||||
Net Increase/(Decrease) in net assets resulting from operations | (1,080,336) | 3,524,493 | ||||||
FROM DISTRIBUTIONS TO SHAREHOLDERS: | ||||||||
Retail Class: | ||||||||
Dividends from net investment income | (106,000) | (48,621) | ||||||
Decrease in net assets from distributions to shareholders | (106,000) | (48,621) | ||||||
FROM CAPITAL SHARE TRANSACTIONS: | ||||||||
Retail Class Shares: | ||||||||
Proceeds from shares sold | 1,135,610 | 3,641,912 | ||||||
Net asset value of shares issued in reinvestment of distributions to shareholders | 101,121 | 47,281 | ||||||
Payments for shares redeemed | (1,090,528) | (3,259,497) | ||||||
Net increase in net assets from Retail Class capital share transactions | 146,203 | 429,696 | ||||||
Total Increase/(Decrease) in Net Assets | (1,040,133) | 3,905,568 | ||||||
NET ASSETS: | ||||||||
Beginning of period | 13,402,941 | 9,497,373 | ||||||
End of period | $ | 12,362,808 | $ | 13,402,941 | ||||
Accumulated Net Investment Income | $ | 4,652 | $ | 71,646 | ||||
SUMMARY OF CAPITAL SHARE ACTIVITY: | ||||||||
Retail Class Shares: | ||||||||
Shares sold | 107,333 | 375,514 | ||||||
Shares issued in reinvestment of distributions to shareholders | 9,640 | 4,434 | ||||||
Shares redeemed | (108,665) | (307,726) | ||||||
Net increase in shares outstanding | 8,308 | 72,222 | ||||||
Shares outstanding, beginning of period | 1,177,957 | 1,105,735 | ||||||
Shares outstanding, end of period | 1,186,265 | 1,177,957 | ||||||
See Notes to Financial Statements.
| 30 | www.jamesfunds.com |
Table of Contents
| James Micro Cap Fund | Statements of Changes in Net Assets |
For the Six Months Ended (Unaudited) | For the Year Ended June 30, 2011(a) | |||||||
FROM OPERATIONS: | ||||||||
Net investment income/(loss) | $ | 3,561 | $ | (20,602) | ||||
Net realized gain/(loss) from security transactions | (693,793) | 55,986 | ||||||
Net change in unrealized appreciation/(depreciation) on investments | (381,190) | 1,005,381 | ||||||
Net Increase/(Decrease) in net assets resulting from operations | (1,071,422) | 1,040,765 | ||||||
FROM DISTRIBUTIONS TO SHAREHOLDERS: | ||||||||
Retail Class: | ||||||||
From net realized gain on investments | (40,982) | – | ||||||
Decrease in net assets from distributions to shareholders | (40,982) | – | ||||||
FROM CAPITAL SHARE TRANSACTIONS: | ||||||||
Retail Class Shares: | ||||||||
Proceeds from shares sold | 1,076,007 | 8,959,456 | ||||||
Net asset value of shares issued in reinvestment of distributions to shareholders | 40,846 | – | ||||||
Payments for shares redeemed, net of redemption fees | (1,691,727) | (255,408) | ||||||
Net increase/(decrease) in net assets from Retail Class capital share transactions | (574,874) | 8,704,048 | ||||||
Total Increase/(Decrease) in Net Assets | (1,687,278) | 9,744,813 | ||||||
NET ASSETS: | ||||||||
Beginning of period | 9,744,813 | – | ||||||
End of period | $ | 8,057,535 | $ | 9,744,813 | ||||
Accumulated Net Investment Income/(Loss) | $ | 539 | $ | (3,022) | ||||
SUMMARY OF CAPITAL SHARE ACTIVITY: | ||||||||
Retail Class Shares: | ||||||||
Shares sold | 95,133 | 839,625 | ||||||
Shares issued in reinvestment of distributions to shareholders | 3,927 | – | ||||||
Shares redeemed | (168,287) | (21,740) | ||||||
Net increase/(decrease) in shares outstanding | (69,227) | 817,885 | ||||||
Shares outstanding, beginning of period | 817,885 | – | ||||||
Shares outstanding, end of period | 748,658 | 817,885 | ||||||
| (a) | Fund commenced operations on July 1, 2010. |
See Notes to Financial Statements.
Semi-Annual Report | December 31, 2011 | 31 |
Table of Contents
| Statements of Changes in Net Assets | James Long-Short Fund |
For the Six Months Ended December 31, 2011 | For the Period Ended | |||||||
FROM OPERATIONS: | ||||||||
Net investment income/(loss) | $ | 13,167 | $ | (4,002) | ||||
Net realized gain/(loss) from security transactions and securities sold short | (609,749) | 2 | ||||||
Net change in unrealized appreciation/(depreciation) on investments and securities sold short | (37,633) | 104,928 | ||||||
Net Increase/(Decrease) in net assets resulting from operations | (634,215) | 100,928 | ||||||
FROM DISTRIBUTIONS TO SHAREHOLDERS: | ||||||||
Retail Class: | ||||||||
Dividends from net investment income | (12,000) | – | ||||||
Decrease in net assets from distributions to shareholders | (12,000) | – | ||||||
FROM CAPITAL SHARE TRANSACTIONS: | ||||||||
Retail Class Shares: | ||||||||
Proceeds from shares sold | 780,851 | 10,619,105 | ||||||
Net asset value of shares issued in reinvestment of distributions to shareholders | 12,000 | – | ||||||
Payments for shares redeemed | (3,334,890) | (1,715) | ||||||
Net increase/(decrease) in net assets from Retail Class capital share transactions | (2,542,039) | 10,617,390 | ||||||
Total Increase/(Decrease) in Net Assets | (3,188,254) | 10,718,318 | ||||||
NET ASSETS: | ||||||||
Beginning of period | 10,718,318 | – | ||||||
End of period | $ | 7,530,064 | $ | 10,718,318 | ||||
Accumulated Net Investment Income | $ | 1,167 | $ | – | ||||
SUMMARY OF CAPITAL SHARE ACTIVITY: | ||||||||
Retail Class Shares: | ||||||||
Shares sold | 81,822 | 1,061,053 | ||||||
Shares issued in reinvestment of distributions to shareholders | 1,241 | – | ||||||
Shares redeemed | (360,685) | (170) | ||||||
Net increase/(decrease) in shares outstanding | (277,622) | 1,060,883 | ||||||
Shares outstanding, beginning of period | 1,060,883 | – | ||||||
Shares outstanding, end of period | 783,261 | 1,060,883 | ||||||
| (a) | Fund commenced operations on May 23, 2011. |
See Notes to Financial Statements.
| 32 | www.jamesfunds.com |
Table of Contents
| James Balanced: Golden Rainbow Fund – Retail Class | Financial Highlights | |
| For a share outstanding throughout the periods indicated. |
For the Six Months Ended December 31, 2011 | For the Year Ended | For the Year Ended | For the Year Ended June 30, 2009 | For the Year Ended | For the Year Ended | |||||||||||||||||||
Net asset value - beginning of period | $ | 20.66 | $ | 18.32 | $ | 16.69 | $ | 18.09 | $ | 18.33 | $ | 17.32 | ||||||||||||
Income/(Loss) from investment operations: |
| |||||||||||||||||||||||
Net investment income | 0.13 | 0.24 | 0.30 | 0.28 | 0.40 | 0.39 | ||||||||||||||||||
Net realized and unrealized gain/(loss) on investments | 0.11 | 2.50 | 1.63 | (1.40) | 0.11 | 1.34 | ||||||||||||||||||
Total from investment operations | 0.24 | 2.74 | 1.93 | (1.12) | 0.51 | 1.73 | ||||||||||||||||||
Less distributions: | ||||||||||||||||||||||||
From net investment income | (0.12) | (0.24) | (0.30) | (0.28) | (0.40) | (0.40) | ||||||||||||||||||
From net realized gain on investments | (0.30) | (0.16) | – | (0.00) | (a) | (0.35) | (0.32) | |||||||||||||||||
Total distributions | (0.42) | (0.40) | (0.30) | (0.28) | (0.75) | (0.72) | ||||||||||||||||||
Net asset value at end of period | $ | 20.48 | $ | 20.66 | $ | 18.32 | $ | 16.69 | $ | 18.09 | $ | 18.33 | ||||||||||||
Total return | 1 ..23% | (b) | 15 .01% | 11 .60% | (6 .19)% | 2 .76% | 10 .13% | |||||||||||||||||
Net assets, end of period (in thousands) | $ | 1,112,294 | $ | 937,696 | $ | 572,484 | $ | 537,358 | $ | 478,694 | $ | 341,664 | ||||||||||||
Ratios/Supplemental Data: | ||||||||||||||||||||||||
Ratio of net expenses to average net assets | 1 .08%(c) | 1 .12% | 1 .19% | 1 .16% | 1 .18% | 1 .18% | ||||||||||||||||||
Ratio of net investment income to average net assets | 1 .33%(c) | 1 .27% | 1 .68% | 1 .68% | 2 .20% | 2 .24% | ||||||||||||||||||
Portfolio turnover rate | 17%(b) | 36% | 31% | 72% | 53% | 92% | ||||||||||||||||||
| (a) | Amount rounds to less than $(0.005) per share. |
| (b) | Not Annualized. |
| (c) | Annualized. |
See Notes to Financial Statements.
Semi-Annual Report | December 31, 2011 | 33 |
Table of Contents
| Financial Highlights | James Balanced: Golden Rainbow Fund – Institutional Class | |
For a share outstanding throughout the periods indicated. | ||
For the Six Months Ended December 31, 2011 | For the Year Ended June 30, 2011 | For the Year Ended | For the Period Ended | |||||||||||||
Net asset value - beginning of period | $ | 20.61 | $ | 18.33 | $ | 16.69 | $ | 14.80 | ||||||||
Income from investment operations: | ||||||||||||||||
Net investment income | 0.17 | 0.32 | 0.34 | 0.09 | ||||||||||||
Net realized and unrealized gain on investments | 0.10 | 2.47 | 1.65 | 1.94 | ||||||||||||
Total from investment operations | 0.27 | 2.79 | 1.99 | 2.03 | ||||||||||||
Less distributions: | ||||||||||||||||
From net investment income | (0.16) | (0.35) | (0.35) | (0.14) | ||||||||||||
From net realized gain on investments | (0.30) | (0.16) | – | – | ||||||||||||
Total distributions | (0.46) | (0.51) | (0.35) | (0.14) | ||||||||||||
Net asset value at end of period | $ | 20.42 | $ | 20.61 | $ | 18.33 | $ | 16.69 | ||||||||
Total return | 1 ..36% | (b) | 15 .27% | 11.94% | 13.75% | (b) | ||||||||||
Net assets, end of period (in thousands) | $ | 203,906 | $ | 130,870 | $ | 60,693 | $ | 115 | ||||||||
Ratios/Supplemental Data: | ||||||||||||||||
Ratio of net expenses to average net assets | 0 ..83% | (c) | 0 .87% | 1 .06% | 0 ..95% | (c) | ||||||||||
Ratio of net investment income to average net assets | 1 ..59% | (c) | 1 .52% | 2 .06% | 1.63% | (c) | ||||||||||
Portfolio turnover rate | 17% | (b) | 36% | 31% | 72% | (b) | ||||||||||
| (a) | Fund commenced operations on March 2, 2009. |
| (b) | Not Annualized. |
| (c) | Annualized. |
See Notes to Financial Statements.
| 34 | www.jamesfunds.com |
Table of Contents
| James Small Cap Fund | Financial Highlights | |
| For a share outstanding throughout the periods indicated. | ||
For the Six Months Ended December 31, 2011 | For the Year Ended June 30, 2011 | For the Year Ended June 30, 2010 | For the Year Ended June 30, 2009 | For the Year Ended June 30, 2008 | For the Year Ended | |||||||||||||||||||
Net asset value - beginning of period | $ | 23.88 | $ | 17.51 | $ | 14.18 | $ | 20.04 | $ | 24.56 | $ | 23.28 | ||||||||||||
Income/(Loss) from investment operations: | ||||||||||||||||||||||||
Net investment income | 0.05 | 0.05 | 0.02 | 0.06 | 0.10 | 0.11 | ||||||||||||||||||
Net realized and unrealized gain/(loss) on investments | (0.46) | 6.35 | 3.33 | (5.86) | (4.52) | 1.50 | ||||||||||||||||||
Total from investment operations | (0.41) | 6.40 | 3.35 | (5.80) | (4.42) | 1.61 | ||||||||||||||||||
Less distributions: | ||||||||||||||||||||||||
From net investment income | (0.03) | (0.03) | – | (0.06) | (0.10) | (0.11) | ||||||||||||||||||
From net realized gain on investments | – | – | – | – | – | (0.22) | ||||||||||||||||||
From tax return of capital | – | – | (0.02) | – | – | – | ||||||||||||||||||
Total distributions | (0.03) | (0.03) | (0.02) | (0.06) | (0.10) | (0.33) | ||||||||||||||||||
Paid-in capital from redemption fees(a) | – | – | – | – | – | 0.00 | (b) | |||||||||||||||||
Net asset value at end of period | $ | 23.44 | $ | 23.88 | $ | 17.51 | $ | 14.18 | $ | 20.04 | $ | 24.56 | ||||||||||||
Total return | (1.69) | %(c) | 36.59 | % | 23.61 | % | (28.91) | % | (18.03) | % | 6.97 | % | ||||||||||||
Net assets, end of period (in thousands) | $ | 138,103 | $ | 81,505 | $ | 65,443 | $ | 99,801 | $ | 177,915 | $ | 327,467 | ||||||||||||
Ratios/Supplemental Data: | ||||||||||||||||||||||||
Ratio of net expenses to average net assets | 1.50 | %(d) | 1.50 | % | 1.50 | % | 1.50 | % | 1.50 | % | 1.50 | % | ||||||||||||
Ratio of net investment income to average net assets | 0.37 | %(d) | 0.23 | % | 0.08 | % | 0.37 | % | 0.42 | % | 0.54 | % | ||||||||||||
Portfolio turnover rate | 24 | %(c) | 60 | % | 38 | % | 46 | % | 54 | % | 104 | % | ||||||||||||
| (a) | Amount calculated based on average shares outstanding throughout the period. Effective February 21, 2007, the redemption fee was eliminated. |
| (b) | Amount rounds to less than $0.005 per share. |
| (c) | Not Annualized. |
| (d) | Annualized. |
See Notes to Financial Statements.
Semi-Annual Report | December 31, 2011 | 35 |
Table of Contents
Financial Highlights | James Mid Cap Fund | |
For a share outstanding throughout the periods indicated. |
For the Six Months Ended | For the Year Ended | For the Year | For the Year | For the Year | For the Year Ended June 30, 2007(a) | |||||||||||||||||||
Net asset value - beginning of period | $ | 11.38 | $ | 8.59 | $ | 7.05 | $ | 10.66 | $ | 11.70 | $ | 10.00 | ||||||||||||
Income/(Loss) from investment operations: |
| |||||||||||||||||||||||
Net investment income | 0.03 | 0.01 | 0.02 | 0.03 | | 0.00 | (b) | 0.04 | ||||||||||||||||
Net realized and unrealized gain/(loss) on investments | (0.90) | 2.82 | 1.54 | (3.61) | (1.01) | 1.70 | ||||||||||||||||||
Total from investment operations | (0.87) | 2.83 | 1.56 | (3.58) | (1.01) | 1.74 | ||||||||||||||||||
Less distributions: | ||||||||||||||||||||||||
From net investment income | (0.09) | (0.04) | (0.02) | (0.03) | (0.01) | – | ||||||||||||||||||
From net realized gain on investments | – | – | – | – | (0.02) | (0.04) | ||||||||||||||||||
Total distributions | (0.09) | (0.04) | (0.02) | (0.03) | (0.03) | (0.04) | ||||||||||||||||||
Paid-in capital from redemption fees(c) | – | – | – | – | – | 0.00 | (b) | |||||||||||||||||
Net asset value at end of period | $ | 10.42 | $ | 11.38 | $ | 8.59 | $ | 7.05 | $ | 10.66 | $ | 11.70 | | |||||||||||
Total return | (7.65) | %(d) | 32.97 | % | 22.13 | % | (33.51) | % | (8.61) | % | 17.41 | % | ||||||||||||
Net assets, end of period (in thousands) | $ | 12,363 | $ | 13,403 | $ | 9,497 | $ | 4,438 | $ | 6,002 | $ | 6,441 | ||||||||||||
Ratios/Supplemental Data: |
| |||||||||||||||||||||||
Ratio of net expenses to average net assets | 1.50 | %(e) | 1.50 | % | 1.50 | % | 1.50 | % | 1.48 | % | 1.49 | % | ||||||||||||
Ratio of net investment income to average net assets | 0.64 | %(e) | 0.13 | % | 0.24 | % | 0.48 | % | 0.01 | % | 0.40 | % | ||||||||||||
Portfolio turnover rate | 15 | %(d) | 56 | % | 37 | % | 38 | % | 55 | % | 53 | % | ||||||||||||
| (a) | Fund commenced operations on June 30, 2006. |
| (b) | Amount rounds to less than $0.005 per share. |
| (c) | Amount calculated based on average shares outstanding throughout the period. Effective February 21, 2007, the redemption fee was eliminated. |
| (d) | Not Annualized. |
| (e) | Annualized. |
See Notes to Financial Statements.
| 36 | www.jamesfunds.com |
Table of Contents
| Financial Highlights | ||
For a share outstanding throughout the periods indicated. |
| For the Six Months Ended | For the Year Ended June 30, 2011(a) | ||||||
Net asset value - beginning of period | $ | 11.91 | $ | 10.00 | ||||
Income/(Loss) from investment operations: | ||||||||
Net investment income/(loss) | 0.00 | (b) | (0.03) | |||||
Net realized and unrealized gain/(loss) on investments | (1.09) | 1.94 | ||||||
Total from investment operations | (1.09) | 1.91 | ||||||
Less distributions: | ||||||||
From net investment income | – | – | ||||||
From net realized gain on investments | (0.06) | – | ||||||
Total distributions | (0.06) | – | ||||||
Net asset value at end of period | $ | 10.76 | $ | 11.91 | ||||
Total return | (9 .17)% | (c) | 19.10 | % | ||||
Net assets, end of period (in thousands) | $ | 8,058 | $ | 9,745 | ||||
Ratios/Supplemental Data: | ||||||||
Ratio of net expenses to average net assets | 1 .50% | (d) | 1 .50 | % | ||||
Ratio of net investment income/(loss) to average net assets | 0 .08% | (d) | (0.31) | % | ||||
Portfolio turnover rate | 51% | (c) | 69 | % | ||||
| (a) | Fund commenced operations on July 1, 2010. |
| (b) | Amount rounds to less than $0.005 per share. |
| (c) | Not Annualized. |
| (d) | Annualized. |
See Notes to Financial Statements.
Semi-Annual Report | December 31, 2011 | 37 |
Table of Contents
Financial Highlights | James Long-Short Fund | |
| For a share outstanding throughout the period indicated. |
| For the Six Months Ended | For the Period Ended June 30, 2011(a) | ||||||
Net asset value - beginning of period | $ | 10.10 | $ | 10.00 | ||||
Income/(Loss) from investment operations: |
| |||||||
Net investment income/(loss) | 0.02 | (0.00) | (b) | |||||
Net realized and unrealized gain/(loss) on investments | (0.49) | 0.10 | ||||||
Total from investment operations | (0.47) | 0.10 | ||||||
Less distributions: | ||||||||
From net investment income | (0.02) | – | ||||||
From net realized gain on investments | – | – | ||||||
Total distributions | (0.02) | – | ||||||
Net asset value at end of period | $ | 9.61 | $ | 10.10 | ||||
Total return | (4 .70)% | (c) | 1 .00% | (c) | ||||
Net assets, end of period (in thousands) | $ | 7,530 | $ | 10,718 | ||||
Ratios/Supplemental Data: | ||||||||
Ratio of net expenses to average net assets(d) | 1 .86% | (e) | 1 .73% | (e) | ||||
Ratio of net investment income/(loss) to average net assets | 0 .32% | (e) | (1 .03)% | (e) | ||||
Portfolio turnover rate | 110% | (c) | 0% | (c) | ||||
| (a) | Fund commenced operations on May 23, 2011. |
| (b) | Amount rounds to less than $0.005 per share. |
| (c) | Not Annualized. |
| (d) | Dividend and interest expense on securities sold short totaled 0.36% (annualized) and 0.23% (annualized) of average net assets for the six months ended December 31, 2011 and the period ended June 30, 2011, respectively. |
| (e) | Annualized. |
See Notes to Financial Statements.
| 38 | www.jamesfunds.com |
Table of Contents
James Advantage Funds | Notes to Financial Statements | |
| December 31, 2011 (Unaudited) |
1. GENERAL INFORMATION AND SIGNIFICANT
ACCOUNTING POLICIES
James Balanced: Golden Rainbow Fund, James Small Cap Fund and James Mid Cap Fund are each a diversified series of James Advantage Funds (the “Trust”), and James Micro Cap Fund and James Long-Short Fund are each a non-diversified series of the Trust (individually a “Fund,” collectively the “Funds”). The Trust is an open-end management investment company that was organized as an Ohio business trust on August 29, 1997. The Trust is registered under the Investment Company Act of 1940 (the “1940 Act”). James Balanced: Golden Rainbow Fund was originally organized as a series of the Flagship Admiral Funds Inc., a Maryland corporation. On June 26, 1998, pursuant to an Agreement and Plan of Reorganization, James Balanced: Golden Rainbow Fund was restructured through a tax-free reorganization as a series of the Trust. The James Small Cap Fund commenced its public offering of shares on October 2, 1998. The James Mid Cap Fund commenced its public offering of shares on June 30, 2006. Effective March 2, 2009, James Balanced: Golden Rainbow began offering a new class of shares: the Institutional Class. The initial class of shares is now referred to as the Retail Class. Each class of James Balanced: Golden Rainbow Fund represents an interest in the same portfolio of investments and has the same rights, but differs primarily in distribution fees and shareholder features. The Retail Class shares are subject to distribution (12b-1) fees but have a lower minimum investment requirement and offer certain shareholder services not available to Institutional Class shareholders. The Institutional Class shares are not subject to distribution (12b-1) fees and are available only through investment advisers and bank trust departments that have made arrangements for shares of all of their clients investing in the Fund to be held in an omnibus account (as well as other entities that are approved by management of the Trust). The James Micro Cap Fund commenced its public offering of shares on July 1, 2010. The James Long-Short Fund commenced its public offering of shares on May 23, 2011.
James Balanced: Golden Rainbow Fund seeks to provide total return through a combination of growth and income and preservation of capital in declining markets. The Fund seeks to achieve its objective by investing primarily in common stocks and/or debt securities that the Fund’s adviser, James Investment Research, Inc. (“James” or the “Adviser”), believes are undervalued.
James Small Cap Fund seeks to provide long-term capital appreciation. The Fund seeks to achieve its objective by investing primarily in common stocks of small capitalization companies. James Mid Cap Fund seeks to
provide long-term capital appreciation. The Fund seeks to achieve its objective by investing primarily in common stocks of mid capitalization companies.
James Mid Cap Fund seeks to provide long-termcapital appreciation.The Fund seeks to achieve its objective by investing primarily in common stocks of mid capitalization companies.
James Micro Cap Fund seeks to provide long-term capital appreciation. The Fund seeks to achieve its objective by investing primarily in common stocks of micro capitalization companies.
James Long-Short Fund seeks to provide long-term capital appreciation. The Fund seeks to achieve its objective by investing primarily in foreign and domestic equity securities that the Adviser
believes are undervalued and more likely to appreciate, and by selling short equity securities that the Adviser believes are overvalued and more likely to depreciate. The Fund also may take long positions in domestic and foreign fixed income securities that the Adviser believes are more likely to appreciate in the interest rate and spread environment anticipated by the Adviser, and short positions in fixed income securities that the Adviser believes are more likely to depreciate in the interest rate and spread environment anticipated by the Adviser. The Fund seeks to achieve positive returns on both the long positions and short positions that it takes in various securities.
The following is a summary of significant accounting policies followed by the Funds in preparation of their financial statements, in accordance with accounting principles generally accepted in the United States of America (“GAAP”).
Share Valuation
The net asset value per share of each Fund, other than the James Balanced: Golden Rainbow Fund, is calculated daily by dividing the total value of the Fund’s assets, less liabilities, by the number of shares outstanding. The net asset value per share of each class of shares of the James Balanced: Golden Rainbow Fund is calculated daily by dividing the total value of the Fund’s assets attributable to that class, less liabilities attributable to that class, by the number of outstanding shares of that class.
Securities Valuation
The Funds’ portfolio securities, including short positions, are valued as of the close of the New York Stock Exchange (“NYSE”) (generally, 4:00 p.m., Eastern time) on each day that the NYSE is open for business and on any other day that the Fair Valuation Policy would dictate. Equity securities that are traded on any exchange, including closed-end funds and exchange-traded funds, are valued at the last quoted sale price. Lacking a last sale price, a security is valued at its last bid price except when, in James’s opinion, the last bid price does not accurately reflect the current value of the security. Securities that are traded on the NASDAQ over-the-counter market are valued at their NASDAQ Official Closing Price (“NOCP”) for all NASDAQ National Market (“NNM”) and NASDAQ Capital Market® securities. When market quotations are not readily available, if an event occurs after the close of the trading market (but before the time as of which a Fund calculates its net asset value) that materially affects a security’s value, or when James determines that the market quotation does not accurately reflect the current value or when a non-144A restricted security is being valued, that security will be valued at its fair value as determined in good faith in conformity with guidelines adopted by and subject to review of the Board of Trustees. The Funds may use pricing services to determine market value for securities. Fixed income securities will be valued by an independent, recognized pricing service, which determines valuations based upon market transactions for normal, institutional-size trading units of securities or a matrix method which considers yield or price of comparable bonds provided by a pricing service. If the Adviser decides that a price provided by the pricing service does not accurately reflect the fair market value of the securities or when prices are not readily available from a pricing service, those securities will be priced at fair value as determined in good faith by the Adviser. Short-term investments in fixed-income securities with maturities of less than 60 days when acquired, or which subsequently are within 60 days of maturity, are valued by using the amortized cost method of valuation, which the Board of Trustees has determined will approximate fair value.
Semi-Annual Report | December 31, 2011 | 39 |
Table of Contents
Notes to Financial Statements | James Advantage Funds | |
| December 31, 2011 (Unaudited) |
For valuation purposes, quotations of foreign securities in a foreign currency are converted to U.S. dollar equivalents at the time of pricing the Funds. In computing the net asset value of the Funds by the fund accounting service provider, ALPS Fund Services, Inc., the values of foreign portfolio securities are generally based upon market quotations which, depending upon the exchange or market, may be last sale price last bid price or the average of the last bid and asked prices as of, in each case, the close of the appropriate exchange or another designated time.
The calculation of the share price of each Fund that holds foreign securities in its portfolio does not take place contemporaneously with the determination of the values of many of the foreign portfolio securities used in such calculation. Events affecting the values of foreign portfolio securities that occur between the time their prices are determined and the calculation of the Fund’s share price will be taken into account by the Adviser, subject to review by the Board of Trustees, in the determination of the value of those securities.
In accordance with the Trust’s good faith pricing guidelines, James is required to consider all appropriate factors relevant to the value of securities for which it has determined other pricing sources are not available or reliable as described above. There is no single standard for determining fair value, since fair value depends upon the circumstances of each individual case. As a general principle, the current fair value of an issue of securities being valued by the Adviser
would appear to be the amount that the owner might reasonably expect to receive for them upon their current sale. Methods which are in accordance with this principle may, for example, be based on (i) a multiple of earnings, (ii) a discount from market of a similar freely traded security (including a derivative security or a basket of securities traded on other markets, exchanges or among dealers), or (iii) yield to maturity with respect to debt issues, or a combination of these and other methods.
Various inputs are used in determining the value of the Funds’ investments. These inputs are summarized in the three broad levels listed below:
Level 1 | - | Unadjusted quoted prices in active markets for identical, unrestricted assets or liabilities that a Fund has the ability to access at the measurement date; | ||
Level 2 | - | Quoted prices which are not active, quoted prices for similar assets or liabilities in active markets or input other than quoted prices that are observable (either directly or indirectly) for substantially the full term of the asset or liability; and | ||
Level 3 | - | Significant unobservable prices or inputs (including a Fund’s own assumptions in determining the fair value of investments) where there is little or no market activity for the asset or liability at the measurement date. |
The inputs or methodologies used for valuing securities are not necessarily an indication of the risk associated with investing in those securities. For example, securities maturing within 60 days of the reporting date are valued using amortized cost, in accordance with rules under the 1940 Act. Generally, amortized cost approximates the current fair value of a security, but since the value is not obtained from a quoted price in an active market, such securities are reflected as Level 2.
The following is a summary of the inputs used to value the Funds’ investments as of December 31, 2011:
| James Balanced: Golden Rainbow Fund | ||||||||||||||||
| Valuation Inputs | ||||||||||||||||
| Investments in Securities at Value* | Level 1 | Level 2 | Level 3 | Total | ||||||||||||
Common Stocks | $ | 600,525,131 | $ | – | $ | – | $ | 600,525,131 | ||||||||
Closed-End Funds | 938,050 | – | – | 938,050 | ||||||||||||
Exchange Traded Funds | 15,278,594 | – | – | 15,278,594 | ||||||||||||
Preferred Stocks | 340,710 | – | – | 340,710 | ||||||||||||
Corporate Bonds | – | 53,415,441 | – | 53,415,441 | ||||||||||||
U.S. Government Agencies | – | 13,900,783 | – | 13,900,783 | ||||||||||||
U.S. Treasury Bonds & Notes | – | 511,151,180 | – | 511,151,180 | ||||||||||||
Foreign Bonds | – | 44,957,015 | – | 44,957,015 | ||||||||||||
Municipal Bonds | – | 33,871,853 | – | 33,871,853 | ||||||||||||
Total | $ | 617,082,485 | $ | 657,296,272 | $ | – | $ | 1,274,378,757 | ||||||||
| 40 | www.jamesfunds.com |
Table of Contents
James Advantage Funds | Notes to Financial Statements | |
| December 31, 2011 (Unaudited) |
James Small Cap Fund
| Valuation Inputs | ||||||||||||||||
| Investments in Securities at Value* | Level 1 | Level 2 | Level 3 | Total | ||||||||||||
Common Stocks | $ | 128,647,427 | $ | – | $ | – | $ | 128,647,427 | ||||||||
Total | $ | 128,647,427 | $ | – | $ | – | $ | 128,647,427 | ||||||||
| ||||||||||||||||
James Mid Cap Fund
| ||||||||||||||||
| Valuation Inputs | ||||||||||||||||
| Investments in Securities at Value* | Level 1 | Level 2 | Level 3 | Total | ||||||||||||
Common Stocks | $ | 11,723,263 | $ | – | $ | – | $ | 11,723,263 | ||||||||
Exchange Traded Funds | 217,682 | – | – | 217,682 | ||||||||||||
Total | $ | 11,940,945 | $ | – | $ | – | $ | 11,940,945 | ||||||||
| ||||||||||||||||
James Micro Cap Fund
| ||||||||||||||||
| Valuation Inputs | ||||||||||||||||
| Investments in Securities at Value* | Level 1 | Level 2 | Level 3 | Total | ||||||||||||
Common Stocks | $ | 7,675,391 | $ | – | $ | – | $ | 7,675,391 | ||||||||
Total | $ | 7,675,391 | $ | – | $ | – | $ | 7,675,391 | ||||||||
| ||||||||||||||||
James Long-Short Fund
| ||||||||||||||||
| Valuation Inputs | ||||||||||||||||
| Investments in Securities at Value* | Level 1 | Level 2 | Level 3 | Total | ||||||||||||
Common Stocks | $ | 7,911,351 | $ | – | $ | – | $ | 7,911,351 | ||||||||
Total | $ | 7,911,351 | $ | – | $ | – | $ | 7,911,351 | ||||||||
| ||||||||||||||||
* For detailed descriptions of sector and industry, see the accompanying Schedule of Investments.
For the six months ended December 31, 2011, the Funds did not have any significant transfers between Level 1 and Level 2 securities.
For the six months ended December 31, 2011, the Funds did not have any securities which used significant unobservable inputs (Level 3) used in determining fair value. Therefore, a reconciliation of assets in which significant unobservable inputs (Level 3) were used in determining fair value is not applicable.
Securities Transactions
Securities transactions are recorded on a trade date basis. Securities purchased or sold on a when-issued or delayed delivery basis may have extended settlement periods. Any securities so purchased are subject to market fluctuation during this period. The James Balanced: Golden Rainbow Fund will instruct its custodian to segregate assets in a separate account with a current value at least equal to the amount of its when-issued and delayed delivery purchase commitments. As of December 31, 2011, the Funds did not hold when-issued securities or delayed delivery purchase commitments.
Withholding taxes on foreign dividends have been provided for in accordance with the Trust’s understanding of the applicable country’s tax rules and rates.
Foreign Currency Translation
The market value of investment securities and other assets and liabilities denominated in foreign currencies are translated into U.S. dollars at the current exchange rate at the close of each business day. Purchases and sales of securities, income receipts and expense payments are translated into U.S. dollars based at the exchange rate on the date of the transaction.
Semi-Annual Report | December 31, 2011 | 41 |
Table of Contents
Notes to Financial Statements | James Advantage Funds | |
| December 31, 2011 (Unaudited) |
Reported net realized foreign exchange gains or losses arise from sales and maturities of short-term securities, sales of foreign currencies, currency gains or losses realized between the trade and settlement dates on securities transactions, the difference between the amounts of dividends, interest, and foreign withholding taxes recorded on the Funds’ books, and the U.S. dollar equivalent of the amounts actually received or paid. Net unrealized foreign exchange gains and losses arise from the changes in the value of assets and liabilities including investments in securities at the reporting period, resulting from changes in the exchange rate.
Short Sales and Segregated Cash
The James Long-Short Fund actively sells short equity and fixed income securities. Short sales are transactions in which the Fund sells a security it does not own in anticipation of a decline in the market value of that security. To complete such a transaction, the Fund must borrow the security to deliver to the buyer upon the short sale; the Fund is then obligated to replace the security borrowed by purchasing it in the open market at some later date.
The Fund will incur a loss if the market price of the security increases between the date of the short sale and the date on which the Fund replaces the borrowed security. The Fund will realize a gain if the security declines in value between those dates. If a security sold short pays a dividend while the Fund is short that security, the Fund will pay the dividend and record that amount as an expense.
All short sales are collateralized, as required by the Fund’s prime broker. The Fund maintains the collateral in segregated accounts consisting of cash and/or high-grade liquid assets sufficient to collateralize the market value of its short positions.
Investment Income
Dividend income is recorded on the ex-dividend date. Interest income is determined on the basis of interest accrued, adjusted for amortization of premiums and accretion of discounts on all debt securities. Amortization and accretion is calculated using the effective yield method.
Dividends and Distributions to Shareholders
Net investment income, if any, is generally declared and distributed to shareholders of each Fund on at least an annual basis. Net realized capital gains from security transactions, if any, are distributed to shareholders not less frequently than annually. Furthermore, capital gains are distributed only to the extent they exceed available capital loss carryforwards. Distributions to shareholders of
net investment income and net realized capital gains are recorded on the exdividend date. The amount and timing of distributions are determined in accordance with federal income tax regulations, which may differ from GAAP. Accordingly, temporary overdistributions as a result of these differences may occur and will be classified as either distributions in excess of net investment income and/or distributions in excess of net realized gains from security transactions, where applicable.
Distributions received from Limited Partnership investments of a Fund are recorded as a return of capital and are excluded from available income in the calculation of distributions paid by the Funds. Return of capital is recorded as a reduction to the cost of investments in the Statements of Assets and Liabilities and in the Schedule of Investments.
Allocations
Investment income earned, realized capital gains and losses, and unrealized appreciation and depreciation for the James Balanced: Golden Rainbow Fund is allocated daily to each class of shares based upon its proportionate share of total net assets of the Fund. Class-specific expenses are charged directly to the class incurring the expense. Common expenses, which are not attributable to a specific class, are allocated daily to each class of shares based upon its proportionate share of total net assets of the Fund. Expenses not directly billed to a particular Fund are allocated proportionally among all Funds daily in relation to net assets of each Fund or another reasonable measure.
Use of Estimates
The preparation of financial statements in conformity with GAAP requires management to make estimates and assumptions that affect the reported amounts of assets and liabilities and disclosure of contingent assets and liabilities at the date of the financial statements and the reported amounts of increases and decreases in net assets from operations during the reporting period. Actual results could differ from those estimates.
Federal Income Taxes
The Funds generally intend to distribute all taxable income and capital gains to shareholders, if any, and to otherwise continue to comply with the requirements of Subchapter M of the Internal Revenue Code applicable to regulated investment companies. Therefore, no federal tax provision is required.
During the six months ended December 31, 2011, none of the Funds recorded a liability for any uncertain tax positions in the accompanying financial statements. The Funds file income tax returns in the U.S. federal jurisdiction. For the years ended June 30, 2008 through June 30, 2011, the Funds’ returns are still open to examination by the appropriate taxing authority.
The following information is computed on a tax basis for each item as of December 31, 2011:
Federal Tax Cost | Gross Unrealized Appreciation | Gross Unrealized (Depreciation) | Net Unrealized | |||||||||||||
James Balanced: Golden Rainbow |
| |||||||||||||||
| Fund | $ | 1,140,265,516 | $ | 161,596,801 | $ | (27,483,560) | $ | 134,113,241 | ||||||||
| James Small Cap | ||||||||||||||||
| Fund | 104,480,278 | 26,468,039 | (2,300,890) | 24,167,149 | ||||||||||||
| James Mid Cap | ||||||||||||||||
| Fund | 10,555,649 | 1,983,057 | (597,761) | 1,385,296 | ||||||||||||
| James Micro Cap | ||||||||||||||||
| Fund | 7,046,624 | 1,008,115 | (379,348) | 628,767 | ||||||||||||
| James Long-Short | ||||||||||||||||
| Fund | 8,069,395 | 251,797 | (409,841) | (158,044) | ||||||||||||
Semi-Annual Report | December 31, 2011 | 42 |
Table of Contents
James Advantage Funds | Notes to Financial Statements | |
| December 31, 2011 (Unaudited) |
The difference between the cost of portfolio investments on a tax basis and financial statement cost for the Funds is due primarily to wash sale losses and to the differing treatment of certain investments under income tax regulations and GAAP.
On December 22, 2010, The Regulated Investment Company Modernization Act of 2010 (the “Modernization Act”) was signed into law. The Modernization Act is the first major piece of legislation affecting regulated investment companies (“RICs”) since 1986 and it modernizes several of the federal income and excise tax provisions related to RICs. Some highlights of the enacted provisions are as follows:
New capital losses may now be carried forward indefinitely, and retain the character of the original loss. Under pre-enactment law, capital losses could be carried forward for eight years, and carried forward as short-term capital losses, irrespective of the character of the original loss.
The Modernization Act contains simplification provisions, which are aimed at preventing disqualification of a RIC for “inadvertent” failures of the asset diversification and/or qualifying income tests. Additionally, the Modernization Act exempts RICs from the preferential dividend rule, and repealed the 60-day designation requirement for certain types of pay-through income and gains.
Finally, the Modernization Act contains several provisions aimed at preserving the character of distributions made by a fiscal year RIC during the portion of its taxable year ending after October 31 or December 31, reducing the circumstances under which a RIC might be required to file amended Forms 1099 to restate previously reported distributions.
New Accounting Pronouncements
In May 2011, the FASB issued ASU No. 2011-04 “Amendments to Achieve Common Fair Value Measurement and Disclosure Requirements” in GAAP and the International Financial Reporting Standards (“IFRSs”). ASU No.2011-04 amends FASB ASC Topic 820, “Fair Value Measurements and Disclosures”, to establish common requirements for measuring fair value and for disclosing information about fair value measurements in accordance with GAAP and IFRSs. ASU No.2011-04 is effective for fiscal years beginning after December 15, 2011 and for interim periods within those fiscal years. Management is currently evaluating the impact these amendments may have on the Funds’ financial statements.
2. SECURITIES TRANSACTIONS
Purchases and sales (including maturities) of investments in long-term U.S. Government obligations for the six months ended December 31, 2011 were as follows:
| Purchases | Sales | |||||||
James Balanced: Golden Rainbow Fund | $ | 101,433,156 | $ | 145,828,750 | ||||
James Long -Short Fund | – | 4,266,564 | ||||||
Purchases and sales (including maturities) of investments in other securities for the six months ended December 31, 2011 were as follows:
| Purchases | Sales | |||||||
James Balanced: Golden Rainbow Fund | $ | 323,896,293 | $ | 49,985,782 | ||||
James Small Cap Fund | 75,104,093 | 23,446,561 | ||||||
James Mid Cap Fund | 2,089,050 | 1,808,285 | ||||||
James Micro Cap Fund | 4,238,201 | 4,669,843 | ||||||
James Long -Short Fund | 9,034,015 | 5,614,262 | ||||||
For the six-month period ended December 31, 2011, the cost of securities purchased to cover short sales and the proceeds from securities sold short were $4,060,871 and $6,472,782, respectively, for the James Long-Short Fund.
3. MANAGEMENT FEE AND OTHER TRANSACTIONS WITH AFFILIATES
Investment Management Agreement
The Funds retain James to manage the Funds’ investments. The investment decisions for the Funds are made by a committee of James’ personnel, which is primarily responsible for the day-to-day management of each Fund’s portfolio. James Balanced: Golden Rainbow Fund is authorized to pay James a fee equal to an annual rate of 0.74% of its average daily net assets for assets up to and including $500 million; at the annual rate of 0.70% of the average daily net assets for assets from $500 million up to and including $1 billion; at the annual rate of 0.65% of the average daily net assets for assets from $1 billion up to and including $2 billion; and at the annual rate of 0.60% of the average daily net assets for assets over $2 billion. James Balanced: Golden Rainbow Fund is responsible for the payment of all of its operating expenses.
James is authorized to receive a fee equal to an annual rate of 1.25% of the average daily net assets of the James Small Cap Fund, James Mid Cap Fund and the James Long-Short Fund, respectively, for assets up to and including $500 million; 1.20% of average daily assets for assets from $500 million up to and including $1 billion; 1.15% of the average daily assets for assets from $1 billion to and including $2 billion; and 1.10% of the daily average net assets over $2 billion. James is authorized to receive a fee equal to 1.50% of James Micro Cap Fund average daily assets for assets up to and including $500 million and 1.45% of average daily assets for assets over $500 million. Advisory fees for the James Small Cap, James Mid Cap Fund, James Micro Cap Fund and James Long-Short Fund are reduced by the fees and expenses of the non-interested person trustees incurred by the applicable Fund.
James is responsible for the payment of all operating expenses of the James Small Cap Fund, James Mid Cap Fund, James Micro Cap Fund and James Long-Short Fund, except for brokerage fees and commissions, taxes, interest (including dividend expense on securities sold short) and 12b-1 expenses.
Administrative Services Agreement
ALPS Fund Services, Inc. (“ALPS” or the “Administrator”) serves as administrator to the Funds. ALPS receives a monthly fee paid by James Balanced: Golden Rainbow Fund, for itself, and paid by James for the James Small Cap Fund, James Mid Cap Fund, James Micro Cap Fund and James Long-Short Fund, subject to a minimum monthly fee. Pursuant to an administrative agreement, ALPS will provide operational services to the Funds including, but not limited to fund accounting and fund administration and generally assist in each Fund’s operations.
Transfer Agency and Services Agreement
ALPS, pursuant to a Transfer Agency and Services Agreement with the Trust, serves as Transfer Agent for the Funds. Under the Transfer Agency and Services Agreement, ALPS receives an annual minimum fee, a fee based upon the number of shareholder accounts, and is also reimbursed for out-of-pocket expenses. These fees and reimbursements for out of pocket expenses are paid and reimbursed
Semi-Annual Report | December 31, 2011 | 43 |
Table of Contents
Notes to Financial Statements | James Advantage Funds | |
December 31, 2011 (Unaudited) |
by James Balanced: Golden Rainbow Fund, for itself, and by James, for the James Small Cap Fund, James Mid Cap Fund, James Micro Cap Fund and James Long-Short Fund.
Plans of Distribution
Each Fund (only the Retail Class of the James Balanced: Golden Rainbow Fund), other than the James Micro Cap Fund, has adopted a plan pursuant to Rule 12b-1 under the 1940 Act (collectively, the “Plans”) under which each Fund may incur expenses related to distribution of its shares and for services provided to shareholders. Payments under a Plan are made to James, which uses them to pay distribution and shareholder service expenses on behalf of and as agent of the Fund. The amount payable by each Fund (the Retail Class of the James Balanced: Golden Rainbow Fund), other than the James Micro Cap Fund, under its Plan is 0.25% of its average daily net assets for the year. The Plans are compensation plans, which means that payments are made to James regardless of 12b-1 expenses actually incurred. Therefore, payments under a Plan may exceed distribution and shareholder service expenses incurred pursuant to the Plan, and James is permitted to retain the excess. It is also possible that 12b-1 expenses paid by James for a period will exceed the payments received by James, in which case James may pay such excess expenses out of its own resources. Payments received by James under the Plans are in addition to the fees paid to James pursuant to the Management Agreements. The Plans require that James act in the Funds’ best interests in expending the payments it receives from the Funds and use payments solely for the purpose of paying distribution expenses on behalf of the Funds. The Funds’ Distributor, ALPS Distributors, Inc., verifies all payment amounts to be made to brokers that have properly executed dealer agreements with the Funds before James will make such payments. For the six-month period ended December 31, 2011, $1,251,068, $15,225, $124,281 and $10,269 was paid to James on behalf of James Balanced: Golden Rainbow Fund, James Small Cap Fund, James Mid Cap Fund and James Long-Short Fund, respectively, pursuant to the Plans.
4. COMMITMENTS AND CONTINGENCIES
The Funds indemnify the Trust’s officers and trustees for certain liabilities that might arise from their performance of their duties to the Funds. Additionally, in the normal course of business, the Funds enter into contracts that contain a variety of representations and warranties and that provide general indemnifications. The Funds’ maximum exposure under these arrangements is unknown, as this would involve future claims that may be made against the Funds that have not yet occurred. However, based on experience, the Funds expect the risk of loss to be remote.
5. LINE OF CREDIT
The Trust has a $3,000,000 revolving line of credit agreement with U.S. Bank, N.A (the “Bank”) for the James Long-Short Fund. Borrowings under this arrangement are secured by investments held in the Fund’s portfolio as notated on the Schedule of Investments and bear interest at the Bank’s prime rate. As of December 31, 2011, the James Long-Short Fund had an outstanding balance of $436,000 as reported as a “Loan payable” on the Statement of Assets and Liabilities.
6. SUBSEQUENT EVENTS
The Funds evaluated subsequent events from December 31, 2011, the date of these financial statements, through the date these financial statements were issued and available. There were no subsequent events to report that would have a material impact on the Funds’ financial statements.
| 44 | www.jamesfunds.com |
Table of Contents
James Advantage Funds | Additional Information | |
| December 31, 2011 (Unaudited) |
PROXY VOTING GUIDELINES
James is responsible for exercising the voting rights associated with the securities purchased and held by the Funds. A description of the policies and procedures that James uses in fulfilling this responsibility and information regarding how those proxies were voted during the most recent 12-month period ended June 30 are available without charge upon request by calling toll free 1-800-995-2637. These items are also available on the Securities and Exchange Commission’s website at http://www.sec.gov.
QUARTERLY PORTFOLIO DISCLOSURE
James files a complete listing of portfolio holdings for each Fund as of the end of the first and third quarters of each fiscal year on Form N-Q. The complete listing (i) is available on the Commission’s website; (ii) may be reviewed and copied at the Commission’s Public Reference Room in Washington, DC; and (iii) will be made available to shareholders upon request by calling 1-800-995-2637. Information on the operation of the Public Reference Room may be obtained by calling 1-800-SEC-0330.
PRIVACY POLICY
Facts
What does James Advantage Funds do with your personal information?
Why?
Financial companies choose how they share your personal information. Federal law gives consumers the right to limit some, but not all sharing. Federal law also requires us to tell you how we collect, share, and protect your personal information. Please read this notice carefully to understand what we do.
What?
The types of personal information we collect and share depends on the product or service that you have with us. This information can include:
• Social Security number and wire transfer instructions
• account transactions and transaction history
• investment experience and purchase history
When you are no longer our customer, we continue to share your information as described in this notice.
How?
All financial companies need to share customers’ personal information to run their everyday business. In the section below, we list the reasons financial companies can share their customers’ personal information; the reasons James Advantage Funds chooses to share; and whether you can limit this sharing.
| Reasons we can share your personal information: | Does James Advantage Funds share information? | Can you limit this sharing? | ||
| For our everyday business purposes - such as to process your transactions, maintain your account(s), respond to court orders and legal investigations, or report to credit bureaus. | YES | NO | ||
| For our marketing purposes - to offer our products and services to you. | YES | NO | ||
| For joint marketing with other financial companies. | NO | We don’t share | ||
| For our affiliates’ everyday business purposes - information about your transactions and records. | NO | We don’t share | ||
| For our affiliates’ everyday business purposes - information about your credit worthiness. | NO | We don’t share | ||
| For our affiliates to market to you | NO | We don’t share | ||
| For non-affiliates to market to you | NO | We don’t share |
Questions? Call 1-800-99 James
Semi-Annual Report | December 31, 2011 | 45 |
Table of Contents
Additional Information | James Advantage Funds | |
December 31, 2011 (Unaudited) |
PRIVACY POLICY (CONTINUED)
What we do: | ||
| How does James Advantage Funds protect my personal information? | To protect your personal information from unauthorized access and use, we use security measures that comply with federal law. These measures include computer safeguards and secured files and buildings. | |
| Our service providers are held accountable for adhering to strict policies and procedures to prevent any misuse of your nonpublic personal information. | ||
| How does James Advantage Funds collect my personal information? | We collect your personal information, for example, when you | |
• open and account or deposit money • direct us to buy securities or direct us to sell your securities • seek advice about your investments We also collect your personal information from others, Such as credit bureaus, affiliates, or other companies. | ||
| Why can’t I limit all sharing? | Federal law gives you the right to limit only: | |
• sharing for affiliates’ everyday business purposes –information about your creditworthiness. • affiliates from using your information to market to you. • sharing for non affiliates to market to you. State laws and individual companies may give you additional rights to limit sharing. | ||
| Definitions | ||
| Affiliates | Companies related by common ownership or control. They can be financial and non-financial companies. | |
• Our affiliates include financial companies, such as James Investment Research, Inc. and James Capital Alliance. | ||
| Non-affiliates | Companies not related by common ownership or control. They can be financial and non-financial companies. | |
• James Advantage Funds does not share with nonaffiliates so they can market to you. | ||
| Joint marketing | A formal agreement between nonaffiliated financial companies that together market financial products or services to you. | |
• James Advantage Funds does not jointly market. | ||
| 46 | www.jamesfunds.com |
Table of Contents
James Advantage Funds | Notes | |
| December 31, 2011 (Unaudited) |
|
|
|
|
|
|
|
|
|
|
|
|
|
|
|
|
|
|
|
|
|
|
|
|
|
|
|
|
|
|
|
|
|
|
|
Semi-Annual Report | December 31, 2011 | 47 |
Table of Contents
Notes | James Advantage Funds | |
December 31, 2011 (Unaudited) |
|
|
|
|
|
|
|
|
|
|
|
|
|
|
|
|
|
|
|
|
|
|
|
|
|
|
|
|
|
|
|
|
|
|
|
| 48 | www.jamesfunds.com |
Table of Contents

INVESTMENT ADVISER | INDEPENDENT REGISTERED PUBLIC ACCOUNTING FIRM | |||
James Investment Research, Inc. | Deloitte & Touche LLP | |||
P.O. Box 8 | 250 East Fifth Street | |||
Alpha, Ohio 45301 | Suite 1900 | |||
info@jamesfunds.com | Cincinnati, ohio 45202 | |||
CUSTODIAN | DISTRIBUTOR | |||
U.S. Bank | ALPS Distributors, Inc. | |||
425 Walnut Street | 1290 Broadway, Suite 1100 | |||
Cincinnati, ohio 45202 | Denver, Colorado 80203 | |||
TRANSFER AGENT | LEGAL COUNSEL | |||
ALPS Fund Services, inc. | Thompson Hine LLp | |||
1290 Broadway | 312 Walnut Street | |||
Suite 1100 | 14th Floor | |||
Denver, Co 80203 | Cincinnati, Ohio 45202 | |||

Table of Contents
Item 2. Code of Ethics.
Not applicable to this Report.
Item 3. Audit Committee Financial Expert.
Not applicable to this Report.
Item 4. Principal Accountant Fees and Services.
Not applicable to this Report.
Item 5. Audit Committee of Listed Companies.
Not applicable to registrant.
Item 6. Schedule of Investments.
The schedule is included as part of the Reports to Stockholders filed under Item 1 of this Report.
Item 7. Disclosure of Proxy Voting Policies and Procedures for Closed-End Management Investment Companies.
Not applicable to the registrant.
Item 8. Portfolio Managers of Closed-End Funds.
Not applicable to the registrant.
Item 9. Purchases of Equity Securities by Closed-End Funds.
Not applicable to the registrant.
Item 10. Submission of Matters to a Vote of Security Holders.
Not applicable to the registrant.
Table of Contents
Item 11. Controls and Procedures.
(a) Based on an evaluation of the registrant’s disclosure controls and procedures (as defined in Rule 30a-3(c) under the Investment Company Act of 1940, as amended) the registrant’s principal executive officer and principal financial officer have concluded that the registrant’s disclosure controls and procedures are effective as of a date within 90 days of the filing date of this Report.
(b) There were no significant changes in the registrant’s internal control over financial reporting that occurred during the registrant’s last fiscal half-year that have materially affected, or are reasonably likely to materially affect, the registrant’s internal control over financial reporting.
Item 12. Exhibits.
| (a)(1) | Not applicable to this Report. | |
| (a)(2) | Certifications required by Item 12(a)(2) of Form N-CSR are filed herewith. | |
Table of Contents
SIGNATURES
Pursuant to the requirements of the Securities Exchange Act of 1934 and the Investment Company Act of 1940, the registrant has duly caused this report to be signed on its behalf by the undersigned, thereunto duly authorized.
(Registrant) The James Advantage Funds
By (Signature and Title)
/s/ Barry R. James |
| Barry R. James |
| President |
| Date: March 5, 2012 |
Pursuant to the requirements of the Securities Exchange Act of 1934 and the Investment Company Act of 1940, this report has been signed below by the following persons on behalf of the registrant and in the capacities and on the dates indicated.
By (Signature and Title)
/s/ Barry R. James |
| Barry R. James |
| President |
Date: March 5, 2012
By (Signature and Title)
/s/ Thomas L. Mangan |
| Thomas L. Mangan |
| Treasurer, Chief Financial Officer |
Date: March 5, 2012