Filing under Rule 425 under the U.S. Securities Act of 1933
Filing by: Chuo Mitsui Trust Holdings, Inc.
Subject Company: The Sumitomo Trust and Banking Co., Ltd.
Commission File Number: 132-02705
Dated November 26, 2010
Analyst Meeting
Presentation Material
November 26, 2010
Chuo Mitsui Trust Group
Agenda
I .Status of Profit
Financial Summary P3
Factors for Increase/Decrease in Net Profit P4 Factors for Increase/Decrease in Gross P5 Operating profit Recomposition of Revenue Structure P6
Expenses P7
II .Business Strategy
Management Direction for 2H FY2010 P9
Outlook for FY2010 P10
Gross Operating Profit by Business Unit P11
III .Priority Businesses
Investment Trust & Insurance P13
related Business Real Estate Business P14
Loans to Individuals P15
IV.Condition of Assets
Loan Portofolio P17
NPL/Credit Cost P18
Securities P19
V.Status of Capital
Capital/Public Funds P21 Effects of New Basel Regulations P22
(References)
Pension/Stock Transfer Agency P24
Real Estate Asset Finance P25
Alternative Investment P26
Loan Portfolio and Trend of Yields P27
Effects of New Basel Regulations (Detail) P28
Chuo Mitsui Trust Group
1
I.Status of Profit
Financial Summary
Factors for Increase/Decrease in Net Profit
Factors for Increase/Decrease in Gross Operating Profit
Recomposition of Revenue Structure
Expenses
2
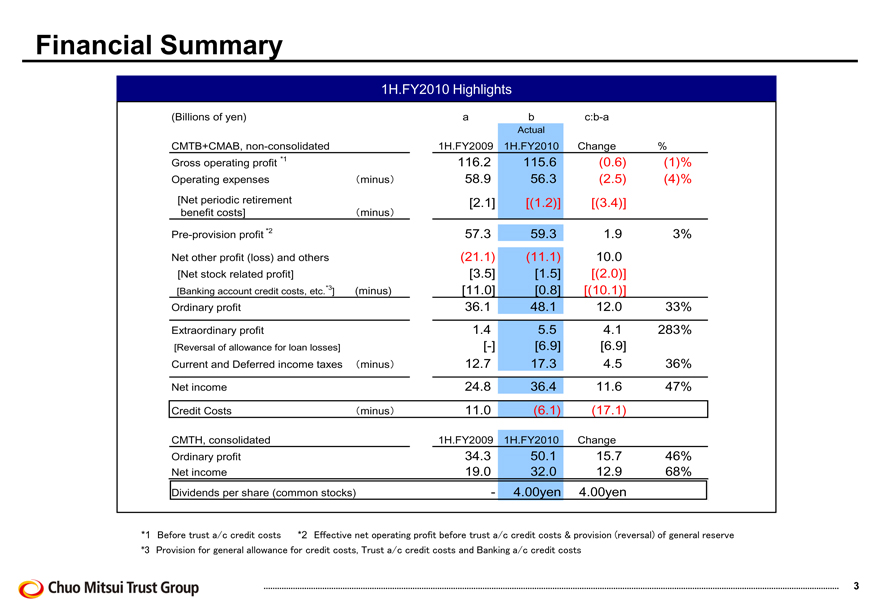
Financial Summary
1H.FY2010 Highlights
(Billions of yen)
CMTB+CMAB, non-consolidated
Gross operating profit *1
(minus)
Operating expenses
[Net periodic retirement benefit costs]
(minus)
Pre-provision profit *2
Net other profit (loss) and others [Net stock related profit] [Banking account credit costs, etc.*3]
(minus)
Ordinary profit
Extraordinary profit
[Reversal of allowance for loan losses] Current and Deferred income taxes
(minus)
Net income
Credit Costs
(minus)
CMTH, consolidated Ordinary profit Net income
Dividends per share (common stocks)
a
b
c:b-a
1H.FY2009
116.2
58.9
[2.1]
57.3
(21.1)
[3.5]
[11.0]
36.1
1.4
[-]
12.7
24.8
11.0
1H.FY2009
34.3
19.0
Actual 1H.FY2010
115.6 56.3 [(1.2)]
59.3 (11.1) [1.5] [0.8] 48.1 5.5 [6.9] 17.3 36.4 (6.1)
1H.FY2010
50.1 32.0 4.00yen
Change
(0.6) (2.5) [(3.4)]
1.9 10.0 [(2.0)] [(10.1)] 12.0 4.1 [6.9] 4.5 11.6 (17.1)
Change
15.7 12.9 4.00yen
%
(1)% (4)%
3%
33% 283%
36% 47%
46% 68%
*1 Before trust a/c credit costs
*2 Effective net operating profit before trust a/c credit costs & provision (reversal) of general reserve
*3 Provision for general alloweance for credit costs, Trust a/c credit costs and Banking a/c credit costs
3
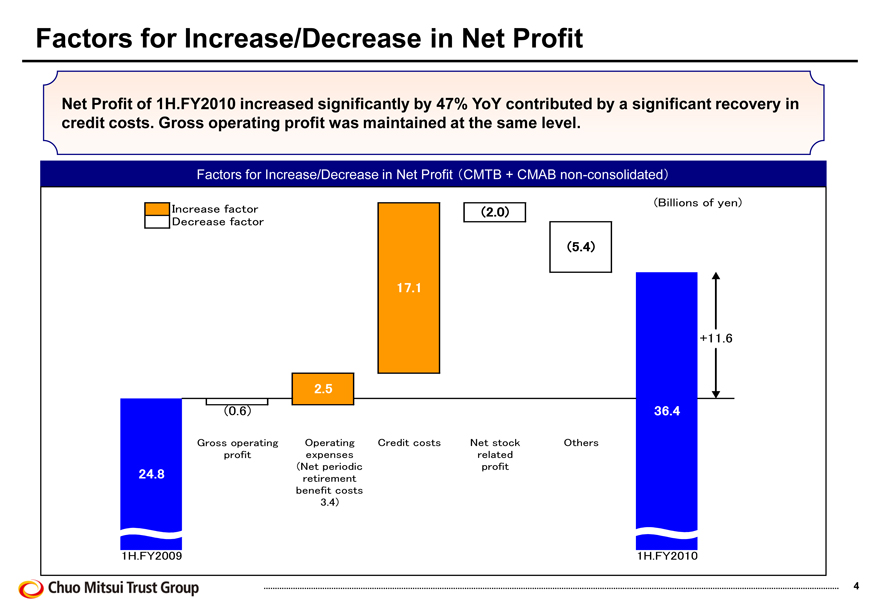
Factors for Increase/Decrease in Net Profit
Net Profit of 1H.FY2010 increased significantly by 47% YoY contributed by a significant recovery in credit costs. Gross operating profit was maintained at the same level.
Factors for Increase/Decrease in Net Profit ( CMTB + CMAB non-consolidated)
Increase factor
Decrease factor
2.5
17.1
(2.0)
(5.4)
(Billions of yen)
24.8
1H.FY2009
(0.6)
Gross operating profit
Operating expenses (Net periodic retirement benefit costs 3.4)
Credit costs
Net stock related profit
Others
+11.6
36.4
1H.FY2010
4
Factors for Increase/Decrease in Gross Operating Profit
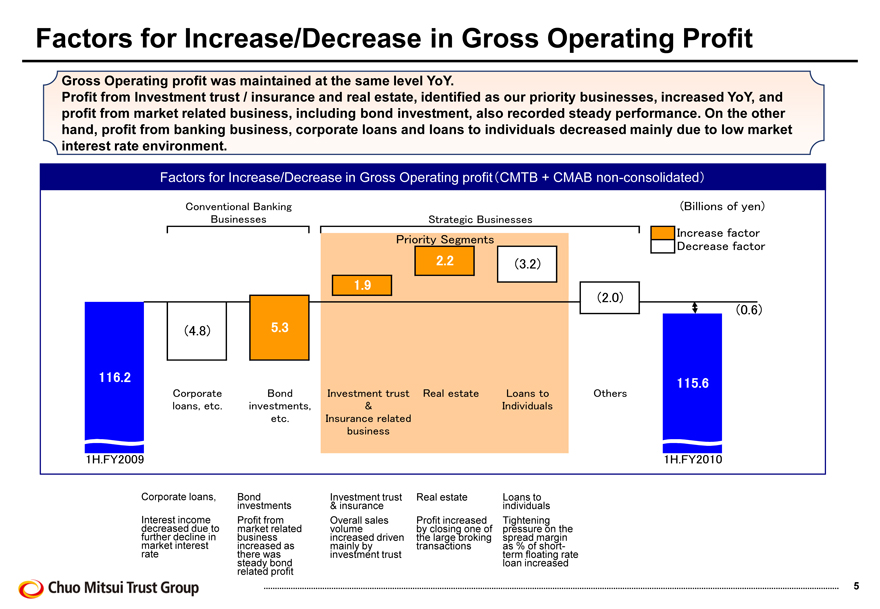
Gross Operating profit was maintained at the same level YoY.
Profit from Investment trust / insurance and real estate, identified as our priority businesses, increased YoY, and profit from market related business, including bond investment, also recorded steady performance. On the other hand, profit from banking business, corporate loans and loans to individuals decreased mainly due to low market interest rate environment.
Factors for Increase/Decrease in Gross Operating profit ( CMTB + CMAB non-consolidated)
Conventional Banking Businesses
Strategic Businesses
(Billions of yen)
Increase factor Priority Segments Decrease factor
1.9 2.2 (3.2) (2.0)
116.2 (4.8) 5.3 (0.6)
1H.FY2009
Corporate loans, etc.
Bond investments, etc.
Investment trust & Insurance related business
Real estate
Loans to Individuals
Others
115.6
1H.FY2010
Corporate loans,
Interest income decreased due to further decline in market interest rate
Bond investments Profit from market related business increased as there was steady bond related profit
Investment trust & insurance Overall sales volume increased driven mainly by investment trust
Real estate
Profit increased by closing one of the large broking transactions
Loans to individuals Tightening pressure on the spread margin as % of short-term floating rate loan increased
5
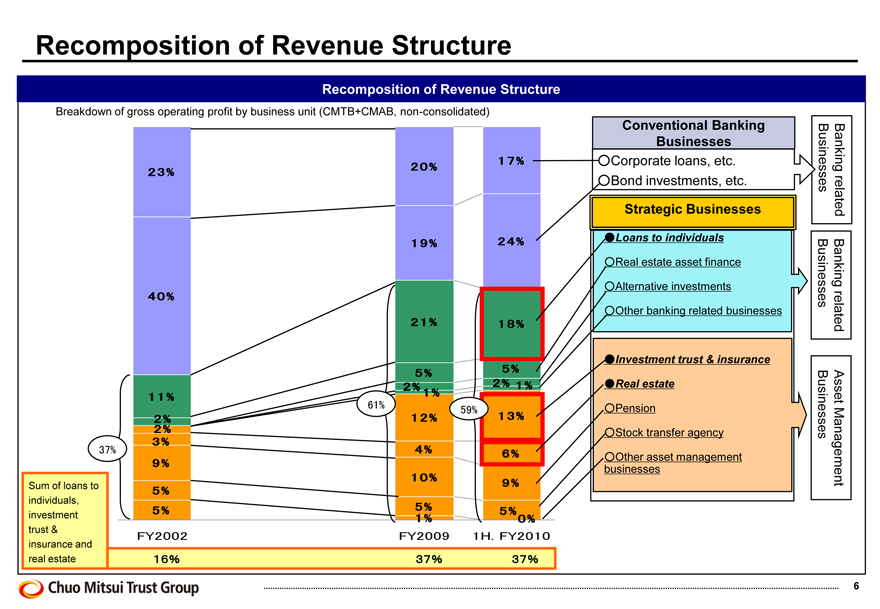
Recomposition of Revenue Structure
Recomposition of Revenue Structure
Breakdown of gross operating profit by business unit (CMTB+CMAB, non-consolidated)
23%
40%
11%
2%
2%
3%
9%
5%
5%
37%
FY2002
16%
20%
19%
21%
5%
2%
1%
12%
4%
10%
5%
1%
61%
FY2009
37%
17%
24%
18%
5%
2%
1%
13%
6%
9%
5%
0%
59%
1H.FY2010
37%
Sum of loans to individuals, investment trust & insurance and real estate
Conventional Banking Businesses
Corporate loans, etc.
Bond investments, etc.
Strategic Businesses
Loans to individuals
Real estate asset finance
Alternative investments
Other banking related businesses
Investment trust & insurance
Real estate
Pension
Stock transfer agency
Other asset management businesses
Banking related Businesses
Banking related Businesses
Asset Management Businesses
6
Expenses
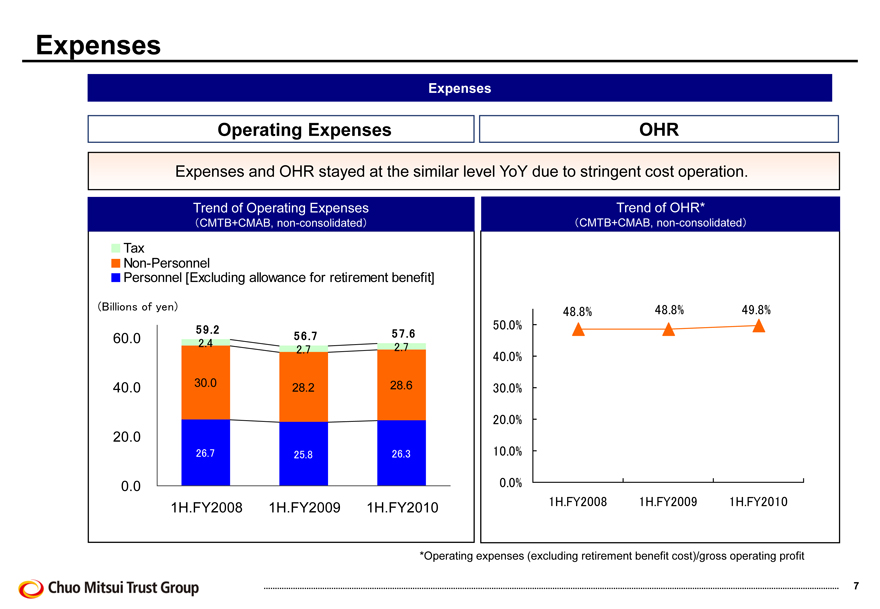
Expenses Operating Expenses OHR
Expenses and OHR stayed at the similar level YoY due to stringent cost operation.
Trend of Operating Expenses (CMTB+CMAB, non-consolidated)
Tax
Non-Personnel
Personnel [Excluding allowance for retirement benefit]
(Billions of yen)
60.0 40.0 20.0 0.0
59.2 57.6 56.7 2.4 2.7
2.7
30.0 28.2 28.6
26.7 25.8 26.3
1H.FY2008 1H.FY2009 1H.FY2010
Trend of OHR*
(CMTB+CMAB, non-consolidated)
50.0% 40.0% 30.0% 20.0% 10.0% 0.0%
48.8% 48.8% 49.8%
1H.FY2008 1H.FY2009 1H.FY2010
*Operating expenses (excluding retirement benefit cost)/gross operating profit
7
II.Business Strategy
Management Direction for 2H FY2010
Outlook for FY2010
Gross Operating Profit by Business Unit
8
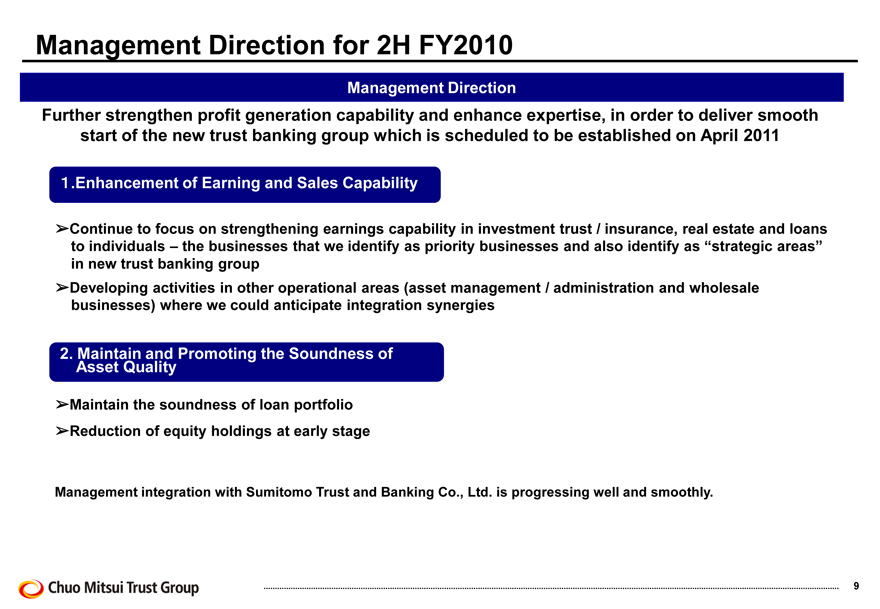
Management Direction for 2H FY2010
Management Direction
Further strengthen profit generation capability and enhance expertise, in order to deliver smooth start of the new trust banking group which is scheduled to be established on April 2011
1.Enhancement of Earning and Sales Capability
Continue to focus on strengthening earnings capability in investment trust / insurance, real estate and loans to individuals – the businesses that we identify as priority businesses and also identify as “strategic areas” in new trust banking group
Developing activities in other operational areas (asset management / administration and wholesale businesses) where we could anticipate integration synergies
2. Maintain and Promoting the Soundness of Asset Quality
Maintain the soundness of loan portfolio
Reduction of equity holdings at early stage
Management integration with Sumitomo Trust and Banking Co., Ltd. is progressing well and smoothly.
9
Outlook for FY2010
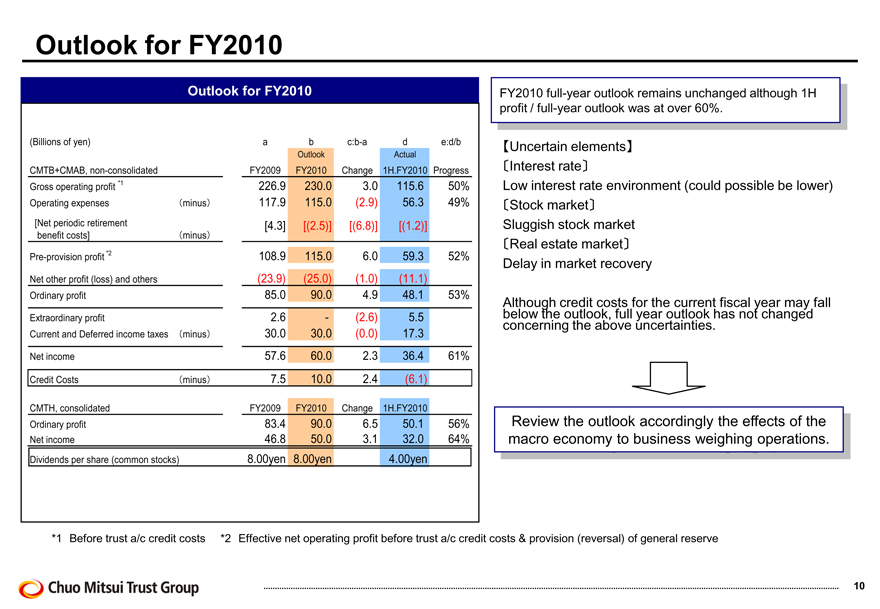
Outlook for FY2010
(Billions of yen) a b c:b-a d e:d/b
Outlook Actual
CMTB+CMAB, non-consolidated FY2009 FY2010 Change 1H.FY2010 Progress
Gross operating profit *1 226.9 230.0 3.0 115.6 50%
Operating expenses minus 117.9 115.0 (2.9) 56.3 49%
[Net periodic retirement [4.3] [(2.5)] [(6.8)] [(1.2)]
benefit costs] minus
Pre-provision profit *2 108.9 115.0 6.0 59.3 52%
Net other profit (loss) and others (23.9) (25.0) (1.0) (11.1)
Ordinary profit 85.0 90.0 4.9 48.1 53%
Extraordinary profit 2.6 - (2.6) 5.5
Current and Deferred income taxes minus 30.0 30.0 (0.0) 17.3
Net income 57.6 60.0 2.3 36.4 61%
Credit Costs minus 7.5 10.0 2.4 (6.1)
CMTH, consolidated FY2009 FY2010 Change 1H.FY2010
Ordinary profit 83.4 90.0 6.5 50.1 56%
Net income 46.8 50.0 3.1 32.0 64%
Dividends per share (common stocks) 8.00yen 8.00yen 4.00yen
FY2010 full-year outlook remains unchanged although 1H profit / full-year outlook was at over 60%.
[Uncertain elements] [Interest rate]
Low interest rate environment (could possible be lower)
[Stock market]
Sluggish stock market
[Real estate market]
Delay in market recovery
Although credit costs for the current fiscal year may fall below the outlook, full year outlook has not changed concerning the above uncertainties.
Review the outlook accordingly the effects of the macro economy to business weighing operations.
*1 Before trust a/c credit costs
*2 Effective net operating profit before trust a/c credit costs & provision (reversal) of general reserve
10
Gross Operating Profit by Business Unit
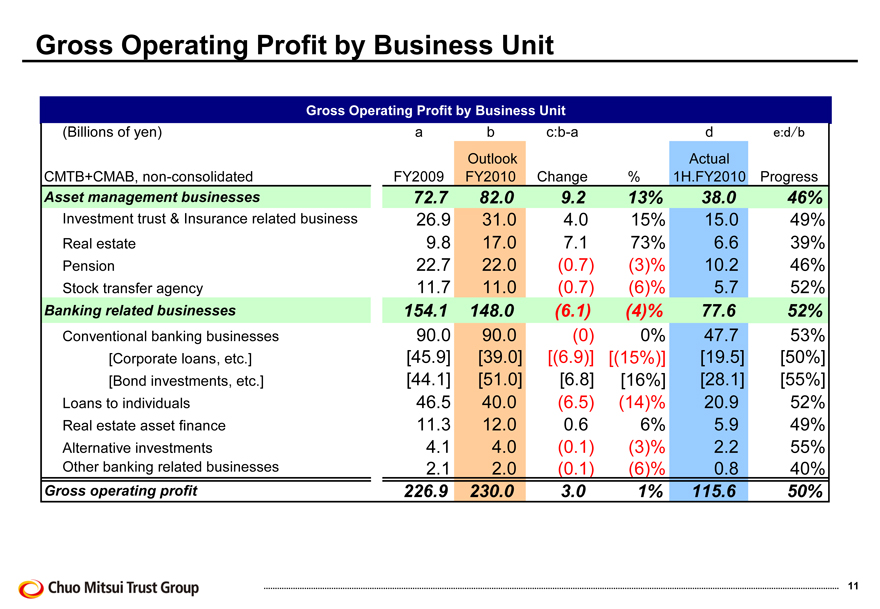
Gross Operating Profit by Business Unit
(Billions of yen) a b c:b-a d e:d/b
Outlook Actual
CMTB+CMAB, non-consolidated FY2009 FY2010 Change % 1H.FY2010 Progress
Asset management businesses 72.7 82.0 9.2 13% 38.0 46%
Investment trust & Insurance related business 26.9 31.0 4.0 15% 15.0 49%
Real estate 9.8 17.0 7.1 73% 6.6 39%
Pension 22.7 22.0 (0.7) (3)% 10.2 46%
Stock transfer agency 11.7 11.0 (0.7) (6)% 5.7 52%
Banking related businesses 154.1 148.0 (6.1) (4)% 77.6 52%
Conventional banking businesses 90.0 90.0 (0) 0% 47.7 53%
[Corporate loans, etc.] [45.9] [39.0] [(6.9)] [(15%)] [19.5] [50%]
[Bond investments, etc.] [44.1] [51.0] [6.8] [16%] [28.1] [55%]
Loans to individuals 46.5 40.0 (6.5) (14)% 20.9 52%
Real estate asset finance 11.3 12.0 0.6 6% 5.9 49%
Alternative investments 4.1 4.0 (0.1) (3)% 2.2 55%
Other banking related businesses 2.1 2.0 (0.1) (6)% 0.8 40%
Gross operating profit 226.9 230.0 3.0 1% 115.6 50%
Chuo Mitsui Trust Group
11
III. Priority Businesses
Investment Trust & Insurance related Business
Real Estate Business
Loans to Individuals
Chuo Mitsui Trust Group
12
Investment Trust & Insurance related Business
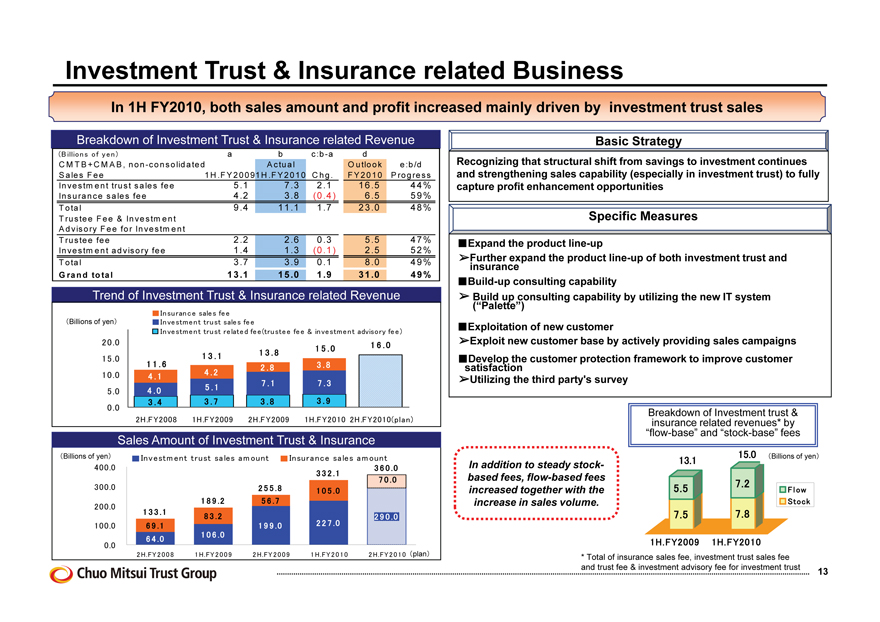
In 1H FY2010, both sales amount and profit increased mainly driven by investment trust sales
Breakdown of Investment Trust & Insurance related Revenue
(Billions of yen) a b c:b-a d
CMTB + CMAB , non-consolidated Actual Outlook e:b/d
Sales Fee 1 H.F Y 2009 1 H.FY2010 Chg . FY 2010 Progress
Investment trust sales fee 5.1 7.3 2.1 16.5 44%
Insurance sales fee 4.2 3.8 (0.4) 6.5 59%
Total 9.4 11.1 1.7 23.0 48%
Trustee Fee & Investment
Advisory Fee for Investment
Trustee fee 2.2 2.6 0.3 5.5 47%
Investment advisory fee 1.4 1.3 (0.1) 2.5 52%
Total 3.7 3.9 0.1 8.0 49%
Grand total 13.1 15.0 1.9 31.0 49%
Basic Strategy
Recognizing that structural shift from savings to investment continues and strengthening sales capability (especially in investment trust) to fully capture profit enhancement opportunities
Specific Measures
Expand the product line-up
Further expand the product line-up of both investment trust and insurance
Build-up consulting capability
Build up consulting capability by utilizing the new IT system (“Palette”)
Exploitation of new customer
Exploit new customer base by actively providing sales campaigns
Develop the customer protection framework to improve customer satisfaction
Utilizing the third party’s survey
Trend of Investment Trust & Insurance related Revenue
Insurance sales fee Investment trust sales fee
Investment trust related fee (trustee fee & investment advisory fee)
(Billions of yen)
20.0 15.0 10.0 5.0 0.0
2H.FY2008 1H.FY2009 2H.FY2009 1H.FY2010 2H.FY2010 (plan)
15.0 16.0
13.1 13.8
11.6 2.8 3.8
4.1 4.2
7.1 7.3
4.0 5.1
3.4 3.7 3.8 3.9
Sales Amount of Investment Trust & Insurance
(Billions of yen)
400.0 300.0 200.0 100.0 0.0
Investment trust sales amount Insurance sales amount
2H.FY2008 1H.FY2009 2H.FY2009 1H.FY2010 2H.FY2010 (plan)
332.1 360.0
70.0
255.8 105.0
189.2 56.7
133.1 83.2 290.0
69.1 199.0 227.0
64.0 106.0
Breakdown of Investment trust & insurance related revenues* by “flow-base” and “stock-base” fees
In addition to steady stock-based fees, flow-based fees increased together with the increase in sales volume.
1H.FY2009 1H.FY2010
* Total of insurance sales fee, investment trust sales fee and trust fee & investment advisory fee for investment trust
15.0 ( Billions of yen)
13.1
7.2
5.5 Flow Stock
7.5 7.8
Chuo Mitsui Trust Group
13
Real Estate Business
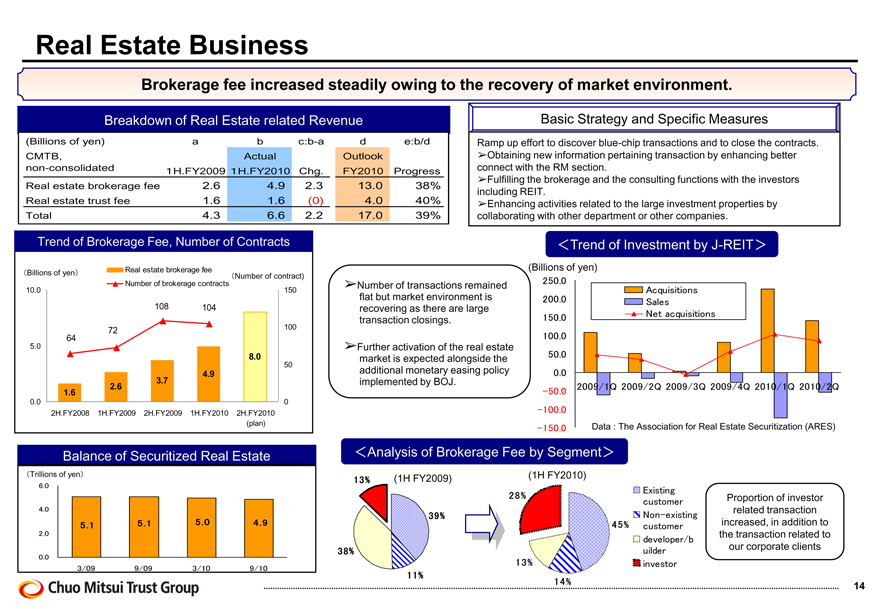
Brokerage fee increased steadily owing to the recovery of market environment.
Breakdown of Real Estate related Revenue
(Billions of yen ) a b c:b-a d e:b /d
CMTB, Actual Outlook
non-consolidated 1H. FY2009 1H. FY2010 Chg. FY2010 Progress
Real estate brokerage fee 2.6 4.9 2.3 13.0 38%
Real estate trust fee 1.6 1.6 (0) 4.0 40%
Total 4.3 6.6 2.2 17.0 39%
Trend of Brokerage Fee, Number of Contracts
Billions of yen
Real estate brokerage fee
Number of contract)
Number of brokerage contracts
10.0 5.0 0.0
64 72 108 104 150 100 50 0
2H.FY2008 1H.FY2009 2H.FY2009 1H.FY2010 2H.FY2010
(plan)
Balance of Securitized Real Estate
Trillions of yen
6.0
4.0
2.0
0.0
3/09 9/09 3/10 9/10
Basic Strategy and Specific Measures
Ramp up effort to discover blue-chip transactions and to close the contracts.
Obtaining new information pertaining transaction by enhancing better connect with the RM section.
Fulfilling the brokerage and the consulting functions with the investors including REIT.
Enhancing activities related to the large investment properties by collaborating with other department or other companies.
Number of transactions remained flat but market environment is recovering as there are large transaction closings.
Further activation of the real estate market is expected alongside the additional monetary easing policy implemented by BOJ.
Trend of Investment by J-REIT
(Billions of yen)
2500 .
Acquisitions
2000. Sales
1500. Net acquisitions
1000.
500. 00.
2009/1Q 2009/2Q 2009/3Q
-500.
-1000.
-500. Data: The Association for Real Estate Securitization (ARES)
Analysis of Brokerage Fee by Segment
13% (1H FY2009)
39%
38% 11%
(IH FY2010)
28% 13% 14% 45%
Existing customer Non-existing customer developer/builder investor
Proportion of investor related transaction increased, in addition to the transaction related to our corporate clients
14
Loans to Individuals
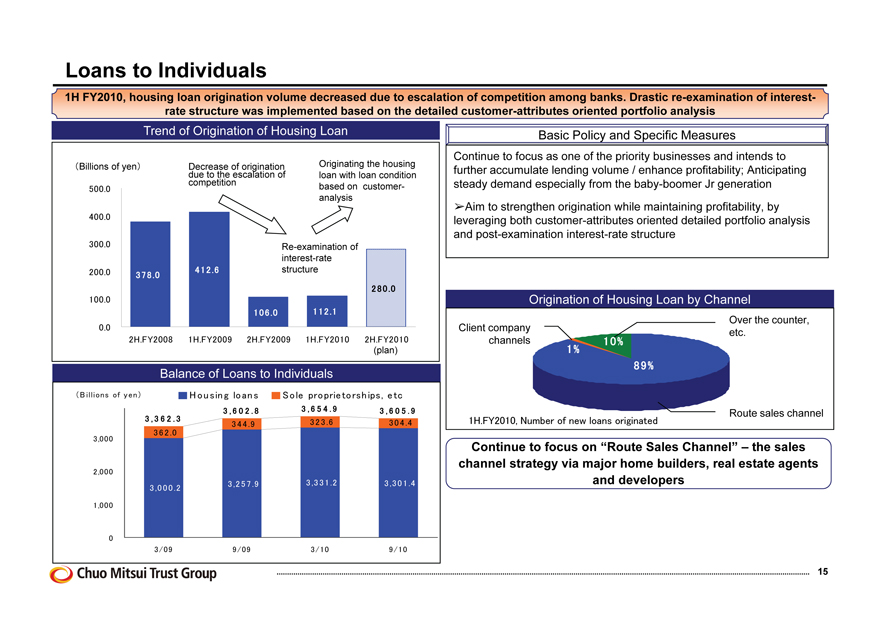
1H FY2010, housing loan origination volume decreased due to escalation of competition among banks. Drastic re-examination of interest-rate structure was implemented based on the detailed customer-attributes oriented portfolio analysis
Trend of Origination of Housing Loan
(Billions of yen)
Decrease of origination due to the escalation of competition Originating the housing loan with loan condition based on customer- analysis
500.0 400.0 300.0 200.0 100.0 0.0
Re-examination of interest-rate structure
2H.FY2008 1H.FY2009 2H.FY2009 1H.FY2010 2H.FY2010
(plan)
412.6 378.0
280.0
106.0 112.1
Balance of Loans to Individuals
(Billions of yen) Housing loans Sole proprietorships, etc
3,000
2,000
1,000
0
323.6
3,362.3 3,602.8 3,654.9 3,605.9
344.9 304.4 362.0
3,257.9 3,331.2 3,301.4 3,000.2
3/09 9/09 3/10 9/10
Basic Policy and Specific Measures
Continue to focus as one of the priority businesses and intends to further accumulate lending volume / enhance profitability; Anticipating steady demand especially from the baby-boomer Jr generation
Aim to strengthen origination while maintaining profitability, by leveraging both customer-attributes oriented detailed portfolio analysis and post-examination interest-rate structure
Origination of Housing Loan by Channel
Client company channels
Over the counter, etc.
10% 1% 89%
Route sales channel
1H.FY2010, Number of new loans originated
Continue to focus on “Route Sales Channel” – the sales channel strategy via major home builders, real estate agents and developers
Chuo Mitsui Trust Group
15
IV. Condition of Assets
Loan Portfolio NPL/Credit Cost Securities
Chuo Mitsui Trust Group
16
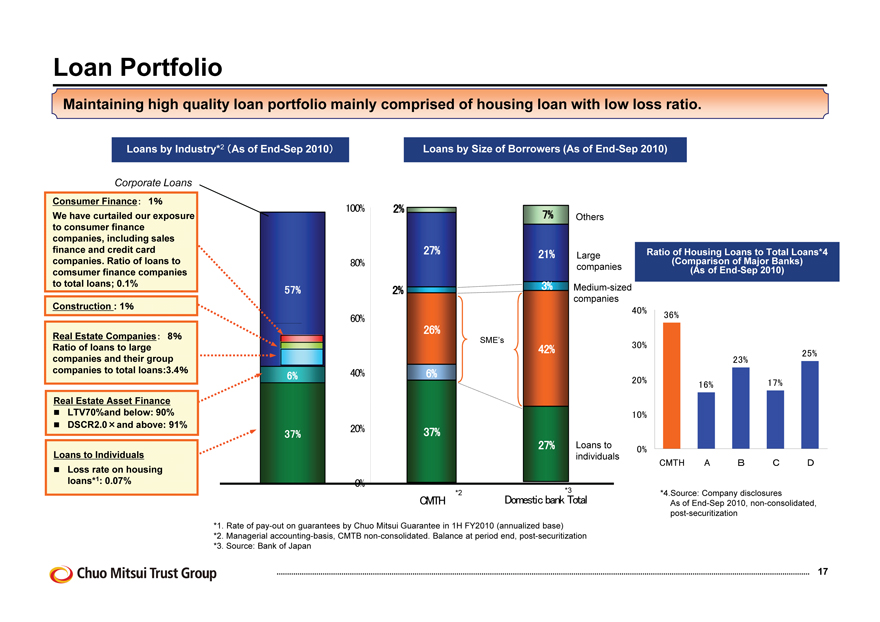
Loan Portfolio
Maintaining high quality loan portfolio mainly comprised of housing loan with low loss ratio.
Loans by Industry*2 (As of End-Sep 2010) Loans by Size of Borrowers (As of End-Sep 2010)
Corporate Loans
Consumer Finance: 1% We have curtailed our exposure to consumer finance companies, including sales finance and credit card companies. Ratio of loans to comsumer finance companies to total loans; 0.1%
Construction : 1%
Real Estate Companies: 8% Ratio of loans to large companies and their group companies to total loans:3.4%
Real Estate Asset Finance
LTV70%and below: 90%
DSCR2.0×and above: 91%
Loans to Individuals
Loss rate on housing loans*1: 0.07%
Ratio of Housing Loans to Total Loans*4
(Comparison of Major Banks)
(As of End-Sep 2010)
100% 2%
7%
27% 21% 80%
57% 2% 3%
60%
26%
SME’s 42%
6% 40% 6%
20% 37% 37%
27%
Others
Large companies
Medium-sized companies
Loans to individuals
40%
30%
20%
10%
0%
36% 16% 23% 17% 25%
CMTH A B C D
*4.Source: Company disclosures
As of End-Sep 2010, non-consolidated, post-securitization
*2 Domestic bank Total *3 CMTH
*1. Rate of pay-out on guarantees by Chuo Mitsui Guarantee in 1H FY2010 (annualized base) *2. Managerial accounting-basis, CMTB non-consolidated. Balance at period end, post-securitization *3. Source: Bank of Japan
Chuo Mitsui Trust Group
17
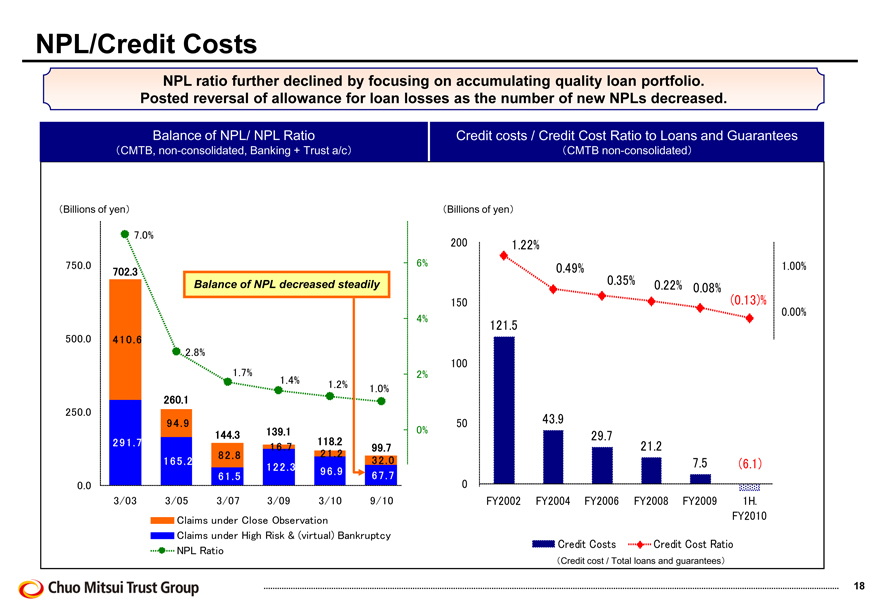
NPL/Credit Costs
NPL ratio further declined by focusing on accumulating quality loan portfolio. Posted reversal of allowance for loan losses as the volume of new NPLs decreased.
Balance of NPL/ NPL Ratio Credit costs / Credit Cost Ratio to Loans and Guarantees
CMTB, non-consolidated, Banking + Trust a/c CMTB non-consolidated
Billions of yen
70%.
7500. 6%
Balance of NPL decreased steadily
4% 5000.410.6 28% .
17% . 2% 14% . 12% .
10% .
2500.
94.9
0%
291.7
16.7
82.8
21.2
165.2
32.0
122.3
96.9
61.5
67.7
00. -3/03 3/05 3/07 3/09
Claims under Close Observation
Claims under High Risk & (Virtual) Bankruptcy
NPL Ratio
Billions of yen
200 122% .
049% . 100% . 035% . 022% .
008% . -013% . 150 000% .
1215.
100 -100% .
-200% .
50 439.
297.
212. -300% . 75. (61) .
0
FY2002 FY2004 FY2006 FY2008 -400%. 9/10 FY2010
-50
Credit CostsCredit Cost Ratio -500% .
Credit cost / Total loans and guarantees
Chuo Mitsui Trust Group
18
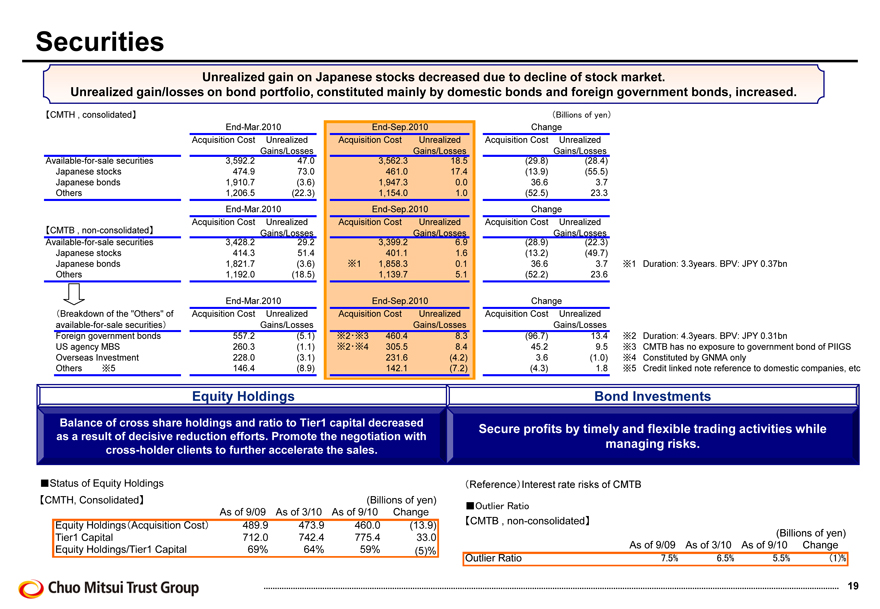
Securities
Unrealized gain on Japanese stocks decreased due to decline of stock market.
Unrealized gain/losses on bond portfolio, constituted mainly by domestic bonds and foreign government bonds, increased.
[CMTH, consolidated] (Billions of yen)
End-Mar.2010 End-Sep.2010 Change
Acquisition Cost Unrealized Acquisition Cost Unrealized Acquisition Cost Unrealized
Gains/Losses Gains/Losses Gains/Losses
Available-for-sale securities 3,592.2 47.0 3,562.3 18.5 (29.8) (28.4)
Japanese stocks 474.9 73.0 461.0 17.4 (13.9) (55.5)
Japanese bonds 1,910.7 (3.6) 1,947.3 0.0 36.6 3.7
Others 1,206.5 (22.3) 1,154.0 1.0 (52.5) 23.3
End-Mar.2010 End-Sep.2010 Change
Acquisition Cost Unrealized Acquisition Cost Unrealized Acquisition Cost Unrealized
[CMTB, non-consolidated] Gains/Losses Gains/Losses Gains/Losses
Available-for-sale securities 3,428.2 29.2 3,399.2 6.9 (28.9) (22.3)
Japanese stocks 414.3 51.4 401.1 1.6 (13.2) (49.7)
Japanese bonds 1,821.7 (3.6) 1 1,858.3 0.1 36.6 3.7
Others 1,192.0 (18.5) 1,139.7 5.1 (52.2) 23.6
End-Mar.2010 End-Sep.2010 Change
(Breakdown of the “Others” of Acquisition Cost Unrealized Acquisition Cost Unrealized Acquisition Cost Unrealized
available-for-sale securities) Gains/Losses Gains/Losses Gains/Losses
Foreign government bonds 557.2 (5.1) 23 460.4 8.3 (96.7) 13.4
US agency MBS 260.3 (1.1) 24 305.5 8.4 45.2 9.5
Overseas Investment 228.0 (3.1) 231.6 (4.2) 3.6 (1.0)
Others 5 146.4 (8.9) 142.1 (7.2) (4.3) 1.8
1 Duration: 3.3years. BPV: JPY 0.37bn
2 Duration: 4.3years. BPV: JPY 0.31bn
3 CMTB has no exposure to government bond of PIIGS
4 Constituted by GNMA only
5 Credit linked note reference to domestic companies, etc
Equity Holdings
Balance of cross share holdings and ratio to Tier1 capital decreased as a result of decisive reduction efforts. Promote the negotiation with cross-holder clients to further accelerate the sales.
Bond Investments
Secure profits by timely and flexible trading activities while managing risks.
Status of Equity Holdings
[CMTH, Consolidated] (Billions of yen) As of 9/09 As of 3/10 As of 9/10 Change Equity Holdings (Acquisition Cost) 489.9 473.9 460.0 (13.9) Tier1 Capital 712.0 742.4 775.4 33.0 Equity Holdings/Tier1 Capital 69% 64% 59% (5)%
(Reference) Interest rate risks of CMTB
Outlier Ratio
[CMTB, non-consolidated]
(Billions of yen) As of 9/09 As of 3/10 As of 9/10 Change Outlier Ratio 7.5% 6.5% 5.5% (1)%
Chuo Mitsui Trust Group
19
V. Status of capital
Capital/Public Funds
Effect of New Basel Regulation
Chuo Mitsui Trust Group
20
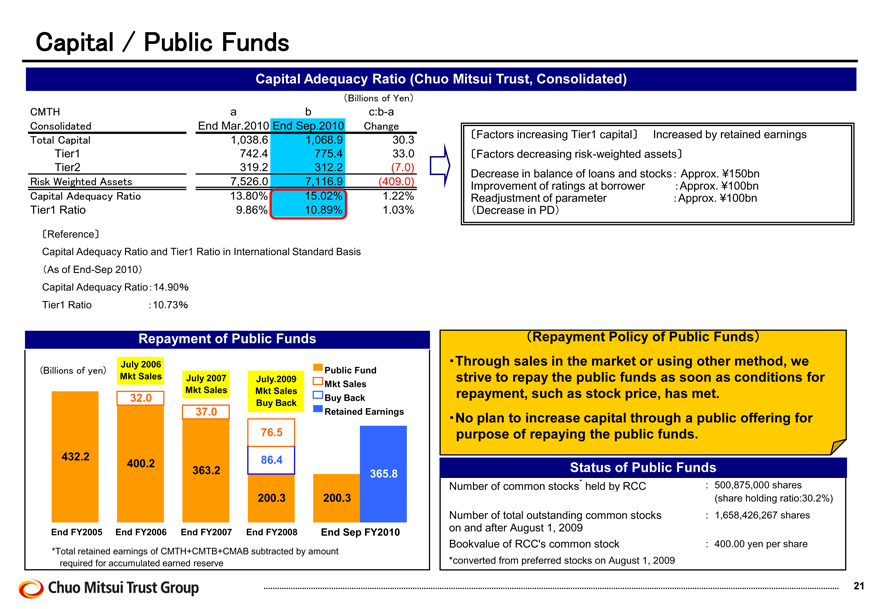
Capital / Public Funds
Capital Adequacy Ratio (Chuo Mitsui Trust, Consolidated)
Billions of Yen
CM TH Consolidated Total Capital
Tier1 Tier2
Risk Weighted Assets Capital Adequacy Ratio
Tier1 Ratio
a End Mar.2010 1,038.6 742.4 319.2 7,526.0 13.80% 9.86%
b End Sep.2010 1,068.9 775.4 312.2 7,116.9 15.02% 10.89%
c:b-a
Change
30.3 33.0 (7.0) (409.0) 1.22% 1.03%
[Factors increasing Tier1 capital] Increased by retained earnings
[Factors decreasing risk-weighted assets]
Decrease in balance of loans and stocks Approx: ¥150bn Improvement of ratings at borrower Approx: ¥100bn
Readjustment of Parameter Approx: ¥100bn
(Decrease in PD)
[Reference]
Capital Adequacy Ratio and Tier1 Ratio in International Standard Basis
(As of End-Sep 2010)
Capital Adequacy Ratio: 14.90 Tier1 Ratio: 10.73
Repayment of Public Funds
July 2006
(Billions of yen)
Mkt Sales
July 2007 Mkt Sales
July.2009 Mkt Sales Buy Back
Public Fund Mkt Sales Buy Back Retained Earnings
32.0
37.0
76.5
86.4
432.2
400.2
363.2
200.3 200.3
365.8
End FY2005 End FY2006 End FY2007 End FY2008 End Sep FY2010
*Total retained earnings of CMTH+CMTB+CMAB subtracted by amount required for accumulated earned reserve
(Repayment Policy of Public Funds)
Through sales in the market or using other method, we strive to repay the public funds as soon as conditions for repayment, such as stock price, has met.
No plan to increase capital through a public offering for purpose of repaying the public funds.
Status of Public Funds
Number of common stocks held by RCC : 500,875,000 shares (share holding ratio:30.2%) Number of total outstanding common stocks : 1,658,426,267 shares on and after August 1, 2009 Bookvalue of RCC’s common stock : 400.00 yen per share *converted from preferred stocks on August 1, 2009
Chuo Mitsui Trust Group
21
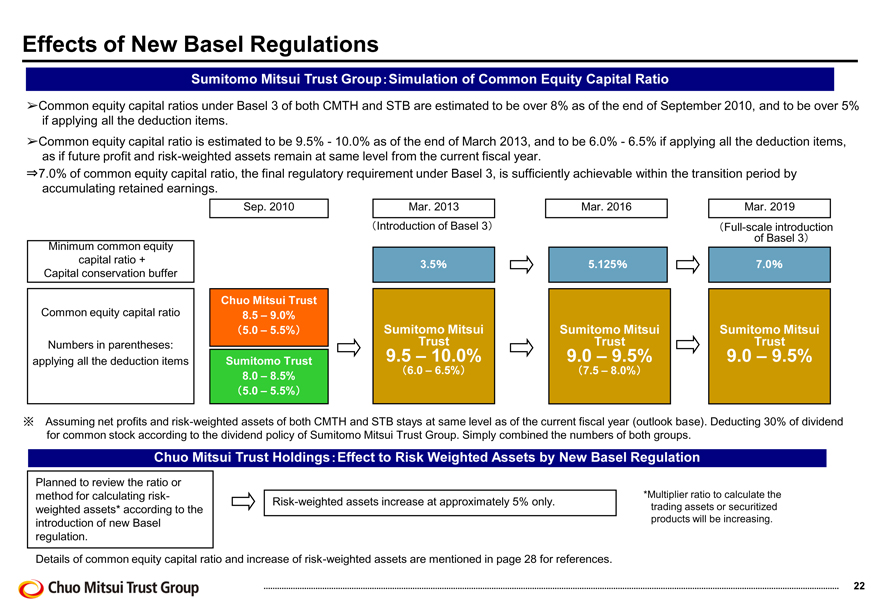
Effects of New Basel Regulations
Sumitomo Mitsui Trust Group: Simulation of Common Equity Capital Ratio
Common equity capital ratios under Basel 3 of both CMTH and STB are estimated to be over 8% as of the end of September 2010, and to be over 5% if applying all the deduction items.
Common equity capital ratio is estimated to be 9.5% - 10.0% as of the end of March 2013, and to be 6.0% - 6.5% if applying all the deduction items, as if future profit and risk-weighted assets remain at same level from the current fiscal year.
7.0% of common equity capital ratio, the final regulatory requirement under Basel 3, is sufficiently achievable within the transition period by accumulating retained earnings.
Sep. 2010 Mar. 2013 Mar. 2016 Mar. 2019 (Introduction of Basel 3) (Full-scale introduction of Basel 3)
Minimum common equity capital ratio + Capital conservation buffer
Common equity capital ratio
Numbers in parentheses: applying all the deduction items
Chuo Mitsui Trust 8.5 – 9.0%
(5.0 – 5.5%)
Sumitomo Trust 8.0 – 8.5%
(5.0 – 5.5%)
3.5%
Sumitomo Mitsui Trust
9.5 – 10.0%
(6.0 – 6.5%)
5.125%
Sumitomo Mitsui Trust
9.0 – 9.5%
(7.5 – 8.0%)
7.0%
Sumitomo Mitsui Trust
9.0 – 9.5%
Assuming net profits and risk-weighted assets of both CMTH and STB stays at same level as of the current fiscal year (outlook base). Deducting 30% of dividend for common stock according to the dividend policy of Sumitomo Mitsui Trust Group. Simply combined the numbers of both groups.
Chuo Mitsui Trust Holdings: Effect to Risk Weighted Assets by New Basel Regulation
Planned to review the ratio or method for calculating risk-weighted assets* according to the introduction of new Basel regulation.
Risk-weighted assets increase at approximately 5% only.
*Multiplier ratio to calculate the trading assets or securitized products will be increasing.
Details of common equity capital ratio and increase of risk-weighted assets are mentioned in page 28 for references.
Chuo Mitsui Trust Group
22
(References)
Pension/Stock Transfer Agency
Real Estate Asset Finance
Alternative Investment
Loan Portfolio and Trend of Yields
Effects of New Basel Regulations (Detail)
Chuo Mitsui Trust Group
23
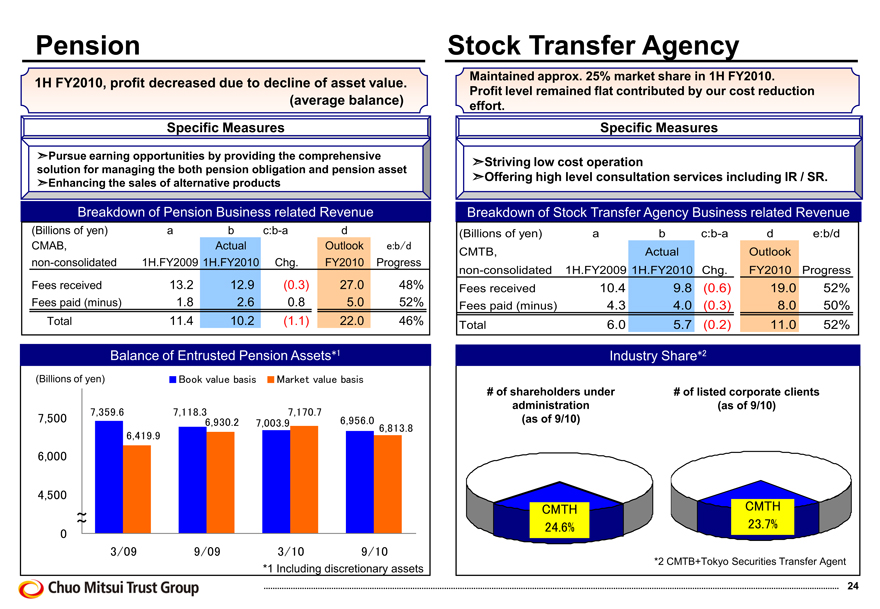
Pension
1H FY2010, profit decreased due to decline of asset value.
(average balance) Specific Measures
Pursue earning opportunities by providing the comprehensive solution for managing the both pension obligation and pension asset
Enhancing the sales of alternative products
Breakdown of Pension Business related Revenue
(Billions of yen) a b c:b-a d
CMAB, Actual Outlook e:b/d
non-consolidated 1H.FY2009 1H.FY2010 Chg. FY2010 Progress
Fees received 13.2 12.9 (0.3) 27.0 48%
Fees paid (minus) 1.8 2.6 0.8 5.0 52%
Total 11.4 10.2 (1.1) 22.0 46%
Balance of Entrusted Pension Assets*1
(Billions of yen) Book value basis Market value basis
7,359.6 7,118.3 7,170.7
7,500 6,930.2 7,003.9 6,956.0
6,813.8
6,419.9
6,000
4,500
3/09 9/09 3/10 9/10
*1 Including discretionary assets
Stock Transfer Agency
Maintained approx. 25% market share in 1H FY2010. Profit level remained flat contributed by our cost reduction effort.
Specific Measures
Striving low cost operation
Offering high level consultation services including IR / SR.
Breakdown of Stock Transfer Agency Business related Revenue
(Billions of yen) a b c:b-a d e:b/d
CMTB, Actual Outlook
non-consolidated 1H.FY2009 1H.FY2010 Chg. FY2010 Progress
Fees received 10.4 9.8 (0.6) 19.0 52%
Fees paid (minus) 4.3 4.0 (0.3) 8.0 50%
Total 6.0 5.7 (0.2) 11.0 52%
Industry Share*2
# of shareholders under # of listed corporate clients administration (as of 9/10) (as of 9/10)
CMTH CMTH 24.6% 23.7%
*2 CMTB+Tokyo Securities Transfer Agent
24
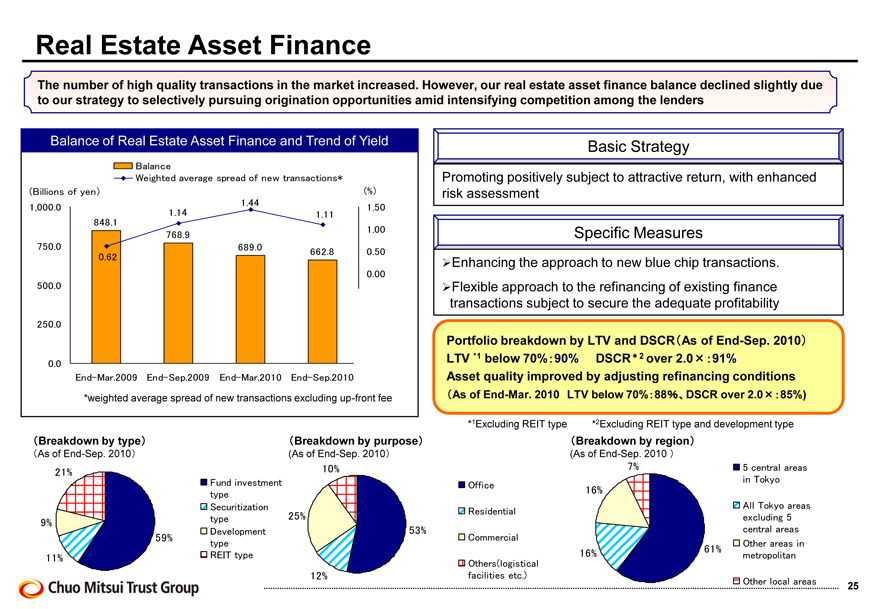
Real Estate Asset Finance
The number of high quality transactions in the market increased. However, our real estate asset finance balance declined slightly due to our strategy to selectively pursuing origination opportunities amid intensifying competition among the lenders
Balance of Real Estate Asset Finance and Trend of Yield
Balance
Weighted average spread of new transactions*
(Billions of yen)
1,000.0
(%) 1.50
1.00 0.50 0.00
750.0 500.0 250.0 0.0
848.1
0.62
1.14
768.9
1.44
689.0
1.11
662.8
End-Mar.2009 End-Sep.2009 End-Mar.2010 End-Sep.2010
*weighted average spread of new transactions excluding up-front fee
(Breakdown by type)
(As of End-Sep. 2010)
21%
9%
59% 11%
Fund investment type Securitization type Development type REIT type
(Breakdown by purpose)
(As of End-Sep. 2010)
10%
25% 53% 12%
Basic Strategy Promoting positively subject to attractive return, with enhanced risk assessment
Specific Measures
Enhancing the approach to new blue chip transactions.
Flexible approach to the refinancing of existing finance transactions subject to secure the adequate profitability
Portfolio breakdown by LTV and DSCR (As of End-Sep. 2010) LTV *1 below 70% 90% DSCR*2 over 2.0 × : 91% Asset quality improved by adjusting refinancing conditions (As of End-Mar. 2010 LTV below 70% : 88 DSCR over 2.0 × : 85%)
*1Excluding REIT type *2Excluding REIT type and development type
(Breakdown by region)
(As of End-Sep. 2010)
Office
Commercial
Others (logistical facilities etc.)
Residential
7%
16%
16%
61%
5 central areas in Tokyo
All Tokyo areas excluding 5 central areas
Other areas in metropolitan
Other local areas
25
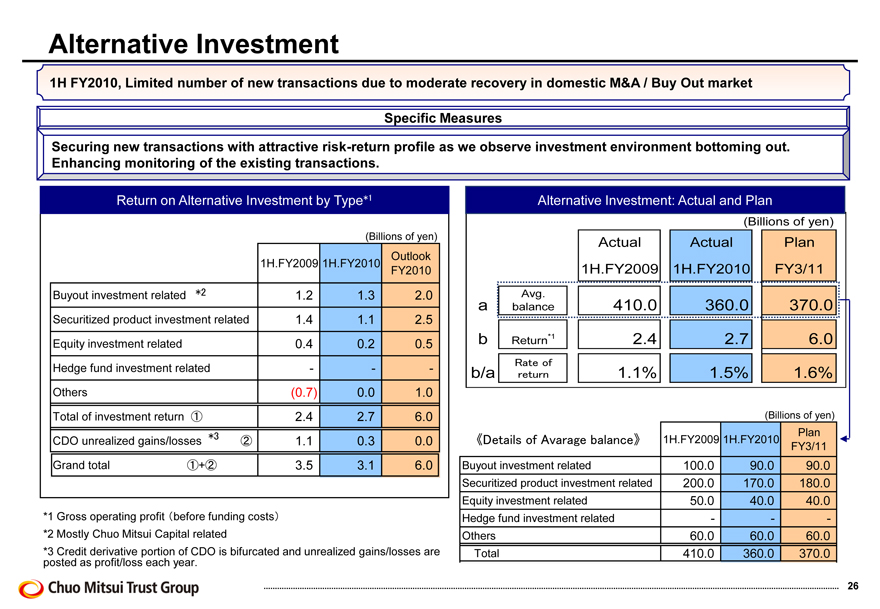
Alternative Investment
1H FY2010, Limited number of new transactions due to moderate recovery in domestic M&A / Buy Out market Specific Measures
Securing new transactions with attractive risk-return profile as we observe investment environment bottoming out. Enhancing monitoring of the existing transactions.
Return on Alternative Investment by Type*1 Alternative Investment: Actual and Plan
Buyout investment related *2 Securitized product investment related
Equity investment related Hedge fund investment related Others
Total of investment return 1
CDO unrealized gains/losses *3 2
Grand total 1+2
1H.FY2009
1.2 1.4 0.4 -(0.7) 2.4 1.1 3.5
1H.FY2010
1.3 1.1 0.2 - 0.0 2.7 0.3 3.1
(Billions of yen)
Outlook FY2010
2.0 2.5 0.5 - 1.0 6.0 0.0 6.0
*1 Gross operating profit before funding costs
*2 Mostly Chuo Mitsui Capital related
*3 Credit derivative portion of CDO is bifurcated and unrealized gains/losses are posted as profit/loss each year.
Alternative Investment: Actual and Plan
(Billions of yen)
a b b/a
Avg. balance
Return*1
Rate of return
Actual 1H.FY2009
410.0
2.4
1.1%
Actual 1H.FY2010
360.0 2.7 1.5%
Plan FY3/11
370.0
6.0
1.6%
(Billions of yen)
(Details of Average balance) 1H.FY2009 1H.FY2010 Plan FY3/11
Buyout investment related 100.0 90.0 90.0
Securitized product investment related 200.0 170.0 180.0
Equity investment related 50.0 40.0 40.0
Hedge fund investment related - - -
Others 60.0 60.0 60.0
Total 410.0 360.0 370.0
26
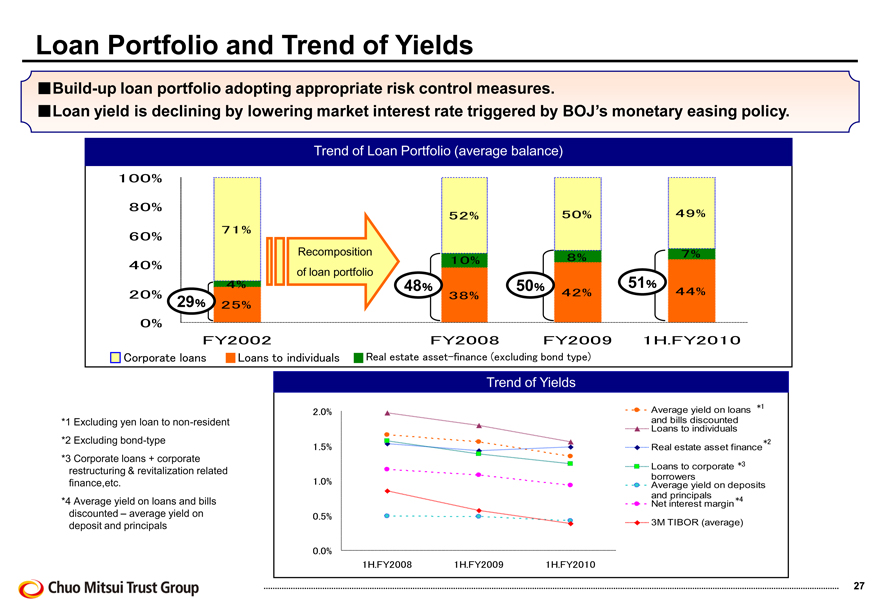
Loan Portfolio and Trend of Yields
Build-up loan portfolio adopting appropriate risk control measures.
Loan yield is declining by lowering market interest rate triggered by BOJ’s monetary easing policy.
Trend of Loan Portfolio (average balance)
100%
80%
60%
40%
20%
0%
71%
4%
25%
FY2002
Recomposition of loan portfolio
52%
10%
38%
FY2008
50%
8%
42%
FY2009
49%
7%
44%
1H.FY2010
29% 48% 50% 51%
Corporate loans
Loans to individuals
Real estate asset-finance (excluding bond type)
Trend of Yields
*1 Excluding yen loan to non-resident
*2 Excluding bond-type
*3 Corporate loans + corporate restructuring & revitalization related finance,etc.
*4 Average yield on loans and bills discounted – average yield on deposit and principals
2.0%
1.5%
1.0%
0.5%
0.0%
1H.FY2008
1H.FY2009
1H.FY2010
Average yield on loans and bills discounted Loans to individuals *1
Real estate asset finance *2
Loans to corporate *3
borrowers
Average yield on deposits and principals
Net interest margin *4
3M TIBOR (average)
Chuo Mitsui Trust Group
27
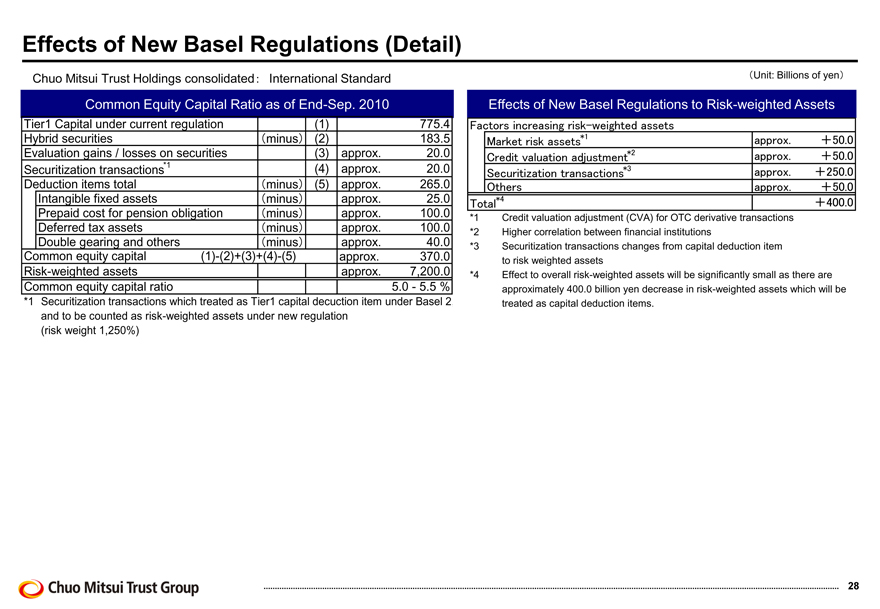
Effects of New Basel Regulations (Detail)
Chuo Mitsui Trust Holdings consolidated: International Standard
Common Equity Capital Ratio as of End-Sep. 2010
Tier1 Capital under current regulation (1) 775.4
Hybrid securities (minus) (2) 183.5
Evaluation gains / losses on securities (3) approx. 20.0
Securitization transactions*1 (4) approx. 20.0
Deduction items total (minus) (5) approx. 265.0
Intangible fixed assets (minus) approx. 25.0
Prepaid cost for pension ogbligation (minus) approx. 100.0
Deferred tax assets (minus) approx. 100.0
Double gearing and others (minus) approx. 40.0
Common equity capital (1)-(2) + (3) + (4)-(5) approx. 370.0
Risk-weighted assets approx. 7,200.0
Common equity capital ratio 5.0 - 5.5 %
*1 Securitization transactions which treated as Tier1 capital decuction item under Basel 2 and to be counted as risk-weighted assets under new regulation (risk weight 1,250%)
(Unit: Billions of yen)
Effects of New Basel Regulations to Risk-weighted Assets
Factors increasing risk-weighted assets
Market risk assets*1 approx. +50.0
Credit valuation adjustment*2 approx. +50.0
Securitization transactions*3 approx. +250.0
Others approx. +50.0
Total *4 +400.0
*1 Credit valuation adjustment (CVA) for OTC derivative transactions
*2 Higher correlation between financial institutions
*3 Securitization transactions changes from capital deduction item to risk weighted assets
*4 Effect to overall risk-weighted assets will be significantly small as there are approximately 400.0 billion yen decrease in risk-weighted assets which will be
treated as capital deduction items.
Chuo Mitsui Trust Group
28
Cautionary Statement Regarding Forward-Looking Statements This material contains certain forward-looking statements that reflect the plans and expectations of Chuo Mitsui Trust Holdings, Inc. and The Sumitomo Trust and Banking Co., Ltd. in relation to, and the benefits resulting from, their proposed business combination and business alliance. These forward-looking statements may be identified by words such as ‘believes’, ‘expects’, ‘anticipates’, ‘projects’, ‘intends’, ‘should’, ‘seeks’, ‘estimates’, ‘future’ or similar expressions or by discussion of, among other things, strategy, goals, plans or intentions. Actual results may differ materially in the future from those reflected in forward-looking statements contained in this document, due to various factors including but not limited to:
• failure of the parties to agree on some or all of the terms of business combination;
• failure to obtain a necessary shareholder approval;
• inability to obtain some or all necessary regulatory approvals or to fulfill any other condition to the closing of the transaction; • changes in laws or accounting standards, or other changes in the business environment relevant to the parties; • challenges in executing our business strategies; • the effects of financial instability or other changes in general economic or industry conditions; and • other risks to consummation of the transaction.
Additional Information and Where to Find It
Chuo Mitsui Trust Holdings, Inc. has filed a registration statement on Form F-4 with the U.S. Securities and Exchange Commission (the “SEC”) in connection with its proposed business combination with The Sumitomo Trust and Banking Co., Ltd. The Form F-4 contains a prospectus and other documents. The prospectus contained in the Form F-4 is expected to be mailed to U.S. shareholders of The Sumitomo Trust and Banking Co., Ltd. prior to the shareholders’ meeting at which the proposed business combination will be voted upon. The Form F-4 and prospectus, as they may be amended from time to time, contain important information about Chuo Mitsui Trust Holdings, Inc. and The Sumitomo Trust and Banking Co., Ltd., the business combination and related matters including the terms and conditions of the transaction. U.S. shareholders of The Sumitomo Trust and Banking Co., Ltd. are urged to read carefully the Form F-4, the prospectus and the other documents, as they may be amended from time to time, that have been or may be filed with the SEC in connection with the transaction before they make any decision at the shareholders meeting with respect to the business combination. The Form F-4 the prospectus and all other documents filed with the SEC in connection with the business combination is available, free of charge, on the SEC’s web site at http://www.sec.gov. In addition, the prospectus and all other documents filed with the SEC in connection with the business combination is made available to U.S. shareholders of The Sumitomo Trust and Banking Co., Ltd., free of charge, by faxing a request to Chuo Mitsui Trust Holdings, Inc. at +81-
3-5232-8716 or to The Sumitomo Trust and Banking Co., Ltd. at +81-3-3286-4654.
29
This material contains certain forward-looking statements. These statements are not guarantees of future performance., and involve risks and uncertainties. Actual results may differ from these forward-looking statements contained in the present material, due to various factors, including, but not limited, to changes in overall economic conditions.
30
