Filing under Rule 425 under the U.S. Securities Act of 1933
Filing by: The Sumitomo Trust and Banking Co., Ltd.
Subject Company: The Sumitomo Trust and Banking Co., Ltd.
Commission File Number: 132-02705
Dated December 21, 2010
The Sumitomo Trust and Banking Co., Ltd.
Information Meeting on Financial Results for 1HFY2010
November 24, 2010
This presentation material contains information that constitutes forward-looking statements. Such forward-looking statements are not guarantees of future performance and involve risks and uncertainties, and actual results may differ from those in the forward-looking statements as a result of various factors including changes in managerial circumstances.
This presentation does not constitute an offer to sell or a solicitation of an offer to subscribe for or purchase any securities.
Meeting agenda
1HFY2010 financial results and financial condition 3
Basel III and status of capital 16
Forecast for FY2010 19
Strengthen group strategy and prioritized businesses 21
(For reference) Credit portfolio 28
(For reference) Division performance 34
1

I am Hitoshi Tsunekage, President and CEO of The Sumitomo Trust and Banking Co., Ltd. Thank you very much for taking the time out of your busy schedule to attend our information meeting on financial results today.
Looking back over 1HFY2010, against a backdrop of concerns about Europe’s fiscal problems and economic slowdown in developed countries, deflation has remained an issue in financial markets as well, especially with regard to stock prices and interest rates. Currently, sparked by the recent announcement of a second round of quantitative easing (QE2) by the Federal Reserve Board, we are finally seeing a change in the tide of financial market trends. However, there remain latent factors of instability, such as yesterday’s incident that heightened tension on the Korean Peninsula.
In this environment, based on our strategy and business “form” which have evolved under the Midterm Management Plan that began in FY2009, in 1HFY2010 we worked to achieve results by realizing the thorough and persistent implementation of this plan. With regard to the results, I still cannot say I am fully satisfied with the level achieved in 1HFY2010. However, in each of our prioritized business areas, we see the beginning of recovery, or solid progress in the expansion of business foundations for 2HFY2010 onwards.
On the other hand, although there is now less risk of a “second dip” in the economy, considering the path for solving structural issues especially in developed countries, we still cannot relax our preparations against uncertainties in the macroeconomic and financial environments. We have been steadily working to control financial risks in our own way, to achieve the best balance of “offense” and “defense” strategies which I have been emphasizing.
Today, I will explain about these results in 1HFY2010, and discuss priority issues for 2HFY2010 and our determination to deal with them head-on.
Please see page 2, “Summary of 1HFY2010.”
Summary of 1HFY2010
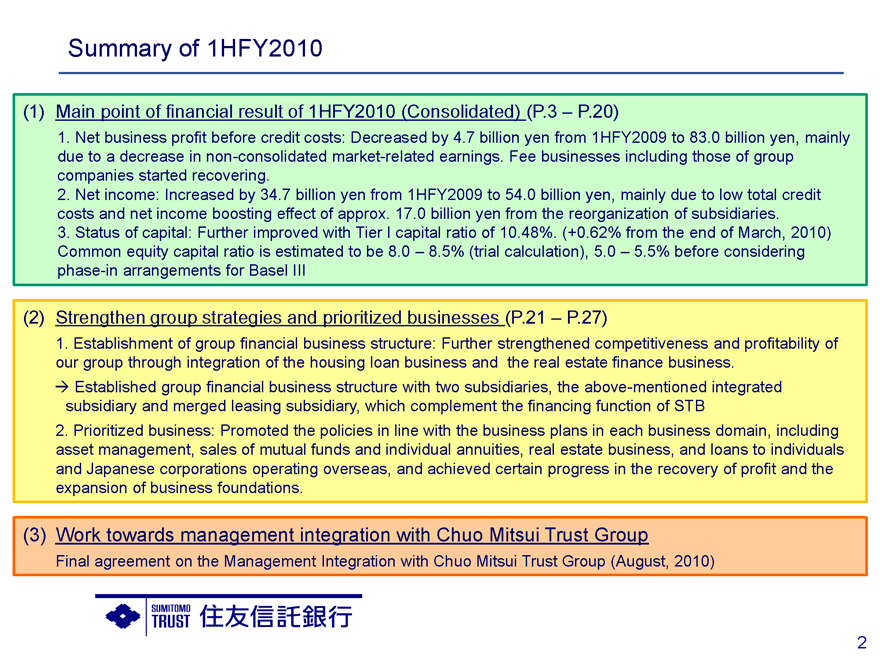
(1) Main point of financial result of 1HFY2010 (Consolidated) (P.3 – P.20)
1. Net business profit before credit costs: Decreased by 4.7 billion yen from 1HFY2009 to 83.0 billion yen, mainly due to a decrease in non-consolidated market-related earnings. Fee businesses including those of group companies started recovering.
2. Net income: Increased by 34.7 billion yen from 1HFY2009 to 54.0 billion yen, mainly due to low total credit costs and net income boosting effect of approx. 17.0 billion yen from the reorganization of subsidiaries.
3. Status of capital: Further improved with Tier I capital ratio of 10.48%. (+0.62% from the end of March, 2010) Common equity capital ratio is estimated to be 8.0 – 8.5% (trial calculation), 5.0 – 5.5% before considering phase-in arrangements for Basel III
(2) Strengthen group strategies and prioritized businesses (P.21 – P.27)
1. Establishment of group financial business structure: Further strengthened competitiveness and profitability of our group through integration of the housing loan business and the real estate finance business.
Established group financial business structure with two subsidiaries, the above-mentioned integrated subsidiary and merged leasing subsidiary, which complement the financing function of STB
2. Prioritized business: Promoted the policies in line with the business plans in each business domain, including asset management, sales of mutual funds and individual annuities, real estate business, and loans to individuals and Japanese corporations operating overseas, and achieved certain progress in the recovery of profit and the expansion of business foundations.
(3) Work towards management integration with Chuo Mitsui Trust Group
Final agreement on the Management Integration with Chuo Mitsui Trust Group (August, 2010)
2
I will begin by explaining the main points of our 1HFY2010 financial results. Consolidated net business profit before credit costs decreased by 4.7 billion yen from 1HFY2009 to 83.0 billion yen, mainly due to a decrease in non-consolidated market-related earnings. Since last year, we have moved to greatly reduce our risk of domestic and foreign bonds held. As we have thoroughly prepared against the risk of fluctuations in long-term interest rates that we are now seeing, our result of market-related earnings was much different from those of other large banks in 1HFY2010. I think this is one notable point. Meanwhile, fee businesses including those of group companies, such as sales of mutual funds and individual annuities, and the real estate and fiduciary businesses, started recovering.
Consolidated net income increased by 34.7 billion yen from 1HFY2009 to 54.0 billion yen, mainly due to low total credit costs and the subsidiary reorganization which generated net income boosting effect of approximately 17.0 billion yen centered on tax benefits.
Looking at the capital adequacy ratio, our Tier I capital ratio rose by 0.62% from March 2010 to 10.48%, due to increased retained earnings and a decrease in risk-weighted assets. Our trial calculation shows a so-called “common equity capital ratio” between 8% and 8.5% as of September 2010. I will further explain Basel III-related topic later.
Next, looking back on 1HFY2010, I will describe the state of our progress in strengthening group strategy and prioritized businesses. One point is that we integrated our groups housing loan and real estate finance businesses, thereby concentrating our group financial businesses into a two-subsidiary structure. Another point is the state of progress and results from our policies in prioritized business areas. I will explain these later while looking at their slides.
Looking back on 1HFY2010, another point is the final agreement on management integration with Chuo Mitsui Trust Group announced in August 2010. Since we have already explained our integration plan, today I will focus on the first two points I just mentioned.
I will now proceed to explain our 1HFY2010 financial results. Please look at page 4, a summary of our consolidated financial results.
1HFY2010 financial results and financial condition
3
[Blank]

1HFY2010 financial results (Consolidated)
Net business profit before credit costs decreased by 4.7 billion yen from 1HFY2009 to 83.0 billion yen, mainly due to a decrease in non-consolidated net business profit before credit costs. Contribution of group companies to net business profit before credit costs (before consolidated adjustments) increased by 5.9 billion yen to 23.4 billion yen over the same period, mainly due to Nikko Asset Management (Nikko AM) becoming a subsidiary
Net income increased by 34.7 billion yen from 1HFY2009 to 54.0 billion yen, owing to income-boosting factors such as tax effect resulting from the reorganization of subsidiaries (16.5 billion yen), in addition to a significant decrease in non-consolidated total credit costs
<Consolidated> (in billions of Yen) 1HFY2010 1HFY2009 Change
Net business profit before credit costs 83.0 87.7 -4.7(1)
(Contribution of group companies before consolidated adjustments) (23.4) (17.5) (5.9) (2)
Ordinary profit 61.5 33.4 28.0
Extraordinary profit -9.1 9.5 -18.6
Goodwill impairment loss -6.0—-6.0
Gain on retirement of perpetual subordinated bonds—9.4 -9.4
Income before income taxes 52.4 43.0 9.3
Net income 54.0 19.2 34.7
Total substantial credit costs (*) -9.9 -40.8 30.8(3)
(Group companies) (-6.2) (-8.1) (1.8)
Return on shareholders’ equity 9.8% 3.8% 6.0%
EPS (Yen) 30.89 11.31 19.58
Dividend on common share (Interim dividend) (Yen) 6.0 5.0 1.0
(*) “Total substantial credit costs” is a sum of “Total credit costs”, costs in “Net gains on sales of stocks and other securities” and “Others” which are related to investment in securities of domestic and overseas credit, and affiliates’ total credit costs included in “Net income from affiliates by equity method”.
<Major factors (change from 1HFY2009)>
(1) Net business profit before credit costs: -4.7 bn yen Non-consolidated -21.2 bn (60.4 bn 81.6 bn) Group companies +16.4 bn (22.6 bn 6.1 bn) (2) Contribution of group companies before consolidated adjustments(*) :+5.9 bn yen (*) Include dividend income (9.5 bn) from overseas SPV
Nikko AM +4.1 bn (new contribution) Sumishin Panasonic Financial Services
+1.3 bn (8.9 bn 7.5 bn) Sumishin Realty +0.7 bn (0.3 bn -0.3 bn) (3) Total substantial credit costs: +30.8 bn yen Non-consolidated +29.0 bn (-3.6 bn -32.7 bn) Group companies +1.8 bn (-6.2 bn -8.1bn)
<Effects from reorganization of subsidiaries (Consolidated)> Effect from reorganization of subsidiaries:+16.5 bn yen Goodwill impairment loss -6.0 bn Additional allowance for business not transferred -5.6 bn Taxes resulting from business transfer: -4.1 bn Tax effects for goodwill impairment loss and additional allowance: +6.1 bn
Tax effect for allowance for investment loss posted previous fiscal year: +26.3 bn
4
As I mentioned earlier, “net business profit before credit costs” decreased by 4.7 billion yen from 1HFY2009, mainly due to a decrease in non-consolidated net business profit before credit costs. The contribution of group companies before consolidated adjustments increased by 5.9 billion yen.
“Net income” increased by 34.7 billion yen from 1HFY2009 to 54.0 billion yen. In addition to a significant decrease in “total substantial credit a major factor was the reorganization of First Credit and Life Housing Loan, which boosted net income by 16.5 billion yen, mainly due to tax effects. Regarding the effect from the reorganization of subsidiaries, you can see the major factors in detail on the right side.
Next, on page 5, I would like you to see the contributions of major group companies.
Contribution of major group companies to consolidated financial results
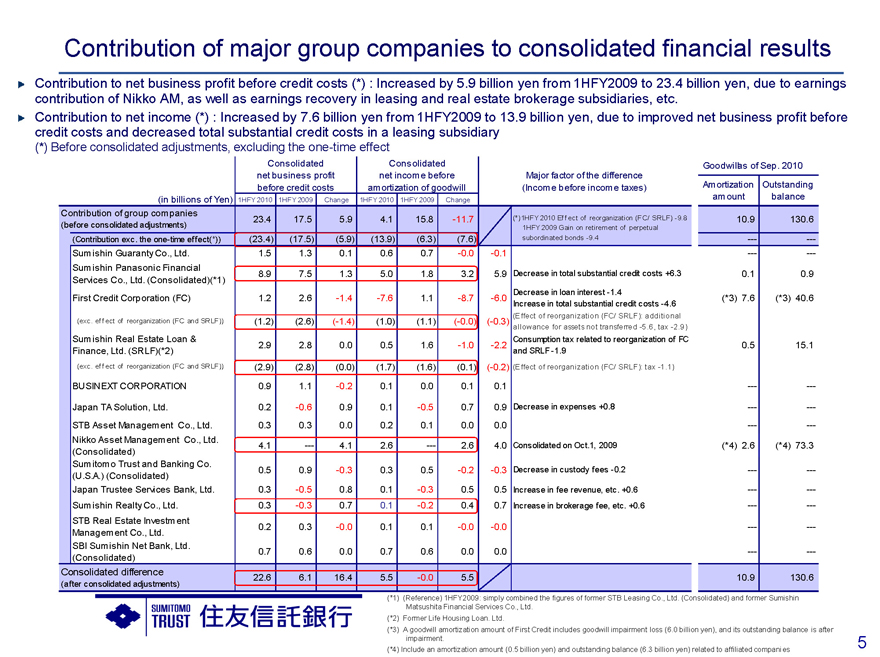
Contribution to net business profit before credit costs (*) : Increased by 5.9 billion yen from 1HFY2009 to 23.4 billion yen, due to earnings contribution of Nikko AM, as well as earnings recovery in leasing and real estate brokerage subsidiaries, etc.
Contribution to net income (*) : Increased by 7.6 billion yen from 1HFY2009 to 13.9 billion yen, due to improved net business profit before credit costs and decreased total substantial credit costs in a leasing subsidiary (*) Before consolidated adjustments, excluding the one-time effect
Consolidated Consolidated
net business profit net income before
before credit costs amortization of goodwill
(in billions of Yen) 1HFY2010 1HFY2009 Change 1HFY2010 1HFY2009 Change
Contribution of group companies 23.4 17.5 5.9 4.1 15.8 -11.7
(before consolidated adjustments)
(Contribution exc. the one-time effect (*)) (23.4) (17.5) (5.9) (13.9) (6.3) (7.6)
Sumishin Guaranty Co., Ltd. 1.5 1.3 0.1 0.6 0.7 -0.0 -0.1
Sumishin Panasonic Financial
8.9 7.5 1.3 5.0 1.8 3.2 5.9
Services Co., Ltd. (Consolidated)(*1)
First Credit Corporation (FC) 1.2 2.6 -1.4 -7.6 1.1 -8.7 -6.0
(exc. effect of reorganization (FC and SRLF)) (1.2) (2.6) (-1.4) (1.0) (1.1) (-0.0) (-0.3)
Sumishin Real Estate Loan &
2.9 2.8 0.0 0.5 1.6 -1.0 -2.2
Finance, Ltd. (SRLF)(*2)
(exc. effect of reorganization (FC and SRLF)) (2.9) (2.8) (0.0) (1.7) (1.6)(0.1) (-0.2)
BUSINEXT CORPORATION 0.9 1.1 -0.2 0.1 0.0 0.1 0.1
Japan TA Solution, Ltd. 0.2 -0.6 0.9 0.1 -0.5 0.7 0.9
STB Asset Management Co., Ltd. 0.3 0.3 0.0 0.2 0.1 0.0 0.0
Nikko Asset Management Co., Ltd.
4.1 — 4.1 2.6 — 2.6 4.0
(Consolidated)
Sumitomo Trust and Banking Co.
0.5 0.9 -0.3 0.3 0.5 -0.2 -0.3
(U.S.A.) (Consolidated)
Japan Trustee Services Bank, Ltd. 0.3 -0.5 0.8 0.1 -0.3 0.5 0.5
Sumishin Realty Co., Ltd. 0.3 -0.3 0.7 0.1 -0.2 0.4 0.7
STB Real Estate Investment
0.2 0.3 -0.0 0.1 0.1 - -0.0 -0.0
Management Co., Ltd.
SBI Sumishin Net Bank, Ltd.
0.7 0.6 0.0 0.7 0.6 0.0 0.0
(Consolidated)
Consolidated difference 22.6 6.1 16.4 5.5 -0.0 5.5
(after consolidated adjustments)
Goodwill as of Sep. 2010
Major factor of the difference
(Income before income taxes) Amortization Outstanding
amount balance
(*)1HFY2010 Effect of reorganization (FC/ SRLF) -9.8 10.9 130.6
1HFY2009
Gain on retirement of perpetual subordinated bonds -9.4 — — — —
Decrease in total substantial credit costs +6.3 0.1 0.9
Decrease in loan interest -1.4
(*3) 7.6(*3) 40.6
Increase in total substantial credit costs -4.6
(Effect of reorganization (FC/ SRLF): additional
allowance for assets not transferred -5.6, tax -2.9)
Consumption tax related to reorganization of FC
0.5 15.1
and SRLF -1.9
(Effect of reorganization (FC/ SRLF): tax -1.1)
— —
Decrease in expenses +0.8 — —
— —
Consolidated on Oct.1, 2009(*4) 2.6(*4) 73.3
Decrease in custody fees -0.2 — —
Increase in fee revenue, etc. +0.6 — —
Increase in brokerage fee, etc. +0.6 — —
— —
— —
10.9 130.6
(*1) (Reference) 1HFY2009: simply combined the figures of former STB Leasing Co., Ltd. (Consolidated) and former Sumishin Matsushita Financial Services Co., Ltd.
(*2) Former Life Housing Loan. Ltd.
(*3) A goodwill amortization amount of First Credit includes goodwill impairment loss (6.0 billion yen), and its outstanding balance is after impairment.
(*4) Include an amortization amount (0.5 billion yen) and outstanding balance (6.3 billion yen) related to affiliated companies
5
I will explain the contribution to consolidated financial results based on the figures before consolidated adjustments and excluding one-time effects, such as the reorganization of subsidiaries and the retirement of perpetual subordinated bonds, as shown in the second line from the top in the chart below.
Contribution at the stage of “net business profit before credit costs” increased by 5.9 billion yen from 1HFY2009. This was due to a 4.1 billion yen earnings contribution by Nikko Asset Management, which has become a consolidated subsidiary since last October, and earnings recovery in our leasing and real estate brokerage subsidiaries, etc. Earnings of First Credit decreased from 1HFY2009, but its results are generally in line with our initial forecast.
Also, contribution at the stage of “net income” before goodwill amortization increased by 7.6 billion yen from 1HFY2009. This was mainly due to an earnings contribution by Nikko Asset Management, and a significant decrease in “total substantial credit costs” in our leasing subsidiary.
I will explain in detail later about Sumishin Real Estate Loan & Finance, which started anew on September 30 when it was renamed after the business reorganization. Our leasing, real estate, and fiduciary-related business subsidiaries also all saw a recovery or stabilization in their results. Next, for an outline of non-consolidated financial results, please look at page 6.
1HFY2010 financial results (Non-consolidated)
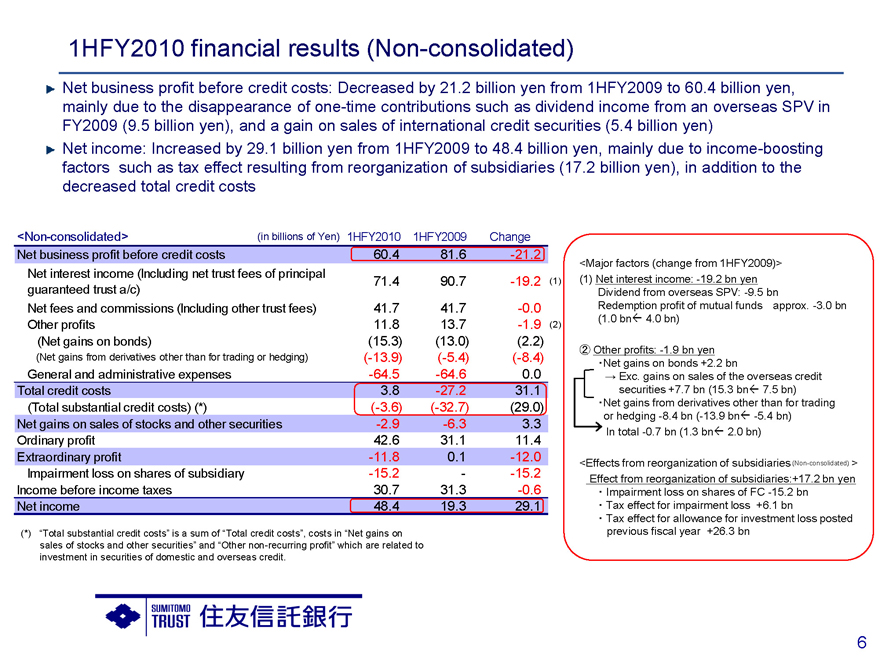
Net business profit before credit costs: Decreased by 21.2 billion yen from 1HFY2009 to 60.4 billion yen, mainly due to the disappearance of one-time contributions such as dividend income from an overseas SPV in FY2009 (9.5 billion yen), and a gain on sales of international credit securities (5.4 billion yen) Net income: Increased by 29.1 billion yen from 1HFY2009 to 48.4 billion yen, mainly due to income-boosting factors such as tax effect resulting from reorganization of subsidiaries (17.2 billion yen), in addition to the decreased total credit costs
<Non-consolidated>(in billions of Yen) 1HFY2010 1HFY2009 Change
Net business profit before credit costs 60.4 81.6 -21.2
Net interest income (Including net trust fees of principal 71.4 90.7 -19.2(1)
guaranteed trust a/c)
Net fees and commissions (Including other trust fees) 41.7 41.7 -0.0
Other profits 11.8 13.7 -1.9(2)
(Net gains on bonds)(15.3)(13.0)(2.2)
(Net gains from derivatives other than for trading or hedging) (-13.9)(-5.4)(-8.4)
General and administrative expenses -64.5 -64.6 0.0
Total credit costs 3.8 -27.2 31.1
(Total substantial credit costs) (*) (-3.6) (-32.7) (29.0)
Net gains on sales of stocks and other securities -2.9 -6.3 3.3
Ordinary profit 42.6 31.1 11.4
Extraordinary profit -11.8 0.1 -12.0
Impairment loss on shares of subsidiary -15.2 - -15.2
Income before income taxes 30.7 31.3 -0.6
Net income 48.4 19.3 29.1
(*) “Total substantial credit costs” is a sum of “Total credit costs”, costs in “Net gains on sales of stocks and other securities” and “Other non-recurring profit” which are related to investment in securities of domestic and overseas credit.
<Major factors (change from 1HFY2009)>
(1) Net interest income: -19.2 bn yen
Dividend from overseas SPV: -9.5 bn
Redemption profit of mutual funds approx. -3.0 bn
(1.0 bn 4.0 bn)
(2) Other profits: -1.9 bn yen
Net gains on bonds +2.2 bn
Exc. gains on sales of the overseas credit securities +7.7 bn (15.3 bn 7.5 bn)
Net gains from derivatives other than for trading
or hedging -8.4 bn (-13.9 bn -5.4 bn)
In total -0.7 bn (1.3 bn 2.0 bn)
<Effects from reorganization of subsidiaries (Non-consolidated) >
Effect from reorganization of subsidiaries: +17.2 bn yen
Impairment loss on shares of FC -15.2 bn
Tax effect for impairment loss +6.1 bn
Tax effect for allowance for investment loss posted previous fiscal year +26.3 bn
6
“Net business profit before credit costs” decreased by 21.2 billion yen from 1HFY2009 to 60.4 billion yen, mainly due to the disappearance of one-time contributions which totaled approximately 15.0 billion yen. These were dividend income from an overseas SPV funded by the gain on retirement of perpetual subordinated bonds in FY2009 (9.5 billion yen), and a gain on sales of international credit securities (5.4 billion yen).
Looking at major contributing factors, “net interest income” decreased by 19.2 billion yen from 1HFY2009, which includes a 9.5 billion yen decrease due to the disappearance of the dividend income from an overseas SPV that I just mentioned, and an approximately 3.0 billion yen decrease in redemption profit of mutual funds. In “other profits”, “net gains on bonds” increased by 2.2 billion yen from 1HFY2009, while “net gains from derivatives other than for trading or hedging” decreased by 8.4 billion yen.
Most of “net gains from derivatives other than for trading or hedging” were generated from our position managed together with bonds held by our business group of treasury and financial products. Therefore, one should view the actual capital gains/losses on bonds by combining them both.
“Net income” increased by 29.1 billion yen from 1HFY2009 to 48.4 billion yen. This was mainly due to income-boosting factors such as decreased credit costs”, and a total 17.2 billion yen net increase from the reorganization of subsidiaries resulting in impairment loss on a subsidiary’s shares, tax effects and others, as shown in the box at the right.
Next, we will look at top line changes in each business. Please look at page 7.
Breakdown of profit by business
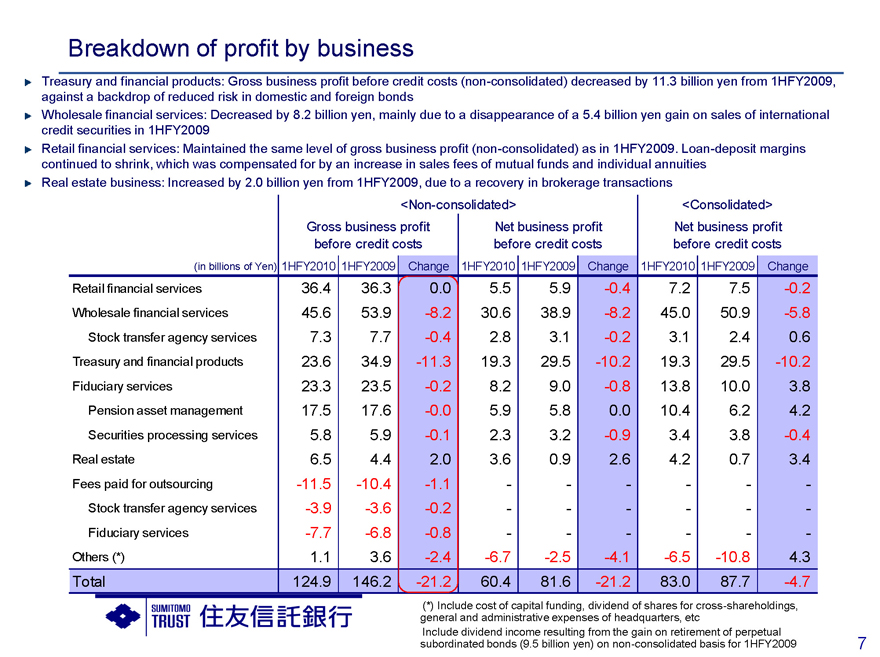
Treasury and financial products: Gross business profit before credit costs (non-consolidated) decreased by 11.3 billion yen from 1HFY2009, against a backdrop of reduced risk in domestic and foreign bonds Wholesale financial services: Decreased by 8.2 billion yen, mainly due to a disappearance of a 5.4 billion yen gain on sales of international credit securities in 1HFY2009 Retail financial services: Maintained the same level of gross business profit (non-consolidated) as in 1HFY2009. Loan-deposit margins continued to shrink, which was compensated for by an increase in sales fees of mutual funds and individual annuities Real estate business: Increased by 2.0 billion yen from 1HFY2009, due to a recovery in brokerage transactions
<Non-consolidated> <Consolidated>
Gross business profit Net business profit Net business profit
before credit costs before credit costs before credit costs
(in billions of Yen) 1HFY2010 1HFY2009 Change 1HFY2010 1HFY2009 Change 1HFY2010 1HFY2009 Change
Retail financial services 36.4 36.3 0.0 5.5 5.9 -0.4 7.2 7.5 -0.2
Wholesale financial services 45.6 53.9 -8.2 30.6 38.9 -8.2 45.0 50.9 -5.8
Stock transfer agency services 7.3 7.7 -0.4 2.8 3.1 -0.2 3.1 2.4 0.6
Treasury and financial products 23.6 34.9 -11.3 19.3 29.5 -10.2 19.3 29.5 -10.2
Fiduciary services 23.3 23.5 -0.2 8.2 9.0 -0.8 13.8 10.0 3.8
Pension asset management 17.5 17.6 -0.0 5.9 5.8 0.0 10.4 6.2 4.2
Securities processing services 5.8 5.9 -0.1 2.3 3.2 -0.9 3.4 3.8 -0.4
Real estate 6.5 4.4 2.0 3.6 0.9 2.6 4.2 0.7 3.4
Fees paid for outsourcing -11.5 -10.4 -1.1 - - - - - -
Stock transfer agency services -3.9 -3.6 -0.2 - - - - - -
Fiduciary services -7.7 -6.8 -0.8 - - - - - -
Others (*) 1.1 3.6 -2.4 -6.7 -2.5 -4.1 -6.5 -10.8 4.3
Total 124.9 146.2 -21.2 60.4 81.6 -21.2 83.0 87.7 -4.7
(*) Include cost of capital funding, dividend of shares for cross-shareholdings, general and administrative expenses of headquarters, etc Include dividend income resulting from the gain on retirement of perpetual subordinated bonds (9.5 billion yen) on non-consolidated basis for 1HFY2009
7
Looking at non-consolidated “gross business profit before credit costs”, that of treasury and financial products decreased by 11.3 billion yen from 1HFY2009. You can see that of wholesale financial services decreased by
8.2 billion yen, mainly due to the disappearance of the gain on sales of international credit securities in FY2009.
Treasury and financial products saw a decrease in income from domestic and overseas bonds, while marketing function-related earnings were stable. Details are shown on page 40, so you may check them later.
Retail financial services maintained the same level as in 1HFY2009. Although lower interest rates resulted in worsened loan-deposit margins, there was an increase in sales fees of mutual funds and individual annuities. Real estate business saw an increase by 2.0 billion yen from 1HFY2009, due to a recovery in brokerage transactions. Fiduciary services maintained almost the same level as in 1HFY2009, despite weak stock prices and the strong yen.
Next, I will explain our breakdown of net interest income. Please proceed to page 8.
Breakdown of net interest income (Non-consolidated)
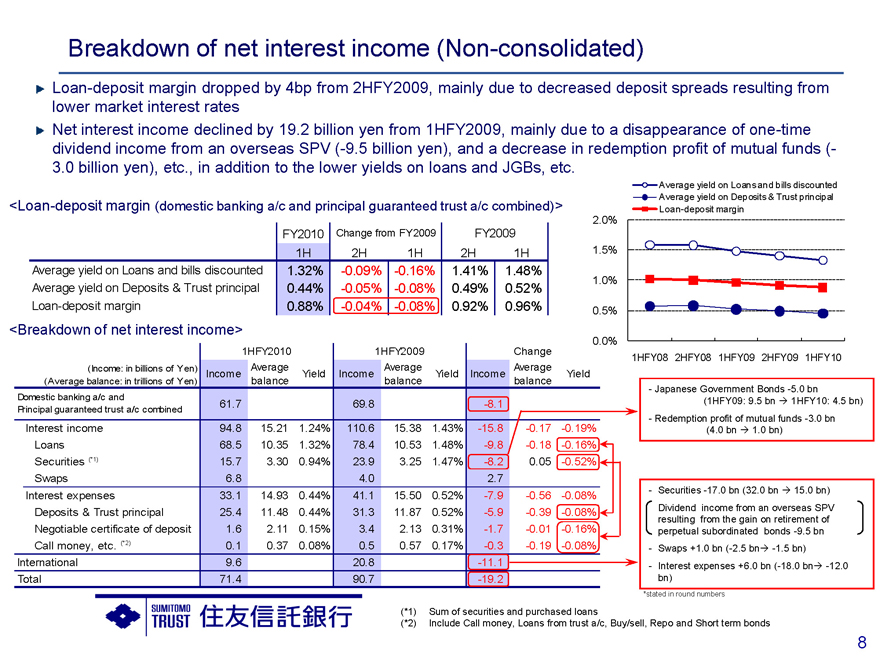
Loan-deposit margin dropped by 4bp from 2HFY2009, mainly due to decreased deposit spreads resulting from lower market interest rates Net interest income declined by 19.2 billion yen from 1HFY2009, mainly due to a disappearance of one-time dividend income from an overseas SPV (-9.5 billion yen), and a decrease in redemption profit of mutual funds (-
3.0 billion yen), etc., in addition to the lower yields on loans and JGBs, etc.
<Loan-deposit margin (domestic banking a/c and principal guaranteed trust a/c combined)>
FY2010 Change from FY2009 FY2009
1H 2H 1H 2H 1H
Average yield on Loans and bills discounted 1.32% -0.09% -0.16% 1.41% 1.48%
Average yield on Deposits & Trust principal 0.44% -0.05% - -0.08% 0.49% 0.52%
Loan-deposit margin 0.88% -0.04% -0.08% 0.92% 0.96%
<Breakdown of net interest income>
1HFY2010 1HFY2009 Change
(Income: in billions of Yen) Average Average Average
Income Yield Income Yield Income Yield
(Average balance: in trillions of Yen) balance balance balance
Domestic banking a/c and
Principal guaranteed trust a/c combined 61.7 69.8 -8.1
Interest income 94.8 15.21 1.24% 110.6 15.38 1.43% -15.8 -0.17 -0.19%
Loans 68.5 10.35 1.32% 78.4 10.53 1.48% -9.8 -0.18 -0.16%
Securities (*1) 15.7 3.30 0.94% 23.9 3.25 1.47% -8.2 0.05 -0.52%
Swaps 6.8 4.0 2.7
Interest expenses 33.1 14.93 0.44% 41.1 15.50 0.52% -7.9 -0.56 -0.08%
Deposits & Trust principal 25.4 11.48 0.44% 31.3 11.87 0.52% - -5.9 -0.39 -0.08%
Negotiable certificate of deposit 1.6 2.11 0.15% 3.4 2.13 0.31% -1.7 -0.01 -0.16%
Call money, etc. (*2) 0.1 0.37 0.08% 0.5 0.57 0.17% -0.3 -0.19 -0.08%
International 9.6 20.8 -11.1
Total 71.4 90.7 -19.2
Average yield on Loans and bills discounted
Average yield on Deposits & Trust principal
Loan-deposit margin
2.0%
1.5%
1.0%
0.5%
0.0%
1HFY08 2HFY08 1HFY09 2HFY09 1HFY10
- Japanese Government Bonds -5.0 bn
(1HFY09: 9.5 bn 1HFY10: 4.5 bn)
- Redemption profit of mutual funds -3.0 bn
(4.0 bn 1.0 bn)
- Securities -17.0 bn (32.0 bn 15.0 bn) Dividend income from an overseas SPV resulting from the gain on retirement of perpetual subordinated bonds -9.5 bn
- Swaps +1.0 bn (-2.5 bn -1.5 bn)
- Interest expenses +6.0 bn (-18.0 bn -12.0 bn)
*stated in round numbers
(*1) Sum of securities and purchased loans
(*2) Include Call money, Loans from trust a/c, Buy/sell, Repo and Short term bonds
8
“Loan-deposit margin” on a domestic banking account and principal guaranteed trust account combined basis dropped by 4 basis points from 2HFY2009 and by 8 basis points from 1HFY2009. It shrunk a little faster than we assumed it would.
“Net interest income” decreased by 19.2 billion yen from 1HFY2009, mainly due to the reason I just explained.
Next, for changes in our fee revenues, please look at page 9.
Fee revenue breakdown (Consolidated, non-consolidated)
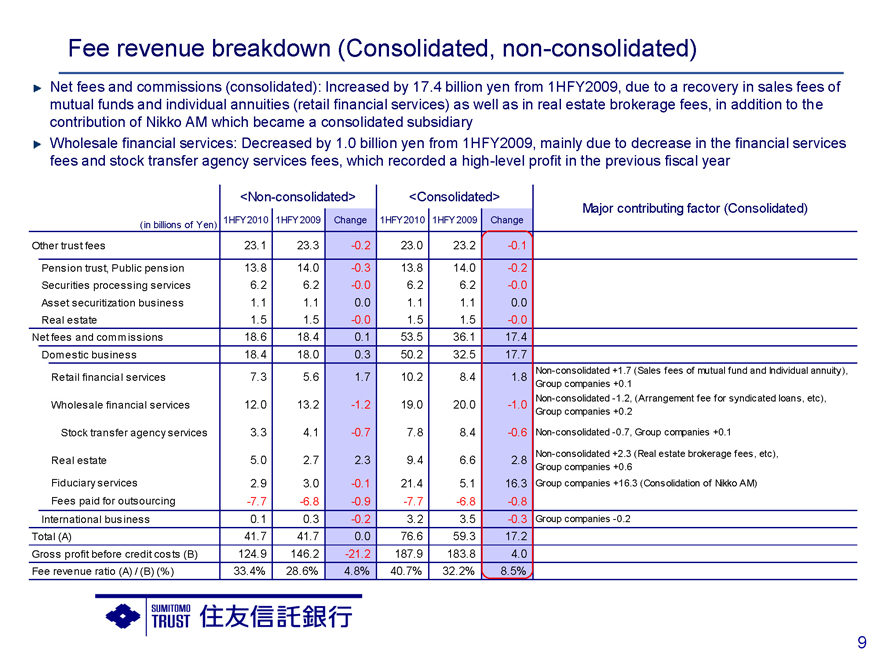
Net fees and commissions (consolidated): Increased by 17.4 billion yen from 1HFY2009, due to a recovery in sales fees of mutual funds and individual annuities (retail financial services) as well as in real estate brokerage fees, in addition to the contribution of Nikko AM which became a consolidated subsidiary Wholesale financial services: Decreased by 1.0 billion yen from 1HFY2009, mainly due to decrease in the financial services fees and stock transfer agency services fees, which recorded a high-level profit in the previous fiscal year
<Non-consolidated> <Consolidated>
(in billions of Yen) 1HFY2010 1HFY2009 Change 1HFY2010 1HFY2009 Change
Other trust fees 23.1 23.3 -0.2 23.0 23.2 -0.1
Pension trust, Public pension 13.8 14.0 -0.3 13.8 14.0 -0.2
Securities processing services 6.2 6.2 -0.0 6.2 6.2 -0.0
Asset securitization business 1.1 1.1 0.0 1.1 1.1 0.0
Real estate 1.5 1.5 -0.0 1.5 1.5 -0.0
Net fees and commissions 18.6 18.4 0.1 53.5 36.1 17.4
Domestic business 18.4 18.0 0.3 50.2 32.5 17.7
Retail financial services 7.3 5.6 1.7 10.2 8.4 1.8
Wholesale financial services 12.0 13.2 -1.2 19.0 20.0 -1.0
Stock transfer agency services 3.3 4.1 -0.7 7.8 8.4 -0.6
Real estate 5.0 2.7 2.3 9.4 6.6 2.8
Fiduciary services 2.9 3.0 -0.1 21.4 5.1 16.3
Fees paid for outsourcing -7.7 -6.8 -0.9 -7.7 -6.8 -0.8
International business 0.1 0.3 -0.2 3.2 3.5 -0.3
Total (A) 41.7 41.7 0.0 76.6 59.3 17.2
Gross profit before credit costs (B) 124.9 146.2 -21.2 187.9 183.8 4.0
Fee revenue ratio (A) / (B) (%) 33.4% 28.6% 4.8% 40.7% 32.2% 8.5%
Major contributing factor (Consolidated)
Non-consolidated +1.7 (Sales fees of mutual fund and Individual annuity),
Group companies +0.1
Non-consolidated -1.2, (Arrangement fee for syndicated loans, etc),
Group companies +0.2
Non-consolidated -0.7, Group companies +0.1
Non-consolidated +2.3 (Real estate brokerage fees, etc),
Group companies +0.6
Group companies +16.3 (Consolidation of Nikko AM)
Group companies -0.2
9
I will explain the figures here on a consolidated basis. In “other trust fees”, the same level as last year was generally maintained in fiduciary services-related business, asset securitization business, and real estate business.
“Net fees and commissions” increased by 17.4 billion yen from 1HFY2009, with a profit contribution by Nikko Asset Management, and growth in sales fees of mutual funds and individual annuities in retail financial services and real estate brokerage fees. Those of wholesale financial services decreased by 1.0 billion yen from 1HFY2009, mainly due to decline in non-consolidated fees of stock transfer agency services and syndicated loans, compared to the high levels recorded in FY2009.
Fees related to mutual funds and individual annuities and real estate-related fees saw large decreases around the time of the financial crisis. These are solidly on the road to recovery, and we think that spurring on their recovery is one of our priority agendas in 2HFY2010.
Next, I will explain “total substantial credit costs” . Please proceed to page 10.
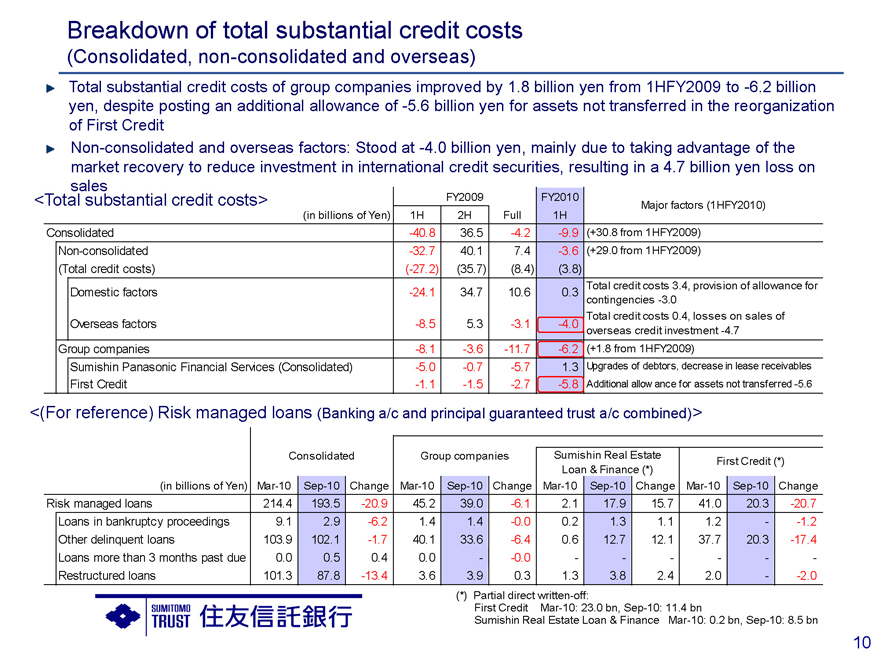
Breakdown of total substantial credit costs
(Consolidated, non-consolidated and overseas)
Total substantial credit costs of group companies improved by 1.8 billion yen from 1HFY2009 to -6.2 billion yen, despite posting an additional allowance of -5.6 billion yen for assets not transferred in the reorganization of First Credit Non-consolidated and overseas factors: Stood at -4.0 billion yen, mainly due to taking advantage of the market recovery to reduce investment in international credit securities, resulting in a 4.7 billion yen loss on sales
<Total substantial credit costs> FY2009 FY2010
(in billions of Yen) 1H 2H Full 1H
Consolidated -40.8 36.5 -4.2 -9.9
Non-consolidated -32.7 40.1 7.4 -3.6
(Total credit costs)(-27.2)(35.7)(8.4)(3.8)
Domestic factors -24.1 34.7 10.6 0.3
Overseas factors -8.5 5.3 -3.1 -4.0
Group companies -8.1 -3.6 -11.7 -6.2
Sumishin Panasonic Financial Services (Consolidated) -5.0 -0.7 -5.7 1.3
First Credit -1.1 -1.5 -2.7 -5.8
Major factors (1HFY2010)
(+30.8 from 1HFY2009)
(+29.0 from 1HFY2009)
Total credit costs 3.4, provision of allowance for contingencies -3.0
Total credit costs 0.4, losses on sales of overseas credit investment -4.7
(+1.8 from 1HFY2009)
Upgrades of debtors, decrease in lease receivables
Additional allowance for assets not transferred -5.6
<(For reference) Risk managed loans (Banking a/c and principal guaranteed trust a/c combined)>
Consolidated Group companies Sumishin Real Estate First Credit (*)
Loan & Finance (*)
(in billions of Yen) Mar-10 Sep-10 Change Mar-10 Sep-10 Change Mar-10 Sep-10 Change Mar-10 Sep-10 Change
Risk managed loans 214.4 193.5 -20.9 45.2 39.0 -6.1 2.1 17.9 15.7 41.0 20.3 -20.7
Loans in bankruptcy proceedings 9.1 2.9 -6.2 1.4 1.4 -0.0 0.2 1.3 1.1 1.2—-1.2
Other delinquent loans 103.9 102.1 -1.7 40.1 33.6 -6.4 0.6 12.7 12.1 37.7 20.3 -17.4
Loans more than 3 months past due 0.0 0.5 0.4 0.0—-0.0
— — — — — —
Restructured loans 101.3 87.8 -13.4 3.6 3.9 0.3 1.3 3.8 2.4 2.0—-2.0
(*) Partial direct written-off:
First Credit Mar-10: 23.0 bn, Sep-10: 11.4 bn
Sumishin Real Estate Loan & Finance Mar-10: 0.2 bn, Sep-10: 8.5 bn
10
Here, I will explain group companies’ factors, and overseas factors on a non-consolidated basis.
“Total substantial credit costs” of group companies stood at 6.2 billion yen, mainly due to First Credit’s additional allowance of 5.6 billion yen against assets not transferred, based on the collateral disposal value.
Those of other group companies were generally stable at a low level. In addition, the leasing subsidiary had a net gain on reversal of allowance for loan losses.
The overseas factors on a non-consolidated basis were 4.0 billion yen overall, in spite of posting a 4.7 billion yen loss on sales resulting from the effort to reduce investment in international credit securities, taking advantage of the market recovery.
International credit investments are summarized on page 30, which you may refer to later. Please especially note that international credit securities classified as “available-for-sale securities” were reduced by more than 100.0 billion yen during 1HFY2010, through sales and redemptions, etc. On the next page, I explain non-consolidated domestic factors, on the basis of so-called “total credit costs”.
Please look at page 11.
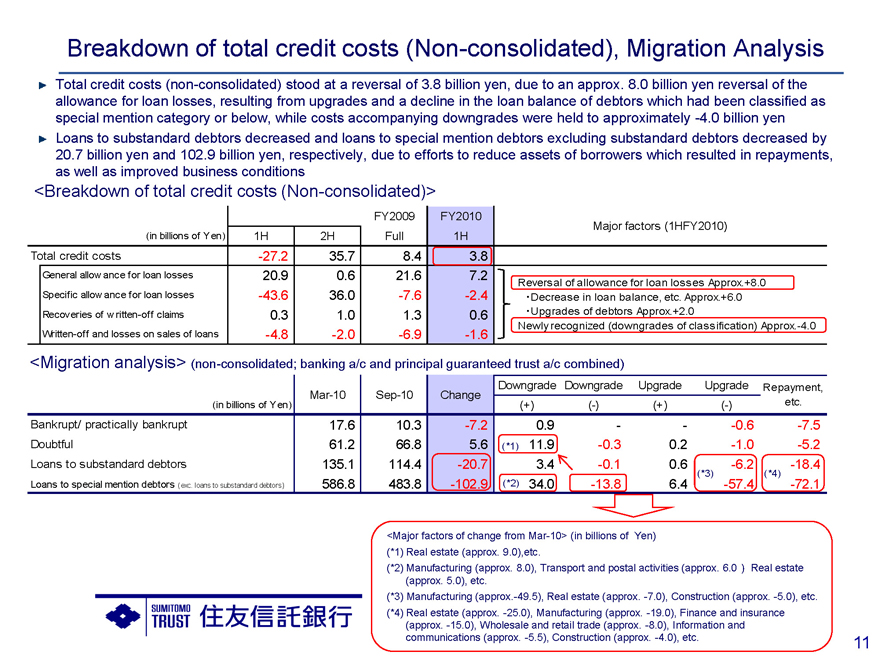
Breakdown of total credit costs (Non-consolidated), Migration Analysis
Total credit costs (non-consolidated) stood at a reversal of 3.8 billion yen, due to an approx. 8.0 billion yen reversal of the allowance for loan losses, resulting from upgrades and a decline in the loan balance of debtors which had been classified as special mention category or below, while costs accompanying downgrades were held to approximately -4.0 billion yen Loans to substandard debtors decreased and loans to special mention debtors excluding substandard debtors decreased by
20.7 billion yen and 102.9 billion yen, respectively, due to efforts to reduce assets of borrowers which resulted in repayments, as well as improved business conditions
<Breakdown of total credit costs (Non-consolidated)>
FY2009 FY2010
(in billions of Yen) 1H 2H Full 1H
Total credit costs -27.2 35.7 8.4 3.8
General allowance for loan losses 20.9 0.6 21.6 7.2
Specific allowance for loan losses -43.6 36.0 -7.6 -2.4
Recoveries of written-off claims 0.3 1.0 1.3 0.6
Written-off and losses on sales of loans -4.8 -2.0 -6.9 -1.6
Major factors (1HFY2010)
Reversal of allowance for loan losses Approx.+8.0
Decrease in loan balance, etc. Approx.+6.0
Upgrades of debtors Approx.+2.0
Newly recognized (downgrades of classification) Approx.-4.0
<Migration analysis> (non-consolidated; banking a/c and principal guaranteed trust a/c combined)
Downgrade Downgrade Upgrade Upgrade Repayment,
Mar-10 Sep-10 Change
(in billions of Yen)(+)(-)(+)(-) etc.
Bankrupt/ practically bankrupt 17.6 10.3 -7.2 0.9——0.6 -7.5
Doubtful 61.2 66.8 5.6(*1) 11.9 -0.3 0.2 -1.0 -5.2
Loans to substandard debtors 135.1 114.4 -20.7 3.4 -0.1 0.6 -6.2 -18.4
(*3)(*4)
Loans to special mention debtors (exc. loans to substandard debtors) 586.8 483.8 -102.9(*2) 34.0 -13.8 6.4 -57.4 -72.1
<Major factors of change from Mar-10> (in billions of Yen) (*1) Real estate (approx. 9.0),etc.
(*2) Manufacturing (approx. 8.0), Transport and postal activities (approx. 6.0 Real estate (approx. 5.0), etc.
(*3) Manufacturing (approx.-49.5), Real estate (approx. -7.0), Construction (approx. -5.0), etc.
(*4) Real estate (approx. -25.0), Manufacturing (approx. -19.0), Finance and insurance (approx. -15.0), Wholesale and retail trade (approx. -8.0), Information and communications (approx. -5.5), Construction (approx. -4.0), etc.
11
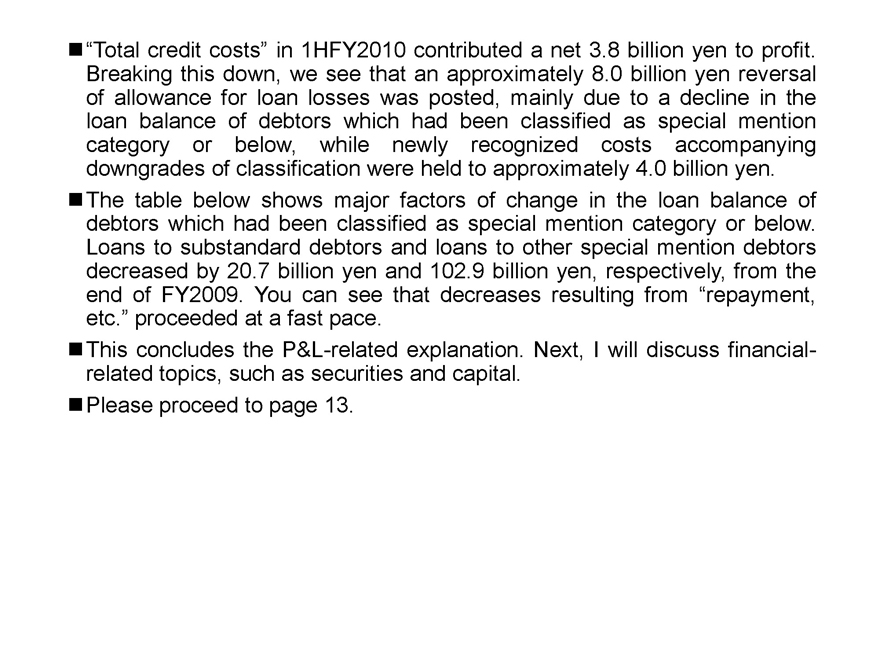
“Total credit costs” in 1HFY2010 contributed a net 3.8 billion yen to profit. Breaking this down, we see that an approximately 8.0 billion yen reversal of allowance for loan losses was posted, mainly due to a decline in the loan balance of debtors which had been classified as special mention category or below, while newly recognized costs accompanying downgrades of classification were held to approximately 4.0 billion yen.
The table below shows major factors of change in the loan balance of debtors which had been classified as special mention category or below. Loans to substandard debtors and loans to other special mention debtors decreased by 20.7 billion yen and 102.9 billion yen, respectively, from the end of FY2009. You can see that decreases resulting from “repayment, etc.” proceeded at a fast pace.
This concludes the P&L-related explanation. Next, I will discuss financial-related topics, such as securities and capital.
Please proceed to page 13.
Non-performing loans: Collaterals and allowances, by industries (Non-consolidated)
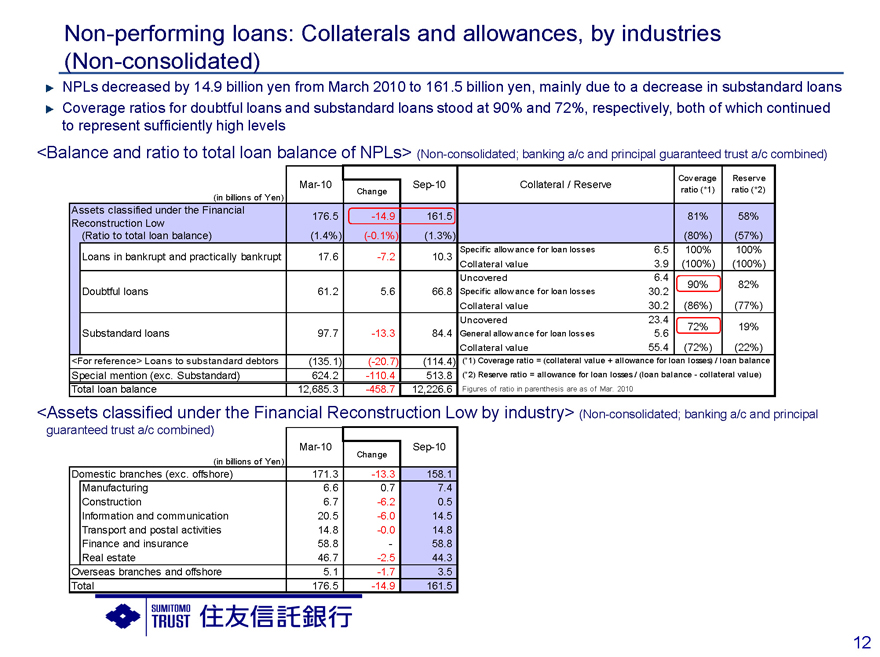
NPLs decreased by 14.9 billion yen from March 2010 to 161.5 billion yen, mainly due to a decrease in substandard loans
Coverage ratios for doubtful loans and substandard loans stood at 90% and 72%, respectively, both of which continued to represent sufficiently high levels
<Balance and ratio to total loan balance of NPLs> (Non-consolidated; banking a/c and principal guaranteed trust a/c combined)
Mar-10 Sep-10
Change
(in billions of Yen)
Assets classified under the Financial 176.5 -14.9 161.5
Reconstruction Low
(Ratio to total loan balance)(1.4%)(-0.1%)(1.3%)
Loans in bankrupt and practically bankrupt 17.6 -7.2 10.3
Doubtful loans 61.2 5.6 66.8
Substandard loans 97.7 -13.3 84.4
<For reference> Loans to substandard debtors(135.1)(-20.7)(114.4)
Special mention (exc. Substandard) 624.2 - -110.4 513.8
Total loan balance 12,685.3 -458.7 12,226.6
Coverage Reserve
Collateral / Reserve
ratio (*1) ratio (*2)
81% 58%
(80%)(57%)
Specific allowance for loan losses 6.5 100% 100%
Collateral value 3.9(100%)(100%)
Uncovered 6.4
90% 82%
Specific allow ance for loan losses 30.2
Collateral value 30.2(86%)(77%)
Uncovered 23.4
72% 19%
General allowance for loan losses 5.6
Collateral value 55.4(72%)(22%)
(*1) Coverage ratio = (collateral value + allowance for loan losses) / loan balance
(*2) Reserve ratio = allowance for loan losses / (loan balance-collateral value)
Figures of ratio in parenthesis are as of Mar. 2010
<Assets classified under the Financial Reconstruction Low by industry> (Non-consolidated; banking a/c and principal guaranteed trust a/c combined)
Mar-10 Sep-10
Change
(in billions of Yen)
Domestic branches (exc. offshore) 171.3 -13.3 158.1
Manufacturing 6.6 0.7 7.4
Construction 6.7 -6.2 0.5
Information and communication 20.5 -6.0 14.5
Transport and postal activities 14.8 -0.0 14.8
Finance and insurance 58.8 — 58.8
Real estate 46.7 -2.5 44.3
Overseas branches and offshore 5.1 -1.7 3.5
Total 176.5 -14.9 161.5
12

[Blank]
Securities portfolio and interest rate risk
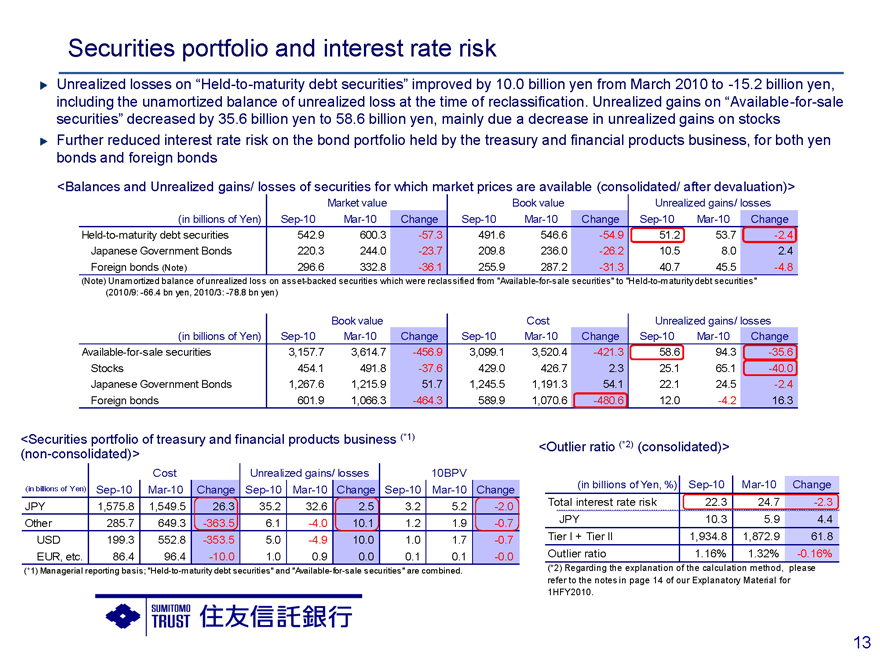
Unrealized losses on “Held-to-maturity debt securities” improved by 10.0 billion yen from March 2010 to -15.2 billion yen, including the unamortized balance of unrealized loss at the time of reclassification. Unrealized gains on “Available-for-sale securities” decreased by 35.6 billion yen to 58.6 billion yen, mainly due a decrease in unrealized gains on stocks
Further reduced interest rate risk on the bond portfolio held by the treasury and financial products business, for both yen bonds and foreign bonds
<Balances and Unrealized gains/ losses of securities for which market prices are available (consolidated/ after devaluation)>
Market value Book value Unrealized gains/ losses
(in billions of Yen) Sep-10 Mar-10 Change Sep-10 Mar-10 Change Sep-10 Mar-10 Change
Held-to-maturity debt securities 542.9 600.3 -57.3 491.6 546.6 -54.9 51.2 53.7 -2.4
Japanese Government Bonds 220.3 244.0 -23.7 209.8 236.0 -26.2 10.5 8.0 2.4
Foreign bonds (Note) 296.6 332.8 -36.1 255.9 287.2 -31.3 40.7 45.5 -4.8
(Note) Unamortized balance of unrealized loss on asset-backed securities which were reclassified from “Available-for-sale securities” to “Held-to-maturity debt securities”
(2010/9: -66.4 bn yen, 2010/3: -78.8 bn yen)
Book value Cost Unrealized gains/ losses
(in billions of Yen) Sep-10 Mar-10 Change Sep-10 Mar-10 Change Sep-10 Mar-10 Change
Available-for-sale securities 3,157.7 3,614.7 -456.9 3,099.1 3,520.4 -421.3 58.6 94.3 -35.6
Stocks 454.1 491.8 -37.6 429.0 426.7 2.3 25.1 65.1 -40.0
Japanese Government Bonds 1,267.6 1,215.9 51.7 1,245.5 1,191.3 54.1 22.1 24.5 -2.4
Foreign bonds 601.9 1,066.3 -464.3 589.9 1,070.6 -480.6 12.0 -4.2 16.3
<Securities portfolio of treasury and financial products business (*1) (non-consolidated)>
Cost Unrealized gains/ losses 10BPV
(in billions of Yen) Sep-10 Mar-10 Change Sep-10 Mar-10 Change Sep-10 Mar-10 Change
JPY 1,575.8 1,549.5 26.3 35.2 32.6 2.5 3.2 5.2 -2.0
Other 285.7 649.3 -363.5 6.1 -4.0 10.1 1.2 1.9 -0.7
USD 199.3 552.8 -353.5 5.0 -4.9 10.0 1.0 1.7 -0.7
EUR, etc. 86.4 96.4 -10.0 1.0 0.9 0.0 0.1 0.1 -0.0
(*1) Managerial reporting basis; “Held-to-maturity debt securities” and “Available-for-sale securities” are combined.
<Outlier ratio (*2) (consolidated)>
(in billions of Yen, %) Sep-10 Mar-10 Change
Total interest rate risk 22.3 24.7 -2.3
JPY 10.3 5.9 4.4
Tier I + Tier II 1,934.8 1,872.9 61.8
Outlier ratio 1.16% 1.32% -0.16%
(*2) Regarding the explanation of the calculation method, please
refer to the notes in page 14 of our Explanatory Material for
1HFY2010.
13
Here, looking at the table’s central columns, we see the securities balance on a so-called book value basis. There was a large decrease in “foreign bonds”, especially centered on available-for-sale securities. “foreign bonds” include the international credit securities which I touched on earlier. As a breakdown of these securities, the status of bonds managed by treasury and financial products business is shown at the lower left. The balance of Japanese bonds was flat while its duration was shortened, and we greatly reduced our balance of foreign bonds, thereby further reducing the amount of interest rate risk for both categories from the end of FY2009. Currently, we see that there may be a change in the tide of the bond market. I think you can see that we are well prepared against the risk of drastic changes in domestic and foreign long-term interest rates.
Next, I will explain the situation of our capital adequacy ratio. Please look at page 14.
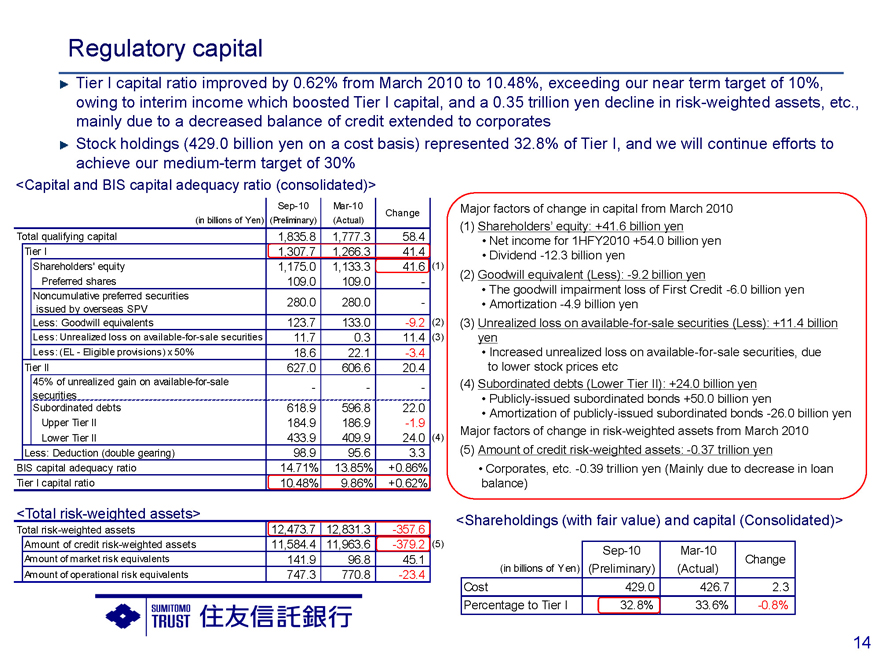
Regulatory capital
Tier I capital ratio improved by 0.62% from March 2010 to 10.48%, exceeding our near term target of 10%, owing to interim income which boosted Tier I capital, and a 0.35 trillion yen decline in risk-weighted assets, etc., mainly due to a decreased balance of credit extended to corporates Stock holdings (429.0 billion yen on a cost basis) represented 32.8% of Tier I, and we will continue efforts to achieve our medium-term target of 30%
<Capital and BIS capital adequacy ratio (consolidated)>
Sep-10 Mar-10
Change
(in billions of Yen)(Preliminary)(Actual)
Total qualifying capital 1,835.8 1,777.3 58.4
Tier I 1,307.7 1,266.3 41.4
Shareholders’ equity 1,175.0 1,133.3 41.6(1)
Preferred shares 109.0 109.0 -
Noncumulative preferred securities 280.0 280.0 -
issued by overseas SPV
Less: Goodwill equivalents 123.7 133.0 -9.2(2)
Less: Unrealized loss on available-for-sale securities 11.7 0.3 11.4(3)
Less: (EL - Eligible provisions) x 50% 18.6 22.1 -3.4
Tier II 627.0 606.6 20.4
45% of unrealized gain on available-for-sale — —
securities
Subordinated debts 618.9 596.8 22.0
Upper Tier II 184.9 186.9 -1.9
Lower Tier II 433.9 409.9 24.0(4)
Less: Deduction (double gearing) 98.9 95.6 3.3
BIS capital adequacy ratio 14.71% 13.85% +0.86%
Tier I capital ratio 10.48% 9.86% +0.62%
<Total risk-weighted assets>
Total risk-weighted assets 12,473.7 12,831.3 -357.6
Amount of credit risk-weighted assets 11,584.4 11,963.6 -379.2(5)
Amount of market risk equivalents 141.9 96.8 45.1
Amount of operational risk equivalents 747.3 770.8 -23.4
Major factors of change in capital from March 2010
(1) Shareholders’ billion equity: yen +41.6
Net income for billion 1HFY2010 yen +54.0
Dividend -12.3 billion yen
(2) Goodwill equivalent (Less): -9.2 billion yen
The goodwill impairment -6.0 billion yen loss of First Credit
Amortization -4.9 billion yen
(3) Unrealized loss on available-for-sale securities (Less): +11.4 billion
yen
Increased unrealized-for-sale securities, loss due on available
to lower stock prices etc
(4) Subordinated debts (Lower Tier II): +24.0 billion yen
Publicly-issued subordinated bonds +50.0 billion yen
Amortization-issued subordinated of publicly bonds -26.0 billion yen
Major factors of change in risk-weighted assets from March 2010
(5) Amount of credit risk-weighted assets: -0.37 trillion yen
Corporates, -0.39 trillion yen etc. (Mainly due to decrease in loan
balance)
<Shareholdings (with fair value) and capital (Consolidated)>
Sep-10 Mar-10
Change
(in billions of Yen)(Preliminary)(Actual)
Cost 429.0 426.7 2.3
Percentage to Tier I 32.8% 33.6% -0.8%
14
Tier I capital ratio as of the end of 1HFY2010 improved by 0.62% from the end of FY2009 to 10.48%, which exceeded our near-term target of 10% under current regulations. This was due to interim income which boosted Tier I capital, and a decrease in credit risk-weighted assets resulting from a decreased balance of credit extended to corporate clients.
Shareholdings represented approximately 33% of Tier I, kept at the same level as of the end of FY2009. We will discuss our post-integration target from now on, but first of all we intend to continue working to reduce shareholdings to the 30% level by ourself.
We will now look at our estimation of Basel III “common equity capital ratio”, which is attracting a lot of attention. Please proceed to page 17.
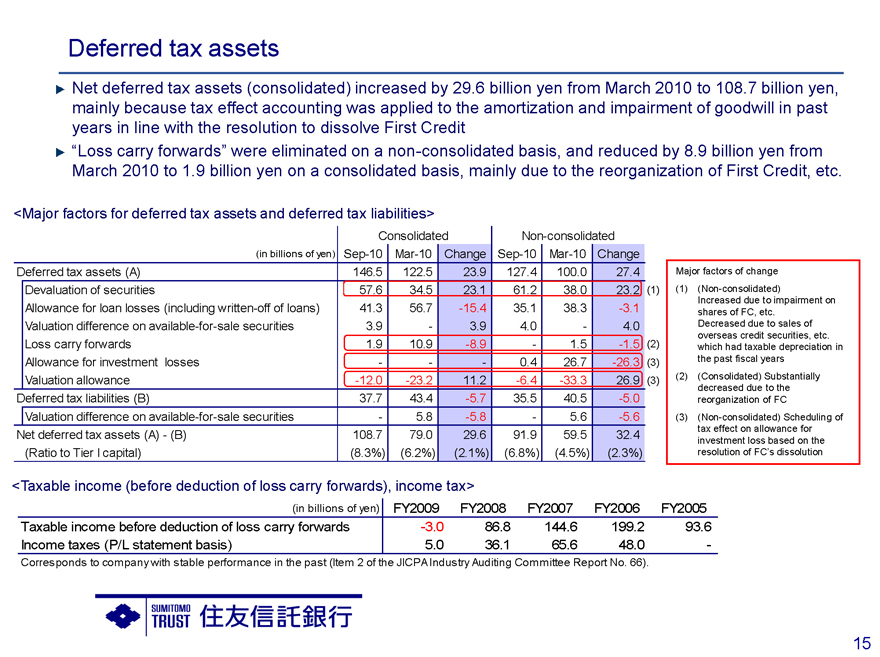
Deferred tax assets
Net deferred tax assets (consolidated) increased by 29.6 billion yen from March 2010 to 108.7 billion yen, mainly because tax effect accounting was applied to the amortization and impairment of goodwill in past years in line with the resolution to dissolve First Credit “Loss carry forwards” were eliminated on a non-consolidated basis, and reduced by 8.9 on billion a yen non from March 2010 to 1.9 billion yen on a consolidated basis, mainly due to the reorganization of First Credit, etc.
<Major factors for deferred tax assets and deferred tax liabilities>
Consolidated Non-consolidated
(in billions of yen) Sep-10 Mar-10 Change Sep-10 Mar-10 Change
Deferred tax assets (A) 146.5 122.5 23.9 127.4 100.0 27.4
Devaluation of securities 57.6 34.5 23.1 61.2 38.0 23.2(1)
Allowance for loan losses (including written-off of loans) 41.3 56.7 -15.4 35.1 38.3 -3.1
Valuation difference on available-for-sale securities 3.9 — 3.9 4.0 — 4.0
Loss carry forwards 1.9 10.9 -8.9 — 1.5 - -1.5(2)
Allowance for investment losses — — 0.4 26.7 - -26.3(3)
Valuation allowance -12.0 -23.2 11.2 -6.4 -33.3 26.9(3)
Deferred tax liabilities (B) 37.7 43.4 -5.7 35.5 40.5 -5.0
Valuation difference on available-for-sale securities — 5.8 - -5.8 — 5.6 -5.6
Net deferred tax assets (A) - (B) 108.7 79.0 29.6 91.9 59.5 32.4
(Ratio to Tier I capital) (8.3%) (6.2%) (2.1%) (6.8%) (4.5%) (2.3%)
Major factors of change
(1) (Non-consolidated)
Increased due to impairment on shares of FC, etc.
Decreased due to sales of overseas credit securities, etc. which had taxable depreciation in the past fiscal years
(2) (Consolidated) Substantially decreased due to the reorganization of FC
(3) (Non-consolidated) Scheduling of tax effect on allowance for investment loss based on the resolution of FC’s dissolution
<Taxable income (before deduction of loss carry forwards), income tax>
(in billions of yen) FY2009 FY2008 FY2007 FY2006 FY2005
Taxable income before deduction of loss carry forwards -3.0 86.8 144.6 199.2 93.6
Income taxes (P/L statement basis) 5.0 36.1 65.6 48.0 -
Corresponds to company with stable performance in the past (Item 2 of the JICPA Industry Auditing Committee Report No. 66).
15

[Blank]
Basel III and status of capital
16

[Blank]
Basel III Common equity capital ratio and total risk-weighted assets
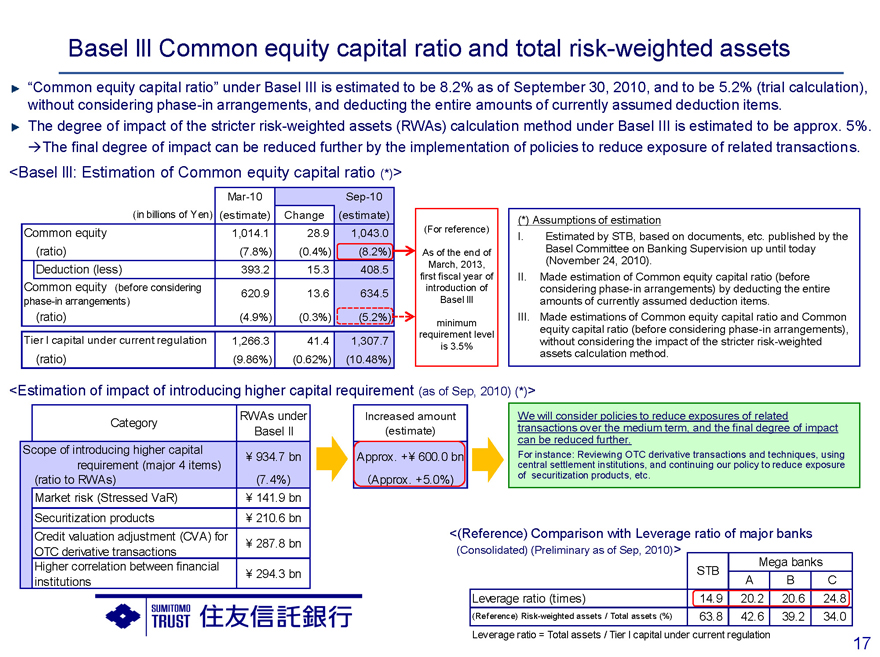
“Common equity capital ratio” under Basel III is estimated to be 8.2% as of September 30, 2010, and to be 5.2% (trial calculation), without considering phase-in arrangements, and deducting the entire amounts of currently assumed deduction items.
The degree of impact of the stricter risk-weighted assets (RWAs) calculation method under Basel III is estimated to be approx. 5%. The final degree of impact can be reduced further by the implementation of policies to reduce exposure of related transactions.
<Basel lll: Estimation of Common equity capital ratio (*)>
Mar-10 Sep-10
(in billions of Yen)(estimate) Change(estimate)
Common equity 1,014.1 28.9 1,043.0
(ratio)(7.8%)(0.4%)(8.2%)
Deduction (less) 393.2 15.3 408.5
Common equity (before considering 620.9 13.6 634.5
phase-in arrangements)
(ratio)(4.9%)(0.3%)(5.2%)
Tier l capital under current regulation 1,266.3 41.4 1,307.7
(ratio)(9.86%)(0.62%)(10.48%)
(For reference)
As of the end of March, 2013, first fiscal year of introduction of Basel lll
minimum requirement level is 3.5%
(*) Assumptions of estimation
I. Estimated by STB, based on documents, etc. published by the Basel Committee on Banking Supervision up until today (November 24, 2010).
II. Made estimation of Common equity capital ratio (before considering phase-in arrangements) by deducting the entire amounts of currently assumed deduction items.
III. Made estimations of Common equity capital ratio and Common equity capital ratio (before considering phase-in arrangements), without considering the impact of the stricter risk-weighted assets calculation method.
<Estimation of impact of introducing higher capital requirement (as of Sep, 2010) (*)>
Category RWAs under
Basel II
Scope of introducing higher capital ¥ 934.7 bn
requirement (major 4 items)
(ratio to RWAs)(7.4%)
Market risk (Stressed VaR) ¥ 141.9 bn
Securitization products ¥ 210.6 bn
Credit valuation adjustment (CVA) for ¥ 287.8 bn
OTC derivative transactions
Higher correlation between financial ¥ 294.3 bn
institutions
Increased amount (estimate)
Approx. +¥ 600.0 bn (Approx. +5.0%)
We will consider policies to reduce exposures of related transactions over the medium term, and the final degree of impact can be reduced further.
For instance: Reviewing OTC derivative transactions and techniques, using central settlement institutions, and continuing our policy to reduce exposure of securitization products, etc.
<(Reference) Comparison with Leverage ratio of major banks
(Consolidated) (Preliminary as of Sep, 2010)>
Mega banks
STB
A B C
Leverage ratio (times) 14.9 20.2 20.6 24.8
(Reference) Risk-weighted assets / Total assets (%) 63.8 42.6 39.2 34.0
Leverage ratio = Total assets / Tier l capital under current regulation
17
Our estimation gives an 8.2% “common equity capital ratio” as of the end of 1HFY2009. It was 5.2% without considering phase-in arrangements, and deducting the entire amounts of currently assumed “deduction items” from the numerator.
At the lower left, we show our estimation, based on various assumptions, regarding the effects of the stricter risk-weighted assets calculation method planned until Basel III is introduced.
According to this estimation, there will be approximately a 5% impact on our current risk-weighted assets. Our policy is to study actions to reduce various exposures related to securitization products and counterparty risks of OTC derivatives, etc. Thus, we think we can significantly reduce their final effects.
Therefore, the estimation of our current “common equity capital ratio” does not consider the effects of the stricter risk-weighted assets calculation method.
Please proceed to page 18.

Sumitomo Mitsui Trust Group: Simulation of Common equity capital ratio
“Common equity capital ratios” under Basel III of both CMTH and STB are estimated to be over 8% as of the end of September 2010, and to be over 5% before considering phase-in arrangements
“Common equity capital ratio” under certain assumptions (see below) is estimated to be 9.5% - 10.0% as of the end of March 2013, and to be 6.0% - 6.5% before considering phase-in arrangements By accumulating retained earnings, the final regulatory requirement level of 7.0% is sufficiently achievable within the transition period
Simulation of Common Equity Capital ratio
Assumptions of the simulation
(1) From March 2013 onwards, denominators (risk-weighted assets) and numerators (Common equity) are calculated by simply adding together the figures of both companies (2) Annual net incomes from FY2011 onwards are assumed to be the same level as that of FY2010 (consolidated dividend payout ratio of 30%), and risk-weighted assets and stock prices, etc. are assumed to stay at the same level as those of September 30, 2010 (3) Methods of calculating Common equity and risk-weighted assets are as described in the previous page
Sep, 2010
Mar, 2013
Mar, 2016
Mar, 2019
First year of partial introduction of Basel III regulations
Full-scale introduction of Basel III regulations
Minimum common equity capital ratio + Capital conservation buffer
Common equity capital ratio
* |
| Numbers in parentheses: before considering phase-in arrangements |
Chuo Mitsui Trust
8.5 |
| — 9.0% |
(5.0 |
| — 5.5%) |
Sumitomo Trust
8.0 |
| — 8.5% |
(5.0 |
| — 5.5%) |
3.5% |
| 5.125% 7.0% |
Sumitomo Mitsui Sumitomo Mitsui Sumitomo Mitsui
Trust Trust Trust
9.5 |
| — 10.0% 9.0 — 9.5% 9.0 — 9.5% |
(6.0 |
| — 6.5%)(7.5 — 8.0%) |
18
Here, we show the results of a simulation based on certain assumptions under which the current profit level and risk-weighted assets, etc continue to be flat, and on the basis of simple combination with Chuo Mitsui Trust, with which we are planning a management integration.
As of the end of March 2013, the first fiscal year of introduction of Basel III regulations, while its regulatory requirement level is 3.5%, we show a level of between 9.5% and 10%, and if we do not consider phase-in arrangements concerning deduction items, we show a level of between 6% and 6.5%. As of the end of March, 2016, three years after the regulations are introduced, while the regulatory required level is 5.125% including a capital conservation buffer, our calculations reach a level of between 9% and 9.5%, and even if we do not consider phase-in arrangements concerning deduction items, we reach a level of between 7.5% and 8%.
Our basic thinking is that we will review capital policies and specific financial targets under Basel III at the stage when details of regulations become clear. However, we currently think that we want to properly use the time set as a transition period.
As you can see in the estimation shown here, we think that the final regulatory required 7% level for the “common equity capital ratio” is sufficiently achievable within the transition period by accumulating retained earnings and controlling risk-weighted assets, without relying on capital raising.
This concludes my explanation of our financial situation. Data on our credit portfolio are shown on pages 29 through 33, which you may refer to later. I will now explain our FY2010 forecast. Please proceed to page 20.

Forecast for FY2010
19

[Blank]
Forecast for FY2010
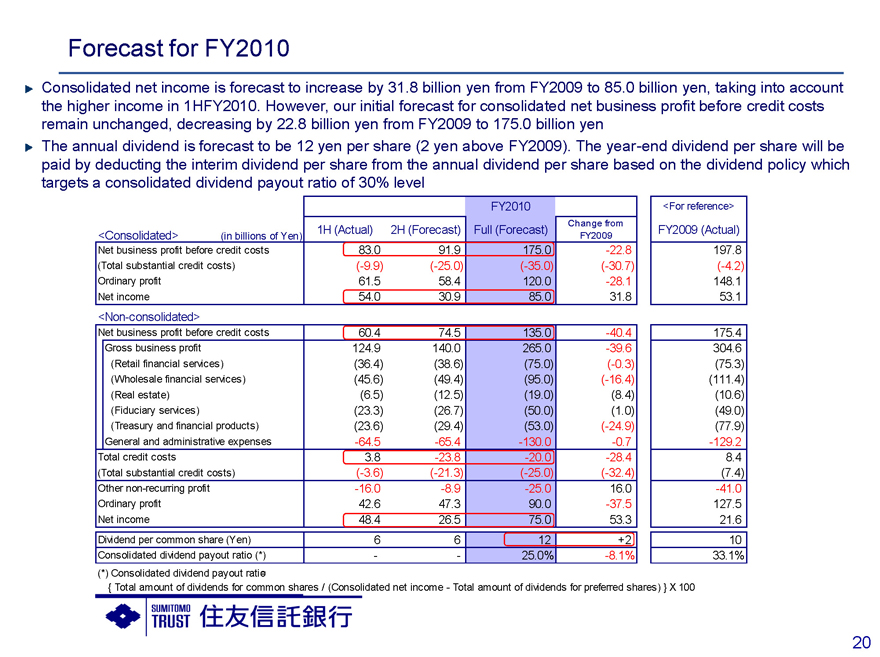
Consolidated net income is forecast to increase by 31.8 billion yen from FY2009 to 85.0 billion yen, taking into account the higher income in 1HFY2010. However, our initial forecast for consolidated net business profit before credit costs remain unchanged, decreasing by 22.8 billion yen from FY2009 to 175.0 billion yen The annual dividend is forecast to be 12 yen per share (2 yen above FY2009). The year-end dividend per share will be paid by deducting the interim dividend per share from the annual dividend per share based on the dividend policy which targets a consolidated dividend payout ratio of 30% level
FY2010 <For reference>
Change from
1H (Actual) 2H (Forecast) Full (Forecast) FY2009 (Actual)
<Consolidated> (in billions of Yen) FY2009
Net business profit before credit costs 83.0 91.9 175.0 -22.8 197.8
(Total substantial credit costs) (-9.9) (-25.0) (-35.0) (-30.7) (-4.2)
Ordinary profit 61.5 58.4 120.0 -28.1 148.1
Net income 54.0 30.9 85.0 31.8 53.1
<Non-consolidated>
Net business profit before credit costs 60.4 74.5 135.0 -40.4 175.4
Gross business profit 124.9 140.0 265.0 -39.6 304.6
(Retail financial services) (36.4) (38.6) (75.0) (-0.3) (75.3)
(Wholesale financial services) (45.6) (49.4) (95.0) (-16.4) (111.4)
(Real estate) (6.5) (12.5) (19.0) (8.4) (10.6)
(Fiduciary services) (23.3) (26.7) (50.0) (1.0) (49.0)
(Treasury and financial products) (23.6) (29.4) (53.0) (-24.9) (77.9)
General and administrative expenses -64.5 -65.4 -130.0 -0.7 -129.2
Total credit costs 3.8 -23.8 -20.0 -28.4 8.4
(Total substantial credit costs) (-3.6) (-21.3) (-25.0) (-32.4) (7.4)
Other non-recurring profit -16.0 -8.9 -25.0 16.0 -41.0
Ordinary profit 42.6 47.3 90.0 -37.5 127.5
Net income 48.4 26.5 75.0 53.3 21.6
Dividend per common share (Yen) 6 6 12 +2 10
Consolidated dividend payout ratio (*) — — 25.0% -8.1% 33.1%
(*) Consolidated dividend payout ratio=
{ Total amount of dividends for common shares / (Consolidated net income-Total amount of dividends for preferred shares) } X 100
20
Consolidated “net income” is forecast to be 85.0 billion yen for FY2010, reorganization of subsidiaries which boosted profits in 1HFY2010.
For 2HFY2010, considering the macroeconomic uncertainties, our forecast incorporates a suitable risk buffer in non-recurring profit, including total credit costs.
We forecast “net business profit before credit costs” of 175.0 billion yen on a consolidated basis. Taking into consideration our progress in 1HFY2010, we revised downward by 5.0 billion yen our initial forecast for treasury and financial products business on a non-consolidated basis, while our initial forecast on a consolidated basis remains unchanged.
The annual dividend is forecast to be 12 yen per share, 2 yen more than that in FY2009. We will pay 6 yen, half of that, as the interim dividend. The year-end dividend will be calculated and paid by subtracting the 6 yen interim dividend per share from the annual dividend per share based on the dividend policy which targets a dividend payout ratio of 30% level. This concludes our financial results and financial-related topics. Next, I will explain the progress and results in strengthening group strategy and prioritized businesses.
Please proceed to page 22.
Strengthen group strategy and prioritized businesses
21

[Blank]
.
Strengthen group strategy (1) Sumishin Real Estate Loan & Finance
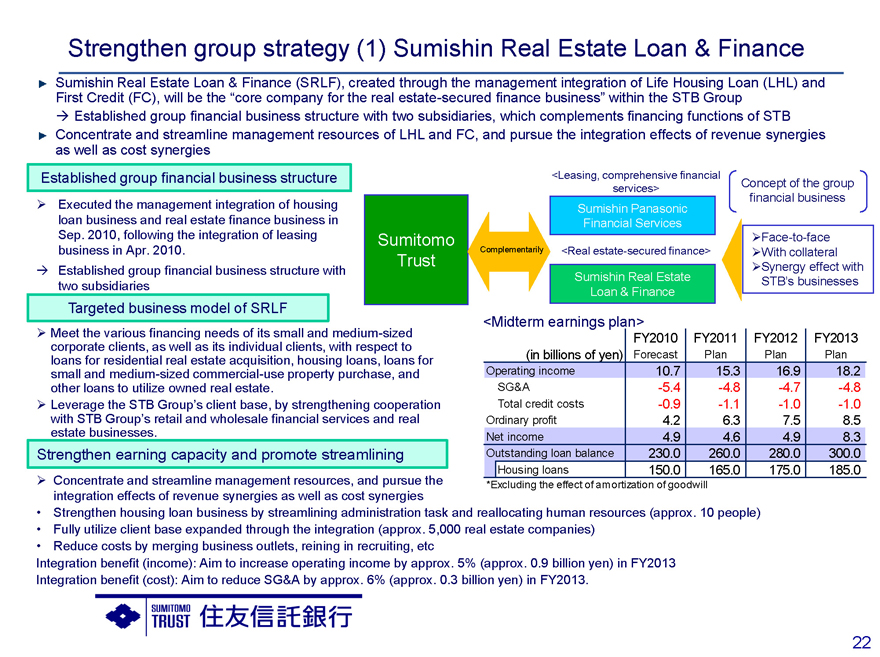
Sumishin Real Estate Loan & Finance (SRLF), created through the management integration of Life Housing Loan (LHL) and First Credit (FC), will be the “core company for the real estate-secured finance business” within the STB Group
Established group financial business structure with two subsidiaries, which complements financing functions of STB Concentrate and streamline management resources of LHL and FC, and pursue the integration effects of revenue synergies as well as cost synergies
Established group financial business structure
Executed the management integration of housing loan business and real estate finance business in Sep. 2010, following the integration of leasing business in Apr. 2010.
Established group financial business structure with two subsidiaries
Targeted business model of SRLF
Meet the various financing needs of its small and medium-sized corporate clients, as well as its individual clients, with respect to loans for residential real estate acquisition, housing loans, loans for small and medium-sized commercial-use property purchase, and other loans to utilize owned real estate.
Leverage the STB Group’s client base, by strengthening cooperation with STB Group’s retail and wholesale financial services and real estate businesses.
Strengthen earning capacity and promote streamlining
Concentrate and streamline management resources, and pursue the integration effects of revenue synergies as well as cost synergies
Strengthen housing loan business by streamlining administration task and reallocating human resources (approx. 10 people)
Fully utilize client base expanded through the integration (approx. 5,000 real estate companies)
Reduce costs by merging business outlets, reining in recruiting, etc
Integration benefit (income): Aim to increase operating income by approx. 5% (approx. 0.9 billion yen) in FY2013
Integration benefit (cost): Aim to reduce SG&A by approx. 6% (approx. 0.3 billion yen) in FY2013.
Sumitomo Trust
Complementarily
<Leasing, comprehensive financial services>
Sumishin Panasonic Financial Services
<Real estate-secured finance>
Sumishin Real Estate Loan & Finance
Concept of the group financial business
<Midterm earnings plan>
FY2010 FY2011 FY2012 FY2013
(in billions of yen) Forecast Plan Plan Plan
Operating income 10.7 15.3 16.9 18.2
SG&A -5.4 -4.8 -4.7 -4.8
Total credit cost - -0.9 -1.1 -1.0 -1.0
Ordinary profit 4.2 6.3 7.5 8.5
Net income 4.9 4.6 4.9 8.3
Outstanding loan balance 230.0 260.0 280.0 300.0
Housing loans 150.0 165.0 175.0 185.0
*Excluding the effect of amortization of goodwill
22
Face-to-face With collateral Synergy effect with
STB’s businesses

The management integration of Life Housing Loan with First Credit took for “Sumishin Real Estate Loan & Finance”, which will be the core company for the real estate-secured finance business within our Group.
As shown in the figure on the right, our group finance business has been developed based on “face-to-face” and “with collateral” and by targeting areas where synergies can be expected with our business foundations. With the current reorganization and integration, we think that we have established our group financial business structure, having streamlined it into a two-subsidiary structure, which will be able to demonstrate the competitiveness and efficiency.
“Sumishin Real Estate Loan & Finance” has a policy of meeting diverse financing needs in the areas of small and medium-sized real estate-secured finance, focused on various funding needs originating in housing. Through the concentration of management resources achieved through the management integration, we will pursue the integration effects of revenue synergies as well as cost synergies.
As the second part of strengthening group strategy, I will explain our strategy regarding acquisitions by Nikko Asset Management. Please look at page 24.
(For reference) Transfer of First Credit’s business to Life Housing Loan
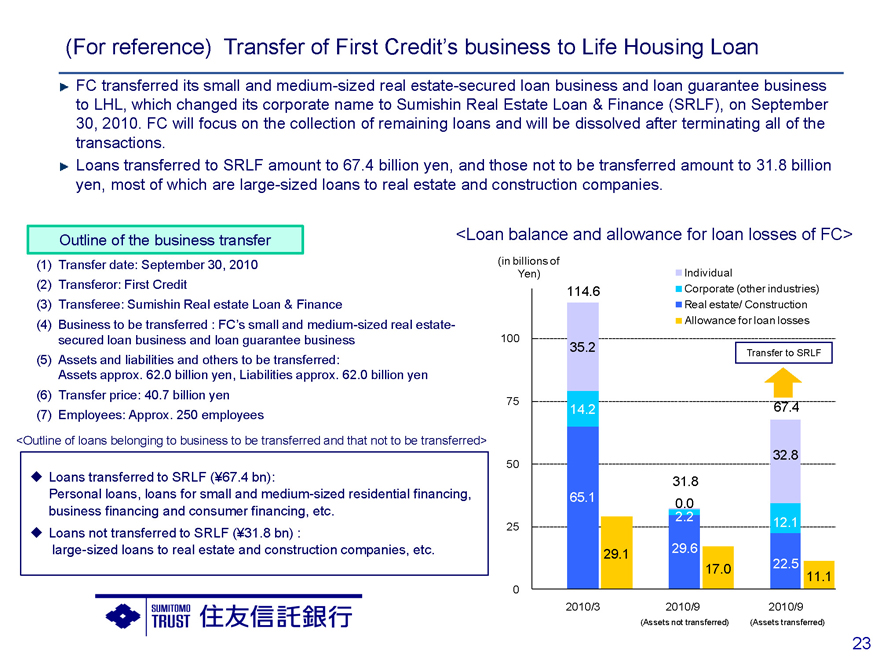
FC transferred its small and medium-sized real estate-secured loan business and loan guarantee business to LHL, which changed its corporate name to Sumishin Real Estate Loan & Finance (SRLF), on September 30, 2010. FC will focus on the collection of remaining loans and will be dissolved after terminating all of the transactions.
Loans transferred to SRLF amount to 67.4 billion yen, and those not to be transferred amount to 31.8 billion yen, most of which are large-sized loans to real estate and construction companies.
Outline of the business transfer
(1) Transfer date: September 30, 2010
(2) Transferor: First Credit
(3) Transferee: Sumishin Real estate Loan & Finance
(4) Business to be transferred: FC’s small and medium-sized real estate-secured loan business and loan guarantee business
(5) Assets and liabilities and others to be transferred:
Assets approx. 62.0 billion yen, Liabilities approx. 62.0 billion yen
(6) Transfer price: 40.7 billion yen
(7) Employees: Approx. 250 employees
<Outline of loans belonging to business to be transferred and that not to be transferred>
Loans transferred to SRLF (¥67.4 bn):
Personal loans, loans for small and medium-sized residential financing, business financing and consumer financing, etc.
Loans not transferred to SRLF (¥31.8 bn) : large-sized loans to real estate and construction companies, etc.
<Loan balance and allowance for loan losses of FC>
(in billions of Yen)
Individual
Corporate (other industries) Real estate/ Construction Allowance for loan losses
100 75 50 25 0
114.6
35.2
14.2
65.1
29.1
31.8
0.0
2.2
29.6
17.0
Transfer to SRLF
67.4
32.8
12.1
22.5
11.1
2010/3 2010/9 2010/9
(Assets not transferred) (Assets transferred)
23

[Blank]
Strengthen group strategy (2) Nikko AM
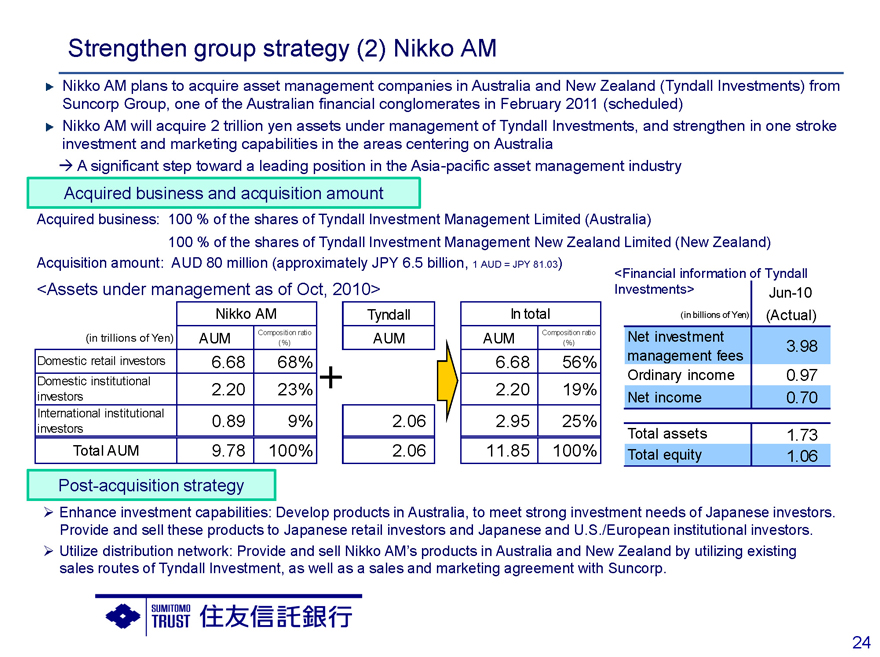
Nikko AM plans to acquire asset management companies in Australia and New Zealand (Tyndall Investments) from Suncorp Group, one of the Australian financial conglomerates in February 2011 (scheduled)
Nikko AM will acquire 2 trillion yen assets under management of Tyndall Investments, and strengthen in one stroke investment and marketing capabilities in the areas centering on Australia
A significant step toward a leading position in the Asia-pacific asset management industry
Acquired business and acquisition amount
Acquired business: 100 % of the shares of Tyndall Investment Management Limited (Australia)
100 % of the shares of Tyndall Investment Management New Zealand Limited (New Zealand)
Acquisition amount: AUD 80 million (approximately JPY 6.5 billion, 1 AUD = JPY 81.03)
<Assets under management as of Oct, 2010>
Nikko AM
(in trillions of Yen) AUM Composition ratio
(%)
Domestic retail investors 6.68 68%
Domestic institutional
investors 2.20 23%
International institutional 0.89 9%
investors
Total AUM 9.78 100%
Tyndall In total
AUM AUM Composition ratio
(%)
6.68 |
| 56% |
2.20 |
| 19% |
2.06 |
| 2.95 25% |
2.06 |
| 11.85 100% |
<Financial information of Tyndall
Investments> Jun-10
(in billions of Yen)(Actual)
Net investment 3.98
management fees
Ordinary income 0.97
Net income 0.70
Total assets 1.73
Total equity 1.06
Post-acquisition strategy
Enhance investment capabilities: Develop products in Australia, to meet strong investment needs of Japanese investors. Provide and sell these products to Japanese retail investors and Japanese and U.S./European institutional investors.
Utilize distribution network: Provide and sell Nikko AM’s products in Australia and New Zealand by utilizing existing sales routes of Tyndall Investment, as well as a sales and marketing agreement with Suncorp.
24

As we announced on November 16, Nikko Asset Management came to an agreement with Suncorp, the Australian financial conglomerate, regarding the acquisition of its subsidiary Tyndall Investment. The planned acquisition amount is 80 million Australian dollars, which is approximately 6.5 billion yen.
Through this acquisition, Nikko Asset Management will acquire approximately two trillion yen of assets under management, mainly of Australian institutional investors. This also would enable the strengthening of its investment and sales capabilities in that targeted region in one stroke. Nikko Asset Management already has asset management and marketing bases in China and Singapore. This acquisition is judged to be a significant step towards a leading position in the Asia Pacific asset management industry.
After this acquisition, we intend to utilize Tyndall’s asset management capabilities, promoting sales to the Japanese retail market including our own retail client base, and to institutional investors in Japan, the U.S., and Europe. We will also maximize the use of Tyndall’s and channels in the Australian region.
Next, I will explain the results and progress on our policies regarding investment sales, which is one of our prioritized businesses.
Please proceed to page 25.
Strengthen prioritized business 1. Investment sales (Retail, wholesale)
Retail investment marketing: Achieved solid progress in coordination with STB AM and Nikko AM, and sales of fund wrap and SMAs
Reinforce sales support structure of headquarters, to solidify consulting sales model at bank networks
Wholesale investment marketing: Sales volume of investment products in 1HFY2010 reached approx. 450.0 billion yen, and their balance as of September 2010 amounted to approx. 1.1 trillion yen.
Strengthen capability to provide custom-made investment products by investor segment
Retail investment marketing
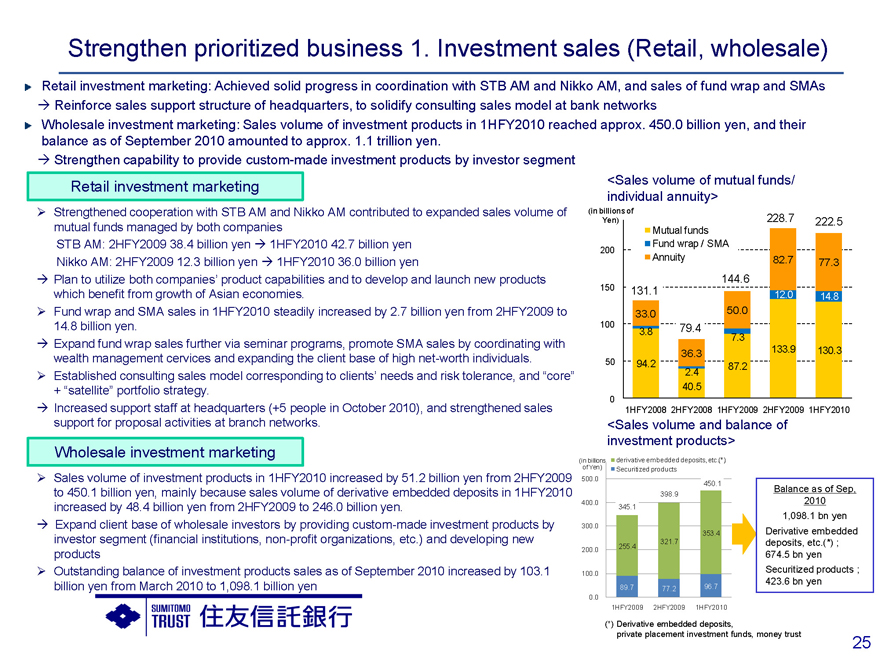
Strengthened cooperation with STB AM and Nikko AM contributed to expanded sales volume of mutual funds managed by both companies
STB AM: 2HFY2009 38.4 billion yen 1HFY2010 42.7 billion yen Nikko AM: 2HFY2009 12.3 billion yen 1HFY2010 36.0 billion yen
Plan to utilize both companies’ product capabilities and to develop and launch new products which benefit from growth of Asian economies.
Fund wrap and SMA sales in 1HFY2010 steadily increased by 2.7 billion yen from 2HFY2009 to
14.8 billion yen.
Expand fund wrap sales further via seminar programs, promote SMA sales by coordinating with wealth management cervices and expanding the client base of high net-worth individuals.
Established consulting sales model corresponding to clients’ needs and risk tolerance, and “core”
+ “satellite” portfolio strategy.
Increased support staff at headquarters (+5 people in October 2010), and strengthened sales support for proposal activities at branch networks.
Wholesale investment marketing
Sales volume of investment products in 1HFY2010 increased by 51.2 billion yen from 2HFY2009 to 450.1 billion yen, mainly because sales volume of derivative embedded deposits in 1HFY2010 increased by 48.4 billion yen from 2HFY2009 to 246.0 billion yen.
Expand client base of wholesale investors by providing custom-made investment products by investor segment (financial institutions, non-profit organizations, etc.) and developing new products
Outstanding balance of investment products sales as of September 2010 increased by 103.1 billion yen from March 2010 to 1,098.1 billion yen
<Sales volume of mutual funds/ individual annuity>
(in billions of Yen)
228.7 222.5
Mutual funds
Fund wrap / SMA
200
Annuity 82.7 77.3
144.6
150 131.1 12.0 14.8
33.0 50.0
100 3.8 79.4
7.3
36.3 133.9 130.3
50 94.2 87.2
2.4
40.5
0
1HFY2008 2HFY2008 1HFY2009 2HFY2009 1HFY2010
<Sales volume and balance of investment products>
(in billions
of Yen) derivative embedded deposits, etc.(*) Securitized products
500.0
450.1
398.9
400.0 345.1
300.0
353.4
321.7
200.0 255.4
100.0
89.7 77.2 96.7
0.0
1HFY2009 2HFY2009 1HFY2010
Balance as of Sep, 2010 1,098.1 bn yen Derivative embedded deposits, etc.(*) ; 674.5 bn yen Securitized products ; 423.6 bn yen
(*) Derivative embedded deposits, private placement investment funds, money trust
25
In retail investment marketing, our consulting sales model based on “core” + “satellite” portfolio strategy is taking root, especially with results seen from strengthened cooperation with STB Asset Management and Nikko Asset Management. In 1HFY2010, we sold through our branches 42.7 billion yen of mutual funds managed by STB Asset Management, and 36.0 billion yen managed by Nikko Asset Management, respectively.
Also, sales of fund wraps and SMAs, which are some of our products for high net-worth individuals, solidly expanded to 14.8 billion yen in 1HFY2010. We will continue to strengthen our sales structure for these products, which demonstrate the combination of asset management and consulting capabilities we have developed in investment sales to institutional investors.
Meanwhile, in wholesale investment marketing, sales of investment products such as derivative embedded deposits, jointly-operated money trusts, and securitized products reached approximately 450.0 billion yen in 1HFY2010. Outstanding balance of investment products sales as of the end of September, 2010 amounted to approximately 1.1 trillion yen. To further expand our client base of wholesale investors, we will provide custom-made investment products by investor segments, work to develop new products, and further evolve our investment sales model.
Next, I will explain our real estate business, as the second part of our prioritized businesses. Please proceed to page 26.
Strengthen prioritized business 2. Real estate business
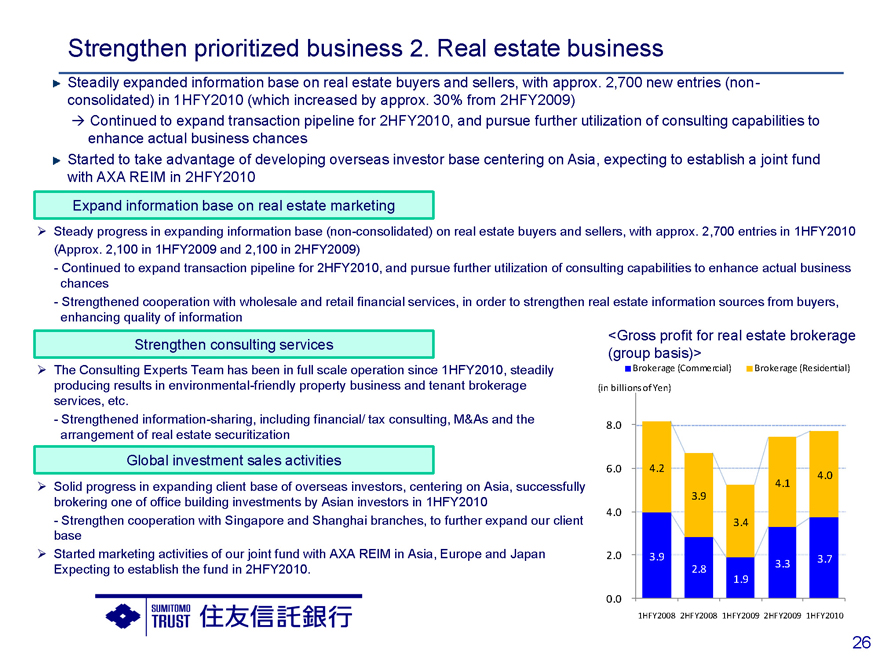
Steadily expanded information base on real estate buyers and sellers, with approx. 2,700 new entries (non-consolidated) in 1HFY2010 (which increased by approx. 30% from 2HFY2009)
Continued to expand transaction pipeline for 2HFY2010, and pursue further utilization of consulting capabilities to enhance actual business chances Started to take advantage of developing overseas investor base centering on Asia, expecting to establish a joint fund with AXA REIM in 2HFY2010
Expand information base on real estate marketing
Steady progress in expanding information base (non-consolidated) on real estate buyers and sellers, with approx. 2,700 entries in 1HFY2010 (Approx. 2,100 in 1HFY2009 and 2,100 in 2HFY2009)
- Continued to expand transaction pipeline for 2HFY2010, and pursue further utilization of consulting capabilities to enhance actual business chances
- Strengthened cooperation with wholesale and retail financial services, in order to strengthen real estate information sources from buyers, enhancing quality of information
Strengthen consulting services
The Consulting Experts Team has been in full scale operation since 1HFY2010, steadily producing results in environmental-friendly property business and tenant brokerage services, etc.
- Strengthened information-sharing, including financial/ tax consulting, M&As and the arrangement of real estate securitization
Global investment sales activities
Solid progress in expanding client base of overseas investors, centering on Asia, successfully brokering one of office building investments by Asian investors in 1HFY2010
- Strengthen cooperation with Singapore and Shanghai branches, to further expand our client base Started marketing activities of our joint fund with AXA REIM in Asia, Europe and Japan Expecting to establish the fund in 2HFY2010.
<Gross profit for real estate brokerage (group basis)>
Brokerage (Commercial) Brokerage (Residential)
(in billions of Yen)
8.0
6.0 4.2 4.0
4.1
3.9
4.0
3.4
2.0 3.9 3.7
2.8 3.3
1.9
0.0
1HFY2008 2HFY2008 1HFY2009 2HFY2009 1HFY2010
26
We are steadily expanding our information base on real estate buyers and sellers, with approximately 30% more new entries in 1HFY2010, compared with 2HFY2009. We think there will be solid growth in our transaction pipeline for 2HFY2010. With this background, we made a little more aggressive plan for 2HFY2010 than that for 1HFY2010.
We will work to strengthen and thoroughly utilize our function of providing consulting services, and increase cooperation with other businesses. We will thereby further enhance our sourcing of information originating in buying needs, and enhance actual business chances.
We also see solid progress in global investment sales activities, which is becoming an important theme in the real estate business, too.
In 1HFY2010, we finally showed visible results, including our success in brokering one of office building investments by Asian investors. We strengthened the real estate investment sales structure of Singapore branch, and our system for cooperation in the entire Asia region, to further expand our client base.
As the final topic in my summary of 1HFY2010, I will explain the status of our efforts in credit portfolio restructuring, specifically regarding loans to individuals and to Japanese corporations operating overseas. Please look at page 27.
Restructure credit portfolio:
Expand loans to individuals and Japanese corporations operating overseas
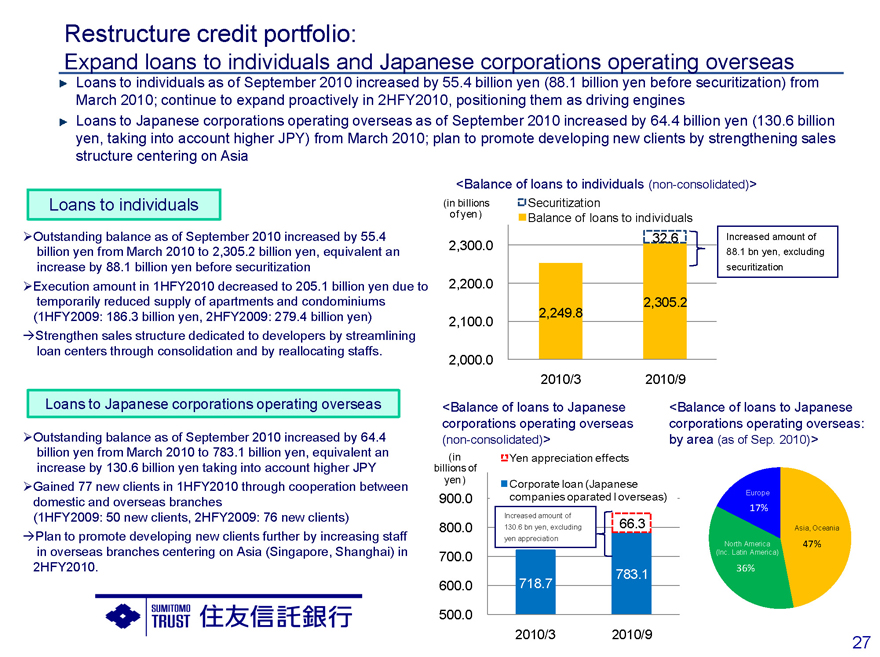
Loans to individuals as of September 2010 increased by 55.4 billion yen (88.1 billion yen before securitization) from March 2010; continue to expand proactively in 2HFY2010, positioning them as driving engines Loans to Japanese corporations operating overseas as of September 2010 increased by 64.4 billion yen (130.6 billion yen, taking into account higher JPY) from March 2010; plan to promote developing new clients by strengthening sales structure centering on Asia
Loans to individuals
Outstanding balance as of September 2010 increased by 55.4 billion yen from March 2010 to 2,305.2 billion yen, equivalent an increase by 88.1 billion yen before securitization Execution amount in 1HFY2010 decreased to 205.1 billion yen due to temporarily reduced supply of apartments and condominiums (1HFY2009: 186.3 billion yen, 2HFY2009: 279.4 billion yen) Strengthen sales structure dedicated to developers by streamlining loan centers through consolidation and by reallocating staffs.
Loans to Japanese corporations operating overseas
Outstanding balance as of September 2010 increased by 64.4 billion yen from March 2010 to 783.1 billion yen, equivalent an increase by 130.6 billion yen taking into account higher JPY Gained 77 new clients in 1HFY2010 through cooperation between domestic and overseas branches (1HFY2009: 50 new clients, 2HFY2009: 76 new clients) Plan to promote developing new clients further by increasing staff in overseas branches centering on Asia (Singapore, Shanghai) in 2HFY2010.
<Balance of loans to individuals (non-consolidated)>
(in billions Securitization
of yen) Balance of loans to individuals
2,300.0 32.6
2,200.0
2,305.2
2,249.8
2,100.0
2,000.0
2010/3 2010/9
Increased amount of
88.1 bn yen, excluding securitization
<Balance of loans to Japanese corporations operating overseas (non-consolidated)>
(in Yen appreciation effects
billions of yen)
Corporate loan (Japanese
900.0 companies oparated I overseas)
Increased amount of
800.0 130.6 bn yen, excluding 66.3
yen appreciation
700.0
783.1
600.0 718.7
500.0
2010/3 2010/9
<Balance of loans to Japanese corporations operating overseas: by area (as of Sep. 2010)>
Europe
17%
Asia, Oceania
North America 47% (Inc. Latin America)
36%
27
As to loans to individuals, there was a temporary dip in the supply of apartments and condominiums in 1HFY2010, and the execution amount was just over 200.0 billion yen, while the outstanding balance grew by approximately 90.0 billion yen on a pre-securitization basis.
Loans to individuals are positioned as driving engines for credit portfolio restructuring. We will also work to expand them proactively in 2HFY2010 by strengthening our sales structure dedicated to developers.
Loans to Japanese corporations operating overseas continued to expand at a high pace, with the outstanding balance growing by approximately 130.0 billion yen excluding the effects of yen appreciation. From the perspective of expanding our client base, we conducted transactions with 77 new clients, on par with our result in 2HFY2009.
As shown in the pie chart at the lower right, our regional breakdown shows that loans to Asia and Oceania approached 50% as of September 30, 2010.
In 2HFY2010, we will also increase our staff, especially in Singapore and Shanghai, making aggressive efforts to gain new clients and expand our business.
(Please proceed to next page.)
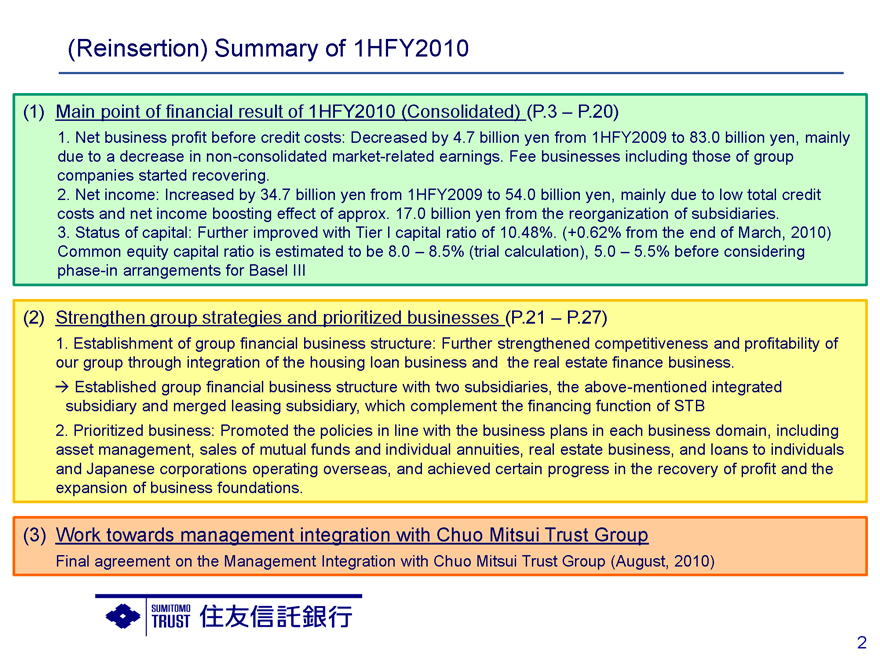
(Reinsertion) Summary of 1HFY2010
(1) |
| Main point of financial result of 1HFY2010 (Consolidated) (P.3–P.20) |
1. Net business profit before credit costs: Decreased by 4.7 billion yen from 1HFY2009 to 83.0 billion yen, mainly due to a decrease in non-consolidated market-related earnings. Fee businesses including those of group companies started recovering.
2. Net income: Increased by 34.7 billion yen from 1HFY2009 to 54.0 billion yen, mainly due to low total credit costs and net income boosting effect of approx. 17.0 billion yen from the reorganization of subsidiaries.
3. Status of capital: Further improved with Tier I capital ratio of 10.48%. (+0.62% from the end of March, 2010) Common equity capital ratio is estimated to be 8.0 –8.5% (trial calculation), 5.0 –5.5% before considering phase-in arrangements for Basel III
(2) |
| Strengthen group strategies and prioritized businesses (P.21–P.27) |
1. Establishment of group financial business structure: Further strengthened competitiveness and profitability of our group through integration of the housing loan business and the real estate finance business.
Established group financial business structure with two subsidiaries, the above-mentioned integrated subsidiary and merged leasing subsidiary, which complement the financing function of STB
2. Prioritized business: Promoted the policies in line with the business plans in each business domain, including asset management, sales of mutual funds and individual annuities, real estate business, and loans to individuals and Japanese corporations operating overseas, and achieved certain progress in the recovery of profit and the expansion of business foundations.
(3) |
| Work towards management integration with Chuo Mitsui Trust Group |
Final agreement on the Management Integration with Chuo Mitsui Trust Group (August, 2010)
2 |
|
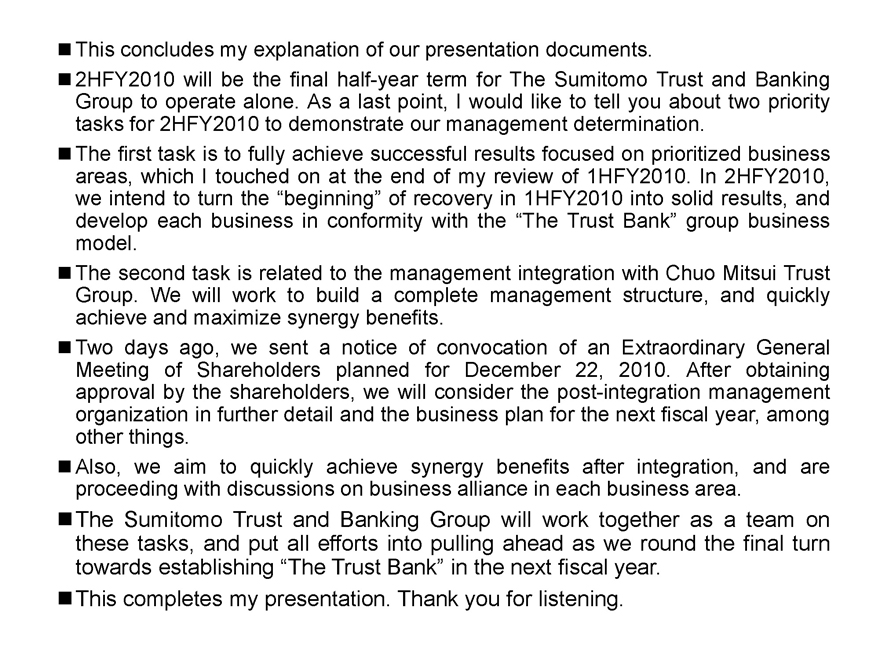
This concludes my explanation of our presentation documents.
2HFY2010 will be the final half-year term for The Sumitomo Trust and Banking Group to operate alone. As a last point, I would like
to tell you about two priority tasks for 2HFY2010 to demonstrate our management determination.
The first task is to fully achieve successful results focused on prioritized business areas, which I touched on at the end of my review of 1HFY2010. In 2HFY2010, we intend to turn the “beginning” of recovery in 1HFY2010 into solid results, and develop each business in conformity with the “The Trust Bank” group business model.
The second task is related to the management integration with Chuo Mitsui Trust Group. We will work to build a complete management structure, and quickly achieve and maximize synergy benefits.
Two days ago, we sent a notice of convocation of an Extraordinary General Meeting of Shareholders planned for December 22, 2010. After obtaining approval by the shareholders, we will consider the post-integration management organization in further detail and the business plan for the next fiscal year, among other things.
Also, we aim to quickly achieve synergy benefits after integration, and are proceeding with discussions on business alliance in each business area.
The Sumitomo Trust and Banking Group will work together as a team on these tasks, and put all efforts into pulling ahead as we round the final turn towards establishing “The Trust Bank” in the next fiscal year.
This completes my presentation. Thank you for listening.

Credit portfolio
28
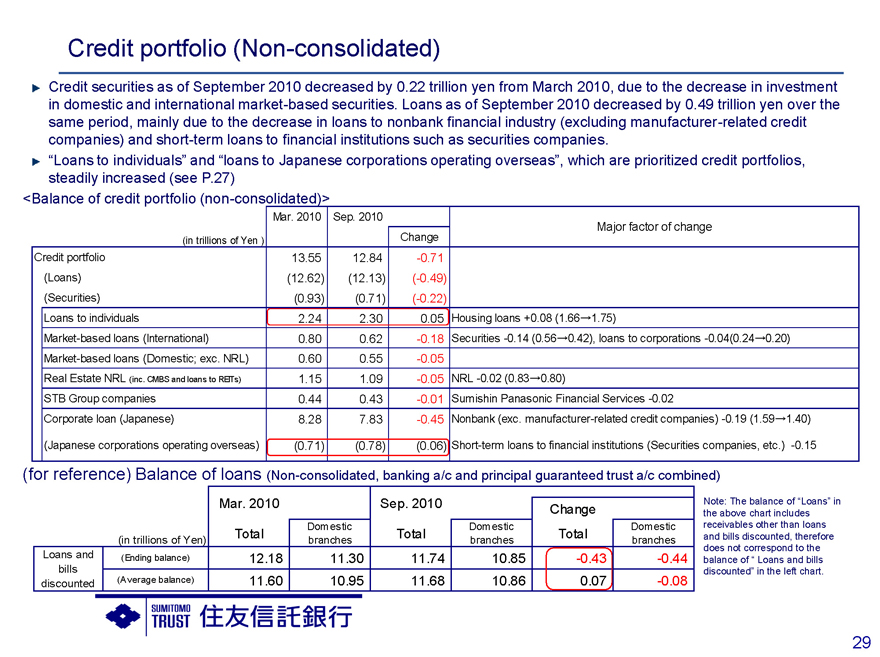
Credit portfolio (Non-consolidated)
Credit securities as of September 2010 decreased by 0.22 trillion yen from March 2010, due to the decrease in investment in domestic and international market-based securities. Loans as of September 2010 decreased by 0.49 trillion yen over the same period, mainly due to the decrease in loans to nonbank financial industry (excluding manufacturer-related credit companies) and short-term loans to financial institutions such as securities companies.
“Loans to individuals” and “loans to Japanese corporations operating overseas”, which are prioritized credit portfolios, steadily increased (see P.27)
<Balance of credit portfolio (non-consolidated)>
Mar. 2010 Sep. 2010
(in trillions of Yen ) Change
Credit portfolio 13.55 12.84 -0.71
(Loans)(12.62)(12.13)(-0.49)
(Securities)(0.93)(0.71)(-0.22)
Loans to individuals 2.24 2.30 0.05
Market-based loans (International) 0.80 0.62 -0.18
Market-based loans (Domestic; exc. NRL) 0.60 0.55 -0.05
Real Estate NRL (inc. CMBS and loans to REITs) 1.15 1.09 -0.05
STB Group companies 0.44 0.43 -0.01
Corporate loan (Japanese) 8.28 7.83 -0.45
(Japanese corporations operating overseas)(0.71)(0.78)(0.06)
Major factor of change
Housing loans +0.08 (1.66 1.75)
Securities -0.14 (0.56 0.42), loans to corporations -0.04(0.24 0.20)
NRL -0.02 (0.83 0.80)
Sumishin Panasonic Financial Services -0.02
Nonbank (exc. manufacturer-related credit companies) -0.19 (1.59 1.40)
Short-term loans to financial institutions (Securities companies, etc.) -0.15
(for reference) Balance of loans (Non-consolidated, banking a/c and principal guaranteed trust a/c combined)
Mar. 2010 Sep. 2010 Change
Domestic Domestic Domestic
Total Total Total
(in trillions of Yen) branches branches branches
Loans and (Ending balance) 12.18 11.30 11.74 10.85 -0.43 -0.44
bills
discounted (Average balance) 11.60 10.95 11.68 10.86 0.07 -0.08
Note: The balance of “Loans” in the above chart includes receivables other than loans and bills discounted, therefore does not correspond to the balance of “Loans and bills discounted” in the left chart.
29
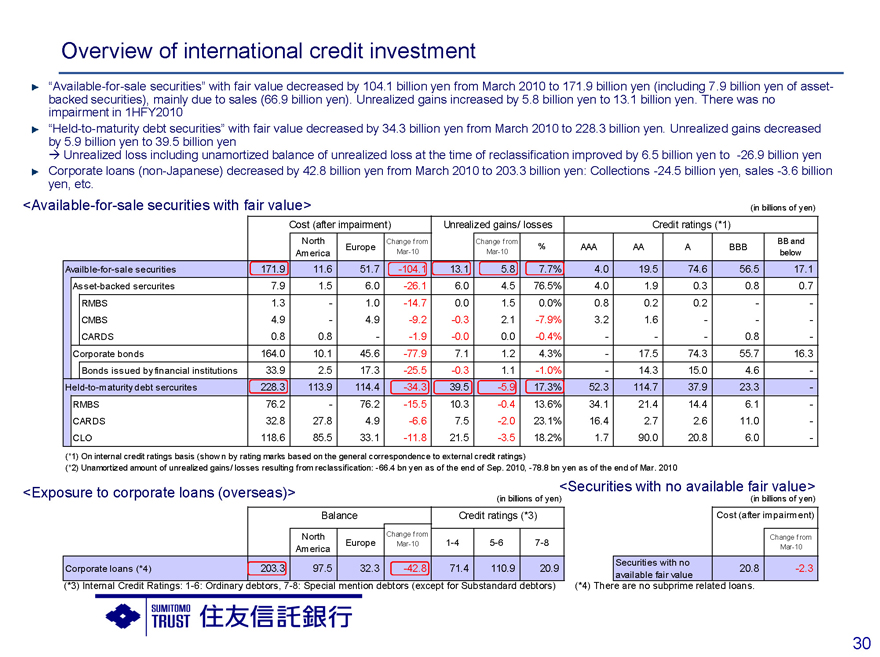
Overview of international credit investment
“Available-for-sale securities” with fair value decreased by 104.1 billion yen from March 2010 to 171.9 billion yen (including 7.9 billion yen) of asset-backed securities), mainly due to sales (66.9 billion yen). Unrealized gains increased by 5.8 billion yen to 13.1 billion yen. There was no impairment in 1HFY2010
“Held-to-maturity debt securities” with fair value decreased by 34.3 billion yen from March 2010 to 228.3 billion yen. Unrealized gains decreased by 5.9 billion yen to 39.5 billion yen Unrealized loss including unamortized balance of unrealized loss at the time of reclassification improved by 6.5 billion yen to -26.9 billion yen Corporate loans (non-Japanese) decreased by 42.8 billion yen from March 2010 to 203.3 billion yen: Collections -24.5 billion yen, sales -3.6 billion yen, etc.
<Available-for-sale securities with fair value>
Cost (after impairment) Unrealized gains/ losses
North Change from Change from
Europe %
America Mar-10 Mar-10
Availble-for-sale securities 171.9 11.6 51.7 -104.1 13.1 5.8 7.7%
Asset-backed sercurites 7.9 1.5 6.0 -26.1 6.0 4.5 76.5%
RMBS 1.3 - 1.0 -14.7 0.0 1.5 0.0%
CMBS 4.9 - 4.9 -9.2 -0.3 2.1 -7.9%
CARDS 0.8 0.8 - - - 1.9 -0.0 0.0 -0.4%
Corporate bonds 164.0 10.1 45.6 -77.9 7.1 1.2 4.3%
Bonds issued by financial institutions 33.9 2.5 17.3 -25.5 -0.3 1.1 -1.0%
Held-to-maturity debt sercurites 228.3 113.9 114.4 -34.3 39.5 -5.9 17.3%
RMBS 76.2 - 76.2 -15.5 10.3 -0.4 13.6%
CARDS 32.8 27.8 4.9 -6.6 7.5 -2.0 23.1%
CLO 118.6 85.5 33.1 -11.8 21.5 -3.5 18.2%
Credit ratings (*1)
BB and
AAA AA A BBB
below
4.0 19.5 74.6 56.5 17.1
4.0 1.9 0.3 0.8 0.7
0.8 0.2 0.2 - -
3.2 1.6---
---0.8 -
- 17.5 74.3 55.7 16.3
- 14.3 15.0 4.6 -
52.3 114.7 37.9 23.3 -
34.1 21.4 14.4 6.1 -
16.4 2.7 2.6 11.0 -
1.7 90.0 20.8 6.0 -
(in billions of yen)
(*1) On internal credit ratings basis (show n by rating marks based on the general correspondence to external credit ratings)
(*2) Unamortized amount of unrealized gains/ losses resulting from reclassification: -66.4 bn yen as of the end of Sep. 2010, -78.8 bn yen as of the end of Mar. 2010
<Exposure to corporate loans (overseas)>
(in billions of yen)
Balance Credit ratings (*3)
North Change from
America Europe Mar-10 1-4 5-6 7-8
Corporate loans (*4) 203.3 97.5 32.3 -42.8 71.4 110.9 20.9
(*3) Internal Credit Ratings: 1-6: Ordinary debtors, 7-8: Special mention debtors (except for Substandard debtors)
<Securities with no available fair value>
(in billions of yen)
Cost (after impairment)
Change from
Mar-10
Securities with no 20.8 -2.3
available fair value
(*4) There are no subprime related loans.
30
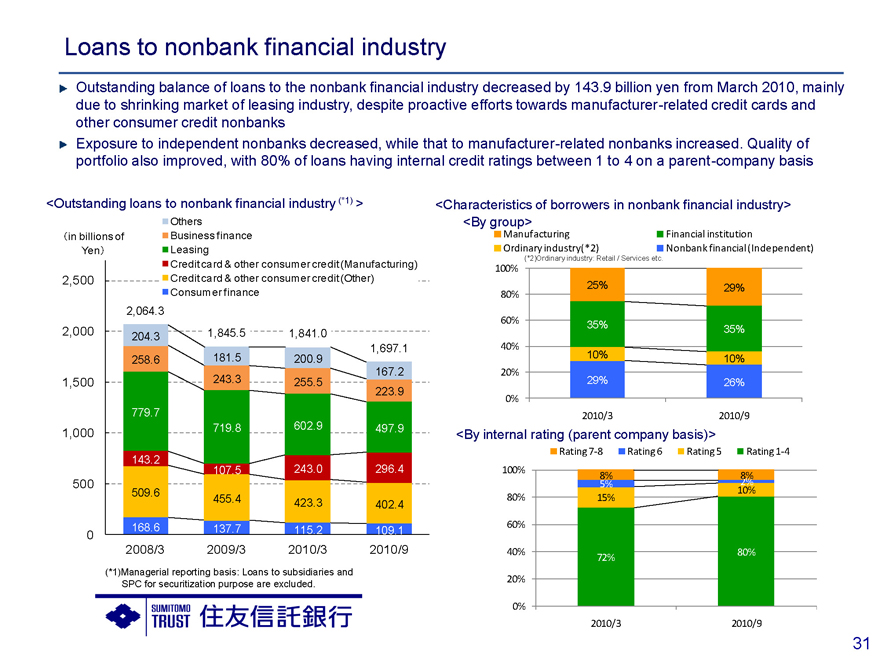
Loans to nonbank financial industry
Outstanding balance of loans to the nonbank financial industry decreased by 143.9 billion yen from March 2010, mainly due to shrinking market of leasing industry, despite proactive efforts towards manufacturer-related credit cards and other consumer credit nonbanks Exposure to independent nonbanks decreased, while that to manufacturer-related nonbanks increased. Quality of portfolio also improved, with 80% of loans having internal credit ratings between 1 to 4 on a parent-company basis
<Outstanding loans to nonbank financial industry (*1) >
Others
Business finance Leasing
Credit card & other consumer credit (Manufacturing) Credit card & other consumer credit (Other) Consumer finance
in billions of Yen
2,500 2,000 1,500 1,000 500 0
2,064.3
204.3 1,845.5 1,841.0
1,697.1
258.6 181.5 200.9
167.2
243.3 255.5
223.9
779.7
719.8 602.9 497.9
143.2
107.5 243.0 296.4
509.6
455.4 423.3 402.4
168.6 137.7 115.2 109.1
2008/3 2009/3 2010/3 2010/9
(*1)Managerial reporting basis: Loans to subsidiaries and SPC for securitization purpose are excluded.
<Characteristics of borrowers in nonbank financial industry>
<By group>
Manufacturing Financial institution
Ordinary industry(*2) Nonbank financial (Independent)
(*2)Ordinary industry: Retail / Services etc.
100%
25% 29%
80%
60%
35% 35%
40%
10% 10%
20%
29% 26%
0%
2010/3 2010/9
<By internal rating (parent company basis)>
Rating 7-8 Rating 6 Rating 5 Rating 1-4
100% 8% 8%
5% 2%
10%
80% 15%
60%
40% 80%
72%
20%
0%
2010/3 2010/9
31
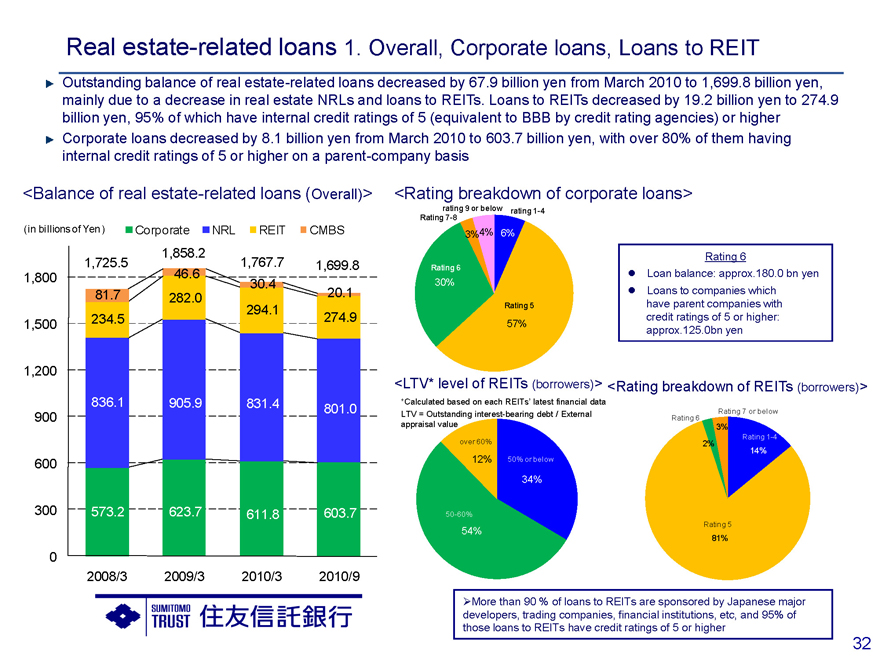
Real estate-related loans 1. Overall, Corporate loans, Loans to REIT
Outstanding balance of real estate-related loans decreased by 67.9 billion yen from March 2010 to 1,699.8 billion yen, mainly due to a decrease in real estate NRLs and loans to REITs. Loans to REITs decreased by 19.2 billion yen to 274.9 billion yen, 95% of which have internal credit ratings of 5 (equivalent to BBB by credit rating agencies) or higher Corporate loans decreased by 8.1 billion yen from March 2010 to 603.7 billion yen, with over 80% of them having internal credit ratings of 5 or higher on a parent-company basis
<Balance of real estate-related loans (Overall)>
(in billions of Yen) Corporate NRL REIT CMBS
1,858.2
1,725.5 1,767.7 1,699.8
1,800 46.6 30.4
81.7 282.0 20.1
294.1
1,500 234.5 274.9
1,200
836.1 905.9 831.4 801.0
900
600
300 573.2 623.7 611.8 603.7
0
2008/3 2009/3 2010/3 2010/9
<Rating breakdown of corporate loans>
rating 9 or below
Rating 7-8 rating 1-4 3% 4% 6% Rating 6 30% Rating 5 57%
Rating 6 Loan balance: approx.180.0 bn yen Loans to companies which have parent companies with credit ratings of 5 or higher: approx.125.0bn yen
<LTV* level of REITs (borrowers)>
*Calculated based on each REITs’ latest financial data
LTV = Outstanding interest-bearing debt / External appraisal value
<Rating breakdown of REITs (borrowers)>
over 60%
12% 50% or below
34%
50-60%
54%
Rating 6 Rating 7 or below 3%
2% Rating 1-4 14%
Rating 5 81%
More than 90 % of loans to REITs are sponsored by Japanese major developers, trading companies, financial institutions, etc, and 95% of those loans to REITs have credit ratings of 5 or higher
32
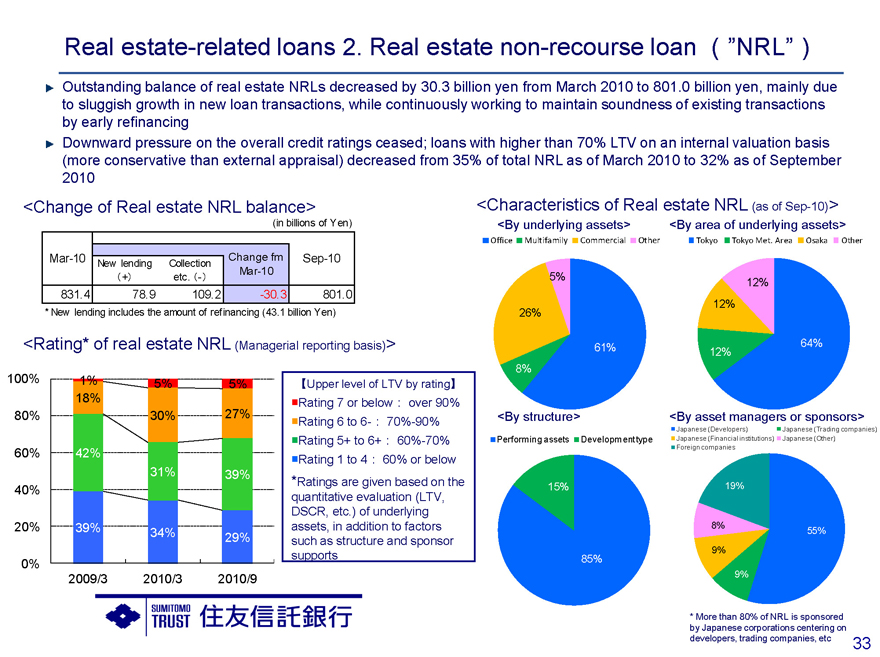
Real estate-related loans 2. Real estate non-recourse loan ”NRL”
Outstanding balance of real estate NRLs decreased by 30.3 billion yen from March 2010 to 801.0 billion yen, mainly due to sluggish growth in new loan transactions, while continuously working to maintain soundness of existing transactions by early refinancing Downward pressure on the overall credit ratings ceased; loans with higher than 70% LTV on an internal valuation basis (more conservative than external appraisal) decreased from 35% of total NRL as of March 2010 to 32% as of September 2010
<Change of Real estate NRL balance>
(in billions of Yen)
Mar-10 Change fm Sep-10
New lending Collection
+ etc. - Mar-10
831.4 78.9 109.2 -30.3 801.0
* New lending includes the amount of refinancing (43.1 billion Yen)
<Rating* of real estate NRL (Managerial reporting basis)>
100% 1% 5% 5%
18%
80% 30% 27%
60% 42%
31% 39%
40%
20% 39% 34%
29%
0%
2009/3 2010/3 2010/9
[Upper level of LTV by rating]
Rating 7 or below over 90%
Rating 6 to 6- : 70%-90%
Rating 5+ to 6+ : 60%-70%
Rating 1 to 4 : 60% or below
*Ratings are given based on the quantitative evaluation (LTV, DSCR, etc.) of underlying assets, in addition to factors such as structure and sponsor supports
<Characteristics of Real estate NRL (as of Sep-10)>
<By underlying assets>
Office Multifamily Commercial Other
<By area of underlying assets>
Tokyo Tokyo Met. Area Osaka Other
5%
26%
61% 8%
12% 12%
64% 12%
<By structure>
Performing assets Development type
<By asset managers or sponsors>
Japanese (Developers) Japanese (Trading companies) Japanese (Financial institutions) Japanese (Other) Foreign companies
15%
85%
19%
8%
9%
9%
55%
* More than 80% of NRL is sponsored by Japanese corporations centering on developers, trading companies, etc
33
Division performance
34
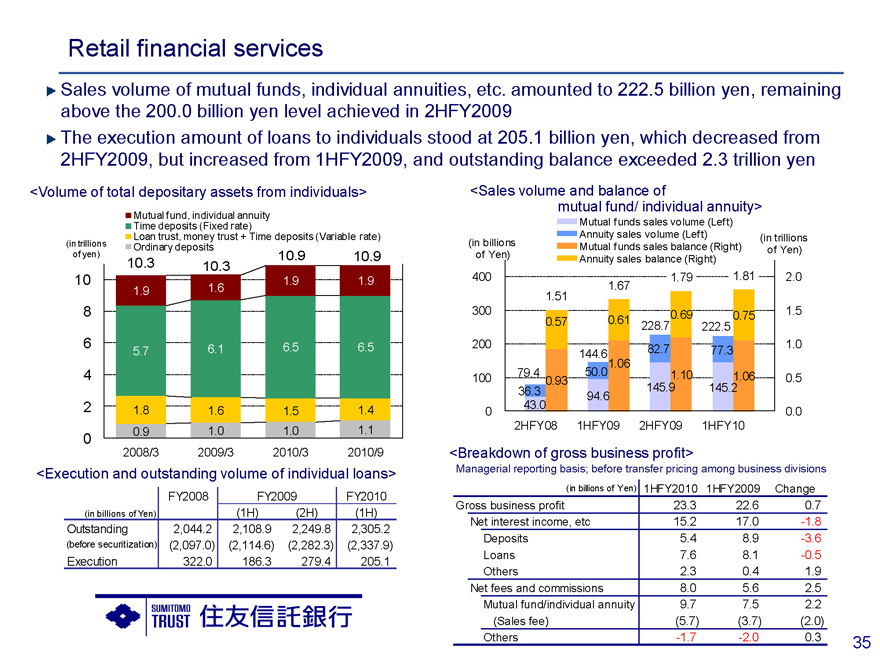
Retail financial services
Sales volume of mutual funds, individual annuities, etc. amounted to 222.5 billion yen, remaining above the 200.0 billion yen level achieved in 2HFY2009 The execution amount of loans to individuals stood at 205.1 billion yen, which decreased from 2HFY2009, but increased from 1HFY2009, and outstanding balance exceeded 2.3 trillion yen
<Volume of total depositary assets from individuals>
Mutual fund, individual annuity Time deposits (Fixed rate)
Loan trust, money trust + Time deposits (Variable rate) Ordinary deposits
(in trillions of yen)
10.9 10.9
10.3 10.3
10 1.9 1.9
1.9 1.6
8
6 6.1 6.5 6.5
5.7
4
2 1.8 1.6 1.5 1.4
0.9 1.0 1.0 1.1
0
2008/3 2009/3 2010/3 2010/9
<Execution and outstanding volume of individual loans>
FY2008 FY2009 FY2010
(in billions of Yen)(1H)(2H)(1H)
Outstanding 2,044.2 2,108.9 2,249.8 2,305.2
(before securitization)(2,097.0)(2,114.6)(2,282.3)(2,337.9)
Execution 322.0 186.3 279.4 205.1
<Sales volume and balance of mutual fund/ individual annuity>
Mutual funds sales volume (Left) Annuity sales volume (Left) Mutual funds sales balance (Right) Annuity sales balance (Right)
(in billions of Yen)
(in trillions of Yen)
400 1.79 1.81 2.0
1.67
1.51
300 0.69 0.75 1.5
0.57 0.61 228.7 222.5
200 82.7 77.3 1.0
144.6 1.06
100 79.4 0.93 50.0 1.10 1.06 0.5
36.3 145.9 145.2
94.6
43.0
0 0.0
2HFY08 1HFY09 2HFY09 1HFY10
<Breakdown of gross business profit>
Managerial reporting basis; before transfer pricing among business divisions
(in billions of Yen) 1HFY2010 1HFY2009 Change
Gross business profit 23.3 22.6 0.7
Net interest income, etc 15.2 17.0 -1.8
Deposits 5.4 8.9 -3.6
Loans 7.6 8.1 -0.5
Others 2.3 0.4 1.9
Net fees and commissions 8.0 5.6 2.5
Mutual fund/individual annuity 9.7 7.5 2.2
(Sales fee)(5.7)(3.7)(2.0)
Others -1.7 -2.0 0.3
35

Wholesale financial services & Loan portfolio (Non-consolidated)
Net interest income (managerial reporting basis) decreased by 1.4 billion yen from 1HFY2009, mainly due to a decline in earnings resulting from the decrease in the balance of international credit investment
Net fees and commissions (managerial reporting basis) decreased by 1.4 billion yen from 1HFY2009, mainly due to a decrease in arrangement fees of syndicated loans, etc. as well as fees of stock transfer agency services
<Balance of credit portfolio (non-consolidated)>
(in trillions of yen)
Individual loans
Market-based loan (international)
Market-based loan (domestic: exc. Real estate NRL) Real estate NRL (inc. CMBS and loans to REITs) Sumitomo Trust’s group companies Corporate loan (Japanese)
15 12 9 6 3 0
13.3 13.5 13.5
12.8
2.0 2.0 2.2
2.3
1.3 1.0 0.8
0.8 0.6 0.6 0.5 0.6
1.2 1.1
0.6 1.2 0.5 0.4 1.0 0.4
7.4 7.9 8.2 7.8
2008/3 2009/3 2010/3 2010/9
<Breakdown of net interest income (non-consolidated)>
Managerial reporting basis; before transfer pricing among business divisions
1HFY2010 1HFY2009 Change
(in billions of Yen)
Net interest income, etc 40.8 49.4 -8.6
Net interest income 40.8 42.2 -1.4
Deposits 1.1 1.9 -0.7
Credit investment 39.6 40.3 - -0.7
Domestic 34.7 32.9 1.9
International 4.9 7.5 -2.5
Others (*) - 7.2 -7.2
(*) Including 5.4 billion yen of net gains on international credit securities
<Breakdown of fee revenue (non-consolidated)>
Managerial reporting basis; including net trust fee
(in billions of Yen) 1HFY2010 1HFY2009 Change
Fee revenue 12.7 14.0 -1.4
Real estate NRL 2.3 2.0 0.3
Other Market-based loan
& syndicated loan 4.3 5.0 -0.8
Securitization 2.3 1.7 0.6
Stock transfer agency services 7.3 7.7 -0.4
Fees paid for outsourcing(*) -4.0 -3.6 -0.3
(*) Fees paid for outsourcing of stock agency services operation
36

Financial related business in group companies
1. Leasing, Internet Banking
Sumishin Panasonic Financial Services: With the merger of two leasing subsidiaries, operating assets as of September 2010 increased to 1.1 trillion yen and net income amounted to 6.0 billion yen, mainly due to a decrease in total substantial credit costs
SBI Sumishin Net Bank: Net income increased by 0.1 billion yen from 1HFY2009 to 1.4 billion yen. Its client base steadily expanded, with deposits of approx. 1.4 trillion yen, and a balance of loans to individuals exceeding 560.0 billion yen
<Sumishin Panasonic Financial Services>
(Operating assets)
(in billions of Loans Credit (Retail) Leasing/ installment
Yen)
1,200 1,071.7 1,029.4 1,082.5 1,100.5
1,000 88.8 94.8 122.1 126.2
95.4 94.9 94.6 91.1
800
600
400 887.4 839.6 865.8 883.1
200
0
2009/3 2009/9 2010/3 2010/9
* 2010/3 and before: simple combined figure of former STB leasing and former Sumishin Matsushita Financial services
(for reference)
Sumishin Panasonic
Sumishin Matsushita STB Leasing
Financial Services Financial Services
(Consolidated)(Consolidated)
(in billions of Yen) 1HFY2010 1HFY2009 1HFY2009
Net business profit 10.0 1.0 1.4
Leasing profit 158.2 84.6 77.4
Leasing expense -137.3 -73.7 -70.9
G&A expense -10.8 -9.8 -5.0
Ordinary profit 9.9 1.1 1.2
Net income 6.0 1.7 0.8
Total substantial credit costs 1.3 -2.0 -2.9
<SBI Sumishin Net Bank>
Sep-10 Mar-10 Change
Number of account (thousands) 890 750 140
Deposits (in billions of Yen) 1,402.7 1,193.8 208.8
Loans (in billions of Yen) 565.2 442.4 122.8
(P/L)
1HFY2010 1HFY2009 Change
(in billions of Yen)
Net business profit 1.4 1.3 0.1
Ordinary profit 1.4 1.2 0.1
Net income 1.4 1.2 0.1
(B/S) Sep-10 Mar-10 Change
(in billions of Yen)
Total assets 1,555.4 1,248.6 306.7
Net assets 38.1 26.6 11.5
Shareholders’ equity 39.9 26.5 13.4
37
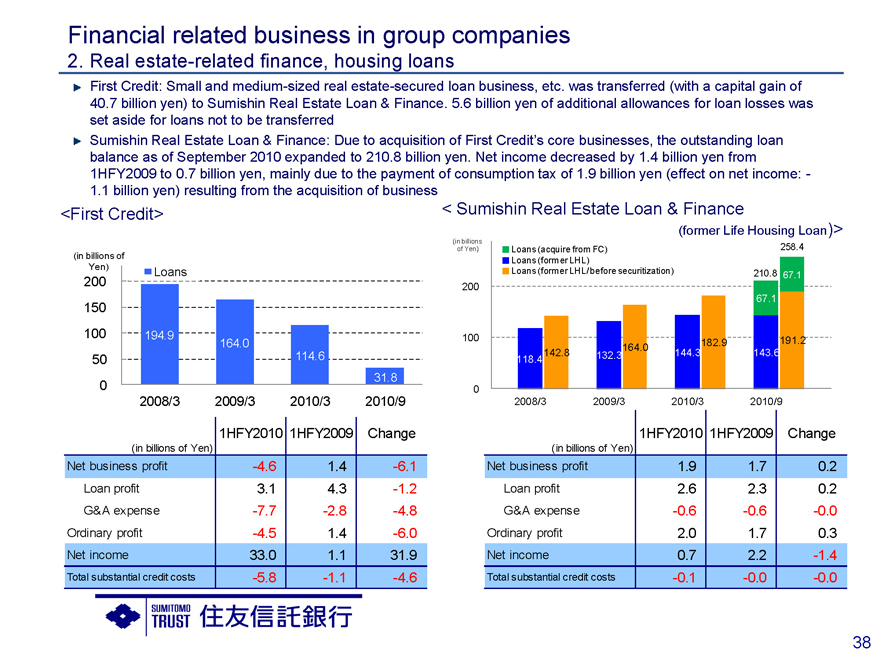
Financial related business in group companies
2. Real estate-related finance, housing loans
First Credit: Small and medium-sized real estate-secured loan business, etc. was transferred (with a capital gain of 40.7 billion yen) to Sumishin Real Estate Loan & Finance. 5.6 billion yen of additional allowances for loan losses was set aside for loans not to be transferred
Sumishin Real Estate Loan & Finance: Due to acquisition of First Credit’s core businesses, the outstanding loan balance as of September 2010 expanded to 210.8 billion yen. Net income decreased by 1.4 billion yen from 1HFY2009 to 0.7 billion yen, mainly due to the payment of consumption tax of 1.9 billion yen (effect on net income: -
1.1 billion yen) resulting from the acquisition of business
<First Credit>
(in billions of
Yen) Loans
200
150
100 194.9
164.0
50 114.6
0 31.8
2008/3 2009/3 2010/3 2010/9
1HFY2010 1HFY2009 Change
(in billions of Yen)
Net business profit -4.6 1.4 -6.1
Loan profit 3.1 4.3 -1.2
G&A expense -7.7 -2.8 -4.8
Ordinary profit -4.5 1.4 -6.0
Net income 33.0 1.1 31.9
Total substantial credit costs -5.8 -1.1 -4.6
< Sumishin Real Estate Loan & Finance
(former Life Housing Loan)>
(in billions
of Yen) Loans (acquire from FC) 258.4
Loans (former LHL)
Loans (former LHL/ before securitization) 210.8 67.1
200
67.1
100 182.9 191.2
142.8 132.3 164.0 144.3 143.6
118.4
0
2008/3 2009/3 2010/3 2010/9
1HFY2010 1HFY2009 Change
(in billions of Yen)
Net business profit 1.9 1.7 0.2
Loan profit 2.6 2.3 0.2
G&A expense -0.6 -0.6 -0.0
Ordinary profit 2.0 1.7 0.3
Net income 0.7 2.2 -1.4
Total substantial credit costs -0.1 -0.0 -0.0
38
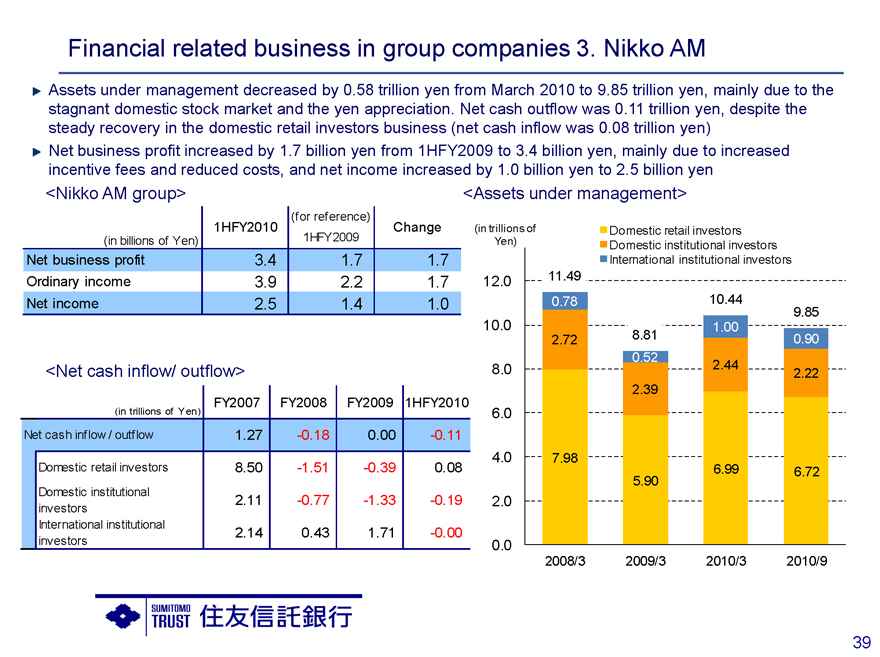
Financial related business in group companies 3. Nikko AM
Assets under management decreased by 0.58 trillion yen from March 2010 to 9.85 trillion yen, mainly due to the stagnant domestic stock market and the yen appreciation. Net cash outflow was 0.11 trillion yen, despite the steady recovery in the domestic retail investors business (net cash inflow was 0.08 trillion yen) Net business profit increased by 1.7 billion yen from 1HFY2009 to 3.4 billion yen, mainly due to increased incentive fees and reduced costs, and net income increased by 1.0 billion yen to 2.5 billion yen
<Nikko AM group>
(for reference)
1HFY2010 Change
(in billions of Yen) 1HFY2009
Net business profit 3.4 1.7 1.7
Ordinary income 3.9 2.2 1.7
Net income 2.5 1.4 1.0
<Net cash inflow/ outflow>
FY2007 FY2008 FY2009 1HFY2010
(in trillions of Yen)
Net cash inflow / outflow 1.27 -0.18 0.00 -0.11
Domestic retail investors 8.50 -1.51 -0.39 0.08
Domestic institutional 2.11 -0.77 -1.33 -0.19
investors
International institutional 2.14 0.43 1.71 -0.00
investors
<Assets under management>
(in trillions of Yen)
Domestic retail investors
Domestic institutional investors International institutional investors
12.0 11.49
0.78 10.44
9.85
10.0 1.00
2.72 8.81 0.90
0.52 2.44
8.0 2.22
2.39
6.0
4.0 7.98
6.99 6.72
5.90
2.0
0.0
2008/3 2009/3 2010/3 2010/9
39
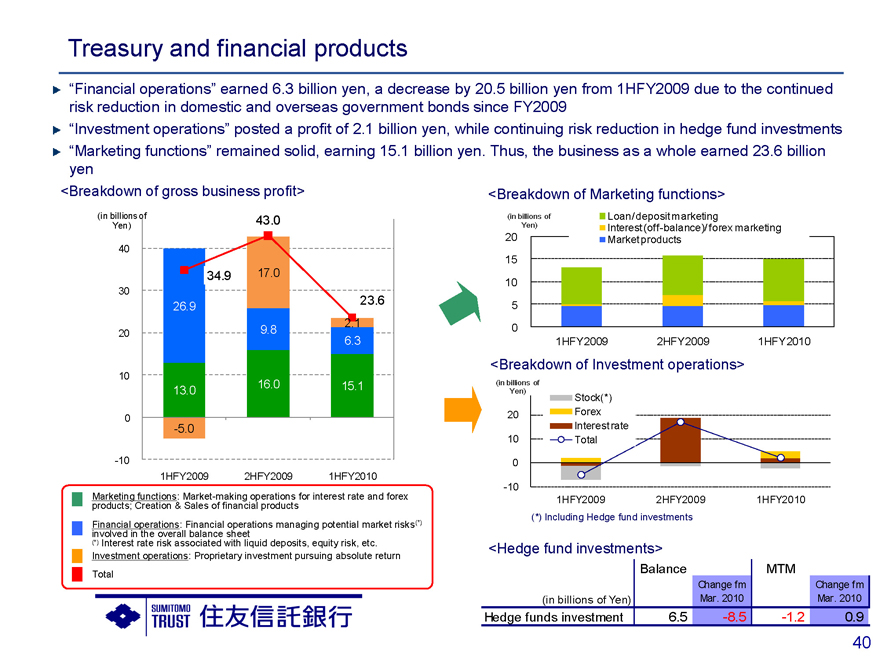
Treasury and financial products
“Financial operations” earned 6.3 billion yen, a decrease by 20.5 billion yen from 1HFY2009 due to the continued risk reduction in domestic and overseas government bonds since FY2009
“Investment operations” posted a profit of 2.1 billion yen, while continuing risk reduction in hedge fund investments
“Marketing functions” remained solid, earning 15.1 billion yen. Thus, the business as a whole earned 23.6 billion yen
<Breakdown of gross business profit>
(in billions of 43.0
Yen)
40
34.9 17.0
30
26.9 23.6
2.1
20 9.8
6.3
10
13.0 16.0 15.1
0
-5.0
-10
1HFY2009 2HFY2009 1HFY2010
Marketing functions: Market-making operations for interest rate and forex products; Creation & Sales of financial products Financial operations: Financial operations managing potential market risks(*) involved in the overall balance sheet (*) Interest rate risk associated with liquid deposits, equity risk, etc.
Investment operations: Proprietary investment pursuing absolute return Total
<Breakdown of Marketing functions>
(in billions of Yen)
Loan/ deposit marketing
Interest (off-balance)/ forex marketing Market products
20 15 10 5 0
1HFY2009 2HFY2009 1HFY2010
<Breakdown of Investment operations>
(in billions of Yen)
Stock(*) Forex Interest rate Total
20
10
0
-10
1HFY2009 2HFY2009 1HFY2010
(*) Including Hedge fund investments
<Hedge fund investments>
Balance MTM
Change fm Change fm
(in billions of Yen) Mar. 2010 Mar. 2010
Hedge funds investment 6.5 -8.5 -1.2 0.9
40
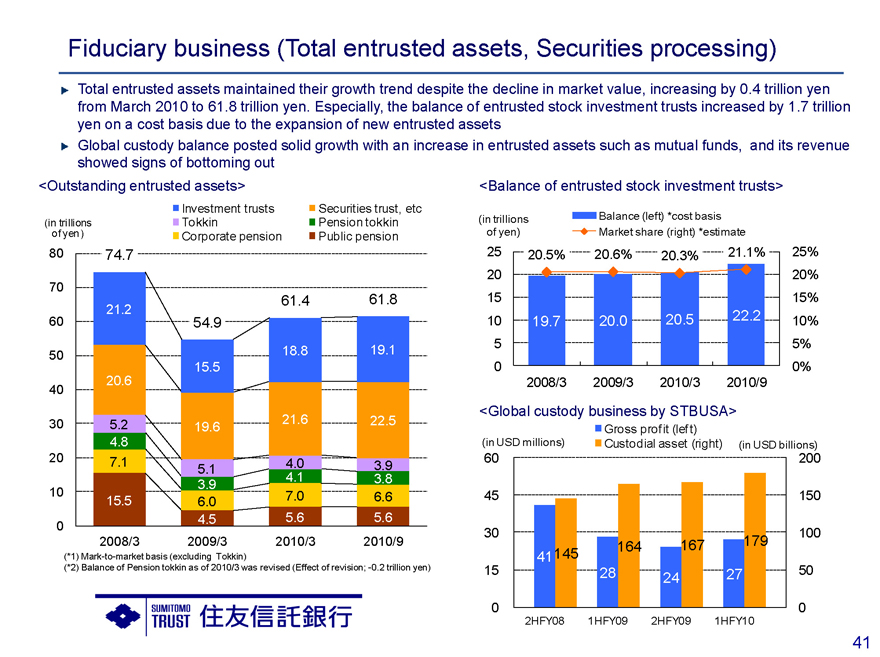
Fiduciary business (Total entrusted assets, Securities processing)
Total entrusted assets maintained their growth trend despite the decline in market value, increasing by 0.4 trillion yen from March 2010 to 61.8 trillion yen. Especially, the balance of entrusted stock investment trusts increased by 1.7 trillion yen on a cost basis due to the expansion of new entrusted assets Global custody balance posted solid growth with an increase in entrusted assets such as mutual funds, and its revenue showed signs of bottoming out
<Outstanding entrusted assets>
Investment trusts Tokkin Corporate pension
Securities trust, etc Pension tokkin Public pension
(in trillions of yen)
80 74.7
70
21.2 61.4 61.8
60 54.9
50 18.8 19.1
15.5
20.6
40
30 5.2 19.6 21.6 22.5
4.8
20 7.1 5.1 4.0 3.9
3.9 4.1 3.8
10 15.5 6.0 7.0 6.6
0 4.5 5.6 5.6
2008/3 2009/3 2010/3 2010/9
(*1) Mark-to-market basis (excluding Tokkin)
(*2) Balance of Pension tokkin as of 2010/3 was revised (Effect of revision; -0.2 trillion yen)
<Balance of entrusted stock investment trusts>
(in trillions of yen)
Balance (left) *cost basis Market share (right) *estimate
25 20.5% 20.6% 20.3% 21.1% 25%
20 20%
15 15%
10 19.7 20.0 20.5 22.2 10%
5 5%
0 0%
2008/3 2009/3 2010/3 2010/9
<Global custody business by STBUSA>
(in USD millions)
Gross profit (left) Custodial asset (right)
(in USD billions)
60 45 30 15 0
41
145
28
164
24
167
27
179
200 150 100 50 0
2HFY08 1HFY09 2HFY09 1HFY10
41

Fiduciary business (Pension, Investment management)
Total assets under management of the group decreased by 1.4 trillion yen from March 2010 to 38.1 trillion yen, mainly due to the decline in market value Change of corporate pension balance due to market share changes among trust banks remained almost flat, while our market share among trust banks grew solidly The ratio of active investments was stable at about 48%. Outstanding balance of alternative investment remained above 1 trillion yen level
<Assets under management of STB group >
(in trillions of Yen)
Public pension
Investment advisory (inc. crossborder) Corporate pension STB AM
Nikko AM
27.6
40(39.1) 26.1 39.5 38.1
(34.9)
11.4 10.4 9.8
30 8.8
1.5 1.5 1.5
1.2
20 7.1 6.0 7.0 6.6
3.3
14.2 14.9 14.4
10
15.5
4.5 5.6 5.6
0
2008/3 2009/3 2010/3 2010/9
(*1) Mark-to-market basis
(*2) Figures for Nikko AM before 2009/3 are for reference and numbers in pharenthesis are referencial number including Nikko AM
<Market share of corporate pension and change of balance due to market share changes among trust banks (estimate)>
Change of balance by share change (Left) *Cost basis Market share (Right) *estimate
(in trillions of Yen)
19.6% 19.7% 19.8% 19.9%
0.4 20%
0.3 15%
0.2 10%
0.34
0.26
0.1 0.16 5%
0.00
0.0 0%
2008/3 2009/3 2010/3 2010/9
<Ratio of active management (corporate pension) etc.>
(in billions of Yen)
Balance of alternative investment (Left) *Mark-to-market basis Ratio of active investment (Right)
50.0% 48.0% 48.2% 47.9%
1,200.0 50%
1,000.0 40%
800.0 1,079.6 1,058.4 30%
944.8 897.8
600.0 20%
2009/3 2009/9 2010/3 2010/9
42
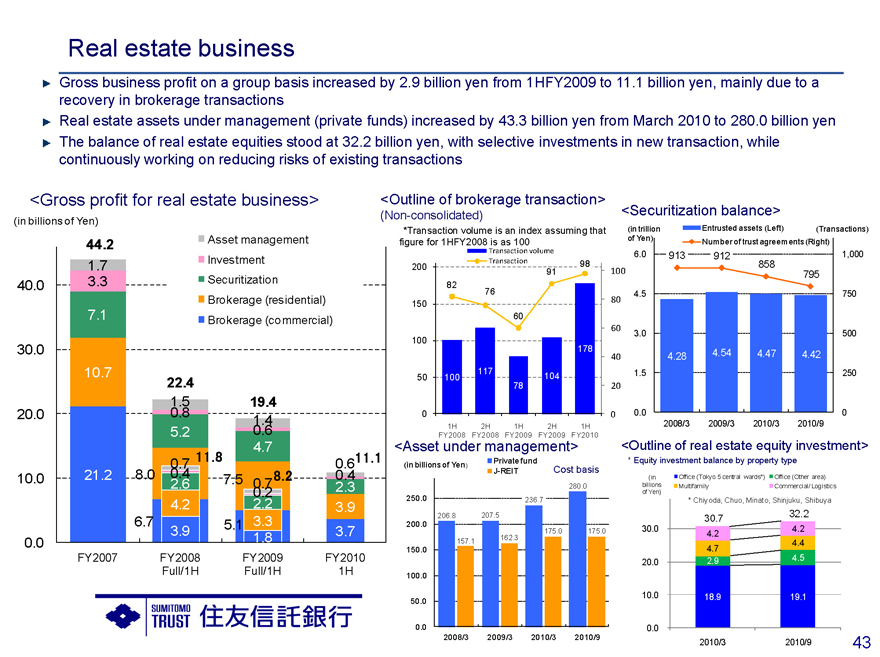
Real estate business
Gross business profit on a group basis increased by 2.9 billion yen from 1HFY2009 to 11.1 billion yen, mainly due to a recovery in brokerage transactions
Real estate assets under management (private funds) increased by 43.3 billion yen from March 2010 to 280.0 billion yen The balance of real estate equities stood at 32.2 billion yen, with selective investments in new transaction, while continuously working on reducing risks of existing transactions
<Gross profit for real estate business>
(in billions of Yen)
Asset management Investment Securitization Brokerage (residential) Brokerage (commercial)
40.0
30.0
20.0
10.0
0.0
44.2
1.7
3.3
7.1
10.7
21.2
22.4
1.5 19.4
0.8 1.4
5.2 0.6
4.7
0.7 11.8 0.6 11.1
8.0 0.4 7.5 0.7 8.2 0.4
2.6 0.2 2.3
4.2 2.2 3.9
6.7 5.1 3.3
3.9 1.8 3.7
FY2007 FY2008 Full/1H FY2009 Full/1H FY2010 1H
<Outline of brokerage transaction>
(Non-consolidated)
*Transaction volume is an index assuming that figure for 1HFY2008 is as 100
Transaction volume
200 Transaction 98
91 100
82
76
150 80
60
60
100
178
40
117
50 100 104
78 20
0 0
1H FY2008 2H FY2008 1H FY2009 2H FY2009 1H FY2010
<Securitization balance>
(in trillion of Yen)
Entrusted assets (Left) (Transactions) Number of trust agreements (Right)
6.0 913 912 1,000
858
795
4.5 750
3.0 500
4.28 4.54 4.47 4.42
1.5 250
0.0 0
2008/3 2009/3 2010/3 2010/9
<Outline of real estate equity investment>
* Equity investment balance by property type
<Asset under management>
Private fund
(in billions of Yen) J-REIT Cost basis
280.0
250.0 236.7
206.8 207.5
200.0
175.0 175.0
157.1 162.3
150.0
100.0
50.0
0.0
2008/3 2009/3 2010/3 2010/9
Office (Tokyo 5 central wards*) Office (Other area)
Multifamily Commercial/ Logistics
(in billions of Yen)
* Chiyoda, Chuo, Minato, Shinjuku, Shibuya
30.7 32.2
30.0 4.2
4.2
4.7 4.4
20.0 2.9 4.5
10.0 18.9 19.1
0.0
2010/3 2010/9
43
Cautionary Statement Regarding Forward-Looking Statements
This announcement contains certain forward-looking statements that reflect the plans and expectations of Chuo Mitsui Trust Holdings, Inc. and The Sumitomo Trust and Banking Co., Ltd. in relation to, and the benefits resulting from, their proposed business combination and business alliance. These forward-looking statements may be identified by words such as ‘believes’, ‘expects’, ‘anticipates’, ‘projects’, ‘intends’, ‘should’, ‘seeks’, ‘estimates’, ‘future’, or similar expressions or by discussion of, among other things, strategy, goals, plans or intentions. Actual results may differ materially in the future from those reflected in forward-looking statements contained in this document, due to various factors including but not limited to:
failure of the parties to agree on some or all of the terms of business combination; failure to obtain a necessary shareholder approval; inability to obtain some or all necessary regulatory approvals or to fulfill any other condition to the closing of the transaction; changes in laws or accounting standards, or other changes in the business environment relevant to the parties; challenges in executing our business strategies; the effects of financial instability or other changes in general economic or industry conditions; and other risks to consummation of the transaction.
Additional Information and Where to Find It
Chuo Mitsui Trust Holdings, Inc. has filed a registration statement on Form F-4 with the U.S. Securities and Exchange
Commission (the “SEC”) in connection with its proposed business combination with The Sumitomo Trust and Banking Co., Ltd.
The Form F-4 contains a prospectus and other documents. The prospectus contained in the Form F-4 is expected to be mailed to U.S. shareholders of The Sumitomo Trust and Banking Co., Ltd. prior to the shareholders’ meeting at which the proposed business combination will be voted upon. The Form F-4 and prospectus, as they may be amended from time to time, contain important information about Chuo Mitsui Trust Holdings, Inc. and The Sumitomo Trust and Banking Co., Ltd., the business combination and related matters including the terms and conditions of the transaction. U.S. shareholders of The Sumitomo Trust and Banking Co., Ltd. are urged to read carefully the Form F-4, the prospectus and the other documents, as they may be amended from time to time, that have been or may be filed with the SEC in connection with the transaction before they make any decision at the shareholders meeting with respect to the business combination. The Form F-4 the prospectus and all other documents filed with the SEC in connection with the business combination is available, free of charge, on the SEC’s web site at http://www.sec.gov. In addition, the prospectus and all other documents filed with the SEC in connection with the business combination is made available to U.S. shareholders of The Sumitomo Trust and Banking Co., Ltd., free of charge, by faxing a request to Chuo Mitsui Trust Holdings, Inc. at +81-3-5232-8716 or to The Sumitomo Trust and Banking Co., Ltd. at +81-3-3286-4654.