| |
OMB APPROVAL |
|
| OMB Number: 3235-0570 |
|
| Expires: September 30, 2007 |
| |
| Estimated average |
| burden hours per |
| response: 19.4 |
|
UNITED STATES
SECURITIES AND EXCHANGE COMMISSION
Washington, D.C. 20549
FORM N-CSR
CERTIFIED SHAREHOLDER REPORT OF REGISTERED MANAGEMENT INVESTMENT COMPANIES
Investment Company Act file number 811-08413
Evergreen Equity Trust
_____________________________________________________________
(Exact name of registrant as specified in charter)
200 Berkeley Street
Boston, Massachusetts 02116
_____________________________________________________________
(Address of principal executive offices) (Zip code)
Michael H. Koonce, Esq.
200 Berkeley Street
Boston, Massachusetts 02116
____________________________________________________________
(Name and address of agent for service)
Registrant's telephone number, including area code: (617) 210-3200
Date of fiscal year end: Registrant is making an annual filing for one of its series, Evergreen Balanced Fund, for the year ended March 31, 2008. This one series has a March 31 fiscal year end.
Date of reporting period: March 31, 2008
Item 1 - Reports to Stockholders.
Evergreen Balanced Fund
| | | table of contents |
| 1 | | LETTER TO SHAREHOLDERS |
| 4 | | FUND AT A GLANCE |
| 5 | | PORTFOLIO MANAGER COMMENTARY |
| 8 | | ABOUT YOUR FUND’S EXPENSES |
| 9 | | FINANCIAL HIGHLIGHTS |
| 13 | | SCHEDULE OF INVESTMENTS |
| 23 | | STATEMENT OF ASSETS AND LIABILITIES |
| 24 | | STATEMENT OF OPERATIONS |
| 25 | | STATEMENTS OF CHANGES IN NET ASSETS |
| 26 | | NOTES TO FINANCIAL STATEMENTS |
| 34 | | REPORT OF INDEPENDENT REGISTERED PUBLIC ACCOUNTING FIRM |
| 35 | | ADDITIONAL INFORMATION |
| 36 | | TRUSTEES AND OFFICERS |
This annual report must be preceded or accompanied by a prospectus of the Evergreen fund contained herein. The prospectus contains more complete information, including fees and expenses, and should be read carefully before investing or sending money.
The fund will file its complete schedule of portfolio holdings with the SEC for the first and third quarters of each fiscal year on Form N-Q. The fund’s Form N-Q will be available on the SEC’s Web site at http://www.sec.gov. In addition, the fund’s Form N-Q may be reviewed and copied at the SEC’s Public Reference Room in Washington, D.C. Information on the operation of the Public Reference Room may be obtained by calling 800.SEC.0330.
A description of the fund’s proxy voting policies and procedures, as well as information regarding how the fund voted proxies relating to portfolio securities during the most recent 12-month period ended June 30, is available by visiting our Web site at EvergreenInvestments.com or by visiting the SEC’s Web site at http://www.sec.gov. The fund’s proxy voting policies and procedures are also available without charge, upon request, by calling 800.343.2898.
| Mutual Funds: | | | | |
| NOT FDIC INSURED | | MAY LOSE VALUE | | NOT BANK GUARANTEED |
Evergreen InvestmentsSM is a service mark of Evergreen Investment Management Company, LLC.
Copyright 2008, Evergreen Investment Management Company, LLC.
Evergreen Investment Management Company, LLC is a subsidiary of Wachovia Corporation
and is an affiliate of Wachovia Corporation’s other Broker Dealer subsidiaries.
Evergreen mutual funds are distributed by Evergreen Investment Services, Inc.
200 Berkeley Street, Boston, MA 02116
LETTER TO SHAREHOLDERS
May 2008

Dennis H. Ferro
President and Chief Executive Officer
Dear Shareholder:
We are pleased to provide the Annual Report for Evergreen Balanced Fund for the twelve-month period ended March 31, 2008 (the “twelve-month period”).
The fiscal year was a period of significant change in the capital markets as investors grew increasingly apprehensive that the economy was starting to weaken dramatically. Economic growth had appeared strong at the start of the fiscal year, with persistently solid gains in corporate profits and employment encouraging optimism. The backdrop for investing began to change by the summer of 2007, however, amid widening worries about problems in the Financials sector. Investors feared weakness in housing and problems in the subprime mortgage industry could pull the domestic economy into recession. Major financial institutions began to report substantial losses from their exposures to subprime mortgages and banks started to tighten their credit standards and to restrict their lending. With fears of a dramatic downturn hovering over the market, fixed income investors sought out the highest-quality securities and attempted to avoid credit risk. As a consequence, the prices of corporate bonds and many asset-backed securities fell, while Treasuries rallied in a general flight to quality. At the same time, equity prices were buffeted by news of falling profits, weakening housing, slowing employment, rising inflationary pressures and growing credit problems. Stock valuations fell across all market capitalizations, investment styles and regions. In this environment, the prices of gold, oil and other commodities surged while the U.S. dollar weakened further.
The U.S. economy grew at a healthy pace early in 2007, but then started to show signs of slowing in the final half of 2007 and the first quarter of
1
LETTER TO SHAREHOLDERS continued
2008. Economic growth decelerated as lending for ordinary consumer and commercial activity dried up, accentuating the weakening effects of declining home prices. Corporate profits, employment and other key economic indicators showed clear evidence of deterioration. Gross Domestic Product growth slowed to just 0.6% during the final quarter of 2007 and the first quarter of 2008. To reinvigorate the economy and stimulate lending activity, the Federal Reserve Board (the “Fed”) became increasingly aggressive, taking a series of steps to pour liquidity into the financial system. Starting in September 2007 and continuing through April 2008, the Fed cut the key fed funds rate seven different times, lowering the influential short-term rate from 5.25% to 2%. In March 2008, the central bank also opened its lending facilities to securities firms as well as commercial banks and intervened to help JPMorgan Chase & Co. purchase the collapsing investment bank Bear Stearns Cos. Congress and the Bush administration, meanwhile, rushed through a $168 billion fiscal stimulus bill, which included tax rebate checks, in an effort to boost growth in the second half of 2008.
Throughout this period, managers of the fund remained focused on the primary goals of seeking both capital appreciation and generous income. Early in the fiscal year, however, we did change the fund’s investment strategy. The fund’s new emphasis included greater exposure to high-quality equities and domestic high yield corporate bonds, with lesser emphasis on international bonds, Treasuries and investment-grade corporate bonds. The great majority of the fund’s equity investments now are in dividend-paying stocks, with an emphasis on companies that the fund’s manager believes to have the potential to increase their dividend payouts. Most of the fund’s bond investments are currently in the higher-quality tiers of the domestic high yield bond market.
We believe the fund’s newer emphasis should leave it well positioned to pursue its long-term goals, even as the investment environment changes. The experiences in the capital markets during the twelve-month period
2
LETTER TO SHAREHOLDERS continued
have underscored the value of a well-diversified, long-term investment strategy to help soften the effects of volatility in any one market or asset class. As always, we encourage investors to maintain diversified investment portfolios in pursuit of their long-term investment goals.
Please visit us atEvergreenInvestments.com for more information about our funds and other investment products available to you. Thank you for your continued support of Evergreen Investments.
Sincerely,

Dennis H. Ferro
President and Chief Executive Officer
Evergreen Investment Company, Inc.
Notification of Name and Strategy Change:
Effective May 30, 2008, Evergreen Balanced Fund changed its name to Evergreen Diversified Capital Builder Fund.
Also effective May 30, 2008, the section of the Fund’s prospectus entitled “Investment Strategy” is revised by deleting the sentence that reads:
“The Fund normally invests at least 25% of its assets in fixed income securities.”
and replacing it with the following:
“The Fund generally expects to invest approximately 10% to 30% of its assets in fixed income securities.”
Special Notice to Shareholders:
Please visit our Web site at EvergreenInvestments.com for statements from President and Chief Executive Officer, Dennis Ferro, regarding the firm’s recent settlement with the Securities and Exchange Commission (SEC) and prior settlement with the Financial Industry Regulatory Authority (FINRA).
3
FUND AT A GLANCE
as of March 31, 2008
MANAGEMENT TEAM
Investment Advisor:
Evergreen Investment Management Company, LLC
Portfolio Manager:
Margaret D. Patel
CURRENT INVESTMENT STYLE
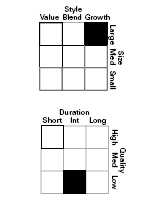
Source: Morningstar, Inc.
Morningstar’s style box is based on a portfolio date as of 3/31/2008.
The Equity style box placement is based on 10 growth and valuation measures for each fund holding and the median size of the companies in which the fund invests.
The Fixed Income style box placement is based on a fund’s average effective maturity or duration and the average credit rating of the bond portfolio.
PERFORMANCE AND RETURNS
Portfolio inception date: 9/11/1935
| | | Class A | | Class B | | Class C | | Class I |
| Class inception date | | 1/20/1998 | | 9/11/1935 | | 1/22/1998 | | 1/26/1998 |
|
| Nasdaq symbol | | EKBAX | | EKBBX | | EKBCX | | EKBYX |
|
| Average annual return* | | | | | | | | |
|
| 1-year with sales charge | | -9.00% | | -8.52% | | -4.92% | | N/A |
|
| 1-year w/o sales charge | | -3.45% | | -4.09% | | -4.03% | | -3.08% |
|
| 5-year | | 5.81% | | 6.01% | | 6.31% | | 7.38% |
|
| 10-year | | 2.52% | | 2.38% | | 2.39% | | 3.40% |
|
| Maximum sales charge | | 5.75% | | 5.00% | | 1.00% | | N/A |
| | | Front-end | | CDSC | | CDSC | | |
|
* Adjusted for maximum applicable sales charge, unless noted.Past performance is no guarantee of future results. The performance quoted represents past performance and current performance may be lower or higher. The investment return and principal value of an investment will fluctuate so that investors’ shares, when redeemed, may be worth more or less than their original cost. To obtain performance information current to the most recent month-end for Classes A, B, C or I, please go to EvergreenInvestments.com/fundperformance. The performance of each class may vary based on differences in loads, fees and expenses paid by the shareholders investing in each class. Performance includes the reinvestment of income dividends and capital gain distributions. Performance shown does not reflect the deduction of taxes that a shareholder would pay on fund distributions or the redemption of fund shares.
The fund incurs a 12b-1 fee of 0.25% for Class A and 1.00% for Classes B and C. Class I does not pay a 12b-1 fee.
The advisor is waiving a portion of its advisory fee and reimbursing a portion of the 12b-1 fee for Class A. Had the fees not been waived or reimbursed, returns would have been lower.
LONG-TERM GROWTH

Comparison of a $10,000 investment in the Evergreen Balanced Fund Class A shares versus a similar investment in the Lehman Brothers Aggregate Bond Index (LBABI), the Russell 1000 Index (Russell 1000), the S&P 500 Index (S&P 500) and the Consumer Price Index (CPI).
The LBABI, the Russell 1000 and the S&P 500 are unmanaged market indexes and do not include transaction costs associated with buying and selling securities, any mutual fund fees or expenses or any taxes. The CPI is a commonly used measure of inflation and does not represent an investment return. It is not possible to invest directly in an index.
The fund has previously compared its performance to the S&P 500 and the LBABI. Given recent changes to the fund’s principal investment strategies, the fund believes that the Russell 1000 is a more appropriate benchmark than the S&P 500. In future periods, the fund will compare its performance to the LBABI and the Russell 1000.
4
PORTFOLIO MANAGER COMMENTARY
The fund’s Class A shares returned -3.45% for the twelve-month period ended March 31, 2008, excluding any applicable sales charges. During the same period, the LBABI returned 7.67%, the Russell 1000 returned -5.40% and the S&P 500 returned -5.08%.
The fund’s objective is to seek long-term total return through capital growth and current income.
Investment Process
During a year that ended with both the equity and fixed income markets buffeted by growing concerns about a significant economic slowdown, we continued to position the fund with a long-term view. As the fund’s fiscal year began, the equity portion of the portfolio was focused on companies that we thought might be able to sustain growth in earnings and cash flow in a slowing economy. Believing that conditions existed for large cap companies to start outperforming other sectors of the market, we heavily weighted the portfolio to emphasize larger corporations. We believed our portfolio companies had superior earnings stability and growth potential than those of the overall S&P stock universe. We kept the fund’s overall allocation relatively stable throughout the period, with approximately three-quarters of assets invested in equities and the remainder invested in fixed income securities as the fiscal year came to a close.
At the outset of 2007, equity sector weightings initially approximated the S&P 500 weights, but with some variations: We had overweights in Health Care, Information Technology and Consumer Staples companies, and underweights in Industrials, Materials and Utilities. By fiscal year end, however, we had increased investments in economically sensitive sectors where stock valuations appeared particularly attractive, and in companies that we believed had the best opportunity to outperform when the economy re-accelerates. For example, we increased our investments in Energy companies, Industrials stocks and Materials companies. At the same time, we reduced our positions in Health Care as we cut our exposure to large cap pharmaceutical
Class I shares are only offered, subject to the minimum initial purchase requirements, in the following manner: (1) to investment advisory clients of EIMC (or its advisory affiliates), (2) to employer- or state-sponsored benefit plans, including but not limited to, retirement plans, defined benefit plans, deferred compensation plans, or savings plans, (3) to fee-based mutual fund wrap accounts, (4) through arrangements entered into on behalf of the Evergreen funds with certain financial services firms, (5) to certain institutional investors, and (6) to persons who owned Class Y shares in registered name in an Evergreen fund on or before December 31, 1994 or who owned shares of any SouthTrust fund in registered name as of March 18, 2005 or who owned shares of Vestaur Securities Fund as of May 20, 2005.
Class I shares are only available to institutional shareholders with a minimum of $1 million investment, which may be waived in certain situations.
The fund’s investment objective may be changed without a vote of the fund’s shareholders.
Foreign investments may contain more risk due to the inherent risks associated with changing political climates, foreign market instability and foreign currency fluctuations.
Mid cap securities may be subject to special risks associated with narrower product lines and limited financial resources compared to their large cap counterparts, and, as a result, mid cap securities may decline significantly in market downturns.
The stocks of smaller companies may be more volatile than those of larger companies due to the higher risk of failure.
Asset-backed and mortgage-backed securities are generally subject to higher prepayment risks than other types of debt securities, which can limit the potential for gain in a declining interest rate environment and increase the potential for loss in a rising interest rate environment. Mortgage-backed securities may also be structured so that they are particularly sensitive to interest rates.
Derivatives involve additional risks including interest rate risk, credit risk, the risk of improper valuation and the risk of non-correlation to the relevant instruments they are designed to hedge or to closely track.
High yield, lower-rated bonds may contain more risk due to the increased possibility of default.
The return of principal is not guaranteed due to fluctuation in the fund’s NAV caused by changes in the price of individual bonds held by the fund and the buying and selling of bonds by the fund. Bond funds have the same inflation, interest rate and credit risks as individual bonds. Generally, the value of bond funds rises when prevailing interest rates fall, and falls when interest rates rise.
U.S. government guarantees apply only to certain securities held in the fund’s portfolio and not to the fund’s shares.
All data is as of March 31, 2008, and subject to change.
5
PORTFOLIO MANAGER COMMENTARY continued
companies, and pared back our investments in Consumer Staples corporations. We ended the fiscal year significantly underweighted in Financials stocks, where we tended to focus on real estate investment trusts (REITs) of office, shopping mall, lodging and timber properties, while seeking to avoid companies exposed to losses from their investments in structured products and residential real estate mortgages.
In the fixed income market over the past year, we noticed that the higher the quality of a bond, the better the price performance within the high yield market. Our holdings benefited from this, because we virtually eliminated bonds rated in the lower half of the high yield universe, and concentrated holding in bonds rated just below investment grade. In fact, better quality high yield bonds offered good relative return compared to most sectors of the equity market in the last several months of this fiscal year.
Contributors to performance
In 2007, stock holdings that helped the portfolio included Joy Global, a manufacturer of heavy machinery that benefited from the expectation of increased coal mining activity; and Apache Corp., an energy exploration and production corporation whose share price rose on the expectation of increased investments in energy development activities. Questar, a natural gas corporation with divisions involved in exploration, pipeline development and marketing, also rose in value, helping performance. Among our REIT holdings in the Financials sector, two strong performers were Simon Property Group, owner of shopping mall properties, and Mack-Cali Realty Corp., owner of office and mixed-use properties. Within the Consumer Discretionary group, online retailer Amazon.com, Inc. was a top contributor, as it continued to benefit from its favorable position in Internet commerce. Personal products care company Estee Lauder, a relatively new fund holding, also contributed positively both because of strong revenue growth in developing markets and as a result of rising investor expectations that a new management team would improve operations further. In Information Technology, companies Google and Microsoft created gains. Google, a leader in Internet search providers, continued its strong growth trends as it expanded into new areas. Software leader Microsoft reported solid earnings gains during the quarter, helping lift the value of its stock. Other individual equity investments that supported results included Cisco Systems, Inc., a leader in producing the infrastructure for information network systems; Schlumberger, Ltd., a major oil services company that benefited from increased exploration and production activity in the energy industry; and Air Products & Chemicals, Inc., a beneficiary from growth in process industries that use industrial gases and related equipment. Our holdings in Cisco Systems, Microsoft and Amazon have since been sold, as we felt they had reached fully valued levels considering their growth prospects relative to other holdings.
Among our fixed income investments, the convertible securities of Inverness Medical Innovations, a health care diagnostics company, appreciated as the corporation’s underlying stock gained. And, as mentioned previously, our emphasis on the higher-quality tiers of the high yield bond universe also helped performance, as these bonds outperformed bonds rated CCC or lower. Lack of exposure to housing-related industry bonds supported relative results, as well.
Detractors from performance
Within our equity portfolio, stocks of several Industrials holdings performed poorly as investors grew worried about the effects of the deceleration in the nation’s economy. Underperforming Industrials in the portfolio included General Cable, a victim of increasing concerns about the combined effects of weakening demand from nonresidential construction activities and the rising costs of raw materials; aircraft manufacturer Boeing, whose stock declined after the announcement of a delay in the production of a new commercial jet; and Parker Hannifin, a leading producer of
6
PORTFOLIO MANAGER COMMENTARY continued
motion and control equipment for a variety of industrial applications. In addition, our investment in QUALCOMM, a leading provider of operating software for wireless telecommunication services, fell because of uncertainties created by a patent dispute. Pharmaceutical company Wyeth was the most noteworthy detractor among health care holdings. Its share price fell after the Food and Drug Administration announced that Wyeth’s application for approval of Prispiq, an anti-depressant drug under development, would not be approved without extensive additional testing. In the Financials sector, Legg Mason, Inc., became a liability as concerns grew that volatility in the financial markets would slow growth in the asset management business.
Our emphasis on high yielding corporate bonds tended to hold back results, relative to the benchmark. These lower-rated bonds trailed Treasuries and other high-grade bonds, whose prices tended to increase as market interest rates declined. In contrast, as corporate bonds fell out of favor, the yield spreads between Treasuries and high yield bonds widened, with high yield bonds generally producing negative total returns. The underperformance of our fixed income holdings tended to be the result of market trends rather than any deterioration of the fundamentals of our holdings. In addition, our position in bonds issued by Freescale Semiconductor underperformed as the corporation faced sluggish demand for its communications-related products. By fiscal year end, we had eliminated our positions in Freescale, as well as QUALCOMM, Wyeth and Legg Mason, to free up funds needed to pursue other growth opportunities.
Management outlook
We currently believe both the stock and bond markets offer interesting opportunities for investors willing to look beyond the recent market weakness brought on by problems in the housing industry and the financials sector. We think stocks of many economically sensitive companies have fallen to attractive levels, while their prospects may be rising because of sustained growth in developing markets and the potential for improving conditions in the domestic economy later this year. Growth in emerging markets has been generating heavy investments in basic infrastructure and industrial plants, while the U.S. economy may benefit both from the efforts of the Federal Reserve to inject more liquidity into the financial system and from the Treasury Department’s tax rebates, expected in the coming months. We think investments in equities make sense, especially for those investors with time horizons of a year or more who have the patience to wait for a recovery in the markets.
The yields of lower-rated corporate bonds, meanwhile, have increased substantially and their yield advantages over Treasuries have widened significantly because of the recent flight to quality in the fixed income markets. We currently think corporate bonds issued by companies that are financially strong enough to withstand the recent economic downdraft have the potential to perform particularly well when the economy begins to re-accelerate.
This commentary reflects the views and opinions of the fund’s portfolio manager(s) on the date indicated and may include statements that constitute “forward-looking statements” under the U.S. Securities laws. Forward-looking statements include, among other things, projections, estimates, and information about possible or future results related to the fund, markets, or regulatory developments. The views expressed above are not guarantees of future performance or economic results and involve certain risks, uncertainties, and assumptions that could cause actual outcomes and results to differ materially from the views expressed herein. The views expressed above are subject to change at any time based upon economic, market, or other conditions and Evergreen undertakes no obligation to update the views expressed herein. Any discussions of specific securities should not be considered a recommendation to buy or sell those securities. The views expressed herein (including any forward-looking statements) may not be relied upon as investment advice or as an indication of the fund’s trading intent.
You should carefully consider the fund’s investment objectives, policies, risks, charges and expenses before investing. To obtain a prospectus, which contains this and other important information visit www.EvergreenInvestments.com or call 1.800.847.5397.
Please read the prospectus carefully before investing.
7
ABOUT YOUR FUND’S EXPENSES
The Example below is intended to describe the fees and expenses borne by shareholders and the impact of those costs on your investment.
Example
As a shareholder of the fund, you incur two types of costs: (1) transaction costs, including sales charges (loads), redemption fees and exchange fees; and (2) ongoing costs, including management fees, distribution (12b-1) fees and other fund expenses. This Example is intended to help you understand your ongoing costs (in dollars) of investing in the fund and to compare these costs with the ongoing costs of investing in other mutual funds. The Example is based on an investment of $1,000 invested at the beginning of the period and held for the entire period from October 1, 2007 to March 31, 2008.
The example illustrates your fund’s costs in two ways:
Actual expenses
The section in the table under the heading “Actual” provides information about actual account values and actual expenses. You may use the information in these columns, together with the amount you invested, to estimate the expenses that you paid over the period. Simply divide your account value by $1,000 (for example, an $8,600 account value divided by $1,000 = 8.6), then multiply the result by the number in the appropriate column for your share class, in the column entitled “Expenses Paid During Period” to estimate the expenses you paid on your account during this period.
Hypothetical example for comparison purposes
The section in the table under the heading “Hypothetical (5% return before expenses)” provides information about hypothetical account values and hypothetical expenses based on the fund’s actual expense ratio and an assumed rate of return of 5% per year before expenses, which is not the fund’s actual return. The hypothetical account values and expenses may not be used to estimate the actual ending account balance or expenses you paid for the period. You may use this information to compare the ongoing costs of investing in the fund and other funds. To do so, compare this 5% hypothetical example with the 5% hypothetical examples that appear in the shareholder reports of the other funds.
Please note that the expenses shown in the table are meant to highlight your ongoing costs only and do not reflect any transactional costs, such as sales charges (loads), redemption fees or exchange fees. Therefore, the section in the table under the heading “Hypothetical (5% return before expenses)” is useful in comparing ongoing costs only, and will not help you determine the relative total costs of owning different funds. In addition, if these transactional costs were included, your costs would have been higher.
| | | Beginning | | Ending | | |
| | | Account | | Account | | Expenses |
| | | Value | | Value | | Paid During |
| | | 10/1/2007 | | 3/31/2008 | | Period* |
|
| Actual |
| Class A | | $ 1,000.00 | | $ 902.05 | | $ 4.52 |
| Class B | | $ 1,000.00 | | $ 899.58 | | $ 8.03 |
| Class C | | $ 1,000.00 | | $ 899.84 | | $ 8.03 |
| Class I | | $ 1,000.00 | | $ 904.01 | | $ 3.28 |
| Hypothetical | | |
| (5% return | |
| before expenses) | |
| Class A | | $ 1,000.00 | | $ 1,020.25 | | $ 4.80 |
| Class B | | $ 1,000.00 | | $ 1,016.55 | | $ 8.52 |
| Class C | | $ 1,000.00 | | $ 1,016.55 | | $ 8.52 |
| Class I | | $ 1,000.00 | | $ 1,021.55 | | $ 3.49 |
|
* For each class of the Fund, expenses are equal to the annualized expense ratio of each class (0.95% for Class A, 1.69% for Class B, 1.69% for Class C and 0.69% for Class I), multiplied by the average account value over the period, multiplied by 183 / 366 days.8
| FINANCIAL HIGHLIGHTS |
|
| (For a share outstanding throughout each period) | | Year Ended March 31, |
| |
|
| CLASS A | | 2008 | | 2007 | | 2006 | | 2005 | | 2004 |
|
| Net asset value, beginning of period | | $9.35 | | $8.90 | | $8.30 | | $8.20 | | $6.91 |
|
| Income from investment operations |
| Net investment income (loss) | | 0.18 | | 0.18 | | 0.18 | | 0.14 | | 0.12 |
| Net realized and unrealized gains or losses on investments | | (0.44) | | 0.43 | | 0.58 | | 0.13 | | 1.32 |
| |
|
| Total from investment operations | | (0.26) | | 0.61 | | 0.76 | | 0.27 | | 1.44 |
|
| Distributions to shareholders from |
| Net investment income | | (0.18) | | (0.16) | | (0.16) | | (0.17) | | (0.15) |
| Net realized gains | | (0.63) | | 0 | | 0 | | 0 | | 0 |
| |
|
| Total distributions to shareholders | | (0.81) | | (0.16) | | (0.16) | | (0.17) | | (0.15) |
|
| Net asset value, end of period | | $8.28 | | $9.35 | | $8.90 | | $8.30 | | $8.20 |
|
| Total return1 | | (3.45%) | | 6.92% | | 9.14% | | 3.29% | | 20.90% |
|
| Ratios and supplemental data |
| Net assets, end of period (millions) | | $ 742 | | $ 900 | | $ 986 | | $ 592 | | $ 688 |
| Ratios to average net assets |
Expenses including waivers/reimbursements
but excluding expense reductions | | 0.96% | | 0.99% | | 0.99% | | 1.00% | | 1.00% |
Expenses excluding waivers/reimbursements
and expense reductions | | 1.03% | | 1.02% | | 1.03% | | 1.00% | | 1.00% |
| Net investment income (loss) | | 1.96% | | 2.04% | | 1.91% | | 1.85% | | 1.59% |
| Portfolio turnover rate | | 91% | | 67% | | 77% | | 103% | | 122% |
|
1 Excluding applicable sales charges
See Notes to Financial Statements9
| FINANCIAL HIGHLIGHTS |
|
| (For a share outstanding throughout each period) | | Year Ended March 31, |
| |
|
| CLASS B | | 2008 | | 2007 | | 2006 | | 2005 | | 2004 |
|
| Net asset value, beginning of period | | $9.35 | | $8.90 | | $8.30 | | $8.20 | | $6.91 |
|
| Income from investment operations |
| Net investment income (loss) | | 0.121 | | 0.121 | | 0.111 | | 0.091 | | 0.071 |
| Net realized and unrealized gains or losses on investments | | (0.45) | | 0.42 | | 0.59 | | 0.12 | | 1.31 |
| |
|
| Total from investment operations | | (0.33) | | 0.54 | | 0.70 | | 0.21 | | 1.38 |
|
| Distributions to shareholders from |
| Net investment income | | (0.10) | | (0.09) | | (0.10) | | (0.11) | | (0.09) |
| Net realized gains | | (0.63) | | 0 | | 0 | | 0 | | 0 |
| |
|
| Total distributions to shareholders | | (0.73) | | (0.09) | | (0.10) | | (0.11) | | (0.09) |
|
| Net asset value, end of period | | $8.29 | | $9.35 | | $8.90 | | $8.30 | | $ 8.20 |
|
| Total return2 | | (4.09%) | | 6.12% | | 8.45% | | 2.55% | | 20.06% |
|
| Ratios and supplemental data |
| Net assets, end of period (millions) | | $ 53 | | $ 104 | | $ 190 | | $ 77 | | $ 98 |
| Ratios to average net assets |
Expenses including waivers/reimbursements
but excluding expense reductions | | 1.69% | | 1.69% | | 1.69% | | 1.70% | | 1.70% |
Expenses excluding waivers/reimbursements
and expense reductions | | 1.73% | | 1.72% | | 1.73% | | 1.70% | | 1.70% |
| Net investment income (loss) | | 1.25% | | 1.34% | | 1.22% | | 1.15% | | 0.89% |
| Portfolio turnover rate | | 91% | | 67% | | 77% | | 103% | | 122% |
|
1 Net investment income (loss) per share is based on average shares outstanding during the period.2 Excluding applicable sales chargesSee Notes to Financial Statements10
| FINANCIAL HIGHLIGHTS |
|
| (For a share outstanding throughout each period) | | Year Ended March 31, |
| |
|
| CLASS C | | 2008 | | 2007 | | 2006 | | 2005 | | 2004 |
|
| Net asset value, beginning of period | | $9.35 | | $8.90 | | $8.32 | | $8.21 | | $6.93 |
|
| Income from investment operations |
| Net investment income (loss) | | 0.11 | | 0.12 | | 0.11 | | 0.09 | | 0.061 |
| Net realized and unrealized gains or losses on investments | | (0.43) | | 0.42 | | 0.57 | | 0.13 | | 1.32 |
| |
|
| Total from investment operations | | (0.32) | | 0.54 | | 0.68 | | 0.22 | | 1.38 |
|
| Distributions to shareholders from |
| Net investment income | | (0.11) | | (0.09) | | (0.10) | | (0.11) | | (0.10) |
| Net realized gains | | (0.63) | | 0 | | 0 | | 0 | | 0 |
| |
|
| Total distributions to shareholders | | (0.74) | | (0.09) | | (0.10) | | (0.11) | | (0.10) |
|
| Net asset value, end of period | | $8.29 | | $9.35 | | $8.90 | | $8.32 | | $8.21 |
|
| Total return2 | | (4.03%) | | 6.16% | | 8.26% | | 2.70% | | 19.91% |
|
| Ratios and supplemental data |
| Net assets, end of period (millions) | | $ 61 | | $ 72 | | $ 85 | | $ 16 | | $ 16 |
| Ratios to average net assets |
Expenses including waivers/reimbursements
but excluding expense reductions | | 1.69% | | 1.69% | | 1.69% | | 1.70% | | 1.70% |
Expenses excluding waivers/reimbursements
and expense reductions | | 1.73% | | 1.72% | | 1.73% | | 1.70% | | 1.70% |
| Net investment income (loss) | | 1.22% | | 1.34% | | 1.22% | | 1.16% | | 0.83% |
| Portfolio turnover rate | | 91% | | 67% | | 77% | | 103% | | 122% |
|
1 Net investment income (loss) per share is based on average shares outstanding during the period.2 Excluding applicable sales chargesSee Notes to Financial Statements11
| FINANCIAL HIGHLIGHTS |
|
| (For a share outstanding throughout each period) | | Year Ended March 31, |
| |
|
| CLASS I | | 2008 | | 2007 | | 2006 | | 2005 | | 2004 |
|
| Net asset value, beginning of period | | $9.31 | | $8.87 | | $8.27 | | $8.16 | | $6.89 |
|
| Income from investment operations |
| Net investment income (loss) | | 0.20 | | 0.21 | | 0.19 | | 0.16 | | 0.15 |
| Net realized and unrealized gains or losses on investments | | (0.43) | | 0.42 | | 0.59 | | 0.14 | | 1.29 |
| |
|
| Total from investment operations | | (0.23) | | 0.63 | | 0.78 | | 0.30 | | 1.44 |
|
| Distributions to shareholders from |
| Net investment income | | (0.20) | | (0.19) | | (0.18) | | (0.19) | | (0.17) |
| Net realized gains | | (0.63) | | 0 | | 0 | | 0 | | 0 |
| |
|
| Total distributions to shareholders | | (0.83) | | (0.19) | | (0.18) | | (0.19) | | (0.17) |
|
| Net asset value, end of period | | $8.25 | | $9.31 | | $8.87 | | $8.27 | | $8.16 |
|
| Total return | | (3.08%) | | 7.15% | | 9.47% | | 3.74% | | 21.03% |
|
| Ratios and supplemental data |
| Net assets, end of period (millions) | | $ 169 | | $ 204 | | $ 267 | | $ 136 | | $ 216 |
| Ratios to average net assets |
Expenses including waivers/reimbursements
but excluding expense reductions | | 0.69% | | 0.69% | | 0.69% | | 0.70% | | 0.70% |
Expenses excluding waivers/reimbursements
and expense reductions | | 0.73% | | 0.72% | | 0.73% | | 0.70% | | 0.70% |
| Net investment income (loss) | | 2.22% | | 2.33% | | 2.21% | | 2.13% | | 1.91% |
| Portfolio turnover rate | | 91% | | 67% | | 77% | | 103% | | 122% |
|
See Notes to Financial Statements12
| SCHEDULE OF INVESTMENTS | | | | | | |
|
| March 31, 2008 | | | | | | Principal | | | | |
| | | | | | | Amount | | | | Value |
|
| ASSET-BACKED SECURITIES 0.1% | | | | | | |
| Long Beach Asset Holdings Corp., Ser. 2006-2, Class N2, 7.63%, 04/25/2046 | | | | | | |
| 144A | | | | | | $ 1,000,000 | | $ 149,380 |
| Telos CLO, Ltd., Ser. 2006-1A, Class E, FRN, 8.69%, 10/11/2021 144A | | 1,000,000 | | | | 668,870 |
| |
|
| Total Asset-Backed Securities (cost $1,997,513) | | | | | | 818,250 |
| |
|
| COMMERCIAL MORTGAGE-BACKED SECURITIES 0.3% | | | | | | |
| FIXED-RATE 0.2% | | | | | | | | | | |
| GS Mtge. Securities Corp., Ser. 2007-NIM1, Class N2, 8.00%, 08/25/2046 144A | | 2,000,000 | | | | 1,963,920 |
| |
|
| FLOATING-RATE 0.1% | | | | | | | | |
| Structured Adjustable Rate Mtge. Loan Pass-Through Cert., Ser. 2005-9, | | | | | | |
| Class B8, 4.64%, 05/25/2035 | | | | 1,743,849 | | | | 758,975 |
| |
|
| Total Commercial Mortgage-Backed Securities (cost $3,674,705) | | | | | | 2,722,895 |
| |
|
| CORPORATE BONDS 17.1% |
| CONSUMER DISCRETIONARY 0.0% |
| Textiles, Apparel & Luxury Goods 0.0% |
| Oxford Industries, Inc., 8.875%, 06/01/2011 | | 100,000 | | | | 95,500 |
| |
|
| CONSUMER STAPLES 0.1% |
| Household Products 0.1% |
| Church & Dwight Co., 6.00%, 12/15/2012 | | 1,000,000 | | | | 980,000 |
| |
|
| ENERGY 3.7% | | | | | | | | | | |
| Energy Equipment & Services 0.8% |
| Bristow Group, Inc.: | | | | | | | | | | |
| 6.125%, 06/15/2013 | | | | 250,000 | | | | 241,250 |
| 7.50%, 09/15/2017 144A | | | | 7,785,000 | | | | 7,862,850 |
| |
|
| | | | | | | | | | | 8,104,100 |
| |
|
| Oil, Gas & Consumable Fuels 2.9% |
| Ferrellgas Partners, LP, 6.75%, 05/01/2014 | | 250,000 | | | | 245,000 |
| Frontier Oil Corp., 6.625%, 10/01/2011 | | 125,000 | | | | 124,063 |
| McMoRan Exploration Co., 11.875%, 11/15/2014 | | 17,100,000 | | | | 17,356,500 |
| Peabody Energy Corp.: | | | | | | | | | | |
| 5.875%, 04/15/2016 (p) | | | | 9,291,000 | | | | 8,826,450 |
| 6.875%, 03/15/2013 | | | | 170,000 | | | | 173,400 |
| Tesoro Corp., 6.625%, 11/01/2015 | | | | 2,775,000 | | | | 2,580,750 |
| Williams Cos., 7.125%, 09/01/2011 | | 125,000 | | | | 133,437 |
| Williams Partners, LP, 7.25%, 02/01/2017 | | 150,000 | | | | 151,500 |
| |
|
| | | | | | | | | | | 29,591,100 |
| |
|
| FINANCIALS 0.9% | | | | | | | | | | |
| Consumer Finance 0.0% |
| Qwest Capital Funding, Inc., 6.50%, 11/15/2018 | | 250,000 | | | | 203,750 |
| |
|
| Real Estate Investment Trusts 0.9% |
| Saul Centers, Inc., 7.50%, 03/01/2014 | | 10,600,000 | | | | 9,460,500 |
| |
|
See Notes to Financial Statements13
| SCHEDULE OF INVESTMENTS continued | | | | | | |
|
| March 31, 2008 | | Principal | | | | |
| | | Amount | | | | Value |
|
| CORPORATE BONDS continued | | | | | | |
| HEALTH CARE 0.0% | | | | | | |
| Health Care Providers & Services 0.0% | | | | | | |
| Universal Hospital Services, Inc., 8.29%, 06/01/2015 | | $ 13,000 | | $ 11,635 |
| |
|
| INDUSTRIALS 6.7% | | | | | | |
| Aerospace & Defense 0.3% | | | | | | |
| DRS Technologies, Inc., 6.625%, 02/01/2016 | | 2,640,000 | | | | 2,593,800 |
| |
|
| Commercial Services & Supplies 0.0% | | | | | | |
| Allied Waste North America, Inc., 6.375%, 04/15/2011 | | 100,000 | | | | 98,875 |
| |
|
| Electrical Equipment 3.7% | | | | | | |
| Baldor Electric Co., 8.625%, 02/15/2017 | | 24,000,000 | | | | 23,880,000 |
| Belden, Inc., 7.00%, 03/15/2017 | | 2,600,000 | | | | 2,522,000 |
| General Cable Corp., 7.125%, 04/01/2017 (p) | | 12,250,000 | | | | 11,760,000 |
| |
|
| | | | | | | 38,162,000 |
| |
|
| Machinery 2.7% | | | | | | |
| Actuant Corp., 6.875%, 06/15/2017 144A | | 22,353,000 | | | | 22,185,352 |
| SPX Corp., 7.625%, 12/15/2014 144A | | 5,170,000 | | | | 5,331,563 |
| |
|
| | | | | | | 27,516,915 |
| |
|
| Road & Rail 0.0% | | | | | | |
| Avis Budget Car Rental, LLC, 7.625%, 05/15/2014 | | 195,000 | | | | 169,163 |
| |
|
| INFORMATION TECHNOLOGY 1.2% | | | | | | |
| Electronic Equipment & Instruments 0.4% | | | | | | |
| Itron, Inc., 7.75%, 05/15/2012 | | 4,331,000 | | | | 4,197,432 |
| |
|
| IT Services 0.8% | | | | | | |
| Iron Mountain, Inc.: | | | | | | |
| 6.625%, 01/01/2016 (p) | | 7,800,000 | | | | 7,468,500 |
| 8.625%, 04/01/2013 | | 100,000 | | | | 101,500 |
| |
|
| | | | | | | 7,570,000 |
| |
|
| MATERIALS 2.4% | | | | | | |
| Chemicals 0.0% | | | | | | |
| ARCO Chemical Co., 9.80%, 02/01/2020 | | 35,000 | | | | 29,575 |
| MacDermid, Inc., 9.50%, 04/15/2017 144A | | 50,000 | | | | 45,000 |
| Millenium America, Inc., 7.625%, 11/15/2026 | | 25,000 | | | | 16,250 |
| |
|
| | | | | | | 90,825 |
| |
|
| Containers & Packaging 1.9% | | | | | | |
| Crown Holdings, Inc., 7.75%, 11/15/2015 (p) | | 18,925,000 | | | | 19,540,062 |
| |
|
| Metals & Mining 0.5% | | | | | | |
| Freeport-McMoRan Copper & Gold, Inc.: | | | | | | |
| 8.25%, 04/01/2015 | | 70,000 | | | | 74,025 |
| 8.375%, 04/01/2017 | | 75,000 | | | | 79,781 |
| Steel Dynamics, Inc., 7.75%, 04/15/2016 144A | | 4,600,000 | | | | 4,628,750 |
| |
|
| | | | | | | 4,782,556 |
| |
|
See Notes to Financial Statements14
| SCHEDULE OF INVESTMENTS continued |
|
| March 31, 2008 | | Principal | | | | |
| | | Amount | | | | Value |
|
| CORPORATE BONDS continued |
| MATERIALS continued |
| Paper & Forest Products 0.0% |
| Glatfelter, 7.125%, 05/01/2016 | | $ 75,000 | | $ 74,063 |
| |
|
| TELECOMMUNICATION SERVICES 0.0% |
| Wireless Telecommunication Services 0.0% |
| Rural Cellular Corp., 8.25%, 03/15/2012 | | 250,000 | | | | 257,500 |
| |
|
| UTILITIES 2.1% |
| Electric Utilities 1.2% |
| Aquila, Inc., 14.875%, 07/01/2012 | | 150,000 | | | | 185,625 |
| NRG Energy, Inc., 7.25%, 02/01/2014 | | 250,000 | | | | 247,500 |
| Reliant Energy, Inc., 7.625%, 06/15/2014 (p) | | 12,560,000 | | | | 12,528,600 |
| |
|
| | | | | | | 12,961,725 |
| |
|
| Independent Power Producers & Energy Traders 0.9% |
| Dynegy, Inc., 6.875%, 04/01/2011 | | 9,000,000 | | | | 8,887,500 |
| |
|
| Total Corporate Bonds (cost $178,305,973) | | | | 175,349,001 |
| |
|
| WHOLE LOAN MORTGAGE-BACKED COLLATERALIZED |
| MORTGAGE OBLIGATIONS 0.2% |
| FIXED-RATE 0.2% |
| Harborview NIM Corp.: | | | | | | |
| Ser. 2006-07A, Class N2, 8.35%, 09/19/2036 144A | | 390,115 | | | | 402,540 |
| Ser. 2006-12, Class N2, 8.35%, 12/19/2036 144A (s) | | 1,600,000 | | | | 1,589,250 |
| |
|
| Total Whole Loan Mortgage-Backed Collateralized Mortgage Obligations | | | | | | |
| (cost $1,990,115) | | | | | | 1,991,790 |
| |
|
| WHOLE LOAN SUBORDINATE COLLATERALIZED MORTGAGE |
| OBLIGATIONS 0.4% |
| FIXED-RATE 0.2% |
| Banc of America Mtge. Securities, Inc., Ser. 2003-7, Class B-5, 4.75%, 09/25/2018 | | 115,095 | | | | 97,000 |
| Chase Mtge. Fin. Corp., Ser. 2003-S12: | | | | | | |
| Class B-3, 4.89%, 12/25/2018 | | 232,743 | | | | 210,154 |
| Class B-4, 4.89%, 12/26/2018 | | 117,848 | | | | 79,757 |
| Class B-5, 4.89%, 12/25/2018 | | 234,790 | | | | 142,952 |
| Residential Funding Securities Corp., Ser. 2003-RM2, Class B3-2, 6.00%, | | | | | | |
| 05/25/2033 | | 352,120 | | | | 346,577 |
| Wells Fargo Mtge. Backed Securities Trust, Ser. 2006-16, Class B4, 5.00%, | | | | | | |
| 11/25/2036 | | 1,474,496 | | | | 1,391,158 |
| |
|
| | | | | | | 2,267,598 |
| |
|
| FLOATING-RATE 0.2% |
| Banc of America Mtge. Securities, Inc., Ser. 2002-E, Class B-4, 7.14%, 06/20/2031 | | 228,611 | | | | 195,786 |
| Cendant Mtge. Corp., Ser. 2005, Class B-4, 5.45%, 02/18/2035 | | 177,368 | | | | 80,610 |
| Harborview Mtge. Loan Trust, Ser. 2004-7, Class B4, 6.12%, 11/19/2034 | | 599,371 | | | | 441,103 |
| MASTR Reperforming Loan Trust, Ser. 2006-2, Class B4, 5.90%, 05/25/2036 | | 257,778 | | | | 215,030 |
| Merrill Lynch Mtge. Investors, Inc., Ser. 2003-A2, Class 2B2, 5.47%, 03/25/2033 | | 505,475 | | | | 469,732 |
See Notes to Financial Statements15
| SCHEDULE OF INVESTMENTS continued | | | | | | |
|
| March 31, 2008 | | | | Principal | | | | |
| | | | | Amount | | | | Value |
|
| WHOLE LOAN SUBORDINATE COLLATERALIZED MORTGAGE |
| OBLIGATIONS continued |
| FLOATING-RATE continued |
| PHH Mtge. Capital, LLC Mtge. Pass Through Certs.: | | | | | | |
| Ser. 2005-4, Class B4, 5.62%, 07/18/2035 | | $ 264,392 | | $ 248,161 |
| Ser. 2005-5, Class B4, 5.54%, 08/18/2035 | | 332,388 | | | | 309,513 |
| |
|
| | | | | | | | | 1,959,935 |
| |
|
| Total Whole Loan Subordinate Collateralized Mortgage Obligations (cost $4,208,339) | | | | | | | | 4,227,533 |
| |
|
| YANKEE OBLIGATIONS - CORPORATE 0.2% |
| FINANCIALS 0.2% |
| Diversified Financial Services 0.2% |
| Preferred Term Securities XII, Ltd., FRN, 10.00%, 12/24/2033 | | 1,000,000 | | | | 717,720 |
| Preferred Term Securities XIII, Ltd., FRN, 10.00%, 03/24/2034 | | 1,000,000 | | | | 658,040 |
| |
|
| | | | | | | | | 1,375,760 |
| |
|
| MATERIALS 0.0% |
| Metals & Mining 0.0% |
| Novelis, Inc., 7.25%, 02/15/2015 | | 330,000 | | | | 293,700 |
| |
|
| Total Yankee Obligations - Corporate (cost $1,721,129) | | | | 1,669,460 |
| |
|
|
| | | | | Shares | | | | Value |
|
| COMMON STOCKS 73.7% |
| CONSUMER DISCRETIONARY 0.2% |
| Media 0.0% |
| Time Warner, Inc. | | | | 1 | | | | 14 |
| |
|
| Multi-line Retail 0.2% |
| J.C. Penney Co., Inc. | | | | 40,000 | | | | 1,508,400 |
| |
|
| CONSUMER STAPLES 2.8% |
| Beverages 0.9% |
| Diageo plc * | | | | 468,030 | | | | 9,435,843 |
| |
|
| Food & Staples Retailing 0.2% |
| CVS Caremark Corp. | | | | 50,000 | | | | 2,025,500 |
| |
|
| Household Products 0.7% |
| Church & Dwight Co. | | | | 100,000 | | | | 5,424,000 |
| Procter & Gamble Co. | | | | 25,000 | | | | 1,751,750 |
| |
|
| | | | | | | | | 7,175,750 |
| |
|
| Personal Products 1.0% |
| Estee Lauder Cos., Class A | | 225,000 | | | | 10,316,250 |
| |
|
| ENERGY 16.4% |
| Energy Equipment & Services 7.1% |
| Grant Prideco, Inc. * | | | | 180,000 | | | | 8,859,600 |
See Notes to Financial Statements16
| SCHEDULE OF INVESTMENTS continued |
|
| March 31, 2008 | | | | | | | | | | | | |
| | | | | | | | | Shares | | | | Value |
|
| COMMON STOCKS continued |
| ENERGY continued |
| Energy Equipment & Services continued | | | | | | | | | | | | |
| Halliburton Co. | | | | | | | | 260,000 | | $ 10,225,800 |
| Noble Corp. | | | | | | | | 315,000 | | | | 15,646,050 |
| Pride International, Inc. * | | | | | | | | 475,000 | | | | 16,601,250 |
| Schlumberger, Ltd. | | | | | | | | 187,754 | | | | 16,334,598 |
| Transocean, Inc. * | | | | | | | | 33,000 | | | | 4,461,600 |
| |
|
| | | | | | | | | | | | | 72,128,898 |
| |
|
| Oil, Gas & Consumable Fuels 9.3% |
| Anadarko Petroleum Corp. | | | | | | | | 330,000 | | | | 20,799,900 |
| Apache Corp. (p) | | | | | | | | 69,000 | | | | 8,336,580 |
| BP plc, ADR * | | | | | | | | 115,000 | | | | 6,974,750 |
| Exxon Mobil Corp. | | | | | | | | 100,000 | | | | 8,458,000 |
| Marathon Oil Corp. | | | | | | | | 380,000 | | | | 17,328,000 |
| Occidental Petroleum Corp. | | | | | | | | 55,000 | | | | 4,024,350 |
| Patriot Coal Corp. * | | | | | | | | 90,000 | | | | 4,227,300 |
| Peabody Energy Corp. (p) | | | | | | | | 200,000 | | | | 10,200,000 |
| Tesoro Corp. | | | | | | | | 165,000 | | | | 4,950,000 |
| Valero Energy Corp. | | | | | | | | 210,000 | | | | 10,313,100 |
| |
|
| | | | | | | | | | | | | 95,611,980 |
| |
|
| FINANCIALS 3.8% |
| Capital Markets 0.4% |
| Lazard, Ltd. | | | | | | | | 97,000 | | | | 3,705,400 |
| |
|
| Real Estate Investment Trusts 3.4% |
| General Growth Properties, Inc. | | | | | | 155,000 | | | | 5,916,350 |
| Host Hotels & Resorts, Inc. (p) | | 520,000 | | | | 8,278,400 |
| Mack-Cali Realty Corp. | | | | | | | | 175,000 | | | | 6,249,250 |
| Plum Creek Timber Co., Inc. (p) | | 230,000 | | | | 9,361,000 |
| Simon Property Group, Inc. | | | | | | | | 60,000 | | | | 5,574,600 |
| |
|
| | | | | | | | | | | | | 35,379,600 |
| |
|
| HEALTH CARE 10.1% |
| Health Care Equipment & Supplies 2.5% |
| Inverness Medical Innovations, Inc. * (p) | | 500,000 | | | | 15,050,000 |
| Medtronic, Inc. * | | 35,000 | | | | 1,692,950 |
| Varian Medical Systems, Inc. * | | 140,000 | | | | 6,557,600 |
| Zimmer Holdings, Inc. * | | 30,000 | | | | 2,335,800 |
| |
|
| | | | | | | | | | | | | 25,636,350 |
| |
|
| Life Sciences Tools & Services 5.5% |
| Applied Biosystems Group - Applera Corp. | | 180,000 | | | | 5,914,800 |
| Bio-Rad Laboratories, Inc., Class A * | | 40,000 | | | | 3,558,000 |
| Millipore Corp. * (p) | | 130,000 | | | | 8,763,300 |
| PerkinElmer, Inc. | | 500,000 | | | | 12,125,000 |
| Thermo Fisher Scientific, Inc. * | | 465,000 | | | | 26,430,600 |
| |
|
| | | | | | | | | | | | | 56,791,700 |
| |
|
See Notes to Financial Statements17
| SCHEDULE OF INVESTMENTS continued |
|
| March 31, 2008 | | | | | | | | |
| | | | | Shares | | | | Value |
|
| COMMON STOCKS continued |
| HEALTH CARE continued |
| Pharmaceuticals 2.1% |
| Abbott Laboratories * | | | | 50,000 | | $ 2,757,500 |
| Bristol-Myers Squibb Co. * | | | | 400,000 | | | | 8,520,000 |
| Johnson & Johnson | | | | 150,000 | | | | 9,730,500 |
| |
|
| | | | | | | | | 21,008,000 |
| |
|
| INDUSTRIALS 19.1% |
| Aerospace & Defense 3.2% |
| Boeing Co. | | | | 40,000 | | | | 2,974,800 |
| DRS Technologies, Inc. | | | | 130,000 | | | | 7,576,400 |
| Esterline Technologies Corp. * | | 80,000 | | | | 4,029,600 |
| Lockheed Martin Corp. | | | | 90,000 | | | | 8,937,000 |
| Raytheon Co. | | | | 80,000 | | | | 5,168,800 |
| United Technologies Corp. | | | | 65,000 | | | | 4,473,300 |
| |
|
| | | | | | | | | 33,159,900 |
| |
|
| Building Products 0.4% |
| Lennox International, Inc. | | | | 120,000 | | | | 4,316,400 |
| |
|
| Electrical Equipment 5.8% |
| Ametek, Inc. | | | | 30,000 | | | | 1,317,300 |
| Baldor Electric Co. | | | | 80,000 | | | | 2,240,000 |
| Belden, Inc. | | | | 121,000 | | | | 4,273,720 |
| Cooper Industries, Inc. | | | | 335,000 | | | | 13,450,250 |
| Emerson Electric Co. | | | | 150,000 | | | | 7,719,000 |
| General Cable Corp. * (p) | | | | 200,000 | | | | 11,814,000 |
| Rockwell Automation, Inc. | | | | 115,000 | | | | 6,603,300 |
| Roper Industries, Inc. (p) | | | | 195,000 | | | | 11,590,800 |
| |
|
| | | | | | | | | 59,008,370 |
| |
|
| Industrial Conglomerates 1.5% |
| General Electric Co. | | | | 400,000 | | | | 14,804,000 |
| |
|
| Machinery 7.3% |
| Danaher Corp. | | | | 115,000 | | | | 8,743,450 |
| Donaldson Co., Inc. | | | | 135,000 | | | | 5,437,800 |
| Dover Corp. | | | | 150,000 | | | | 6,267,000 |
| Flowserve Corp. | | | | 120,000 | | | | 12,525,600 |
| IDEX Corp. | | | | 20,000 | | | | 613,800 |
| ITT Corp. | | | | 100,000 | | | | 5,181,000 |
| Joy Global, Inc. | | | | 140,000 | | | | 9,122,400 |
| Pall Corp. | | | | 294,929 | | | | 10,343,160 |
| Parker Hannifin Corp. | | | | 86,500 | | | | 5,991,855 |
| SPX Corp. | | | | 100,000 | | | | 10,490,000 |
| |
|
| | | | | | | | | 74,716,065 |
| |
|
| Road & Rail 0.6% | | | | | | | | |
| Norfolk Southern Corp. | | | | 115,000 | | | | 6,246,800 |
| |
|
See Notes to Financial Statements18
| SCHEDULE OF INVESTMENTS continued |
|
| March 31, 2008 | | | | | | | | | | | | |
| | | | | | | | | Shares | | | | Value |
|
| COMMON STOCKS continued |
| INDUSTRIALS continued |
| Trading Companies & Distributors 0.3% |
| Wesco International, Inc. * | | | | | | 90,000 | | $ 3,284,100 |
| |
|
| INFORMATION TECHNOLOGY 4.2% |
| Communications Equipment 0.1% |
| CommScope, Inc. * | | | | | | | | 15,000 | | | | 522,450 |
| |
|
| Electronic Equipment & Instruments 2.2% | | | | | | | | | | | | |
| Agilent Technologies, Inc. * | | | | | | 275,000 | | | | 8,203,250 |
| Amphenol Corp., Class A | | | | | | 275,000 | | | | 10,243,750 |
| Itron, Inc. * - | | | | | | | | 50,000 | | | | 4,511,500 |
| |
|
| | | | | | | | | | | | | 22,958,500 |
| |
|
| Internet Software & Services 1.9% |
| Google, Inc., Class A * | | | | | | 45,000 | | | | 19,821,150 |
| |
|
| MATERIALS 12.4% |
| Chemicals 5.7% |
| Air Products & Chemicals, Inc. | | | | | | 122,864 | | | | 11,303,488 |
| E.I. DuPont de Nemours & Co. (p) | | 415,000 | | | | 19,405,400 |
| FMC Corp. | | | | | | | | 245,000 | | | | 13,595,050 |
| Monsanto Co. | | | | | | | | 80,000 | | | | 8,920,000 |
| Sigma-Aldrich Corp. (p) | | 85,000 | | | | 5,070,250 |
| |
|
| | | | | | | | | | | | | 58,294,188 |
| |
|
| Construction Materials 1.9% |
| Martin Marietta Materials, Inc. (p) | | 50,000 | | | | 5,308,500 |
| Texas Industries, Inc. (p) | | 150,000 | | | | 9,016,500 |
| Vulcan Materials Co. (p) | | 70,000 | | | | 4,648,000 |
| |
|
| | | | | | | | | | | | | 18,973,000 |
| |
|
| Containers & Packaging 0.4% |
| Greif, Inc., Class A | | | | | | | | 60,000 | | | | 4,075,800 |
| |
|
| Metals & Mining 2.2% |
| Barrick Gold Corp. | | | | | | | | 25,000 | | | | 1,086,250 |
| Freeport-McMoRan Copper & Gold, Inc. | | 225,000 | | | | 21,649,500 |
| |
|
| | | | | | | | | | | | | 22,735,750 |
| |
|
| Paper & Forest Products 2.2% |
| Weyerhaeuser Co. (p) | | | | | | 350,000 | | | | 22,764,000 |
| |
|
| UTILITIES 4.7% |
| Electric Utilities 3.5% |
| DPL, Inc. (p) | | | | | | | | 150,000 | | | | 3,846,000 |
| Duke Energy Corp. | | | | | | | | 165,000 | | | | 2,945,250 |
| Exelon Corp. * | | | | | | | | 30,000 | | | | 2,438,100 |
| NRG Energy, Inc. * (p) | | 500,000 | | | | 19,495,000 |
| Southern Co. (p) | | 200,000 | | | | 7,122,000 |
| |
|
| | | | | | | | | | | | | 35,846,350 |
| |
|
See Notes to Financial Statements19
| SCHEDULE OF INVESTMENTS continued |
|
| March 31, 2008 | | | | | | | | |
| | | | | Shares | | | | Value |
|
| COMMON STOCKS continued | | | | | | |
| UTILITIES continued | | | | | | | | |
| Gas Utilities 1.2% | | | | | | | | |
| Questar Corp. | | | | 225,000 | | $ 12,726,000 |
| |
|
| Total Common Stocks (cost $753,650,758) | | | | | | 754,976,508 |
| |
|
|
| | | | | Principal | | | | |
| | | | | Amount | | | | Value |
|
| CONVERTIBLE DEBENTURES 7.3% |
| FINANCIALS 2.2% | | | | | | | | |
| Real Estate Investment Trusts 2.2% | | | | | | |
| Alexandria Real Estate Equities, Inc., 3.70%, 01/15/2027 144A | | $ 6,250,000 | | | | 6,054,688 |
| Macerich Co., 3.25%, 03/15/2012 144A | | 19,250,000 | | | | 16,314,375 |
| |
|
| | | | | | | | | 22,369,063 |
| |
|
| HEALTH CARE 1.8% | | | | | | | | |
| Health Care Equipment & Supplies 1.2% | | | | | | |
| Inverness Medical Innovations, Inc.: | | | | | | |
| 3.00%, 05/15/2016 | | | | 7,598,000 | | | | 7,161,115 |
| 3.00%, 05/15/2016 144A | | | | 6,100,000 | | | | 5,749,250 |
| |
|
| | | | | | | | | 12,910,365 |
| |
|
| Life Sciences Tools & Services 0.6% | | | | | | |
| Millipore Corp., 3.75%, 06/01/2026 | | 6,000,000 | | | | 6,172,500 |
| |
|
| INDUSTRIALS 3.3% | | | | | | | | |
| Electrical Equipment 3.3% | | | | | | | | |
| General Cable Corp., 1.00%, 10/15/2012 144A | | 34,065,000 | | | | 33,766,931 |
| |
|
| Total Convertible Debentures (cost $84,286,548) | | | | | | 75,218,859 |
| |
|
| SHORT-TERM INVESTMENTS 16.8% |
| CORPORATE BONDS 0.8% | | | | | | | | |
| Capital Markets 0.3% | | | | | | | | |
| Carrera Capital Finance, LLC, SIV, FRN, 2.58%, 05/27/2008 (pp) + | | 3,000,000 | | | | 2,993,670 |
| |
|
| Diversified Financial Services 0.5% |
| Premier Asset Collateralized Entity, LLC, SIV, FRN, 2.80%, 05/15/2008 (pp) + | | 5,000,000 | | | | 4,993,990 |
| |
|
| REPURCHASE AGREEMENTS ^ 8.5% | | | | | | |
| Banc of America Securities, LLC, 3.07%, dated 03/31/2008, maturing 04/01/2008, | | | | | | |
| maturity value $11,501,981 (pp) (1) | | 11,501,000 | | | | 11,501,000 |
| BNP Paribas Securities, 3.10%, dated 03/31/2008, maturing 04/01/2008, maturity | | | | | | |
| value $14,630,260 (pp) (2) | | | | 14,629,000 | | | | 14,629,000 |
| Credit Suisse First Boston, LLC, 3.15%, dated 03/31/2008, maturing 04/01/2008, | | | | | | |
| maturity value $11,691,023 (pp) (3) | | 11,690,000 | | | | 11,690,000 |
| Deutsche Bank Securities, Inc., 3.10%, dated 03/31/2008, maturing 04/01/2008, | | | | | | |
| maturity value $9,981,859 (pp) (4) | | 9,981,000 | | | | 9,981,000 |
| Dresdner Kleinwort Wasserstein Securities, LLC, 3.10%, dated 03/31/2008, | | | | | | |
| maturing 04/01/2008, maturity value $9,000,775 (pp) (5) | | 9,000,000 | | | | 9,000,000 |
See Notes to Financial Statements20
| SCHEDULE OF INVESTMENTS continued | | | | | | |
|
| March 31, 2008 | | | | Principal | | | | |
| | | | | Amount | | | | Value |
|
| SHORT-TERM INVESTMENTS continued | | | | | | | | |
| REPURCHASE AGREEMENTS ^ continued | | | | | | | | |
| Greenwich Capital Markets, Inc., 3.10%, dated 03/31/2008, maturing | | | | | | |
| 04/01/2008, maturity value (pp) (6) | | $ 13,000,000 | | $ 13,000,000 |
| JPMorgan Securities, Inc., 3.07%, dated 03/31/2008, maturing 04/01/2008, | | | | | | |
| maturity value $7,000,597 (pp) (7) | | 7,000,000 | | | | 7,000,000 |
| Merrill Lynch Pierce Fenner & Smith, Inc., 3.10%, dated 03/31/2008, maturing | | | | | | | | |
| 04/01/2008, maturity value $10,069,867 (pp) (8) | | 10,069,000 | | | | 10,069,000 |
| |
|
| | | | | | | | | 86,870,000 |
| |
|
|
| | | | | Shares | | | | Value |
|
| MUTUAL FUND SHARES 7.5% | | | | | | | | |
| BGI Prime Money Market Fund, Premium Shares, 3.15% q (pp) | | 10,952,000 | | | | 10,952,000 |
| BlackRock Liquidity TempFund, Institutional Class, 3.25% q (pp) | | 9,562,000 | | | | 9,562,000 |
| Evergreen Institutional U.S. Government Money Market Fund, Class I, | | | | | | |
| 2.24% q ø | | | | 11,715,605 | | | | 11,715,605 |
| Evergreen Institutional Money Market Fund, Class I, 3.27% q ø (pp) | | 28,000,000 | | | | 28,000,000 |
| Morgan Stanley Institutional Liquidity Fund Money Market Portfolio, Institutional |
| Class, 3.31% q (pp) | | | | 17,000,343 | | | | 17,000,343 |
| |
|
| | | | | | | | | 77,229,948 |
| |
|
| Total Short-Term Investments (cost $172,099,842) | | | | | | 172,087,608 |
| |
|
| Total Investments (cost $1,201,934,922) 116.1% | | | | | | | | 1,189,061,904 |
| Other Assets and Liabilities (16.1%) | | | | | | | | (164,753,720) |
| |
|
| Net Assets 100.0% | | | | | | $ 1,024,308,184 |
| |
|
| 144A | | Security that may be sold to qualified institutional buyers under Rule 144A of the Securities Act of 1933, as amended. |
| | | This security has been determined to be liquid under guidelines established by the Board of Trustees, unless otherwise |
| | | noted. |
| (p) | | All or a portion of this security is on loan. |
| (s) | | Security is valued at fair value as determined by the investment advisor in good faith, according to procedures approved |
| | | by the Board of Trustees. |
| * | | Non-income producing security |
| + | | Security is deemed illiquid and is valued using market quotations when readily available, unless otherwise noted. |
| (pp) | | All or a portion of this security represents investment of cash collateral received from securities on loan. |
| q | | Rate shown is the 7-day annualized yield at period end. |
| ø | | Evergreen Investment Management Company, LLC is the investment advisor to both the Fund and the money market |
| | | fund. |
See Notes to Financial Statements21
SCHEDULE OF INVESTMENTS continued
March 31, 2008
| ^ | | Collateral is pooled with the collateral of other Evergreen funds and allocated on a pro rata basis consisting of: |
| | | (1) investment grade corporate bonds, 2.88% to 8.60%, 10/15/2008 to 06/01/2065, value including accrued interest is |
| | | $11,731,020. |
| | | (2) investment grade corporate bonds, 5.30% to 8.25%, 10/28/2015 to 06/01/2032, value including accrued interest is |
| | | $14,921,580. |
| | | (3) investment grade corporate bonds, 7.375% to 8.00%, 06/15/2010 to 03/15/2038, value including accrued interest |
| | | is $11,923,805. |
| | | (4) high grade CMOs, 2.84% to 6.15%, 09/15/2021 to 02/15/2051, value including accrued interest is $8,549,458; |
| | | investment grade CMO, 4.04%, 04/25/2034, value including accrued interest is $1,631,162. |
| | | (5) investment grade corporate bonds, 5.70% to 8.75%, 02/15/2017 to 03/01/2031, value including accrued interest is |
| | | $502,021; high grade asset-backed securities 2.97% to 3.41% 05/25/2035 to 08/25/2046, value including accrued |
| | | interest is $5,457,959; high grade CMOs, 3.21% to 5.22% 07/15/2035 to 08/25/2046, value including accrued |
| | | interest is $3,220,403. |
| | | (6) agency mortgage-backed security, 5.00%, 03/01/2038, value including accrued interest is $13,260,323. |
| | | (7) investment grade commercial paper, 0.02% to 0.19%, 04/01/2008 to 06/20/2008, value including accrued interest |
| | | is $7,140,166. |
| | | (8) investment grade corporate bonds, 0.00% to 7.15%, 08/15/2013 to 06/01/2037, value including accrued interest is |
| | | $10,270,408. |
| Summary of Abbreviations |
| ADR | | American Depository Receipt | | MASTR | | Mortgage Asset Securitization Transactions, Inc. |
| CLO | | Collateralized Loan Obligation | | NIM | | Net Interest Margin |
| CMO | | Collateralized Mortgage Obligation | | SIV | | Structured Investment Vehicle |
| FRN | | Floating Rate Note | | | | |
The following table shows portfolio composition as a percent of total investments as of March 31, 2008:
| Industrials | | 25.0% | | Information Technology | | 4.6% |
| Energy | | 17.3% | | Consumer Staples | | 2.5% |
| Materials | | 12.8% | | Mortgage-Backed Securities | | 0.8% |
| Health Care | | 10.3% | | Consumer Discretionary | | 0.1% |
| Repurchase Agreements | | 7.3% | | Asset-Backed Securities | | 0.1% |
| Financials | | 6.9% | | Cash Equivalents | | 6.5% |
| Utilities | | 5.8% | | | |
|
| | | | | | | 100.0% |
| | | | | | |
|
The following table shows the percent of total bonds (excluding collateral for securities on loan) by credit quality based on Moody’s and Standard & Poor’s ratings as of March 31, 2008 (unaudited):
| AAA | | 1.4% |
| BBB | | 2.2% |
| BB | | 29.3% |
| B | | 51.6% |
| CCC | | 6.8% |
| NR | | 8.7% |
| |
|
| | | 100.0% |
| | |
|
The following table shows the percent of total bonds (excluding collateral for securities on loan) based on effective maturity as of March 31, 2008 (unaudited):
| Less than 1 year | | 4.5% |
| 1 to 3 year(s) | | 0.3% |
| 3 to 5 years | | 29.6% |
| 5 to 10 years | | 64.6% |
| 10 to 20 years | | 0.4% |
| 20 to 30 years | | 0.5% |
| Greater than 30 years | | 0.1% |
| |
|
| | | 100.0% |
| | |
|
See Notes to Financial Statements22
| STATEMENT OF ASSETS AND LIABILITIES | | | | |
|
| March 31, 2008 | | | | |
|
| Assets | | | | |
| Investments in securities, at value (cost $1,162,219,317) including |
| $157,209,652 of securities loaned | | $ 1,149,346,299 |
| Investments in affiliated money market fund, at value (cost $39,715,605) | | 39,715,605 |
|
| Total investments | | | | 1,189,061,904 |
| Cash | | | | 1,446 |
| Foreign currency, at value (cost $193,947) | | | | 187,997 |
| Receivable for securities sold | | | | 7,834,352 |
| Principal paydown receivable | | | | 14,558 |
| Receivable for Fund shares sold | | | | 232,998 |
| Dividends and interest receivable | | | | 5,366,057 |
| Receivable for securities lending income | | | | 38,345 |
| Receivable from investment advisor | | | | 13,940 |
| Prepaid expenses and other assets | | | | 106,591 |
|
| Total assets | | | | 1,202,858,188 |
|
| Liabilities | | | | |
| Payable for securities purchased | | | | 16,227,612 |
| Payable for Fund shares redeemed | | | | 1,474,783 |
| Payable for securities on loan | | | | 160,384,237 |
| Due to related parties | | | | 35,856 |
| Accrued expenses and other liabilities | | | | 427,516 |
|
| Total liabilities | | | | 178,550,004 |
|
| Net assets | | $ 1,024,308,184 |
|
| Net assets represented by | | | | |
| Paid-in capital | | $ 970,790,829 |
| Undistributed net investment income | | | | 1,859,575 |
| Accumulated net realized gains on investments | | | | 64,537,313 |
| Net unrealized losses on investments | | | | (12,879,533) |
|
| Total net assets | | $ 1,024,308,184 |
|
| Net assets consists of | | | | |
| Class A | | $ 741,701,096 |
| Class B | | | | 52,813,934 |
| Class C | | | | 61,029,168 |
| Class I | | | | 168,763,986 |
|
| Total net assets | | $ 1,024,308,184 |
|
| Shares outstanding (unlimited number of shares authorized) |
| Class A | | | | 89,537,581 |
| Class B | | | | 6,373,155 |
| Class C | | | | 7,365,794 |
| Class I | | | | 20,462,111 |
|
| Net asset value per share |
| Class A | | $ 8.28 |
| Class A — Offering price (based on sales charge of 5.75%) | | $ 8.79 |
| Class B | | $ 8.29 |
| Class C | | $ 8.29 |
| Class I | | $ 8.25 |
|
See Notes to Financial Statements23
| STATEMENT OF OPERATIONS | | | | |
|
| Year Ended March 31, 2008 | | | | |
|
| Investment income | | | | |
| Interest | | $ 17,428,319 |
| Dividends (net of foreign withholding taxes of $8,797) | | | | 14,661,939 |
| Income from affiliate | | | | 2,630,556 |
| Securities lending | | | | 232,532 |
|
| Total investment income | | | | 34,953,346 |
|
| Expenses | | | | |
| Advisory fee | | | | 4,217,610 |
| Distribution Plan expenses | | | | |
| Class A | | | | 2,565,200 |
| Class B | | | | 779,956 |
| Class C | | | | 693,494 |
| Administrative services fee | | | | 1,190,873 |
| Transfer agent fees | | | | 2,620,482 |
| Trustees’ fees and expenses | | | | 26,119 |
| Printing and postage expenses | | | | 195,102 |
| Custodian and accounting fees | | | | 315,272 |
| Registration and filing fees | | | | 58,659 |
| Professional fees | | | | 69,610 |
| Other | | | | 28,262 |
|
| Total expenses | | | | 12,760,639 |
| Less: Expense reductions | | | | (36,501) |
| Fee waivers and expense reimbursements | | | | (724,088) |
|
| Net expenses | | | | 12,000,050 |
|
| Net investment income | | | | 22,953,296 |
|
| Net realized and unrealized gains or losses on investments |
| Net realized gains on: | | | | |
| Securities | | | | 182,642,990 |
| Foreign currency related transactions | | | | 2,092,551 |
|
| Net realized gains on investments | | | | 184,735,541 |
| Net change in unrealized gains or losses on investments | | | | (237,474,189) |
|
| Net realized and unrealized gains or losses on investments | | | | (52,738,648) |
|
| Net decrease in net assets resulting from operations | | $ (29,785,352) |
|
See Notes to Financial Statements24
| STATEMENTS OF CHANGES IN NET ASSETS |
|
| | | Year Ended March 31, |
| |
|
| | | 2008 | | 2007 |
|
| Operations | | | | | | | | |
| Net investment income | | $ 22,953,296 | | $ 27,473,243 |
| Net realized gains on investments | | | | 184,735,541 | | | | 72,197,672 |
| Net change in unrealized gains or | | | | | | | | |
| losses on investments | | | | (237,474,189) | | | | (10,126,762) |
|
| Net increase (decrease) in net assets | | | | | | | | |
| resulting from operations | | | | (29,785,352) | | | | 89,544,153 |
|
| Distributions to shareholders from | | | | | | | | |
| Net investment income | | | | | | | | |
| Class A | | | | (16,087,492) | | | | (16,348,443) |
| Class B | | | | (832,482) | | | | (1,331,154) |
| Class C | | | | (802,901) | | | | (800,868) |
| Class I | | | | (4,218,960) | | | | (4,703,494) |
| Net realized gains | | | | | | | | |
| Class A | | | | (55,487,193) | | | | 0 |
| Class B | | | | (4,676,359) | | | | 0 |
| Class C | | | | (4,530,378) | | | | 0 |
| Class I | | | | (12,803,118) | | | | 0 |
|
| Total distributions to shareholders | | | | (99,438,883) | | | | (23,183,959) |
|
| | | Shares | | | | Shares | | |
| Capital share transactions | | | | | | | | |
| Proceeds from shares sold | | | | | | | | |
| Class A | | 2,116,695 | | 19,902,655 | | 2,119,543 | | 19,080,040 |
| Class B | | 532,856 | | 4,956,924 | | 471,633 | | 4,240,528 |
| Class C | | 520,490 | | 4,863,135 | | 182,729 | | 1,655,975 |
| Class I | | 1,064,046 | | 9,901,068 | | 1,864,268 | | 16,757,756 |
|
| | | | | 39,623,782 | | | | 41,734,299 |
|
| Net asset value of shares issued in | | | | | | | | |
| reinvestment of distributions | | | | | | | | |
| Class A | | 7,239,013 | | 65,620,160 | | 1,613,664 | | 14,480,105 |
| Class B | | 572,291 | | 5,181,260 | | 138,394 | | 1,233,098 |
| Class C | | 526,431 | | 4,762,420 | | 79,923 | | 715,084 |
| Class I | | 1,631,060 | �� | 14,726,202 | | 429,402 | | 3,840,826 |
|
| | | | | 90,290,042 | | | | 20,269,113 |
|
| Automatic conversion of Class B | | | | | | | | |
| shares to Class A shares | | | | | | | | |
| Class A | | 3,235,924 | | 30,201,711 | | 5,532,709 | | 49,797,284 |
| Class B | | (3,238,010) | | (30,201,711) | | (5,538,866) | | (49,797,284) |
|
| | | | | 0 | | | | 0 |
|
| Payment for shares redeemed | | | | | | | | |
| Class A | | (19,268,621) | | (180,470,631) | | (23,806,029) | | (214,837,395) |
| Class B | | (2,578,454) | | (24,092,859) | | (5,318,014) | | (47,747,034) |
| Class C | | (1,375,052) | | (12,773,890) | | (2,096,525) | | (18,928,756) |
| Class I | | (4,087,568) | | (37,792,983) | | (10,552,271) | | (95,524,914) |
|
| | | | | (255,130,363) | | | | (377,038,099) |
|
| Net decrease in net assets resulting | | | | | | | | |
| from capital share transactions | | | | (125,216,539) | | | | (315,034,687) |
|
| Total decrease in net assets | | | | (254,440,774) | | | | (248,674,493) |
| Net assets | | | | | | | | |
| Beginning of period | | | | 1,278,748,958 | | | | 1,527,423,451 |
|
| End of period | | $ 1,024,308,184 | | $ 1,278,748,958 |
|
| Undistributed net investment income | | $ 1,859,575 | | $ 1,370,367 |
|
See Notes to Financial Statements25
NOTES TO FINANCIAL STATEMENTS
1. ORGANIZATION
Evergreen Balanced Fund (the “Fund”) is a diversified series of Evergreen Equity Trust (the “Trust”), a Delaware statutory trust organized on September 18, 1997. The Trust is an open-end management investment company registered under the Investment Company Act of 1940, as amended (the “1940 Act”).
The Fund offers Class A, Class B, Class C and Class I shares. Class A shares are sold with a front-end sales charge. However, Class A share investments of $1 million or more are not subject to a front-end sales charge but are subject to a contingent deferred sales charge of 1.00% upon redemption within 18 months. Class B shares are sold without a front-end sales charge but are subject to a contingent deferred sales charge that is payable upon redemption and decreases depending on how long the shares have been held. Class C shares are sold without a front-end sales charge but are subject to a contingent deferred sales charge that is payable upon redemption within one year. Class I shares are sold without a front-end sales charge or contingent deferred sales charge. Each class of shares, except Class I shares, pays an ongoing distribution fee.
2. SIGNIFICANT ACCOUNTING POLICIES
The following is a summary of significant accounting policies consistently followed by the Fund in the preparation of its financial statements. The policies are in conformity with generally accepted accounting principles in the United States of America, which require management to make estimates and assumptions that affect amounts reported herein. Actual results could differ from these estimates.
a. Valuation of investments
Listed equity securities are usually valued at the last sales price or official closing price on the national securities exchange where the securities are principally traded.
Foreign securities traded on an established exchange are valued at the last sales price on the exchange where the security is primarily traded. If there has been no sale, the securities are valued at the mean between bid and asked prices. Foreign securities may be valued at fair value according to procedures approved by the Board of Trustees if the closing price is not reflective of current market values due to trading or events occurring in the foreign markets between the close of the established exchange and the valuation time of the Fund. In addition, substantial changes in values in the U.S. markets subsequent to the close of a foreign market may also affect the values of securities traded in the foreign market. The value of foreign securities may be adjusted if such movements in the U.S. market exceed a specified threshold.
Portfolio debt securities acquired with more than 60 days to maturity are fair valued using matrix pricing methods determined by an independent pricing service which takes into consideration such factors as similar security prices, yields, maturities, liquidity and ratings. Securities for which valuations are not readily available from an independent pricing service may be valued by brokers which use prices provided by market makers or estimates of market value obtained from yield data relating to investments or securities with similar characteristics.
26
NOTES TO FINANCIAL STATEMENTS continued
Short-term securities with remaining maturities of 60 days or less at the time of purchase are valued at amortized cost, which approximates market value.
Investments in open-end mutual funds are valued at net asset value. Securities for which market quotations are not readily available or not reflective of current market value are valued at fair value as determined by the investment advisor in good faith, according to procedures approved by the Board of Trustees.
b. Repurchase agreements
Securities pledged as collateral for repurchase agreements are held by the custodian bank or in a segregated account in the Fund’s name until the agreements mature. Collateral for certain tri-party repurchase agreements is held at the counterparty’s custodian in a segregated account for the benefit of the Fund and the counterparty. Each agreement requires that the market value of the collateral be sufficient to cover payments of interest and principal. However, in the event of default or bankruptcy by the other party to the agreement, retention of the collateral may be subject to legal proceedings. The Fund will only enter into repurchase agreements with banks and other financial institutions, which are deemed by the investment advisor to be creditworthy pursuant to guidelines established by the Board of Trustees. In certain instances, the Fund’s securities lending agent may provide collateral in the form of repurchase agreements.
c. Foreign currency translation
All assets and liabilities denominated in foreign currencies are translated into U.S. dollar amounts at the date of valuation. Purchases and sales of portfolio securities and income items denominated in foreign currencies are translated into U.S. dollar amounts on the respective dates of such transactions. The Fund does not separately account for that portion of the results of operations resulting from changes in foreign exchange rates on investments and the fluctuations arising from changes in market prices of securities held. Such fluctuations are included with the net realized and unrealized gains or losses on investments.
d. Forward foreign currency contracts
A forward foreign currency contract is an agreement between two parties to purchase or sell a specific currency for an agreed-upon price at a future date. The Fund enters into forward foreign currency contracts to facilitate transactions in foreign-denominated securities and to attempt to minimize the risk to the Fund from adverse changes in the relationship between currencies. Forward foreign currency contracts are recorded at the forward rate and marked-to-market daily. When the contracts are closed, realized gains and losses arising from such transactions are recorded as realized gains or losses on foreign currency related transactions. The Fund could be exposed to risks if the counterparties to the contracts are unable to meet the terms of their contracts or if the value of the foreign currency changes unfavorably.
e. When-issued and delayed delivery transactions
The Fund records when-issued or delayed delivery securities as of trade date and maintains security positions such that sufficient liquid assets will be available to make payment for the securities purchased. Securities purchased on a when-issued or delayed delivery basis are marked-to-market
27
NOTES TO FINANCIAL STATEMENTS continued
daily and begin earning interest on the settlement date. Losses may occur on these transactions due to changes in market conditions or the failure of counterparties to perform under the contract.
f. Securities lending
The Fund may lend its securities to certain qualified brokers in order to earn additional income. The Fund receives compensation in the form of fees or interest earned on the investment of any cash collateral received. The Fund also continues to receive interest and dividends on the securities loaned. The Fund receives collateral in the form of cash or securities with a market value at least equal to the market value of the securities on loan, including accrued interest. In the event of default or bankruptcy by the borrower, the Fund could experience delays and costs in recovering the loaned securities or in gaining access to the collateral. The Fund has the right under the lending agreement to recover the securities from the borrower on demand.
g. Dollar roll transactions
The Fund may enter into dollar roll transactions with respect to mortgage-backed securities. In a dollar roll transaction, the Fund sells mortgage-backed securities to financial institutions and simultaneously agrees to accept substantially similar (same type, coupon and maturity) securities at a later date at an agreed upon price. The Fund will use the proceeds generated from the transactions to invest in short-term investments, which may enhance the Fund’s current yield and total return. The Fund accounts for dollar roll transactions as purchases and sales. The Fund could be exposed to risks if the counterparty defaults on its obligation to perform under the terms of the agreement, if the Fund receives inferior securities in comparison to what was sold to the coun-terparty at redelivery or if there are variances in paydown speed between the mortgage-related pools.
h. Total return swaps
The Fund may enter into total return swap contracts. Total return swaps involve commitments to pay interest in exchange for a market-linked return, both based on notional amounts. To the extent the total return of the security or index underlying the transaction exceeds or falls short of the offsetting interest rate obligation, the Fund will receive a payment from, or make a payment to, the counterparty.
The value of the swap contract is marked-to-market daily based upon quotations from an independent pricing service or market makers and any change in value is recorded as an unrealized gain or loss. Periodic payments made or received are recorded as realized gains or losses. The Fund could be exposed to risks if the counterparty defaults on its obligation to perform, or if there are unfavorable changes in the fluctuation of interest rates or in the price of the underlying security or index.
i. Security transactions and investment income
Security transactions are recorded on trade date. Realized gains and losses are computed using the specific cost of the security sold. Interest income is recorded on the accrual basis and includes accretion of discounts and amortization of premiums. Dividend income is recorded on the ex-
28
NOTES TO FINANCIAL STATEMENTS continued
dividend date or in the case of some foreign securities, on the date when the Fund is made aware of the dividend. Foreign income and capital gains realized on some securities may be subject to foreign taxes, which are accrued as applicable.
j. Federal and other taxes
The Fund intends to continue to qualify as a regulated investment company and distribute all of its taxable income, including any net capital gains (which have already been offset by available capital loss carryovers). Accordingly, no provision for federal taxes is required. The Fund has adopted the provisions of FASB Interpretation No. 48, Accounting for Uncertainty in Income Taxes (“FIN 48”) which prescribes a minimum threshold for financial statement recognition of the benefit of a tax position taken or expected to be taken in a tax return. The Fund’s financial statements have not been impacted by the adoption of FIN 48. The Fund’s income and excise tax returns and all financial records supporting those returns are subject to examination by the federal, Massachusetts and Delaware revenue authorities for all taxable years beginning after March 31, 2004.
k. Distributions
Distributions to shareholders from net investment income and net realized gains, if any, are recorded on the ex-dividend date. Such distributions are determined in conformity with income tax regulations, which may differ from generally accepted accounting principles.
Reclassifications have been made to the Fund’s components of net assets to reflect income and gains available for distribution (or available capital loss carryovers, as applicable) under income tax regulations. The primary permanent differences causing such reclassifications are due to net realized foreign currency gains or losses and certain distributions received from litigation proceeds. During the year ended March 31, 2008, the following amounts were reclassified:
|
| Undistributed net investment income | | $ (522,253) |
| Accumulated net realized gains on investments | | 522,253 |
|
l. Class allocations
Income, common expenses and realized and unrealized gains and losses are allocated to the classes based on the relative net assets of each class. Distribution fees, if any, are calculated daily at the class level based on the appropriate net assets of each class and the specific expense rates applicable to each class.3. ADVISORY FEE AND OTHER TRANSACTIONS WITH AFFILIATES
Evergreen Investment Management Company, LLC (“EIMC”), an indirect, wholly-owned subsidiary of Wachovia Corporation (“Wachovia”), is the investment advisor to the Fund and is paid a fee at an annual rate of 1.5% of the Fund’s gross investment income plus an amount determined by applying percentage rates to the aggregate average daily net assets of the Fund and its variable annuity counterpart, Evergreen VA Balanced Fund, starting at 0.41% and declining to 0.21% as the aggregate average daily net assets of the Fund and its variable annuity counterpart
29
NOTES TO FINANCIAL STATEMENTS continued
increase. For the year ended March 31, 2008, the advisory fee was equivalent to 0.35% of the Fund’s average daily net assets.
From time to time, EIMC may voluntarily or contractually waive its fee and/or reimburse expenses in order to limit operating expenses. During the year ended March 31, 2008, EIMC contractually and voluntarily waived its advisory fee in the amounts of $11,728 and $418,979, respectively. In addition, EIMC voluntarily reimbursed Distribution Plan expenses (see Note 4) relating to Class A shares in the amount of $293,381.
The Fund may invest in money market funds which are advised by EIMC. Income earned on these investments is included in income from affiliate on the Statement of Operations.
Effective January 1, 2008, EIMC replaced Evergreen Investment Services, Inc. (“EIS”), an indirect, wholly-owned subsidiary of Wachovia, as the administrator to the Fund upon the assignment of the Fund’s Administrative Services Agreement from EIS to EIMC. There were no changes to the services being provided or fees being paid by the Fund. The administrator provides the Fund with facilities, equipment and personnel and is paid an annual rate determined by applying percentage rates to the aggregate average daily net assets of the Evergreen funds (excluding money market funds and Evergreen Institutional Enhanced Income Fund), starting at 0.10% and declining to 0.05% as the aggregate average daily net assets of the Evergreen funds (excluding money market funds and Evergreen Institutional Enhanced Income Fund) increase.
Evergreen Service Company, LLC (“ESC”), an indirect, wholly-owned subsidiary of Wachovia, is the transfer and dividend disbursing agent for the Fund. ESC receives account fees that vary based on the type of account held by the shareholders in the Fund. For the year ended March 31, 2008, the transfer agent fees were equivalent to an annual rate of 0.22% of the Fund’s average daily net assets.
Wachovia Bank NA, through its securities lending division of Wachovia Global Securities Lending, acts as the securities lending agent for the Fund.
The Fund has placed a portion of its portfolio transactions with brokerage firms that are affiliates of Wachovia. During the year ended March 31, 2008, the Fund paid brokerage commissions of $244,126 to Wachovia Securities, LLC.
4. DISTRIBUTION PLANS
EIS serves as distributor of the Fund’s shares. The Fund has adopted Distribution Plans, as allowed by Rule 12b-1 of the 1940 Act, for each class of shares, except Class I. Under the Distribution Plans, distribution fees were paid at an annual rate of 0.30% of the average daily net assets for Class A shares and 1.00% of the average daily net assets for each of Class B and Class C shares.
For the year ended March 31, 2008, EIS received $26,212 from the sale of Class A shares and $176, $116,694 and $1,976 in contingent deferred sales charges from redemptions of Class A, Class B and Class C shares, respectively.
30
NOTES TO FINANCIAL STATEMENTS continued
5. INVESTMENT TRANSACTIONS
Cost of purchases and proceeds from sales of investment securities (excluding short-term securities) were as follows for the year ended March 31, 2008:
| Cost of Purchases | | Proceeds from Sales |
|
| U.S. | | Non-U.S. | | U.S. | | Non-U.S. |
| Government | | Government | | Government | | Government |
|
| $68,153,585 | | $982,893,003 | | $215,884,093 | | $1,028,500,454 |
|
During the year ended March 31, 2008, the Fund loaned securities to certain brokers and earned $1,075 in affiliated income relating to securities lending activity which is included in income from affiliate on the Statement of Operations. At March 31, 2008, the value of securities on loan and the total value of collateral received for securities loaned amounted to $157,209,652 and $160,384,237, respectively.On March 31, 2008, the aggregate cost of securities for federal income tax purposes was $1,202,067,517. The gross unrealized appreciation and depreciation on securities based on tax cost was $70,644,506 and $83,650,119, respectively, with a net unrealized depreciation of $13,005,613.
As of March 31, 2008, the Fund had $20,337,192 in capital loss carryovers for federal income tax purposes with $15,320,915 expiring in 2010 and $5,016,277 expiring in 2011.
These losses are subject to certain limitations prescribed by the Internal Revenue Code. Utilization of these capital loss carryovers was limited during the year ended March 31, 2008 in accordance with income tax regulations.
6. INTERFUND LENDING
Pursuant to an Exemptive Order issued by the SEC, the Fund may participate in an interfund lending program with certain funds in the Evergreen fund family. This program allows the Fund to borrow from, or lend money to, other participating funds. During the year ended March 31, 2008, the Fund did not participate in the interfund lending program.
7. DISTRIBUTIONS TO SHAREHOLDERS
As of March 31, 2008, the components of distributable earnings on a tax basis were as follows:
| Undistributed | | Undistributed | | | | | | Temporary |
| Ordinary | | Long-term | | Unrealized | | Capital Loss | | Book/Tax |
| Income | | Capital Gain | | Depreciation | | Carryovers | | Differences |
|
| $2,077,423 | | $85,007,100 | | $13,012,128 | | $20,337,192 | | $(217,848) |
|
The differences between the components of distributable earnings on a tax basis and the amounts reflected in the Statement of Assets and Liabilities are primarily due to wash sales and passive foreign investment companies. The temporary book/tax differences are a result of timing differences between book and tax recognition of income and/or expenses.31
NOTES TO FINANCIAL STATEMENTS continued
The tax character of distributions paid was as follows:
| | | Year Ended March 31, |
| |
|
| | | 2008 | | 2007 |
|
| Ordinary Income | | $ 21,941,835 | | $ 23,183,959 |
| Long-term Capital Gain | | 77,497,048 | | 0 |
|
8. EXPENSE REDUCTIONS
Through expense offset arrangements with ESC and the Fund’s custodian, a portion of fund expenses has been reduced.9. DEFERRED TRUSTEES’ FEES
Each Trustee of the Fund may defer any or all compensation related to performance of his or her duties as a Trustee. The Trustees’ deferred balances are allocated to deferral accounts, which are included in the accrued expenses for the Fund. The investment performance of the deferral accounts is based on the investment performance of certain Evergreen funds. Any gains earned or losses incurred in the deferral accounts are reported in the Fund’s Trustees’ fees and expenses. At the election of the Trustees, the deferral account will be paid either in one lump sum or in quarterly installments for up to ten years.
10. FINANCING AGREEMENT
The Fund and certain other Evergreen funds share in an unsecured revolving credit commitment for temporary and emergency purposes, including the funding of redemptions, as permitted by each participating fund’s borrowing restrictions. Borrowings under this facility bear interest at 0.50% per annum above the Federal Funds rate. All of the participating funds are charged an annual commitment fee on the unused balance, which is allocated pro rata. The credit facility is for $100 million with an annual commitment fee of 0.08% . During the year ended March 31, 2008, the Fund had no borrowings.
11. REGULATORY MATTERS AND LEGAL PROCEEDINGS
Pursuant to an administrative order issued by the SEC on September 19, 2007, EIMC, EIS, ESC (collectively, the “Evergreen Entities”), Wachovia Securities, LLC and the SEC have entered into an agreement settling allegations of (i) improper short-term trading arrangements in effect prior to May 2003 involving former officers and employees of EIMC and certain broker-dealers, (ii) insufficient systems for monitoring exchanges and enforcing exchange limitations as stated in certain funds’ prospectuses, and (iii) inadequate e-mail retention practices. Under the settlement, the Evergreen Entities were censured and have paid approximately $32 million in disgorgement and penalties. This amount, along with a fine assessed by the SEC against Wachovia Securities, LLC will be distributed pursuant to a plan to be developed by an independent distribution consultant and approved by the SEC. The Evergreen Entities neither admitted nor denied the allegations and findings set forth in its settlement with the SEC.
32
NOTES TO FINANCIAL STATEMENTS continued
In addition, the Evergreen funds and EIMC and certain of its affiliates are involved in various legal actions, including private litigation and class action lawsuits. EIMC does not expect that any of such legal actions currently pending or threatened will have a material adverse impact on the financial position or operations of any of the Evergreen funds or on EIMC’s ability to provide services to the Evergreen funds.
Although EIMC believes that none of the matters discussed above will have a material adverse impact on the Evergreen funds, there can be no assurance that these matters and any publicity surrounding or resulting from them will not result in reduced sales or increased redemptions of Evergreen fund shares, which could increase Evergreen fund transaction costs or operating expenses, or that they will not have other adverse consequences on the Evergreen funds.
12. NEW ACCOUNTING PRONOUNCEMENTS
In September 2006, FASB issued Statement of Financial Accounting Standards No. 157, Fair Value Measurements (“FAS 157”). FAS 157 establishes a single authoritative definition of fair value, establishes a framework for measuring fair value and expands disclosures about fair value measurements. FAS 157 applies to fair value measurements already required or permitted by existing standards. The change to current generally accepted accounting principles from the application of FAS 157 relates to the definition of fair value, the methods used to measure fair value, and the expanded disclosures about fair value measurements. Management of the Fund does not believe the adoption of FAS 157 will materially impact the financial statement amounts, however, additional disclosures may be required about the inputs used to develop the measurements and the effect of certain of the measurements on changes in net assets for the period. FAS 157 is effective for financial statements issued for fiscal years beginning after November 15, 2007 and interim periods within those fiscal years.
In March 2008, FASB issued Statement of Financial Accounting Standards No. 161, Disclosures about Derivative Instruments and Hedging Activities (“FAS 161”), an amendment of FASB Statement No. 133. FAS 161 requires enhanced disclosures about (a) how and why a fund uses derivative instruments, (b) how derivative instruments and hedging activities are accounted for, and (c) how derivative instruments and related hedging activities affect a fund’s financial position, financial performance, and cash flows. Management of the Fund does not believe the adoption of FAS 161 will materially impact the financial statement amounts, but will require additional disclosures. This will include qualitative and quantitative disclosures on derivative positions existing at period end and the effect of using derivatives during the reporting period. FAS 161 is effective for financial statements issued for fiscal years and interim periods beginning after November 15, 2008.
33
REPORT OF INDEPENDENT REGISTERED PUBLIC ACCOUNTING FIRM
Board of Trustees and Shareholders
Evergreen Equity Trust
We have audited the accompanying statement of assets and liabilities, including the schedule of investments, of the Evergreen Balanced Fund, a series of the Evergreen Equity Trust, as of March 31, 2008 and the related statement of operations for the year then ended, statements of changes in net assets for each of the years in the two-year period then ended and the financial highlights for each of the years in the five-year period then ended. These financial statements and financial highlights are the responsibility of the Fund’s management. Our responsibility is to express an opinion on these financial statements and financial highlights based on our audits.
We conducted our audits in accordance with the standards of the Public Company Accounting Oversight Board (United States). Those standards require that we plan and perform the audit to obtain reasonable assurance about whether the financial statements and financial highlights are free of material misstatement. An audit includes examining, on a test basis, evidence supporting the amounts and disclosures in the financial statements. Our procedures included confirmation of securities owned as of March 31, 2008 by correspondence with the custodian and brokers, or by other appropriate auditing procedures where replies from brokers were not received. An audit also includes assessing the accounting principles used and significant estimates made by management, as well as evaluating the overall financial statement presentation. We believe that our audits provide a reasonable basis for our opinion.
In our opinion, the financial statements and financial highlights referred to above present fairly, in all material respects, the financial position of the Evergreen Balanced Fund as of March 31, 2008, the results of its operations, changes in its net assets and financial highlights for each of the years described above, in conformity with U.S. generally accepted accounting principles.

Boston, Massachusetts
May 27, 2008
34
ADDITIONAL INFORMATION (unaudited)
FEDERAL TAX DISTRIBUTIONS
Pursuant to Section 852 of the Internal Revenue Code, the Fund has designated long-term capital gain distributions of $77,497,048 for the fiscal year ended March 31, 2008.
For corporate shareholders, 54.27% of ordinary income dividends paid during the fiscal year ended March 31, 2008 qualified for the dividends received deduction.
With respect to dividends paid from investment company taxable income during the fiscal year ended March 31, 2008, the Fund designates 59.32% of ordinary income and any short-term capital gain distributions as Qualified Dividend Income in accordance with the Internal Revenue Code. Complete 2008 year-end tax information will be reported on your 2008 Form 1099-DIV, which shall be provided to you in early 2009.
35
| TRUSTEES AND OFFICERS |
|
| TRUSTEES1 | | |
| Charles A. Austin III | | Investment Counselor, Anchor Capital Advisors, LLC. (investment advice); Director, The Andover |
| Trustee | | Companies (insurance); Trustee, Arthritis Foundation of New England; Former Director, The |
| DOB: 10/23/1934 | | Francis Ouimet Society (scholarship program); Former Director, Executive Vice President and |
| Term of office since: 1991 | | Treasurer, State Street Research & Management Company (investment advice) |
| Other directorships: None | | |
|
| K. Dun Gifford | | Chairman and President, Oldways Preservation and Exchange Trust (education); Trustee, |
| Trustee | | Chairman of the Finance Committee, Member of the Executive Committee, and Former |
| DOB: 10/23/1938 | | Treasurer, Cambridge College |
| Term of office since: 1974 | | |
| Other directorships: None | | |
|
| Dr. Leroy Keith, Jr. | | Managing Director, Almanac Capital Management (commodities firm); Trustee, Phoenix |
| Trustee | | Fund Complex; Director, Diversapack Co. (packaging company); Former Partner, Stonington |
| DOB: 2/14/1939 | | Partners, Inc. (private equity fund); Former Director, Obagi Medical Products Co.; Former |
| Term of office since: 1983 | | Director, Lincoln Educational Services |
| Other directorships: Trustee, | | |
| Phoenix Fund Complex (consisting |
| of 53 portfolios as of 12/31/2007) | | |
|
| Carol A. Kosel1 | | Former Consultant to the Evergreen Boards of Trustees; Former Vice President and Senior Vice |
| Trustee | | President, Evergreen Investments, Inc.; Former Treasurer, Evergreen Funds; Former Treasurer, |
| DOB: 12/25/1963 | | Vestaur Securities Fund |
| Term of office since: 2008 | | |
| Other directorships: None | | |
|
| Gerald M. McDonnell | | Former Manager of Commercial Operations, CMC Steel (steel producer) |
| Trustee | | |
| DOB: 7/14/1939 | | |
| Term of office since: 1988 | | |
| Other directorships: None | | |
|
| Patricia B. Norris | | President and Director of Buckleys of Kezar Lake, Inc. (real estate company); Former President |
| Trustee | | and Director of Phillips Pond Homes Association (home community); Former Partner, |
| DOB: 4/9/1948 | | PricewaterhouseCoopers, LLP (independent registered public accounting firm) |
| Term of office since: 2006 | | |
| Other directorships: None | | |
|
| William Walt Pettit | | Partner and Vice President, Kellam & Pettit, P.A. (law firm); Director, Superior Packaging Corp. |
| Trustee | | (packaging company); Member, Superior Land, LLC (real estate holding company), Member, |
| DOB: 8/26/1955 | | K&P Development, LLC (real estate development); Former Director, National Kidney Foundation |
| Term of office since: 1988 | | of North Carolina, Inc. (non-profit organization) |
| Other directorships: None | | |
|
| David M. Richardson | | President, Richardson, Runden LLC (executive recruitment advisory services); Director, J&M |
| Trustee | | Cumming Paper Co. (paper merchandising); Trustee, NDI Technologies, LLP (communications); |
| DOB: 9/19/1941 | | Former Consultant, AESC (The Association of Executive Search Consultants) |
| Term of office since: 1982 | | |
| Other directorships: None | | |
|
| Dr. Russell A. Salton III | | President/CEO, AccessOne MedCard, Inc. |
| Trustee | | |
| DOB: 6/2/1947 | | |
| Term of office since: 1984 | | |
| Other directorships: None | | |
|
36
| TRUSTEES AND OFFICERS continued |
|
| Michael S. Scofield | | Retired Attorney, Law Offices of Michael S. Scofield; Former Director and Chairman, Branded |
| Trustee | | Media Corporation (multi-media branding company) |
| DOB: 2/20/1943 | | |
| Term of office since: 1984 | | |
| Other directorships: None | | |
|
| Richard J. Shima | | Independent Consultant; Director, Hartford Hospital; Trustee, Greater Hartford YMCA; Former |
| Trustee | | Director, Trust Company of CT; Former Director, Old State House Association; Former Trustee, |
| DOB: 8/11/1939 | | Saint Joseph College (CT) |
| Term of office since: 1993 | | |
| Other directorships: None | | |
|
| Richard K. Wagoner, CFA2 | | Member and Former President, North Carolina Securities Traders Association; Member, Financial |
| Trustee | | Analysts Society |
| DOB: 12/12/1937 | | |
| Term of office since: 1999 | | |
| Other directorships: None | | |
|
| OFFICERS | | |
| Dennis H. Ferro3 | | Principal occupations: President and Chief Executive Officer, Evergreen Investment Company, |
| President | | Inc. and Executive Vice President, Wachovia Bank, N.A.; former Chief Investment Officer, |
| DOB: 6/20/1945 | | Evergreen Investment Company, Inc. |
| Term of office since: 2003 | | |
|
| Jeremy DePalma4 | | Principal occupations: Senior Vice President, Evergreen Investment Management Company, LLC; |
| Treasurer | | Former Vice President, Evergreen Investment Services, Inc.; Former Assistant Vice President, |
| DOB: 2/5/1974 | | Evergreen Investment Services, Inc. |
| Term of office since: 2005 | | |
|
| Michael H. Koonce4 | | Principal occupations: Senior Vice President and General Counsel, Evergreen Investment |
| Secretary | | Services, Inc.; Secretary, Senior Vice President and General Counsel, Evergreen Investment |
| DOB: 4/20/1960 | | Management Company, LLC and Evergreen Service Company, LLC; Senior Vice President and |
| Term of office since: 2000 | | Assistant General Counsel, Wachovia Corporation |
|
| Robert Guerin4 | | Principal occupations: Chief Compliance Officer, Evergreen Funds and Senior Vice President of |
| Chief Compliance Officer | | Evergreen Investments Co, Inc; Former Managing Director and Senior Compliance Officer, |
| DOB: 9/20/1965 | | Babson Capital Management LLC; Former Principal and Director, Compliance and Risk |
| Term of office since: 2007 | | Management, State Street Global Advisors; Former Vice President and Manager, Sales Practice |
| | | Compliance, Deutsche Asset Management. |
|
1 Each Trustee, except Mses. Kosel and Norris, serves until a successor is duly elected or qualified or until his or her death, resignation, retirement or removal from office. As new Trustees, Ms. Kosel’s and Ms. Norris’ initial terms end December 31, 2010 and June 30, 2009, respectively, at which times they may be re-elected by Trustees to serve until a successor is duly elected or qualified or until her death, resignation, retirement or removal from office by the Trustees. Each Trustee, except Ms. Kosel, oversaw 93 Evergreen funds as of December 31, 2007. Ms. Kosel became a Trustee on January 1, 2008. Correspondence for each Trustee may be sent to Evergreen Board of Trustees, P.O. Box 20083, Charlotte, NC 28202.
2 Mr. Wagoner is an “interested person” of the Fund because of his ownership of shares in Wachovia Corporation, the parent to the Fund’s investment advisor.
3 The address of the Officer is 401 S. Tryon Street, 20th Floor, Charlotte, NC 28288.
4 The address of the Officer is 200 Berkeley Street, Boston, MA 02116.
Additional information about the Fund’s Board of Trustees and Officers can be found in the Statement of Additional Information (SAI) and is available upon request without charge by calling 800.343.2898.
37
66390 rv5 04/2008
Item 2 – Code of Ethics
(a) The Registrant has adopted a code of ethics that applies to the Registrant's principal executive officer and principal financial officer.
(b) During the period covered by this report, there were no amendments to the provisions of the code of ethics adopted in 2.(a) above.
(c) During the period covered by this report, there were no implicit or explicit waivers to the provisions of the code of ethics adopted in 2.(a) above.
Item 3 – Audit Committee Financial Expert
Charles A. Austin III and Patricia B. Norris have been determined by the Registrant's Board of Trustees to be audit committee financial experts within the meaning of Section 407 of the Sarbanes-Oxley Act. These financial experts are independent of management.
Items 4 – Principal Accountant Fees and Services
The following table represents fees for professional audit services rendered by KPMG LLP, for the audits of the one series of the Registrant’s annual financial statements for the fiscal years ended March 31, 2008 and March 31, 2007, and fees billed for other services rendered by KPMG LLP.
| | | 2008 | | 2007 |
| Audit fees | | $ | | 26,300 | | $ | | 24,100 |
| Audit-related fees | | | | 0 | | | | 0 |
| Tax fees (1) | | | | 0 | | | | 909 |
| Non-audit fees (2) | | | | 1,082,374 | | | | 813,367 |
| All other fees | | | | 0 | | | | 0 |
| |
| | | |
|
| Total fees | | $ | | 1,108,674 | | $ | | 838,376 |
| |
| | | |
|
| (1) | Tax fees consists of fees for tax consultation, tax compliance and tax review. |
| |
| (2) | Non-audit fees consists of the aggregate fees for non-audit services rendered to the Fund, EIMC (not including any sub-advisor whose role is primarily portfolio management and is subcontracted with or overseen by another investment advisor) and EIS. |
| |
Evergreen Funds
Evergreen Income Advantage Fund
Evergreen Multi-Sector Fund
Evergreen Utilities and High Income Fund
Evergreen International Balanced Income Fund
Evergreen Global Dividend Opportunity Fund
Audit and Non-Audit Services Pre-Approval Policy
I. Statement of Principles
Under the Sarbanes-Oxley Act of 2002 (the “Act”), the Audit Committee of the Board of Trustees/Directors is responsible for the appointment, compensation and oversight of the work of the independent auditor. As part of this responsibility, the Audit Committee is required to pre-approve the audit and non-audit services performed by the independent auditor in order to assure that they do not impair the auditor’s independence from the Funds. To implement these provisions of the Act, the Securities and Exchange Commission (the “SEC”) has issued rules specifying the types of services that an independent auditor may not provide to its audit client, as well as the audit committee’s administration of the engagement of the independent auditor. Accordingly, the Audit Committee has adopted, and the Board of Trustees/Directors has ratified, the Audit and Non-Audit Services Pre Approval Policy (the “Policy”),
which sets forth the procedures and the conditions pursuant to which services proposed to be performed by the independent auditor may be pre-approved.
The SEC’s rules establish two different approaches to pre-approving services, which the SEC considers to be equally valid. Proposed services either: may be pre-approved without consideration of specific case-by-case services by the Audit Committee (“general pre-approval”); or require the specific pre-approval of the Audit Committee (“specified pre-approval”). The Audit Committee believes that the combination of these two approaches in this Policy will result in an effective and efficient procedure to pre-approve services performed by the independent auditor. As set forth in this Policy, unless a type of service has received general pre-approval, it will require specific pre-approval by the Audit Committee if it is to be provided by the independent auditor. Any proposed services exceeding pre-approved cost levels or budgeted amounts will also require specific pre-approval by the Audit Committee.
For both types of pre-approval, the Audit Committee will consider whether such services are consistent with the SEC’s rules on auditor independence. The Audit Committee will also consider whether the independent auditor is best positioned to provide the most effective and efficient service, for reasons such as its familiarity with the Funds’ business people, culture, accounting systems, risk profile and other factors, and whether the service might enhance the Funds’ ability to manage or control risk or improve audit quality. All such factors will be considered as a whole, and no one factor should necessarily be determinative.
The Audit Committee is also mindful of the relationship between fees for audit and non-audit services in deciding whether to pre-approve any such services and may determine, for each fiscal year, the ratio between the total amount of fees for Audit, Audit-related and Tax services and the total amount of fees for certain permissible non-audit services classified as All Other services.
The term of any general pre-approval is 12 months from the date of pre-approval, unless the Audit Committee considers a different period and states otherwise. The Audit Committee will annually review and pre-approve the services that may be provided by the independent auditor without obtaining specific pre-approval from the Audit Committee. The Audit Committee will add or subtract to the list of general pre-approved services from time to time, based on subsequent determinations.
The purpose of this Policy is to set forth the procedures by which the Audit Committee intends to fulfill its responsibilities. It does not delegate the Audit Committee’s responsibilities to pre-approve services performed by the independent auditor to management.
The independent auditor has reviewed this Policy and believes that implementation of the policy will not adversely affect the auditor’s independence.
II. Delegation
As provided in the Act and the SEC’s rules, the Audit Committee may delegate either type of pre-approval authority to one or more of its members. The member to whom such authority is delegated must report, for informational purposes only, any pre-approval decisions of the Audit Committee at its next scheduled meeting.
III. Audit Services
The annual Audit services engagement terms and fees will be subject to the specific pre-approval of the Audit Committee. Audit services include the annual financial statement audit and other procedures required to be performed by the independent auditor to be able to form an opinion on the Funds’ financial statements. These other procedures include information systems and procedural reviews and testing performed in order to understand and place reliance on the systems of internal control, and consultations relating to the audit. Audit services also include the attestation engagement for the independent auditor’s report on management’s report on internal controls for financial reporting. The Audit Committee will monitor the Audit services engagement as necessary, but no less than on a quarterly basis, and will also approve, if necessary, any changes in terms, conditions and fees resulting from changes in audit scope, Fund service providers or other items.
In addition to the annual Audit services engagement approved by the Audit Committee, the Audit Committee may grant general pre-approval to other Audit services, which are those services that only the independent auditor reasonably can provide. Other Audit services may include services associated with SEC registration statements, periodic reports and other documents filed with the SEC or other documents issued in connection with mergers or acquisitions.
IV. Audit-related Services
Audit-related services are assurance and related services that are reasonably related to the performance of the audit or review of the Funds’ financial statements or that are traditionally performed by the independent auditor. Because the Audit Committee believes that the provision of Audit-related services does not impair the independence of the auditor and is consistent with SEC’s rules on auditor independence, the Audit Committee may grant general pre-approval to Audit-related services. Audit-related services include, among others, due diligence services pertaining to potential business acquisitions/dispositions; accounting consultations related to accounting, financial reporting or disclosure matters not classified as “Audit services”; assistance with understanding and implementing new accounting and financial reporting guidance from rulemaking authorities; agreed-upon or expanded audit procedures related to accounting records required to respond to or comply with financial, accounting or regulatory reporting matters; and assistance with internal control reporting requirements.
V. Tax Services
The Audit Committee believes that the independent auditor can provide Tax services to the Funds such as tax compliance, tax planning and tax advice without impairing the auditor’s independence, and the SEC has stated that the independent auditor may provide such services. Hence, the Audit Committee believes it may grant general pre-approval to those Tax services that have historically been provided by the auditor, that the Audit Committee has reviewed and believes would not impair the independence of the auditor, and that are consistent with the SEC’s rules on auditor independence. The Audit Committee will not permit the retention of the independent auditor in connection with a transaction initially recommended by the independent auditor, the sole business purpose of which may be tax avoidance and the tax treatment of which may not be supported in the Internal Revenue Code and related regulations. The Audit Committee will consult with the Director of Fund Administration, the Vice President of Tax Services or outside counsel to determine that the tax planning and reporting positions are consistent with this policy.
All Tax services involving large and complex transactions must be specifically pre-approved by the Audit Committee, including: tax services proposed to be provide by the independent auditor to any executive officer or director of the Funds, in his or her individual capacity, where such services are paid for by the Funds or the investment advisor.
VI. All Other Services
The Audit Committee believes, based on the SEC’s rules prohibiting the independent auditor from providing specific non-audit services, that other types of non-audit services are permitted. Accordingly, the Audit Committee believes it may grant general pre-approval to those permissible non-audit services classified as All Other services that it believes are routine and recurring services, would not impair the independence of the auditor and are consistent with the SEC’s rules on auditor independence.
The SEC’s rules and relevant guidance should be consulted to determine the precise definitions of the SEC’s prohibited non-audit services and the applicability of exceptions to certain of the prohibitions.
VII. Pre-Approval Fee Levels or Budgeted Amounts
Pre-approval fee levels or budgeted amounts for all services to be provided by the independent auditor will be established annually by the Audit Committee. Any proposed services exceeding these levels or amounts will require specific pre-approval by the Audit Committee. The Audit Committee is mindful of the overall relationship of fees for audit and non-audit services in determining whether to pre-approve any such services. For each fiscal year, the Audit Committee may determine to ratio between the total amount of fees for Audit, Audit-related and Tax services, and the total amount of fees for services classified as All Other services.
VIII. Procedures
All requests or applications for services to be provided by the independent auditor that do not require specific approval by the Audit Committee will be submitted to the Director of Fund Administration or Assistant Director of Fund Administration and must include a detailed description of the services to be rendered. The Director/Assistant Director of Fund Administration will determine whether such services are included within the list of services that have received the general pre-approval of the Audit Committee. The Audit Committee will be informed on a quarterly basis (or more frequent if requested by the audit committee) of any such services rendered by the independent auditor.
Request or applications to provide services that require specific approval by the Audit Committee will be submitted to the Audit Committee by both the independent auditor and the Director/Assistant Director of Fund Administration, and must include a joint statement as to whether, in their view, the request or application is consistent with the SEC’s rules on auditor independence.
The Audit Committee has designated the Chief Compliance Officer to monitor the performance of all services provided by the independent auditor and to determine whether such services are in compliance with this policy. The Chief Compliance Officer will report to the Audit Committee on a periodic basis on the results of its monitoring. Both the Chief Compliance Officer and management will immediately report to the chairman of the Audit Committee any breach of this policy that comes to the attention of the Chief Compliance Officer or any member of management.
The Audit Committee will also review the internal auditor’s annual internal audit plan to determine that the plan provides for the monitoring of the independent auditor’s services.
IX. Additional Requirements
The Audit Committee has determined to take additional measures on an annual basis to meet its responsibility to oversee the work of the independent auditor and to assure the auditor’s independence from the Funds, such as reviewing a formal written statement from the independent auditor delineating all relationships between the independent auditor and the Funds, the Funds’ investment advisor and related parties of the investment advisor, consistent with Independence Standards Board Standard No. 1, and discussing with the independent auditor its methods and procedures for ensuring independence.
Items 5 – Audit Committee of Listed Registrants
Not applicable.
Item 6 – Schedule of Investments
Please see schedule of investments contained in the Report to Stockholders included under Item 1 of this Form N-CSR.
Item 7 – Disclosure of Proxy Voting Policies and Procedures for Closed-End Management Investment Companies.
Not applicable.
Item 8 – Portfolio Managers of Closed-End Management Investment Companies.
Not applicable.
Item 9 – Purchases of Equity Securities by Closed-End Management Investment Company and Affiliated Purchasers.
Not applicable.
Item 10 – Submission of Matters to a Vote of Security Holders
There have been no material changes to the procedures by which shareholders may recommend nominees to the Registrant’s board of trustees that have been implemented since the Registrant last provided disclosure in response to the requirements of this Item.
Item 11 - Controls and Procedures
| (a) | The Registrant's principal executive officer and principal financial officer have evaluated the Registrant's disclosure controls and procedures (as defined in Rule 30a-3(c) under the Investment Company Act of 1940) within 90 days of this filing and have concluded that the Registrant's disclosure controls and procedures were effective, as of that date, in ensuring that information required to be disclosed by the Registrant in this Form N-CSR was recorded, processed, summarized, and reported timely. |
| |
| (b) | There has been no changes in the Registrant's internal controls over financial reporting (as defined in Rule 30a-3(d) under the Investment Company Act of 1940) that occurred during the second fiscal quarter of the period covered by this report that has materially affected, or is reasonable likely to affect, the Registrant’s internal control over financial reporting . |
| |
Item 12 - Exhibits
File the exhibits listed below as part of this Form. Letter or number the exhibits in the sequence indicated.
| (a) | Any code of ethics, or amendment thereto, that is the subject of the disclosure required by Item 2, to the extent that the Registrant intends to satisfy the Item 2 requirements through filing of an exhibit. |
| |
(b)(1) Separate certifications for the Registrant's principal executive officer and principal financial officer, as required by Section 302 of the Sarbanes-Oxley Act of 2002 and Rule 30a-2(a) under the Investment Company Act of 1940, are attached as EX99.CERT.
(b)(2) Separate certifications for the Registrant's principal executive officer and principal financial officer, as required by Section 1350 of Title 18 of United States Code, as adopted pursuant to Section 906 of the Sarbanes-Oxley Act of 2002, and Rule 30a-2(b) under the Investment Company Act of 1940, are attached as EX99.906CERT. The certifications furnished pursuant to this paragraph are not deemed to be "filed" for purposes of Section 18 of the Securities Exchange Act of 1934, or otherwise subject to the liability of that section. Such certifications are not deemed to be incorporated by reference into any filing under the Securities Act of 1933 or the Securities Exchange Act of 1934, except to the extent that the Registrant specifically incorporates them by reference.
Pursuant to the requirements of the Securities Exchange Act of 1934 and the Investment Company Act of 1940, the Registrant has duly caused this report to be signed on its behalf by the undersigned, thereunto duly authorized.
| Evergreen Equity Trust |
By: |
| Dennis H. Ferro |
| Principal Executive Officer |
Date: May 23, 2008 |
Pursuant to the requirements of the Securities Exchange Act of 1934 and the Investment Company Act of 1940, this report has been signed below by the following persons on behalf of the Registrant and in the capacities and on the dates indicated.
| By: | | |
| | | Dennis H. Ferro |
| | | Principal Executive Officer |
| Date: May 23, 2008 |
By: |
| Jeremy DePalma |
| Principal Financial Officer |
Date: May 23, 2008 |