Security transactions are recorded on trade date. Realized gains and losses are computed using the specific cost of the security sold. Dividend income is recorded on the ex-dividend date or in the case of some foreign securities, on the date when the Fund is made aware of the dividend. Foreign income and capital gains realized on some securities may be subject to foreign taxes, which are accrued as applicable.
Distributions to shareholders from net investment income and net realized gains, if any, are recorded on the ex-dividend date. Such distributions are determined in conformity with income tax regulations, which may differ from generally accepted accounting principles.
Reclassifications have been made to the Fund’s components of net assets to reflect income and gains available for distribution (or available capital loss carryovers, as applicable) under income tax regulations. The primary permanent differences causing such reclassifications are due to overdistributed net investment income and dividend redesignations. During the year ended July 31, 2008, the following amounts were reclassified:
Income, common expenses and realized and unrealized gains and losses are allocated to the classes based on the relative net assets of each class. Distribution fees, if any, are calculated daily at the class level based on the appropriate net assets of each class and the specific expense rates applicable to each class.
NOTES TO FINANCIAL STATEMENTS continued
3. ADVISORY FEE AND OTHER TRANSACTIONS WITH AFFILIATES
Evergreen Investment Management Company, LLC (“EIMC”), an indirect, wholly-owned subsidiary of Wachovia Corporation (“Wachovia”), is the investment advisor to the Fund and is paid an annual fee starting at 0.70% and declining to 0.50% as the aggregate average daily net assets of the Fund and its variable annuity counterpart, Evergreen VA Fundamental Large Cap Fund, increase. For the year ended July 31, 2008, the advisory fee was equivalent to 0.59% of the Fund’s average daily net assets.
From time to time, EIMC may voluntarily or contractually waive its fee and/or reimburse expenses in order to limit operating expenses. During the year ended July 31, 2008, EIMC voluntarily reimbursed Distribution Plan expenses (see Note 4) relating to Class A shares in the amount of $167,533.
The Fund may invest in money market funds which are advised by EIMC. Income earned on these investments is included in income from affiliates on the Statement of Operations.
Effective January 1, 2008, EIMC replaced Evergreen Investment Services, Inc. (“EIS”), an indirect, wholly-owned subsidiary of Wachovia, as the administrator to the Fund upon the assignment of the Fund’s Administrative Services Agreement from EIS to EIMC. There were no changes to the services being provided or fees being paid by the Fund. The administrator provides the Fund with facilities, equipment and personnel and is paid an annual rate determined by applying percentage rates to the aggregate average daily net assets of the Evergreen funds (excluding money market funds) starting at 0.10% and declining to 0.05% as the aggregate average daily net assets of the Evergreen funds (excluding money market funds) increase. For the year ended July 31, 2008, the administration services fee was equivalent to 0.10% of the Fund’s average daily net assets.
Evergreen Service Company, LLC (“ESC”), an indirect, wholly-owned subsidiary of Wachovia, is the transfer and dividend disbursing agent for the Fund. ESC receives account fees that vary based on the type of account held by the shareholders in the Fund. For the year ended July 31, 2008, the transfer agent fees were equivalent to an annual rate of 0.32% of the Fund’s average daily net assets.
Wachovia Bank NA, through its securities lending division of Wachovia Global Securities Lending, acts as the securities lending agent for the Fund.
The Fund has placed a portion of its portfolio transactions with brokerage firms that are affiliates of Wachovia. During the year ended July 31, 2008, the Fund paid brokerage commissions of $212,210 to Wachovia Securities, LLC.
27
NOTES TO FINANCIAL STATEMENTS continued
4. DISTRIBUTION PLANS
EIS serves as distributor of the Fund’s shares. The Fund has adopted Distribution Plans, as allowed by Rule 12b-1 of the 1940 Act, for each class of shares, except Class I. Under the Distribution Plans, the Fund is permitted to pay distribution fees at an annual rate of up to 0.75% of the average daily net assets for Class A shares and up to 1.00% of the average daily net assets for each of Class B and Class C shares. However, currently the distribution fees for Class A shares are limited to 0.25% of the average daily net assets of the class. Prior to April 1, 2008, distribution fees were paid at an annual rate of 0.30% of the average daily net assets for Class A shares.
For the year ended July 31, 2008, EIS received $10,855 from the sale of Class A shares and $62, $162,044 and $1,079 in contingent deferred sales charges from redemptions of Class A, Class B and Class C shares, respectively.
5. INVESTMENT TRANSACTIONS
Cost of purchases and proceeds from sales of investment securities (excluding short-term securities) were $247,979,680 and $422,262,515, respectively, for the year ended July 31, 2008.
During the year ended July 31, 2008, the Fund loaned securities to certain brokers and earned $289,471 in affiliated income relating to securities lending activity which is included in income from affiliates on the Statement of Operations. At July 31, 2008, the value of securities on loan and the total value of collateral received for securities loaned amounted to $153,894,903 and $160,975,007, respectively.
On July 31, 2008, the aggregate cost of securities for federal income tax purposes was $924,464,045. The gross unrealized appreciation and depreciation on securities based on tax cost was $174,199,846 and $52,175,935, respectively, with a net unrealized appreciation of $122,023,911.
As of July 31, 2008, the Fund had $136,638,686 in capital loss carryovers for federal income tax purposes with $134,054,733 expiring in 2010 and $2,583,953 expiring in 2011. Certain portions of the capital loss carryovers of the Fund were assumed as a result of acquisitions. These losses are subject to certain limitations prescribed by the Internal Revenue Code. Utilization of these capital loss carryovers was limited during the year ended July 31, 2008 in accordance with income tax regulations.
6. INTERFUND LENDING
Pursuant to an Exemptive Order issued by the SEC, the Fund may participate in an inter-fund lending program with certain funds in the Evergreen fund family. This program allows the Fund to borrow from, or lend money to, other participating funds. During the year ended July 31, 2008, the Fund did not participate in the interfund lending program.
28
NOTES TO FINANCIAL STATEMENTS continued
7. DISTRIBUTIONS TO SHAREHOLDERS
As of July 31, 2008, the components of distributable earnings on a tax basis were as follows:
Unrealized
Appreciation | | Capital Loss
Carryovers | | Temporary
Book/Tax
Differences |
|
|
|
|
|
$122,032,333 | | $136,638,686 | | $(197,813) |
|
|
|
|
|
The differences between the components of distributable earnings on a tax basis and the amounts reflected in the Statement of Assets and Liabilities are primarily due to wash sales and deferred losses on debt restructuring. Additionally, short-term capital gains are considered ordinary income for income tax purposes. The temporary book/tax differences are a result of timing differences between book and tax recognition of income and/or expenses.
The tax character of distributions paid was as follows:
| | Year Ended July 31, |
| |
|
| | 2008 | | 2007 |
|
|
|
|
|
Ordinary Income | | $ | 5,026,363 | | $ | 4,917,958 |
Long-term Capital Gain | | | 52,601,895 | | | 15,090,707 |
|
|
|
|
|
|
|
8. EXPENSE REDUCTIONS
Through expense offset arrangements with ESC and the Fund’s custodian, a portion of fund expenses has been reduced.
9. DEFERRED TRUSTEES’ FEES
Each Trustee of the Fund may defer any or all compensation related to performance of his or her duties as a Trustee. The Trustees’ deferred balances are allocated to deferral accounts, which are included in the accrued expenses for the Fund. The investment performance of the deferral accounts is based on the investment performance of certain Evergreen funds. Any gains earned or losses incurred in the deferral accounts are reported in the Fund’s Trustees’ fees and expenses. At the election of the Trustees, the deferral account will be paid either in one lump sum or in quarterly installments for up to ten years.
10. FINANCING AGREEMENT
The Fund and certain other Evergreen funds share in a $100 million unsecured revolving credit commitment for temporary and emergency purposes, including the funding of redemptions, as permitted by each participating fund’s borrowing restrictions. Borrowings under this facility bear interest at 0.50% per annum above the Federal Funds rate. All of the participating funds are charged an annual commitment fee of 0.09% on the unused
29
NOTES TO FINANCIAL STATEMENTS continued
balance, which is allocated pro rata. Prior to June 27, 2008, the annual commitment fee was 0.08%. During the year ended July 31, 2008, the Fund had no borrowings.
11. REGULATORY MATTERS AND LEGAL PROCEEDINGS
Pursuant to an administrative order issued by the SEC on September 19, 2007, EIMC, EIS, ESC (collectively, the “Evergreen Entities”), Wachovia Securities, LLC and the SEC have entered into an agreement settling allegations of (i) improper short-term trading arrangements in effect prior to May 2003 involving former officers and employees of EIMC and certain broker-dealers, (ii) insufficient systems for monitoring exchanges and enforcing exchange limitations as stated in certain funds’ prospectuses, and (iii) inadequate e-mail retention practices. Under the settlement, the Evergreen Entities were censured and have paid approximately $32 million in disgorgement and penalties. This amount, along with a fine assessed by the SEC against Wachovia Securities, LLC will be distributed pursuant to a plan to be developed by an independent distribution consultant and approved by the SEC. The Evergreen Entities neither admitted nor denied the allegations and findings set forth in its settlement with the SEC.
In addition, the Evergreen funds and EIMC and certain of its affiliates are involved in various legal actions, including private litigation and class action lawsuits. EIMC does not expect that any of such legal actions currently pending or threatened will have a material adverse impact on the financial position or operations of any of the Evergreen funds or on EIMC’s ability to provide services to the Evergreen funds.
Although EIMC believes that none of the matters discussed above will have a material adverse impact on the Evergreen funds, there can be no assurance that these matters and any publicity surrounding or resulting from them will not result in reduced sales or increased redemptions of Evergreen fund shares, which could increase Evergreen fund transaction costs or operating expenses, or that they will not have other adverse consequences on the Evergreen funds.
12. NEW ACCOUNTING PRONOUNCEMENTS
In September 2006, FASB issued Statement of Financial Accounting Standards No. 157, Fair Value Measurements (“FAS 157”). FAS 157 establishes a single authoritative definition of fair value, establishes a framework for measuring fair value and expands disclosures about fair value measurements. FAS 157 applies to fair value measurements already required or permitted by existing standards. The change to current generally accepted accounting principles from the application of FAS 157 relates to the definition of fair value, the methods used to measure fair value, and the expanded disclosures about fair value measurements. Management of the Fund does not believe the adoption of FAS 157 will materially impact the financial statement amounts, however, additional disclosures will be required about the inputs used to develop the measurements and the effect of certain of the measurements on changes in net assets for the period. FAS 157 is effective for
30
NOTES TO FINANCIAL STATEMENTS continued
financial statements issued for fiscal years beginning after November 15, 2007 and interim periods within those fiscal years.
In March 2008, FASB issued Statement of Financial Accounting Standards No. 161, Disclosures about Derivative Instruments and Hedging Activities (“FAS 161”), an amendment of FASB Statement No. 133. FAS 161 requires enhanced disclosures about (a) how and why a fund uses derivative instruments, (b) how derivative instruments and hedging activities are accounted for, and (c) how derivative instruments and related hedging activities affect a fund’s financial position, financial performance, and cash flows. Management of the Fund does not believe the adoption of FAS 161 will materially impact the financial statement amounts, but will require additional disclosures. This will include qualitative and quantitative disclosures on derivative positions existing at period end and the effect of using derivatives during the reporting period. FAS 161 is effective for financial statements issued for fiscal years and interim periods beginning after November 15, 2008.
13. SUBSEQUENT DISTRIBUTIONS
On September 11, 2008, the Fund declared distributions from net investment income to shareholders of record on September 10, 2008. The per share amounts payable on September 12, 2008 are as follows:
| Net Investment |
| Income |
|
|
Class A | $ 0.0057 |
Class I | 0.0367 |
|
|
These distributions are not reflected in the accompanying financial statements.
31
REPORT OF INDEPENDENT REGISTERED PUBLIC ACCOUNTING FIRM
Board of Trustees and Shareholders
Evergreen Equity Trust
We have audited the accompanying statement of assets and liabilities, including the schedule of investments, of the Evergreen Fundamental Large Cap Fund, a series of the Evergreen Equity Trust, as of July 31, 2008 and the related statement of operations for the year then ended, statements of changes in net assets for each of the years in the two-year period then ended and the financial highlights for each of the years in the five-year period then ended. These financial statements and financial highlights are the responsibility of the Fund’s management. Our responsibility is to express an opinion on these financial statements and financial highlights based on our audits.
We conducted our audits in accordance with the standards of the Public Company Accounting Oversight Board (United States). Those standards require that we plan and perform the audit to obtain reasonable assurance about whether the financial statements and financial highlights are free of material misstatement. An audit includes examining, on a test basis, evidence supporting the amounts and disclosures in the financial statements. Our procedures included confirmation of securities owned as of July 31, 2008 by correspondence with the custodian and brokers, or by other appropriate auditing procedures where replies from brokers were not received. An audit also includes assessing the accounting principles used and significant estimates made by management, as well as evaluating the overall financial statement presentation. We believe that our audits provide a reasonable basis for our opinion.
In our opinion, the financial statements and financial highlights referred to above present fairly, in all material respects, the financial position of the Evergreen Fundamental Large Cap Fund as of July 31, 2008, the results of its operations, changes in its net assets and financial highlights for each of the years described above, in conformity with U.S. generally accepted accounting principles.

Boston, Massachusetts
September 29, 2008
32
ADDITIONAL INFORMATION (unaudited)
FEDERAL TAX DISTRIBUTIONS
Pursuant to Section 852 of the Internal Revenue Code, the Fund has designated long-term capital gain distributions of $52,601,895 for the fiscal year ended July 31, 2008.
For corporate shareholders, 100% of ordinary income dividends paid during the fiscal year ended July 31, 2008 qualified for the dividends received deduction.
With respect to dividends paid from investment company taxable income during the fiscal year ended July 31, 2008, the Fund designates 100% of ordinary income and any short-term capital gain distributions as Qualified Dividend Income in accordance with the Internal Revenue Code. Complete 2008 year-end tax information will be reported on your 2008 Form 1099-DIV, which shall be provided to you in early 2009.
33
This page left intentionally blank
34
This page left intentionally blank
35
TRUSTEES AND OFFICERS
TRUSTEES1 | | |
Charles A. Austin III
Trustee
DOB: 10/23/1934
Term of office since: 1991
Other directorships: None | | Investment Counselor, Anchor Capital Advisors, LLC. (investment advice); Director, The Andover Companies (insurance); Trustee, Arthritis Foundation of New England; Former Director, The Francis Ouimet Society (scholarship program); Former Director, Executive Vice President and Treasurer, State Street Research & Management Company (investment advice) |
|
|
|
K. Dun Gifford
Trustee
DOB: 10/23/1938
Term of office since: 1974
Other directorships: None | | Chairman and President, Oldways Preservation and Exchange Trust (education); Trustee, Chairman of the Finance Committee, Member of the Executive Committee, and Former Treasurer, Cambridge College |
|
|
|
Dr. Leroy Keith, Jr.
Trustee
DOB: 2/14/1939
Term of office since: 1983
Other directorships: Trustee,
Phoenix Fund Complex
(consisting of 53 portfolios
as of 12/31/2007) | | Managing Director, Almanac Capital Management (commodities firm); Trustee, Phoenix Fund Complex; Director, Diversapack Co. (packaging company); Former Partner, Stonington Partners, Inc. (private equity fund); Former Director, Obagi Medical Products Co.; Former Director, Lincoln Educational Services |
|
|
|
Carol A. Kosel1
Trustee
DOB: 12/25/1963
Term of office since: 2008
Other directorships: None | | Former Consultant to the Evergreen Boards of Trustees; Former Vice President and Senior Vice President, Evergreen Investments, Inc.; Former Treasurer, Evergreen Funds; Former Treasurer, Vestaur Securities Fund |
|
|
|
Gerald M. McDonnell
Trustee
DOB: 7/14/1939
Term of office since: 1988
Other directorships: None | | Former Manager of Commercial Operations, CMC Steel (steel producer) |
|
|
|
Patricia B. Norris
Trustee
DOB: 4/9/1948
Term of office since: 2006
Other directorships: None | | President and Director of Buckleys of Kezar Lake, Inc. (real estate company); Former President and Director of Phillips Pond Homes Association (home community); Former Partner, PricewaterhouseCoopers, LLP (independent registered public accounting firm) |
|
|
|
William Walt Pettit
Trustee
DOB: 8/26/1955
Term of office since: 1988
Other directorships: None | | Partner and Vice President, Kellam & Pettit, P.A. (law firm); Director, Superior Packaging Corp. (packaging company); Member, Superior Land, LLC (real estate holding company), Member, K&P Development, LLC (real estate development); Former Director, National Kidney Foundation of North Carolina, Inc. (non-profit organization) |
|
|
|
David M. Richardson
Trustee
DOB: 9/19/1941
Term of office since: 1982
Other directorships: None | | President, Richardson, Runden LLC (executive recruitment advisory services); Director, J&M Cumming Paper Co. (paper merchandising); Trustee, NDI Technologies, LLP (communications); Former Consultant, AESC (The Association of Executive Search Consultants) |
|
|
|
Dr. Russell A. Salton III
Trustee
DOB: 6/2/1947
Term of office since: 1984
Other directorships: None | | President/CEO, AccessOne MedCard, Inc. |
|
|
|
36
TRUSTEES AND OFFICERS continued
Michael S. Scofield
Trustee
DOB: 2/20/1943
Term of office since: 1984
Other directorships: None | | Retired Attorney, Law Offices of Michael S. Scofield; Former Director and Chairman, Branded Media Corporation (multi-media branding company) |
|
|
|
Richard J. Shima
Trustee
DOB: 8/11/1939
Term of office since: 1993
Other directorships: None | | Independent Consultant; Director, Hartford Hospital; Trustee, Greater Hartford YMCA; Former Director, Trust Company of CT; Former Director, Old State House Association; Former Trustee, Saint Joseph College (CT) |
|
|
|
Richard K. Wagoner, CFA2
Trustee
DOB: 12/12/1937
Term of office since: 1999
Other directorships: None | | Member and Former President, North Carolina Securities Traders Association; Member, Financial Analysts Society |
|
|
|
OFFICERS
Dennis H. Ferro3
President
DOB: 6/20/1945
Term of office since: 2003 | | Principal occupations: President and Chief Executive Officer, Evergreen Investment Company, Inc. and Executive Vice President, Wachovia Bank, N.A.; former Chief Investment Officer, Evergreen Investment Company, Inc. |
|
|
|
Jeremy DePalma4
Treasurer
DOB: 2/5/1974
Term of office since: 2005 | | Principal occupations: Senior Vice President, Evergreen Investment Management Company, LLC; Former Vice President, Evergreen Investment Services, Inc.; Former Assistant Vice President, Evergreen Investment Services, Inc. |
|
|
|
Michael H. Koonce4
Secretary
DOB: 4/20/1960
Term of office since: 2000 | | Principal occupations: Senior Vice President and General Counsel, Evergreen Investment Services, Inc.; Secretary, Senior Vice President and General Counsel, Evergreen Investment Management Company, LLC and Evergreen Service Company, LLC; Senior Vice President and Assistant General Counsel, Wachovia Corporation |
|
|
|
Robert Guerin4
Chief Compliance Officer
DOB: 9/20/1965
Term of office since: 2007 | | Principal occupations: Chief Compliance Officer, Evergreen Funds and Senior Vice President of Evergreen Investments Co., Inc.; Former Managing Director and Senior Compliance Officer, Babson Capital Management LLC; Former Principal and Director, Compliance and Risk Management, State Street Global Advisors; Former Vice President and Manager, Sales Practice Compliance, Deutsche Asset Management |
|
|
|
1 | Each Trustee, except Mses. Kosel and Norris, serves until a successor is duly elected or qualified or until his or her death, resignation, retirement or removal from office. As new Trustees, Ms. Kosel’s and Ms. Norris’ initial terms end December 31, 2010 and June 30, 2009, respectively, at which times they may be re-elected by Trustees to serve until a successor is duly elected or qualified or until her death, resignation, retirement or removal from office by the Trustees. Each Trustee, except Ms. Kosel, oversaw 94 Evergreen funds as of December 31, 2007. Ms. Kosel became a Trustee on January 1, 2008. Correspondence for each Trustee may be sent to Evergreen Board of Trustees, P.O. Box 20083, Charlotte, NC 28202. |
2 | Mr. Wagoner is an “interested person” of the Fund because of his ownership of shares in Wachovia Corporation, the parent to the Fund’s investment advisor. |
3 | The address of the Officer is 401 S. Tryon Street, 20th Floor, Charlotte, NC 28288. |
4 | The address of the Officer is 200 Berkeley Street, Boston, MA 02116. |
Additional information about the Fund’s Board of Trustees and Officers can be found in the Statement of Additional Information (SAI) and is available upon request without charge by calling 800.343.2898.
37
567509 rv5 09/2008
Evergreen Fundamental Mid Cap Value Fund
| | table of contents |
1 | | LETTER TO SHAREHOLDERS |
4 | | FUND AT A GLANCE |
6 | | PORTFOLIO MANAGER COMMENTARY |
9 | | ABOUT YOUR FUND’S EXPENSES |
10 | | FINANCIAL HIGHLIGHTS |
14 | | SCHEDULE OF INVESTMENTS |
18 | | STATEMENT OF ASSETS AND LIABILITIES |
19 | | STATEMENT OF OPERATIONS |
20 | | STATEMENT OF CHANGES IN NET ASSETS |
21 | | NOTES TO FINANCIAL STATEMENTS |
27 | | REPORT OF INDEPENDENT REGISTERED PUBLIC ACCOUNTING FIRM |
28 | | ADDITIONAL INFORMATION |
32 | | TRUSTEES AND OFFICERS |
This annual report must be preceded or accompanied by a prospectus of the Evergreen fund contained herein. The prospectus contains more complete information, including fees and expenses, and should be read carefully before investing or sending money.
The fund will file its complete schedule of portfolio holdings with the SEC for the first and third quarters of each fiscal year on Form N-Q. The fund’s Form N-Q will be available on the SEC’s Web site at http://www.sec.gov. In addition, the fund’s Form N-Q may be reviewed and copied at the SEC’s Public Reference Room in Washington, D.C. Information on the operation of the Public Reference Room may be obtained by calling 800.SEC.0330.
A description of the fund’s proxy voting policies and procedures, as well as information regarding how the fund voted proxies relating to portfolio securities during the most recent 12-month period ended June 30, is available by visiting our Web site at EvergreenInvestments.com or by visiting the SEC’s Web site at http://www.sec.gov. The fund’s proxy voting policies and procedures are also available without charge, upon request, by calling 800.343.2898.
Mutual Funds:
| NOT FDIC INSURED | MAY LOSE VALUE | NOT BANK GUARANTEED |
Evergreen InvestmentsSM is a service mark of Evergreen Investment Management Company, LLC. Copyright 2008, Evergreen Investment Management Company, LLC.
Evergreen Investment Management Company, LLC is a subsidiary of Wachovia Corporation and is an affiliate of Wachovia Corporation’s other Broker Dealer subsidiaries.
Evergreen mutual funds are distributed by Evergreen Investment Services, Inc. 200 Berkeley Street, Boston, MA 02116
LETTER TO SHAREHOLDERS
September 2008

Dennis H. Ferro
President and Chief Executive Officer
Dear Shareholder:
We are pleased to provide the Annual Report for Evergreen Fundamental Mid Cap Value Fund for the twelve-month period ended July 31, 2008 (the “period”).
Capital markets came under extreme pressure during the period as investors confronted a variety of challenges that ranged from a crisis in credit markets and deteriorating housing values to rapidly rising energy costs and intensifying inflationary pressures. All these factors contributed to growing fears that the U.S. economy might be moving toward a significant slump that potentially could undermine the growth of the global economy. Against this backdrop, the domestic equity market saw falling stock valuations for companies of all sizes and virtually all sectors, with the notable exception of the energy and utilities groups. Financials stocks were particularly hard-hit, as many major institutions suffered steep losses from their exposure to subprime mortgages. Outside the United States, stocks in both industrial and emerging market nations slumped, reflecting concerns about the potentially contagious effects of problems in the United States. In the domestic fixed income market, widespread credit problems dragged down the prices of virtually all types of securities carrying credit risk, most notably corporate bonds and asset-backed securities. High yield corporates performed particularly poorly. In contrast, Treasuries and other high-quality securities held up well. In world bond markets, sovereign government securities in industrialized nations outperformed other groups, while emerging market debt and high yield corporate bonds underperformed.
Despite many warning signals, the U.S. economy appeared to defy expectations for recession. While the nation’s real Gross Domestic Product grew at an annual rate of just 0.9% in the first quarter of 2008, growth accelerated to a 3.3% pace in the second quarter. The combination of a weak currency, which supported exports, and the injection of tax-rebate checks sustained the expansion, cushioning the impacts of weakening employment, slowing profit growth and rising inflation. Moreover, problems in the credit markets persisted, with major financial institutions continuing to report significant losses. In the face of these threats, the Federal Reserve Board (the “Fed”) continued to relax monetary policy in an effort to inject new liquidity into the nation’s financial system. The Fed slashed the key fed funds rate from 5.25% to 2.00% between
1
LETTER TO SHAREHOLDERS continued
August 2007 and April 2008. The central bank also took other policy initiatives to make funds more available to financial institutions, including commercial and investment banks. In early September 2008, the U.S. Treasury Department acted forcefully to take control over both Fannie Mae and Freddie Mac, the two giant mortgage institutions that had been seriously weakened by the upheaval in the mortgage market. The Treasury’s actions were seen as major initiatives to instill confidence in the economy by supporting the mortgage market.
During a volatile and challenging period in the stock market, the management teams of Evergreen’s value- and core-equity funds held fast to their long-term disciplines. The team supervising Evergreen Equity Index Fund maintained a portfolio reflecting the composition of the Standard & Poor’s 500 Index, using a proprietary process to control trading and operational costs. Managers of Evergreen Enhanced S&P 500® Fund, meanwhile, employed a discipline based principally on quantitative analysis to select a portfolio composed principally of larger-company stocks. Managers of Evergreen Equity Income Fund emphasized companies with the ability to both maintain and increase their dividends to shareholders. The team managing Evergreen Fundamental Large Cap Fund, meanwhile, emphasized companies with attractive earnings growth records and strong management teams. At the same time, the team supervising Evergreen Fundamental Mid Cap Value Fund focused on mid-sized companies selling at reasonable valuations. Portfolio managers of Evergreen Intrinsic Value Fund sought out positions in established companies selling at a discount to the managers’ estimate of the stock’s intrinsic value. Meanwhile, managers of Evergreen Disciplined Value Fund and Evergreen Disciplined Small-Mid Value Fund employed a combination of quantitative tools and traditional fundamental analysis in reviewing opportunities among large company and small and mid cap value companies, respectively. Meanwhile, teams supervising Evergreen Small Cap Value Fund and Evergreen Special Values Fund each selected stocks based on their assessments of better quality, small cap companies with reasonable prices and strong balance sheets.
We believe the changing conditions in the investment environment over the period have underscored the value of a well-diversified, long-term investment strategy to help soften the effects of volatility in any one market or asset class. As always, we encourage investors to maintain diversified investment portfolios in pursuit of their long-term investment goals.
2
LETTER TO SHAREHOLDERS continued
Please visit us at EvergreenInvestments.com for more information about our funds and other investment products available to you. Thank you for your continued support of Evergreen Investments.
Sincerely,

Dennis H. Ferro
President and Chief Executive Officer
Evergreen Investment Company, Inc.
Special Notice to Shareholders:
Please visit our Web site at EvergreenInvestments.com for statements from President and Chief Executive Officer (CEO), Dennis Ferro, regarding the firm’s recent settlement with the Securities and Exchange Commission (SEC) and prior settlement with the Financial Industry Regulatory Authority (FINRA).
Special Notice to Shareholders:
Dennis Ferro, President and CEO of Evergreen Investments, will retire at the end of 2008 and Peter Cieszko, current President of Global Distribution, will succeed Mr. Ferro as President and CEO at that time. Additionally, David Germany has been named the new Chief Investment Officer (CIO). Please visit our Web site for additional information regarding these announcements.
3
FUND AT A GLANCE
as of July 31, 2008
MANAGEMENT TEAM
Investment Advisor:
Evergreen Investment Management Company, LLC
Portfolio Manager:
James M. Tringas, CFA
CURRENT INVESTMENT STYLE

Source: Morningstar, Inc.
Morningstar’s style box is based on a portfolio date as of 6/30/2008.
The Equity style box placement is based on 10 growth and valuation measures for each fund holding and the median size of the companies in which the fund invests.
PERFORMANCE AND RETURNS
Portfolio inception date: 9/28/2007
| Class A | Class B | Class C | Class I |
Class inception date | 9/28/2007 | 9/28/2007 | 9/28/2007 | 9/28/2007 |
|
|
|
|
|
Nasdaq symbol | EFVAX | EFVBX | EFVCX | EFVIX |
|
|
|
|
|
Cumulative return | | | | |
|
|
|
|
|
Since portfolio inception with sales charge | -13.35% | -13.16% | -9.51% | N/A |
|
|
|
|
|
Since portfolio inception w/o sales charge | -8.06% | -8.59% | -8.59% | -7.92% |
|
|
|
|
|
Maximum sales charge | 5.75% | 5.00% | 1.00% | N/A |
| Front-end | CDSC | CDSC | |
|
|
|
|
|
Past performance is no guarantee of future results. The performance quoted represents past performance and current performance may be lower or higher. The investment return and principal value of an investment will fluctuate so that investors’ shares, when redeemed, may be worth more or less than their original cost. To obtain performance information current to the most recent month-end for Classes A, B, C or I, please go to EvergreenInvestments.com/fundperformance. The performance of each class may vary based on differences in loads, fees and expenses paid by the shareholders investing in each class. Performance includes the reinvestment of income dividends and capital gain distributions. Performance shown does not reflect the deduction of taxes that a shareholder would pay on fund distributions or the redemption of fund shares.
Performance results are extremely short term, and may not provide an adequate basis for evaluating a fund's performance over varying market conditions or economic cycles. Unusual investment returns may be a result of a fund's recent inception, existing market and economic conditions and the increased potential of a small number of stocks affecting fund performance due to the smaller asset size. Most mutual funds are intended to be long-term investments.
The fund incurs a 12b-1 fee of 0.25% for Class A and 1.00% for Classes B and C. Class I does not pay a 12b-1 fee.
The advisor is waiving its advisory fee and reimbursing the fund for a portion of other expenses. Had the fee not been waived and expenses not reimbursed, returns would have been lower.
4
FUND AT A GLANCE continued

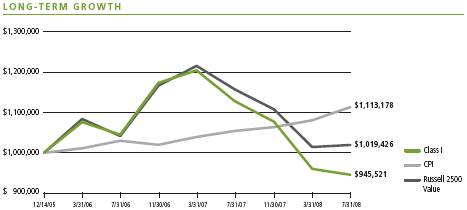
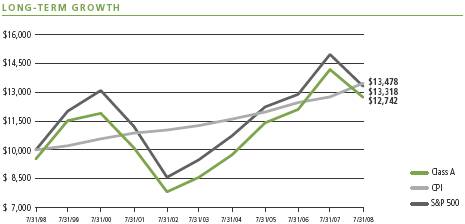
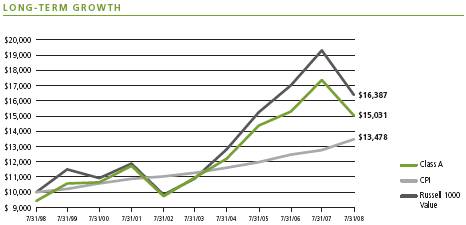
Comparison of a $10,000 investment in the Evergreen Fundamental Mid Cap Value Fund Class A shares versus a similar investment in the Russell Midcap Value Index (Russell Midcap Value) and the Consumer Price Index (CPI).
The Russell Midcap Value is an unmanaged market index and does not include transaction costs associated with buying and selling securities, any mutual fund fees or expenses or any taxes. The CPI is a commonly used measure of inflation and does not represent an investment return. It is not possible to invest directly in an index.
Class I shares are only offered, subject to the minimum initial purchase requirements, in the following manner: (1) to investment advisory clients of EIMC (or its advisory affiliates), (2) to employer- or state-sponsored benefit plans, including but not limited to, retirement plans, defined benefit plans, deferred compensation plans, or savings plans, (3) to fee-based mutual fund wrap accounts, (4) through arrangements entered into on behalf of the Evergreen funds with certain financial services firms, (5) to certain institutional investors, and (6) to persons who owned Class Y shares in registered name in an Evergreen fund on or before December 31, 1994 or who owned shares of any SouthTrust fund in registered name as of March 18, 2005 or who owned shares of Vestaur Securities Fund as of May 20, 2005.
Class I shares are only available to institutional shareholders with a minimum of $1 million investment, which may be waived in certain situations.
The fund’s investment objective may be changed without a vote of the fund’s shareholders.
Mid cap securities may be subject to special risks associated with narrower product lines and limited financial resources compared to their large cap counterparts, and, as a result, mid cap securities may decline significantly in market downturns.
The stocks of smaller companies may be more volatile than those of larger companies due to the higher risk of failure.
Value-based investments are subject to the risk that the broad market may not recognize their intrinsic value.
All data is as of July 31, 2008, and subject to change.
5
PORTFOLIO MANAGER COMMENTARY
The fund’s Class A shares returned -8.06% for the period ended July 31, 2008, excluding any applicable sales charges. During the same period, the Russell Midcap Value returned -15.02%.
The fund’s objective is to seek long-term capital growth.
Investment Process
The inaugural year for the fund was a successful one. Although absolute returns were disappointing, the fund outperformed its benchmark. Using the time-tested philosophy and process of Evergreen Special Values Fund (which we also manage), we sought to build a long-term portfolio of financially strong, quality companies trading at substantial discounts to intrinsic value. We believed that the process that had consistently performed well in the small cap universe had the potential to also generate superior results at the mid cap level.
The goal of the fund is to pursue above-average returns while employing a strategy of risk minimization. We seek to invest in high-quality companies only when we believe projected returns relative to the potential risk of capital losses are heavily in our favor. For each company that we analyze, we calculate intrinsic value using a financial buyer methodology. In other words, we ask the question “What price would a cash buyer pay for this business?” We also ask the question, “How much risk are we assuming should we buy (or continue to own) a particular stock?” The answers to these questions are what guide our capital allocation process.
The ten-month period ended July 31, 2008 was a challenging time for mid cap value investors. The launch of the fund almost perfectly coincided with the market’s recognition that the economy was slowing dramatically as a result of the housing slowdown and subsequent credit crisis. The fall of 2007 was characterized by the movement of capital to companies exposed to international economies in an effort to capture growth as well as benefit from the falling dollar. This trade worked well until the Federal Reserve Board abruptly and aggressively cut interest rates in the first quarter of 2008, sparking a brief rally in financials and domestically exposed companies. However, as oil continued its ascent, sparking inflation fears, and it became apparent that the banking sector was dealing with deeper credit issues, capital once again flowed to commodities and overseas exposure. The fund was able to perform well during the year due to superior stock selection as well as investment philosophy. Stock selection within the Financials, Consumer Discretionary and Technology sectors were notable bright spots. Our focus on quality and quantifiable downside risk kept us away from the numerous mid cap banking companies that were exposed to mortgage-related problems. Many banks experienced steep declines in their share prices. Recognition of risk drove a selling discipline that also served us well, as we were quick to capture returns and reallocate capital where returns relative to risk were more favorable, in our opinion.
6
PORTFOLIO MANAGER COMMENTARY continued
Contributors to performance
While several companies contributed to the fund’s performance, three in particular stand out as reflective of our philosophy and process.
LSI Corp., a semiconductor and storage systems company, declined in the fall of 2007 as a result of concerns regarding the recently completed Agere merger, as well as the market’s fear that LSI would not fare well in an economic downturn. We were first attracted to LSI because of its strong balance sheet, with over $1 per share in net cash. Second, we were also impressed with the substantial cash flow that the company generated and noted that GAAP earnings (earnings reported according to generally accepted accounting principles, or GAAP) were significantly penalized by purchase accounting. Essentially, cash earnings were substantially higher than reported GAAP earnings. Third, LSI has relatively new management that was focused on cost-cutting and margins. We used the short-sighted sell off in the shares as an opportunity to accumulate the stock.
Darden Restaurants, the owner of the Olive Garden and Red Lobster chains, was a top performer for us. Once again, we took advantage of market fears to build a sizable position. In the fall of 2007, Darden purchased Rare Hospitality for $1.2 billion in cash. This added a substantial but manageable amount of debt to Darden’s balance sheet at a time when the economy and the consumer were under pressure. The acquisition, although well conceived longer term, suffered from poor timing. Our knowledge of the company and understanding of the merger deal greatly assisted in our ability to confidently accumulate Darden shares. We initially accumulated shares in the $30-range only to see the shares fall to the low $20s as consumers pulled back in spending. We calculated intrinsic value near $50 and saw, in our opinion, a unique opportunity to purchase what we believed was a very high-quality company at a special price.
UnionBanCal, a West Coast bank, was purchased at an average cost of $47. Our attraction to the bank was its low exposure to residential loans and its underutilized balance sheet. Our calculation of intrinsic value was above $70 per share. We used market fears about the broad banking industry to pick up what we believed was a high-quality company at a very attractive price.
Detractors from performance
Assured Guaranty, a municipal bond insurer, was a significant detractor from performance. Our original attraction to Assured was its unique position within the industry. As competitors Ambac and MBIA suffered steep losses from their subprime exposure, Assured was able to garner increased market share. Our belief was that Assured had the best business model, and the profits from future municipal bond business would generate attractive returns for shareholders. In July of 2008, Moody’s hinted that it might withdraw its “A” rating for Assured. This came as a surprise to us as the market sent the shares substantially lower. We no longer own the stock.
7
PORTFOLIO MANAGER COMMENTARY continued
Everest RE Group, a property and casualty insurer, was a disappointment to us during the fiscal year. A soft market for insurance underwriting combined with a higher-than-expected charge for asbestos and environmental reserves led to a 25% decline in the price of the stock over the course of the fiscal year. We continue to own the stock as we currently believe that the stock is inexpensive at 7 times projected earnings and less than 1 times book value.
Portfolio Management outlook
We currently believe that the equity markets offer appealing opportunities for investors willing to look beyond the recent weakness brought on by problems in the housing industry and Financials sector. We believe that stocks with sensitivity to the U.S. economy are trading at attractive levels, and may garner increased investor focus as the developing economies currently exhibit signs of deceleration. Within Financials, we presently are intrigued with valuations that appear cheap relative to historical norms, but are being very selective, as we believe that risks and further write-downs remain ahead. In addition, given the relatively large outperformance of growth versus value investing over the past 18 months, we currently believe that the fund is well positioned to achieve attractive returns, despite the near-term challenges still present in the marketplace.
This commentary reflects the views and opinions of the fund’s portfolio manager(s) on the date indicated and may include statements that constitute “forward-looking statements” under the U.S. Securities laws. Forward-looking statements include, among other things, projections, estimates, and information about possible or future results related to the fund, markets, or regulatory developments. The views expressed above are not guarantees of future performance or economic results and involve certain risks, uncertainties, and assumptions that could cause actual outcomes and results to differ materially from the views expressed herein. The views expressed above are subject to change at any time based upon economic, market, or other conditions and Evergreen undertakes no obligation to update the views expressed herein. Any discussions of specific securities should not be considered a recommendation to buy or sell those securities. The views expressed herein (including any forward-looking statements) may not be relied upon as investment advice or as an indication of the fund’s trading intent.
You should carefully consider the fund’s investment objectives, policies, risks, charges and expenses before investing. To obtain a prospectus, which contains this and other important information visit www.EvergreenInvestments.com or call 1.800.847.5397. Please read the prospectus carefully before investing.
8
ABOUT YOUR FUND’S EXPENSES
The Example below is intended to describe the fees and expenses borne by shareholders and the impact of those costs on your investment.
Example
As a shareholder of the fund, you incur two types of costs: (1) transaction costs, including sales charges (loads), redemption fees and exchange fees; and (2) ongoing costs, including management fees, distribution (12b-1) fees and other fund expenses. This Example is intended to help you understand your ongoing costs (in dollars) of investing in the fund and to compare these costs with the ongoing costs of investing in other mutual funds. The Example is based on an investment of $1,000 invested at the beginning of the period and held for the entire period from February 1, 2008 to July 31, 2008.
The example illustrates your fund’s costs in two ways:
• Actual expenses
The section in the table under the heading “Actual” provides information about actual account values and actual expenses. You may use the information in these columns, together with the amount you invested, to estimate the expenses that you paid over the period. Simply divide your account value by $1,000 (for example, an $8,600 account value divided by $1,000 = 8.6), then multiply the result by the number in the appropriate column for your share class, in the column entitled “Expenses Paid During Period” to estimate the expenses you paid on your account during this period.
• Hypothetical example for comparison purposes
The section in the table under the heading “Hypothetical (5% return before expenses)” provides information about hypothetical account values and hypothetical expenses based on the fund’s actual expense ratio and an assumed rate of return of 5% per year before expenses, which is not the fund’s actual return. The hypothetical account values and expenses may not be used to estimate the actual ending account balance or expenses you paid for the period. You may use this information to compare the ongoing costs of investing in the fund and other funds. To do so, compare this 5% hypothetical example with the 5% hypothetical examples that appear in the shareholder reports of the other funds.
Please note that the expenses shown in the table are meant to highlight your ongoing costs only and do not reflect any transactional costs, such as sales charges (loads), redemption fees or exchange fees. Therefore, the section in the table under the heading “Hypothetical (5% return before expenses)” is useful in comparing ongoing costs only, and will not help you determine the relative total costs of owning different funds. In addition, if these transactional costs were included, your costs would have been higher.
| Beginning
Account Value
2/1/2008 | Ending
Account Value
7/31/2008 | Expenses Paid
During Period* |
|
|
|
|
Actual | | | |
Class A | $1,000.00 | $ 980.77 | $ 6.16 |
Class B | $1,000.00 | $ 976.50 | $ 9.83 |
Class C | $1,000.00 | $ 976.50 | $ 9.83 |
Class I | $1,000.00 | $ 981.84 | $ 4.93 |
Hypothetical | | | |
(5% return before expenses) | | | |
Class A | $1,000.00 | $1,018.65 | $ 6.27 |
Class B | $1,000.00 | $1,014.92 | $10.02 |
Class C | $1,000.00 | $1,014.92 | $10.02 |
Class I | $1,000.00 | $1,019.89 | $ 5.02 |
|
|
|
|
* | For each class of the fund, expenses are equal to the annualized expense ratio of each class (1.25% for Class A, 2.00% for Class B, 2.00% for Class C and 1.00% for Class I), multiplied by the average account value over the period, multiplied by 182 / 366 days. |
9
FINANCIAL HIGHLIGHTS
(For a share outstanding throughout the period)
CLASS A | | Period Ended
July 31, 20081 |
|
|
|
|
Net asset value, beginning of period | | $ | 10.00 |
|
|
|
|
Income from investment operations | | | |
Net investment income (loss) | | | 0.05 |
Net realized and unrealized gains or losses on investments | | | (0.87) |
| |
|
|
Total from investment operations | | | (0.82) |
|
|
|
|
Distributions to shareholders from | | | |
Net investment income | | | (0.01) |
|
|
|
|
Net asset value, end of period | | $ | 9.17 |
|
|
|
|
Total return2 | | | (8.06%) |
|
|
|
|
Ratios and supplemental data | | | |
Net assets, end of period (thousands) | | $ | 390 |
Ratios to average net assets | | | |
Expenses including waivers/reimbursements but excluding expense reductions | | | 1.25%3 |
Expenses excluding waivers/reimbursements and expense reductions | | | 13.49%3 |
Net investment income (loss) | | | 0.71%3 |
Portfolio turnover rate | | | 120% |
|
|
|
|
1 | For the period from September 28, 2007 (commencement of class operations), to July 31, 2008. |
2 | Excluding applicable sales charges |
See Notes to Financial Statements
10
FINANCIAL HIGHLIGHTS
(For a share outstanding throughout the period)
CLASS B | | Period Ended
July 31, 20081 |
|
|
|
Net asset value, beginning of period | | $ | 10.00 |
|
|
|
|
Income from investment operations | | | |
Net investment income (loss) | | | 0 |
Net realized and unrealized gains or losses on investments | | | (0.87) |
| |
|
|
Total from investment operations | | | (0.87) |
|
|
|
|
Distributions to shareholders from | | | |
Net investment income | | | 02 |
|
|
|
|
Net asset value, end of period | | $ | 9.13 |
|
|
|
|
Total return3 | | | (8.59%) |
|
|
|
|
Ratios and supplemental data | | | |
Net assets, end of period (thousands) | | $ | 308 |
Ratios to average net assets | | | |
Expenses including waivers/reimbursements but excluding expense reductions | | | 2.00%4 |
Expenses excluding waivers/reimbursements and expense reductions | | | 14.24%4 |
Net investment income (loss) | | | (0.04)%4 |
Portfolio turnover rate | | | 120% |
|
|
|
|
1 | For the period from September 28, 2007 (commencement of class operations), to July 31, 2008. |
2 | Amount represents less than $0.005 per share. |
3 | Excluding applicable sales charges |
See Notes to Financial Statements
11
FINANCIAL HIGHLIGHTS
(For a share outstanding throughout the period)
CLASS C | | Period Ended
July 31, 20081 |
|
|
|
Net asset value, beginning of period | | $ | 10.00 |
|
|
|
|
Income from investment operations | | | |
Net investment income (loss) | | | 0 |
Net realized and unrealized gains or losses on investments | | | (0.86) |
| |
|
|
Total from investment operations | | | (0.86) |
|
|
|
|
Distributions to shareholders from | | | |
Net investment income | | | 02 |
|
|
|
|
Net asset value, end of period | | $ | 9.14 |
|
|
|
|
Total return3 | | | (8.59%) |
|
|
|
|
Ratios and supplemental data | | | |
Net assets, end of period (thousands) | | $ | 1,107 |
Ratios to average net assets | | | |
Expenses including waivers/reimbursements but excluding expense reductions | | | 2.00%4 |
Expenses excluding waivers/reimbursements and expense reductions | | | 14.24%4 |
Net investment income (loss) | | | (0.01)%4 |
Portfolio turnover rate | | | 120% |
|
|
|
|
1 | For the period from September 28, 2007 (commencement of class operations), to July 31, 2008. |
2 | Amount represents less than $0.005 per share. |
3 | Excluding applicable sales charges |
See Notes to Financial Statements
12
FINANCIAL HIGHLIGHTS
(For a share outstanding throughout the period)
CLASS I | | Period Ended
July 31, 20081 |
|
|
|
Net asset value, beginning of period | | $ | 10.00 |
|
|
|
|
Income from investment operations | | | |
Net investment income (loss) | | | 0.06 |
Net realized and unrealized gains or losses on investments | | | (0.85) |
| |
|
|
Total from investment operations | | | (0.79) |
|
|
|
|
Distributions to shareholders from | | | |
Net investment income | | | (0.02) |
|
|
|
|
Net asset value, end of period | | $ | 9.19 |
|
|
|
|
Total return | | | (7.92%) |
|
|
|
|
Ratios and supplemental data | | | |
Net assets, end of period (thousands) | | $ | 465 |
Ratios to average net assets | | | |
Expenses including waivers/reimbursements but excluding expense reductions | | | 1.00%2 |
Expenses excluding waivers/reimbursements and expense reductions | | | 13.24%2 |
Net investment income (loss) | | | 1.01%2 |
Portfolio turnover rate | | | 120% |
|
|
|
|
1 | For the period from September 28, 2007 (commencement of class operations), to July 31, 2008. |
See Notes to Financial Statements
13
SCHEDULE OF INVESTMENTS
July 31, 2008
| | Shares | | | Value |
|
|
|
|
|
|
|
COMMON STOCKS 90.5% | | | | | | |
CONSUMER DISCRETIONARY 13.2% | | | | | | |
Hotels, Restaurants & Leisure 3.7% | | | | | | |
Darden Restaurants, Inc. | | | 924 | | $ | 30,095 |
Wendy’s International, Inc. | | | 2,395 | | | 54,965 |
| | | | |
|
|
| | | | | | 85,060 |
| | | | |
|
|
Household Durables 1.1% | | | | | | |
Snap-On, Inc. | | | 425 | | | 23,923 |
| | | | |
|
|
Internet & Catalog Retail 1.2% | | | | | | |
IAC/InterActiveCorp * | | | 1,528 | | | 26,679 |
| | | | |
|
|
Media 3.8% | | | | | | |
E.W. Scripps Co., Class A | | | 898 | | | 36,405 |
McGraw-Hill Cos. | | | 451 | | | 18,342 |
Washington Post Co., Class B | | | 50 | | | 30,913 |
| | | | |
|
|
| | | | | | 85,660 |
| | | | |
|
|
Multi-line Retail 1.5% | | | | | | |
Sears Holdings Corp. * | | | 422 | | | 34,182 |
| | | | |
|
|
Specialty Retail 1.9% | | | | | | |
AnnTaylor Stores Corp. * | | | 1,944 | | | 43,837 |
| | | | |
|
|
CONSUMER STAPLES 3.1% | | | | | | |
Food Products 2.4% | | | | | | |
Sara Lee Corp. | | | 3,916 | | | 53,493 |
| | | | |
|
|
Household Products 0.7% | | | | | | |
Clorox Co. | | | 301 | | | 16,404 |
| | | | |
|
|
ENERGY 10.0% | | | | | | |
Energy Equipment & Services 1.8% | | | | | | |
Atwood Oceanics, Inc. * | | | 872 | | | 40,034 |
| | | | |
|
|
Oil, Gas & Consumable Fuels 8.2% | | | | | | |
Cimarex Energy Co. | | | 1,000 | | | 52,110 |
Mariner Energy, Inc. * | | | 1,222 | | | 32,334 |
Newfield Exploration Co. * | | | 414 | | | 20,277 |
Pioneer Natural Resources Co. | | | 673 | | | 40,010 |
St. Mary Land & Exploration Co. | | | 971 | | | 41,326 |
| | | | |
|
|
| | | | | | 186,057 |
| | | | |
|
|
FINANCIALS 21.0% | | | | | | |
Commercial Banks 6.2% | | | | | | |
Cullen/Frost Bankers, Inc. | | | 924 | | | 48,732 |
National City Corp. | | | 2,039 | | | 9,644 |
UnionBanCal Corp. | | | 1,522 | | | 81,762 |
| | | | |
|
|
| | | | | | 140,138 |
| | | | |
|
|
See Notes to Financial Statements
14
SCHEDULE OF INVESTMENTS continued
July 31, 2008
| | Shares | | | Value |
|
|
|
|
|
|
|
COMMON STOCKS continued | | | | | | |
FINANCIALS continued | | | | | | |
Insurance 11.9% | | | | | | |
Brown & Brown, Inc. | | | 2,591 | | $ | 45,524 |
Everest Re Group, Ltd. | | | 1,198 | | | 97,997 |
Fidelity National Financial, Inc., Class A | | | 2,148 | | | 28,697 |
White Mountains Insurance Group, Ltd. | | | 224 | | | 97,776 |
| | | | |
|
|
| | | | | | 269,994 |
| | | | |
|
|
Real Estate Investment Trusts 0.5% | | | | | | |
Annaly Capital Management, Inc. | | | 831 | | | 12,523 |
| | | | |
|
|
Real Estate Management & Development 1.1% | | | | | | |
Brookfield Properties Corp. | | | 1,302 | | | 24,582 |
| | | | |
|
|
Thrifts & Mortgage Finance 1.3% | | | | | | |
People’s United Financial, Inc. | | | 1,777 | | | 30,173 |
| | | | |
|
|
HEALTH CARE 1.8% | | | | | | |
Pharmaceuticals 1.8% | | | | | | |
Endo Pharmaceuticals Holdings, Inc. * | | | 1,127 | | | 26,090 |
Forest Laboratories, Inc. * | | | 398 | | | 14,133 |
| | | | |
|
|
| | | | | | 40,223 |
| | | | |
|
|
INDUSTRIALS 14.4% | | | | | | |
Air Freight & Logistics 1.6% | | | | | | |
UTi Worldwide, Inc. | | | 1,971 | | | 35,853 |
| | | | |
|
|
Commercial Services & Supplies 4.0% | | | | | | |
Avery Dennison Corp. | | | 950 | | | 41,809 |
Monster Worldwide, Inc. * | | | 2,697 | | | 47,845 |
| | | | |
|
|
| | | | | | 89,654 |
| | | | |
|
|
Electrical Equipment 2.0% | | | | | | |
Belden, Inc. | | | 1,247 | | | 46,039 |
| | | | |
|
|
Machinery 4.0% | | | | | | |
Dover Corp. | | | 523 | | | 25,957 |
Eaton Corp. | | | 501 | | | 35,591 |
Timken Co. | | | 902 | | | 29,784 |
| | | | |
|
|
| | | | | | 91,332 |
| | | | |
|
|
Road & Rail 2.8% | | | | | | |
Con-Way, Inc. | | | 1,272 | | | 64,312 |
| | | | |
|
|
INFORMATION TECHNOLOGY 14.5% | | | | | | |
Communications Equipment 0.5% | | | | | | |
CommScope, Inc. * | | | 275 | | | 12,262 |
| | | | |
|
|
See Notes to Financial Statements
15
SCHEDULE OF INVESTMENTS continued
July 31, 2008
| | Shares | | | Value |
|
|
|
|
|
|
|
COMMON STOCKS continued | | | | | | |
INFORMATION TECHNOLOGY continued | | | | | | |
Computers & Peripherals 6.0% | | | | | | |
Imation Corp. | | | 3,176 | | $ | 60,534 |
Lexmark International, Inc., Class A * | | | 1,473 | | | 51,673 |
Sun Microsystems, Inc. * | | | 2,305 | | | 24,502 |
| | | | |
|
|
| | | | | | 136,709 |
| | | | |
|
|
Electronic Equipment & Instruments 1.8% | | | | | | |
Ingram Micro, Inc., Class A * | | | 2,241 | | | 41,302 |
| | | | |
|
|
IT Services 3.9% | | | | | | |
Computer Sciences Corp. * | | | 422 | | | 19,990 |
Fidelity National Information Services, Inc. | | | 182 | | | 3,489 |
Global Payments, Inc. | | | 1,450 | | | 64,221 |
| | | | |
|
|
| | | | | | 87,700 |
| | | | |
|
|
Semiconductors & Semiconductor Equipment 1.3% | | | | | | |
LSI Corp. * | | | 4,133 | | | 28,683 |
| | | | |
|
|
Software 1.0% | | | | | | |
Check Point Software Technologies, Ltd. * | | | 1,020 | | | 23,287 |
| | | | |
|
|
MATERIALS 5.4% | | | | | | |
Containers & Packaging 5.4% | | | | | | |
Owens-Illinois, Inc. * | | | 1,496 | | | 63,191 |
Pactiv Corp. * | | | 2,444 | | | 58,925 |
| | | | |
|
|
| | | | | | 122,116 |
| | | | |
|
|
TELECOMMUNICATION SERVICES 1.5% | | | | | | |
Diversified Telecommunication Services 1.5% | | | | | | |
CenturyTel, Inc. | | | 727 | | | 27,037 |
Embarq Corp. | | | 153 | | | 7,003 |
| | | | |
|
|
| | | | | | 34,040 |
| | | | |
|
|
UTILITIES 5.6% | | | | | | |
Electric Utilities 3.8% | | | | | | |
Mirant Corp. * | | | 1,348 | | | 41,262 |
Westar Energy, Inc. | | | 2,028 | | | 44,778 |
| | | | |
|
|
| | | | | | 86,040 |
| | | | |
|
|
Multi-Utilities 1.8% | | | | | | |
Ameren Corp. | | | 1,024 | | | 42,076 |
| | | | |
|
|
Total Common Stocks (cost $2,203,105) | | | | | | 2,054,367 |
| | | | |
|
|
EXCHANGE TRADED FUND 3.2% | | | | | | |
iShares Russell Midcap Value Index Fund (cost $83,970) | | | 1,717 | | | 72,269 |
| | | | |
|
|
See Notes to Financial Statements
16
SCHEDULE OF INVESTMENTS continued
July 31, 2008
| | Shares | | | Value |
|
|
|
|
|
|
SHORT-TERM INVESTMENTS 11.1% | | | | | |
MUTUAL FUND SHARES 11.1% | | | | | |
Evergreen Institutional Money Market Fund, Class I, 2.54% q ø (cost $252,079) | | 252,079 | | $ | 252,079 |
| | | |
|
|
Total Investments (cost $2,539,154) 104.8% | | | | | 2,378,715 |
Other Assets and Liabilities (4.8%) | | | | | (108,512) |
| | | |
|
|
Net Assets 100.0% | | | | $ | 2,270,203 |
| | | |
|
|
* | Non-income producing security |
q | Rate shown is the 7-day annualized yield at period end. |
ø | Evergreen Investment Management Company, LLC is the investment advisor to both the Fund and the money market fund. |
The following table shows the percent of total long-term investments by sector as of July 31, 2008:
Financials | 22.5% |
Information Technology | 15.5% |
Industrials | 15.4% |
Consumer Discretionary | 14.1% |
Energy | 10.6% |
Utilities | 6.0% |
Materials | 5.7% |
Consumer Staples | 3.3% |
Health Care | 1.9% |
Telecommunication Services | 1.6% |
Other | 3.4% |
|
|
| 100.0% |
|
|
See Notes to Financial Statements
17
STATEMENT OF ASSETS AND LIABILITIES
July 31, 2008
Assets | | | |
Investments in securities, at value (cost $2,287,075) | | $ | 2,126,636 |
Investments in affiliated money market fund, at value (cost $252,079) | | | 252,079 |
|
|
|
|
Total investments | | | 2,378,715 |
Receivable for securities sold | | | 30,123 |
Receivable for Fund shares sold | | | 19,161 |
Dividends receivable | | | 1,766 |
Receivable from investment advisor | | | 453 |
Prepaid expenses and other assets | | | 26,612 |
|
|
|
|
Total assets | | | 2,456,830 |
|
|
|
|
Liabilities | | | |
Payable for securities purchased | | | 57,339 |
Distribution Plan expenses payable | | | 40 |
Due to affiliate | | | 110,715 |
Due to other related parties | | | 527 |
Printing and postage expenses payable | | | 10,412 |
Accrued expenses and other liabilities | | | 7,594 |
|
|
|
|
Total liabilities | | | 186,627 |
|
|
|
|
Net assets | | $ | 2,270,203 |
|
|
|
|
Net assets represented by | | | |
Paid-in capital | | $ | 2,440,279 |
Undistributed net investment income | | | 3,220 |
Accumulated net realized losses on investments | | | (12,857) |
Net unrealized losses on investments | | | (160,439) |
|
|
|
|
Total net assets | | $ | 2,270,203 |
|
|
|
|
Net assets consists of | | | |
Class A | | $ | 390,049 |
Class B | | | 308,221 |
Class C | | | 1,106,808 |
Class I | | | 465,125 |
|
|
|
|
Total net assets | | $ | 2,270,203 |
|
|
|
|
Shares outstanding (unlimited number of shares authorized) | | | |
Class A | | | 42,513 |
Class B | | | 33,742 |
Class C | | | 121,141 |
Class I | | | 50,613 |
|
|
|
|
Net asset value per share | | | |
Class A | | $ | 9.17 |
Class A — Offering price (based on sales charge of 5.75%) | | $ | 9.73 |
Class B | | $ | 9.13 |
Class C | | $ | 9.14 |
Class I | | $ | 9.19 |
|
|
|
|
See Notes to Financial Statements
18
STATEMENT OF OPERATIONS
Period Ended July 31, 2008 (a)
| | | |
| | | |
Investment income | | | |
Dividends (net of foreign withholding taxes of $30) | | $ | 17,991 |
Income from affiliate | | | 4,354 |
|
|
|
|
Total investment income | | | 22,345 |
|
|
|
|
Expenses | | | |
Advisory fee | | | 7,323 |
Distribution Plan expenses | | | |
Class A | | | 625 |
Class B | | | 2,162 |
Class C | | | 4,192 |
Administrative services fee | | | 1,125 |
Transfer agent fees | | | 309 |
Trustees’ fees and expenses | | | 1,016 |
Printing and postage expenses | | | 16,000 |
Custodian and accounting fees | | | 2,080 |
Registration and filing fees | | | 93,146 |
Professional fees | | | 27,152 |
Other | | | 1,001 |
|
|
|
|
Total expenses | | | 156,131 |
Less: Expense reductions | | | (7) |
Fee waivers and expense reimbursements | | | (137,879) |
|
|
|
|
Net expenses | | | 18,245 |
|
|
|
|
Net investment income | | | 4,100 |
|
|
|
|
Net realized and unrealized gains or losses on investments | | | |
Net realized losses on investments | | | (12,857) |
Net change in unrealized gains or losses on investments | | | (160,439) |
|
|
|
|
Net realized and unrealized gains or losses on investments | | | (173,296) |
|
|
|
|
Net decrease in net assets resulting from operations | | $ | (169,196) |
|
|
|
|
(a) For the period from September 28, 2007 (commencement of operations), to July 31, 2008. | | | |
See Notes to Financial Statements
19
STATEMENT OF CHANGES IN NET ASSETS
| | Period Ended
July 31, 2008 (a) |
|
|
|
Operations | | | | | |
Net investment income | | | | $ | 4,100 |
Net realized losses on investments | | | | | (12,857) |
Net change in unrealized gains or losses on investments | | | | | (160,439) |
|
|
|
|
|
|
Net decrease in net assets resulting from operations | | | | | (169,196) |
|
|
|
|
|
|
Distributions to shareholders from | | | | | |
Net investment income | | | | | |
Class A | | | | | (366) |
Class B | | | | | (23) |
Class C | | | | | (23) |
Class I | | | | | (468) |
|
|
|
|
|
|
Total distributions to shareholders | | | | | (880) |
|
|
|
|
|
|
| | Shares | | | |
|
|
|
|
|
|
Capital share transactions | | | | | |
Proceeds from shares sold | | | | | |
Class A | | 43,029 | | | 423,823 |
Class B | | 36,282 | | | 359,720 |
Class C | | 122,828 | | | 1,187,779 |
Class I | | 50,625 | | | 512,670 |
|
|
|
|
|
|
| | | | | 2,483,992 |
|
|
|
|
|
|
Payment for shares redeemed | | | | | |
Class A | | (516) | | | (4,770) |
Class B | | (2,540) | | | (23,409) |
Class C | | (1,687) | | | (15,419) |
Class I | | (12) | | | (115) |
|
|
|
|
|
|
| | | | | (43,713) |
|
|
|
|
|
|
Net increase in net assets resulting from capital share transactions | | | | | 2,440,279 |
|
|
|
|
|
|
Total increase in net assets | | | | | 2,270,203 |
Net assets | | | | | |
Beginning of period | | | | | 0 |
|
|
|
|
|
|
End of period | | | | $ | 2,270,203 |
|
|
|
|
|
|
Undistributed net investment income | | | | $ | 3,220 |
|
|
|
|
|
|
(a) | For the period from September 28, 2007 (commencement of operations), to July 31, 2008. |
See Notes to Financial Statements
20
NOTES TO FINANCIAL STATEMENTS
1. ORGANIZATION
Evergreen Fundamental Mid Cap Value Fund (the “Fund”) is a diversified series of Evergreen Equity Trust (the “Trust”), a Delaware statutory trust organized on September 18, 1997. The Trust is an open-end management investment company registered under the Investment Company Act of 1940, as amended (the “1940 Act”).
The Fund offers Class A, Class B, Class C and Class I shares. Class A shares are sold with a front-end sales charge. However, Class A share investments of $1 million or more are not subject to a front-end sales charge but are subject to a contingent deferred sales charge of 1.00% upon redemption within 18 months. Class B shares are sold without a front-end sales charge but are subject to a contingent deferred sales charge that is payable upon redemption and decreases depending on how long the shares have been held. Class C shares are sold without a front-end sales charge but are subject to a contingent deferred sales charge that is payable upon redemption within one year. Class I shares are sold without a front-end sales charge or contingent deferred sales charge. Each class of shares, except Class I shares, pays an ongoing distribution fee.
2. SIGNIFICANT ACCOUNTING POLICIES
The following is a summary of significant accounting policies consistently followed by the Fund in the preparation of its financial statements. The policies are in conformity with generally accepted accounting principles in the United States of America, which require management to make estimates and assumptions that affect amounts reported herein. Actual results could differ from these estimates.
a. Valuation of investments
Listed equity securities are usually valued at the last sales price or official closing price on the national securities exchange where the securities are principally traded.
Investments in open-end mutual funds are valued at net asset value. Securities for which market quotations are not readily available or not reflective of current market value are valued at fair value as determined by the investment advisor in good faith, according to procedures approved by the Board of Trustees.
b. Security transactions and investment income
Security transactions are recorded on trade date. Realized gains and losses are computed using the specific cost of the security sold. Dividend income is recorded on the ex-dividend date. Foreign income and capital gains realized on some securities may be subject to foreign taxes, which are accrued as applicable.
c. Federal and other taxes
The Fund intends to qualify as a regulated investment company and distribute all of its taxable income, including any net capital gains. Accordingly, no provision for federal taxes is required. The Fund has adopted the provisions of FASB Interpretation No. 48, Accounting for Uncertainty in Income Taxes (“FIN 48”) which prescribes a minimum
21
NOTES TO FINANCIAL STATEMENTS continued
threshold for financial statement recognition of the benefit of a tax position taken or expected to be taken in a tax return. The Fund’s financial statements have not been impacted by the adoption of FIN 48. The Fund’s income and excise tax returns and all financial records supporting those returns are subject to examination by the federal, Massachusetts and Delaware revenue authorities.
d. Distributions
Distributions to shareholders from net investment income and net realized gains, if any, are recorded on the ex-dividend date. Such distributions are determined in conformity with income tax regulations, which may differ from generally accepted accounting principles.
e. Class allocations
Income, common expenses and realized and unrealized gains and losses are allocated to the classes based on the relative net assets of each class. Distribution fees, if any, are calculated daily at the class level based on the appropriate net assets of each class and the specific expense rates applicable to each class.
3. ADVISORY FEE AND OTHER TRANSACTIONS WITH AFFILIATES
Evergreen Investment Management Company, LLC (“EIMC”), an indirect, wholly-owned subsidiary of Wachovia Corporation (“Wachovia”), is the investment advisor to the Fund and is paid an annual fee starting at 0.65% and declining to 0.60% as average daily net assets increase. For the period ended July 31, 2008, the advisory fee was equivalent to 0.65% of the Fund’s average daily net assets (on an annualized basis).
From time to time, EIMC may voluntarily or contractually waive its fee and/or reimburse expenses in order to limit operating expenses. During the period ended July 31, 2008, EIMC voluntarily waived its advisory fee in the amount of $7,323 and reimbursed other expenses in the amount of $130,556.
The Fund may invest in money market funds which are advised by EIMC. Income earned on these investments is included in income from affiliate on the Statement of Operations.
Effective January 1, 2008, EIMC replaced Evergreen Investment Services, Inc. (“EIS”), an indirect, wholly-owned subsidiary of Wachovia, as the administrator to the Fund upon the assignment of the Fund’s Administrative Services Agreement from EIS to EIMC. There were no changes to the services being provided or fees being paid by the Fund. The administrator provides the Fund with facilities, equipment and personnel and is paid an annual rate determined by applying percentage rates to the aggregate average daily net assets of the Evergreen funds (excluding money market funds) starting at 0.10% and declining to 0.05% as the aggregate average daily net assets of the Evergreen funds (excluding money market funds) increase. For the year ended July 31, 2008, the administration services fee was equivalent to 0.10% of the Fund’s average daily net assets (on an annualized basis).
22
NOTES TO FINANCIAL STATEMENTS continued
During the period ended July 31, 2008, the Fund incurred expenses during its inception which were paid by EIMC on the Fund’s behalf. These amounts which will be reimbursed to EIMC are reflected in the payable to affiliate on the Statement of Assets and Liabilities.
Evergreen Service Company, LLC (“ESC”), an indirect, wholly-owned subsidiary of Wachovia, is the transfer and dividend disbursing agent for the Fund. ESC receives account fees that vary based on the type of account held by the shareholders in the Fund.
The Fund has placed a portion of its portfolio transactions with brokerage firms that are affiliates of Wachovia. During the period ended July 31, 2008, the Fund paid brokerage commissions of $72 to Wachovia Securities, LLC.
4. DISTRIBUTION PLANS
EIS serves as distributor of the Fund’s shares. The Fund has adopted Distribution Plans, as allowed by Rule 12b-1 of the 1940 Act, for each class of shares, except Class I. Under the Distribution Plans, the Fund is permitted to pay distribution fees at an annual rate of up to 0.75% of the average daily net assets for Class A and up to 1.00% of the average daily net assets for each of Class B and Class C. However, currently the distribution fees for Class A are limited to 0.25% of the average daily net assets of the class.
For the period ended July 31, 2008, EIS received $213 from the sale of Class A shares and $15 in contingent deferred sales charges from redemptions of Class B shares.
5. INVESTMENT TRANSACTIONS
Cost of purchases and proceeds from sales of investment securities (excluding short-term securities) were $3,845,765 and $1,546,086, respectively, for the period ended July 31, 2008.
On July 31, 2008, the aggregate cost of securities for federal income tax purposes was $2,548,803. The gross unrealized appreciation and depreciation on securities based on tax cost was $37,618 and $207,706, respectively, with a net unrealized depreciation of $170,088.
For income tax purposes, capital losses incurred after October 31 within the Fund’s fiscal year are deemed to arise on the first business day of the following fiscal year. As of July 31, 2008, the Fund incurred and will elect to defer post-October losses of $3,484.
6. INTERFUND LENDING
Pursuant to an Exemptive Order issued by the SEC, the Fund may participate in an interfund lending program with certain funds in the Evergreen fund family. This program allows the Fund to borrow from, or lend money to, other participating funds. During the period ended July 31, 2008, the Fund did not participate in the interfund lending program.
23
NOTES TO FINANCIAL STATEMENTS continued
7. DISTRIBUTIONS TO SHAREHOLDERS
As of July 31, 2008, the components of distributable earnings on a tax basis were as follows:
Undistributed
Ordinary
Income | Unrealized
Depreciation | Post-October
Losses |
|
|
|
$3,496 | $ 170,088 | $ 3,484 |
|
|
|
The differences between the components of distributable earnings on a tax basis and the amounts reflected in the Statement of Assets and Liabilities are primarily due to wash sales. Additionally, short-term capital gains are considered ordinary income for income tax purposes.
The tax character of distributions paid was $880 of ordinary income for the period ended July 31, 2008.
8. EXPENSE REDUCTIONS
Through expense offset arrangements with ESC and the Fund’s custodian, a portion of fund expenses has been reduced.
9. DEFERRED TRUSTEES’ FEES
Each Trustee of the Fund may defer any or all compensation related to performance of his or her duties as a Trustee. The Trustees’ deferred balances are allocated to deferral accounts, which are included in the accrued expenses for the Fund. The investment performance of the deferral accounts is based on the investment performance of certain Evergreen funds. Any gains earned or losses incurred in the deferral accounts are reported in the Fund’s Trustees’ fees and expenses. At the election of the Trustees, the deferral account will be paid either in one lump sum or in quarterly installments for up to ten years.
10. FINANCING AGREEMENT
The Fund and certain other Evergreen funds share in a $100 million unsecured revolving credit commitment for temporary and emergency purposes, including the funding of redemptions, as permitted by each participating fund’s borrowing restrictions. Borrowings under this facility bear interest at 0.50% per annum above the Federal Funds rate. Effective February 22, 2008, the Fund was eligible to participate in the $100 million credit facility. All of the participating funds are charged an annual commitment fee of 0.09% on the unused balance, which is allocated pro rata. Prior to June 27, 2008, the annual commitment fee was 0.08%. During the period ended July 31, 2008, the Fund had no borrowings.
24
NOTES TO FINANCIAL STATEMENTS continued
11. REGULATORY MATTERS AND LEGAL PROCEEDINGS
Pursuant to an administrative order issued by the SEC on September 19, 2007, EIMC, EIS, ESC (collectively, the “Evergreen Entities”), Wachovia Securities, LLC and the SEC have entered into an agreement settling allegations of (i) improper short-term trading arrangements in effect prior to May 2003 involving former officers and employees of EIMC and certain broker-dealers, (ii) insufficient systems for monitoring exchanges and enforcing exchange limitations as stated in certain funds’ prospectuses, and (iii) inadequate e-mail retention practices. Under the settlement, the Evergreen Entities were censured and have paid approximately $32 million in disgorgement and penalties. This amount, along with a fine assessed by the SEC against Wachovia Securities, LLC will be distributed pursuant to a plan to be developed by an independent distribution consultant and approved by the SEC. The Evergreen Entities neither admitted nor denied the allegations and findings set forth in its settlement with the SEC.
In addition, the Evergreen funds and EIMC and certain of its affiliates are involved in various legal actions, including private litigation and class action lawsuits. EIMC does not expect that any of such legal actions currently pending or threatened will have a material adverse impact on the financial position or operations of any of the Evergreen funds or on EIMC’s ability to provide services to the Evergreen funds.
Although EIMC believes that none of the matters discussed above will have a material adverse impact on the Evergreen funds, there can be no assurance that these matters and any publicity surrounding or resulting from them will not result in reduced sales or increased redemptions of Evergreen fund shares, which could increase Evergreen fund transaction costs or operating expenses, or that they will not have other adverse consequences on the Evergreen funds.
12. NEW ACCOUNTING PRONOUNCEMENTS
In September 2006, FASB issued Statement of Financial Accounting Standards No. 157, Fair Value Measurements (“FAS 157”). FAS 157 establishes a single authoritative definition of fair value, establishes a framework for measuring fair value and expands disclosures about fair value measurements. FAS 157 applies to fair value measurements already required or permitted by existing standards. The change to current generally accepted accounting principles from the application of FAS 157 relates to the definition of fair value, the methods used to measure fair value, and the expanded disclosures about fair value measurements. Management of the Fund does not believe the adoption of FAS 157 will materially impact the financial statement amounts, however, additional disclosures will be required about the inputs used to develop the measurements and the effect of certain of the measurements on changes in net assets for the period. FAS 157 is effective for financial statements issued for fiscal years beginning after November 15, 2007 and interim periods within those fiscal years.
25
NOTES TO FINANCIAL STATEMENTS continued
In March 2008, FASB issued Statement of Financial Accounting Standards No. 161, Disclosures about Derivative Instruments and Hedging Activities (“FAS 161”), an amendment of FASB Statement No. 133. FAS 161 requires enhanced disclosures about (a) how and why a fund uses derivative instruments, (b) how derivative instruments and hedging activities are accounted for, and (c) how derivative instruments and related hedging activities affect a fund’s financial position, financial performance, and cash flows. Management of the Fund does not believe the adoption of FAS 161 will materially impact the financial statement amounts, but will require additional disclosures. This will include qualitative and quantitative disclosures on derivative positions existing at period end and the effect of using derivatives during the reporting period. FAS 161 is effective for financial statements issued for fiscal years and interim periods beginning after November 15, 2008.
26
REPORT OF INDEPENDENT REGISTERED PUBLIC ACCOUNTING FIRM
Board of Trustees and Shareholders
Evergreen Equity Trust
We have audited the accompanying statement of assets and liabilities, including the schedule of investments, of the Evergreen Fundamental Mid Cap Value Fund, a series of the Evergreen Equity Trust, as of July 31, 2008 and the related statement of operations, statement of changes in net assets and the financial highlights for the period from September 28, 2007 (commencement of operations) to July 31, 2008. These financial statements and financial highlights are the responsibility of the Fund’s management. Our responsibility is to express an opinion on these financial statements and financial highlights based on our audit.
We conducted our audit in accordance with the standards of the Public Company Accounting Oversight Board (United States). Those standards require that we plan and perform the audit to obtain reasonable assurance about whether the financial statements and financial highlights are free of material misstatement. An audit includes examining, on a test basis, evidence supporting the amounts and disclosures in the financial statements. Our procedures included confirmation of securities owned as of July 31, 2008 by correspondence with the custodian and brokers, or by other appropriate auditing procedures where replies from brokers were not received. An audit also includes assessing the accounting principles used and significant estimates made by management, as well as evaluating the overall financial statement presentation. We believe that our audit provides a reasonable basis for our opinion.
In our opinion, the financial statements and financial highlights referred to above present fairly, in all material respects, the financial position of the Evergreen Fundamental Mid Cap Value Fund as of July 31, 2008, the results of its operations, changes in its net assets and financial highlights for the period from September 28, 2007 (commencement of operations) to July 31, 2008, in conformity with U.S. generally accepted accounting principles.

Boston, Massachusetts
September 29, 2008
27
ADDITIONAL INFORMATION (unaudited)
FEDERAL TAX DISTRIBUTIONS
For corporate shareholders, 100% of ordinary income dividends paid during the fiscal year ended July 31, 2008 qualified for the dividends received deduction.
With respect to dividends paid from investment company taxable income during the fiscal year ended July 31, 2008, the Fund designates 100% of ordinary income and any short-term capital gain distributions as Qualified Dividend Income in accordance with the Internal Revenue Code. Complete 2008 year-end tax information will be reported on your 2008 Form 1099-DIV, which shall be provided to you in early 2009.
Pursuant to Section 871 of the Internal Revenue Code, $276 has been designated as Qualified Short-Term Gains for purposes of exempting withholding of tax on distributions to nonresident alien shareholders.
28
This page left intentionally blank
29
This page left intentionally blank
30
This page left intentionally blank
31
TRUSTEES AND OFFICERS
TRUSTEES1 | | |
Charles A. Austin III
Trustee
DOB: 10/23/1934
Term of office since: 1991
Other directorships: None | | Investment Counselor, Anchor Capital Advisors, LLC. (investment advice); Director, The Andover Companies (insurance); Trustee, Arthritis Foundation of New England; Former Director, The Francis Ouimet Society (scholarship program); Former Director, Executive Vice President and Treasurer, State Street Research & Management Company (investment advice) |
|
|
|
K. Dun Gifford
Trustee
DOB: 10/23/1938
Term of office since: 1974
Other directorships: None | | Chairman and President, Oldways Preservation and Exchange Trust (education); Trustee, Chairman of the Finance Committee, Member of the Executive Committee, and Former Treasurer, Cambridge College |
|
|
|
Dr. Leroy Keith, Jr.
Trustee
DOB: 2/14/1939
Term of office since: 1983
Other directorships: Trustee,
Phoenix Fund Complex
(consisting of 53 portfolios
as of 12/31/2007) | | Managing Director, Almanac Capital Management (commodities firm); Trustee, Phoenix Fund Complex; Director, Diversapack Co. (packaging company); Former Partner, Stonington Partners, Inc. (private equity fund); Former Director, Obagi Medical Products Co.; Former Director, Lincoln Educational Services |
|
|
|
Carol A. Kosel1
Trustee
DOB: 12/25/1963
Term of office since: 2008
Other directorships: None | | Former Consultant to the Evergreen Boards of Trustees; Former Vice President and Senior Vice President, Evergreen Investments, Inc.; Former Treasurer, Evergreen Funds; Former Treasurer, Vestaur Securities Fund |
|
|
|
Gerald M. McDonnell
Trustee DOB: 7/14/1939
Term of office since: 1988
Other directorships: None | | Former Manager of Commercial Operations, CMC Steel (steel producer) |
|
|
|
Patricia B. Norris
Trustee
DOB: 4/9/1948
Term of office since: 2006
Other directorships: None | | President and Director of Buckleys of Kezar Lake, Inc. (real estate company); Former President and Director of Phillips Pond Homes Association (home community); Former Partner, PricewaterhouseCoopers, LLP (independent registered public accounting firm) |
|
|
|
William Walt Pettit
Trustee
DOB: 8/26/1955
Term of office since: 1988
Other directorships: None | | Partner and Vice President, Kellam & Pettit, P.A. (law firm); Director, Superior Packaging Corp. (packaging company); Member, Superior Land, LLC (real estate holding company), Member, K&P Development, LLC (real estate development); Former Director, National Kidney Foundation of North Carolina, Inc. (non-profit organization) |
|
|
|
David M. Richardson
Trustee
DOB: 9/19/1941
Term of office since: 1982
Other directorships: None | | President, Richardson, Runden LLC (executive recruitment advisory services); Director, J&M Cumming Paper Co. (paper merchandising); Trustee, NDI Technologies, LLP (communications); Former Consultant, AESC (The Association of Executive Search Consultants) |
|
|
|
Dr. Russell A. Salton III Trustee
DOB: 6/2/1947
Term of office since: 1984
Other directorships: None | | President/CEO, AccessOne MedCard, Inc. |
|
|
|
32
TRUSTEES AND OFFICERS continued
Michael S. Scofield
Trustee
DOB: 2/20/1943
Term of office since: 1984
Other directorships: None | | Retired Attorney, Law Offices of Michael S. Scofield; Former Director and Chairman, Branded Media Corporation (multi-media branding company) |
|
|
|
Richard J. Shima
Trustee
DOB: 8/11/1939
Term of office since: 1993
Other directorships: None | | Independent Consultant; Director, Hartford Hospital; Trustee, Greater Hartford YMCA; Former Director, Trust Company of CT; Former Director, Old State House Association; Former Trustee, Saint Joseph College (CT) |
|
|
|
Richard K. Wagoner, CFA2
Trustee
DOB: 12/12/1937
Term of office since: 1999
Other directorships: None | | Member and Former President, North Carolina Securities Traders Association; Member, Financial Analysts Society |
|
|
|
| | |
OFFICERS | | |
Dennis H. Ferro3
President
DOB: 6/20/1945
Term of office since: 2003 | | Principal occupations: President and Chief Executive Officer, Evergreen Investment Company, Inc. and Executive Vice President, Wachovia Bank, N.A.; former Chief Investment Officer, Evergreen Investment Company, Inc. |
|
|
|
Jeremy DePalma4
Treasurer
DOB: 2/5/1974
Term of office since: 2005 | | Principal occupations: Senior Vice President, Evergreen Investment Management Company, LLC; Former Vice President, Evergreen Investment Services, Inc.; Former Assistant Vice President, Evergreen Investment Services, Inc. |
|
|
|
Michael H. Koonce4
Secretary
DOB: 4/20/1960
Term of office since: 2000 | | Principal occupations: Senior Vice President and General Counsel, Evergreen Investment Services, Inc.; Secretary, Senior Vice President and General Counsel, Evergreen Investment Management Company, LLC and Evergreen Service Company, LLC; Senior Vice President and Assistant General Counsel, Wachovia Corporation |
|
|
|
Robert Guerin4
Chief Compliance Officer
DOB: 9/20/1965
Term of office since: 2007 | | Principal occupations: Chief Compliance Officer, Evergreen Funds and Senior Vice President of Evergreen Investments Co., Inc.; Former Managing Director and Senior Compliance Officer, Babson Capital Management LLC; Former Principal and Director, Compliance and Risk Management, State Street Global Advisors; Former Vice President and Manager, Sales Practice Compliance, Deutsche Asset Management |
|
|
|
1 | Each Trustee, except Mses. Kosel and Norris, serves until a successor is duly elected or qualified or until his or her death, resignation, retirement or removal from office. As new Trustees, Ms. Kosel’s and Ms. Norris’ initial terms end December 31, 2010 and June 30, 2009, respectively, at which times they may be re-elected by Trustees to serve until a successor is duly elected or qualified or until her death, resignation, retirement or removal from office by the Trustees. Each Trustee, except Ms. Kosel, oversaw 94 Evergreen funds as of December 31, 2007. Ms. Kosel became a Trustee on January 1, 2008. Correspondence for each Trustee may be sent to Evergreen Board of Trustees, P.O. Box 20083, Charlotte, NC 28202. |
2 | Mr. Wagoner is an “interested person” of the Fund because of his ownership of shares in Wachovia Corporation, the parent to the Fund’s investment advisor. |
3 | The address of the Officer is 401 S. Tryon Street, 20th Floor, Charlotte, NC 28288. |
4 | The address of the Officer is 200 Berkeley Street, Boston, MA 02116. |
Additional information about the Fund’s Board of Trustees and Officers can be found in the Statement of Additional Information (SAI) and is available upon request without charge by calling 800.343.2898.
33

583272 09/2008
Evergreen Golden Core Opportunities Fund
| | table of contents |
1 | | LETTER TO SHAREHOLDERS |
4 | | FUND AT A GLANCE |
6 | | PORTFOLIO MANAGER COMMENTARY |
8 | | ABOUT YOUR FUND’S EXPENSES |
9 | | FINANCIAL HIGHLIGHTS |
13 | | SCHEDULE OF INVESTMENTS |
17 | | STATEMENT OF ASSETS AND LIABILITIES |
18 | | STATEMENT OF OPERATIONS |
19 | | STATEMENT OF CHANGES IN NET ASSETS |
20 | | NOTES TO FINANCIAL STATEMENTS |
26 | | REPORT OF INDEPENDENT REGISTERED PUBLIC ACCOUNTING FIRM |
28 | | TRUSTEES AND OFFICERS |
This annual report must be preceded or accompanied by a prospectus of the Evergreen fund contained herein. The prospectus contains more complete information, including fees and expenses, and should be read carefully before investing or sending money.
The fund will file its complete schedule of portfolio holdings with the SEC for the first and third quarters of each fiscal year on Form N-Q. The fund’s Form N-Q will be available on the SEC’s Web site at http://www.sec.gov. In addition, the fund’s Form N-Q may be reviewed and copied at the SEC’s Public Reference Room in Washington, D.C. Information on the operation of the Public Reference Room may be obtained by calling 800.SEC.0330.
A description of the fund’s proxy voting policies and procedures, as well as information regarding how the fund voted proxies relating to portfolio securities during the most recent 12-month period ended June 30, is available by visiting our Web site at EvergreenInvestments.com or by visiting the SEC’s Web site at http://www.sec.gov. The fund’s proxy voting policies and procedures are also available without charge, upon request, by calling 800.343.2898.
Mutual Funds:
| NOT FDIC INSURED | MAY LOSE VALUE | NOT BANK GUARANTEED |
Evergreen InvestmentsSM is a service mark of Evergreen Investment Management Company, LLC. Copyright 2008, Evergreen Investment Management Company, LLC.
Evergreen Investment Management Company, LLC is a subsidiary of Wachovia Corporation and is an affiliate of Wachovia Corporation’s other Broker Dealer subsidiaries.
Evergreen mutual funds are distributed by Evergreen Investment Services, Inc. 200 Berkeley Street, Boston, MA 02116
LETTER TO SHAREHOLDERS
September 2008

Dennis H. Ferro
President and Chief Executive Officer
Dear Shareholder:
We are pleased to provide the Annual Report for Evergreen Golden Core Opportunities Fund for the period from the fund’s inception on December 17, 2007 through the end of the fiscal year on July 31, 2008 (the “period”).
Capital markets came under extreme pressure during this period, as investors confronted a variety of challenges that ranged from a crisis in credit markets and deteriorating housing values to rapidly rising energy costs and intensifying inflationary pressures. All these factors contributed to growing fears that the U.S. economy might be moving toward a significant slump that potentially could undermine the growth of the global economy. Against this backdrop, the domestic equity market saw falling stock valuations for companies of all sizes and virtually all sectors, with the notable exception of the energy and utilities groups. Financials stocks were particularly hard-hit, as many major institutions suffered steep losses from their exposure to subprime mortgages. Outside the United States, stocks in both industrial and emerging market nations slumped, reflecting concerns about the potentially contagious effects of problems in the United States. In the domestic fixed income market, widespread credit problems dragged down the prices of virtually all types of securities carrying credit risk, most notably corporate bonds and asset-backed securities. High yield corporates performed particularly poorly. In contrast, Treasuries and other high-quality securities held up well. In world bond markets, sovereign government securities in industrialized nations outperformed other groups, while emerging market debt and high yield corporate bonds underperformed.
Despite many warning signals, the U.S. economy appeared to defy expectations for recession. While the nation’s real Gross Domestic Product grew at an annual rate of just 0.9% in the first quarter of 2008, growth accelerated to a 3.3% pace in the second quarter. The combination of a weak currency, which supported exports, and the injection of tax-rebate checks sustained the expansion, cushioning the impacts of weakening employment, slowing profit growth and rising inflation. Moreover, problems in the credit markets persisted, with major financial institutions continuing to report significant losses. In the face of these threats, the Federal Reserve Board (the “Fed”) continued to relax monetary policy in an effort to inject new liquidity into the nation’s financial system. The Fed slashed the key fed funds rate from 5.25% to 2.00% between August 2007 and April 2008. The central bank also took other policy initiatives to make funds more available to financial institutions, including commercial and investment
1
LETTER TO SHAREHOLDERS continued
banks. In early September 2008, the U.S. Treasury Department acted forcefully to take control over both Fannie Mae and Freddie Mac, the two giant mortgage institutions that had been seriously weakened by the upheaval in the mortgage market. The Treasury’s actions were seen as major initiatives to instill confidence in the economy by supporting the mortgage market.
During this volatile and challenging period in the stock market, the management teams of Evergreen’s newly introduced Golden Funds maintained the investment disciplines developed at Golden Capital Management, LLC, an investment manager specializing in core equity management. Portfolio managers of Evergreen Golden Core Opportunities Fund, for example, employed a largely quantitative process to analyze the fundamentals of approximately 2,000 small and mid cap stocks. They ranked these stocks based on valuation, earnings and momentum before identifying and selecting holdings for the fund’s portfolio. The team supervising Evergreen Golden Mid Cap Core Fund used a comparable process in analyzing and selecting stocks from a universe of approximately 800 mid cap companies. Meanwhile, managers of Evergreen Golden Large Cap Core Fund followed the same discipline in assembling a portfolio from an initial universe of stocks of the largest 3,000 corporations.
We believe the changing conditions in the investment environment over the period have underscored the value of a well-diversified, long-term investment strategy to help soften the effects of volatility in any one market or asset class. As always, we encourage investors to maintain diversified investment portfolios in pursuit of their long-term investment goals.
Please visit us at EvergreenInvestments.com for more information about our funds and other investment products available to you. Thank you for your continued support of Evergreen Investments.
Sincerely,

Dennis H. Ferro
President and Chief Executive Officer
Evergreen Investment Company, Inc.
2
LETTER TO SHAREHOLDERS continued
Special Notice to Shareholders:
Please visit our Web site at EvergreenInvestments.com for statements from President and Chief Executive Officer (CEO), Dennis Ferro, regarding the firm’s recent settlement with the Securities and Exchange Commission (SEC) and prior settlement with the Financial Industry Regulatory Authority (FINRA).
Special Notice to Shareholders:
Dennis Ferro, President and CEO of Evergreen Investments, will retire at the end of 2008 and Peter Cieszko, current President of Global Distribution, will succeed Mr. Ferro as President and CEO at that time. Additionally, David Germany has been named the new Chief Investment Officer (CIO). Please visit our Web site for additional information regarding these announcements.
3
FUND AT A GLANCE
as of July 31, 2008
MANAGEMENT TEAM
Investment Advisor:
Evergreen Investment Management Company, LLC
Sub-Advisor:
Golden Capital Management, LLC
Portfolio Manager:
John R. Campbell, CFA
CURRENT INVESTMENT STYLE

Source: Morningstar, Inc.
Morningstar’s style box is based on a portfolio date as of 6/30/2008.
The Equity style box placement is based on 10 growth and valuation measures for each fund holding and the median size of the companies in which the fund invests.
PERFORMANCE AND RETURNS
Portfolio inception date: 12/17/2007
Class inception date | Class A
12/17/2007 | Class B
12/17/2007 | Class C
12/17/2007 | Class I
12/17/2007 |
|
|
|
|
|
Nasdaq symbol | ECOAX | ECOBX | ECOCX | ECOIX |
|
|
|
|
|
Cumulative return | | | | |
|
|
|
|
|
Since portfolio inception with sales charge | -14.61% | -14.12% | -10.50% | N/A |
|
|
|
|
|
Since portfolio inception w/o sales charge | -9.40% | -9.60% | -9.60% | -9.30% |
|
|
|
|
|
Maximum sales charge | 5.75%
Front-end | 5.00%
CDSC | 1.00%
CDSC | |
|
|
|
|
|
Past performance is no guarantee of future results. The performance quoted represents past performance and current performance may be lower or higher. The investment return and principal value of an investment will fluctuate so that investors’ shares, when redeemed, may be worth more or less than their original cost. To obtain performance information current to the most recent month-end for Classes A, B, C or I, please go to EvergreenInvestments.com/fundperformance. The performance of each class may vary based on differences in loads, fees and expenses paid by the shareholders investing in each class. Performance includes the reinvestment of income dividends and capital gain distributions. Performance shown does not reflect the deduction of taxes that a shareholder would pay on fund distributions or the redemption of fund shares.
Performance results are extremely short term, and may not provide an adequate basis for evaluating a fund’s performance over varying market conditions or economic cycles. Unusual investment returns may be a result of a fund’s recent inception, existing market and economic conditions and the increased potential of a small number of stocks affecting fund performance due to the smaller asset size. Most mutual funds are intended to be long-term investments.
The fund incurs a 12b-1 fee of 0.25% for Class A and 1.00% for Classes B and C. Class I does not pay a 12b-1 fee.
The advisor is waiving its advisory fee and reimbursing the fund for a portion of other expenses. Had the fee not been waived and expenses not reimbursed, returns would have been lower.
4
FUND AT A GLANCE continued

Comparison of a $10,000 investment in the Evergreen Golden Core Opportunities Fund Class A shares versus a similar investment in the Russell 2500 Index (Russell 2500) and the Consumer Price Index (CPI).
The Russell 2500 is an unmanaged market index and does not include transaction costs associated with buying and selling securities, any mutual fund fees or expenses or any taxes. The CPI is a commonly used measure of inflation and does not represent an investment return. It is not possible to invest directly in an index.
Class I shares are only offered, subject to the minimum initial purchase requirements, in the following manner: (1) to investment advisory clients of EIMC (or its advisory affiliates), (2) to employer- or state-sponsored benefit plans, including but not limited to, retirement plans, defined benefit plans, deferred compensation plans, or savings plans, (3) to fee-based mutual fund wrap accounts, (4) through arrangements entered into on behalf of the Evergreen funds with certain financial services firms, (5) to certain institutional investors, and (6) to persons who owned Class Y shares in registered name in an Evergreen fund on or before December 31, 1994 or who owned shares of any SouthTrust fund in registered name as of March 18, 2005 or who owned shares of Vestaur Securities Fund as of May 20, 2005.
Class I shares are only available to institutional shareholders with a minimum of $1 million investment, which may be waived in certain situations.
The fund’s investment objective may be changed without a vote of the fund’s shareholders.
Mid cap securities may be subject to special risks associated with narrower product lines and limited financial resources compared to their large cap counterparts, and, as a result, mid cap securities may decline significantly in market downturns.
Since the fund tends to invest in a smaller number of stocks than many similar mutual funds, changes in the value of individual stocks may have a larger impact on its net asset value than such fluctuations would if the fund were more broadly invested.
The stocks of smaller companies may be more volatile than those of larger companies due to the higher risk of failure.
All data is as of July 31, 2008, and subject to change.
5
PORTFOLIO MANAGER COMMENTARY
The fund’s Class A shares returned -9.40% for the period ended July 31, 2008, excluding any applicable sales charges. During the same period, the Russell 2500 returned -4.91%.
The fund’s objective is to seek long-term capital growth.
Domestic equity prices were buffeted in a volatile environment during the 7-month period. Most benchmarks declined as investors worried about the effects of a crisis in credit markets, rapidly rising energy costs and the effects of these factors on the economy’s overall health. Despite this general tendency, the market also saw brief rallies when investors, particularly in April and May 2008, were encouraged by the actions of the Federal Reserve Board to inject more liquidity into the credit markets. In July 2008, the final month of the period, results were mixed, as the market weighed the potential effects of weakening growth and rising unemployment against the hope that energy prices were starting to retreat.
The fund began operations in mid-December 2007, following the investment discipline developed at Golden Capital Management, LLC, an investment manager specializing in core equity management for institutional and high net-worth investors. The portfolio manager uses a quantitative methodology that analyzes the fundamentals of approximately 2,000 companies. Stocks are ranked based on valuation, earnings and momentum factors and then are screened using qualitative analysis. The manager seeks to identify about 50 companies that he believes are selling at low prices and that have the potential to deliver future earnings exceeding the expectations of general investment industry analysts. Sector weightings tend not to deviate significantly from those of the benchmark index.
Over the abbreviated fiscal period since the fund’s inception, the fund lagged the Russell 2500 Index during the first quarter of 2008, outperformed the benchmark during the second quarter, and lagged in July 2008. For the full period, stock selection in the Consumer Discretionary sector had the most significant positive impact on results, which also were supported by selections in the Utilities and Consumer Staples groups. The leading contributor among the fund’s Consumer Discretionary holdings was Hasbro, Inc., the producer of toys and games. Hasbro announced two strong quarterly earnings reports. From the Utilities sector, investments in Energen Corp. and MDU Resources Group added support to performance, as both companies have significant natural gas exploration and production businesses that benefited from rising commodity prices. In Consumer Staples, NBTY, Inc., which produces and distributes vitamins and food supplements, performed well based on its improving sales. Other holdings that contributed to results over the period included Industrials corporation Gardner Denver, which increased its earnings outlook, and Materials company FMC Corp., a specialty chemical company that has been able to raise its pricing because of strong demand.
Selections in the Information Technology sector tended to have the greatest negative impact on relative performance, which also was held back by selections in the Health
6
PORTFOLIO MANAGER COMMENTARY continued
Care, Financials and Energy sectors. Among Information Technology positions, stocks that tended to detract from results included those of Avnet, Inc., International Rectifier Corp. and Methode Electronics. In Health Care, Health Net’s share price fell in the second quarter as other managed care companies announced lower earnings forecasts, while Waters Corp. issued a disappointing earnings report because of higher-than-expected taxes. In the Financials sector, stock exchange operator NASDAQ OMX Group saw its price fall as investors feared that reduced trading costs would pressure earnings margins. Also holding back results was the investment in Industrials company Goodrich, as investors worried that a weakening commercial aviation market could slow the company’s growth.
7
ABOUT YOUR FUND’S EXPENSES
The Example below is intended to describe the fees and expenses borne by shareholders and the impact of those costs on your investment.
Example
As a shareholder of the fund, you incur two types of costs: (1) transaction costs, including sales charges (loads), redemption fees and exchange fees; and (2) ongoing costs, including management fees, distribution (12b-1) fees and other fund expenses. This Example is intended to help you understand your ongoing costs (in dollars) of investing in the fund and to compare these costs with the ongoing costs of investing in other mutual funds. The Example is based on an investment of $1,000 invested at the beginning of the period and held for the entire period from February 1, 2008 to July 31, 2008.
The example illustrates your fund’s costs in two ways:
• Actual expenses
The section in the table under the heading “Actual” provides information about actual account values and actual expenses. You may use the information in these columns, together with the amount you invested, to estimate the expenses that you paid over the period. Simply divide your account value by $1,000 (for example, an $8,600 account value divided by $1,000 = 8.6), then multiply the result by the number in the appropriate column for your share class, in the column entitled “Expenses Paid During Period” to estimate the expenses you paid on your account during this period.
• Hypothetical example for comparison purposes
The section in the table under the heading “Hypothetical (5% return before expenses)” provides information about hypothetical account values and hypothetical expenses based on the fund’s actual expense ratio and an assumed rate of return of 5% per year before expenses, which is not the fund’s actual return. The hypothetical account values and expenses may not be used to estimate the actual ending account balance or expenses you paid for the period. You may use this information to compare the ongoing costs of investing in the fund and other funds. To do so, compare this 5% hypothetical example with the 5% hypothetical examples that appear in the shareholder reports of the other funds.
Please note that the expenses shown in the table are meant to highlight your ongoing costs only and do not reflect any transactional costs, such as sales charges (loads), redemption fees or exchange fees. Therefore, the section in the table under the heading “Hypothetical (5% return before expenses)” is useful in comparing ongoing costs only, and will not help you determine the relative total costs of owning different funds. In addition, if these transactional costs were included, your costs would have been higher.