| OMB APPROVAL |
|
| OMB Number: 3235-0570 |
| |
| Expires: September 30, 2007 |
|
| Estimated average |
| burden hours per |
| response: 19.4 |
|
UNITED STATES
SECURITIES AND EXCHANGE COMMISSION
Washington, D.C. 20549
FORM N-CSRS
CERTIFIED SHAREHOLDER REPORT OF REGISTERED MANAGEMENT INVESTMENT
COMPANIES
Investment Company Act file number 811-08413
Evergreen Equity Trust
_____________________________________________________________
(Exact name of registrant as specified in charter)
200 Berkeley Street
Boston, Massachusetts 02116
_____________________________________________________________
(Address of principal executive offices) (Zip code)
Michael H. Koonce, Esq.
200 Berkeley Street
Boston, Massachusetts 02116
____________________________________________________________
(Name and address of agent for service)
Registrant's telephone number, including area code: (617) 210-3200
Date of fiscal year end: Registrant is making a semi-annual filing for six of its series, Evergreen Enhanced S&P 500 Fund, Evergreen Growth Fund, Evergreen Large Company Growth Fund, Evergreen Mid Cap Growth Fund, Evergreen Omega Fund and Evergreen Small-Mid Growth Fund, for the six months ended March 31, 2008. These six series have a September 30 fiscal year end.
Date of reporting period: March 31, 2008
Item 1 - Reports to Stockholders.
Evergreen Enhanced S&P 500® Fund
| table of contents |
| 1 | | LETTER TO SHAREHOLDERS |
| 4 | | FUND AT A GLANCE |
| 6 | | ABOUT YOUR FUND’S EXPENSES |
| 7 | | FINANCIAL HIGHLIGHTS |
| 12 | | SCHEDULE OF INVESTMENTS |
| 20 | | STATEMENT OF ASSETS AND LIABILITIES |
| 21 | | STATEMENT OF OPERATIONS |
| 22 | | STATEMENTS OF CHANGES IN NET ASSETS |
| 24 | | NOTES TO FINANCIAL STATEMENTS |
| 32 | | TRUSTEES AND OFFICERS |
This semiannual report must be preceded or accompanied by a prospectus of the Evergreen fund contained herein. The prospectus contains more complete information, including fees and expenses, and should be read carefully before investing or sending money.
The fund will file its complete schedule of portfolio holdings with the SEC for the first and third quarters of each fiscal year on Form N-Q. The fund’s Form N-Q will be available on the SEC’s Web site at http://www.sec.gov. In addition, the fund’s Form N-Q may be reviewed and copied at the SEC’s Public Reference Room in Washington, D.C. Information on the operation of the Public Reference Room may be obtained by calling 800.SEC.0330.
A description of the fund’s proxy voting policies and procedures, as well as information regarding how the fund voted proxies relating to portfolio securities during the most recent 12-month period ended June 30, is available by visiting our Web site at EvergreenInvestments.com or by visiting the SEC’s Web site at http://www.sec.gov. The fund’s proxy voting policies and procedures are also available without charge, upon request, by calling 800.343.2898.
| Mutual Funds: | | | | |
| NOT FDIC INSURED | | MAY LOSE VALUE | | NOT BANK GUARANTEED |
Evergreen InvestmentsSM is a service mark of Evergreen Investment Management Company, LLC.
Copyright 2008, Evergreen Investment Management Company, LLC.
Evergreen Investment Management Company, LLC is a subsidiary of Wachovia Corporation
and is an affiliate of Wachovia Corporation’s other Broker Dealer subsidiaries.
Evergreen mutual funds are distributed by Evergreen Investment Services, Inc.
200 Berkeley Street, Boston, MA 02116
LETTER TO SHAREHOLDERS
May 2008
Dennis H. Ferro
President and Chief Executive Officer
Dear Shareholder:
We are pleased to provide the Semiannual Report for Evergreen Enhanced S&P 500® Fund for the six-month period ended March 31, 2008 (the “six-month period”).
Mounting evidence of a slowing economy undermined confidence in equities and credit-sensitive fixed income securities during the six-month period. Investors feared weakness in housing and problems in the subprime mortgage industry could pull the domestic economy into recession. Major financial institutions began to report substantial losses from their exposures to subprime mortgages and banks started to tighten their credit standards and to restrict their lending. Equity prices were buffeted by news of falling profits, weakening housing, slowing employment, rising inflationary pressures and growing credit problems. Stock valuations fell across all market capitalizations, investment styles and regions. With fears of a dramatic downturn hovering over the market, fixed income investors sought out the highest-quality securities and attempted to avoid credit risk. As a consequence, the prices of corporate bonds and many asset-backed securities fell, while Treasuries rallied in a general flight to quality. In this environment, the prices of gold, oil and other commodities surged while the U.S. dollar weakened further.
The U.S. economy showed clear signs of weakening over the six-month period. Problems in the credit markets led to declines in lending for ordinary consumer and commercial activity, accentuating the effects of declining home prices. Corporate profits, employment and other key economic indicators showed signs of deterioration. Gross Domestic Product growth slowed to just 0.6% both in the final quarter of 2007 and in the first quarter of 2008. To reinvigorate the economy
1
LETTER TO SHAREHOLDERS continued
and stimulate lending activity, the Federal Reserve Board (the “Fed”) became increasingly aggressive, taking a series of steps to pour liquidity into the financial system. Starting in September 2007 and continuing through April 2008, the Fed cut the key fed funds rate seven different times, lowering the influential short-term rate from 5.25% to 2%. In March 2008, the central bank also opened its lending facilities to securities firms as well as commercial banks and intervened to help JPMorgan Chase & Co. purchase the collapsing investment bank Bear Stearns Cos. Congress and the Bush administration, meanwhile, rushed through a $168 billion fiscal stimulus bill, which included tax rebate checks, in an effort to boost growth in the second half of 2008.
During the six-month period, the management teams of Evergreen’s growth-oriented equity funds maintained their pursuit of capital appreciation, consistent with the investment discipline and style of each fund. The manager of Evergreen Large Company Growth Fund and Evergreen Omega Fund focused on bottom-up, fundamental analysis in making individual stock selections. The portfolio manager supervising Evergreen Mid Cap Growth Fund and Evergreen Small-Mid Growth Fund, meanwhile, sought to balance each portfolio with exposure both to consistent growth companies and to more cyclically oriented corporations. At the same time, managers of Evergreen Growth Fund concentrated on opportunities among small cap growth companies with above-average earnings prospects and reasonable stock valuations. The portfolio manager of Evergreen Enhanced S&P 500® Fund, in turn, employed a largely quantitative discipline in choosing a portfolio of predominately large cap stocks from both the value and growth stock universes.
We believe the experiences in the capital markets during the six-month period have underscored the value of a well-diversified, long-term investment strategy to help soften the effects of volatility in any one market or asset class. As always, we encourage investors to maintain diversified investment portfolios in pursuit of their long-term investment goals.
2
LETTER TO SHAREHOLDERS continued
Please visit us at EvergreenInvestments.com for more information about our funds and other investment products available to you. Thank you for your continued support of Evergreen Investments.
Sincerely,
Dennis H. Ferro
President and Chief Executive Officer
Evergreen Investment Company, Inc.
Special Notice to Shareholders:
Please visit our Web site at EvergreenInvestments.com for statements from President and Chief Executive Officer, Dennis Ferro, regarding the firm’s recent settlement with the Securities and Exchange Commission (SEC) and prior settlement with the Financial Industry Regulatory Authority (FINRA).
3
FUND AT A GLANCE
as of March 31, 2008
MANAGEMENT TEAM
Investment Advisor:
Evergreen Investment Management Company, LLC
Portfolio Manager:
William E. Zieff
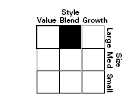
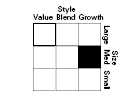
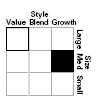
CURRENT INVESTMENT STYLE
Source: Morningstar, Inc.
Morningstar’s style box is based on a portfolio date as of 3/31/2008.
The Equity style box placement is based on 10 growth and valuation measures for each fund holding and the median size of the companies in which the fund invests.
PERFORMANCE AND RETURNS
Portfolio inception date: 2/28/1990
| | | Class A | | Class B | | Class C | | Class I | | Class IS |
| Class inception date | | 2/28/1990 | | 11/7/1997 | | 6/30/1999 | | 2/21/1995 | | 6/30/2000 |
|
| Nasdaq symbol | | EVSAX | | EVSBX | | EVSTX | | EVSYX | | EVSSX |
|
| 6-month return with sales charge | | -16.34% | | -16.35% | | -13.23% | | N/A | | N/A |
|
| 6-month return w/o sales charge | | -12.16% | | -12.47% | | -12.45% | | -12.05% | | -12.13% |
|
| Average annual return* | | | | | | | | | | |
|
| 1-year with sales charge | | -10.66% | | -11.06% | | -7.71% | | N/A | | N/A |
|
| 1-year w/o sales charge | | -6.21% | | -6.94% | | -6.89% | | -5.97% | | -6.22% |
|
| 5-year | | 11.25% | | 11.24% | | 11.52% | | 12.63% | | 12.36% |
|
| 10-year | | 2.14% | | 1.87% | | 1.97% | | 2.90% | | 2.64% |
|
| Maximum sales charge | | 4.75% | | 5.00% | | 1.00% | | N/A | | N/A |
| | | Front-end | | CDSC | | CDSC | | | | |
|
* Adjusted for maximum applicable sales charge, unless noted.
Past performance is no guarantee of future results. The performance quoted represents past performance and current performance may be lower or higher. The investment return and principal value of an investment will fluctuate so that investors’ shares, when redeemed, may be worth more or less than their original cost. To obtain performance information current to the most recent month-end for Classes A, B, C, I or IS, please go to EvergreenInvestments.com/fundperformance. The performance of each class may vary based on differences in loads, fees and expenses paid by the shareholders investing in each class. Performance includes the reinvestment of income dividends and capital gain distributions. Performance shown does not reflect the deduction of taxes that a shareholder would pay on fund distributions or the redemption of fund shares.
Historical performance shown for Classes C and IS prior to their inception is based on the performance of Class A, the original class offered. The historical returns for Class C have not been adjusted to reflect the effect of its 12b-1 fee. The fund incurs a 12b-1 fee of 0.25% for Classes A and IS and 1.00% for Classes B and C. Class I does not pay a 12b-1 fee. If these fees had been reflected, returns for Class C would have been lower.
Returns reflect expense limits previously in effect, without which returns would have been lower.
4
FUND AT A GLANCE continued
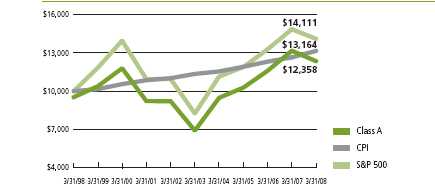
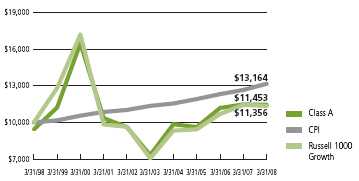
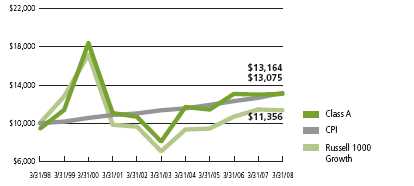
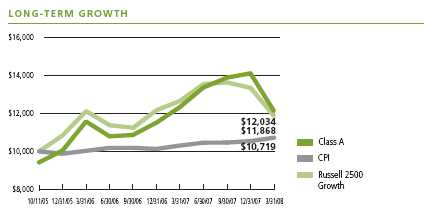
LONG-TERM GROWTH
Comparison of a $10,000 investment in the Evergreen Enhanced S&P 500® Fund Class A shares versus a similar investment in the S&P 500® Index (S&P 500) and the Consumer Price Index (CPI).
The S&P 500 is an unmanaged market index and does not include transaction costs associated with buying and selling securities, any mutual fund fees or expenses or any taxes. The CPI is a commonly used measure of inflation and does not represent an investment return. It is not possible to invest directly in an index.
Class I shares are only offered, subject to the minimum initial purchase requirements, in the following manner: (1) to investment advisory clients of EIMC (or its advisory affiliates), (2) to employer- or state-sponsored benefit plans, including but not limited to, retirement plans, defined benefit plans, deferred compensation plans, or savings plans, (3) to fee-based mutual fund wrap accounts, (4) through arrangements entered into on behalf of the Evergreen funds with certain financial services firms, (5) to certain institutional investors, and (6) to persons who owned Class Y shares in registered name in an Evergreen fund on or before December 31, 1994 or who owned shares of any SouthTrust fund in registered name as of March 18, 2005 or who owned shares of Vestaur Securities Fund as of May 20, 2005.
Class I and IS shares are only available to institutional shareholders with a minimum of $1 million investment, which may be waived in certain situations.
The fund’s investment objective may be changed without a vote of the fund’s shareholders.
“Standard & Poor’s,” “S&P,” “S&P 500,” “Standard & Poor’s 500” and “500” are trademarks of The McGraw-Hill Companies, Inc. and have been licensed for use by Evergreen Investments. The product is not sponsored, endorsed, sold or promoted by Standard & Poor’s and Standard & Poor’s makes no representation regarding the advisability of investing in the product.
Foreign investments may contain more risk due to the inherent risks associated with changing political climates, foreign market instability and foreign currency fluctuations.
All data is as of March 31, 2008, and subject to change.
5
ABOUT YOUR FUND’S EXPENSES
The Example below is intended to describe the fees and expenses borne by shareholders and the impact of those costs on your investment.
Example
As a shareholder of the fund, you incur two types of costs: (1) transaction costs, including sales charges (loads), redemption fees and exchange fees; and (2) ongoing costs, including management fees, distribution (12b-1) fees and other fund expenses. This Example is intended to help you understand your ongoing costs (in dollars) of investing in the fund and to compare these costs with the ongoing costs of investing in other mutual funds. The Example is based on an investment of $1,000 invested at the beginning of the period and held for the entire period from October 1, 2007 to March 31, 2008.
The example illustrates your fund’s costs in two ways:
Actual expenses
The section in the table under the heading “Actual” provides information about actual account values and actual expenses. You may use the information in these columns, together with the amount you invested, to estimate the expenses that you paid over the period. Simply divide your account value by $1,000 (for example, an $8,600 account value divided by $1,000 = 8.6), then multiply the result by the number in the appropriate column for your share class, in the column entitled “Expenses Paid During Period” to estimate the expenses you paid on your account during this period.
Hypothetical example for comparison purposes
The section in the table under the heading “Hypothetical (5% return before expenses)” provides information about hypothetical account values and hypothetical expenses based on the fund’s actual expense ratio and an assumed rate of return of 5% per year before expenses, which is not the fund’s actual return. The hypothetical account values and expenses may not be used to estimate the actual ending account balance or expenses you paid for the period. You may use this information to compare the ongoing costs of investing in the fund and other funds. To do so, compare this 5% hypothetical example with the 5% hypothetical examples that appear in the shareholder reports of the other funds.
Please note that the expenses shown in the table are meant to highlight your ongoing costs only and do not reflect any transactional costs, such as sales charges (loads), redemption fees or exchange fees. Therefore, the section in the table under the heading “Hypothetical (5% return before expenses)” is useful in comparing ongoing costs only, and will not help you determine the relative total costs of owning different funds. In addition, if these transactional costs were included, your costs would have been higher.
| | | Beginning | | Ending | | |
| | | Account | | Account | | Expenses |
| | | Value | | Value | | Paid During |
| | | 10/1/2007 | | 3/31/2008 | | Period* |
|
| Actual |
| Class A | | $ 1,000.00 | | $ 878.45 | | $ 4.37 |
| Class B | | $ 1,000.00 | | $ 875.27 | | $ 7.88 |
| Class C | | $ 1,000.00 | | $ 875.50 | | $ 7.88 |
| Class I | | $ 1,000.00 | | $ 879.47 | | $ 3.20 |
| Class IS | | $ 1,000.00 | | $ 878.72 | | $ 4.37 |
| Hypothetical | | |
| (5% return | |
| before expenses) | |
| Class A | | $ 1,000.00 | | $ 1,020.35 | | $ 4.70 |
| Class B | | $ 1,000.00 | | $ 1,016.60 | | $ 8.47 |
| Class C | | $ 1,000.00 | | $ 1,016.60 | | $ 8.47 |
| Class I | | $ 1,000.00 | | $ 1,021.60 | | $ 3.44 |
| Class IS | | $ 1,000.00 | | $ 1,020.35 | | $ 4.70 |
|
* For each class of the Fund, expenses are equal to the annualized expense ratio of each class (0.93% for Class A, 1.68% for Class B, 1.68% for Class C, 0.68% for Class I and 0.93% for Class IS), multiplied by the average account value over the period, multiplied by 183 / 366 days.
6
| FINANCIAL HIGHLIGHTS |
|
| (For a share outstanding throughout each period) | | Six Months Ended | | Year Ended September 30, |
| | March 31, 2008 | |
|
| CLASS A | | (unaudited) | | 2007 | | 2006 | | 2005 | | 2004 | | 2003 |
|
| Net asset value, beginning of period | | $18.97 | | $17.09 | | $15.56 | | $13.56 | | $11.93 | | $9.70 |
|
| Income from investment operations |
| Net investment income (loss) | | 0.09 | | 0.18 | | 0.19 | | 0.121 | | 0.07 | | 0.051 |
Net realized and unrealized gains
or losses on investments | | (2.21) | | 2.48 | | 1.53 | | 2.02 | | 1.62 | | 2.23 |
| |
|
| Total from investment operations | | (2.12) | | 2.66 | | 1.72 | | 2.14 | | 1.69 | | 2.28 |
|
| Distributions to shareholders from |
| Net investment income | | (0.09) | | (0.18) | | (0.19) | | (0.14) | | (0.06) | | (0.05) |
| Net realized gains | | (1.99) | | (0.60) | | 0 | | 0 | | 0 | | 0 |
| |
|
| Total distributions to shareholders | | (2.08) | | (0.78) | | (0.19) | | (0.14) | | (0.06) | | (0.05) |
|
| Net asset value, end of period | | $14.77 | | $18.97 | | $17.09 | | $15.56 | | $13.56 | | $11.93 |
|
| Total return2 | | (12.16%) | | 15.98% | | 11.13% | | 15.86% | | 14.16% | | 23.61% |
|
| Ratios and supplemental data |
| Net assets, end of period (thousands) | | $386,742 | | $513,074 | | $115,630 | | $100,728 | | $51,209 | | $40,373 |
| Ratios to average net assets |
| Expenses including waivers/reimbursements | | |
| but excluding expense reductions | | 0.93%3 | | 0.89% | | 0.81% | | 1.11% | | 1.15% | | 1.12% |
| Expenses excluding waivers/reimbursements | | |
| and expense reductions | | 0.93%3 | | 0.89% | | 0.82% | | 1.15% | | 1.17% | | 1.22% |
| Net investment income (loss) | | 1.13%3 | | 0.92% | | 1.20% | | 0.83% | | 0.47% | | 0.47% |
| Portfolio turnover rate | | 18% | | 71% | | 52% | | 38% | | 54% | | 49% |
|
1 Net investment income (loss) per share is based on average shares outstanding during the period.
2 Excluding applicable sales charges
3 Annualized
See Notes to Financial Statements
7
| FINANCIAL HIGHLIGHTS |
|
| (For a share outstanding throughout each period) | | Six Months Ended | | Year Ended September 30, |
| | March 31, 2008 | |
|
| CLASS B | | (unaudited) | | 2007 | | 2006 | | 2005 | | 2004 | | 2003 |
|
| Net asset value, beginning of period | | $18.13 | | $16.36 | | $14.90 | | $13.01 | | $11.48 | | $9.36 |
|
| Income from investment operations |
| Net investment income (loss) | | 0.031 | | 0.041 | | 0.071 | | 01 | | (0.04) | | (0.03)1 |
Net realized and unrealized gains
or losses on investments | | (2.10) | | 2.37 | | 1.47 | | 1.95 | | 1.57 | | 2.15 |
| |
|
| Total from investment operations | | (2.07) | | 2.41 | | 1.54 | | 1.95 | | 1.53 | | 2.12 |
|
| Distributions to shareholders from |
| Net investment income | | (0.03) | | (0.04) | | (0.08) | | (0.06) | | 02 | | 02 |
| Net realized gains | | (1.99) | | (0.60) | | 0 | | 0 | | 0 | | 0 |
| |
|
| Total distributions to shareholders | | (2.02) | | (0.64) | | (0.08) | | (0.06) | | 0 | | 0 |
|
| Net asset value, end of period | | $14.04 | | $18.13 | | $16.36 | | $14.90 | | $13.01 | | $11.48 |
|
| Total return3 | | (12.47%) | | 15.05% | | 10.34% | | 15.03% | | 13.34% | | 22.68% |
|
| Ratios and supplemental data |
| Net assets, end of period (thousands) | | $14,617 | | $23,630 | | $29,352 | | $55,071 | | $11,177 | | $10,211 |
| Ratios to average net assets |
| Expenses including waivers/reimbursements | | |
| but excluding expense reductions | | 1.68%4 | | 1.62% | | 1.57% | | 1.81% | | 1.85% | | 1.85% |
| Expenses excluding waivers/reimbursements | | |
| and expense reductions | | 1.68%4 | | 1.62% | | 1.58% | | 1.85% | | 1.87% | | 1.94% |
| Net investment income (loss) | | 0.38%4 | | 0.25% | | 0.46% | | 0.00% | | (0.24%) | | (0.25%) |
| Portfolio turnover rate | | 18% | | 71% | | 52% | | 38% | | 54% | | 49% |
|
1 Net investment income (loss) per share is based on average shares outstanding during the period.
2 Amount represents less than $0.005 per share.
3 Excluding applicable sales charges
4 Annualized
See Notes to Financial Statements
8
| FINANCIAL HIGHLIGHTS |
|
| (For a share outstanding throughout each period) | | Six Months Ended | | Year Ended September 30, |
| | March 31, 2008 | |
|
| CLASS C | | (unaudited) | | 2007 | | 2006 | | 2005 | | 2004 | | 2003 |
|
| Net asset value, beginning of period | | $18.45 | | $16.64 | | $15.17 | | $13.24 | | $11.69 | | $9.53 |
|
| Income from investment operations |
| Net investment income (loss) | | 0.03 | | 0.041 | | 0.071 | | 0.011 | | (0.03)1 | | (0.02)1 |
Net realized and unrealized gains
or losses on investments | | (2.15) | | 2.42 | | 1.49 | | 1.98 | | 1.58 | | 2.18 |
| |
|
| Total from investment operations | | (2.12) | | 2.46 | | 1.56 | | 1.99 | | 1.55 | | 2.16 |
|
| Distributions to shareholders from |
| Net investment income | | (0.03) | | (0.05) | | (0.09) | | (0.06) | | 02 | | 0 |
| Net realized gains | | (1.99) | | (0.60) | | 0 | | 0 | | 0 | | 0 |
| |
|
| Total distributions to shareholders | | (2.02) | | (0.65) | | (0.09) | | (0.06) | | 0 | | 0 |
|
| Net asset value, end of period | | $14.31 | | $18.45 | | $16.64 | | $15.17 | | $13.24 | | $11.69 |
|
| Total return3 | | (12.45%) | | 15.10% | | 10.29% | | 15.08% | | 13.27% | | 22.67% |
|
| Ratios and supplemental data |
| Net assets, end of period (thousands) | | $10,569 | | $12,331 | | $7,944 | | $6,003 | | $2,518 | | $460 |
| Ratios to average net assets |
| Expenses including waivers/reimbursements | | |
| but excluding expense reductions | | 1.68%4 | | 1.63% | | 1.55% | | 1.81% | | 1.84% | | 1.85% |
| Expenses excluding waivers/reimbursements | | |
| and expense reductions | | 1.68%4 | | 1.63% | | 1.56% | | 1.85% | | 1.86% | | 1.94% |
| Net investment income (loss) | | 0.38%4 | | 0.24% | | 0.45% | | 0.09% | | (0.24%) | | (0.21%) |
| Portfolio turnover rate | | 18% | | 71% | | 52% | | 38% | | 54% | | 49% |
|
1 Net investment income (loss) per share is based on average shares outstanding during the period.
2 Amount represents less than $0.005 per share.
3 Excluding applicable sales charges
4 Annualized
See Notes to Financial Statements
9
| FINANCIAL HIGHLIGHTS |
|
| (For a share outstanding throughout each period) | | Six Months Ended | | Year Ended September 30, |
| | March 31, 2008 | |
|
| CLASS I | | (unaudited) | | 2007 | | 2006 | | 2005 | | 2004 | | 2003 |
|
| Net asset value, beginning of period | | $19.06 | | $17.16 | | $15.62 | | $13.61 | | $11.99 | | $9.74 |
|
| Income from investment operations |
| Net investment income (loss) | | 0.12 | | 0.23 | | 0.24 | | 0.18 | | 0.10 | | 0.081 |
Net realized and unrealized gains
or losses on investments | | (2.23) | | 2.49 | | 1.53 | | 2.01 | | 1.62 | | 2.25 |
| |
|
| Total from investment operations | | (2.11) | | 2.72 | | 1.77 | | 2.19 | | 1.72 | | 2.33 |
|
| Distributions to shareholders from |
| Net investment income | | (0.11) | | (0.22) | | (0.23) | | (0.18) | | (0.10) | | (0.08) |
| Net realized gains | | (1.99) | | (0.60) | | 0 | | 0 | | 0 | | 0 |
| |
|
| Total distributions to shareholders | | (2.10) | | (0.82) | | (0.23) | | (0.18) | | (0.10) | | (0.08) |
|
| Net asset value, end of period | | $14.85 | | $19.06 | | $17.16 | | $15.62 | | $13.61 | | $11.99 |
|
| Total return | | (12.05%) | | 16.28% | | 11.44% | | 16.19% | | 14.40% | | 24.04% |
|
| Ratios and supplemental data |
| Net assets, end of period (thousands) | | $1,104,343 | | $1,592,166 | | $1,722,790 | | $1,432,963 | | $1,455,039 | | $528,160 |
| Ratios to average net assets |
| Expenses including waivers/reimbursements | | |
| but excluding expense reductions | | 0.68%2 | | 0.62% | | 0.55% | | 0.80% | | 0.84% | | 0.85% |
| Expenses excluding waivers/reimbursements | | |
| and expense reductions | | 0.68%2 | | 0.62% | | 0.56% | | 0.84% | | 0.86% | | 0.94% |
| Net investment income (loss) | | 1.37%2 | | 1.25% | | 1.45% | | 1.23% | | 0.76% | | 0.76% |
| Portfolio turnover rate | | 18% | | 71% | | 52% | | 38% | | 54% | | 49% |
|
1 Net investment income (loss) per share is based on average shares outstanding during the period.
2 Annualized
See Notes to Financial Statements
10
| FINANCIAL HIGHLIGHTS |
|
| (For a share outstanding throughout each period) | | Six Months Ended | | Year Ended September 30, |
| | March 31, 2008 | |
|
| CLASS IS | | (unaudited) | | 2007 | | 2006 | | 2005 | | 2004 | | 2003 |
|
| Net asset value, beginning of period | | $18.99 | | $17.10 | | $15.57 | | $13.57 | | $11.93 | | $9.70 |
|
| Income from investment operations |
| Net investment income (loss) | | 0.091 | | 0.18 | | 0.20 | | 0.151 | | 0.07 | | 0.051 |
Net realized and unrealized gains
or losses on investments | | (2.21) | | 2.49 | | 1.52 | | 2.00 | | 1.63 | | 2.24 |
| |
|
| Total from investment operations | | (2.12) | | 2.67 | | 1.72 | | 2.15 | | 1.70 | | 2.29 |
|
| Distributions to shareholders from |
| Net investment income | | (0.10) | | (0.18) | | (0.19) | | (0.15) | | (0.06) | | (0.06) |
| Net realized gains | | (1.99) | | (0.60) | | 0 | | 0 | | 0 | | 0 |
| |
|
| Total distributions to shareholders | | (2.09) | | (0.78) | | (0.19) | | (0.15) | | (0.06) | | (0.06) |
|
| Net asset value, end of period | | $14.78 | | $18.99 | | $17.10 | | $15.57 | | $13.57 | | $11.93 |
|
| Total return | | (12.13%) | | 15.92% | | 11.13% | | 15.89% | | 14.23% | | 23.64% |
|
| Ratios and supplemental data |
| Net assets, end of period (thousands) | | $54,949 | | $68,154 | | $68,764 | | $75,019 | | $80,111 | | $915 |
| Ratios to average net assets |
| Expenses including waivers/reimbursements | | |
| but excluding expense reductions | | 0.93%2 | | 0.87% | | 0.80% | | 1.05% | | 1.08% | | 1.10% |
| Expenses excluding waivers/reimbursements | | |
| and expense reductions | | 0.93%2 | | 0.87% | | 0.81% | | 1.09% | | 1.10% | | 1.19% |
| Net investment income (loss) | | 1.13%2 | | 1.00% | | 1.21% | | 0.99% | | 0.51% | | 0.49% |
| Portfolio turnover rate | | 18% | | 71% | | 52% | | 38% | | 54% | | 49% |
|
1 Net investment income (loss) per share is based on average shares outstanding during the period.
2 Annualized
See Notes to Financial Statements
11
| SCHEDULE OF INVESTMENTS | | | | | | |
|
| March 31, 2008 (unaudited) |
| | | Shares | | | | Value |
|
| COMMON STOCKS 99.2% |
| CONSUMER DISCRETIONARY 8.2% |
| Hotels, Restaurants & Leisure 1.2% |
| Carnival Corp. | | 88,630 | | $ 3,587,742 |
| Darden Restaurants, Inc. | | 174,287 | | | | 5,673,042 |
| McDonald’s Corp. | | 168,210 | | | | 9,381,072 |
| |
|
| | | | | | | | | 18,641,856 |
| |
|
| Household Durables 0.4% |
| Whirlpool Corp. | | 73,790 | | | | 6,403,496 |
| |
|
| Internet & Catalog Retail 0.3% |
| Amazon.com, Inc. * | | 67,975 | | | | 4,846,618 |
| |
|
| Leisure Equipment & Products 0.6% |
| Hasbro, Inc. (p) | | 325,321 | | | | 9,076,456 |
| |
|
| Media 3.2% |
| Omnicom Group, Inc. | | 312,853 | | | | 13,821,846 |
| Time Warner, Inc. | | 1,025,760 | | | | 14,381,155 |
| Viacom, Inc., Class B * | | 319,320 | | | | 12,651,458 |
| Walt Disney Co. (p) | | 282,092 | | | | 8,852,047 |
| |
|
| | | | | | | | | 49,706,506 |
| |
|
| Specialty Retail 1.5% |
| AutoZone, Inc. * | | 29,885 | | | | 3,401,810 |
| Best Buy Co., Inc. | | 266,331 | | | | 11,042,083 |
| TJX Cos. | | 293,550 | | | | 9,707,698 |
| |
|
| | | | | | | | | 24,151,591 |
| |
|
| Textiles, Apparel & Luxury Goods 1.0% | | | | | | | | |
| Coach, Inc. * | | 152,174 | | | | 4,588,046 |
| Nike, Inc., Class B | | 161,254 | | | | 10,965,272 |
| |
|
| | | | | | | | | 15,553,318 |
| |
|
| CONSUMER STAPLES 11.8% |
| Beverages 2.7% |
| Coca-Cola Enterprises, Inc. | | 485,477 | | | | 11,748,543 |
| Molson Coors Brewing Co., Class B | | 246,928 | | | | 12,981,005 |
| Pepsi Bottling Group, Inc. | | 265,690 | | | | 9,009,548 |
| PepsiCo, Inc. (p) | | 126,726 | | | | 9,149,617 |
| |
|
| | | | | | | | | 42,888,713 |
| |
|
| Food & Staples Retailing 3.0% |
| Kroger Co. | | 446,196 | | | | 11,333,378 |
| Safeway, Inc. | | 169,945 | | | | 4,987,886 |
| Wal-Mart Stores, Inc. | | 596,217 | | | | 31,408,712 |
| |
|
| | | | | | | | | 47,729,976 |
| |
|
| Food Products 0.5% |
| Bunge, Ltd. (p) | | 79,848 | | | | 6,937,194 |
| |
|
See Notes to Financial Statements
12
| SCHEDULE OF INVESTMENTS continued |
|
| March 31, 2008 (unaudited) |
| | | Shares | | | | Value |
|
| COMMON STOCKS continued |
| CONSUMER STAPLES continued |
| Household Products 2.4% |
| Procter & Gamble Co. | | 536,418 | | $ 37,586,809 |
| |
|
| Personal Products 0.6% |
| Alberto-Culver Co. | | 343,543 | | | | 9,416,514 |
| |
|
| Tobacco 2.6% |
| Altria Group, Inc. | | 482,788 | | | | 10,717,894 |
| Philip Morris International, Inc. * | | 482,788 | | | | 24,419,417 |
| Reynolds American, Inc. (p) | | 99,913 | | | | 5,897,864 |
| |
|
| | | | | | | | | | | 41,035,175 |
| |
|
| ENERGY 12.7% |
| Energy Equipment & Services 2.4% |
| ENSCO International, Inc. | | 167,213 | | | | 10,470,878 |
| Halliburton Co. | | 200,957 | | | | 7,903,639 |
| National Oilwell Varco, Inc. * | | 151,462 | | | | 8,842,351 |
| Noble Corp. | | 199,270 | | | | 9,897,741 |
| |
|
| | | | | 37,114,609 |
| |
|
| Oil, Gas & Consumable Fuels 10.3% | | | | | | | | | | |
| Apache Corp. | | 82,722 | | | | 9,994,472 |
| Chevron Corp. (p) | | 458,985 | | | | 39,178,960 |
| ConocoPhillips | | 374,225 | | | | 28,519,687 |
| Exxon Mobil Corp. | | 706,999 | | | | 59,797,975 |
| Marathon Oil Corp. | | 177,301 | | | | 8,084,926 |
| Occidental Petroleum Corp. | | 123,049 | | | | 9,003,495 |
| Valero Energy Corp. | | 157,723 | | | | 7,745,777 |
| |
|
| | | | | | | | | | | 162,325,292 |
| |
|
| FINANCIALS 14.3% |
| Capital Markets 3.2% |
| Federated Investors, Inc., Class B | | 170,598 | | | | 6,680,618 |
| Goldman Sachs Group, Inc. | | 103,315 | | | | 17,087,268 |
| Lehman Brothers Holdings, Inc. | | 144,964 | | | | 5,456,445 |
| Morgan Stanley | | 173,689 | | | | 7,937,587 |
| State Street Corp. (p) | | 163,739 | | | | 12,935,381 |
| |
|
| | | | | | | | | | | 50,097,299 |
| |
|
| Commercial Banks 1.9% |
| Comerica, Inc. | | 202,867 | | | | 7,116,574 |
| Wells Fargo & Co. | | 787,665 | | | | 22,921,052 |
| |
|
| | | | | | | | | | | 30,037,626 |
| |
|
| Diversified Financial Services 4.2% |
| Bank of America Corp. | | 644,364 | | | | 24,427,839 |
| Citigroup, Inc. | | 736,753 | | | | 15,781,249 |
| JPMorgan Chase & Co. | | 586,593 | | | | 25,194,170 |
| |
|
| | | | | | | | | | | 65,403,258 |
| |
|
See Notes to Financial Statements
13
| SCHEDULE OF INVESTMENTS continued |
|
| March 31, 2008 (unaudited) |
| | | | | | | Shares | | | | Value |
|
| COMMON STOCKS continued |
| FINANCIALS continued |
| Insurance 4.6% |
| ACE, Ltd. | | 213,921 | | $ 11,778,490 |
| Allstate Corp. | | 256,339 | | | | 12,319,652 |
| American International Group, Inc. (p) | | 465,765 | | | | 20,144,336 |
| MetLife, Inc. (p) | | 203,633 | | | | 12,270,925 |
| Travelers Companies, Inc. | | 317,172 | | | | 15,176,680 |
| |
|
| | | | | | | | | | | 71,690,083 |
| |
|
| Real Estate Investment Trusts 0.4% |
| Simon Property Group, Inc. | | 74,667 | | | | 6,937,311 |
| |
|
| HEALTH CARE 13.0% |
| Biotechnology 1.5% |
| Amgen, Inc. * | | 310,499 | | | | 12,972,648 |
| Biogen Idec, Inc. * | | 99,884 | | | | 6,161,844 |
| Genzyme Corp. * | | 69,023 | | | | 5,144,975 |
| |
|
| | | | | | | | | | | 24,279,467 |
| |
|
| Health Care Equipment & Supplies 2.2% | | | | | | | | | | |
| Baxter International, Inc. | | 236,241 | | | | 13,659,454 |
| St. Jude Medical, Inc. * (p) | | 230,888 | | | | 9,972,053 |
| Zimmer Holdings, Inc. * | | 131,020 | | | | 10,201,217 |
| |
|
| | | | | | | | | | | 33,832,724 |
| |
|
| Health Care Providers & Services 2.5% |
| CIGNA Corp. | | 246,248 | | | | 9,990,281 |
| McKesson Corp. | | 101,106 | | | | 5,294,921 |
| Medco Health Solutions, Inc. * | | 82,707 | | | | 3,621,740 |
| UnitedHealth Group, Inc. | | 387,402 | | | | 13,311,133 |
| WellPoint, Inc. * | | 165,816 | | | | 7,317,460 |
| |
|
| | | | | | | | | | | 39,535,535 |
| |
|
| Pharmaceuticals 6.8% |
| Eli Lilly & Co. (p) | | 303,851 | | | | 15,675,673 |
| Forest Laboratories, Inc. * | | 253,430 | | | | 10,139,734 |
| Johnson & Johnson | | 548,815 | | | | 35,601,629 |
| Merck & Co., Inc. | | 209,103 | | | | 7,935,459 |
| Pfizer, Inc. | | 1,469,344 | | | | 30,753,370 |
| Wyeth | | 143,480 | | | | 5,991,725 |
| |
|
| | | | | | | | | | | 106,097,590 |
| |
|
| INDUSTRIALS 11.4% |
| Aerospace & Defense 4.4% |
| Boeing Co. | | 85,425 | | | | 6,353,057 |
| General Dynamics Corp. | | 130,084 | | | | 10,845,103 |
| Honeywell International, Inc. | | 147,921 | | | | 8,345,703 |
| L-3 Communications Holdings, Inc. (p) | | 103,839 | | | | 11,353,756 |
| Lockheed Martin Corp. | | 105,948 | | | | 10,520,637 |
See Notes to Financial Statements
14
| SCHEDULE OF INVESTMENTS continued |
|
| March 31, 2008 (unaudited) |
| | | | | | | | | Shares | | | | Value |
|
| COMMON STOCKS continued |
| INDUSTRIALS continued |
| Aerospace & Defense continued |
| Northrop Grumman Corp. | | 185,332 | | $ 14,420,683 |
| United Technologies Corp. | | 116,066 | | | | 7,987,662 |
| |
|
| | | | | | | | | | | | | 69,826,601 |
| |
|
| Air Freight & Logistics 0.4% |
| United Parcel Service, Inc., Class B | | 86,029 | | | | 6,281,837 |
| |
|
| Commercial Services & Supplies 0.2% | | | | | | | | | | | | |
| Manpower, Inc. | | 61,203 | | | | 3,443,281 |
| |
|
| Industrial Conglomerates 2.9% |
| General Electric Co. | | 1,218,618 | | | | 45,101,052 |
| |
|
| Machinery 2.3% |
| Cummins, Inc. | | 183,195 | | | | 8,577,190 |
| Eaton Corp. | | 126,264 | | | | 10,059,453 |
| Paccar, Inc. (p) | | 150,138 | | | | 6,756,210 |
| Parker Hannifin Corp. | | 162,911 | | | | 11,284,845 |
| |
|
| | | | | | | | | | | | | 36,677,698 |
| |
|
| Road & Rail 1.2% |
| CSX Corp. | | 127,759 | | | | 7,163,447 |
| Norfolk Southern Corp. | | 214,311 | | | | 11,641,374 |
| |
|
| | | | | | | | | | | | | 18,804,821 |
| |
|
| INFORMATION TECHNOLOGY 17.3% |
| Communications Equipment 1.6% | | | |
| Cisco Systems, Inc. * | | 655,345 | | | | 15,787,261 |
| Corning, Inc. | | 175,891 | | | | 4,228,420 |
| QUALCOMM, Inc. | | 116,584 | | | | 4,779,944 |
| |
|
| | | | | | | | | | | | | 24,795,625 |
| |
|
| Computers & Peripherals 5.9% |
| Apple, Inc. * | | 116,459 | | | | 16,711,866 |
| Hewlett-Packard Co. | | 508,257 | | | | 23,207,015 |
| International Business Machines Corp. | | 291,329 | | | | 33,543,621 |
| Lexmark International, Inc., Class A * | | 178,937 | | | | 5,496,945 |
| NetApp, Inc. | | 220,748 | | | | 4,425,997 |
| Seagate Technology, Inc. | | 229,484 | | | | 4,805,395 |
| Western Digital Corp. * | | 140,423 | | | | 3,797,038 |
| |
|
| | | | | | | | | | | | | 91,987,877 |
| |
|
| Internet Software & Services 1.3% |
| eBay, Inc. * | | 293,086 | | | | 8,745,686 |
| Google, Inc., Class A * | | 27,681 | | | | 12,192,650 |
| |
|
| | | | | | | | | | | | | 20,938,336 |
| |
|
See Notes to Financial Statements
15
| SCHEDULE OF INVESTMENTS continued |
|
| March 31, 2008 (unaudited) |
| | | | | Shares | | | | Value |
|
| COMMON STOCKS continued |
| INFORMATION TECHNOLOGY continued |
| IT Services 1.2% |
| Accenture, Ltd., Class A | | 214,535 | | $ 7,545,196 |
| Automatic Data Processing, Inc. | | 141,342 | | | | 5,991,488 |
| Computer Sciences Corp. * | | 115,875 | | | | 4,726,541 |
| |
|
| | | | | | | | | 18,263,225 |
| |
|
| Office Electronics 0.2% |
| Xerox Corp. * | | 258,294 | | | | 3,866,661 |
| |
|
| Semiconductors & Semiconductor Equipment 2.8% | | | | | | | | |
| Intel Corp. | | 1,011,113 | | | | 21,415,373 |
| MEMC Electronic Materials, Inc. * | | 117,651 | | | | 8,341,456 |
| NVIDIA Corp. * | | 260,776 | | | | 5,160,757 |
| Texas Instruments, Inc. | | 333,625 | | | | 9,431,579 |
| |
|
| | | | | | | | | 44,349,165 |
| |
|
| Software 4.3% |
| Adobe Systems, Inc. * | | 121,872 | | | | 4,337,425 |
| Microsoft Corp. | | 1,435,248 | | | | 40,732,338 |
| Oracle Corp. * | | 954,770 | | | | 18,675,301 |
| Symantec Corp. * | | 271,701 | | | | 4,515,671 |
| |
|
| | | | | | | | | 68,260,735 |
| |
|
| MATERIALS 3.0% |
| Chemicals 2.0% |
| Dow Chemical Co. | | 334,353 | | | | 12,320,908 |
| E.I. DuPont de Nemours & Co. | | 184,034 | | | | 8,605,430 |
| Lubrizol Corp. | | 178,502 | | | | 9,908,646 |
| |
|
| | | | | | | | | 30,834,984 |
| |
|
| Metals & Mining 1.0% |
| Freeport-McMoRan Copper & Gold, Inc. | | 85,916 | | | | 8,266,837 |
| United States Steel Corp. (p) | | 64,708 | | | | 8,209,504 |
| |
|
| | | | | | | | | 16,476,341 |
| |
|
| TELECOMMUNICATION SERVICES 4.1% |
| Diversified Telecommunication Services 3.8% |
| AT&T, Inc. | | 962,360 | | | | 36,858,388 |
| Verizon Communications, Inc. | | 641,116 | | | | 23,368,678 |
| |
|
| | | | | | | | | 60,227,066 |
| |
|
| Wireless Telecommunication Services 0.3% |
| Sprint Nextel Corp. (p) | | 567,731 | | | | 3,798,121 |
| |
|
See Notes to Financial Statements
16
| SCHEDULE OF INVESTMENTS continued |
|
| March 31, 2008 (unaudited) |
| | | | | | | | | Shares | | | | Value |
|
| COMMON STOCKS continued |
| UTILITIES 3.4% |
| Electric Utilities 2.3% |
| Duke Energy Corp. | | | | 681,070 | | $ 12,157,099 |
| Edison International | | | | 268,179 | | | | 13,146,135 |
| FirstEnergy Corp. | | | | 152,567 | | | | 10,469,147 |
| |
|
| | | | | | | | | | | | | 35,772,381 |
| |
|
| Multi-Utilities 1.1% |
| CenterPoint Energy, Inc. (p) | | | | 723,246 | | | | 10,320,721 |
| Xcel Energy, Inc. | | | | 405,115 | | | | 8,082,044 |
| |
|
| | | | | | | | | | | | | 18,402,765 |
| |
|
| Total Common Stocks (cost $1,251,872,760) | | | | 1,559,433,588 |
| |
|
|
| | | | | | | | | Principal | | | | |
| | | | | | | | | Amount | | | | Value |
|
| SHORT-TERM INVESTMENTS 8.7% |
| CORPORATE BONDS 0.9% |
| Consumer Finance 0.3% |
| Carrera Capital Finance, LLC, FRN, SIV, 2.58%, 05/27/2008 (pp) + | | $ 5,000,000 | | | | 4,989,450 |
| |
|
| Diversified Financial Services 0.6% |
| Premier Asset Collateralized, LLC, FRN, SIV, 2.80%, 05/15/2008 (pp) + | | | | 5,000,000 | | | | 4,993,990 |
| Sigma Finance, Inc., FRN, SIV, 2.34%, 06/16/2008 (pp) + | | | | 5,000,000 | | | | 4,870,500 |
| |
|
| | | | | | | | | | | | | 9,864,490 |
| |
|
| REPURCHASE AGREEMENTS ^ 4.5% |
| Banc of America Securities, LLC, 3.07%, dated 03/31/2008, maturing | | | | | | | | |
| 04/01/2008, maturity value $17,001,450 (pp) (1) | | | | 17,000,000 | | | | 17,000,000 |
| BNP Paribas Securities, 3.10% dated 03/31/2008, maturing 04/01/2008, maturity | | | | | | | | |
| value $4,400,379 (pp) (2) | | | | 4,400,000 | | | | 4,400,000 |
| Credit Suisse First Boston, LLC, 3.15%, dated 03/31/2008, maturing 04/01/2008, | | | | | | | | |
| maturity value $4,937,435 (pp) (3) | | | | 4,973,000 | | | | 4,973,000 |
| Deutsche Bank Securities, Inc., 3.10%, dated 03/31/2008, maturing 04/01/2008, | | | | | | | | |
| maturity value $20,601,774 (pp) (4) | | | | 20,600,000 | | | | 20,600,000 |
| Dresdner Kleinwort Wasserstein Securities, LLC, 3.10%, dated 03/31/2008, | | | | | | | | |
| maturing 04/01/2008, maturity value $5,050,435 (pp) (5) | | | | 5,050,000 | | | | 5,050,000 |
| Greenwich Capital Markets, Inc., 3.10%, dated 03/31/2008, maturing | | | | | | | | |
| 04/01/2008, maturity value $3,000,258 (pp) (6) | | | | 3,000,000 | | | | 3,000,000 |
| JPMorgan Securities, Inc., 3.07%, dated 03/31/2008, maturing 04/01/2008, | | | | | | | | |
| maturity value $11,000,938 (pp) (7) | | | | 11,000,000 | | | | 11,000,000 |
| Merrill Lynch Pierce Fenner & Smith, Inc., 3.10%, dated 03/31/2008, maturing | | | | | | | | |
| 04/01/2008, maturity value $4,000,344 (pp) (8) | | | | 4,000,000 | | | | 4,000,000 |
| |
|
| | | | | | | | | | | | | 70,023,000 |
| |
|
See Notes to Financial Statements
17
| SCHEDULE OF INVESTMENTS continued |
|
| March 31, 2008 (unaudited) | | | | | | | | Principal | | | | |
| | | | | | | | | Amount | | | | Value |
|
| SHORT-TERM INVESTMENTS continued |
| U.S. TREASURY OBLIGATIONS 0.1% |
| U.S. Treasury Bills: |
| 0.63%, 06/19/2008 ƒ ß | | $ 500,000 | | $ 499,308 |
| 2.03%, 05/08/2008 ƒ ß | | | | 1,000,000 | | | | 997,914 |
| |
|
| | | | | | | | | | | | | 1,497,222 |
| |
|
|
| | | | | | | | | Shares | | | | Value |
|
| MUTUAL FUND SHARES 3.2% |
| BGI Prime Money Market Fund, Premium Shares, 3.15% (pp) q | | | | 11,020,000 | | | | 11,020,000 |
| BlackRock Liquidity TempFund, Institutional Class, 3.25% (pp) q | | | | 6,747,000 | | | | 6,747,000 |
| Evergreen Institutional Money Market Fund, Class I, 3.27% (pp) q ø | | | | 20,925,867 | | | | 20,925,867 |
| Morgan Stanley Institutional Liquidity Fund Money Market Portfolio, Institutional | | | | | | | | |
| Class, 3.31% (pp) q | | | | 10,925,000 | | | | 10,925,000 |
| |
|
| | | | | | | | | | | | | 49,617,867 |
| |
|
| Total Short-Term Investments (cost $136,137,953) | | | | | | | | 135,992,029 |
| |
|
| Total Investments (cost $1,388,010,713) 107.9% | | | | 1,695,425,617 |
| Other Assets and Liabilities (7.9%) | | | | (124,205,610) |
| |
|
| Net Assets 100.0% | | $ 1,571,220,007 |
| |
|
| * | | Non-income producing security |
| (p) | | All or a portion of this security is on loan. |
| (pp) | | All or a portion of this security represents investment of cash collateral received from securities on loan. |
| + | | Security is deemed illiquid and is valued using market quotations when readily available, unless otherwise noted. |
| ƒ | | All or a portion of this security was pledged to cover initial margin requirements for open futures contracts. |
| ß | | Rate shown represents the yield to maturity at date of purchase. |
| q | | Rate shown is the 7-day annualized yield at period end. |
| ø | | Evergreen Investment Management Company, LLC is the investment advisor to both the Fund and the money market |
| | | fund. |
| ^ | | Collateral is pooled with the collateral of other Evergreen funds and allocated on a pro-rata basis consisting of: |
| | | (1) | | investment grade corporate bonds, 2.88% to 8.60%, 10/15/2008 to 06/01/2065, value including accrued |
| | | | | interest is $17,340,000. |
| | | (2) | | investment grade corporate bonds, 5.30% to 8.25%, 10/28/2015 to 06/01/2032, value including accrued |
| | | | | interest is $4,488,000. |
| | | (3) | | investment grade corporate bonds, 7.375% to 8.00%, 06/15/2010 to 03/15/2038, value including accrued |
| | | | | interest is $5,072,462. |
| | | (4) | | high grade CMOs, 2.84% to 6.15%, 09/15/2021 to 02/15/2051, value including accrued interest is |
| | | | | $17,645,409; investment grade CMO, 4.04%, 04/25/2034, value including accrued interest is $3,366,591. |
| | | (5) | | investment grade corporate bonds, 5.70% to 8.75%, 02/15/2017 to 03/01/2031, value including accrued |
| | | | | interest is $281,690; high grade asset-backed securities 2.97% to 3.41%, 05/25/2035 to 08/25/2046, value |
| | | | | including accrued interest is $3,062,521; high grade CMOs, 3.21% to 5.22%, 07/15/2035 to 08/25/2046, |
| | | | | value including accrued interest is $1,807,004. |
| | | (6) | | agency mortgage-backed security, 5.00%, 03/01/2038, value including accrued interest is $3,060,075. |
| | | (7) | | investment grade commercial paper, 0.02% to 0.19%, 04/01/2008 to 06/20/2008, value including accrued |
| | | | | interest is $11,220,262. |
| | | (8) | | investment grade corporate bonds, 0.00% to 7.15%, 08/15/2013 to 06/01/2037, value including accrued |
| | | | | interest is $4,080,011. |
See Notes to Financial Statements
18
SCHEDULE OF INVESTMENTS continued
March 31, 2008 (unaudited)
Summary of Abbreviations
| CMO | | Collateralized Mortgage Obligation |
| FRN | | Floating Rate Note |
| SIV | | Structured Investment Vehicle |
The following table shows the percent of total long-term investments by sector as of March 31, 2008:
| Information Technology | | 17.5% |
| Financials | | 14.4% |
| Health Care | | 13.1% |
| Energy | | 12.8% |
| Consumer Staples | | 11.9% |
| Industrials | | 11.5% |
| Consumer Discretionary | | 8.2% |
| Telecommunication Services | | 4.1% |
| Utilities | | 3.5% |
| Materials | | 3.0% |
| |
|
| | | 100.0% |
| | |
|
See Notes to Financial Statements
19
| STATEMENT OF ASSETS AND LIABILITIES | | | | |
|
| March 31, 2008 (unaudited) | | | | |
|
| Assets | | | | |
| Investments in securities, at value (cost $1,367,084,846) including $131,024,602 of securities | | | | |
| loaned | | $ 1,674,499,750 |
| Investments in affiliated money market fund, at value (cost $20,925,867) | | | | 20,925,867 |
|
| Total investments | | | | 1,695,425,617 |
| Receivable for securities sold | | | | 9,886,600 |
| Receivable for Fund shares sold | | | | 888,638 |
| Dividends receivable | | | | 2,119,567 |
| Receivable for daily variation margin on open futures contracts | | | | 44,958 |
| Receivable for securities lending income | | | | 21,815 |
| Prepaid expenses and other assets | | | | 53,457 |
|
| Total assets | | | | 1,708,440,652 |
|
| Liabilities | | | | |
| Dividends payable | | | | 530,566 |
| Payable for Fund shares redeemed | | | | 1,699,586 |
| Payable for securities on loan | | | | 134,640,731 |
| Due to custodian bank | | | | 139,380 |
| Advisory fee payable | | | | 19,252 |
| Distribution Plan expenses payable | | | | 3,689 |
| Due to other related parties | | | | 4,283 |
| Accrued expenses and other liabilities | | | | 183,158 |
|
| Total liabilities | | | | 137,220,645 |
|
| Net assets | | $ 1,571,220,007 |
|
| Net assets represented by | | | | |
| Paid-in capital | | $ 1,322,492,714 |
| Overdistributed net investment income | | | | (854,765) |
| Accumulated net realized losses on investments | | | | (58,066,713) |
| Net unrealized gains on investments | | | | 307,648,771 |
|
| Total net assets | | $ 1,571,220,007 |
|
| Net assets consists of | | | | |
| Class A | | $ 386,741,899 |
| Class B | | | | 14,616,912 |
| Class C | | | | 10,569,326 |
| Class I | | | | 1,104,343,146 |
| Class IS | | | | 54,948,724 |
|
| Total net assets | | $ 1,571,220,007 |
|
| Shares outstanding (unlimited number of shares authorized) |
| Class A | | | | 26,183,807 |
| Class B | | | | 1,041,014 |
| Class C | | | | 738,340 |
| Class I | | | | 74,367,397 |
| Class IS | | | | 3,717,642 |
|
| Net asset value per share | | | | |
| Class A | | $ 14.77 |
| Class A — Offering price (based on sales charge of 4.75%) | | $ 15.51 |
| Class B | | $ 14.04 |
| Class C | | $ 14.31 |
| Class I | | $ 14.85 |
| Class IS | | $ 14.78 |
|
See Notes to Financial Statements
20
| STATEMENT OF OPERATIONS | | | | |
|
| Six Months Ended March 31, 2008 (unaudited) | | | | |
|
| Investment income | | | | |
| Dividends | | $ 18,702,316 |
| Income from affiliate | | | | 362,164 |
| Securities lending | | | | 184,617 |
| Interest | | | | 18,328 |
|
| Total investment income | | | | 19,267,425 |
|
| Expenses | | | | |
| Advisory fee | | | | 4,228,106 |
| Distribution Plan expenses | | | | |
| Class A | | | | 565,410 |
| Class B | | | | 95,473 |
| Class C | | | | 55,991 |
| Class IS | | | | 76,966 |
| Administrative services fee | | | | 937,154 |
| Transfer agent fees | | | | 675,924 |
| Trustees’ fees and expenses | | | | 19,547 |
| Printing and postage expenses | | | | 70,900 |
| Custodian and accounting fees | | | | 231,294 |
| Registration and filing fees | | | | 52,092 |
| Professional fees | | | | 46,528 |
| Interest expense | | | | 647 |
| Other | | | | 111,754 |
|
| Total expenses | | | | 7,167,786 |
| Less: Expense reductions | | | | (18,444) |
|
| Net expenses | | | | 7,149,342 |
|
| Net investment income | | | | 12,118,083 |
|
| Net realized and unrealized gains or losses on investments | | | | |
| Net realized gains or losses on: | | | | |
| Securities | | | | 56,442,177 |
| Futures contracts | | | | (2,000,619) |
|
| Net realized gains on investments | | | | 54,441,558 |
| Net change in unrealized gains or losses on investments | | | | (301,956,728) |
|
| Net realized and unrealized gains or losses on investments | | | | (247,515,170) |
|
| Net decrease in net assets resulting from operations | | $ (235,397,087) |
|
See Notes to Financial Statements
21
| STATEMENTS OF CHANGES IN NET ASSETS | | | | |
|
| | Six Months Ended | | |
| | | March 31, 2008 | | Year Ended |
| | | (unaudited) | | September 30, 2007 |
|
| Operations | | | | | | | | |
| Net investment income | | $ 12,118,083 | | $ 24,666,231 |
| Net realized gains on investments | | | | 54,441,558 | | | | 317,472,821 |
| Net change in unrealized gains or | | | | | | | | |
| losses on investments | | | | (301,956,728) | | | | (58,186,121) |
|
| Net increase (decrease) in net assets | | | | | | | | |
| resulting from operations | | | | (235,397,087) | | | | 283,952,931 |
|
| Distributions to shareholders from | | | | | | | | |
| Net investment income | | | | | | | | |
| Class A | | | | (2,593,067) | | | | (3,348,628) |
| Class B | | | | (33,847) | | | | (59,143) |
| Class C | | | | (23,194) | | | | (25,804) |
| Class I | | | | (8,893,800) | | | | (20,692,940) |
| Class IS | | | | (367,390) | | | | (665,003) |
| Net realized gains | | | | | | | | |
| Class A | | | | (51,305,752) | | | | (4,070,673) |
| Class B | | | | (2,370,573) | | | | (1,044,861) |
| Class C | | | | (1,265,357) | | | | (307,085) |
| Class I | | | | (157,887,576) | | | | (58,268,660) |
| Class IS | | | | (6,975,858) | | | | (2,358,668) |
|
| Total distributions to shareholders | | | | (231,716,414) | | | | (90,841,465) |
|
| | | Shares | | | | Shares | | |
| Capital share transactions | | | | | | | | |
| Proceeds from shares sold | | | | | | | | |
| Class A | | 713,438 | | 11,354,424 | | 2,285,129 | | 42,144,543 |
| Class B | | 46,590 | | 747,210 | | 215,470 | | 3,744,929 |
| Class C | | 124,616 | | 1,938,604 | | 271,740 | | 4,788,660 |
| Class I | | 5,487,189 | | 89,091,341 | | 15,094,476 | | 280,114,830 |
| Class IS | | 17,669 | | 296,849 | | 39,036 | | 714,883 |
|
| | | | | 103,428,428 | | | | 331,507,845 |
|
| Net asset value of shares issued in | | | | | | | | |
| reinvestment of distributions | | | | | | | | |
| Class A | | 3,168,970 | | 51,763,600 | | 386,349 | | 6,959,436 |
| Class B | | 142,839 | | 2,217,035 | | 61,800 | | 1,038,276 |
| Class C | | 51,137 | | 809,376 | | 12,516 | | 214,218 |
| Class I | | 5,410,073 | | 88,908,680 | | 2,001,115 | | 35,605,091 |
| Class IS | | 393,481 | | 6,430,104 | | 144,674 | | 2,563,336 |
|
| | | | | 150,128,795 | | | | 46,380,357 |
|
| Automatic conversion of Class B | | | | | | | | |
| shares to Class A shares | | | | | | | | |
| Class A | | 240,537 | | 4,691,118 | | 360,217 | | 6,538,358 |
| Class B | | (252,811) | | (4,691,118) | | (377,148) | | (6,538,358) |
|
| | | | | 0 | | | | 0 |
|
| Payment for shares redeemed | | | | | | | | |
| Class A | | (4,988,152) | | (82,249,312) | | (10,014,036) | | (188,221,519) |
| Class B | | (198,809) | | (2,371,399) | | (391,453) | | (6,795,099) |
| Class C | | (105,800) | | (1,749,964) | | (93,304) | | (1,649,230) |
| Class I | | (20,078,388) | | (333,524,315) | | (33,929,502) | | (622,568,556) |
| Class IS | | (283,393) | | (4,684,277) | | (615,247) | | (11,201,450) |
|
| | | | | (424,579,267) | | | | (830,435,854) |
|
| Net asset value of shares issued in | | | | | | | | |
| acquisition | | | | | | | | |
| Class A | | 0 | | 0 | | 27,266,273 | | 524,311,277 |
|
See Notes to Financial Statements
22
| STATEMENTS OF CHANGES IN NET ASSETS continued |
|
| | Six Months Ended | | |
| | | March 31, 2008 | | Year Ended |
| | | (unaudited) | | September 30, 2007 |
|
| Capital share transactions | | | | | | | | |
| continued | | | | | | | | |
| Net increase (decrease) in net assets | | | | | | | | |
| resulting from capital share | | | | | | | | |
| transactions | | $ (171,022,044) | | $ 71,763,625 |
|
| Total increase (decrease) in net assets | | | | (638,135,545) | | | | 264,875,091 |
| Net assets | | | | | | | | |
| Beginning of period | | | | 2,209,355,552 | | | | 1,944,480,461 |
|
| End of period | | $ 1,571,220,007 | | $ 2,209,355,552 |
|
| Overdistributed net investment | | | | | | | | |
| income | | $ (854,765) | | $ (1,061,550) |
|
See Notes to Financial Statements
23
NOTES TO FINANCIAL STATEMENTS (unaudited)
1. ORGANIZATION
Evergreen Enhanced S&P 500® Fund (the “Fund”) is a diversified series of Evergreen Equity Trust (the “Trust”), a Delaware statutory trust organized on September 18, 1997. The Trust is an open-end management investment company registered under the Investment Company Act of 1940, as amended (the “1940 Act”).
The Fund offers Class A, Class B, Class C, Class I and Class IS. Class A shares are sold with a front-end sales charge. However, Class A share investments of $1 million or more are not subject to a front-end sales charge but are subject to a contingent deferred sales charge of 1.00% upon redemption within 18 months. Class B shares are sold without a front-end sales charge but are subject to a contingent deferred sales charge that is payable upon redemption and decreases depending on how long the shares have been held. Class C shares are sold without a front-end sales charge but are subject to a contingent deferred sales charge that is payable upon redemption within one year. Class I and Class IS shares are sold without a front-end sales charge or contingent deferred sales charge. Each class of shares, except Class I shares, pays an ongoing distribution fee.
2. SIGNIFICANT ACCOUNTING POLICIES
The following is a summary of significant accounting policies consistently followed by the Fund in the preparation of its financial statements. The policies are in conformity with generally accepted accounting principles in the United States of America, which require management to make estimates and assumptions that affect amounts reported herein. Actual results could differ from these estimates.
a. Valuation of investments
Listed equity securities are usually valued at the last sales price or official closing price on the national securities exchange where the securities are principally traded.
Portfolio debt securities acquired with more than 60 days to maturity are fair valued using matrix pricing methods determined by an independent pricing service which takes into consideration such factors as similar security prices, yields, maturities, liquidity and ratings. Securities for which valuations are not readily available from an independent pricing service may be valued by brokers which use prices provided by market makers or estimates of market value obtained from yield data relating to investments or securities with similar characteristics.
Short-term securities with remaining maturities of 60 days or less at the time of purchase are valued at amortized cost, which approximates market value.
Investments in open-end mutual funds are valued at net asset value. Securities for which market quotations are not readily available or not reflective of current market value are valued at fair value as determined by the investment advisor in good faith, according to procedures approved by the Board of Trustees.
24
NOTES TO FINANCIAL STATEMENTS (unaudited) continued
b. Repurchase agreements
Securities pledged as collateral for repurchase agreements are held by the custodian bank or in a segregated account in the Fund’s name until the agreements mature. Collateral for certain tri-party repurchase agreements is held at the counterparty’s custodian in a segregated account for the benefit of the Fund and the counterparty. Each agreement requires that the market value of the collateral be sufficient to cover payments of interest and principal. However, in the event of default or bankruptcy by the other party to the agreement, retention of the collateral may be subject to legal proceedings. The Fund will enter into repurchase agreements with banks and other financial institutions, which are deemed by the investment advisor to be creditworthy pursuant to guidelines established by the Board of Trustees. In certain instances, the Fund’s securities lending agent may provide collateral in the form of repurchase agreements.
c. Futures contracts
In order to gain exposure to, or protect against changes in, security values, the Fund may buy and sell futures contracts. The primary risks associated with the use of futures contracts are the imperfect correlation between changes in market values of securities held by the Fund and the prices of futures contracts, and the possibility of an illiquid market.
Futures contracts are valued based upon their quoted daily settlement prices. The aggregate principal amounts of the contracts are not recorded in the financial statements. Fluctuations in the value of the contracts are recorded in the Statement of Assets and Liabilities as an asset or liability and in the Statement of Operations as unrealized gains or losses until the contracts are closed, at which point they are recorded as net realized gains or losses on futures contracts.
d. Securities lending
The Fund may lend its securities to certain qualified brokers in order to earn additional income. The Fund receives compensation in the form of fees or interest earned on the investment of any cash collateral received. The Fund also continues to receive interest and dividends on the securities loaned. The Fund receives collateral in the form of cash or securities with a market value at least equal to the market value of the securities on loan. In the event of default or bankruptcy by the borrower, the Fund could experience delays and costs in recovering the loaned securities or in gaining access to the collateral. The Fund has the right under the lending agreement to recover the securities from the borrower on demand.
e. Options
The Fund may write covered put or call options. When a Fund writes an option, an amount equal to the premium received is recorded as a liability and is subsequently adjusted to the current market value of the written option. Premiums received from written options, which expire unexercised, are recognized as realized gains from investments on the expiration date. The difference between the premium received and the amount paid on effecting a closing purchase transaction, including brokerage commissions, is treated as a realized gain or loss. If a call option is exercised, the premium is added to the proceeds from the sale of the underlying security in calculating the realized gain or loss on the sale. If a put option is exercised, the premium reduces the cost of the
25
NOTES TO FINANCIAL STATEMENTS (unaudited) continued
security purchased. The Fund, as a writer of an option, bears the market risk of an unfavorable change in the price of the security underlying the written option.
The Fund may also purchase call or put options. The premium is included in the Statement of Assets and Liabilities as an investment which is subsequently adjusted to the current market value of the option. Premiums paid for purchased options which expire are recognized as realized losses from investments on the expiration date. Premiums paid for purchased options which are exercised or closed are added to the amount paid or offset against the proceeds on the underlying security to determine the realized gain or loss. The risk of loss associated with purchased options is limited to the premium paid.
f. Security transactions and investment income
Security transactions are recorded on trade date. Realized gains and losses are computed using the specific cost of the security sold. Interest income is recorded on the accrual basis and includes accretion of discounts and amortization of premiums. Dividend income is recorded on the ex-dividend date.
g. Federal and other taxes
The Fund intends to continue to qualify as a regulated investment company and distribute all of its taxable income, including any net capital gains (which have already been offset by available capital loss carryovers). Accordingly, no provision for federal taxes is required. The Fund has adopted the provisions of FASB Interpretation No. 48, Accounting for Uncertainty in Income Taxes (“FIN 48”) which prescribes a minimum threshold for financial statement recognition of the benefit of a tax position taken or expected to be taken in a tax return. The Fund’s financial statements have not been impacted by the adoption of FIN 48.
h. Distributions
Distributions to shareholders from net investment income and net realized gains, if any, are recorded on the ex-dividend date. Such distributions are determined in conformity with income tax regulations, which may differ from generally accepted accounting principles.
i. Class allocations
Income, common expenses and realized and unrealized gains and losses are allocated to the classes based on the relative net assets of each class. Distribution fees, if any, are calculated daily at the class level based on the appropriate net assets of each class and the specific expense rates applicable to each class.
3. ADVISORY FEE AND OTHER TRANSACTIONS WITH AFFILIATES
Evergreen Investment Management Company, LLC (“EIMC”), an indirect, wholly-owned subsidiary of Wachovia Corporation (“Wachovia”), is the investment advisor to the Fund and is paid a base monthly management fee at an annual rate of 0.30% which could be adjusted up to a maximum annual rate of 0.45% or down to a minimum annual rate of 0.15%, depending on the Fund’s performance against the S&P 500. For the six months ended March 31, 2008, the advisory fee was equivalent to 0.45% of the Fund’s average daily net assets (on an annualized basis).
26
NOTES TO FINANCIAL STATEMENTS (unaudited) continued
The Fund may invest in money market funds which are advised by EIMC. Income earned on these investments is included in income from affiliate on the Statement of Operations.
Effective January 1, 2008, EIMC replaced Evergreen Investment Services, Inc. (“EIS”), an indirect, wholly-owned subsidiary of Wachovia, as the administrator to the Fund upon the assignment of the Fund’s Administrative Services Agreement from EIS to EIMC. There were no changes to the services being provided or fees being paid by the Fund. The administrator provides the Fund with facilities, equipment and personnel and is paid an annual rate determined by applying percentage rates to the aggregate average daily net assets of the Evergreen funds (excluding money market funds and Evergreen Institutional Enhanced Income Fund), starting at 0.10% and declining to 0.05% as the aggregate average daily net assets of the Evergreen funds (excluding money market funds and Evergreen Institutional Enhanced Income Fund) increase.
Evergreen Service Company, LLC (“ESC”), an indirect, wholly-owned subsidiary of Wachovia, is the transfer and dividend disbursing agent for the Fund. ESC receives account fees that vary based on the type of account held by the shareholders in the Fund.
Wachovia Bank NA, through its securities lending division of Wachovia Global Securities Lending, acts as the securities lending agent for the Fund.
4. DISTRIBUTION PLANS
EIS serves as distributor of the Fund’s shares. The Fund has adopted Distribution Plans, as allowed by Rule 12b-1 of the 1940 Act, for each class of shares, except Class I. Under the Distribution Plans, distribution fees are paid at an annual rate of 0.25% of the average daily net assets for Class A and Class IS shares and 1.00% of the average daily net assets for each of Class B and Class C shares.
For the six months ended March 31, 2008, EIS received $2,769 from the sale of Class A shares and $71, $11,428 and $456 in contingent deferred sales charges from redemptions of Class A, Class B and Class C shares, respectively.
5. ACQUISITIONS
Effective at the close of business on May 18, 2007, the Fund acquired the net assets of Atlas Growth Opportunities Fund in a tax-free exchange for Class A shares of the Fund. Shares were issued to shareholders of Atlas Growth Opportunities Fund at an exchange ratio of 1.33 for Class A shares of the Fund. On the same date, the Fund also acquired the net assets of Atlas Strategic Growth Fund in a tax-free exchange for Class A shares of the Fund. Shares were issued to shareholders of Atlas Strategic Growth Fund at an exchange ratio of 0.81 for Class A shares of the Fund. The aggregate net assets of the Fund immediately prior to the acquisitions were $2,009,952,035.
27
NOTES TO FINANCIAL STATEMENTS (unaudited) continued
The value of net assets acquired, unrealized appreciation acquired and number of shares issued were as follows:
| | | | | Value of Net | | | | | | Number of |
| Acquired | | | | Assets | | | | Unrealized | | Shares |
| Fund | | | | Acquired | | | | Appreciation | | Issued |
|
| Atlas Growth | | | | | | | | | | |
| Opportunities Fund | | $ 434,721,074 | | $ 98,150,126 | | 22,607,238 Class A |
| Atlas Strategic | | | | | | | | | | |
| Growth Fund | | | | 89,590,203 | | | | 15,433,119 | | 4,659,035 Class A |
|
The aggregate net assets of the Fund immediately after these acquisitions were $2,534,263,312.
6. INVESTMENT TRANSACTIONS
Cost of purchases and proceeds from sales of investment securities (excluding short-term securities) were $338,480,649 and $670,899,432, respectively, for the six months ended March 31, 2008.
At March 31, 2008, the Fund had open long futures contracts outstanding as follows:
| | | | | Initial | | | | |
| | | | | Contract | | Value at | | Unrealized |
| Expiration | | Contracts | | Amount | | March 31, 2008 | | Gain |
|
| June 2008 | | 34 S&P 500 Index | | $11,020,133 | | $11,254,000 | | $233,867 |
|
During the six months ended March 31, 2008, the Fund loaned securities to certain brokers and earned $816 in affiliated income relating to securities lending activity which is included in income from affiliate on the Statement of Operations. At March 31, 2008, the value of securities on loan and the total value of collateral received for securities loaned amounted to $131,024,602 and $134,640,731, respectively.
On March 31, 2008, the aggregate cost of securities for federal income tax purposes was $1,390,686,101. The gross unrealized appreciation and depreciation on securities based on tax cost was $365,563,652 and $60,824,136, respectively, with a net unrealized appreciation of $304,739,516.
As of September 30, 2007, the Fund had $91,324,780 in capital loss carryovers for federal income tax purposes with $8,005,030 expiring in 2008, $26,197,616 expiring in 2009 and $57,122,134 expiring in 2010.
These losses are subject to certain limitations prescribed by the Internal Revenue Code. Utilization of these capital loss carryovers was limited during the year ended September 30, 2007 in accordance with income tax regulations.
7. INTERFUND LENDING
Pursuant to an Exemptive Order issued by the SEC, the Fund may participate in an interfund lending program with certain funds in the Evergreen fund family. This program allows the Fund
28
NOTES TO FINANCIAL STATEMENTS (unaudited) continued
to borrow from, or lend money to, other participating funds. During the six months ended March 31, 2008, the Fund did not participate in the interfund lending program.
8. EXPENSE REDUCTIONS
Through expense offset arrangements with ESC and the Fund’s custodian, a portion of fund expenses has been reduced.
9. DEFERRED TRUSTEES’ FEES
Each Trustee of the Fund may defer any or all compensation related to performance of his or her duties as a Trustee. The Trustees’ deferred balances are allocated to deferral accounts, which are included in the accrued expenses for the Fund. The investment performance of the deferral accounts is based on the investment performance of certain Evergreen funds. Any gains earned or losses incurred in the deferral accounts are reported in the Fund’s Trustees’ fees and expenses. At the election of the Trustees, the deferral account will be paid either in one lump sum or in quarterly installments for up to ten years.
10. FINANCING AGREEMENT
The Fund and certain other Evergreen funds share in an unsecured revolving credit commitment for temporary and emergency purposes, including the funding of redemptions, as permitted by each participating fund’s borrowing restrictions. Borrowings under this facility bear interest at 0.50% per annum above the Federal Funds rate. All of the participating funds are charged an annual commitment fee on the unused balance, which is allocated pro rata. The credit facility is for $100 million with an annual commitment fee of 0.08%.
During the six months ended March 31, 2008, the Fund had average borrowings outstanding of $17,836 (on an annualized basis) at an average rate of 3.63% and paid interest of $647.
11. REGULATORY MATTERS AND LEGAL PROCEEDINGS
Pursuant to an administrative order issued by the SEC on September 19, 2007, EIMC, EIS, ESC (collectively, the “Evergreen Entities”), Wachovia Securities, LLC and the SEC have entered into an agreement settling allegations of (i) improper short-term trading arrangements in effect prior to May 2003 involving former officers and employees of EIMC and certain broker-dealers, (ii) insufficient systems for monitoring exchanges and enforcing exchange limitations as stated in certain funds’ prospectuses, and (iii) inadequate e-mail retention practices. Under the settlement, the Evergreen Entities were censured and have paid approximately $32 million in disgorgement and penalties. This amount, along with a fine assessed by the SEC against Wachovia Securities, LLC will be distributed pursuant to a plan to be developed by an independent distribution consultant and approved by the SEC. The Evergreen Entities neither admitted nor denied the allegations and findings set forth in its settlement with the SEC.
In addition, the Evergreen funds and EIMC and certain of its affiliates are involved in various legal actions, including private litigation and class action lawsuits. EIMC does not expect that any of such legal actions currently pending or threatened will have a material adverse impact on the
29
NOTES TO FINANCIAL STATEMENTS (unaudited) continued
financial position or operations of any of the Evergreen funds or on EIMC’s ability to provide services to the Evergreen funds.
Although EIMC believes that none of the matters discussed above will have a material adverse impact on the Evergreen funds, there can be no assurance that these matters and any publicity surrounding or resulting from them will not result in reduced sales or increased redemptions of Evergreen fund shares, which could increase Evergreen fund transaction costs or operating expenses, or that they will not have other adverse consequences on the Evergreen funds.
12. NEW ACCOUNTING PRONOUNCEMENTS
In September 2006, FASB issued Statement of Financial Accounting Standards No. 157, Fair Value Measurements (“FAS 157”). FAS 157 establishes a single authoritative definition of fair value, establishes a framework for measuring fair value and expands disclosures about fair value measurements. FAS 157 applies to fair value measurements already required or permitted by existing standards. The change to current generally accepted accounting principles from the application of FAS 157 relates to the definition of fair value, the methods used to measure fair value, and the expanded disclosures about fair value measurements. Management of the Fund does not believe the adoption of FAS 157 will materially impact the financial statement amounts, however, additional disclosures may be required about the inputs used to develop the measurements and the effect of certain of the measurements on changes in net assets for the period. FAS 157 is effective for financial statements issued for fiscal years beginning after November 15, 2007 and interim periods within those fiscal years.
In March 2008, FASB issued Statement of Financial Accounting Standards No. 161, Disclosures about Derivative Instruments and Hedging Activities (“FAS 161”), an amendment of FASB Statement No. 133. FAS 161 requires enhanced disclosures about (a) how and why a fund uses derivative instruments, (b) how derivative instruments and hedging activities are accounted for, and (c) how derivative instruments and related hedging activities affect a fund’s financial position, financial performance, and cash flows. Management of the Fund does not believe the adoption of FAS 161 will materially impact the financial statement amounts, but will require additional disclosures. This will include qualitative and quantitative disclosures on derivative positions existing at period end and the effect of using derivatives during the reporting period. FAS 161 is effective for financial statements issued for fiscal years and interim periods beginning after November 15, 2008.
30
This page left intentionally blank
31
| TRUSTEES AND OFFICERS |
|
| TRUSTEES1 |
| Charles A. Austin III | | Investment Counselor, Anchor Capital Advisors, LLC. (investment advice); Director, The Andover |
| Trustee | | Companies (insurance); Trustee, Arthritis Foundation of New England; Former Director, The |
| DOB: 10/23/1934 | | Francis Ouimet Society (scholarship program); Former Director, Executive Vice President and |
| Term of office since: 1991 | | Treasurer, State Street Research & Management Company (investment advice) |
| Other directorships: None | | |
|
| K. Dun Gifford | | Chairman and President, Oldways Preservation and Exchange Trust (education); Trustee, |
| Trustee | | Chairman of the Finance Committee, Member of the Executive Committee, and Former |
| DOB: 10/23/1938 | | Treasurer, Cambridge College |
| Term of office since: 1974 | | |
| Other directorships: None | | |
|
| Dr. Leroy Keith, Jr. | | Managing Director, Almanac Capital Management (commodities firm); Trustee, Phoenix |
| Trustee | | Fund Complex; Director, Diversapack Co. (packaging company); Former Partner, Stonington |
| DOB: 2/14/1939 | | Partners, Inc. (private equity fund); Former Director, Obagi Medical Products Co.; Former |
| Term of office since: 1983 | | Director, Lincoln Educational Services |
| Other directorships: Trustee, | | |
| Phoenix Fund Complex (consisting | | |
| of 53 portfolios as of 12/31/2007) | | |
|
| Carol A. Kosel1 | | Former Consultant to the Evergreen Boards of Trustees; Former Vice President and Senior Vice |
| Trustee | | President, Evergreen Investments, Inc.; Former Treasurer, Evergreen Funds; Former Treasurer, |
| DOB: 12/25/1963 | | Vestaur Securities Fund |
| Term of office since: 2008 | | |
| Other directorships: None | | |
|
| Gerald M. McDonnell | | Former Manager of Commercial Operations, CMC Steel (steel producer) |
| Trustee | | |
| DOB: 7/14/1939 | | |
| Term of office since: 1988 | | |
| Other directorships: None | | |
|
| Patricia B. Norris | | President and Director of Buckleys of Kezar Lake, Inc. (real estate company); Former President |
| Trustee | | and Director of Phillips Pond Homes Association (home community); Former Partner, |
| DOB: 4/9/1948 | | PricewaterhouseCoopers, LLP (independent registered public accounting firm) |
| Term of office since: 2006 | | |
| Other directorships: None | | |
|
| William Walt Pettit | | Partner and Vice President, Kellam & Pettit, P.A. (law firm); Director, Superior Packaging Corp. |
| Trustee | | (packaging company); Member, Superior Land, LLC (real estate holding company), Member, |
| DOB: 8/26/1955 | | K&P Development, LLC (real estate development); Former Director, National Kidney Foundation |
| Term of office since: 1988 | | of North Carolina, Inc. (non-profit organization) |
| Other directorships: None | | |
|
| David M. Richardson | | President, Richardson, Runden LLC (executive recruitment advisory services); Director, J&M |
| Trustee | | Cumming Paper Co. (paper merchandising); Trustee, NDI Technologies, LLP (communications); |
| DOB: 9/19/1941 | | Former Consultant, AESC (The Association of Executive Search Consultants) |
| Term of office since: 1982 | | |
| Other directorships: None | | |
|
| Dr. Russell A. Salton III | | President/CEO, AccessOne MedCard, Inc. |
| Trustee | | |
| DOB: 6/2/1947 | | |
| Term of office since: 1984 | | |
| Other directorships: None | | |
|
32
| TRUSTEES AND OFFICERS continued |
|
| Michael S. Scofield | | Retired Attorney, Law Offices of Michael S. Scofield; Former Director and Chairman, Branded |
| Trustee | | Media Corporation (multi-media branding company) |
| DOB: 2/20/1943 | | |
| Term of office since: 1984 | | |
| Other directorships: None | | |
|
| Richard J. Shima | | Independent Consultant; Director, Hartford Hospital; Trustee, Greater Hartford YMCA; Former |
| Trustee | | Director, Trust Company of CT; Former Director, Old State House Association; Former Trustee, |
| DOB: 8/11/1939 | | Saint Joseph College (CT) |
| Term of office since: 1993 | | |
| Other directorships: None | | |
|
| Richard K. Wagoner, CFA2 | | Member and Former President, North Carolina Securities Traders Association; Member, Financial |
| Trustee | | Analysts Society |
| DOB: 12/12/1937 | | |
| Term of office since: 1999 | | |
| Other directorships: None | | |
|
| OFFICERS |
| Dennis H. Ferro3 | | Principal occupations: President and Chief Executive Officer, Evergreen Investment Company, |
| President | | Inc. and Executive Vice President, Wachovia Bank, N.A.; former Chief Investment Officer, |
| DOB: 6/20/1945 | | Evergreen Investment Company, Inc. |
| Term of office since: 2003 | | |
|
| Jeremy DePalma4 | | Principal occupations: Senior Vice President, Evergreen Investment Management Company, LLC; |
| Treasurer | | Former Vice President, Evergreen Investment Services, Inc.; Former Assistant Vice President, |
| DOB: 2/5/1974 | | Evergreen Investment Services, Inc. |
| Term of office since: 2005 | | |
|
| Michael H. Koonce4 | | Principal occupations: Senior Vice President and General Counsel, Evergreen Investment |
| Secretary | | Services, Inc.; Secretary, Senior Vice President and General Counsel, Evergreen Investment |
| DOB: 4/20/1960 | | Management Company, LLC and Evergreen Service Company, LLC; Senior Vice President and |
| Term of office since: 2000 | | Assistant General Counsel, Wachovia Corporation |
|
| Robert Guerin4 | | Principal occupations: Chief Compliance Officer, Evergreen Funds and Senior Vice President of |
| Chief Compliance Officer | | Evergreen Investments Co, Inc; Former Managing Director and Senior Compliance Officer, |
| DOB: 9/20/1965 | | Babson Capital Management LLC; Former Principal and Director, Compliance and Risk |
| Term of office since: 2007 | | Management, State Street Global Advisors; Former Vice President and Manager, Sales Practice |
| | | Compliance, Deutsche Asset Management. |
|
1 Each Trustee, except Mses. Kosel and Norris, serves until a successor is duly elected or qualified or until his or her death, resignation, retirement or removal from office. As new Trustees, Ms. Kosel’s and Ms. Norris’ initial terms end December 31, 2010 and June 30, 2009, respectively, at which times they may be re-elected by Trustees to serve until a successor is duly elected or qualified or until her death, resignation, retirement or removal from office by the Trustees. Each Trustee, except Ms. Kosel, oversaw 93 Evergreen funds as of December 31, 2007. Ms. Kosel became a Trustee on January 1, 2008. Correspondence for each Trustee may be sent to Evergreen Board of Trustees, P.O. Box 20083, Charlotte, NC 28202.
2 Mr. Wagoner is an “interested person” of the Fund because of his ownership of shares in Wachovia Corporation, the parent to the Fund’s investment advisor.
3 The address of the Officer is 401 S. Tryon Street, 20th Floor, Charlotte, NC 28288.
4 The address of the Officer is 200 Berkeley Street, Boston, MA 02116.
Additional information about the Fund’s Board of Trustees and Officers can be found in the Statement of Additional Information (SAI) and is available upon request without charge by calling 800.343.2898.
33
569843 rv4 04/2008
Evergreen Growth Fund
| table of contents |
| 1 | | LETTER TO SHAREHOLDERS |
| 4 | | FUND AT A GLANCE |
| 6 | | ABOUT YOUR FUND’S EXPENSES |
| 7 | | FINANCIAL HIGHLIGHTS |
| 11 | | SCHEDULE OF INVESTMENTS |
| 18 | | STATEMENT OF ASSETS AND LIABILITIES |
| 19 | | STATEMENT OF OPERATIONS |
| 20 | | STATEMENTS OF CHANGES IN NET ASSETS |
| 21 | | NOTES TO FINANCIAL STATEMENTS |
| 28 | | TRUSTEES AND OFFICERS |
This semiannual report must be preceded or accompanied by a prospectus of the Evergreen fund contained herein. The prospectus contains more complete information, including fees and expenses, and should be read carefully before investing or sending money.
The fund will file its complete schedule of portfolio holdings with the SEC for the first and third quarters of each fiscal year on Form N-Q. The fund’s Form N-Q will be available on the SEC’s Web site at http://www.sec.gov. In addition, the fund’s Form N-Q may be reviewed and copied at the SEC’s Public Reference Room in Washington, D.C. Information on the operation of the Public Reference Room may be obtained by calling 800.SEC.0330.
A description of the fund’s proxy voting policies and procedures, as well as information regarding how the fund voted proxies relating to portfolio securities during the most recent 12-month period ended June 30, is available by visiting our Web site at EvergreenInvestments.com or by visiting the SEC’s Web site at http://www.sec.gov. The fund’s proxy voting policies and procedures are also available without charge, upon request, by calling 800.343.2898.
| Mutual Funds: | | | | |
| NOT FDIC INSURED | | MAY LOSE VALUE | | NOT BANK GUARANTEED |
Evergreen InvestmentsSM is a service mark of Evergreen Investment Management Company, LLC.
Copyright 2008, Evergreen Investment Management Company, LLC.
Evergreen Investment Management Company, LLC is a subsidiary of Wachovia Corporation and is an affiliate of Wachovia Corporation’s other Broker Dealer subsidiaries.
Evergreen mutual funds are distributed by Evergreen Investment Services, Inc.
200 Berkeley Street, Boston, MA 02116
LETTER TO SHAREHOLDERS
May 2008
Dennis H. Ferro
President and Chief Executive Officer
Dear Shareholder:
We are pleased to provide the Semiannual Report for Evergreen Growth Fund for the six-month period ended March 31, 2008 (the “six-month period”).
Mounting evidence of a slowing economy undermined confidence in equities and credit-sensitive fixed income securities during the six-month period. Investors feared weakness in housing and problems in the subprime mortgage industry could pull the domestic economy into recession. Major financial institutions began to report substantial losses from their exposures to subprime mortgages and banks started to tighten their credit standards and to restrict their lending. Equity prices were buffeted by news of falling profits, weakening housing, slowing employment, rising inflationary pressures and growing credit problems. Stock valuations fell across all market capitalizations, investment styles and regions. With fears of a dramatic downturn hovering over the market, fixed income investors sought out the highest-quality securities and attempted to avoid credit risk. As a consequence, the prices of corporate bonds and many asset-backed securities fell, while Treasuries rallied in a general flight to quality. In this environment, the prices of gold, oil and other commodities surged while the U.S. dollar weakened further.
The U.S. economy showed clear signs of weakening over the six-month period. Problems in the credit markets led to declines in lending for ordinary consumer and commercial activity, accentuating the effects of declining home prices. Corporate profits, employment and other key economic indicators showed signs of deterioration. Gross Domestic Product growth slowed to just 0.6% both in the final quarter of 2007 and in the first quarter of 2008. To reinvigorate the economy
1
LETTER TO SHAREHOLDERS continued
and stimulate lending activity, the Federal Reserve Board (the “Fed”) became increasingly aggressive, taking a series of steps to pour liquidity into the financial system. Starting in September 2007 and continuing through April 2008, the Fed cut the key fed funds rate seven different times, lowering the influential short-term rate from 5.25% to 2%. In March 2008, the central bank also opened its lending facilities to securities firms as well as commercial banks and intervened to help JPMorgan Chase & Co. purchase the collapsing investment bank Bear Stearns Cos. Congress and the Bush administration, meanwhile, rushed through a $168 billion fiscal stimulus bill, which included tax rebate checks, in an effort to boost growth in the second half of 2008.
During the six-month period, the management teams of Evergreen’s growth-oriented equity funds maintained their pursuit of capital appreciation, consistent with the investment discipline and style of each fund. The manager of Evergreen Large Company Growth Fund and Evergreen Omega Fund focused on bottom-up, fundamental analysis in making individual stock selections. The portfolio manager supervising Evergreen Mid Cap Growth Fund and Evergreen Small-Mid Growth Fund, meanwhile, sought to balance each portfolio with exposure both to consistent growth companies and to more cyclically oriented corporations. At the same time, managers of Evergreen Growth Fund concentrated on opportunities among small cap growth companies with above-average earnings prospects and reasonable stock valuations. The portfolio manager of Evergreen Enhanced S&P 500® Fund, in turn, employed a largely quantitative discipline in choosing a portfolio of predominately large cap stocks from both the value and growth stock universes.
We believe the experiences in the capital markets during the six-month period have underscored the value of a well-diversified, long-term investment strategy to help soften the effects of volatility in any one market or asset class. As always, we encourage investors to maintain diversified investment portfolios in pursuit of their long-term investment goals.
2
LETTER TO SHAREHOLDERS continued
Please visit us at EvergreenInvestments.com for more information about our funds and other investment products available to you. Thank you for your continued support of Evergreen Investments.
Sincerely,
Dennis H. Ferro
President and Chief Executive Officer
Evergreen Investment Company, Inc.
Special Notice to Shareholders:
Please visit our Web site at EvergreenInvestments.com for statements from President and Chief Executive Officer, Dennis Ferro, regarding the firm’s recent settlement with the Securities and Exchange Commission (SEC) and prior settlement with the Financial Industry Regulatory Authority (FINRA).
3
FUND AT A GLANCE
as of March 31, 2008
MANAGEMENT TEAM
Investment Advisor:
• Evergreen Investment Management Company, LLC
Portfolio Managers:
• Jeffrey S. Drummond, CFA
• Linda Z. Freeman, CFA
• Paul Carder, CFA
• Jeffrey Harrison, CFA
• Edward Rick, CFA
CURRENT INVESTMENT STYLE
Source: Morningstar, Inc.
Morningstar’s style box is based on a portfolio date as of 3/31/2008.
The Equity style box placement is based on 10 growth and valuation measures for each fund holding and the median size of the companies in which the fund invests.
PERFORMANCE AND RETURNS
Portfolio inception date: 4/15/1985
| | | Class A | | Class B | | Class C† | | Class I |
| Class inception date | | 6/5/1995 | | 10/18/1999 | | 4/15/1985 | | 11/19/1997 |
|
| Nasdaq symbol | | EGWAX | | EGRBX | | EGRTX | | EGRYX |
|
| 6-month return with sales charge | | -22.65% | | -21.67% | | -18.87% | | N/A |
|
| 6-month return w/o sales charge | | -17.94% | | -18.32% | | -18.20% | | -17.83% |
|
| Average annual return* | | | | | | | | |
|
| 1-year with sales charge | | -15.22% | | -14.42% | | -11.35% | | N/A |
|
| 1-year w/o sales charge | | -10.05% | | -10.76% | | -10.61% | | -9.77% |
|
| 5-year | | 10.97% | | 11.22% | | 11.52% | | 12.63% |
|
| 10-year | | 3.13% | | 2.99% | | 3.00% | | 4.02% |
|
| Maximum sales charge | | 5.75% | | 5.00% | | 1.00% | | N/A |
| | | Front-end | | CDSC | | CDSC | | |
|
* Adjusted for maximum applicable sales charge, unless noted.
Past performance is no guarantee of future results. The performance quoted represents past performance and current performance may be lower or higher. The investment return and principal value of an investment will fluctuate so that investors’ shares, when redeemed, may be worth more or less than their original cost. To obtain performance information current to the most recent month-end for Classes A, B, C or I, please go to EvergreenInvestments.com/fundperformance. The performance of each class may vary based on differences in loads, fees and expenses paid by the shareholders investing in each class. Performance includes the reinvestment of income dividends and capital gain distributions. Performance shown does not reflect the deduction of taxes that a shareholder would pay on fund distributions or the redemption of fund shares.
Historical performance shown for Class B prior to its inception is based on the performance of Class C, the original class offered. The fund incurs a 12b-1 fee of 0.25% for Class A and 1.00% for Classes B and C. Class I does not pay a 12b-1 fee.
The advisor is reimbursing a portion of the 12b-1 fee for Class A. Had the fee not been reimbursed, returns Class A would have been lower.
4
FUND AT A GLANCE continued
LONG-TERM GROWTH
Comparison of a $10,000 investment in the Evergreen Growth Fund Class A shares versus a similar investment in the Russell 2000 Growth Index (Russell 2000 Growth) and the Consumer Price Index (CPI).
The Russell 2000 Growth is an unmanaged market index and does not include transaction costs associated with buying and selling securities, any mutual fund fees or expenses or any taxes. The CPI is a commonly used measure of inflation and does not represent an investment return. It is not possible to invest directly in an index.
† As of 1/31/2008, Class C is closed to new investors.
Class I shares are only offered, subject to the minimum initial purchase requirements, in the following manner: (1) to investment advisory clients of EIMC (or its advisory affiliates), (2) to employer- or state-sponsored benefit plans, including but not limited to, retirement plans, defined benefit plans, deferred compensation plans, or savings plans, (3) to fee-based mutual fund wrap accounts, (4) through arrangements entered into on behalf of the Evergreen funds with certain financial services firms, (5) to certain institutional investors, and (6) to persons who owned Class Y shares in registered name in an Evergreen fund on or before December 31, 1994 or who owned shares of any SouthTrust fund in registered name as of March 18, 2005 or who owned shares of Vestaur Securities Fund as of May 20, 2005.
Class I shares are only available to institutional shareholders with a minimum of $1 million investment, which may be waived in certain situations.
The fund’s investment objective may be changed without a vote of the fund’s shareholders.
Mid cap securities may be subject to special risks associated with narrower product lines and limited financial resources compared to their large cap counterparts, and, as a result, mid cap securities may decline significantly in market downturns.
The stocks of smaller companies may be more volatile than those of larger companies due to the higher risk of failure.
All data is as of March 31, 2008, and subject to change.
5
ABOUT YOUR FUND’S EXPENSES
The Example below is intended to describe the fees and expenses borne by shareholders and the impact of those costs on your investment.
Example
As a shareholder of the fund, you incur two types of costs: (1) transaction costs, including sales charges (loads), redemption fees and exchange fees; and (2) ongoing costs, including management fees, distribution (12b-1) fees and other fund expenses. This Example is intended to help you understand your ongoing costs (in dollars) of investing in the fund and to compare these costs with the ongoing costs of investing in other mutual funds. The Example is based on an investment of $1,000 invested at the beginning of the period and held for the entire period from October 1, 2007 to March 31, 2008.
The example illustrates your fund’s costs in two ways:
• Actual expenses
The section in the table under the heading “Actual” provides information about actual account values and actual expenses. You may use the information in these columns, together with the amount you invested, to estimate the expenses that you paid over the period. Simply divide your account value by $1,000 (for example, an $8,600 account value divided by $1,000 = 8.6), then multiply the result by the number in the appropriate column for your share class, in the column entitled “Expenses Paid During Period” to estimate the expenses you paid on your account during this period.
• Hypothetical example for comparison purposes
The section in the table under the heading “Hypothetical (5% return before expenses)” provides information about hypothetical account values and hypothetical expenses based on the fund’s actual expense ratio and an assumed rate of return of 5% per year before expenses, which is not the fund’s actual return. The hypothetical account values and expenses may not be used to estimate the actual ending account balance or expenses you paid for the period. You may use this information to compare the ongoing costs of investing in the fund and other funds. To do so, compare this 5% hypothetical example with the 5% hypothetical examples that appear in the shareholder reports of the other funds.
Please note that the expenses shown in the table are meant to highlight your ongoing costs only and do not reflect any transactional costs, such as sales charges (loads), redemption fees or exchange fees. Therefore, the section in the table under the heading “Hypothetical (5% return before expenses)” is useful in comparing ongoing costs only, and will not help you determine the relative total costs of owning different funds. In addition, if these transactional costs were included, your costs would have been higher.
| | | Beginning | | Ending | | | | |
| | | Account | | Account | | Expenses |
| | | Value | | Value | | Paid During |
| | | 10/1/2007 | | 3/31/2008 | | Period* |
|
| Actual | | | | | | | | | | |
| Class A | | $ 1,000.00 | | $ | | 820.60 | | $ 5.64 |
| Class B | | $ 1,000.00 | | $ | | 816.79 | | $ 8.99 |
| Class C | | $ 1,000.00 | | $ | | 818.03 | | $ 8.04 |
| Class I | | $ 1,000.00 | | $ | | 821.75 | | $ 4.46 |
| Hypothetical | | | | | | | | | | |
| (5% return | | | | | | | | | | |
| before expenses) | | | | | | | | | | |
| Class A | | $ 1,000.00 | | $ 1,018.80 | | $ 6.26 |
| Class B | | $ 1,000.00 | | $ 1,015.10 | | $ 9.97 |
| Class C | | $ 1,000.00 | | $ 1,016.15 | | $ 8.92 |
| Class I | | $ 1,000.00 | | $ 1,020.10 | | $ 4.95 |
|
* For each class of the Fund, expenses are equal to the annualized expense ratio of each class (1.24% for Class A, 1.98% for Class B, 1.77% for Class C and 0.98% for Class I), multiplied by the average account value over the period, multiplied by 183 / 366 days.
6
FINANCIALHIGHLIGHTS
(For a share outstanding throughout each period)
| | | Six Months Ended | | Year Ended September 30, |
| | | March 31, 2008 | |
|
| CLASS A | | (unaudited) | | 2007 | | 2006 | | 2005 | | 2004 | | 2003 |
|
| Net asset value, beginning of period | | $ 18.70 | | $ 17.35 | | $ 19.03 | | $ 15.41 | | $ 14.08 | | $ 10.66 |
|
| Income from investment operations | | | | | | | | | | | | | | | | |
| Net investment income (loss) | | | | (0.03)1 | | (0.12)1 | | (0.16)1 | | | | (0.17)1 | | (0.16)1 | | (0.13)1 |
Net realized and unrealized gains
or losses on investments | | | | (2.85) | | 3.63 | | 0.55 | | | | 3.79 | | 1.49 | | 3.55 |
| |
|
| Total from investment operations | | | | (2.88) | | 3.51 | | 0.39 | | | | 3.62 | | 1.33 | | 3.42 |
|
| Distributions to shareholders from | | | | | | | | | | | | | | | | |
| Net realized gains | | | | (2.86) | | (2.16) | | (2.07) | | | | 0 | | 0 | | 0 |
|
| Net asset value, end of period | | $ 12.96 | | $ 18.70 | | $ 17.35 | | $ 19.03 | | $ 15.41 | | $ 14.08 |
|
| Total return2 | | | | (17.94%) | | 21.93% | | 2.55% | | | | 23.49% | | 9.45% | | 32.08% |
|
| Ratios and supplemental data | | | | | | | | | | | | | | | | |
| Net assets, end of period (thousands) | | $72,139 | | $90,563 | | $91,606 | | $94,947 | | $82,353 | | $66,586 |
| Ratios to average net assets | | | | | | | | | | | | | | | | |
| Expenses including waivers/reimbursements | | | | | | | | | | | | | | | | |
| but excluding expense reductions | | | | 1.24%3 | | 1.25% | | 1.26% | | | | 1.25% | | 1.27% | | 1.36% |
| Expenses excluding waivers/reimbursements | | | | | | | | | | | | | | | | |
| and expense reductions | | | | 1.28%3 | | 1.26% | | 1.26% | | | | 1.25% | | 1.27% | | 1.36% |
| Net investment income (loss) | | | | (0.41%)3 | | (0.68%) | | (0.88%) | | | | (0.96%) | | (1.03%) | | (1.05%) |
| Portfolio turnover rate | | | | 64% | | 98% | | 91% | | | | 80% | | 87% | | 120% |
|
1 Net investment income (loss) per share is based on average shares outstanding during the period.
2 Excluding applicable sales charges
3 Annualized
See Notes to Financial Statements
7
FINANCIALHIGHLIGHTS
(For a share outstanding throughout each period)
| | | Six Months Ended | | Year Ended September 30, |
| | | March 31, 2008 | |
|
| CLASS B | | (unaudited) | | 2007 | | 2006 | | 2005 | | 2004 | | 2003 |
|
| Net asset value, beginning of period | | $ 16.17 | | $ 15.37 | | $ 17.21 | | $ 14.04 | | $ 12.91 | | $ 9.86 |
|
| Income from investment operations | | | | | | | | | | | | | | | | |
| Net investment income (loss) | | | | (0.08)1 | | (0.21)1 | | (0.25)1 | | | | (0.26)1 | | (0.25)1 | | (0.20)1 |
Net realized and unrealized gains
or losses on investments | | | | (2.39) | | 3.17 | | 0.48 | | | | 3.43 | | 1.38 | | 3.25 |
| |
|
| Total from investment operations | | | | (2.47) | | 2.96 | | 0.23 | | | | 3.17 | | 1.13 | | 3.05 |
|
| Distributions to shareholders from | | | | | | | | | | | | | | | | |
| Net realized gains | | | | (2.86) | | (2.16) | | (2.07) | | | | 0 | | 0 | | 0 |
|
| Net asset value, end of period | | $ 10.84 | | $ 16.17 | | $ 15.37 | | $ 17.21 | | $ 14.04 | | $ 12.91 |
|
| Total return2 | | | | (18.32%) | | 21.08% | | 1.82% | | | | 22.58% | | 8.75% | | 30.93% |
|
| Ratios and supplemental data | | | | | | | | | | | | | | | | |
| Net assets, end of period (thousands) | | $12,714 | | $18,518 | | $18,940 | | $21,955 | | $20,926 | | $19,127 |
| Ratios to average net assets | | | | | | | | | | | | | | | | |
| Expenses including waivers/reimbursements | | | | | | | | | | | | | | | | |
| but excluding expense reductions | | | | 1.98%3 | | 1.96% | | 1.96% | | | | 1.95% | | 1.98% | | 2.08% |
| Expenses excluding waivers/reimbursements | | | | | | | | | | | | | | | | |
| and expense reductions | | | | 1.98%3 | | 1.96% | | 1.96% | | | | 1.95% | | 1.98% | | 2.08% |
| Net investment income (loss) | | | | (1.16%)3 | | (1.39%) | | (1.59%) | | | | (1.67%) | | (1.73%) | | (1.77%) |
| Portfolio turnover rate | | | | 64% | | 98% | | 91% | | | | 80% | | 87% | | 120% |
|
1 Net investment income (loss) per share is based on average shares outstanding during the period.
2 Excluding applicable sales charges
3 Annualized
See Notes to Financial Statements
8
FINANCIALHIGHLIGHTS
(For a share outstanding throughout each period)
| | | Six Months Ended | | Year Ended September 30, |
| | | March 31, 2008 | |
|
| CLASS C | | (unaudited) | | 2007 | | 2006 | | 2005 | | 2004 | | 2003 |
|
| Net asset value, beginning of period | | $ 16.15 | | $ 15.35 | | $ 17.19 | | $ 14.02 | | $ 12.90 | | $ 9.84 |
|
| Income from investment operations | | | | | | | | | | | | | | | | |
| Net investment income (loss) | | | | (0.06)1 | | (0.21)1 | | (0.25)1 | | | | (0.26)1 | | (0.25)1 | | (0.20)1 |
Net realized and unrealized gains
or losses on investments | | | | (2.40) | | 3.17 | | 0.48 | | | | 3.43 | | 1.37 | | 3.26 |
| |
|
| Total from investment operations | | | | (2.46) | | 2.96 | | 0.23 | | | | 3.17 | | 1.12 | | 3.06 |
|
| Distributions to shareholders from | | | | | | | | | | | | | | | | |
| Net realized gains | | | | (2.86) | | (2.16) | | (2.07) | | | | 0 | | 0 | | 0 |
|
| Net asset value, end of period | | $ 10.83 | | $ 16.15 | | $ 15.35 | | $ 17.19 | | $ 14.02 | | $ 12.90 |
|
| Total return2 | | | | (18.20%) | | 21.11% | | 1.82% | | | | 22.61% | | 8.68% | | 31.10% |
|
| Ratios and supplemental data | | | | | | | | | | | | | | | | |
| Net assets, end of period (thousands) | | $120,908 | | $167,832 | | $168,681 | | $201,363 | | $202,086 | | $220,442 |
| Ratios to average net assets | | | | | | | | | | | | | | | | |
| Expenses including waivers/reimbursements | | | | | | | | | | | | | | | | |
| but excluding expense reductions | | | | 1.77%3 | | 1.96% | | 1.96% | | | | 1.95% | | 1.97% | | 2.09% |
| Expenses excluding waivers/reimbursements | | | | | | | | | | | | | | | | |
| and expense reductions | | | | 1.77%3 | | 1.96% | | 1.96% | | | | 1.95% | | 1.97% | | 2.09% |
| Net investment income (loss) | | | | (0.95%)3 | | (1.39%) | | (1.59%) | | | | (1.67%) | | (1.73%) | | (1.77%) |
| Portfolio turnover rate | | | | 64% | | 98% | | 91% | | | | 80% | | 87% | | 120% |
|
1 Net investment income (loss) per share is based on average shares outstanding during the period.
2 Excluding applicable sales charges
3 Annualized
See Notes to Financial Statements
9
FINANCIALHIGHLIGHTS
(For a share outstanding throughout each period)
| | | Six Months Ended | | Year Ended September 30, |
| | | March 31, 2008 | |
|
| CLASS I | | (unaudited) | | 2007 | | 2006 | | 2005 | | 2004 | | 2003 |
|
| Net asset value, beginning of period | | $ 19.37 | | $ 17.86 | | $ 19.47 | | $ 15.72 | | $ 14.32 | | $ 10.82 |
|
| Income from investment operations | | | | | | | | | | | | | | | | |
| Net investment income (loss) | | | | (0.01)1 | | (0.07)1 | | (0.11)1 | | | | (0.12)1 | | (0.12)1 | | (0.10)1 |
Net realized and unrealized gains
or losses on investments | | | | (2.97) | | 3.74 | | 0.57 | | | | 3.87 | | 1.52 | | 3.60 |
| |
|
| Total from investment operations | | | | (2.98) | | 3.67 | | 0.46 | | | | 3.75 | | 1.40 | | 3.50 |
|
| Distributions to shareholders from | | | | | | | | | | | | | | | | |
| Net realized gains | | | | (2.86) | | (2.16) | | (2.07) | | | | 0 | | 0 | | 0 |
|
| Net asset value, end of period | | $ 13.53 | | $ 19.37 | | $ 17.86 | | $ 19.47 | | $ 15.72 | | $ 14.32 |
|
| Total return | | | | (17.83%) | | 22.23% | | 2.89% | | | | 23.85% | | 9.78% | | 32.35% |
|
| Ratios and supplemental data | | | | | | | | | | | | | | | | |
| Net assets, end of period (thousands) | | $476,429 | | $621,896 | | $692,450 | | $705,901 | | $623,418 | | $497,489 |
| Ratios to average net assets | | | | | | | | | | | | | | | | |
| Expenses including waivers/reimbursements | | | | | | | | | | | | | | | | |
| but excluding expense reductions | | | | 0.98%2 | | 0.96% | | 0.96% | | | | 0.95% | | 0.98% | | 1.07% |
| Expenses excluding waivers/reimbursements | | | | | | | | | | | | | | | | |
| and expense reductions | | | | 0.98%2 | | 0.96% | | 0.96% | | | | 0.95% | | 0.98% | | 1.07% |
| Net investment income (loss) | | | | (0.15%)2 | | (0.39%) | | (0.59%) | | | | (0.67%) | | (0.73%) | | (0.77%) |
| Portfolio turnover rate | | | | 64% | | 98% | | 91% | | | | 80% | | 87% | | 120% |
|
1 Net investment income (loss) per share is based on average shares outstanding during the period.
2 Annualized
See Notes to Financial Statements
10
SCHEDULE OF INVESTMENTS
March 31, 2008 (unaudited)
| | | | | Shares | | | | Value |
|
| |
| COMMON STOCKS 97.6% | | | | | | | | |
| CONSUMER DISCRETIONARY 12.1% | | | | | | |
| Diversified Consumer Services 1.0% | | | | | | |
| Strayer Education, Inc. | | | | 44,900 | | $ | | 6,847,250 |
| |
|
| Hotels, Restaurants & Leisure 4.4% | | | | | | |
| California Pizza Kitchen, Inc. * (p) | | | | 379,850 | | | | 4,979,834 |
| Chipotle Mexican Grill, Inc., Class A * (p) | | 60,700 | | | | 6,885,201 |
| Gaylord Entertainment Co. * | | | | 262,236 | | | | 7,943,128 |
| Great Wolf Resorts, Inc. * (p) | | | | 554,900 | | | | 3,540,262 |
| Life Time Fitness, Inc. * (p) | | | | 113,355 | | | | 3,537,810 |
| Pinnacle Entertainment, Inc. * (p) | | | | 267,700 | | | | 3,426,560 |
| |
|
| | | | | | | | | 30,312,795 |
| |
|
| Internet & Catalog Retail 1.0% | | | | | | |
| Blue Nile, Inc. * (p) | | | | 124,600 | | | | 6,747,090 |
| |
|
| Leisure Equipment & Products 1.0% | | | | | | |
| Callaway Golf Co. | | | | 457,400 | | | | 6,714,632 |
| |
|
| Media 2.5% | | | | | | | | |
| Marvel Entertainment, Inc. * | | | | 243,900 | | | | 6,534,081 |
| National CineMedia, Inc. | | | | 469,300 | | | | 10,549,864 |
| |
|
| | | | | | | | | 17,083,945 |
| |
|
| Specialty Retail 1.2% | | | | | | | | |
| Conn’s, Inc. * (p) | | | | 308,869 | | | | 5,037,653 |
| J. Crew Group, Inc. * (p) | | | | 69,400 | | | | 3,065,398 |
| |
|
| | | | | | | | | 8,103,051 |
| |
|
| Textiles, Apparel & Luxury Goods 1.0% | | | | | | |
| Iconix Brand Group, Inc. * (p) | | | | 380,400 | | | | 6,599,940 |
| |
|
| CONSUMER STAPLES 2.8% | | | | | | | | |
| Food & Staples Retailing 1.1% | | | | | | |
| Longs Drug Stores Corp. | | | | 171,200 | | | | 7,269,152 |
| |
|
| Food Products 0.9% | | | | | | | | |
| Hain Celestial Group, Inc. * | | | | 204,800 | | | | 6,041,600 |
| |
|
| Personal Products 0.8% | | | | | | | | |
| Bare Escentuals, Inc. * (p) | | | | 242,800 | | | | 5,686,376 |
| |
|
| ENERGY 8.1% | | | | | | | | |
| Energy Equipment & Services 5.7% | | | | | | |
| Core Laboratories NV * (p) | | | | 74,700 | | | | 8,911,710 |
| Dril-Quip, Inc. * | | | | 69,400 | | | | 3,225,018 |
| ION Geophysical Corp. * | | | | 289,400 | | | | 3,993,720 |
| Matrix Service Co. * | | | | 306,700 | | | | 5,269,106 |
| Natco Group, Inc., Class A * | | | | 121,400 | | | | 5,675,450 |
| Oceaneering International, Inc. * | | | | 191,000 | | | | 12,033,000 |
| |
|
| | | | | | | | | 39,108,004 |
| |
|
See Notes to Financial Statements
11
SCHEDULE OF INVESTMENTS continued
March 31, 2008 (unaudited)
| | | | | | | Shares | | | | Value |
|
| |
| COMMON STOCKS continued | | | | | | | | | | |
| ENERGY continued | | | | | | | | | | |
| Oil, Gas & Consumable Fuels 2.4% | | | | | | |
| Petrohawk Energy Corp. * | | | | | | 328,400 | | $ | | 6,623,828 |
| PetroQuest Energy, Inc. * | | | | | | 236,300 | | | | 4,097,442 |
| World Fuel Services Corp. | | | | | | 189,700 | | | | 5,324,879 |
| |
|
| | | | | | | | | | | 16,046,149 |
| |
|
| FINANCIALS 6.8% | | | | | | | | | | |
| Capital Markets 4.1% | | | | | | | | | | |
| Greenhill & Co. (p) | | | | | | 108,800 | | | | 7,568,128 |
| KBW, Inc. * (p) | | | | | | 277,500 | | | | 6,118,875 |
| Stifel Financial Corp. * (p) | | | | | | 193,996 | | | | 8,710,420 |
| Waddell & Reed Financial, Inc., Class A | | | | 183,200 | | | | 5,886,216 |
| |
|
| | | | | | | | | | | 28,283,639 |
| |
|
| Commercial Banks 1.2% | | | | | | | | | | |
| PrivateBancorp, Inc. (p) | | | | | | 149,538 | | | | 4,705,961 |
| United Community Banks, Inc. (p) | | | | | | 190,800 | | | | 3,239,784 |
| |
|
| | | | | | | | | | | 7,945,745 |
| |
|
| Diversified Financial Services 0.6% | | | | | | |
| MarketAxess Holdings, Inc. * (p) | | | | | | 382,600 | | | | 3,803,044 |
| |
|
| Real Estate Investment Trusts 0.9% | | | | | | |
| Redwood Trust, Inc. (p) | | | | | | 177,700 | | | | 6,459,395 |
| |
|
| HEALTH CARE 19.8% | | | | | | | | | | |
| Biotechnology 2.2% | | | | | | | | | | |
| BioMarin Pharmaceutical, Inc. * (p) | | | | | | 168,000 | | | | 5,942,160 |
| Cepheid * | | | | | | 118,400 | | | | 2,887,776 |
| United Therapeutics Corp. * (p) | | | | | | 67,200 | | | | 5,826,240 |
| |
|
| | | | | | | | | | | 14,656,176 |
| |
|
| Health Care Equipment & Supplies 5.6% | | | | | |
| ArthroCare Corp. * | | | | | | 93,218 | | | | 3,108,820 |
| Conceptus, Inc. * (p) | | | | | | 251,300 | | | | 4,664,128 |
| Hansen Medical, Inc. * (p) | | | | | | 236,700 | | | | 3,328,002 |
| Hologic, Inc. * | | | | | | 87,800 | | | | 4,881,680 |
| Masimo Corp. * | | | | | | 106,050 | | | | 2,757,300 |
| Meridian Bioscience, Inc. | | | | | | 220,050 | | | | 7,356,271 |
| NuVasive, Inc. * (p) | | | | | | 148,500 | | | | 5,124,735 |
| Zoll Medical Corp. * | | | | | | 247,501 | | | | 6,581,052 |
| |
|
| | | | | | | | | | | 37,801,988 |
| |
|
| Health Care Providers & Services 5.6% | | | | | | |
| Inventiv Health, Inc. * | | | | | | 227,020 | | | | 6,540,446 |
| Pediatrix Medical Group, Inc. * | | | | | | 114,000 | | | | 7,683,600 |
| Psychiatric Solutions, Inc. * (p) | | | | | | 354,598 | | | | 12,027,964 |
| Sun Healthcare Group, Inc. * | | | | | | 414,000 | | | | 5,439,960 |
| VCA Antech, Inc. * | | | | | | 247,627 | | | | 6,772,599 |
| |
|
| | | | | | | | | | | 38,464,569 |
| |
|
See Notes to Financial Statements
12
SCHEDULE OF INVESTMENTS continued
March 31, 2008 (unaudited)
| | | | | | | Shares | | | | Value |
|
| |
| COMMON STOCKS continued | | | | | | | | |
| HEALTH CARE continued | | | | | | | | |
| Health Care Technology 0.6% | | | | | | | | |
| Eclipsys Corp. * | | | | | | 197,300 | | $ | | 3,869,053 |
| |
|
| Life Sciences Tools & Services 5.5% | | | | | | |
| Icon plc * | | | | | | 192,900 | | | | 12,517,281 |
| Illumina, Inc. * | | | | | | 144,100 | | | | 10,937,190 |
| PAREXEL International Corp. * | | | | 398,800 | | | | 10,408,680 |
| Sequenom, Inc. * (p) | | | | | | 601,300 | | | | 3,908,450 |
| |
|
| | | | | | | | | | | 37,771,601 |
| |
|
| Pharmaceuticals 0.3% | | | | | | | | |
| Obagi Medical Products, Inc. * | | | | 251,400 | | | | 2,182,152 |
| |
|
| INDUSTRIALS 17.8% | | | | | | | | | | |
| Aerospace & Defense 5.1% | | | | | | | | |
| AAR Corp. * (p) | | | | | | 266,600 | | | | 7,270,182 |
| ARGON ST, Inc. * (p) | | | | | | 380,554 | | | | 6,473,224 |
| BE Aerospace, Inc. * | | | | | | 332,700 | | | | 11,627,865 |
| Hexcel Corp. * (p) | | | | | | 513,700 | | | | 9,816,807 |
| |
|
| | | | | | | | | | | 35,188,078 |
| |
|
| Air Freight & Logistics 0.9% | | | | | | | | |
| Forward Air Corp. (p) | | | | | | 184,205 | | | | 6,528,225 |
| |
|
| Airlines 0.9% | | | | | | | | | | |
| AirTran Holdings, Inc. * (p) | | | | | | 919,100 | | | | 6,066,060 |
| |
|
| Commercial Services & Supplies 4.3% | | | | | | |
| Advisory Board Co. * | | | | | | 82,400 | | | | 4,527,056 |
| Clean Harbors, Inc. * | | | | | | 75,900 | | | | 4,933,500 |
| Heidrick & Struggles International, Inc. | | | | 54,200 | | | | 1,763,126 |
| Interface, Inc., Class A | | | | | | 338,100 | | | | 4,750,305 |
| Kforce, Inc. * | | | | | | 173,400 | | | | 1,532,856 |
| Steiner Leisure, Ltd. * | | | | | | 161,474 | | | | 5,328,642 |
| Waste Connections, Inc. * | | | | | | 213,500 | | | | 6,562,990 |
| |
|
| | | | | | | | | | | 29,398,475 |
| |
|
| Construction & Engineering 2.0% | | | | | | |
| Quanta Services, Inc. * (p) | | | | | | 579,900 | | | | 13,436,283 |
| |
|
| Electrical Equipment 1.6% | | | | | | | | |
| General Cable Corp. * (p) | | | | | | 111,600 | | | | 6,592,212 |
| Polypore International, Inc. * | | | | 210,251 | | | | 4,350,093 |
| |
|
| | | | | | | | | | | 10,942,305 |
| |
|
| Machinery 2.4% | | | | | | | | | | |
| Albany International Corp., Class A | | | | 125,700 | | | | 4,542,798 |
| Manitowoc Co., Inc. (p) | | | | | | 138,700 | | | | 5,658,960 |
| RBC Bearings, Inc. * | | | | | | 163,647 | | | | 6,076,213 |
| |
|
| | | | | | | | | | | 16,277,971 |
| |
|
See Notes to Financial Statements
13
SCHEDULE OF INVESTMENTS continued
March 31, 2008 (unaudited)
| | | | | | | | | Shares | | | | Value |
|
| |
| COMMON STOCKS continued | | | | | | | | | | |
| INDUSTRIALS continued | | | | | | | | | | | | |
| Trading Companies & Distributors 0.6% | | | | | | | | |
| Interline Brands, Inc. * | | | | | | | | 205,809 | | $ | | 3,817,757 |
| |
|
| INFORMATION TECHNOLOGY 25.2% | | | | | | | | |
| Communications Equipment 1.5% | | | | | | | | | | |
| Adtran, Inc. | | | | | | | | 327,300 | | | | 6,055,050 |
| Harmonic, Inc. * | | | | | | | | 600,400 | | | | 4,563,040 |
| |
|
| | | | | | | | | | | | | 10,618,090 |
| |
|
| Computers & Peripherals 0.5% | | | | | | | | | | |
| Stratasys, Inc. * (p) | | | | | | | | 183,652 | | | | 3,269,005 |
| |
|
| Electronic Equipment & Instruments 2.0% | | | | | | | | |
| Benchmark Electronics, Inc. * | | | | | | | | 432,662 | | | | 7,766,283 |
| Mellanox Technologies, Ltd. * | | | | | | | | 410,800 | | | | 5,722,444 |
| |
|
| | | | | | | | | | | | | 13,488,727 |
| |
|
| Internet Software & Services 8.6% | | | | | | | | |
| Bankrate, Inc. * (p) | | | | | | | | 152,777 | | | | 7,622,044 |
| ComScore, Inc. * | | | | | | | | 189,600 | | | | 3,803,376 |
| Constant Contact, Inc. * (p) | | | | | | | | 261,520 | | | | 3,786,810 |
| Equinix, Inc. * (p) | | | | | | | | 142,854 | | | | 9,498,362 |
| LivePerson, Inc. * | | | | | | | | 914,728 | | | | 2,835,657 |
| NIC, Inc. | | | | | | | | 1,130,508 | | | | 8,037,912 |
| SonicWALL, Inc. * | | | | | | | | 500,700 | | | | 4,090,719 |
| SupportSoft, Inc. * | | | | | | | | 1,052,396 | | | | 3,472,907 |
| Switch & Data Facilities Co., Inc. * (p) | | | | | | 557,624 | | | | 5,693,341 |
| ValueClick, Inc. * | | | | | | | | 196,200 | | | | 3,384,450 |
| Vocus, Inc. * | | | | | | | | 259,600 | | | | 6,853,440 |
| |
|
| | | | | | | | | | | | | 59,079,018 |
| |
|
Semiconductors & Semiconductor
Equipment 6.3% | | | | |
| Advanced Energy Industries, Inc. * | | | | | | | | 190,700 | | | | 2,528,682 |
| ATMI, Inc. * | | | | | | | | 488,894 | | | | 13,605,920 |
| FormFactor, Inc. * | | | | | | | | 186,400 | | | | 3,560,240 |
| NetLogic Microsystems, Inc. * (p) | | | | | | | | 316,500 | | | | 7,640,310 |
| PDF Solutions, Inc. * (p) | | | | | | | | 398,678 | | | | 2,196,716 |
| Power Integrations, Inc. * | | | | | | | | 266,655 | | | | 7,802,325 |
| Tessera Technologies, Inc. * | | | | | | | | 260,100 | | | | 5,410,080 |
| |
|
| | | | | | | | | | | | | 42,744,273 |
| |
|
| Software 6.3% | | | | | | | | | | | | |
| Blackboard, Inc. * | | | | | | | | 273,075 | | | | 9,101,590 |
| Bottomline Technologies, Inc. * | | | | | | | | 394,500 | | | | 4,970,700 |
| Concur Technologies, Inc. * (p) | | | | | | | | 284,678 | | | | 8,839,252 |
| Micros Systems, Inc. * | | | | | | | | 288,304 | | | | 9,704,313 |
| Ultimate Software Group, Inc. * (p) | | | | | | | | 342,510 | | | | 10,295,850 |
| |
|
| | | | | | | | | | | | | 42,911,705 |
| |
|
See Notes to Financial Statements
14
SCHEDULE OF INVESTMENTS continued
March 31, 2008 (unaudited)
| | | | | | | Shares | | | | Value |
|
| |
| COMMON STOCKS continued | | | | | | |
| MATERIALS 1.3% | | | | | | | | | | |
| Chemicals 0.7% | | | | | | | | | | |
| Cytec Industries, Inc. | | | | | | 96,500 | | $ | | 5,196,525 |
| |
|
| Metals & Mining 0.6% | | | | | | | | |
| Compass Minerals International, Inc. | | 67,456 | | | | 3,978,555 |
| |
|
| TELECOMMUNICATION SERVICES 3.7% | | | | | | |
| Diversified Telecommunication Services 3.7% | | | | | | |
| Cogent Communications Group, Inc. * (p) | | 368,500 | | | | 6,747,235 |
| Paetec Holding Corp. * | | | | | | 1,243,167 | | | | 8,279,492 |
| Time Warner Telecom, Inc. * (p) | | | | 645,909 | | | | 10,005,131 |
| |
|
| | | | | | | | | | | 25,031,858 |
| |
|
| Total Common Stocks (cost $637,924,861) | | | | | | 665,770,256 |
| | |
|
|
| | | | | | | Principal | | | | |
| | | | | | | Amount | | | | Value |
|
| |
| SHORT-TERM INVESTMENTS 31.7% | | | | | | |
| CORPORATE BONDS 7.2% | | | | | | | | |
| Consumer Finance 2.2% | | | | | | | | |
| Carrera Capital Finance, LLC., SIV, FRN, 2.58%, 05/27/2008 + (pp) | | $ 5,000,000 | | | | 4,989,450 |
| Toyota Motor Credit Corp., FRN, 2.13%, 05/08/2008 (pp) | | 10,000,000 | | | | 9,998,460 |
| |
|
| | | | | | | | | | | 14,987,910 |
| |
|
| Diversified Financial Services 5.0% | | | | | | |
| Bank of America Corp., FRN, 3.05%, 06/13/2008 (pp) | | 10,000,000 | | | | 9,995,760 |
| Premier Asset Collateralized Entity, LLC, SIV, FRN, 2.80%, 05/15/2008 + (pp) | | 10,000,000 | | | | 9,987,980 |
| Sigma Finance, Inc., SIV, FRN, 2.34%, 06/16/2008 + (pp) | | 5,000,000 | | | | 4,870,500 |
| White Pine Finance, LLC, SIV, FRN, 0.00%, 03/17/2008 + (h) • (pp) | | 10,000,000 | | | | 9,000,000 |
| |
|
| | | | | | | | | | | 33,854,240 |
| |
|
| REPURCHASE AGREEMENTS ^ 13.1% | | | | | | |
| Banc of America Securities, LLC, 3.07%, dated 03/31/2008, maturing 04/01/2008, | | | | | | |
| maturity value $5,404,461 (pp) (1) | | 5,404,000 | | | | 5,404,000 |
| BNP Paribas Securities, 3.10% dated 03/31/2008, maturing 04/01/2008, maturity | | | | | | |
| value $16,001,378 (pp) (2) | | | | 16,000,000 | | | | 16,000,000 |
| Credit Suisse First Boston Corp., 3.15%, dated 03/31/2008, maturing | | | | | | |
| 04/01/2008, maturity value $1,000,088 (pp) (3) | | 1,000,000 | | | | 1,000,000 |
| Deutsche Bank Securities, Inc., 3.10% dated 03/31/2008, maturing 04/01/2008, | | | | | | |
| maturity value $12,601,085 (pp) (4) | | 12,600,000 | | | | 12,600,000 |
| Dresdner Kleinwort Wasserstein Securities, LLC, 3.10%, dated 03/31/2008, | | | | | | |
| maturing 04/01/2008, maturity value $17,001,464 (pp) (5) | | 17,000,000 | | | | 17,000,000 |
| Greenwich Capital Markets, Inc., 3.10%, dated 03/31/2008, maturing | | | | | | |
| 04/01/2008, maturity value $5,000,431 (pp) (6) | | 5,000,000 | | | | 5,000,000 |
| JPMorgan Securities, Inc., 3.07%, dated 03/31/2008, maturing 04/01/2008, | | | | | | |
| maturity value $13,329,137 (pp) (7) | | 13,328,000 | | | | 13,328,000 |
See Notes to Financial Statements
15
SCHEDULE OF INVESTMENTS continued
March 31, 2008 (unaudited)
| | | | | Principal | | | | |
| | | | | Amount | | | | Value |
|
| |
| SHORT-TERM INVESTMENTS continued | | | | | | |
| REPURCHASE AGREEMENTS ^ continued | | | | | | |
| Merrill Lynch Pierce Fenner & Smith, Inc., 3.10%, dated 03/31/2008, maturing | | | | | | |
| 04/01/2008, maturity value $18,945,631 (pp) (8) | | $18,944,000 | | $ | | 18,944,000 |
| |
|
| | | | | | | | | 89,276,000 |
| | |
|
|
| | | | | Shares | | | | Value |
|
| |
| MUTUAL FUND SHARES 11.4% | | | | | | |
| BGI Prime Money Market Fund, Premium Shares, 3.15% q (pp) | | 3,000,000 | | | | 3,000,000 |
| BlackRock Liquidity TempFund, Institutional Class, 3.25% q (pp) | | 1,663,000 | | | | 1,663,000 |
| Evergreen Institutional Money Market Fund, Class I, 3.27% q ø (pp) | | 50,262,214 | | | | 50,262,214 |
| Morgan Stanley Institutional Liquidity Fund Money Market Portfolio, Institutional | | | | | | |
| Class, 3.31% q (pp) | | | | 23,000,000 | | | | 23,000,000 |
| |
|
| | | | | | | | | 77,925,214 |
| |
|
| Total Short-Term Investments (cost $217,201,018) | | | | | | 216,043,364 |
| |
|
| Total Investments (cost $855,125,879) 129.3% | | | | | | 881,813,620 |
| Other Assets and Liabilities (29.3%) | | | | | | (199,623,894) |
| |
|
| Net Assets 100.0% | | | | | | $ | | 682,189,726 |
| |
|
| * | | Non-income producing security |
| (p) | | All or a portion of this security is on loan. |
| + | | Security is deemed illiquid and is valued using market quotations when readily available, unless otherwise noted. |
| (pp) | | All or a portion of this security represents investment of cash collateral received from securities on loan. |
| (h) | | Security is valued at fair value as determined by the investment advisor in good faith, according to procedures approved |
| | | by the Board of Trustees. |
| • | | Security which has defaulted on payment of interest and/or principal. The Fund has stopped accruing interest on this |
| | | security. |
| ^ | | Collateral is pooled with the collateral of other Evergreen funds and allocated on a pro rata basis consisting of: |
| | | (1) | | investment grade corporate bonds, 2.88% to 8.60%, 10/15/2008 to 06/01/2065, value including accrued interest |
| | | | | is $5,512,080. |
| | | (2) | | investment grade corporate bonds, 5.30% to 8.25%, 10/28/2015 to 06/01/2032, value including accrued interest |
| | | | | is $16,320,000. |
| | | (3) | | investment grade corporate bonds, 7.375% to 8.00%, 06/15/2010 to 03/15/2038, value including accrued interest |
| | | | | is $1,020,000. |
| | | (4) | | high grade CMOs, 2.84% to 6.15%, 09/15/2021 to 02/15/2051, value including accrued interest is $10,792,823; |
| | | | | investment grade CMO, 4.04%, 04/25/2034, value including accrued interest is $2,059,177. |
| | | (5) | | investment grade corporate bonds, 5.70% to 8.75%, 02/15/2017 to 03/01/2031, value including accrued interest |
| | | | | is $948,262; high grade asset-backed securities 2.97% to 3.41%, 05/25/2035 to 08/25/2046, value including |
| | | | | accrued interest is $10,309,477; high grade CMOs, 3.21% to 5.22%, 07/15/2035 to 08/25/2046, value including |
| | | | | accrued interest is $6,082,983. |
| | | (6) | | agency mortgage-backed security, 5.00%, 03/01/2038, value including accrued interest is $5,100,124. |
| | | (7) | | investment grade commercial paper, 0.02% to 0.19%, 04/01/2008 to 06/20/2008, value including accrued interest |
| | | | | is $13,594,877. |
| | | (8) | | investment grade corporate bonds, 0.00% to 7.15%, 08/15/2013 to 06/01/2037, value including accrued interest |
| | | | | is $19,322,933. |
| q | | Rate shown is the 7-day annualized yield at period end. |
| ø | | Evergreen Investment Management Company, LLC is the investment advisor to both the Fund and the money market |
| | | fund. |
See Notes to Financial Statements
16
SCHEDULE OF INVESTMENTS continued
March 31, 2008 (unaudited)
| Summary of Abbreviations |
| CMO | | Collateralized Mortgage Obligation |
| FRN | | Floating Rate Note |
| SIV | | Structured Investment Vehicle |
The following table shows the percent of total long-term investments by sector as of March 31, 2008:
| Information Technology | | 25.8% |
| Health Care | | 20.2% |
| Industrials | | 18.2% |
| Consumer Discretionary | | 12.4% |
| Energy | | 8.3% |
| Financials | | 7.0% |
| Telecommunication Services | | 3.8% |
| Consumer Staples | | 2.9% |
| Materials | | 1.4% |
| |
|
| | | 100.0% |
| | |
|
See Notes to Financial Statements
17
STATEMENT OF ASSETS AND LIABILITIES
March 31, 2008 (unaudited)
| Assets | | | | |
| Investments in securities, at value (cost $715,587,665) including $191,168,665 of | | | | |
| securities loaned | | $ | | 742,275,406 |
| Investments in affiliated money market fund, at value (cost $50,262,214) | | | | 50,262,214 |
| Investments in repurchase agreements, at value (cost $89,276,000) | | | | 89,276,000 |
|
| Total investments | | | | 881,813,620 |
| Receivable for securities sold | | | | 1,430,143 |
| Receivable for Fund shares sold | | | | 2,063,225 |
| Dividends receivable | | | | 282,265 |
| Receivable for securities lending income | | | | 348,099 |
| Prepaid expenses and other assets | | | | 15,019 |
|
| Total assets | | | | 885,952,371 |
|
| Liabilities | | | | |
| Payable for securities purchased | | | | 3,523,915 |
| Payable for Fund shares redeemed | | | | 2,198,945 |
| Payable for securities on loan | | | | 197,939,789 |
| Due to custodian bank | | | | 194 |
| Advisory fee payable | | | | 11,703 |
| Due to other related parties | | | | 3,941 |
| Accrued expenses and other liabilities | | | | 84,158 |
|
| Total liabilities | | | | 203,762,645 |
|
| Net assets | | $ | | 682,189,726 |
|
| Net assets represented by | | | | |
| Paid-in capital | | $ | | 691,940,137 |
| Undistributed net investment loss | | | | (1,405,613) |
| Accumulated net realized losses on investments | | | | (35,032,539) |
| Net unrealized gains on investments | | | | 26,687,741 |
|
| Total net assets | | $ | | 682,189,726 |
|
| Net assets consists of | | | | |
| Class A | | $ | | 72,138,621 |
| Class B | | | | 12,714,174 |
| Class C | | | | 120,907,887 |
| Class I | | | | 476,429,044 |
|
| Total net assets | | $ | | 682,189,726 |
|
| Shares outstanding (unlimited number of shares authorized) | | | | |
| Class A | | | | 5,566,902 |
| Class B | | | | 1,173,422 |
| Class C | | | | 11,163,689 |
| Class I | | | | 35,220,780 |
|
| Net asset value per share | | | | |
| Class A | | $ | | 12.96 |
| Class A — Offering price (based on sales charge of 5.75%) | | $ | | 13.75 |
| Class B | | $ | | 10.84 |
| Class C | | $ | | 10.83 |
| Class I | | $ | | 13.53 |
|
See Notes to Financial Statements
18
STATEMENT OF OPERATIONS
Six Months Ended March 31, 2008 (unaudited)
| Investment income | | | | |
| Securities lending | | $ | | 1,505,288 |
| Dividends | | | | 1,173,277 |
| Income from affiliate | | | | 600,501 |
|
| Total investment income | | | | 3,279,066 |
|
| Expenses | | | | |
| Advisory fee | | | | 2,781,757 |
| Distribution Plan expenses | | | | |
| Class A | | | | 125,585 |
| Class B | | | | 79,723 |
| Class C | | | | 582,788 |
| Administrative services fee | | | | 396,498 |
| Transfer agent fees | | | | 533,677 |
| Trustees’ fees and expenses | | | | 8,558 |
| Printing and postage expenses | | | | 31,550 |
| Custodian and accounting fees | | | | 101,837 |
| Registration and filing fees | | | | 23,671 |
| Professional fees | | | | 24,000 |
| Other | | | | 12,249 |
|
| Total expenses | | | | 4,701,893 |
| Less: Expense reductions | | | | (24,208) |
| Expense reimbursements | | | | (18,639) |
|
| Net expenses | | | | 4,659,046 |
|
| Net investment loss | | | | (1,379,980) |
|
| Net realized and unrealized gains or losses on investments | | | | |
| Net realized losses on investments | | | | (6,193,124) |
| Net change in unrealized gains or losses on investments | | | | (144,425,939) |
|
| Net realized and unrealized gains or losses on investments | | | | (150,619,063) |
|
| Net decrease in net assets resulting from operations | | $ | | (151,999,043) |
|
See Notes to Financial Statements
19
STATEMENTS OF CHANGES IN NET ASSETS
| | | Six Months Ended | | | | |
| | | March 31, 2008 | | Year Ended |
| | | (unaudited) | | September 30, 2007 |
|
| Operations | | | | | | | | |
| Net investment loss | | $ | | (1,379,980) | | $ | | (5,910,520) |
| Net realized gains or losses on | | | | | | | | |
| investments | | | | (6,193,124) | | | | 173,899,070 |
| Net change in unrealized gains or | | | | | | | | |
| losses on investments | | | | (144,425,939) | | | | 24,758,002 |
|
| Net increase (decrease) in net assets | | | | | | | | |
| resulting from operations | | | | (151,999,043) | | | | 192,746,552 |
|
| Distributions to shareholders from | | | | | | | | |
| Net realized gains | | | | | | | | |
| Class A | | | | (13,465,592) | | | | (11,088,327) |
| Class B | | | | (3,145,977) | | | | (2,597,247) |
| Class C | | | | (29,319,083) | | | | (23,072,094) |
| Class I | | | | (89,966,008) | | | | (80,566,303) |
|
| Total distributions to shareholders | | | | (135,896,660) | | | | (117,323,971) |
|
| | | Shares | | | | Shares | | |
| Capital share transactions | | | | | | | | |
| Proceeds from shares sold | | | | | | | | |
| Class A | | 919,804 | | 14,257,108 | | 789,883 | | 13,862,642 |
| Class B | | 50,462 | | 694,791 | | 99,440 | | 1,514,410 |
| Class C | | 163,728 | | 2,163,086 | | 235,048 | | 3,520,370 |
| Class I | | 7,122,330 | | 113,609,714 | | 7,086,501 | | 127,348,851 |
|
| | | | | 130,724,699 | | | | 146,246,273 |
|
| Net asset value of shares issued in | | | | | | | | |
| reinvestment of distributions | | | | | | | | |
| Class A | | 808,058 | | 12,549,142 | | 635,950 | | 10,416,868 |
| Class B | | 217,488 | | 2,831,697 | | 166,339 | | 2,370,332 |
| Class C | | 2,055,175 | | 26,717,273 | | 1,482,948 | | 21,102,351 |
| Class I | | 3,615,751 | | 58,575,170 | | 2,703,517 | | 45,743,514 |
|
| | | | | 100,673,282 | | | | 79,633,065 |
|
| Automatic conversion of Class B | | | | | | | | |
| shares to Class A shares | | | | | | | | |
| Class A | | 26,405 | | 398,570 | | 40,491 | | 711,386 |
| Class B | | (31,249) | | (398,570) | | (46,582) | | (711,386) |
|
| | | | | 0 | | | | 0 |
|
| Payment for shares redeemed | | | | | | | | |
| Class A | | (1,029,402) | | (15,728,319) | | (1,903,193) | | (33,246,246) |
| Class B | | (208,609) | | (2,699,015) | | (305,910) | | (4,677,564) |
| Class C | | (1,450,147) | | (17,695,984) | | (2,309,705) | | (35,050,479) |
| Class I | | (7,616,324) | | (123,998,576) | | (16,466,887) | | (301,195,137) |
|
| | | | | (160,121,894) | | | | (374,169,426) |
|
| Net increase (decrease) in net assets | | | | | | | | |
| resulting from capital share | | | | | | | | |
| transactions | | | | 71,276,087 | | | | (148,290,088) |
|
| Total decrease in net assets | | | | (216,619,616) | | | | (72,867,507) |
| Net assets | | | | | | | | |
| Beginning of period | | | | 898,809,342 | | | | 971,676,849 |
|
| End of period | | $ | | 682,189,726 | | $ | | 898,809,342 |
|
| Undistributed net investment loss | | $ | | (1,405,613) | | $ | | (25,633) |
|
See Notes to Financial Statements
20
NOTES TO FINANCIAL STATEMENTS (unaudited)
1. ORGANIZATION
Evergreen Growth Fund (the “Fund”) is a diversified series of Evergreen Equity Trust (the “Trust”), a Delaware statutory trust organized on September 18, 1997. The Trust is an open-end management investment company registered under the Investment Company Act of 1940, as amended (the “1940 Act”).
The Fund offers Class A, Class B, Class C and Class I shares. Class A shares are sold with a front-end sales charge. However, Class A share investments of $1 million or more are not subject to a front-end sales charge but are subject to a contingent deferred sales charge of 1.00% upon redemption within 18 months. Class B shares are sold without a front-end sales charge but are subject to a contingent deferred sales charge that is payable upon redemption and decreases depending on how long the shares have been held. Class C shares are sold without a front-end sales charge but are subject to a contingent deferred sales charge that is payable upon redemption within one year. Class I shares are sold without a front-end sales charge or contingent deferred sales charge. Each class of shares, except Class I shares, pays an ongoing distribution fee.
Effective January 31, 2008, Class C shares are only available for purchase by existing shareholders of the Fund.
2. SIGNIFICANT ACCOUNTING POLICIES
The following is a summary of significant accounting policies consistently followed by the Fund in the preparation of its financial statements. The policies are in conformity with generally accepted accounting principles in the United States of America, which require management to make estimates and assumptions that affect amounts reported herein. Actual results could differ from these estimates.
a. Valuation of investments
Listed equity securities are usually valued at the last sales price or official closing price on the national securities exchange where the securities are principally traded.
Portfolio debt securities acquired with more than 60 days to maturity are fair valued using matrix pricing methods determined by an independent pricing service which takes into consideration such factors as similar security prices, yields, maturities, liquidity and ratings. Securities for which valuations are not readily available from an independent pricing service may be valued by brokers which use prices provided by market makers or estimates of market value obtained from yield data relating to investments or securities with similar characteristics.
Short-term securities with remaining maturities of 60 days or less at the time of purchase are valued at amortized cost, which approximates market value.
Investments in open-end mutual funds are valued at net asset value. Securities for which market quotations are not readily available or not reflective of current market value are valued at fair value as determined by the investment advisor in good faith, according to procedures approved by the Board of Trustees.
21
NOTES TO FINANCIAL STATEMENTS (unaudited) continued
b. Repurchase agreements
Securities pledged as collateral for repurchase agreements are held by the custodian bank or in a segregated account in the Fund’s name until the agreements mature. Collateral for certain tri-party repurchase agreements is held at the counterparty’s custodian in a segregated account for the benefit of the Fund and the counterparty. Each agreement requires that the market value of the collateral be sufficient to cover payments of interest and principal. However, in the event of default or bankruptcy by the other party to the agreement, retention of the collateral may be subject to legal proceedings. The Fund will enter into repurchase agreements with banks and other financial institutions, which are deemed by the investment advisor to be creditworthy pursuant to guidelines established by the Board of Trustees. In certain instances, the Fund’s securities lending agent may provide collateral in the form of repurchase agreements.
c. Securities lending
The Fund may lend its securities to certain qualified brokers in order to earn additional income. The Fund receives compensation in the form of fees or interest earned on the investment of any cash collateral received. The Fund also continues to receive interest and dividends on the securities loaned. The Fund receives collateral in the form of cash or securities with a market value at least equal to the market value of the securities on loan. In the event of default or bankruptcy by the borrower, the Fund could experience delays and costs in recovering the loaned securities or in gaining access to the collateral. The Fund has the right under the lending agreement to recover the securities from the borrower on demand.
d. Security transactions and investment income
Security transactions are recorded on trade date. Realized gains and losses are computed using the specific cost of the security sold. Dividend income is recorded on the ex-dividend date.
e. Federal and other taxes
The Fund intends to continue to qualify as a regulated investment company and distribute all of its taxable income, including any net capital gains (which have already been offset by available capital loss carryovers). Accordingly, no provision for federal taxes is required. The Fund has adopted the provisions of FASB Interpretation No. 48, Accounting for Uncertainty in Income Taxes (“FIN 48”) which prescribes a minimum threshold for financial statement recognition of the benefit of a tax position taken or expected to be taken in a tax return. The Fund’s financial statements have not been impacted by the adoption of FIN 48.
f. Distributions
Distributions to shareholders from net investment income and net realized gains, if any, are recorded on the ex-dividend date. Such distributions are determined in conformity with income tax regulations, which may differ from generally accepted accounting principles.
g. Class allocations
Income, common expenses and realized and unrealized gains and losses are allocated to the classes based on the relative net assets of each class. Distribution fees, if any, are calculated daily at the
22
NOTES TO FINANCIAL STATEMENTS (unaudited) continued
class level based on the appropriate net assets of each class and the specific expense rates applicable to each class.
3. ADVISORY FEE AND OTHER TRANSACTIONS WITH AFFILIATES
Evergreen Investment Management Company, LLC (“EIMC”), an indirect, wholly-owned subsidiary of Wachovia Corporation (“Wachovia”), is the investment advisor to the Fund and is paid an annual fee starting at 0.70% and declining to 0.65% as the aggregate average daily net assets of the Fund and its variable annuity counterpart, Evergreen VA Growth Fund, increase. For the six months ended March 31, 2008, the advisory fee was equivalent to 0.70% of the Fund’s average daily net assets (on an annualized basis).
From time to time, EIMC may voluntarily or contractually waive its fee and/or reimburse expenses in order to limit operating expenses. During the six months ended March 31, 2008, EIMC voluntarily reimbursed Distribution Plan expenses (see Note 4) relating to Class A shares in the amount of $18,639.
The Fund may invest in money market funds which are advised by EIMC. Income earned on these investments is included in income from affiliate on the Statement of Operations.
Effective January 1, 2008, EIMC replaced Evergreen Investment Services, Inc. (“EIS”), an indirect, wholly-owned subsidiary of Wachovia, as the administrator to the Fund upon the assignment of the Fund’s Administrative Services Agreement from EIS to EIMC. There were no changes to the services being provided or fees being paid by the Fund. The administrator provides the Fund with facilities, equipment and personnel and is paid an annual rate determined by applying percentage rates to the aggregate average daily net assets of the Evergreen funds (excluding money market funds and Evergreen Institutional Enhanced Income Fund), starting at 0.10% and declining to 0.05% as the aggregate average daily net assets of the Evergreen funds (excluding money market funds and Evergreen Institutional Enhanced Income Fund) increase.
Evergreen Service Company, LLC (“ESC”), an indirect, wholly-owned subsidiary of Wachovia, is the transfer and dividend disbursing agent for the Fund. ESC receives account fees that vary based on the type of account held by the shareholders in the Fund. For the six months ended March 31, 2008, the transfer agent fees were equivalent to an annual rate of 0.13% of the Fund’s average daily net assets.
Wachovia Bank NA, through its securities lending division of Wachovia Global Securities Lending, acts as the securities lending agent for the Fund.
The Fund has placed a portion of its portfolio transactions with brokerage firms that are affiliates of Wachovia. During the six months ended March 31, 2008, the Fund paid brokerage commissions of $10,089 to Wachovia Securities, LLC.
23
NOTES TO FINANCIAL STATEMENTS (unaudited) continued
4. DISTRIBUTION PLANS
EIS serves as distributor of the Fund’s shares. The Fund has adopted Distribution Plans, as allowed by Rule 12b-1 of the 1940 Act, for each class of shares, except Class I. Under the Distribution Plans, distribution fees were paid at an annual rate 0.30% of the average daily net assets for Class A shares and 1.00% of the average daily net assets for each of Class B and Class C shares. Effective January 31, 2008, the Fund suspended payments under the distribution plan attributable to its Class C shares in accordance with regulatory requirements applicable to the distributor. However, the 0.25% service fee continues to be assessed to Class C shares of the Fund.
For the six months ended March 31, 2008, EIS received $2,115 from the sale of Class A shares and $23, $9,849 and $1,088 in contingent deferred sales charges from redemptions of Class A, Class B and Class C shares, respectively.
5. INVESTMENT TRANSACTIONS
Cost of purchases and proceeds from sales of investment securities (excluding short-term securities) were $497,441,092 and $545,005,854, respectively, for the six months ended March 31, 2008.
During the six months ended March 31, 2008, the Fund loaned securities to certain brokers and earned $6,956 in affiliated income relating to securities lending activity which is included in income from affiliate on the Statement of Operations. At March 31, 2008, the value of securities on loan and the total value of collateral received for securities loaned amounted to $191,168,665 and $197,939,789, respectively.
On March 31, 2008, the aggregate cost of securities for federal income tax purposes was $858,345,843. The gross unrealized appreciation and depreciation on securities based on tax cost was $100,471,231 and $77,003,454, respectively, with a net unrealized appreciation of $23,467,777.
As of September 30, 2007, the Fund had $14,906,502 in capital loss carryovers for federal income tax purposes with $3,016,044 expiring in 2008, $111,919 expiring in 2009 and $11,778,539 expiring in 2010. These losses are subject to certain limitations prescribed by the Internal Revenue Code. Utilization of these capital loss carryovers was limited during the year ended September 30, 2007 in accordance with income tax regulations.
6. INTERFUND LENDING
Pursuant to an Exemptive Order issued by the SEC, the Fund may participate in an interfund lending program with certain funds in the Evergreen fund family. This program allows the Fund to borrow from, or lend money to, other participating funds. During the six months ended March 31, 2008, the Fund did not participate in the interfund lending program.
7. EXPENSE REDUCTIONS
Through expense offset arrangements with ESC and the Fund’s custodian, a portion of fund expenses has been reduced.
24
NOTES TO FINANCIAL STATEMENTS (unaudited) continued
8. DEFERRED TRUSTEES’ FEES
Each Trustee of the Fund may defer any or all compensation related to performance of his or her duties as a Trustee. The Trustees’ deferred balances are allocated to deferral accounts, which are included in the accrued expenses for the Fund. The investment performance of the deferral accounts is based on the investment performance of certain Evergreen funds. Any gains earned or losses incurred in the deferral accounts are reported in the Fund’s Trustees’ fees and expenses. At the election of the Trustees, the deferral account will be paid either in one lump sum or in quarterly installments for up to ten years.
9. FINANCING AGREEMENT
The Fund and certain other Evergreen funds share in an unsecured revolving credit commitment for temporary and emergency purposes, including the funding of redemptions, as permitted by each participating fund’s borrowing restrictions. Borrowings under this facility bear interest at 0.50% per annum above the Federal Funds rate. All of the participating funds are charged an annual commitment fee on the unused balance, which is allocated pro rata. The credit facility is for $100 million with an annual commitment fee of 0.08%. During the six months ended March 31, 2008, the Fund had no borrowings.
10. REGULATORY MATTERS AND LEGAL PROCEEDINGS
Pursuant to an administrative order issued by the SEC on September 19, 2007, EIMC, EIS, ESC (collectively, the “Evergreen Entities”), Wachovia Securities, LLC and the SEC have entered into an agreement settling allegations of (i) improper short-term trading arrangements in effect prior to May 2003 involving former officers and employees of EIMC and certain broker-dealers, (ii) insufficient systems for monitoring exchanges and enforcing exchange limitations as stated in certain funds’ prospectuses, and (iii) inadequate e-mail retention practices. Under the settlement, the Evergreen Entities were censured and have paid approximately $32 million in disgorgement and penalties. This amount, along with a fine assessed by the SEC against Wachovia Securities, LLC will be distributed pursuant to a plan to be developed by an independent distribution consultant and approved by the SEC. The Evergreen Entities neither admitted nor denied the allegations and findings set forth in its settlement with the SEC.
In addition, the Evergreen funds and EIMC and certain of its affiliates are involved in various legal actions, including private litigation and class action lawsuits. EIMC does not expect that any of such legal actions currently pending or threatened will have a material adverse impact on the financial position or operations of any of the Evergreen funds or on EIMC’s ability to provide services to the Evergreen funds.
Although EIMC believes that none of the matters discussed above will have a material adverse impact on the Evergreen funds, there can be no assurance that these matters and any publicity surrounding or resulting from them will not result in reduced sales or increased redemptions of Evergreen fund shares, which could increase Evergreen fund transaction costs or operating expenses, or that they will not have other adverse consequences on the Evergreen funds.
25
NOTES TO FINANCIAL STATEMENTS (unaudited) continued
11. NEW ACCOUNTING PRONOUNCEMENTS
In September 2006, FASB issued Statement of Financial Accounting Standards No. 157, Fair Value Measurements (“FAS 157”). FAS 157 establishes a single authoritative definition of fair value, establishes a framework for measuring fair value and expands disclosures about fair value measurements. FAS 157 applies to fair value measurements already required or permitted by existing standards. The change to current generally accepted accounting principles from the application of FAS 157 relates to the definition of fair value, the methods used to measure fair value, and the expanded disclosures about fair value measurements. Management of the Fund does not believe the adoption of FAS 157 will materially impact the financial statement amounts, however, additional disclosures may be required about the inputs used to develop the measurements and the effect of certain of the measurements on changes in net assets for the period. FAS 157 is effective for financial statements issued for fiscal years beginning after November 15, 2007 and interim periods within those fiscal years.
In March 2008, FASB issued Statement of Financial Accounting Standards No. 161, Disclosures about Derivative Instruments and Hedging Activities (“FAS 161”), an amendment of FASB Statement No. 133. FAS 161 requires enhanced disclosures about (a) how and why a fund uses derivative instruments, (b) how derivative instruments and hedging activities are accounted for, and (c) how derivative instruments and related hedging activities affect a fund’s financial position, financial performance, and cash flows. Management of the Fund does not believe the adoption of FAS 161 will materially impact the financial statement amounts, but will require additional disclosures. This will include qualitative and quantitative disclosures on derivative positions existing at period end and the effect of using derivatives during the reporting period. FAS 161 is effective for financial statements issued for fiscal years and interim periods beginning after November 15, 2008.
26
This page left intentionally blank
27
TRUSTEES AND OFFICERS
TRUSTEES1
| Charles A. Austin III | | Investment Counselor, Anchor Capital Advisors, LLC. (investment advice); Director, The Andover |
| Trustee | | Companies (insurance); Trustee, Arthritis Foundation of New England; Former Director, The |
| DOB: 10/23/1934 | | Francis Ouimet Society (scholarship program); Former Director, Executive Vice President and |
| Term of office since: 1991 | | Treasurer, State Street Research & Management Company (investment advice) |
| Other directorships: None | | |
|
| |
| K. Dun Gifford | | Chairman and President, Oldways Preservation and Exchange Trust (education); Trustee, |
| Trustee | | Chairman of the Finance Committee, Member of the Executive Committee, and Former |
| DOB: 10/23/1938 | | Treasurer, Cambridge College |
| Term of office since: 1974 | | |
| Other directorships: None | | |
|
| |
| Dr. Leroy Keith, Jr. | | Managing Director, Almanac Capital Management (commodities firm); Trustee, Phoenix |
| Trustee | | Fund Complex; Director, Diversapack Co. (packaging company); Former Partner, Stonington |
| DOB: 2/14/1939 | | Partners, Inc. (private equity fund); Former Director, Obagi Medical Products Co.; Former |
| Term of office since: 1983 | | Director, Lincoln Educational Services |
| Other directorships: Trustee, | | |
| Phoenix Fund Complex (consisting | | |
| of 53 portfolios as of 12/31/2007) | | |
|
| |
| Carol A. Kosel1 | | Former Consultant to the Evergreen Boards of Trustees; Former Vice President and Senior Vice |
| Trustee | | President, Evergreen Investments, Inc.; Former Treasurer, Evergreen Funds; Former Treasurer, |
| DOB: 12/25/1963 | | Vestaur Securities Fund |
| Term of office since: 2008 | | |
| Other directorships: None | | |
|
| |
| Gerald M. McDonnell | | Former Manager of Commercial Operations, CMC Steel (steel producer) |
| Trustee | | |
| DOB: 7/14/1939 | | |
| Term of office since: 1988 | | |
| Other directorships: None | | �� |
|
| |
| Patricia B. Norris | | President and Director of Buckleys of Kezar Lake, Inc. (real estate company); Former President |
| Trustee | | and Director of Phillips Pond Homes Association (home community); Former Partner, |
| DOB: 4/9/1948 | | PricewaterhouseCoopers, LLP (independent registered public accounting firm) |
| Term of office since: 2006 | | |
| Other directorships: None | | |
|
| |
| William Walt Pettit | | Partner and Vice President, Kellam & Pettit, P.A. (law firm); Director, Superior Packaging Corp. |
| Trustee | | (packaging company); Member, Superior Land, LLC (real estate holding company), Member, |
| DOB: 8/26/1955 | | K&P Development, LLC (real estate development); Former Director, National Kidney Foundation |
| Term of office since: 1988 | | of North Carolina, Inc. (non-profit organization) |
| Other directorships: None | | |
|
| |
| David M. Richardson | | President, Richardson, Runden LLC (executive recruitment advisory services); Director, J&M |
| Trustee | | Cumming Paper Co. (paper merchandising); Trustee, NDI Technologies, LLP (communications); |
| DOB: 9/19/1941 | | Former Consultant, AESC (The Association of Executive Search Consultants) |
| Term of office since: 1982 | | |
| Other directorships: None | | |
|
| |
| Dr. Russell A. Salton III | | President/CEO, AccessOne MedCard, Inc. |
| Trustee | | |
| DOB: 6/2/1947 | | |
| Term of office since: 1984 | | |
| Other directorships: None | | |
|
28
TRUSTEES AND OFFICERS continued
| Michael S. Scofield | | Retired Attorney, Law Offices of Michael S. Scofield; Former Director and Chairman, Branded |
| Trustee | | Media Corporation (multi-media branding company) |
| DOB: 2/20/1943 | | |
| Term of office since: 1984 | | |
| Other directorships: None | | |
|
| |
| Richard J. Shima | | Independent Consultant; Director, Hartford Hospital; Trustee, Greater Hartford YMCA; Former |
| Trustee | | Director, Trust Company of CT; Former Director, Old State House Association; Former Trustee, |
| DOB: 8/11/1939 | | Saint Joseph College (CT) |
| Term of office since: 1993 | | |
| Other directorships: None | | |
|
| |
| Richard K. Wagoner, CFA2 | | Member and Former President, North Carolina Securities Traders Association; Member, Financial |
| Trustee | | Analysts Society |
| DOB: 12/12/1937 | | |
| Term of office since: 1999 | | |
| Other directorships: None | | |
|
| |
| |
| OFFICERS | | |
| |
| Dennis H. Ferro3 | | Principal occupations: President and Chief Executive Officer, Evergreen Investment Company, |
| President | | Inc. and Executive Vice President, Wachovia Bank, N.A.; former Chief Investment Officer, |
| DOB: 6/20/1945 | | Evergreen Investment Company, Inc. |
| Term of office since: 2003 | | |
|
| |
| Jeremy DePalma4 | | Principal occupations: Senior Vice President, Evergreen Investment Management Company, LLC; |
| Treasurer | | Former Vice President, Evergreen Investment Services, Inc.; Former Assistant Vice President, |
| DOB: 2/5/1974 | | Evergreen Investment Services, Inc. |
| Term of office since: 2005 | | |
|
| |
| Michael H. Koonce4 | | Principal occupations: Senior Vice President and General Counsel, Evergreen Investment |
| Secretary | | Services, Inc.; Secretary, Senior Vice President and General Counsel, Evergreen Investment |
| DOB: 4/20/1960 | | Management Company, LLC and Evergreen Service Company, LLC; Senior Vice President and |
| Term of office since: 2000 | | Assistant General Counsel, Wachovia Corporation |
|
| |
| Robert Guerin4 | | Principal occupations: Chief Compliance Officer, Evergreen Funds and Senior Vice President of |
| Chief Compliance Officer | | Evergreen Investments Co, Inc; Former Managing Director and Senior Compliance Officer, |
| DOB: 9/20/1965 | | Babson Capital Management LLC; Former Principal and Director, Compliance and Risk |
| Term of office since: 2007 | | Management, State Street Global Advisors; Former Vice President and Manager, Sales Practice |
| | | Compliance, Deutsche Asset Management. |
|
1 Each Trustee, except Mses. Kosel and Norris, serves until a successor is duly elected or qualified or until his or her death, resignation, retirement or removal from office. As new Trustees, Ms. Kosel’s and Ms. Norris’ initial terms end December 31, 2010 and June 30, 2009, respectively, at which times they may be re-elected by Trustees to serve until a successor is duly elected or qualified or until her death, resignation, retirement or removal from office by the Trustees. Each Trustee, except Ms. Kosel, oversaw 93 Evergreen funds as of December 31, 2007. Ms. Kosel became a Trustee on January 1, 2008. Correspondence for each Trustee may be sent to Evergreen Board of Trustees, P.O. Box 20083, Charlotte, NC 28202.
2 Mr. Wagoner is an “interested person” of the Fund because of his ownership of shares in Wachovia Corporation, the parent to the Fund’s investment advisor.
3 The address of the Officer is 401 S. Tryon Street, 20th Floor, Charlotte, NC 28288.
4 The address of the Officer is 200 Berkeley Street, Boston, MA 02116.
Additional information about the Fund’s Board of Trustees and Officers can be found in the Statement of Additional Information (SAI) and is available upon request without charge by calling 800.343.2898.
29
566379 rv5 04/2008
Evergreen Large Company Growth Fund
| table of contents |
| 1 | | LETTER TO SHAREHOLDERS |
| 4 | | FUND AT A GLANCE |
| 6 | | ABOUT YOUR FUND’S EXPENSES |
| 7 | | FINANCIAL HIGHLIGHTS |
| 11 | | SCHEDULE OF INVESTMENTS |
| 15 | | STATEMENT OF ASSETS AND LIABILITIES |
| 16 | | STATEMENT OF OPERATIONS |
| 17 | | STATEMENTS OF CHANGES IN NET ASSETS |
| 18 | | NOTES TO FINANCIAL STATEMENTS |
| 24 | | TRUSTEES AND OFFICERS |
This semiannual report must be preceded or accompanied by a prospectus of the Evergreen fund contained herein. The prospectus contains more complete information, including fees and expenses, and should be read carefully before investing or sending money.
The fund will file its complete schedule of portfolio holdings with the SEC for the first and third quarters of each fiscal year on Form N-Q. The fund’s Form N-Q will be available on the SEC’s Web site at http://www.sec.gov. In addition, the fund’s Form N-Q may be reviewed and copied at the SEC’s Public Reference Room in Washington, D.C. Information on the operation of the Public Reference Room may be obtained by calling 800.SEC.0330.
A description of the fund’s proxy voting policies and procedures, as well as information regarding how the fund voted proxies relating to portfolio securities during the most recent 12-month period ended June 30, is available by visiting our Web site at EvergreenInvestments.com or by visiting the SEC’s Web site at http://www.sec.gov. The fund’s proxy voting policies and procedures are also available without charge, upon request, by calling 800.343.2898.
Mutual Funds:
| NOT FDIC INSURED | | MAY LOSE VALUE | | NOT BANK GUARANTEED |
Evergreen InvestmentsSM is a service mark of Evergreen Investment Management Company, LLC.
Copyright 2008, Evergreen Investment Management Company, LLC.
Evergreen Investment Management Company, LLC is a subsidiary of Wachovia Corporation
and is an affiliate of Wachovia Corporation’s other Broker Dealer subsidiaries.
Evergreen mutual funds are distributed by Evergreen Investment Services, Inc.
200 Berkeley Street, Boston, MA 02116
LETTER TO SHAREHOLDERS
May 2008
Dennis H. Ferro
President and Chief
Executive Officer
Dear Shareholder:
We are pleased to provide the Semiannual Report for Evergreen Large Company Growth Fund for the six-month period ended March 31, 2008 (the “six-month period”).
Mounting evidence of a slowing economy undermined confidence in equities and credit-sensitive fixed income securities during the six-month period. Investors feared weakness in housing and problems in the subprime mortgage industry could pull the domestic economy into recession. Major financial institutions began to report substantial losses from their exposures to subprime mortgages and banks started to tighten their credit standards and to restrict their lending. Equity prices were buffeted by news of falling profits, weakening housing, slowing employment, rising inflationary pressures and growing credit problems. Stock valuations fell across all market capitalizations, investment styles and regions. With fears of a dramatic downturn hovering over the market, fixed income investors sought out the highest-quality securities and attempted to avoid credit risk. As a consequence, the prices of corporate bonds and many asset-backed securities fell, while Treasuries rallied in a general flight to quality. In this environment, the prices of gold, oil and other commodities surged while the U.S. dollar weakened further.
The U.S. economy showed clear signs of weakening over the six-month period. Problems in the credit markets led to declines in lending for ordinary consumer and commercial activity, accentuating the effects of declining home prices. Corporate profits, employment and other key economic indicators showed signs of deterioration. Gross Domestic Product growth slowed to just 0.6% both in the final quarter of 2007 and in the first quarter of 2008. To reinvigorate the economy
1
LETTER TO SHAREHOLDERS continued
and stimulate lending activity, the Federal Reserve Board (the “Fed”) became increasingly aggressive, taking a series of steps to pour liquidity into the financial system. Starting in September 2007 and continuing through April 2008, the Fed cut the key fed funds rate seven different times, lowering the influential short-term rate from 5.25% to 2%. In March 2008, the central bank also opened its lending facilities to securities firms as well as commercial banks and intervened to help JPMorgan Chase & Co. purchase the collapsing investment bank Bear Stearns Cos. Congress and the Bush administration, meanwhile, rushed through a $168 billion fiscal stimulus bill, which included tax rebate checks, in an effort to boost growth in the second half of 2008.
During the six-month period, the management teams of Evergreen’s growth-oriented equity funds maintained their pursuit of capital appreciation, consistent with the investment discipline and style of each fund. The manager of Evergreen Large Company Growth Fund and Evergreen Omega Fund focused on bottom-up, fundamental analysis in making individual stock selections. The portfolio manager supervising Evergreen Mid Cap Growth Fund and Evergreen Small-Mid Growth Fund, meanwhile, sought to balance each portfolio with exposure both to consistent growth companies and to more cyclically oriented corporations. At the same time, managers of Evergreen Growth Fund concentrated on opportunities among small cap growth companies with above-average earnings prospects and reasonable stock valuations. The portfolio manager of Evergreen Enhanced S&P 500® Fund, in turn, employed a largely quantitative discipline in choosing a portfolio of predominately large cap stocks from both the value and growth stock universes.
We believe the experiences in the capital markets during the six-month period have underscored the value of a well-diversified, long-term investment strategy to help soften the effects of volatility in any one market or asset class. As always, we encourage investors to maintain diversified investment portfolios in pursuit of their long-term investment goals.
2
LETTER TO SHAREHOLDERS continued
Please visit us at EvergreenInvestments.com for more information about our funds and other investment products available to you. Thank you for your continued support of Evergreen Investments.
Sincerely,
 Dennis H. FerroPresident and Chief Executive OfficerEvergreen Investment Company, Inc
Special Notice to Shareholders:
Please visit our Web site at EvergreenInvestments.com for statements from President and Chief Executive Officer, Dennis Ferro, regarding the firm’s recent settlement with the Securities and Exchange Commission (SEC) and prior settlement with the Financial Industry Regulatory Authority (FINRA).
3
FUND AT A GLANCE
as of March 31, 2008
MANAGEMENT TEAM
Investment Advisor:
• Evergreen Investment Management Company, LLC
Portfolio Manager:
• Aziz Hamzaogullari, CFA
CURRENT INVESTMENT STYLE
Source: Morningstar, Inc.
Morningstar’s style box is based on a portfolio date as of 3/31/2008.
The Equity style box placement is based on 10 growth and valuation measures for each fund holding and the median size of the companies in which the fund invests.
PERFORMANCE AND RETURNS
Portfolio inception date: 9/11/1935
| | | Class A | | Class B | | Class C | | Class I |
| Class inception date | | 1/20/1998 | | 9/11/1935 | | 1/22/1998 | | 6/30/1999 |
|
| Nasdaq symbol | | EKJAX | | EKJBX | | EKJCX | | EKJYX |
|
| 6-month return with sales charge | | -18.69% | | -18.43% | | -14.89% | | N/A |
|
| 6-month return w/o sales charge | | -13.72% | | -14.14% | | -14.03% | | -13.66% |
|
| Average annual return* | | | | | | | | |
|
| 1-year with sales charge | | -5.97% | | -5.98% | | -2.02% | | N/A |
|
| 1-year w/o sales charge | | -0.22% | | -1.03% | | -1.03% | | -0.07% |
|
| 5-year | | 8.04% | | 8.27% | | 8.56% | | 9.64% |
|
| 10-year | | 1.37% | | 1.22% | | 1.21% | | 2.11% |
|
| Maximum sales charge | | 5.75% | | 5.00% | | 1.00% | | N/A |
| | | Front-end | | CDSC | | CDSC | | |
|
* Adjusted for maximum applicable sales charge, unless noted.
Past performance is no guarantee of future results. The performance quoted represents past performance and current performance may be lower or higher. The investment return and principal value of an investment will fluctuate so that investors’ shares, when redeemed, may be worth more or less than their original cost. To obtain performance information current to the most recent month-end for Classes A, B, C or I, please go to EvergreenInvestments.com/fundperformance. The performance of each class may vary based on differences in loads, fees and expenses paid by the shareholders investing in each class. Performance includes the reinvestment of income dividends and capital gain distributions. Performance shown does not reflect the deduction of taxes that a shareholder would pay on fund distributions or the redemption of fund shares.
Historical performance shown for Class I prior to its inception is based on the performance of Class B, one of the original classes offered. The historical returns for Class I reflect the 1.00% 12b-1 fee applicable to Class B. Class I does not pay a 12b-1 fee. If this fee had not been reflected, returns for Class I would have been higher. The fund incurs a 12b-1 fee of 0.25% for Class A and 1.00% for Classes B and C.
The advisor is reimbursing a portion of the 12b-1 fee for Class A. Had the fee not been reimbursed, returns for Class A would have been lower.
4
FUND AT A GLANCE continued
LONG-TERM GROWTH
Comparison of a $10,000 investment in the Evergreen Large Company Growth Fund Class A shares versus a similar investment in the Russell 1000 Growth Index (Russell 1000 Growth) and the Consumer Price Index (CPI).
The Russell 1000 Growth is an unmanaged market index and does not include transaction costs associated with buying and selling securities, any mutual fund fees or expenses or any taxes. The CPI is a commonly used measure of inflation and does not represent an investment return. It is not possible to invest directly in an index.
Class I shares are only offered, subject to the minimum initial purchase requirements, in the following manner: (1) to investment advisory clients of EIMC (or its advisory affiliates), (2) to employer- or state-sponsored benefit plans, including but not limited to, retirement plans, defined benefit plans, deferred compensation plans, or savings plans, (3) to fee-based mutual fund wrap accounts, (4) through arrangements entered into on behalf of the Evergreen funds with certain financial services firms, (5) to certain institutional investors, and (6) to persons who owned Class Y shares in registered name in an Evergreen fund on or before December 31, 1994 or who owned shares of any SouthTrust fund in registered name as of March 18, 2005 or who owned shares of Vestaur Securities Fund as of May 20, 2005.
Class I shares are only available to institutional shareholders with a minimum of $1 million investment, which may be waived in certain situations.
The fund’s investment objective may be changed without a vote of the fund’s shareholders.
Foreign investments may contain more risk due to the inherent risks associated with changing political climates, foreign market instability and foreign currency fluctuations.
All data is as of March 31, 2008, and subject to change.
5
ABOUT YOUR FUND’S EXPENSES
The Example below is intended to describe the fees and expenses borne by shareholders and the impact of those costs on your investment.
Example
As a shareholder of the fund, you incur two types of costs: (1) transaction costs, including sales charges (loads), redemption fees and exchange fees; and (2) ongoing costs, including management fees, distribution (12b-1) fees and other fund expenses. This Example is intended to help you understand your ongoing costs (in dollars) of investing in the fund and to compare these costs with the ongoing costs of investing in other mutual funds. The Example is based on an investment of $1,000 invested at the beginning of the period and held for the entire period from October 1, 2007 to March 31, 2008.
The example illustrates your fund’s costs in two ways:
• Actual expenses
The section in the table under the heading “Actual” provides information about actual account values and actual expenses. You may use the information in these columns, together with the amount you invested, to estimate the expenses that you paid over the period. Simply divide your account value by $1,000 (for example, an $8,600 account value divided by $1,000 = 8.6), then multiply the result by the number in the appropriate column for your share class, in the column entitled “Expenses Paid During Period” to estimate the expenses you paid on your account during this period.
• Hypothetical example for comparison purposes
The section in the table under the heading “Hypothetical (5% return before expenses)” provides information about hypothetical account values and hypothetical expenses based on the fund’s actual expense ratio and an assumed rate of return of 5% per year before expenses, which is not the fund’s actual return. The hypothetical account values and expenses may not be used to estimate the actual ending account balance or expenses you paid for the period. You may use this information to compare the ongoing costs of investing in the fund and other funds. To do so, compare this 5% hypothetical example with the 5% hypothetical examples that appear in the shareholder reports of the other funds.
Please note that the expenses shown in the table are meant to highlight your ongoing costs only and do not reflect any transactional costs, such as sales charges (loads), redemption fees or exchange fees. Therefore, the section in the table under the heading “Hypothetical (5% return before expenses)” is useful in comparing ongoing costs only, and will not help you determine the relative total costs of owning different funds. In addition, if these transactional costs were included, your costs would have been higher.
| | | Beginning | | Ending | | |
| | | Account | | Account | | Expenses |
| | | Value | | Value | | Paid During |
| | | 10/1/2007 | | 3/31/2008 | | Period* |
|
| Actual | | | | | | | | |
| Class A | | $ 1,000.00 | | $ | | 862.84 | | $ 4.98 |
| Class B | | $ 1,000.00 | | $ | | 858.60 | | $ 8.41 |
| Class C | | $ 1,000.00 | | $ | | 859.69 | | $ 8.42 |
| Class I | | $ 1,000.00 | | $ | | 863.44 | | $ 3.77 |
| Hypothetical | | | | | | | | |
| (5% return | | | | | | | | |
| before expenses) | | | | | | | | |
| Class A | | $ 1,000.00 | | $ | | 1,019.65 | | $ 5.40 |
| Class B | | $ 1,000.00 | | $ | | 51,015.9 | | $ 9.12 |
| Class C | | $ 1,000.00 | | $ | | 1,015.95 | | $ 9.12 |
| Class I | | $ 1,000.00 | | $ | | 1,020.95 | | $ 4.09 |
|
* For each class of the Fund, expenses are equal to the annualized expense ratio of each class (1.07% for Class A, 1.81% for Class B, 1.81% for Class C and 0.81% for Class I), multiplied by the average account value over the period, multiplied by 183 / 366 days.
6
FINANCIALHIGHLIGHTS
(For a share outstanding throughout each period)
| | | Six Months Ended | | Year Ended September 30, |
| | March 31, 2008 | |
|
| CLASS A | | (unaudited) | | 2007 | | 2006 | | 2005 | | 2004 | | 2003 |
|
| Net asset value, beginning of period | | | | $ 8.50 | | $ 6.96 | | $ 6.66 | | | | $ 5.96 | | $ 5.52 | | $ 4.68 |
|
| Income from investment operations | | | | | | | | | | | | | | | | |
| Net investment income (loss) | | | | 0.02 | | 0.011 | | 01 | | | | 0.011 | | (0.02)1 | | (0.02)1 |
Net realized and unrealized gains
or losses on investments | | | | (1.19) | | 1.53 | | 0.31 | | | | 0.69 | | 0.46 | | 0.86 |
| | | | |
| |
| |
| | | |
| |
| |
|
| Total from investment operations | | | | (1.17) | | 1.54 | | 0.31 | | | | 0.70 | | 0.44 | | 0.84 |
|
| Distributions to shareholders from | | | | | | | | | | | | | | | | |
| Net investment income | | | | 02 | | 0 | | (0.01) | | | | 0 | | 0 | | 0 |
|
| Net asset value, end of period | | | | $ 7.33 | | $ 8.50 | | $ 6.96 | | | | $ 6.66 | | $ 5.96 | | $ 5.52 |
|
| Total return3 | | | | (13.72%) | | 22.13% | | 4.65% | | | | 11.74% | | 7.97% | | 17.95% |
|
| Ratios and supplemental data | | | | | | | | | | | | | | | | |
| Net assets, end of period (thousands) | | $298,763 | | $361,051 | | $341,511 | | $370,926 | | $399,769 | | $413,448 |
| Ratios to average net assets | | | | | | | | | | | | | | | | |
| Expenses including waivers/reimbursements but | | | | | | | | | | | | | | | | |
| excluding expense reductions | | | | 1.07%4 | | 1.10% | | 1.14% | | | | 1.15% | | 1.18% | | 1.20% |
| Expenses excluding waivers/reimbursements | | | | | | | | | | | | | | | | |
| and expense reductions | | | | 1.11%4 | | 1.12% | | 1.14% | | | | 1.15% | | 1.18% | | 1.20% |
| Net investment income (loss) | | | | 0.47%4 | | 0.10% | | (0.01%) | | | | 0.18% | | (0.36%) | | (0.35%) |
| Portfolio turnover rate | | | | 17% | | 21% | | 117% | | | | 120% | | 106% | | 206% |
|
1 Net investment income (loss) per share is based on average shares outstanding during the period.
2 Amount represents less than $0.005 per share.
3 Excluding applicable sales charges
4 Annualized
See Notes to Financial Statements
7
FINANCIALHIGHLIGHTS
(For a share outstanding throughout each period)
| | | Six Months Ended | | Year Ended September 30, |
| | March 31, 2008 | |
|
| CLASS B | | (unaudited) | | 2007 | | 2006 | | 2005 | | 2004 | | 2003 |
|
| Net asset value, beginning of period | | $ 7.85 | | $ 6.47 | | $ 6.23 | | $ 5.61 | | $ 5.23 | | $ 4.47 |
|
| Income from investment operations | | | | | | | | | | | | | | | | |
| Net investment income (loss) | | | | (0.01)1 | | (0.04)1 | | (0.05)1 | | | | (0.03)1 | | (0.06)1 | | (0.05)1 |
Net realized and unrealized gains
or losses on investments | | | | (1.10) | | 1.42 | | 0.29 | | | | 0.65 | | 0.44 | | 0.81 |
| | | | |
| |
| |
| | | |
| |
| |
|
| Total from investment operations | | | | (1.11) | | 1.38 | | 0.24 | | | | 0.62 | | 0.38 | | 0.76 |
|
| Net asset value, end of period | | $ 6.74 | | $ 7.85 | | $ 6.47 | | $ 6.23 | | $ 5.61 | | $ 5.23 |
|
| Total return2 | | | | (14.14%) | | 21.33% | | 3.85% | | | | 11.05% | | 7.27% | | 17.00% |
|
| Ratios and supplemental data | | | | | | | | | | | | | | | | |
| Net assets, end of period (thousands) | | $12,626 | | $16,694 | | $17,986 | | $21,949 | | $27,068 | | $26,874 |
| Ratios to average net assets | | | | | | | | | | | | | | | | |
| Expenses including waivers/reimbursements but | | | | | | | | | | | | | | | | |
| excluding expense reductions | | | | 1.81%3 | | 1.82% | | 1.84% | | | | 1.85% | | 1.88% | | 1.92% |
| Expenses excluding waivers/reimbursements | | | | | | | | | | | | | | | | |
| and expense reductions | | | | 1.81%3 | | 1.82% | | 1.84% | | | | 1.85% | | 1.88% | | 1.92% |
| Net investment income (loss) | | | | (0.28%)3 | | (0.61%) | | (0.71%) | | | | (0.50%) | | (1.07%) | | (1.07%) |
| Portfolio turnover rate | | | | 17% | | 21% | | 117% | | | | 120% | | 106% | | 206% |
|
1 Net investment income (loss) per share is based on average shares outstanding during the period.
2 Excluding applicable sales charges
3 Annualized
See Notes to Financial Statements
8
FINANCIALHIGHLIGHTS
(For a share outstanding throughout each period)
| | | Six Months Ended | | | | Year Ended September 30, | | |
| | | March 31, 2008 | |
|
| CLASS C | | (unaudited) | | 2007 | | 2006 | | 2005 | | 2004 | | 2003 |
|
| Net asset value, beginning of period | | $ 7.84 | | $ 6.47 | | $ 6.23 | | $ 5.61 | | $ 5.24 | | $ 4.47 |
|
| Income from investment operations | | | | | | | | | | | | |
| Net investment income (loss) | | (0.01)1 | | (0.04)1 | | (0.05)1 | | (0.03)1 | | (0.06)1 | | (0.05)1 |
Net realized and unrealized gains
or losses on investments | | (1.09) | | 1.41 | | 0.29 | | 0.65 | | 0.43 | | 0.82 |
| | |
| |
| |
| |
| |
| |
|
| Total from investment operations | | (1.10) | | 1.37 | | 0.24 | | 0.62 | | 0.37 | | 0.77 |
|
| Net asset value, end of period | | $ 6.74 | | $ 7.84 | | $ 6.47 | | $ 6.23 | | $ 5.61 | | $ 5.24 |
|
| Total return2 | | (14.03%) | | 21.17% | | 3.85% | | 11.05% | | 7.06% | | 17.23% |
|
| Ratios and supplemental data | | | | | | | | | | | | |
| Net assets, end of period (thousands) | | $9,815 | | $10,058 | | $8,397 | | $8,799 | | $8,778 | | $8,059 |
| Ratios to average net assets | | | | | | | | | | | | |
| Expenses including waivers/reimbursements | | | | | | | | | | | | |
| but excluding expensereductions | | 1.81%3 | | 1.82% | | 1.84% | | 1.85% | | 1.88% | | 1.92% |
| Expenses excluding waivers/reimbursements | | | | | | | | | | | | |
| and expense reductions | | 1.81%3 | | 1.82% | | 1.84% | | 1.85% | | 1.88% | | 1.92% |
| Net investment income (loss) | | (0.26%)3 | | (0.61%) | | (0.71%) | | (0.53%) | | (1.06%) | | (1.08%) |
| Portfolio turnover rate | | 17% | | 21% | | 117% | | 120% | | 106% | | 206% |
|
1 Net investment income (loss) per share is based on average shares outstanding during the period.
2 Excluding applicable sales charges
3 Annualized
See Notes to Financial Statements
9
FINANCIALHIGHLIGHTS
(For a share outstanding throughout each period)
| | | Six Months Ended | | | | Year Ended September 30, | | |
| | | March 31, 2008 | |
|
| CLASS I | | (unaudited) | | 2007 | | 2006 | | 2005 | | 2004 | | 2003 |
|
| Net asset value, beginning of period | | $ 8.53 | | $ 6.96 | | $ 6.67 | | $ 5.94 | | $ 5.49 | | $ 4.64 |
|
| Income from investment operations | | | | | | | | | | | | |
| Net investment income (loss) | | 0.04 | | 0.031 | | 0.021 | | 0.031 | | 01 | | (0.01)1 |
Net realized and unrealized gains
or losses on investments | | (1.20) | | 1.54 | | 0.30 | | 0.70 | | 0.45 | | 0.86 |
| | |
| |
| |
| |
| |
| |
|
| Total from investment operations | | (1.16) | | 1.57 | | 0.32 | | 0.73 | | 0.45 | | 0.85 |
|
| Distributions to shareholders from | | | | | | | | | | | | |
| Net investment income | | (0.03) | | 0 | | (0.03) | | 0 | | 0 | | 0 |
|
| Net asset value, end of period | | $ 7.34 | | $ 8.53 | | $ 6.96 | | $ 6.67 | | $ 5.94 | | $ 5.49 |
|
| Total return | | (13.66%) | | 22.56% | | 4.81% | | 12.29% | | 8.20% | | 18.32% |
|
| Ratios and supplemental data | | | | | | | | | | | | |
| Net assets, end of period (thousands) | | $8,684 | | $11,197 | | $13,605 | | $14,685 | | $15,323 | | $9,793 |
| Ratios to average net assets | | | | | | | | | | | | |
| Expenses including waivers/reimbursements | | | | | | | | | | | | |
| but excluding expense reductions | | 0.81%2 | | 0.82% | | 0.84% | | 0.85% | | 0.88% | | 0.92% |
| Expenses excluding waivers/reimbursements | | | | | | | | | | | | |
| and expense reductions | | 0.81%2 | | 0.82% | | 0.84% | | 0.85% | | 0.88% | | 0.92% |
| Net investment income (loss) | | 0.71%2 | | 0.39% | | 0.29% | | 0.49% | | (0.05%) | | (0.13%) |
| Portfolio turnover rate | | 17% | | 21% | | 117% | | 120% | | 106% | | 206% |
|
1 Net investment income (loss) per share is based on average shares outstanding during the period.
2 Annualized
See Notes to Financial Statements
10
SCHEDULE OF INVESTMENTS
March 31, 2008 (unaudited)
| | | | | | | Shares | | | | Value |
|
| COMMON STOCKS 98.9% | | | | | | | | |
| CONSUMER DISCRETIONARY 15.2% | | | | | | |
| Hotels, Restaurants & Leisure 1.1% | | | | | | |
| Carnival Corp. | | | | | | 92,619 | | $ | | 3,749,217 |
| |
|
| Internet & Catalog Retail 6.0% | | | | | | |
| Amazon.com, Inc. * (p) | | | | 276,591 | | | | 19,720,939 |
| |
|
| Media 3.1% | | | | | | | | | | |
| Omnicom Group, Inc. * | | | | 229,132 | | | | 10,123,052 |
| |
|
| Multi-line Retail 1.2% | | | | | | | | |
| Target Corp. | | | | | | 79,400 | | | | 4,023,992 |
| |
|
| Specialty Retail 2.2% | | | | | | | | |
| Best Buy Co., Inc. | | | | | | 89,831 | | | | 3,724,393 |
| Home Depot, Inc. | | | | | | 127,500 | | | | 3,566,175 |
| |
|
| | | | | | | | | | | 7,290,568 |
| |
|
| Textiles, Apparel & Luxury Goods 1.6% | | | | |
| Timberland Co., Class A * | | | | 372,600 | | | | 5,115,798 |
| |
|
| CONSUMER STAPLES 10.4% | | | | | | | | |
| Beverages 4.1% | | | | | | | | | | |
| Coca-Cola Co. | | | | | | 162,466 | | | | 9,889,305 |
| Diageo plc, ADR * | | | | | | 46,940 | | | | 3,817,161 |
| |
|
| | | | | | | | | | | 13,706,466 |
| |
|
| Food & Staples Retailing 1.2% | | | | | | |
| Wal-Mart Stores, Inc. | | | | | | 72,601 | | | | 3,824,621 |
| |
|
| Household Products 5.1% | | | | | | | | |
| Clorox Co. * | | | | | | 118,000 | | | | 6,683,520 |
| Procter & Gamble Co. * | | | | 143,173 | | | | 10,032,132 |
| |
|
| | | | | | | | | | | 16,715,652 |
| |
|
| ENERGY 1.4% | | | | | | | | | | |
| Oil, Gas & Consumable Fuels 1.4% | | | | | | |
| Chevron Corp. * | | | | | | 28,700 | | | | 2,449,832 |
| ConocoPhillips * | | | | | | 29,830 | | | | 2,273,344 |
| |
|
| | | | | | | | | | | 4,723,176 |
| |
|
| FINANCIALS 10.1% | | | | | | | | |
| Capital Markets 2.8% | | | | | | | | |
| Legg Mason, Inc. * | | | | | | 164,900 | | | | 9,231,102 |
| |
|
| Consumer Finance 1.9% | | | | | | | | |
| Visa, Inc., Class A * | | | | | | 102,800 | | | | 6,410,608 |
| |
|
| Diversified Financial Services 1.7% | | | | | | |
| Citigroup, Inc. * | | | | | | 255,397 | | | | 5,470,604 |
| |
|
| Insurance 3.7% | | | | | | | | | | |
| Marsh & McLennan Cos. * | | | | 506,587 | | | | 12,335,393 |
| |
|
See Notes to Financial Statements
11
SCHEDULE OF INVESTMENTS continued
March 31, 2008 (unaudited)
| | | | | | | Shares | | | | Value |
|
| COMMON STOCKS continued | | | | | | | | |
| HEALTH CARE 23.2% | | | | | | | | | | |
| Biotechnology 6.7% | | | | | | | | | | |
| Amgen, Inc. * | | | | | | 365,420 | | $ | | 15,267,247 |
| Biogen Idec, Inc. * | | | | | | 109,555 | | | | 6,758,448 |
| |
|
| | | | | | | | | | | 22,025,695 |
| |
|
| Health Care Equipment & Supplies 7.1% | | | | | | |
| Medtronic, Inc. * | | | | | | 260,817 | | | | 12,615,718 |
| St. Jude Medical, Inc. * | | | | | | 51,680 | | | | 2,232,059 |
| Zimmer Holdings, Inc. * | | | | | | 109,619 | | | | 8,534,936 |
| |
|
| | | | | | | | | | | 23,382,713 |
| |
|
| Health Care Providers & Services 0.6% | | | | | | |
| WellPoint, Inc. * | | | | | | 49,300 | | | | 2,175,609 |
| |
|
| Pharmaceuticals 8.8% | | | | | | | | | | |
| Bristol-Myers Squibb Co. * | | | | | | 459,592 | | | | 9,789,310 |
| Novartis AG, ADR * | | | | | | 317,200 | | | | 16,250,156 |
| Pfizer, Inc. | | | | | | 145,300 | | | | 3,041,129 |
| |
|
| | | | | | | | | | | 29,080,595 |
| |
|
| INDUSTRIALS 6.8% | | | | | | | | | | |
| Air Freight & Logistics 1.7% | | | | | | | | | | |
| Expeditors International of Washington, Inc. * | | 44,500 | | | | 2,010,510 |
| United Parcel Service, Inc., Class B * | | | | 48,900 | | | | 3,570,678 |
| |
|
| | | | | | | | | | | 5,581,188 |
| |
|
| Commercial Services & Supplies 2.3% | | | | | | |
| Cintas Corp. | | | | | | 266,000 | | | | 7,591,640 |
| |
|
| Industrial Conglomerates 2.8% | | | | | | | | |
| General Electric Co. * | | | | | | 134,387 | | | | 4,973,663 |
| Tyco International, Ltd. | | | | | | 99,579 | | | | 4,386,455 |
| |
|
| | | | | | | | | | | 9,360,118 |
| |
|
| INFORMATION TECHNOLOGY 31.8% | | | | | | |
| Communications Equipment 7.5% | | | | | | |
| Cisco Systems, Inc. * | | | | | | 482,000 | | | | 11,611,380 |
| QUALCOMM, Inc. * | | | | | | 316,158 | | | | 12,962,478 |
| |
|
| | | | | | | | | | | 24,573,858 |
| |
|
| Computers & Peripherals 2.3% | | | | | | | | |
| Dell, Inc. * | | | | | | 386,136 | | | | 7,691,829 |
| |
|
| Internet Software & Services 2.0% | | | | | | |
| Google, Inc., Class A * | | | | | | 15,180 | | | | 6,686,335 |
| |
|
| IT Services 2.2% | | | | | | | | | | |
| Automatic Data Processing, Inc. * | | | | | | 170,593 | | | | 7,231,437 |
| |
|
See Notes to Financial Statements
12
SCHEDULE OF INVESTMENTS continued
March 31, 2008 (unaudited)
| | | | | | | Shares | | | | Value |
|
| |
| COMMON STOCKS continued | | | | | | | | |
| INFORMATION TECHNOLOGY continued | | | | | | | | |
| Semiconductors & Semiconductor Equipment 8.2% | | | | | | | | |
| Altera Corp. * | | | | | | 716,314 | | $ | | 13,201,667 |
| Intel Corp. * | | | | | | 513,670 | | | | 10,879,531 |
| Texas Instruments, Inc. * | | | | | | 103,291 | | | | 2,920,036 |
| |
|
| | | | | | | | | | | 27,001,234 |
| |
|
| Software 9.6% | | | | | | | | | | |
| FactSet Research Systems, Inc. * (p) | | | | | | 113,900 | | | | 6,135,793 |
| Microsoft Corp. * | | | | | | 417,399 | | | | 11,845,784 |
| Oracle Corp. * | | | | | | 689,528 | | | | 13,487,168 |
| |
|
| | | | | | | | | | | 31,468,745 |
| |
|
| Total Common Stocks (cost $320,823,144) | | | | | | | | 326,292,184 |
| | |
|
|
| | | | | | | Principal | | | | |
| | | | | | | Amount | | | | Value |
|
| |
| SHORT-TERM INVESTMENTS 7.5% | | | | | | | | |
| REPURCHASE AGREEMENTS ^ 3.7% | | | | | | | | |
| Banc of America Securities, LLC, 3.07%, dated 03/31/2008, maturing 04/01/2008, | | | | | | | | |
| maturity value $788,067 (pp)(1) | | $ | | 788,000 | | | | 788,000 |
| BNP Paribas Securities, 3.10%, dated 03/31/2008, maturing 04/01/2008, maturity | | | | | | | | |
| value $2,427,209 (pp)(2) | | | | | | 2,427,000 | | | | 2,427,000 |
| Credit Suisse First Boston Corp., 3.15%, dated 03/31/2008, maturing | | | | | | | | |
| 04/01/2008, maturity value $1,655,145 (pp)(3) | | | | 1,655,000 | | | | 1,655,000 |
| Deutsche Bank Securities, Inc., 3.10% dated 03/31/2008, maturing 04/01/2008, | | | | | | | | |
| maturity value $3,306,285 (pp)(4) | | | | 3,306,000 | | | | 3,306,000 |
| Dresdner Kleinwort Wasserstein Securities, LLC, 3.10%, dated 03/31/2008, | | | | | | | | |
| maturing 04/01/2008, maturity value $3,000,258 (pp)(5) | | | | 3,000,000 | | | | 3,000,000 |
| Merrill Lynch Pierce Fenner & Smith, Inc., 3.10%, dated 03/31/2008, maturing | | | | | | | | |
| 04/01/2008, maturity value $1,000,086 (pp)(6) | | | | 1,000,000 | | | | 1,000,000 |
| |
|
| | | | | | | | | | | 12,176,000 |
| | |
|
|
| | | | | | | Shares | | | | Value |
|
| |
| MUTUAL FUND SHARES 3.8% | | | | | | | | |
| BGI Prime Money Market Fund, Premium Class, 3.15% q (pp) | | | | 1,550,000 | | | | 1,550,000 |
| BlackRock Liquidity TempFund, Institutional Class, 3.25% q (pp) | | | | 1,537,000 | | | | 1,537,000 |
| Evergreen Institutional Money Market Fund, Class I, 3.27% q ø (pp) | | | | 4,003,551 | | | | 4,003,551 |
| Evergreen Institutional U.S. Government Money Market Fund, Class I, 2.24% q ø | | | | 2,495,505 | | | | 2,495,505 |
| Morgan Stanley Institutional Liquidity Fund, Money Market Portfolio, Institutional | | | | | | | | |
| Class, 3.31% q (pp) | | | | | | 3,000,000 | | | | 3,000,000 |
| |
|
| | | | | | | | | | | 12,586,056 |
| |
|
| Total Short-Term Investments (cost $24,762,056) | | | | | | | | 24,762,056 |
| |
|
| Total Investments (cost $345,585,200) 106.4% | | | | | | | | 351,054,240 |
| Other Assets and Liabilities (6.4%) | | | | | | | | (21,165,660) |
| |
|
| Net Assets 100.0% | | | | | | | | $ | | 329,888,580 |
| |
|
See Notes to Financial Statements
13
SCHEDULE OF INVESTMENTS continued
March 31, 2008 (unaudited)
| * | | Non-income producing security |
| (p) | | All or a portion of this security is on loan. |
| (pp) | | All or a portion of this security represents investment of cash collateral received from securities on loan. |
| q | | Rate shown is the 7-day annualized yield at period end. |
| ø | | Evergreen Investment Management Company, LLC is the investment advisor to both the Fund and the money market |
| | | fund. |
| ^ | | Collateral is pooled with the collateral of other Evergreen funds and allocated on a pro rata basis consisting of: |
| | | (1) | | investment grade corporate bonds, 2.88% to 8.60%, 10/15/2008 to 06/01/2065, value including accrued interest |
| | | | | is $803,760. |
| | | (2) | | investment grade corporate bonds, 5.30% to 8.25%, 10/28/2015 to 06/01/2032, value including accrued interest |
| | | | | is $2,475,540. |
| | | (3) | | investment grade corporate bonds, 7.375% to 8.00%, 06/15/2010 to 03/15/2038, value including accrued interest |
| | | | | is $1,688,101. |
| | | (4) | | high grade CMOs, 2.84% to 6.15%, 09/15/2021 to 02/15/2051, value including accrued interest is $2,831,831; |
| | | | | investment grade CMO, 4.04%, 04/25/2034, value including accrued interest is $540,289. |
| | | (5) | | investment grade corporate bonds, 5.70% to 8.75%, 02/15/2017 to 03/01/2031, value including accrued interest |
| | | | | is $167,340; high grade asset-backed securities 2.97% to 3.41%, 05/25/2035 to 08/25/2046, value including |
| | | | | accrued interest is $1,819,320; high grade CMOs, 3.21% to 5.22%, 07/15/2035 to 08/25/2046, value including |
| | | | | accrued interest is $1,073,468. |
| | | (6) | | investment grade corporate bonds, 0.00% to 7.15%, 08/15/2013 to 06/01/2037, value including accrued interest |
| | | | | is $1,020,003. |
| |
| Summary of Abbreviations |
| ADR | | American Depository Receipt |
| CMO | | Collateralized Mortgage Obligation |
| |
| The following table shows the percent of total long-term investments by sector as of March 31, 2008: |
| Information Technology | | 32.1% |
| Health Care | | 23.5% |
| Consumer Discretionary | | 15.3% |
| Consumer Staples | | 10.5% |
| Financials | | 10.2% |
| Industrials | | 6.9% |
| Energy | | 1.5% |
| |
|
| | | 100.0% |
| | |
|
See Notes to Financial Statements
14
STATEMENT OF ASSETS AND LIABILITIES
March 31, 2008 (unaudited)
| Assets | | | | |
| Investments in securities, at value (cost $339,086,144) including $22,065,497 of | | | | |
| securities loaned | | $ | | 344,555,184 |
| Investments in affiliated money market funds, at value (cost $6,499,056) | | | | 6,499,056 |
|
| Total investments | | | | 351,054,240 |
| Foreign currency, at value (cost $15) | | | | 16 |
| Receivable for Fund shares sold | | | | 569,994 |
| Dividends receivable | | | | 744,705 |
| Receivable for securities lending income | | | | 3,543 |
| Receivable from investment advisor | | | | 5,005 |
| Prepaid expenses and other assets | | | | 77,963 |
|
| Total assets | | | | 352,455,466 |
|
| Liabilities | | | | |
| Payable for Fund shares redeemed | | | | 224,751 |
| Payable for securities on loan | | | | 22,266,551 |
| Due to related parties | | | | 1,728 |
| Trustees’ fees and expenses payable | | | | 36,233 |
| Printing and postage expenses payable | | | | 20,478 |
| Accrued expenses and other liabilities | | | | 17,145 |
|
| Total liabilities | | | | 22,566,886 |
|
| Net assets | | $ | | 329,888,580 |
|
| Net assets represented by | | | | |
| Paid-in capital | | $ | | 378,022,019 |
| Undistributed net investment income | | | | 744,336 |
| Accumulated net realized losses on investments | | | | (54,346,816) |
| Net unrealized gains on investments | | | | 5,469,041 |
|
| Total net assets | | $ | | 329,888,580 |
|
| Net assets consists of | | | | |
| Class A | | $ | | 298,762,747 |
| Class B | | | | 12,626,177 |
| Class C | | | | 9,815,347 |
| Class I | | | | 8,684,309 |
|
| Total net assets | | $ | | 329,888,580 |
|
| Shares outstanding (unlimited number of shares authorized) | | | | |
| Class A | | | | 40,750,889 |
| Class B | | | | 1,872,319 |
| Class C | | | | 1,455,635 |
| Class I | | | | 1,182,523 |
|
| Net asset value per share | | | | |
| Class A | | $ | | 7.33 |
| Class A — Offering price (based on sales charge of 5.75%) | | $ | | 7.78 |
| Class B | | $ | | 6.74 |
| Class C | | $ | | 6.74 |
| Class I | | $ | | 7.34 |
|
See Notes to Financial Statements
15
STATEMENT OF OPERATIONS
Six Months Ended March 31, 2008 (unaudited)
| Investment income | | | | |
| Dividends (net of foreign withholding taxes of $70,764) | | $ | | 2,753,438 |
| Income from affiliate | | | | 50,535 |
| Securities lending | | | | 16,377 |
|
| Total investment income | | | | 2,820,350 |
|
| Expenses | | | | |
| Advisory fee | | | | 935,771 |
| Distribution Plan expenses | | | | |
| Class A | | | | 496,812 |
| Class B | | | | 74,224 |
| Class C | | | | 53,953 |
| Administrative services fee | | | | 183,033 |
| Transfer agent fees | | | | 248,169 |
| Trustees’ fees and expenses | | | | 3,508 |
| Printing and postage expenses | | | | 23,700 |
| Custodian and accounting fees | | | | 47,802 |
| Registration and filing fees | | | | 26,874 |
| Professional fees | | | | 15,930 |
| Other | | | | 5,739 |
|
| Total expenses | | | | 2,115,515 |
| Less: Expense reductions | | | | (3,064) |
| Expense reimbursements | | | | (73,860) |
|
| Net expenses | | | | 2,038,591 |
|
| Net investment income | | | | 781,759 |
|
| Net realized and unrealized gains or losses on investments | | | | |
| Net realized gains on investments | | | | 17,224,900 |
| Net change in unrealized gains or losses on investments | | | | (71,949,214) |
|
| Net realized and unrealized gains or losses on investments | | | | (54,724,314) |
|
| Net decrease in net assets resulting from operations | | $ | | (53,942,555) |
|
See Notes to Financial Statements
16
STATEMENTS OF CHANGES IN NET ASSETS
| | | Six Months Ended | | | | |
| | | March 31, 2008 | | Year Ended |
| | | (unaudited) | | September 30, 2007 |
|
| Operations | | | | | | | | |
| Net investment income | | $ | | 781,759 | | $ | | 244,184 |
| Net realized gains on investments | | | | 17,224,900 | | | | 19,111,834 |
| Net change in unrealized gains or losses | | | | | | | | |
| on investments | | | | (71,949,214) | | | | 58,291,091 |
|
| Net increase (decrease) in net assets | | | | | | | | |
| resulting from operations | | | | (53,942,555) | | | | 77,647,109 |
|
| Distributions to shareholders from | | | | | | | | |
| Net investment income | | | | | | | | |
| Class A | | | | (196,570) | | | | 0 |
| Class I | | | | (37,174) | | | | 0 |
|
| Total distributions to shareholders | | | | (233,744) | | | | 0 |
|
| | | Shares | | | | Shares | | |
| Capital share transactions | | | | | | | | |
| Proceeds from shares sold | | | | | | | | |
| Class A | | 488,556 | | 3,950,458 | | 658,088 | | 5,052,812 |
| Class B | | 116,067 | | 861,423 | | 277,355 | | 1,964,204 |
| Class C | | 327,626 | | 2,514,408 | | 204,197 | | 1,497,628 |
| Class I | | 220,575 | | 1,675,884 | | 10,798 | | 81,000 |
|
| | | | | 9,002,173 | | | | 8,595,644 |
|
| Net asset value of shares issued in | | | | | | | | |
| reinvestment of distributions | | | | | | | | |
| Class A | | 20,184 | | 168,534 | | 0 | | 0 |
| Class I | | 410 | | 3,431 | | 0 | | 0 |
|
| | | | | 171,965 | | | | 0 |
|
| Automatic conversion of Class B shares | | | | | | | | |
| to Class A shares | | | | | | | | |
| Class A | | 150,776 | | 1,191,239 | | 243,581 | | 1,875,682 |
| Class B | | (163,645) | | (1,191,239) | | (263,049) | | (1,875,682) |
|
| | | | | 0 | | | | 0 |
|
| Payment for shares redeemed | | | | | | | | |
| Class A | | (2,376,255) | | (18,884,317) | | (7,513,393) | | (57,431,898) |
| Class B | | (208,047) | | (1,501,717) | | (667,586) | | (4,726,568) |
| Class C | | (154,163) | | (1,083,886) | | (220,615) | | (1,573,080) |
| Class I | | (351,133) | | (2,639,658) | | (652,282) | | (5,011,033) |
|
| | | | | (24,109,578) | | | | (68,742,579) |
|
| Net decrease in net assets resulting from | | | | | | | | |
| capital share transactions | | | | (14,935,440) | | | | (60,146,935) |
|
| Total increase (decrease) in net assets | | | | (69,111,739) | | | | 17,500,174 |
| Net assets | | | | | | | | |
| Beginning of period | | | | 399,000,319 | | | | 381,500,145 |
|
| End of period | | $ | | 329,888,580 | | $ | | 399,000,319 |
|
| Undistributed net investment income | | $ | | 744,336 | | $ | | 196,321 |
|
See Notes to Financial Statements
17
NOTES TO FINANCIAL STATEMENTS (unaudited)
1. ORGANIZATION
Evergreen Large Company Growth Fund (the “Fund”) is a diversified series of Evergreen Equity Trust (the “Trust”), a Delaware statutory trust organized on September 18, 1997. The Trust is an open-end management investment company registered under the Investment Company Act of 1940, as amended (the “1940 Act”).
The Fund offers Class A, Class B, Class C and Class I shares. Class A shares are sold with a front-end sales charge. However, Class A share investments of $1 million or more are not subject to a front-end sales charge but are subject to a contingent deferred sales charge of 1.00% upon redemption within 18 months. Class B shares are sold without a front-end sales charge but are subject to a contingent deferred sales charge that is payable upon redemption and decreases depending on how long the shares have been held. Class C shares are sold without a front-end sales charge but are subject to a contingent deferred sales charge that is payable upon redemption within one year. Class I shares are sold without a front-end sales charge or contingent deferred sales charge. Each class of shares, except Class I shares, pays an ongoing distribution fee.
2. SIGNIFICANT ACCOUNTING POLICIES
The following is a summary of significant accounting policies consistently followed by the Fund in the preparation of its financial statements. The policies are in conformity with generally accepted accounting principles in the United States of America, which require management to make estimates and assumptions that affect amounts reported herein. Actual results could differ from these estimates.
a. Valuation of investments
Listed equity securities are usually valued at the last sales price or official closing price on the national securities exchange where the securities are principally traded.
Foreign securities traded on an established exchange are valued at the last sales price on the exchange where the security is primarily traded. If there has been no sale, the securities are valued at the mean between bid and asked prices. Foreign securities may be valued at fair value according to procedures approved by the Board of Trustees if the closing price is not reflective of current market values due to trading or events occurring in the foreign markets between the close of the established exchange and the valuation time of the Fund. In addition, substantial changes in values in the U.S. markets subsequent to the close of a foreign market may also affect the values of securities traded in the foreign market. The value of foreign securities may be adjusted if such movements in the U.S. market exceed a specified threshold.
Short-term securities with remaining maturities of 60 days or less at the time of purchase are valued at amortized cost, which approximates market value.
Investments in open-end mutual funds are valued at net asset value. Securities for which market quotations are not readily available or not reflective of current market value are valued at fair value as determined by the investment advisor in good faith, according to procedures approved by the Board of Trustees.
18
NOTES TO FINANCIAL STATEMENTS (unaudited) continued
b. Repurchase agreements
Securities pledged as collateral for repurchase agreements are held by the custodian bank or in a segregated account in the Fund’s name until the agreements mature. Collateral for certain tri-party repurchase agreements is held at the counterparty’s custodian in a segregated account for the benefit of the Fund and the counterparty. Each agreement requires that the market value of the collateral be sufficient to cover payments of interest and principal. However, in the event of default or bankruptcy by the other party to the agreement, retention of the collateral may be subject to legal proceedings. The Fund will enter into repurchase agreements with banks and other financial institutions, which are deemed by the investment advisor to be creditworthy pursuant to guidelines established by the Board of Trustees. In certain instances, the Fund’s securities lending agent may provide collateral in the form of repurchase agreements.
c. Foreign currency translation
All assets and liabilities denominated in foreign currencies are translated into U.S. dollar amounts at the date of valuation. Purchases and sales of portfolio securities and income items denominated in foreign currencies are translated into U.S. dollar amounts on the respective dates of such transactions. The Fund does not separately account for that portion of the results of operations resulting from changes in foreign exchange rates on investments and the fluctuations arising from changes in market prices of securities held. Such fluctuations are included with the net realized and unrealized gains or losses on investments.
d. Securities lending
The Fund may lend its securities to certain qualified brokers in order to earn additional income. The Fund receives compensation in the form of fees or interest earned on the investment of any cash collateral received. The Fund also continues to receive interest and dividends on the securities loaned. The Fund receives collateral in the form of cash or securities with a market value at least equal to the market value of the securities on loan. In the event of default or bankruptcy by the borrower, the Fund could experience delays and costs in recovering the loaned securities or in gaining access to the collateral. The Fund has the right under the lending agreement to recover the securities from the borrower on demand.
e. Security transactions and investment income
Security transactions are recorded on trade date. Realized gains and losses are computed using the specific cost of the security sold. Dividend income is recorded on the ex-dividend date or in the case of some foreign securities, on the date when the Fund is made aware of the dividend. Foreign income and capital gains realized on some securities may be subject to foreign taxes, which are accrued as applicable.
f. Federal and other taxes
The Fund intends to continue to qualify as a regulated investment company and distribute all of its taxable income, including any net capital gains (which have already been offset by available capital loss carryovers). Accordingly, no provision for federal taxes is required. The Fund has adopted the provisions of FASB Interpretation No. 48, Accounting for Uncertainty in Income Taxes (“FIN 48”) which prescribes a minimum threshold for financial statement recognition of the
19
NOTES TO FINANCIAL STATEMENTS (unaudited) continued
benefit of a tax position taken or expected to be taken in a tax return. The Fund’s financial statements have not been impacted by the adoption of FIN 48.
g. Distributions
Distributions to shareholders from net investment income and net realized gains, if any, are recorded on the ex-dividend date. Such distributions are determined in conformity with income tax regulations, which may differ from generally accepted accounting principles.
h. Class allocations
Income, common expenses and realized and unrealized gains and losses are allocated to the classes based on the relative net assets of each class. Distribution fees, if any, are calculated daily at the class level based on the appropriate net assets of each class and the specific expense rates applicable to each class.
3. ADVISORY FEE AND OTHER TRANSACTIONS WITH AFFILIATES
Evergreen Investment Management Company, LLC (“EIMC”), an indirect, wholly-owned subsidiary of Wachovia Corporation (“Wachovia”), is the investment advisor to the Fund and is paid an annual fee starting at 0.51% and declining to 0.26% as average daily net assets increase. For the six months ended March 31, 2008, the advisory fee was equivalent to 0.51% of the Fund’s average daily net assets (on an annualized basis).
From time to time, EIMC may voluntarily or contractually waive its fee and/or reimburse expenses in order to limit operating expenses. During the six months ended March 31, 2008, EIMC voluntarily reimbursed Distribution Plan expenses (see Note 4) relating to Class A shares in the amount of $73,860.
The Fund may invest in money market funds which are advised by EIMC. Income earned on these investments is included in income from affiliates on the Statement of Operations.
Effective January 1, 2008, EIMC replaced Evergreen Investment Services, Inc. (“EIS”), an indirect, wholly-owned subsidiary of Wachovia, as the administrator to the Fund upon the assignment of the Fund’s Administrative Services Agreement from EIS to EIMC. There were no changes to the services being provided or fees being paid by the Fund. The administrator provides the Fund with facilities, equipment and personnel and is paid an annual rate determined by applying percentage rates to the aggregate average daily net assets of the Evergreen funds (excluding money market funds and Evergreen Institutional Enhanced Income Fund), starting at 0.10% and declining to 0.05% as the aggregate average daily net assets of the Evergreen funds (excluding money market funds and Evergreen Institutional Enhanced Income Fund) increase.
Evergreen Service Company, LLC (“ESC”), an indirect, wholly-owned subsidiary of Wachovia, is the transfer and dividend disbursing agent for the Fund. ESC receives account fees that vary based on the type of account held by the shareholders in the Fund. For the six months ended March 31, 2008, the transfer agent fees were equivalent to an annual rate of 0.14% of the Fund’s average daily net assets.
20
NOTES TO FINANCIAL STATEMENTS (unaudited) continued
Wachovia Bank NA, through its securities lending division of Wachovia Global Securities Lending, acts as the securities lending agent for the Fund.
The Fund has placed a portion of its portfolio transactions with brokerage firms that are affiliates of Wachovia. During the six months ended March 31, 2008, the Fund paid brokerage commissions of $12,250 to Wachovia Securities, LLC.
4. DISTRIBUTION PLANS
EIS serves as distributor of the Fund’s shares. The Fund has adopted Distribution Plans, as allowed by Rule 12b-1 of the 1940 Act, for each class of shares, except Class I. Under the Distribution Plans, distribution fees were paid at an annual rate of 0.30% of the average daily net assets for Class A shares and 1.00% of the average daily net assets for each of Class B and Class C shares.
For the six months ended March 31, 2008, EIS received $4,140 from the sale of Class A shares and $25, $10,925 and $743 in contingent deferred sales charges from redemptions of Class A, Class B and Class C shares, respectively.
5. INVESTMENT TRANSACTIONS
Cost of purchases and proceeds from sales of investment securities (excluding short-term securities) were $61,838,632 and $76,562,509, respectively, for the six months ended March 31, 2008.
During the six months ended March 31, 2008, the Fund loaned securities to certain brokers and earned $251 in affiliated income relating to securities lending activity which is included in income from affiliate on the Statement of Operations. At March 31, 2008, the value of securities on loan and the total value of collateral received for securities loaned amounted to $22,065,497 and $22,266,551, respectively.
On March 31, 2008, the aggregate cost of securities for federal income tax purposes was $345,598,430. The gross unrealized appreciation and depreciation on securities based on tax cost was $42,175,713 and $36,719,903, respectively, with a net unrealized appreciation of $5,455,810.
As of September 30, 2007, the Fund had $71,561,319 in capital loss carryovers for federal income tax purposes with $33,685,092 expiring in 2010 and $37,876,227 expiring in 2011.
6. INTERFUND LENDING
Pursuant to an Exemptive Order issued by the SEC, the Fund may participate in an interfund lending program with certain funds in the Evergreen fund family. This program allows the Fund to borrow from, or lend money to, other participating funds. During the six months ended March 31, 2008, the Fund did not participate in the interfund lending program.
21
NOTES TO FINANCIAL STATEMENTS (unaudited) continued
7. EXPENSE REDUCTIONS
Through expense offset arrangements with ESC and the Fund’s custodian, a portion of fund expenses has been reduced.
8. DEFERRED TRUSTEES’ FEES
Each Trustee of the Fund may defer any or all compensation related to performance of his or her duties as a Trustee. The Trustees’ deferred balances are allocated to deferral accounts, which are included in the accrued expenses for the Fund. The investment performance of the deferral accounts is based on the investment performance of certain Evergreen funds. Any gains earned or losses incurred in the deferral accounts are reported in the Fund’s Trustees’ fees and expenses. At the election of the Trustees, the deferral account will be paid either in one lump sum or in quarterly installments for up to ten years.
9. FINANCING AGREEMENT
The Fund and certain other Evergreen funds share in an unsecured revolving credit commitment for temporary and emergency purposes, including the funding of redemptions, as permitted by each participating fund’s borrowing restrictions. Borrowings under this facility bear interest at 0.50% per annum above the Federal Funds rate. All of the participating funds are charged an annual commitment fee on the unused balance, which is allocated pro rata. The credit facility is for $100 million with an annual commitment fee of 0.08% . During the six months ended March 31, 2008, the Fund had no borrowings.
10. REGULATORY MATTERS AND LEGAL PROCEEDINGS
Pursuant to an administrative order issued by the SEC on September 19, 2007, EIMC, EIS, ESC (collectively, the “Evergreen Entities”), Wachovia Securities, LLC and the SEC have entered into an agreement settling allegations of (i) improper short-term trading arrangements in effect prior to May 2003 involving former officers and employees of EIMC and certain broker-dealers, (ii) insufficient systems for monitoring exchanges and enforcing exchange limitations as stated in certain funds’ prospectuses, and (iii) inadequate e-mail retention practices. Under the settlement, the Evergreen Entities were censured and have paid approximately $32 million in disgorgement and penalties. This amount, along with a fine assessed by the SEC against Wachovia Securities, LLC will be distributed pursuant to a plan to be developed by an independent distribution consultant and approved by the SEC. The Evergreen Entities neither admitted nor denied the allegations and findings set forth in its settlement with the SEC.
In addition, the Evergreen funds and EIMC and certain of its affiliates are involved in various legal actions, including private litigation and class action lawsuits. EIMC does not expect that any of such legal actions currently pending or threatened will have a material adverse impact on the financial position or operations of any of the Evergreen funds or on EIMC’s ability to provide services to the Evergreen funds.
22
NOTES TO FINANCIAL STATEMENTS (unaudited) continued
Although EIMC believes that none of the matters discussed above will have a material adverse impact on the Evergreen funds, there can be no assurance that these matters and any publicity surrounding or resulting from them will not result in reduced sales or increased redemptions of Evergreen fund shares, which could increase Evergreen fund transaction costs or operating expenses, or that they will not have other adverse consequences on the Evergreen funds.
11. NEW ACCOUNTING PRONOUNCEMENTS
In September 2006, FASB issued Statement of Financial Accounting Standards No. 157, Fair Value Measurements (“FAS 157”). FAS 157 establishes a single authoritative definition of fair value, establishes a framework for measuring fair value and expands disclosures about fair value measurements. FAS 157 applies to fair value measurements already required or permitted by existing standards. The change to current generally accepted accounting principles from the application of FAS 157 relates to the definition of fair value, the methods used to measure fair value, and the expanded disclosures about fair value measurements. Management of the Fund does not believe the adoption of FAS 157 will materially impact the financial statement amounts, however, additional disclosures may be required about the inputs used to develop the measurements and the effect of certain of the measurements on changes in net assets for the period. FAS 157 is effective for financial statements issued for fiscal years beginning after November 15, 2007 and interim periods within those fiscal years.
In March 2008, FASB issued Statement of Financial Accounting Standards No. 161, Disclosures about Derivative Instruments and Hedging Activities (“FAS 161”), an amendment of FASB Statement No. 133. FAS 161 requires enhanced disclosures about (a) how and why a fund uses derivative instruments, (b) how derivative instruments and hedging activities are accounted for, and (c) how derivative instruments and related hedging activities affect a fund’s financial position, financial performance, and cash flows. Management of the Fund does not believe the adoption of FAS 161 will materially impact the financial statement amounts, but will require additional disclosures. This will include qualitative and quantitative disclosures on derivative positions existing at period end and the effect of using derivatives during the reporting period. FAS 161 is effective for financial statements issued for fiscal years and interim periods beginning after November 15, 2008.
23
TRUSTEES AND OFFICERS
TRUSTEES1
| Charles A. Austin III | | Investment Counselor, Anchor Capital Advisors, LLC. (investment advice); Director, The Andover |
| Trustee | | Companies (insurance); Trustee, Arthritis Foundation of New England; Former Director, The |
| DOB: 10/23/1934 | | Francis Ouimet Society (scholarship program); Former Director, Executive Vice President and |
| Term of office since: 1991 | | Treasurer, State Street Research & Management Company (investment advice) |
| Other directorships: None | | |
|
| K. Dun Gifford | | Chairman and President, Oldways Preservation and Exchange Trust (education); Trustee, |
| Trustee | | Chairman of the Finance Committee, Member of the Executive Committee, and Former |
| DOB: 10/23/1938 | | Treasurer, Cambridge College |
| Term of office since: 1974 | | |
| Other directorships: None | | |
|
| Dr. Leroy Keith, Jr. | | Managing Director, Almanac Capital Management (commodities firm); Trustee, Phoenix |
| Trustee | | Fund Complex; Director, Diversapack Co. (packaging company); Former Partner, Stonington |
| DOB: 2/14/1939 | | Partners, Inc. (private equity fund); Former Director, Obagi Medical Products Co.; Former |
| Term of office since: 1983 | | Director, Lincoln Educational Services |
| Other directorships: Trustee, | | |
| Phoenix Fund Complex (consisting | | |
| of 53 portfolios as of 12/31/2007) | | |
|
| Carol A. Kosel1 | | Former Consultant to the Evergreen Boards of Trustees; Former Vice President and Senior Vice |
| Trustee | | President, Evergreen Investments, Inc.; Former Treasurer, Evergreen Funds; Former Treasurer, |
| DOB: 12/25/1963 | | Vestaur Securities Fund |
| Term of office since: 2008 | | |
| Other directorships: None | | |
|
| Gerald M. McDonnell | | Former Manager of Commercial Operations, CMC Steel (steel producer) |
| Trustee | | |
| DOB: 7/14/1939 | | |
| Term of office since: 1988 | | |
| Other directorships: None | | |
|
| Patricia B. Norris | | President and Director of Buckleys of Kezar Lake, Inc. (real estate company); Former President |
| Trustee | | and Director of Phillips Pond Homes Association (home community); Former Partner, |
| DOB: 4/9/1948 | | PricewaterhouseCoopers, LLP (independent registered public accounting firm) |
| Term of office since: 2006 | | |
| Other directorships: None | | |
|
| William Walt Pettit | | Partner and Vice President, Kellam & Pettit, P.A. (law firm); Director, Superior Packaging Corp. |
| Trustee | | (packaging company); Member, Superior Land, LLC (real estate holding company), Member, |
| DOB: 8/26/1955 | | K&P Development, LLC (real estate development); Former Director, National Kidney Foundation |
| Term of office since: 1988 | | of North Carolina, Inc. (non-profit organization) |
| Other directorships: None | | |
|
| David M. Richardson | | President, Richardson, Runden LLC (executive recruitment advisory services); Director, J&M |
| Trustee | | Cumming Paper Co. (paper merchandising); Trustee, NDI Technologies, LLP (communications); |
| DOB: 9/19/1941 | | Former Consultant, AESC (The Association of Executive Search Consultants) |
| Term of office since: 1982 | | |
| Other directorships: None | | |
|
| Dr. Russell A. Salton III | | President/CEO, AccessOne MedCard, Inc. |
| Trustee | | |
| DOB: 6/2/1947 | | |
| Term of office since: 1984 | | |
| Other directorships: None | | |
|
24
TRUSTEES AND OFFICERS continued
| Michael S. Scofield | | Retired Attorney, Law Offices of Michael S. Scofield; Former Director and Chairman, Branded |
| Trustee | | Media Corporation (multi-media branding company) |
| DOB: 2/20/1943 | | |
| Term of office since: 1984 | | |
| Other directorships: None | | |
|
| Richard J. Shima | | Independent Consultant; Director, Hartford Hospital; Trustee, Greater Hartford YMCA; Former |
| Trustee | | Director, Trust Company of CT; Former Director, Old State House Association; Former Trustee, |
| DOB: 8/11/1939 | | Saint Joseph College (CT) |
| Term of office since: 1993 | | |
| Other directorships: None | | |
|
| Richard K. Wagoner, CFA2 | | Member and Former President, North Carolina Securities Traders Association; Member, Financial |
| Trustee | | Analysts Society |
| DOB: 12/12/1937 | | |
| Term of office since: 1999 | | |
| Other directorships: None | | |
|
| |
| OFFICERS | | |
| |
| Dennis H. Ferro3 | | Principal occupations: President and Chief Executive Officer, Evergreen Investment Company, |
| President | | Inc. and Executive Vice President, Wachovia Bank, N.A.; former Chief Investment Officer, |
| DOB: 6/20/1945 | | Evergreen Investment Company, Inc. |
| Term of office since: 2003 | | |
|
| Jeremy DePalma4 | | Principal occupations: Senior Vice President, Evergreen Investment Management Company, LLC; |
| Treasurer | | Former Vice President, Evergreen Investment Services, Inc.; Former Assistant Vice President, |
| DOB: 2/5/1974 | | Evergreen Investment Services, Inc. |
| Term of office since: 2005 | | |
|
| Michael H. Koonce4 | | Principal occupations: Senior Vice President and General Counsel, Evergreen Investment |
| Secretary | | Services, Inc.; Secretary, Senior Vice President and General Counsel, Evergreen Investment |
| DOB: 4/20/1960 | | Management Company, LLC and Evergreen Service Company, LLC; Senior Vice President and |
| Term of office since: 2000 | | Assistant General Counsel, Wachovia Corporation |
|
| Robert Guerin4 | | Principal occupations: Chief Compliance Officer, Evergreen Funds and Senior Vice President of |
| Chief Compliance Officer | | Evergreen Investments Co, Inc; Former Managing Director and Senior Compliance Officer, |
| DOB: 9/20/1965 | | Babson Capital Management LLC; Former Principal and Director, Compliance and Risk |
| Term of office since: 2007 | | Management, State Street Global Advisors; Former Vice President and Manager, Sales Practice |
| | | Compliance, Deutsche Asset Management. |
|
| 1 | | Each Trustee, except Mses. Kosel and Norris, serves until a successor is duly elected or qualified or until his or her death, resignation, |
| | | retirement or removal from office. As new Trustees, Ms. Kosel’s and Ms. Norris’ initial terms end December 31, 2010 and June 30, |
| | | 2009, respectively, at which times they may be re-elected by Trustees to serve until a successor is duly elected or qualified or until her |
| | | death, resignation, retirement or removal from office by the Trustees. Each Trustee, except Ms. Kosel, oversaw 93 Evergreen funds as of |
| | | December 31, 2007. Ms. Kosel became a Trustee on January 1, 2008. Correspondence for each Trustee may be sent to Evergreen |
| | | Board of Trustees, P.O. Box 20083, Charlotte, NC 28202. |
| 2 | | Mr. Wagoner is an “interested person” of the Fund because of his ownership of shares in Wachovia Corporation, the parent to the |
| | | Fund’s investment advisor. |
| 3 | | The address of the Officer is 401 S. Tryon Street, 20th Floor, Charlotte, NC 28288. |
| 4 | | The address of the Officer is 200 Berkeley Street, Boston, MA 02116. |
| |
| Additional information about the Fund’s Board of Trustees and Officers can be found in the Statement of Additional Information (SAI) and |
| is available upon request without charge by calling 800.343.2898. |
25
566380 rv5 04/2008
Evergreen Mid Cap Growth Fund

| table of contents |
| 1 | | LETTER TO SHAREHOLDERS |
| 4 | | FUND AT A GLANCE |
| 6 | | ABOUT YOUR FUND’S EXPENSES |
| 7 | | FINANCIAL HIGHLIGHTS |
| 11 | | SCHEDULE OF INVESTMENTS |
| 16 | | STATEMENT OF ASSETS AND LIABILITIES |
| 17 | | STATEMENT OF OPERATIONS |
| 18 | | STATEMENTS OF CHANGES IN NET ASSETS |
| 19 | | NOTES TO FINANCIAL STATEMENTS |
| 28 | | TRUSTEES AND OFFICERS |
This semiannual report must be preceded or accompanied by a prospectus of the Evergreen fund contained herein. The prospectus contains more complete information, including fees and expenses, and should be read carefully before investing or sending money.
The fund will file its complete schedule of portfolio holdings with the SEC for the first and third quarters of each fiscal year on Form N-Q. The fund’s Form N-Q will be available on the SEC’s Web site at http://www.sec.gov. In addition, the fund’s Form N-Q may be reviewed and copied at the SEC’s Public Reference Room in Washington, D.C. Information on the operation of the Public Reference Room may be obtained by calling 800.SEC.0330.
A description of the fund’s proxy voting policies and procedures, as well as information regarding how the fund voted proxies relating to portfolio securities during the most recent 12-month period ended June 30, is available by visiting our Web site at EvergreenInvestments.com or by visiting the SEC’s Web site at http://www.sec.gov. The fund’s proxy voting policies and procedures are also available without charge, upon request, by calling 800.343.2898.
| Mutual Funds: | | | | |
| NOT FDIC INSURED | | MAY LOSE VALUE | | NOT BANK GUARANTEED |
Evergreen InvestmentsSM is a service mark of Evergreen Investment Management Company, LLC.
Copyright 2008, Evergreen Investment Management Company, LLC.
Evergreen Investment Management Company, LLC is a subsidiary of Wachovia Corporation
and is an affiliate of Wachovia Corporation’s other Broker Dealer subsidiaries.
Evergreen mutual funds are distributed by Evergreen Investment Services, Inc.
200 Berkeley Street, Boston, MA 02116
LETTER TO SHAREHOLDERS
May 2008
Dennis H. Ferro
President and Chief Executive Officer
Dear Shareholder:
We are pleased to provide the Semiannual Report for Evergreen Mid Cap Growth Fund for the six-month period ended March 31, 2008 (the “six-month period”).
Mounting evidence of a slowing economy undermined confidence in equities and credit-sensitive fixed income securities during the six-month period. Investors feared weakness in housing and problems in the subprime mortgage industry could pull the domestic economy into recession. Major financial institutions began to report substantial losses from their exposures to subprime mortgages and banks started to tighten their credit standards and to restrict their lending. Equity prices were buffeted by news of falling profits, weakening housing, slowing employment, rising inflationary pressures and growing credit problems. Stock valuations fell across all market capitalizations, investment styles and regions. With fears of a dramatic downturn hovering over the market, fixed income investors sought out the highest-quality securities and attempted to avoid credit risk. As a consequence, the prices of corporate bonds and many asset-backed securities fell, while Treasuries rallied in a general flight to quality. In this environment, the prices of gold, oil and other commodities surged while the U.S. dollar weakened further.
The U.S. economy showed clear signs of weakening over the six-month period. Problems in the credit markets led to declines in lending for ordinary consumer and commercial activity, accentuating the effects of declining home prices. Corporate profits, employment and other key economic indicators showed signs of deterioration. Gross Domestic Product growth slowed to just 0.6% both in the final quarter of 2007 and in the first quarter of 2008. To reinvigorate the economy
1
LETTER TO SHAREHOLDERS continued
and stimulate lending activity, the Federal Reserve Board (the “Fed”) became increasingly aggressive, taking a series of steps to pour liquidity into the financial system. Starting in September 2007 and continuing through April 2008, the Fed cut the key fed funds rate seven different times, lowering the influential short-term rate from 5.25% to 2%. In March 2008, the central bank also opened its lending facilities to securities firms as well as commercial banks and intervened to help JPMorgan Chase & Co. purchase the collapsing investment bank Bear Stearns Cos. Congress and the Bush administration, meanwhile, rushed through a $168 billion fiscal stimulus bill, which included tax rebate checks, in an effort to boost growth in the second half of 2008.
During the six-month period, the management teams of Evergreen’s growth-oriented equity funds maintained their pursuit of capital appreciation, consistent with the investment discipline and style of each fund. The manager of Evergreen Large Company Growth Fund and Evergreen Omega Fund focused on bottom-up, fundamental analysis in making individual stock selections. The portfolio manager supervising Evergreen Mid Cap Growth Fund and Evergreen Small-Mid Growth Fund, meanwhile, sought to balance each portfolio with exposure both to consistent growth companies and to more cyclically oriented corporations. At the same time, managers of Evergreen Growth Fund concentrated on opportunities among small cap growth companies with above-average earnings prospects and reasonable stock valuations. The portfolio manager of Evergreen Enhanced S&P 500® Fund, in turn, employed a largely quantitative discipline in choosing a portfolio of predominately large cap stocks from both the value and growth stock universes.
We believe the experiences in the capital markets during the six-month period have underscored the value of a well-diversified, long-term investment strategy to help soften the effects of volatility in any one market or asset class. As always, we encourage investors to maintain diversified investment portfolios in pursuit of their long-term investment goals.
2
LETTER TO SHAREHOLDERS continued
Please visit us at EvergreenInvestments.com for more information about our funds and other investment products available to you. Thank you for your continued support of Evergreen Investments.
Sincerely,
Dennis H. Ferro
President and Chief Executive Officer
Evergreen Investment Company, Inc.
Special Notice to Shareholders:
Please visit our Web site at EvergreenInvestments.com for statements from President and Chief Executive Officer, Dennis Ferro, regarding the firm’s recent settlement with the Securities and Exchange Commission (SEC) and prior settlement with the Financial Industry Regulatory Authority (FINRA).
3
FUND AT A GLANCE
as of March 31, 2008
MANAGEMENT TEAM
Investment Advisor:
Evergreen Investment Management Company, LLC
Portfolio Managers:
Kenneth J. Doerr
Robert C. Junkin, CPA
CURRENT INVESTMENT STYLE
Source: Morningstar, Inc.
Morningstar’s style box is based on a portfolio date as of 3/31/2008.
The Equity style box placement is based on 10 growth and valuation measures for each fund holding and the median size of the companies in which the fund invests.
PERFORMANCE AND RETURNS
Portfolio inception date: 9/11/1935
| | | Class A | | Class B | | Class C | | Class I |
| Class inception date | | 1/20/1998 | | 9/11/1935 | | 1/26/1998 | | 1/26/1998 |
|
| Nasdaq symbol | | EKAAX | | EKABX | | EKACX | | EKAYX |
|
| 6-month return with sales charge | | -19.94% | | -19.48% | | -16.04% | | N/A |
|
| 6-month return w/o sales charge | | -15.03% | | -15.39% | | -15.22% | | -14.96% |
|
| Average annual return* | | | | | | | | |
|
| 1-year with sales charge | | -10.29% | | -10.15% | | -6.47% | | N/A |
|
| 1-year w/o sales charge | | -4.85% | | -5.58% | | -5.56% | | -4.70% |
|
| 5-year | | 11.80% | | 12.09% | | 12.39% | | 13.49% |
|
| 10-year | | 2.58% | | 2.46% | | 2.47% | | 3.46% |
|
| Maximum sales charge | | 5.75% | | 5.00% | | 1.00% | | N/A |
| | | Front-end | | CDSC | | CDSC | | |
|
* Adjusted for maximum applicable sales charge, unless noted.
Past performance is no guarantee of future results. The performance quoted represents past performance and current performance may be lower or higher. The investment return and principal value of an investment will fluctuate so that investors’ shares, when redeemed, may be worth more or less than their original cost. To obtain performance information current to the most recent month-end for Classes A, B, C or I, please go to EvergreenInvestments.com/fundperformance. The performance of each class may vary based on differences in loads, fees and expenses paid by the shareholders investing in each class. Performance includes the reinvestment of income dividends and capital gain distributions. Performance shown does not reflect the deduction of taxes that a shareholder would pay on fund distributions or the redemption of fund shares.
The fund incurs a 12b-1 fee of 0.25% for Class A and 1.00% for Classes B and C. Class I does not pay a 12b-1 fee.
The advisor is waiving a portion of its advisory fee and reimbursing a portion of the 12b-1 fee for Class A. Had the fees not been waived or reimbursed, returns would have been lower.
Effective May 7, 2008, Mr. Doerr and Mr. Junkin became portfolio managers of the fund. Effective May 14, 2008, Donald M. Bisson no longer managed the fund and Mr. Doerr and Mr. Junkin assumed day-to-day management responsibility of the fund.
4
FUND AT A GLANCE continued
LONG-TERM GROWTH
Comparison of a $10,000 investment in the Evergreen Mid Cap Growth Fund Class A shares versus a similar investment in the Russell Midcap Growth Index (Russell Midcap Growth) and the Consumer Price Index (CPI).
The Russell Midcap Growth is an unmanaged market index and does not include transaction costs associated with buying and selling securities, any mutual fund fees or expenses or any taxes. The CPI is a commonly used measure of inflation and does not represent an investment return. It is not possible to invest directly in an index.
Class I shares are only offered, subject to the minimum initial purchase requirements, in the following manner: (1) to investment advisory clients of EIMC (or its advisory affiliates), (2) to employer- or state-sponsored benefit plans, including but not limited to, retirement plans, defined benefit plans, deferred compensation plans, or savings plans, (3) to fee-based mutual fund wrap accounts, (4) through arrangements entered into on behalf of the Evergreen funds with certain financial services firms, (5) to certain institutional investors, and (6) to persons who owned Class Y shares in registered name in an Evergreen fund on or before December 31, 1994 or who owned shares of any SouthTrust fund in registered name as of March 18, 2005 or who owned shares of Vestaur Securities Fund as of May 20, 2005.
Class I shares are only available to institutional shareholders with a minimum of $1 million investment, which may be waived in certain situations.
The fund’s investment objective may be changed without a vote of the fund’s shareholders.
Foreign investments may contain more risk due to the inherent risks associated with changing political climates, foreign market instability and foreign currency fluctuations.
Mid cap securities may be subject to special risks associated with narrower product lines and limited financial resources compared to their large cap counterparts, and, as a result, mid cap securities may decline significantly in market downturns.
The stocks of smaller companies may be more volatile than those of larger companies due to the higher risk of failure.
All data is as of March 31, 2008, and subject to change.
5
ABOUT YOUR FUND’S EXPENSES
The Example below is intended to describe the fees and expenses borne by shareholders and the impact of those costs on your investment.
Example
As a shareholder of the fund, you incur two types of costs: (1) transaction costs, including sales charges (loads), redemption fees and exchange fees; and (2) ongoing costs, including management fees, distribution (12b-1) fees and other fund expenses. This Example is intended to help you understand your ongoing costs (in dollars) of investing in the fund and to compare these costs with the ongoing costs of investing in other mutual funds. The Example is based on an investment of $1,000 invested at the beginning of the period and held for the entire period from October 1, 2007 to March 31, 2008.
The example illustrates your fund’s costs in two ways:
Actual expenses
The section in the table under the heading “Actual” provides information about actual account values and actual expenses. You may use the information in these columns, together with the amount you invested, to estimate the expenses that you paid over the period. Simply divide your account value by $1,000 (for example, an $8,600 account value divided by $1,000 = 8.6), then multiply the result by the number in the appropriate column for your share class, in the column entitled “Expenses Paid During Period” to estimate the expenses you paid on your account during this period.
Hypothetical example for comparison purposes
The section in the table under the heading “Hypothetical (5% return before expenses)” provides information about hypothetical account values and hypothetical expenses based on the fund’s actual expense ratio and an assumed rate of return of 5% per year before expenses, which is not the fund’s actual return. The hypothetical account values and expenses may not be used to estimate the actual ending account balance or expenses you paid for the period. You may use this information to compare the ongoing costs of investing in the fund and other funds. To do so, compare this 5% hypothetical example with the 5% hypothetical examples that appear in the shareholder reports of the other funds.
Please note that the expenses shown in the table are meant to highlight your ongoing costs only and do not reflect any transactional costs, such as sales charges (loads), redemption fees or exchange fees. Therefore, the section in the table under the heading “Hypothetical (5% return before expenses)” is useful in comparing ongoing costs only, and will not help you determine the relative total costs of owning different funds. In addition, if these transactional costs were included, your costs would have been higher.
| | | Beginning | | Ending | | |
| | | Account | | Account | | Expenses |
| | | Value | | Value | | Paid During |
| | | 10/1/2007 | | 3/31/2008 | | Period* |
|
| Actual |
| Class A | | $ 1,000.00 | | $ 849.74 | | $ 4.62 |
| Class B | | $ 1,000.00 | | $ 846.10 | | $ 8.03 |
| Class C | | $ 1,000.00 | | $ 847.80 | | $ 8.04 |
| Class I | | $ 1,000.00 | | $ 850.35 | | $ 3.42 |
| Hypothetical | | |
| (5% return | |
| before expenses) | |
| Class A | | $ 1,000.00 | | $ 1,020.00 | | $ 5.05 |
| Class B | | $ 1,000.00 | | $ 1,016.30 | | $ 8.77 |
| Class C | | $ 1,000.00 | | $ 1,016.30 | | $ 8.77 |
| Class I | | $ 1,000.00 | | $ 1,021.30 | | $ 3.74 |
|
* For each class of the Fund, expenses are equal to the annualized expense ratio of each class (1.00% for Class A, 1.74% for Class B, 1.74% for Class C and 0.74% for Class I), multiplied by the average account value over the period, multiplied by 183 / 366 days.
6
| FINANCIAL HIGHLIGHTS |
|
| (For a share outstanding throughout each period) | | Six Months Ended | | Year Ended September 30, |
| | March 31, 2008 | |
|
| CLASS A | | (unaudited) | | 2007 | | 2006 | | 2005 | | 2004 | | 2003 |
|
| Net asset value, beginning of period | | $7.01 | | $5.55 | | $5.44 | | $4.65 | | $4.25 | | $2.98 |
|
| Income from investment operations |
| Net investment income (loss) | | (0.01)1 | | (0.01) | | (0.02) | | (0.03) | | (0.03) | | (0.03)1 |
Net realized and unrealized gains
or losses on investments | | (1.01) | | 1.47 | | 0.13 | | 0.82 | | 0.43 | | 1.30 |
| |
|
| Total from investment operations | | (1.02) | | 1.46 | | 0.11 | | 0.79 | | 0.40 | | 1.27 |
|
| Distributions to shareholders from |
| Net investment income | | (0.09) | | 0 | | 0 | | 0 | | 0 | | 0 |
| Net realized gains | | (0.17) | | 0 | | 0 | | 0 | | 0 | | 0 |
| |
|
| Total distributions to shareholders | | (0.26) | | 0 | | 0 | | 0 | | 0 | | 0 |
|
| Net asset value, end of period | | $5.73 | | $7.01 | | $5.55 | | $5.44 | | $4.65 | | $4.25 |
|
| Total return2 | | (15.03%) | | 26.31% | | 2.02% | | 16.99% | | 9.41% | | 42.62% |
|
| Ratios and supplemental data |
| Net assets, end of period (millions) | | $430 | | $540 | | $506 | | $564 | | $549 | | $544 |
| Ratios to average net assets |
| Expenses including waivers/reimbursements | | |
| but excluding expense reductions | | 1.00%3 | | 1.06% | | 1.09% | | 1.13% | | 1.16% | | 1.22% |
| Expenses excluding waivers/reimbursements | | |
| and expense reductions | | 1.06%3 | | 1.07% | | 1.09% | | 1.13% | | 1.16% | | 1.22% |
| Net investment income (loss) | | (0.23%)3 | | (0.36%) | | (0.34%) | | (0.68%) | | (0.75%) | | (0.84%) |
| Portfolio turnover rate | | 32% | | 89% | | 110% | | 141% | | 140% | | 221% |
|
1 Net investment income (loss) per share is based on average shares outstanding during the period.
2 Excluding applicable sales charges
3 Annualized
See Notes to Financial Statements
7
| FINANCIAL HIGHLIGHTS |
|
| (For a share outstanding throughout each period) | | Six Months Ended | | Year Ended September 30, |
| | March 31, 2008 | |
|
| CLASS B | | (unaudited) | | 2007 | | 2006 | | 2005 | | 2004 | | 2003 |
|
| Net asset value, beginning of period | | $6.45 | | $5.15 | | $5.08 | | $4.37 | | $4.02 | | $2.84 |
|
| Income from investment operations |
| Net investment income (loss) | | (0.03)1 | | (0.06)1 | | (0.05)1 | | (0.07)1 | | (0.08) | | (0.05)1 |
Net realized and unrealized gains
or losses on investments | | (0.94) | | 1.36 | | 0.12 | | 0.78 | | 0.43 | | 1.23 |
| |
|
| Total from investment operations | | (0.97) | | 1.30 | | 0.07 | | 0.71 | | 0.35 | | 1.18 |
|
| Distributions to shareholders from |
| Net investment income | | (0.03) | | 0 | | 0 | | 0 | | 0 | | 0 |
| Net realized gains | | (0.17) | | 0 | | 0 | | 0 | | 0 | | 0 |
| |
|
| Total distributions to shareholders | | (0.20) | | 0 | | 0 | | 0 | | 0 | | 0 |
|
| Net asset value, end of period | | $5.28 | | $6.45 | | $5.15 | | $5.08 | | $4.37 | | $4.02 |
|
| Total return2 | | (15.39%) | | 25.24% | | 1.38% | | 16.25% | | 8.71% | | 41.55% |
|
| Ratios and supplemental data |
| Net assets, end of period (millions) | | $15 | | $21 | | $21 | | $27 | | $30 | | $28 |
| Ratios to average net assets |
| Expenses including waivers/reimbursements | | |
| but excluding expense reductions | | 1.74%3 | | 1.78% | | 1.79% | | 1.83% | | 1.86% | | 1.94% |
| Expenses excluding waivers/reimbursements | | |
| and expense reductions | | 1.76%3 | | 1.78% | | 1.79% | | 1.83% | | 1.86% | | 1.94% |
| Net investment income (loss) | | (0.97%)3 | | (1.08%) | | (1.04%) | | (1.38%) | | (1.45%) | | (1.56%) |
| Portfolio turnover rate | | 32% | | 89% | | 110% | | 141% | | 140% | | 221% |
|
1 Net investment income (loss) per share is based on average shares outstanding during the period.
2 Excluding applicable sales charges
3 Annualized
See Notes to Financial Statements
8
| FINANCIAL HIGHLIGHTS |
|
| (For a share outstanding throughout each period) | | Six Months Ended | | Year Ended September 30, |
| | March 31, 2008 | |
|
| CLASS C | | (unaudited) | | 2007 | | 2006 | | 2005 | | 2004 | | 2003 |
|
| Net asset value, beginning of period | | $6.45 | | $5.15 | | $5.08 | | $4.37 | | $4.02 | | $2.85 |
|
| Income from investment operations |
| Net investment income (loss) | | (0.03)1 | | (0.06)1 | | (0.05)1 | | (0.07)1 | | (0.07) | | (0.05)1 |
Net realized and unrealized gains
or losses on investments | | (0.93) | | 1.36 | | 0.12 | | 0.78 | | 0.42 | | 1.22 |
| |
|
| Total from investment operations | | (0.96) | | 1.30 | | 0.07 | | 0.71 | | 0.35 | | 1.17 |
|
| Distributions to shareholders from |
| Net investment income | | (0.04) | | 0 | | 0 | | 0 | | 0 | | 0 |
| Net realized gains | | (0.17) | | 0 | | 0 | | 0 | | 0 | | 0 |
| |
|
| Total distributions to shareholders | | (0.21) | | 0 | | 0 | | 0 | | 0 | | 0 |
|
| Net asset value, end of period | | $5.28 | | $6.45 | | $5.15 | | $5.08 | | $4.37 | | $4.02 |
|
| Total return2 | | (15.22%) | | 25.24% | | 1.38% | | 16.25% | | 8.71% | | 41.05% |
|
| Ratios and supplemental data |
| Net assets, end of period (millions) | | $6 | | $7 | | $6 | | $7 | | $8 | | $8 |
| Ratios to average net assets |
| Expenses including waivers/reimbursements | | |
| but excluding expense reductions | | 1.74%3 | | 1.78% | | 1.79% | | 1.83% | | 1.86% | | 1.94% |
| Expenses excluding waivers/reimbursements | | |
| and expense reductions | | 1.76%3 | | 1.78% | | 1.79% | | 1.83% | | 1.86% | | 1.94% |
| Net investment income (loss) | | (0.97%)3 | | (1.09%) | | (1.04%) | | (1.38%) | | (1.45%) | | (1.56%) |
| Portfolio turnover rate | | 32% | | 89% | | 110% | | 141% | | 140% | | 221% |
|
1 Net investment income (loss) per share is based on average shares outstanding during the period.
2 Excluding applicable sales charges
3 Annualized
See Notes to Financial Statements
9
| FINANCIAL HIGHLIGHTS |
|
| (For a share outstanding throughout each period) | | Six Months Ended | | Year Ended September 30, |
| | March 31, 2008 | |
|
| CLASS I | | (unaudited) | | 2007 | | 2006 | | 2005 | | 2004 | | 2003 |
|
| Net asset value, beginning of period | | $7.24 | | $5.72 | | $5.59 | | $4.76 | | $4.33 | | $3.03 |
|
| Income from investment operations |
| Net investment income (loss) | | 01 | | 01 | | (0.01) | | (0.02) | | (0.02)1 | | (0.02)1 |
Net realized and unrealized gains
or losses on investments | | (1.05) | | 1.52 | | 0.14 | | 0.85 | | 0.45 | | 1.32 |
| |
|
| Total from investment operations | | (1.05) | | 1.52 | | 0.13 | | 0.83 | | 0.43 | | 1.30 |
|
| Distributions to shareholders from |
| Net investment income | | (0.11) | | 0 | | 0 | | 0 | | 0 | | 0 |
| Net realized gains | | (0.17) | | 0 | | 0 | | 0 | | 0 | | 0 |
| |
|
| Total distributions to shareholders | | (0.28) | | 0 | | 0 | | 0 | | 0 | | 0 |
|
| Net asset value, end of period | | $5.91 | | $7.24 | | $5.72 | | $5.59 | | $4.76 | | $4.33 |
|
| Total return | | (14.96%) | | 26.57% | | 2.33% | | 17.44% | | 9.93% | | 42.90% |
|
| Ratios and supplemental data |
| Net assets, end of period (millions) | | $95 | | $94 | | $114 | | $86 | | $41 | | $4 |
| Ratios to average net assets |
| Expenses including waivers/reimbursements | | |
| but excluding expense reductions | | 0.74%2 | | 0.78% | | 0.79% | | 0.83% | | 0.86% | | 0.94% |
| Expenses excluding waivers/reimbursements | | |
| and expense reductions | | 0.76%2 | | 0.78% | | 0.79% | | 0.83% | | 0.86% | | 0.94% |
| Net investment income (loss) | | 0.02%2 | | (0.08%) | | (0.03%) | | (0.38%) | | (0.42%) | | (0.54%) |
| Portfolio turnover rate | | 32% | | 89% | | 110% | | 141% | | 140% | | 221% |
|
1 Net investment income (loss) per share is based on average shares outstanding during the period.
2 Annualized
See Notes to Financial Statements
10
| SCHEDULE OF INVESTMENTS |
|
| March 31, 2008 (unaudited) | | | | | | | | |
| | | | | Shares | | | | Value |
|
| COMMON STOCKS 97.9% |
| CONSUMERDISCRETIONARY 17.6% |
| Diversified Consumer Services 3.4% | | | | | | | | |
| Apollo Group, Inc., Class A * | | 145,500 | | $ 6,285,600 |
| Strayer Education, Inc. | | 78,200 | | | | 11,925,500 |
| |
|
| | | | | | | | | 18,211,100 |
| |
|
| Hotels, Restaurants & Leisure 2.3% |
| International Game Technology | | 316,100 | | | | 12,710,381 |
| |
|
| Household Durables 2.8% |
| Garmin, Ltd. (p) | | 83,100 | | | | 4,488,231 |
| Newell Rubbermaid, Inc. | | 474,300 | | | | 10,847,241 |
| |
|
| | | | | | | | | 15,335,472 |
| |
|
| Internet & Catalog Retail 1.3% |
| priceline.com, Inc. * (p) | | 58,100 | | | | 7,021,966 |
| |
|
| Media 2.6% |
| Focus Media Holding, Ltd., ADR * (p) | | 140,300 | | | | 4,931,545 |
| Lamar Advertising Co., Class A (p) | | 251,500 | | | | 9,036,395 |
| |
|
| | | | | | | | | 13,967,940 |
| |
|
| Specialty Retail 1.2% |
| GameStop Corp., Class A * | | 128,000 | | | | 6,618,880 |
| |
|
| Textiles, Apparel & Luxury Goods 4.0% |
| Coach, Inc. * | | 255,822 | | | | 7,713,033 |
| Hanesbrands, Inc. * (p) | | 489,400 | | | | 14,290,480 |
| |
|
| | | | | | | | | 22,003,513 |
| |
|
| CONSUMER STAPLES 1.9% |
| Personal Products 1.9% |
| Alberto-Culver Co. | | 383,660 | | | | 10,516,121 |
| |
|
| ENERGY 12.5% |
| Energy Equipment & Services 6.1% |
| Cameron International Corp. * | | 279,300 | | | | 11,630,052 |
| Diamond Offshore Drilling, Inc. (p) | | 97,500 | | | | 11,349,000 |
| National Oilwell Varco, Inc. * | | 178,100 | | | | 10,397,478 |
| |
|
| | | | | | | | | 33,376,530 |
| |
|
| Oil, Gas & Consumable Fuels 6.4% |
| Denbury Resources, Inc. * | | 421,600 | | | | 12,036,680 |
| Southwestern Energy Co. * | | 678,200 | | | | 22,848,558 |
| |
|
| | | | | | | | | 34,885,238 |
| |
|
| FINANCIALS 5.7% |
| Capital Markets 1.8% |
| Affiliated Managers Group, Inc. * | | 111,749 | | | | 10,140,104 |
| |
|
| Insurance 1.8% |
| Fidelity National Financial, Inc. | | 532,400 | | | | 9,758,892 |
| |
|
See Notes to Financial Statements
11
| SCHEDULE OF INVESTMENTS continued |
|
| March 31, 2008 (unaudited) | | | | | | | | | | |
| | | | | | | Shares | | | | Value |
|
| COMMON STOCKS continued |
| FINANCIALS continued |
| Thrifts & Mortgage Finance 2.1% |
| New York Community Bancorp, Inc. (p) | | 627,900 | | $ 11,440,338 |
| |
|
| HEALTH CARE 18.0% |
| Biotechnology 4.2% |
| Celgene Corp. * (p) | | 200,000 | | | | 12,258,000 |
| Cephalon, Inc. *(p) | | 167,300 | | | | 10,774,120 |
| |
|
| | | | | | | | | | | 23,032,120 |
| |
|
| Health Care Equipment & Supplies 9.4% | | | | | | | | | | |
| Hologic, Inc. * (p) | | 237,200 | | | | 13,188,320 |
| Hospira, Inc. * (p) | | 315,000 | | | | 13,472,550 |
| Smith & Nephew plc, ADR (p) | | 213,300 | | | | 14,075,667 |
| Varian Medical Systems, Inc. * (p) | | 229,000 | | | | 10,726,360 |
| |
|
| | | | | | | | | | | 51,462,897 |
| |
|
| Health Care Providers & Services 2.5% |
| Pediatrix Medical Group, Inc. * (p) | | 200,900 | | | | 13,540,660 |
| |
|
| Life Sciences Tools & Services 1.9% |
| Pharmaceutical Product Development, Inc. | | 243,000 | | | | 10,181,700 |
| |
|
| INDUSTRIALS 17.3% |
| Commercial Services & Supplies 5.0% |
| FTI Consulting, Inc. * (p) | | 256,527 | | | | 18,223,678 |
| Watson Wyatt Worldwide, Inc. | | 160,700 | | | | 9,119,725 |
| |
|
| | | | | | | | | | | 27,343,403 |
| |
|
| Electrical Equipment 2.1% |
| Roper Industries, Inc. (p) | | 190,700 | | | | 11,335,208 |
| |
|
| Industrial Conglomerates 2.5% |
| McDermott International, Inc. * | | 248,400 | | | | 13,617,288 |
| |
|
| Machinery 3.0% |
| ITT Corp. | | 190,000 | | | | 9,843,900 |
| Manitowoc Co., Inc. | | 156,700 | | | | 6,393,360 |
| |
|
| | | | | | | | | | | 16,237,260 |
| |
|
| Road & Rail 2.7% |
| Landstar System, Inc. (p) | | 282,900 | | | | 14,756,064 |
| |
|
| Trading Companies & Distributors 2.0% |
| MSC Industrial Direct Co., Class A | | 261,400 | | | | 11,044,150 |
| |
|
| INFORMATION TECHNOLOGY 16.6% |
| Communications Equipment 6.2% |
| F5 Networks, Inc. * | | 441,328 | | | | 8,018,930 |
| NICE-Systems, Ltd., ADR * | | 445,600 | | | | 12,574,832 |
| Research In Motion, Ltd. * | | 116,400 | | | | 13,063,572 |
| |
|
| | | | | | | | | | | 33,657,334 |
| |
|
See Notes to Financial Statements
12
| SCHEDULE OF INVESTMENTS continued |
|
| March 31, 2008 (unaudited) | | | | | | | | | | |
| | | | | | | Shares | | | | Value |
|
| COMMON STOCKS continued |
| INFORMATION TECHNOLOGY continued |
| Internet Software & Services 3.4% |
| Akamai Technologies, Inc. * (p) | | 410,000 | | $ 11,545,600 |
| SINA Corp. * | | 189,800 | | | | 6,690,450 |
| |
|
| | | | | | | | | | | 18,236,050 |
| |
|
| IT Services 2.2% |
| Cognizant Technology Solutions Corp., Class A * | | 422,400 | | | | 12,177,792 |
| |
|
| Semiconductors & Semiconductor Equipment 2.5% |
| MEMC Electronic Materials, Inc. * | | 191,700 | | | | 13,591,530 |
| |
|
| Software 2.3% |
| Jack Henry & Associates, Inc. | | 517,400 | | | | 12,764,258 |
| |
|
| MATERIALS 4.8% |
| Chemicals 2.4% |
| Agrium, Inc. (p) | | 212,600 | | | | 13,204,586 |
| |
|
| Metals & Mining 2.4% |
| United States Steel Corp. | | 101,400 | | | | 12,864,618 |
| |
|
| TELECOMMUNICATION SERVICES 3.5% |
| Diversified Telecommunication Services 2.1% |
| Time Warner Telecom, Inc. * (p) | | 730,200 | | | | 11,310,798 |
| |
|
| Wireless Telecommunication Services 1.4% |
| NII Holdings, Inc. * | | 241,732 | | | | 7,682,243 |
| |
|
Total Common Stocks (cost $470,297,078) | | | | 534,026,434 |
| |
|
|
| | | | | | | Principal | | | | |
| | | | | | | Amount | | | | Value |
|
| SHORT-TERM INVESTMENTS 29.6% |
| CORPORATE BONDS 2.7% |
| Capital Markets 0.5% |
| Carrera Capital Finance, LLC, FRN, SIV, 2.57%, 05/27/2008 (pp) + | | $ 3,000,000 | | | | 2,993,670 |
| |
|
| Consumer Finance 0.4% |
| Toyota Motor Credit Corp., FRN, 2.13%, 05/08/2008 (pp) | | 2,000,000 | | | | 1,999,692 |
| |
|
| Diversified Financial Services 1.8% |
Premier Asset Collateralized Entity, LLC, FRN, SIV, 2.80%,
05/15/2008 (pp) + | | 5,000,000 | | | | 4,993,990 |
| Sigma Finance, Inc., FRN, SIV, 2.34%, 06/16/2008 (pp) + | | 5,000,000 | | | | 4,870,500 |
| |
|
| | | | | | | | | | | 9,864,490 |
| |
|
| | | | | | | | | | | 14,857,852 |
| |
|
See Notes to Financial Statements
13
| SCHEDULE OF INVESTMENTS continued |
|
| March 31, 2008 (unaudited) | | | | Principal | | | | |
| | | | | Amount | | | | Value |
|
| SHORT-TERM INVESTMENTS continued |
| REPURCHASE AGREEMENTS ^ 11.9% |
| Banc of America Securities, LLC, 3.07%, dated 03/31/2008, maturing 04/01/2008, | | |
| maturity value $9,528,813 (pp) (1) | | $ 9,528,000 | | $ 9,528,000 |
| BNP Paribas SA, 3.10%, dated 03/31/2008, maturing 04/01/2008, maturity value | | |
| $6,549,564 (pp) (2) | | 6,549,000 | | | | 6,549,000 |
| Credit Suisse First Boston, LLC, 3.15%, dated 03/31/2008, maturing 04/01/2008, | | |
| maturity value $8,000,700 (pp) (3) | | 8,000,000 | | | | 8,000,000 |
| Deutsche Bank Securities, Inc., 3.10%, dated 03/31/2008, maturing 04/01/2008, | | |
| maturity value $17,007,464 (pp) (4) | | 17,006,000 | | | | 17,006,000 |
| Dresdner Kleinwort Wasserstein Securities, LLC, 3.10%, dated 03/31/2008, | | |
| maturing 04/01/2008, maturity value $11,000,947 (pp) (5) | | 11,000,000 | | | | 11,000,000 |
| Greenwich Capital Markets, Inc., 3.10%, dated 03/31/2008, maturing 04/01/2008, | | |
| maturity value $10,000,861 (pp) (6) | | 10,000,000 | | | | 10,000,000 |
| Merrill Lynch Pierce Fenner & Smith, Inc., 3.10%, dated 03/31/2008, maturing | | |
| 04/01/2008, maturity value $3,000,258 (pp) (7) | | 3,000,000 | | | | 3,000,000 |
| |
|
| | | | | | | | | 65,083,000 |
| |
|
|
| | | | | Shares | | | | Value |
|
| MUTUAL FUND SHARES 15.0% |
| BGI Prime Money Market Fund, Premium Shares, 3.15% q (pp) | | 9,907,000 | | | | 9,907,000 |
| BlackRock Liquidity TempFund, Institutional Class, 3.25% q (pp) | | 9,002,000 | | | | 9,002,000 |
| Evergreen Institutional Money Market Fund, Class I, 3.27% q ø (pp) | | 43,951,225 | | | | 43,951,225 |
| Morgan Stanley Institutional Liquidity Fund Money Market Portfolio, Institutional | | |
| Class, 3.31% q (pp) | | 19,000,000 | | | | 19,000,000 |
| |
|
| | | | | | | | | 81,860,225 |
| |
|
| Total Short-Term Investments (cost $161,943,119) | | | | 161,801,077 |
| |
|
| Total Investments (cost $632,240,197) 127.5% | | | | 695,827,511 |
| Other Assets and Liabilities (27.5%) | | | | (150,255,144) |
| |
|
| Net Assets 100.0% | | $ 545,572,367 |
| |
|
| * | | Non-income producing security |
| (p) | | All or a portion of this security is on loan. |
| (pp) | | All or a portion of this security represents investment of cash collateral received from securities on loan. |
| + | | Security is deemed illiquid and is valued using market quotations when readily available, unless otherwise noted. |
| q | | Rate shown is the 7-day annualized yield at period end. |
| ø | | Evergreen Investment Management Company, LLC is the investment advisor to both the Fund and the money market |
| | | fund. |
See Notes to Financial Statements
14
SCHEDULE OF INVESTMENTS continued
March 31, 2008 (unaudited)
| ^ | | Collateral is pooled with the collateral of other Evergreen funds and allocated on a pro rata basis consisting of: |
| | | (1) investment grade corporate bonds, 2.88% to 8.60%, 10/15/2008 to 06/01/2065, value including accrued |
| | | interest is $9,718,560. |
| | | (2) investment grade corporate bonds, 5.30% to 8.25%, 10/28/2015 to 06/01/2032, value including accrued |
| | | interest is $6,679,980. |
| | | (3) investment grade corporate bonds, 7.375% to 8.00%, 06/15/2010 to 03/15/2038, value including accrued |
| | | interest is $8,160,003. |
| | | (4) high grade CMOs, 2.84% to 6.15%, 09/15/2021 to 02/15/2051, value including accrued interest is |
| | | $14,566,885; investment grade CMO, 4.04%, 04/25/2034, value including accrued interest is $2,779,235. |
| | | (5) investment grade corporate bonds, 5.70% to 8.75%, 02/15/2017 to 03/01/2031, value including accrued |
| | | interest is $613,581; high grade asset-backed securities 2.97% to 3.41%, 05/25/2035 to 08/25/2046, value |
| | | including accrued interest is $6,670,838; high grade CMOs, 3.21% to 5.22%, 07/15/2035 to 08/25/2046, |
| | | value including accrued interest is $3,936,048. |
| | | (6) agency mortgage-backed security, 5.00%, 03/01/2038, value including accrued interest is $10,200,249. |
| | | (7) investment grade corporate bonds, 0.00% to 7.15%, 08/15/2013 to 06/01/2037, value including accrued |
| | | interest is $3,060,008. |
| Summary of Abbreviations |
| ADR | | American Depository Receipt |
| CMO | | Collateralized Mortgage Obligation |
| FRN | | Floating Rate Note |
| SIV | | Structured Investment Vehicle |
The following table shows the percent of total long-term investments by sector as of March 31, 2008:
| Health Care | | 18.4% |
| Consumer Discretionary | | 17.8% |
| Industrials | | 17.7% |
| Information Technology | | 16.9% |
| Energy | | 12.8% |
| Financials | | 5.9% |
| Materials | | 4.9% |
| Telecommunication Services | | 3.6% |
| Consumer Staples | | 2.0% |
| |
|
| | | 100.0% |
| | |
|
See Notes to Financial Statements
15
| STATEMENT OF ASSETS AND LIABILITIES |
|
| March 31, 2008 (unaudited) | | |
|
| Assets | | |
| Investments in securities, at value (cost $588,288,972) including $135,524,209 | |
| of securities loaned | | $ 651,876,286 |
| Investments in affiliated money market fund, at value (cost $43,951,225) | | | | 43,951,225 |
|
| Total investments | | | | 695,827,511 |
| Receivable for Fund shares sold | | | | 197,477 |
| Dividends receivable | | | | 148,206 |
| Receivable for securities lending income | | | | 37,797 |
| Receivable from investment advisor | | | | 9,583 |
| Prepaid expenses and other assets | | | | 63,339 |
|
| Total assets | | | | 696,283,913 |
|
| Liabilities | | | | |
| Payable for securities purchased | | | | 10,306,392 |
| Payable for Fund shares redeemed | | | | 258,037 |
| Payable for securities on loan | | | | 139,992,750 |
| Due to related parties | | | | 1,671 |
| Accrued expenses and other liabilities | | | | 152,696 |
|
| Total liabilities | | | | 150,711,546 |
|
| Net assets | $ 545,572,367 |
|
| Net assets represented by |
| Paid-in capital | | $ 509,314,461 |
| Overdistributed net investment loss | | | | (710,437) |
| Accumulated net realized losses on investments | | | | (26,618,971) |
| Net unrealized gains on investments | | | | 63,587,314 |
|
| Total net assets | | $ 545,572,367 |
|
| Net assets consists of |
| Class A | | $ 429,938,938 |
| Class B | | | | 14,989,525 |
| Class C | | | | 5,981,807 |
| Class I | | | | 94,662,097 |
|
| Total net assets | | $ 545,572,367 |
|
| Shares outstanding (unlimited number of shares authorized) |
| Class A | | | | 75,023,612 |
| Class B | | | | 2,838,069 |
| Class C | | | | 1,133,888 |
| Class I | | | | 16,017,492 |
|
| Net asset value per share | | | | |
| Class A | | $ 5.73 |
| Class A — Offering price (based on sales charge of 5.75%) | | $ 6.08 |
| Class B | | $ 5.28 |
| Class C | | $ 5.28 |
| Class I | | $ 5.91 |
|
See Notes to Financial Statements
16
| STATEMENT OF OPERATIONS |
|
| Six Months Ended March 31, 2008 (unaudited) |
|
| Investment income |
| Dividends (net of foreign withholding taxes of $1,899) | | $ 1,750,579 |
| Income from affiliate | | | | 361,230 |
| Securities lending | | | | 318,602 |
|
| Total investment income | | | | 2,430,411 |
|
| Expenses |
| Advisory fee | | | | 1,517,887 |
| Distribution Plan expenses |
| Class A | | | | 731,737 |
| Class B | | | | 90,619 |
| Class C | | | | 34,727 |
| Administrative services fee | | | | 316,671 |
| Transfer agent fees | | | | 365,009 |
| Trustees’ fees and expenses | | | | 6,557 |
| Printing and postage expenses | | | | 48,346 |
| Custodian and accounting fees | | | | 81,572 |
| Registration and filing fees | | | | 30,978 |
| Professional fees | | | | 56,559 |
| Other | | | | 7,153 |
|
| Total expenses | | | | 3,287,815 |
| Less: Expense reductions | | | | (7,173) |
| Fee waivers and expense reimbursements | | | | (187,702) |
|
| Net expenses | | | | 3,092,940 |
|
| Net investment loss | | | | (662,529) |
|
| Net realized and unrealized gains or losses on investments |
| Net realized losses on investments | | | | (16,195,095) |
| Net change in unrealized gains or losses on investments | | | | (90,666,709) |
|
| Net realized and unrealized gains or losses on investments | | | | (106,861,804) |
|
| Net decrease in net assets resulting from operations | | $ (107,524,333) |
|
See Notes to Financial Statements
17
| STATEMENTS OF CHANGES IN NET ASSETS | | | | |
|
| | | Six Months Ended | | |
| | | March 31, 2008 | | Year Ended |
| | | (unaudited) | | September 30, 2007 |
|
| Operations |
| Net investment loss | | $ (662,529) | | $ (2,263,932) |
| Net realized gains or losses on investments | | | | (16,195,095) | | | | 110,872,772 |
| Net change in unrealized gains or losses | | |
| on investments | | | | (90,666,709) | | | | 42,976,810 |
|
| Net increase (decrease) in net assets | | | | | | | | |
| resulting from operations | | | | (107,524,333) | | | | 151,585,650 |
|
| Distributions to shareholders from | | | | | | | | |
| Net investment income | | | | | | | | |
| Class A | | | | (6,490,876) | | | | 0 |
| Class B | | | | (88,869) | | | | 0 |
| Class C | | | | (49,653) | | | | 0 |
| Class I | | | | (2,470,873) | | | | 0 |
| Net realized gains | | | | | | | | |
| Class A | | | | (13,134,151) | | | | 0 |
| Class B | | | | (537,940) | | | | 0 |
| Class C | | | | (203,157) | | | | 0 |
| Class I | | | | (3,449,860) | | | | 0 |
|
| Total distributions to shareholders | | | | (26,425,379) | | | | 0 |
|
| | | Shares | | | | Shares | | |
| Capital share transactions | | | | | | | | |
| Proceeds from shares sold | | | | | | | | |
| Class A | | 710,001 | | 4,553,338 | | 1,376,213 | | 8,686,939 |
| Class B | | 103,345 | | 612,359 | | 266,771 | | 1,552,437 |
| Class C | | 146,710 | | 886,691 | | 284,232 | | 1,646,842 |
| Class I | | 14,769,701 | | 103,766,999 | | 3,430,863 | | 22,333,393 |
|
| | | | | 109,819,387 | | | | 34,219,611 |
|
| Net asset value of shares issued | | | | | | | | |
| in reinvestment of distributions | | | | | | | | |
| Class A | | 2,516,125 | | 16,535,571 | | 0 | | 0 |
| Class B | | 96,125 | | 577,923 | | 0 | | 0 |
| Class C | | 34,539 | | 207,886 | | 0 | | 0 |
| Class I | | 326,722 | | 2,220,518 | | 0 | | 0 |
|
| | | | | 19,541,898 | | | | 0 |
|
| Automatic conversion of Class B shares | | | | | | | | |
| to Class A shares | | | | | | | | |
| Class A | | 208,634 | | 1,321,296 | | 273,124 | | 1,710,588 |
| Class B | | (226,693) | | (1,321,296) | | (295,991) | | (1,710,588) |
|
| | | | | 0 | | | | 0 |
|
| Payment for shares redeemed | | | | | | | | |
| Class A | | (5,494,773) | | (35,492,568) | | (15,665,477) | | (97,342,315) |
| Class B | | (383,070) | | (2,259,259) | | (768,483) | | (4,457,039) |
| Class C | | (206,209) | | (1,171,714) | | (298,139) | | (1,715,526) |
| Class I | | (12,047,826) | | (73,646,860) | | (10,362,989) | | (66,076,786) |
|
| | | | | (112,570,401) | | | | (169,591,666) |
|
| Net increase (decrease) in net assets | | | | | | | | |
| resulting from capital share transactions | | | | 16,790,884 | | | | (135,372,055) |
|
| Total increase (decrease) in net assets | | | | (117,158,828) | | | | 16,213,595 |
| Net assets | | | | | | | | |
| Beginning of period | | | | 662,731,195 | | | | 646,517,600 |
|
| End of period | | $ 545,572,367 | | $ 662,731,195 |
|
| Undistributed (overdistributed) | | | | | | | | |
| net investment income (loss) | | $ (710,437) | | $ 9,052,363 |
|
See Notes to Financial Statements
18
NOTES TO FINANCIAL STATEMENTS (unaudited)
1. ORGANIZATION
Evergreen Mid Cap Growth Fund (the “Fund”) is a diversified series of Evergreen Equity Trust (the “Trust”), a Delaware statutory trust organized on September 18, 1997. The Trust is an open-end management investment company registered under the Investment Company Act of 1940, as amended (the “1940 Act”).
The Fund offers Class A, Class B, Class C and Class I shares. Class A shares are sold with a front-end sales charge. However, Class A share investments of $1 million or more are not subject to a front-end sales charge but are subject to a contingent deferred sales charge of 1.00% upon redemption within 18 months. Class B shares are sold without a front-end sales charge but are subject to a contingent deferred sales charge that is payable upon redemption and decreases depending on how long the shares have been held. Class C shares are sold without a front-end sales charge but are subject to a contingent deferred sales charge that is payable upon redemption within one year. Class I shares are sold without a front-end sales charge or contingent deferred sales charge. Each class of shares, except Class I shares, pays an ongoing distribution fee.
2. SIGNIFICANT ACCOUNTING POLICIES
The following is a summary of significant accounting policies consistently followed by the Fund in the preparation of its financial statements. The policies are in conformity with generally accepted accounting principles in the United States of America, which require management to make estimates and assumptions that affect amounts reported herein. Actual results could differ from these estimates.
a. Valuation of investments
Listed equity securities are usually valued at the last sales price or official closing price on the national securities exchange where the securities are principally traded.
Foreign securities traded on an established exchange are valued at the last sales price on the exchange where the security is primarily traded. If there has been no sale, the securities are valued at the mean between bid and asked prices. Foreign securities may be valued at fair value according to procedures approved by the Board of Trustees if the closing price is not reflective of current market values due to trading or events occurring in the foreign markets between the close of the established exchange and the valuation time of the Fund. In addition, substantial changes in values in the U.S. markets subsequent to the close of a foreign market may also affect the values of securities traded in the foreign market. The value of foreign securities may be adjusted if such movements in the U.S. market exceed a specified threshold.
Portfolio debt securities acquired with more than 60 days to maturity are fair valued using matrix pricing methods determined by an independent pricing service which takes into consideration such factors as similar security prices, yields, maturities, liquidity and ratings. Securities for which valuations are not readily available from an independent pricing service may be valued by brokers which use prices provided by market makers or estimates of market value obtained from yield data relating to investments or securities with similar characteristics.
19
NOTES TO FINANCIAL STATEMENTS (unaudited) continued
Short-term securities with remaining maturities of 60 days or less at the time of purchase are valued at amortized cost, which approximates market value.
Investments in open-end mutual funds are valued at net asset value. Securities for which market quotations are not readily available or not reflective of current market value are valued at fair value as determined by the investment advisor in good faith, according to procedures approved by the Board of Trustees.
b. Repurchase agreements
Securities pledged as collateral for repurchase agreements are held by the custodian bank or in a segregated account in the Fund’s name until the agreements mature. Collateral for certain tri-party repurchase agreements is held at the counterparty’s custodian in a segregated account for the benefit of the Fund and the counterparty. Each agreement requires that the market value of the collateral be sufficient to cover payments of interest and principal. However, in the event of default or bankruptcy by the other party to the agreement, retention of the collateral may be subject to legal proceedings. The Fund will only enter into repurchase agreements with banks and other financial institutions, which are deemed by the investment advisor to be creditworthy pursuant to guidelines established by the Board of Trustees. In certain instances, the Fund’s securities lending agent may provide collateral in the form of repurchase agreements.
c. Foreign currency translation
All assets and liabilities denominated in foreign currencies are translated into U.S. dollar amounts at the date of valuation. Purchases and sales of portfolio securities and income items denominated in foreign currencies are translated into U.S. dollar amounts on the respective dates of such transactions. The Fund does not separately account for that portion of the results of operations resulting from changes in foreign exchange rates on investments and the fluctuations arising from changes in market prices of securities held. Such fluctuations are included with the net realized and unrealized gains or losses on investments.
d. Securities lending
The Fund may lend its securities to certain qualified brokers in order to earn additional income. The Fund receives compensation in the form of fees or interest earned on the investment of any cash collateral received. The Fund also continues to receive interest and dividends on the securities loaned. The Fund receives collateral in the form of cash or securities with a market value at least equal to the market value of the securities on loan. In the event of default or bankruptcy by the borrower, the Fund could experience delays and costs in recovering the loaned securities or in gaining access to the collateral. The Fund has the right under the lending agreement to recover the securities from the borrower on demand.
e. Security transactions and investment income
Security transactions are recorded on trade date. Realized gains and losses are computed using the specific cost of the security sold. Dividend income is recorded on the ex-dividend date or in the case of some foreign securities, on the date when the Fund is made aware of the dividend. Foreign
20
NOTES TO FINANCIAL STATEMENTS (unaudited) continued
income and capital gains realized on some securities may be subject to foreign taxes, which are accrued as applicable.
f. Federal and other taxes
The Fund intends to continue to qualify as a regulated investment company and distribute all of its taxable income, including any net capital gains (which have already been offset by available capital loss carryovers). Accordingly, no provision for federal taxes is required. The Fund has adopted the provisions of FASB Interpretation No. 48, Accounting for Uncertainty in Income Taxes (“FIN 48”) which prescribes a minimum threshold for financial statement recognition of the benefit of a tax position taken or expected to be taken in a tax return. The Fund’s financial statements have not been impacted by the adoption of FIN 48.
g. Distributions
Distributions to shareholders from net investment income and net realized gains, if any, are recorded on the ex-dividend date. Such distributions are determined in conformity with income tax regulations, which may differ from generally accepted accounting principles.
h. Class allocations
Income, common expenses and realized and unrealized gains and losses are allocated to the classes based on the relative net assets of each class. Distribution fees, if any, are calculated daily at the class level based on the appropriate net assets of each class and the specific expense rates applicable to each class.
3. ADVISORY FEE AND OTHER TRANSACTIONS WITH AFFILIATES
Evergreen Investment Management Company, LLC (“EIMC”), an indirect, wholly-owned subsidiary of Wachovia Corporation (“Wachovia”), is the investment advisor to the Fund and is paid an annual fee starting at 0.51% and declining to 0.26% as average daily net assets increase. For the six months ended March 31, 2008, the advisory fee was equivalent to 0.48% of the Fund’s average daily net assets (on an annualized basis).
From time to time, EIMC may voluntarily or contractually waive its fee and/or reimburse expenses in order to limit operating expenses. During the six months ended March 31, 2008, EIMC voluntarily waived its advisory fee in the amount of $79,164 and reimbursed Distribution Plan expenses (see Note 4) relating to Class A shares in the amount of $108,538.
The Fund may invest in money market funds which are advised by EIMC. Income earned on these investments is included in income from affiliate on the Statement of Operations.
Effective January 1, 2008, EIMC replaced Evergreen Investment Services, Inc. (“EIS”), an indirect, wholly-owned subsidiary of Wachovia, as the administrator to the Fund upon the assignment of the Fund’s Administrative Services Agreement from EIS to EIMC. There were no changes to the services being provided or fees being paid by the Fund. The administrator provides the Fund with facilities, equipment and personnel and is paid an annual rate determined by applying percentage rates to the aggregate average daily net assets of the Evergreen funds
21
NOTES TO FINANCIAL STATEMENTS (unaudited) continued
(excluding money market funds and Evergreen Institutional Enhanced Income Fund), starting at 0.10% and declining to 0.05% as the aggregate average daily net assets of the Evergreen funds (excluding money market funds and Evergreen Institutional Enhanced Income Fund) increase.
Evergreen Service Company, LLC (“ESC”), an indirect, wholly-owned subsidiary of Wachovia, is the transfer and dividend disbursing agent for the Fund. ESC receives account fees that vary based on the type of account held by the shareholders in the Fund. For the six months ended March 31, 2008, the transfer agent fees were equivalent to an annual rate of 0.11% of the Fund’s average daily net assets.
Wachovia Bank NA, through its securities lending division of Wachovia Global Securities Lending, acts as the securities lending agent for the Fund.
The Fund has placed a portion of its portfolio transactions with brokerage firms that are affiliates of Wachovia. During the six months ended March 31, 2008, the Fund paid brokerage commissions of $26,941 to Wachovia Securities, LLC.
4. DISTRIBUTION PLANS
EIS serves as distributor of the Fund’s shares. The Fund has adopted Distribution Plans, as allowed by Rule 12b-1 of the 1940 Act, for each class of shares, except Class I. Under the Distribution Plans, distribution fees were paid at an annual rate of 0.30% of the average daily net assets for Class A shares and 1.00% of the average daily net assets for each of Class B and Class C shares.
For the six months ended March 31, 2008, EIS received $2,669 from the sale of Class A shares and $45, $17,668 and $150 in contingent deferred sales charges from redemptions of Class A, Class B and Class C shares, respectively.
5. INVESTMENT TRANSACTIONS
Cost of purchases and proceeds from sales of investment securities (excluding short-term securities) were $201,834,005 and $217,196,492, respectively, for the six months ended March 31, 2008.
During the six months ended March 31, 2008, the Fund loaned securities to certain brokers and earned $1,601 in affiliated income relating to securities lending activity which is included in income from affiliate on the Statement of Operations. At March 31, 2008, the value of securities on loan and the total value of collateral received for securities loaned amounted to $135,524,209 and $139,992,750, respectively.
On March 31, 2008, the aggregate cost of securities for federal income tax purposes was $633,365,521. The gross unrealized appreciation and depreciation on securities based on tax cost was $93,640,294 and $31,178,304, respectively, with a net unrealized appreciation of $62,461,990.
22
NOTES TO FINANCIAL STATEMENTS (unaudited) continued
6. INTERFUND LENDING
Pursuant to an Exemptive Order issued by the SEC, the Fund may participate in an interfund lending program with certain funds in the Evergreen fund family. This program allows the Fund to borrow from, or lend money to, other participating funds. During the six months ended March 31, 2008, the Fund did not participate in the interfund lending program.
7. EXPENSE REDUCTIONS
Through expense offset arrangements with ESC and the Fund’s custodian, a portion of fund expenses has been reduced.
8. DEFERRED TRUSTEES’ FEES
Each Trustee of the Fund may defer any or all compensation related to performance of their duties as a Trustee. The Trustees’ deferred balances are allocated to deferral accounts, which are included in the accrued expenses for the Fund. The investment performance of the deferral accounts is based on the investment performance of certain Evergreen funds. Any gains earned or losses incurred in the deferral accounts are reported in the Fund’s Trustees’ fees and expenses. At the election of the Trustees, the deferral account will be paid either in one lump sum or in quarterly installments for up to ten years.
9. FINANCING AGREEMENT
The Fund and certain other Evergreen funds share in an unsecured revolving credit commitment for temporary and emergency purposes, including the funding of redemptions, as permitted by each participating fund’s borrowing restrictions. Borrowings under this facility bear interest at 0.50% per annum above the Federal Funds rate. All of the participating funds are charged an annual commitment fee on the unused balance, which is allocated pro rata. The credit facility is for $100 million with an annual commitment fee of 0.08%. During the six months ended March 31, 2008, the Fund had no borrowings.
10. REGULATORY MATTERS AND LEGAL PROCEEDINGS
Pursuant to an administrative order issued by the SEC on September 19, 2007, EIMC, EIS, ESC (collectively, the “Evergreen Entities”), Wachovia Securities, LLC and the SEC have entered into an agreement settling allegations of (i) improper short-term trading arrangements in effect prior to May 2003 involving former officers and employees of EIMC and certain broker-dealers, (ii) insufficient systems for monitoring exchanges and enforcing exchange limitations as stated in certain funds’ prospectuses, and (iii) inadequate e-mail retention practices. Under the settlement, the Evergreen Entities were censured and have paid approximately $32 million in disgorgement and penalties. This amount, along with a fine assessed by the SEC against Wachovia Securities, LLC will be distributed pursuant to a plan to be developed by an independent distribution consultant and approved by the SEC. The Evergreen Entities neither admitted nor denied the allegations and findings set forth in its settlement with the SEC.
23
NOTES TO FINANCIAL STATEMENTS (unaudited) continued
In addition, the Evergreen funds and EIMC and certain of its affiliates are involved in various legal actions, including private litigation and class action lawsuits. EIMC does not expect that any of such legal actions currently pending or threatened will have a material adverse impact on the financial position or operations of any of the Evergreen funds or on EIMC’s ability to provide services to the Evergreen funds.
Although EIMC believes that none of the matters discussed above will have a material adverse impact on the Evergreen funds, there can be no assurance that these matters and any publicity surrounding or resulting from them will not result in reduced sales or increased redemptions of Evergreen fund shares, which could increase Evergreen fund transaction costs or operating expenses, or that they will not have other adverse consequences on the Evergreen funds.
11. NEW ACCOUNTING PRONOUNCEMENTS
In September 2006, FASB issued Statement of Financial Accounting Standards No. 157, Fair Value Measurements (“FAS 157”). FAS 157 establishes a single authoritative definition of fair value, establishes a framework for measuring fair value and expands disclosures about fair value measurements. FAS 157 applies to fair value measurements already required or permitted by existing standards. The change to current generally accepted accounting principles from the application of FAS 157 relates to the definition of fair value, the methods used to measure fair value, and the expanded disclosures about fair value measurements. Management of the Fund does not believe the adoption of FAS 157 will materially impact the financial statement amounts, however, additional disclosures may be required about the inputs used to develop the measurements and the effect of certain of the measurements on changes in net assets for the period. FAS 157 is effective for financial statements issued for fiscal years beginning after November 15, 2007 and interim periods within those fiscal years.
In March 2008, FASB issued Statement of Financial Accounting Standards No. 161, Disclosures about Derivative Instruments and Hedging Activities (“FAS 161”), an amendment of FASB Statement No. 133. FAS 161 requires enhanced disclosures about (a) how and why a fund uses derivative instruments, (b) how derivative instruments and hedging activities are accounted for, and (c) how derivative instruments and related hedging activities affect a fund’s financial position, financial performance, and cash flows. Management of the Fund does not believe the adoption of FAS 161 will materially impact the financial statement amounts, but will require additional disclosures. This will include qualitative and quantitative disclosures on derivative positions existing at period end and the effect of using derivatives during the reporting period. FAS 161 is effective for financial statements issued for fiscal years and interim periods beginning after November 15, 2008.
24
This page left intentionally blank
25
This page left intentionally blank
26
This page left intentionally blank
27
| TRUSTEES AND OFFICERS |
|
| TRUSTEES1 |
| Charles A. Austin III | | Investment Counselor, Anchor Capital Advisors, LLC. (investment advice); Director, The Andover |
| Trustee | | Companies (insurance); Trustee, Arthritis Foundation of New England; Former Director, The |
| DOB: 10/23/1934 | | Francis Ouimet Society (scholarship program); Former Director, Executive Vice President and |
| Term of office since: 1991 | | Treasurer, State Street Research & Management Company (investment advice) |
| Other directorships: None | | |
|
| K. Dun Gifford | | Chairman and President, Oldways Preservation and Exchange Trust (education); Trustee, |
| Trustee | | Chairman of the Finance Committee, Member of the Executive Committee, and Former |
| DOB: 10/23/1938 | | Treasurer, Cambridge College |
| Term of office since: 1974 | | |
| Other directorships: None | | |
|
| Dr. Leroy Keith, Jr. | | Managing Director, Almanac Capital Management (commodities firm); Trustee, Phoenix |
| Trustee | | Fund Complex; Director, Diversapack Co. (packaging company); Former Partner, Stonington |
| DOB: 2/14/1939 | | Partners, Inc. (private equity fund); Former Director, Obagi Medical Products Co.; Former |
| Term of office since: 1983 | | Director, Lincoln Educational Services |
| Other directorships: Trustee, | | |
| Phoenix Fund Complex (consisting | | |
| of 53 portfolios as of 12/31/2007) | | |
|
| Carol A. Kosel1 | | Former Consultant to the Evergreen Boards of Trustees; Former Vice President and Senior Vice |
| Trustee | | President, Evergreen Investments, Inc.; Former Treasurer, Evergreen Funds; Former Treasurer, |
| DOB: 12/25/1963 | | Vestaur Securities Fund |
| Term of office since: 2008 | | |
| Other directorships: None | | |
|
| Gerald M. McDonnell | | Former Manager of Commercial Operations, CMC Steel (steel producer) |
| Trustee | | |
| DOB: 7/14/1939 | | |
| Term of office since: 1988 | | |
| Other directorships: None | | |
|
| Patricia B. Norris | | President and Director of Buckleys of Kezar Lake, Inc. (real estate company); Former President |
| Trustee | | and Director of Phillips Pond Homes Association (home community); Former Partner, |
| DOB: 4/9/1948 | | PricewaterhouseCoopers, LLP (independent registered public accounting firm) |
| Term of office since: 2006 | | |
| Other directorships: None | | |
|
| William Walt Pettit | | Partner and Vice President, Kellam & Pettit, P.A. (law firm); Director, Superior Packaging Corp. |
| Trustee | | (packaging company); Member, Superior Land, LLC (real estate holding company), Member, |
| DOB: 8/26/1955 | | K&P Development, LLC (real estate development); Former Director, National Kidney Foundation |
| Term of office since: 1988 | | of North Carolina, Inc. (non-profit organization) |
| Other directorships: None | | |
|
| David M. Richardson | | President, Richardson, Runden LLC (executive recruitment advisory services); Director, J&M |
| Trustee | | Cumming Paper Co. (paper merchandising); Trustee, NDI Technologies, LLP (communications); |
| DOB: 9/19/1941 | | Former Consultant, AESC (The Association of Executive Search Consultants) |
| Term of office since: 1982 | | |
| Other directorships: None | | |
|
| Dr. Russell A. Salton III | | President/CEO, AccessOne MedCard, Inc. |
| Trustee | | |
| DOB: 6/2/1947 | | |
| Term of office since: 1984 | | |
| Other directorships: None | | |
|
28
| TRUSTEES AND OFFICERS continued |
|
| Michael S. Scofield | | Retired Attorney, Law Offices of Michael S. Scofield; Former Director and Chairman, Branded |
| Trustee | | Media Corporation (multi-media branding company) |
| DOB: 2/20/1943 | | |
| Term of office since: 1984 | | |
| Other directorships: None | | |
|
| Richard J. Shima | | Independent Consultant; Director, Hartford Hospital; Trustee, Greater Hartford YMCA; Former |
| Trustee | | Director, Trust Company of CT; Former Director, Old State House Association; Former Trustee, |
| DOB: 8/11/1939 | | Saint Joseph College (CT) |
| Term of office since: 1993 | | |
| Other directorships: None | | |
|
| Richard K. Wagoner, CFA2 | | Member and Former President, North Carolina Securities Traders Association; Member, Financial |
| Trustee | | Analysts Society |
| DOB: 12/12/1937 | | |
| Term of office since: 1999 | | |
| Other directorships: None | | |
|
| OFFICERS |
| Dennis H. Ferro3 | | Principal occupations: President and Chief Executive Officer, Evergreen Investment Company, |
| President | | Inc. and Executive Vice President, Wachovia Bank, N.A.; former Chief Investment Officer, |
| DOB: 6/20/1945 | | Evergreen Investment Company, Inc. |
| Term of office since: 2003 | | |
|
| Jeremy DePalma4 | | Principal occupations: Senior Vice President, Evergreen Investment Management Company, LLC; |
| Treasurer | | Former Vice President, Evergreen Investment Services, Inc.; Former Assistant Vice President, |
| DOB: 2/5/1974 | | Evergreen Investment Services, Inc. |
| Term of office since: 2005 | | |
|
| Michael H. Koonce4 | | Principal occupations: Senior Vice President and General Counsel, Evergreen Investment |
| Secretary | | Services, Inc.; Secretary, Senior Vice President and General Counsel, Evergreen Investment |
| DOB: 4/20/1960 | | Management Company, LLC and Evergreen Service Company, LLC; Senior Vice President and |
| Term of office since: 2000 | | Assistant General Counsel, Wachovia Corporation |
|
| Robert Guerin4 | | Principal occupations: Chief Compliance Officer, Evergreen Funds and Senior Vice President of |
| Chief Compliance Officer | | Evergreen Investments Co, Inc; Former Managing Director and Senior Compliance Officer, |
| DOB: 9/20/1965 | | Babson Capital Management LLC; Former Principal and Director, Compliance and Risk |
| Term of office since: 2007 | | Management, State Street Global Advisors; Former Vice President and Manager, Sales Practice |
| | | Compliance, Deutsche Asset Management. |
|
1 Each Trustee, except Mses. Kosel and Norris, serves until a successor is duly elected or qualified or until his or her death, resignation, retirement or removal from office. As new Trustees, Ms. Kosel’s and Ms. Norris’ initial terms end December 31, 2010 and June 30, 2009, respectively, at which times they may be re-elected by Trustees to serve until a successor is duly elected or qualified or until her death, resignation, retirement or removal from office by the Trustees. Each Trustee, except Ms. Kosel, oversaw 93 Evergreen funds as of December 31, 2007. Ms. Kosel became a Trustee on January 1, 2008. Correspondence for each Trustee may be sent to Evergreen Board of Trustees, P.O. Box 20083, Charlotte, NC 28202.
2 Mr. Wagoner is an “interested person” of the Fund because of his ownership of shares in Wachovia Corporation, the parent to the Fund’s investment advisor.
3 The address of the Officer is 401 S. Tryon Street, 20th Floor, Charlotte, NC 28288.
4 The address of the Officer is 200 Berkeley Street, Boston, MA 02116.
Additional information about the Fund’s Board of Trustees and Officers can be found in the Statement of Additional Information (SAI) and is available upon request without charge by calling 800.343.2898.
29
569842 rv4 04/2008
Evergreen Omega Fund
| table of contents |
| 1 | | LETTER TO SHAREHOLDERS |
| 4 | | FUND AT A GLANCE |
| 6 | | ABOUT YOUR FUND’S EXPENSES |
| 7 | | FINANCIAL HIGHLIGHTS |
| 12 | | SCHEDULE OF INVESTMENTS |
| 17 | | STATEMENT OF ASSETS AND LIABILITIES |
| 18 | | STATEMENT OF OPERATIONS |
| 19 | | STATEMENTS OF CHANGES IN NET ASSETS |
| 20 | | NOTES TO FINANCIAL STATEMENTS |
| 28 | | TRUSTEES AND OFFICERS |
This semiannual report must be preceded or accompanied by a prospectus of the Evergreen fund contained herein. The prospectus contains more complete information, including fees and expenses, and should be read carefully before investing or sending money.
The fund will file its complete schedule of portfolio holdings with the SEC for the first and third quarters of each fiscal year on Form N-Q. The fund’s Form N-Q will be available on the SEC’s Web site at http://www.sec.gov. In addition, the fund’s Form N-Q may be reviewed and copied at the SEC’s Public Reference Room in Washington, D.C. Information on the operation of the Public Reference Room may be obtained by calling 800.SEC.0330.
A description of the fund’s proxy voting policies and procedures, as well as information regarding how the fund voted proxies relating to portfolio securities during the most recent 12-month period ended June 30, is available by visiting our Web site at EvergreenInvestments.com or by visiting the SEC’s Web site at http://www.sec.gov. The fund’s proxy voting policies and procedures are also available without charge, upon request, by calling 800.343.2898.
| Mutual Funds: | | | | |
| NOT FDIC INSURED | | MAY LOSE VALUE | | NOT BANK GUARANTEED |
Evergreen InvestmentsSM is a service mark of Evergreen Investment Management Company, LLC.
Copyright 2008, Evergreen Investment Management Company, LLC.
Evergreen Investment Management Company, LLC is a subsidiary of Wachovia Corporation and is an affiliate of Wachovia Corporation’s other Broker Dealer subsidiaries.
Evergreen mutual funds are distributed by Evergreen Investment Services, Inc.
200 Berkeley Street, Boston, MA 02116
LETTER TO SHAREHOLDERS
May 2008
Dennis H. Ferro
President and Chief Executive Officer
Dear Shareholder:
We are pleased to provide the Semiannual Report for Evergreen Omega Fund for the six-month period ended March 31, 2008 (the “six-month period”).
Mounting evidence of a slowing economy undermined confidence in equities and credit-sensitive fixed income securities during the six-month period. Investors feared weakness in housing and problems in the subprime mortgage industry could pull the domestic economy into recession. Major financial institutions began to report substantial losses from their exposures to subprime mortgages and banks started to tighten their credit standards and to restrict their lending. Equity prices were buffeted by news of falling profits, weakening housing, slowing employment, rising inflationary pressures and growing credit problems. Stock valuations fell across all market capitalizations, investment styles and regions. With fears of a dramatic downturn hovering over the market, fixed income investors sought out the highest-quality securities and attempted to avoid credit risk. As a consequence, the prices of corporate bonds and many asset-backed securities fell, while Treasuries rallied in a general flight to quality. In this environment, the prices of gold, oil and other commodities surged while the U.S. dollar weakened further.
The U.S. economy showed clear signs of weakening over the six-month period. Problems in the credit markets led to declines in lending for ordinary consumer and commercial activity, accentuating the effects of declining home prices. Corporate profits, employment and other key economic indicators showed signs of deterioration. Gross Domestic Product growth slowed to just 0.6% both in the final quarter of 2007 and in the first quarter of 2008. To reinvigorate the economy
1
LETTER TO SHAREHOLDERS continued
and stimulate lending activity, the Federal Reserve Board (the “Fed”) became increasingly aggressive, taking a series of steps to pour liquidity into the financial system. Starting in September 2007 and continuing through April 2008, the Fed cut the key fed funds rate seven different times, lowering the influential short-term rate from 5.25% to 2%. In March 2008, the central bank also opened its lending facilities to securities firms as well as commercial banks and intervened to help JPMorgan Chase & Co. purchase the collapsing investment bank Bear Stearns Cos. Congress and the Bush administration, meanwhile, rushed through a $168 billion fiscal stimulus bill, which included tax rebate checks, in an effort to boost growth in the second half of 2008.
During the six-month period, the management teams of Evergreen’s growth-oriented equity funds maintained their pursuit of capital appreciation, consistent with the investment discipline and style of each fund. The manager of Evergreen Large Company Growth Fund and Evergreen Omega Fund focused on bottom-up, fundamental analysis in making individual stock selections. The portfolio manager supervising Evergreen Mid Cap Growth Fund and Evergreen Small-Mid Growth Fund, meanwhile, sought to balance each portfolio with exposure both to consistent growth companies and to more cyclically oriented corporations. At the same time, managers of Evergreen Growth Fund concentrated on opportunities among small cap growth companies with above-average earnings prospects and reasonable stock valuations. The portfolio manager of Evergreen Enhanced S&P 500® Fund, in turn, employed a largely quantitative discipline in choosing a portfolio of predominately large cap stocks from both the value and growth stock universes.
We believe the experiences in the capital markets during the six-month period have underscored the value of a well-diversified, long-term investment strategy to help soften the effects of volatility in any one market or asset class. As always, we encourage investors to maintain diversified investment portfolios in pursuit of their long-term investment goals.
2
LETTER TO SHAREHOLDERS continued
Please visit us at EvergreenInvestments.com for more information about our funds and other investment products available to you. Thank you for your continued support of Evergreen Investments.
Sincerely,
Dennis H. Ferro
President and Chief Executive Officer
Evergreen Investment Company, Inc.
Special Notice to Shareholders:
Please visit our Web site at EvergreenInvestments.com for statements from President and Chief Executive Officer, Dennis Ferro, regarding the firm’s recent settlement with the Securities and Exchange Commission (SEC) and prior settlement with the Financial Industry Regulatory Authority (FINRA).
3
FUND AT A GLANCE
as of March 31, 2008
MANAGEMENT TEAM
Investment Advisor:
• Evergreen Investment Management Company, LLC
Portfolio Manager:
• Aziz Hamzaogullari, CFA
CURRENT INVESTMENT STYLE

Source: Morningstar, Inc.
Morningstar’s style box is based on a portfolio date as of 3/31/2008.
The Equity style box placement is based on 10 growth and valuation measures for each fund holding and the median size of the companies in which the fund invests.
PERFORMANCE AND RETURNS
Portfolio inception date: 4/29/1968
| | | Class A | | Class B | | Class C | | Class I | | Class R |
| Class inception date | | 4/29/1968 | | 8/2/1993 | | 8/2/1993 | | 1/13/1997 | | 10/10/2003 |
|
| Nasdaq symbol | | EKOAX | | EKOBX | | EKOCX | | EOMYX | | EKORX |
|
| 6-month return with sales charge | | -18.16% | | -17.81% | | -14.35% | | N/A | | N/A |
|
| 6-month return w/o sales charge | | -13.17% | | -13.48% | | -13.48% | | -13.03% | | -13.24% |
|
| Average annual return* | | | | | | | | | | |
|
| 1-year with sales charge | | -5.19% | | -5.12% | | -1.12% | | N/A | | N/A |
|
| 1-year w/o sales charge | | 0.59% | | -0.13% | | -0.13% | | 0.90% | | 0.41% |
|
| 5-year | | 8.80% | | 9.03% | | 9.31% | | 10.41% | | 9.91% |
|
| 10-year | | 2.72% | | 2.59% | | 2.58% | | 3.62% | | 3.24% |
|
| Maximum sales charge | | 5.75% | | 5.00% | | 1.00% | | N/A | | N/A |
| | | Front-end | | CDSC | | CDSC | | | | |
|
* Adjusted for maximum applicable sales charge, unless noted.
Past performance is no guarantee of future results. The performance quoted represents past performance and current performance may be lower or higher. The investment return and principal value of an investment will fluctuate so that investors’ shares, when redeemed, may be worth more or less than their original cost. To obtain performance information current to the most recent month-end for Classes A, B, C or I, please go to EvergreenInvestments.com/fundperformance. Please call 1.800.847.5397 for the most recent month-end performance information for Class R. The performance of each class may vary based on differences in loads, fees and expenses paid by the shareholders investing in each class. Performance includes the reinvestment of income dividends and capital gain distributions. Performance shown does not reflect the deduction of taxes that a shareholder would pay on fund distributions or the redemption of fund shares.
Historical performance shown for Class R prior to its inception is based on the performance of Class A, the original class offered. The historical returns for Class R have not been adjusted to reflect the effect of its 12b-1 fee. The fund incurs a 12b-1 fee of 0.25% for Class A, 0.50% for Class R and 1.00% for Classes B and C. Class I does not pay a 12b-1 fee. If these fees had been reflected, returns for Class R would have been lower.
The advisor is waiving a portion of its advisory fee and reimbursing a portion of the 12b-1 fee for Class A. Had the fees not been waived or reimbursed, returns would have been lower.
4
FUND AT A GLANCE continued
LONG-TERM GROWTH
Comparison of a $10,000 investment in the Evergreen Omega Fund Class A shares versus a similar investment in the Russell 1000 Growth Index (Russell 1000 Growth) and the Consumer Price Index (CPI).
The Russell 1000 Growth is an unmanaged market index and does not include transaction costs associated with buying and selling securities, any mutual fund fees or expenses or any taxes. The CPI is a commonly used measure of inflation and does not represent an investment return. It is not possible to invest directly in an index.
Class I shares are only offered, subject to the minimum initial purchase requirements, in the following manner: (1) to investment advisory clients of EIMC (or its advisory affiliates), (2) to employer- or state-sponsored benefit plans, including but not limited to, retirement plans, defined benefit plans, deferred compensation plans, or savings plans, (3) to fee-based mutual fund wrap accounts, (4) through arrangements entered into on behalf of the Evergreen funds with certain financial services firms, (5) to certain institutional investors, and (6) to persons who owned Class Y shares in registered name in an Evergreen fund on or before December 31, 1994 or who owned shares of any SouthTrust fund in registered name as of March 18, 2005 or who owned shares of Vestaur Securities Fund as of May 20, 2005.
Class I shares are only available to institutional shareholders with a minimum of $1 million investment, which may be waived in certain situations.
Class R shares generally are available only to 401(k) plans, 457 plans, employer-sponsored 403(b) plans, profit sharing and money purchase pension plans, defined benefit plans and non-qualified deferred compensation plans.
The fund’s investment objective may be changed without a vote of the fund’s shareholders.
Foreign investments may contain more risk due to the inherent risks associated with changing political climates, foreign market instability and foreign currency fluctuations.
Mid cap securities may be subject to special risks associated with narrower product lines and limited financial resources compared to their large cap counterparts, and, as a result, mid cap securities may decline significantly in market downturns.
The stocks of smaller companies may be more volatile than those of larger companies due to the higher risk of failure.
All data is as of March 31, 2008, and subject to change.
5
ABOUT YOUR FUND’S EXPENSES
The Example below is intended to describe the fees and expenses borne by shareholders and the impact of those costs on your investment.
Example
As a shareholder of the fund, you incur two types of costs: (1) transaction costs, including sales charges (loads), redemption fees and exchange fees; and (2) ongoing costs, including management fees, distribution (12b-1) fees and other fund expenses. This Example is intended to help you understand your ongoing costs (in dollars) of investing in the fund and to compare these costs with the ongoing costs of investing in other mutual funds. The Example is based on an investment of $1,000 invested at the beginning of the period and held for the entire period from October 1, 2007 to March 31, 2008.
The example illustrates your fund’s costs in two ways:
- Actual expenses
The section in the table under the heading “Actual” provides information about actual account values and actual expenses. You may use the information in these columns, together with the amount you invested, to estimate the expenses that you paid over the period. Simply divide your account value by $1,000 (for example, an $8,600 account value divided by $1,000 = 8.6), then multiply the result by the number in the appropriate column for your share class, in the column entitled “Expenses Paid During Period” to estimate the expenses you paid on your account during this period.
- Hypothetical example for comparison purposes
The section in the table under the heading “Hypothetical (5% return before expenses)” provides information about hypothetical account values and hypothetical expenses based on the fund’s actual expense ratio and an assumed rate of return of 5% per year before expenses, which is not the fund’s actual return. The hypothetical account values and expenses may not be used to estimate the actual ending account balance or expenses you paid for the period. You may use this information to compare the ongoing costs of investing in the fund and other funds. To do so, compare this 5% hypothetical example with the 5% hypothetical examples that appear in the shareholder reports of the other funds.
Please note that the expenses shown in the table are meant to highlight your ongoing costs only and do not reflect any transactional costs, such as sales charges (loads), redemption fees or exchange fees. Therefore, the section in the table under the heading “Hypothetical (5% return before expenses)” is useful in comparing ongoing costs only, and will not help you determine the relative total costs of owning different funds. In addition, if these transactional costs were included, your costs would have been higher.
| | | Beginning | | Ending | | |
| | | Account | | Account | | Expenses |
| | | Value | | Value | | Paid During |
| | | 10/1/2007 | | 3/31/2008 | | Period* |
|
| Actual | | | | | | |
| Class A | | $ 1,000.00 | | $ 868.32 | | $ 6.40 |
| Class B | | $ 1,000.00 | | $ 865.21 | | $ 9.84 |
| Class C | | $ 1,000.00 | | $ 865.19 | | $ 9.84 |
| Class I | | $ 1,000.00 | | $ 869.74 | | $ 5.19 |
| Class R | | $ 1,000.00 | | $ 867.63 | | $ 7.56 |
| Hypothetical | | | | | | |
| (5% return | | | | | | |
| before expenses) | | | | | | |
| Class A | | $ 1,000.00 | | $ 1,018.15 | | $ 6.91 |
| Class B | | $ 1,000.00 | | $ 1,014.45 | | $ 10.63 |
| Class C | | $ 1,000.00 | | $ 1,014.45 | | $ 10.63 |
| Class I | | $ 1,000.00 | | $ 1,019.45 | | $ 5.60 |
| Class R | | $ 1,000.00 | | $ 1,016.90 | | $ 8.17 |
|
* For each class of the Fund, expenses are equal to the annualized expense ratio of each class (1.37% for Class A, 2.11% for Class B, 2.11% for Class C, 1.11% for Class I and 1.62% for Class R), multiplied by the average account value over the period, multiplied by 183 / 366 days.
6
FINANCIALHIGHLIGHTS
(For a share outstanding throughout each period)
| | | | | | | | | | | | | |
| | | Six Months Ended | | Year Ended September 30, |
| | March 31, 2008 | |
|
| CLASS A | | (unaudited) | | 2007 | | 2006 | | 2005 | | 2004 | | 2003 |
|
| Net asset value, beginning of period | | $ 31.44 | | $ 25.60 | | $ 25.54 | | $ 23.00 | | $ 21.07 | | $ 16.69 |
|
| Income from investment operations | | | | | | | | | | | | |
| Net investment income (loss) | | 0.011 | | (0.11)1 | | (0.15)1 | | (0.12)1 | | (0.22) | | (0.20)1 |
Net realized and unrealized gains
or losses on investments | | (4.15) | | 5.95 | | 0.21 | | 2.66 | | 2.15 | | 4.58 |
| |
|
| Total from investment operations | | (4.14) | | 5.84 | | 0.06 | | 2.54 | | 1.93 | | 4.38 |
|
| Net asset value, end of period | | $ 27.30 | | $ 31.44 | | $ 25.60 | | $ 25.54 | | $ 23.00 | | $ 21.07 |
|
| Total return2 | | (13.17%) | | 22.81% | | 0.23% | | 11.04% | | 9.16% | | 26.24% |
|
| Ratios and supplemental data | | | | | | | | | | | | |
| Net assets, end of period (thousands) | | $495,433 | | $595,296 | | $520,421 | | $449,639 | | $485,315 | | $441,808 |
| Ratios to average net assets | | | | | | | | | | | | |
| Expenses including waivers/reimbursements | | | | | | | | | | | | |
| but excluding expense reductions | | 1.37%3 | | 1.40% | | 1.42% | | 1.44% | | 1.49% | | 1.67% |
| Expenses excluding waivers/reimbursements | | | | | | | | | | | | |
| and expense reductions | | 1.47%3 | | 1.46% | | 1.51% | | 1.48% | | 1.51% | | 1.67% |
| Net investment income (loss) | | 0.06%3 | | (0.38%) | | (0.57%) | | (0.49%) | | (0.92%) | | (1.11%) |
| Portfolio turnover rate | | 21% | | 23% | | 128% | | 134% | | 159% | | 206% |
|
1 Net investment income (loss) per share is based on average shares outstanding during the period.
2 Excluding applicable sales charges
3 Annualized
See Notes to Financial Statements
7
FINANCIALHIGHLIGHTS
(For a share outstanding throughout each period)
| | | | | | | | | | | | | |
| | | Six Months Ended | | Year Ended September 30, |
| | March 31, 2008 | |
|
| CLASS B | | (unaudited) | | 2007 | | 2006 | | 2005 | | 2004 | | 2003 |
|
| Net asset value, beginning of period | | $ 27.45 | | $ 22.51 | | $ 22.62 | | $ 20.51 | | $ 18.92 | | $ 15.10 |
|
| Income from investment operations | | | | | | | | | | | | |
| Net investment income (loss) | | (0.09)1 | | (0.27)1 | | (0.29)1 | | (0.25)1 | | (0.34)1 | | (0.30)1 |
Net realized and unrealized gains
or losses on investments | | (3.61) | | 5.21 | | 0.18 | | 2.36 | | 1.93 | | 4.12 |
| |
|
| Total from investment operations | | (3.70) | | 4.94 | | (0.11) | | 2.11 | | 1.59 | | 3.82 |
|
| Net asset value, end of period | | $ 23.75 | | $ 27.45 | | $ 22.51 | | $ 22.62 | | $ 20.51 | | $ 18.92 |
|
| Total return2 | | (13.48%) | | 21.95% | | (0.49%) | | 10.29% | | 8.40% | | 25.30% |
|
| Ratios and supplemental data | | | | | | | | | | | | |
| Net assets, end of period (thousands) | | $113,214 | | $183,129 | | $311,011 | | $437,122 | | $542,897 | | $578,129 |
| Ratios to average net assets | | | | | | | | | | | | |
| Expenses including waivers/reimbursements | | | | | | | | | | | | |
| but excluding expense reductions | | 2.11%3 | | 2.11% | | 2.12% | | 2.14% | | 2.19% | | 2.39% |
| Expenses excluding waivers/reimbursements | | | | | | | | | | | | |
| and expense reductions | | 2.17%3 | | 2.15% | | 2.21% | | 2.18% | | 2.21% | | 2.39% |
| Net investment income (loss) | | (0.70%)3 | | (1.08%) | | (1.27%) | | (1.17%) | | (1.62%) | | (1.83%) |
| Portfolio turnover rate | | 21% | | 23% | | 128% | | 134% | | 159% | | 206% |
|
1 Net investment income (loss) per share is based on average shares outstanding during the period.
2 Excluding applicable sales charges
3 Annualized
See Notes to Financial Statements
8
FINANCIALHIGHLIGHTS
(For a share outstanding throughout each period)
| | | | | | | | | | | | | |
| | | Six Months Ended | | Year Ended September 30, |
| | March 31, 2008 | |
|
| CLASS C | | (unaudited) | | 2007 | | 2006 | | 2005 | | 2004 | | 2003 |
|
| Net asset value, beginning of period | | $ 27.52 | | $ 22.57 | | $ 22.67 | | $ 20.57 | | $ 18.97 | | $ 15.14 |
|
| Income from investment operations | | | | | | | | | | | | |
| Net investment income (loss) | | (0.09)1 | | (0.27)1 | | (0.29)1 | | (0.25)1 | | (0.34)1 | | (0.30)1 |
Net realized and unrealized gains
or losses on investments | | (3.62) | | 5.22 | | 0.19 | | 2.35 | | 1.94 | | 4.13 |
| |
|
| Total from investment operations | | (3.71) | | 4.95 | | (0.10) | | 2.10 | | 1.60 | | 3.83 |
|
| Net asset value, end of period | | $ 23.81 | | $ 27.52 | | $ 22.57 | | $ 22.67 | | $ 20.57 | | $ 18.97 |
|
| Total return2 | | (13.48%) | | 21.93% | | (0.44%) | | 10.21% | | 8.43% | | 25.30% |
|
| Ratios and supplemental data | | | | | | | | | | | | |
| Net assets, end of period (thousands) | | $44,143 | | $54,982 | | $64,042 | | $92,223 | | $128,964 | | $133,551 |
| Ratios to average net assets | | | | | | | | | | | | |
| Expenses including waivers/reimbursements | | | | | | | | | | | | |
| but excluding expense reductions | | 2.11%3 | | 2.11% | | 2.12% | | 2.14% | | 2.19% | | 2.39% |
| Expenses excluding waivers/reimbursements | | | | | | | | | | | | |
| and expense reductions | | 2.17%3 | | 2.15% | | 2.21% | | 2.18% | | 2.21% | | 2.39% |
| Net investment income (loss) | | (0.68%)3 | | (1.09%) | | (1.27%) | | (1.15%) | | (1.62%) | | (1.83%) |
| Portfolio turnover rate | | 21% | | 23% | | 128% | | 134% | | 159% | | 206% |
|
1 Net investment income (loss) per share is based on average shares outstanding during the period.
2 Excluding applicable sales charges
3 Annualized
See Notes to Financial Statements
9
FINANCIALHIGHLIGHTS
(For a share outstanding throughout each period)
| | | | | | | | | | | | | |
| | | Six Months Ended | | Year Ended September 30, |
| | March 31, 2008 | |
|
| CLASS I | | (unaudited) | | 2007 | | 2006 | | 2005 | | 2004 | | 2003 |
|
| Net asset value, beginning of period | | $ 32.32 | | $ 26.25 | | $ 26.10 | | $ 23.44 | | $ 21.40 | | $ 16.91 |
|
| Income from investment operations | | | | | | | | | | | | |
| Net investment income (loss) | | 0.051 | | (0.03)1 | | (0.08)1 | | (0.04)1 | | (0.15) | | (0.16)1 |
Net realized and unrealized gains
or losses on investments | | (4.26) | | 6.10 | | 0.23 | | 2.70 | | 2.19 | | 4.65 |
| |
|
| Total from investment operations | | (4.21) | | 6.07 | | 0.15 | | 2.66 | | 2.04 | | 4.49 |
|
| Net asset value, end of period | | $ 28.11 | | $ 32.32 | | $ 26.25 | | $ 26.10 | | $ 23.44 | | $ 21.40 |
|
| Total return | | (13.03%) | | 23.12% | | 0.57% | | 11.35% | | 9.53% | | 26.55% |
|
| Ratios and supplemental data | | | | | | | | | | | | |
| Net assets, end of period (thousands) | | $13,714 | | $16,503 | | $16,344 | | $10,526 | | $15,127 | | $13,913 |
| Ratios to average net assets | | | | | | | | | | | | |
| Expenses including waivers/reimbursements | | | | | | | | | | | | |
| but excluding expense reductions | | 1.11%2 | | 1.11% | | 1.12% | | 1.14% | | 1.19% | | 1.39% |
| Expenses excluding waivers/reimbursements | | | | | | | | | | | | |
| and expense reductions | | 1.17%2 | | 1.15% | | 1.21% | | 1.18% | | 1.21% | | 1.39% |
| Net investment income (loss) | | 0.32%2 | | (0.09%) | | (0.30%) | | (0.15%) | | (0.62%) | | (0.83%) |
| Portfolio turnover rate | | 21% | | 23% | | 128% | | 134% | | 159% | | 206% |
|
1 Net investment income (loss) per share is based on average shares outstanding during the period.
2 Annualized
See Notes to Financial Statements
10
FINANCIALHIGHLIGHTS
(For a share outstanding throughout each period)
| | | | | | | | | | | |
| | | Six Months Ended | | Year Ended September 30, |
| | March 31, 2008 | |
|
| CLASS R | | (unaudited) | | 2007 | | 2006 | | 2005 | | 20041 |
|
| Net asset value, beginning of period | | $31.20 | | $25.47 | | $25.46 | | $22.97 | | $22.31 |
|
| Income from investment operations | | | | | | | | | | |
| Net investment income (loss) | | (0.04) | | (0.14)2 | | (0.19)2 | | (0.24)2 | | (0.22)2 |
Net realized and unrealized gains
or losses on investments | | (4.09) | | 5.87 | | 0.20 | | 2.73 | | 0.88 |
| |
|
| Total from investment operations | | (4.13) | | 5.73 | | 0.01 | | 2.49 | | 0.66 |
|
| Net asset value, end of period | | $27.07 | | $31.20 | | $25.47 | | $25.46 | | $22.97 |
|
| Total return | | (13.24%) | | 22.50% | | 0.04% | | 10.84% | | 2.96% |
|
| Ratios and supplemental data | | | | | | | | | | |
| Net assets, end of period (thousands) | | $ 57 | | $ 63 | | $ 445 | | $ 385 | | $ 7 |
| Ratios to average net assets | | | | | | | | | | |
Expenses including waivers/reimbursements
but excluding expense reductions | | 1.62%3 | | 1.61% | | 1.62% | | 1.63% | | 1.64%3 |
Expenses excluding waivers/reimbursements
and expense reductions | | 1.68%3 | | 1.65% | | 1.71% | | 1.67% | | 1.66%3 |
| Net investment income (loss) | | (0.19%)3 | | (0.53%) | | (0.75%) | | (0.98%) | | (1.00%)3 |
| Portfolio turnover rate | | 21% | | 23% | | 128% | | 134% | | 159% |
|
1 For the period from October 10, 2003 (commencem ent of class operations), to September 30, 2004.
2 Net investment income (loss) per share is based on average shares outstanding during the period.
3 Annualized
See Notes to Financial Statements
11
SCHEDULE OF INVESTMENTS
March 31, 2008 (unaudited)
| | | | | | | Shares | | Value |
|
| COMMON STOCKS 99.2% | | | | | | |
| CONSUMER DISCRETIONARY 17.7% | | | | |
| Hotels, Restaurants & Leisure 0.9% | | | | |
| Carnival Corp. | | | | | | 151,381 | | $ 6,127,903 |
| |
|
| Internet & Catalog Retail 8.4% | | | | |
| Amazon.com, Inc. * (p) | | | | 570,192 | | 40,654,690 |
| Blue Nile, Inc. * (p) | | | | | | 280,200 | | 15,172,830 |
| |
|
| | | | | | | | | 55,827,520 |
| |
|
| Media 2.6% | | | | | | | | |
| Omnicom Group, Inc. * | | | | 392,180 | | 17,326,512 |
| |
|
| Multi-line Retail 1.2% | | | | | | |
| Target Corp. | | | | | | 162,502 | | 8,235,601 |
| |
|
| Specialty Retail 2.2% | | | | | | |
| Best Buy Co., Inc. | | | | | | 170,752 | | 7,079,378 |
| Home Depot, Inc. (p) | | | | 260,850 | | 7,295,975 |
| |
|
| | | | | | | | | 14,375,353 |
| |
|
| Textiles, Apparel & Luxury Goods 2.4% | | | | |
| Timberland Co., Class A * (p) | | | | 1,185,500 | | 16,276,915 |
| |
|
| CONSUMER STAPLES 7.9% | | | | | | |
| Beverages 1.3% | | | | | | |
| Coca-Cola Co. | | | | | | 135,843 | | 8,268,764 |
| |
|
| Food & Staples Retailing 0.7% | | | | |
| Wal-Mart Stores, Inc. | | | | 39,343 | | 2,072,589 |
| Whole Foods Market, Inc. * (p) | | | | 83,400 | | 2,749,698 |
| |
|
| | | | | | | | | 4,822,287 |
| |
|
| Food Products 1.6% | | | | | | |
| McCormick & Co., Inc. * | | | | 282,100 | | 10,429,237 |
| |
|
| Household Products 4.3% | | | | | | |
| Clorox Co. | | | | | | 270,100 | | 15,298,464 |
| Procter & Gamble Co. | | | | 194,291 | | 13,613,970 |
| |
|
| | | | | | | | | 28,912,434 |
| |
|
| ENERGY 1.3% | | | | | | | | |
| Oil, Gas & Consumable Fuels 1.3% | | | | |
| Chevron Corp. | | | | | | 52,700 | | 4,498,472 |
| ConocoPhillips * | | | | | | 54,440 | | 4,148,872 |
| |
|
| | | | | | | | | 8,647,344 |
| |
|
| FINANCIALS 10.1% | | | | | | |
| Capital Markets 3.1% | | | | | | |
| Legg Mason, Inc. * | | | | | | 366,900 | | 20,539,062 |
| |
|
| Consumer Finance 1.9% | | | | | | |
| Visa, Inc., Class A * | | | | 207,800 | | 12,958,408 |
| |
|
See Notes to Financial Statements
12
SCHEDULE OF INVESTMENTS continued
March 31, 2008 (unaudited)
| | | | | | | Shares | | Value |
|
| COMMON STOCKS continued | | | | | | |
| FINANCIALS continued | | | | | | | | |
| Diversified Financial Services 1.0% | | | | |
| Citigroup, Inc. * | | | | | | 301,204 | | $ 6,451,790 |
| |
|
| Insurance 4.1% | | | | | | | | |
| Marsh & McLennan Cos. * | | | | | | 1,124,492 | | 27,381,380 |
| |
|
| HEALTH CARE 21.9% | | | | | | | | |
| Biotechnology 5.9% | | | | | | | | |
| Amgen, Inc. * | | | | | | 757,945 | | 31,666,942 |
| Biogen Idec, Inc. * | | | | | | 125,625 | | 7,749,806 |
| |
|
| | | | | | | | | 39,416,748 |
| |
|
| Health Care Equipment & Supplies 7.0% | | | | |
| Medtronic, Inc. * | | | | | | 469,015 | | 22,686,255 |
| St. Jude Medical, Inc. * | | | | | | 147,003 | | 6,349,060 |
| Zimmer Holdings, Inc. * | | | | | | 229,256 | | 17,849,872 |
| |
|
| | | | | | | | | 46,885,187 |
| |
|
| Health Care Providers & Services | | 0.6% | | | | |
| WellPoint, Inc. * | | | | | | 82,800 | | 3,653,964 |
| |
|
| Pharmaceuticals 8.4% | | | | | | | | |
| Bristol-Myers Squibb Co. | | | | | | 725,521 | | 15,453,597 |
| Novartis AG, ADR * (p) | | | | | | 663,900 | | 34,011,597 |
| Pfizer, Inc. | | | | | | 321,991 | | 6,739,272 |
| |
|
| | | | | | | | | 56,204,466 |
| |
|
| INDUSTRIALS 8.1% | | | | | | | | |
| Air Freight & Logistics 3.9% | | | | | | | | |
| Expeditors International of Washington, Inc. * | | 502,661 | | 22,710,224 |
| United Parcel Service, Inc., Class B * | | | | 44,300 | | 3,234,786 |
| |
|
| | | | | | | | | 25,945,010 |
| |
|
| Commercial Services & Supplies 3.2% | | | | |
| Cintas Corp. | | | | | | 742,800 | | 21,199,512 |
| |
|
| Industrial Conglomerates 1.0% | | | | | | |
| Tyco International, Ltd. | | | | | | 149,856 | | 6,601,157 |
| |
|
| INFORMATION TECHNOLOGY 32.2% | | | | |
| Communications Equipment 7.0% | | | | |
| Cisco Systems, Inc. * | | | | | | 749,627 | | 18,058,514 |
| QUALCOMM, Inc. | | | | | | 696,941 | | 28,574,581 |
| |
|
| | | | | | | | | 46,633,095 |
| |
|
| Computers & Peripherals 2.8% | | | | | | |
| Avid Technology, Inc. * (p) | | | | | | 169,300 | | 4,120,762 |
| Dell, Inc. * | | | | | | 723,512 | | 14,412,359 |
| |
|
| | | | | | | | | 18,533,121 |
| |
|
See Notes to Financial Statements
13
SCHEDULE OF INVESTMENTS continued
March 31, 2008 (unaudited)
| | | | | | | Shares | | Value |
|
| |
| COMMON STOCKS continued | | | | |
| INFORMATION TECHNOLOGY continued | | | | |
| Internet Software & Services 1.4% | | | | |
| Google, Inc., Class A * | | | | | | 22,235 | | $ 9,793,851 |
| |
|
| IT Services 1.9% | | | | | | | | |
| Automatic Data Processing, Inc. * | | | | 303,192 | | 12,852,309 |
| |
|
| Semiconductors & Semiconductor Equipment 9.5% | | | | |
| Altera Corp. * | | | | | | 1,941,387 | | 35,779,762 |
| Intel Corp. | | | | | | 516,561 | | 10,940,762 |
| KLA-Tencor Corp. | | | | | | 70,217 | | 2,605,051 |
| Linear Technology Corp. (p) | | | | 257,700 | | 7,908,813 |
| Texas Instruments, Inc. * | | | | 210,986 | | 5,964,574 |
| |
|
| | | | | | | | | 63,198,962 |
| |
|
| Software 9.6% | | | | | | | | |
| FactSet Research Systems, Inc. * (p) | | | | 335,900 | | 18,094,933 |
| Microsoft Corp. | | | | | | 724,706 | | 20,567,156 |
| Oracle Corp. * | | | | | | 1,287,731 | | 25,188,019 |
| |
|
| | | | | | | | | 63,850,108 |
| |
|
| Total Common Stocks (cost $666,982,341) | | | | 661,348,000 |
| | |
|
|
| | | | | | | Principal | | |
| | | | | | | Amount | | Value |
|
| |
| SHORT-TERM INVESTMENTS 11.7% | | | | |
| CORPORATE BONDS 1.9% | | | | | | |
| Consumer Finance 0.7% | | | | | | |
| Carrera Capital Finance, LLC, FRN, SIV, 2.58%, 05/27/2008 (pp) + | | $ 3,000,000 | | 2,993,670 |
| Toyota Motor Credit Corp., FRN, 2.13%, 05/08/2008 (pp) | | 2,000,000 | | 1,999,692 |
| |
|
| | | | | | | | | 4,993,362 |
| |
|
| Diversified Financial Services 1.2% | | | | |
| Premier Asset Collateralized, LLC, FRN, SIV, 2.80%, 05/15/2008 (pp) + | | 3,000,000 | | 2,996,394 |
| Sigma Finance, Inc., FRN, SIV, 2.34%, 06/16/2008 (pp) + | | 5,000,000 | | 4,870,500 |
| |
|
| | | | | | | | | 7,866,894 |
| |
|
| REPURCHASE AGREEMENTS ^ 4.7% | | | | |
| Banc of America Securities LLC, 3.07%, dated 03/31/2008, maturing 04/01/2008, | | | | |
| maturity value $4,720,403 (pp) (1) | | 4,720,000 | | 4,720,000 |
| BNP Paribas Securities, Inc., 3.10%, dated 03/31/2008, maturing 04/01/2008, | | | | |
| maturity value $5,588,481 (pp) (2) | | 5,588,000 | | 5,588,000 |
| Credit Suisse First Boston LLC, 3.15%, dated 03/31/2008, maturing 04/01/2008, | | | | |
| maturity value $1,000,088 (pp) (3) | | 1,000,000 | | 1,000,000 |
| Dresdner Kleinwort Wasserstein Securities, LLC, 3.10%, dated 03/31/2008, | | | | |
| maturing 04/01/2008, maturity value $5,375,463 (pp) (4) | | 5,375,000 | | 5,375,000 |
| Greenwich Capital Markets, Inc., 3.10%, dated 03/31/2008, maturing | | | | |
| 04/01/2008, maturity value $6,000,517 (pp) (5) | | 6,000,000 | | 6,000,000 |
See Notes to Financial Statements
14
SCHEDULE OF INVESTMENTS continued
March 31, 2008 (unaudited)
| | | | | Principal | | |
| | | | | Amount | | Value |
|
| |
| SHORT-TERM INVESTMENTS continued | | | | |
| REPURCHASE AGREEMENTS ^ continued | | | | |
| JPMorgan Securities, Inc., 3.07%, dated 03/31/2008, maturing 04/01/2008, | | | | |
| maturity value $3,428,292 (pp) (6) | | $ 3,428,000 | | $ 3,428,000 |
| Merrill Lynch Pierce Fenner & Smith, Inc., 3.10%, dated 03/31/2008, maturing | | | | |
| 04/01/2008, maturity value $5,000,431 (pp) (7) | | 5,000,000 | | 5,000,000 |
| |
|
| | | | | | | 31,111,000 |
| | |
|
|
| | | | | Shares | | Value |
|
| |
| MUTUAL FUND SHARES 5.1% | | | | |
| BGI Prime Money Market Fund, Premium Shares, 3.15% (pp) q | | 12,083,575 | | 12,083,575 |
| BlackRock Liquidity TempFund, Institutional Class, 3.25% (pp) q | | 4,000,000 | | 4,000,000 |
| Evergreen Institutional Money Market Fund, Class I, 3.27% (pp) q ø | | 10,000,000 | | 10,000,000 |
| Evergreen Institutional U.S. Government Money Market Fund, | | | | |
| Class I, 2.24% q ø | | | | 2,047,286 | | 2,047,286 |
| Morgan Stanley Institutional Liquidity Fund Money Market Portfolio, | | | | |
| Institutional Class, 3.31% (pp) q | | 6,000,000 | | 6,000,000 |
| |
|
| | | | | | | 34,130,861 |
| |
|
| Total Short-Term Investments (cost $78,241,779) | | | | 78,102,117 |
| |
|
| Total Investments (cost $745,224,120) 110.9% | | | | 739,450,117 |
| Other Assets and Liabilities (10.9%) | | | | (72,888,918) |
| |
|
| Net Assets 100.0% | | | | | | $ 666,561,199 |
| |
|
| * | | Non-income producing security |
| (p) | | All or a portion of this security is on loan. |
| (pp) | | All or a portion of this security represents investment of cash collateral received from securities on loan. |
| + | | Security is deemed illiquid and is valued using market quotations when readily available, unless otherwise noted. |
| q | | Rate shown is the 7-day annualized yield at period end. |
| ø | | Evergreen Investment Management Company, LLC is the investment advisor to both the Fund and the money market |
| | | fund. | | |
| ^ | | Collateral is pooled with the collateral of other Evergreen funds and allocated on a pro rata basis consisting of: |
| | | (1) | | investment grade corporate bonds, 2.88% to 8.60%, 10/15/2008 to 06/01/2065, value including accrued |
| | | | | interest is $4,814,400. |
| | | (2) | | investment grade corporate bonds, 5.30% to 8.25%, 10/28/2015 to 06/01/2032, value including accrued |
| | | | | interest is $5,699,760. |
| | | (3) | | investment grade corporate bonds, 7.375% to 8.00%, 06/15/2010 to 03/15/2038, value including accrued |
| | | | | interest is $1,020,000. |
| | | (4) | | investment grade corporate bonds, 5.70% to 8.75%, 02/15/2017 to 03/01/2031, value including accrued |
| | | | | interest is $299,818; high grade asset-backed securities 2.97% to 3.41%, 05/25/2035 to 08/25/2046, value |
| | | | | including accrued interest is $3,259,614; high grade CMOs, 3.21% to 5.22%, 07/15/2035 to 08/25/2046, |
| | | | | value including accrued interest is $1,923,296. |
| | | (5) | | agency mortgage-backed security, 5.00%, 03/01/2038, value including accrued interest is $6,120,149. |
| | | (6) | | investment grade commercial paper, 0.02% to 0.19%, 04/01/2008 to 06/20/2008, value including accrued |
| | | | | interest is $3,496,642. |
| | | (7) | | investment grade corporate bonds, 0.00% to 7.15%, 08/15/2013 to 06/01/2037, value including accrued |
| | | | | interest is $5,100,014. |
See Notes to Financial Statements
15
SCHEDULE OF INVESTMENTS continued
March 31, 2008 (unaudited)
| Summary of Abbreviations |
| ADR | | American Depository Receipt |
| CMO | | Collateralized Mortgage Obligation |
| FRN | | Floating Rate Note |
| SIV | | Structured Investment Vehicle |
| The following table shows the percent of total long-term investments by sector as of March 31, 2008: |
| |
| Information Technology | | 32.5% | |
| Health Care | | 22.1% | |
| Consumer Discretionary | | 17.9% | |
| Financials | | 10.2% | |
| Industrials | | 8.1% | |
| Consumer Staples | | 7.9% | |
| Energy | | 1.3% | |
| |
| |
| | | 100.0% | |
| | |
| |
See Notes to Financial Statements
16
STATEMENT OF ASSETS AND LIABILITIES
March 31, 2008 (unaudited)
| Assets | | |
| Investments in securities, at value (cost $733,176,834) including $74,935,322 of securities | | |
| loaned | | $ 727,402,831 |
| Investments in affiliated money market funds, at value (cost $12,047,286) | | 12,047,286 |
|
| Total investments | | 739,450,117 |
| Receivable for securities sold | | 3,325,502 |
| Receivable for Fund shares sold | | 117,091 |
| Dividends receivable | | 1,218,174 |
| Receivable for securities lending income | | 95,510 |
| Receivable from investment advisor | | 5,182 |
| Prepaid expenses and other assets | | 20,937 |
|
| Total assets | | 744,232,513 |
|
| Liabilities | | |
| Payable for Fund shares redeemed | | 1,134,134 |
| Payable for securities on loan | | 76,194,493 |
| Due to related parties | | 86,177 |
| Printing and postage expenses payable | | 139,060 |
| Accrued expenses and other liabilities | | 117,450 |
|
| Total liabilities | | 77,671,314 |
|
| Net assets | | $ 666,561,199 |
|
| Net assets represented by | | |
| Paid-in capital | | $ 1,068,044,790 |
| Undistributed net investment loss | | (531,072) |
| Accumulated net realized losses on investments | | (395,178,516) |
| Net unrealized losses on investments | | (5,774,003) |
|
| Total net assets | | $ 666,561,199 |
|
| Net assets consists of | | |
| Class A | | $ 495,432,982 |
| Class B | | 113,214,316 |
| Class C | | 44,142,901 |
| Class I | | 13,713,939 |
| Class R | | 57,061 |
|
| Total net assets | | $ 666,561,199 |
|
| Shares outstanding (unlimited number of shares authorized) | | |
| Class A | | 18,144,511 |
| Class B | | 4,766,590 |
| Class C | | 1,853,731 |
| Class I | | 487,891 |
| Class R | | 2,108 |
|
| Net asset value per share | | |
| Class A | | $ 27.30 |
| Class A — Offering price (based on sales charge of 5.75%) | | $ 28.97 |
| Class B | | $ 23.75 |
| Class C | | $ 23.81 |
| Class I | | $ 28.11 |
| Class R | | $ 27.07 |
|
See Notes to Financial Statements
17
STATEMENT OF OPERATIONS
Six Months Ended March 31, 2008 (unaudited)
| Investment income | | |
| Dividends (net of foreign withholding taxes of $149,189) | | $ 5,090,997 |
| Securities lending | | 217,193 |
| Income from affiliate | | 89,242 |
|
| Total investment income | | 5,397,432 |
|
| Expenses | | |
| Advisory fee | | 1,971,495 |
| Distribution Plan expenses | | |
| Class A | | 823,386 |
| Class B | | 722,730 |
| Class C | | 247,811 |
| Class R | | 152 |
| Administrative services fee | | 378,186 |
| Transfer agent fees | | 1,856,768 |
| Trustees’ fees and expenses | | 8,253 |
| Printing and postage expenses | | 86,399 |
| Custodian and accounting fees | | 97,930 |
| Registration and filing fees | | 23,951 |
| Professional fees | | 27,902 |
| Other | | 10,433 |
|
| Total expenses | | 6,255,396 |
| Less: Expense reductions | | (6,768) |
| Fee waivers and expense reimbursements | | (368,577) |
|
| Net expenses | | 5,880,051 |
|
| Net investment loss | | (482,619) |
|
| Net realized and unrealized gains or losses on investments | | |
| Net realized gains on investments | | 62,379,863 |
| Net change in unrealized gains or losses on investments | | (168,657,391) |
|
| Net realized and unrealized gains or losses on investments | | (106,277,528) |
|
| Net decrease in net assets resulting from operations | | $ (106,760,147) |
|
See Notes to Financial Statements
18
STATEMENTS OF CHANGES IN NET ASSETS
| | | Six Months Ended | | | | |
| | | March 31, 2008 | | Year Ended |
| | | (unaudited) | | September 30, 2007 |
|
| Operations | | | | | | | | |
| Net investment loss | | $ (482,619) | | $ (5,428,388) |
| Net realized gains on investments | | | | 62,379,863 | | | | 63,903,942 |
| Net change in unrealized gains or losses | | | | | | | | |
| on investments | | | | (168,657,391) | | | | 120,158,196 |
|
| Net increase (decrease) in net assets | | | | | | | | |
| resulting from operations | | | | (106,760,147) | | | | 178,633,750 |
|
| | | Shares | | | | Shares | | |
| Capital share transactions | | | | | | | | |
| Proceeds from shares sold | | | | | | | | |
| Class A | | 230,174 | | 6,856,608 | | 1,059,015 | | 30,125,249 |
| Class B | | 93,131 | | 2,380,213 | | 257,700 | | 6,387,112 |
| Class C | | 78,424 | | 1,968,097 | | 67,308 | | 1,672,566 |
| Class I | | 31,191 | | 964,122 | | 67,559 | | 1,979,036 |
| Class R | | 301 | | 8,764 | | 3,939 | | 107,140 |
|
| | | | | 12,177,804 | | | | 40,271,103 |
|
| Automatic conversion of Class B shares | | | | | | | | |
| to Class A shares | | | | | | | | |
| Class A | | 1,155,711 | | 34,438,531 | | 3,636,390 | | 102,963,002 |
| Class B | | (1,325,534) | | (34,438,531) | | (4,150,240) | | (102,963,002) |
|
| | | | | 0 | | | | 0 |
|
| Payment for shares redeemed | | | | | | | | |
| Class A | | (2,178,086) | | (64,188,538) | | (6,086,657) | | (172,896,099) |
| Class B | | (672,850) | | (17,316,483) | | (3,249,468) | | (80,227,227) |
| Class C | | (222,694) | | (5,690,069) | | (906,625) | | (22,332,884) |
| Class I | | (53,891) | | (1,628,752) | | (179,597) | | (5,193,338) |
| Class R | | (215) | | (5,905) | | (19,397) | | (545,160) |
|
| | | | | (88,829,747) | | | | (281,194,708) |
|
| Net decrease in net assets resulting from | | | | | | | | |
| capital share transactions | | | | (76,651,943) | | | | (240,923,605) |
|
| Total decrease in net assets | | | | (183,412,090) | | | | (62,289,855) |
| Net assets | | | | | | | | |
| Beginning of period | | | | 849,973,289 | | | | 912,263,144 |
|
| End of period | | $ 666,561,199 | | $ 849,973,289 |
|
| Undistributed net investment loss | | $ (531,072) | | $ (48,453) |
|
See Notes to Financial Statements
19
NOTES TO FINANCIAL STATEMENTS (unaudited)
1. ORGANIZATION
Evergreen Omega Fund (the “Fund”) is a diversified series of Evergreen Equity Trust (the “Trust”), a Delaware statutory trust organized on September 18, 1997. The Trust is an open-end management investment company registered under the Investment Company Act of 1940, as amended (the “1940 Act”).
The Fund offers Class A, Class B, Class C, Class I and Class R shares. Class A shares are sold with a front-end sales charge. However, Class A share investments of $1 million or more are not subject to a front-end sales charge but are subject to a contingent deferred sales charge of 1.00% upon redemption within 18 months. Class B shares are sold without a front-end sales charge but are subject to a contingent deferred sales charge that is payable upon redemption and decreases depending on how long the shares have been held. Class C shares are sold without a front-end sales charge but are subject to a contingent deferred sales charge that is payable upon redemption within one year. Class I shares are sold without a front-end sales charge or contingent deferred sales charge. Class R shares are only available to participants in certain retirement plans and are sold without a front-end sales charge or contingent deferred sales charge. Each class of shares, except Class I shares, pays an ongoing distribution fee.
2. SIGNIFICANT ACCOUNTING POLICIES
The following is a summary of significant accounting policies consistently followed by the Fund in the preparation of its financial statements. The policies are in conformity with generally accepted accounting principles in the United States of America, which require management to make estimates and assumptions that affect amounts reported herein. Actual results could differ from these estimates.
a. Valuation of investments
Listed equity securities are usually valued at the last sales price or official closing price on the national securities exchange where the securities are principally traded.
Portfolio debt securities acquired with more than 60 days to maturity are fair valued using matrix pricing methods determined by an independent pricing service which takes into consideration such factors as similar security prices, yields, maturities, liquidity and ratings. Securities for which valuations are not readily available from an independent pricing service may be valued by brokers which use prices provided by market makers or estimates of market value obtained from yield data relating to investments or securities with similar characteristics.
Short-term securities with remaining maturities of 60 days or less at the time of purchase are valued at amortized cost, which approximates market value.
Investments in open-end mutual funds are valued at net asset value. Securities for which market quotations are not readily available or not reflective of current market value are valued at fair value as determined by the investment advisor in good faith, according to procedures approved by the Board of Trustees.
20
NOTES TO FINANCIAL STATEMENTS (unaudited) continued
b. Repurchase agreements
Securities pledged as collateral for repurchase agreements are held by the custodian bank or in a segregated account in the Fund’s name until the agreements mature. Collateral for certain tri-party repurchase agreements is held at the counterparty’s custodian in a segregated account for the benefit of the Fund and the counterparty. Each agreement requires that the market value of the collateral be sufficient to cover payments of interest and principal. However, in the event of default or bankruptcy by the other party to the agreement, retention of the collateral may be subject to legal proceedings. The Fund will enter into repurchase agreements with banks and other financial institutions, which are deemed by the investment advisor to be creditworthy pursuant to guidelines established by the Board of Trustees. In certain instances, the Fund’s securities lending agent may provide collateral in the form of repurchase agreements.
c. Securities lending
The Fund may lend its securities to certain qualified brokers in order to earn additional income. The Fund receives compensation in the form of fees or interest earned on the investment of any cash collateral received. The Fund also continues to receive interest and dividends on the securities loaned. The Fund receives collateral in the form of cash or securities with a market value at least equal to the market value of the securities on loan. In the event of default or bankruptcy by the borrower, the Fund could experience delays and costs in recovering the loaned securities or in gaining access to the collateral. The Fund has the right under the lending agreement to recover the securities from the borrower on demand.
d. Security transactions and investment income
Security transactions are recorded on trade date. Realized gains and losses are computed using the specific cost of the security sold. Dividend income is recorded on the ex-dividend. Foreign income and capital gains realized on some securities may be subject to foreign taxes, which are accrued as applicable.
e. Federal and other taxes
The Fund intends to continue to qualify as a regulated investment company and distribute all of its taxable income, including any net capital gains (which have already been offset by available capital loss carryovers). Accordingly, no provision for federal taxes is required. The Fund has adopted the provisions of FASB Interpretation No. 48, Accounting for Uncertainty in Income Taxes (“FIN 48”) which prescribes a minimum threshold for financial statement recognition of the benefit of a tax position taken or expected to be taken in a tax return. The Fund’s financial statements have not been impacted by the adoption of FIN 48.
f. Distributions
Distributions to shareholders from net investment income and net realized gains, if any, are recorded on the ex-dividend date. Such distributions are determined in conformity with income tax regulations, which may differ from generally accepted accounting principles.
21
NOTES TO FINANCIAL STATEMENTS (unaudited) continued
g. Class allocations
Income, common expenses and realized and unrealized gains and losses are allocated to the classes based on the relative net assets of each class. Distribution fees, if any, are calculated daily at the class level based on the appropriate net assets of each class and the specific expense rates applicable to each class.
3. ADVISORY FEE AND OTHER TRANSACTIONS WITH AFFILIATES
Evergreen Investment Management Company, LLC (“EIMC”), an indirect, wholly-owned subsidiary of Wachovia Corporation (“Wachovia”), is the investment advisor to the Fund and is paid an annual fee starting at 0.52% and declining to 0.41% as the aggregate average daily net assets of the Fund and its variable annuity counterpart, Evergreen VA Omega Fund, increase. For the six months ended March 31, 2008, the advisory fee was equivalent to 0.52% of the Fund’s average daily net assets (on an annualized basis).
From time to time, EIMC may voluntarily or contractually waive its fee and/or reimburse expenses in order to limit operating expenses. During the six months ended March 31, 2008, EIMC contractually waived its advisory fee in the amount of $246,167 and voluntarily reimbursed Distribution Plan expenses (see Note 4) relating to Class A shares in the amount of $122,410.
The Fund may invest in money market funds which are advised by EIMC. Income earned on these investments is included in income from affiliate on the Statement of Operations.
Effective January 1, 2008, EIMC replaced Evergreen Investment Services, Inc. (“EIS”), an indirect, wholly-owned subsidiary of Wachovia, as the administrator to the Fund upon the assignment of the Fund’s Administrative Services Agreement from EIS to EIMC. There were no changes to the services being provided or fees being paid by the Fund. The administrator provides the Fund with facilities, equipment and personnel and is paid an annual rate determined by applying percentage rates to the aggregate average daily net assets of the Evergreen funds (excluding money market funds and Evergreen Institutional Enhanced Income Fund), starting at 0.10% and declining to 0.05% as the aggregate average daily net assets of the Evergreen funds (excluding money market funds and Evergreen Institutional Enhanced Income Fund) increase.
Evergreen Service Company, LLC (“ESC”), an indirect, wholly-owned subsidiary of Wachovia, is the transfer and dividend disbursing agent for the Fund. ESC receives account fees that vary based on the type of account held by the shareholders in the Fund. For the six months ended March 31, 2008, the transfer agent fees were equivalent to an annual rate of 0.49% of the Fund’s average daily net assets.
Wachovia Bank NA, through its securities lending division of Wachovia Global Securities Lending, acts as the securities lending agent for the Fund.
The Fund has placed a portion of its portfolio transactions with brokerage firms that are affiliates of Wachovia. During the six months ended March 31, 2008, the Fund paid brokerage commissions of $57,021 to Wachovia Securities, LLC.
22
NOTES TO FINANCIAL STATEMENTS (unaudited) continued
4. DISTRIBUTION PLANS
EIS serves as distributor of the Fund’s shares. The Fund has adopted Distribution Plans, as allowed by Rule 12b-1 of the 1940 Act, for each class of shares, except Class I. Under the Distribution Plans, distribution fees were paid at an annual rate of 0.30% of the average daily net assets for Class A shares, 0.50% of the average daily net assets for Class R shares and 1.00% of the average daily net assets for each of Class B and Class C shares.
For the six months ended March 31, 2008, EIS received $6,067 from the sale of Class A shares and $85, $127,311 and $427 in contingent deferred sales charges from redemptions of Class A, Class B and Class C shares, respectively.
5. INVESTMENT TRANSACTIONS
Cost of purchases and proceeds from sales of investment securities (excluding short-term securities) were $161,343,866 and $241,087,087, respectively, for the six months ended March 31, 2008.
During the six months ended March 31, 2008, the Fund loaned securities to certain brokers and earned $1,048 in affiliated income relating to securities lending activity which is included in income from affiliate on the Statement of Operations. At March 31, 2008, the value of securities on loan and the total value of collateral received for securities loaned amounted to $74,935,322 and $76,194,493, respectively.
On March 31, 2008, the aggregate cost of securities for federal income tax purposes was $745,332,572. The gross unrealized appreciation and depreciation on securities based on tax cost was $71,464,549 and $77,347,004, respectively, with a net unrealized depreciation of $5,882,455.
As of September 30, 2007, the Fund had $457,129,736 in capital loss carryovers for federal income tax purposes with $11,186,457 expiring in 2009, $246,522,252 expiring in 2010 and $199,421,027 expiring in 2011.
These losses are subject to certain limitations prescribed by the Internal Revenue Code.
6. INTERFUND LENDING
Pursuant to an Exemptive Order issued by the SEC, the Fund may participate in an interfund lending program with certain funds in the Evergreen fund family. This program allows the Fund to borrow from, or lend money to, other participating funds. During the six months ended March 31, 2008, the Fund did not participate in the interfund lending program.
7. EXPENSE REDUCTIONS
Through expense offset arrangements with ESC and the Fund’s custodian, a portion of fund expenses has been reduced.
23
NOTES TO FINANCIAL STATEMENTS (unaudited) continued
8. DEFERRED TRUSTEES’ FEES
Each Trustee of the Fund may defer any or all compensation related to performance of his or her duties as a Trustee. The Trustees’ deferred balances are allocated to deferral accounts, which are included in the accrued expenses for the Fund. The investment performance of the deferral accounts is based on the investment performance of certain Evergreen funds. Any gains earned or losses incurred in the deferral accounts are reported in the Fund’s Trustees’ fees and expenses. At the election of the Trustees, the deferral account will be paid either in one lump sum or in quarterly installments for up to ten years.
9. FINANCING AGREEMENT
The Fund and certain other Evergreen funds share in an unsecured revolving credit commitment for temporary and emergency purposes, including the funding of redemptions, as permitted by each participating fund’s borrowing restrictions. Borrowings under this facility bear interest at 0.50% per annum above the Federal Funds rate. All of the participating funds are charged an annual commitment fee on the unused balance, which is allocated pro rata. The credit facility is for $100 million with an annual commitment fee of 0.08%. During the six months ended March 31, 2008, the Fund had no borrowings.
10. REGULATORY MATTERS AND LEGAL PROCEEDINGS
Pursuant to an administrative order issued by the SEC on September 19, 2007, EIMC, EIS, ESC (collectively, the “Evergreen Entities”), Wachovia Securities, LLC and the SEC have entered into an agreement settling allegations of (i) improper short-term trading arrangements in effect prior to May 2003 involving former officers and employees of EIMC and certain broker-dealers, (ii) insufficient systems for monitoring exchanges and enforcing exchange limitations as stated in certain funds’ prospectuses, and (iii) inadequate e-mail retention practices. Under the settlement, the Evergreen Entities were censured and have paid approximately $32 million in disgorgement and penalties. This amount, along with a fine assessed by the SEC against Wachovia Securities, LLC will be distributed pursuant to a plan to be developed by an independent distribution consultant and approved by the SEC. The Evergreen Entities neither admitted nor denied the allegations and findings set forth in its settlement with the SEC.
In addition, the Evergreen funds and EIMC and certain of its affiliates are involved in various legal actions, including private litigation and class action lawsuits. EIMC does not expect that any of such legal actions currently pending or threatened will have a material adverse impact on the financial position or operations of any of the Evergreen funds or on EIMC’s ability to provide services to the Evergreen funds.
Although EIMC believes that none of the matters discussed above will have a material adverse impact on the Evergreen funds, there can be no assurance that these matters and any publicity surrounding or resulting from them will not result in reduced sales or increased redemptions of Evergreen fund shares, which could increase Evergreen fund transaction costs or operating expenses, or that they will not have other adverse consequences on the Evergreen funds.
24
NOTES TO FINANCIAL STATEMENTS (unaudited) continued
11. NEW ACCOUNTING PRONOUNCEMENTS
In September 2006, FASB issued Statement of Financial Accounting Standards No. 157, Fair Value Measurements (“FAS 157”). FAS 157 establishes a single authoritative definition of fair value, establishes a framework for measuring fair value and expands disclosures about fair value measurements. FAS 157 applies to fair value measurements already required or permitted by existing standards. The change to current generally accepted accounting principles from the application of FAS 157 relates to the definition of fair value, the methods used to measure fair value, and the expanded disclosures about fair value measurements. Management of the Fund does not believe the adoption of FAS 157 will materially impact the financial statement amounts, however, additional disclosures may be required about the inputs used to develop the measurements and the effect of certain of the measurements on changes in net assets for the period. FAS 157 is effective for financial statements issued for fiscal years beginning after November 15, 2007 and interim periods within those fiscal years.
In March 2008, FASB issued Statement of Financial Accounting Standards No. 161, Disclosures about Derivative Instruments and Hedging Activities (“FAS 161”), an amendment of FASB Statement No. 133. FAS 161 requires enhanced disclosures about (a) how and why a fund uses derivative instruments, (b) how derivative instruments and hedging activities are accounted for, and (c) how derivative instruments and related hedging activities affect a fund’s financial position, financial performance, and cash flows. Management of the Fund does not believe the adoption of FAS 161 will materially impact the financial statement amounts, but will require additional disclosures. This will include qualitative and quantitative disclosures on derivative positions existing at period end and the effect of using derivatives during the reporting period. FAS 161 is effective for financial statements issued for fiscal years and interim periods beginning after November 15, 2008.
25
This page left intentionally blank
26
This page left intentionally blank
27
TRUSTEES AND OFFICERS
TRUSTEES1
| Charles A. Austin III | | Investment Counselor, Anchor Capital Advisors, LLC. (investment advice); Director, The Andover |
| Trustee | | Companies (insurance); Trustee, Arthritis Foundation of New England; Former Director, The |
| DOB: 10/23/1934 | | Francis Ouimet Society (scholarship program); Former Director, Executive Vice President and |
| Term of office since: 1991 | | Treasurer, State Street Research & Management Company (investment advice) |
| Other directorships: None | | |
|
| |
| K. Dun Gifford | | Chairman and President, Oldways Preservation and Exchange Trust (education); Trustee, |
| Trustee | | Chairman of the Finance Committee, Member of the Executive Committee, and Former |
| DOB: 10/23/1938 | | Treasurer, Cambridge College |
| Term of office since: 1974 | | |
| Other directorships: None | | |
|
| |
| Dr. Leroy Keith, Jr. | | Managing Director, Almanac Capital Management (commodities firm); Trustee, Phoenix |
| Trustee | | Fund Complex; Director, Diversapack Co. (packaging company); Former Partner, Stonington |
| DOB: 2/14/1939 | | Partners, Inc. (private equity fund); Former Director, Obagi Medical Products Co.; Former |
| Term of office since: 1983 | | Director, Lincoln Educational Services |
| Other directorships: Trustee, | | |
| Phoenix Fund Complex (consisting | | |
| of 53 portfolios as of 12/31/2007) | | |
|
| |
| Carol A. Kosel1 | | Former Consultant to the Evergreen Boards of Trustees; Former Vice President and Senior Vice |
| Trustee | | President, Evergreen Investments, Inc.; Former Treasurer, Evergreen Funds; Former Treasurer, |
| DOB: 12/25/1963 | | Vestaur Securities Fund |
| Term of office since: 2008 | | |
| Other directorships: None | | |
|
| |
| Gerald M. McDonnell | | Former Manager of Commercial Operations, CMC Steel (steel producer) |
| Trustee | | |
| DOB: 7/14/1939 | | |
| Term of office since: 1988 | | |
| Other directorships: None | | |
|
| |
| Patricia B. Norris | | President and Director of Buckleys of Kezar Lake, Inc. (real estate company); Former President |
| Trustee | | and Director of Phillips Pond Homes Association (home community); Former Partner, |
| DOB: 4/9/1948 | | PricewaterhouseCoopers, LLP (independent registered public accounting firm) |
| Term of office since: 2006 | | |
| Other directorships: None | | |
|
| |
| William Walt Pettit | | Partner and Vice President, Kellam & Pettit, P.A. (law firm); Director, Superior Packaging Corp. |
| Trustee | | (packaging company); Member, Superior Land, LLC (real estate holding company), Member, |
| DOB: 8/26/1955 | | K&P Development, LLC (real estate development); Former Director, National Kidney Foundation |
| Term of office since: 1988 | | of North Carolina, Inc. (non-profit organization) |
| Other directorships: None | | |
|
| |
| David M. Richardson | | President, Richardson, Runden LLC (executive recruitment advisory services); Director, J&M |
| Trustee | | Cumming Paper Co. (paper merchandising); Trustee, NDI Technologies, LLP (communications); |
| DOB: 9/19/1941 | | Former Consultant, AESC (The Association of Executive Search Consultants) |
| Term of office since: 1982 | | |
| Other directorships: None | | |
|
| |
| Dr. Russell A. Salton III | | President/CEO, AccessOne MedCard, Inc. |
| Trustee | | |
| DOB: 6/2/1947 | | |
| Term of office since: 1984 | | |
| Other directorships: None | | |
|
28
TRUSTEES AND OFFICERS continued
| Michael S. Scofield | | Retired Attorney, Law Offices of Michael S. Scofield; Former Director and Chairman, Branded |
| Trustee | | Media Corporation (multi-media branding company) |
| DOB: 2/20/1943 | | |
| Term of office since: 1984 | | |
| Other directorships: None | | |
|
| |
| Richard J. Shima | | Independent Consultant; Director, Hartford Hospital; Trustee, Greater Hartford YMCA; Former |
| Trustee | | Director, Trust Company of CT; Former Director, Old State House Association; Former Trustee, |
| DOB: 8/11/1939 | | Saint Joseph College (CT) |
| Term of office since: 1993 | | |
| Other directorships: None | | |
|
| |
| Richard K. Wagoner, CFA2 | | Member and Former President, North Carolina Securities Traders Association; Member, Financial |
| Trustee | | Analysts Society |
| DOB: 12/12/1937 | | |
| Term of office since: 1999 | | |
| Other directorships: None | | |
|
| |
| |
| OFFICERS | | |
| |
| Dennis H. Ferro3 | | Principal occupations: President and Chief Executive Officer, Evergreen Investment Company, |
| President | | Inc. and Executive Vice President, Wachovia Bank, N.A.; former Chief Investment Officer, |
| DOB: 6/20/1945 | | Evergreen Investment Company, Inc. |
| Term of office since: 2003 | | |
|
| |
| Jeremy DePalma4 | | Principal occupations: Senior Vice President, Evergreen Investment Management Company, LLC; |
| Treasurer | | Former Vice President, Evergreen Investment Services, Inc.; Former Assistant Vice President, |
| DOB: 2/5/1974 | | Evergreen Investment Services, Inc. |
| Term of office since: 2005 | | |
|
| |
| Michael H. Koonce4 | | Principal occupations: Senior Vice President and General Counsel, Evergreen Investment |
| Secretary | | Services, Inc.; Secretary, Senior Vice President and General Counsel, Evergreen Investment |
| DOB: 4/20/1960 | | Management Company, LLC and Evergreen Service Company, LLC; Senior Vice President and |
| Term of office since: 2000 | | Assistant General Counsel, Wachovia Corporation |
|
| |
| Robert Guerin4 | | Principal occupations: Chief Compliance Officer, Evergreen Funds and Senior Vice President of |
| Chief Compliance Officer | | Evergreen Investments Co, Inc; Former Managing Director and Senior Compliance Officer, |
| DOB: 9/20/1965 | | Babson Capital Management LLC; Former Principal and Director, Compliance and Risk |
| Term of office since: 2007 | | Management, State Street Global Advisors; Former Vice President and Manager, Sales Practice |
| | | Compliance, Deutsche Asset Management. |
|
1 Each Trustee, except Mses. Kosel and Norris, serves until a successor is duly elected or qualified or until his or her death, resignation, retirement or removal from office. As new Trustees, Ms. Kosel’s and Ms. Norris’ initial terms end December 31, 2010 and June 30, 2009, respectively, at which times they may be re-elected by Trustees to serve until a successor is duly elected or qualified or until her death, resignation, retirement or removal from office by the Trustees. Each Trustee, except Ms. Kosel, oversaw 93 Evergreen funds as of December 31, 2007. Ms. Kosel became a Trustee on January 1, 2008. Correspondence for each Trustee may be sent to Evergreen Board of Trustees, P.O. Box 20083, Charlotte, NC 28202.
2 Mr. Wagoner is an ��interested person” of the Fund because of his ownership of shares in Wachovia Corporation, the parent to the Fund’s investment advisor.
3 The address of the Officer is 401 S. Tryon Street, 20th Floor, Charlotte, NC 28288.
4 The address of the Officer is 200 Berkeley Street, Boston, MA 02116.
Additional information about the Fund’s Board of Trustees and Officers can be found in the Statement of Additional Information (SAI) and is available upon request without charge by calling 800.343.2898.
29
566382 rv5 04/2008
Evergreen Small-Mid Growth Fund
| table of contents |
| 1 | | LETTER TO SHAREHOLDERS |
| 4 | | FUND AT A GLANCE |
| 6 | | ABOUT YOUR FUND’S EXPENSES |
| 7 | | FINANCIAL HIGHLIGHTS |
| 9 | | SCHEDULE OF INVESTMENTS |
| 14 | | STATEMENT OF ASSETS AND LIABILITIES |
| 15 | | STATEMENT OF OPERATIONS |
| 16 | | STATEMENTS OF CHANGES IN NET ASSETS |
| 17 | | NOTES TO FINANCIAL STATEMENTS |
| 28 | | TRUSTEES AND OFFICERS |
This semiannual report must be preceded or accompanied by a prospectus of the Evergreen fund contained herein. The prospectus contains more complete information, including fees and expenses, and should be read carefully before investing or sending money.
The fund will file its complete schedule of portfolio holdings with the SEC for the first and third quarters of each fiscal year on Form N-Q. The fund’s Form N-Q will be available on the SEC’s Web site at http://www.sec.gov. In addition, the fund’s Form N-Q may be reviewed and copied at the SEC’s Public Reference Room in Washington, D.C. Information on the operation of the Public Reference Room may be obtained by calling 800.SEC.0330.
A description of the fund’s proxy voting policies and procedures, as well as information regarding how the fund voted proxies relating to portfolio securities during the most recent 12-month period ended June 30, is available by visiting our Web site at EvergreenInvestments.com or by visiting the SEC’s Web site at http://www.sec.gov. The fund’s proxy voting policies and procedures are also available without charge, upon request, by calling 800.343.2898.
| Mutual Funds: | | | | |
| NOT FDIC INSURED | | MAY LOSE VALUE | | NOT BANK GUARANTEED |
Evergreen InvestmentsSM is a service mark of Evergreen Investment Management Company, LLC.
Copyright 2008, Evergreen Investment Management Company, LLC.
Evergreen Investment Management Company, LLC is a subsidiary of Wachovia Corporation
and is an affiliate of Wachovia Corporation’s other Broker Dealer subsidiaries.
Evergreen mutual funds are distributed by Evergreen Investment Services, Inc.
200 Berkeley Street, Boston, MA 02116
LETTER TO SHAREHOLDERS
May 2008
Dennis H. Ferro
President and Chief
Executive Officer
Dear Shareholder:
We are pleased to provide the Semiannual Report for Evergreen Small-Mid Growth Fund for the six-month period ended March 31, 2008 (the “six-month period”).
Mounting evidence of a slowing economy undermined confidence in equities and credit-sensitive fixed income securities during the six-month period. Investors feared weakness in housing and problems in the subprime mortgage industry could pull the domestic economy into recession. Major financial institutions began to report substantial losses from their exposures to subprime mortgages and banks started to tighten their credit standards and to restrict their lending. Equity prices were buffeted by news of falling profits, weakening housing, slowing employment, rising inflationary pressures and growing credit problems. Stock valuations fell across all market capitalizations, investment styles and regions. With fears of a dramatic downturn hovering over the market, fixed income investors sought out the highest-quality securities and attempted to avoid credit risk. As a consequence, the prices of corporate bonds and many asset-backed securities fell, while Treasuries rallied in a general flight to quality. In this environment, the prices of gold, oil and other commodities surged while the U.S. dollar weakened further.
The U.S. economy showed clear signs of weakening over the six-month period. Problems in the credit markets led to declines in lending for ordinary consumer and commercial activity, accentuating the effects of declining home prices. Corporate profits, employment and other key economic indicators showed signs of deterioration. Gross Domestic Product growth slowed to just 0.6% both in the final quarter of 2007 and in the first quarter of 2008. To reinvigorate the economy
1
LETTER TO SHAREHOLDERS continued
and stimulate lending activity, the Federal Reserve Board (the “Fed”) became increasingly aggressive, taking a series of steps to pour liquidity into the financial system. Starting in September 2007 and continuing through April 2008, the Fed cut the key fed funds rate seven different times, lowering the influential short-term rate from 5.25% to 2%. In March 2008, the central bank also opened its lending facilities to securities firms as well as commercial banks and intervened to help JPMorgan Chase & Co. purchase the collapsing investment bank Bear Stearns Cos. Congress and the Bush administration, meanwhile, rushed through a $168 billion fiscal stimulus bill, which included tax rebate checks, in an effort to boost growth in the second half of 2008.
During the six-month period, the management teams of Evergreen’s growth-oriented equity funds maintained their pursuit of capital appreciation, consistent with the investment discipline and style of each fund. The manager of Evergreen Large Company Growth Fund and Evergreen Omega Fund focused on bottom-up, fundamental analysis in making individual stock selections. The portfolio manager supervising Evergreen Mid Cap Growth Fund and Evergreen Small-Mid Growth Fund, meanwhile, sought to balance each portfolio with exposure both to consistent growth companies and to more cyclically oriented corporations. At the same time, managers of Evergreen Growth Fund concentrated on opportunities among small cap growth companies with above-average earnings prospects and reasonable stock valuations. The portfolio manager of Evergreen Enhanced S&P 500® Fund, in turn, employed a largely quantitative discipline in choosing a portfolio of predominately large cap stocks from both the value and growth stock universes.
We believe the experiences in the capital markets during the six-month period have underscored the value of a well-diversified, long-term investment strategy to help soften the effects of volatility in any one market or asset class. As always, we encourage investors to maintain diversified investment portfolios in pursuit of their long-term investment goals.
2
LETTER TO SHAREHOLDERS continued
Please visit us at EvergreenInvestments.com for more information about our funds and other investment products available to you. Thank you for your continued support of Evergreen Investments.
Sincerely,
Dennis H. Ferro
President and Chief Executive Officer
Evergreen Investment Company, Inc.
Special Notice to Shareholders:
Please visit our Web site at EvergreenInvestments.com for statements from President and Chief Executive Officer, Dennis Ferro, regarding the firm’s recent settlement with the Securities and Exchange Commission (SEC) and prior settlement with the Financial Industry Regulatory Authority (FINRA).
3
FUND AT A GLANCE
as of March 31, 2008
MANAGEMENT TEAM
Investment Advisor:
Evergreen Investment Management Company, LLC
Portfolio Managers:
Kenneth J. Doerr
Robert C. Junkin, CPA
CURRENT INVESTMENT STYLE
Source: Morningstar, Inc.
Morningstar’s style box is based on a portfolio date as of 3/31/2008.
The Equity style box placement is based on 10 growth and valuation measures for each fund holding and the median size of the companies in which the fund invests.
PERFORMANCE AND RETURNS
Portfolio inception date: 10/11/2005
| | | Class A | | Class I |
| Class inception date | | 10/11/2005 | | 10/11/2005 |
|
| Nasdaq symbol | | ESMGX | | ESMIX |
|
| 6-month return with sales charge | | -18.31% | | N/A |
|
| 6-month return w/o sales charge | | -13.32% | | -13.20% |
| |
| Average annual return* | | | | |
|
| 1-year with sales charge | | -8.08% | | N/A |
|
| 1-year w/o sales charge | | -2.46% | | -2.21% |
|
| Since portfolio inception | | 7.79% | | 10.63% |
|
| Maximum sales charge | | 5.75% | | N/A |
| | | Front-end | | |
|
* Adjusted for maximum applicable sales charge, unless noted.
Past performance is no guarantee of future results. The performance quoted represents past performance and current performance may be lower or higher. The investment return and principal value of an investment will fluctuate so that investors’ shares, when redeemed, may be worth more or less than their original cost. To obtain performance information current to the most recent month-end for Classes A or I, please go to EvergreenInvestments.com/fundperformance. The performance of each class may vary based on differences in loads, fees and expenses paid by the shareholders investing in each class. Performance includes the reinvestment of income dividends and capital gain distributions. Performance shown does not reflect the deduction of taxes that a shareholder would pay on fund distributions or the redemption of fund shares.
The fund incurs a 12b-1 fee of 0.25% for Class A. Class I does not pay a 12b-1 fee.
The advisor is waiving a portion of its advisory fee and reimbursing a portion of the 12b-1 fee for Class A. Had the fees not been waived or reimbursed, returns would have been lower.
| Effective May 7, 2008, Mr. Doerr and Mr. Junkin became portfolio managers of the fund. Effective |
| May 14, 2008, Donald M. Bisson no longer managed the fund and Mr. Doerr and Mr. Junkin assumed |
| day-to-day management responsibility of the fund. |
4
FUND AT A GLANCE continued
Comparison of a $10,000 investment in the Evergreen Small-Mid Growth Fund Class A shares versus a similar investment in the Russell 2500 Growth Index (Russell 2500 Growth) and the Consumer Price Index (CPI).
The Russell 2500 Growth is an unmanaged market index and does not include transaction costs associated with buying and selling securities, any mutual fund fees or expenses or any taxes. The CPI is a commonly used measure of inflation and does not represent an investment return. It is not possible to invest directly in an index.
Class I shares are only offered, subject to the minimum initial purchase requirements, in the following manner: (1) to investment advisory clients of EIMC (or its advisory affiliates), (2) to employer- or state-sponsored benefit plans, including but not limited to, retirement plans, defined benefit plans, deferred compensation plans, or savings plans, (3) to fee-based mutual fund wrap accounts, (4) through arrangements entered into on behalf of the Evergreen funds with certain financial services firms, (5) to certain institutional investors, and (6) to persons who owned Class Y shares in registered name in an Evergreen fund on or before December 31, 1994 or who owned shares of any SouthTrust fund in registered name as of March 18, 2005 or who owned shares of Vestaur Securities Fund as of May 20, 2005.
Class I shares are only available to institutional shareholders with a minimum of $1 million investment, which may be waived in certain situations.
The fund’s investment objective may be changed without a vote of the fund’s shareholders.
Mid cap securities may be subject to special risks associated with narrower product lines and limited financial resources compared to their large cap counterparts, and, as a result, mid cap securities may decline significantly in market downturns.
The stocks of smaller companies may be more volatile than those of larger companies due to the higher risk of failure.
All data is as of March 31, 2008, and subject to change.
5
ABOUT YOUR FUND’S EXPENSES
The Example below is intended to describe the fees and expenses borne by shareholders and the impact of those costs on your investment.
Example
As a shareholder of the fund, you incur two types of costs: (1) transaction costs, including sales charges (loads), redemption fees and exchange fees; and (2) ongoing costs, including management fees, distribution (12b-1) fees and other fund expenses. This Example is intended to help you understand your ongoing costs (in dollars) of investing in the fund and to compare these costs with the ongoing costs of investing in other mutual funds. The Example is based on an investment of $1,000 invested at the beginning of the period and held for the entire period from October 1, 2007 to March 31, 2008.
The example illustrates your fund’s costs in two ways:
Actual expenses
The section in the table under the heading “Actual” provides information about actual account values and actual expenses. You may use the information in these columns, together with the amount you invested, to estimate the expenses that you paid over the period. Simply divide your account value by $1,000 (for example, an $8,600 account value divided by $1,000 = 8.6), then multiply the result by the number in the appropriate column for your share class, in the column entitled “Expenses Paid During Period” to estimate the expenses you paid on your account during this period.
Hypothetical example for comparison purposes
The section in the table under the heading “Hypothetical (5% return before expenses)” provides information about hypothetical account values and hypothetical expenses based on the fund’s actual expense ratio and an assumed rate of return of 5% per year before expenses, which is not the fund’s actual return. The hypothetical account values and expenses may not be used to estimate the actual ending account balance or expenses you paid for the period. You may use this information to compare the ongoing costs of investing in the fund and other funds. To do so, compare this 5% hypothetical example with the 5% hypothetical examples that appear in the shareholder reports of the other funds.
Please note that the expenses shown in the table are meant to highlight your ongoing costs only and do not reflect any transactional costs, such as sales charges (loads), redemption fees or exchange fees. Therefore, the section in the table under the heading “Hypothetical (5% return before expenses)” is useful in comparing ongoing costs only, and will not help you determine the relative total costs of owning different funds. In addition, if these transactional costs were included, your costs would have been higher.
| | | Beginning | | Ending | | |
| | | Account | | Account | | Expenses |
| | | Value | | Value | | Paid During |
| | | 10/1/2007 | | 3/31/2008 | | Period* |
|
| Actual | | | | | | | | |
| Class A | | $ 1,000.00 | | $ | | 866.82 | | $ 5.46 |
| Class I | | $ 1,000.00 | | $ | | 867.97 | | $ 4.30 |
| Hypothetical | | | | | | | | |
| (5% return | | | | | | | | |
| before expenses) | | | | | | | | |
| Class A | | $ 1,000.00 | | $ 1,019.15 | | $ 5.91 |
| Class I | | $ 1,000.00 | | $ 1,020.40 | | $ 4.65 |
|
* For each class of the Fund, expenses are equal to the annualized expense ratio of each class (1.17% for Class A and 0.92% for Class I), multiplied by the average account value over the period, multiplied by 183 / 366 days.
6
FINANCIALHIGHLIGHTS
(For a share outstanding throughout each period)
| | | Six Months Ended | | Year Ended September 30, |
| | | March 31, 2008 | |
|
| CLASS A | | (unaudited) | | 2007 | | 20061 |
|
| Net asset value, beginning of period | | $ 14.73 | | $ 11.53 | | $10.00 |
|
| Income from investment operations | | | | | | |
| Net investment income (loss) | | (0.04) | | (0.11)2 | | (0.05) |
| Net realized and unrealized gains or losses on investments | | (1.74) | | 3.31 | | 1.58 |
| | |
| |
| |
|
| Total from investment operations | | (1.78) | | 3.20 | | 1.53 |
|
| Distributions to shareholders from | | | | | | |
| Net realized gains | | (1.42) | | 0 | | 0 |
|
| Net asset value, end of period | | $ 11.53 | | $ 14.73 | | $11.53 |
|
| Total return3 | | (13.32%) | | 27.75% | | 15.30% |
|
| Ratios and supplemental data | | | | | | |
| Net assets, end of period (thousands) | | $33,727 | | $45,706 | | $ 3 |
| Ratios to average net assets | | | | | | |
Expenses including waivers/reimbursements
but excluding expense reductions | | 1.17%4 | | 1.17% | | 1.18%4,5 |
Expenses excluding waivers/reimbursements
and expense reductions | | 1.28%4 | | 1.28% | | 1.99%4 |
| Net investment income (loss) | | (0.56%)4 | | (0.79%) | | (0.66%)4 |
| Portfolio turnover rate | | 60% | | 192% | | 132% |
|
1 For the period from October 11, 2005 (commencem ent of class operations), to September 30, 2006.
2 Net investment income (loss) per share is based on average shares outstanding during the period.
3 Excluding applicable sales charges
4 Annualized
5 Including the expense reductions, the ratio would be 1.17%.
See Notes to Financial Statements
7
FINANCIALHIGHLIGHTS
(For a share outstanding throughout each period)
| | | Six Months Ended | | Year Ended September 30, |
| | | March 31, 2008 | |
|
| CLASS I | | (unaudited) | | 2007 | | 20061 |
|
| Net asset value, beginning of period | | $ 14.77 | | $ 11.54 | | $ 10.00 |
|
| Income from investment operations | | | | | | |
| Net investment income (loss) | | (0.02) | | (0.06)2 | | (0.02) |
| Net realized and unrealized gains or losses on investments | | (1.75) | | 3.30 | | 1.56 |
| | |
| |
| |
|
| Total from investment operations | | (1.77) | | 3.24 | | 1.54 |
|
| Distributions to shareholders from | | | | | | |
| Net investment income | | 0 | | (0.01) | | 0 |
| | |
| Net realized gains | | (1.42) | | 0 | | 0 |
| Total distributions to shareholders | | (1.42) | | (0.01) | | 0 |
|
| Net asset value, end of period | | $ 11.58 | | $ 14.77 | | $ 11.54 |
|
| Total return | | (13.20%) | | 28.11% | | 15.40% |
|
| Ratios and supplemental data | | | | | | |
| Net assets, end of period (thousands) | | $109,225 | | $140,931 | | $22,429 |
| Ratios to average net assets | | | | | | |
Expenses including waivers/reimbursements
but excluding expense reductions | | 0.92%3 | | 0.92% | | 0.93%3,4 |
Expenses excluding waivers/reimbursements
and expense reductions | | 0.98%3 | | 0.98% | | 1.74%3 |
| Net investment income (loss) | | (0.31%)3 | | (0.42%) | | (0.37%)3 |
| Portfolio turnover rate | | 60% | | 192% | | 132% |
|
1 For the period from October 11, 2005 (commencement of class operations), to September 30, 2006.
2 Net investment income (loss) per share is based on average shares outstanding during the period.
3 Annualized
4 Including the expense reductions, the ratio would be 0.92%.
See Notes to Financial Statements
8
SCHEDULE OF INVESTMENTS
March 31, 2008 (unaudited)
| | | | | | | | | Shares | | | | Value |
|
| COMMON STOCKS 97.5% | | | | | | | | | | |
| CONSUMER DISCRETIONARY 12.1% | | | | | | |
| Diversified Consumer Services 3.9% | | | | | | |
| Capella Education Co. * | | | | | | 53,357 | | $ | | 2,913,292 |
| Strayer Education, Inc. | | | | | | | | 18,000 | | | | 2,745,000 |
| |
|
| | | | | | | | | | | | | 5,658,292 |
| |
|
| Hotels, Restaurants & Leisure 2.8% | | | | | | |
| Buffalo Wild Wings, Inc. * | | | | | | 41,579 | | | | 1,018,686 |
| Penn National Gaming, Inc. * | | | | | | 68,400 | | | | 2,991,132 |
| |
|
| | | | | | | | | | | | | 4,009,818 |
| |
|
| Internet & Catalog Retail 1.2% | | | | | | |
| priceline.com, Inc. * (p) | | | | | | | | 14,600 | | | | 1,764,556 |
| |
|
| Media 0.9% | | | | | | | | | | | | |
| Lamar Advertising Co., Class A (p) | | | | 34,900 | | | | 1,253,957 |
| |
|
| Specialty Retail 1.2% | | | | | | | | | | |
| GameStop Corp., Class A * | | | | | | 32,500 | | | | 1,680,575 |
| |
|
| Textiles, Apparel & Luxury Goods 2.1% | | | | |
| Hanesbrands, Inc. * | | | | | | | | 102,600 | | | | 2,995,920 |
| |
|
| CONSUMER STAPLES 6.4% | | | | | | | | |
| Food Products 4.4% | | | | | | | | | | |
| Hain Celestial Group, Inc. * (p) | | | | | | 103,000 | | | | 3,038,500 |
| Ralcorp Holdings, Inc. * | | | | | | | | 55,200 | | | | 3,209,880 |
| |
|
| | | | | | | | | | | | | 6,248,380 |
| |
|
| Personal Products 2.0% | | | | | | | | | | |
| Alberto-Culver Co. | | | | | | | | 104,300 | | | | 2,858,863 |
| |
|
| ENERGY 10.2% | | | | | | | | | | | | |
| Energy Equipment & Services 5.1% | | | | | | |
| Atwood Oceanics, Inc. * | | | | | | 33,840 | | | | 3,103,805 |
| Dril-Quip, Inc. * | | | | | | | | 58,900 | | | | 2,737,083 |
| ION Geophysical Corp. | | | | | | | | 107,300 | | | | 1,480,740 |
| |
|
| | | | | | | | | | | | | 7,321,628 |
| |
|
| Oil, Gas & Consumable Fuels 5.1% | | | | | | |
| Denbury Resources, Inc. * | | | | | | 89,377 | | | | 2,551,713 |
| Southwestern Energy Co. * | | | | | | 138,456 | | | | 4,664,583 |
| |
|
| | | | | | | | | | | | | 7,216,296 |
| |
|
| FINANCIALS 4.2% | | | | | | | | | | | | |
| Commercial Banks 2.0% | | | | | | | | | | |
| Associated Banc-Corp. (p) | | | | | | 106,800 | | | | 2,844,084 |
| |
|
| Insurance 2.2% | | | | | | | | | | | | |
| Fidelity National Financial, Inc. | | | | | | 168,500 | | | | 3,088,605 |
| |
|
See Notes to Financial Statements
9
SCHEDULE OF INVESTMENTS continued
March 31, 2008 (unaudited)
| | | | | Shares | | | | Value |
|
| COMMON STOCKS continued | | | | | | | | |
| HEALTH CARE 19.9% | | | | | | | | |
| Biotechnology 2.1% | | | | | | | | |
| Cephalon, Inc. * (p) | | | | 46,040 | | $ | | 2,964,976 |
| |
|
| Health Care Equipment & Supplies 9.8% | | | | | | |
| ArthroCare Corp. * | | | | 66,300 | | | | 2,211,105 |
| Beckman Coulter, Inc. | | | | 44,300 | | | | 2,859,565 |
| Hologic, Inc. * | | | | 58,500 | | | | 3,252,600 |
| STERIS Corp. | | | | 49,170 | | | | 1,319,231 |
| Symmetry Medical, Inc. * | | | | 95,668 | | | | 1,588,089 |
| Varian Medical Systems, Inc. * | | | | 58,700 | | | | 2,749,508 |
| |
|
| | | | | | | | | 13,980,098 |
| |
|
| Health Care Providers & Services 4.5% | | | | | | |
| Pediatrix Medical Group, Inc. * | | | | 52,890 | | | | 3,564,786 |
| Psychiatric Solutions, Inc. * | | | | 86,594 | | | | 2,937,268 |
| |
|
| | | | | | | | | 6,502,054 |
| |
|
| Life Sciences Tools & Services 3.5% | | | | | | |
| AMAG Pharmaceuticals, Inc. * | | | | 37,900 | | | | 1,532,297 |
| Qiagen NV * (p) | | | | 168,900 | | | | 3,513,120 |
| |
|
| | | | | | | | | 5,045,417 |
| |
|
| INDUSTRIALS 18.9% | | | | | | | | |
| Commercial Services & Supplies 5.6% | | | | | | |
| FTI Consulting, Inc. * | | | | 55,038 | | | | 3,909,899 |
| Watson Wyatt Worldwide, Inc. | | | | 72,900 | | | | 4,137,075 |
| |
|
| | | | | | | | | 8,046,974 |
| |
|
| Electrical Equipment 5.6% | | | | | | | | |
| EnerSys, Inc. * | | | | 117,700 | | | | 2,815,384 |
| JA Solar Holdings Co., Ltd., ADS | | | | 120,400 | | | | 2,239,440 |
| Roper Industries, Inc. (p) | | | | 48,540 | | | | 2,885,218 |
| |
|
| | | | | | | | | 7,940,042 |
| |
|
| Machinery 4.3% | | | | | | | | |
| Kaydon Corp. (p) | | | | 65,000 | | | | 2,854,150 |
| Titan International, Inc. | | | | 108,500 | | | | 3,321,185 |
| |
|
| | | | | | | | | 6,175,335 |
| |
|
| Road & Rail 2.4% | | | | | | | | |
| Landstar System, Inc. (p) | | | | 65,100 | | | | 3,395,616 |
| |
|
| Trading Companies & Distributors 1.0% | | | | | | |
| MSC Industrial Direct Co., Class A | | | | 34,225 | | | | 1,446,006 |
| |
|
See Notes to Financial Statements
10
SCHEDULE OF INVESTMENTS continued
March 31, 2008 (unaudited)
| | | | | | | Shares | | | | Value |
|
| COMMON STOCKS continued | | | | | | |
| INFORMATION TECHNOLOGY 19.9% | | | | | | |
| Communications Equipment 3.8% | | | | | | |
| Acme Packet, Inc. * (p) | | | | 169,900 | | $ | | 1,357,501 |
| F5 Networks, Inc. * | | | | 66,212 | | | | 1,203,072 |
| NICE-Systems, Ltd., ADR * | | | | 103,225 | | | | 2,913,010 |
| |
|
| | | | | | | | | | | 5,473,583 |
| |
|
| Electronic Equipment & Instruments 2.5% | | | | | | |
| Flir Systems, Inc. * (p) | | | | 118,200 | | | | 3,556,638 |
| |
|
| Internet Software & Services 6.6% | | | | | | |
| Akamai Technologies, Inc. * | | | | 101,700 | | | | 2,863,872 |
| Bankrate, Inc. * (p) | | | | 49,235 | | | | 2,456,334 |
| SINA Corp. * | | | | 36,200 | | | | 1,276,050 |
| VistaPrint, Ltd. | | | | 81,900 | | | | 2,862,405 |
| |
|
| | | | | | | | | | | 9,458,661 |
| |
|
| IT Services 1.4% | | | | | | | | |
| Syntel, Inc. (p) | | | | 73,869 | | | | 1,968,609 |
| |
|
| Semiconductors & Semiconductor Equipment 3.3% | | | | | | |
| Monolithic Power Systems, Inc. * (p) | | | | 98,139 | | | | 1,730,191 |
| Power Integrations, Inc. * | | | | 102,300 | | | | 2,993,298 |
| |
|
| | | | | | | | | | | 4,723,489 |
| |
|
| Software 2.3% | | | | | | | | |
| ANSYS, Inc. * | | | | 41,000 | | | | 1,415,320 |
| Quality Systems, Inc. (p) | | | | 61,836 | | | | 1,847,041 |
| |
|
| | | | | | | | | | | 3,262,361 |
| |
|
| MATERIALS 3.9% | | | | | | | | |
| Chemicals 1.7% | | | | | | | | |
| CF Industries Holdings, Inc. | | | | 23,500 | | | | 2,435,070 |
| |
|
| Metals & Mining 2.2% | | | | | | | | |
| Steel Dynamics, Inc. | | | | 94,600 | | | | 3,125,584 |
| |
|
| TELECOMMUNICATION SERVICES 2.0% | | | | | | |
| Diversified Telecommunication Services 2.0% | | | | | | |
| Time Warner Telecom, Inc. * | | | | 183,700 | | | | 2,845,513 |
| |
|
| Total Common Stocks (cost $141,365,331) | | | | | | 139,287,000 |
| |
|
See Notes to Financial Statements
11
SCHEDULE OF INVESTMENTS continued
March 31, 2008 (unaudited)
| | | | | | | | | Principal | | | | |
| | | | | | | | | Amount | | | | Value |
|
| SHORT-TERM INVESTMENTS 22.7% | | | | | | | | | | |
| REPURCHASE AGREEMENTS ^ 11.6% | | | | | | | | | | |
| BNP Paribas Securities, 3.10%, dated 03/31/2008, maturing 04/01/2008, maturity | | | | | | | | |
| value $1,502,129 (pp)(1) | | | | | | $ | | 1,502,000 | | $ | | 1,502,000 |
| Credit Suisse First Boston, LLC, 3.15%, dated 03/31/2008, maturing 04/01/2008, | | | | | | | | |
| maturity value $2,482,217 (pp)(2) | | | | | | 2,482,000 | | | | 2,482,000 |
| Deutsche Bank Securities, Inc., 3.10%, dated 03/31/2008, maturing 04/01/2008, | | | | | | | | |
| maturity value $4,000,344 (pp)(3) | | | | | | 4,000,000 | | | | 4,000,000 |
| Dresdner Kleinwort Wasserstein Securities, LLC, 3.10%, dated 03/31/2008, | | | | | | | | |
| maturing 04/01/2008, maturity value $2,000,172 (pp)(4) | | | | 2,000,000 | | | | 2,000,000 |
| Greenwich Capital Markets, Inc., 3.10%, dated 03/31/2008, maturing | | | | | | | | |
| 04/01/2008, maturity value $3,000,258 (pp)(5) | | | | | | 3,000,000 | | | | 3,000,000 |
| JPMorgan Securities, Inc., 3.07%, dated 03/31/2008, maturing 04/01/2008, | | | | | | | | |
| maturity value $601,051 (pp)(6) | | | | | | 601,000 | | | | 601,000 |
| Merrill Lynch Pierce Fenner & Smith, Inc., 3.10%, dated 03/31/2008, maturing | | | | | | | | |
| 04/01/2008, maturity value $3,000,258 (pp)(7) | | | | | | 3,000,000 | | | | 3,000,000 |
| |
|
| | | | | | | | | | | | | 16,585,000 |
| | |
|
|
| | | | | | | | | Shares | | | | Value |
|
| MUTUAL FUND SHARES 11.1% | | | | | | | | | | |
| BGI Prime Money Market Fund, Premium Shares, 3.15% (pp)q | | | | 2,249,000 | | | | 2,249,000 |
| BlackRock Liquidity TempFund, Institutional Class, 3.25% (pp)q | | | | 2,000,000 | | | | 2,000,000 |
| Evergreen Institutional Money Market Fund, Class I, 3.27% q ø (pp) | | | | 7,646,715 | | | | 7,646,715 |
| Morgan Stanley Institutional Liquidity Fund Money Market Portfolio, Institutional | | | | | | | | |
| Class, 3.31% (pp) q | | | | | | | | 4,000,000 | | | | 4,000,000 |
| |
|
| | | | | | | | | | | | | 15,895,715 |
| |
|
| Total Short-Term Investments (cost $32,480,715) | | | | | | | | | | 32,480,715 |
| |
|
| Total Investments (cost $173,846,046) 120.2% | | | | | | | | | | 171,767,715 |
| Other Assets and Liabilities (20.2%) | | | | | | | | | | (28,816,077) |
| |
|
| Net Assets 100.0% | | | | | | | | | | $ | | 142,951,638 |
| |
|
| * | | Non-income producing security |
| (p) | | All or a portion of this security is on loan. |
| q | | Rate shown is the 7-day annualized yield at period end. |
| (pp) | | All or a portion of this security represents investment of cash collateral received from securities on loan. |
| ø | | Evergreen Investment Management Company, LLC is the investment advisor to both the Fund and the money market |
| | | fund. |
See Notes to Financial Statements
12
SCHEDULE OF INVESTMENTS continued
March 31, 2008 (unaudited)
| ^ | | Collateral is pooled with the collateral of other Evergreen funds and allocated on a pro rata basis consisting of: |
| | | (1) | | investment grade corporate bonds, 5.30% to 8.25%, 10/28/2015 to 06/01/2032, value including accrued |
| | | | | interest is $1,532,040. |
| | | (2) | | investment grade corporate bonds, 7.375% to 8.00%, 06/15/2010 to 03/15/2038, value including accrued |
| | | | | interest is $2,531,641. |
| | | (3) | | high grade CMOs, 2.84% to 6.15%, 09/15/2021 to 02/15/2051, value including accrued interest is |
| | | | | $3,426,293; investment grade CMO, 4.04%, 04/25/2034, value including accrued interest is $653,707. |
| | | (4) | | investment grade corporate bonds, 5.70% to 8.75%, 02/15/2017 to 03/01/2031, value including accrued |
| | | | | interest is $111,560; high grade asset-backed securities, 2.97% to 3.41%, 05/25/2035 to 08/25/2046, value |
| | | | | including accrued interest is $1,212,880; high grade CMOs, 3.21% to 5.22%, 07/15/2035 to 08/25/2046, |
| | | | | value including accrued interest is $715,645. |
| | | (5) | | agency mortgage-backed security, 5.00%, 03/01/2038, value including accrued interest is $3,060,075. |
| | | (6) | | investment grade commercial paper, 0.02% to 0.19%, 04/01/2008 to 06/20/2008, value including accrued |
| | | | | interest is $613,034. |
| | | (7) | | investment grade corporate bonds, 0.00% to 7.15%, 08/15/2013 to 06/01/2037, value including accrued |
| | | | | interest is $3,060,008. |
| Summary of Abbreviations |
| ADR | | American Depository Receipt |
| ADS | | American Depository Shares |
| CMO | | Collateralized Mortgage Obligation |
The following table shows the percent of total long-term investments by sector as of March 31, 2008:
| Health Care | | 20.5% |
| Information Technology | | 20.4% |
| Industrials | | 19.4% |
| Consumer Discretionary | | 12.5% |
| Energy | | 10.4% |
| Consumer Staples | | 6.5% |
| Financials | | 4.3% |
| Materials | | 4.0% |
| Telecommunication Services | | 2.0% |
| |
|
| | | 100.0% |
| |
|
See Notes to Financial Statements
13
STATEMENT OF ASSETS AND LIABILITIES
March 31, 2008 (unaudited)
| Assets | | | | |
| Investments in securities, at value (cost $166,199,331) including $28,356,519 of securities | | | | |
| loaned | | $ | | 164,121,000 |
| Investments in affiliated money market fund, at value (cost $7,646,715) | | | | 7,646,715 |
|
| Total investments | | | | 171,767,715 |
| Segregated cash | | | | 1,083 |
| Receivable for securities sold | | | | 2,389,266 |
| Receivable for Fund shares sold | | | | 138,863 |
| Dividends receivable | | | | 57,538 |
| Receivable for securities lending income | | | | 17,859 |
| Prepaid expenses and other assets | | | | 17,633 |
|
| Total assets | | | | 174,389,957 |
|
| Liabilities | | | | |
| Payable for securities purchased | | | | 2,526,260 |
| Payable for Fund shares redeemed | | | | 55,961 |
| Payable for securities on loan | | | | 28,835,083 |
| Advisory fee payable | | | | 1,174 |
| Due to other related parties | | | | 376 |
| Accrued expenses and other liabilities | | | | 19,465 |
|
| Total liabilities | | | | 31,438,319 |
|
| Net assets | | $ | | 142,951,638 |
|
| Net assets represented by | | | | |
| Paid-in capital | | $ | | 148,446,516 |
| Undistributed net investment loss | | | | (322,463) |
| Accumulated net realized losses on investments | | | | (3,094,084) |
| Net unrealized losses on investments | | | | (2,078,331) |
|
| Total net assets | | $ | | 142,951,638 |
|
| Net assets consists of | | | | |
| Class A | | $ | | 33,727,028 |
| Class I | | | | 109,224,610 |
|
| Total net assets | | $ | | 142,951,638 |
|
| Shares outstanding (unlimited number of shares authorized) | | | | |
| Class A | | | | 2,925,470 |
| Class I | | | | 9,434,352 |
|
| Net asset value per share | | | | |
| Class A | | $ | | 11.53 |
| Class A — Offering price (based on sales charge of 5.75%) | | $ | | 12.23 |
| Class I | | $ | | 11.58 |
|
See Notes to Financial Statements
14
STATEMENT OF OPERATIONS
Six Months Ended March 31, 2008 (unaudited)
| Investment income | | | | |
| Dividends | | $ | | 294,919 |
| Income from affiliate | | | | 127,838 |
| Securities lending | | | | 114,122 |
|
| Total investment income | | | | 536,879 |
|
| Expenses | | | | |
| Advisory fee | | | | 614,597 |
| Distribution Plan expenses | | | | 61,075 |
| Administrative services fee | | | | 87,577 |
| Transfer agent fees | | | | 80,340 |
| Trustees’ fees and expenses | | | | 2,522 |
| Printing and postage expenses | | | | 16,141 |
| Custodian and accounting fees | | | | 27,367 |
| Registration and filing fees | | | | 19,546 |
| Professional fees | | | | 17,000 |
| Other | | | | 523 |
|
| Total expenses | | | | 926,688 |
| Less: Expense reductions | | | | (2,000) |
| Fee waivers and expense reimbursements | | | | (66,035) |
|
| Net expenses | | | | 858,653 |
|
| Net investment loss | | | | (321,774) |
|
| Net realized and unrealized gains or losses on investments | | | | |
| Net realized losses on investments | | | | (351,790) |
| Net change in unrealized gains or losses on investments | | | | (23,196,430) |
|
| Net realized and unrealized gains or losses on investments | | | | (23,548,220) |
|
| Net decrease in net assets resulting from operations | | $ | | (23,869,994) |
|
See Notes to Financial Statements
15
STATEMENTS OF CHANGES IN NET ASSETS
| | | Six Months Ended | | | | |
| | | March 31, 2008 | | Year Ended |
| | | (unaudited) | | September 30, 2007 |
|
| Operations | | | | | | | | |
| Net investment loss | | $ | | (321,774) | | $ | | (554,111) |
| Net realized gains or losses on | | | | | | | | |
| investments | | | | (351,790) | | | | 16,633,100 |
| Net change in unrealized gains or losses | | | | | | | | |
| on investments | | | | (23,196,430) | | | | 8,932,635 |
|
| Net increase (decrease) in net assets | | | | | | | | |
| resulting from operations | | | | (23,869,994) | | | | 25,011,624 |
|
| Distributions to shareholders from | | | | | | | | |
| Net investment income | | | | | | | | |
| Class I | | | | 0 | | | | (42,978) |
| Net realized gains | | | | | | | | |
| Class A | | | | (4,279,029) | | | | 0 |
| Class I | | | | (14,423,967) | | | | 0 |
|
| Total distributions to shareholders | | | | (18,702,996) | | | | (42,978) |
|
| | | Shares | | | | Shares | | |
| Capital share transactions | | | | | | | | |
| Proceeds from shares sold | | | | | | | | |
| Class A | | 115,762 | | 1,561,878 | | 102,928 | | 1,449,393 |
| Class I | | 1,926,637 | | 26,525,773 | | 10,284,332 | | 132,986,140 |
|
| | | | | 28,087,651 | | | | 134,435,533 |
|
| Net asset value of shares issued in | | | | | | | | |
| reinvestment of distributions | | | | | | | | |
| Class A | | 320,456 | | 4,246,043 | | 0 | | 0 |
| Class I | | 974,366 | | 12,949,320 | | 2,869 | | 35,831 |
|
| | | | | 17,195,363 | | | | 35,831 |
|
| Payment for shares redeemed | | | | | | | | |
| Class A | | (613,558) | | (7,838,078) | | (2,833,493) | | (39,621,734) |
| Class I | | (3,007,977) | | (38,556,585) | | (2,689,942) | | (36,518,443) |
|
| | | | | (46,394,663) | | | | (76,140,177) |
|
| Net asset value of shares issued in | | | | | | | | |
| acquisition | | | | | | | | |
| Class A | | 0 | | 0 | | 5,833,081 | | 80,903,617 |
|
| Net increase (decrease) in net assets | | | | | | | | |
| resulting from capital share transactions | | | | (1,111,649) | | | | 139,234,804 |
|
| Total increase (decrease) in net assets | | | | (43,684,639) | | | | 164,203,450 |
| Net assets | | | | | | | | |
| Beginning of period | | | | 186,636,277 | | | | 22,432,827 |
|
| End of period | | $ 142,951,638 | | $ 186,636,277 |
|
| Undistributed (overdistributed) net | | | | | | | | |
| investment loss | | $ | | (322,463) | | $ | | (689) |
|
See Notes to Financial Statements
16
NOTES TO FINANCIAL STATEMENTS (unaudited)
1. ORGANIZATION
Evergreen Small-Mid Growth Fund (the “Fund”) is a diversified series of Evergreen Equity Trust (the “Trust”), a Delaware statutory trust organized on September 18, 1997. The Trust is an open-end management investment company registered under the Investment Company Act of 1940, as amended (the “1940 Act”).
The Fund offers Class A and Class I shares. Class A shares are sold with a front-end sales charge. However, Class A share investments of $1 million or more are not subject to a front-end sales charge but are subject to a contingent deferred sales charge of 1.00% upon redemption within 18 months. Class I shares are sold without a front-end sales charge or contingent deferred sales charge. Class A shares pay an ongoing distribution fee.
2. SIGNIFICANT ACCOUNTING POLICIES
The following is a summary of significant accounting policies consistently followed by the Fund in the preparation of its financial statements. The policies are in conformity with generally accepted accounting principles in the United States of America, which require management to make estimates and assumptions that affect amounts reported herein. Actual results could differ from these estimates.
a. Valuation of investments
Listed equity securities are usually valued at the last sales price or official closing price on the national securities exchange where the securities are principally traded.
Foreign securities traded on an established exchange are valued at the last sales price on the exchange where the security is primarily traded. If there has been no sale, the securities are valued at the mean between bid and asked prices. Foreign securities may be valued at fair value according to procedures approved by the Board of Trustees if the closing price is not reflective of current market values due to trading or events occurring in the foreign markets between the close of the established exchange and the valuation time of the Fund. In addition, substantial changes in values in the U.S. markets subsequent to the close of a foreign market may also affect the values of securities traded in the foreign market. The value of foreign securities may be adjusted if such movements in the U.S. market exceed a specified threshold.
Short-term securities with remaining maturities of 60 days or less at the time of purchase are valued at amortized cost, which approximates market value.
Investments in open-end mutual funds are valued at net asset value. Securities for which market quotations are not readily available or not reflective of current market value are valued at fair value as determined by the investment advisor in good faith, according to procedures approved by the Board of Trustees.
17
NOTES TO FINANCIAL STATEMENTS (unaudited) continued
b. Repurchase agreements
Securities pledged as collateral for repurchase agreements are held by the custodian bank or in a segregated account in the Fund’s name until the agreements mature. Collateral for certain tri-party repurchase agreements is held at the counterparty’s custodian in a segregated account for the benefit of the Fund and the counterparty. Each agreement requires that the market value of the collateral be sufficient to cover payments of interest and principal. However, in the event of default or bankruptcy by the other party to the agreement, retention of the collateral may be subject to legal proceedings. The Fund will enter into repurchase agreements with banks and other financial institutions, which are deemed by the investment advisor to be creditworthy pursuant to guidelines established by the Board of Trustees. In certain instances, the Fund’s securities lending agent may provide collateral in the form of repurchase agreements.
c. Foreign currency translation
All assets and liabilities denominated in foreign currencies are translated into U.S. dollar amounts at the date of valuation. Purchases and sales of portfolio securities and income items denominated in foreign currencies are translated into U.S. dollar amounts on the respective dates of such transactions. The Fund does not separately account for that portion of the results of operations resulting from changes in foreign exchange rates on investments and the fluctuations arising from changes in market prices of securities held. Such fluctuations are included with the net realized and unrealized gains or losses on investments.
d. Securities lending
The Fund may lend its securities to certain qualified brokers in order to earn additional income. The Fund receives compensation in the form of fees or interest earned on the investment of any cash collateral received. The Fund also continues to receive interest and dividends on the securities loaned. The Fund receives collateral in the form of cash or securities with a market value at least equal to the market value of the securities on loan. In the event of default or bankruptcy by the borrower, the Fund could experience delays and costs in recovering the loaned securities or in gaining access to the collateral. The Fund has the right under the lending agreement to recover the securities from the borrower on demand.
e. Security transactions and investment income
Security transactions are recorded on trade date. Realized gains and losses are computed using the specific cost of the security sold. Interest income is recorded on the accrual basis and includes accretion of discounts and amortization of premiums. Dividend income is recorded on the ex-dividend date.
f. Federal and other taxes
The Fund intends to continue to qualify as a regulated investment company and distribute all of its taxable income, including any net capital gains (which have already been offset by available capital loss carryovers). Accordingly, no provision for federal taxes is required. The Fund has
18
NOTES TO FINANCIAL STATEMENTS (unaudited) continued
adopted the provisions of FASB Interpretation No. 48, Accounting for Uncertainty in Income Taxes (“FIN 48”) which prescribes a minimum threshold for financial statement recognition of the benefit of a tax position taken or expected to be taken in a tax return. The Fund’s financial statements have not been impacted by the adoption of FIN 48.
g. Distributions
Distributions to shareholders from net investment income and net realized gains, if any, are recorded on the ex-dividend date. Such distributions are determined in conformity with income tax regulations, which may differ from generally accepted accounting principles.
h. Class allocations
Income, common expenses and realized and unrealized gains and losses are allocated to the classes based on the relative net assets of each class. Distribution fees, if any, are calculated daily at the class level based on the appropriate net assets of each class and the specific expense rates applicable to each class.
3. ADVISORY FEE AND OTHER TRANSACTIONS WITH AFFILIATES
Evergreen Investment Management Company, LLC (“EIMC”), an indirect, wholly-owned subsidiary of Wachovia Corporation (“Wachovia”), is the investment advisor to the Fund and is paid an annual fee starting at 0.70% and declining to 0.65% as average daily net assets increase. For the six months ended March 31, 2008, the advisory fee was equivalent to 0.70% of the Fund’s average daily net assets (on an annualized basis).
From time to time, EIMC may voluntarily or contractually waive its fee and/or reimburse expenses in order to limit operating expenses. During the six months ended March 31, 2008, EIMC contractually and voluntarily waived its advisory fee in the amount of $2,782 and $53,074, respectively. In addition, EIMC voluntarily reimbursed Distribution Plan expenses (see Note 4) relating to Class A shares in the amount of $10,179.
The Fund may invest in money market funds which are advised by EIMC. Income earned on these investments is included in income from affiliate on the Statement of Operations.
Effective January 1, 2008, EIMC replaced Evergreen Investment Services, Inc. (“EIS”), an indirect, wholly-owned subsidiary of Wachovia, as the administrator to the Fund upon the assignment of the Fund’s Administrative Services Agreement from EIS to EIMC. There were no changes to the services being provided or fees being paid by the Fund. The administrator provides the Fund with facilities, equipment and personnel and is paid an annual rate determined by applying percentage rates to the aggregate average daily net assets of the Evergreen funds (excluding money market funds and Evergreen Institutional Enhanced Income Fund), starting at 0.10% and declining to 0.05% as the aggregate average daily net assets of the Evergreen funds (excluding money market funds and Evergreen Institutional Enhanced Income Fund) increase.
19
NOTES TO FINANCIAL STATEMENTS (unaudited) continued
Evergreen Service Company, LLC (“ESC”), an indirect, wholly-owned subsidiary of Wachovia, is the transfer and dividend disbursing agent for the Fund. ESC receives account fees that vary based on the type of account held by the shareholders in the Fund. For the six months ended March 31, 2008, the transfer agent fees were equivalent to an annual rate of 0.09% of the Fund’s average daily net assets.
Wachovia Bank NA, through its securities lending division of Wachovia Global Securities Lending, acts as the securities lending agent for the Fund.
The Fund has placed a portion of its portfolio transactions with brokerage firms that are affiliates of Wachovia. During the six months ended March 31, 2008, the Fund paid brokerage commissions of $1,629 to Wachovia Securities, LLC.
4. DISTRIBUTION PLAN
EIS serves as distributor of the Fund’s shares. The Fund has adopted a Distribution Plan, as allowed by Rule 12b-1 of the 1940 Act, for Class A shares. Under the Distribution Plan, distribution fees were paid at an annual rate of 0.30% of the average daily net assets for Class A shares.
For the six months ended March 31, 2008, EIS received $1,118 from the sale of Class A shares.
5. ACQUISITION
Effective at the close of business on May 18, 2007, the Fund acquired the net assets of Atlas Emerging Growth Fund in a tax-free exchange for Class A shares of the Fund. Shares were issued to shareholders of Atlas Emerging Growth Fund at an exchange ratio of 1.28 for Class A shares of the Fund. The acquired net assets consisted primarily of portfolio securities with unrealized appreciation of $10,877,372. The aggregate net assets of the Fund and Atlas Emerging Growth Fund immediately prior to the acquisition were $115,705,154 and $80,903,617, respectively. The aggregate net assets of the Fund immediately after the acquisition were $196,608,771.
6. INVESTMENT TRANSACTIONS
Cost of purchases and proceeds from sales of investment securities (excluding short-term securities) were $100,476,387 and $122,932,556, respectively, for the six months ended March 31, 2008.
During the six months ended March 31, 2008, the Fund loaned securities to certain brokers and earned $453 in affiliated income relating to securities lending activity which is included in income from affiliate on the Statement of Operations. At Month March 31, 2008, the value of securities on loan and the total value of collateral received for securities loaned (including segregated cash) amounted to $28,356,519 and $28,835,083, respectively.
20
NOTES TO FINANCIAL STATEMENTS (unaudited) continued
On March 31, 2008, the aggregate cost of securities for federal income tax purposes was $174,808,068. The gross unrealized appreciation and depreciation on securities based on tax cost was $10,201,576 and $13,241,929, respectively, with a net unrealized depreciation of $3,040,353.
7. INTERFUND LENDING
Pursuant to an Exemptive Order issued by the SEC, the Fund may participate in an interfund lending program with certain funds in the Evergreen fund family. This program allows the Fund to borrow from, or lend money to, other participating funds. During the six months ended March 31, 2008, the Fund did not participate in the interfund lending program.
8. EXPENSE REDUCTIONS
Through expense offset arrangements with ESC and the Fund’s custodian, a portion of fund expenses has been reduced.
9. DEFERRED TRUSTEES’ FEES
Each Trustee of the Fund may defer any or all compensation related to performance of his or her duties as a Trustee. The Trustees’ deferred balances are allocated to deferral accounts, which are included in the accrued expenses for the Fund. The investment performance of the deferral accounts is based on the investment performance of certain Evergreen funds. Any gains earned or losses incurred in the deferral accounts are reported in the Fund’s Trustees’ fees and expenses. At the election of the Trustees, the deferral account will be paid either in one lump sum or in quarterly installments for up to ten years.
10. FINANCING AGREEMENT
The Fund and certain other Evergreen funds share in an unsecured revolving credit commitment for temporary and emergency purposes, including the funding of redemptions, as permitted by each participating fund’s borrowing restrictions. Borrowings under this facility bear interest at 0.50% per annum above the Federal Funds rate. All of the participating funds are charged an annual commitment fee on the unused balance, which is allocated pro rata. The credit facility is for $100 million with an annual commitment fee of 0.08% . During the six months ended March 31, 2008, the Fund had no borrowings.
11. REGULATORY MATTERS AND LEGAL PROCEEDINGS
Pursuant to an administrative order issued by the SEC on September 19, 2007, EIMC, EIS, ESC (collectively, the “Evergreen Entities”), Wachovia Securities, LLC and the SEC have entered into an agreement settling allegations of (i) improper short-term trading arrangements in effect prior to May 2003 involving former officers and employees of EIMC and certain broker-dealers,
21
NOTES TO FINANCIAL STATEMENTS (unaudited) continued
(ii) insufficient systems for monitoring exchanges and enforcing exchange limitations as stated in certain funds’ prospectuses, and (iii) inadequate e-mail retention practices. Under the settlement, the Evergreen Entities were censured and have paid approximately $32 million in disgorgement and penalties. This amount, along with a fine assessed by the SEC against Wachovia Securities, LLC will be distributed pursuant to a plan to be developed by an independent distribution consultant and approved by the SEC. The Evergreen Entities neither admitted nor denied the allegations and findings set forth in its settlement with the SEC.
In addition, the Evergreen funds and EIMC and certain of its affiliates are involved in various legal actions, including private litigation and class action lawsuits. EIMC does not expect that any of such legal actions currently pending or threatened will have a material adverse impact on the financial position or operations of any of the Evergreen funds or on EIMC’s ability to provide services to the Evergreen funds.
Although EIMC believes that none of the matters discussed above will have a material adverse impact on the Evergreen funds, there can be no assurance that these matters and any publicity surrounding or resulting from them will not result in reduced sales or increased redemptions of Evergreen fund shares, which could increase Evergreen fund transaction costs or operating expenses, or that they will not have other adverse consequences on the Evergreen funds.
12. NEW ACCOUNTING PRONOUNCEMENTS
In September 2006, FASB issued Statement of Financial Accounting Standards No. 157, Fair Value Measurements (“FAS 157”). FAS 157 establishes a single authoritative definition of fair value, establishes a framework for measuring fair value and expands disclosures about fair value measurements. FAS 157 applies to fair value measurements already required or permitted by existing standards. The change to current generally accepted accounting principles from the application of FAS 157 relates to the definition of fair value, the methods used to measure fair value, and the expanded disclosures about fair value measurements. Management of the Fund does not believe the adoption of FAS 157 will materially impact the financial statement amounts, however, additional disclosures may be required about the inputs used to develop the measurements and the effect of certain of the measurements on changes in net assets for the period. FAS 157 is effective for financial statements issued for fiscal years beginning after November 15, 2007 and interim periods within those fiscal years.
In March 2008, FASB issued Statement of Financial Accounting Standards No. 161, Disclosures about Derivative Instruments and Hedging Activities (“FAS 161”), an amendment of FASB Statement No. 133. FAS 161 requires enhanced disclosures about (a) how and why a fund uses derivative instruments, (b) how derivative instruments and hedging activities are accounted for, and (c) how derivative instruments and related hedging activities affect a fund’s financial position, financial performance, and cash flows. Management of the Fund does not believe the adoption of
22
NOTES TO FINANCIAL STATEMENTS (unaudited) continued
FAS 161 will materially impact the financial statement amounts, but will require additional disclosures. This will include qualitative and quantitative disclosures on derivative positions existing at period end and the effect of using derivatives during the reporting period. FAS 161 is effective for financial statements issued for fiscal years and interim periods beginning after November 15, 2008.
23
This page left intentionally blank
24
This page left intentionally blank
25
This page left intentionally blank
26
This page left intentionally blank
27
TRUSTEES AND OFFICERS
TRUSTEES1
| Charles A. Austin III | | Investment Counselor, Anchor Capital Advisors, LLC. (investment advice); Director, The Andover |
| Trustee | | Companies (insurance); Trustee, Arthritis Foundation of New England; Former Director, The |
| DOB: 10/23/1934 | | Francis Ouimet Society (scholarship program); Former Director, Executive Vice President and |
| Term of office since: 1991 | | Treasurer, State Street Research & Management Company (investment advice) |
| Other directorships: None | | |
|
| K. Dun Gifford | | Chairman and President, Oldways Preservation and Exchange Trust (education); Trustee, |
| Trustee | | Chairman of the Finance Committee, Member of the Executive Committee, and Former |
| DOB: 10/23/1938 | | Treasurer, Cambridge College |
| Term of office since: 1974 | | |
| Other directorships: None | | |
|
| Dr. Leroy Keith, Jr. | | Managing Director, Almanac Capital Management (commodities firm); Trustee, Phoenix |
| Trustee | | Fund Complex; Director, Diversapack Co. (packaging company); Former Partner, Stonington |
| DOB: 2/14/1939 | | Partners, Inc. (private equity fund); Former Director, Obagi Medical Products Co.; Former |
| Term of office since: 1983 | | Director, Lincoln Educational Services |
| Other directorships: Trustee, | | |
| Phoenix Fund Complex (consisting | | |
| of 53 portfolios as of 12/31/2007) | | |
|
| Carol A. Kosel1 | | Former Consultant to the Evergreen Boards of Trustees; Former Vice President and Senior Vice |
| Trustee | | President, Evergreen Investments, Inc.; Former Treasurer, Evergreen Funds; Former Treasurer, |
| DOB: 12/25/1963 | | Vestaur Securities Fund |
| Term of office since: 2008 | | |
| Other directorships: None | | |
|
| Gerald M. McDonnell | | Former Manager of Commercial Operations, CMC Steel (steel producer) |
| Trustee | | |
| DOB: 7/14/1939 | | |
| Term of office since: 1988 | | |
| Other directorships: None | | |
|
| Patricia B. Norris | | President and Director of Buckleys of Kezar Lake, Inc. (real estate company); Former President |
| Trustee | | and Director of Phillips Pond Homes Association (home community); Former Partner, |
| DOB: 4/9/1948 | | PricewaterhouseCoopers, LLP (independent registered public accounting firm) |
| Term of office since: 2006 | | |
| Other directorships: None | | |
|
| William Walt Pettit | | Partner and Vice President, Kellam & Pettit, P.A. (law firm); Director, Superior Packaging Corp. |
| Trustee | | (packaging company); Member, Superior Land, LLC (real estate holding company), Member, |
| DOB: 8/26/1955 | | K&P Development, LLC (real estate development); Former Director, National Kidney Foundation |
| Term of office since: 1988 | | of North Carolina, Inc. (non-profit organization) |
| Other directorships: None | | |
|
| David M. Richardson | | President, Richardson, Runden LLC (executive recruitment advisory services); Director, J&M |
| Trustee | | Cumming Paper Co. (paper merchandising); Trustee, NDI Technologies, LLP (communications); |
| DOB: 9/19/1941 | | Former Consultant, AESC (The Association of Executive Search Consultants) |
| Term of office since: 1982 | | |
| Other directorships: None | | |
|
| Dr. Russell A. Salton III | | President/CEO, AccessOne MedCard, Inc. |
| Trustee | | |
| DOB: 6/2/1947 | | |
| Term of office since: 1984 | | |
| Other directorships: None | | |
|
28
TRUSTEES AND OFFICERS continued
| Michael S. Scofield | | Retired Attorney, Law Offices of Michael S. Scofield; Former Director and Chairman, Branded |
| Trustee | | Media Corporation (multi-media branding company) |
| DOB: 2/20/1943 | | |
| Term of office since: 1984 | | |
| Other directorships: None | | |
|
| Richard J. Shima | | Independent Consultant; Director, Hartford Hospital; Trustee, Greater Hartford YMCA; Former |
| Trustee | | Director, Trust Company of CT; Former Director, Old State House Association; Former Trustee, |
| DOB: 8/11/1939 | | Saint Joseph College (CT) |
| Term of office since: 1993 | | |
| Other directorships: None | | |
|
| Richard K. Wagoner, CFA2 | | Member and Former President, North Carolina Securities Traders Association; Member, Financial |
| Trustee | | Analysts Society |
| DOB: 12/12/1937 | | |
| Term of office since: 1999 | | |
| Other directorships: None | | |
|
| OFFICERS | | |
| Dennis H. Ferro3 | | Principal occupations: President and Chief Executive Officer, Evergreen Investment Company, |
| President | | Inc. and Executive Vice President, Wachovia Bank, N.A.; former Chief Investment Officer, |
| DOB: 6/20/1945 | | Evergreen Investment Company, Inc. |
| Term of office since: 2003 | | |
|
| Jeremy DePalma4 | | Principal occupations: Senior Vice President, Evergreen Investment Management Company, LLC; |
| Treasurer | | Former Vice President, Evergreen Investment Services, Inc.; Former Assistant Vice President, |
| DOB: 2/5/1974 | | Evergreen Investment Services, Inc. |
| Term of office since: 2005 | | |
|
| Michael H. Koonce4 | | Principal occupations: Senior Vice President and General Counsel, Evergreen Investment |
| Secretary | | Services, Inc.; Secretary, Senior Vice President and General Counsel, Evergreen Investment |
| DOB: 4/20/1960 | | Management Company, LLC and Evergreen Service Company, LLC; Senior Vice President and |
| Term of office since: 2000 | | Assistant General Counsel, Wachovia Corporation |
|
| Robert Guerin4 | | Principal occupations: Chief Compliance Officer, Evergreen Funds and Senior Vice President of |
| Chief Compliance Officer | | Evergreen Investments Co, Inc; Former Managing Director and Senior Compliance Officer, |
| DOB: 9/20/1965 | | Babson Capital Management LLC; Former Principal and Director, Compliance and Risk |
| Term of office since: 2007 | | Management, State Street Global Advisors; Former Vice President and Manager, Sales Practice |
| | | Compliance, Deutsche Asset Management. |
|
1 Each Trustee, except Mses. Kosel and Norris, serves until a successor is duly elected or qualified or until his or her death, resignation, retirement or removal from office. As new Trustees, Ms. Kosel’s and Ms. Norris’ initial terms end December 31, 2010 and June 30, 2009, respectively, at which times they may be re-elected by Trustees to serve until a successor is duly elected or qualified or until her death, resignation, retirement or removal from office by the Trustees. Each Trustee, except Ms. Kosel, oversaw 93 Evergreen funds as of December 31, 2007. Ms. Kosel became a Trustee on January 1, 2008. Correspondence for each Trustee may be sent to Evergreen Board of Trustees, P.O. Box 20083, Charlotte, NC 28202.
2 Mr. Wagoner is an “interested person” of the Fund because of his ownership of shares in Wachovia Corporation, the parent to the Fund’s investment advisor.
3 The address of the Officer is 401 S. Tryon Street, 20th Floor, Charlotte, NC 28288.
4 The address of the Officer is 200 Berkeley Street, Boston, MA 02116.
Additional information about the Fund’s Board of Trustees and Officers can be found in the Statement of Additional Information (SAI) and is available upon request without charge by calling 800.343.2898.
29
576004 rv2 04/2008
Item 2 – Code of Ethics
Not required for this semi-annual filing.
Item 3 – Audit Committee Financial Expert
Not required for this semi-annual filing.
Items 4 – Principal Accountant Fees and Services
Not required for this semi-annual filing.
Items 5 – Audit Committee of Listed Registrants
Not applicable.
Item 6 – Schedule of Investments
Please see schedule of investments contained in the Report to Stockholders included under Item 1 of this Form N-CSR.
Item 7 – Disclosure of Proxy Voting Policies and Procedures for Closed-End Management Investment Companies.
Not applicable.
Item 8 – Portfolio Managers of Closed-End Management Investment Companies.
Not applicable.
Item 9 – Purchases of Equity Securities by Closed-End Management Investment Company and Affiliated Purchasers.
Not applicable.
Item 10 – Submission of Matters to a Vote of Security Holders
There have been no material changes to the procedures by which shareholders may recommend nominees to the Registrant’s board of trustees that have been implemented since the Registrant last provided disclosure in response to the requirements of this Item.
Item 11 – Controls and Procedures
| (a) | The Registrant's principal executive officer and principal financial officer have evaluated the Registrant's disclosure controls and procedures (as defined in Rule 30a-3(c) under the Investment Company Act of 1940) within 90 days of this filing and have concluded that the Registrant's disclosure controls and procedures were effective, as of that date, in ensuring that information required to be disclosed by the Registrant in this Form N-CSR was recorded, processed, summarized, and reported timely. |
| |
| (b) | There has been no changes in the Registrant's internal controls over financial reporting (as defined in Rule 30a-3(d) under the Investment Company Act of 1940) that occurred during the second fiscal quarter of the period covered by this report that has materially affected, or is reasonable likely to affect, the Registrant’s internal control over financial reporting . |
| |
Item 12 – Exhibits
File the exhibits listed below as part of this Form. Letter or number the exhibits in the sequence indicated.
| (a) | Any code of ethics, or amendment thereto, that is the subject of the disclosure required by Item 2, to the extent that the Registrant intends to satisfy the Item 2 requirements through filing of an exhibit. |
| |
(b)(1) Separate certifications for the Registrant's principal executive officer and principal financial officer, as required by Section 302 of the Sarbanes-Oxley Act of 2002 and Rule 30a-2(a) under the Investment Company Act of 1940, are attached as EX99.CERT.
(b)(2) Separate certifications for the Registrant's principal executive officer and principal financial officer, as required by Section 1350 of Title 18 of United States Code, as adopted pursuant to Section 906 of the Sarbanes-Oxley Act of 2002, and Rule 30a-2(b) under the Investment Company Act of 1940, are attached as EX99.906CERT. The certifications furnished pursuant to this paragraph are not deemed to be "filed" for purposes of Section 18 of the Securities Exchange Act of 1934, or otherwise subject to the liability of that section. Such certifications are not deemed to be incorporated by reference into any filing under the Securities Act of 1933 or the Securities Exchange Act of 1934, except to the extent that the Registrant specifically incorporates them by reference.
Pursuant to the requirements of the Securities Exchange Act of 1934 and the Investment Company Act of 1940, the Registrant has duly caused this report to be signed on its behalf by the undersigned, thereunto duly authorized.
| Evergreen Equity Trust |
By: |
| Dennis H. Ferro, |
| Principal Executive Officer |
Date: May 23, 2008 |
Pursuant to the requirements of the Securities Exchange Act of 1934 and the Investment Company Act of 1940, this report has been signed below by the following persons on behalf of the Registrant and in the capacities and on the dates indicated.
| By: |
| Dennis H. Ferro, |
| Principal Executive Officer |
Date: May 23, 2008 |
By: |
| Jeremy Depalma |
| Principal Financial Officer |
Date: May 23, 2008 |