| OMB APPROVAL |
OMB Number: 3235-0570 Expires: September 30, 2007 Estimated average burden hours per response: 19.4 |
UNITED STATES
SECURITIES AND EXCHANGE COMMISSION
Washington, D.C. 20549
FORM N-CSRS
CERTIFIED SHAREHOLDER REPORT OF REGISTERED MANAGEMENT INVESTMENT COMPANIES
Investment Company Act file number 811-08413
Evergreen Equity Trust
_____________________________________________________________
(Exact name of registrant as specified in charter)
200 Berkeley Street Boston, Massachusetts 02116
_____________________________________________________________
(Address of principal executive offices) (Zip code)
Michael H. Koonce, Esq. 200 Berkeley Street Boston, Massachusetts 02116
____________________________________________________________
(Name and address of agent for service)
Registrant's telephone number, including area code: (617) 210-3200
Date of fiscal year end: Registrant is making a semi-annual filing for eleven of its series, Evergreen Disciplined Small-Mid Value Fund, Evergreen Disciplined Value Fund, Evergreen Equity Income Fund, Evergreen Fundamental Large Cap Fund, Evergreen Fundamental Mid Cap Fund, Evergreen Golden Core Opportunities Fund, Evergreen Golden Large Cap Core Fund, Evergreen Golden Mid Cap Core Fund, Evergreen Intrinsic Value Fund, Evergreen Small Cap Value Fund and Evergreen Special Values Fund, for the six months ended January 31, 2008. These eleven series have a July 31 fiscal year end.
Date of reporting period: January 31, 2008
Item 1 - Reports to Stockholders.
Evergreen Disciplined Small-Mid Value Fund
| table of contents |
| 1 | | LETTER TO SHAREHOLDERS |
| 4 | | FUND AT A GLANCE |
| 6 | | ABOUT YOUR FUND’S EXPENSES |
| 7 | | FINANCIAL HIGHLIGHTS |
| 9 | | SCHEDULE OF INVESTMENTS |
| 17 | | STATEMENT OF ASSETS AND LIABILITIES |
| 18 | | STATEMENT OF OPERATIONS |
| 19 | | STATEMENTS OF CHANGES IN NET ASSETS |
| 20 | | NOTES TO FINANCIAL STATEMENTS |
| 26 | | ADDITIONAL INFORMATION |
| 32 | | TRUSTEES AND OFFICERS |
This semiannual report must be preceded or accompanied by a prospectus of the Evergreen fund contained herein. The prospectus contains more complete information, including fees and expenses, and should be read carefully before investing or sending money.
The fund will file its complete schedule of portfolio holdings with the SEC for the first and third quarters of each fiscal year on Form N-Q. The fund’s Form N-Q will be available on the SEC’s Web site at http://www.sec.gov. In addition, the fund’s Form N-Q may be reviewed and copied at the SEC’s Public Reference Room in Washington, D.C. Information on the operation of the Public Reference Room may be obtained by calling 800.SEC.0330.
A description of the fund’s proxy voting policies and procedures, as well as information regarding how the fund voted proxies relating to portfolio securities during the most recent 12-month period ended June 30, is available by visiting our Web site at EvergreenInvestments.com or by visiting the SEC’s Web site at http://www.sec.gov. The fund’s proxy voting policies and procedures are also available without charge, upon request, by calling 800.343.2898.
| Mutual Funds: | | | | |
| NOT FDIC INSURED | | MAY LOSE VALUE | | NOT BANK GUARANTEED |
Evergreen InvestmentsSM is a service mark of Evergreen Investment Management Company, LLC.
Copyright 2008, Evergreen Investment Management Company, LLC.
Evergreen Investment Management Company, LLC is a subsidiary of Wachovia Corporation
and is an affiliate of Wachovia Corporation’s other Broker Dealer subsidiaries.
Evergreen mutual funds are distributed by Evergreen Investment Services, Inc.
200 Berkeley Street, Boston, MA 02116
LETTER TO SHAREHOLDERS
March 2008

Dennis H. Ferro
President and Chief Executive Officer
Dear Shareholder:
We are pleased to provide the Semiannual Report for Evergreen Disciplined Small-Mid Value Fund, covering the six-month period ended January 31, 2008.
Investors in the domestic equity market faced challenging and increasingly stormy conditions over the six-month period ended January 31, 2008. Problems in the housing and subprime mortgage markets led to a tightening of credit, which in turn contributed to widening fears of a dramatic deceleration in the economy’s expansion. As the economy weakened, equity prices generally declined across companies of all sizes. Large cap stocks held up somewhat better than mid cap and small cap shares, while growth stocks outperformed more economically sensitive value stocks. Fixed income investors, meanwhile, sought out the highest-quality securities and attempted to avoid credit risk. Longer-maturity Treasuries outperformed other sectors, while the prices of corporate bonds and many asset-backed securities fell as the yield spreads between Treasuries and lower-rated securities widened. In this environment, the price of gold surged while the dollar remained weak.
The U.S. economy exhibited increasing signs of weakness in the latter half of 2007 and the first month of 2008 after experiencing solid growth early in 2007. Although housing and credit-related concerns began weighing on investor sentiment early in the year, the economy’s growth trajectory continued to be supported early in 2007 by the combination of solid trends in employment, income, investment and export trends. That began to change in the latter months of 2007, however, as each of these pillars of support began to weaken. Growth in Gross Domestic Product
1
LETTER TO SHAREHOLDERS continued
rose by just 0.6% during the final quarter of 2007 as economic output slowed because of a sharp reduction in business inventories. The rate of corporate earnings growth, meanwhile, declined over the second half of 2007. Payrolls dropped by 17,000 in January 2008, contributing to growing concerns about the outlook for consumer spending, which accounts for up to 70% of economic output. Faced with growing evidence of the economy’s deceleration, the Federal Reserve Board (the “Fed”) began to focus more on stimulating growth and less on watching inflation. The Fed cut the target fed funds rate from 5.25% to 4.25% during the last four months of 2007 and then slashed the rate by an additional 1.25% in two separate actions within just eight days of each other in January 2008. Also in early 2008, Congress passed, and President Bush signed, a $168 billion fiscal stimulus bill that contained rebates for taxpayers, tax breaks for businesses and additional assistance for Social Security recipients and disabled veterans.
Over the six-month period ended January 31, 2008, the management teams of Evergreen’s value-oriented equity funds tended to emphasize investments in attractively priced, fundamentally sound corporations. The portfolio manager of both Evergreen Disciplined Value Fund and Evergreen Disciplined Small-Mid Value Fund, for example, used a combination of quantitative tools and traditional fundamental analysis in reviewing opportunities among larger and smaller companies, respectively. The manager of Evergreen Equity Index Fund maintained a portfolio reflecting the composition of the Standard & Poor’s 500® Index, using a proprietary process to control trading and operational costs. Managers of Evergreen Equity Income Fund emphasized companies they believe have the ability to maintain and increase their dividends to shareholders. The managers of Evergreen Fundamental Large Cap Fund focused on larger corporations with stable earnings growth records while the managers of Evergreen Fundamental Mid Cap Value Fund, which was launched on September 28, 2007, emphasized mid-sized companies selling at what the managers believed to be reasonable valuations. The team managing Evergreen Intrinsic Value Fund sought out investments in
2
LETTER TO SHAREHOLDERS continued
established companies selling at stock prices below the managers’ estimate of the company’s intrinsic value. Meanwhile, the managers of Evergreen Small Cap Value Fund and Evergreen Special Values Fund each focused on higher-quality small companies that the managers believed to have reasonable prices and strong balance sheets.
We believe the experiences in the investment markets during the past six months have underscored the value of a well-diversified, long-term investment strategy to help soften the effects of volatility in any one market or asset class. As always, we encourage investors to maintain diversified investment portfolios in pursuit of their long-term investment goals.
Please visit us at EvergreenInvestments.com for more information about our funds and other investment products available to you. Thank you for your continued support of Evergreen Investments.
Sincerely,

Dennis H. Ferro
President and Chief Executive Officer
Evergreen Investment Company, Inc.
Special Notice to Shareholders:
Please visit our Web site at EvergreenInvestments.com for statements from President and Chief Executive Officer, Dennis Ferro, regarding the firm’s recent settlement with the Securities and Exchange Commission (SEC) and prior settlement with the Financial Industry Regulatory Authority (FINRA).
3
FUND AT A GLANCE
as of January 31, 2008
MANAGEMENT TEAM
Investment Advisor:
• Evergreen Investment Management Company, LLC
Portfolio Manager:
• William E. Zieff
CURRENT INVESTMENT STYLE

Source: Morningstar, Inc.
Morningstar’s style box is based on a portfolio date as of 12/31/2007.
The Equity style box placement is based on 10 growth and valuation measures for each fund holding and the median size of the companies in which the fund invests.
PERFORMANCE AND RETURNS
Portfolio inception date: 12/14/2005
| | | Class A | | Class I |
| Class inception date | | 12/14/2005 | | 12/14/2005 |
|
| Nasdaq symbol | | EDASX | | EDISX |
|
| 6-month return with sales charge | | -15.11% | | N/A |
|
| 6-month return w/o sales charge | | -9.90% | | -9.75% |
|
| Average annual return* | | | | |
|
| 1-year with sales charge | | -21.15% | | N/A |
|
| 1-year w/o sales charge | | -16.32% | | -16.02% |
|
| Since portfolio inception | | -2.19% | | 0.84% |
|
| Maximum sales charge | | 5.75% | | N/A |
| | | Front-end | | |
|
* Adjusted for maximum applicable sales charge, unless noted.
Past performance is no guarantee of future results. The performance quoted represents past performance and current performance may be lower or higher. The investment return and principal value of an investment will fluctuate so that investors’ shares, when redeemed, may be worth more or less than their original cost. To obtain performance information current to the most recent month-end for Class I, please go to EvergreenInvestments.com/fundperformance. Class A shares are not available for sale to the public. The performance of each class may vary based on differences in loads, fees and expenses paid by the shareholders investing in each class. Performance includes the reinvestment of income dividends and capital gain distributions. Performance shown does not reflect the deduction of taxes that a shareholder would pay on fund distributions or the redemption of fund shares.
The fund incurs a 12b-1 fee of 0.30% for Class A. Class I does not pay a 12b-1 fee.
The advisor is waiving a portion of its advisory fee and reimbursing a portion of the 12b-1 fee for Class A. Had the fees not been waived or reimbursed, returns would have been lower.
4
FUND AT A GLANCE continued
LONG-TERM GROWTH
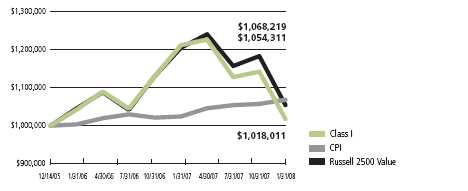
Comparison of a $1,000,000 investment in the Evergreen Disciplined Small-Mid Value Fund Class I shares versus a similar investment in the Russell 2500 Value Index (Russell 2500 Value) and the Consumer Price Index (CPI).
The Russell 2500 Value is an unmanaged market index and does not include transaction costs associated with buying and selling securities, any mutual fund fees or expenses or any taxes. The CPI is a commonly used measure of inflation and does not represent an investment return. It is not possible to invest directly in an index.
Class I shares are only offered in the following manner: (1) to investment advisory clients of Evergreen Investment Management Company, LLC (or its advisory affiliates) when purchased by such advisor(s) on behalf of its clients, (2) to certain mutual fund wrap program clients of Wachovia Securities and of third-party broker/dealers when purchased through a clearing relationship with Wachovia Securities or an affiliate providing mutual fund clearing services, (3) through arrangements entered into on behalf of the Evergreen funds with certain financial services firms, (4) to certain institutional investors, and (5) to persons who owned Class Y shares in registered name in an Evergreen fund on or before December 31, 1994 or who owned shares of any SouthTrust fund in registered name as of March 18, 2005 or who owned shares of Vestaur Securities Fund as of May 20, 2005.
Class I shares are only available to institutional shareholders with a minimum of $1 million investment, which may be waived in certain situations.
The fund’s investment objective may be changed without a vote of the fund’s shareholders.
Mid cap securities may be subject to special risks associated with narrower product lines and limited financial resources compared to their large cap counterparts, and, as a result, mid cap securities may decline significantly in market downturns.
The stocks of smaller companies may be more volatile than those of larger companies due to the higher risk of failure.
Value-based investments are subject to the risk that the broad market may not recognize their intrinsic value.
All data is as of January 31, 2008, and subject to change.
5
ABOUT YOUR FUND’S EXPENSES
The Example below is intended to describe the fees and expenses borne by shareholders and the impact of those costs on your investment.
Example
As a shareholder of the fund, you incur two types of costs: (1) transaction costs, including sales charges (loads), redemption fees and exchange fees; and (2) ongoing costs, including management fees, distribution (12b-1) fees and other fund expenses. This Example is intended to help you understand your ongoing costs (in dollars) of investing in the fund and to compare these costs with the ongoing costs of investing in other mutual funds. The Example is based on an investment of $1,000 invested at the beginning of the period and held for the entire period from August 1, 2007 to January 31, 2008.
The example illustrates your fund’s costs in two ways:
- Actual expenses
The section in the table under the heading “Actual” provides information about actual account values and actual expenses. You may use the information in these columns, together with the amount you invested, to estimate the expenses that you paid over the period. Simply divide your account value by $1,000 (for example, an $8,600 account value divided by $1,000 = 8.6), then multiply the result by the number in the appropriate column for your share class, in the column entitled “Expenses Paid During Period” to estimate the expenses you paid on your account during this period. - Hypothetical example for comparison purposes
The section in the table under the heading “Hypothetical (5% return before expenses)” provides information about hypothetical account values and hypothetical expenses based on the fund’s actual expense ratio and an assumed rate of return of 5% per year before expenses, which is not the fund’s actual return. The hypothetical account values and expenses may not be used to estimate the actual ending account balance or expenses you paid for the period. You may use this information to compare the ongoing costs of investing in the fund and other funds. To do so, compare this 5% hypothetical example with the 5% hypothetical examples that appear in the shareholder reports of the other funds.
Please note that the expenses shown in the table are meant to highlight your ongoing costs only and do not reflect any transactional costs, such as sales charges (loads), redemption fees or exchange fees. Therefore, the section in the table under the heading “Hypothetical (5% return before expenses)” is useful in comparing ongoing costs only, and will not help you determine the relative total costs of owning different funds. In addition, if these transactional costs were included, your costs would have been higher.
| | | Beginning | | Ending | | |
| | | Account | | Account | | Expenses |
| | | Value | | Value | | Paid During |
| | | 8/1/2007 | | 1/31/2008 | | Period* |
|
| Actual | | | | | | |
| Class A | | $ 1,000.00 | | $ 901.05 | | $ 5.64 |
| Class I | | $ 1,000.00 | | $ 902.53 | | $ 4.40 |
| Hypothetical | | | | | | |
| (5% return | | | | | | |
| before expenses) | | | | | | |
| Class A | | $ 1,000.00 | | $ 1,019.20 | | $ 5.99 |
| Class I | | $ 1,000.00 | | $ 1,020.51 | | $ 4.67 |
|
* For each class of the Fund, expenses are equal to the annualized expense ratio of each class (1.18% for Class A and 0.92% for Class I), multiplied by the average account value over the period, multiplied by 184 / 366 days.
6
FINANCIAL HIGHLIGHTS
(For a share outstanding throughout each period)
| | | | | | | |
| | | Six Months Ended | | Year Ended July 31, |
| | January 31, 2008 | |
|
| CLASS A | | (unaudited) | | 2007 | | 20061 |
|
| Net asset value, beginning of period | | $11.07 | | $10.44 | | $10.00 |
|
| Income from investment operations | | | | | | |
| Net investment income (loss) | | 0.07 | | 0.08 | | 0.06 |
| Net realized and unrealized gains or losses on investments | | (1.15) | | 0.722 | | 0.38 |
| |
|
| Total from investment operations | | (1.08) | | 0.80 | | 0.44 |
|
| Distributions to shareholders from | | | | | | |
| Net investment income | | (0.09) | | (0.12) | | 0 |
| Net realized gains | | (0.25) | | (0.05) | | 0 |
| |
|
| Total distributions to shareholders | | (0.34) | | (0.17) | | 0 |
|
| Net asset value, end of period | | $ 9.65 | | $11.07 | | $10.44 |
|
| Total return3 | | (9.90%) | | 7.59% | | 4.40% |
|
| Ratios and supplemental data | | | | | | |
| Net assets, end of period (thousands) | | $ 27 | | $ 32 | | $ 1 |
| Ratios to average net assets | | | | | | |
| Expenses including waivers/reimbursements but excluding expense reductions | | 1.18%4 | | 1.16% | | 1.11%4 |
| Expenses excluding waivers/reimbursements and expense reductions | | 1.44%4 | | 1.90% | | 3.38%4 |
| Net investment income (loss) | | 1.14%4 | | 1.45% | | 0.97%4 |
| Portfolio turnover rate | | 35% | | 73% | | 63% |
|
1 For the period from December 14, 2005 (commencement of class operations), to July 31, 2006.
2 The per share net realized and unrealized gains or losses is not in accord with the net realized and unrealized gains or losses for the period due to the timing of sales and redemptions of fund shares in relation to fluctuating market values of the portfolio.
3 Excluding applicable sales charges
4 Annualized
See Notes to Financial Statements
7
FINANCIAL HIGHLIGHTS
(For a share outstanding throughout each period)
| | | | | | | |
| | | Six Months Ended | | Year Ended July 31, |
| | January 31, 2008 | |
|
| CLASS I | | (unaudited) | | 2007 | | 20061 |
|
| Net asset value, beginning of period | | $ 11.11 | | $ 10.45 | | $10.00 |
|
| Income from investment operations | | | | | | |
| Net investment income (loss) | | 0.08 | | 0.12 | | 0.07 |
| Net realized and unrealized gains or losses on investments | | (1.14) | | 0.722 | | 0.38 |
| |
|
| Total from investment operations | | (1.06) | | 0.84 | | 0.45 |
|
| Distributions to shareholders from | | | | | | |
| Net investment income | | (0.11) | | (0.13) | | 0 |
| Net realized gains | | (0.25) | | (0.05) | | 0 |
| |
|
| Total distributions to shareholders | | (0.36) | | (0.18) | | 0 |
|
| Net asset value, end of period | | $ 9.69 | | $ 11.11 | | $10.45 |
|
| Total return | | (9.75%) | | 7.94% | | 4.50% |
|
| Ratios and supplemental data | | | | | | |
| Net assets, end of period (thousands) | | $23,424 | | $27,816 | | $6,665 |
| Ratios to average net assets | | | | | | |
| Expenses including waivers/reimbursements but excluding expense reductions | | 0.92%3 | | 0.92% | | 0.93%3 |
| Expenses excluding waivers/reimbursements and expense reductions | | 1.13%3 | | 1.61% | | 3.20%3 |
| Net investment income (loss) | | 1.39%3 | | 1.76% | | 1.20%3 |
| Portfolio turnover rate | | 35% | | 73% | | 63% |
|
1 For the period from December 14, 2005 (commencement of class operations), to July 31, 2006.
2 The per share net realized and unrealized gains or losses is not in accord with the net realized and unrealized gains or losses for the period due to the timing of sales and redemptions of fund shares in relation to fluctuating market values of the portfolio.
3 Annualized
See Notes to Financial Statements
8
SCHEDULE OF INVESTMENTS
January 31, 2008 (unaudited)
| | | | | Shares | | Value |
|
| |
| COMMON STOCKS 97.3% | | | | | | |
| CONSUMER DISCRETIONARY 10.6% | | | | |
| Auto Components 1.2% | | | | | | |
| BorgWarner, Inc. | | | | 2,748 | | $ 139,076 |
| Lear Corp. | | | | 4,850 | | 142,396 |
| |
|
| | | | | | | 281,472 |
| |
|
| Diversified Consumer Services 0.5% | | | | |
| Stewart Enterprises, Inc., Class A | | | | 15,676 | | 111,613 |
| |
|
| Hotels, Restaurants & Leisure 1.6% | | | | |
| Bob Evans Farms, Inc. | | | | 4,289 | | 127,555 |
| IHOP Corp. (p) | | | | 2,506 | | 133,420 |
| O’Charley’s, Inc. * | | | | 7,921 | | 109,864 |
| |
|
| | | | | | | 370,839 |
| |
|
| Household Durables 2.2% | | | | | | |
| American Greetings Corp., Class A | | | | 5,914 | | 121,356 |
| BLYTH, Inc. | | | | 6,499 | | 141,613 |
| NVR, Inc. * | | | | 182 | | 114,933 |
| Tupperware Brands Corp. | | | | 3,595 | | 133,015 |
| |
|
| | | | | | | 510,917 |
| |
|
| Leisure Equipment & Products 0.8% | | | | |
| Hasbro, Inc. | | | | 7,473 | | 194,074 |
| |
|
| Media 2.5% | | | | | | |
| DreamWorks Animation SKG, Inc., Class A * | | 6,019 | | 147,164 |
| Marvel Entertainment, Inc. | | | | 5,888 | | 166,042 |
| Media General, Inc., Class A | | | | 3,956 | | 75,096 |
| R.H. Donnelley Corp. | | | | 2,602 | | 78,242 |
| Scholastic Corp. * | | | | 3,323 | | 113,879 |
| |
|
| | | | | | | 580,423 |
| |
|
| Specialty Retail 1.2% | | | | | | |
| Asbury Automotive Group, Inc. | | | | 1,671 | | 23,695 |
| Barnes & Noble, Inc. | | | | 4,451 | | 151,111 |
| RadioShack Corp. | | | | 6,391 | | 110,884 |
| |
|
| | | | | | | 285,690 |
| |
|
| Textiles, Apparel & Luxury Goods 0.6% | | | | |
| Jones Apparel Group, Inc. | | | | 8,858 | | 148,814 |
| |
|
| CONSUMER STAPLES 5.7% | | | | | | |
| Beverages 0.9% | | | | | | |
| Molson Coors Brewing Co., Class B | | | | 4,885 | | 218,213 |
| |
|
| Food & Staples Retailing 1.4% | | | | |
| Casey’s General Stores, Inc. | | | | 4,536 | | 117,936 |
| Longs Drug Stores Corp. | | | | 2,875 | | 132,279 |
| Spartan Stores, Inc. | | | | 4,338 | | 76,262 |
| |
|
| | | | | | | 326,477 |
| |
|
See Notes to Financial Statements
9
SCHEDULE OF INVESTMENTS continued
January 31, 2008 (unaudited)
| | | | | | | Shares | | Value |
|
| |
| COMMON STOCKS continued | | | | | | |
| CONSUMER STAPLES continued | | | | |
| Food Products 1.3% | | | | | | |
| Corn Products International, Inc. | | | | 3,925 | | $ 133,270 |
| Del Monte Foods Co. | | | | | | 5,649 | | 180,994 |
| |
|
| | | | | | | | | 314,264 |
| |
|
| Household Products 0.5% | | | | | | |
| Church & Dwight Co. | | | | | | 2,011 | | 107,025 |
| |
|
| Personal Products 0.8% | | | | | | |
| Alberto-Culver Co. | | | | | | 7,366 | | 197,335 |
| |
|
| Tobacco 0.8% | | | | | | | | |
| Universal Corp. | | | | | | 3,537 | | 176,178 |
| |
|
| ENERGY 6.0% | | | | | | | | |
| Energy Equipment & Services 2.9% | | | | |
| Grey Wolf, Inc. * | | | | | | 21,162 | | 126,126 |
| Patterson-UTI Energy, Inc. | | | | 4,795 | | 93,792 |
| SEACOR Holdings, Inc. | | | | | | 2,031 | | 179,134 |
| Tidewater, Inc. | | | | | | 2,396 | | 126,892 |
| Trico Marine Services, Inc. | | | | 4,894 | | 157,048 |
| |
|
| | | | | | | | | 682,992 |
| |
|
| Oil, Gas & Consumable Fuels 3.1% | | | | |
| Continental Resources, Inc. | | | | 5,011 | | 124,824 |
| Frontier Oil Corp. | | | | | | 4,423 | | 155,999 |
| Helix Energy Solutions, Inc. * | | | | 3,134 | | 115,864 |
| Mariner Energy, Inc. * | | | | | | 6,650 | | 166,649 |
| Swift Energy Co. * | | | | | | 2,169 | | 93,593 |
| Tesoro Corp. | | | | | | 1,844 | | 72,008 |
| |
|
| | | | | | | | | 728,937 |
| |
|
| FINANCIALS 25.7% | | | | | | |
| Capital Markets 2.4% | | | | | | |
| Jefferies Group, Inc. | | | | | | 2,906 | | 58,759 |
| Knight Capital Group, Inc., Class A * | | 8,529 | | 142,861 |
| MCG Capital Corp. | | | | | | 6,675 | | 88,470 |
| Raymond James Financial, Inc. | | | | 4,486 | | 126,012 |
| Waddell & Reed Financial, Inc., Class A | | 4,676 | | 155,150 |
| |
|
| | | | | | | | | 571,252 |
| |
|
| Commercial Banks 6.5% | | | | | | |
| Banco Latinoamericano de Exportaciones SA | | 6,759 | | 104,291 |
| BOK Financial Corp. | | | | | | 1,481 | | 80,685 |
| Center Financial Corp. | | | | | | 4,137 | | 47,906 |
| Central Pacific Financial Corp. | | | | 3,614 | | 68,666 |
| Colonial BancGroup, Inc. (p) | | | | 5,171 | | 81,185 |
| East West Bancorp, Inc. | | | | | | 3,545 | | 85,293 |
| Hanmi Financial Corp. | | | | | | 5,029 | | 43,650 |
See Notes to Financial Statements
10
SCHEDULE OF INVESTMENTS continued
January 31, 2008 (unaudited)
| | | Shares | | Value |
|
| |
| COMMON STOCKS continued | | | | |
| FINANCIALS continued | | | | |
| Commercial Banks continued | | | | |
| Irwin Financial Corp. | | 8,198 | | $ 94,195 |
| Oriental Financial Group, Inc. | | 9,705 | | 154,989 |
| Pacific Capital Bancorp | | 4,074 | | 87,591 |
| Peoples Bancorp, Inc. | | 4,967 | | 117,321 |
| Popular, Inc. (p) | | 15,254 | | 206,234 |
| Simmons First National Corp., Class A | | 2,116 | | 59,989 |
| South Financial Group, Inc. | | 5,808 | | 100,362 |
| Southwest Bancorp, Inc. | | 5,668 | | 99,700 |
| Taylor Capital Group, Inc. | | 4,608 | | 90,271 |
| |
|
| | | | | 1,522,328 |
| |
|
| Consumer Finance 0.4% | | | | |
| Cash America International, Inc. | | 2,867 | | 93,206 |
| |
|
| Diversified Financial Services 0.6% | | | | |
| Nasdaq Stock Market, Inc. * | | 2,896 | | 133,998 |
| |
|
| Insurance 10.5% | | | | |
| Allied World Assurance Co. Holdings, Ltd. | | 2,647 | | 125,060 |
| American Physicians Capital, Inc. | | 1,762 | | 72,806 |
| Arch Capital Group, Ltd. | | 2,939 | | 207,082 |
| Aspen Insurance Holdings, Ltd. | | 6,728 | | 189,864 |
| Axis Capital Holdings, Ltd. | | 6,456 | | 258,498 |
| Cathay Financial Holding Co., Ltd. | | 3,190 | | 82,545 |
| HCC Insurance Holdings, Inc. | | 5,690 | | 158,523 |
| IPC Holdings, Ltd. | | 6,671 | | 171,645 |
| National Financial Partners Corp. | | 1,726 | | 62,309 |
| PartnerRe, Ltd. | | 2,253 | | 178,618 |
| Reinsurance Group of America, Inc. | | 2,983 | | 172,924 |
| RenaissanceRe Holdings, Ltd. | | 3,996 | | 227,732 |
| Safety Insurance Group, Inc. | | 2,998 | | 116,982 |
| TransAtlantic Holdings, Inc. | | 1,433 | | 97,731 |
| Universal American Financial Corp. | | 6,725 | | 186,484 |
| Zenith National Insurance Corp. | | 3,844 | | 153,068 |
| |
|
| | | | | 2,461,871 |
| |
|
| Real Estate Investment Trusts 4.5% | | | | |
| Agree Realty Corp. | | 4,376 | | 129,180 |
| Arbor Realty Trust, Inc. | | 4,895 | | 86,984 |
| Capital Trust, Inc., Class A (p) | | 1,946 | | 55,831 |
| Deerfield Capital Corp. (p) | | 8,200 | | 65,518 |
| First Industrial Realty Trust, Inc. | | 2,837 | | 98,813 |
| Gramercy Capital Corp. (p) | | 2,927 | | 67,760 |
| Hospitality Properties Trust | | 4,671 | | 158,580 |
| HRPT Properties Trust | | 12,954 | | 102,984 |
| LaSalle Hotel Properties | | 3,564 | | 97,689 |
See Notes to Financial Statements
11
SCHEDULE OF INVESTMENTS continued
January 31, 2008 (unaudited)
| | | | | | | | | Shares | | Value |
|
| |
| COMMON STOCKS continued | | | | | | |
| FINANCIALS continued | | | | | | | | |
| Real Estate Investment Trusts continued | | | | |
| LTC Properties, Inc. | | | | | | | | 2,098 | | $ 54,653 |
| Newcastle Investment Corp. | | | | | | | | 3,538 | | 44,225 |
| Potlatch Corp. | | | | | | | | 2,387 | | 102,474 |
| |
|
| | | | | | | | | | | 1,064,691 |
| |
|
| Thrifts & Mortgage Finance 0.8% | | | | | | |
| Corus Bankshares, Inc. (p) | | | | | | | | 5,122 | | 65,152 |
| FirstFed Financial Corp. * (p) | | | | | | | | 1,620 | | 67,959 |
| PMI Group, Inc. | | | | | | | | 4,827 | | 45,856 |
| |
|
| | | | | | | | | | | 178,967 |
| |
|
| HEALTH CARE 6.5% | | | | | | | | | | |
| Biotechnology 0.5% | | | | | | | | | | |
| Applera Corp. - Celera Genomics Group * | | 8,328 | | 127,585 |
| |
|
| Health Care Equipment & Supplies 0.3% | | | | |
| Varian Medical Systems, Inc. | | | | | | 1,228 | | 66,619 |
| |
|
| Health Care Providers & Services 3.0% | | | | |
| AMERIGROUP Corp. * | | | | | | | | 4,791 | | 179,758 |
| Centene Corp. * | | | | | | | | 5,771 | | 138,158 |
| Health Net, Inc. * | | | | | | | | 2,343 | | 108,926 |
| HealthSpring, Inc. * | | | | | | | | 6,498 | | 134,444 |
| Molina Healthcare, Inc. * | | | | | | | | 3,919 | | 133,677 |
| |
|
| | | | | | | | | | | 694,963 |
| |
|
| Life Sciences Tools & Services 1.5% | | | | |
| Charles River Laboratories International, Inc. * | | 2,740 | | 170,154 |
| Invitrogen Corp. * | | | | | | | | 1,986 | | 170,140 |
| |
|
| | | | | | | | | | | 340,294 |
| |
|
| Pharmaceuticals 1.2% | | | | | | | | |
| King Pharmaceuticals, Inc. * | | | | | | 13,183 | | 138,290 |
| Watson Pharmaceuticals, Inc. * | | | | | | 5,727 | | 149,532 |
| |
|
| | | | | | | | | | | 287,822 |
| |
|
| INDUSTRIALS 11.3% | | | | | | | | | | |
| Aerospace & Defense 0.2% | | | | | | | | |
| Curtiss-Wright Corp. | | | | | | | | 1,369 | | 57,087 |
| |
|
| Air Freight & Logistics 0.4% | | | | | | | | |
| Pacer International, Inc. | | | | | | | | 5,719 | | 97,966 |
| |
|
| Airlines 0.5% | | | | | | | | | | |
| UAL Corp. | | | | | | | | 3,122 | | 118,480 |
| |
|
See Notes to Financial Statements
12
SCHEDULE OF INVESTMENTS continued
January 31, 2008 (unaudited)
| | | | | Shares | | Value |
|
| |
| COMMON STOCKS continued | | | | |
| INDUSTRIALS continued | | | | | | |
| Commercial Services & Supplies 2.2% | | | | |
| Bowne & Co. | | | | 6,580 | | $ 80,934 |
| Deluxe Corp. | | | | 3,559 | | 86,555 |
| RSC Holdings, Inc. | | | | 7,239 | | 79,629 |
| Spherion Corp. * | | | | 20,240 | | 135,203 |
| United Stationers, Inc. * | | | | 2,242 | | 123,893 |
| |
|
| | | | | | | 506,214 |
| |
|
| Construction & Engineering 1.0% | | | | |
| EMCOR Group, Inc. | | | | 6,512 | | 142,808 |
| Perini Corp. * | | | | 2,572 | | 89,892 |
| |
|
| | | | | | | 232,700 |
| |
|
| Electrical Equipment 1.1% | | | | | | |
| Acuity Brands, Inc. | | | | 2,837 | | 129,456 |
| Hubbell, Inc., Class B | | | | 2,542 | | 121,203 |
| |
|
| | | | | | | 250,659 |
| |
|
| Industrial Conglomerates 1.2% | | | | |
| Teleflex, Inc. | | | | 2,511 | | 148,450 |
| Tredegar Corp. | | | | 9,715 | | 134,650 |
| |
|
| | | | | | | 283,100 |
| |
|
| Machinery 3.7% | | | | | | |
| AGCO Corp. * | | | | 2,946 | | 177,408 |
| Gardner Denver, Inc. * | | | | 5,225 | | 169,499 |
| Mueller Industries, Inc. | | | | 5,397 | | 151,116 |
| SPX Corp. | | | | 2,101 | | 211,361 |
| Timken Co. | | | | 5,518 | | 166,809 |
| |
|
| | | | | | | 876,193 |
| |
|
| Road & Rail 0.4% | | | | | | |
| Hertz Global Holdings, Inc. | | | | 6,990 | | 104,291 |
| |
|
| Trading Companies & Distributors 0.6% | | | | |
| GATX Corp. | | | | 3,533 | | 132,841 |
| |
|
| INFORMATION TECHNOLOGY 10.6% | | | | |
| Communications Equipment 2.6% | | | | |
| ADC Telecommunications, Inc. * | | | | 6,414 | | 94,863 |
| Adtran, Inc. | | | | 5,038 | | 104,841 |
| CommScope, Inc. * | | | | 2,130 | | 94,130 |
| Extreme Networks, Inc. * | | | | 32,630 | | 112,573 |
| Plantronics, Inc. | | | | 4,687 | | 89,522 |
| Tekelec * | | | | 9,923 | | 118,977 |
| |
|
| | | | | | | 614,906 |
| |
|
See Notes to Financial Statements
13
SCHEDULE OF INVESTMENTS continued
January 31, 2008 (unaudited)
| | | | | Shares | | Value |
|
| |
| COMMON STOCKS continued | | | | | | |
| INFORMATION TECHNOLOGY continued | | | | | | |
| Computers & Peripherals 1.0% | | | | | | |
| Lexmark International, Inc., Class A * | | | | 3,385 | | $ 122,571 |
| QLogic Corp. * | | | | 7,153 | | 102,288 |
| |
|
| | | | | | | 224,859 |
| |
|
| Electronic Equipment & Instruments 1.6% | | | | | | |
| Avnet, Inc. * | | | | 4,028 | | 143,437 |
| AVX Corp. | | | | 2,668 | | 34,764 |
| Littelfuse, Inc. * | | | | 2,868 | | 87,158 |
| Tech Data Corp. * | | | | 3,052 | | 104,928 |
| |
|
| | | | | | | 370,287 |
| |
|
| IT Services 2.1% | | | | | | |
| CACI International, Inc., Class A * | | | | 3,224 | | 140,534 |
| CIBER, Inc. | | | | 16,403 | | 79,063 |
| Hewitt Associates, Inc., Class A * | | | | 3,881 | | 144,257 |
| ManTech International Corp., Class A * | | | | 2,938 | | 120,164 |
| |
|
| | | | | | | 484,018 |
| |
|
| Semiconductors & Semiconductor Equipment 2.0% | | | | |
| Amkor Technology, Inc. * | | | | 8,266 | | 63,152 |
| Entegris, Inc. * | | | | 12,323 | | 94,887 |
| Integrated Device Technology, Inc. | | | | 10,536 | | 78,493 |
| RF Micro Devices Inc. | | | | 14,759 | | 47,672 |
| Teradyne, Inc. * | | | | 10,098 | | 110,775 |
| Zoran Corp. * | | | | 6,706 | | 79,131 |
| |
|
| | | | | | | 474,110 |
| |
|
| Software 1.3% | | | | | | |
| Compuware Corp. * | | | | 13,460 | | 114,410 |
| Lawson Software, Inc. | | | | 10,452 | | 90,828 |
| Parametric Technology Corp. | | | | 6,718 | | 110,511 |
| |
|
| | | | | | | 315,749 |
| |
|
| MATERIALS 8.0% | | | | | | |
| Chemicals 5.3% | | | | | | |
| Celanese Corp., Ser. A | | | | 5,607 | | 208,468 |
| Cytec Industries, Inc. | | | | 2,413 | | 136,600 |
| Eastman Chemical Co. | | | | 1,386 | | 91,573 |
| H.B. Fuller Co. | | | | 6,049 | | 125,577 |
| International Flavors & Fragrances, Inc. | | | | 2,626 | | 111,894 |
| Lubrizol Corp. | | | | 3,953 | | 207,967 |
| OM Group, Inc. | | | | 2,896 | | 166,173 |
| PolyOne Corp. * | | | | 13,571 | | 83,598 |
| Spartech Corp. | | | | 8,081 | | 119,033 |
| |
|
| | | | | | | 1,250,883 |
| |
|
See Notes to Financial Statements
14
SCHEDULE OF INVESTMENTS continued
January 31, 2008 (unaudited)
| | | | | Shares | | Value |
|
| |
| COMMON STOCKS continued | | | | | | |
| MATERIALS continued | | | | | | |
| Metals & Mining 1.6% | | | | | | |
| Carpenter Technology Corp. | | | | 2,824 | | $ 174,071 |
| Quanex Corp. | | | | 3,798 | | 199,053 |
| |
|
| | | | | | | 373,124 |
| |
|
| Paper & Forest Products 1.1% | | | | | | |
| Buckeye Technologies, Inc. | | | | 8,862 | | 116,535 |
| Schweitzer-Mauduit International, Inc. | | | | 6,045 | | 144,113 |
| |
|
| | | | | | | 260,648 |
| |
|
| TELECOMMUNICATION SERVICES 2.1% | | | | |
| Diversified Telecommunication Services 1.4% | | | | |
| CenturyTel, Inc. | | | | 4,563 | | 168,420 |
| IDT Corp., Class B * | | | | 11,658 | | 80,907 |
| Premiere Global Services, Inc. * | | | | 7,496 | | 91,376 |
| |
|
| | | | | | | 340,703 |
| |
|
| Wireless Telecommunication Services 0.7% | | | | |
| Telephone & Data Systems, Inc. | | | | 2,973 | | 156,796 |
| |
|
| UTILITIES 10.8% | | | | | | |
| Electric Utilities 3.4% | | | | | | |
| CMS Energy Corp. | | | | 11,904 | | 186,536 |
| Northeast Utilities | | | | 7,251 | | 200,998 |
| Pepco Holdings, Inc. | | | | 9,848 | | 250,730 |
| UIL Holdings Corp. | | | | 4,571 | | 156,099 |
| |
|
| | | | | | | 794,363 |
| |
|
| Gas Utilities 4.3% | | | | | | |
| AGL Resources, Inc. | | | | 3,338 | | 126,343 |
| Energen Corp. | | | | 2,896 | | 182,159 |
| Northwest Natural Gas Co. | | | | 1,910 | | 90,991 |
| ONEOK, Inc. | | | | 5,033 | | 236,551 |
| Southern Union Co. | | | | 3,692 | | 100,349 |
| UGI Corp. | | | | 3,857 | | 102,926 |
| WGL Holdings, Inc. | | | | 5,146 | | 165,907 |
| |
|
| | | | | | | 1,005,226 |
| |
|
| Multi-Utilities 3.1% | | | | | | |
| Alliant Energy Corp. | | | | 4,914 | | 181,327 |
| CenterPoint Energy, Inc. | | | | 8,374 | | 134,068 |
| NSTAR | | | | 6,214 | | 201,520 |
| OGE Energy Corp. | | | | 6,258 | | 204,824 |
| |
|
| | | | | | | 721,739 |
| |
|
| Total Common Stocks (cost $26,036,196) | | | | 22,825,801 |
| |
|
See Notes to Financial Statements
15
SCHEDULE OF INVESTMENTS continued
January 31, 2008 (unaudited)
| | | | | Principal | | |
| | | | | Amount | | Value |
|
| SHORT-TERM INVESTMENTS 6.4% | | | | |
| U.S. TREASURY OBLIGATIONS 0.4% | | | | |
| U.S. Treasury Bill, 2.70%, 03/20/2008 ß ƒ | | $ 100,000 | | $ 99,640 |
| | |
|
|
| | | | | Shares | | Value |
|
| |
| MUTUAL FUND SHARES 6.0% | | | | |
| AIM Short-Term Investments Trust Government & Agency Portfolio, | | | | |
| Class I, 3.72% q (pp) | | | | 736,701 | | 736,701 |
| Evergreen Institutional Money Market Fund, Class I, 4.31% q ø | | 656,308 | | 656,308 |
| |
|
| | | | | | | 1,393,009 |
| |
|
| Total Short-Term Investments (cost $1,492,649) | | | | 1,492,649 |
| |
|
| Total Investments (cost $27,528,845) 103.7% | | | | 24,318,450 |
| Other Assets and Liabilities (3.7%) | | | | (867,080) |
| |
|
| Net Assets 100.0% | | | | | | $ 23,451,370 |
| |
|
| (p) | | All or a portion of this security is on loan. |
| * | | Non-income producing security |
| q | | Rate shown is the 7-day annualized yield at period end. |
| (pp) | | All or a portion of this security represents investment of cash collateral received from securities on loan. |
| ø | | Evergreen Investment Management Company, LLC is the investment advisor to both the Fund and the money market |
| | | fund. |
| ß | | Rate shown represents the yield to maturity at date of purchase. |
| ƒ | | All or a portion of this security was pledged to cover initial margin requirements for open futures contracts. |
| The following table shows the percent of total long-term investments by sector as of January 31, 2008: |
| |
| Financials | | 26.4% | |
| Industrials | | 11.6% | |
| Utilities | | 11.0% | |
| Information Technology | | 10.9% | |
| Consumer Discretionary | | 10.9% | |
| Materials | | 8.3% | |
| Health Care | | 6.6% | |
| Energy | | 6.2% | |
| Consumer Staples | | 5.9% | |
| Telecommunication Services | | 2.2% | |
| |
| |
| | | 100.0% | |
| | |
| |
See Notes to Financial Statements
16
STATEMENT OF ASSETS AND LIABILITIES
January 31, 2008 (unaudited)
| Assets | | |
| Investments in securities, at value (cost $26,872,537) including $730,579 | | |
| of securities loaned | | $ 23,662,142 |
| Investments in affiliated money market fund, at value (cost $656,308) | | 656,308 |
|
| Total investments | | 24,318,450 |
| Receivable for securities sold | | 991,005 |
| Dividends receivable | | 32,378 |
| Receivable for daily variation margin on open futures contracts | | 15,620 |
| Receivable for securities lending income | | 2,491 |
| Prepaid expenses and other assets | | 5,480 |
|
| Total assets | | 25,365,424 |
|
| Liabilities | | |
| Payable for securities purchased | | 1,140,825 |
| Payable for Fund shares redeemed | | 20,960 |
| Payable for securities on loan | | 736,701 |
| Advisory fee payable | | 319 |
| Due to other related parties | | 213 |
| Accrued expenses and other liabilities | | 15,036 |
|
| Total liabilities | | 1,914,054 |
|
| Net assets | | $ 23,451,370 |
|
| Net assets represented by | | |
| Paid-in capital | | $ 28,057,673 |
| Undistributed net investment income | | 66,887 |
| Accumulated net realized losses on investments | | (1,422,676) |
| Net unrealized losses on investments | | (3,250,514) |
|
| Total net assets | | $ 23,451,370 |
|
| Net assets consists of | | |
| Class A | | $ 27,453 |
| Class I | | 23,423,917 |
|
| Total net assets | | $ 23,451,370 |
|
| Shares outstanding (unlimited number of shares authorized) | | |
| Class A | | 2,846 |
| Class I | | 2,417,228 |
|
| Net asset value per share | | |
| Class A | | $ 9.65 |
| Class A—Offering price (based on sales charge of 5.75%) | | $ 10.24 |
| Class I | | $ 9.69 |
|
See Notes to Financial Statements
17
STATEMENT OF OPERATIONS
Six Months Ended January 31, 2008 (unaudited)
| Investment income | | |
| Dividends (net of foreign withholding taxes of $725) | | $ 264,747 |
| Income from affiliate | | 20,874 |
| Securities lending | | 12,128 |
| Interest | | 4,443 |
|
| Total investment income | | 302,192 |
|
| Expenses | | |
| Advisory fee | | 91,558 |
| Distribution Plan expenses | | 46 |
| Administrative services fee | | 13,029 |
| Transfer agent fees | | 40 |
| Trustees’ fees and expenses | | 421 |
| Printing and postage expenses | | 9,031 |
| Custodian and accounting fees | | 9,993 |
| Registration and filing fees | | 14,405 |
| Professional fees | | 9,680 |
| Other | | 326 |
|
| Total expenses | | 148,529 |
| Less: Expense reductions | | (403) |
| Fee waivers and expense reimbursements | | (27,946) |
|
| Net expenses | | 120,180 |
|
| Net investment income | | 182,012 |
|
| Net realized and unrealized gains or losses on investments | | |
| Net realized losses on: | | |
| Securities | | (1,279,798) |
| Futures contracts | | (177,249) |
|
| Net realized losses on investments | | (1,457,047) |
| Net change in unrealized gains or losses on investments | | (1,433,862) |
|
| Net realized and unrealized gains or losses on investments | | (2,890,909) |
|
| Net decrease in net assets resulting from operations | | $ (2,708,897) |
|
See Notes to Financial Statements
18
STATEMENTS OF CHANGES IN NET ASSETS
| | | Six Months Ended | | | | |
| | | January 31, 2008 | | Year Ended |
| | | (unaudited) | | July 31, 2007 |
|
| Operations | | | | | | | | |
| Net investment income | | $ 182,012 | | $ 213,560 |
| Net realized gains or losses on investments | | | | (1,457,047) | | | | 659,695 |
| Net change in unrealized gains or losses | | | | | | | | |
| on investments | | | | (1,433,862) | | | | (1,977,985) |
|
| Net decrease in net assets resulting from | | | | | | | | |
| operations | | | | (2,708,897) | | | | (1,104,730) |
|
| Distributions to shareholders from | | | | | | | | |
| Net investment income | | | | | | | | |
| Class A | | | | (228) | | | | (337) |
| Class I | | | | (270,849) | | | | (92,917) |
| Net realized gains | | | | | | | | |
| Class A | | | | (731) | | | | (144) |
| Class I | | | | (596,084) | | | | (36,420) |
|
| Total distributions to shareholders | | | | (867,892) | | | | (129,818) |
|
| | | Shares | | | | Shares | | |
| Capital share transactions | | | | | | | | |
| Proceeds from shares sold | | | | | | | | |
| Class A | | 0 | | 0 | | 2,727 | | 29,688 |
| Class I | | 392,784 | | 4,191,843 | | 2,084,856 | | 25,040,612 |
|
| | | | | 4,191,843 | | | | 25,070,300 |
|
| Net asset value of shares issued in | | | | | | | | |
| reinvestment of distributions | | | | | | | | |
| Class A | | 90 | | 926 | | 40 | | 464 |
| Class I | | 21,056 | | 217,549 | | 93 | | 1,084 |
|
| | | | | 218,475 | | | | 1,548 |
|
| Payment for shares redeemed | | | | | | | | |
| Class A | | (111) | | (1,115) | | 0 | | 0 |
| Class I | | (500,074) | | (5,229,008) | | (219,189) | | (2,655,406) |
|
| | | | | (5,230,123) | | | | (2,655,406) |
|
| Net increase (decrease) in net assets | | | | | | | | |
| resulting from capital share transactions | | | | (819,805) | | | | 22,416,442 |
|
| Total increase (decrease) in net assets | | | | (4,396,594) | | | | 21,181,894 |
| Net assets | | | | | | | | |
| Beginning of period | | | | 27,847,964 | | | | 6,666,070 |
|
| End of period | | $ 23,451,370 | | $ 27,847,964 |
|
| Undistributed net investment income | | $ 66,887 | | $ 155,952 |
|
See Notes to Financial Statements
19
NOTES TO FINANCIAL STATEMENTS (unaudited)
1. ORGANIZATION
Evergreen Disciplined Small-Mid Value Fund (the “Fund”) is a diversified series of Evergreen Equity Trust (the “Trust”), a Delaware statutory trust organized on September 18, 1997. The Trust is an open-end management investment company registered under the Investment Company Act of 1940, as amended (the “1940 Act”).
The Fund offers Class A and Class I shares. Class A shares are sold with a front-end sales charge. However, Class A share investments of $1 million or more are not subject to a front-end sales charge but are subject to a contingent deferred sales charge of 1.00% upon redemption within 18 months. Class A shares are currently not available for sale to the public. Class I shares are sold without a front-end sales charge or contingent deferred sales charge. Class A shares pay an ongoing distribution fee.
2. SIGNIFICANT ACCOUNTING POLICIES
The following is a summary of significant accounting policies consistently followed by the Fund in the preparation of its financial statements. The policies are in conformity with generally accepted accounting principles in the United States of America, which require management to make estimates and assumptions that affect amounts reported herein. Actual results could differ from these estimates.
a. Valuation of investments
Listed equity securities are usually valued at the last sales price or official closing price on the national securities exchange where the securities are principally traded.
Short-term securities with remaining maturities of 60 days or less at the time of purchase are valued at amortized cost, which approximates market value.
Investments in open-end mutual funds are valued at net asset value. Securities for which market quotations are not readily available or not reflective of current market value are valued at fair value as determined by the investment advisor in good faith, according to procedures approved by the Board of Trustees.
b. Repurchase agreements
Securities pledged as collateral for repurchase agreements are held by the custodian bank or in a segregated account in the Fund’s name until the agreements mature. Collateral for certain tri-party repurchase agreements is held at the counterparty’s custodian in a segregated account for the benefit of the Fund and the counterparty. Each agreement requires that the market value of the collateral be sufficient to cover payments of interest and principal. However, in the event of default or bankruptcy by the other party to the agreement, retention of the collateral may be subject to legal proceedings. The Fund will enter into repurchase agreements with banks and other financial institutions, which are deemed by the investment advisor to be creditworthy pursuant to guidelines established by the Board of Trustees. In certain instances, the Fund’s securities lending agent may provide collateral in the form of repurchase agreements.
20
NOTES TO FINANCIAL STATEMENTS (unaudited) continued
c. Futures contracts
In order to gain exposure to, or protect against changes in, security values, the Fund may buy and sell futures contracts. The primary risks associated with the use of futures contracts are the imperfect correlation between changes in market values of securities held by the Fund and the prices of futures contracts, and the possibility of an illiquid market.
Futures contracts are valued based upon their quoted daily settlement prices. The aggregate principal amounts of the contracts are not recorded in the financial statements. Fluctuations in the value of the contracts are recorded in the Statement of Assets and Liabilities as an asset or liability and in the Statement of Operations as unrealized gains or losses until the contracts are closed, at which point they are recorded as net realized gains or losses on futures contracts.
d. Securities lending
The Fund may lend its securities to certain qualified brokers in order to earn additional income. The Fund receives compensation in the form of fees or interest earned on the investment of any cash collateral received. The Fund also continues to receive interest and dividends on the securities loaned. The Fund receives collateral in the form of cash or securities with a market value at least equal to the market value of the securities on loan. In the event of default or bankruptcy by the borrower, the Fund could experience delays and costs in recovering the loaned securities or in gaining access to the collateral. The Fund has the right under the lending agreement to recover the securities from the borrower on demand.
e. Security transactions and investment income
Security transactions are recorded on trade date. Realized gains and losses are computed using the specific cost of the security sold. Interest income is recorded on the accrual basis and includes accretion of discounts and amortization of premiums. Dividend income is recorded on the ex-dividend date. Foreign income and capital gains realized on some securities may be subject to foreign taxes, which are accrued as applicable.
f. Federal taxes
The Fund intends to continue to qualify as a regulated investment company and distribute all of its taxable income, including any net capital gains (which have already been offset by available capital loss carryovers). Accordingly, no provision for federal taxes is required.
g. Distributions
Distributions to shareholders from net investment income and net realized gains, if any, are recorded on the ex-dividend date. Such distributions are determined in conformity with income tax regulations, which may differ from generally accepted accounting principles.
h. Class allocations
Income, common expenses and realized and unrealized gains and losses are allocated to the classes based on the relative net assets of each class. Distribution fees, if any, are calculated daily at the class level based on the appropriate net assets of each class and the specific expense rates applicable to each class.
21
NOTES TO FINANCIAL STATEMENTS (unaudited) continued
3. ADVISORY FEE AND OTHER TRANSACTIONS WITH AFFILIATES
Evergreen Investment Management Company, LLC (“EIMC”), an indirect, wholly-owned subsidiary of Wachovia Corporation (“Wachovia”), is the investment advisor to the Fund and is paid an annual fee starting at 0.70% and declining to 0.65% as average daily net assets increase. For the six months ended January 31, 2008, the advisory fee was equivalent to 0.70% of the Fund’s average daily net assets (on an annualized basis).
From time to time, EIMC may voluntarily or contractually waive its fee and/or reimburse expenses in order to limit operating expenses. During the six months ended January 31, 2008, EIMC contractually and voluntarily waived its advisory fee in the amounts of $22,099 and $5,840, respectively, and voluntarily reimbursed Distribution Plan expenses (see Note 4) relating to Class A shares in the amount of $7.
The Fund may invest in money market funds which are advised by EIMC. Income earned on these investments is included in income from affiliate on the Statement of Operations.
Effective January 1, 2008, EIMC replaced Evergreen Investment Services, Inc. (“EIS”), an indirect, wholly-owned subsidiary of Wachovia, as the administrator to the Fund upon the assignment of the Fund’s Administrative Services Agreement from EIS to EIMC. There were no changes to the services being provided or fees being paid by the Fund. The administrator provides the Fund with facilities, equipment and personnel and is paid an annual rate determined by applying percentage rates to the aggregate average daily net assets of the Evergreen funds (excluding money market funds and Evergreen Institutional Enhanced Income Fund), starting at 0.10% and declining to 0.05% as the aggregate average daily net assets of the Evergreen funds (excluding money market funds and Evergreen Institutional Enhanced Income Fund) increase.
Evergreen Service Company, LLC (“ESC”), an indirect, wholly-owned subsidiary of Wachovia, is the transfer and dividend disbursing agent for the Fund. ESC receives account fees that vary based on the type of account held by the shareholders in the Fund.
Wachovia Bank NA, through its securities lending division of Wachovia Global Securities Lending, acts as the securities lending agent for the Fund.
4. DISTRIBUTION PLAN
EIS serves as distributor of the Fund’s shares. The Fund has adopted a Distribution Plan, as allowed by Rule 12b-1 of the 1940 Act, for Class A shares. Under the Distribution Plan, distribution fees are paid at an annual rate of 0.30% of the average daily net assets for Class A shares.
5. INVESTMENT TRANSACTIONS
Cost of purchases and proceeds from sales of investment securities (excluding short-term securities) were $8,907,610 and $9,329,848, respectively, for the six months ended January 31, 2008.
During the six months ended January 31, 2008, the Fund loaned securities to certain brokers. At January 31, 2008, the value of securities on loan and the total value of collateral received for securities loaned amounted to $730,579 and $736,701, respectively.
22
NOTES TO FINANCIAL STATEMENTS (unaudited) continued
At January 31, 2008, the Fund had open long futures contracts outstanding as follows:
| | | | | Initial | | Value at | | |
| | | | | Contract | | January 31, | | Unrealized |
| Expiration | | Contracts | | Amount | | 2008 | | Loss |
|
| March 2008 | | 3 Russell 2000 | | $ 229,418 | | $ 214,500 | | $14,918 |
| | | Mini Futures | | | | | | |
| |
| March 2008 | | 4 S&P MidCap | | 347,761 | | 322,560 | | 25,201 |
| | | 400 Futures | | | | | | |
|
On January 31, 2008 the aggregate cost of securities for federal income tax purposes was $27,537,286. The gross unrealized appreciation and depreciation on securities based on tax cost was $594,819 and $3,813,655, respectively, with a net unrealized depreciation of $3,218,836.
6. INTERFUND LENDING
Pursuant to an Exemptive Order issued by the SEC, the Fund may participate in an interfund lending program with certain funds in the Evergreen fund family. This program allows the Fund to borrow from, or lend money to, other participating funds. During the six months ended January 31, 2008, the Fund did not participate in the interfund lending program.
7. EXPENSE REDUCTIONS
Through expense offset arrangements with ESC and the Fund’s custodian, a portion of fund expenses has been reduced.
8. DEFERRED TRUSTEES’ FEES
Each Trustee of the Fund may defer any or all compensation related to performance of his or her duties as a Trustee. The Trustees’ deferred balances are allocated to deferral accounts, which are included in the accrued expenses for the Fund. The investment performance of the deferral accounts is based on the investment performance of certain Evergreen funds. Any gains earned or losses incurred in the deferral accounts are reported in the Fund’s Trustees’ fees and expenses. At the election of the Trustees, the deferral account will be paid either in one lump sum or in quarterly installments for up to ten years.
9. FINANCING AGREEMENT
The Fund and certain other Evergreen funds share in an unsecured revolving credit commitment for temporary and emergency purposes, including the funding of redemptions, as permitted by each participating fund’s borrowing restrictions. Borrowings under this facility bear interest at 0.50% per annum above the Federal Funds rate. All of the participating funds are charged an annual commitment fee on the unused balance, which is allocated pro rata. The credit facility is for $100 million with an annual commitment fee of 0.08%. During the six months ended January 31, 2008, the Fund had no borrowings.
23
NOTES TO FINANCIAL STATEMENTS (unaudited) continued
10. REGULATORY MATTERS AND LEGAL PROCEEDINGS
Pursuant to an administrative order issued by the SEC on September 19, 2007, EIMC, EIS, ESC (collectively, the “Evergreen Entities”), Wachovia Securities, LLC and the SEC have entered into an agreement settling allegations of (i) improper short-term trading arrangements in effect prior to May 2003 involving former officers and employees of EIMC and certain broker-dealers, (ii) insufficient systems for monitoring exchanges and enforcing exchange limitations as stated in certain funds’ prospectuses, and (iii) inadequate e-mail retention practices. Under the settlement, the Evergreen Entities were censured and paid approximately $32 million in disgorgement and penalties. This amount, along with a fine assessed by the SEC against Wachovia Securities, LLC will be distributed pursuant to a plan to be developed by an independent distribution consultant and approved by the SEC. The Evergreen Entities neither admitted nor denied the allegations and findings set forth in its settlement with the SEC.
In addition, the Evergreen funds and EIMC and certain of its affiliates are involved in various legal actions, including private litigation and class action lawsuits. EIMC does not expect that any of such legal actions currently pending or threatened will have a material adverse impact on the financial position or operations of any of the Evergreen funds or on EIMC’s ability to provide services to the Evergreen funds.
Although EIMC believes that none of the matters discussed above will have a material adverse impact on the Evergreen funds, there can be no assurance that these matters and any publicity surrounding or resulting from them will not result in reduced sales or increased redemptions of Evergreen fund shares, which could increase Evergreen fund transaction costs or operating expenses, or that they will not have other adverse consequences on the Evergreen funds.
11. NEW ACCOUNTING PRONOUNCEMENTS
In June 2006, the Financial Accounting Standards Board (“FASB”) issued FASB Interpretation No. 48, Accounting for Uncertainty in Income Taxes — an interpretation of FASB statement 109 (“FIN 48”). FIN 48 supplements FASB 109 by prescribing a recognition threshold and measurement attribute for the financial statement recognition and measurement of a tax position taken or expected to be taken in a tax return. The Fund’s financial statements have not been impacted by the adoption of FIN 48. However, the conclusions regarding FIN 48 may be subject to review and adjustment at a later date based on factors including, but not limited to, further implementation guidance expected from FASB, and on-going analysis of tax laws, regulations, and interpretations thereof.
In September 2006, FASB issued Statement of Financial Accounting Standards No. 157, Fair Value Measurements (“FAS 157”). FAS 157 establishes a single authoritative definition of fair value, establishes a framework for measuring fair value and expands disclosures about fair value measurements. FAS 157 applies to fair value measurements already required or permitted by existing standards. The change to current generally accepted accounting principles from the application of FAS 157 relates to the definition of fair value, the methods used to measure fair
24
NOTES TO FINANCIAL STATEMENTS (unaudited) continued
value, and the expanded disclosures about fair value measurements. Management of the Fund does not believe the adoption of FAS 157 will materially impact the financial statement amounts, however, additional disclosures may be required about the inputs used to develop the measurements and the effect of certain of the measurements on changes in net assets for the period. FAS 157 is effective for financial statements issued for fiscal years beginning after November 15, 2007 and interim periods within those fiscal years.
25
ADDITIONAL INFORMATION (unaudited)
INFORMATION ABOUT THE REVIEW AND APPROVAL OF THE FUND’S INVESTMENT ADVISORY AGREEMENT
Each year, the Fund’s Board of Trustees is required to consider whether to continue in place the Fund’s investment advisory agreement. In September 2007, the Trustees, including a majority of the Trustees who are not interested persons (as that term is defined in the 1940 Act) of the Fund or of EIMC, approved the continuation of the Fund’s investment advisory agreement. (References below to the “Fund” are to Evergreen Disciplined Small-Mid Value Fund; references to the “funds” are to the Evergreen funds generally.)
At the same time, the Trustees considered the continuation of the investment advisory agreements for all of the funds, and the description below refers in many cases to the Trustees’ process and conclusions in connection with their consideration of this matter for all of the funds. (See “Certain Fund-Specific Considerations” below for a discussion regarding certain factors considered by the Trustees relating specifically to the Fund.) In all of its deliberations, the Board of Trustees and the disinterested Trustees were advised by independent counsel to the disinterested Trustees and counsel to the funds.
The review process. The 1940 Act requires that the Board of Trustees request and evaluate, and that EIMC and any sub-advisors furnish, such information as may reasonably be necessary to evaluate the terms of a fund’s advisory agreement. The review process began at the time of the last advisory contract-renewal process in September 2006. In the course of that process, the Trustees identified a number of funds that had experienced either short-term or longer-term performance issues. During the following months, the Trustees reviewed information relating to any changes in the performance of those funds and/or any changes in the investment process or the investment teams responsible for the management of the funds. In addition, during the course of the year, the Trustees reviewed information regarding the investment performance of all of the funds and identified additional funds that they believed warranted further attention based on performance since September 2006.
In spring 2007, a committee of the Board of Trustees (the “Committee”), working with EIMC management, determined generally the types of information the Board would review and set a timeline detailing the information required and the dates for its delivery to the Trustees. The independent data provider Keil Fiduciary Strategies LLC (“Keil”) was engaged to provide fund-specific and industry-wide data to the Board containing information of a nature and in a format generally prescribed by the Committee, and the Committee worked with Keil and EIMC to develop appropriate groups of peer funds for each fund. The Committee also identified a number of expense, performance, and other issues and requested specific information as to those issues.
The Trustees reviewed, with the assistance of an independent industry consultant retained by the disinterested Trustees, the information provided by EIMC in response to the Committee’s requests and the information provided by Keil. The Trustees formed small committees to review individual funds in greater detail. In addition, the Trustees requested information regarding,
26
ADDITIONAL INFORMATION (unaudited) continued
among other things, brokerage practices of the funds, the use of derivatives by the funds, strategic planning for the funds, analyst and research support available to the portfolio management teams, and information regarding the various fall-out benefits received directly and indirectly by EIMC and its affiliates from the funds. The Trustees requested and received additional information following that review.
The Committee met several times by telephone to consider the information provided by EIMC. The Committee met with representatives of EIMC in early September. At a meeting of the full Board of Trustees later in September, the Committee reported the results of its discussions with EIMC, and the full Board met with representatives of EIMC, engaged in further review of the materials provided to them, and approved the continuation of each of the advisory and sub-advisory agreements.
The disinterested Trustees discussed the continuation of the funds’ advisory agreements with representatives of EIMC and in multiple private sessions with legal counsel at which no personnel of EIMC were present. In considering the continuation of the agreement, the Trustees did not identify any particular information or consideration that was all-important or controlling, and each Trustee attributed different weights to various factors. The Trustees evaluated information provided to them both in terms of the Evergreen mutual funds generally and with respect to each fund, including the Fund, specifically as they considered appropriate; although the Trustees considered the continuation of the agreement as part of the larger process of considering the continuation of the advisory contracts for all of the funds, their determination to continue the advisory agreement for each of the funds was ultimately made on a fund-by-fund basis.
This summary describes a number of the most important, but not necessarily all, of the factors considered by the Board and the disinterested Trustees.
Information reviewed. The Board of Trustees and committees of the Board of Trustees meet periodically during the course of the year. At those meetings, the Board receives a wide variety of information regarding the services performed by EIMC, the investment performance of the funds, and other aspects of the business and operations of the funds. At those meetings, and in the process of considering the continuation of the agreements, the Trustees considered information regarding, for example, the funds’ investment results; the portfolio management teams for the funds and the experience of the members of those teams, and any recent changes in the membership of the teams; portfolio trading practices; compliance by the funds and EIMC with applicable laws and regulations and with the funds’ and EIMC’s compliance policies and procedures; risk evaluation and oversight procedures at EIMC; services provided by affiliates of EIMC to the funds and shareholders of the funds; and other information relating to the nature, extent, and quality of services provided by EIMC. The Trustees considered a number of changes in portfolio management personnel at EIMC and its advisory affiliates in the year since September 2006, and recent changes in compliance personnel at EIMC, including the appointment of a new Chief Compliance Officer for the funds.
27
ADDITIONAL INFORMATION (unaudited) continued
The Trustees considered the rates at which the funds pay investment advisory fees, and the efforts generally by EIMC and its affiliates as sponsors of the funds. The data provided by Keil showed the management fees paid by each fund in comparison to the management fees of other peer mutual funds, in addition to data regarding the investment performance of the funds in comparison to other peer mutual funds. The Trustees were assisted by the independent industry consultant in reviewing the information presented to them.
The Trustees considered the transfer agency fees paid by the funds to an affiliate of EIMC. They reviewed information presented to them showing that the transfer agency fees charged to the funds were generally consistent with industry norms.
The Trustees also considered that EIS, an affiliate of EIMC, serves as administrator to the funds and receives a fee for its services as administrator. In their comparison of the advisory fee paid by the funds with those paid by other mutual funds, the Trustees took into account administrative fees paid by the funds and those other mutual funds. The Board considered that EIS serves as distributor to the funds generally and receives fees from the funds for those services. They considered other so-called “fall-out” benefits to EIMC and its affiliates due to their other relationships with the funds, including, for example, soft-dollar services received by EIMC attributable to transactions entered into by EIMC for the benefit of the funds and brokerage commissions received by Wachovia Securities, LLC, an affiliate of EIMC, from transactions effected by it for the funds. The Trustees also noted that the funds pay sub-transfer agency fees to various financial institutions who hold fund shares in omnibus accounts, and that Wachovia Securities, LLC and its affiliates receive such payments from the funds in respect of client accounts they hold in omnibus arrangements, and that an affiliate of EIMC receives fees for administering the sub-transfer agency payment program. They also considered that Wachovia Securities, LLC and its affiliates receive distribution-related fees and shareholder servicing payments (including amounts derived from payments under the funds’ Rule 12b-1 plans) in respect of shares sold or held through it. The Trustees also noted that an affiliate of EIMC receives compensation for serving as a securities lending agent for the funds.
Nature and quality of the services provided. The Trustees considered that EIMC and its affiliates generally provide a comprehensive investment management service to the funds. They noted that EIMC makes its personnel available to serve as officers of the funds, and concluded that the reporting and management functions provided by EIMC with respect to the funds were generally satisfactory. The Trustees considered the investment philosophy of the Fund’s portfolio management team, and considered the in-house research capabilities of EIMC and its affiliates, as well as other resources available to EIMC, including research services available to it from third parties. The Board considered the managerial and financial resources available to EIMC and its affiliates, and the commitment that the Wachovia organization has made to the funds generally. On the basis of these factors, they determined that the nature and scope of the services provided by EIMC were consistent with its duties under the investment advisory agreements and appropriate and consistent with the investment programs and best interests of the funds.
28
ADDITIONAL INFORMATION (unaudited) continued
The Trustees noted the resources EIMC and its affiliates have committed to the regulatory, compliance, accounting, tax and oversight of tax reporting, and shareholder servicing functions, and the number and quality of staff committed to those functions, which they concluded were appropriate and generally in line with EIMC’s responsibilities to the Fund and to the funds generally. The Board and the disinterested Trustees concluded, within the context of their overall conclusions regarding the funds’ advisory agreements, that they were generally satisfied with the nature, extent, and quality of the services provided by EIMC, including services provided by EIS under its administrative services agreements with the funds.
Investment performance. The Trustees considered the investment performance of each fund, both by comparison to other comparable mutual funds and to broad market indices. The Trustees emphasized that the continuation of the investment advisory agreement for a fund should not be taken as any indication that the Trustees did not believe investment performance for any specific fund might not be improved, and they noted that they would continue to monitor closely the investment performance of the funds going forward.
Advisory and administrative fees. The Trustees recognized that EIMC does not seek to provide the lowest cost investment advisory service, but to provide a high quality, full-service investment management product at a reasonable price. They also noted that EIMC has in many cases sought to set its investment advisory fees at levels consistent with industry norms. The Trustees noted that, in certain cases, a fund’s management fees were higher than many or most other mutual funds in the same Keil peer group. However, in each case, the Trustees determined on the basis of the information presented that the level of management fees was not excessive.
Certain Fund-specific considerations. The Trustees noted that, for the one-year period ended December 31, 2006, the Fund’s Class A shares had outperformed the Fund’s benchmark index, the Russell 2500 Value Index, and a majority of the mutual funds against which the Trustees compared the Fund’s performance. The Trustees also noted that the Fund’s management fee was lower than the management fees of the mutual funds against which the Trustees compared the Fund’s management fee and that the level of profitability realized by EIMC in respect of the fee did not appear excessive.
Economies of scale. The Trustees noted that economies of scale would likely be achieved by EIMC in managing the funds as the funds grow. The Trustees noted that the Fund had implemented breakpoints in its advisory fee structure. The Trustees noted that they would continue to review the appropriate levels of breakpoints in the future, but concluded that the breakpoints as implemented appeared to be a reasonable step toward the realization of economies of scale by the Fund.
Profitability. The Trustees considered information provided to them regarding the profitability to the EIMC organization of the investment advisory, administration, and transfer agency (with respect to the open-end funds only) fees paid to EIMC and its affiliates by each of the funds. They considered that the information provided to them was necessarily estimated, and that the profitability information provided to them, especially on a fund-by-fund basis, did not necessarily
29
ADDITIONAL INFORMATION (unaudited) continued
provide a definitive tool for evaluating the appropriateness of each fund’s advisory fee. They noted that the levels of profitability of the funds to EIMC varied widely, depending on among other things the size and type of fund. They considered the profitability of the funds in light of such factors as, for example, the information they had received regarding the relation of the fees paid by the funds to those paid by other mutual funds, the investment performance of the funds, and the amount of revenues involved. In light of these factors, the Trustees concluded that the profitability of any of the funds, individually or in the aggregate, should not prevent the Trustees from approving the continuation of the agreements.
30
This page left intentionally blank
31
TRUSTEES AND OFFICERS
TRUSTEES1
| Charles A. Austin III | | Investment Counselor, Anchor Capital Advisors, LLC. (investment advice); Director, The Andover |
| Trustee | | Companies (insurance); Trustee, Arthritis Foundation of New England; Former Director, The |
| DOB: 10/23/1934 | | Francis Ouimet Society (scholarship program); Former Director, Executive Vice President and |
| Term of office since: 1991 | | Treasurer, State Street Research & Management Company (investment advice) |
| Other directorships: None | | |
|
| |
| K. Dun Gifford | | Chairman and President, Oldways Preservation and Exchange Trust (education); Trustee, |
| Trustee | | Chairman of the Finance Committee, Member of the Executive Committee, and Former |
| DOB: 10/23/1938 | | Treasurer, Cambridge College |
| Term of office since: 1974 | | |
| Other directorships: None | | |
|
| |
| Dr. Leroy Keith, Jr. | | Managing Director, Almanac Capital Management (commodities firm); Trustee, Phoenix |
| Trustee | | Fund Complex; Director, Diversapack Co. (packaging company); Former Partner, Stonington |
| DOB: 2/14/1939 | | Partners, Inc. (private equity fund); Former Director, Obagi Medical Products Co.; Former |
| Term of office since: 1983 | | Director, Lincoln Educational Services |
| Other directorships: Trustee, | | |
| Phoenix Fund Complex (consisting | | |
| of 53 portfolios as of 12/31/2007) | | |
|
| |
| Carol A. Kosel1 | | Former Consultant to the Evergreen Boards of Trustees; Former Vice President and Senior Vice |
| Trustee | | President, Evergreen Investments, Inc.; Former Treasurer, Evergreen Funds; Former Treasurer, |
| DOB: 12/25/1963 | | Vestaur Securities Fund |
| Term of office since: 2008 | | |
| Other directorships: None | | |
|
| |
| Gerald M. McDonnell | | Former Manager of Commercial Operations, CMC Steel (steel producer) |
| Trustee | | |
| DOB: 7/14/1939 | | |
| Term of office since: 1988 | | |
| Other directorships: None | | |
|
| |
| Patricia B. Norris | | President and Director of Buckleys of Kezar Lake, Inc. (real estate company); Former President |
| Trustee | | and Director of Phillips Pond Homes Association (home community); Former Partner, |
| DOB: 4/9/1948 | | PricewaterhouseCoopers, LLP (independent registered public accounting firm) |
| Term of office since: 2006 | | |
| Other directorships: None | | |
|
| |
| William Walt Pettit | | Partner and Vice President, Kellam & Pettit, P.A. (law firm); Director, Superior Packaging Corp. |
| Trustee | | (packaging company); Member, Superior Land, LLC (real estate holding company), Member, |
| DOB: 8/26/1955 | | K&P Development, LLC (real estate development); Former Director, National Kidney Foundation |
| Term of office since: 1988 | | of North Carolina, Inc. (non-profit organization) |
| Other directorships: None | | |
|
| |
| David M. Richardson | | President, Richardson, Runden LLC (executive recruitment advisory services); Director, J&M |
| Trustee | | Cumming Paper Co. (paper merchandising); Trustee, NDI Technologies, LLP (communications); |
| DOB: 9/19/1941 | | Former Consultant, AESC (The Association of Executive Search Consultants) |
| Term of office since: 1982 | | |
| Other directorships: None | | |
|
| |
| Dr. Russell A. Salton III | | President/CEO, AccessOne MedCard, Inc. |
| Trustee | | |
| DOB: 6/2/1947 | | |
| Term of office since: 1984 | | |
| Other directorships: None | | |
|
32
TRUSTEES AND OFFICERS continued
| Michael S. Scofield | | Retired Attorney, Law Offices of Michael S. Scofield; Former Director and Chairman, Branded |
| Trustee | | Media Corporation (multi-media branding company) |
| DOB: 2/20/1943 | | |
| Term of office since: 1984 | | |
| Other directorships: None | | |
|
| |
| Richard J. Shima | | Independent Consultant; Director, Hartford Hospital; Trustee, Greater Hartford YMCA; Former |
| Trustee | | Director, Trust Company of CT; Former Director, Old State House Association; Former Trustee, |
| DOB: 8/11/1939 | | Saint Joseph College (CT) |
| Term of office since: 1993 | | |
| Other directorships: None | | |
|
| |
| Richard K. Wagoner, CFA2 | | Member and Former President, North Carolina Securities Traders Association; Member, Financial |
| Trustee | | Analysts Society |
| DOB: 12/12/1937 | | |
| Term of office since: 1999 | | |
| Other directorships: None | | |
|
| |
| |
| OFFICERS | | |
| |
| Dennis H. Ferro3 | | Principal occupations: President and Chief Executive Officer, Evergreen Investment Company, |
| President | | Inc. and Executive Vice President, Wachovia Bank, N.A.; former Chief Investment Officer, |
| DOB: 6/20/1945 | | Evergreen Investment Company, Inc. |
| Term of office since: 2003 | | |
|
| |
| Jeremy DePalma4 | | Principal occupations: Senior Vice President, Evergreen Investment Management Company, LLC; |
| Treasurer | | Former Vice President, Evergreen Investment Services, Inc.; Former Assistant Vice President, |
| DOB: 2/5/1974 | | Evergreen Investment Services, Inc. |
| Term of office since: 2005 | | |
|
| |
| Michael H. Koonce4 | | Principal occupations: Senior Vice President and General Counsel, Evergreen Investment |
| Secretary | | Services, Inc.; Secretary, Senior Vice President and General Counsel, Evergreen Investment |
| DOB: 4/20/1960 | | Management Company, LLC and Evergreen Service Company, LLC; Senior Vice President and |
| Term of office since: 2000 | | Assistant General Counsel, Wachovia Corporation |
|
| |
| Robert Guerin4 | | Principal occupations: Chief Compliance Officer, Evergreen Funds and Senior Vice President of |
| Chief Compliance Officer | | Evergreen Investments Co, Inc; Former Managing Director and Senior Compliance Officer, |
| DOB: 9/20/1965 | | Babson Capital Management LLC; Former Principal and Director, Compliance and Risk |
| Term of office since: 2007 | | Management, State Street Global Advisors; Former Vice President and Manager, Sales Practice |
| | | Compliance, Deutsche Asset Management. |
|
1 Each Trustee, except Mses. Kosel and Norris, serves until a successor is duly elected or qualified or until his or her death, resignation, retirement or removal from office. As new Trustees, Ms. Kosel’s and Ms. Norris’ initial terms end December 31, 2010 and June 30, 2009, respectively, at which times they may be re-elected by Trustees to serve until a successor is duly elected or qualified or until her death, resignation, retirement or removal from office by the Trustees. Each Trustee, except Ms. Kosel, oversaw 93 Evergreen funds as of December 31, 2007. Ms. Kosel became a Trustee on January 1, 2008. Correspondence for each Trustee may be sent to Evergreen Board of Trustees, P.O. Box 20083, Charlotte, NC 28202.
2 Mr. Wagoner is an “interested person” of the Fund because of his ownership of shares in Wachovia Corporation, the parent to the Fund’s investment advisor.
3 The address of the Officer is 401 S. Tryon Street, 20th Floor, Charlotte, NC 28288.
4 The address of the Officer is 200 Berkeley Street, Boston, MA 02116.
Additional information about the Fund’s Board of Trustees and Officers can be found in the Statement of Additional Information (SAI) and is available upon request without charge by calling 800.343.2898.
33

575707 rv2 03/2008
Evergreen Disciplined Value Fund
| table of contents |
| 1 | | LETTER TO SHAREHOLDERS |
| 4 | | FUND AT A GLANCE |
| 6 | | ABOUT YOUR FUND’S EXPENSES |
| 7 | | FINANCIAL HIGHLIGHTS |
| 11 | | SCHEDULE OF INVESTMENTS |
| 17 | | STATEMENT OF ASSETS AND LIABILITIES |
| 18 | | STATEMENT OF OPERATIONS |
| 19 | | STATEMENTS OF CHANGES IN NET ASSETS |
| 20 | | NOTES TO FINANCIAL STATEMENTS |
| 27 | | ADDITIONAL INFORMATION |
| 32 | | TRUSTEES AND OFFICERS |
This semiannual report must be preceded or accompanied by a prospectus of the Evergreen fund contained herein. The prospectus contains more complete information, including fees and expenses, and should be read carefully before investing or sending money.
The fund will file its complete schedule of portfolio holdings with the SEC for the first and third quarters of each fiscal year on Form N-Q. The fund’s Form N-Q will be available on the SEC’s Web site at http://www.sec.gov. In addition, the fund’s Form N-Q may be reviewed and copied at the SEC’s Public Reference Room in Washington, D.C. Information on the operation of the Public Reference Room may be obtained by calling 800.SEC.0330.
A description of the fund’s proxy voting policies and procedures, as well as information regarding how the fund voted proxies relating to portfolio securities during the most recent 12-month period ended June 30, is available by visiting our Web site at EvergreenInvestments.com or by visiting the SEC’s Web site at http://www.sec.gov. The fund’s proxy voting policies and procedures are also available without charge, upon request, by calling 800.343.2898.
| Mutual Funds: | | | | |
| NOT FDIC INSURED | | MAY LOSE VALUE | | NOT BANK GUARANTEED |
Evergreen InvestmentsSM is a service mark of Evergreen Investment Management Company, LLC.
Copyright 2008, Evergreen Investment Management Company, LLC.
Evergreen Investment Management Company, LLC is a subsidiary of Wachovia Corporation
and is an affiliate of Wachovia Corporation’s other Broker Dealer subsidiaries.
Evergreen mutual funds are distributed by Evergreen Investment Services, Inc.
200 Berkeley Street, Boston, MA 02116
LETTER TO SHAREHOLDERS
March 2008

Dennis H. Ferro
President and Chief Executive Officer
Dear Shareholder:
We are pleased to provide the Semiannual Report for Evergreen Disciplined Value Fund, covering the six-month period ended January 31, 2008.
Investors in the domestic equity market faced challenging and increasingly stormy conditions over the six-month period ended January 31, 2008. Problems in the housing and subprime mortgage markets led to a tightening of credit, which in turn contributed to widening fears of a dramatic deceleration in the economy’s expansion. As the economy weakened, equity prices generally declined across companies of all sizes. Large cap stocks held up somewhat better than mid cap and small cap shares, while growth stocks outperformed more economically sensitive value stocks. Fixed income investors, meanwhile, sought out the highest-quality securities and attempted to avoid credit risk. Longer-maturity Treasuries outperformed other sectors, while the prices of corporate bonds and many asset-backed securities fell as the yield spreads between Treasuries and lower-rated securities widened. In this environment, the price of gold surged while the dollar remained weak.
The U.S. economy exhibited increasing signs of weakness in the latter half of 2007 and the first month of 2008 after experiencing solid growth early in 2007. Although housing and credit-related concerns began weighing on investor sentiment early in the year, the economy’s growth trajectory continued to be supported early in 2007 by the combination of solid trends in employment, income, investment and export trends. That began to change in the latter months of 2007, however, as each of these pillars of support began to weaken. Growth in Gross Domestic Product
1
LETTER TO SHAREHOLDERS continued
rose by just 0.6% during the final quarter of 2007 as economic output slowed because of a sharp reduction in business inventories. The rate of corporate earnings growth, meanwhile, declined over the second half of 2007. Payrolls dropped by 17,000 in January 2008, contributing to growing concerns about the outlook for consumer spending, which accounts for up to 70% of economic output. Faced with growing evidence of the economy’s deceleration, the Federal Reserve Board (the “Fed”) began to focus more on stimulating growth and less on watching inflation. The Fed cut the target fed funds rate from 5.25% to 4.25% during the last four months of 2007 and then slashed the rate by an additional 1.25% in two separate actions within just eight days of each other in January 2008. Also in early 2008, Congress passed, and President Bush signed, a $168 billion fiscal stimulus bill that contained rebates for taxpayers, tax breaks for businesses and additional assistance for Social Security recipients and disabled veterans.
Over the six-month period ended January 31, 2008, the management teams of Evergreen’s value-oriented equity funds tended to emphasize investments in attractively priced, fundamentally sound corporations. The portfolio manager of both Evergreen Disciplined Value Fund and Evergreen Disciplined Small-Mid Value Fund, for example, used a combination of quantitative tools and traditional fundamental analysis in reviewing opportunities among larger and smaller companies, respectively. The manager of Evergreen Equity Index Fund maintained a portfolio reflecting the composition of the Standard & Poor’s 500® Index, using a proprietary process to control trading and operational costs. Managers of Evergreen Equity Income Fund emphasized companies they believe have the ability to maintain and increase their dividends to shareholders. The managers of Evergreen Fundamental Large Cap Fund focused on larger corporations with stable earnings growth records while the managers of Evergreen Fundamental Mid Cap Value Fund, which was launched on September 28, 2007, emphasized mid-sized companies selling at what the managers believed to be reasonable valuations. The team managing Evergreen Intrinsic Value Fund sought out investments in
2
LETTER TO SHAREHOLDERS continued
established companies selling at stock prices below the managers’ estimate of the company’s intrinsic value. Meanwhile, the managers of Evergreen Small Cap Value Fund and Evergreen Special Values Fund each focused on higher-quality small companies that the managers believed to have reasonable prices and strong balance sheets.
We believe the experiences in the investment markets during the past six months have underscored the value of a well-diversified, long-term investment strategy to help soften the effects of volatility in any one market or asset class. As always, we encourage investors to maintain diversified investment portfolios in pursuit of their long-term investment goals.
Please visit us at EvergreenInvestments.com for more information about our funds and other investment products available to you. Thank you for your continued support of Evergreen Investments.
Sincerely,

Dennis H. Ferro
President and Chief Executive Officer
Evergreen Investment Company, Inc.
Special Notice to Shareholders:
Please visit our Web site at EvergreenInvestments.com for statements from President and Chief Executive Officer, Dennis Ferro, regarding the firm’s recent settlement with the Securities and Exchange Commission (SEC) and prior settlement with the Financial Industry Regulatory Authority (FINRA).
3
FUND AT A GLANCE
as of January 31, 2008
MANAGEMENT TEAM
Investment Advisor:
• Evergreen Investment Management Company, LLC
Portfolio Manager:
• William E. Zieff
CURRENT INVESTMENT STYLE

Source: Morningstar, Inc.
Morningstar’s style box is based on a portfolio date as of 12/31/2007.
The Equity style box placement is based on 10 growth and valuation measures for each fund holding and the median size of the companies in which the fund invests.
PERFORMANCE AND RETURNS
Portfolio inception date: 5/8/1992
| | | Class A | | Class B | | Class C | | Class I |
| Class inception date | | 3/18/2005 | | 3/18/2005 | | 3/18/2005 | | 5/8/1992 |
|
| Nasdaq symbol | | EDSAX | | EDSBX | | EDSCX | | EDSIX |
|
| 6-month return with sales charge | | -9.81% | | -8.89% | | -5.55% | | N/A |
|
| 6-month return w/o sales charge | | -4.31% | | -4.71% | | -4.72% | | -4.20% |
|
| Average annual return* | | | | | | | | |
|
| 1-year with sales charge | | -9.71% | | -9.15% | | -5.82% | | N/A |
|
| 1-year w/o sales charge | | -4.23% | | -4.99% | | -4.99% | | -4.00% |
|
| 5-year | | 13.41% | | 14.01% | | 14.22% | | 14.88% |
|
| 10-year | | 6.42% | | 6.80% | | 6.79% | | 7.10% |
|
| Maximum sales charge | | 5.75% | | 5.00% | | 1.00% | | N/A |
| | | Front-end | | CDSC | | CDSC | | |
|
* Adjusted for maximum applicable sales charge, unless noted.
Past performance is no guarantee of future results. The performance quoted represents past performance and current performance may be lower or higher. The investment return and principal value of an investment will fluctuate so that investors’ shares, when redeemed, may be worth more or less than their original cost. To obtain performance information current to the most recent month-end for Classes A, B, C or I, please go to EvergreenInvestments.com/fundperformance. The performance of each class may vary based on differences in loads, fees and expenses paid by the shareholders investing in each class. Performance includes the reinvestment of income dividends and capital gain distributions. Performance shown does not reflect the deduction of taxes that a shareholder would pay on fund distributions or the redemption of fund shares.
Historical performance shown for Classes A, B and C prior to their inception is based on the performance of Class I. Historical performance for Class I prior to 3/21/2005 is based on the fund’s predecessor fund, SouthTrust Value Fund. The historical returns for Classes A, B and C have not been adjusted to reflect the effect of each class’ 12b-1 fee. These fees are 0.25% for Class A and 1.00% for Classes B and C. Class I does not, and the fund’s predecessor fund did not, pay a 12b-1 fee. If these fees had been reflected, returns for Classes A, B and C would have been lower.
The advisor is waiving a portion of its advisory fee. Had the fee not been waived, returns would have been lower.
4
FUND AT A GLANCE continued
LONG-TERM GROWTH
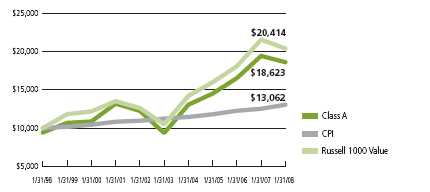
Comparison of a $10,000 investment in the Evergreen Disciplined Value Fund Class A shares versus a similar investment in the Russell 1000 Value Index (Russell 1000 Value) and the Consumer Price Index (CPI).
The Russell 1000 Value is an unmanaged market index and does not include transaction costs associated with buying and selling securities, any mutual fund fees or expenses or any taxes. The CPI is a commonly used measure of inflation and does not represent an investment return. It is not possible to invest directly in an index.
Class I shares are only offered in the following manner: (1) to investment advisory clients of Evergreen Investment Management Company, LLC (or its advisory affiliates) when purchased by such advisor(s) on behalf of its clients, (2) to certain mutual fund wrap program clients of Wachovia Securities and of third-party broker/dealers when purchased through a clearing relationship with Wachovia Securities or an affiliate providing mutual fund clearing services, (3) through arrangements entered into on behalf of the Evergreen funds with certain financial services firms, (4) to certain institutional investors, and (5) to persons who owned Class Y shares in registered name in an Evergreen fund on or before December 31, 1994 or who owned shares of any SouthTrust fund in registered name as of March 18, 2005 or who owned shares of Vestaur Securities Fund as of May 20, 2005.
Class I shares are only available to institutional shareholders with a minimum of $1 million investment, which may be waived in certain situations.
The fund’s investment objective may be changed without a vote of the fund’s shareholders.
Value-based investments are subject to the risk that the broad market may not recognize their intrinsic value.
All data is as of January 31, 2008, and subject to change.
5
ABOUT YOUR FUND’S EXPENSES
The Example below is intended to describe the fees and expenses borne by shareholders and the impact of those costs on your investment.
Example
As a shareholder of the fund, you incur two types of costs: (1) transaction costs, including sales charges (loads), redemption fees and exchange fees; and (2) ongoing costs, including management fees, distribution (12b-1) fees and other fund expenses. This Example is intended to help you understand your ongoing costs (in dollars) of investing in the fund and to compare these costs with the ongoing costs of investing in other mutual funds. The Example is based on an investment of $1,000 invested at the beginning of the period and held for the entire period from August 1, 2007 to January 31, 2008.
The example illustrates your fund’s costs in two ways:
- Actual expenses
The section in the table under the heading “Actual” provides information about actual account values and actual expenses. You may use the information in these columns, together with the amount you invested, to estimate the expenses that you paid over the period. Simply divide your account value by $1,000 (for example, an $8,600 account value divided by $1,000 = 8.6), then multiply the result by the number in the appropriate column for your share class, in the column entitled “Expenses Paid During Period” to estimate the expenses you paid on your account during this period. - Hypothetical example for comparison purposes
The section in the table under the heading “Hypothetical (5% return before expenses)” provides information about hypothetical account values and hypothetical expenses based on the fund’s actual expense ratio and an assumed rate of return of 5% per year before expenses, which is not the fund’s actual return. The hypothetical account values and expenses may not be used to estimate the actual ending account balance or expenses you paid for the period. You may use this information to compare the ongoing costs of investing in the fund and other funds. To do so, compare this 5% hypothetical example with the 5% hypothetical examples that appear in the shareholder reports of the other funds.
Please note that the expenses shown in the table are meant to highlight your ongoing costs only and do not reflect any transactional costs, such as sales charges (loads), redemption fees or exchange fees. Therefore, the section in the table under the heading “Hypothetical (5% return before expenses)” is useful in comparing ongoing costs only, and will not help you determine the relative total costs of owning different funds. In addition, if these transactional costs were included, your costs would have been higher.
| | | Beginning | | Ending | | |
| | | Account | | Account | | Expenses |
| | | Value | | Value | | Paid During |
| | | 8/1/2007 | | 1/31/2008 | | Period* |
|
| Actual | | | | | | |
| Class A | | $ 1,000.00 | | $ 956.91 | | $ 5.12 |
| Class B | | $ 1,000.00 | | $ 952.86 | | $ 8.79 |
| Class C | | $ 1,000.00 | | $ 952.83 | | $ 8.79 |
| Class I | | $ 1,000.00 | | $ 957.96 | | $ 3.89 |
| Hypothetical | | | | | | |
| (5% return | | | | | | |
| before expenses) | | | | | | |
| Class A | | $ 1,000.00 | | $ 1,019.91 | | $ 5.28 |
| Class B | | $ 1,000.00 | | $ 1,016.14 | | $ 9.07 |
| Class C | | $ 1,000.00 | | $ 1,016.14 | | $ 9.07 |
| Class I | | $ 1,000.00 | | $ 1,021.17 | | $ 4.01 |
|
*For each class of the Fund, expenses are equal to the annualized expense ratio of each class (1.04% for Class A, 1.79% for Class B, 1.79% for Class C and 0.79% for Class I), multiplied by the average account value over the period, multiplied by 184 / 366 days.
6
FINANCIAL HIGHLIGHTS
(For a share outstanding throughout each period)
| | | Six Months | | | | | | | | |
| | | Ended | | Year Ended July 31, | | |
| | January 31, 2008 | |
| | Year Ended |
| CLASS A | | (unaudited) | | 2007 | | 2006 | | 20051 | | April 30, 20052 |
|
| Net asset value, beginning of period | | $ 18.05 | | $ 16.62 | | $ 15.82 | | $16.96 | | $17.35 |
|
| Income from investment operations | | | | | | | | | | |
| Net investment income (loss) | | 0.14 | | 0.27 | | 0.22 | | 0.05 | | 0.01 |
Net realized and unrealized gains
or losses on investments | | (0.83) | | 1.96 | | 1.22 | | 1.08 | | (0.36) |
| |
|
| Total from investment operations | | (0.69) | | 2.23 | | 1.44 | | 1.13 | | (0.35) |
|
| Distributions to shareholders from | | | | | | | | | | |
| Net investment income | | (0.13) | | (0.27) | | (0.19) | | (0.04) | | (0.04) |
| Net realized gains | | (2.15) | | (0.53) | | (0.45) | | (2.23) | | 0 |
| |
|
| Total distributions to shareholders | | (2.28) | | (0.80) | | (0.64) | | (2.27) | | (0.04) |
|
| Net asset value, end of period | | $ 15.08 | | $ 18.05 | | $ 16.62 | | $15.82 | | $16.96 |
|
| Total return3 | | (4.31%) | | 13.60% | | 9.44% | | 7.76% | | (2.01%) |
|
| Ratios and supplemental data | | | | | | | | | | |
| Net assets, end of period (thousands) | | $88,290 | | $119,461 | | $13,428 | | $1,617 | | $ 1 |
| Ratios to average net assets | | | | | | | | | | |
Expenses including waivers/reimbursements
but excluding expense reductions | | 1.04%4 | | 1.04% | | 1.15% | | 1.26%4 | | 1.11%4 |
Expenses excluding waivers/reimbursements
and expense reductions | | 1.10%4 | | 1.04% | | 1.17% | | 1.26%4 | | 1.11%4 |
| Net investment income (loss) | | 1.59%4 | | 1.04% | | 1.14% | | 0.74%4 | | 0.58%4 |
| Portfolio turnover rate | | 26% | | 60% | | 55% | | 15% | | 54% |
|
1 For the three months ended July 31, 2005. The Fund changed its fiscal year end from April 30 to July 31, effective July 31, 2005.
2 For the period from March 18, 2005 (commencement of class operations), to April 30, 2005.
3 Excluding applicable sales charges
4 Annualized
See Notes to Financial Statements
7
FINANCIAL HIGHLIGHTS
(For a share outstanding throughout each period)
| | | Six Months | | | | | | | | |
| | | Ended | | Year Ended July 31, | | |
| | January 31, 2008 | |
| | Year Ended |
| CLASS B | | (unaudited) | | 2007 | | 2006 | | 20051 | | April 30, 20052 |
|
| Net asset value, beginning of period | | $17.96 | | $16.55 | | $15.79 | | $16.97 | | $17.35 |
|
| Income from investment operations | | | | | | | | | | |
| Net investment income (loss) | | 0.07 | | 0.13 | | 0.10 | | 0.013 | | 03 |
Net realized and unrealized gains
or losses on investments | | (0.83) | | 1.94 | | 1.22 | | 1.06 | | (0.34) |
| |
|
| Total from investment operations | | (0.76) | | 2.07 | | 1.32 | | 1.07 | | (0.34) |
|
| Distributions to shareholders from | | | | | | | | | | |
| Net investment income | | (0.06) | | (0.13) | | (0.11) | | (0.02) | | (0.04) |
| Net realized gains | | (2.15) | | (0.53) | | (0.45) | | (2.23) | | 0 |
| |
|
| Total distributions to shareholders | | (2.21) | | (0.66) | | (0.56) | | (2.25) | | (0.04) |
|
| Net asset value, end of period | | $14.99 | | $17.96 | | $16.55 | | $15.79 | | $16.97 |
|
| Total return4 | | (4.71%) | | 12.70% | | 8.64% | | 7.35% | | (1.97%) |
|
| Ratios and supplemental data | | | | | | | | | | |
| Net assets, end of period (thousands) | | $5,740 | | $7,329 | | $5,070 | | $ 121 | | $ 5 |
| Ratios to average net assets | | | | | | | | | | |
Expenses including waivers/reimbursements
but excluding expense reductions | | 1.79%5 | | 1.79% | | 1.89% | | 2.00%5 | | 1.82%5 |
Expenses excluding waivers/reimbursements
and expense reductions | | 1.85%5 | | 1.79% | | 1.91% | | 2.00%5 | | 1.82%5 |
| Net investment income (loss) | | 0.84%5 | | 0.71% | | 0.47% | | 0.16%5 | | 0.10%5 |
| Portfolio turnover rate | | 26% | | 60% | | 55% | | 15% | | 54% |
|
1 For the three months ended July 31, 2005. The Fund changed its fiscal year end from April 30 to July 31, effective July 31, 2005.
2 For the period from March 18, 2005 (commencement of class operations), to April 30, 2005.
3 Net investment income (loss) per share is based on average shares outstanding during the period.
4 Excluding applicable sales charges
5 Annualized
See Notes to Financial Statements
8
FINANCIAL HIGHLIGHTS
(For a share outstanding throughout each period)
| | | Six Months | | | | | | | | |
| | | Ended | | Year Ended July 31, | | |
| | January 31, 2008 | |
| | Year Ended |
| CLASS C | | (unaudited) | | 2007 | | 2006 | | 20051 | | April 30, 20052 |
|
| Net asset value, beginning of period | | $17.93 | | $16.53 | | $15.79 | | $16.97 | | $17.35 |
|
| Income from investment operations | | | | | | | | | | |
| Net investment income (loss) | | 0.07 | | 0.13 | | 0.12 | | 03 | | 0 |
Net realized and unrealized gains
or losses on investments | | (0.83) | | 1.93 | | 1.18 | | 1.08 | | (0.34) |
| |
|
| Total from investment operations | | (0.76) | | 2.06 | | 1.30�� | | 1.08 | | (0.34) |
|
| Distributions to shareholders from | | | | | | | | | | |
| Net investment income | | (0.06) | | (0.13) | | (0.11) | | (0.03) | | (0.04) |
| Net realized gains | | (2.15) | | (0.53) | | (0.45) | | (2.23) | | 0 |
| |
|
| Total distributions to shareholders | | (2.21) | | (0.66) | | (0.56) | | (2.26) | | (0.04) |
|
| Net asset value, end of period | | $14.96 | | $17.93 | | $16.53 | | $15.79 | | $16.97 |
|
| Total return4 | | (4.72%) | | 12.65% | | 8.54% | | 7.37% | | (1.97%) |
|
| Ratios and supplemental data | | | | | | | | | | |
| Net assets, end of period (thousands) | | $2,376 | | $3,009 | | $1,617 | | $ 144 | | $ 1 |
| Ratios to average net assets | | | | | | | | | | |
Expenses including waivers/reimbursements
but excluding expense reductions | | 1.79%5 | | 1.79% | | 1.88% | | 2.16%5 | | 1.85%5 |
Expenses excluding waivers/reimbursements
and expense reductions | | 1.85%5 | | 1.79% | | 1.90% | | 2.16%5 | | 1.85%5 |
| Net investment income (loss) | | 0.83%5 | | 0.70% | | 0.53% | | (0.09%)5 | | (0.16%)5 |
| Portfolio turnover rate | | 26% | | 60% | | 55% | | 15% | | 54% |
|
1 For the three months ended July 31, 2005. The Fund changed its fiscal year end from April 30 to July 31, effective July 31, 2005.
2 For the period from March 18, 2005 (commencement of class operations), to April 30, 2005.
3 Net investment income (loss) per share is based on average shares outstanding during the period.
4 Excluding applicable sales charges
5 Annualized
See Notes to Financial Statements
9
FINANCIAL HIGHLIGHTS
(For a share outstanding throughout each period)
| | | Six Months | | | | | | | | | | | | |
| | | Ended | | Year Ended July 31, | | Year Ended April 30, |
| | January 31, 2008 | |
| |
|
| CLASS I | | (unaudited) | | 2007 | | 2006 | | 20051 | | 20052 | | 20042 | | 20032 |
|
| Net asset value, beginning of period | | $ 18.01 | | $ 16.59 | | $ 15.81 | | $ 16.97 | | $ 16.14 | | $ 12.30 | | $ 15.29 |
|
| Income from investment operations | | | | | | | | | | | | | | |
| Net investment income (loss) | | 0.16 | | 0.32 | | 0.24 | | 0.05 | | 0.12 | | 0.08 | | 0.09 |
| Net realized and unrealized gains or losses | | | | | | | | | | | | | | |
| on investments | | (0.83) | | 1.94 | | 1.23 | | 1.07 | | 1.843 | | 3.83 | | (2.93) |
| |
|
| Total from investment operations | | (0.67) | | 2.26 | | 1.47 | | 1.12 | | 1.96 | | 3.91 | | (2.84) |
|
| Distributions to shareholders from | | | | | | | | | | | | | | |
| Net investment income | | (0.15) | | (0.31) | | (0.24) | | (0.05) | | (0.12) | | (0.07) | | (0.09) |
| Net realized gains | | (2.15) | | (0.53) | | (0.45) | | (2.23) | | (1.01) | | 0 | | (0.06) |
| |
|
| Total distributions to shareholders | | (2.30) | | (0.84) | | (0.69) | | (2.28) | | (1.13) | | (0.07) | | (0.15) |
|
| Net asset value, end of period | | $ 15.04 | | $ 18.01 | | $ 16.59 | | $ 15.81 | | $ 16.97 | | $ 16.14 | | $ 12.30 |
|
| Total return | | (4.20%) | | 13.85% | | 9.66% | | 7.65% | | 12.10% | | 31.87%4 | | (18.50%)4 |
|
| Ratios and supplemental data | | | | | | | | | | | | | | |
| Net assets, end of period (thousands) | | $415,180 | | $559,719 | | $673,865 | | $157,238 | | $157,107 | | $313,929 | | $250,385 |
| Ratios to average net assets | | | | | | | | | | | | | | |
| Expenses including waivers/reimbursements | | | | | | | | | | | | | | |
| but excluding expense reductions | | 0.79%5 | | 0.79% | | 0.88% | | 0.91%5 | | 0.99% | | 0.99% | | 0.99% |
| Expenses excluding waivers/reimbursements | | | | | | | | | | | | | | |
| and expense reductions | | 0.85%5 | | 0.79% | | 0.90% | | 0.91%5 | | 1.20% | | 1.19% | | 1.19% |
| Net investment income (loss) | | 1.85%5 | | 1.78% | | 1.45% | | 1.34%5 | | 0.64% | | 0.54% | | 0.74% |
| Portfolio turnover rate | | 26% | | 60% | | 55% | | 15% | | 54% | | 33% | | 37% |
|
1 For the three months ended July 31, 2005. The Fund changed its fiscal year end from April 30 to July 31, effective July 31, 2005.
2 Effective at the close of business March 18, 2005, the Fund acquired the net assets of SouthTrust Value Fund (“SouthTrust Fund”). SouthTrust Fund was the accounting and performance survivor in this transaction . The financial highlights for the periods prior to March 21, 20 05 are those of SouthTrust Fund.
3 The per share net realized and unrealized gains or losses are not in accord with the net realized and unrealized gains or losses for the period due to the timing of sales and redemptions of fund shares in relation to fluctuating market values for the portfolio.
4 Excluding any sales charges applicable to SouthTrust Fund
5 Annualized
See Notes to Financial Statements
10
SCHEDULE OF INVESTMENTS
January 31, 2008 (unaudited)
| | | | | | | Shares | | Value |
|
| |
| COMMON STOCKS 98.0% | | | | | | |
| CONSUMER DISCRETIONARY 6.6% | | | | |
| Hotels, Restaurants & Leisure 1.4% | | | | |
| Darden Restaurants, Inc. | | | | 73,027 | | $ 2,068,124 |
| McDonald’s Corp. | | | | | | 90,178 | | 4,829,032 |
| |
|
| | | | | | | | | 6,897,156 |
| |
|
| Leisure Equipment & Products 0.6% | | | | |
| Hasbro, Inc. | | | | | | 120,581 | | 3,131,489 |
| |
|
| Media 2.9% | | | | | | | | |
| Meredith Corp. | | | | | | 37,412 | | 1,757,990 |
| Omnicom Group, Inc. | | | | | | 61,814 | | 2,804,501 |
| Time Warner, Inc. | | | | | | 225,922 | | 3,556,012 |
| Viacom, Inc., Class B * | | | | | | 66,006 | | 2,558,393 |
| Walt Disney Co. | | | | | | 141,579 | | 4,237,459 |
| |
|
| | | | | | | | | 14,914,355 |
| |
|
| Specialty Retail 1.0% | | | | | | |
| Best Buy Co., Inc. | | | | | | 45,128 | | 2,202,698 |
| TJX Cos. | | | | | | 85,542 | | 2,699,705 |
| |
|
| | | | | | | | | 4,902,403 |
| |
|
| Textiles, Apparel & Luxury Goods 0.7% | | | | |
| Nike, Inc., Class B | | | | | | 61,651 | | 3,807,566 |
| |
|
| CONSUMER STAPLES 10.2% | | | | | | |
| Beverages 1.9% | | | | | | | | |
| Coca-Cola Enterprises, Inc. (p) | | | | 140,460 | | 3,240,412 |
| Molson Coors Brewing Co., Class B | | | | 84,865 | | 3,790,920 |
| Pepsi Bottling Group, Inc. | | | | 80,398 | | 2,801,870 |
| |
|
| | | | | | | | | 9,833,202 |
| |
|
| Food & Staples Retailing 2.1% | | | | |
| Kroger Co. | | | | | | 134,494 | | 3,422,872 |
| Safeway, Inc. | | | | | | 105,267 | | 3,262,224 |
| Wal-Mart Stores, Inc. | | | | | | 81,910 | | 4,167,581 |
| |
|
| | | | | | | | | 10,852,677 |
| |
|
| Food Products 0.7% | | | | | | |
| Bunge, Ltd. (p) | | | | | | 29,372 | | 3,479,701 |
| |
|
| Household Products 2.2% | | | | | | |
| Procter & Gamble Co. | | | | | | 168,465 | | 11,110,267 |
| |
|
| Personal Products 0.6% | | | | | | |
| Alberto-Culver Co. | | | | | | 105,265 | | 2,820,049 |
| |
|
| Tobacco 2.7% | | | | | | | | |
| Altria Group, Inc. | | | | | | 134,522 | | 10,199,458 |
| Reynolds American, Inc. (p) | | | | 59,972 | | 3,798,027 |
| |
|
| | | | | | | | | 13,997,485 |
| |
|
See Notes to Financial Statements
11
SCHEDULE OF INVESTMENTS continued
January 31, 2008 (unaudited)
| | | | | Shares | | Value |
|
| |
| COMMON STOCKS continued | | | | | | |
| ENERGY 14.7% | | | | | | |
| Energy Equipment & Services 0.9% | | | | |
| Halliburton Co. | | | | 47,854 | | $ 1,587,317 |
| National Oilwell Varco, Inc. * | | | | 49,720 | | 2,994,636 |
| |
|
| | | | | | | 4,581,953 |
| |
|
| Oil, Gas & Consumable Fuels 13.8% | | | | |
| Chevron Corp. | | | | 205,700 | | 17,381,650 |
| ConocoPhillips | | | | 162,811 | | 13,076,980 |
| Exxon Mobil Corp. | | | | 356,159 | | 30,772,138 |
| Marathon Oil Corp. | | | | 106,364 | | 4,983,153 |
| Occidental Petroleum Corp. | | | | 28,814 | | 1,955,606 |
| Valero Energy Corp. | | | | 38,495 | | 2,278,519 |
| |
|
| | | | | | | 70,448,046 |
| |
|
| FINANCIALS 25.8% | | | | | | |
| Capital Markets 4.4% | | | | | | |
| Federated Investors, Inc., Class B | | | | 45,162 | | 1,922,546 |
| Goldman Sachs Group, Inc. | | | | 32,342 | | 6,493,303 |
| Lehman Brothers Holdings, Inc. | | | | 41,490 | | 2,662,413 |
| Merrill Lynch & Co., Inc. | | | | 49,504 | | 2,792,026 |
| Morgan Stanley | | | | 89,170 | | 4,407,673 |
| State Street Corp. | | | | 49,298 | | 4,048,352 |
| |
|
| | | | | | | 22,326,313 |
| |
|
| Commercial Banks 4.4% | | | | | | |
| Comerica, Inc. | | | | 48,217 | | 2,103,225 |
| PNC Financial Services Group, Inc. | | | | 49,443 | | 3,244,450 |
| Popular, Inc. (p) | | | | 130,778 | | 1,768,118 |
| U.S. Bancorp | | | | 84,925 | | 2,883,204 |
| Wells Fargo & Co. (p) | | | | 369,558 | | 12,568,668 |
| |
|
| | | | | | | 22,567,665 |
| |
|
| Diversified Financial Services 7.8% | | | | |
| Bank of America Corp. | | | | 304,874 | | 13,521,162 |
| Citigroup, Inc. | | | | 385,326 | | 10,873,900 |
| JPMorgan Chase & Co. | | | | 327,468 | | 15,571,103 |
| |
|
| | | | | | | 39,966,165 |
| |
|
| Insurance 8.1% | | | | | | |
| ACE, Ltd. | | | | 80,794 | | 4,713,522 |
| Allstate Corp. | | | | 125,352 | | 6,176,093 |
| American International Group, Inc. | | | | 104,220 | | 5,748,775 |
| Chubb Corp. | | | | 99,039 | | 5,129,230 |
| Hartford Financial Services Group, Inc. | | 55,418 | | 4,476,112 |
| MetLife, Inc. | | | | 67,080 | | 3,955,708 |
| PartnerRe, Ltd. | | | | 38,886 | | 3,082,882 |
| Reinsurance Group of America, Inc. | | | | 23,744 | | 1,376,440 |
| Travelers Companies, Inc. | | | | 143,703 | | 6,912,114 |
| |
|
| | | | | | | 41,570,876 |
| |
|
See Notes to Financial Statements
12
SCHEDULE OF INVESTMENTS continued
January 31, 2008 (unaudited)
| | | | | Shares | | Value |
|
| |
| COMMON STOCKS continued | | | | | | |
| FINANCIALS continued | | | | | | |
| Real Estate Investment Trusts 1.1% | | | | |
| Hospitality Properties Trust | | | | 44,820 | | $ 1,521,639 |
| HRPT Properties Trust (p) | | | | 220,567 | | 1,753,508 |
| Simon Property Group, Inc. | | | | 28,585 | | 2,554,927 |
| |
|
| | | | | | | 5,830,074 |
| |
|
| HEALTH CARE 10.4% | | | | | | |
| Biotechnology 0.5% | | | | | | |
| Biogen Idec, Inc. * | | | | 45,141 | | 2,751,344 |
| |
|
| Health Care Equipment & Supplies 0.6% | | | | |
| Baxter International, Inc. | | | | 45,336 | | 2,753,709 |
| |
|
| Health Care Providers & Services 1.8% | | | | |
| CIGNA Corp. | | | | 90,337 | | 4,440,967 |
| McKesson Corp. | | | | 41,750 | | 2,621,482 |
| UnitedHealth Group, Inc. | | | | 41,751 | | 2,122,621 |
| |
|
| | | | | | | 9,185,070 |
| |
|
| Life Sciences Tools & Services 0.5% | | | | |
| Invitrogen Corp. * | | | | 30,857 | | 2,643,519 |
| |
|
| Pharmaceuticals 7.0% | | | | | | |
| Eli Lilly & Co. | | | | 81,799 | | 4,214,284 |
| Forest Laboratories, Inc. * | | | | 50,415 | | 2,005,005 |
| Johnson & Johnson | | | | 178,476 | | 11,290,392 |
| Pfizer, Inc. | | | | 667,279 | | 15,607,656 |
| Wyeth | | | | 71,836 | | 2,859,073 |
| |
|
| | | | | | | 35,976,410 |
| |
|
| INDUSTRIALS 10.2% | | | | | | |
| Aerospace & Defense 3.4% | | | | | | |
| Boeing Co. | | | | 28,595 | | 2,378,532 |
| General Dynamics Corp. | | | | 47,140 | | 3,981,444 |
| L-3 Communications Holdings, Inc. | | | | 37,477 | | 4,153,576 |
| Lockheed Martin Corp. | | | | 17,130 | | 1,848,670 |
| Northrop Grumman Corp. | | | | 65,772 | | 5,219,666 |
| |
|
| | | | | | | 17,581,888 |
| |
|
| Commercial Services & Supplies 0.4% | | | | |
| Manpower, Inc. | | | | 36,473 | | 2,051,971 |
| |
|
| Industrial Conglomerates 3.1% | | | | | | |
| General Electric Co. | | | | 444,163 | | 15,727,812 |
| |
|
| Machinery 2.4% | | | | | | |
| Cummins, Inc. | | | | 60,392 | | 2,915,726 |
| Eaton Corp. | | | | 30,344 | | 2,511,269 |
| Paccar, Inc. | | | | 45,703 | | 2,144,385 |
| Parker Hannifin Corp. | | | | 67,700 | | 4,577,197 |
| |
|
| | | | | | | 12,148,577 |
| |
|
See Notes to Financial Statements
13
SCHEDULE OF INVESTMENTS continued
January 31, 2008 (unaudited)
| | | | | Shares | | Value |
|
| |
| COMMON STOCKS continued | | | | | | |
| INDUSTRIALS continued | | | | | | |
| Road & Rail 0.9% | | | | | | |
| Ryder System, Inc. | | | | 33,144 | | $ 1,725,477 |
| Union Pacific Corp. | | | | 25,482 | | 3,186,014 |
| |
|
| | | | | | | 4,911,491 |
| |
|
| INFORMATION TECHNOLOGY 4.5% | | | | | | |
| Computers & Peripherals 1.6% | | | | | | |
| Dell, Inc. * | | | | 1,223 | | 24,509 |
| Hewlett-Packard Co. | | | | 48,458 | | 2,120,037 |
| International Business Machines Corp. | | | | 46,889 | | 5,033,065 |
| Seagate Technology, Inc. | | | | 60,277 | | 1,221,815 |
| |
|
| | | | | | | 8,399,426 |
| |
|
| IT Services 0.8% | | | | | | |
| Accenture, Ltd., Class A | | | | 51,962 | | 1,798,924 |
| Computer Sciences Corp. * | | | | 51,155 | | 2,164,880 |
| |
|
| | | | | | | 3,963,804 |
| |
|
| Office Electronics 0.5% | | | | | | |
| Xerox Corp. | | | | 174,990 | | 2,694,846 |
| |
|
| Semiconductors & Semiconductor Equipment 0.6% | | | | |
| Intel Corp. | | | | 75,828 | | 1,607,554 |
| Texas Instruments, Inc. | | | | 39,057 | | 1,208,033 |
| |
|
| | | | | | | 2,815,587 |
| |
|
| Software 1.0% | | | | | | |
| Microsoft Corp. | | | | 61,779 | | 2,013,995 |
| Symantec Corp. * | | | | 169,080 | | 3,031,605 |
| |
|
| | | | | | | 5,045,600 |
| |
|
| MATERIALS 3.6% | | | | | | |
| Chemicals 2.6% | | | | | | |
| Celanese Corp., Ser. A | | | | 68,851 | | 2,559,880 |
| E.I. DuPont de Nemours & Co. | | | | 93,654 | | 4,231,288 |
| Eastman Chemical Co. | | | | 47,789 | | 3,157,419 |
| Lubrizol Corp. | | | | 66,139 | | 3,479,573 |
| |
|
| | | | | | | 13,428,160 |
| |
|
| Metals & Mining 1.0% | | | | | | |
| Freeport-McMoRan Copper & Gold, Inc. | | | | 27,219 | | 2,423,307 |
| United States Steel Corp. | | | | 24,844 | | 2,536,821 |
| |
|
| | | | | | | 4,960,128 |
| |
|
| TELECOMMUNICATION SERVICES 6.5% | | | | | | |
| Diversified Telecommunication Services 6.0% | | | | | | |
| AT&T, Inc. | | | | 461,900 | | 17,778,531 |
| Embarq Corp. | | | | 37,123 | | 1,681,672 |
| Verizon Communications, Inc. | | | | 294,178 | | 11,425,874 |
| |
|
| | | | | | | 30,886,077 |
| |
|
See Notes to Financial Statements
14
SCHEDULE OF INVESTMENTS continued
January 31, 2008 (unaudited)
| | | | | | | Shares | | Value |
|
| |
| COMMON STOCKS continued | | | | |
| TELECOMMUNICATION SERVICES 6.5% | | | | |
| Wireless Telecommunication Services 0.5% | | | | |
| Sprint Nextel Corp. | | | | | | 223,738 | | $ 2,355,961 |
| |
|
| UTILITIES 5.5% | | | | | | | | |
| Electric Utilities 2.0% | | | | | | |
| Edison International | | | | | | 70,681 | | 3,686,721 |
| FirstEnergy Corp. | | | | | | 64,671 | | 4,605,869 |
| Pepco Holdings, Inc. (p) | | | | 66,016 | | 1,680,767 |
| |
|
| | | | | | | | | 9,973,357 |
| |
|
| Multi-Utilities 3.5% | | | | | | |
| CenterPoint Energy, Inc. | | | | 187,371 | | 2,999,809 |
| DTE Energy Co. | | | | | | 46,308 | | 1,975,036 |
| OGE Energy Corp. | | | | | | 87,548 | | 2,865,446 |
| PG&E Corp. | | | | | | 68,696 | | 2,819,284 |
| Public Service Enterprise Group, Inc. | | 52,998 | | 5,087,808 |
| Xcel Energy, Inc. | | | | | | 107,749 | | 2,240,102 |
| |
|
| | | | | | | | | 17,987,485 |
| |
|
| Total Common Stocks (cost $456,980,265) | | | | 501,279,664 |
| | |
|
|
| | | | | | | Principal | | |
| | | | | | | Amount | | Value |
|
| |
| SHORT-TERM INVESTMENTS 5.0% | | | | |
| CORPORATE BONDS 0.2% | | | | | | |
| Capital Markets 0.2% | | | | | | |
| Citigroup Global Markets, Inc., 3.25%, 02/01/2008 (pp) | | $ 1,000,000 | | 1,000,000 |
| |
|
| REPURCHASE AGREEMENTS ^ 2.7% | | | | |
| ABN AMRO, Inc., 3.21%, dated 01/31/2008, maturing 02/01/2008, maturity | | | | |
| value $1,000,089 (pp) | | | | 1,000,000 | | 1,000,000 |
| Banc of America Securities, LLC, 3.20%, dated 01/31/2008, maturing 02/01/2008, | | | | |
| maturity value $3,000,267 (pp) | | 3,000,000 | | 3,000,000 |
| Bear Stearns & Co., Inc., 3.22%, dated 01/31/2008, maturing 02/01/2008, | | | | |
| maturity value $1,000,089 (pp) | | 1,000,000 | | 1,000,000 |
| Cantor Fitzgerald & Co., 3.30%, dated 01/31/2008, maturing 02/01/2008, | | | | |
| maturity value $1,000,092 (pp) | | 1,000,000 | | 1,000,000 |
| Credit Suisse First Boston, LLC, 3.21%, dated 01/31/2008, maturing 02/01/2008, | | | | |
| maturity value $1,000,089 (pp) | | 1,000,000 | | 1,000,000 |
| Dresdner Kleinwort Wasserstein Securities, LLC, 3.21%, dated 01/31/2008, | | | | |
| maturing 02/01/2008, maturity value $2,000,178 (pp) | | 2,000,000 | | 2,000,000 |
| Greenwich Capital Markets, Inc, 3.21%, dated 01/31/2008, maturing 02/01/2008, | | | | |
| maturity value $1,000,089 (pp) | | 1,000,000 | | 1,000,000 |
| JP Morgan Securities, Inc., 3.20%, dated 01/31/2008, maturing 02/01/2008, | | | | |
| maturity value $2,000,178 (pp) | | 2,000,000 | | 2,000,000 |
| Lehman Brothers, Inc., 3.20%, dated 01/31/2008, maturing 02/01/2008, | | | | |
| maturity value $1,000,089 (pp) | | 1,000,000 | | 1,000,000 |
See Notes to Financial Statements
15
SCHEDULE OF INVESTMENTS continued
January 31, 2008 (unaudited)
| | | | | Principal | | |
| | | | | Amount | | Value |
|
| SHORT-TERM INVESTMENTS continued | | | | |
| REPURCHASE AGREEMENTS ^ continued | | | | |
| Merrill Lynch & Co., Inc., 3.20%, dated 01/31/2008, maturing 02/01/2008, | | | | |
| maturity value $1,000,089 (pp) | | $ 1,000,000 | | $ 1,000,000 |
| |
|
| | | | | | | 14,000,000 |
| |
|
| U.S. TREASURY OBLIGATIONS 0.3% | | | | |
| U.S. Treasury Bills: | | | | | | |
| 2.80%, 03/13/2008 ß ƒ | | | | 300,000 | | 299,043 |
| 2.88%, 03/20/2008 ß ƒ | | | | 100,000 | | 99,616 |
| 3.18%, 04/10/2008 ß ƒ | | | | 500,000 | | 496,953 |
| 3.39%, 02/07/2008 ß ƒ | | | | 500,000 | | 499,717 |
| |
|
| | | | | | | 1,395,329 |
| | |
|
|
| | | | | Shares | | Value |
|
| |
| MUTUAL FUND SHARES 1.8% | | | | |
| AIM Short-Term Investments Trust Government & Agency Portfolio, | | | | |
| Class I, 3.72% q (pp) | | | | 594,458 | | 594,458 |
| Evergreen Institutional Money Market Fund, Class I, 4.31% q ø | | 8,591,682 | | 8,591,682 |
| |
|
| | | | | | | 9,186,140 |
| |
|
| Total Short-Term Investments (cost $25,581,469) | | | | 25,581,469 |
| |
|
| Total Investments (cost $482,561,734) 103.0% | | | | 526,861,133 |
| Other Assets and Liabilities (3.0%) | | | | (15,275,454) |
| |
|
| Net Assets 100.0% | | | | | | $ 511,585,679 |
| |
|
| * | | Non-income producing security |
| (p) | | All or a portion of this security is on loan. |
| (pp) | | All or a portion of this security represents investment of cash collateral received from securities on loan. |
| ^ | | Collateral is pooled with the collateral of other Evergreen funds and allocated on a pro-rata basis into 159 issues of |
| | | high grade short-term securities such that sufficient collateral is applied to the respective repurchase agreement. |
| ß | | Rate shown represents the yield to maturity at date of purchase. |
| ƒ | | All or a portion of this security was pledged to cover initial margin requirements for open futures contracts. |
| q | | Rate shown is the 7-day annualized yield at period end. |
| ø | | Evergreen Investment Management Company, LLC is the investment advisor to both the Fund and the money market |
| | | fund. |
| The following table shows the percent of total long-term investments by sector as of January 31, 2008: |
| |
| Financials | | 26.3% | |
| Energy | | 15.0% | |
| Health Care | | 10.6% | |
| Industrials | | 10.5% | |
| Consumer Staples | | 10.4% | |
| Consumer Discretionary | | 6.7% | |
| Telecommunication Services | | 6.6% | |
| Utilities | | 5.6% | |
| Information Technology | | 4.6% | |
| Materials | | 3.7% | |
| |
| |
| | | 100.0% | |
| | |
| |
See Notes to Financial Statements
16
STATEMENT OF ASSETS AND LIABILITIES
January 31, 2008 (unaudited)
| Assets | | |
| Investments in securities, at value (cost $473,970,052) including $15,133,725 | | |
| of securities loaned | | $ 518,269,451 |
| Investments in affiliated money market fund, at value (cost $8,591,682) | | 8,591,682 |
|
| Total investments | | 526,861,133 |
| Receivable for Fund shares sold | | 163,297 |
| Dividends receivable | | 754,834 |
| Receivable for daily variation margin on open futures contracts | | 202,436 |
| Receivable for securities lending income | | 6,468 |
| Prepaid expenses and other assets | | 25,471 |
|
| Total assets | | 528,013,639 |
|
| Liabilities | | |
| Payable for Fund shares redeemed | | 784,488 |
| Payable for securities on loan | | 15,594,458 |
| Advisory fee payable | | 7,482 |
| Distribution Plan expenses payable | | 817 |
| Due to other related parties | | 1,475 |
| Accrued expenses and other liabilities | | 39,240 |
|
| Total liabilities | | 16,427,960 |
|
| Net assets | | $ 511,585,679 |
|
| Net assets represented by | | |
| Paid-in capital | | $ 452,090,901 |
| Undistributed net investment income | | 806,069 |
| Accumulated net realized gains on investments | | 15,056,376 |
| Net unrealized gains on investments | | 43,632,333 |
|
| Total net assets | | $ 511,585,679 |
|
| Net assets consists of | | |
| Class A | | $ 88,289,779 |
| Class B | | 5,739,605 |
| Class C | | 2,375,949 |
| Class I | | 415,180,346 |
|
| Total net assets | | $ 511,585,679 |
|
| Shares outstanding (unlimited number of shares authorized) | | |
| Class A | | 5,855,993 |
| Class B | | 382,818 |
| Class C | | 158,782 |
| Class I | | 27,607,134 |
|
| Net asset value per share | | |
| Class A | | $ 15.08 |
| Class A—Offering price (based on sales charge of 5.75%) | | $ 16.00 |
| Class B | | $ 14.99 |
| Class C | | $ 14.96 |
| Class I | | $ 15.04 |
|
See Notes to Financial Statements
17
STATEMENT OF OPERATIONS
Six Months Ended January 31, 2008 (unaudited)
| Investment income | | |
| Dividends | | $ 7,763,238 |
| Income from affiliate | | 254,879 |
| Securities lending | | 30,328 |
| Interest | | 17,963 |
|
| Total investment income | | 8,066,408 |
|
| Expenses | | |
| Advisory fee | | 1,894,767 |
| Distribution Plan expenses | | |
| Class A | | 131,668 |
| Class B | | 34,651 |
| Class C | | 14,388 |
| Administrative services fee | | 304,377 |
| Transfer agent fees | | 211,786 |
| Trustees’ fees and expenses | | 6,570 |
| Printing and postage expenses | | 23,042 |
| Custodian and accounting fees | | 85,200 |
| Registration and filing fees | | 32,682 |
| Professional fees | | 37,969 |
| Interest expense | | 1,870 |
| Other | | 7,189 |
|
| Total expenses | | 2,786,159 |
| Less: Expense reductions | | (5,900) |
| Fee waivers | | (183,383) |
|
| Net expenses | | 2,596,876 |
|
| Net investment income | | 5,469,532 |
|
| Net realized and unrealized gains or losses on investments | | |
| Net realized gains or losses on: | | |
| Securities | | 13,158,263 |
| Foreign currency related transactions | | (21) |
| Futures contracts | | (941,631) |
|
| Net realized gains on investments | | 12,216,611 |
| Net change in unrealized gains or losses on investments | | (39,438,898) |
|
| Net realized and unrealized gains or losses on investments | | (27,222,287) |
|
| Net decrease in net assets resulting from operations | | $ (21,752,755) |
|
See Notes to Financial Statements
18
STATEMENTS OF CHANGES IN NET ASSETS
| | | Six Months Ended | | | | |
| | | January 31, 2008 | | Year Ended |
| | | (unaudited) | | July 31, 2007 |
|
| Operations | | | | | | | | |
| Net investment income | | $ 5,469,532 | | $ 11,909,951 |
| Net realized gains on investments | | | | 12,216,611 | | | | 98,250,961 |
| Net change in unrealized gains or losses | | | | | | | | |
| on investments | | | | (39,438,898) | | | | (26,649,744) |
|
| Net increase (decrease) in net assets | | | | | | | | |
| resulting from operations | | | | (21,752,755) | | | | 83,511,168 |
|
| Distributions to shareholders from | | | | | | | | |
| Net investment income | | | | | | | | |
| Class A | | | | (785,079) | | | | (394,869) |
| Class B | | | | (24,154) | | | | (44,707) |
| Class C | | | | (10,305) | | | | (19,067) |
| Class I | | | | (4,319,522) | | | | (11,393,940) |
| Net realized gains | | | | | | | | |
| Class A | | | | (12,226,944) | | | | (447,830) |
| Class B | | | | (826,017) | | | | (170,488) |
| Class C | | | | (336,376) | | | | (68,598) |
| Class I | | | | (57,464,687) | | | | (20,286,301) |
|
| Total distributions to shareholders | | | | (75,993,084) | | | | (32,825,800) |
|
| | | Shares | | | | Shares | | |
| Capital share transactions | | | | | | | | |
| Proceeds from shares sold | | | | | | | | |
| Class A | | 191,336 | | 3,316,778 | | 1,159,020 | | 21,219,105 |
| Class B | | 18,780 | | 318,372 | | 199,113 | | 3,571,566 |
| Class C | | 6,366 | | 103,924 | | 90,405 | | 1,605,127 |
| Class I | | 2,224,960 | | 35,871,012 | | 6,051,897 | | 112,662,110 |
|
| | | | | 39,610,086 | | | | 139,057,908 |
|
| Net asset value of shares issued in | | | | | | | | |
| reinvestment of distributions | | | | | | | | |
| Class A | | 798,002 | | 12,599,375 | | 41,540 | | 740,853 |
| Class B | | 46,570 | | 729,185 | | 10,481 | | 181,619 |
| Class C | | 16,661 | | 260,395 | | 3,915 | | 67,788 |
| Class I | | 1,963,595 | | 30,944,991 | | 733,942 | | 12,801,347 |
|
| | | | | 44,533,946 | | | | 13,791,607 |
|
| Automatic conversion of Class B shares | | | | | | | | |
| to Class A shares | | | | | | | | |
| Class A | | 9,478 | | 160,696 | | 25,821 | | 468,167 |
| Class B | | (9,528) | | (160,696) | | (25,938) | | (468,167) |
|
| | | | | 0 | | | | 0 |
|
| Payment for shares redeemed | | | | | | | | |
| Class A | | (1,761,733) | | (30,241,667) | | (4,397,745) | | (84,274,434) |
| Class B | | (81,054) | | (1,333,865) | | (81,958) | | (1,474,278) |
| Class C | | (32,073) | | (524,189) | | (24,350) | | (440,496) |
| Class I | | (7,656,869) | | (132,231,446) | | (16,328,066) | | (296,186,015) |
|
| | | | | (164,331,167) | | | | (382,375,223) |
|
| Net asset value of shares issued | | | | | | | | |
| in acquisitions— Class A | | 0 | | 0 | | 8,982,336 | | 174,379,711 |
|
| Net decrease in net assets resulting | | | | | | | | |
| from capital share transactions | | | | (80,187,135) | | | | (55,145,997) |
|
| Total decrease in net assets | | | | (177,932,974) | | | | (4,460,629) |
| Net assets | | | | | | | | |
| Beginning of period | | | | 689,518,653 | | | | 693,979,282 |
|
| End of period | | $ 511,585,679 | | $ 689,518,653 |
|
| Undistributed net investment income | | $ 806,069 | | $ 475,597 |
|
See Notes to Financial Statements
19
NOTES TO FINANCIAL STATEMENTS (unaudited)
1. ORGANIZATION
Evergreen Disciplined Value Fund (the “Fund”) is a diversified series of Evergreen Equity Trust (the “Trust”), a Delaware statutory trust organized on September 18, 1997. The Trust is an open-end management investment company registered under the Investment Company Act of 1940, as amended (the “1940 Act”).
The Fund offers Class A, Class B, Class C and Class I shares. Class A shares are sold with a front-end sales charge. However, Class A share investments of $1 million or more are not subject to a front-end sales charge but are subject to a contingent deferred sales charge of 1.00% upon redemption within 18 months. Class B shares are sold without a front-end sales charge but are subject to a contingent deferred sales charge that is payable upon redemption and decreases depending on how long the shares have been held. Class C shares are sold without a front-end sales charge but are subject to a contingent deferred sales charge that is payable upon redemption within one year. Class I shares are sold without a front-end sales charge or contingent deferred sales charge. Each class of shares, except Class I shares, pays an ongoing distribution fee.
2. SIGNIFICANT ACCOUNTING POLICIES
The following is a summary of significant accounting policies consistently followed by the Fund in the preparation of its financial statements. The policies are in conformity with generally accepted accounting principles in the United States of America, which require management to make estimates and assumptions that affect amounts reported herein. Actual results could differ from these estimates.
a. Valuation of investments
Listed equity securities are usually valued at the last sales price or official closing price on the national securities exchange where the securities are principally traded.
Foreign securities traded on an established exchange are valued at the last sales price on the exchange where the security is primarily traded. If there has been no sale, the securities are valued at the mean between bid and asked prices. Foreign securities may be valued at fair value according to procedures approved by the Board of Trustees if the closing price is not reflective of current market values due to trading or events occurring in the foreign markets between the close of the established exchange and the valuation time of the Fund. In addition, substantial changes in values in the U.S. markets subsequent to the close of a foreign market may also affect the values of securities traded in the foreign market. The value of foreign securities may be adjusted if such movements in the U.S. market exceed a specified threshold.
Portfolio debt securities acquired with more than 60 days to maturity are fair valued using matrix pricing methods determined by an independent pricing service which takes into consideration such factors as similar security prices, yields, maturities, liquidity and ratings. Securities for which valuations are not readily available from an independent pricing service may be valued by brokers which use prices provided by market makers or estimates of market value obtained from yield data relating to investments or securities with similar characteristics.
20
NOTES TO FINANCIAL STATEMENTS (unaudited) continued
Short-term securities with remaining maturities of 60 days or less at the time of purchase are valued at amortized cost, which approximates market value.
Investments in open-end mutual funds are valued at net asset value. Securities for which market quotations are not readily available or not reflective of current market value are valued at fair value as determined by the investment advisor in good faith, according to procedures approved by the Board of Trustees.
b. Repurchase agreements
Securities pledged as collateral for repurchase agreements are held by the custodian bank or in a segregated account in the Fund’s name until the agreements mature. Collateral for certain tri-party repurchase agreements is held at the counterparty’s custodian in a segregated account for the benefit of the Fund and the counterparty. Each agreement requires that the market value of the collateral be sufficient to cover payments of interest and principal. However, in the event of default or bankruptcy by the other party to the agreement, retention of the collateral may be subject to legal proceedings. The Fund will enter into repurchase agreements with banks and other financial institutions, which are deemed by the investment advisor to be creditworthy pursuant to guidelines established by the Board of Trustees. In certain instances, the Fund’s securities lending agent may provide collateral in the form of repurchase agreements.
c. Foreign currency translation
All assets and liabilities denominated in foreign currencies are translated into U.S. dollar amounts at the date of valuation. Purchases and sales of portfolio securities and income items denominated in foreign currencies are translated into U.S. dollar amounts on the respective dates of such transactions. The Fund does not separately account for that portion of the results of operations resulting from changes in foreign exchange rates on investments and the fluctuations arising from changes in market prices of securities held. Such fluctuations are included with the net realized and unrealized gains or losses on investments.
d. Futures contracts
In order to gain exposure to, or protect against changes in, security values, the Fund may buy and sell futures contracts. The primary risks associated with the use of futures contracts are the imperfect correlation between changes in market values of securities held by the Fund and the prices of futures contracts, and the possibility of an illiquid market.
Futures contracts are valued based upon their quoted daily settlement prices. The aggregate principal amounts of the contracts are not recorded in the financial statements. Fluctuations in the value of the contracts are recorded in the Statement of Assets and Liabilities as an asset or liability and in the Statement of Operations as unrealized gains or losses until the contracts are closed, at which point they are recorded as net realized gains or losses on futures contracts.
e. Securities lending
The Fund may lend its securities to certain qualified brokers in order to earn additional income. The Fund receives compensation in the form of fees or interest earned on the investment of any cash collateral received. The Fund also continues to receive interest and dividends on the securi-
21
NOTES TO FINANCIAL STATEMENTS (unaudited) continued
ties loaned. The Fund receives collateral in the form of cash or securities with a market value at least equal to the market value of the securities on loan. In the event of default or bankruptcy by the borrower, the Fund could experience delays and costs in recovering the loaned securities or in gaining access to the collateral. The Fund has the right under the lending agreement to recover the securities from the borrower on demand.
f. Security transactions and investment income
Security transactions are recorded on trade date. Realized gains and losses are computed using the specific cost of the security sold. Interest income is recorded on the accrual basis and includes accretion of discounts and amortization of premiums. Dividend income is recorded on the ex-dividend date or in the case of some foreign securities, on the date when the Fund is made aware of the dividend.
g. Federal taxes
The Fund intends to continue to qualify as a regulated investment company and distribute all of its taxable income, including any net capital gains (which have already been offset by available capital loss carryovers). Accordingly, no provision for federal taxes is required.
h. Distributions
Distributions to shareholders from net investment income and net realized gains, if any, are recorded on the ex-dividend date. Such distributions are determined in conformity with income tax regulations, which may differ from generally accepted accounting principles.
i. Class allocations
Income, common expenses and realized and unrealized gains and losses are allocated to the classes based on the relative net assets of each class. Distribution fees, if any, are calculated daily at the class level based on the appropriate net assets of each class and the specific expense rates applicable to each class.
3. ADVISORY FEE AND OTHER TRANSACTIONS WITH AFFILIATES
Evergreen Investment Management Company, LLC (“EIMC”), an indirect, wholly-owned subsidiary of Wachovia Corporation (“Wachovia”), is the investment advisor to the Fund and is paid an annual fee starting at 0.62% and declining to 0.45% as average daily net assets increase. For the six months ended January 31, 2008, the advisory fee was equivalent to 0.62% of the Fund’s average daily net assets (on an annualized basis).
From time to time, EIMC may voluntarily or contractually waive its fee and/or reimburse expenses in order to limit operating expenses. During the six months ended January 31, 2008, EIMC contractually waived its advisory fee in the amount of $183,383.
The Fund may invest in money market funds which are advised by EIMC. Income earned on these investments is included in income from affiliate on the Statement of Operations.
Effective January 1, 2008, EIMC replaced Evergreen Investment Services, Inc. (“EIS”), an indirect, wholly-owned subsidiary of Wachovia, as the administrator to the Fund upon the
22
NOTES TO FINANCIAL STATEMENTS (unaudited) continued
assignment of the Fund’s Administrative Services Agreement from EIS to EIMC. There were no changes to the services being provided or fees being paid by the Fund. The administrator provides the Fund with facilities, equipment and personnel and is paid an annual rate determined by applying percentage rates to the aggregate average daily net assets of the Evergreen funds (excluding money market funds and Evergreen Institutional Enhanced Income Fund), starting at 0.10% and declining to 0.05% as the aggregate average daily net assets of the Evergreen funds (excluding money market funds and Evergreen Institutional Enhanced Income Fund) increase.
Evergreen Service Company, LLC (“ESC”), an indirect, wholly-owned subsidiary of Wachovia, is the transfer and dividend disbursing agent for the Fund. ESC receives account fees that vary based on the type of account held by the shareholders in the Fund. For the six months ended January 31, 2008, the transfer agent fees were equivalent to an annual rate of 0.07% of the Fund’s average daily net assets.
Wachovia Bank NA, through its securities lending division of Wachovia Global Securities Lending, acts as the securities lending agent for the Fund.
4. DISTRIBUTION PLANS
EIS serves as distributor of the Fund’s shares. The Fund has adopted Distribution Plans, as allowed by Rule 12b-1 of the 1940 Act, for each class of shares, except Class I. Under the Distribution Plans, distribution fees are paid at an annual rate of 0.25% of the average daily net assets for Class A shares and 1.00% of the average daily net assets for each of Class B and Class C shares.
For the six months ended January 31, 2008, EIS received $1,678 from the sale of Class A shares and $278, $10,781 and $33 in contingent deferred sales charges from redemptions of Class A, Class B and Class C shares, respectively.
5. ACQUISITIONS
Effective at the close of business on May 18, 2007, the Fund acquired the net assets of Atlas Dual Focus Fund in a tax-free exchange for Class A shares of the Fund. Shares were issued to shareholders of Atlas Dual Focus Fund at an exchange ratio of 0.70 for Class A shares of the Fund. On the same date, the Fund also acquired the net assets of Atlas Value Fund in a tax-free exchange for Class A shares of the Fund. Shares were issued to shareholders of Atlas Value Fund at an exchange ratio of 0.70 for Class A shares of the Fund. The aggregate net assets of the Fund immediately prior to the acquisitions were $638,076,973.
The value of net assets acquired, unrealized appreciation acquired and number of shares issued were as follows:
| | | Value of Net | | Unrealized | | Number of |
| Acquired Fund | | Assets Acquired | | Appreciation | | Shares Issued |
|
| Atlas Dual Focus Fund | | $ 60,185,843 | | $10,717,156 | | 3,100,185 Class A |
| Atlas Value Fund | | 114,193,868 | | 22,194,802 | | 5,882,151 Class A |
|
23
NOTES TO FINANCIAL STATEMENTS (unaudited) continued
The aggregate net assets of the Fund immediately after these acquisitions were $812,456,684.
6. INVESTMENT TRANSACTIONS
Cost of purchases and proceeds from sales of investment securities (excluding short-term securities) were $153,411,290 and $307,683,477, respectively, for the six months ended January 31, 2008.
At January 31, 2008, the Fund had open long futures contracts outstanding as follows:
| | | | | Initial | | Value at | | |
| | | | | Contract | | January 31, | | Unrealized |
| Expiration | | Contracts | | Amount | | 2008 | | Loss |
|
| March 2008 | | 29 S&P 500 Index | | $10,669,166 | | $10,002,100 | | $667,066 |
|
During the six months ended January 31, 2008, the Fund loaned securities to certain brokers. At January 31, 2008, the value of securities on loan and the total value of collateral received for securities loaned amounted to $15,133,725 and $15,594,458, respectively.On January 31, 2008, the aggregate cost of securities for federal income tax purposes was $485,810,193. The gross unrealized appreciation and depreciation on securities based on tax cost was $60,729,681 and $19,678,741, respectively, with a net unrealized appreciation of $41,050,940.
As of July 31, 2007, the Fund had $5,828,725 in capital loss carryovers for federal income tax expiring in 2010.
Certain portions of the capital loss carryovers of the Fund were assumed as a result of acquisitions. These losses are subject to certain limitations prescribed by the Internal Revenue Code. Utilization of these capital loss carryovers was limited during the year ended July 31, 2007 in accordance with income tax regulations.
7. INTERFUND LENDING
Pursuant to an Exemptive Order issued by the SEC, the Fund may participate in an interfund lending program with certain funds in the Evergreen fund family. This program allows the Fund to borrow from, or lend money to, other participating funds. During the six months ended January 31, 2008, the Fund did not participate in the interfund lending program.
8. EXPENSE REDUCTIONS
Through expense offset arrangements with ESC and the Fund’s custodian, a portion of fund expenses has been reduced.
9. DEFERRED TRUSTEES’ FEES
Each Trustee of the Fund may defer any or all compensation related to performance of his or her duties as a Trustee. The Trustees’ deferred balances are allocated to deferral accounts, which are included in the accrued expenses for the Fund. The investment performance of the deferral
24
NOTES TO FINANCIAL STATEMENTS (unaudited) continued
accounts is based on the investment performance of certain Evergreen funds. Any gains earned or losses incurred in the deferral accounts are reported in the Fund’s Trustees’ fees and expenses. At the election of the Trustees, the deferral account will be paid either in one lump sum or in quarterly installments for up to ten years.
10. FINANCING AGREEMENT
The Fund and certain other Evergreen funds share in an unsecured revolving credit commitment for temporary and emergency purposes, including the funding of redemptions, as permitted by each participating fund’s borrowing restrictions. Borrowings under this facility bear interest at 0.50% per annum above the Federal Funds rate. All of the participating funds are charged an annual commitment fee on the unused balance, which is allocated pro rata. The credit facility is for $100 million with an annual commitment fee of 0.08% .
During the six months ended January 31, 2008, the Fund had average borrowings outstanding of $31,641 (on an annualized basis) at an average rate of 5.91% and paid interest of $1,870.
11. REGULATORY MATTERS AND LEGAL PROCEEDINGS
Pursuant to an administrative order issued by the SEC on September 19, 2007, EIMC, EIS, ESC (collectively, the “Evergreen Entities”), Wachovia Securities, LLC and the SEC have entered into an agreement settling allegations of (i) improper short-term trading arrangements in effect prior to May 2003 involving former officers and employees of EIMC and certain broker-dealers, (ii) insufficient systems for monitoring exchanges and enforcing exchange limitations as stated in certain funds’ prospectuses, and (iii) inadequate e-mail retention practices. Under the settlement, the Evergreen Entities were censured and paid approximately $32 million in disgorgement and penalties. This amount, along with a fine assessed by the SEC against Wachovia Securities, LLC will be distributed pursuant to a plan to be developed by an independent distribution consultant and approved by the SEC. The Evergreen Entities neither admitted nor denied the allegations and findings set forth in its settlement with the SEC.
In addition, the Evergreen funds and EIMC and certain of its affiliates are involved in various legal actions, including private litigation and class action lawsuits. EIMC does not expect that any of such legal actions currently pending or threatened will have a material adverse impact on the financial position or operations of any of the Evergreen funds or on EIMC’s ability to provide services to the Evergreen funds.
Although EIMC believes that none of the matters discussed above will have a material adverse impact on the Evergreen funds, there can be no assurance that these matters and any publicity surrounding or resulting from them will not result in reduced sales or increased redemptions of Evergreen fund shares, which could increase Evergreen fund transaction costs or operating expenses, or that they will not have other adverse consequences on the Evergreen funds.
25
NOTES TO FINANCIAL STATEMENTS (unaudited) continued
12. NEW ACCOUNTING PRONOUNCEMENTS
In June 2006, the Financial Accounting Standards Board (“FASB”) issued FASB Interpretation No. 48, Accounting for Uncertainty in Income Taxes — an interpretation of FASB statement 109 (“FIN 48”). FIN 48 supplements FASB 109 by prescribing a recognition threshold and measurement attribute for the financial statement recognition and measurement of a tax position taken or expected to be taken in a tax return. The Fund’s financial statements have not been impacted by the adoption of FIN 48. However, the conclusions regarding FIN 48 may be subject to review and adjustment at a later date based on factors including, but not limited to, further implementation guidance expected from FASB, and on-going analysis of tax laws, regulations, and interpretations thereof.
In September 2006, FASB issued Statement of Financial Accounting Standards No. 157, Fair Value Measurements (“FAS 157”). FAS 157 establishes a single authoritative definition of fair value, establishes a framework for measuring fair value and expands disclosures about fair value measurements. FAS 157 applies to fair value measurements already required or permitted by existing standards. The change to current generally accepted accounting principles from the application of FAS 157 relates to the definition of fair value, the methods used to measure fair value, and the expanded disclosures about fair value measurements. Management of the Fund does not believe the adoption of FAS 157 will materially impact the financial statement amounts, however, additional disclosures may be required about the inputs used to develop the measurements and the effect of certain of the measurements on changes in net assets for the period. FAS 157 is effective for financial statements issued for fiscal years beginning after November 15, 2007 and interim periods within those fiscal years.
13. SUBSEQUENT DISTRIBUTIONS
On March 13, 2008, the Fund declared distributions from net investment income to shareholders of record on March 12, 2008. The per share amounts payable on March 14, 2008 were as follows:
| | | Net |
| | | Investment |
| | | Income |
|
| Class A | | $ 0.0693 |
| Class B | | 0.0404 |
| Class C | | 0.0380 |
| Class I | | 0.0785 |
|
These distributions are not reflected in the accompanying financial statements.
26
ADDITIONAL INFORMATION (unaudited)
INFORMATION ABOUT THE REVIEW AND APPROVAL OF THE FUND’S INVESTMENT ADVISORY AGREEMENT
Each year, the Fund’s Board of Trustees is required to consider whether to continue in place the Fund’s investment advisory agreement. In September 2007, the Trustees, including a majority of the Trustees who are not interested persons (as that term is defined in the 1940 Act) of the Fund or of EIMC, approved the continuation of the Fund’s investment advisory agreement. (References below to the “Fund” are to Evergreen Disciplined Value Fund; references to the “funds” are to the Evergreen funds generally.)
At the same time, the Trustees considered the continuation of the investment advisory agreements for all of the funds, and the description below refers in many cases to the Trustees’ process and conclusions in connection with their consideration of this matter for all of the funds. (See “Certain Fund-Specific Considerations” below for a discussion regarding certain factors considered by the Trustees relating specifically to the Fund.) In all of its deliberations, the Board of Trustees and the disinterested Trustees were advised by independent counsel to the disinterested Trustees and counsel to the funds.
The review process. The 1940 Act requires that the Board of Trustees request and evaluate, and that EIMC and any sub-advisors furnish, such information as may reasonably be necessary to evaluate the terms of a fund’s advisory agreement. The review process began at the time of the last advisory contract-renewal process in September 2006. In the course of that process, the Trustees identified a number of funds that had experienced either short-term or longer-term performance issues. During the following months, the Trustees reviewed information relating to any changes in the performance of those funds and/or any changes in the investment process or the investment teams responsible for the management of the funds. In addition, during the course of the year, the Trustees reviewed information regarding the investment performance of all of the funds and identified additional funds that they believed warranted further attention based on performance since September 2006.
In spring 2007, a committee of the Board of Trustees (the “Committee”), working with EIMC management, determined generally the types of information the Board would review and set a timeline detailing the information required and the dates for its delivery to the Trustees. The independent data provider Keil Fiduciary Strategies LLC (“Keil”) was engaged to provide fund-specific and industry-wide data to the Board containing information of a nature and in a format generally prescribed by the Committee, and the Committee worked with Keil and EIMC to develop appropriate groups of peer funds for each fund. The Committee also identified a number of expense, performance, and other issues and requested specific information as to those issues.
The Trustees reviewed, with the assistance of an independent industry consultant retained by the disinterested Trustees, the information provided by EIMC in response to the Committee’s requests and the information provided by Keil. The Trustees formed small committees to review individual funds in greater detail. In addition, the Trustees requested information regarding,
27
ADDITIONAL INFORMATION (unaudited) continued
among other things, brokerage practices of the funds, the use of derivatives by the funds, strategic planning for the funds, analyst and research support available to the portfolio management teams, and information regarding the various fall-out benefits received directly and indirectly by EIMC and its affiliates from the funds. The Trustees requested and received additional information following that review.
The Committee met several times by telephone to consider the information provided by EIMC. The Committee met with representatives of EIMC in early September. At a meeting of the full Board of Trustees later in September, the Committee reported the results of its discussions with EIMC, and the full Board met with representatives of EIMC, engaged in further review of the materials provided to them, and approved the continuation of each of the advisory and sub-advisory agreements.
The disinterested Trustees discussed the continuation of the funds’ advisory agreements with representatives of EIMC and in multiple private sessions with legal counsel at which no personnel of EIMC were present. In considering the continuation of the agreement, the Trustees did not identify any particular information or consideration that was all-important or controlling, and each Trustee attributed different weights to various factors. The Trustees evaluated information provided to them both in terms of the Evergreen mutual funds generally and with respect to each fund, including the Fund, specifically as they considered appropriate; although the Trustees considered the continuation of the agreement as part of the larger process of considering the continuation of the advisory contracts for all of the funds, their determination to continue the advisory agreement for each of the funds was ultimately made on a fund-by-fund basis.
This summary describes a number of the most important, but not necessarily all, of the factors considered by the Board and the disinterested Trustees.
Information reviewed. The Board of Trustees and committees of the Board of Trustees meet periodically during the course of the year. At those meetings, the Board receives a wide variety of information regarding the services performed by EIMC, the investment performance of the funds, and other aspects of the business and operations of the funds. At those meetings, and in the process of considering the continuation of the agreements, the Trustees considered information regarding, for example, the funds’ investment results; the portfolio management teams for the funds and the experience of the members of those teams, and any recent changes in the membership of the teams; portfolio trading practices; compliance by the funds and EIMC with applicable laws and regulations and with the funds’ and EIMC’s compliance policies and procedures; risk evaluation and oversight procedures at EIMC; services provided by affiliates of EIMC to the funds and shareholders of the funds; and other information relating to the nature, extent, and quality of services provided by EIMC. The Trustees considered a number of changes in portfolio management personnel at EIMC and its advisory affiliates in the year since September 2006, and recent changes in compliance personnel at EIMC, including the appointment of a new Chief Compliance Officer for the funds.
28
ADDITIONAL INFORMATION (unaudited) continued
The Trustees considered the rates at which the funds pay investment advisory fees, and the efforts generally by EIMC and its affiliates as sponsors of the funds. The data provided by Keil showed the management fees paid by each fund in comparison to the management fees of other peer mutual funds, in addition to data regarding the investment performance of the funds in comparison to other peer mutual funds. The Trustees were assisted by the independent industry consultant in reviewing the information presented to them.
The Trustees considered the transfer agency fees paid by the funds to an affiliate of EIMC. They reviewed information presented to them showing that the transfer agency fees charged to the funds were generally consistent with industry norms.
The Trustees also considered that EIS, an affiliate of EIMC, serves as administrator to the funds and receives a fee for its services as administrator. In their comparison of the advisory fee paid by the funds with those paid by other mutual funds, the Trustees took into account administrative fees paid by the funds and those other mutual funds. The Board considered that EIS serves as distributor to the funds generally and receives fees from the funds for those services. They considered other so-called “fall-out” benefits to EIMC and its affiliates due to their other relationships with the funds, including, for example, soft-dollar services received by EIMC attributable to transactions entered into by EIMC for the benefit of the funds and brokerage commissions received by Wachovia Securities, LLC, an affiliate of EIMC, from transactions effected by it for the funds. The Trustees also noted that the funds pay sub-transfer agency fees to various financial institutions who hold fund shares in omnibus accounts, and that Wachovia Securities, LLC and its affiliates receive such payments from the funds in respect of client accounts they hold in omnibus arrangements, and that an affiliate of EIMC receives fees for administering the sub-transfer agency payment program. They also considered that Wachovia Securities, LLC and its affiliates receive distribution-related fees and shareholder servicing payments (including amounts derived from payments under the funds’ Rule 12b-1 plans) in respect of shares sold or held through it. The Trustees also noted that an affiliate of EIMC receives compensation for serving as a securities lending agent for the funds.
Nature and quality of the services provided. The Trustees considered that EIMC and its affili-ates generally provide a comprehensive investment management service to the funds. They noted that EIMC makes its personnel available to serve as officers of the funds, and concluded that the reporting and management functions provided by EIMC with respect to the funds were generally satisfactory. The Trustees considered the investment philosophy of the Fund’s portfolio management team, and considered the in-house research capabilities of EIMC and its affiliates, as well as other resources available to EIMC, including research services available to it from third parties. The Board considered the managerial and financial resources available to EIMC and its affiliates, and the commitment that the Wachovia organization has made to the funds generally. On the basis of these factors, they determined that the nature and scope of the services provided by EIMC were consistent with its duties under the investment advisory agreements and appropriate and consistent with the investment programs and best interests of the funds.
29
ADDITIONAL INFORMATION (unaudited) continued
The Trustees noted the resources EIMC and its affiliates have committed to the regulatory, compliance, accounting, tax and oversight of tax reporting, and shareholder servicing functions, and the number and quality of staff committed to those functions, which they concluded were appropriate and generally in line with EIMC’s responsibilities to the Fund and to the funds generally. The Board and the disinterested Trustees concluded, within the context of their overall conclusions regarding the funds’ advisory agreements, that they were generally satisfied with the nature, extent, and quality of the services provided by EIMC, including services provided by EIS under its administrative services agreements with the funds.
Investment performance. The Trustees considered the investment performance of each fund, both by comparison to other comparable mutual funds and to broad market indices. The Trustees emphasized that the continuation of the investment advisory agreement for a fund should not be taken as any indication that the Trustees did not believe investment performance for any specific fund might not be improved, and they noted that they would continue to monitor closely the investment performance of the funds going forward.
Advisory and administrative fees. The Trustees recognized that EIMC does not seek to provide the lowest cost investment advisory service, but to provide a high quality, full-service investment management product at a reasonable price. They also noted that EIMC has in many cases sought to set its investment advisory fees at levels consistent with industry norms. The Trustees noted that, in certain cases, a fund’s management fees were higher than many or most other mutual funds in the same Keil peer group. However, in each case, the Trustees determined on the basis of the information presented that the level of management fees was not excessive.
Certain Fund-specific considerations. The Trustees noted that, for the one-, three-, five-, and ten-year periods ended December 31, 2006, the Fund’s Class I shares (the Fund’s oldest share class) had underperformed the Fund’s benchmark index, the Russell 1000 Value Index. The Trustees noted that, for the one-, three-, and ten-year periods ended December 31, 2006, the Fund’s Class I shares outperformed a majority of the mutual funds against which the Trustees compared the Fund’s performance, but that, for the five-year period ended December 31, 2006, the Fund’s Class I shares had underperformed a majority of the mutual funds against which the Trustees compared the Fund’s performance.
The Trustees noted that the management fee paid by the Fund was lower than the management fees paid by most of the other mutual funds against which the Trustees compared the Fund’s management fee and that the level of profitability realized by EIMC in respect of the fee did not appear excessive.
The Trustees considered information regarding the rates at which other clients pay advisory fees to EIMC or its affiliates for advisory services that are comparable to the advisory services they provide to the Fund. Fees charged by EIMC to those other clients were generally lower than those charged to the Fund. EIMC explained that compliance, reporting, and other legal burdens of providing investment advice to mutual funds generally exceed those required to provide advisory services to non-mutual fund clients such as retirement or pension plans. In addition, EIMC
30
ADDITIONAL INFORMATION (unaudited) continued
pointed out that there is substantially greater legal and other risk to EIMC and its affiliates from managing public mutual funds than in managing private accounts. The Trustees also considered the investment performance of those other accounts managed by EIMC and its affiliates, and concluded that the performance of those accounts did not reflect any substantial difference in the quality of the service provided by EIMC and its affiliates to those accounts.
Economies of scale. The Trustees noted that economies of scale would likely be achieved by EIMC in managing the funds as the funds grow. The Trustees noted that the Fund had implemented breakpoints in its advisory fee structure. The Trustees noted that they would continue to review the appropriate levels of breakpoints in the future, but concluded that the breakpoints as implemented appeared to be a reasonable step toward the realization of economies of scale by the Fund.
Profitability. The Trustees considered information provided to them regarding the profitability to the EIMC organization of the investment advisory, administration, and transfer agency (with respect to the open-end funds only) fees paid to EIMC and its affiliates by each of the funds. They considered that the information provided to them was necessarily estimated, and that the profitability information provided to them, especially on a fund-by-fund basis, did not necessarily provide a definitive tool for evaluating the appropriateness of each fund’s advisory fee. They noted that the levels of profitability of the funds to EIMC varied widely, depending on among other things the size and type of fund. They considered the profitability of the funds in light of such factors as, for example, the information they had received regarding the relation of the fees paid by the funds to those paid by other mutual funds, the investment performance of the funds, and the amount of revenues involved. In light of these factors, the Trustees concluded that the profitability of any of the funds, individually or in the aggregate, should not prevent the Trustees from approving the continuation of the agreements.
31
TRUSTEES AND OFFICERS
TRUSTEES1
| Charles A. Austin III | | Investment Counselor, Anchor Capital Advisors, LLC. (investment advice); Director, The Andover |
| Trustee | | Companies (insurance); Trustee, Arthritis Foundation of New England; Former Director, The |
| DOB: 10/23/1934 | | Francis Ouimet Society (scholarship program); Former Director, Executive Vice President and |
| Term of office since: 1991 | | Treasurer, State Street Research & Management Company (investment advice) |
| Other directorships: None | | |
|
| |
| K. Dun Gifford | | Chairman and President, Oldways Preservation and Exchange Trust (education); Trustee, |
| Trustee | | Chairman of the Finance Committee, Member of the Executive Committee, and Former |
| DOB: 10/23/1938 | | Treasurer, Cambridge College |
| Term of office since: 1974 | | |
| Other directorships: None | | |
|
| |
| Dr. Leroy Keith, Jr. | | Managing Director, Almanac Capital Management (commodities firm); Trustee, Phoenix |
| Trustee | | Fund Complex; Director, Diversapack Co. (packaging company); Former Partner, Stonington |
| DOB: 2/14/1939 | | Partners, Inc. (private equity fund); Former Director, Obagi Medical Products Co.; Former |
| Term of office since: 1983 | | Director, Lincoln Educational Services |
| Other directorships: Trustee, | | |
| Phoenix Fund Complex (consisting | | |
| of 53 portfolios as of 12/31/2007) | | |
|
| |
| Carol A. Kosel1 | | Former Consultant to the Evergreen Boards of Trustees; Former Vice President and Senior Vice |
| Trustee | | President, Evergreen Investments, Inc.; Former Treasurer, Evergreen Funds; Former Treasurer, |
| DOB: 12/25/1963 | | Vestaur Securities Fund |
| Term of office since: 2008 | | |
| Other directorships: None | | |
|
| |
| Gerald M. McDonnell | | Former Manager of Commercial Operations, CMC Steel (steel producer) |
| Trustee | | |
| DOB: 7/14/1939 | | |
| Term of office since: 1988 | | |
| Other directorships: None | | |
|
| |
| Patricia B. Norris | | President and Director of Buckleys of Kezar Lake, Inc. (real estate company); Former President |
| Trustee | | and Director of Phillips Pond Homes Association (home community); Former Partner, |
| DOB: 4/9/1948 | | PricewaterhouseCoopers, LLP (independent registered public accounting firm) |
| Term of office since: 2006 | | |
| Other directorships: None | | |
|
| |
| William Walt Pettit | | Partner and Vice President, Kellam & Pettit, P.A. (law firm); Director, Superior Packaging Corp. |
| Trustee | | (packaging company); Member, Superior Land, LLC (real estate holding company), Member, |
| DOB: 8/26/1955 | | K&P Development, LLC (real estate development); Former Director, National Kidney Foundation |
| Term of office since: 1988 | | of North Carolina, Inc. (non-profit organization) |
| Other directorships: None | | |
|
| |
| David M. Richardson | | President, Richardson, Runden LLC (executive recruitment advisory services); Director, J&M |
| Trustee | | Cumming Paper Co. (paper merchandising); Trustee, NDI Technologies, LLP (communications); |
| DOB: 9/19/1941 | | Former Consultant, AESC (The Association of Executive Search Consultants) |
| Term of office since: 1982 | | |
| Other directorships: None | | |
|
| |
| Dr. Russell A. Salton III | | President/CEO, AccessOne MedCard, Inc. |
| Trustee | | |
| DOB: 6/2/1947 | | |
| Term of office since: 1984 | | |
| Other directorships: None | | |
|
32
TRUSTEES AND OFFICERS continued
| Michael S. Scofield | | Retired Attorney, Law Offices of Michael S. Scofield; Former Director and Chairman, Branded |
| Trustee | | Media Corporation (multi-media branding company) |
| DOB: 2/20/1943 | | |
| Term of office since: 1984 | | |
| Other directorships: None | | |
|
| |
| Richard J. Shima | | Independent Consultant; Director, Hartford Hospital; Trustee, Greater Hartford YMCA; Former |
| Trustee | | Director, Trust Company of CT; Former Director, Old State House Association; Former Trustee, |
| DOB: 8/11/1939 | | Saint Joseph College (CT) |
| Term of office since: 1993 | | |
| Other directorships: None | | |
|
| |
| Richard K. Wagoner, CFA2 | | Member and Former President, North Carolina Securities Traders Association; Member, Financial |
| Trustee | | Analysts Society |
| DOB: 12/12/1937 | | |
| Term of office since: 1999 | | |
| Other directorships: None | | |
|
| |
| |
| OFFICERS | | |
| |
| Dennis H. Ferro3 | | Principal occupations: President and Chief Executive Officer, Evergreen Investment Company, |
| President | | Inc. and Executive Vice President, Wachovia Bank, N.A.; former Chief Investment Officer, |
| DOB: 6/20/1945 | | Evergreen Investment Company, Inc. |
| Term of office since: 2003 | | |
|
| |
| Jeremy DePalma4 | | Principal occupations: Senior Vice President, Evergreen Investment Management Company, LLC; |
| Treasurer | | Former Vice President, Evergreen Investment Services, Inc.; Former Assistant Vice President, |
| DOB: 2/5/1974 | | Evergreen Investment Services, Inc. |
| Term of office since: 2005 | | |
|
| |
| Michael H. Koonce4 | | Principal occupations: Senior Vice President and General Counsel, Evergreen Investment |
| Secretary | | Services, Inc.; Secretary, Senior Vice President and General Counsel, Evergreen Investment |
| DOB: 4/20/1960 | | Management Company, LLC and Evergreen Service Company, LLC; Senior Vice President and |
| Term of office since: 2000 | | Assistant General Counsel, Wachovia Corporation |
|
| |
| Robert Guerin4 | | Principal occupations: Chief Compliance Officer, Evergreen Funds and Senior Vice President of |
| Chief Compliance Officer | | Evergreen Investments Co, Inc; Former Managing Director and Senior Compliance Officer, |
| DOB: 9/20/1965 | | Babson Capital Management LLC; Former Principal and Director, Compliance and Risk |
| Term of office since: 2007 | | Management, State Street Global Advisors; Former Vice President and Manager, Sales Practice |
| | | Compliance, Deutsche Asset Management. |
1 Each Trustee, except Mses. Kosel and Norris, serves until a successor is duly elected or qualified or until his or her death, resignation, retirement or removal from office. As new Trustees, Ms. Kosel’s and Ms. Norris’ initial terms end December 31, 2010 and June 30, 2009, respectively, at which times they may be re-elected by Trustees to serve until a successor is duly elected or qualified or until her death, resignation, retirement or removal from office by the Trustees. Each Trustee, except Ms. Kosel, oversaw 93 Evergreen funds as of December 31, 2007. Ms. Kosel became a Trustee on January 1, 2008. Correspondence for each Trustee may be sent to Evergreen Board of Trustees, P.O. Box 20083, Charlotte, NC 28202.
2 Mr. Wagoner is an “interested person” of the Fund because of his ownership of shares in Wachovia Corporation, the parent to the Fund’s investment advisor.
3 The address of the Officer is 401 S. Tryon Street, 20th Floor, Charlotte, NC 28288.
4 The address of the Officer is 200 Berkeley Street, Boston, MA 02116.
Additional information about the Fund’s Board of Trustees and Officers can be found in the Statement of Additional Information (SAI) and is available upon request without charge by calling 800.343.2898.
33
575709 rv2 03/2008
Evergreen Equity Income Fund
| table of contents |
| 1 | | LETTER TO SHAREHOLDERS |
| 4 | | FUND AT A GLANCE |
| 6 | | ABOUT YOUR FUND’S EXPENSES |
| 7 | | FINANCIAL HIGHLIGHTS |
| 12 | | SCHEDULE OF INVESTMENTS |
| 17 | | STATEMENT OF ASSETS AND LIABILITIES |
| 18 | | STATEMENT OF OPERATIONS |
| 19 | | STATEMENTS OF CHANGES IN NET ASSETS |
| 21 | | NOTES TO FINANCIAL STATEMENTS |
| 27 | | ADDITIONAL INFORMATION |
| 36 | | TRUSTEES AND OFFICERS |
This semiannual report must be preceded or accompanied by a prospectus of the Evergreen fund contained herein. The prospectus contains more complete information, including fees and expenses, and should be read carefully before investing or sending money.
The fund will file its complete schedule of portfolio holdings with the SEC for the first and third quarters of each fiscal year on Form N-Q. The fund’s Form N-Q will be available on the SEC’s Web site at http://www.sec.gov. In addition, the fund’s Form N-Q may be reviewed and copied at the SEC’s Public Reference Room in Washington, D.C. Information on the operation of the Public Reference Room may be obtained by calling 800.SEC.0330.
A description of the fund’s proxy voting policies and procedures, as well as information regarding how the fund voted proxies relating to portfolio securities during the most recent 12-month period ended June 30, is available by visiting our Web site at EvergreenInvestments.com or by visiting the SEC’s Web site at http://www.sec.gov. The fund’s proxy voting policies and procedures are also available without charge, upon request, by calling 800.343.2898.
| Mutual Funds: | | | | |
| NOT FDIC INSURED | MAY LOSE VALUE | NOT BANK GUARANTEED |
Evergreen InvestmentsSM is a service mark of Evergreen Investment Management Company, LLC.
Copyright 2008, Evergreen Investment Management Company, LLC.
Evergreen Investment Management Company, LLC is a subsidiary of Wachovia Corporation and is an affiliate of Wachovia Corporation’s other Broker Dealer subsidiaries.
Evergreen mutual funds are distributed by Evergreen Investment Services, Inc.
200 Berkeley Street, Boston, MA 02116
LETTER TO SHAREHOLDERS
March 2008

Dennis H. Ferro
President and Chief
Executive Officer
Dear Shareholder:
We are pleased to provide the Semiannual Report for Evergreen Equity Income Fund, covering the six-month period ended January 31, 2008.
Investors in the domestic equity market faced challenging and increasingly stormy conditions over the six-month period ended January 31, 2008. Problems in the housing and subprime mortgage markets led to a tightening of credit, which in turn contributed to widening fears of a dramatic deceleration in the economy’s expansion. As the economy weakened, equity prices generally declined across companies of all sizes. Large cap stocks held up somewhat better than mid cap and small cap shares, while growth stocks outperformed more economically sensitive value stocks. Fixed income investors, meanwhile, sought out the highest-quality securities and attempted to avoid credit risk. Longer-maturity Treasuries outperformed other sectors, while the prices of corporate bonds and many asset-backed securities fell as the yield spreads between Treasuries and lower-rated securities widened. In this environment, the price of gold surged while the dollar remained weak.
The U.S. economy exhibited increasing signs of weakness in the latter half of 2007 and the first month of 2008 after experiencing solid growth early in 2007. Although housing and credit-related concerns began weighing on investor sentiment early in the year, the economy’s growth trajectory continued to be supported early in 2007 by the combination of solid trends in employment, income, investment and export trends. That began to change in the latter months of 2007, however, as each of these pillars of support began to weaken. Growth in Gross Domestic Product
1
LETTER TO SHAREHOLDERS continued
rose by just 0.6% during the final quarter of 2007 as economic output slowed because of a sharp reduction in business inventories. The rate of corporate earnings growth, meanwhile, declined over the second half of 2007. Payrolls dropped by 17,000 in January 2008, contributing to growing concerns about the outlook for consumer spending, which accounts for up to 70% of economic output. Faced with growing evidence of the economy’s deceleration, the Federal Reserve Board (the “Fed”) began to focus more on stimulating growth and less on watching inflation. The Fed cut the target fed funds rate from 5.25% to 4.25% during the last four months of 2007 and then slashed the rate by an additional 1.25% in two separate actions within just eight days of each other in January 2008. Also in early 2008, Congress passed, and President Bush signed, a $168 billion fiscal stimulus bill that contained rebates for taxpayers, tax breaks for businesses and additional assistance for Social Security recipients and disabled veterans.
Over the six-month period ended January 31, 2008, the management teams of Evergreen’s value-oriented equity funds tended to emphasize investments in attractively priced, fundamentally sound corporations. The portfolio manager of both Evergreen Disciplined Value Fund and Evergreen Disciplined Small-Mid Value Fund, for example, used a combination of quantitative tools and traditional fundamental analysis in reviewing opportunities among larger and smaller companies, respectively. The manager of Evergreen Equity Index Fund maintained a portfolio reflecting the composition of the Standard & Poor’s 500® Index, using a proprietary process to control trading and operational costs. Managers of Evergreen Equity Income Fund emphasized companies they believe have the ability to maintain and increase their dividends to shareholders. The managers of Evergreen Fundamental Large Cap Fund focused on larger corporations with stable earnings growth records while the managers of Evergreen Fundamental Mid Cap Value Fund, which was launched on September 28, 2007, emphasized mid-sized companies selling at what the managers believed to be reasonable valuations. The team managing Evergreen Intrinsic Value Fund sought out investments in
2
LETTER TO SHAREHOLDERS continued
established companies selling at stock prices below the managers’ estimate of the company’s intrinsic value. Meanwhile, the managers of Evergreen Small Cap Value Fund and Evergreen Special Values Fund each focused on higher-quality small companies that the managers believed to have reasonable prices and strong balance sheets.
We believe the experiences in the investment markets during the past six months have underscored the value of a well-diversified, long-term investment strategy to help soften the effects of volatility in any one market or asset class. As always, we encourage investors to maintain diversified investment portfolios in pursuit of their long-term investment goals.
Please visit us at EvergreenInvestments.com for more information about our funds and other investment products available to you. Thank you for your continued support of Evergreen Investments.
Sincerely,

Dennis H. Ferro
President and Chief Executive Officer
Evergreen Investment Company, Inc.
Special Notice to Shareholders:
Please visit our Web site at EvergreenInvestments.com for statements from President and Chief Executive Officer, Dennis Ferro, regarding the firm’s recent settlement with the Securities and Exchange Commission (SEC) and prior settlement with the Financial Industry Regulatory Authority (FINRA).
3
FUND AT A GLANCE
as of January 31, 2008
MANAGEMENT TEAM
Investment Advisor:
• Evergreen Investment Management Company, LLC
Portfolio Managers:
• Walter T. McCormick, CFA
• Gary Mishuris, CFA
CURRENT INVESTMENT STYLE

Source: Morningstar, Inc.
Morningstar’s style box is based on a portfolio date as of 12/31/2007.
The Equity style box placement is based on 10 growth and valuation measures for each fund holding and the median size of the companies in which the fund invests.
PERFORMANCE AND RETURNS
Portfolio inception date: 8/31/1978
| | | Class A | | Class B | | Class C | | Class I | | Class R |
| Class inception date | | 1/3/1995 | | 1/3/1995 | | 1/3/1995 | | 8/31/1978 | | 10/10/2003 |
|
| Nasdaq symbol | | ETRAX | | ETRBX | | ETRCX | | EVTRX | | ETRRX |
|
| 6-month return with sales | | | | | | | | | | |
| charge | | -10.18% | | -9.45% | | -5.92% | | N/A | | N/A |
|
| 6-month return w/o sales charge | | -4.71% | | -5.08% | | -5.04% | | -4.58% | | -4.81% |
|
| Average annual return* | | | | | | | | | | |
|
| 1-year with sales charge | | -8.17% | | -7.72% | | -4.17% | | N/A | | N/A |
|
| 1-year w/o sales charge | | -2.57% | | -3.29% | | -3.28% | | -2.34% | | -2.83% |
|
| 5-year | | 10.44% | | 10.69% | | 10.97% | | 12.08% | | 11.58% |
|
| 10-year | | 5.18% | | 5.03% | | 5.03% | | 6.09% | | 5.85% |
|
| Maximum sales charge | | 5.75% | | 5.00% | | 1.00% | | N/A | | N/A |
| | | Front-end | | CDSC | | CDSC | | | | |
|
* Adjusted for maximum applicable sales charge, unless noted.
Past performance is no guarantee of future results. The performance quoted represents past performance and current performance may be lower or higher. The investment return and principal value of an investment will fluctuate so that investors’ shares, when redeemed, may be worth more or less than their original cost. To obtain performance information current to the most recent month-end for Classes A, B, C or I, please go to EvergreenInvestments.com/fundperformance. Please call 1.800.847.5397 for the most recent month-end performance information for Class R. The performance of each class may vary based on differences in loads, fees and expenses paid by the shareholders investing in each class. Performance includes the reinvestment of income dividends and capital gain distributions. Performance shown does not reflect the deduction of taxes that a shareholder would pay on fund distributions or the redemption of fund shares.
Historical performance shown for Class R prior to its inception is based on the performance of Class I, the original class offered. The historical returns for Class R have not been adjusted to reflect the effect of its 12b-1 fee. The fund incurs a 12b-1 fee of 0.30% for Class A, 0.50% for Class R and 1.00% for Classes B and C. Class I does not pay a 12b-1 fee. If these fees had been reflected, returns for Class R would have been lower.
The advisor is reimbursing a portion of the 12b-1 fee for Class A. Had the fee not been reimbursed, returns for Class A would have been lower. Returns reflect expense limits previously in effect for all classes, without which returns would have been lower.
4
FUND AT A GLANCE continued
LONG-TERM GROWTH
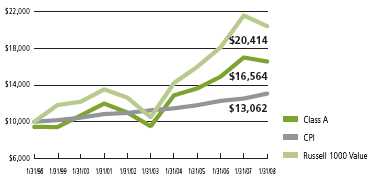
Comparison of a $10,000 investment in the Evergreen Equity Income Fund Class A shares versus a similar investment in the Russell 1000 Value Index (Russell 1000 Value) and the Consumer Price Index (CPI).
The Russell 1000 Value is an unmanaged market index and does not include transaction costs associated with buying and selling securities, any mutual fund fees or expenses or any taxes. The CPI is a commonly used measure of inflation and does not represent an investment return. It is not possible to invest directly in an index.
Class I shares are only offered in the following manner: (1) to investment advisory clients of Evergreen Investment Management Company, LLC (or its advisory affiliates) when purchased by such advisor(s) on behalf of its clients, (2) to certain mutual fund wrap program clients of Wachovia Securities and of third-party broker/dealers when purchased through a clearing relationship with Wachovia Securities or an affiliate providing mutual fund clearing services, (3) through arrangements entered into on behalf of the Evergreen funds with certain financial services firms, (4) to certain institutional investors, and (5) to persons who owned Class Y shares in registered name in an Evergreen fund on or before December 31, 1994 or who owned shares of any SouthTrust fund in registered name as of March 18, 2005 or who owned shares of Vestaur Securities Fund as of May 20, 2005.
Class I shares are only available to institutional shareholders with a minimum of $1 million investment, which may be waived in certain situations.
Class R shares generally are available only to 401(k) plans, 457 plans, employer-sponsored 403(b) plans, profit sharing and money purchase pension plans, defined benefit plans and non-qualified deferred compensation plans.
The fund’s investment objective may be changed without a vote of the fund’s shareholders.
Foreign investments may contain more risk due to the inherent risks associated with changing political climates, foreign market instability and foreign currency fluctuations.
The stocks of smaller companies may be more volatile than those of larger companies due to the higher risk of failure.
Value-based investments are subject to the risk that the broad market may not recognize their intrinsic value.
High yield, lower-rated bonds may contain more risk due to the increased possibility of default.
All data is as of January 31, 2008, and subject to change.
5
ABOUT YOUR FUND’S EXPENSES
The Example below is intended to describe the fees and expenses borne by shareholders and the impact of those costs on your investment.
Example
As a shareholder of the fund, you incur two types of costs: (1) transaction costs, including sales charges (loads), redemption fees and exchange fees; and (2) ongoing costs, including management fees, distribution (12b-1) fees and other fund expenses. This Example is intended to help you understand your ongoing costs (in dollars) of investing in the fund and to compare these costs with the ongoing costs of investing in other mutual funds. The Example is based on an investment of $1,000 invested at the beginning of the period and held for the entire period from August 1, 2007 to January 31, 2008.
The example illustrates your fund’s costs in two ways:
• Actual expenses
The section in the table under the heading “Actual” provides information about actual account values and actual expenses. You may use the information in these columns, together with the amount you invested, to estimate the expenses that you paid over the period. Simply divide your account value by $1,000 (for example, an $8,600 account value divided by $1,000 = 8.6), then multiply the result by the number in the appropriate column for your share class, in the column entitled “Expenses Paid During Period” to estimate the expenses you paid on your account during this period.
• Hypothetical example for comparison purposes
The section in the table under the heading “Hypothetical (5% return before expenses)” provides information about hypothetical account values and hypothetical expenses based on the fund’s actual expense ratio and an assumed rate of return of 5% per year before expenses, which is not the fund’s actual return. The hypothetical account values and expenses may not be used to estimate the actual ending account balance or expenses you paid for the period. You may use this information to compare the ongoing costs of investing in the fund and other funds. To do so, compare this 5% hypothetical example with the 5% hypothetical examples that appear in the shareholder reports of the other funds.
Please note that the expenses shown in the table are meant to highlight your ongoing costs only and do not reflect any transactional costs, such as sales charges (loads), redemption fees or exchange fees. Therefore, the section in the table under the heading “Hypothetical (5% return before expenses)” is useful in comparing ongoing costs only, and will not help you determine the relative total costs of owning different funds. In addition, if these transactional costs were included, your costs would have been higher.
| | | Beginning | | | | Ending | | | | |
| | | Account | | | | Account | | Expenses |
| | | Value | | | | Value | | Paid During |
| | | 8/1/2007 | | 1/31/2008 | | Period* |
|
| Actual | | | | | | | | | | |
| Class A | | $ 1,000.00 | | $ 952.86 | | $ 5.60 |
| Class B | | $ 1,000.00 | | $ 949.17 | | $ 9.16 |
| Class C | | $ 1,000.00 | | $ 949.57 | | $ 9.16 |
| Class I | | $ 1,000.00 | | $ 954.17 | | $ 4.32 |
| Class R | | $ 1,000.00 | | $ 951.87 | | $ 6.77 |
| Hypothetical | | | | | | | | | | |
| (5% return | | | | | | | | | | |
| before expenses) | | | | | | | | �� | | |
| Class A | | $ 1,000.00 | | $ 1,019.41 | | $ 5.79 |
| Class B | | $ 1,000.00 | | $ 1,015.74 | | $ 9.48 |
| Class C | | $ 1,000.00 | | $ 1,015.74 | | $ 9.48 |
| Class I | | $ 1,000.00 | | $ 1,020.71 | | $ 4.47 |
| Class R | | $ 1,000.00 | | $ 1,018.20 | | $ 7.00 |
|
* For each class of the Fund, expenses are equal to the annualized expense ratio of each class (1.14% for Class A, 1.87% for Class B, 1.87% for Class C, 0.88% for Class I and 1.38% for Class R), multiplied by the average account value over the period, multiplied by 184 / 366 days.
6
FINANCIAL HIGHLIGHTS
(For a share outstanding throughout each period)
| | | Six Months Ended | | Year Ended July 31, |
| | | January 31, 2008 | |
|
| CLASS A | | (unaudited) | | 2007 | | 2006 | | 2005 | | 2004 | | 2003 |
|
| Net asset value, beginning of period | | $ 23.98 | | $ 24.16 | | $ 24.08 | | $ 21.43 | | $ 19.57 | | $ 17.81 |
|
| Income from investment operations | | | | | | | | | | | | | | | | |
| Net investment income (loss) | | | | 0.13 | | 0.36 | | 0.44 | | | | 0.35 | | 0.36 | | 0.46 |
Net realized and unrealized gains
or losses on investments | | | | (1.17) | | 2.70 | | 1.01 | | | | 3.40 | | 1.89 | | 1.70 |
| |
|
| Total from investment operations | | | | (1.04) | | 3.06 | | 1.45 | | | | 3.75 | | 2.25 | | 2.16 |
|
| Distributions to shareholders from | | | | | | | | | | | | | | | | |
| Net investment income | | | | (0.13) | | (0.49) | | (0.30) | | | | (0.33) | | (0.39) | | (0.40) |
| Net realized gains | | | | (1.85) | | (2.75) | | (1.07) | | | | (0.77) | | 0 | | 0 |
| |
|
| Total distributions to shareholders | | | | (1.98) | | (3.24) | | (1.37) | | | | (1.10) | | (0.39) | | (0.40) |
|
| Net asset value, end of period | | $ 20.96 | | $ 23.98 | | $ 24.16 | | $ 24.08 | | $ 21.43 | | $ 19.57 |
|
| Total return1 | | | | (4.71%) | | 13.55% | | 6.40% | | | | 17.85% | | 11.48% | | 12.39% |
|
| Ratios and supplemental data | | | | | | | | | | | | | | | | |
| Net assets, end of period (thousands) | | $349,639 | | $404,494 | | $420,757 | | $494,637 | | $485,701 | | $378,882 |
| Ratios to average net assets | | | | | | | | | | | | | | | | |
| Expenses including waivers/ | | | | | | | | | | | | | | | | |
| reimbursements but excluding expense reductions | | | | 1.14%2 | | 1.18% | | 1.21% | | | | 1.19% | | 1.34% | | 1.40% |
| Expenses excluding waivers/ | | | | | | | | | | | | | | | | |
| reimbursements and expense reductions | | | | 1.18%2 | | 1.19% | | 1.21% | | | | 1.23% | | 1.36% | | 1.41% |
| Net investment income (loss) | | | | 1.15%2 | | 1.49% | | 1.80% | | | | 1.56% | | 1.62% | | 2.03% |
| Portfolio turnover rate | | | | 16% | | 57% | | 96% | | | | 114% | | 137% | | 112% |
|
1 Excluding applicable sales charges
2 Annualized
See Notes to Financial Statements
7
FINANCIAL HIGHLIGHTS
(For a share outstanding throughout each period)
| | | Six Months Ended | | Year Ended July 31, |
| | | January 31, 2008 | |
|
| CLASS B | | (unaudited) | | 2007 | | 2006 | | 2005 | | 2004 | | 2003 |
|
| Net asset value, beginning of period | | $ 23.77 | | $ 23.96 | | $ 23.88 | | $ 21.26 | | $ 19.40 | | $ 17.66 |
|
| Income from investment operations | | | | | | | | | | | | | | | | |
| Net investment income (loss) | | | | 0.03 | | 0.191 | | 0.251 | | | | 0.201 | | 0.201 | | 0.31 |
Net realized and unrealized gains
or losses on investments | | | | (1.16) | | 2.69 | | 1.02 | | | | 3.35 | | 1.88 | | 1.70 |
| |
|
| Total from investment operations | | | | (1.13) | | 2.88 | | 1.27 | | | | 3.55 | | 2.08 | | 2.01 |
|
| Distributions to shareholders from | | | | | | | | | | | | | | | | |
| Net investment income | | | | (0.04) | | (0.32) | | (0.12) | | | | (0.16) | | (0.22) | | (0.27) |
| Net realized gains | | | | (1.85) | | (2.75) | | (1.07) | | | | (0.77) | | 0 | | 0 |
| |
|
| Total distributions to shareholders | | | | (1.89) | | (3.07) | | (1.19) | | | | (0.93) | | (0.22) | | (0.27) |
|
| Net asset value, end of period | | $ 20.75 | | $ 23.77 | | $ 23.96 | | $ 23.88 | | $ 21.26 | | $ 19.40 |
|
| Total return2 | | | | (5.08%) | | 12.76% | | 5.66% | | | | 16.97% | | 10.71% | | 11.57% |
|
| Ratios and supplemental data | | | | | | | | | | | | | | | | |
| Net assets, end of period (thousands) | | $38,611 | | $48,897 | | $60,111 | | $85,366 | | $121,797 | | $158,010 |
| Ratios to average net assets | | | | | | | | | | | | | | | | |
| Expenses including waivers/ | | | | | | | | | | | | | | | | |
| reimbursements but excluding expense reductions | | | | 1.87%3 | | 1.89% | | 1.91% | | | | 1.89% | | 2.05% | | 2.11% |
| Expenses excluding waivers/ | | | | | | | | | | | | | | | | |
| reimbursements and expense reductions | | | | 1.87%3 | | 1.89% | | 1.91% | | | | 1.93% | | 2.07% | | 2.11% |
| Net investment income (loss) | | | | 0.42%3 | | 0.78% | | 1.05% | | | | 0.89% | | 0.92% | | 1.60% |
| Portfolio turnover rate | | | | 16% | | 57% | | 96% | | | | 114% | | 137% | | 112% |
|
1 Net investment income (loss) per share is based on average shares outstanding during the period.
2 Excluding applicable sales charges
3 Annualized
See Notes to Financial Statements
8
FINANCIAL HIGHLIGHTS
(For a share outstanding throughout each period)
| | | Six Months Ended | | Year Ended July 31, |
| | | January 31, 2008 | |
|
| CLASS C | | (unaudited) | | 2007 | | 2006 | | 2005 | | 2004 | | 2003 |
|
| Net asset value, beginning of period | | $ 23.72 | | $ 23.92 | | $ 23.85 | | $ 21.23 | | $ 19.39 | | $ 17.65 |
|
| Income from investment operations | | | | | | | | | | | | | | | | |
| Net investment income (loss) | | | | 0.04 | | 0.191 | | 0.251 | | | | 0.201 | | 0.201 | | 0.30 |
Net realized and unrealized gains
or losses on investments | | | | (1.16) | | 2.68 | | 1.02 | | | | 3.35 | | 1.87 | | 1.71 |
| |
|
| Total from investment operations | | | | (1.12) | | 2.87 | | 1.27 | | | | 3.55 | | 2.07 | | 2.01 |
|
| Distributions to shareholders from | | | | | | | | | | | | | | | | |
| Net investment income | | | | (0.04) | | (0.32) | | (0.13) | | | | (0.16) | | (0.23) | | (0.27) |
| Net realized gains | | | | (1.85) | | (2.75) | | (1.07) | | | | (0.77) | | 0 | | 0 |
| |
|
| Total distributions to shareholders | | | | (1.89) | | (3.07) | | (1.20) | | | | (0.93) | | (0.23) | | (0.27) |
|
| Net asset value, end of period | | $ 20.71 | | $ 23.72 | | $ 23.92 | | $ 23.85 | | $ 21.23 | | $ 19.39 |
|
| Total return2 | | | | (5.04%) | | 12.74% | | 5.64% | | | | 17.02% | | 10.70% | | 11.58% |
|
| Ratios and supplemental data | | | | | | | | | | | | | | | | |
| Net assets, end of period (thousands) | | $21,986 | | $27,901 | | $28,739 | | $37,607 | | $42,447 | | $25,780 |
| Ratios to average net assets | | | | | | | | | | | | | | | | |
| Expenses including waivers/ | | | | | | | | | | | | | | | | |
| reimbursements but excluding expense reductions | | | | 1.87%3 | | 1.89% | | 1.91% | | | | 1.89% | | 2.04% | | 2.11% |
| Expenses excluding waivers/ | | | | | | | | | | | | | | | | |
| reimbursements and expense reductions | | | | 1.87%3 | | 1.89% | | 1.91% | | | | 1.93% | | 2.06% | | 2.11% |
| Net investment income (loss) | | | | 0.42%3 | | 0.78% | | 1.08% | | | | 0.87% | | 0.92% | | 1.62% |
| Portfolio turnover rate | | | | 16% | | 57% | | 96% | | | | 114% | | 137% | | 112% |
|
1 Net investment income (loss) per share is based on average shares outstanding during the period.
2 Excluding applicable sales charges
3 Annualized
See Notes to Financial Statements
9
FINANCIAL HIGHLIGHTS
(For a share outstanding throughout each period)
| | | Six Months Ended | | Year Ended July 31, |
| | | January 31, 2008 | |
|
| CLASS I | | (unaudited) | | 2007 | | 2006 | | 2005 | | 2004 | | 2003 |
|
| Net asset value, beginning of period | | $23.98 | | $24.16 | | $24.08 | | $21.43 | | $19.57 | | $17.81 |
|
| Income from investment operations | | | | | | | | | | | | |
| Net investment income (loss) | | 0.16 | | 0.42 | | 0.51 | | 0.43 | | 0.42 | | 0.47 |
| Net realized and unrealized gains or losses on investments | | (1.18) | | 2.72 | | 1.01 | | 3.39 | | 1.89 | | 1.73 |
| |
|
| Total from investment operations | | (1.02) | | 3.14 | | 1.52 | | 3.82 | | 2.31 | | 2.20 |
|
| Distributions to shareholders from | | | | | | | | | | | | |
| Net investment income | | (0.16) | | (0.57) | | (0.37) | | (0.40) | | (0.45) | | (0.44) |
| Net realized gains | | (1.85) | | (2.75) | | (1.07) | | (0.77) | | 0 | | 0 |
| |
|
| Total distributions to shareholders | | (2.01) | | (3.32) | | (1.44) | | (1.17) | | (0.45) | | (0.44) |
|
| Net asset value, end of period | | $20.95 | | $23.98 | | $24.16 | | $24.08 | | $21.43 | | $19.57 |
|
| Total return | | (4.58%) | | 13.84% | | 6.72% | | 18.19% | | 11.81% | | 12.69% |
|
| Ratios and supplemental data | | | | | | | | | | | | |
| Net assets, end of period (millions) | | $ 578 | | $ 642 | | $ 616 | | $ 640 | | $ 631 | | $ 575 |
| Ratios to average net assets | | | | | | | | | | | | |
| Expenses including waivers/ | | | | | | | | | | | | |
| reimbursements but excluding expense reductions | | 0.88%1 | | 0.89% | | 0.92% | | 0.89% | | 1.05% | | 1.11% |
| Expenses excluding waivers/ | | | | | | | | | | | | |
| reimbursements and expense reductions | | 0.88%1 | | 0.89% | | 0.92% | | 0.93% | | 1.07% | | 1.11% |
| Net investment income (loss) | | 1.41%1 | | 1.78% | | 2.12% | | 1.87% | | 1.92% | | 2.65% |
| Portfolio turnover rate | | 16% | | 57% | | 96% | | 114% | | 137% | | 112% |
|
1 Annualized
See Notes to Financial Statements
10
FINANCIAL HIGHLIGHTS
(For a share outstanding throughout each period)
| | | Six Months Ended | | Year Ended July 31, |
| | | January 31, 2008 | |
|
| CLASS R | | (unaudited) | | 2007 | | 2006 | | 2005 | | 20041 |
|
| Net asset value, beginning of period | | $24.02 | | $24.19 | | $24.10 | | $21.42 | | $20.33 |
|
| Income from investment operations | | | | | | | | | | |
| Net investment income (loss) | | 0.11 | | 0.30 | | 0.34 | | 0.24 | | 0.25 |
| Net realized and unrealized gains or losses on investments | | (1.19) | | 2.73 | | 1.06 | | 3.44 | | 1.08 |
| |
|
| Total from investment operations | | (1.08) | | 3.03 | | 1.40 | | 3.68 | | 1.33 |
|
| Distributions to shareholders from | | | | | | | | | | |
| Net investment income | | (0.10) | | (0.45) | | (0.24) | | (0.23) | | (0.24) |
| Net realized gains | | (1.85) | | (2.75) | | (1.07) | | (0.77) | | 0 |
| |
|
| Total distributions to shareholders | | (1.95) | | (3.20) | | (1.31) | | (1.00) | | (0.24) |
|
| Net asset value, end of period | | $20.99 | | $24.02 | | $24.19 | | $24.10 | | $21.42 |
|
| Total return | | (4.81%) | | 13.30% | | 6.19% | | 17.46% | | 6.50% |
|
| Ratios and supplemental data | | | | | | | | | | |
| Net assets, end of period (thousands) | | $ 106 | | $ 103 | | $ 85 | | $ 88 | | $ 1 |
| Ratios to average net assets | | | | | | | | | | |
| Expenses including waivers/ | | | | | | | | | | |
| reimbursements but excluding expense reductions | | 1.38%2 | | 1.39% | | 1.42% | | 1.47% | | 1.47%2 |
| Expenses excluding waivers/ | | | | | | | | | | |
| reimbursements and expense reductions | | 1.38%2 | | 1.39% | | 1.42% | | 1.51% | | 1.49%2 |
| Net investment income (loss) | | 0.90%2 | | 1.27% | | 1.45% | | 0.88% | | 1.41%2 |
| Portfolio turnover rate | | 16% | | 57% | | 96% | | 114% | | 137% |
|
1 For the period from October 10, 2003 (commencement of class operations), to July 31, 2004.
2 Annualized
See Notes to Financial Statements
11
SCHEDULE OF INVESTMENTS
January 31, 2008 (unaudited)
| | | | | | | Shares | | | | Value |
|
| COMMON STOCKS 96.0% | | | | | | | | |
| CONSUMER DISCRETIONARY 10.0% | | | | | | |
| Hotels, Restaurants & Leisure 2.3% | | | | | | |
| Carnival Corp. | | | | | | 502,000 | | $ | | 22,333,980 |
| |
|
| Media 3.3% | | | | | | | | | | |
| Omnicom Group, Inc. | | | | 721,966 | | | | 32,755,598 |
| |
|
| Multi-line Retail 1.3% | | | | | | | | |
| Target Corp. (p) | | | | | | 232,392 | | | | 12,916,347 |
| |
|
| Specialty Retail 1.2% | | | | | | | | |
| Home Depot, Inc. | | | | | | 399,600 | | | | 12,255,732 |
| |
|
| Textiles, Apparel & Luxury Goods 1.9% | | | | | | |
| Timberland Co., Class A * | | | | 1,134,000 | | | | 18,608,940 |
| |
|
| CONSUMER STAPLES 13.2% | | | | | | | | |
| Beverages 3.3% | | | | | | | | | | |
| Coca-Cola Co. | | | | | | 160,096 | | | | 9,472,881 |
| Diageo plc | | | | | | 1,114,386 | | | | 22,417,669 |
| |
|
| | | | | | | | | | | 31,890,550 |
| |
|
| Food & Staples Retailing 2.1% | | | | | | |
| Whole Foods Market, Inc. (p) | | | | 531,800 | | | | 20,974,192 |
| |
|
| Food Products 2.5% | | | | | | | | |
| Kraft Foods, Inc., Class A | | | | 476,122 | | | | 13,931,330 |
| McCormick & Co., Inc. | | | | 323,900 | | | | 10,921,908 |
| |
|
| | | | | | | | | | | 24,853,238 |
| |
|
| Household Products 3.5% | | | | | | | | |
| Clorox Co. | | | | | | 190,900 | | | | 11,705,988 |
| Procter & Gamble Co. | | | | 349,621 | | | | 23,057,505 |
| |
|
| | | | | | | | | | | 34,763,493 |
| |
|
| Tobacco 1.8% | | | | | | | | | | |
| Altria Group, Inc. | | | | | | 232,683 | | | | 17,642,025 |
| |
|
| ENERGY 11.8% | | | | | | | | | | |
| Oil, Gas & Consumable Fuels 11.8% | | | | | | |
| Chevron Corp. | | | | | | 220,100 | | | | 18,598,450 |
| ConocoPhillips | | | | | | 480,526 | | | | 38,595,848 |
| Exxon Mobil Corp. | | | | | | 484,429 | | | | 41,854,666 |
| Occidental Petroleum Corp. | | | | 265,430 | | | | 18,014,734 |
| |
|
| | | | | | | | | | | 117,063,698 |
| |
|
| FINANCIALS 22.9% | | | | | | | | |
| Capital Markets 3.1% | | | | | | | | |
| Legg Mason, Inc. (p) | | | | | | 423,800 | | | | 30,513,600 |
| |
|
| Commercial Banks 1.2% | | | | | | | | |
| Wells Fargo & Co. | | | | | | 333,504 | | | | 11,342,471 |
| |
|
See Notes to Financial Statements
12
SCHEDULE OF INVESTMENTS continued
January 31, 2008 (unaudited)
| | | | | | | Shares | | | | Value |
|
| |
| COMMON STOCKS continued | | | | | | | | |
| FINANCIALS continued | | | | | | | | |
| Diversified Financial Services 10.0% | | | | | | |
| Apollo Global Management, LLC, Class A + | | 451,410 | | $ | | 7,619,801 |
| Bank of America Corp. (p) | | | | | | 873,185 | | | | 38,725,755 |
| Citigroup, Inc. | | | | | | 992,935 | | | | 28,020,626 |
| JPMorgan Chase & Co. | | | | | | 523,010 | | | | 24,869,125 |
| |
|
| | | | | | | | | | | 99,235,307 |
| |
|
| Insurance 6.4% | | | | | | | | | | |
| American International Group, Inc. | | | | 326,202 | | | | 17,993,302 |
| Genworth Financial, Inc., Class A | | | | 165,173 | | | | 4,020,311 |
| Marsh & McLennan Cos. | | | | | | 903,363 | | | | 24,932,819 |
| Prudential Financial, Inc. | | | | | | 110,000 | | | | 9,280,700 |
| Stewart Information Services Corp. (p) | | | | 217,300 | | | | 7,438,179 |
| |
|
| | | | | | | | | | | 63,665,311 |
| |
|
| Thrifts & Mortgage Finance 2.2% | | | | | | | | |
| Fannie Mae (p) | | | | | | 330,000 | | | | 11,173,800 |
| Freddie Mac | | | | | | 362,131 | | | | 11,005,161 |
| |
|
| | | | | | | | | | | 22,178,961 |
| |
|
| HEALTH CARE 14.0% | | | | | | | | | | |
| Biotechnology 2.0% | | | | | | | | | | |
| Amgen, Inc. * | | | | | | 429,800 | | | | 20,024,382 |
| |
|
| Health Care Equipment & Supplies 3.6% | | | | | | |
| Baxter International, Inc. | | | | | | 171,462 | | | | 10,414,602 |
| Boston Scientific Corp. * | | | | | | 781,300 | | | | 9,477,169 |
| Medtronic, Inc. | | | | | | 327,594 | | | | 15,256,052 |
| |
|
| | | | | | | | | | | 35,147,823 |
| |
|
| Health Care Providers & Services 2.3% | | | | | | |
| WellPoint, Inc. * (p) | | | | | | 292,195 | | | | 22,849,649 |
| |
|
| Pharmaceuticals 6.1% | | | | | | | | |
| Bristol-Myers Squibb Co. | | | | | | 395,526 | | | | 9,172,248 |
| Merck & Co., Inc. | | | | | | 174,658 | | | | 8,083,172 |
| Novartis AG, ADR | | | | | | 427,800 | | | | 21,650,958 |
| Pfizer, Inc. | | | | | | 914,430 | | | | 21,388,518 |
| |
|
| | | | | | | | | | | 60,294,896 |
| |
|
| INDUSTRIALS 9.6% | | | | | | | | | | |
| Aerospace & Defense 1.3% | | | | | | | | |
| Lockheed Martin Corp. | | | | | | 115,950 | | | | 12,513,324 |
| |
|
| Air Freight & Logistics 1.3% | | | | | | | | |
| Expeditors International of Washington, Inc. (p) | | 265,000 | | | | 12,531,850 |
| |
|
| Commercial Services & Supplies 2.6% | | | | | | |
| Avery Dennison Corp. | | | | | | 201,800 | | | | 10,457,276 |
| Cintas Corp. | | | | | | 481,800 | | | | 15,812,676 |
| |
|
| | | | | | | | | | | 26,269,952 |
| |
|
See Notes to Financial Statements
13
SCHEDULE OF INVESTMENTS continued
January 31, 2008 (unaudited)
| | | | | Shares | | | | Value |
|
| COMMON STOCKS continued | | | | | | |
| INDUSTRIALS continued | | | | | | | | |
| Industrial Conglomerates 4.4% | | | | | | |
| General Electric Co. | | | | 1,227,169 | | $ | | 43,454,054 |
| |
|
| INFORMATION TECHNOLOGY 8.4% | | | | | | |
| Communications Equipment 2.3% | | | | | | |
| QUALCOMM, Inc. | | | | 530,200 | | | | 22,491,084 |
| |
|
| Computers & Peripherals 0.7% | | | | | | |
| Dell, Inc. * | | | | 350,000 | | | | 7,014,000 |
| |
|
| IT Services 0.7% | | | | | | | | |
| Affiliated Computer Services, Inc., Class A * | | 148,879 | | | | 7,257,851 |
| |
|
| Semiconductors & Semiconductor Equipment 2.3% | | | | | | |
| Intel Corp. | | | | 548,200 | | | | 11,621,840 |
| Texas Instruments, Inc. | | | | 367,300 | | | | 11,360,589 |
| |
|
| | | | | | | | | 22,982,429 |
| |
|
| Software 2.4% | | | | | | | | |
| Microsoft Corp. | | | | 712,453 | | | | 23,225,968 |
| |
|
| TELECOMMUNICATION SERVICES 1.6% | | | | | | |
| Wireless Telecommunication Services 1.6% | | | | | | |
| Sprint Nextel Corp. (p) | | | | 1,527,128 | | | | 16,080,658 |
| |
|
| UTILITIES 4.5% | | | | | | | | |
| Electric Utilities 3.9% | | | | | | | | |
| Entergy Corp. | | | | 107,360 | | | | 11,614,205 |
| Exelon Corp. | | | | 186,500 | | | | 14,209,435 |
| Fortum Oyj | | | | 319,800 | | | | 12,918,346 |
| |
|
| | | | | | | | | 38,741,986 |
| |
|
| Multi-Utilities 0.6% | | | | | | | | |
| Energy East Corp. | | | | 233,729 | | | | 5,901,657 |
| |
|
| Total Common Stocks (cost $904,110,768) | | | | | | 949,775,006 |
| | |
|
|
| | | | | Principal | | | | |
| | | | | Amount | | | | Value |
|
| |
| SHORT-TERM INVESTMENTS 12.5% | | | | | | |
| CORPORATE BONDS 2.4% | | | | | | | | |
| Capital Markets 0.3% | | | | | | | | |
| Carrera Capital Finance, LLC, FRN, SIV, 3.36%, 05/27/2008 + (pp) | | $ 3,000,000 | | | | 2,987,049 |
| |
|
| Commercial Banks 0.5% | | | | | | | | |
| BNP Paribas SA, 3.10%, 02/22/2008 (pp) | | 5,000,000 | | | | 4,999,795 |
| |
|
See Notes to Financial Statements
14
SCHEDULE OF INVESTMENTS continued
January 31, 2008 (unaudited)
| | | | | Principal | | | | |
| | | | | Amount | | | | Value |
|
| |
| SHORT-TERM INVESTMENTS continued | | | | | | | | |
| CORPORATE BONDS continued | | | | | | | | |
| Diversified Financial Services 1.6% | | | | | | | | |
| Bank of America Corp., FRN, 3.18%, 02/08/2008 (pp) | | $ | | 4,000,000 | | $ | | 4,000,036 |
| Citigroup Global Markets, Inc., FRN, 3.25%, 02/01/2008 (pp) | | | | 3,000,000 | | | | 3,000,000 |
| Natixis Corp., FRN, 3.18%, 02/11/2008 (pp) | | | | 1,000,000 | | | | 999,986 |
| Premier Asset Collateralized Entity, LLC, FRN, SIV, 4.22%, 05/15/2008 + (pp) | | | | 3,000,000 | | | | 2,991,600 |
| Sigma Finance, Inc., FRN, SIV, 3.10%, 06/16/2008 + (pp) | | | | 5,000,000 | | | | 4,962,550 |
| |
|
| | | | | | | | | 15,954,172 |
| |
|
| REPURCHASE AGREEMENTS ^ 6.1% | | | | | | | | |
| ABN Amro, Inc., 3.21%, dated 01/31/2008, maturing 02/01/2008, maturity | | | | | | | | |
| value $1,000,089 (pp) | | | | 1,000,000 | | | | 1,000,000 |
| Banc of America Securities, LLC, 3.20%, dated 01/31/2008, maturing 02/01/2008, | | | | | | | | |
| maturity value $3,000,267 (pp) | | | | 3,000,000 | | | | 3,000,000 |
| Bear Stearns & Co., Inc., 3.23%, dated 01/31/2008, maturing 02/01/2008, | | | | | | | | |
| maturity value $2,000,179 (pp) | | | | 2,000,000 | | | | 2,000,000 |
| BNP Paribas Securities, Inc., 3.21%, dated 01/31/2008, maturing 02/01/2008, | | | | | | | | |
| maturity value $5,000,446 (pp) | | | | 5,000,000 | | | | 5,000,000 |
| Cantor Fitzgerald & Co., 3.30%, dated 01/31/2008, maturing 02/01/2008, | | | | | | | | |
| maturity value $4,000,367 (pp) | | | | 4,000,000 | | | | 4,000,000 |
| Credit Suisse First Boston, LLC, 3.21%, dated 01/31/2008, maturing 02/01/2008, | | | | | | | | |
| maturity value $13,001,159 (pp) | | | | 13,000,000 | | | | 13,000,000 |
| Deutsche Bank Securities, Inc., 3.21%, dated 01/31/2008, maturing 02/01/2008, | | | | | | | | |
| maturity value $3,000,268 (pp) | | | | 3,000,000 | | | | 3,000,000 |
| Dresdner Kleinwort Wasserstein Securities, LLC, 3.21%, dated 01/31/2008, | | | | | | | | |
| maturing 02/01/2008, maturity value $12,001,070 (pp) | | | | 12,000,000 | | | | 12,000,000 |
| Greenwich Capital Markets, Inc., 3.21%, dated 01/31/2008, maturing | | | | | | | | |
| 02/01/2008, maturity value $1,000,089 (pp) | | | | 1,000,000 | | | | 1,000,000 |
| JP Morgan Securities, Inc., 3.20%, dated 01/31/2008, maturing 02/01/2008, | | | | | | | | |
| maturity value $6,000,533 (pp) | | | | 6,000,000 | | | | 6,000,000 |
| Lehman Brothers, Inc., 3.20%, dated 01/31/2008, maturing 02/01/2008, maturity | | | | | | | | |
| value $5,000,444 (pp) | | | | 5,000,000 | | | | 5,000,000 |
| Merrill Lynch Pierce Fenner & Smith, Inc., 3.20%, dated 01/31/2008, maturing | | | | | | | | |
| 02/01/2008, maturity value $5,000,444 (pp) | | | | 5,000,000 | | | | 5,000,000 |
| |
|
| | | | | | | | | 60,000,000 |
| | |
|
|
| | | | | Shares | | | | Value |
|
| |
| MUTUAL FUND SHARES 4.0% | | | | | | | | |
| AIM Short-Term Investments Trust Government & Agency Portfolio, Class I, | | | | | | | | |
| 3.72% q (pp) | | | | 307,593 | | | | 307,593 |
| Evergreen Institutional U.S. Government Money Market Fund, Class I, 3.46% q ø | | | | 39,034,955 | | | | 39,034,955 |
| |
|
| | | | | | | | | 39,342,548 |
| |
|
| Total Short-Term Investments (cost $123,342,518) | | | | | | | | 123,283,564 |
| |
|
| Total Investments (cost $1,027,453,286) 108.5% | | | | | | | | 1,073,058,570 |
| Other Assets and Liabilities (8.5%) | | | | | | | | (84,379,303) |
| |
|
| Net Assets 100.0% | | | | | | $ | | 988,679,267 |
| |
|
See Notes to Financial Statements
15
SCHEDULE OF INVESTMENTS continued
January 31, 2008 (unaudited)
| + | | Security is deemed illiquid and is valued using market quotations when readily available, unless otherwise noted. |
| * | | Non-income producing security |
| (p) | | All or a portion of this security is on loan. |
| ^ | | Collateral is pooled with the collateral of other Evergreen funds and allocated on a pro-rata basis into 172 issues of |
| | | high grade short-term securities such that sufficient collateral is applied to the respective repurchase agreement. |
| q | | Rate shown is the 7-day annualized yield at period end. |
| ø | | Evergreen Investment Management Company, LLC is the investment advisor to both the Fund and the money market |
| | | fund. |
| (pp) | | All or a portion of this security represents investment of cash collateral received from securities on loan. |
Summary of Abbreviations
| ADR | | American Depository Receipt |
| FRN | | Floating Rate Note |
| SIV | | Structured Investment Vehicle |
The following table shows the percent of total long-term investments by sector as of January 31, 2008:
| Financials | | 23.9% |
| Health Care | | 14.6% |
| Consumer Staples | | 13.7% |
| Energy | | 12.3% |
| Consumer Discretionary | | 10.4% |
| Industrials | | 10.0% |
| Information Technology | | 8.7% |
| Utilities | | 4.7% |
| Telecommunication Services | | 1.7% |
| |
|
| | | 100.0% |
| | |
|
See Notes to Financial Statements
16
STATEMENT OF ASSETS AND LIABILITIES
January 31, 2008 (unaudited)
| Assets | | | | |
| Investments in securities, at value (cost $988,418,331) including $84,450,890 of securities | | | | |
| loaned | | $ | | 1,034,023,615 |
| Investments in affiliated money market fund, at value (cost $39,034,955) | | | | 39,034,955 |
|
| Total investments | | | | 1,073,058,570 |
| Foreign currency, at value (cost $77,017) | | | | 74,783 |
| Receivable for Fund shares sold | | | | 43,761 |
| Dividends receivable | | | | 1,136,515 |
| Receivable for securities lending income | | | | 17,695 |
| Prepaid expenses and other assets | | | | 66,933 |
|
| Total assets | | | | 1,074,398,257 |
|
| Liabilities | | | | |
| Payable for Fund shares redeemed | | | | 1,112,243 |
| Payable for securities on loan | | | | 84,307,563 |
| Advisory fee payable | | | | 5,977 |
| Due to other related parties | | | | 17,629 |
| Accrued expenses and other liabilities | | | | 275,578 |
|
| Total liabilities | | | | 85,718,990 |
|
| Net assets | | $ | | 988,679,267 |
|
| Net assets represented by | | | | |
| Paid-in capital | | $ | | 897,386,553 |
| Undistributed net investment income | | | | 593,244 |
| Accumulated net realized gains on investments | | | | 45,096,241 |
| Net unrealized gains on investments | | | | 45,603,229 |
|
| Total net assets | | $ | | 988,679,267 |
|
| Net assets consists of | | | | |
| Class A | | $ | | 349,639,409 |
| Class B | | | | 38,610,808 |
| Class C | | | | 21,985,532 |
| Class I | | | | 578,337,226 |
| Class R | | | | 106,292 |
|
| Total net assets | | $ | | 988,679,267 |
|
| Shares outstanding (unlimited number of shares authorized) | | | | |
| Class A | | | | 16,683,943 |
| Class B | | | | 1,860,589 |
| Class C | | | | 1,061,800 |
| Class I | | | | 27,600,589 |
| Class R | | | | 5,064 |
|
| Net asset value per share | | | | |
| Class A | | $ | | 20.96 |
| Class A — Offering price (based on sales charge of 5.75%) | | $ | | 22.24 |
| Class B | | $ | | 20.75 |
| Class C | | $ | | 20.71 |
| Class I | | $ | | 20.95 |
| Class R | | $ | | 20.99 |
|
See Notes to Financial Statements
17
STATEMENT OF OPERATIONS
Six Months Ended January 31, 2008 (unaudited)
| Investment income | | | | |
| Dividends | | $ | | 12,079,468 |
| Income from affiliate | | | | 324,717 |
| Securities lending | | | | 130,060 |
| Interest | | | | 3,089 |
|
| Total investment income | | | | 12,537,334 |
|
| Expenses | | | | |
| Advisory fee | | | | 3,309,409 |
| Distribution Plan expenses | | | | |
| Class A | | | | 586,880 |
| Class B | | | | 227,028 |
| Class C | | | | 128,947 |
| Class R | | | | 271 |
| Administrative services fee | | | | 546,757 |
| Transfer agent fees | | | | 663,529 |
| Trustees’ fees and expenses | | | | 10,120 |
| Printing and postage expenses | | | | 60,578 |
| Custodian and accounting fees | | | | 145,722 |
| Registration and filing fees | | | | 33,079 |
| Professional fees | | | | 27,217 |
| Other | | | | 6,495 |
|
| Total expenses | | | | 5,746,032 |
| Less: Expense reductions | | | | (10,502) |
| Expense reimbursements | | | | (74,377) |
|
| Net expenses | | | | 5,661,153 |
|
| Net investment income | | | | 6,876,181 |
|
| Net realized and unrealized gains or losses on investments | | | | |
| Net realized gains on: | | | | |
| Securities | | | | 68,909,853 |
| Foreign currency related transactions | | | | 58,183 |
|
| Net realized gains on investments | | | | 68,968,036 |
| Net change in unrealized gains or losses on investments | | | | (124,164,554) |
|
| Net realized and unrealized gains or losses on investments | | | | (55,196,518) |
|
| Net decrease in net assets resulting from operations | | $ | | (48,320,337) |
|
See Notes to Financial Statements
18
STATEMENTS OF CHANGES IN NET ASSETS
| | | Six Months Ended | | | | |
| | | January 31, 2008 | | Year Ended |
| | | (unaudited) | | July 31, 2007 |
|
| Operations | | | | | | | | |
| Net investment income | | $ | | 6,876,181 | | $ | | 18,519,381 |
| Net realized gains on investments | | | | 68,968,036 | | | | 76,632,230 |
| Net change in unrealized gains or | | | | | | | | |
| losses on investments | | | | (124,164,554) | | | | 53,256,136 |
|
| Net increase (decrease) in net assets | | | | | | | | |
| resulting from operations | | | | (48,320,337) | | | | 148,407,747 |
|
| Distributions to shareholders from | | | | | | | | |
| Net investment income | | | | | | | | |
| Class A | | | | (2,141,519) | | | | (8,718,422) |
| Class B | | | | (74,802) | | | | (762,784) |
| Class C | | | | (44,990) | | | | (395,967) |
| Class I | | | | (4,385,828) | | | | (15,087,058) |
| Class R | | | | (469) | | | | (1,780) |
| Net realized gains | | | | | | | | |
| Class A | | | | (29,784,846) | | | | (45,915,770) |
| Class B | | | | (3,438,895) | | | | (6,349,903) |
| Class C | | | | (1,990,621) | | | | (3,277,061) |
| Class I | | | | (48,668,287) | | | | (68,962,365) |
| Class R | | | | (8,302) | | | | (10,166) |
|
| Total distributions to shareholders | | | | (90,538,559) | | | | (149,481,276) |
|
| | | Shares | | | | Shares | | |
| Capital share transactions | | | | | | | | |
| Proceeds from shares sold | | | | | | | | |
| Class A | | 176,009 | | 4,037,487 | | 453,700 | | 10,961,240 |
| Class B | | 37,884 | | 864,808 | | 143,480 | | 3,431,050 |
| Class C | | 27,757 | | 641,253 | | 129,712 | | 3,127,587 |
| Class I | | 96,521 | | 2,223,160 | | 349,978 | | 8,611,641 |
| Class R | | 869 | | 19,701 | | 1,455 | | 34,787 |
|
| | | | | 7,786,409 | | | | 26,166,305 |
|
| Net asset value of shares issued in | | | | | | | | |
| reinvestment of distributions | | | | | | | | |
| Class A | | 1,362,700 | | 29,936,026 | | 2,217,493 | | 51,065,450 |
| Class B | | 144,468 | | 3,133,735 | | 280,026 | | 6,371,009 |
| Class C | | 77,502 | | 1,677,350 | | 131,519 | | 2,986,974 |
| Class I | | 2,235,578 | | 49,148,061 | | 3,358,151 | | 77,398,342 |
| Class R | | 26 | | 571 | | 0 | | 0 |
|
| | | | | 83,895,743 | | | | 137,821,775 |
|
| Automatic conversion of Class B | | | | | | | | |
| shares to Class A shares | | | | | | | | |
| Class A | | 83,547 | | 1,959,193 | | 234,614 | | 5,680,214 |
| Class B | | (84,345) | | (1,959,193) | | (236,747) | | (5,680,214) |
|
| | | | | 0 | | | | 0 |
|
| Payment for shares redeemed | | | | | | | | |
| Class A | | (1,803,550) | | (41,718,988) | | (3,459,069) | | (83,914,665) |
| Class B | | (294,756) | | (6,797,503) | | (638,130) | | (15,324,382) |
| Class C | | (219,783) | | (4,967,566) | | (286,415) | | (6,869,175) |
| Class I | | (1,482,049) | | (33,614,098) | | (2,455,140) | | (59,446,683) |
| Class R | | (111) | | (2,612) | | (675) | | (16,319) |
|
| | | | | (87,100,767) | | | | (165,571,224) |
|
See Notes to Financial Statements
19
STATEMENTS OF CHANGES IN NET ASSETS continued
| | | Six Months Ended | | | | |
| | | January 31, 2008 | | Year Ended |
| | | (unaudited) | | July 31, 2007 |
|
| Capital share transactions | | | | | | | | |
| continued | | | | | | | | |
| Net increase (decrease) in net assets | | | | | | | | |
| resulting from capital share | | | | | | | | |
| transactions | | $ | | 4,581,385 | | $ | | (1,583,144) |
|
| Total decrease in net assets | | | | (134,277,511) | | | | (2,656,673) |
| Net assets | | | | | | | | |
| Beginning of period | | | | 1,122,956,778 | | | | 1,125,613,451 |
|
| End of period | | $ | | 988,679,267 | | $ | | 1,122,956,778 |
|
| Undistributed net investment income | | $ | | 593,244 | | $ | | 364,671 |
|
See Notes to Financial Statements
20
NOTES TO FINANCIAL STATEMENTS (unaudited)
1. ORGANIZATION
Evergreen Equity Income Fund (the “Fund”) is a diversified series of Evergreen Equity Trust (the “Trust”), a Delaware statutory trust organized on September 18, 1997. The Trust is an open-end management investment company registered under the Investment Company Act of 1940, as amended (the “1940 Act”).
The Fund offers Class A, Class B, Class C, Class I and Class R shares. Class A shares are sold with a front-end sales charge. However, Class A share investments of $1 million or more are not subject to a front-end sales charge but are subject to a contingent deferred sales charge of 1.00% upon redemption within 18 months. Class B shares are sold without a front-end sales charge but are subject to a contingent deferred sales charge that is payable upon redemption and decreases depending on how long the shares have been held. Class C shares are sold without a front-end sales charge but are subject to a contingent deferred sales charge that is payable upon redemption within one year. Class I shares are sold without a front-end sales charge or contingent deferred sales charge. Class R shares are only available to participants in certain retirement plans and are sold without a front-end sales charge or contingent deferred sales charge. Each class of shares, except Class I shares, pays an ongoing distribution fee.
2. SIGNIFICANT ACCOUNTING POLICIES
The following is a summary of significant accounting policies consistently followed by the Fund in the preparation of its financial statements. The policies are in conformity with generally accepted accounting principles in the United States of America, which require management to make estimates and assumptions that affect amounts reported herein. Actual results could differ from these estimates.
a. Valuation of investments
Listed equity securities are usually valued at the last sales price or official closing price on the national securities exchange where the securities are principally traded.
Foreign securities traded on an established exchange are valued at the last sales price on the exchange where the security is primarily traded. If there has been no sale, the securities are valued at the mean between bid and asked prices. Foreign securities may be valued at fair value according to procedures approved by the Board of Trustees if the closing price is not reflective of current market values due to trading or events occurring in the foreign markets between the close of the established exchange and the valuation time of the Fund. In addition, substantial changes in values in the U.S. markets subsequent to the close of a foreign market may also affect the values of securities traded in the foreign market. The value of foreign securities may be adjusted if such movements in the U.S. market exceed a specified threshold.
Short-term securities with remaining maturities of 60 days or less at the time of purchase are valued at amortized cost, which approximates market value.
Investments in open-end mutual funds are valued at net asset value. Securities for which market quotations are not readily available or not reflective of current market value are valued at fair value
21
NOTES TO FINANCIAL STATEMENTS (unaudited) continued
as determined by the investment advisor in good faith, according to procedures approved by the Board of Trustees.
b. Repurchase agreements
Securities pledged as collateral for repurchase agreements are held by the custodian bank or in a segregated account in the Fund’s name until the agreements mature. Collateral for certain tri-party repurchase agreements is held at the counterparty’s custodian in a segregated account for the benefit of the Fund and the counterparty. Each agreement requires that the market value of the collateral be sufficient to cover payments of interest and principal. However, in the event of default or bankruptcy by the other party to the agreement, retention of the collateral may be subject to legal proceedings. The Fund will enter into repurchase agreements with banks and other financial institutions, which are deemed by the investment advisor to be creditworthy pursuant to guidelines established by the Board of Trustees. In certain instances, the Fund’s securities lending agent may provide collateral in the form of repurchase agreements.
c. Foreign currency translation
All assets and liabilities denominated in foreign currencies are translated into U.S. dollar amounts at the date of valuation. Purchases and sales of portfolio securities and income items denominated in foreign currencies are translated into U.S. dollar amounts on the respective dates of such transactions. The Fund does not separately account for that portion of the results of operations resulting from changes in foreign exchange rates on investments and the fluctuations arising from changes in market prices of securities held. Such fluctuations are included with the net realized and unrealized gains or losses on investments.
d. Securities lending
The Fund may lend its securities to certain qualified brokers in order to earn additional income. The Fund receives compensation in the form of fees or interest earned on the investment of any cash collateral received. The Fund also continues to receive interest and dividends on the securities loaned. The Fund receives collateral in the form of cash or securities with a market value at least equal to the market value of the securities on loan. In the event of default or bankruptcy by the borrower, the Fund could experience delays and costs in recovering the loaned securities or in gaining access to the collateral. The Fund has the right under the lending agreement to recover the securities from the borrower on demand.
e. Security transactions and investment income
Security transactions are recorded on trade date. Realized gains and losses are computed using the specific cost of the security sold. Interest income is recorded on the accrual basis and includes accretion of discounts and amortization of premiums. Dividend income is recorded on the ex-dividend date.
f. Federal taxes
The Fund intends to continue to qualify as a regulated investment company and distribute all of its taxable income, including any net capital gains (which have already been offset by available capital loss carryovers). Accordingly, no provision for federal taxes is required.
22
NOTES TO FINANCIAL STATEMENTS (unaudited) continued
g. Distributions
Distributions to shareholders from net investment income and net realized gains, if any, are recorded on the ex-dividend date. Such distributions are determined in conformity with income tax regulations, which may differ from generally accepted accounting principles.
h. Class allocations
Income, common expenses and realized and unrealized gains and losses are allocated to the classes based on the relative net assets of each class. Distribution fees, if any, are calculated daily at the class level based on the appropriate net assets of each class and the specific expense rates applicable to each class.
3. ADVISORY FEE AND OTHER TRANSACTIONS WITH AFFILIATES
Evergreen Investment Management Company, LLC (“EIMC”), an indirect, wholly-owned subsidiary of Wachovia Corporation (“Wachovia”), is the investment advisor to the Fund and is paid an annual fee starting at 0.70% and declining to 0.50% as average daily net assets increase. For the six months ended January 31, 2008, the advisory fee was equivalent to 0.60% of the Fund’s average daily net assets (on an annualized basis).
From time to time, EIMC may voluntarily or contractually waive its fee and/or reimburse expenses in order to limit operating expenses. During the six months ended January 31, 2008, EIMC voluntarily reimbursed Distribution Plan expenses (see Note 4) relating to Class A shares in the amount of $74,377.
The Fund may invest in money market funds which are advised by EIMC. Income earned on these investments is included in income from affiliate on the Statement of Operations.
Effective January 1, 2008, EIMC replaced Evergreen Investment Services, Inc. (“EIS”), an indirect, wholly-owned subsidiary of Wachovia, as the administrator to the Fund upon the assignment of the Fund’s Administrative Services Agreement from EIS to EIMC. There were no changes to the services being provided or fees being paid by the Fund. The administrator provides the Fund with facilities, equipment and personnel and is paid an annual rate determined by applying percentage rates to the aggregate average daily net assets of the Evergreen funds (excluding money market funds and Evergreen Institutional Enhanced Income Fund), starting at 0.10% and declining to 0.05% as the aggregate average daily net assets of the Evergreen funds (excluding money market funds and Evergreen Institutional Enhanced Income Fund) increase.
Evergreen Service Company, LLC (“ESC”), an indirect, wholly-owned subsidiary of Wachovia, is the transfer and dividend disbursing agent for the Fund. ESC receives account fees that vary based on the type of account held by the shareholders in the Fund. For the six months ended January 31, 2008, the transfer agent fees were equivalent to an annual rate of 0.12% of the Fund’s average daily net assets.
Wachovia Bank NA, through its securities lending division of Wachovia Global Securities Lending, acts as the securities lending agent for the Fund.
23
NOTES TO FINANCIAL STATEMENTS (unaudited) continued
The Fund has placed a portion of its portfolio transactions with brokerage firms that are affiliates of Wachovia. During the six months ended January 31, 2008, the Fund paid brokerage commissions of $126,770 to Wachovia Securities, LLC.
4. DISTRIBUTION PLANS
EIS serves as distributor of the Fund’s shares. The Fund has adopted Distribution Plans, as allowed by Rule 12b-1 of the 1940 Act, for each class of shares, except Class I. Under the Distribution Plans, distribution fees are paid at an annual rate of 0.30% of the average daily net assets for Class A shares, 0.50% of the average daily net assets for Class R shares and 1.00% of the average daily net assets for each of Class B and Class C shares.
For the six months ended January 31, 2008, EIS received $3,914 from the sale of Class A shares and $15, $35,074 and $1,290 in contingent deferred sales charges from redemptions of Class A, Class B and Class C shares, respectively.
5. INVESTMENT TRANSACTIONS
Cost of purchases and proceeds from sales of investment securities (excluding short-term securities) were $173,810,689 and $277,078,748, respectively, for the six months ended January 31, 2008.
During the six months ended January 31, 2008, the Fund loaned securities to certain brokers. At January 31, 2008, the value of securities on loan and the total value of collateral received for securities loaned amounted to $84,450,890 and $84,307,563, respectively.
On January 31, 2008, the aggregate cost of securities for federal income tax purposes was $1,027,838,694. The gross unrealized appreciation and depreciation on securities based on tax cost was $110,737,697 and $65,517,821, respectively, with a net unrealized appreciation of $45,219,876.
For income tax purposes, currency losses incurred after October 31 within the Fund’s fiscal year are deemed to arise on the first business day of the following fiscal year. As of July 31, 2007, the Fund incurred and elected to defer post-October currency losses of $68,592.
6. INTERFUND LENDING
Pursuant to an Exemptive Order issued by the SEC, the Fund may participate in an interfund lending program with certain funds in the Evergreen fund family. This program allows the Fund to borrow from, or lend money to, other participating funds. During the six months ended January 31, 2008, the Fund did not participate in the interfund lending program.
7. EXPENSE REDUCTIONS
Through expense offset arrangements with ESC and the Fund’s custodian, a portion of fund expenses has been reduced.
24
NOTES TO FINANCIAL STATEMENTS (unaudited) continued
8. DEFERRED TRUSTEES’ FEES
Each Trustee of the Fund may defer any or all compensation related to performance of his or her duties as a Trustee. The Trustees’ deferred balances are allocated to deferral accounts, which are included in the accrued expenses for the Fund. The investment performance of the deferral accounts is based on the investment performance of certain Evergreen funds. Any gains earned or losses incurred in the deferral accounts are reported in the Fund’s Trustees’ fees and expenses. At the election of the Trustees, the deferral account will be paid either in one lump sum or in quarterly installments for up to ten years.
9. FINANCING AGREEMENT
The Fund and certain other Evergreen funds share in an unsecured revolving credit commitment for temporary and emergency purposes, including the funding of redemptions, as permitted by each participating fund’s borrowing restrictions. Borrowings under this facility bear interest at 0.50% per annum above the Federal Funds rate. All of the participating funds are charged an annual commitment fee on the unused balance, which is allocated pro rata. The credit facility is for $100 million with an annual commitment fee of 0.08% . During the six months ended January 31, 2008, the Fund had no borrowings.
10. REGULATORY MATTERS AND LEGAL PROCEEDINGS
Pursuant to an administrative order issued by the SEC on September 19, 2007, EIMC, EIS, ESC (collectively, the “Evergreen Entities”), Wachovia Securities, LLC and the SEC have entered into an agreement settling allegations of (i) improper short-term trading arrangements in effect prior to May 2003 involving former officers and employees of EIMC and certain broker-dealers, (ii) insufficient systems for monitoring exchanges and enforcing exchange limitations as stated in certain funds’ prospectuses, and (iii) inadequate e-mail retention practices. Under the settlement, the Evergreen Entities were censured and paid approximately $32 million in disgorgement and penalties. This amount, along with a fine assessed by the SEC against Wachovia Securities, LLC will be distributed pursuant to a plan to be developed by an independent distribution consultant and approved by the SEC. The Evergreen Entities neither admitted nor denied the allegations and findings set forth in its settlement with the SEC.
In addition, the Evergreen funds and EIMC and certain of its affiliates are involved in various legal actions, including private litigation and class action lawsuits. EIMC does not expect that any of such legal actions currently pending or threatened will have a material adverse impact on the financial position or operations of any of the Evergreen funds or on EIMC’s ability to provide services to the Evergreen funds.
Although EIMC believes that none of the matters discussed above will have a material adverse impact on the Evergreen funds, there can be no assurance that these matters and any publicity surrounding or resulting from them will not result in reduced sales or increased redemptions of Evergreen fund shares, which could increase Evergreen fund transaction costs or operating expenses, or that they will not have other adverse consequences on the Evergreen funds.
25
NOTES TO FINANCIAL STATEMENTS (unaudited) continued
11. NEW ACCOUNTING PRONOUNCEMENTS
In June 2006, the Financial Accounting Standards Board (“FASB”) issued FASB Interpretation No. 48, Accounting for Uncertainty in Income Taxes — an interpretation of FASB statement 109 (“FIN 48”). FIN 48 supplements FASB 109 by prescribing a recognition threshold and measurement attribute for the financial statement recognition and measurement of a tax position taken or expected to be taken in a tax return. The Fund’s financial statements have not been impacted by the adoption of FIN 48. However, the conclusions regarding FIN 48 may be subject to review and adjustment at a later date based on factors including, but not limited to, further implementation guidance expected from FASB, and on-going analysis of tax laws, regulations, and interpretations thereof.
In September 2006, FASB issued Statement of Financial Accounting Standards No. 157, Fair Value Measurements (“FAS 157”). FAS 157 establishes a single authoritative definition of fair value, establishes a framework for measuring fair value and expands disclosures about fair value measurements. FAS 157 applies to fair value measurements already required or permitted by existing standards. The change to current generally accepted accounting principles from the application of FAS 157 relates to the definition of fair value, the methods used to measure fair value, and the expanded disclosures about fair value measurements. Management of the Fund does not believe the adoption of FAS 157 will materially impact the financial statement amounts, however, additional disclosures may be required about the inputs used to develop the measurements and the effect of certain of the measurements on changes in net assets for the period. FAS 157 is effective for financial statements issued for fiscal years beginning after November 15, 2007 and interim periods within those fiscal years.
12. SUBSEQUENT DISTRIBUTIONS
On March 13, 2008, the Fund declared distributions from net investment income to shareholders of record on March 12, 2008. The per share amounts payable on March 14, 2008 were as follows:
| | | Net |
| | | Investment |
| | | Income |
|
| Class A | | $ | | 0.0850 |
| Class B | | $ | | 0.0460 |
| Class C | | $ | | 0.0471 |
| Class I | | $ | | 0.0990 |
| Class R | | $ | | 0.0736 |
|
These distributions are not reflected in the accompanying financial statements.
26
ADDITIONAL INFORMATION (unaudited)
INFORMATION ABOUT THE REVIEW AND APPROVAL OF THE FUND’S INVESTMENT ADVISORY AGREEMENT
Each year, the Fund’s Board of Trustees is required to consider whether to continue in place the Fund’s investment advisory agreement. In September 2007, the Trustees, including a majority of the Trustees who are not interested persons (as that term is defined in the 1940 Act) of the Fund or of EIMC, approved the continuation of the Fund’s investment advisory agreement. (References below to the “Fund” are to Evergreen Equity Income Fund; references to the “funds” are to the Evergreen funds generally.)
At the same time, the Trustees considered the continuation of the investment advisory agreements for all of the funds, and the description below refers in many cases to the Trustees’ process and conclusions in connection with their consideration of this matter for all of the funds. (See “Certain Fund-Specific Considerations” below for a discussion regarding certain factors considered by the Trustees relating specifically to the Fund.) In all of its deliberations, the Board of Trustees and the disinterested Trustees were advised by independent counsel to the disinterested Trustees and counsel to the funds.
The review process. The 1940 Act requires that the Board of Trustees request and evaluate, and that EIMC and any sub-advisors furnish, such information as may reasonably be necessary to evaluate the terms of a fund’s advisory agreement. The review process began at the time of the last advisory contract-renewal process in September 2006. In the course of that process, the Trustees identified a number of funds that had experienced either short-term or longer-term performance issues. During the following months, the Trustees reviewed information relating to any changes in the performance of those funds and/or any changes in the investment process or the investment teams responsible for the management of the funds. In addition, during the course of the year, the Trustees reviewed information regarding the investment performance of all of the funds and identified additional funds that they believed warranted further attention based on performance since September 2006.
In spring 2007, a committee of the Board of Trustees (the “Committee”), working with EIMC management, determined generally the types of information the Board would review and set a timeline detailing the information required and the dates for its delivery to the Trustees. The independent data provider Keil Fiduciary Strategies LLC (“Keil”) was engaged to provide fund-specific and industry-wide data to the Board containing information of a nature and in a format generally prescribed by the Committee, and the Committee worked with Keil and EIMC to develop appropriate groups of peer funds for each fund. The Committee also identified a number of expense, performance, and other issues and requested specific information as to those issues.
The Trustees reviewed, with the assistance of an independent industry consultant retained by the disinterested Trustees, the information provided by EIMC in response to the Committee’s requests and the information provided by Keil. The Trustees formed small committees to review individual funds in greater detail. In addition, the Trustees requested information regarding, among other things, brokerage practices of the funds, the use of derivatives by the funds, strategic
27
ADDITIONAL INFORMATION (unaudited) continued
planning for the funds, analyst and research support available to the portfolio management teams, and information regarding the various fall-out benefits received directly and indirectly by EIMC and its affiliates from the funds. The Trustees requested and received additional information following that review.
The Committee met several times by telephone to consider the information provided by EIMC. The Committee met with representatives of EIMC in early September. At a meeting of the full Board of Trustees later in September, the Committee reported the results of its discussions with EIMC, and the full Board met with representatives of EIMC, engaged in further review of the materials provided to them, and approved the continuation of each of the advisory and sub-advisory agreements.
The disinterested Trustees discussed the continuation of the funds’ advisory agreements with representatives of EIMC and in multiple private sessions with legal counsel at which no personnel of EIMC were present. In considering the continuation of the agreement, the Trustees did not identify any particular information or consideration that was all-important or controlling, and each Trustee attributed different weights to various factors. The Trustees evaluated information provided to them both in terms of the Evergreen mutual funds generally and with respect to each fund, including the Fund, specifically as they considered appropriate; although the Trustees considered the continuation of the agreement as part of the larger process of considering the continuation of the advisory contracts for all of the funds, their determination to continue the advisory agreement for each of the funds was ultimately made on a fund-by-fund basis.
This summary describes a number of the most important, but not necessarily all, of the factors considered by the Board and the disinterested Trustees.
Information reviewed. The Board of Trustees and committees of the Board of Trustees meet periodically during the course of the year. At those meetings, the Board receives a wide variety of information regarding the services performed by EIMC, the investment performance of the funds, and other aspects of the business and operations of the funds. At those meetings, and in the process of considering the continuation of the agreements, the Trustees considered information regarding, for example, the funds’ investment results; the portfolio management teams for the funds and the experience of the members of those teams, and any recent changes in the membership of the teams; portfolio trading practices; compliance by the funds and EIMC with applicable laws and regulations and with the funds’ and EIMC’s compliance policies and procedures; risk evaluation and oversight procedures at EIMC; services provided by affiliates of EIMC to the funds and shareholders of the funds; and other information relating to the nature, extent, and quality of services provided by EIMC. The Trustees considered a number of changes in portfolio management personnel at EIMC and its advisory affiliates in the year since September 2006, and recent changes in compliance personnel at EIMC, including the appointment of a new Chief Compliance Officer for the funds.
The Trustees considered the rates at which the funds pay investment advisory fees, and the efforts generally by EIMC and its affiliates as sponsors of the funds. The data provided by Keil showed
28
ADDITIONAL INFORMATION (unaudited) continued
the management fees paid by each fund in comparison to the management fees of other peer mutual funds, in addition to data regarding the investment performance of the funds in comparison to other peer mutual funds. The Trustees were assisted by the independent industry consultant in reviewing the information presented to them.
The Trustees considered the transfer agency fees paid by the funds to an affiliate of EIMC. They reviewed information presented to them showing that the transfer agency fees charged to the funds were generally consistent with industry norms.
The Trustees also considered that EIS, an affiliate of EIMC, serves as administrator to the funds and receives a fee for its services as administrator. In their comparison of the advisory fee paid by the funds with those paid by other mutual funds, the Trustees took into account administrative fees paid by the funds and those other mutual funds. The Board considered that EIS serves as distributor to the funds generally and receives fees from the funds for those services. They considered other so-called “fall-out” benefits to EIMC and its affiliates due to their other relationships with the funds, including, for example, soft-dollar services received by EIMC attributable to transactions entered into by EIMC for the benefit of the funds and brokerage commissions received by Wachovia Securities, LLC, an affiliate of EIMC, from transactions effected by it for the funds. The Trustees also noted that the funds pay sub-transfer agency fees to various financial institutions who hold fund shares in omnibus accounts, and that Wachovia Securities, LLC and its affiliates receive such payments from the funds in respect of client accounts they hold in omnibus arrangements, and that an affiliate of EIMC receives fees for administering the sub-transfer agency payment program. They also considered that Wachovia Securities, LLC and its affiliates receive distribution-related fees and shareholder servicing payments (including amounts derived from payments under the funds’ Rule 12b-1 plans) in respect of shares sold or held through it. The Trustees also noted that an affiliate of EIMC receives compensation for serving as a securities lending agent for the funds.
Nature and quality of the services provided. The Trustees considered that EIMC and its affili-ates generally provide a comprehensive investment management service to the funds. They noted that EIMC makes its personnel available to serve as officers of the funds, and concluded that the reporting and management functions provided by EIMC with respect to the funds were generally satisfactory. The Trustees considered the investment philosophy of the Fund’s portfolio management team, and considered the in-house research capabilities of EIMC and its affiliates, as well as other resources available to EIMC, including research services available to it from third parties. The Board considered the managerial and financial resources available to EIMC and its affiliates, and the commitment that the Wachovia organization has made to the funds generally. On the basis of these factors, they determined that the nature and scope of the services provided by EIMC were consistent with its duties under the investment advisory agreements and appropriate and consistent with the investment programs and best interests of the funds.
The Trustees noted the resources EIMC and its affiliates have committed to the regulatory, compliance, accounting, tax and oversight of tax reporting, and shareholder servicing functions,
29
ADDITIONAL INFORMATION (unaudited) continued
and the number and quality of staff committed to those functions, which they concluded were appropriate and generally in line with EIMC’s responsibilities to the Fund and to the funds generally. The Board and the disinterested Trustees concluded, within the context of their overall conclusions regarding the funds’ advisory agreements, that they were generally satisfied with the nature, extent, and quality of the services provided by EIMC, including services provided by EIS under its administrative services agreements with the funds.
Investment performance. The Trustees considered the investment performance of each fund, both by comparison to other comparable mutual funds and to broad market indices. The Trustees emphasized that the continuation of the investment advisory agreement for a fund should not be taken as any indication that the Trustees did not believe investment performance for any specific fund might not be improved, and they noted that they would continue to monitor closely the investment performance of the funds going forward.
Advisory and administrative fees. The Trustees recognized that EIMC does not seek to provide the lowest cost investment advisory service, but to provide a high quality, full-service investment management product at a reasonable price. They also noted that EIMC has in many cases sought to set its investment advisory fees at levels consistent with industry norms. The Trustees noted that, in certain cases, a fund’s management fees were higher than many or most other mutual funds in the same Keil peer group. However, in each case, the Trustees determined on the basis of the information presented that the level of management fees was not excessive.
Certain Fund-specific considerations. The Trustees noted that, for the one-, three-, five-, and ten-year periods ended December 31, 2006, the Fund’s Class A shares had underperformed the Fund’s benchmark index, the Russell 1000 Value Index. The Trustees also noted that, for the one-, three-, and ten-year periods ended December 31, 2006, the Fund’s Class A shares had underperformed a majority of the mutual funds against which the Trustees compared the Fund’s performance, but had outperformed a majority of the mutual funds against which the Trustees compared the Fund’s performance for the five-year period ended December 31, 2006. The Trustees noted that the Fund’s portfolio management team had recently changed and that the new team’s performance record with the Fund was too short to allow for useful comparison to peers. The Trustees noted, however, that the Fund’s relative performance had improved since the appointment of the new portfolio management team.
The Trustees noted that the management fee paid by the Fund was near but higher than the median of the management fees paid by the other mutual funds against which the Trustees compared the Fund’s management fee and that the level of profitability realized by EIMC in respect of the fee did not appear excessive.
Economies of scale. The Trustees noted that economies of scale would likely be achieved by EIMC in managing the funds as the funds grow. The Trustees noted that the Fund had implemented breakpoints in its advisory fee structure. The Trustees noted that they would continue to review the appropriate levels of breakpoints in the future, but concluded that the breakpoints as
30
ADDITIONAL INFORMATION (unaudited) continued
implemented appeared to be a reasonable step toward the realization of economies of scale by the Fund.
Profitability. The Trustees considered information provided to them regarding the profitability to the EIMC organization of the investment advisory, administration, and transfer agency (with respect to the open-end funds only) fees paid to EIMC and its affiliates by each of the funds. They considered that the information provided to them was necessarily estimated, and that the profitability information provided to them, especially on a fund-by-fund basis, did not necessarily provide a definitive tool for evaluating the appropriateness of each fund’s advisory fee. They noted that the levels of profitability of the funds to EIMC varied widely, depending on among other things the size and type of fund. They considered the profitability of the funds in light of such factors as, for example, the information they had received regarding the relation of the fees paid by the funds to those paid by other mutual funds, the investment performance of the funds, and the amount of revenues involved. In light of these factors, the Trustees concluded that the profitability of any of the funds, individually or in the aggregate, should not prevent the Trustees from approving the continuation of the agreements.
31
This page left intentionally blank
32
This page left intentionally blank
33
This page left intentionally blank
34
This page left intentionally blank
35
TRUSTEES AND OFFICERS
| TRUSTEES1 | | |
| Charles A. Austin III | | Investment Counselor, Anchor Capital Advisors, LLC. (investment advice); Director, The Andover |
| Trustee | | Companies (insurance); Trustee, Arthritis Foundation of New England; Former Director, The |
| DOB: 10/23/1934 | | Francis Ouimet Society (scholarship program); Former Director, Executive Vice President and |
| Term of office since: 1991 | | Treasurer, State Street Research & Management Company (investment advice) |
| Other directorships: None | | |
|
| |
| K. Dun Gifford | | Chairman and President, Oldways Preservation and Exchange Trust (education); Trustee, |
| Trustee | | Chairman of the Finance Committee, Member of the Executive Committee, and Former |
| DOB: 10/23/1938 | | Treasurer, Cambridge College |
| Term of office since: 1974 | | |
| Other directorships: None | | |
|
| |
| Dr. Leroy Keith, Jr. | | Managing Director, Almanac Capital Management (commodities firm); Trustee, Phoenix |
| Trustee | | Fund Complex; Director, Diversapack Co. (packaging company); Former Partner, Stonington |
| DOB: 2/14/1939 | | Partners, Inc. (private equity fund); Former Director, Obagi Medical Products Co.; Former |
| Term of office since: 1983 | | Director, Lincoln Educational Services |
| Other directorships: Trustee, | | |
| Phoenix Fund Complex (consisting | | |
| of 53 portfolios as of 12/31/2007) | | |
|
| |
| Carol A. Kosel1 | | Former Consultant to the Evergreen Boards of Trustees; Former Vice President and Senior Vice |
| Trustee | | President, Evergreen Investments, Inc.; Former Treasurer, Evergreen Funds; Former Treasurer, |
| DOB: 12/25/1963 | | Vestaur Securities Fund |
| Term of office since: 2008 | | |
| Other directorships: None | | |
|
| |
| Gerald M. McDonnell | | Former Manager of Commercial Operations, CMC Steel (steel producer) |
| Trustee | | |
| DOB: 7/14/1939 | | |
| Term of office since: 1988 | | |
| Other directorships: None | | |
|
| |
| Patricia B. Norris | | President and Director of Buckleys of Kezar Lake, Inc. (real estate company); Former President |
| Trustee | | and Director of Phillips Pond Homes Association (home community); Former Partner, |
| DOB: 4/9/1948 | | PricewaterhouseCoopers, LLP (independent registered public accounting firm) |
| Term of office since: 2006 | | |
| Other directorships: None | | |
|
| |
| William Walt Pettit | | Partner and Vice President, Kellam & Pettit, P.A. (law firm); Director, Superior Packaging Corp. |
| Trustee | | (packaging company); Member, Superior Land, LLC (real estate holding company), Member, |
| DOB: 8/26/1955 | | K&P Development, LLC (real estate development); Former Director, National Kidney Foundation |
| Term of office since: 1988 | | of North Carolina, Inc. (non-profit organization) |
| Other directorships: None | | |
|
| |
| David M. Richardson | | President, Richardson, Runden LLC (executive recruitment advisory services); Director, J&M |
| Trustee | | Cumming Paper Co. (paper merchandising); Trustee, NDI Technologies, LLP (communications); |
| DOB: 9/19/1941 | | Former Consultant, AESC (The Association of Executive Search Consultants) |
| Term of office since: 1982 | | |
| Other directorships: None | | |
|
| |
| Dr. Russell A. Salton III | | President/CEO, AccessOne MedCard, Inc. |
| Trustee | | |
| DOB: 6/2/1947 | | |
| Term of office since: 1984 | | |
| Other directorships: None | | |
|
36
TRUSTEES AND OFFICERS continued
| Michael S. Scofield | | Retired Attorney, Law Offices of Michael S. Scofield; Former Director and Chairman, Branded |
| Trustee | | Media Corporation (multi-media branding company) |
| DOB: 2/20/1943 | | |
| Term of office since: 1984 | | |
| Other directorships: None | | |
|
| |
| Richard J. Shima | | Independent Consultant; Director, Hartford Hospital; Trustee, Greater Hartford YMCA; Former |
| Trustee | | Director, Trust Company of CT; Former Director, Old State House Association; Former Trustee, |
| DOB: 8/11/1939 | | Saint Joseph College (CT) |
| Term of office since: 1993 | | |
| Other directorships: None | | |
|
| |
| Richard K. Wagoner, CFA2 | | Member and Former President, North Carolina Securities Traders Association; Member, Financial |
| Trustee | | Analysts Society |
| DOB: 12/12/1937 | | |
| Term of office since: 1999 | | |
| Other directorships: None | | |
|
| |
| |
| OFFICERS | | |
| |
| Dennis H. Ferro3 | | Principal occupations: President and Chief Executive Officer, Evergreen Investment Company, |
| President | | Inc. and Executive Vice President, Wachovia Bank, N.A.; former Chief Investment Officer, |
| DOB: 6/20/1945 | | Evergreen Investment Company, Inc. |
| Term of office since: 2003 | | |
|
| |
| Jeremy DePalma4 | | Principal occupations: Senior Vice President, Evergreen Investment Management Company, LLC; |
| Treasurer | | Former Vice President, Evergreen Investment Services, Inc.; Former Assistant Vice President, |
| DOB: 2/5/1974 | | Evergreen Investment Services, Inc. |
| Term of office since: 2005 | | |
|
| |
| Michael H. Koonce4 | | Principal occupations: Senior Vice President and General Counsel, Evergreen Investment |
| Secretary | | Services, Inc.; Secretary, Senior Vice President and General Counsel, Evergreen Investment |
| DOB: 4/20/1960 | | Management Company, LLC and Evergreen Service Company, LLC; Senior Vice President and |
| Term of office since: 2000 | | Assistant General Counsel, Wachovia Corporation |
|
| |
| Robert Guerin4 | | Principal occupations: Chief Compliance Officer, Evergreen Funds and Senior Vice President of |
| Chief Compliance Officer | | Evergreen Investments Co, Inc; Former Managing Director and Senior Compliance Officer, |
| DOB: 9/20/1965 | | Babson Capital Management LLC; Former Principal and Director, Compliance and Risk |
| Term of office since: 2007 | | Management, State Street Global Advisors; Former Vice President and Manager, Sales Practice |
| | | Compliance, Deutsche Asset Management. |
|
1 Each Trustee, except Mses. Kosel and Norris, serves until a successor is duly elected or qualified or until his or her death, resignation, retirement or removal from office. As new Trustees, Ms. Kosel’s and Ms. Norris’ initial terms end December 31, 2010 and June 30, 2009, respectively, at which times they may be re-elected by Trustees to serve until a successor is duly elected or qualified or until her death, resignation, retirement or removal from office by the Trustees. Each Trustee, except Ms. Kosel, oversaw 93 Evergreen funds as of December 31, 2007. Ms. Kosel became a Trustee on January 1, 2008. Correspondence for each Trustee may be sent to Evergreen Board of Trustees, P.O. Box 20083, Charlotte, NC 28202.
2 Mr. Wagoner is an “interested person” of the Fund because of his ownership of shares in Wachovia Corporation, the parent to the Fund’s investment advisor.
3 The address of the Officer is 401 S. Tryon Street, 20th Floor, Charlotte, NC 28288.
4 The address of the Officer is 200 Berkeley Street, Boston, MA 02116.
Additional information about the Fund’s Board of Trustees and Officers can be found in the Statement of Additional Information (SAI) and is available upon request without charge by calling 800.343.2898.
37
565219 rv5 03/2008
Evergreen Fundamental Large Cap Fund
| table of contents |
| 1 | | LETTER TO SHAREHOLDERS |
| 4 | | FUND AT A GLANCE |
| 6 | | ABOUT YOUR FUND’S EXPENSES |
| 7 | | FINANCIAL HIGHLIGHTS |
| 11 | | SCHEDULE OF INVESTMENTS |
| 16 | | STATEMENT OF ASSETS AND LIABILITIES |
| 17 | | STATEMENT OF OPERATIONS |
| 18 | | STATEMENTS OF CHANGES IN NET ASSETS |
| 19 | | NOTES TO FINANCIAL STATEMENTS |
| 25 | | ADDITIONAL INFORMATION |
| 32 | | TRUSTEES AND OFFICERS |
This semiannual report must be preceded or accompanied by a prospectus of the Evergreen fund contained herein. The prospectus contains more complete information, including fees and expenses, and should be read carefully before investing or sending money.
The fund will file its complete schedule of portfolio holdings with the SEC for the first and third quarters of each fiscal year on Form N-Q. The fund’s Form N-Q will be available on the SEC’s Web site at http://www.sec.gov. In addition, the fund’s Form N-Q may be reviewed and copied at the SEC’s Public Reference Room in Washington, D.C. Information on the operation of the Public Reference Room may be obtained by calling 800.SEC.0330.
A description of the fund’s proxy voting policies and procedures, as well as information regarding how the fund voted proxies relating to portfolio securities during the most recent 12-month period ended June 30, is available by visiting our Web site at EvergreenInvestments.com or by visiting the SEC’s Web site at http://www.sec.gov. The fund’s proxy voting policies and procedures are also available without charge, upon request, by calling 800.343.2898.
| Mutual Funds: | | | | |
| NOT FDIC INSURED | MAY LOSE VALUE | NOT BANK GUARANTEED |
Evergreen InvestmentsSM is a service mark of Evergreen Investment Management Company, LLC.
Copyright 2008, Evergreen Investment Management Company, LLC.
Evergreen Investment Management Company, LLC is a subsidiary of Wachovia Corporation and is an affiliate of Wachovia Corporation’s other Broker Dealer subsidiaries.
Evergreen mutual funds are distributed by Evergreen Investment Services, Inc.
200 Berkeley Street, Boston, MA 02116
LETTER TO SHAREHOLDERS
March 2008

Dennis H. Ferro
President and Chief
Executive Officer
Dear Shareholder:
We are pleased to provide the Semiannual Report for Evergreen Fundamental Large Cap Fund, covering the six-month period ended January 31, 2008.
Investors in the domestic equity market faced challenging and increasingly stormy conditions over the six-month period ended January 31, 2008. Problems in the housing and subprime mortgage markets led to a tightening of credit, which in turn contributed to widening fears of a dramatic deceleration in the economy’s expansion. As the economy weakened, equity prices generally declined across companies of all sizes. Large cap stocks held up somewhat better than mid cap and small cap shares, while growth stocks outperformed more economically sensitive value stocks. Fixed income investors, meanwhile, sought out the highest-quality securities and attempted to avoid credit risk. Longer-maturity Treasuries outperformed other sectors, while the prices of corporate bonds and many asset-backed securities fell as the yield spreads between Treasuries and lower-rated securities widened. In this environment, the price of gold surged while the dollar remained weak.
The U.S. economy exhibited increasing signs of weakness in the latter half of 2007 and the first month of 2008 after experiencing solid growth early in 2007. Although housing and credit-related concerns began weighing on investor sentiment early in the year, the economy’s growth trajectory continued to be supported early in 2007 by the combination of solid trends in employment, income, investment and export trends. That began to change in the latter months of 2007, however, as each of these pillars of support began to weaken. Growth in Gross Domestic Product
1
LETTER TO SHAREHOLDERS continued
rose by just 0.6% during the final quarter of 2007 as economic output slowed because of a sharp reduction in business inventories. The rate of corporate earnings growth, meanwhile, declined over the second half of 2007. Payrolls dropped by 17,000 in January 2008, contributing to growing concerns about the outlook for consumer spending, which accounts for up to 70% of economic output. Faced with growing evidence of the economy’s deceleration, the Federal Reserve Board (the “Fed”) began to focus more on stimulating growth and less on watching inflation. The Fed cut the target fed funds rate from 5.25% to 4.25% during the last four months of 2007 and then slashed the rate by an additional 1.25% in two separate actions within just eight days of each other in January 2008. Also in early 2008, Congress passed, and President Bush signed, a $168 billion fiscal stimulus bill that contained rebates for taxpayers, tax breaks for businesses and additional assistance for Social Security recipients and disabled veterans.
Over the six-month period ended January 31, 2008, the management teams of Evergreen’s value-oriented equity funds tended to emphasize investments in attractively priced, fundamentally sound corporations. The portfolio manager of both Evergreen Disciplined Value Fund and Evergreen Disciplined Small-Mid Value Fund, for example, used a combination of quantitative tools and traditional fundamental analysis in reviewing opportunities among larger and smaller companies, respectively. The manager of Evergreen Equity Index Fund maintained a portfolio reflecting the composition of the Standard & Poor’s 500® Index, using a proprietary process to control trading and operational costs. Managers of Evergreen Equity Income Fund emphasized companies they believe have the ability to maintain and increase their dividends to shareholders. The managers of Evergreen Fundamental Large Cap Fund focused on larger corporations with stable earnings growth records while the managers of Evergreen Fundamental Mid Cap Value Fund, which was launched on September 28, 2007, emphasized mid-sized companies selling at what the managers believed to be reasonable valuations. The team managing Evergreen Intrinsic Value Fund sought out investments in
2
LETTER TO SHAREHOLDERS continued
established companies selling at stock prices below the managers’ estimate of the company’s intrinsic value. Meanwhile, the managers of Evergreen Small Cap Value Fund and Evergreen Special Values Fund each focused on higher-quality small companies that the managers believed to have reasonable prices and strong balance sheets.
We believe the experiences in the investment markets during the past six months have underscored the value of a well-diversified, long-term investment strategy to help soften the effects of volatility in any one market or asset class. As always, we encourage investors to maintain diversified investment portfolios in pursuit of their long-term investment goals.
Please visit us at EvergreenInvestments.com for more information about our funds and other investment products available to you. Thank you for your continued support of Evergreen Investments.
Sincerely,

Dennis H. Ferro
President and Chief Executive Officer
Evergreen Investment Company, Inc.
Special Notice to Shareholders:
Please visit our Web site at EvergreenInvestments.com for statements from President and Chief Executive Officer, Dennis Ferro, regarding the firm’s recent settlement with the Securities and Exchange Commission (SEC) and prior settlement with the Financial Industry Regulatory Authority (FINRA).
3
FUND AT A GLANCE
as of January 31, 2008
MANAGEMENT TEAM
Investment Advisor:
• Evergreen Investment Management Company, LLC
Portfolio Managers:
• Walter T. McCormick, CFA
• Emory Sanders, Jr., CFA
CURRENT INVESTMENT STYLE

Source: Morningstar, Inc.
Morningstar’s style box is based on a portfolio date as of 12/31/2007.
The Equity style box placement is based on 10 growth and valuation measures for each fund holding and the median size of the companies in which the fund invests.
PERFORMANCE AND RETURNS
Portfolio inception date: 10/15/1986
| | | Class A | | Class B | | Class C | | Class I |
| Class inception date | | 1/3/1995 | | 1/3/1995 | | 1/3/1995 | | 10/15/1986 |
|
| Nasdaq symbol | | EGIAX | | EGIBX | | EGICX | | EVVTX |
|
| 6-month return with sales charge | | -9.56% | | -8.92% | | -5.28% | | N/A |
|
| 6-month return w/o sales charge | | -4.04% | | -4.37% | | -4.38% | | -3.87% |
|
| Average annual return* | | | | | | | | |
|
| 1-year with sales charge | | -6.25% | | -5.93% | | -2.22% | | N/A |
|
| 1-year w/o sales charge | | -0.55% | | -1.24% | | -1.28% | | -0.24% |
|
| 5-year | | 10.43% | | 10.70% | | 10.97% | | 12.07% |
|
| 10-year | | 2.61% | | 2.47% | | 2.47% | | 3.50% |
|
| Maximum sales charge | | 5.75% | | 5.00% | | 1.00% | | N/A |
| | | Front-end | | CDSC | | CDSC | | |
|
* Adjusted for maximum applicable sales charge, unless noted.
Past performance is no guarantee of future results. The performance quoted represents past performance and current performance may be lower or higher. The investment return and principal value of an investment will fluctuate so that investors’ shares, when redeemed, may be worth more or less than their original cost. To obtain performance information current to the most recent month-end for Classes A, B, C or I, please go to EvergreenInvestments.com/fundperformance. The performance of each class may vary based on differences in loads, fees and expenses paid by the shareholders investing in each class. Performance includes the reinvestment of income dividends and capital gain distributions. Performance shown does not reflect the deduction of taxes that a shareholder would pay on fund distributions or the redemption of fund shares.
The fund incurs a 12b-1 fee of 0.30% for Class A and 1.00% for Classes B and C. Class I does not pay a 12b-1 fee.
The advisor is reimbursing a portion of the 12b-1 fee for Class A. Had the fee not been reimbursed, returns for Class A would have been lower. Returns reflect expense limits previously in effect for all classes, without which returns would have been lower.
4
FUND AT A GLANCE continued
LONG-TERM GROWTH
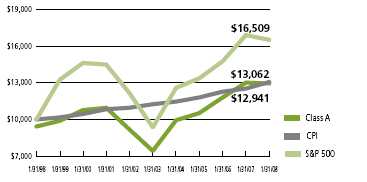
Comparison of a $10,000 investment in the Evergreen Fundamental Large Cap Fund Class A shares versus a similar investment in the S&P 500 Index (S&P 500) and the Consumer Price Index (CPI).
The S&P 500 is an unmanaged market index and does not include transaction costs associated with buying and selling securities, any mutual fund fees or expenses or any taxes. The CPI is a commonly used measure of inflation and does not represent an investment return. It is not possible to invest directly in an index.
Class I shares are only offered in the following manner: (1) to investment advisory clients of Evergreen Investment Management Company, LLC (or its advisory affiliates) when purchased by such advisor(s) on behalf of its clients, (2) to certain mutual fund wrap program clients of Wachovia Securities and of third-party broker/dealers when purchased through a clearing relationship with Wachovia Securities or an affiliate providing mutual fund clearing services, (3) through arrangements entered into on behalf of the Evergreen funds with certain financial services firms, (4) to certain institutional investors, and (5) to persons who owned Class Y shares in registered name in an Evergreen fund on or before December 31, 1994 or who owned shares of any SouthTrust fund in registered name as of March 18, 2005 or who owned shares of Vestaur Securities Fund as of May 20, 2005.
Class I shares are only available to institutional shareholders with a minimum of $1 million investment, which may be waived in certain situations.
The fund’s investment objective may be changed without a vote of the fund’s shareholders.
Foreign investments may contain more risk due to the inherent risks associated with changing political climates, foreign market instability and foreign currency fluctuations.
Value-based investments are subject to the risk that the broad market may not recognize their intrinsic value.
High yield, lower-rated bonds may contain more risk due to the increased possibility of default.
All data is as of January 31, 2008, and subject to change.
5
ABOUT YOUR FUND’S EXPENSES
The Example below is intended to describe the fees and expenses borne by shareholders and the impact of those costs on your investment.
Example
As a shareholder of the fund, you incur two types of costs: (1) transaction costs, including sales charges (loads), redemption fees and exchange fees; and (2) ongoing costs, including management fees, distribution (12b-1) fees and other fund expenses. This Example is intended to help you understand your ongoing costs (in dollars) of investing in the fund and to compare these costs with the ongoing costs of investing in other mutual funds. The Example is based on an investment of $1,000 invested at the beginning of the period and held for the entire period from August 1, 2007 to January 31, 2008.
The example illustrates your fund’s costs in two ways:
• Actual expenses
The section in the table under the heading “Actual” provides information about actual account values and actual expenses. You may use the information in these columns, together with the amount you invested, to estimate the expenses that you paid over the period. Simply divide your account value by $1,000 (for example, an $8,600 account value divided by $1,000 = 8.6), then multiply the result by the number in the appropriate column for your share class, in the column entitled “Expenses Paid During Period” to estimate the expenses you paid on your account during this period.
• Hypothetical example for comparison purposes
The section in the table under the heading “Hypothetical (5% return before expenses)” provides information about hypothetical account values and hypothetical expenses based on the fund’s actual expense ratio and an assumed rate of return of 5% per year before expenses, which is not the fund’s actual return. The hypothetical account values and expenses may not be used to estimate the actual ending account balance or expenses you paid for the period. You may use this information to compare the ongoing costs of investing in the fund and other funds. To do so, compare this 5% hypothetical example with the 5% hypothetical examples that appear in the shareholder reports of the other funds.
Please note that the expenses shown in the table are meant to highlight your ongoing costs only and do not reflect any transactional costs, such as sales charges (loads), redemption fees or exchange fees. Therefore, the section in the table under the heading “Hypothetical (5% return before expenses)” is useful in comparing ongoing costs only, and will not help you determine the relative total costs of owning different funds. In addition, if these transactional costs were included, your costs would have been higher.
| | | Beginning | | Ending | | |
| | | Account | | Account | | Expenses |
| | | Value | | Value | | Paid During |
| | | 8/1/2007 | | 1/31/2008 | | Period* |
|
| Actual |
| Class A | | $ 1,000.00 | | $ 959.57 | | $ 6.45 |
| Class B | | $ 1,000.00 | | $ 956.26 | | $ 10.08 |
| Class C | | $ 1,000.00 | | $ 956.24 | | $ 10.08 |
| Class I | | $ 1,000.00 | | $ 961.28 | | $ 5.18 |
| Hypothetical | | |
| (5% return | |
| before expenses) | |
| Class A | | $ 1,000.00 | | $ 1,018.55 | | $ 6.65 |
| Class B | | $ 1,000.00 | | $ 1,014.83 | | $ 10.38 |
| Class C | | $ 1,000.00 | | $ 1,014.83 | | $ 10.38 |
| Class I | | $ 1,000.00 | | $ 1,019.86 | | $ 5.33 |
|
* For each class of the Fund, expenses are equal to the annualized expense ratio of each class (1.31% for Class A, 2.05% for Class B, 2.05% for Class C and 1.05% for Class I), multiplied by the average account value over the period, multiplied by 184 / 366 days.
6
FINANCIAL HIGHLIGHTS
(For a share outstanding throughout each period)
| | | Six Months Ended | | Year Ended July 31, |
| | | January 31, 200 | |
|
| CLASS A | | (unaudited) | | 2007 | | 2006 | | 2005 | | 2004 | | 2003 |
|
| Net asset value, beginning of period | | $26.73 | | $23.37 | | $23.25 | | $20.85 | | $20.02 | | $18.58 |
|
| Income from investment operations | | | | | | | | | | | | |
| Net investment income (loss) | | 0.08 | | 0.131 | | 0.111 | | 0.141 | | 0.071 | | 0.121 |
Net realized and unrealized gains
or losses on investments | | (1.08) | | 3.65 | | 0.52 | | 3.64 | | 2.21 | | 1.41 |
| |
|
| Total from investment operations | | (1.00) | | 3.78 | | 0.63 | | 3.78 | | 2.28 | | 1.53 |
|
| Distributions to shareholders from | | | | | | | | | | �� | | |
| Net investment income | | (0.06) | | (0.11) | | (0.08) | | (0.12) | | 02 | | (0.09) |
| Net realized gains | | (1.27) | | (0.31) | | (0.43) | | (1.26) | | (1.45) | | 0 |
| |
|
| Total distributions to shareholders | | (1.33) | | (0.42) | | (0.51) | | (1.38) | | (1.45) | | (0.09) |
|
| Net asset value, end of period | | $24.40 | | $26.73 | | $23.37 | | $23.25 | | $20.85 | | $20.02 |
|
| Total return3 | | (4.04%) | | 16.29% | | 2.76% | | 18.77% | | 11.78% | | 8.32% |
|
| Ratios and supplemental data | | | | | | | | | | | | |
| Net assets, end of period (millions) | | $ 577 | | $ 646 | | $ 642 | | $ 794 | | $ 364 | | $ 125 |
| Ratios to average net assets | | | | | | | | | | | | |
| Expenses including waivers/reimbursements but | | | | | | | | | | | | |
| excluding expense reductions | | 1.31%4 | | 1.38% | | 1.38% | | 1.39% | | 1.61% | | 1.70% |
| Expenses excluding waivers/reimbursements and | | | | | | | | | | | | |
| expense reductions | | 1.35%4 | | 1.41% | | 1.40% | | 1.49% | | 1.65% | | 1.70% |
| Net investment income (loss) | | 0.53%4 | | 0.50% | | 0.49% | | 0.62% | | 0.36% | | 0.65% |
| Portfolio turnover rate | | 13% | | 17% | | 21% | | 44% | | 87% | | 72% |
|
1 Net investment income (loss) per share is based on average shares outstanding during the period.
2 Amount represents less than $0.005 per share.
3 Excluding applicable sales charges
4 Annualized
See Notes to Financial Statements
7
FINANCIAL HIGHLIGHTS
(For a share outstanding throughout each period)
| | | Six Months Ended | | Year Ended July 31, |
| | | January 31, 2008 | |
|
| CLASS B | | (unaudited) | | 2007 | | 2006 | | 2005 | | 2004 | | 2003 |
|
| Net asset value, beginning of period | | $24.89 | | $21.87 | | $21.86 | | $19.72 | | $19.14 | | $17.80 |
|
| Income from investment operations | | | | | | | | | | | | |
| Net investment income (loss) | | (0.02)1 | | (0.04)1 | | (0.05)1 | | (0.01)1 | | (0.08)1 | | (0.01)1 |
Net realized and unrealized gains
or losses on investments | | (1.00) | | 3.40 | | 0.49 | | | | 2.11 | | 1.36 |
| |
|
| Total from investment operations | | (1.02) | | 3.36 | | 0.44 | | 3.41 | | 2.03 | | 1.35 |
|
| Distributions to shareholders from | | | | | | | | | | | | |
| Net investment income | | 0 | | (0.03) | | 0 | | (0.01) | | 0 | | (0.01) |
| Net realized gains | | (1.27) | | (0.31) | | (0.43) | | (1.26) | | (1.45) | | 0 |
| |
|
| Total distributions to shareholders | | (1.27) | | (0.34) | | (0.43) | | (1.27) | | (1.45) | | (0.01) |
|
| Net asset value, end of period | | $22.60 | | $24.89 | | $21.87 | | $21.86 | | $19.72 | | $19.14 |
|
| Total return2 | | (4.37%) | | 15.44% | | 2.07% | | 17.93% | | 10.97% | | 7.60% |
|
| Ratios and supplemental data | | | | | | | | | | | | |
| Net assets, end of period (millions) | | $ 114 | | $ 150 | | $ 214 | | $ 340 | | $ 272 | | $ 242 |
| Ratios to average net assets | | | | | | | | | | | | |
| Expenses including waivers/reimbursements but | | | | | | | | | | | | |
| excluding expense reductions | | 2.05%3 | | 2.09% | | 2.07% | | 2.10% | | 2.33% | | 2.43% |
| Expenses excluding waivers/reimbursements and | | | | | | | | | | | | |
| expense reductions | | 2.05%3 | | 2.11% | | 2.09% | | 2.20% | | 2.37% | | 2.43% |
| Net investment income (loss) | | (0.19%)3 | | (0.18%) | | (0.21%) | | (0.03%) | | (0.36%) | | (0.05%) |
| Portfolio turnover rate | | 13% | | 17% | | 21% | | 44% | | 87% | | 72% |
|
1 Net investment income (loss) per share is based on average shares outstanding during the period.2 Excluding applicable sales charges
3 Annualized
See Notes to Financial Statements
8
FINANCIAL HIGHLIGHTS
(For a share outstanding throughout each period)
| | | Six Months Ended | | Year Ended July 31, |
| | | January 31, 2008 | |
|
| CLASS C | | (unaudited) | | 2007 | | 2006 | | 2005 | | 2004 | | 2003 |
|
| Net asset value, beginning of period | | $24.89 | | $21.87 | | $21.86 | | $19.72 | | $19.14 | | $17.81 |
|
| Income from investment operations | | | | | | | | | | | | | | |
| Net investment income (loss) | | | | (0.04) | | (0.05)1 | | (0.05)1 | | 01 | | (0.08)1 | | (0.01)1 |
Net realized and unrealized gains
or losses on investments | | | | (0.97) | | 3.41 | | 0.49 | | 3.42 | | 2.11 | | 1.35 |
| |
|
| Total from investment operations | | | | (1.01) | | 3.36 | | 0.44 | | 3.42 | | 2.03 | | 1.34 |
|
| Distributions to shareholders from | | | | | | | | | | | | | | |
| Net investment income | | | | 0 | | (0.03) | | 0 | | (0.02) | | 0 | | (0.01) |
| Net realized gains | | | | (1.27) | | (0.31) | | (0.43) | | (1.26) | | (1.45) | | 0 |
| |
|
| Total distributions to shareholders | | | | (1.27) | | (0.34) | | (0.43) | | (1.28) | | (1.45) | | (0.01) |
|
| Net asset value, end of period | | $22.61 | | $24.89 | | $21.87 | | $21.86 | | $19.72 | | $19.14 |
|
| Total return2 | | | | (4.38%) | | 15.44% | | 2.07% | | 17.95% | | 10.97% | | 7.54% |
|
| Ratios and supplemental data | | | | | | | | | | | | | | |
| Net assets, end of period (millions) | | $ 70 | | $ 80 | | $ 86 | | $ 110 | | $ 116 | | $ 12 |
| Ratios to average net assets | | | | | | | | | | | | | | |
| Expenses including waivers/reimbursements but | | | | | | | | | | | | | | |
| excluding expense reductions | | | | 2.05%3 | | 2.09% | | 2.08% | | 2.10% | | 2.31% | | 2.43% |
| Expenses excluding waivers/reimbursements and | | | | | | | | | | | | | | |
| expense reductions | | | | 2.05%3 | | 2.11% | | 2.10% | | 2.20% | | 2.35% | | 2.43% |
| Net investment income (loss) | | | | (0.21%)3 | | (0.20%) | | (0.21%) | | (0.01%) | | (0.35%) | | (0.07%) |
| Portfolio turnover rate | | | | 13% | | 17% | | 21% | | 44% | | 87% | | 72% |
|
1 Net investment income (loss) per share is based on average shares outstanding during the period.2 Excluding applicable sales charges
3 Annualized
See Notes to Financial Statements
9
FINANCIAL HIGHLIGHTS
(For a share outstanding throughout each period)
| | | Six Months Ended | | Year Ended July 31, |
| | | January 31, 2008 | |
|
| CLASS I | | (unaudited) | | 2007 | | 2006 | | 2005 | | 2004 | | 2003 |
|
| Net asset value, beginning of period | | $27.21 | | $23.76 | | $23.63 | | $21.16 | | $20.26 | | $18.80 |
|
| Income from investment operations | | | | | | | | | | | | |
| Net investment income (loss) | | 0.10 | | 0.211 | | 0.191 | | 0.201 | | 0.131 | | 0.171 |
Net realized and unrealized gains
or losses on investments | | (1.07) | | 3.70 | | 0.52 | | 3.70 | | 2.25 | | 1.44 |
| |
|
| Total from investment operations | | (0.97) | | 3.91 | | 0.71 | | 3.90 | | 2.38 | | 1.61 |
|
| Distributions to shareholders from | | | | | | | | | | | | |
| Net investment income | | (0.14) | | (0.15) | | (0.15) | | (0.17) | | (0.03) | | (0.15) |
| Net realized gains | | (1.27) | | (0.31) | | (0.43) | | (1.26) | | (1.45) | | 0 |
| |
|
| Total distributions to shareholders | | (1.41) | | (0.46) | | (0.58) | | (1.43) | | (1.48) | | (0.15) |
|
| Net asset value, end of period | | $24.83 | | $27.21 | | $23.76 | | $23.63 | | $21.16 | | $20.26 |
|
| Total return | | (3.87%) | | 16.59% | | 3.08% | | 19.12% | | 12.12% | | 8.64% |
|
| Ratios and supplemental data | | | | | | | | | | | | |
| Net assets, end of period (millions) | | $ 252 | | $ 274 | | $ 263 | | $ 292 | | $ 83 | | $ 93 |
| Ratios to average net assets | | | | | | | | | | | | |
| Expenses including waivers/reimbursements but | | | | | | | | | | | | |
| excluding expense reductions | | 1.05%2 | | 1.09% | | 1.08% | | 1.08% | | 1.33% | | 1.43% |
| Expenses excluding waivers/reimbursements and | | | | | | | | | | | | |
| expense reductions | | 1.05%2 | | 1.11% | | 1.10% | | 1.18% | | 1.37% | | 1.43% |
| Net investment income (loss) | | 0.79%2 | | 0.79% | | 0.80% | | 0.87% | | 0.64% | | 0.94% |
| Portfolio turnover rate | | 13% | | 17% | | 21% | | 44% | | 87% | | 72% |
|
1 Net investment income (loss) per share is based on average shares outstanding during the period.2 Annualized
See Notes to Financial Statements
10
SCHEDULE OF INVESTMENTS
January 31, 2008 (unaudited)
| | | | | | | Shares | | | | Value |
|
| |
| COMMON STOCKS 95.1% | | | | | | | | |
| CONSUMER DISCRETIONARY 7.2% | | | | | | |
| Internet & Catalog Retail 3.7% | | | | | | |
| Amazon.com, Inc. * | | | | | | 450,000 | | $ | | 34,965,000 |
| Blue Nile, Inc. * (p) | | | | | | 41,628 | | | | 2,299,947 |
| |
|
| | | | | | | | | | | 37,264,947 |
| |
|
| Media 1.5% | | | | | | | | | | |
| Omnicom Group, Inc. | | | | | | 334,192 | | | | 15,162,291 |
| |
|
| Textiles, Apparel & Luxury Goods 2.0% | | | | | | |
| Timberland Co., Class A * (p) | | | | 1,254,476 | | | | 20,585,951 |
| |
|
| CONSUMER STAPLES 13.8% | | | | | | | | |
| Beverages 2.6% | | | | | | | | | | |
| Diageo plc | | | | | | 605,131 | | | | 12,173,185 |
| Diageo plc, ADR | | | | | | 44,312 | | | | 3,576,421 |
| PepsiCo, Inc. | | | | | | 146,916 | | | | 10,018,202 |
| |
|
| | | | | | | | | | | 25,767,808 |
| |
|
| Food & Staples Retailing 3.9% | | | | | | |
| CVS Caremark Corp. | | | | | | 566,741 | | | | 22,142,571 |
| Whole Foods Market, Inc. (p) | | | | 451,768 | | | | 17,817,730 |
| |
|
| | | | | | | | | | | 39,960,301 |
| |
|
| Food Products 2.1% | | | | | | | | |
| Kraft Foods, Inc., Class A | | | | 335,810 | | | | 9,825,801 |
| McCormick & Co., Inc. (p) | | | | 335,790 | | | | 11,322,839 |
| |
|
| | | | | | | | | | | 21,148,640 |
| |
|
| Household Products 3.6% | | | | | | | | |
| Clorox Co. | | | | | | 197,777 | | | | 12,127,685 |
| Procter & Gamble Co. | | | | | | 366,607 | | | | 24,177,732 |
| |
|
| | | | | | | | | | | 36,305,417 |
| |
|
| Tobacco 1.6% | | | | | | | | | | |
| Altria Group, Inc. | | | | | | 216,798 | | | | 16,437,624 |
| |
|
| ENERGY 10.0% | | | | | | | | | | |
| Oil, Gas & Consumable Fuels 10.0% | | | | | | |
| Apache Corp. | | | | | | 196,617 | | | | 18,765,127 |
| BP plc, ADR (p) | | | | | | 166,701 | | | | 10,627,189 |
| Chevron Corp. | | | | | | 101,871 | | | | 8,608,100 |
| ConocoPhillips | | | | | | 205,217 | | | | 16,483,029 |
| Exxon Mobil Corp. (p) | | | | | | 540,351 | | | | 46,686,326 |
| |
|
| | | | | | | | | | | 101,169,771 |
| |
|
See Notes to Financial Statements
11
SCHEDULE OF INVESTMENTS continued
January 31, 2008 (unaudited)
| | | | | | | | | Shares | | | | Value |
|
| |
| COMMON STOCKS continued | | | | | | | | |
| FINANCIALS 18.5% | | | | | | | | |
| Capital Markets 5.3% | | | | | | | | |
| Goldman Sachs Group, Inc. | | | | 77,413 | | $ | | 15,542,208 |
| Legg Mason, Inc. (p) | | | | 290,895 | | | | 20,944,440 |
| State Street Corp. (p) | | | | 131,772 | | | | 10,821,117 |
| T. Rowe Price Group, Inc. | | | | 138,597 | | | | 7,011,622 |
| |
|
| | | | | | | | | | | | | 54,319,387 |
| |
|
| Commercial Banks 2.9% | | | | | | | | |
| Wells Fargo & Co. (p) | | | | 865,379 | | | | 29,431,540 |
| |
|
| Consumer Finance 1.1% | | | | | | | | |
| American Express Co. | | | | 217,832 | | | | 10,743,474 |
| |
|
| Diversified Financial Services 5.5% | | | | | | |
| Apollo Global Management, LLC, Class A + | | 463,041 | | | | 7,816,132 |
| Citigroup, Inc. | | | | | | | | 1,046,692 | | | | 29,537,649 |
| JPMorgan Chase & Co. | | | | 387,144 | | | | 18,408,697 |
| |
|
| | | | | | | | | | | | | 55,762,478 |
| |
|
| Insurance 3.7% | | | | | | | | | | |
| American International Group, Inc. | | | | 294,764 | | | | 16,259,182 |
| Marsh & McLennan Cos. | | | | 403,265 | | | | 11,130,114 |
| Prudential Financial, Inc. | | | | 119,938 | | | | 10,119,169 |
| |
|
| | | | | | | | | | | | | 37,508,465 |
| |
|
| HEALTH CARE 13.5% | | | | | | | | |
| Biotechnology 2.9% | | | | | | | | |
| Amgen, Inc. * | | | | | | | | 414,639 | | | | 19,318,031 |
| Biogen Idec, Inc. * | | | | | | | | 160,938 | | | | 9,809,171 |
| |
|
| | | | | | | | | | | | | 29,127,202 |
| |
|
| Health Care Equipment & Supplies 2.7% | | | | | | |
| Baxter International, Inc. | | | | 244,513 | | | | 14,851,720 |
| Medtronic, Inc. | | | | | | | | 275,143 | | | | 12,813,409 |
| |
|
| | | | | | | | | | | | | 27,665,129 |
| |
|
| Health Care Providers & Services 1.1% | | | | | | |
| WellPoint, Inc. * | | | | | | | | 145,037 | | | | 11,341,894 |
| |
|
| Pharmaceuticals 6.8% | | | | | | | | |
| Abbott Laboratories | | | | | | 215,295 | | | | 12,121,108 |
| Bristol-Myers Squibb Co. | | | | 406,307 | | | | 9,422,259 |
| Johnson & Johnson | | | | | | 180,960 | | | | 11,447,530 |
| Novartis AG, ADR | | | | | | | | 283,073 | | | | 14,326,325 |
| Pfizer, Inc. | | | | | | | | 643,857 | | | | 15,059,815 |
| Wyeth | | | | | | | | 162,652 | | | | 6,473,550 |
| |
|
| | | | | | | | | | | | | 68,850,587 |
| |
|
See Notes to Financial Statements
12
SCHEDULE OF INVESTMENTS continued
January 31, 2008 (unaudited)
| | | | | | | | | Shares | | | | Value |
|
| COMMON STOCKS continued | | | | | | | | |
| INDUSTRIALS 8.0% | | | | | | | | | | | | |
| Aerospace & Defense 2.1% | | | | | | | | | | |
| Lockheed Martin Corp. | | | | | | | | 132,834 | | $ | | 14,335,446 |
| United Technologies Corp. | | | | | | | | 99,747 | | | | 7,322,427 |
| |
|
| | | | | | | | | | | | | 21,657,873 |
| |
|
| Air Freight & Logistics 1.7% | | | | | | | | | | |
| Expeditors International of Washington, Inc. (p) | | | | 141,325 | | | | 6,683,259 |
| United Parcel Service, Inc., Class B (p) | | | | 148,708 | | | | 10,879,477 |
| |
|
| | | | | | | | | | | | | 17,562,736 |
| |
|
| Industrial Conglomerates 4.2% | | | | | | | | |
| General Electric Co. | | | | | | | | 1,190,071 | | | | 42,140,414 |
| |
|
| INFORMATION TECHNOLOGY 20.1% | | | | | | | | |
| Communications Equipment 7.5% | | | | | | | | |
| Cisco Systems, Inc. * | | | | | | | | 1,215,331 | | | | 29,775,609 |
| QUALCOMM, Inc. | | | | | | | | 1,086,538 | | | | 46,090,942 |
| |
|
| | | | | | | | | | | | | 75,866,551 |
| |
|
| Computers & Peripherals 0.9% | | | | | | | | |
| Dell, Inc. * (p) | | | | | | | | 478,967 | | | | 9,598,499 |
| |
|
| Internet Software & Services 1.3% | | | | | | | | |
| Google, Inc., Class A * | | | | | | | | 24,126 | | | | 13,614,302 |
| |
|
| IT Services 1.5% | | | | | | | | | | | | |
| Accenture, Ltd., Class A (p) | | | | | | | | 145,011 | | | | 5,020,281 |
| Automatic Data Processing, Inc. | | | | | | 240,440 | | | | 9,754,650 |
| |
|
| | | | | | | | | | | | | 14,774,931 |
| |
|
| Semiconductors & Semiconductor Equipment 3.8% | | | | | | |
| Altera Corp. | | | | | | | | 653,473 | | | | 11,037,159 |
| Intel Corp. | | | | | | | | 775,438 | | | | 16,439,286 |
| Texas Instruments, Inc. | | | | | | | | 348,411 | | | | 10,776,352 |
| |
|
| | | | | | | | | | | | | 38,252,797 |
| |
|
| Software 5.1% | | | | | | | | | | | | |
| Microsoft Corp. | | | | | | | | 692,325 | | | | 22,569,795 |
| Oracle Corp. * | | | | | | | | 1,398,243 | | | | 28,733,894 |
| |
|
| | | | | | | | | | | | | 51,303,689 |
| |
|
| MATERIALS 1.0% | | | | | | | | | | | | |
| Chemicals 1.0% | | | | | | | | | | | | |
| Air Products & Chemicals, Inc. | | | | | | 109,250 | | | | 9,834,685 |
| |
|
| TELECOMMUNICATION SERVICES 2.1% | | | | | | | | |
| Diversified Telecommunication Services 2.1% | | | | | | | | |
| AT&T, Inc. | | | | | | | | 299,099 | | | | 11,512,320 |
| Verizon Communications, Inc. | | | | | | 264,976 | | | | 10,291,668 |
| |
|
| | | | | | | | | | | | | 21,803,988 |
| |
|
See Notes to Financial Statements
13
SCHEDULE OF INVESTMENTS continued
January 31, 2008 (unaudited)
| | | | | | | Shares | | | | Value |
|
| |
| COMMON STOCKS continued | | | | | | |
| UTILITIES 0.9% | | | | | | | | | | |
| Electric Utilities 0.9% | | | | | | | | |
| Exelon Corp. | | | | | | 127,937 | | $ | | 9,747,520 |
| |
|
| Total Common Stocks | | (cost $795,702,157) | | | | | | 964,710,891 |
| | |
|
|
| | | | | | | Principal | | | | |
| | | | | | | Amount | | | | Value |
|
| |
| SHORT-TERM INVESTMENTS 12.9% | | | | | | |
| COMMERCIAL PAPER 0.8% | | | | | | |
| Cheyne Finance, SIV, FRN, 3.17%, 05/19/2008 + (p) (pp) | | $ 10,000,000 | | | | 7,955,368 |
| |
|
| CORPORATE BONDS 0.7% | | | | | | | | |
| Capital Markets 0.1% | | | | | | | | |
| Citigroup Global Markets, Inc., FRN, 3.25%, 02/01/2008 (pp) | | 1,000,000 | | | | 1,000,000 |
| |
|
| Diversified Financial Services 0.6% | | | | | | |
| Natixis Corp., FRN, 3.18%, 02/11/2008 (pp) | | 1,000,000 | | | | 999,986 |
| Sigma Finance, Inc., SIV, FRN, 3.09%, 06/16/2008 + (pp) | | 5,000,000 | | | | 4,962,550 |
| |
|
| | | | | | | | | | | 5,962,536 |
| |
|
| REPURCHASE AGREEMENTS ^ 6.3% | | | | | | |
| ABN Amro, Inc., 3.20%, dated 01/31/2008, maturing 02/01/2008, maturity value | | | | | | |
| $7,000,622 (pp) | | | | | | 7,000,000 | | | | 7,000,000 |
| Banc of America Securities, LLC, 3.20%, dated 01/31/2008, maturing 02/01/2008, | | | | | | |
| maturity value $3,000,267 (pp) | | 3,000,000 | | | | 3,000,000 |
| Bear Stearns Cos., 3.23%, dated 01/31/2008, maturing 02/01/2008, maturity | | | | | | |
| value $8,000,718 (pp) | | | | 8,000,000 | | | | 8,000,000 |
| BNP Paribas SA, 3.21%, dated 01/31/2008, maturing 02/01/2008, maturity | | | | | | |
| value $2,000,178 (pp) | | | | 2,000,000 | | | | 2,000,000 |
| Cantor Fitzgerald & Co., 3.30%, dated 01/31/2008, maturing 02/01/2008, | | | | | | |
| maturity value $4,000,367 (pp) | | 4,000,000 | | | | 4,000,000 |
| Credit Suisse First Boston LLC, 3.21%, dated 01/31/2008, maturing 02/01/2008, | | | | | | |
| maturity value $7,000,624 (pp) | | 7,000,000 | | | | 7,000,000 |
| Deutsche Bank Securities, Inc., 3.21%, dated 01/31/2008, maturing 02/01/2008, | | | | | | |
| maturity value $3,000,268 (pp) | | 3,000,000 | | | | 3,000,000 |
| Dresdner Kleinwort Wasserstein Securities, LLC, 3.21%, dated 01/31/2008, | | | | | | |
| maturing 02/01/2008, maturity value $6,000,535 (pp) | | 6,000,000 | | | | 6,000,000 |
| Greenwich Capital Markets, Inc., 3.21%, dated 01/31/2008, maturing 02/01/2008, | | | | | | |
| maturity value $9,000,803 (pp) | | 9,000,000 | | | | 9,000,000 |
| JPMorgan Securities, Inc., 3.20%, dated 01/31/2008, maturing 02/01/2008, | | | | | | |
| maturity value $10,000,889 (pp) | | 10,000,000 | | | | 10,000,000 |
| Lehman Brothers, Inc., 3.20%, dated 01/31/2008, maturing 02/01/2008, maturity | | | | | | |
| value $2,000,178 (pp) | | | | 2,000,000 | | | | 2,000,000 |
| Merrill Lynch Pierce Fenner & Smith, Inc., 3.20%, dated 01/31/2008, maturing | | | | | | |
| 02/01/2008, maturity value $3,000,267 (pp) | | 3,000,000 | | | | 3,000,000 |
| |
|
| | | | | | | | | | | 64,000,000 |
| |
|
See Notes to Financial Statements
14
SCHEDULE OF INVESTMENTS continued
January 31, 2008 (unaudited)
| | | Shares | | | | Value |
|
| SHORT-TERM INVESTMENTS continued | | | | | | |
| MUTUAL FUND SHARES 5.1% | | | | | | |
| AIM Short-Term Investments Trust Government & Agency Portfolio, Class I, | | | | | | |
| 3.72% q (pp) | | 143,753 | | $ 143,753 |
| Evergreen Institutional U.S. Government Money Market Fund, Class I, 3.46% q ø | | 51,439,914 | | | | 51,439,914 |
| |
|
| | | | | | | 51,583,667 |
| |
|
| Total Short-Term Investments (cost $132,583,150) | | | | | | 130,501,571 |
| |
|
| Total Investments (cost $928,285,307) 108.0% | | | | | | 1,095,212,462 |
| Other Assets and Liabilities (8.0%) | | | | | | (81,347,552) |
| |
|
| Net Assets 100.0% | | | | $ 1,013,864,910 |
| |
|
| * | | Non-income producing security |
| (p) | | All or a portion of this security is on loan. |
| + | | Security is deemed illiquid and is valued using market quotations when readily available, unless otherwise noted. |
| (h) | | Security is valued at fair value as determined by the investment advisor in good faith, according to procedures approved |
| | | by the Board of Trustees. |
| | | Security which has defaulted on payment of interest and/or principal. The Fund has stopped accruing interest on this |
| | | security. |
| (pp) | | All or a portion of this security represents investment of cash collateral received from securities on loan. |
| (v) | | Collateral is pooled with the collateral of other Evergreen funds and allocated on a pro-rata basis into 165 issues of |
| | | high grade short-term securities such that sufficient collateral is applied to the respective repurchase agreement. |
| q | | Rate shown is the 7-day annualized yield at period end. |
| ø | | Evergreen Investment Management Company, LLC is the investment advisor to both the Fund and the money market |
| | | fund. |
Summary of Abbreviations
| ADR | | American Depository Receipt |
| FRN | | Floating Rate Note |
| SIV | | Structural Investment Vehicle |
The following table shows the percent of total long-term investments by sector as of January 31, 2008:
| Information Technology | | 21.1% |
| Financials | | 19.4% |
| Consumer Staples | | 14.5% |
| Health Care | | 14.2% |
| Energy | | 10.5% |
| Industrials | | 8.4% |
| Consumer Discretionary | | 7.6% |
| Telecommunication Services | | 2.3% |
| Materials | | 1.0% |
| Utilities | | 1.0% |
| |
|
| | | 100.0% |
| | |
|
See Notes to Financial Statements
15
STATEMENT OF ASSETS AND LIABILITIES
January 31, 2008 (unaudited)
| Assets | | | | |
| Investments in securities, at value (cost $876,845,393) including $79,326,411 of securities loaned | | $ 1,043,772,548 |
| Investments in affiliated money market fund, at value (cost $51,439,914) | | | | 51,439,914 |
|
| Total investments | | | | 1,095,212,462 |
| Foreign currency, at value (cost $250,013) | | | | 242,751 |
| Receivable for Fund shares sold | | | | 41,149 |
| Dividends receivable | | | | 1,470,939 |
| Receivable for securities lending income | | | | 8,240 |
| Prepaid expenses and other assets | | | | 52,943 |
|
| Total assets | | | | 1,097,028,484 |
|
| Liabilities | | | | |
| Payable for Fund shares redeemed | | | | 1,615,982 |
| Payable for securities on loan | | | | 81,143,236 |
| Advisory fee payable | | | | 1,255 |
| Due to other related parties | | | | 97,814 |
| Accrued expenses and other liabilities | | | | 305,287 |
|
| Total liabilities | | | | 83,163,574 |
|
| Net assets | | $ 1,013,864,910 |
|
| Net assets represented by | | | | |
| Paid-in capital | | $ 999,181,422 |
| Undistributed net investment income | | | | 504,428 |
| Accumulated net realized losses on investments | | | | (152,753,534) |
| Net unrealized gains on investments | | | | 166,932,594 |
|
| Total net assets | | $ 1,013,864,910 |
|
| Net assets consists of | | | | |
| Class A | | $ 577,476,849 |
| Class B | | | | 114,221,882 |
| Class C | | | | 70,466,296 |
| Class I | | | | 251,699,883 |
|
| Total net assets | | $ 1,013,864,910 |
|
| Shares outstanding (unlimited number of shares authorized) | | | | |
| Class A | | | | 23,664,457 |
| Class B | | | | 5,052,966 |
| Class C | | | | 3,116,217 |
| Class I | | | | 10,137,619 |
|
| Net asset value per share | | | | |
| Class A | | $ 24.40 |
| Class A — Offering price (based on sales charge of 5.75%) | | $ 25.89 |
| Class B | | $ 22.60 |
| Class C | | $ 22.61 |
| Class I | | $ 24.83 |
|
See Notes to Financial Statements
16
STATEMENT OF OPERATIONS
Six Months Ended January 31, 2008 (unaudited)
| Investment income | | | | |
| Dividends | | $ | | 9,918,949 |
| Income from affiliate | | | | 499,935 |
| Securities lending | | | | 71,327 |
|
| Total investment income | | | | 10,490,211 |
|
| Expenses | | | | |
| Advisory fee | | | | 3,339,156 |
| Distribution Plan expenses | | | | |
| Class A | | | | 963,569 |
| Class B | | | | 692,213 |
| Class C | | | | 393,691 |
| Administrative services fee | | | | 566,712 |
| Transfer agent fees | | | | 1,751,007 |
| Trustees’ fees and expenses | | | | 8,860 |
| Printing and postage expenses | | | | 102,757 |
| Custodian and accounting fees | | | | 144,970 |
| Registration and filing fees | | | | 27,810 |
| Professional fees | | | | 33,671 |
| Other | | | | 14,095 |
|
| Total expenses | | | | 8,038,511 |
| Less: Expense reductions | | | | (10,676) |
| Expense reimbursements | | | | (122,428) |
|
| Net expenses | | | | 7,905,407 |
|
| Net investment income | | | | 2,584,804 |
|
| Net realized and unrealized gains or losses on investments | | | | |
| Net realized gains on: | | | | |
| Securities | | | | 73,501,685 |
| Foreign currency related transactions | | | | 2,012 |
|
| Net realized gains on investments | | | | 73,503,697 |
| Net change in unrealized gains or losses on investments | | | | (117,050,429) |
|
| Net realized and unrealized gains or losses on investments | | | | (43,546,732) |
|
| Net decrease in net assets resulting from operations | | $ | | (40,961,928) |
|
See Notes to Financial Statements
17
STATEMENTS OF CHANGES IN NET ASSETS
| | | Six Months Ended | | | | |
| | | January 31, 2008 | | Year Ended |
| | | (unaudited) | | July 31, 2007 |
|
| Operations | | | | | | | | |
| Net investment income | | $ | | 2,584,804 | | $ | | 5,019,571 |
| Net realized gains on investments | | | | 73,503,697 | | | | 125,945,445 |
| Net change in unrealized gains or | | | | | | | | |
| losses on investments | | | | (117,050,429) | | | | 52,617,497 |
|
| Net increase (decrease) in net assets | | | | | | | | |
| resulting from operations | | | | (40,961,928) | | | | 183,582,513 |
|
| Distributions to shareholders from | | | | | | | | |
| Net investment income | | | | | | | | |
| Class A | | | | (1,467,433) | | | | (2,907,685) |
| Class B | | | | 0 | | | | (262,630) |
| Class C | | | | 0 | | | | (108,882) |
| Class I | | | | (1,452,772) | | | | (1,638,761) |
| Net realized gains | | | | | | | | |
| Class A | | | | (29,430,678) | | | | (8,042,882) |
| Class B | | | | (6,699,281) | | | | (2,598,259) |
| Class C | | | | (3,865,879) | | | | (1,128,802) |
| Class I | | | | (12,606,057) | | | | (3,320,764) |
|
| Total distributions to shareholders | | | | (55,522,100) | | | | (20,008,665) |
|
| | | Shares | | | | Shares | | |
| Capital share transactions | | | | | | | | |
| Proceeds from shares sold | | | | | | | | |
| Class A | | 215,493 | | 5,778,832 | | 604,429 | | 15,343,614 |
| Class B | | 83,913 | | 2,088,518 | | 225,665 | | 5,380,094 |
| Class C | | 93,684 | | 2,291,386 | | 79,224 | | 1,884,680 |
| Class I | | 244,612 | | 6,582,938 | | 312,634 | | 7,826,337 |
|
| | | | | 16,741,674 | | | | 30,434,725 |
|
| Net asset value of shares issued in | | | | | | | | |
| reinvestment of distributions | | | | | | | | |
| Class A | | 1,127,780 | | 29,320,610 | | 415,400 | | 10,352,616 |
| Class B | | 266,161 | | 6,401,175 | | 117,534 | | 2,744,254 |
| Class C | | 146,188 | | 3,517,293 | | 48,487 | | 1,132,212 |
| Class I | | 482,496 | | 12,793,049 | | 178,741 | | 4,527,922 |
|
| | | | | 52,032,127 | | | | 18,757,004 |
|
| Automatic conversion of Class B | | | | | | | | |
| shares to Class A shares | | | | | | | | |
| Class A | | 528,105 | | 14,153,682 | | 1,806,720 | | 46,010,296 |
| Class B | | (568,630) | | (14,153,682) | | (1,934,007) | | (46,010,296) |
|
| | | | | 0 | | | | 0 |
|
| Payment for shares redeemed | | | | | | | | |
| Class A | | (2,387,871) | | (63,719,028) | | (6,115,489) | | (156,419,145) |
| Class B | | (742,207) | | (18,475,122) | | (2,196,248) | | (52,214,731) |
| Class C | | (327,145) | | (8,114,147) | | (850,377) | | (20,366,917) |
| Class I | | (643,523) | | (17,413,081) | | (1,507,768) | | (39,545,402) |
|
| | | | | (107,721,378) | | | | (268,546,195) |
|
| Net decrease in net assets resulting | | | | | | | | |
| from capital share transactions | | | | (38,947,577) | | | | (219,354,466) |
|
| Total decrease in net assets | | | | (135,431,605) | | | | (55,780,618) |
| Net assets | | | | | | | | |
| Beginning of period | | | | 1,149,296,515 | | | | 1,205,077,133 |
|
| End of period | | $ | | 1,013,864,910 | | $ | | 1,149,296,515 |
|
| Undistributed net investment income | | $ | | 504,428 | | $ | | 839,829 |
|
See Notes to Financial Statements
18
NOTES TO FINANCIAL STATEMENTS (unaudited)
1. ORGANIZATION
Evergreen Fundamental Large Cap Fund (the “Fund”) is a diversified series of Evergreen Equity Trust (the “Trust”), a Delaware statutory trust organized on September 18, 1997. The Trust is an open-end management investment company registered under the Investment Company Act of 1940, as amended (the “1940 Act”).
The Fund offers Class A, Class B, Class C and Class I. Class A shares are sold with a front-end sales charge. However, Class A share investments of $1 million or more are not subject to a front-end sales charge but are subject to a contingent deferred sales charge of 1.00% upon redemption within 18 months. Class B shares are sold without a front-end sales charge but are subject to a contingent deferred sales charge that is payable upon redemption and decreases depending on how long the shares have been held. Class C shares are sold without a front-end sales charge but are subject to a contingent deferred sales charge that is payable upon redemption within one year. Class I shares are sold without a front-end sales charge or contingent deferred sales charge. Each class of shares, except Class I shares, pays an ongoing distribution fee.
2. SIGNIFICANT ACCOUNTING POLICIES
The following is a summary of significant accounting policies consistently followed by the Fund in the preparation of its financial statements. The policies are in conformity with generally accepted accounting principles in the United States of America, which require management to make estimates and assumptions that affect amounts reported herein. Actual results could differ from these estimates.
a. Valuation of investments
Listed equity securities are usually valued at the last sales price or official closing price on the national securities exchange where the securities are principally traded.
Foreign securities traded on an established exchange are valued at the last sales price on the exchange where the security is primarily traded. If there has been no sale, the securities are valued at the mean between bid and asked prices. Foreign securities may be valued at fair value according to procedures approved by the Board of Trustees if the closing price is not reflective of current market values due to trading or events occurring in the foreign markets between the close of the established exchange and the valuation time of the Fund. In addition, substantial changes in values in the U.S. markets subsequent to the close of a foreign market may also affect the values of securities traded in the foreign market. The value of foreign securities may be adjusted if such movements in the U.S. market exceed a specified threshold.
Portfolio debt securities acquired with more than 60 days to maturity are fair valued using matrix pricing methods determined by an independent pricing service which takes into consideration such factors as similar security prices, yields, maturities, liquidity and ratings. Securities for which valuations are not readily available from an independent pricing service may be valued by brokers which use prices provided by market makers or estimates of market value obtained from yield data relating to investments or securities with similar characteristics.
19
NOTES TO FINANCIAL STATEMENTS (unaudited) continued
Short-term securities with remaining maturities of 60 days or less at the time of purchase are valued at amortized cost, which approximates market value.
Investments in open-end mutual funds are valued at net asset value. Securities for which market quotations are not readily available or not reflective of current market value are valued at fair value as determined by the investment advisor in good faith, according to procedures approved by the Board of Trustees.
b. Repurchase agreements
Securities pledged as collateral for repurchase agreements are held by the custodian bank or in a segregated account in the Fund’s name until the agreements mature. Collateral for certain tri-party repurchase agreements is held at the counterparty’s custodian in a segregated account for the benefit of the Fund and the counterparty. Each agreement requires that the market value of the collateral be sufficient to cover payments of interest and principal. However, in the event of default or bankruptcy by the other party to the agreement, retention of the collateral may be subject to legal proceedings. The Fund will enter into repurchase agreements with banks and other financial institutions, which are deemed by the investment advisor to be creditworthy pursuant to guidelines established by the Board of Trustees. In certain instances, the Fund’s securities lending agent may provide collateral in the form of repurchase agreements.
c. Foreign currency translation
All assets and liabilities denominated in foreign currencies are translated into U.S. dollar amounts at the date of valuation. Purchases and sales of portfolio securities and income items denominated in foreign currencies are translated into U.S. dollar amounts on the respective dates of such transactions. The Fund does not separately account for that portion of the results of operations resulting from changes in foreign exchange rates on investments and the fluctuations arising from changes in market prices of securities held. Such fluctuations are included with the net realized and unrealized gains or losses on investments.
d. Securities lending
The Fund may lend its securities to certain qualified brokers in order to earn additional income. The Fund receives compensation in the form of fees or interest earned on the investment of any cash collateral received. The Fund also continues to receive interest and dividends on the securities loaned. The Fund receives collateral in the form of cash or securities with a market value at least equal to the market value of the securities on loan. In the event of default or bankruptcy by the borrower, the Fund could experience delays and costs in recovering the loaned securities or in gaining access to the collateral. The Fund has the right under the lending agreement to recover the securities from the borrower on demand.
e. Security transactions and investment income
Security transactions are recorded on trade date. Realized gains and losses are computed using the specific cost of the security sold. Dividend income is recorded on the ex-dividend date or in the case of some foreign securities, on the date when the Fund is made aware of the dividend.
20
NOTES TO FINANCIAL STATEMENTS (unaudited) continued
f. Federal taxes
The Fund intends to continue to qualify as a regulated investment company and distribute all of its taxable income, including any net capital gains (which have already been offset by available capital loss carryovers). Accordingly, no provision for federal taxes is required.
g. Distributions
Distributions to shareholders from net investment income and net realized gains, if any, are recorded on the ex-dividend date. Such distributions are determined in conformity with income tax regulations, which may differ from generally accepted accounting principles.
h. Class allocations
Income, common expenses and realized and unrealized gains and losses are allocated to the classes based on the relative net assets of each class. Distribution fees, if any, are calculated daily at the class level based on the appropriate net assets of each class and the specific expense rates applicable to each class.
3. ADVISORY FEE AND OTHER TRANSACTIONS WITH AFFILIATES
Evergreen Investment Management Company, LLC (“EIMC”), an indirect, wholly-owned subsidiary of Wachovia Corporation (“Wachovia”), is the investment advisor to the Fund and is paid an annual fee starting at 0.70% and declining to 0.50% as the aggregate average daily net assets of the Fund and its variable annuity counterpart, Evergreen VA Fundamental Large Cap Fund, increase. For the six months ended January 31, 2008, the advisory fee was equivalent to 0.59% of the Fund’s average daily net assets (on an annualized basis).
From time to time, EIMC may voluntarily or contractually waive its fee and/or reimburse expenses in order to limit operating expenses. During the six months ended January 31, 2008, EIMC voluntarily reimbursed Distribution Plan expenses (see Note 4) relating to Class A shares in the amount of $122,428.
The Fund may invest in money market funds which are advised by EIMC. Income earned on these investments is included in income from affiliate on the Statement of Operations.
Effective January 1, 2008, EIMC replaced Evergreen Investment Services, Inc. (“EIS”), an indirect, wholly-owned subsidiary of Wachovia, as the administrator to the Fund upon the assignment of the Fund’s Administrative Services Agreement from EIS to EIMC. There were no changes to the services being provided or fees being paid by the Fund. The administrator provides the Fund with facilities, equipment and personnel and is paid an annual rate determined by applying percentage rates to the aggregate average daily net assets of the Evergreen funds (excluding money market funds and Evergreen Institutional Enhanced Income Fund), starting at 0.10% and declining to 0.05% as the aggregate average daily net assets of the Evergreen funds (excluding money market funds and Evergreen Institutional Enhanced Income Fund) increase.
Evergreen Service Company, LLC (“ESC”), an indirect, wholly-owned subsidiary of Wachovia, is the transfer and dividend disbursing agent for the Fund. ESC receives account fees that vary based on the type of account held by the shareholders in the Fund. For the six months ended
21
NOTES TO FINANCIAL STATEMENTS (unaudited) continued
January 31, 2008, the transfer agent fees were equivalent to an annual rate of 0.31% of the Fund’s average daily net assets.
Wachovia Bank NA, through its securities lending division of Wachovia Global Securities Lending, acts as the securities lending agent for the Fund.
The Fund has placed a portion of its portfolio transactions with brokerage firms that are affiliates of Wachovia. During the six months ended January 31, 2008, the Fund paid brokerage commissions of $129,367 to Wachovia Securities, LLC.
4. DISTRIBUTION PLANS
EIS serves as distributor of the Fund’s shares. The Fund has adopted Distribution Plans, as allowed by Rule 12b-1 of the 1940 Act, for each class of shares, except Class I. Under the Distribution Plans, distribution fees are paid at an annual rate of 0.30% of the average daily net assets for Class A shares and 1.00% of the average daily net assets for each of Class B and Class C shares.
For the six months ended January 31, 2008, EIS received $5,727 from the sale of Class A shares and $62, $95,293 and $503 in contingent deferred sales charges from redemptions of Class A, Class B and Class C shares, respectively.
5. INVESTMENT TRANSACTIONS
Cost of purchases and proceeds from sales of investment securities (excluding short-term securities) were $143,153,028 and $280,088,367, respectively, for the six months ended January 31, 2008.
During the six months ended January 31, 2008, the Fund loaned securities to certain brokers. At January 31, 2008, the amount of securities on loan and the total amount of collateral received for securities loaned amounted to $79,326,411 and $81,143,236, respectively.
On January 31, 2008, the aggregate cost of securities for federal income tax purposes was $930,466,268. The gross unrealized appreciation and depreciation on securities based on tax cost was $205,551,078 and $40,804,884, respectively, with a net unrealized appreciation of $164,746,194.
As of July 31, 2007, the Fund had $172,604,038 in capital loss carryovers for federal income tax purposes with $17,394,863 expiring in 2009, $152,625,222 expiring in 2010 and $2,583,953 expiring in 2011.
These losses are subject to certain limitations prescribed by the Internal Revenue Code. Utilization of these capital loss carryovers was limited during the year ended July 31, 2007 in accordance with income tax regulations.
6. INTERFUND LENDING
Pursuant to an Exemptive Order issued by the SEC, the Fund may participate in an interfund lending program with certain funds in the Evergreen fund family. This program allows the Fund
22
NOTES TO FINANCIAL STATEMENTS (unaudited) continued
to borrow from, or lend money to, other participating funds. During the six months ended January 31, 2008, the Fund did not participate in the interfund lending program.
7. EXPENSE REDUCTIONS
Through expense offset arrangements with ESC and the Fund’s custodian, a portion of fund expenses has been reduced.
8. DEFERRED TRUSTEES’ FEES
Each Trustee of the Fund may defer any or all compensation related to performance of his or her duties as a Trustee. The Trustees’ deferred balances are allocated to deferral accounts, which are included in the accrued expenses for the Fund. The investment performance of the deferral accounts is based on the investment performance of certain Evergreen funds. Any gains earned or losses incurred in the deferral accounts are reported in the Fund’s Trustees’ fees and expenses. At the election of the Trustees, the deferral account will be paid either in one lump sum or in quarterly installments for up to ten years.
9. FINANCING AGREEMENT
The Fund and certain other Evergreen funds share in an unsecured revolving credit commitment for temporary and emergency purposes, including the funding of redemptions, as permitted by each participating fund’s borrowing restrictions. Borrowings under this facility bear interest at 0.50% per annum above the Federal Funds rate. All of the participating funds are charged an annual commitment fee on the unused balance, which is allocated pro rata. The credit facility is for $100 million with an annual commitment fee of 0.08% . During the six months ended January 31, 2008, the Fund had no borrowings.
10. REGULATORY MATTERS AND LEGAL PROCEEDINGS
Pursuant to an administrative order issued by the SEC on September 19, 2007, EIMC, EIS, ESC (collectively, the “Evergreen Entities”), Wachovia Securities, LLC and the SEC have entered into an agreement settling allegations of (i) improper short-term trading arrangements in effect prior to May 2003 involving former officers and employees of EIMC and certain broker-dealers, (ii) insufficient systems for monitoring exchanges and enforcing exchange limitations as stated in certain funds’ prospectuses, and (iii) inadequate e-mail retention practices. Under the settlement, the Evergreen Entities were censured and paid approximately $32 million in disgorgement and penalties. This amount, along with a fine assessed by the SEC against Wachovia Securities, LLC will be distributed pursuant to a plan to be developed by an independent distribution consultant and approved by the SEC. The Evergreen Entities neither admitted nor denied the allegations and findings set forth in its settlement with the SEC.
In addition, the Evergreen funds and EIMC and certain of its affiliates are involved in various legal actions, including private litigation and class action lawsuits. EIMC does not expect that any of such legal actions currently pending or threatened will have a material adverse impact on the financial position or operations of any of the Evergreen funds or on EIMC’s ability to provide services to the Evergreen funds.
23
NOTES TO FINANCIAL STATEMENTS (unaudited) continued
Although EIMC believes that none of the matters discussed above will have a material adverse impact on the Evergreen funds, there can be no assurance that these matters and any publicity surrounding or resulting from them will not result in reduced sales or increased redemptions of Evergreen fund shares, which could increase Evergreen fund transaction costs or operating expenses, or that they will not have other adverse consequences on the Evergreen funds.
11. NEW ACCOUNTING PRONOUNCEMENTS
In June 2006, the Financial Accounting Standards Board (“FASB”) issued FASB Interpretation No. 48, Accounting for Uncertainty in Income Taxes — an interpretation of FASB statement 109 (“FIN 48”). FIN 48 supplements FASB 109 by prescribing a recognition threshold and measurement attribute for the financial statement recognition and measurement of a tax position taken or expected to be taken in a tax return. The Fund’s financial statements have not been impacted by the adoption of FIN 48. However, the conclusions regarding FIN 48 may be subject to review and adjustment at a later date based on factors including, but not limited to, further implementation guidance expected from FASB, and on-going analysis of tax laws, regulations, and interpretations thereof.
In September 2006, FASB issued Statement of Financial Accounting Standards No. 157, Fair Value Measurements (“FAS 157”). FAS 157 establishes a single authoritative definition of fair value, establishes a framework for measuring fair value and expands disclosures about fair value measurements. FAS 157 applies to fair value measurements already required or permitted by existing standards. The change to current generally accepted accounting principles from the application of FAS 157 relates to the definition of fair value, the methods used to measure fair value, and the expanded disclosures about fair value measurements. Management of the Fund does not believe the adoption of FAS 157 will materially impact the financial statement amounts, however, additional disclosures may be required about the inputs used to develop the measurements and the effect of certain of the measurements on changes in net assets for the period. FAS 157 is effective for financial statements issued for fiscal years beginning after November 15, 2007 and interim periods within those fiscal years.
12. SUBSEQUENT DISTRIBUTION
On March 13, 2008, the Fund declared distributions from net investment income to shareholders of record on March 12, 2008. The per share amounts payable on March 14, 2008 were as follows:
| | | Net |
| | | Investment |
| | | Income |
|
| Class A | | $ 0.0555 |
| Class B | | 0.0073 |
| Class C | | 0.0112 |
| Class I | | 0.0732 |
|
These distributions are not reflected in the accompanying financial statements.24
ADDITIONAL INFORMATION (unaudited)
INFORMATION ABOUT THE REVIEW AND APPROVAL OF THE FUND’S INVESTMENT ADVISORY AGREEMENT
Each year, the Fund’s Board of Trustees is required to consider whether to continue in place the Fund’s investment advisory agreement. In September 2007, the Trustees, including a majority of the Trustees who are not interested persons (as that term is defined in the 1940 Act) of the Fund or of EIMC, approved the continuation of the Fund’s investment advisory agreement. (References below to the “Fund” are to Evergreen Fundamental Large Cap Fund; references to the “funds” are to the Evergreen funds generally.)
At the same time, the Trustees considered the continuation of the investment advisory agreements for all of the funds, and the description below refers in many cases to the Trustees’ process and conclusions in connection with their consideration of this matter for all of the funds. (See “Certain Fund-Specific Considerations” below for a discussion regarding certain factors considered by the Trustees relating specifically to the Fund.) In all of its deliberations, the Board of Trustees and the disinterested Trustees were advised by independent counsel to the disinterested Trustees and counsel to the funds.
The review process. The 1940 Act requires that the Board of Trustees request and evaluate, and that EIMC and any sub-advisors furnish, such information as may reasonably be necessary to evaluate the terms of a fund’s advisory agreement. The review process began at the time of the last advisory contract-renewal process in September 2006. In the course of that process, the Trustees identified a number of funds that had experienced either short-term or longer-term performance issues. During the following months, the Trustees reviewed information relating to any changes in the performance of those funds and/or any changes in the investment process or the investment teams responsible for the management of the funds. In addition, during the course of the year, the Trustees reviewed information regarding the investment performance of all of the funds and identified additional funds that they believed warranted further attention based on performance since September 2006.
In spring 2007, a committee of the Board of Trustees (the “Committee”), working with EIMC management, determined generally the types of information the Board would review and set a timeline detailing the information required and the dates for its delivery to the Trustees. The independent data provider Keil Fiduciary Strategies LLC (“Keil”) was engaged to provide fund-specific and industry-wide data to the Board containing information of a nature and in a format generally prescribed by the Committee, and the Committee worked with Keil and EIMC to develop appropriate groups of peer funds for each fund. The Committee also identified a number of expense, performance, and other issues and requested specific information as to those issues.
The Trustees reviewed, with the assistance of an independent industry consultant retained by the disinterested Trustees, the information provided by EIMC in response to the Committee’s requests and the information provided by Keil. The Trustees formed small committees to review individual funds in greater detail. In addition, the Trustees requested information regarding, among other things, brokerage practices of the funds, the use of derivatives by the funds, strategic
25
ADDITIONAL INFORMATION (unaudited) continued
planning for the funds, analyst and research support available to the portfolio management teams, and information regarding the various fall-out benefits received directly and indirectly by EIMC and its affiliates from the funds. The Trustees requested and received additional information following that review.
The Committee met several times by telephone to consider the information provided by EIMC. The Committee met with representatives of EIMC in early September. At a meeting of the full Board of Trustees later in September, the Committee reported the results of its discussions with EIMC, and the full Board met with representatives of EIMC, engaged in further review of the materials provided to them, and approved the continuation of each of the advisory and sub-advisory agreements.
The disinterested Trustees discussed the continuation of the funds’ advisory agreements with representatives of EIMC and in multiple private sessions with legal counsel at which no personnel of EIMC were present. In considering the continuation of the agreement, the Trustees did not identify any particular information or consideration that was all-important or controlling, and each Trustee attributed different weights to various factors. The Trustees evaluated information provided to them both in terms of the Evergreen mutual funds generally and with respect to each fund, including the Fund, specifically as they considered appropriate; although the Trustees considered the continuation of the agreement as part of the larger process of considering the continuation of the advisory contracts for all of the funds, their determination to continue the advisory agreement for each of the funds was ultimately made on a fund-by-fund basis.
This summary describes a number of the most important, but not necessarily all, of the factors considered by the Board and the disinterested Trustees.
Information reviewed. The Board of Trustees and committees of the Board of Trustees meet periodically during the course of the year. At those meetings, the Board receives a wide variety of information regarding the services performed by EIMC, the investment performance of the funds, and other aspects of the business and operations of the funds. At those meetings, and in the process of considering the continuation of the agreements, the Trustees considered information regarding, for example, the funds’ investment results; the portfolio management teams for the funds and the experience of the members of those teams, and any recent changes in the membership of the teams; portfolio trading practices; compliance by the funds and EIMC with applicable laws and regulations and with the funds’ and EIMC’s compliance policies and procedures; risk evaluation and oversight procedures at EIMC; services provided by affiliates of EIMC to the funds and shareholders of the funds; and other information relating to the nature, extent, and quality of services provided by EIMC. The Trustees considered a number of changes in portfolio management personnel at EIMC and its advisory affiliates in the year since September 2006, and recent changes in compliance personnel at EIMC, including the appointment of a new Chief Compliance Officer for the funds.
The Trustees considered the rates at which the funds pay investment advisory fees, and the efforts generally by EIMC and its affiliates as sponsors of the funds. The data provided by Keil showed
26
ADDITIONAL INFORMATION (unaudited) continued
the management fees paid by each fund in comparison to the management fees of other peer mutual funds, in addition to data regarding the investment performance of the funds in comparison to other peer mutual funds. The Trustees were assisted by the independent industry consultant in reviewing the information presented to them.
The Trustees considered the transfer agency fees paid by the funds to an affiliate of EIMC. They reviewed information presented to them showing that the transfer agency fees charged to the funds were generally consistent with industry norms.
The Trustees also considered that EIS, an affiliate of EIMC, serves as administrator to the funds and receives a fee for its services as administrator. In their comparison of the advisory fee paid by the funds with those paid by other mutual funds, the Trustees took into account administrative fees paid by the funds and those other mutual funds. The Board considered that EIS serves as distributor to the funds generally and receives fees from the funds for those services. They considered other so-called “fall-out” benefits to EIMC and its affiliates due to their other relationships with the funds, including, for example, soft-dollar services received by EIMC attributable to transactions entered into by EIMC for the benefit of the funds and brokerage commissions received by Wachovia Securities, LLC, an affiliate of EIMC, from transactions effected by it for the funds. The Trustees also noted that the funds pay sub-transfer agency fees to various financial institutions who hold fund shares in omnibus accounts, and that Wachovia Securities, LLC and its affiliates receive such payments from the funds in respect of client accounts they hold in omnibus arrangements, and that an affiliate of EIMC receives fees for administering the sub-transfer agency payment program. They also considered that Wachovia Securities, LLC and its affiliates receive distribution-related fees and shareholder servicing payments (including amounts derived from payments under the funds’ Rule 12b-1 plans) in respect of shares sold or held through it. The Trustees also noted that an affiliate of EIMC receives compensation for serving as a securities lending agent for the funds.
Nature and quality of the services provided. The Trustees considered that EIMC and its affili-ates generally provide a comprehensive investment management service to the funds. They noted that EIMC makes its personnel available to serve as officers of the funds, and concluded that the reporting and management functions provided by EIMC with respect to the funds were generally satisfactory. The Trustees considered the investment philosophy of the Fund’s portfolio management team, and considered the in-house research capabilities of EIMC and its affiliates, as well as other resources available to EIMC, including research services available to it from third parties. The Board considered the managerial and financial resources available to EIMC and its affiliates, and the commitment that the Wachovia organization has made to the funds generally. On the basis of these factors, they determined that the nature and scope of the services provided by EIMC were consistent with its duties under the investment advisory agreements and appropriate and consistent with the investment programs and best interests of the funds.
The Trustees noted the resources EIMC and its affiliates have committed to the regulatory, compliance, accounting, tax and oversight of tax reporting, and shareholder servicing functions, and the number and quality of staff committed to those functions, which they concluded were
27
ADDITIONAL INFORMATION (unaudited) continued
appropriate and generally in line with EIMC’s responsibilities to the Fund and to the funds generally. The Board and the disinterested Trustees concluded, within the context of their overall conclusions regarding the funds’ advisory agreements, that they were generally satisfied with the nature, extent, and quality of the services provided by EIMC, including services provided by EIS under its administrative services agreements with the funds.
Investment performance. The Trustees considered the investment performance of each fund, both by comparison to other comparable mutual funds and to broad market indices. The Trustees emphasized that the continuation of the investment advisory agreement for a fund should not be taken as any indication that the Trustees did not believe investment performance for any specific fund might not be improved, and they noted that they would continue to monitor closely the investment performance of the funds going forward.
Advisory and administrative fees. The Trustees recognized that EIMC does not seek to provide the lowest cost investment advisory service, but to provide a high quality, full-service investment management product at a reasonable price. They also noted that EIMC has in many cases sought to set its investment advisory fees at levels consistent with industry norms. The Trustees noted that, in certain cases, a fund’s management fees were higher than many or most other mutual funds in the same Keil peer group. However, in each case, the Trustees determined on the basis of the information presented that the level of management fees was not excessive.
Certain Fund-specific considerations. The Trustees noted that, for the one- and ten-year periods ended December 31, 2006, the Fund’s Class A shares had underperformed the Fund’s benchmark index, the S&P 500 Index, and a majority of the mutual funds against which the Trustees compared the Fund’s performance. The Trustees noted that, for the three-year period ended December 31, 2006, the Fund’s Class A shares had underperformed the Fund’s benchmark index and performed in the third quintile of the mutual funds against which the Trustees compared the Fund’s performance. The Trustees noted that, for the five-year period ended December 31, 2006, the Fund’s Class A shares had outperformed the Fund’s benchmark index and a majority of the mutual funds against which the Trustees compared the Fund’s performance. The Trustees considered that the Fund had recently underperformed but that the Fund had a favorable performance record for longer periods and that EIMC remained confident in the Fund’s investment approach and investment management team.
The Trustees noted that the management fee paid by the Fund was near but higher than the average management fee of the other mutual funds against which the Trustees compared the Fund’s management fee and that the level of profitability realized by EIMC in respect of the fee did not appear excessive.
The Trustees considered the investment performance of other accounts managed by EIMC and its affiliates to which EIMC or its affiliates provide advisory services that are comparable to the advisory services they provide to the Fund and concluded that the performance of those accounts did not reflect any substantial difference in the quality of the service provided by EIMC and its affiliates to those accounts.
28
ADDITIONAL INFORMATION (unaudited) continued
Economies of scale. The Trustees noted that economies of scale would likely be achieved by EIMC in managing the funds as the funds grow. The Trustees noted that the Fund had implemented breakpoints in its advisory fee structure. The Trustees noted that they would continue to review the appropriate levels of breakpoints in the future, but concluded that the breakpoints as implemented appeared to be a reasonable step toward the realization of economies of scale by the Fund.
Profitability. The Trustees considered information provided to them regarding the profitability to the EIMC organization of the investment advisory, administration, and transfer agency (with respect to the open-end funds only) fees paid to EIMC and its affiliates by each of the funds. They considered that the information provided to them was necessarily estimated, and that the profitability information provided to them, especially on a fund-by-fund basis, did not necessarily provide a definitive tool for evaluating the appropriateness of each fund’s advisory fee. They noted that the levels of profitability of the funds to EIMC varied widely, depending on among other things the size and type of fund. They considered the profitability of the funds in light of such factors as, for example, the information they had received regarding the relation of the fees paid by the funds to those paid by other mutual funds, the investment performance of the funds, and the amount of revenues involved. In light of these factors, the Trustees concluded that the profitability of any of the funds, individually or in the aggregate, should not prevent the Trustees from approving the continuation of the agreements.
29
This page left intentionally blank
30
This page left intentionally blank
31
TRUSTEES AND OFFICERS
| TRUSTEES1 | | |
| Charles A. Austin III | | Investment Counselor, Anchor Capital Advisors, LLC. (investment advice); Director, The Andover |
| Trustee | | Companies (insurance); Trustee, Arthritis Foundation of New England; Former Director, The |
| DOB: 10/23/1934 | | Francis Ouimet Society (scholarship program); Former Director, Executive Vice President and |
| Term of office since: 1991 | | Treasurer, State Street Research & Management Company (investment advice) |
| Other directorships: None | | |
|
| K. Dun Gifford | | Chairman and President, Oldways Preservation and Exchange Trust (education); Trustee, |
| Trustee | | Chairman of the Finance Committee, Member of the Executive Committee, and Former |
| DOB: 10/23/1938 | | Treasurer, Cambridge College |
| Term of office since: 1974 | | |
| Other directorships: None | | |
|
| Dr. Leroy Keith, Jr. | | Managing Director, Almanac Capital Management (commodities firm); Trustee, Phoenix |
| Trustee | | Fund Complex; Director, Diversapack Co. (packaging company); Former Partner, Stonington |
| DOB: 2/14/1939 | | Partners, Inc. (private equity fund); Former Director, Obagi Medical Products Co.; Former |
| Term of office since: 1983 | | Director, Lincoln Educational Services |
| Other directorships: Trustee, | | |
| Phoenix Fund Complex (consisting | | |
| of 53 portfolios as of 12/31/2007) | | |
|
| Carol A. Kosel1 | | Former Consultant to the Evergreen Boards of Trustees; Former Vice President and Senior Vice |
| Trustee | | President, Evergreen Investments, Inc.; Former Treasurer, Evergreen Funds; Former Treasurer, |
| DOB: 12/25/1963 | | Vestaur Securities Fund |
| Term of office since: 2008 | | |
| Other directorships: None | | |
|
| Gerald M. McDonnell | | Former Manager of Commercial Operations, CMC Steel (steel producer) |
| Trustee | | |
| DOB: 7/14/1939 | | |
| Term of office since: 1988 | | |
| Other directorships: None | | |
|
| Patricia B. Norris | | President and Director of Buckleys of Kezar Lake, Inc. (real estate company); Former President |
| Trustee | | and Director of Phillips Pond Homes Association (home community); Former Partner, |
| DOB: 4/9/1948 | | PricewaterhouseCoopers, LLP (independent registered public accounting firm) |
| Term of office since: 2006 | | |
| Other directorships: None | | |
|
| William Walt Pettit | | Partner and Vice President, Kellam & Pettit, P.A. (law firm); Director, Superior Packaging Corp. |
| Trustee | | (packaging company); Member, Superior Land, LLC (real estate holding company), Member, |
| DOB: 8/26/1955 | | K&P Development, LLC (real estate development); Former Director, National Kidney Foundation |
| Term of office since: 1988 | | of North Carolina, Inc. (non-profit organization) |
| Other directorships: None | | |
|
| David M. Richardson | | President, Richardson, Runden LLC (executive recruitment advisory services); Director, J&M |
| Trustee | | Cumming Paper Co. (paper merchandising); Trustee, NDI Technologies, LLP (communications); |
| DOB: 9/19/1941 | | Former Consultant, AESC (The Association of Executive Search Consultants) |
| Term of office since: 1982 | | |
| Other directorships: None | | |
|
| Dr. Russell A. Salton III | | President/CEO, AccessOne MedCard, Inc. |
| Trustee | | |
| DOB: 6/2/1947 | | |
| Term of office since: 1984 | | |
| Other directorships: None | | |
|
32
TRUSTEES AND OFFICERS continued
| Michael S. Scofield | | Retired Attorney, Law Offices of Michael S. Scofield; Former Director and Chairman, Branded |
| Trustee | | Media Corporation (multi-media branding company) |
| DOB: 2/20/1943 | | |
| Term of office since: 1984 | | |
| Other directorships: None | | |
|
| Richard J. Shima | | Independent Consultant; Director, Hartford Hospital; Trustee, Greater Hartford YMCA; Former |
| Trustee | | Director, Trust Company of CT; Former Director, Old State House Association; Former Trustee, |
| DOB: 8/11/1939 | | Saint Joseph College (CT) |
| Term of office since: 1993 | | |
| Other directorships: None | | |
|
| Richard K. Wagoner, CFA2 | | Member and Former President, North Carolina Securities Traders Association; Member, Financial |
| Trustee | | Analysts Society |
| DOB: 12/12/1937 | | |
| Term of office since: 1999 | | |
| Other directorships: None | | |
|
| OFFICERS |
| Dennis H. Ferro3 | | Principal occupations: President and Chief Executive Officer, Evergreen Investment Company, |
| President | | Inc. and Executive Vice President, Wachovia Bank, N.A.; former Chief Investment Officer, |
| DOB: 6/20/1945 | | Evergreen Investment Company, Inc. |
| Term of office since: 2003 | | |
|
| Jeremy DePalma4 | | Principal occupations: Senior Vice President, Evergreen Investment Management Company, LLC; |
| Treasurer | | Former Vice President, Evergreen Investment Services, Inc.; Former Assistant Vice President, |
| DOB: 2/5/1974 | | Evergreen Investment Services, Inc. |
| Term of office since: 2005 | | |
|
| Michael H. Koonce4 | | Principal occupations: Senior Vice President and General Counsel, Evergreen Investment |
| Secretary | | Services, Inc.; Secretary, Senior Vice President and General Counsel, Evergreen Investment |
| DOB: 4/20/1960 | | Management Company, LLC and Evergreen Service Company, LLC; Senior Vice President and |
| Term of office since: 2000 | | Assistant General Counsel, Wachovia Corporation |
|
| Robert Guerin4 | | Principal occupations: Chief Compliance Officer, Evergreen Funds and Senior Vice President of |
| Chief Compliance Officer | | Evergreen Investments Co, Inc; Former Managing Director and Senior Compliance Officer, |
| DOB: 9/20/1965 | | Babson Capital Management LLC; Former Principal and Director, Compliance and Risk |
| Term of office since: 2007 | | Management, State Street Global Advisors; Former Vice President and Manager, Sales Practice |
| | | Compliance, Deutsche Asset Management. |
|
| 1 Each Trustee, except Mses. Kosel and Norris, serves until a successor is duly elected or qualified or until his or her death, resignation, |
| retirement or removal from office. As new Trustees, Ms. Kosel’s and Ms. Norris’ initial terms end December 31, 2010 and June 30, |
| 2009, respectively, at which times they may be re-elected by Trustees to serve until a successor is duly elected or qualified or until her |
| death, resignation, retirement or removal from office by the Trustees. Each Trustee, except Ms. Kosel, oversaw 93 Evergreen funds as of |
| December 31, 2007. Ms. Kosel became a Trustee on January 1, 2008. Correspondence for each Trustee may be sent to Evergreen |
| Board of Trustees, P.O. Box 20083, Charlotte, NC 28202. |
| 2 Mr. Wagoner is an “interested person” of the Fund because of his ownership of shares in Wachovia Corporation, the parent to the |
| Fund’s investment advisor. |
| 3 The address of the Officer is 401 S. Tryon Street, 20th Floor, Charlotte, NC 28288. |
| 4 The address of the Officer is 200 Berkeley Street, Boston, MA 02116. |
Additional information about the Fund’s Board of Trustees and Officers can be found in the Statement of Additional Information (SAI) and is available upon request without charge by calling 800.343.2898.
33
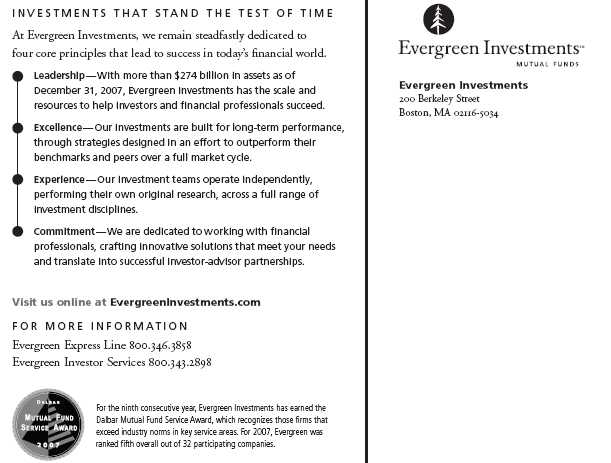
565221 rv5 03/2008
Evergreen Fundamental Mid Cap Value Fund

| | | table of contents |
| 1 | | LETTER TO SHAREHOLDERS |
| 4 | | FUND AT A GLANCE |
| 6 | | ABOUT YOUR FUND’S EXPENSES |
| 7 | | FINANCIAL HIGHLIGHTS |
| 11 | | SCHEDULE OF INVESTMENTS |
| 15 | | STATEMENT OF ASSETS AND LIABILITIES |
| 16 | | STATEMENT OF OPERATIONS |
| 17 | | STATEMENT OF CHANGES IN NET ASSETS |
| 18 | | NOTES TO FINANCIAL STATEMENTS |
| 22 | | ADDITIONAL INFORMATION |
| 24 | | TRUSTEES AND OFFICERS |
This semiannual report must be preceded or accompanied by a prospectus of the Evergreen fund contained herein. The prospectus contains more complete information, including fees and expenses, and should be read carefully before investing or sending money.
The fund will file its complete schedule of portfolio holdings with the SEC for the first and third quarters of each fiscal year on Form N-Q. The fund’s Form N-Q will be available on the SEC’s Web site at http://www.sec.gov. In addition, the fund’s Form N-Q may be reviewed and copied at the SEC’s Public Reference Room in Washington, D.C. Information on the operation of the Public Reference Room may be obtained by calling 800.SEC.0330.
A description of the fund’s proxy voting policies and procedures, as well as information regarding how the fund voted proxies relating to portfolio securities during the most recent 12-month period ended June 30, is available by visiting our Web site at EvergreenInvestments.com or by visiting the SEC’s Web site at http://www.sec.gov. The fund’s proxy voting policies and procedures are also available without charge, upon request, by calling 800.343.2898.
| Mutual Funds: | | | | |
| NOT FDIC INSURED | | MAY LOSE VALUE | | NOT BANK GUARANTEED |
Evergreen InvestmentsSM is a service mark of Evergreen Investment Management Company, LLC. Copyright 2008, Evergreen Investment Management Company, LLC.
Evergreen Investment Management Company, LLC is a subsidiary of Wachovia Corporation and is an affiliate of Wachovia Corporation’s other Broker Dealer subsidiaries.
Evergreen mutual funds are distributed by Evergreen Investment Services, Inc. 200 Berkeley Street, Boston, MA 02116
LETTER TO SHAREHOLDERS
March 2008

Dennis H. Ferro
President and Chief
Executive Officer
Dear Shareholder:
We are pleased to provide the Semiannual Report for Evergreen Fundamental Mid Cap Value Fund, covering the period from September 28, 2007 through January 31, 2008.
Investors in the domestic equity market faced challenging and increasingly stormy conditions over the six-month period ended January 31, 2008. Problems in the housing and subprime mortgage markets led to a tightening of credit, which in turn contributed to widening fears of a dramatic deceleration in the economy’s expansion. As the economy weakened, equity prices generally declined across companies of all sizes. Large cap stocks held up somewhat better than mid cap and small cap shares, while growth stocks outperformed more economically sensitive value stocks. Fixed income investors, meanwhile, sought out the highest-quality securities and attempted to avoid credit risk. Longer-maturity Treasuries outperformed other sectors, while the prices of corporate bonds and many asset-backed securities fell as the yield spreads between Treasuries and lower-rated securities widened. In this environment, the price of gold surged while the dollar remained weak.
The U.S. economy exhibited increasing signs of weakness in the latter half of 2007 and the first month of 2008 after experiencing solid growth early in 2007. Although housing and credit-related concerns began weighing on investor sentiment early in the year, the economy’s growth trajectory continued to be supported early in 2007 by the combination of solid trends in employment, income, investment and export trends. That began to change in the latter months of 2007, however, as each of these pillars of support began to weaken.
1
LETTER TO SHAREHOLDERS continued
Growth in Gross Domestic Product rose by just 0.6% during the final quarter of 2007 as economic output slowed because of a sharp reduction in business inventories. The rate of corporate earnings growth, meanwhile, declined over the second half of 2007. Payrolls dropped by 17,000 in January 2008, contributing to growing concerns about the outlook for consumer spending, which accounts for up to 70% of economic output. Faced with growing evidence of the economy’s deceleration, the Federal Reserve Board (the “Fed”) began to focus more on stimulating growth and less on watching inflation. The Fed cut the target fed funds rate from 5.25% to 4.25% during the last four months of 2007 and then slashed the rate by an additional 1.25% in two separate actions within just eight days of each other in January 2008. Also in early 2008, Congress passed, and President Bush signed, a $168 billion fiscal stimulus bill that contained rebates for taxpayers, tax breaks for businesses and additional assistance for Social Security recipients and disabled veterans.
Over the six-month period ended January 31, 2008, the management teams of Evergreen’s value-oriented equity funds tended to emphasize investments in attractively priced, fundamentally sound corporations. The portfolio manager of both Evergreen Disciplined Value Fund and Evergreen Disciplined Small-Mid Value Fund, for example, used a combination of quantitative tools and traditional fundamental analysis in reviewing opportunities among larger and smaller companies, respectively. The manager of Evergreen Equity Index Fund maintained a portfolio reflecting the composition of the Standard & Poor’s 500® Index, using a proprietary process to control trading and operational costs. Managers of Evergreen Equity Income Fund emphasized companies they believe have the ability to maintain and increase their dividends to shareholders. The managers of Evergreen Fundamental Large Cap Fund focused on larger corporations with stable earnings growth records while the managers of Evergreen Fundamental Mid Cap Value Fund, which was launched on September 28, 2007, emphasized mid-sized companies selling at what the managers believed to be reasonable valuations. The team
2
LETTER TO SHAREHOLDERS continued
managing Evergreen Intrinsic Value Fund sought out investments in established companies selling at stock prices below the managers’ estimate of the company’s intrinsic value. Meanwhile, the managers of Evergreen Small Cap Value Fund and Evergreen Special Values Fund each focused on higher-quality small companies that the managers believed to have reasonable prices and strong balance sheets.
We believe the experiences in the investment markets during the recent months have underscored the value of a well-diversified, long-term investment strategy to help soften the effects of volatility in any one market or asset class. As always, we encourage investors to maintain diversified investment portfolios in pursuit of their long-term investment goals.
Please visit us at EvergreenInvestments.com for more information about our funds and other investment products available to you. Thank you for your continued support of Evergreen Investments.
Sincerely,
Dennis H. Ferro
President and Chief Executive Officer
Evergreen Investment Company, Inc.
Special Notice to Shareholders:
Please visit our Web site at EvergreenInvestments.com for statements from President and Chief Executive Officer, Dennis Ferro, regarding the firm’s recent settlement with the Securities and Exchange Commission (SEC) and prior settlement with the Financial Industry Regulatory Authority (FINRA).
3
FUND AT A GLANCE
as of January 31, 2008
MANAGEMENT TEAM
Investment Advisor:
• Evergreen Investment Management Company, LLC
Portfolio Manager:
• James M. Tringas, CFA
CURRENT INVESTMENT STYLE
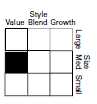
Source: Morningstar, Inc.
Morningstar’s style box is based on a portfolio date as of 12/31/2007.
The Equity style box placement is based on 10 growth and valuation measures for each fund holding and the median size of the companies in which the fund invests.
PERFORMANCE AND RETURNS
Portfolio inception date: 9/28/2007
| | | Class A | | Class B | | Class C | | Class I |
| Class inception date | | 9/28/2007 | | 9/28/2007 | | 9/28/2007 | | 9/28/2007 |
|
| Nasdaq symbol | | EFVAX | | EFVBX | | EFVCX | | EFVIX |
|
| Cumulative return | | | | | | | | |
|
| Since portfolio inception with sales charge | | -11.65% | | -11.07% | | -7.33% | | N/A |
|
| Since portfolio inception w/o sales charge | | -6.26% | | -6.39% | | -6.39% | | -6.22% |
|
| Maximum sales charge | | 5.75% | | 5.00% | | 1.00% | | N/A |
| | | Front-end | | CDSC | | CDSC | | |
|
Past performance is no guarantee of future results. The performance quoted represents past performance and current performance may be lower or higher. The investment return and principal value of an investment will fluctuate so that investors’ shares, when redeemed, may be worth more or less than their original cost. To obtain performance information current to the most recent month-end for Classes A, B, C or I, please go to EvergreenInvestments.com/fundperformance. The performance of each class may vary based on differences in loads, fees and expenses paid by the shareholders investing in each class. Performance includes the reinvestment of income dividends and capital gain distributions. Performance shown does not reflect the deduction of taxes that a shareholder would pay on fund distributions or the redemption of fund shares.
Performance results are extremely short term, and may not provide an adequate basis for evaluating a fund’s performance over varying market conditions or economic cycles. Unusual investment returns may be a result of a fund’s recent inception, existing market and economic conditions and the increased potential of a small number of stocks affecting fund performance due to the smaller asset size. Most mutual funds are intended to be long-term investments.
The fund incurs a 12b-1 fee of 0.25% for Class A and 1.00% for Classes B and C. Class I does not pay a 12b-1 fee.
The advisor is waiving its advisory fee and reimbursing the fund for a portion of other expenses. Had the fee not been waived and expenses not reimbursed, returns would have been lower.
4
FUND AT A GLANCE continued
Class I shares are only offered in the following manner: (1) to investment advisory clients of Evergreen Investment Management Company, LLC (or its advisory affiliates) when purchased by such advisor(s) on behalf of its clients, (2) to certain mutual fund wrap program clients of Wachovia Securities and of third-party broker/dealers when purchased through a clearing relationship with Wachovia Securities or an affiliate providing mutual fund clearing services, (3) through arrangements entered into on behalf of the Evergreen funds with certain financial services firms, (4) to certain institutional investors, and (5) to persons who owned Class Y shares in registered name in an Evergreen fund on or before December 31, 1994 or who owned shares of any SouthTrust fund in registered name as of March 18, 2005 or who owned shares of Vestaur Securities Fund as of May 20, 2005.
Class I shares are only available to institutional shareholders with a minimum of $1 million investment, which may be waived in certain situations.
The fund’s investment objective may be changed without a vote of the fund’s shareholders.
Mid cap securities may be subject to special risks associated with narrower product lines and limited financial resources compared to their large cap counterparts, and, as a result, mid cap securities may decline significantly in market downturns.
The stocks of smaller companies may be more volatile than those of larger companies due to the higher risk of failure.
Value-based investments are subject to the risk that the broad market may not recognize their intrinsic value.
All data is as of January 31, 2008, and subject to change.
5
ABOUT YOUR FUND’S EXPENSES
The Example below is intended to describe the fees and expenses borne by shareholders and the impact of those costs on your investment.
Example
As a shareholder of the fund, you incur two types of costs: (1) transaction costs, including sales charges (loads), redemption fees and exchange fees; and (2) ongoing costs, including management fees, distribution (12b-1) fees and other fund expenses. This Example is intended to help you understand your ongoing costs (in dollars) of investing in the fund and to compare these costs with the ongoing costs of investing in other mutual funds. The actual expense Example for each class is based on an investment of $1,000 invested at the beginning of the period and held for the entire period from September 28, 2007 (commencement of each class’ operations) to January 31, 2008. The hypothetical expense example for each class is based on an investment of $1,000 invested at the beginning of the period and held for the entire period from August 1, 2007 to January 31, 2008.
The example illustrates your fund’s costs in two ways:
• Actual expenses
The section in the table under the heading “Actual” provides information about actual account values and actual expenses. You may use the information in these columns, together with the amount you invested, to estimate the expenses that you paid over the period. Simply divide your account value by $1,000 (for example, an $8,600 account value divided by $1,000 = 8.6), then multiply the result by the number in the appropriate column for your share class, in the column entitled “Expenses Paid During Period” to estimate the expenses you paid on your account during this period.
• Hypothetical example for comparison purposes
The section in the table under the heading “Hypothetical (5% return before expenses)” provides information about hypothetical account values and hypothetical expenses based on the fund’s actual expense ratio and an assumed rate of return of 5% per year before expenses, which is not the fund’s actual return. The hypothetical account values and expenses may not be used to estimate the actual ending account balance or expenses you paid for the period. You may use this information to compare the ongoing costs of investing in the fund and other funds. To do so, compare this 5% hypothetical example with the 5% hypothetical examples that appear in the shareholder reports of the other funds.
Please note that the expenses shown in the table are meant to highlight your ongoing costs only and do not reflect any transactional costs, such as sales charges (loads), redemption fees or exchange fees. Therefore, the section in the table under the heading “Hypothetical (5% return before expenses)” is useful in comparing ongoing costs only, and will not help you determine the relative total costs of owning different funds. In addition, if these transactional costs were included, your costs would have been higher.
| | | Beginning | | Ending | | Expenses |
| | | Account | | Account | | Paid During |
| | | Value | | Value | | Period |
|
| Actual | | | | | | | | | | |
| Class A | | $ 1,000.00 | | $ | | 937.38 | | $ | | 4.14* |
| Class B | | $ 1,000.00 | | $ | | 936.09 | | $ | | 6.61* |
| Class C | | $ 1,000.00 | | $ | | 936.09 | | $ | | 6.61* |
| Class I | | $ 1,000.00 | | $ | | 937.81 | | $ | | 3.31* |
| Hypothetical | | | | | | | | | | |
| (5% return | | | | | | | | | | |
| before expenses) | | | | | | | | | | |
| Class A | | $ 1,000.00 | | $ 1,018.85 | | $ 6.34** |
| Class B | | $ 1,000.00 | | $ 1,015.08 | | $ 10.13** |
| Class C | | $ 1,000.00 | | $ 1,015.08 | | $ 10.13** |
| Class I | | $ 1,000.00 | | $ 1,020.11 | | $ 5.08** |
|
* For each class of the Fund, expenses are equal to the annualized expense ratio of each class (1.25% for Class A, 2.00% for Class B, 2.00% for Class C and 1.00% for Class I), multiplied by the average account value over the period, since each class’ commencement of operations (September 28, 2007), multiplied by 125 / 366 days.
** For each class of the Fund, expenses are equal to the annualized expense ratio of each class (1.25% for Class A, 2.00% for Class B, 2.00% for Class C and 1.00% for Class I), multiplied by the average account value over the period, multiplied by 184 / 366 days.
6
FINANCIAL HIGHLIGHTS
(For a share outstanding throughout the period)
| | | Period Ended |
| | | January 31, 20081 |
| CLASS A | | (unaudited) |
|
| Net asset value, beginning of period | | $10.00 |
|
| Income from investment operations | | | | |
| Net investment income (loss) | | | | 0.01 |
| Net realized and unrealized gains or losses on investments | | | | (0.64) |
| |
|
| Total from investment operations | | | | (0.63) |
|
| Distributions to shareholders from | | | | |
| Net investment income | | | | (0.01) |
|
| Net asset value, end of period | | $ 9.36 |
|
| Total return2 | | | | (6.26%) |
|
| Ratios and supplemental data | | | | |
| Net assets, end of period (thousands) | | $ 267 |
| Ratios to average net assets | | | | |
| Expenses including waivers/reimbursements but excluding expense reductions | | | | 1.25%3 |
| Expenses excluding waivers/reimbursements and expense reductions | | | | 17.09%3 |
| Net investment income (loss) | | | | 0.38%3 |
| Portfolio turnover rate | | | | 60% |
|
1 For the period from September 28, 2007 (commencement of class operations), to January 31, 2008.
2 Excluding applicable sales charges
3 Annualized
See Notes to Financial Statements
7
FINANCIAL HIGHLIGHTS
(For a share outstanding throughout the period)
| | | Period Ended |
| | | January 31, 20081 |
| CLASS B | | (unaudited) |
|
| Net asset value, beginning of period | | $10.00 |
|
| Income from investment operations | | | | |
| Net investment income (loss) | | | | 0 |
| Net realized and unrealized gains or losses on investments | | | | (0.64) |
| |
|
| Total from investment operations | | | | (0.64) |
|
| Distributions to shareholders from | | | | |
| Net investment income | | | | 02 |
|
| Net asset value, end of period | | $ 9.36 |
|
| Total return3 | | | | (6.39%) |
|
| Ratios and supplemental data | | | | |
| Net assets, end of period (thousands) | | $ 234 |
| Ratios to average net assets | | | | |
| Expenses including waivers/reimbursements but excluding expense reductions | | | | 2.00%4 |
| Expenses excluding waivers/reimbursements and expense reductions | | | | 17.84%4 |
| Net investment income (loss) | | | | (0.35%)4 |
| Portfolio turnover rate | | | | 60% |
|
1 For the period from September 28, 2007 (commencement of class operations), to January 31, 2008.
2 Amount represents less than $0.005 per share.
3 Excluding applicable sales charges
4 Annualized
8
FINANCIAL HIGHLIGHTS
(For a share outstanding throughout the period)
| | | Period Ended |
| | | January 31, 20081 |
| CLASS C | | (unaudited) |
|
| Net asset value, beginning of period | | $10.00 |
|
| Income from investment operations | | | | |
| Net investment income (loss) | | | | 0 |
| Net realized and unrealized gains or losses on investments | | | | (0.64) |
| |
|
| Total from investment operations | | | | (0.64) |
|
| Distributions to shareholders from | | | | |
| Net investment income | | | | 02 |
|
| Net asset value, end of period | | $ 9.36 |
|
| Total return3 | | | | (6.39%) |
|
| Ratios and supplemental data | | | | |
| Net assets, end of period (thousands) | | $ 234 |
| Ratios to average net assets | | | | |
| Expenses including waivers/reimbursements but excluding expense reductions | | | | 2.00%4 |
| Expenses excluding waivers/reimbursements and expense reductions | | | | 17.84%4 |
| Net investment income (loss) | | | | (0.35%)4 |
| Portfolio turnover rate | | | | 60% |
|
1 For the period from September 28, 2007 (commencement of class operations), to January 31, 2008.
2 Amount represents less than $0.005 per share.
3 Excluding applicable sales charges
4 Annualized
See Notes to Financial Statements
9
FINANCIAL HIGHLIGHTS
(For a share outstanding throughout the period)
| | | Period Ended |
| | | January 31, 20081 |
| CLASS I | | (unaudited) |
|
| Net asset value, beginning of period | | $10.00 |
|
| Income from investment operations | | | | |
| Net investment income (loss) | | | | 0.02 |
| Net realized and unrealized gains or losses on investments | | | | (0.64) |
| |
|
| Total from investment operations | | | | (0.62) |
|
| Distributions to shareholders from | | | | |
| Net investment income | | | | (0.02) |
|
| Net asset value, end of period | | $ 9.36 |
|
| Total return | | | | (6.22%) |
|
| Ratios and supplemental data | | | | |
| Net assets, end of period (thousands) | | $ 234 |
| Ratios to average net assets | | | | |
| Expenses including waivers/reimbursements but excluding expense reductions | | | | 1.00%2 |
| Expenses excluding waivers/reimbursements and expense reductions | | | | 16.84%2 |
| Net investment income (loss) | | | | 0.65%2 |
| Portfolio turnover rate | | | | 60% |
|
1 For the period from September 28, 2007 (commencement of class operations), to January 31, 2008.
2 Annualized
See Notes to Financial Statements
10
SCHEDULE OF INVESTMENTS
January 31, 2008 (unaudited)
| | | | | Shares | | | | Value |
|
| |
| COMMON STOCKS 89.1% | | | | | | | | |
| CONSUMER DISCRETIONARY 10.6% | | | | | | |
| Hotels, Restaurants & Leisure 5.4% | | | | | | |
| Brinker International, Inc. | | | | 150 | | $ | | 2,792 |
| Darden Restaurants, Inc. | | | | 1,122 | | | | 31,775 |
| Triarc Companies, Inc., Class A | | | | 1,841 | | | | 17,397 |
| |
|
| | | | | | | | | 51,964 |
| |
|
| Household Durables 2.7% | | | | | | | | |
| Mohawk Industries, Inc. * | | | | 57 | | | | 4,556 |
| Snap-On, Inc. | | | | 450 | | | | 22,104 |
| |
|
| | | | | | | | | 26,660 |
| |
|
| Multi-line Retail 0.6% | | | | | | | | |
| Sears Holdings Corp. * | | | | 51 | | | | 5,635 |
| |
|
| Specialty Retail 1.9% | | | | | | | | |
| AnnTaylor Stores Corp. * | | | | 748 | | | | 18,812 |
| |
|
| CONSUMER STAPLES 1.9% | | | | | | | | |
| Food Products 1.9% | | | | | | | | |
| Sara Lee Corp. | | | | 1,314 | | | | 18,475 |
| |
|
| ENERGY 11.4% | | | | | | | | |
| Energy Equipment & Services 1.1% | | | | | | |
| Atwood Oceanics, Inc. * | | | | 123 | | | | 10,220 |
| |
|
| Oil, Gas & Consumable Fuels 10.3% | | | | | | |
| Cimarex Energy Co. | | | | 794 | | | | 32,403 |
| Newfield Exploration Co. * | | | | 220 | | | | 10,974 |
| Pioneer Natural Resources Co. | | | | 555 | | | | 23,255 |
| St. Mary Land & Exploration Co. | | | | 941 | | | | 33,151 |
| |
|
| | | | | | | | | 99,783 |
| |
|
| FINANCIALS 20.1% | | | | | | | | |
| Capital Markets 1.5% | | | | | | | | |
| American Capital Strategies, Ltd. | | | | 232 | | | | 8,159 |
| Investment Technology Group, Inc. * | | 130 | | | | 6,106 |
| |
|
| | | | | | | | | 14,265 |
| |
|
| Commercial Banks 2.4% | | | | | | | | |
| BOK Financial Corp. | | | | 344 | | | | 18,741 |
| Cullen/Frost Bankers, Inc. | | | | 93 | | | | 4,876 |
| |
|
| | | | | | | | | 23,617 |
| |
|
| Insurance 11.6% | | | | | | | | |
| Assured Guaranty, Ltd. | | | | 564 | | | | 13,344 |
| Brown & Brown, Inc. | | | | 1,068 | | | | 24,041 |
| Everest Re Group, Ltd. | | | | 289 | | | | 29,388 |
| Fidelity National Financial, Inc., Class A | | 494 | | | | 9,727 |
| White Mountains Insurance Group, Ltd. | | 74 | | | | 35,890 |
| |
|
| | | | | | | | | 112,390 |
| |
|
See Notes to Financial Statements
11
SCHEDULE OF INVESTMENTS continued
January 31, 2008 (unaudited)
| | | | | | | Shares | | | | Value |
|
| COMMON STOCKS continued | | | | | | | | |
| FINANCIALS continued | | | | | | | | | | |
| Real Estate Investment Trusts 2.2% | | | | | | |
| Annaly Capital Management, Inc. | | | | | | 1,098 | | $ | | 21,653 |
| |
|
| Real Estate Management & Development 2.4% | | | | | | |
| Brookfield Properties Corp. | | | | | | 315 | | | | 6,398 |
| St. Joe Co. | | | | | | 426 | | | | 16,537 |
| |
|
| | | | | | | | | | | 22,935 |
| |
|
| HEALTH CARE 3.1% | | | | | | | | | | |
| Health Care Equipment & Supplies 1.2% | | | | | | |
| Edwards Lifesciences Corp. * | | | | | | 260 | | | | 12,030 |
| |
|
| Pharmaceuticals 1.9% | | | | | | | | | | |
| Endo Pharmaceuticals Holdings, Inc. * | | | | 693 | | | | 18,115 |
| |
|
| INDUSTRIALS 12.2% | | | | | | | | | | |
| Air Freight & Logistics 2.0% | | | | | | | | | | |
| UTi Worldwide, Inc. | | | | | | 1,036 | | | | 19,373 |
| |
|
| Commercial Services & Supplies 3.7% | | | | | | |
| Avery Dennison Corp. | | | | | | 493 | | | | 25,547 |
| Manpower, Inc. | | | | | | 94 | | | | 5,289 |
| Monster Worldwide, Inc. * | | | | | | 175 | | | | 4,874 |
| |
|
| | | | | | | | | | | 35,710 |
| |
|
| Machinery 4.0% | | | | | | | | | | |
| Dover Corp. | | | | | | 640 | | | | 25,830 |
| Timken Co. | | | | | | 429 | | | | 12,969 |
| |
|
| | | | | | | | | | | 38,799 |
| |
|
| Road & Rail 2.5% | | | | | | | | | | |
| Con-Way, Inc. | | | | | | 502 | | | | 24,442 |
| |
|
| INFORMATION TECHNOLOGY 17.1% | | | | | | |
| Communications Equipment 1.7% | | | | | | | | |
| CommScope, Inc. * | | | | | | 380 | | | | 16,853 |
| |
|
| Computers & Peripherals 5.1% | | | | | | | | |
| Imation Corp. | | | | | | 1,343 | | | | 34,797 |
| Lexmark International, Inc., Class A * | | | | 397 | | | | 14,376 |
| |
|
| | | | | | | | | | | 49,173 |
| |
|
| Electronic Equipment & Instruments 2.4% | | | | | | |
| Ingram Micro, Inc., Class A | | | | | | 681 | | | | 12,108 |
| Vishay Intertechnology, Inc. * | | | | | | 1,088 | | | | 11,413 |
| |
|
| | | | | | | | | | | 23,521 |
| |
|
See Notes to Financial Statements
12
SCHEDULE OF INVESTMENTS continued
January 31, 2008 (unaudited)
| | | | | | | | | Shares | | | | Value |
|
| COMMON STOCKS continued | | | | | | | | |
| INFORMATION TECHNOLOGY continued | | | | | | | | |
| IT Services 4.3% | | | | | | | | | | | | |
| Computer Sciences Corp. * | | | | | | | | 348 | | $ | | 14,727 |
| Global Payments, Inc. | | | | | | | | 584 | | | | 21,842 |
| Total System Services, Inc. | | | | | | | | 225 | | | | 5,201 |
| |
|
| | | | | | | | | | | | | 41,770 |
| |
|
| Semiconductors & Semiconductor Equipment 2.7% | | | | | | | | |
| LSI Corp. * | | | | | | | | 4,900 | | | | 25,578 |
| |
|
| Software 0.9% | | | | | | | | | | | | |
| Check Point Software Technologies, Ltd. * | | | | 424 | | | | 9,031 |
| |
|
| MATERIALS 4.7% | | | | | | | | | | | | |
| Chemicals 0.9% | | | | | | | | | | | | |
| FMC Corp. | | | | | | | | 78 | | | | 4,146 |
| Valspar Corp. | | | | | | | | 250 | | | | 5,008 |
| |
|
| | | | | | | | | | | | | 9,154 |
| |
|
| Containers & Packaging 1.5% | | | | | | | | |
| Owens-Illinois, Inc. * | | | | | | | | 283 | | | | 14,263 |
| |
|
| Metals & Mining 2.3% | | | | | | | | | | | | |
| Commercial Metals Co. | | | | | | | | 776 | | | | 22,000 |
| |
|
| UTILITIES 8.0% | | | | | | | | | | | | |
| Electric Utilities 5.0% | | | | | | | | | | | | |
| Mirant Corp. | | | | | | | | 613 | | | | 22,583 |
| Westar Energy, Inc. | | | | | | | | 1,048 | | | | 25,529 |
| |
|
| | | | | | | | | | | | | 48,112 |
| |
|
| Gas Utilities 0.9% | | | | | | | | | | | | |
| Atmos Energy Corp. | | | | | | | | 312 | | | | 8,961 |
| |
|
| Multi-Utilities 2.1% | | | | | | | | | | | | |
| Ameren Corp. | | | | | | | | 450 | | | | 20,164 |
| |
|
| Total Common Stocks (cost $901,359) | | | | | | | | 863,458 |
| |
|
| EXCHANGE TRADED FUND 4.9% | | | | | | | | |
| iShares Russell Midcap Value Index Fund (cost $51,521) | | | | 374 | | | | 47,815 |
| |
|
| SHORT-TERM INVESTMENTS 10.5% | | | | | | | | |
| MUTUAL FUND SHARES 10.5% | | | | | | | | |
| Evergreen Institutional Money Market Fund, Class I, 4.31% q ø | | | | | | |
| (cost $101,640) | | 101,640 | | | | 101,640 |
| |
|
| Total Investments (cost $1,054,520) 104.5% | | | | | | | | 1,012,913 |
| Other Assets and Liabilities (4.5%) | | | | | | | | (43,670) |
| |
|
| Net Assets 100.0% | | | | | | | | | | $ | | 969,243 |
| |
|
| * | | Non-income producing security |
| q | | Rate shown is the 7-day annualized yield at period end. |
| ø | | Evergreen Investment Management Company, LLC is the investment advisor to both the Fund and the money market |
| | | fund. |
See Notes to Financial Statements
13
SCHEDULE OF INVESTMENTS continued
January 31, 2008 (unaudited)
The following table shows the percent of total long-term investments by sector as of January 31, 2008:
| Financials | | 21.4% |
| Information Technology | | 18.2% |
| Industrials | | 13.0% |
| Energy | | 12.1% |
| Consumer Discretionary | | 11.3% |
| Utilities | | 8.5% |
| Materials | | 5.0% |
| Health Care | | 3.3% |
| Consumer Staples | | 2.0% |
| Other | | 5.2% |
| |
|
| | | 100.0% |
| | |
|
See Notes to Financial Statements
14
STATEMENT OF ASSETS AND LIABILITIES
January 31, 2008 (unaudited)
| Assets | | | | |
| Investments in securities, at value (cost $952,880) | | $ | | 911,273 |
| Investments in affiliated money market fund, at value (cost $101,640) | | | | 101,640 |
|
| Total investments | | | | 1,012,913 |
| Receivable for securities sold | | | | 21,635 |
| Dividends receivable | | | | 442 |
| Receivable from investment advisor | | | | 402 |
| Prepaid expenses and other assets | | | | 81,192 |
|
| Total assets | | | | 1,116,584 |
|
| Liabilities | | | | |
| Payable for securities purchased | | | | 17,973 |
| Distribution Plan expenses payable | | | | 14 |
| Due to other related parties | | | | 12 |
| Accrued expenses and other liabilities | | | | 129,342 |
|
| Total liabilities | | | | 147,341 |
|
| Net assets | | $ | | 969,243 |
|
| Net assets represented by | | | | |
| Paid-in capital | | $ | | 1,033,118 |
| Overdistributed net investment income | | | | (601) |
| Accumulated net realized losses on investments | | | | (21,667) |
| Net unrealized losses on investments | | | | (41,607) |
|
| Total net assets | | $ | | 969,243 |
|
| Net assets consists of | | | | |
| Class A | | $ | | 267,392 |
| Class B | | | | 233,875 |
| Class C | | | | 233,875 |
| Class I | | | | 234,101 |
|
| Total net assets | | $ | | 969,243 |
|
| Shares outstanding (unlimited number of shares authorized) | | | | |
| Class A | | | | 28,561 |
| Class B | | | | 25,000 |
| Class C | | | | 25,000 |
| Class I | | | | 25,000 |
|
| Net asset value per share | | | | |
| Class A | | $ | | 9.36 |
| Class A — Offering price (based on sales charge of 5.75%) | | $ | | 9.93 |
| Class B | | $ | | 9.36 |
| Class C | | $ | | 9.36 |
| Class I | | $ | | 9.36 |
|
See Notes to Financial Statements
15
STATEMENT OF OPERATIONS
Period Ended January 31, 2008 (unaudited) (a)
| Investment income | | | | |
| Dividends | | $ | | 3,697 |
| Income from affiliate | | | | 1,653 |
|
| Total investment income | | | | 5,350 |
|
| Expenses | | | | |
| Advisory fee | | | | 2,114 |
| Distribution Plan expenses | | | | |
| Class A | | | | 208 |
| Class B | | | | 806 |
| Class C | | | | 806 |
| Administrative services fee | | | | 324 |
| Transfer agent fees | | | | 32 |
| Trustees’ fees and expenses | | | | 1,216 |
| Printing and postage expenses | | | | 6,453 |
| Custodian and accounting fees | | | | 806 |
| Registration and filing fees | | | | 35,952 |
| Professional fees | | | | 7,461 |
| Other | | | | 403 |
|
| Total expenses | | | | 56,581 |
| Less: Fee waivers and expense reimbursements | | | | (51,510) |
|
| Net expenses | | | | 5,071 |
|
| Net investment income | | | | 279 |
|
| Net realized and unrealized gains or losses on investments | | | | |
| Net realized losses on investments | | | | (21,667) |
| Net change in unrealized gains or losses on investments | | | | (41,607) |
|
| Net realized and unrealized gains or losses on investments | | | | (63,274) |
|
| Net decrease in net assets resulting from operations | | $ | | (62,995) |
|
(a) For the period from September 28, 2007 (commencement of operations), to January 31, 2008.
See Notes to Financial Statements
16
STATEMENT OF CHANGES IN NET ASSETS
| | | Period Ended |
| | | January 31, 2008 |
| | | (unaudited) (a) |
|
| Operations | | | | |
| Net investment income | | $ | | 279 |
| Net realized losses on investments | | | | (21,667) |
| Net change in unrealized gains or losses on investments | | | | (41,607) |
|
| Net decrease in net assets resulting from operations | | | | (62,995) |
|
| Distributions to shareholders from | | | | |
| Net investment income | | | | |
| Class A | | | | (366) |
| Class B | | | | (23) |
| Class C | | | | (23) |
| Class I | | | | (468) |
|
| Total distributions to shareholders | | | | (880) |
|
| | | Shares | | |
| Capital share transactions | | | | |
| Proceeds from shares sold | | | | |
| Class A | | 28,561 | | 282,819 |
| Class B | | 25,000 | | 250,147 |
| Class C | | 25,000 | | 250,147 |
| Class I | | 25,000 | | 250,005 |
|
| Net increase in net assets resulting from capital share transactions | | | | 1,033,118 |
|
| Total increase in net assets | | | | 969,243 |
| Net assets | | | | |
| Beginning of period | | | | 0 |
|
| End of period | | $ | | 969,243 |
|
| Overdistributed net investment income | | $ | | (601) |
|
(a) For the period from September 28, 2007 (commencement of operations), to January 31, 2008.
See Notes to Financial Statements
17
NOTES TO FINANCIAL STATEMENTS (unaudited)
1. ORGANIZATION
Evergreen Fundamental Mid Cap Value Fund (the “Fund”) is a diversified series of Evergreen Equity Trust (the “Trust”), a Delaware statutory trust organized on September 18, 1997. The Trust is an open-end management investment company registered under the Investment Company Act of 1940, as amended (the “1940 Act”).
The Fund offers Class A, Class B, Class C and Class I shares. Class A shares are sold with a front-end sales charge. However, Class A share investments of $1 million or more are not subject to a front-end sales charge but are subject to a contingent deferred sales charge of 1.00% upon redemption within 18 months. Class B shares are sold without a front-end sales charge but are subject to a contingent deferred sales charge that is payable upon redemption and decreases depending on how long the shares have been held. Class C shares are sold without a front-end sales charge but are subject to a contingent deferred sales charge that is payable upon redemption within one year. Class I shares are sold without a front-end sales charge or contingent deferred sales charge. Each class of shares, except Class I shares, pays an ongoing distribution fee.
2. SIGNIFICANT ACCOUNTING POLICIES
The following is a summary of significant accounting policies consistently followed by the Fund in the preparation of its financial statements. The policies are in conformity with generally accepted accounting principles in the United States of America, which require management to make estimates and assumptions that affect amounts reported herein. Actual results could differ from these estimates.
a. Valuation of investments
Listed equity securities are usually valued at the last sales price or official closing price on the national securities exchange where the securities are principally traded.
Investments in open-end mutual funds are valued at net asset value. Securities for which market quotations are not readily available or not reflective of current market value are valued at fair value as determined by the investment advisor in good faith, according to procedures approved by the Board of Trustees.
b. Security transactions and investment income
Security transactions are recorded on trade date. Realized gains and losses are computed using the specific cost of the security sold. Dividend income is recorded on the ex-dividend date.
c. Federal taxes
The Fund intends to qualify as a regulated investment company and distribute all of its taxable income, including any net capital gains. Accordingly, no provision for federal taxes is required.
d. Distributions
Distributions to shareholders from net investment income and net realized gains, if any, are recorded on the ex-dividend date. Such distributions are determined in conformity with income tax regulations, which may differ from generally accepted accounting principles.
18
NOTES TO FINANCIAL STATEMENTS (unaudited) continued
e. Class allocations
Income, common expenses and realized and unrealized gains and losses are allocated to the classes based on the relative net assets of each class. Distribution fees, if any, are calculated daily at the class level based on the appropriate net assets of each class and the specific expense rates applicable to each class.
3. ADVISORY FEE AND OTHER TRANSACTIONS WITH AFFILIATES
Evergreen Investment Management Company, LLC (“EIMC”), an indirect, wholly-owned subsidiary of Wachovia Corporation (“Wachovia”), is the investment advisor to the Fund and is paid an annual fee starting at 0.65% and declining to 0.60% as average daily net assets increase. For the period ended January 31, 2008, the advisory fee was equivalent to 0.65% of the Fund’s average daily net assets (on an annualized basis).
From time to time, EIMC may voluntarily or contractually waive its fee and/or reimburse expenses in order to limit operating expenses. During the six months ended January 31, 2008, EIMC voluntarily waived its advisory fee in the amount of $2,114 and reimbursed other expenses in the amount of $49,396.
The Fund may invest in money market funds which are advised by EIMC. Income earned on these investments is included in income from affiliate on the Statement of Operations.
Effective January 1, 2008, EIMC replaced Evergreen Investment Services, Inc. (“EIS”), an indirect, wholly-owned subsidiary of Wachovia, as the administrator to the Fund upon the assignment of the Fund’s Administrative Services Agreement from EIS to EIMC. There were no changes to the services being provided or fees being paid by the Fund. The administrator provides the Fund with facilities, equipment and personnel and is paid an annual rate determined by applying percentage rates to the aggregate average daily net assets of the Evergreen funds (excluding money market funds and Evergreen Institutional Enhanced Income Fund), starting at 0.10% and declining to 0.05% as the aggregate average daily net assets of the Evergreen funds (excluding money market funds and Evergreen Institutional Enhanced Income Fund) increase.
Evergreen Service Company, LLC (“ESC”), an indirect, wholly-owned subsidiary of Wachovia, is the transfer and dividend disbursing agent for the Fund. ESC receives account fees that vary based on the type of account held by the shareholders in the Fund.
4. DISTRIBUTION PLANS
EIS serves as distributor of the Fund’s shares. The Fund has adopted Distribution Plans, as allowed by Rule 12b-1 of the 1940 Act, for each class of shares, except Class I. Under the Distribution Plans, distribution fees are paid at an annual rate of 0.25% of the average daily net assets for Class A shares and 1.00% of the average daily net assets for each of Class B and Class C shares.
For the period ended January 31, 2008, EIS received $152 from the sale of Class A shares.
19
NOTES TO FINANCIAL STATEMENTS (unaudited) continued
5. INVESTMENT TRANSACTIONS
Cost of purchases and proceeds from sales of investment securities (excluding short-term securities) were $1,523,306 and $548,758, respectively, for the period ended January 31, 2008.
On January 31, 2008, the aggregate cost of securities for federal income tax purposes was $1,054,520. The gross unrealized appreciation and depreciation on securities based on tax cost was $22,585 and $64,192, respectively, with a net unrealized depreciation of $41,607.
6. INTERFUND LENDING
Pursuant to an Exemptive Order issued by the SEC, the Fund may participate in an interfund lending program with certain funds in the Evergreen fund family. This program allows the Fund to borrow from, or lend money to, other participating funds. During the period ended January 31, 2008, the Fund did not participate in the interfund lending program.
7. DEFERRED TRUSTEES’ FEES
Each Trustee of the Fund may defer any or all compensation related to performance of his or her duties as a Trustee. The Trustees’ deferred balances are allocated to deferral accounts, which are included in the accrued expenses for the Fund. The investment performance of the deferral accounts is based on the investment performance of certain Evergreen funds. Any gains earned or losses incurred in the deferral accounts are reported in the Fund’s Trustees’ fees and expenses. At the election of the Trustees, the deferral account will be paid either in one lump sum or in quarterly installments for up to ten years.
8. REGULATORY MATTERS AND LEGAL PROCEEDINGS
Pursuant to an administrative order issued by the SEC on September 19, 2007, EIMC, EIS, ESC (collectively, the “Evergreen Entities”), Wachovia Securities, LLC and the SEC have entered into an agreement settling allegations of (i) improper short-term trading arrangements in effect prior to May 2003 involving former officers and employees of EIMC and certain broker-dealers, (ii) insufficient systems for monitoring exchanges and enforcing exchange limitations as stated in certain funds’ prospectuses, and (iii) inadequate e-mail retention practices. Under the settlement, the Evergreen Entities were censured and paid approximately $32 million in disgorgement and penalties. This amount, along with a fine assessed by the SEC against Wachovia Securities, LLC will be distributed pursuant to a plan to be developed by an independent distribution consultant and approved by the SEC. The Evergreen Entities neither admitted nor denied the allegations and findings set forth in its settlement with the SEC.
In addition, the Evergreen funds and EIMC and certain of its affiliates are involved in various legal actions, including private litigation and class action lawsuits. EIMC does not expect that any of such legal actions currently pending or threatened will have a material adverse impact on the financial position or operations of any of the Evergreen funds or on EIMC’s ability to provide services to the Evergreen funds.
20
NOTES TO FINANCIAL STATEMENTS (unaudited) continued
Although EIMC believes that none of the matters discussed above will have a material adverse impact on the Evergreen funds, there can be no assurance that these matters and any publicity surrounding or resulting from them will not result in reduced sales or increased redemptions of Evergreen fund shares, which could increase Evergreen fund transaction costs or operating expenses, or that they will not have other adverse consequences on the Evergreen funds.
9. NEW ACCOUNTING PRONOUNCEMENTS
In June 2006, the Financial Accounting Standards Board (“FASB”) issued FASB Interpretation No. 48, Accounting for Uncertainty in Income Taxes — an interpretation of FASB statement 109 (“FIN 48”). FIN 48 supplements FASB 109 by prescribing a recognition threshold and measurement attribute for the financial statement recognition and measurement of a tax position taken or expected to be taken in a tax return. The Fund’s financial statements have not been impacted by the adoption of FIN 48. However, the conclusions regarding FIN 48 may be subject to review and adjustment at a later date based on factors including, but not limited to, further implementation guidance expected from FASB, and on-going analysis of tax laws, regulations, and interpretations thereof.
In September 2006, FASB issued Statement of Financial Accounting Standards No. 157, Fair Value Measurements (“FAS 157”). FAS 157 establishes a single authoritative definition of fair value, establishes a framework for measuring fair value and expands disclosures about fair value measurements. FAS 157 applies to fair value measurements already required or permitted by existing standards. The change to current generally accepted accounting principles from the application of FAS 157 relates to the definition of fair value, the methods used to measure fair value, and the expanded disclosures about fair value measurements. Management of the Fund does not believe the adoption of FAS 157 will materially impact the financial statement amounts, however, additional disclosures may be required about the inputs used to develop the measurements and the effect of certain of the measurements on changes in net assets for the period. FAS 157 is effective for financial statements issued for fiscal years beginning after November 15, 2007 and interim periods within those fiscal years.
21
ADDITIONAL INFORMATION (unaudited)
INFORMATION ABOUT THE REVIEW AND APPROVAL OF THE FUND’S INVESTMENT ADVISORY AGREEMENT
The Fund’s Board of Trustees considered the proposed investment advisory agreement between the Fund and EIMC at a meeting held in June of 2007. At that meeting, the Trustees, including a majority of the Trustees who are not interested persons (as that term is defined in the 1940 Act) of the Fund or of EIMC approved the Fund’s investment advisory agreement. (References below to the “Fund” are to Evergreen Fundamental Mid Cap Value Fund; references to the “funds” are to the Evergreen funds generally.)
The Board of Trustees regularly meets with representatives of Evergreen Investments (“Evergreen”) during the course of the year, and, in considering the advisory and administrative arrangements for the Fund, the Trustees took into account information provided in those meetings.
The disinterested Trustees discussed the approval of the investment advisory agreement with representatives of Evergreen and with legal counsel. In all of its deliberations with respect to the Fund and the investment advisory agreement, the Board of Trustees and the disinterested Trustees were advised by independent counsel to the disinterested Trustees and counsel to the Fund. In considering the investment advisory agreement, the Trustees did not identify any particular information or consideration that was all-important or controlling, and each Trustee attributed different weights to various factors. This summary describes a number of the most important, but not necessarily all, of the factors considered by the Board and the disinterested Trustees.
The Trustees considered that EIMC and its affiliates generally provide a comprehensive investment management service to the funds. They noted that EIMC makes its personnel available to serve as officers of the funds and concluded that the reporting and management functions provided by EIMC with respect to the funds were generally satisfactory. The Trustees considered, among other factors, the proposed investment policies and portfolio management team’s investment approach and the historical investment performance of the proposed portfolio management team.
The Trustees considered the proposed investment advisory fee to be paid by the Fund in comparison to comparable mutual funds and to other comparable funds and accounts managed by Evergreen. The Trustees also considered whether further growth in assets of the Fund might result in economies of scale and noted that the Fund was in its start up phase and that the advisory fee for the Fund contemplated a breakpoint at $1 billion. The Trustees noted also that Evergreen agreed to voluntarily waive certain of its fees during the Fund’s start-up phase. The Trustees also relied, in part, on comparisons of the Fund’s projected fees and expenses to the fees and expenses of other peer mutual funds, based on data compiled by Evergreen from information provided by an independent data provider. In their consideration of the fees to be paid by the Fund, the Trustees considered information provided by EIMC regarding the projected profitability of the Fund to EIMC.
22
This page left intentionally blank
23
TRUSTEES AND OFFICERS
TRUSTEES1
| Charles A. Austin III | | Investment Counselor, Anchor Capital Advisors, LLC. (investment advice); Director, The Andover |
| Trustee | | Companies (insurance); Trustee, Arthritis Foundation of New England; Former Director, The |
| DOB: 10/23/1934 | | Francis Ouimet Society (scholarship program); Former Director, Executive Vice President and |
| Term of office since: 1991 | | Treasurer, State Street Research & Management Company (investment advice) |
| Other directorships: None | | |
|
| |
| K. Dun Gifford | | Chairman and President, Oldways Preservation and Exchange Trust (education); Trustee, |
| Trustee | | Chairman of the Finance Committee, Member of the Executive Committee, and Former |
| DOB: 10/23/1938 | | Treasurer, Cambridge College |
| Term of office since: 1974 | | |
| Other directorships: None | | |
|
| |
| Dr. Leroy Keith, Jr. | | Managing Director, Almanac Capital Management (commodities firm); Trustee, Phoenix |
| Trustee | | Fund Complex; Director, Diversapack Co. (packaging company); Former Partner, Stonington |
| DOB: 2/14/1939 | | Partners, Inc. (private equity fund); Former Director, Obagi Medical Products Co.; Former |
| Term of office since: 1983 | | Director, Lincoln Educational Services |
| Other directorships: Trustee, | | |
| Phoenix Fund Complex (consisting | | |
| of 53 portfolios as of 12/31/2007) | | |
|
| |
| Carol A. Kosel1 | | Former Consultant to the Evergreen Boards of Trustees; Former Vice President and Senior Vice |
| Trustee | | President, Evergreen Investments, Inc.; Former Treasurer, Evergreen Funds; Former Treasurer, |
| DOB: 12/25/1963 | | Vestaur Securities Fund |
| Term of office since: 2008 | | |
| Other directorships: None | | |
|
| |
| Gerald M. McDonnell | | Former Manager of Commercial Operations, CMC Steel (steel producer) |
| Trustee | | |
| DOB: 7/14/1939 | | |
| Term of office since: 1988 | | |
| Other directorships: None | | |
|
| |
| Patricia B. Norris | | President and Director of Buckleys of Kezar Lake, Inc. (real estate company); Former President |
| Trustee | | and Director of Phillips Pond Homes Association (home community); Former Partner, |
| DOB: 4/9/1948 | | PricewaterhouseCoopers, LLP (independent registered public accounting firm) |
| Term of office since: 2006 | | |
| Other directorships: None | | |
|
| |
| William Walt Pettit | | Partner and Vice President, Kellam & Pettit, P.A. (law firm); Director, Superior Packaging Corp. |
| Trustee | | (packaging company); Member, Superior Land, LLC (real estate holding company), Member, |
| DOB: 8/26/1955 | | K&P Development, LLC (real estate development); Former Director, National Kidney Foundation |
| Term of office since: 1988 | | of North Carolina, Inc. (non-profit organization) |
| Other directorships: None | | |
|
| |
| David M. Richardson | | President, Richardson, Runden LLC (executive recruitment advisory services); Director, J&M |
| Trustee | | Cumming Paper Co. (paper merchandising); Trustee, NDI Technologies, LLP (communications); |
| DOB: 9/19/1941 | | Former Consultant, AESC (The Association of Executive Search Consultants) |
| Term of office since: 1982 | | |
| Other directorships: None | | |
|
| |
| Dr. Russell A. Salton III | | President/CEO, AccessOne MedCard, Inc. |
| Trustee | | |
| DOB: 6/2/1947 | | |
| Term of office since: 1984 | | |
| Other directorships: None | | |
|
24
TRUSTEES AND OFFICERS continued
| Michael S. Scofield | | Retired Attorney, Law Offices of Michael S. Scofield; Former Director and Chairman, Branded |
| Trustee | | Media Corporation (multi-media branding company) |
| DOB: 2/20/1943 | | |
| Term of office since: 1984 | | |
| Other directorships: None | | |
|
| |
| Richard J. Shima | | Independent Consultant; Director, Hartford Hospital; Trustee, Greater Hartford YMCA; Former |
| Trustee | | Director, Trust Company of CT; Former Director, Old State House Association; Former Trustee, |
| DOB: 8/11/1939 | | Saint Joseph College (CT) |
| Term of office since: 1993 | | |
| Other directorships: None | | |
|
| |
| Richard K. Wagoner, CFA2 | | Member and Former President, North Carolina Securities Traders Association; Member, Financial |
| Trustee | | Analysts Society |
| DOB: 12/12/1937 | | |
| Term of office since: 1999 | | |
| Other directorships: None | | |
|
| |
| |
| OFFICERS | | |
| |
| Dennis H. Ferro3 | | Principal occupations: President and Chief Executive Officer, Evergreen Investment Company, |
| President | | Inc. and Executive Vice President, Wachovia Bank, N.A.; former Chief Investment Officer, |
| DOB: 6/20/1945 | | Evergreen Investment Company, Inc. |
| Term of office since: 2003 | | |
|
| |
| Jeremy DePalma4 | | Principal occupations: Senior Vice President, Evergreen Investment Management Company, LLC; |
| Treasurer | | Former Vice President, Evergreen Investment Services, Inc.; Former Assistant Vice President, |
| DOB: 2/5/1974 | | Evergreen Investment Services, Inc. |
| Term of office since: 2005 | | |
|
| |
| Michael H. Koonce4 | | Principal occupations: Senior Vice President and General Counsel, Evergreen Investment |
| Secretary | | Services, Inc.; Secretary, Senior Vice President and General Counsel, Evergreen Investment |
| DOB: 4/20/1960 | | Management Company, LLC and Evergreen Service Company, LLC; Senior Vice President and |
| Term of office since: 2000 | | Assistant General Counsel, Wachovia Corporation |
|
| |
| Robert Guerin4 | | Principal occupations: Chief Compliance Officer, Evergreen Funds and Senior Vice President of |
| Chief Compliance Officer | | Evergreen Investments Co, Inc; Former Managing Director and Senior Compliance Officer, |
| DOB: 9/20/1965 | | Babson Capital Management LLC; Former Principal and Director, Compliance and Risk |
| Term of office since: 2007 | | Management, State Street Global Advisors; Former Vice President and Manager, Sales Practice |
| | | Compliance, Deutsche Asset Management. |
1 Each Trustee, except Mses. Kosel and Norris, serves until a successor is duly elected or qualified or until his or her death, resignation, retirement or removal from office. As new Trustees, Ms. Kosel’s and Ms. Norris’ initial terms end December 31, 2010 and June 30, 2009, respectively, at which times they may be re-elected by Trustees to serve until a successor is duly elected or qualified or until her death, resignation, retirement or removal from office by the Trustees. Each Trustee, except Ms. Kosel, oversaw 93 Evergreen funds as of December 31, 2007. Ms. Kosel became a Trustee on January 1, 2008. Correspondence for each Trustee may be sent to Evergreen Board of Trustees, P.O. Box 20083, Charlotte, NC 28202.
2 Mr. Wagoner is an “interested person” of the Fund because of his ownership of shares in Wachovia Corporation, the parent to the Fund’s investment advisor.
3 The address of the Officer is 401 S. Tryon Street, 20th Floor, Charlotte, NC 28288.
4 The address of the Officer is 200 Berkeley Street, Boston, MA 02116.
Additional information about the Fund’s Board of Trustees and Officers can be found in the Statement of Additional Information (SAI) and is available upon request without charge by calling 800.343.2898.
25
581828 03/2008
Evergreen Golden Core Opportunities Fund
| | | table of contents |
| 1 | | LETTER TO SHAREHOLDERS |
| 4 | | FUND AT A GLANCE |
| 5 | | ABOUT YOUR FUND’S EXPENSES |
| 6 | | FINANCIAL HIGHLIGHTS |
| 10 | | SCHEDULE OF INVESTMENTS |
| 14 | | STATEMENT OF ASSETS AND LIABILITIES |
| 15 | | STATEMENT OF OPERATIONS |
| 16 | | STATEMENT OF CHANGES IN NET ASSETS |
| 17 | | NOTES TO FINANCIAL STATEMENTS |
| 22 | | ADDITIONAL INFORMATION |
| 28 | | TRUSTEES AND OFFICERS |
This semiannual report must be preceded or accompanied by a prospectus of the Evergreen fund contained herein. The prospectus contains more complete information, including fees and expenses, and should be read carefully before investing or sending money.
The fund will file its complete schedule of portfolio holdings with the SEC for the first and third quarters of each fiscal year on Form N-Q. The fund’s Form N-Q will be available on the SEC’s Web site at http://www.sec.gov. In addition, the fund’s Form N-Q may be reviewed and copied at the SEC’s Public Reference Room in Washington, D.C. Information on the operation of the Public Reference Room may be obtained by calling 800.SEC.0330.
A description of the fund’s proxy voting policies and procedures, as well as information regarding how the fund voted proxies relating to portfolio securities during the most recent 12-month period ended June 30, is available by visiting our Web site at EvergreenInvestments.com or by visiting the SEC’s Web site at http://www.sec.gov. The fund’s proxy voting policies and procedures are also available without charge, upon request, by calling 800.343.2898.
| Mutual Funds: | | | | |
| NOT FDIC INSURED | | MAY LOSE VALUE | | NOT BANK GUARANTEED |
Evergreen InvestmentsSM is a service mark of Evergreen Investment Management Company, LLC.
Copyright 2008, Evergreen Investment Management Company, LLC.
Evergreen Investment Management Company, LLC is a subsidiary of Wachovia Corporation
and is an affiliate of Wachovia Corporation’s other Broker Dealer subsidiaries.
Evergreen mutual funds are distributed by Evergreen Investment Services, Inc.
200 Berkeley Street, Boston, MA 02116
LETTER TO SHAREHOLDERS
March 2008

Dennis H. Ferro
President and Chief Executive Officer
Dear Shareholder:
We are pleased to provide the Semiannual Report for Evergreen Golden Core Opportunities Fund, covering the period from December 17, 2007 through January 31, 2008.
Each of the three Golden funds is managed with the investment strategies developed by Golden Capital Management, LLC (“Golden Capital”), a firm that successfully manages core and enhanced index equity portfolios for institutional and high net worth individual investors. Evergreen Golden Large Cap Core Fund is managed to invest in securities of companies diversified across the major economic sectors, with at least 80% of net assets invested in shares of large cap companies with characteristics similar to those typically found in the Standard & Poor’s 500 Index. Evergreen Golden Mid Cap Core Fund is managed to invest in securities of companies, with at least 80% of net assets invested in the stocks of mid cap companies similar to those found in the Russell Midcap Index. The third fund, Evergreen Golden Core Opportunities Fund, is designed to invest in securities of companies diversified across the major sectors, with at least 80% of net assets invested in stocks of small to mid cap companies similar to those found in the Russell 2500 Index.
We are proud to be able to offer retail investors these three mutual funds that follow Golden Capital’s discipline, which combines fundamental equity research and a quantitative approach in pursuit of consistent, long-term returns. As sub-advisor, Golden Capital is responsible for day-to-day portfolio management of these three funds, while Evergreen Investment Management Company, LLC serves as the investment advisor.
1
LETTER TO SHAREHOLDERS continued
The funds were launched during a challenging period in the domestic equity market. Problems that first appeared in the housing and subprime mortgage markets led to a tightening of credit, which in turn contributed to widening fears of a dramatic deceleration in the economy’s expansion late in 2007 and early in 2008. As the economy weakened, equity prices generally declined across companies of all sizes. Large cap stocks held up somewhat better than mid cap and small cap shares, while growth stocks outperformed more economically sensitive value stocks. Fixed income investors, meanwhile, sought out the highest-quality securities and attempted to avoid credit risk. Longer-maturity Treasuries outperformed other sectors, while the prices of corporate bonds and many asset-backed securities fell as the yield spreads between Treasuries and lower-rated securities widened. In this environment, the price of gold surged while the dollar remained weak.
The U.S. economy exhibited increasing signs of weakness in the latter half of 2007 and the first month of 2008 after experiencing solid growth early in 2007. Although housing and credit-related concerns began weighing on investor sentiment early in the year, the economy’s growth trajectory continued to be supported early in 2007 by the combination of solid trends in employment, income, investment and export trends. That began to change in the latter months of 2007, however, as each of these pillars of support began to weaken. Growth in Gross Domestic Product rose by just 0.6% during the final quarter of 2007 as economic output slowed because of a sharp reduction in business inventories. Corporate earnings growth, meanwhile, fell over the second half of 2007. Payrolls dropped by 17,000 in January 2008, contributing to growing concerns about the outlook for consumer spending, which accounts for up to 70% of economic output. Faced with growing evidence of the economy’s deceleration, the Federal Reserve Board (the “Fed”) began to focus more on stimulating growth and less on watching inflation. The Fed cut the target fed funds rate from 5.25% to 4.25% during the last four months of 2007
2
LETTER TO SHAREHOLDERS continued
and then slashed the rate by an additional 1.25% in two separate actions within just eight days of each other in January 2008. Also in early 2008, Congress passed, and President Bush signed, a $168 billion fiscal stimulus bill that contained rebates for taxpayers, tax breaks for businesses and additional assistance for Social Security recipients and disabled veterans.
We believe the experiences in the investment markets in recent months have underscored the value of a well-diversified, long-term investment strategy to help soften the effects of volatility in any one market or asset class. As always, we encourage investors to maintain diversified investment portfolios in pursuit of their long-term investment goals.
Please visit us at EvergreenInvestments.com for more information about our funds and other investment products available to you. Thank you for your continued support of Evergreen Investments.
Sincerely,

Dennis H. Ferro
President and Chief Executive Officer
Evergreen Investment Company, Inc.
Special Notice to Shareholders:
Please visit our Web site at EvergreenInvestments.com for statements from President and Chief Executive Officer, Dennis Ferro, regarding the firm’s recent settlement with the Securities and Exchange Commission (SEC) and prior settlement with the Financial Industry Regulatory Authority (FINRA).
3
FUND AT A GLANCE
as of January 31, 2008
MANAGEMENT TEAM
Investment Advisor:
• Evergreen Investment Management Company, LLC
Sub-Advisor:
• Golden Capital Management, LLC
Portfolio Manager:
• John R. Campbell, CFA
CURRENT INVESTMENT STYLE
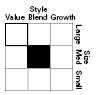
Source: Morningstar, Inc.
Morningstar’s style box is based on a portfolio date as of 12/31/2007.
The Equity style box placement is based on 10 growth and valuation measures for each fund holding and the median size of the companies in which the fund invests.
PERFORMANCE AND RETURNS
Portfolio inception date: 12/17/2007
| | | Class A | | Class B | | Class C | | Class I |
| Class inception date | | 12/17/2007 | | 12/17/2007 | | 12/17/2007 | | 12/17/2007 |
|
| Nasdaq symbol | | ECOAX | | ECOBX | | ECOCX | | ECOIX |
|
| Cumulative return | | | | | | | | |
|
| Since portfolio inception with sales charge | | -13.57% | | -12.88% | | -9.22% | | N/A |
|
| Since portfolio inception w/o sales charge | | -8.30% | | -8.30% | | -8.30% | | -8.30% |
|
| Maximum sales charge | | 5.75% | | 5.00% | | 1.00% | | N/A |
| | | Front-end | | CDSC | | CDSC | | |
|
Past performance is no guarantee of future results. The performance quoted represents past performance and current performance may be lower or higher. The investment return and principal value of an investment will fluctuate so that investors’ shares, when redeemed, may be worth more or less than their original cost. To obtain performance information current to the most recent month-end for Classes A, B, C or I, please go to EvergreenInvestments.com/fundperformance. The performance of each class may vary based on differences in loads, fees and expenses paid by the shareholders investing in each class. Performance includes the reinvestment of income dividends and capital gain distributions. Performance shown does not reflect the deduction of taxes that a shareholder would pay on fund distributions or the redemption of fund shares.
Performance results are extremely short term, and may not provide an adequate basis for evaluating a fund’s performance over varying market conditions or economic cycles. Unusual investment returns may be a result of a fund’s recent inception, existing market and economic conditions and the increased potential of a small number of stocks affecting fund performance due to the smaller asset size. Most mutual funds are intended to be long-term investments.
The fund incurs a 12b-1 fee of 0.25% for Class A and 1.00% for Classes B and C. Class I does not pay a 12b-1 fee.
The advisor is waiving its advisory fee and reimbursing the fund for a portion of other expenses. Had the fee not been waived and expenses not reimbursed, returns would have been lower.
Class I shares are only offered in the following manner: (1) to investment advisory clients of Evergreen Investment Management Company, LLC (or its advisory affiliates) when purchased by such advisor(s) on behalf of its clients, (2) to certain mutual fund wrap program clients of Wachovia Securities and of third-party broker/dealers when purchased through a clearing relationship with Wachovia Securities or an affiliate providing mutual fund clearing services, (3) through arrangements entered into on behalf of the Evergreen funds with certain financial services firms, (4) to certain institutional investors, and (5) to persons who owned Class Y shares in registered name in an Evergreen fund on or before December 31, 1994 or who owned shares of any SouthTrust fund in registered name as of March 18, 2005 or who owned shares of Vestaur Securities Fund as of May 20, 2005.
Class I shares are only available to institutional shareholders with a minimum of $1 million investment, which may be waived in certain situations.
The fund’s investment objective may be changed without a vote of the fund’s shareholders.
Mid cap securities may be subject to special risks associated with narrower product lines and limited financial resources compared to their large cap counterparts, and, as a result, mid cap securities may decline significantly in market downturns.
Since the fund tends to invest in a smaller number of stocks than many similar mutual funds, changes in the value of individual stocks may have a larger impact on its net asset value than such fluctuations would if the fund were more broadly invested.
The stocks of smaller companies may be more volatile than those of larger companies due to the higher risk of failure.
All data is as of January 31, 2008, and subject to change.
4
ABOUT YOUR FUND’S EXPENSES
The Example below is intended to describe the fees and expenses borne by shareholders and the impact of those costs on your investment.
Example
As a shareholder of the fund, you incur two types of costs: (1) transaction costs, including sales charges (loads), redemption fees and exchange fees; and (2) ongoing costs, including management fees, distribution (12b-1) fees and other fund expenses. This Example is intended to help you understand your ongoing costs (in dollars) of investing in the fund and to compare these costs with the ongoing costs of investing in other mutual funds. The actual expense Example for each class is based on an investment of $1,000 invested at the beginning of the period and held for the entire period from December 17, 2007 (commencement of each class’ operations) to January 31, 2008. The hypothetical expense Example for each class is based on an investment of $1,000 invested at the beginning of the period and held for the entire period from August 1, 2007 to January 31, 2008.
The example illustrates your fund’s costs in two ways:
- Actual expenses
The section in the table under the heading “Actual” provides information about actual account values and actual expenses. You may use the information in these columns, together with the amount you invested, to estimate the expenses that you paid over the period. Simply divide your account value by $1,000 (for example, an $8,600 account value divided by $1,000 = 8.6), then multiply the result by the number in the appropriate column for your share class, in the column entitled “Expenses Paid During Period” to estimate the expenses you paid on your account during this period. - Hypothetical example for comparison purposes
The section in the table under the heading “Hypothetical (5% return before expenses)” provides information about hypothetical account values and hypothetical expenses based on the fund’s actual expense ratio and an assumed rate of return of 5% per year before expenses, which is not the fund’s actual return. The hypothetical account values and expenses may not be used to estimate the actual ending account balance or expenses you paid for the period. You may use this information to compare the ongoing costs of investing in the fund and other funds. To do so, compare this 5% hypothetical example with the 5% hypothetical examples that appear in the shareholder reports of the other funds.
Please note that the expenses shown in the table are meant to highlight your ongoing costs only and do not reflect any transactional costs, such as sales charges (loads), redemption fees or exchange fees. Therefore, the section in the table under the heading “Hypothetical (5% return before expenses)” is useful in comparing ongoing costs only, and will not help you determine the relative total costs of owning different funds. In addition, if these transactional costs were included, your costs would have been higher.
| | | Beginning | | Ending | | Expenses |
| | | Account | | Account | | Paid During |
| | | Value | | Value | | Period |
|
| Actual | | | | | | |
| Class A | | $ 1,000.00 | | $ 917.00 | | $ 1.77* |
| Class B | | $ 1,000.00 | | $ 917.00 | | $ 2.65* |
| Class C | | $ 1,000.00 | | $ 917.00 | | $ 2.65* |
| Class I | | $ 1,000.00 | | $ 917.00 | | $ 1.47* |
| Hypothetical | | | | | | |
| (5% return | | | | | | |
| before expenses) | | | | | | |
| Class A | | $ 1,000.00 | | $ 1,017.60 | | $ 7.61** |
| Class B | | $ 1,000.00 | | $ 1,013.83 | | $11.39** |
| Class C | | $ 1,000.00 | | $ 1,013.83 | | $11.39** |
| Class I | | $ 1,000.00 | | $ 1,018.85 | | $ 6.34** |
|
* For each class of the Fund, expenses are equal to the annualized expense ratio of each class (1.50% for Class A, 2.25% for Class B, 2.25% for Class C and 1.25% for Class I), multiplied by the average account value over the period since each class’ commencement of operations (December 17, 2007), multiplied by 45 / 366 days.
** For each class of the Fund, expenses are equal to the annualized expense ratio of each class (1.50% for Class A, 2.25% for Class B, 2.25% for Class C and 1.25% for Class I), multiplied by the average account value over the period, multiplied by 184 / 366 days.
5
FINANCIAL HIGHLIGHTS
(For a share outstanding throughout the period)
| | | Period Ended |
| | | January 31, 20081 |
| CLASS A | | (unaudited) |
|
| Net asset value, beginning of period | | $10.00 |
|
| Income from investment operations | | |
| Net investment income (loss) | | 0 |
| Net realized and unrealized gains or losses on investments | | (0.83) |
| |
|
| Total from investment operations | | (0.83) |
|
| Net asset value, end of period | | $ 9.17 |
|
| Total return2 | | (8.30%) |
|
| Ratios and supplemental data | | |
| Net assets, end of period (thousands) | | $ 461 |
| Ratios to average net assets | | |
| Expenses including waivers/reimbursements but excluding expense reductions | | 1.50%3 |
| Expenses excluding waivers/reimbursements and expense reductions | | 6.52%3 |
| Net investment income (loss) | | (0.38%)3 |
| Portfolio turnover rate | | 0% |
|
1 For the period from December 17, 2007 (commencem ent of class operations), to January 31, 2008.
2 Excluding applicable sales charges
3 Annualized
See Notes to Financial Statements
6
FINANCIAL HIGHLIGHTS
(For a share outstanding throughout the period)
| | | Period Ended |
| | | January 31, 20081 |
| CLASS B | | (unaudited) |
|
| Net asset value, beginning of period | | $10.00 |
|
| Income from investment operations | | |
| Net investment income (loss) | | (0.01) |
| Net realized and unrealized gains or losses on investments | | (0.82) |
| |
|
| Total from investment operations | | (0.83) |
|
| Net asset value, end of period | | $ 9.17 |
|
| Total return2 | | (8.30%) |
|
| Ratios and supplemental data | | |
| Net assets, end of period (thousands) | | $ 459 |
| Ratios to average net assets | | |
| Expenses including waivers/reimbursements but excluding expense reductions | | 2.25%3 |
| Expenses excluding waivers/reimbursements and expense reductions | | 7.27%3 |
| Net investment income (loss) | | (1.13%)3 |
| Portfolio turnover rate | | 0% |
|
1 For the period from December 17, 2007 (commencem ent of class operations), to January 31, 2008.
2 Excluding applicable sales charges
3 Annualized
See Notes to Financial Statements
7
FINANCIAL HIGHLIGHTS
(For a share outstanding throughout the period)
| | | Period Ended |
| | | January 31, 20081 |
| CLASS C | | (unaudited) |
|
| Net asset value, beginning of period | | $10.00 |
|
| Income from investment operations | | |
| Net investment income (loss) | | (0.01) |
| Net realized and unrealized gains or losses on investments | | (0.82) |
| |
|
| Total from investment operations | | (0.83) |
|
| Net asset value, end of period | | $ 9.17 |
|
| Total return2 | | (8.30%) |
|
| Ratios and supplemental data | | |
| Net assets, end of period (thousands) | | $ 464 |
| Ratios to average net assets | | |
| Expenses including waivers/reimbursements but excluding expense reductions | | 2.25%3 |
| Expenses excluding waivers/reimbursements and expense reductions | | 7.27%3 |
| Net investment income (loss) | | (1.13%)3 |
| Portfolio turnover rate | | 0% |
|
1 For the period from December 17, 2007 (commencem ent of class operations), to January 31, 2008.
2 Excluding applicable sales charges
3 Annualized
See Notes to Financial Statements
8
FINANCIAL HIGHLIGHTS
(For a share outstanding throughout the period)
| | | Period Ended |
| | | January 31, 20081 |
| CLASS I | | (unaudited) |
|
| Net asset value, beginning of period | | $10.00 |
|
| Income from investment operations | | |
| Net investment income (loss) | | 0 |
| Net realized and unrealized gains or losses on investments | | (0.83) |
| |
|
| Total from investment operations | | (0.83) |
|
| Net asset value, end of period | | $ 9.17 |
|
| Total return | | (8.30%) |
|
| Ratios and supplemental data | | |
| Net assets, end of period (thousands) | | $3,211 |
| Ratios to average net assets | | |
| Expenses including waivers/reimbursements but excluding expense reductions | | 1.25%2 |
| Expenses excluding waivers/reimbursements and expense reductions | | 6.27%2 |
| Net investment income (loss) | | (0.13%)2 |
| Portfolio turnover rate | | 0% |
|
1 For the period from December 17, 2007 (commencem ent of class operations), to January 31, 2008.
2 Annualized
See Notes to Financial Statements
9
SCHEDULE OF INVESTMENTS
January 31, 2008 (unaudited)
| | | | | | | Shares | | Value |
|
| COMMON STOCKS 98.0% | | | | | | |
| CONSUMER DISCRETIONARY 10.1% | | | | |
| Auto Components 1.9% | | | | | | |
| Gentex Corp. | | | | | | 5,545 | | $ 87,944 |
| |
|
| Household Durables 2.1% | | | | | | |
| Newell Rubbermaid, Inc. | | | | 3,915 | | 94,430 |
| |
|
| Leisure Equipment & Products 2.1% | | | | |
| Hasbro, Inc. | | | | | | 3,810 | | 98,946 |
| |
|
| Specialty Retail 4.0% | | | | | | |
| Brown Shoe Co., Inc. | | | | | | 5,960 | | 102,512 |
| Men’s Wearhouse, Inc. | | | | | | 3,230 | | 82,332 |
| |
|
| | | | | | | | | 184,844 |
| |
|
| CONSUMER STAPLES 3.9% | | | | | | |
| Beverages 1.9% | | | | | | | | |
| Pepsi Bottling Group, Inc. | | | | 2,495 | | 86,951 |
| |
|
| Personal Products 2.0% | | | | | | |
| NBTY, Inc. * | | | | | | 3,725 | | 90,219 |
| |
|
| ENERGY 9.3% | | | | | | | | |
| Energy Equipment & Services 7.2% | | | | |
| Cameron International Corp. * | | | | 2,050 | | 82,533 |
| Global Industries, Ltd. * | | | | 4,230 | | 74,702 |
| Noble Corp. | | | | | | 1,780 | | 77,911 |
| Parker Drilling Co. * | | | | | | 13,630 | | 94,728 |
| |
|
| | | | | | | | | 329,874 |
| |
|
| Oil, Gas & Consumable Fuels 2.1% | | | | |
| Holly Corp. | | | | | | 2,000 | | 96,840 |
| |
|
| FINANCIALS 14.6% | | | | | | |
| Capital Markets 4.4% | | | | | | |
| Ameriprise Financial, Inc. | | | | 1,800 | | 99,558 |
| Federated Investors, Inc. | | | | 2,395 | | 101,955 |
| |
|
| | | | | | | | | 201,513 |
| |
|
| Diversified Financial Services 2.1% | | | | |
| Nasdaq Stock Market, Inc. * | | | | 2,095 | | 96,936 |
| |
|
| Insurance 6.2% | | | | | | | | |
| American Financial Group, Inc. | | | | 3,395 | | 94,143 |
| Assurant, Inc. | | | | | | 1,490 | | 96,686 |
| HCC Insurance Holdings, Inc. | | | | 3,450 | | 96,117 |
| |
|
| | | | | | | | | 286,946 |
| |
|
| Real Estate Investment Trusts 1.9% | | | | |
| AMB Property Corp. | | | | | | 1,705 | | 86,273 |
| |
|
See Notes to Financial Statements
10
SCHEDULE OF INVESTMENTS continued
January 31, 2008 (unaudited)
| | | | | | | Shares | | Value |
|
| |
| COMMON STOCKS continued | | | | | | |
| HEALTH CARE 18.3% | | | | | | | | |
| Health Care Equipment & Supplies 1.9% | | | | |
| Dentsply International, Inc. | | | | | | 2,155 | | $ 89,023 |
| |
|
| Health Care Providers & Services 8.5% | | | | |
| AmerisourceBergen Corp. | | | | | | 2,290 | | 106,829 |
| Express Scripts, Inc. * | | | | | | 1,385 | | 93,474 |
| Health Net, Inc. * | | | | | | 2,005 | | 93,212 |
| Laboratory Corporation of America Holdings * | | 1,315 | | 97,152 |
| |
|
| | | | | | | | | 390,667 |
| |
|
| Life Sciences Tools & Services 3.5% | | | | |
| Applied Biosystems Group - Applera Corp. | | 2,940 | | 92,698 |
| Waters Corp. * | | | | | | 1,225 | | 70,376 |
| |
|
| | | | | | | | | 163,074 |
| |
|
| Pharmaceuticals 4.4% | | | | | | | | |
| Endo Pharmaceuticals Holdings, Inc. * | | | | 3,615 | | 94,496 |
| Sciele Pharma, Inc. * | | | | | | 4,420 | | 105,727 |
| |
|
| | | | | | | | | 200,223 |
| |
|
| INDUSTRIALS 13.0% | | | | | | | | |
| Aerospace & Defense 3.5% | | | | | | | | |
| Goodrich Corp. | | | | | | 1,335 | | 83,504 |
| Spirit AeroSystems Holdings, Inc., Class A * | | 2,870 | | 79,270 |
| |
|
| | | | | | | | | 162,774 |
| |
|
| Electrical Equipment 3.6% | | | | | | | | |
| Cooper Industries, Inc. | | | | | | 1,870 | | 83,290 |
| GrafTech International, Ltd. * | | | | | | 5,415 | | 81,495 |
| |
|
| | | | | | | | | 164,785 |
| |
|
| Machinery 5.9% | | | | | | | | |
| Gardner Denver, Inc. * | | | | | | 2,880 | | 93,427 |
| Parker Hannifin Corp. | | | | | | 1,280 | | 86,541 |
| Terex Corp. * | | | | | | 1,545 | | 90,784 |
| |
|
| | | | | | | | | 270,752 |
| |
|
| INFORMATION TECHNOLOGY 17.0% | | | | |
| Communications Equipment 3.7% | | | | |
| ADC Telecommunications, Inc. * | | | | | | 5,355 | | 79,201 |
| Harris Corp. | | | | | | 1,615 | | 88,324 |
| |
|
| | | | | | | | | 167,525 |
| |
|
| Electronic Equipment & Instruments 7.7% | | | | |
| Amphenol Corp., Class A | | | | | | 2,150 | | 85,871 |
| Arrow Electronics, Inc. * | | | | | | 2,575 | | 88,117 |
| Avnet, Inc. * | | | | | | 2,800 | | 99,708 |
| Methode Electronics, Inc. | | | | | | 6,645 | | 80,537 |
| |
|
| | | | | | | | | 354,233 |
| |
|
See Notes to Financial Statements
11
SCHEDULE OF INVESTMENTS continued
January 31, 2008 (unaudited)
| | | | | Shares | | Value |
|
| COMMON STOCKS continued | | | | |
| INFORMATION TECHNOLOGY continued | | | | |
| IT Services 1.9% | | | | | | |
| Convergys Corp. * | | | | 5,715 | | $ 88,640 |
| |
|
| Semiconductors & Semiconductor Equipment 3.7% | | | | |
| Amkor Technology, Inc. * | | | | 11,305 | | 86,370 |
| International Rectifier Corp. * | | | | 2,975 | | 82,794 |
| |
|
| | | | | | | 169,164 |
| |
|
| MATERIALS 5.8% | | | | | | |
| Chemicals 5.8% | | | | | | |
| Albemarle Corp. | | | | 2,335 | | 84,667 |
| Celanese Corp., Ser. A | | | | 2,210 | | 82,168 |
| FMC Corp. | | | | 1,830 | | 97,283 |
| |
|
| | | | | | | 264,118 |
| |
|
| TELECOMMUNICATION SERVICES 1.9% | | | | |
| Diversified Telecommunication Services 1.9% | | | | |
| CenturyTel, Inc. | | | | 2,350 | | 86,738 |
| |
|
| UTILITIES 4.1% | | | | | | |
| Gas Utilities 2.0% | | | | | | |
| Energen Corp. | | | | 1,485 | | 93,407 |
| |
|
| Multi-Utilities 2.1% | | | | | | |
| MDU Resources Group, Inc. | | | | 3,695 | | 95,774 |
| |
|
| Total Common Stocks (cost $4,915,151) | | | | 4,502,613 |
| |
|
| SHORT-TERM INVESTMENTS 2.5% | | | | |
| MUTUAL FUND SHARES 2.5% | | | | |
| Evergreen Institutional U.S. Government Money Market Fund, Class I, 3.46% q ø | | | | |
| (cost $114,305) | | | | 114,305 | | 114,305 |
| |
|
| Total Investments (cost $5,029,456) 100.5% | | | | 4,616,918 |
| Other Assets and Liabilities (0.5%) | | | | (22,453) |
| |
|
| Net Assets 100.0% | | | | | | $ 4,594,465 |
| |
|
| * | Non-income producing security |
| q | Rate shown is the 7-day annualized yield at period end. |
| ø | Evergreen Investment Management Company, LLC is the investment advisor to both the Fund and the money market fund. |
See Notes to Financial Statements
12
SCHEDULE OF INVESTMENTS continued
January 31, 2008 (unaudited)
| The following table shows the percent of total long-term investments by sector as of January 31, 2008: |
| |
| Health Care | | 18.7% | |
| Information Technology | | 17.3% | |
| Financials | | 14.9% | |
| Industrials | | 13.3% | |
| Consumer Discretionary | | 10.4% | |
| Energy | | 9.5% | |
| Materials | | 5.9% | |
| Utilities | | 4.2% | |
| Consumer Staples | | 3.9% | |
| Telecommunication Services | | 1.9% | |
| | |
| |
| | | 100.0% | |
| | |
| |
See Notes to Financial Statements
13
STATEMENT OF ASSETS AND LIABILITIES
January 31, 2008 (unaudited)
| Assets | | |
| Investments in securities, at value (cost $4,915,151) | | $ 4,502,613 |
| Investments in affiliated money market fund, at value (cost $114,305) | | 114,305 |
|
| Total investments | | 4,616,918 |
| Dividends receivable | | 1,671 |
| Receivable from investment advisor | | 552 |
| Prepaid expenses and other assets | | 92,779 |
|
| Total assets | | 4,711,920 |
|
| Liabilities | | |
| Distribution Plan expenses payable | | 28 |
| Due to other related parties | | 7,344 |
| Accrued expenses and other liabilities | | 110,083 |
|
| Total liabilities | | 117,455 |
|
| Net assets | | $ 4,594,465 |
|
| Net assets represented by | | |
| Paid-in capital | | $ 5,009,071 |
| Undistributed net investment loss | | (2,068) |
| Net unrealized losses on investments | | (412,538) |
|
| Total net assets | | $ 4,594,465 |
|
| Net assets consists of | | |
| Class A | | $ 461,295 |
| Class B | | 458,663 |
| Class C | | 463,579 |
| Class I | | 3,210,928 |
|
| Total net assets | | $ 4,594,465 |
|
| Shares outstanding (unlimited number of shares authorized) | | |
| Class A | | 50,297 |
| Class B | | 50,000 |
| Class C | | 50,536 |
| Class I | | 350,000 |
|
| Net asset value per share | | |
| Class A | | $ 9.17 |
| Class A — Offering price (based on sales charge of 5.75%) | | $ 9.73 |
| Class B | | $ 9.17 |
| Class C | | $ 9.17 |
| Class I | | $ 9.17 |
|
See Notes to Financial Statements
14
STATEMENT OF OPERATIONS
Period Ended January 31, 2008 (unaudited) (a)
| Investment income | | |
| Dividends | | $ 4,485 |
| Income from affiliate | | 2,035 |
|
| Total investment income | | 6,520 |
|
| Expenses | | |
| Advisory fee | | 4,657 |
| Distribution Plan expenses | | |
| Class A | | 146 |
| Class B | | 581 |
| Class C | | 584 |
| Administrative services fee | | 582 |
| Transfer agent fees | | 7,346 |
| Trustees’ fees and expenses | | 689 |
| Printing and postage expenses | | 4,956 |
| Custodian and accounting fees | | 427 |
| Registration and filing fees | | 13,084 |
| Professional fees | | 4,559 |
| Other | | 179 |
|
| Total expenses | | 37,790 |
| Less: Expense reductions | | (7) |
| Fee waivers and expense reimbursements | | (29,195) |
|
| Net expenses | | 8,588 |
|
| Net investment loss | | (2,068) |
|
| Net change in unrealized gains or losses on investments | | (412,538) |
|
| Net decrease in net assets resulting from operations | | $ (414,606) |
|
| (a) For the period from December 17, 2007 (commencement of operations), to January 31, 2008. |
See Notes to Financial Statements
15
STATEMENT OF CHANGES IN NET ASSETS
| | | Period Ended |
| | | January 31, 2008 |
| | | (unaudited) (a) |
|
| Operations | | | | |
| Net investment loss | | $ (2,068) |
| Net change in unrealized gains or losses on investments | | | | (412,538) |
|
| Net decrease in net assets resulting from operations | | | | (414,606) |
|
| | | Shares | | |
| Capital share transactions | | | | |
| Proceeds from shares sold | | | | |
| Class A | | 50,297 | | 503,001 |
| Class B | | 50,000 | | 500,532 |
| Class C | | 50,536 | | 505,533 |
| Class I | | 350,000 | | 3,500,005 |
|
| Net increase in net assets resulting from capital share transactions | | | | 5,009,071 |
|
| Total increase in net assets | | | | 4,594,465 |
| Net assets | | | | |
| Beginning of period | | | | 0 |
|
| End of period | | $ 4,594,465 |
|
| Undistributed net investment loss | | $ (2,068) |
|
| |
| (a) For the period from December 17, 2007 (commencement of operations), to January 31, 2008. |
See Notes to Financial Statements
16
NOTES TO FINANCIAL STATEMENTS (unaudited)
1. ORGANIZATION
Evergreen Golden Core Opportunities Fund (the “Fund”) is a diversified series of Evergreen Equity Trust (the “Trust”), a Delaware statutory trust organized on September 18, 1997. The Trust is an open-end management investment company registered under the Investment Company Act of 1940, as amended (the “1940 Act”).
The Fund offers Class A, Class B, Class C and Class I shares. Class A shares are sold with a front-end sales charge. However, Class A share investments of $1 million or more are not subject to a front-end sales charge but are subject to a contingent deferred sales charge of 1.00% upon redemption within 18 months. Class B shares are sold without a front-end sales charge but are subject to a contingent deferred sales charge that is payable upon redemption and decreases depending on how long the shares have been held. Class C shares are sold without a front-end sales charge but are subject to a contingent deferred sales charge that is payable upon redemption within one year. Class I shares are sold without a front-end sales charge or contingent deferred sales charge. Each class of shares, except Class I shares, pays an ongoing distribution fee.
2. SIGNIFICANT ACCOUNTING POLICIES
The following is a summary of significant accounting policies consistently followed by the Fund in the preparation of its financial statements. The policies are in conformity with generally accepted accounting principles in the United States of America, which require management to make estimates and assumptions that affect amounts reported herein. Actual results could differ from these estimates.
a. Valuation of investments
Listed equity securities are usually valued at the last sales price or official closing price on the national securities exchange where the securities are principally traded.
Investments in open-end mutual funds are valued at net asset value. Securities for which market quotations are not readily available or not reflective of current market value are valued at fair value as determined by the investment advisor in good faith, according to procedures approved by the Board of Trustees.
b. Security transactions and investment income
Security transactions are recorded on trade date. Realized gains and losses are computed using the specific cost of the security sold. Dividend income is recorded on the ex-dividend date.
c. Federal taxes
The Fund intends to qualify as a regulated investment company and distribute all of its taxable income, including any net capital gains. Accordingly, no provision for federal taxes is required.
d. Distributions
Distributions to shareholders from net investment income and net realized gains, if any, are recorded on the ex-dividend date. Such distributions are determined in conformity with income tax regulations, which may differ from generally accepted accounting principles.
17
NOTES TO FINANCIAL STATEMENTS (unaudited) continued
e. Class allocations
Income, common expenses and realized and unrealized gains and losses are allocated to the classes based on the relative net assets of each class. Distribution fees, if any, are calculated daily at the class level based on the appropriate net assets of each class and the specific expense rates applicable to each class.
3. ADVISORY FEE AND OTHER TRANSACTIONS WITH AFFILIATES
Evergreen Investment Management Company, LLC (“EIMC”), an indirect, wholly-owned subsidiary of Wachovia Corporation (“Wachovia”), is the investment advisor to the Fund and is paid an annual fee starting at 0.80% and declining to 0.70% as average daily net assets increase. For the period ended January 31, 2008, the advisory fee was equivalent to 0.80% of the Fund’s average daily net assets (on an annualized basis).
Golden Capital Management, LLC (“Golden Capital”) is the investment sub-advisor to the Fund and is paid by EIMC for its services to the Fund. Wachovia Alternative Strategies, Inc., a wholly-owned subsidiary of Wachovia, owns a 45% minority interest in Golden Capital.
From time to time, EIMC may voluntarily or contractually waive its fee and/or reimburse expenses in order to limit operating expenses. During the period ended January 31, 2008, EIMC voluntarily waived its advisory fee in the amount of $4,657 and reimbursed other expenses in the amount of $24,538.
The Fund may invest in money market funds which are advised by EIMC. Income earned on these investments is included in income from affiliate on the Statement of Operations.
Effective January 1, 2008, EIMC replaced Evergreen Investment Services, Inc. (“EIS”), an indirect, wholly-owned subsidiary of Wachovia, as the administrator to the Fund upon the assignment of the Fund’s Administrative Services Agreement from EIS to EIMC. There were no changes to the services being provided or fees being paid by the Fund. The administrator provides the Fund with facilities, equipment and personnel and is paid an annual rate determined by applying percentage rates to the aggregate average daily net assets of the Evergreen funds (excluding money market funds and Evergreen Institutional Enhanced Income Fund), starting at 0.10% and declining to 0.05% as the aggregate average daily net assets of the Evergreen funds (excluding money market funds and Evergreen Institutional Enhanced Income Fund) increase.
Evergreen Service Company, LLC (“ESC”), an indirect, wholly-owned subsidiary of Wachovia, is the transfer and dividend disbursing agent for the Fund. ESC receives account fees that vary based on the type of account held by the shareholders in the Fund. For the period ended January 31, 2008, the transfer agent fees were equivalent to an annual rate of 1.26% of the Fund’s average daily net assets.
4. DISTRIBUTION PLANS
EIS serves as distributor of the Fund’s shares. The Fund has adopted Distribution Plans, as allowed by Rule 12b-1 of the 1940 Act, for each class of shares, except Class I. Under the
18
NOTES TO FINANCIAL STATEMENTS (unaudited) continued
Distribution Plans, distribution fees are paid at an annual rate of 0.25% of the average daily net assets for Class A shares and 1.00% of the average daily net assets for each of Class B and Class C shares.
5. INVESTMENT TRANSACTIONS
Cost of purchases and proceeds from sales of investment securities (excluding short-term securities) were $4,915,151 and $0, respectively, for the period ended January 31, 2008.
Various inputs are used in determining the value of the Fund’s investments. These inputs are summarized into three broad levels as follows:
Level 1 — quoted prices in active markets for identical securities
Level 2 — other significant observable inputs (including quoted prices for similar securities, interest rates, prepayment speeds, credit risk, etc.)
Level 3 — significant unobservable inputs (including the Fund’s own assumptions in determining the fair value of investments)
As of January 31, 2008, the inputs used in valuing the Fund’s assets, which are carried at fair value, were as follows:
| | | Valuation | | Investments |
| | | Inputs | | in Securities |
|
| Level 1 | | Quoted Prices | | $ 4,616,918 |
| Level 2 | | Other Significant | | |
| | | Observable Inputs | | 0 |
| Level 3 | | Significant | | |
| | | Unobservable | | |
| | | Inputs | | 0 |
| |
|
| Total | | | | $ 4,616,918 |
|
On January 31, 2008, the aggregate cost of securities for federal income tax purposes was $5,029,456. The gross unrealized appreciation and depreciation on securities based on tax cost was $26,098 and $438,636, respectively, with a net unrealized depreciation of $412,538.
6. INTERFUND LENDING
Pursuant to an Exemptive Order issued by the SEC, the Fund may participate in an interfund lending program with certain funds in the Evergreen fund family. This program allows the Fund to borrow from, or lend money to, other participating funds. During the period ended January 31, 2008, the Fund did not participate in the interfund lending program.
7. EXPENSE REDUCTIONS
Through expense offset arrangements with ESC and the Fund’s custodian, a portion of fund expenses has been reduced.
19
NOTES TO FINANCIAL STATEMENTS (unaudited) continued
8. DEFERRED TRUSTEES’ FEES
Each Trustee of the Fund may defer any or all compensation related to performance of his or her duties as a Trustee. The Trustees’ deferred balances are allocated to deferral accounts, which are included in the accrued expenses for the Fund. The investment performance of the deferral accounts is based on the investment performance of certain Evergreen funds. Any gains earned or losses incurred in the deferral accounts are reported in the Fund’s Trustees’ fees and expenses. At the election of the Trustees, the deferral account will be paid either in one lump sum or in quarterly installments for up to ten years.
9. REGULATORY MATTERS AND LEGAL PROCEEDINGS
Pursuant to an administrative order issued by the SEC on September 19, 2007, EIMC, EIS, ESC (collectively, the “Evergreen Entities”), Wachovia Securities, LLC and the SEC have entered into an agreement settling allegations of (i) improper short-term trading arrangements in effect prior to May 2003 involving former officers and employees of EIMC and certain broker-dealers, (ii) insufficient systems for monitoring exchanges and enforcing exchange limitations as stated in certain funds’ prospectuses, and (iii) inadequate e-mail retention practices. Under the settlement, the Evergreen Entities were censured and paid approximately $32 million in disgorgement and penalties. This amount, along with a fine assessed by the SEC against Wachovia Securities, LLC will be distributed pursuant to a plan to be developed by an independent distribution consultant and approved by the SEC. The Evergreen Entities neither admitted nor denied the allegations and findings set forth in its settlement with the SEC.
In addition, the Evergreen funds and EIMC and certain of its affiliates are involved in various legal actions, including private litigation and class action lawsuits. EIMC does not expect that any of such legal actions currently pending or threatened will have a material adverse impact on the financial position or operations of any of the Evergreen funds or on EIMC’s ability to provide services to the Evergreen funds.
Although EIMC believes that none of the matters discussed above will have a material adverse impact on the Evergreen funds, there can be no assurance that these matters and any publicity surrounding or resulting from them will not result in reduced sales or increased redemptions of Evergreen fund shares, which could increase Evergreen fund transaction costs or operating expenses, or that they will not have other adverse consequences on the Evergreen funds.
10. NEW ACCOUNTING PRONOUNCEMENTS
In June 2006, the Financial Accounting Standards Board (“FASB”) issued FASB Interpretation No. 48, Accounting for Uncertainty in Income Taxes — an interpretation of FASB statement 109 (“FIN 48”). FIN 48 supplements FASB 109 by prescribing a recognition threshold and measurement attribute for the financial statement recognition and measurement of a tax position taken or expected to be taken in a tax return. The Fund’s financial statements have not been impacted by the adoption of FIN 48. However, the conclusions regarding FIN 48 may be subject to review and adjustment at a later date based on factors including, but not limited to, further implemen-
20
NOTES TO FINANCIAL STATEMENTS (unaudited) continued
tation guidance expected from FASB, and on-going analysis of tax laws, regulations, and interpretations thereof.
In September 2006, FASB issued Statement of Financial Accounting Standards No. 157, Fair Value Measurements (“FAS 157”). FAS 157 establishes a single authoritative definition of fair value, establishes a framework for measuring fair value and expands disclosures about fair value measurements. FAS 157 applies to fair value measurements already required or permitted by existing standards. The change to current generally accepted accounting principles from the application of FAS 157 relates to the definition of fair value, the methods used to measure fair value, and the expanded disclosures about fair value measurements. The adoption of FAS 157 has not impacted the financial statement amounts, however, additional disclosures about the inputs used to develop the measurements and the effect of certain of the measurements on changes in net assets for the current period have been incorporated into this shareholder report as required.
21
ADDITIONAL INFORMATION (unaudited)
INFORMATION ABOUT THE REVIEW AND APPROVAL OF THE FUND’S INVESTMENT ADVISORY AGREEMENT
The Fund’s Board of Trustees considered the proposed investment advisory agreement between the Fund and EIMC and the proposed sub-advisory agreement between EIMC and Golden Capital Management, LLC (“Golden Capital”) at a meeting held in December of 2007. At that meeting, the Trustees, including a majority of the Trustees who are not interested persons (as that term is defined in the 1940 Act) of the Fund, Golden Capital, or EIMC approved the Fund’s investment advisory agreements. (References below to the “Fund” are to Evergreen Golden Core Opportunities Fund; references to the “funds” are to the Evergreen funds generally.)
The Board of Trustees regularly meets with representatives of Evergreen Investments (“Evergreen”) during the course of the year, and met with representatives of Golden Capital in December of 2007, and, in considering the advisory and administrative arrangements for the Fund, the Trustees took into account information provided in those meetings.
The disinterested Trustees discussed the approval of the investment advisory agreements with representatives of Evergreen and with legal counsel. In all of its deliberations with respect to the Fund and the investment advisory agreements, the Board of Trustees and the disinterested Trustees were advised by independent counsel to the disinterested Trustees and counsel to the Fund. In considering the investment advisory agreements, the Trustees did not identify any particular information or consideration that was all-important or controlling, and each Trustee attributed different weights to various factors. This summary describes a number of the most important, but not necessarily all, of the factors considered by the Board and the disinterested Trustees.
The Trustees considered that EIMC and its affiliates generally provide a comprehensive investment management service to the funds. They noted that EIMC and Golden Capital would formulate and implement an investment program for the Fund. They noted that EIMC makes its personnel available to serve as officers of the funds and concluded that the reporting and management functions provided by EIMC with respect to the funds were generally satisfactory. In considering approval of the Fund’s investment advisory agreements with EIMC and Golden Capital, the Trustees considered, among other factors, Golden Capital’s portfolio management team’s investment approach; information regarding Golden Capital’s historical investment performance, as represented by the performance of other investment funds and a composite of accounts managed by Golden Capital, in comparison to comparable funds and the Russell 2500 Index; the fees to be paid by the Fund to EIMC and affiliates of EIMC and by EIMC to Golden Capital; and the estimated expenses that the Fund would pay after its launch. On the basis of these factors, they determined that Golden Capital appeared qualified to manage the Fund.
The Trustees also considered the proposed investment advisory fee to be paid by the Fund in comparison to comparable mutual funds and to other comparable accounts managed by Evergreen and concluded that the proposed fees and contractual arrangements appeared reasonable and appropriate. The Trustees considered whether further growth in assets of the Fund might
22
ADDITIONAL INFORMATION (unaudited) continued
result in economies of scale and noted that the Fund was in its start-up phase and that the advisory fee for the Fund contemplated breakpoints starting at $1 billion. The Trustees also relied, in part, on comparisons of the Fund’s projected fees and expenses to the fees and expenses of other peer mutual funds, based on data compiled by Evergreen from information provided by an independent data provider. In their consideration of the fees to be paid by the Fund, the Trustees considered information provided by EIMC regarding the projected profitability of the Fund to EIMC.
23
This page left intentionally blank
24
This page left intentionally blank
25
This page left intentionally blank
26
This page left intentionally blank
27
TRUSTEES AND OFFICERS
TRUSTEES1
| Charles A. Austin III | | Investment Counselor, Anchor Capital Advisors, LLC. (investment advice); Director, The Andover |
| Trustee | | Companies (insurance); Trustee, Arthritis Foundation of New England; Former Director, The |
| DOB: 10/23/1934 | | Francis Ouimet Society (scholarship program); Former Director, Executive Vice President and |
| Term of office since: 1991 | | Treasurer, State Street Research & Management Company (investment advice) |
| Other directorships: None | | |
|
| |
| K. Dun Gifford | | Chairman and President, Oldways Preservation and Exchange Trust (education); Trustee, |
| Trustee | | Chairman of the Finance Committee, Member of the Executive Committee, and Former |
| DOB: 10/23/1938 | | Treasurer, Cambridge College |
| Term of office since: 1974 | | |
| Other directorships: None | | |
|
| |
| Dr. Leroy Keith, Jr. | | Managing Director, Almanac Capital Management (commodities firm); Trustee, Phoenix |
| Trustee | | Fund Complex; Director, Diversapack Co. (packaging company); Former Partner, Stonington |
| DOB: 2/14/1939 | | Partners, Inc. (private equity fund); Former Director, Obagi Medical Products Co.; Former |
| Term of office since: 1983 | | Director, Lincoln Educational Services |
| Other directorships: Trustee, | | |
| Phoenix Fund Complex (consisting | | |
| of 53 portfolios as of 12/31/2007) | | |
|
| |
| Carol A. Kosel1 | | Former Consultant to the Evergreen Boards of Trustees; Former Vice President and Senior Vice |
| Trustee | | President, Evergreen Investments, Inc.; Former Treasurer, Evergreen Funds; Former Treasurer, |
| DOB: 12/25/1963 | | Vestaur Securities Fund |
| Term of office since: 2008 | | |
| Other directorships: None | | |
|
| |
| Gerald M. McDonnell | | Former Manager of Commercial Operations, CMC Steel (steel producer) |
| Trustee | | |
| DOB: 7/14/1939 | | |
| Term of office since: 1988 | | |
| Other directorships: None | | |
|
| |
| Patricia B. Norris | | President and Director of Buckleys of Kezar Lake, Inc. (real estate company); Former President |
| Trustee | | and Director of Phillips Pond Homes Association (home community); Former Partner, |
| DOB: 4/9/1948 | | PricewaterhouseCoopers, LLP (independent registered public accounting firm) |
| Term of office since: 2006 | | |
| Other directorships: None | | |
|
| |
| William Walt Pettit | | Partner and Vice President, Kellam & Pettit, P.A. (law firm); Director, Superior Packaging Corp. |
| Trustee | | (packaging company); Member, Superior Land, LLC (real estate holding company), Member, |
| DOB: 8/26/1955 | | K&P Development, LLC (real estate development); Former Director, National Kidney Foundation |
| Term of office since: 1988 | | of North Carolina, Inc. (non-profit organization) |
| Other directorships: None | | |
|
| |
| David M. Richardson | | President, Richardson, Runden LLC (executive recruitment advisory services); Director, J&M |
| Trustee | | Cumming Paper Co. (paper merchandising); Trustee, NDI Technologies, LLP (communications); |
| DOB: 9/19/1941 | | Former Consultant, AESC (The Association of Executive Search Consultants) |
| Term of office since: 1982 | | |
| Other directorships: None | | |
|
| |
| Dr. Russell A. Salton III | | President/CEO, AccessOne MedCard, Inc. |
| Trustee | | |
| DOB: 6/2/1947 | | |
| Term of office since: 1984 | | |
| Other directorships: None | | |
28
TRUSTEES AND OFFICERS continued
| Michael S. Scofield | | Retired Attorney, Law Offices of Michael S. Scofield; Former Director and Chairman, Branded |
| Trustee | | Media Corporation (multi-media branding company) |
| DOB: 2/20/1943 | | |
| Term of office since: 1984 | | |
| Other directorships: None | | |
|
| |
| Richard J. Shima | | Independent Consultant; Director, Hartford Hospital; Trustee, Greater Hartford YMCA; Former |
| Trustee | | Director, Trust Company of CT; Former Director, Old State House Association; Former Trustee, |
| DOB: 8/11/1939 | | Saint Joseph College (CT) |
| Term of office since: 1993 | | |
| Other directorships: None | | |
|
| |
| Richard K. Wagoner, CFA2 | | Member and Former President, North Carolina Securities Traders Association; Member, Financial |
| Trustee | | Analysts Society |
| DOB: 12/12/1937 | | |
| Term of office since: 1999 | | |
| Other directorships: None | | |
|
| |
| |
| OFFICERS | | |
| |
| Dennis H. Ferro3 | | Principal occupations: President and Chief Executive Officer, Evergreen Investment Company, |
| President | | Inc. and Executive Vice President, Wachovia Bank, N.A.; former Chief Investment Officer, |
| DOB: 6/20/1945 | | Evergreen Investment Company, Inc. |
| Term of office since: 2003 | | |
|
| |
| Jeremy DePalma4 | | Principal occupations: Senior Vice President, Evergreen Investment Management Company, LLC; |
| Treasurer | | Former Vice President, Evergreen Investment Services, Inc.; Former Assistant Vice President, |
| DOB: 2/5/1974 | | Evergreen Investment Services, Inc. |
| Term of office since: 2005 | | |
|
| |
| Michael H. Koonce4 | | Principal occupations: Senior Vice President and General Counsel, Evergreen Investment |
| Secretary | | Services, Inc.; Secretary, Senior Vice President and General Counsel, Evergreen Investment |
| DOB: 4/20/1960 | | Management Company, LLC and Evergreen Service Company, LLC; Senior Vice President and |
| Term of office since: 2000 | | Assistant General Counsel, Wachovia Corporation |
|
| |
| Robert Guerin4 | | Principal occupations: Chief Compliance Officer, Evergreen Funds and Senior Vice President of |
| Chief Compliance Officer | | Evergreen Investments Co, Inc; Former Managing Director and Senior Compliance Officer, |
| DOB: 9/20/1965 | | Babson Capital Management LLC; Former Principal and Director, Compliance and Risk |
| Term of office since: 2007 | | Management, State Street Global Advisors; Former Vice President and Manager, Sales Practice |
| | | Compliance, Deutsche Asset Management. |
|
1 Each Trustee, except Mses. Kosel and Norris, serves until a successor is duly elected or qualified or until his or her death, resignation, retirement or removal from office. As new Trustees, Ms. Kosel’s and Ms. Norris’ initial terms end December 31, 2010 and June 30, 2009, respectively, at which times they may be re-elected by Trustees to serve until a successor is duly elected or qualified or until her death, resignation, retirement or removal from office by the Trustees. Each Trustee, except Ms. Kosel, oversaw 93 Evergreen funds as of December 31, 2007. Ms. Kosel became a Trustee on January 1, 2008. Correspondence for each Trustee may be sent to Evergreen Board of Trustees, P.O. Box 20083, Charlotte, NC 28202.
2 Mr. Wagoner is an “interested person” of the Fund because of his ownership of shares in Wachovia Corporation, the parent to the Fund’s investment advisor.
3 The address of the Officer is 401 S. Tryon Street, 20th Floor, Charlotte, NC 28288.
4 The address of the Officer is 200 Berkeley Street, Boston, MA 02116.
Additional information about the Fund’s Board of Trustees and Officers can be found in the Statement of Additional Information (SAI) and is available upon request without charge by calling 800.343.2898.
29

581816 rv1 03/2008
Evergreen Golden Large Cap Core Fund
| | | table of contents |
| 1 | | LETTER TO SHAREHOLDERS |
| 4 | | FUND AT A GLANCE |
| 6 | | ABOUT YOUR FUND’S EXPENSES |
| 7 | | FINANCIAL HIGHLIGHTS |
| 11 | | SCHEDULE OF INVESTMENTS |
| 14 | | STATEMENT OF ASSETS AND LIABILITIES |
| 15 | | STATEMENT OF OPERATIONS |
| 16 | | STATEMENT OF CHANGES IN NET ASSETS |
| 17 | | NOTES TO FINANCIAL STATEMENTS |
| 22 | | ADDITIONAL INFORMATION |
| 24 | | TRUSTEES AND OFFICERS |
This semiannual report must be preceded or accompanied by a prospectus of the Evergreen fund contained herein. The prospectus contains more complete information, including fees and expenses, and should be read carefully before investing or sending money.
The fund will file its complete schedule of portfolio holdings with the SEC for the first and third quarters of each fiscal year on Form N-Q. The fund’s Form N-Q will be available on the SEC’s Web site at http://www.sec.gov. In addition, the fund’s Form N-Q may be reviewed and copied at the SEC’s Public Reference Room in Washington, D.C. Information on the operation of the Public Reference Room may be obtained by calling 800.SEC.0330.
A description of the fund’s proxy voting policies and procedures, as well as information regarding how the fund voted proxies relating to portfolio securities during the most recent 12-month period ended June 30, is available by visiting our Web site at EvergreenInvestments.com or by visiting the SEC’s Web site at http://www.sec.gov. The fund’s proxy voting policies and procedures are also available without charge, upon request, by calling 800.343.2898.
| Mutual Funds: | | | | |
| NOT FDIC INSURED | | MAY LOSE VALUE | | NOT BANK GUARANTEED |
Evergreen InvestmentsSM is a service mark of Evergreen Investment Management Company, LLC.
Copyright 2008, Evergreen Investment Management Company, LLC.
Evergreen Investment Management Company, LLC is a subsidiary of Wachovia Corporation
and is an affiliate of Wachovia Corporation’s other Broker Dealer subsidiaries.
Evergreen mutual funds are distributed by Evergreen Investment Services, Inc.
200 Berkeley Street, Boston, MA 02116
LETTER TO SHAREHOLDERS
March 2008

Dennis H. Ferro
President and Chief Executive Officer
Dear Shareholder:
We are pleased to provide the Semiannual Report for Evergreen Golden Large Cap Core Fund, covering the period from December 17, 2007 through January 31, 2008.
Each of the three Golden funds is managed with the investment strategies developed by Golden Capital Management, LLC (“Golden Capital”), a firm that successfully manages core and enhanced index equity portfolios for institutional and high net worth individual investors. Evergreen Golden Large Cap Core Fund is managed to invest in securities of companies diversified across the major economic sectors, with at least 80% of net assets invested in shares of large cap companies with characteristics similar to those typically found in the Standard & Poor’s 500 Index. Evergreen Golden Mid Cap Core Fund is managed to invest in securities of companies, with at least 80% of net assets invested in the stocks of mid cap companies similar to those found in the Russell Midcap Index. The third fund, Evergreen Golden Core Opportunities Fund, is designed to invest in securities of companies diversified across the major sectors, with at least 80% of net assets invested in stocks of small to mid cap companies similar to those found in the Russell 2500 Index.
We are proud to be able to offer retail investors these three mutual funds that follow Golden Capital’s discipline, which combines fundamental equity research and a quantitative approach in pursuit of consistent, long-term returns. As sub-advisor, Golden Capital is responsible for day-to-day portfolio management of these three funds, while Evergreen Investment Management Company, LLC serves as the investment advisor.
1
LETTER TO SHAREHOLDERS continued
The funds were launched during a challenging period in the domestic equity market. Problems that first appeared in the housing and subprime mortgage markets led to a tightening of credit, which in turn contributed to widening fears of a dramatic deceleration in the economy’s expansion late in 2007 and early in 2008. As the economy weakened, equity prices generally declined across companies of all sizes. Large cap stocks held up somewhat better than mid cap and small cap shares, while growth stocks outperformed more economically sensitive value stocks. Fixed income investors, meanwhile, sought out the highest-quality securities and attempted to avoid credit risk. Longer-maturity Treasuries outperformed other sectors, while the prices of corporate bonds and many asset-backed securities fell as the yield spreads between Treasuries and lower-rated securities widened. In this environment, the price of gold surged while the dollar remained weak.
The U.S. economy exhibited increasing signs of weakness in the latter half of 2007 and the first month of 2008 after experiencing solid growth early in 2007. Although housing and credit-related concerns began weighing on investor sentiment early in the year, the economy’s growth trajectory continued to be supported early in 2007 by the combination of solid trends in employment, income, investment and export trends. That began to change in the latter months of 2007, however, as each of these pillars of support began to weaken. Growth in Gross Domestic Product rose by just 0.6% during the final quarter of 2007 as economic output slowed because of a sharp reduction in business inventories. Corporate earnings growth, meanwhile, fell over the second half of 2007. Payrolls dropped by 17,000 in January 2008, contributing to growing concerns about the outlook for consumer spending, which accounts for up to 70% of economic output. Faced with growing evidence of the economy’s deceleration, the Federal Reserve Board (the “Fed”) began to focus more on stimulating growth and less on watching inflation. The Fed cut the target fed funds rate from 5.25% to 4.25% during the last four months of 2007
2
LETTER TO SHAREHOLDERS continued
and then slashed the rate by an additional 1.25% in two separate actions within just eight days of each other in January 2008. Also in early 2008, Congress passed, and President Bush signed, a $168 billion fiscal stimulus bill that contained rebates for taxpayers, tax breaks for businesses and additional assistance for Social Security recipients and disabled veterans.
We believe the experiences in the investment markets in recent months have underscored the value of a well-diversified, long-term investment strategy to help soften the effects of volatility in any one market or asset class. As always, we encourage investors to maintain diversified investment portfolios in pursuit of their long-term investment goals.
Please visit us at EvergreenInvestments.com for more information about our funds and other investment products available to you. Thank you for your continued support of Evergreen Investments.
Sincerely,

Dennis H. Ferro
President and Chief Executive Officer
Evergreen Investment Company, Inc.
Special Notice to Shareholders:
Please visit our Web site at EvergreenInvestments.com for statements from President and Chief Executive Officer, Dennis Ferro, regarding the firm’s recent settlement with the Securities and Exchange Commission (SEC) and prior settlement with the Financial Industry Regulatory Authority (FINRA).
3
FUND AT A GLANCE
as of January 31, 2008
MANAGEMENT TEAM
Investment Advisor:
• Evergreen Investment Management Company, LLC
Sub-Advisor:
• Golden Capital Management, LLC
Portfolio Manager:
• Jeff C. Moser, CFA
CURRENT INVESTMENT STYLE
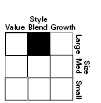
Source: Morningstar, Inc.
Morningstar’s style box is based on a portfolio date as of 12/31/2007.
The Equity style box placement is based on 10 growth and valuation measures for each fund holding and the median size of the companies in which the fund invests.
PERFORMANCE AND RETURNS
Portfolio inception date: 12/17/2007
| | | Class A | | Class B | | Class C | | Class I |
| Class inception date | | 12/17/2007 | | 12/17/2007 | | 12/17/2007 | | 12/17/2007 |
|
| Nasdaq symbol | | EGOAX | | EGOBX | | EGOCX | | EGOIX |
|
| Cumulative return | | | | | | | | |
|
| Since portfolio inception with sales charge | | -11.31% | | -10.51% | | -6.74% | | N/A |
|
| Since portfolio inception w/o sales charge | | -5.90% | | -5.80% | | -5.80% | | -5.80% |
|
| Maximum sales charge | | 5.75% | | 5.00% | | 1.00% | | N/A |
| | | Front-end | | CDSC | | CDSC | | |
|
Past performance is no guarantee of future results. The performance quoted represents past performance and current performance may be lower or higher. The investment return and principal value of an investment will fluctuate so that investors’ shares, when redeemed, may be worth more or less than their original cost. To obtain performance information current to the most recent month-end for Classes A, B, C or I, please go to EvergreenInvestments.com/fundperformance. The performance of each class may vary based on differences in loads, fees and expenses paid by the shareholders investing in each class. Performance includes the reinvestment of income dividends and capital gain distributions. Performance shown does not reflect the deduction of taxes that a shareholder would pay on fund distributions or the redemption of fund shares.
Performance results are extremely short term, and may not provide an adequate basis for evaluating a fund’s performance over varying market conditions or economic cycles. Unusual investment returns may be a result of a fund’s recent inception, existing market and economic conditions and the increased potential of a small number of stocks affecting fund performance due to the smaller asset size. Most mutual funds are intended to be long-term investments.
The fund incurs a 12b-1 fee of 0.25% for Class A and 1.00% for Classes B and C. Class I does not pay a 12b-1 fee.
The advisor is waiving its advisory fee and reimbursing the fund for a portion of other expenses. Had the fee not been waived and expenses not reimbursed, returns would have been lower.
4
FUND AT A GLANCE continued
Class I shares are only offered in the following manner: (1) to investment advisory clients of Evergreen Investment Management Company, LLC (or its advisory affiliates) when purchased by such advisor(s) on behalf of its clients, (2) to certain mutual fund wrap program clients of Wachovia Securities and of third-party broker/dealers when purchased through a clearing relationship with Wachovia Securities or an affiliate providing mutual fund clearing services, (3) through arrangements entered into on behalf of the Evergreen funds with certain financial services firms, (4) to certain institutional investors, and (5) to persons who owned Class Y shares in registered name in an Evergreen fund on or before December 31, 1994 or who owned shares of any SouthTrust fund in registered name as of March 18, 2005 or who owned shares of Vestaur Securities Fund as of May 20, 2005.
Class I shares are only available to institutional shareholders with a minimum of $1 million investment, which may be waived in certain situations.
The fund’s investment objective may be changed without a vote of the fund’s shareholders.
Mid cap securities may be subject to special risks associated with narrower product lines and limited financial resources compared to their large cap counterparts, and, as a result, mid cap securities may decline significantly in market downturns.
Since the fund tends to invest in a smaller number of stocks than many similar mutual funds, changes in the value of individual stocks may have a larger impact on its net asset value than such fluctuations would if the fund were more broadly invested.
The stocks of smaller companies may be more volatile than those of larger companies due to the higher risk of failure.
All data is as of January 31, 2008, and subject to change.
5
ABOUT YOUR FUND’S EXPENSES
The Example below is intended to describe the fees and expenses borne by shareholders and the impact of those costs on your investment.
Example
As a shareholder of the fund, you incur two types of costs: (1) transaction costs, including sales charges (loads), redemption fees and exchange fees; and (2) ongoing costs, including management fees, distribution (12b-1) fees and other fund expenses. This Example is intended to help you understand your ongoing costs (in dollars) of investing in the fund and to compare these costs with the ongoing costs of investing in other mutual funds. The actual expense Example for each class is based on an investment of $1,000 invested at the beginning of the period and held for the entire period from December 17, 2007 (commencement of each class’ operations) to January 31, 2008. The hypothetical expense Example for each class is based on an investment of $1,000 invested at the beginning of the period and held for the entire period from August 1, 2007 to January 31, 2008.
The example illustrates your fund’s costs in two ways:
- Actual expenses
The section in the table under the heading “Actual” provides information about actual account values and actual expenses. You may use the information in these columns, together with the amount you invested, to estimate the expenses that you paid over the period. Simply divide your account value by $1,000 (for example, an $8,600 account value divided by $1,000 = 8.6), then multiply the result by the number in the appropriate column for your share class, in the column entitled “Expenses Paid During Period” to estimate the expenses you paid on your account during this period. - Hypothetical example for comparison purposes
The section in the table under the heading “Hypothetical (5% return before expenses)” provides information about hypothetical account values and hypothetical expenses based on the fund’s actual expense ratio and an assumed rate of return of 5% per year before expenses, which is not the fund’s actual return. The hypothetical account values and expenses may not be used to estimate the actual ending account balance or expenses you paid for the period. You may use this information to compare the ongoing costs of investing in the fund and other funds. To do so, compare this 5% hypothetical example with the 5% hypothetical examples that appear in the shareholder reports of the other funds.
Please note that the expenses shown in the table are meant to highlight your ongoing costs only and do not reflect any transactional costs, such as sales charges (loads), redemption fees or exchange fees. Therefore, the section in the table under the heading “Hypothetical (5% return before expenses)” is useful in comparing ongoing costs only, and will not help you determine the relative total costs of owning different funds. In addition, if these transactional costs were included, your costs would have been higher.
| | | Beginning | | Ending | | Expenses |
| | | Account | | Account | | Paid During |
| | | Value | | Value | | Period |
|
| Actual | | | | | | |
| Class A | | $ 1,000.00 | | $ 941.00 | | $ 1.37* |
| Class B | | $ 1,000.00 | | $ 942.00 | | $ 2.27* |
| Class C | | $ 1,000.00 | | $ 942.00 | | $ 2.27* |
| Class I | | $ 1,000.00 | | $ 942.00 | | $ 1.07* |
| Hypothetical | | | | | | |
| (5% return | | | | | | |
| before expenses) | | | | | | |
| Class A | | $ 1,000.00 | | $ 1,019.36 | | $ 5.84** |
| Class B | | $ 1,000.00 | | $ 1,015.58 | | $ 9.63** |
| Class C | | $ 1,000.00 | | $ 1,015.58 | | $ 9.63** |
| Class I | | $ 1,000.00 | | $ 1,020.61 | | $ 4.57** |
|
* For each class of the Fund, expenses are equal to the annualized expense ratio of each class (1.15% for Class A, 1.90% for Class B, 1.90% for Class C and 0.90% for Class I), multiplied by the average account value over the period since each class’ commencement of operations (December 17, 2007), multiplied by 45 / 366 days.
** For each class of the Fund, expenses are equal to the annualized expense ratio of each class (1.15% for Class A, 1.90% for Class B, 1.90% for Class C and 0.90% for Class I), multiplied by the average account value over the period, multiplied by 184 / 366 days.
6
FINANCIAL HIGHLIGHTS
(For a share outstanding throughout the period)
| | | Period Ended |
| | | January 31, 20081 |
| CLASS A | | (unaudited) |
|
| Net asset value, beginning of period | | $10.00 |
|
| Income from investment operations | | |
| Net investment income (loss) | | 0 |
| Net realized and unrealized gains or losses on investments | | (0.59) |
|
| Net asset value, end of period | | $ 9.41 |
|
| Total return2 | | (5.90%) |
|
| Ratios and supplemental data | | |
| Net assets, end of period (thousands) | | $ 471 |
| Ratios to average net assets | | |
| Expenses including waivers/reimbursements but excluding expense reductions | | 1.15%3 |
| Expenses excluding waivers/reimbursements and expense reductions | | 5.72%3 |
| Net investment income (loss) | | 0.29%3 |
| Portfolio turnover rate | | 2% |
|
1 For the period from December 17, 2007 (commencement of class operations), to January 31, 2008.
2 Excluding applicable sales charges
3 Annualized
See Notes to Financial Statements
7
FINANCIAL HIGHLIGHTS
(For a share outstanding throughout the period)
| | | Period Ended |
| | | January 31, 20081 |
| CLASS B | | (unaudited) |
|
| Net asset value, beginning of period | | $10.00 |
|
| Income from investment operations | | |
| Net investment income (loss) | | (0.01) |
| Net realized and unrealized gains or losses on investments | | (0.57) |
| |
|
| Total from investment operations | | (0.58) |
|
| Net asset value, end of period | | $ 9.42 |
|
| Total return2 | | (5.80%) |
|
| Ratios and supplemental data | | |
| Net assets, end of period (thousands) | | $ 471 |
| Ratios to average net assets | | |
| Expenses including waivers/reimbursements but excluding expense reductions | | 1.90%3 |
| Expenses excluding waivers/reimbursements and expense reductions | | 6.47%3 |
| Net investment income (loss) | | (0.46%)3 |
| Portfolio turnover rate | | 2% |
|
1 For the period from December 17, 2007 (commencement of class operations), to January 31, 2008.
2 Excluding applicable sales charges
3 Annualized
See Notes to Financial Statements
8
FINANCIAL HIGHLIGHTS
(For a share outstanding throughout the period)
| | | Period Ended |
| | | January 31, 20081 |
| CLASS C | | (unaudited) |
|
| Net asset value, beginning of period | | $10.00 |
|
| Income from investment operations | | |
| Net investment income (loss) | | (0.01) |
| Net realized and unrealized gains or losses on investments | | (0.57) |
| |
|
| Total from investment operations | | (0.58) |
|
| Net asset value, end of period | | $ 9.42 |
|
| Total return2 | | (5.80%) |
|
| Ratios and supplemental data | | |
| Net assets, end of period (thousands) | | $ 476 |
| Ratios to average net assets | | |
| Expenses including waivers/reimbursements but excluding expense reductions | | 1.90%3 |
| Expenses excluding waivers/reimbursements and expense reductions | | 6.47%3 |
| Net investment income (loss) | | (0.46%)3 |
| Portfolio turnover rate | | 2% |
|
1 For the period from December 17, 2007 (commencement of class operations), to January 31, 2008.
2 Excluding applicable sales charges
3 Annualized
See Notes to Financial Statements
9
FINANCIAL HIGHLIGHTS
(For a share outstanding throughout the period)
| | | Period Ended |
| | | January 31, 20081 |
| CLASS I | | (unaudited) |
|
| Net asset value, beginning of period | | $10.00 |
|
| Income from investment operations | | |
| Net investment income (loss) | | 0.01 |
| Net realized and unrealized gains or losses on investments | | (0.59) |
| |
|
| Total from investment operations | | (0.58) |
|
| Net asset value, end of period | | $ 9.42 |
|
| Total return | | (5.80%) |
|
| Ratios and supplemental data | | |
| Net assets, end of period (thousands) | | $3,296 |
| Ratios to average net assets | | |
| Expenses including waivers/reimbursements but excluding expense reductions | | 0.90%2 |
| Expenses excluding waivers/reimbursements and expense reductions | | 5.47%2 |
| Net investment income (loss) | | 0.54%2 |
| Portfolio turnover rate | | 2% |
|
1 For the period from December 17, 2007 (commencement of class operations), to January 31, 2008.
2 Annualized
See Notes to Financial Statements
10
SCHEDULE OF INVESTMENTS
January 31, 2008 (unaudited)
| | | | | | | Shares | | Value |
|
| |
| COMMON STOCKS 98.6% | | | | | | |
| CONSUMER DISCRETIONARY 7.9% | | | | |
| Hotels, Restaurants & Leisure 1.9% | | | | |
| McDonald’s Corp. | | | | | | 1,625 | | $ 87,019 |
| |
|
| Household Durables 2.0% | | | | | | |
| Newell Rubbermaid, Inc. | | | | | | 3,965 | | 95,636 |
| |
|
| Specialty Retail 2.0% | | | | | | |
| Sherwin-Williams Co. | | | | | | 1,660 | | 94,968 |
| |
|
| Textiles, Apparel & Luxury Goods 2.0% | | | | |
| Nike, Inc., Class B | | | | | | 1,545 | | 95,419 |
| |
|
| CONSUMER STAPLES 5.7% | | | | | | |
| Food Products 1.9% | | | | | | | | |
| Kellogg Co. | | | | | | 1,845 | | 88,375 |
| |
|
| Household Products 3.8% | | | | | | |
| Clorox Co. | | | | | | 1,510 | | 92,593 |
| Procter & Gamble Co. | | | | | | 1,345 | | 88,703 |
| |
|
| | | | | | | | | 181,296 |
| |
|
| ENERGY 10.1% | | | | | | | | |
| Energy Equipment & Services 2.1% | | | | |
| Tidewater, Inc. | | | | | | 1,840 | | 97,446 |
| |
|
| Oil, Gas & Consumable Fuels 8.0% | | | | |
| Chevron Corp. | | | | | | 1,080 | | 91,260 |
| ConocoPhillips | | | | | | 1,195 | | 95,983 |
| Exxon Mobil Corp. | | | | | | 1,090 | | 94,176 |
| Occidental Petroleum Corp. | | | | 1,400 | | 95,018 |
| |
|
| | | | | | | | | 376,437 |
| |
|
| FINANCIALS 18.6% | | | | | | | | |
| Capital Markets 4.1% | | | | | | |
| Bank of New York Mellon Corp. | | | | 2,070 | | 96,524 |
| Goldman Sachs Group, Inc. | | | | 470 | | 94,362 |
| |
|
| | | | | | | | | 190,886 |
| |
|
| Diversified Financial Services 4.4% | | | | |
| Bank of America Corp. | | | | | | 2,360 | | 104,666 |
| JPMorgan Chase & Co. | | | | | | 2,200 | | 104,610 |
| |
|
| | | | | | | | | 209,276 |
| |
|
| Insurance 10.1% | | | | | | | | |
| ACE, Ltd | | | | | | 1,655 | | 96,553 |
| American International Group, Inc. | | | | 1,780 | | 98,185 |
| AON Corp. | | | | | | 2,025 | | 88,128 |
| Chubb Corp. | | | | | | 1,880 | | 97,365 |
| MetLife, Inc. | | | | | | 1,605 | | 94,647 |
| |
|
| | | | | | | | | 474,878 |
| |
|
See Notes to Financial Statements
11
SCHEDULE OF INVESTMENTS continued
January 31, 2008 (unaudited)
| | | | | | | | | Shares | | Value |
|
| COMMON STOCKS continued | | | | | | | | |
| HEALTH CARE 15.5% | | | | | | | | | | |
| Health Care Equipment & Supplies 4.4% | | | | | | |
| Baxter International, Inc. | | | | | | | | 1,705 | | $ 103,562 |
| Becton Dickinson & Co. | | | | | | | | 1,205 | | 104,268 |
| |
|
| | | | | | | | | | | 207,830 |
| |
|
| Health Care Providers & Services 3.8% | | | | | | |
| Aetna, Inc. | | | | | | | | 1,710 | | 91,075 |
| CIGNA Corp. | | | | | | | | 1,845 | | 90,700 |
| |
|
| | | | | | | | | | | 181,775 |
| |
|
| Pharmaceuticals 7.3% | | | | | | | | |
| Bristol-Myers Squibb Co. | | | | | | | | 3,940 | | 91,369 |
| Johnson & Johnson | | | | | | | | 1,470 | | 92,992 |
| Merck & Co., Inc. | | | | | | | | 1,665 | | 77,056 |
| Wyeth | | | | | | | | 2,050 | | 81,590 |
| |
|
| | | | | | | | | | | 343,007 |
| |
|
| INDUSTRIALS 13.5% | | | | | | | | | | |
| Aerospace & Defense 4.1% | | | | | | | | |
| Lockheed Martin Corp. | | | | | | | | 900 | | 97,128 |
| United Technologies Corp. | | | | | | | | 1,295 | | 95,066 |
| |
|
| | | | | | | | | | | 192,194 |
| |
|
| Electrical Equipment 1.8% | | | | | | | | |
| Cooper Industries, Inc. | | | | | | | | 1,895 | | 84,403 |
| |
|
| Industrial Conglomerates 1.9% | | | | | | | | |
| 3M Co. | | | | | | | | 1,145 | | 91,199 |
| |
|
| Machinery 5.7% | | | | | | | | | | |
| Danaher Corp. | | | | | | | | 1,155 | | 85,990 |
| Eaton Corp. | | | | | | | | 1,110 | | 91,864 |
| Terex Corp. * | | | | | | | | 1,565 | | 91,959 |
| |
|
| | | | | | | | | | | 269,813 |
| |
|
| INFORMATION TECHNOLOGY 19.6% | | | | | | |
| Computers & Peripherals 3.9% | | | | | | | | |
| Hewlett-Packard Co. | | | | | | | | 1,910 | | 83,562 |
| International Business Machines Corp. | | | | | | 940 | | 100,900 |
| |
|
| | | | | | | | | | | 184,462 |
| |
|
| Electronic Equipment & Instruments 2.0% | | | | | | |
| Agilent Technologies, Inc. * | | | | | | 2,735 | | 92,744 |
| |
|
| Office Electronics 2.0% | | | | | | | | |
| Xerox Corp. | | | | | | | | 6,140 | | 94,556 |
| |
|
| Semiconductors & Semiconductor Equipment 3.8% | | | | |
| Applied Materials, Inc. | | | | | | | | 5,585 | | 100,083 |
| Intel Corp. | | | | | | | | 3,780 | | 80,136 |
| |
|
| | | | | | | | | | | 180,219 |
| |
|
See Notes to Financial Statements
12
SCHEDULE OF INVESTMENTS continued
January 31, 2008 (unaudited)
| | | | | | | Shares | | Value |
|
| COMMON STOCKS continued | | | | | | |
| INFORMATION TECHNOLOGY continued | | | | | | |
| Software 7.9% | | | | | | | | |
| Amdocs, Ltd. * | | | | | | 2,840 | | $ 93,976 |
| BMC Software, Inc. * | | | | | | 2,775 | | 88,911 |
| Microsoft Corp. | | | | | | 2,810 | | 91,606 |
| Oracle Corp. * | | | | | | 4,680 | | 96,174 |
| |
|
| | | | | | | | | 370,667 |
| |
|
| MATERIALS 1.9% | | | | | | | | |
| Chemicals 1.9% | | | | | | | | |
| Praxair, Inc. | | | | | | 1,130 | | 91,428 |
| |
|
| TELECOMMUNICATION SERVICES 3.8% | | | | | | |
| Diversified Telecommunication Services 3.8% | | | | | | |
| AT&T, Inc. | | | | | | 2,405 | | 92,568 |
| Verizon Communications, Inc. | | | | | | 2,240 | | 87,002 |
| |
|
| | | | | | | | | 179,570 |
| |
|
| UTILITIES 2.0% | | | | | | | | |
| Independent Power Producers & Energy Traders 2.0% | | | | | | |
| Constellation Energy Group, Inc. | | | | | | 985 | | 92,551 |
| |
|
| Total Common Stocks (cost $4,934,527) | | | | | | 4,648,054 |
| |
|
| SHORT-TERM INVESTMENTS 1.7% | | | | | | |
| MUTUAL FUND SHARES 1.7% | | | | | | |
| Evergreen Institutional Money Market Fund, Class I, 4.31% q ø (cost $80,697) | | 80,697 | | 80,697 |
| |
|
| Total Investments (cost $5,015,224) 100.3% | | | | | | 4,728,751 |
| Other Assets and Liabilities (0.3%) | | | | | | (15,806) |
| |
|
| Net Assets 100.0% | | | | | | | | $ 4,712,945 |
| |
|
| * | | Non-income producing security |
| q | | Rate shown is the 7-day annualized yield at period end. |
| ø | | Evergreen Investment Management Company, LLC is the investment advisor to both the Fund and the money market |
| | | fund. |
| The following table shows the percentage of long-term investments by sector as of January 31, 2008: |
| |
| Information Technology | | 19.9% | |
| Financials | | 18.8% | |
| Health Care | | 15.8% | |
| Industrials | | 13.7% | |
| Energy | | 10.2% | |
| Consumer Discretionary | | 8.0% | |
| Consumer Staples | | 5.8% | |
| Telecommunication Services | | 3.9% | |
| Utilities | | 2.0% | |
| Materials | | 1.9% | |
| |
| |
| | | 100.0% | |
| | |
| |
See Notes to Financial Statements
13
STATEMENT OF ASSETS AND LIABILITIES
January 31, 2008 (unaudited)
| Assets | | |
| Investments in securities, at value (cost $4,934,527) | | $ 4,648,054 |
| Investments in affiliated money market fund, at value (cost $80,697) | | 80,697 |
|
| Total investments | | 4,728,751 |
| Dividends receivable | | 5,561 |
| Receivable from investment advisor | | 529 |
| Prepaid expenses and other assets | | 92,710 |
|
| Total assets | | 4,827,551 |
|
| Liabilities | | |
| Distribution Plan expenses payable | | 29 |
| Due to other related parties | | 3,841 |
| Accrued expenses and other liabilities | | 110,736 |
|
| Total liabilities | | 114,606 |
|
| Net assets | | $ 4,712,945 |
|
| Net assets represented by | | |
| Paid-in capital | | $ 5,006,096 |
| Undistributed net investment income | | 1,902 |
| Accumulated net realized losses on investments | | (8,580) |
| Net unrealized losses on investments | | (286,473) |
|
| Total net assets | | $ 4,712,945 |
|
| Net assets consists of | | |
| Class A | | $ 470,712 |
| Class B | | 470,751 |
| Class C | | 475,564 |
| Class I | | 3,295,918 |
|
| Total net assets | | $ 4,712,945 |
|
| Shares outstanding (unlimited number of shares authorized) | | |
| Class A | | 50,000 |
| Class B | | 50,000 |
| Class C | | 50,511 |
| Class I | | 350,000 |
|
| Net asset value per share | | |
| Class A | | $ 9.41 |
| Class A— Offering price (based on sales charge of 5.75%) | | $ 9.98 |
| Class B | | $ 9.42 |
| Class C | | $ 9.42 |
| Class I | | $ 9.42 |
|
See Notes to Financial Statements
14
STATEMENT OF OPERATIONS
Period Ended January 31, 2008 (unaudited) (a)
| Investment income | | |
| Dividends | | $ 6,780 |
| Income from affiliate | | 1,851 |
|
| Total investment income | | 8,631 |
|
| Expenses | | |
| Advisory fee | | 3,708 |
| Distribution Plan expenses | | |
| Class A | | 150 |
| Class B | | 597 |
| Class C | | 600 |
| Administrative services fee | | 598 |
| Transfer agent fees | | 3,841 |
| Trustees’ fees and expenses | | 554 |
| Printing and postage expenses | | 4,671 |
| Custodian and accounting fees | | 430 |
| Registration and filing fees | | 13,256 |
| Professional fees | | 4,969 |
| Other | | 687 |
|
| Total expenses | | 34,061 |
| Less: Expense reductions | | (8) |
| Fee waivers and expense reimbursements | | (27,324) |
|
| Net expenses | | 6,729 |
|
| Net investment income | | 1,902 |
|
| Net realized and unrealized gains or losses on investments | | |
| Net realized losses on investments | | (8,580) |
| Net change in unrealized gains or losses on investments | | (286,473) |
|
| Net realized and unrealized gains or losses on investments | | (295,053) |
|
| Net decrease in net assets resulting from operations | | $ (293,151) |
|
| (a) For the period from December 17, 2007 (commencement of operations), to January 31, 2008. |
See Notes to Financial Statements
15
STATEMENT OF CHANGES IN NET ASSETS
| | | Period Ended |
| | | January 31, 2008 |
| | | (unaudited) (a) |
|
| Operations | | | | |
| Net investment income | | $ 1,902 |
| Net realized losses on investments | | | | (8,580) |
| Net change in unrealized gains or losses on investments | | | | (286,473) |
|
| Net decrease in net assets resulting from operations | | | | (293,151) |
|
| | | Shares | | |
| Capital share transactions | | | | |
| Proceeds from shares sold | | | | |
| Class A | | 50,179 | | 501,839 |
| Class B | | 50,000 | | 500,498 |
| Class C | | 50,511 | | 505,501 |
| Class I | | 350,000 | | 3,500,005 |
|
| | | | | 5,007,843 |
|
| Payment for shares redeemed | | | | |
| Class A | | (179) | | (1,747) |
|
| Net increase in net assets resulting from capital share transactions | | | | 5,006,096 |
|
| Total increase in net assets | | | | 4,712,945 |
| Net assets | | | | |
| Beginning of period | | | | 0 |
|
| End of period | | $ 4,712,945 |
|
| Undistributed net investment income | | $ 1,902 |
|
| |
| (a) For the period from December 17, 2007 (commencement of operations), to January 31, 2008. |
See Notes to Financial Statements
16
NOTES TO FINANCIAL STATEMENTS (unaudited)
1. ORGANIZATION
Evergreen Golden Large Cap Core Fund (the “Fund”) is a diversified series of Evergreen Equity Trust (the “Trust”), a Delaware statutory trust organized on September 18, 1997. The Trust is an open-end management investment company registered under the Investment Company Act of 1940, as amended (the “1940 Act”).
The Fund offers Class A, Class B, Class C and Class I shares. Class A shares are sold with a front-end sales charge. However, Class A share investments of $1 million or more are not subject to a front-end sales charge but are subject to a contingent deferred sales charge of 1.00% upon redemption within 18 months. Class B shares are sold without a front-end sales charge but are subject to a contingent deferred sales charge that is payable upon redemption and decreases depending on how long the shares have been held. Class C shares are sold without a front-end sales charge but are subject to a contingent deferred sales charge that is payable upon redemption within one year. Class I shares are sold without a front-end sales charge or contingent deferred sales charge. Each class of shares, except Class I shares, pays an ongoing distribution fee.
2. SIGNIFICANT ACCOUNTING POLICIES
The following is a summary of significant accounting policies consistently followed by the Fund in the preparation of its financial statements. The policies are in conformity with generally accepted accounting principles in the United States of America, which require management to make estimates and assumptions that affect amounts reported herein. Actual results could differ from these estimates.
a. Valuation of investments
Listed equity securities are usually valued at the last sales price or official closing price on the national securities exchange where the securities are principally traded.
Investments in open-end mutual funds are valued at net asset value. Securities for which market quotations are not readily available or not reflective of current market value are valued at fair value as determined by the investment advisor in good faith, according to procedures approved by the Board of Trustees.
b. Security transactions and investment income
Security transactions are recorded on trade date. Realized gains and losses are computed using the specific cost of the security sold. Dividend income is recorded on the ex-dividend date.
c. Federal taxes
The Fund intends to qualify as a regulated investment company and distribute all of its taxable income, including any net capital gains. Accordingly, no provision for federal taxes is required.
d. Distributions
Distributions to shareholders from net investment income and net realized gains, if any, are recorded on the ex-dividend date. Such distributions are determined in conformity with income tax regulations, which may differ from generally accepted accounting principles.
17
NOTES TO FINANCIAL STATEMENTS (unaudited) continued
e. Class allocations
Income, common expenses and realized and unrealized gains and losses are allocated to the classes based on the relative net assets of each class. Distribution fees, if any, are calculated daily at the class level based on the appropriate net assets of each class and the specific expense rates applicable to each class.
3. ADVISORY FEE AND OTHER TRANSACTIONS WITH AFFILIATES
Evergreen Investment Management Company, LLC (“EIMC”), an indirect, wholly-owned subsidiary of Wachovia Corporation (“Wachovia”), is the investment advisor to the Fund and is paid an annual fee starting at 0.62% and declining to 0.45% as average daily net assets increase. For the period ended January 31, 2008, the advisory fee was equivalent to 0.62% of the Fund’s average daily net assets (on an annualized basis).
Golden Capital Management, LLC (“Golden Capital”) is the investment sub-advisor to the Fund and is paid by EIMC for its services to the Fund. Wachovia Alternative Strategies, Inc., a wholly-owned subsidiary of Wachovia, owns a 45% minority interest in Golden Capital.
From time to time, EIMC may voluntarily or contractually waive its fee and/or reimburse expenses in order to limit operating expenses. During the period ended January 31, 2008, EIMC voluntarily waived its advisory fee in the amount of $3,708 and reimbursed other expenses in the amount of $23,616.
The Fund may invest in money market funds which are advised by EIMC. Income earned on these investments is included in income from affiliate on the Statement of Operations.
Effective January 1, 2008, EIMC replaced Evergreen Investment Services, Inc. (“EIS”), an indirect, wholly-owned subsidiary of Wachovia, as the administrator to the Fund upon the assignment of the Fund’s Administrative Services Agreement from EIS to EIMC. There were no changes to the services being provided or fees being paid by the Fund. The administrator provides the Fund with facilities, equipment and personnel and is paid an annual rate determined by applying percentage rates to the aggregate average daily net assets of the Evergreen funds (excluding money market funds and Evergreen Institutional Enhanced Income Fund), starting at 0.10% and declining to 0.05% as the aggregate average daily net assets of the Evergreen funds (excluding money market funds and Evergreen Institutional Enhanced Income Fund) increase.
Evergreen Service Company, LLC (“ESC”), an indirect, wholly-owned subsidiary of Wachovia, is the transfer and dividend disbursing agent for the Fund. ESC receives account fees that vary based on the type of account held by the shareholders in the Fund. For the period ended January 31, 2008, the transfer agent fees were equivalent to an annual rate of 0.64% of the Fund’s average daily net assets.
4. DISTRIBUTION PLANS
EIS serves as distributor of the Fund’s shares. The Fund has adopted Distribution Plans, as allowed by Rule 12b-1 of the 1940 Act, for each class of shares, except Class I. Under the
18
NOTES TO FINANCIAL STATEMENTS (unaudited) continued
Distribution Plans, distribution fees are paid at an annual rate of 0.25% of the average daily net assets for Class A shares and 1.00% of the average daily net assets for each of Class B and Class C shares.
5. INVESTMENT TRANSACTIONS
Cost of purchases and proceeds from sales of investment securities (excluding short-term securities) were $5,033,426 and $90,319, respectively, for the period ended January 31, 2008.
Various inputs are used in determining the value of the Fund’s investments. These inputs are summarized into three broad levels as follows:
Level 1 — quoted prices in active markets for identical securities
Level 2 — other significant observable inputs (including quoted prices for similar securities, interest rates, prepayment speeds, credit risk, etc.)
Level 3 — significant unobservable inputs (including the Fund’s own assumptions in determining the fair value of investments)
As of January 31, 2008, the inputs used in valuing the Fund’s assets, which are carried at fair value, were as follows:
| | | Valuation | | Investments |
| | | Inputs | | in Securities |
|
| Level 1 | | Quoted Prices | | $ 4,728,751 |
| Level 2 | | Other Significant | | |
| | | Observable Inputs | | 0 |
| Level 3 | | Significant | | |
| | | Unobservable | | |
| | | Inputs | | 0 |
| |
|
| Total | | | | $ 4,728,751 |
|
On January 31, 2008, the aggregate cost of securities for federal income tax purposes was $5,015,224. The gross unrealized appreciation and depreciation on securities based on tax cost was $25,092 and $311,565, respectively, with a net unrealized depreciation of $286,473.
6. INTERFUND LENDING
Pursuant to an Exemptive Order issued by the SEC, the Fund may participate in an interfund lending program with certain funds in the Evergreen fund family. This program allows the Fund to borrow from, or lend money to, other participating funds. During the period ended January 31, 2008, the Fund did not participate in the interfund lending program.
7. EXPENSE REDUCTIONS
Through expense offset arrangements with ESC and the Fund’s custodian, a portion of fund expenses has been reduced.
19
NOTES TO FINANCIAL STATEMENTS (unaudited) continued
8. DEFERRED TRUSTEES’ FEES
Each Trustee of the Fund may defer any or all compensation related to performance of his or her duties as a Trustee. The Trustees’ deferred balances are allocated to deferral accounts, which are included in the accrued expenses for the Fund. The investment performance of the deferral accounts is based on the investment performance of certain Evergreen funds. Any gains earned or losses incurred in the deferral accounts are reported in the Fund’s Trustees’ fees and expenses. At the election of the Trustees, the deferral account will be paid either in one lump sum or in quarterly installments for up to ten years.
9. REGULATORY MATTERS AND LEGAL PROCEEDINGS
Pursuant to an administrative order issued by the SEC on September 19, 2007, EIMC, EIS, ESC (collectively, the “Evergreen Entities”), Wachovia Securities, LLC and the SEC have entered into an agreement settling allegations of (i) improper short-term trading arrangements in effect prior to May 2003 involving former officers and employees of EIMC and certain broker-dealers, (ii) insufficient systems for monitoring exchanges and enforcing exchange limitations as stated in certain funds’ prospectuses, and (iii) inadequate e-mail retention practices. Under the settlement, the Evergreen Entities were censured and paid approximately $32 million in disgorgement and penalties. This amount, along with a fine assessed by the SEC against Wachovia Securities, LLC will be distributed pursuant to a plan to be developed by an independent distribution consultant and approved by the SEC. The Evergreen Entities neither admitted nor denied the allegations and findings set forth in its settlement with the SEC.
In addition, the Evergreen funds and EIMC and certain of its affiliates are involved in various legal actions, including private litigation and class action lawsuits. EIMC does not expect that any of such legal actions currently pending or threatened will have a material adverse impact on the financial position or operations of any of the Evergreen funds or on EIMC’s ability to provide services to the Evergreen funds.
Although EIMC believes that none of the matters discussed above will have a material adverse impact on the Evergreen funds, there can be no assurance that these matters and any publicity surrounding or resulting from them will not result in reduced sales or increased redemptions of Evergreen fund shares, which could increase Evergreen fund transaction costs or operating expenses, or that they will not have other adverse consequences on the Evergreen funds.
10. NEW ACCOUNTING PRONOUNCEMENTS
In June 2006, the Financial Accounting Standards Board (“FASB”) issued FASB Interpretation No. 48, Accounting for Uncertainty in Income Taxes — an interpretation of FASB statement 109 (“FIN 48”). FIN 48 supplements FASB 109 by prescribing a recognition threshold and measurement attribute for the financial statement recognition and measurement of a tax position taken or expected to be taken in a tax return. The Fund’s financial statements have not been impacted by the adoption of FIN 48. However, the conclusions regarding FIN 48 may be subject to review
20
NOTES TO FINANCIAL STATEMENTS (unaudited) continued
and adjustment at a later date based on factors including, but not limited to, further implementation guidance expected from FASB, and on-going analysis of tax laws, regulations, and interpretations thereof.
In September 2006, FASB issued Statement of Financial Accounting Standards No. 157, Fair Value Measurements (“FAS 157”). FAS 157 establishes a single authoritative definition of fair value, establishes a framework for measuring fair value and expands disclosures about fair value measurements. FAS 157 applies to fair value measurements already required or permitted by existing standards. The change to current generally accepted accounting principles from the application of FAS 157 relates to the definition of fair value, the methods used to measure fair value, and the expanded disclosures about fair value measurements. The adoption of FAS 157 has not impacted the financial statement amounts, however, additional disclosures about the inputs used to develop the measurements and the effect of certain of the measurements on changes in net assets for the period have been incorporated into this shareholder report as required.
21
ADDITIONAL INFORMATION (unaudited)
INFORMATION ABOUT THE REVIEW AND APPROVAL OF THE FUND’S INVESTMENT ADVISORY AGREEMENT
The Fund’s Board of Trustees considered the proposed investment advisory agreement between the Fund and EIMC and the proposed sub-advisory agreement between EIMC and Golden Capital Management, LLC (“Golden Capital”) at a meeting held in December of 2007. At that meeting, the Trustees, including a majority of the Trustees who are not interested persons (as that term is defined in the 1940 Act) of the Fund, Golden Capital, or EIMC approved the Fund’s investment advisory agreements. (References below to the “Fund” are to Evergreen Golden Large Cap Core Fund; references to the “funds” are to the Evergreen funds generally.)
The Board of Trustees regularly meets with representatives of Evergreen Investments (“Evergreen”) during the course of the year, and met with representatives of Golden Capital in December of 2007, and, in considering the advisory and administrative arrangements for the Fund, the Trustees took into account information provided in those meetings.
The disinterested Trustees discussed the approval of the investment advisory agreements with representatives of Evergreen and with legal counsel. In all of its deliberations with respect to the Fund and the investment advisory agreements, the Board of Trustees and the disinterested Trustees were advised by independent counsel to the disinterested Trustees and counsel to the Fund. In considering the investment advisory agreements, the Trustees did not identify any particular information or consideration that was all-important or controlling, and each Trustee attributed different weights to various factors. This summary describes a number of the most important, but not necessarily all, of the factors considered by the Board and the disinterested Trustees.
The Trustees considered that EIMC and its affiliates generally provide a comprehensive investment management service to the funds. They noted that EIMC and Golden Capital would formulate and implement an investment program for the Fund. They noted that EIMC makes its personnel available to serve as officers of the funds and concluded that the reporting and management functions provided by EIMC with respect to the funds were generally satisfactory. In considering approval of the Fund’s investment advisory agreements with EIMC and Golden Capital, the Trustees considered, among other factors, Golden Capital’s portfolio management team’s investment approach; information regarding Golden Capital’s historical investment performance, as represented by the performance of other investment funds and a composite of accounts managed by Golden Capital, in comparison to comparable funds and the S&P 500 Index and the Russell 1000 Index; the fees to be paid by the Fund to EIMC and affiliates of EIMC and by EIMC to Golden Capital; and the estimated expenses that the Fund would pay after its launch. On the basis of these factors, they determined that Golden appeared qualified to manage the Fund.
The Trustees also considered the proposed investment advisory fee to be paid by the Fund in comparison to comparable mutual funds and to other comparable accounts managed by Evergreen and concluded that the proposed fees and contractual arrangements appeared reasonable and appropriate. The Trustees considered whether further growth in assets of the Fund might
22
ADDITIONAL INFORMATION (unaudited) continued
result in economies of scale and noted that the Fund was in its start-up phase and that the advisory fee for the Fund contemplated breakpoints starting at $1 billion. The Trustees also relied, in part, on comparisons of the Fund’s projected fees and expenses to the fees and expenses of other peer mutual funds, based on data compiled by Evergreen from information provided by an independent data provider. In their consideration of the fees to be paid by the Fund, the Trustees considered information provided by EIMC regarding the projected profitability of the Fund to EIMC.
23
TRUSTEES AND OFFICERS
TRUSTEES1
| Charles A. Austin III | | Investment Counselor, Anchor Capital Advisors, LLC. (investment advice); Director, The Andover |
| Trustee | | Companies (insurance); Trustee, Arthritis Foundation of New England; Former Director, The |
| DOB: 10/23/1934 | | Francis Ouimet Society (scholarship program); Former Director, Executive Vice President and |
| Term of office since: 1991 | | Treasurer, State Street Research & Management Company (investment advice) |
| Other directorships: None | | |
|
| |
| K. Dun Gifford | | Chairman and President, Oldways Preservation and Exchange Trust (education); Trustee, |
| Trustee | | Chairman of the Finance Committee, Member of the Executive Committee, and Former |
| DOB: 10/23/1938 | | Treasurer, Cambridge College |
| Term of office since: 1974 | | |
| Other directorships: None | | |
|
| |
| Dr. Leroy Keith, Jr. | | Managing Director, Almanac Capital Management (commodities firm); Trustee, Phoenix |
| Trustee | | Fund Complex; Director, Diversapack Co. (packaging company); Former Partner, Stonington |
| DOB: 2/14/1939 | | Partners, Inc. (private equity fund); Former Director, Obagi Medical Products Co.; Former |
| Term of office since: 1983 | | Director, Lincoln Educational Services |
| Other directorships: Trustee, | | |
| Phoenix Fund Complex (consisting | | |
| of 53 portfolios as of 12/31/2007) | | |
|
| |
| Carol A. Kosel1 | | Former Consultant to the Evergreen Boards of Trustees; Former Vice President and Senior Vice |
| Trustee | | President, Evergreen Investments, Inc.; Former Treasurer, Evergreen Funds; Former Treasurer, |
| DOB: 12/25/1963 | | Vestaur Securities Fund |
| Term of office since: 2008 | | |
| Other directorships: None | | |
|
| |
| Gerald M. McDonnell | | Former Manager of Commercial Operations, CMC Steel (steel producer) |
| Trustee | | |
| DOB: 7/14/1939 | | |
| Term of office since: 1988 | | |
| Other directorships: None | | |
|
| |
| Patricia B. Norris | | President and Director of Buckleys of Kezar Lake, Inc. (real estate company); Former President |
| Trustee | | and Director of Phillips Pond Homes Association (home community); Former Partner, |
| DOB: 4/9/1948 | | PricewaterhouseCoopers, LLP (independent registered public accounting firm) |
| Term of office since: 2006 | | |
| Other directorships: None | | |
|
| |
| William Walt Pettit | | Partner and Vice President, Kellam & Pettit, P.A. (law firm); Director, Superior Packaging Corp. |
| Trustee | | (packaging company); Member, Superior Land, LLC (real estate holding company), Member, |
| DOB: 8/26/1955 | | K&P Development, LLC (real estate development); Former Director, National Kidney Foundation |
| Term of office since: 1988 | | of North Carolina, Inc. (non-profit organization) |
| Other directorships: None | | |
|
| |
| David M. Richardson | | President, Richardson, Runden LLC (executive recruitment advisory services); Director, J&M |
| Trustee | | Cumming Paper Co. (paper merchandising); Trustee, NDI Technologies, LLP (communications); |
| DOB: 9/19/1941 | | Former Consultant, AESC (The Association of Executive Search Consultants) |
| Term of office since: 1982 | | |
| Other directorships: None | | |
|
| |
| Dr. Russell A. Salton III | | President/CEO, AccessOne MedCard, Inc. |
| Trustee | | |
| DOB: 6/2/1947 | | |
| Term of office since: 1984 | | |
| Other directorships: None | | |
|
24
TRUSTEES AND OFFICERS continued
| Michael S. Scofield | | Retired Attorney, Law Offices of Michael S. Scofield; Former Director and Chairman, Branded |
| Trustee | | Media Corporation (multi-media branding company) |
| DOB: 2/20/1943 | | |
| Term of office since: 1984 | | |
| Other directorships: None | | |
|
| |
| Richard J. Shima | | Independent Consultant; Director, Hartford Hospital; Trustee, Greater Hartford YMCA; Former |
| Trustee | | Director, Trust Company of CT; Former Director, Old State House Association; Former Trustee, |
| DOB: 8/11/1939 | | Saint Joseph College (CT) |
| Term of office since: 1993 | | |
| Other directorships: None | | |
|
| |
| Richard K. Wagoner, CFA2 | | Member and Former President, North Carolina Securities Traders Association; Member, Financial |
| Trustee | | Analysts Society |
| DOB: 12/12/1937 | | |
| Term of office since: 1999 | | |
| Other directorships: None | | |
|
| |
| |
| OFFICERS | | |
| |
| Dennis H. Ferro3 | | Principal occupations: President and Chief Executive Officer, Evergreen Investment Company, |
| President | | Inc. and Executive Vice President, Wachovia Bank, N.A.; former Chief Investment Officer, |
| DOB: 6/20/1945 | | Evergreen Investment Company, Inc. |
| Term of office since: 2003 | | |
|
| |
| Jeremy DePalma4 | | Principal occupations: Senior Vice President, Evergreen Investment Management Company, LLC; |
| Treasurer | | Former Vice President, Evergreen Investment Services, Inc.; Former Assistant Vice President, |
| DOB: 2/5/1974 | | Evergreen Investment Services, Inc. |
| Term of office since: 2005 | | |
|
| |
| Michael H. Koonce4 | | Principal occupations: Senior Vice President and General Counsel, Evergreen Investment |
| Secretary | | Services, Inc.; Secretary, Senior Vice President and General Counsel, Evergreen Investment |
| DOB: 4/20/1960 | | Management Company, LLC and Evergreen Service Company, LLC; Senior Vice President and |
| Term of office since: 2000 | | Assistant General Counsel, Wachovia Corporation |
|
| |
| Robert Guerin4 | | Principal occupations: Chief Compliance Officer, Evergreen Funds and Senior Vice President of |
| Chief Compliance Officer | | Evergreen Investments Co, Inc; Former Managing Director and Senior Compliance Officer, |
| DOB: 9/20/1965 | | Babson Capital Management LLC; Former Principal and Director, Compliance and Risk |
| Term of office since: 2007 | | Management, State Street Global Advisors; Former Vice President and Manager, Sales Practice |
| | | Compliance, Deutsche Asset Management. |
|
1 Each Trustee, except Mses. Kosel and Norris, serves until a successor is duly elected or qualified or until his or her death, resignation, retirement or removal from office. As new Trustees, Ms. Kosel’s and Ms. Norris’ initial terms end December 31, 2010 and June 30, 2009, respectively, at which times they may be re-elected by Trustees to serve until a successor is duly elected or qualified or until her death, resignation, retirement or removal from office by the Trustees. Each Trustee, except Ms. Kosel, oversaw 93 Evergreen funds as of December 31, 2007. Ms. Kosel became a Trustee on January 1, 2008. Correspondence for each Trustee may be sent to Evergreen Board of Trustees, P.O. Box 20083, Charlotte, NC 28202.
2 Mr. Wagoner is an “interested person” of the Fund because of his ownership of shares in Wachovia Corporation, the parent to the Fund’s investment advisor.
3 The address of the Officer is 401 S. Tryon Street, 20th Floor, Charlotte, NC 28288.
4 The address of the Officer is 200 Berkeley Street, Boston, MA 02116.
Additional information about the Fund’s Board of Trustees and Officers can be found in the Statement of Additional Information (SAI) and is available upon request without charge by calling 800.343.2898.
25
581819 03/2008
Evergreen Golden Mid Cap Core Fund

| | | table of contents |
| 1 | | LETTER TO SHAREHOLDERS |
| 4 | | FUND AT A GLANCE |
| 5 | | ABOUT YOUR FUND’S EXPENSES |
| 6 | | FINANCIAL HIGHLIGHTS |
| 10 | | SCHEDULE OF INVESTMENTS |
| 13 | | STATEMENT OF ASSETS AND LIABILITIES |
| 14 | | STATEMENT OF OPERATIONS |
| 15 | | STATEMENT OF CHANGES IN NET ASSETS |
| 16 | | NOTES TO FINANCIAL STATEMENTS |
| 21 | | ADDITIONAL INFORMATION |
| 24 | | TRUSTEES AND OFFICERS |
This semiannual report must be preceded or accompanied by a prospectus of the Evergreen fund contained herein. The prospectus contains more complete information, including fees and expenses, and should be read carefully before investing or sending money.
The fund will file its complete schedule of portfolio holdings with the SEC for the first and third quarters of each fiscal year on Form N-Q. The fund’s Form N-Q will be available on the SEC’s Web site at http://www.sec.gov. In addition, the fund’s Form N-Q may be reviewed and copied at the SEC’s Public Reference Room in Washington, D.C. Information on the operation of the Public Reference Room may be obtained by calling 800.SEC.0330.
A description of the fund’s proxy voting policies and procedures, as well as information regarding how the fund voted proxies relating to portfolio securities during the most recent 12-month period ended June 30, is available by visiting our Web site at EvergreenInvestments.com or by visiting the SEC’s Web site at http://www.sec.gov. The fund’s proxy voting policies and procedures are also available without charge, upon request, by calling 800.343.2898.
| Mutual Funds: | | | | |
| NOT FDIC INSURED | | MAY LOSE VALUE | | NOT BANK GUARANTEED |
Evergreen InvestmentsSM is a service mark of Evergreen Investment Management Company, LLC. Copyright 2008, Evergreen Investment Management Company, LLC.
Evergreen Investment Management Company, LLC is a subsidiary of Wachovia Corporation and is an affiliate of Wachovia Corporation’s other Broker Dealer subsidiaries.
Evergreen mutual funds are distributed by Evergreen Investment Services, Inc. 200 Berkeley Street, Boston, MA 02116
LETTER TO SHAREHOLDERS
March 2008

Dennis H. Ferro
President and Chief
Executive Officer
Dear Shareholder:
We are pleased to provide the Semiannual Report for Evergreen Golden Mid Cap Core Fund, covering the period from December 17, 2007 through January 31, 2008.
Each of the three Golden funds is managed with the investment strategies developed by Golden Capital Management, LLC (“Golden Capital”), a firm that successfully manages core and enhanced index equity portfolios for institutional and high net worth individual investors. Evergreen Golden Large Cap Core Fund is managed to invest in securities of companies diversified across the major economic sectors, with at least 80% of net assets invested in shares of large cap companies with characteristics similar to those typically found in the Standard & Poor’s 500 Index. Evergreen Golden Mid Cap Core Fund is managed to invest in securities of companies, with at least 80% of net assets invested in the stocks of mid cap companies similar to those found in the Russell Midcap Index. The third fund, Evergreen Golden Core Opportunities Fund, is designed to invest in securities of companies diversified across the major sectors, with at least 80% of net assets invested in stocks of small to mid cap companies similar to those found in the Russell 2500 Index.
We are proud to be able to offer retail investors these three mutual funds that follow Golden Capital’s discipline, which combines fundamental equity research and a quantitative approach in pursuit of consistent, long-term returns. As sub-advisor, Golden Capital is responsible for day-to-day portfolio management of these three funds, while Evergreen Investment Management Company, LLC serves as the investment advisor.
1
LETTER TO SHAREHOLDERS continued
The funds were launched during a challenging period in the domestic equity market. Problems that first appeared in the housing and subprime mortgage markets led to a tightening of credit, which in turn contributed to widening fears of a dramatic deceleration in the economy’s expansion late in 2007 and early in 2008. As the economy weakened, equity prices generally declined across companies of all sizes. Large cap stocks held up somewhat better than mid cap and small cap shares, while growth stocks outperformed more economically sensitive value stocks. Fixed income investors, meanwhile, sought out the highest-quality securities and attempted to avoid credit risk. Longer-maturity Treasuries outperformed other sectors, while the prices of corporate bonds and many asset-backed securities fell as the yield spreads between Treasuries and lower-rated securities widened. In this environment, the price of gold surged while the dollar remained weak.
The U.S. economy exhibited increasing signs of weakness in the latter half of 2007 and the first month of 2008 after experiencing solid growth early in 2007. Although housing and credit-related concerns began weighing on investor sentiment early in the year, the economy’s growth trajectory continued to be supported early in 2007 by the combination of solid trends in employment, income, investment and export trends. That began to change in the latter months of 2007, however, as each of these pillars of support began to weaken. Growth in Gross Domestic Product rose by just 0.6% during the final quarter of 2007 as economic output slowed because of a sharp reduction in business inventories. Corporate earnings growth, meanwhile, fell over the second half of 2007. Payrolls dropped by 17,000 in January 2008, contributing to growing concerns about the outlook for consumer spending, which accounts for up to 70% of economic output. Faced with growing evidence of the economy’s deceleration, the Federal Reserve Board (the “Fed”) began to focus more on stimulating growth and less on watching inflation. The Fed cut the target fed funds rate from 5.25% to 4.25% during the last four months of 2007
2
LETTER TO SHAREHOLDERS continued
and then slashed the rate by an additional 1.25% in two separate actions within just eight days of each other in January 2008. Also in early 2008, Congress passed, and President Bush signed, a $168 billion fiscal stimulus bill that contained rebates for taxpayers, tax breaks for businesses and additional assistance for Social Security recipients and disabled veterans.
We believe the experiences in the investment markets in recent months have underscored the value of a well-diversified, long-term investment strategy to help soften the effects of volatility in any one market or asset class. As always, we encourage investors to maintain diversified investment portfolios in pursuit of their long-term investment goals.
Please visit us at EvergreenInvestments.com for more information about our funds and other investment products available to you. Thank you for your continued support of Evergreen Investments.
Sincerely,

Dennis H. Ferro
President and Chief Executive Officer
Evergreen Investment Company, Inc.
Special Notice to Shareholders:
Please visit our Web site at EvergreenInvestments.com for statements from President and Chief Executive Officer, Dennis Ferro, regarding the firm’s recent settlement with the Securities and Exchange Commission (SEC) and prior settlement with the Financial Industry Regulatory Authority (FINRA).
3
FUND AT A GLANCE
as of January 31, 2008
MANAGEMENT TEAM
Investment Advisor:
• Evergreen Investment Management Company, LLC
Sub-Advisor:
• Golden Capital Management, LLC
Portfolio Manager:
• John R. Campbell, CFA
CURRENT INVESTMENT STYLE
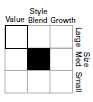
Source: Morningstar, Inc.
Morningstar’s style box is based on a portfolio date as of 12/31/2007.
The Equity style box placement is based on 10 growth and valuation measures for each fund holding and the median size of the companies in which the fund invests.
PERFORMANCE AND RETURNS
Portfolio inception date: 12/17/2007
| | | Class A | | Class B | | Class C | | Class I |
| Class inception date | | 12/17/2007 | | 12/17/2007 | | 12/17/2007 | | 12/17/2007 |
|
| Nasdaq symbol | | EGMAX | | EGMBX | | EGMCX | | EGMIX |
|
| Cumulative return | | | | | | | | |
|
| Since portfolio inception with sales charge | | -13.76% | | -12.98% | | -9.32% | | N/A |
|
| Since portfolio inception w/o sales charge | | -8.50% | | -8.40% | | -8.40% | | -8.40% |
|
| Maximum sales charge | | 5.75% | | 5.00% | | 1.00% | | N/A |
| | | Front-end | | CDSC | | CDSC | | |
|
Past performance is no guarantee of future results. The performance quoted represents past performance and current performance may be lower or higher. The investment return and principal value of an investment will fluctuate so that investors’ shares, when redeemed, may be worth more or less than their original cost. To obtain performance information current to the most recent month-end for Classes A, B, C or I, please go to EvergreenInvestments.com/fundperformance. The performance of each class may vary based on differences in loads, fees and expenses paid by the shareholders investing in each class. Performance includes the reinvestment of income dividends and capital gain distributions. Performance shown does not reflect the deduction of taxes that a shareholder would pay on fund distributions or the redemption of fund shares.
Performance results are extremely short term, and may not provide an adequate basis for evaluating a fund’s performance over varying market conditions or economic cycles. Unusual investment returns may be a result of a fund’s recent inception, existing market and economic conditions and the increased potential of a small number of stocks affecting fund performance due to the smaller asset size. Most mutual funds are intended to be long-term investments.
The fund incurs a 12b-1 fee of 0.25% for Class A and 1.00% for Classes B and C. Class I does not pay a 12b-1 fee.
The advisor is waiving its advisory fee and reimbursing the fund for a portion of other expenses. Had the fee not been waived and expenses not reimbursed, returns would have been lower.
Class I shares are only offered in the following manner: (1) to investment advisory clients of Evergreen Investment Management Company, LLC (or its advisory affiliates) when purchased by such advisor(s) on behalf of its clients, (2) to certain mutual fund wrap program clients of Wachovia Securities and of third-party broker/dealers when purchased through a clearing relationship with Wachovia Securities or an affiliate providing mutual fund clearing services, (3) through arrangements entered into on behalf of the Evergreen funds with certain financial services firms, (4) to certain institutional investors, and (5) to persons who owned Class Y shares in registered name in an Evergreen fund on or before December 31, 1994 or who owned shares of any SouthTrust fund in registered name as of March 18, 2005 or who owned shares of Vestaur Securities Fund as of May 20, 2005.
Class I shares are only available to institutional shareholders with a minimum of $1 million investment, which may be waived in certain situations.
The fund’s investment objective may be changed without a vote of the fund’s shareholders.
Mid cap securities may be subject to special risks associated with narrower product lines and limited financial resources compared to their large cap counterparts, and, as a result, mid cap securities may decline significantly in market downturns.
Since the fund tends to invest in a smaller number of stocks than many similar mutual funds, changes in the value of individual stocks may have a larger impact on its net asset value than such fluctuations would if the fund were more broadly invested.
The stocks of smaller companies may be more volatile than those of larger companies due to the higher risk of failure.
All data is as of January 31, 2008, and subject to change.
4
ABOUT YOUR FUND’S EXPENSES
The Example below is intended to describe the fees and expenses borne by shareholders and the impact of those costs on your investment.
Example
As a shareholder of the fund, you incur two types of costs: (1) transaction costs, including sales charges (loads), redemption fees and exchange fees; and (2) ongoing costs, including management fees, distribution (12b-1) fees and other fund expenses. This Example is intended to help you understand your ongoing costs (in dollars) of investing in the fund and to compare these costs with the ongoing costs of investing in other mutual funds. The actual expense Example for each class is based on an investment of $1,000 invested at the beginning of the period and held for the entire period from December 17, 2007 (commencement of each class’ operations) to January 31, 2008. The hypothetical expense Example for each class is based on an investment of $1,000 invested at the beginning of the period and held for the entire period from August 1, 2007 to January 31, 2008.
The example illustrates your fund’s costs in two ways:
• Actual expenses
The section in the table under the heading “Actual” provides information about actual account values and actual expenses. You may use the information in these columns, together with the amount you invested, to estimate the expenses that you paid over the period. Simply divide your account value by $1,000 (for example, an $8,600 account value divided by $1,000 = 8.6), then multiply the result by the number in the appropriate column for your share class, in the column entitled “Expenses Paid During Period” to estimate the expenses you paid on your account during this period.
• Hypothetical example for comparison purposes
The section in the table under the heading “Hypothetical (5% return before expenses)” provides information about hypothetical account values and hypothetical expenses based on the fund’s actual expense ratio and an assumed rate of return of 5% per year before expenses, which is not the fund’s actual return. The hypothetical account values and expenses may not be used to estimate the actual ending account balance or expenses you paid for the period. You may use this information to compare the ongoing costs of investing in the fund and other funds. To do so, compare this 5% hypothetical example with the 5% hypothetical examples that appear in the shareholder reports of the other funds.
Please note that the expenses shown in the table are meant to highlight your ongoing costs only and do not reflect any transactional costs, such as sales charges (loads), redemption fees or exchange fees. Therefore, the section in the table under the heading “Hypothetical (5% return before expenses)” is useful in comparing ongoing costs only, and will not help you determine the relative total costs of owning different funds. In addition, if these transactional costs were included, your costs would have been higher.
| | | Beginning | | | | Ending | | Expenses |
| | | Account | | | | Account | | Paid During |
| | | Value | | | | Value | | Period |
|
| Actual | | | | | | | | | | |
| Class A | | $ 1,000.00 | | $ 915.00 | | $ 1.47* |
| Class B | | $ 1,000.00 | | $ 916.00 | | $ 2.36* |
| Class C | | $ 1,000.00 | | $ 916.00 | | $ 2.36* |
| Class I | | $ 1,000.00 | | $ 916.00 | | $ 1.18* |
| Hypothetical | | | | | | | | | | |
| (5% return | | | | | | | | | | |
| before expenses) | | | | | | | | | | |
| Class A | | $ 1,000.00 | | $ 1,018.85 | | $ 6.34** |
| Class B | | $ 1,000.00 | | $ 1,015.08 | | $10.13** |
| Class C | | $ 1,000.00 | | $ 1,015.08 | | $10.13** |
| Class I | | $ 1,000.00 | | $ 1,020.11 | | $ 5.08** |
|
* For each class of the Fund, expenses are equal to the annualized expense ratio of each class (1.25% for Class A, 2.00% for Class B, 2.00% for Class C and 1.00% for Class I), multiplied by the average account value over the period since each class’ commencement of operations (December 17, 2007), multiplied by 45 / 366 days.
** For each class of the Fund, expenses are equal to the annualized expense ratio of each class (1.25% for Class A, 2.00% for Class B, 2.00% for Class C and 1.00% for Class I), multiplied by the average account value over the period, multiplied by 184 / 366 days.
5
FINANCIAL HIGHLIGHTS
(For a share outstanding throughout the period)
| | | Period Ended |
| | | January 31, 20081 |
| CLASS A | | (unaudited) |
|
| Net asset value, beginning of period | | $10.00 |
|
| Income from investment operations | | | | |
| Net investment income (loss) | | | | 0 |
| |
|
| Net realized and unrealized gains or losses on investments | | | | (0.85) |
|
| Net asset value, end of period | | $ 9.15 |
|
| Total return2 | | | | (8.50%) |
|
| Ratios and supplemental data | | | | |
| Net assets, end of period (thousands) | | $ 459 |
| Ratios to average net assets | | | | |
| Expenses including waivers/reimbursements but excluding expense reductions | | | | 1.25%3 |
| Expenses excluding waivers/reimbursements and expense reductions | | | | 5.68%3 |
| Net investment income (loss) | | | | (0.17%)3 |
| Portfolio turnover rate | | | | 0% |
|
1 For the period from December 17, 2007 (commencement of class operations), to January 31, 2008.
2 Excluding applicable sales charges
3 Annualized
See Notes to Financial Statements
6
FINANCIAL HIGHLIGHTS
(For a share outstanding throughout the period)
| | | Period Ended |
| | | January 31, 20081 |
| CLASS B | | (unaudited) |
|
| Net asset value, beginning of period | | $10.00 |
|
| Income from investment operations | | | | |
| Net investment income (loss) | | | | (0.01) |
| Net realized and unrealized gains or losses on investments | | | | (0.83) |
| |
|
| Total from investment operations | | | | (0.84) |
|
| Net asset value, end of period | | $ 9.16 |
|
| Total return2 | | | | (8.40%) |
|
| Ratios and supplemental data | | | | |
| Net assets, end of period (thousands) | | $ 458 |
| Ratios to average net assets | | | | |
| Expenses including waivers/reimbursements but excluding expense reductions | | | | 2.00%3 |
| Expenses excluding waivers/reimbursements and expense reductions | | | | 6.43%3 |
| Net investment income (loss) | | | | (0.90%)3 |
| Portfolio turnover rate | | | | 0% |
|
1 For the period from December 17, 2007 (commencement of class operations), to January 31, 2008.
2 Excluding applicable sales charges
3 Annualized
See Notes to Financial Statements
7
FINANCIAL HIGHLIGHTS
(For a share outstanding throughout the period)
| | | Period Ended |
| | | January 31, 20081 |
| CLASS C | | (unaudited) |
|
| Net asset value, beginning of period | | $10.00 |
|
| Income from investment operations | | | | |
| Net investment income (loss) | | | | (0.01) |
| Net realized and unrealized gains or losses on investments | | | | (0.83) |
| |
|
| Total from investment operations | | | | (0.84) |
|
| Net asset value, end of period | | $ 9.16 |
|
| Total return2 | | | | (8.40%) |
|
| Ratios and supplemental data | | | | |
| Net assets, end of period (thousands) | | $ 458 |
| Ratios to average net assets | | | | |
| Expenses including waivers/reimbursements but excluding expense reductions | | | | 2.00%3 |
| Expenses excluding waivers/reimbursements and expense reductions | | | | 6.43%3 |
| Net investment income (loss) | | | | (0.90%)3 |
| Portfolio turnover rate | | | | 0% |
|
1 For the period from December 17, 2007 (commencement of class operations), to January 31, 2008.
2 Excluding applicable sales charges
3 Annualized
See Notes to Financial Statements
8
FINANCIAL HIGHLIGHTS
(For a share outstanding throughout the period)
| | | Period Ended |
| | | January 31, 20081 |
| CLASS I | | (unaudited) |
|
| Net asset value, beginning of period | | $10.00 |
|
| Income from investment operations | | |
| Net investment income (loss) | | 0 |
| |
|
| Net realized and unrealized gains or losses on investments | | (0.84) |
|
| Net asset value, end of period | | $ 9.16 |
|
| Total return | | (8.40%) |
|
| Ratios and supplemental data | | |
| Net assets, end of period (thousands) | | $3,204 |
| Ratios to average net assets | | |
| Expenses including waivers/reimbursements but excluding expense reductions | | 1.00%2 |
| Expenses excluding waivers/reimbursements and expense reductions | | 5.43%2 |
| Net investment income (loss) | | 0.00%2 |
| Portfolio turnover rate | | 0% |
|
1 For the period from December 17, 2007 (commencement of class operations), to January 31, 2008.
2 Annualized
See Notes to Financial Statements
9
SCHEDULE OF INVESTMENTS
January 31, 2008 (unaudited)
| | | | | | | Shares | | | | Value |
|
| COMMON STOCKS 97.2% | | | | | | | | | | |
| CONSUMER DISCRETIONARY 10.2% | | | | | | |
| Distributors 2.5% | | | | | | | | | | |
| Genuine Parts Co. | | | | | | 2,565 | | $ | | 112,680 |
| |
|
| Household Durables 2.6% | | | | | | | | | | |
| Newell Rubbermaid, Inc. | | | | | | 4,870 | | | | 117,464 |
| |
|
| Media 2.5% | | | | | | | | | | |
| Omnicom Group, Inc. | | | | | | 2,550 | | | | 115,694 |
| |
|
| Textiles, Apparel & Luxury Goods 2.6% | | | | | | |
| Wolverine World Wide, Inc. | | | | | | 4,760 | | | | 120,476 |
| |
|
| CONSUMER STAPLES 7.3% | | | | | | | | | | |
| Beverages 2.4% | | | | | | | | | | |
| Pepsi Bottling Group, Inc. | | | | | | 3,105 | | | | 108,209 |
| |
|
| Food Products 2.4% | | | | | | | | | | |
| H.J. Heinz Co. | | | | | | 2,635 | | | | 112,146 |
| |
|
| Personal Products 2.5% | | | | | | | | | | |
| NBTY, Inc. * | | | | | | 4,635 | | | | 112,260 |
| |
|
| ENERGY 8.8% | | | | | | | | | | |
| Energy Equipment & Services 6.6% | | | | | | |
| ENSCO International, Inc. | | | | | | 2,190 | | | | 111,952 |
| Global Industries, Ltd. * | | | | | | 5,265 | | | | 92,980 |
| Noble Corp. | | | | | | 2,205 | | | | 96,513 |
| |
|
| | | | | | | | | | | 301,445 |
| |
|
| Oil, Gas & Consumable Fuels 2.2% | | | | | | |
| Frontier Oil Corp. | | | | | | 2,940 | | | | 103,694 |
| |
|
| FINANCIALS 12.6% | | | | | | | | | | |
| Capital Markets 2.7% | | | | | | | | | | |
| Ameriprise Financial, Inc. | | | | | | 2,240 | | | | 123,894 |
| |
|
| Insurance 7.3% | | | | | | | | | | |
| AON Corp. | | | | | | 2,495 | | | | 108,582 |
| Lincoln National Corp. | | | | | | 2,130 | | | | 115,787 |
| Principal Financial Group, Inc. | | | | | | 1,810 | | | | 107,894 |
| |
|
| | | | | | | | | | | 332,263 |
| |
|
| Real Estate Investment Trusts 2.6% | | | | | | |
| Potlatch Corp. | | | | | | 2,760 | | | | 118,487 |
| |
|
| HEALTH CARE 12.6% | | | | | | | | | | |
| Health Care Equipment & Supplies 2.4% | | | | | | |
| Dentsply International, Inc. | | | | | | 2,680 | | | | 110,711 |
| |
|
| Health Care Providers & Services 5.1% | | | | | | |
| CIGNA Corp. | | | | | | 2,270 | | | | 111,593 |
| Laboratory Corporation of America Holdings * | | 1,635 | | | | 120,794 |
| |
|
| | | | | | | | | | | 232,387 |
| |
|
See Notes to Financial Statements
10
SCHEDULE OF INVESTMENTS continued
January 31, 2008 (unaudited)
| | | | | | | | | Shares | | | | Value |
|
| COMMON STOCKS continued | | | | | | | | | | | | |
| HEALTH CARE continued | | | | | | | | | | | | |
| Life Sciences Tools & Services 2.5% | | | | | | | | |
| Applera Corp. - Applied Biosystems Group | | | | 3,660 | | $ | | 115,400 |
| |
|
| Pharmaceuticals 2.6% | | | | | | | | | | | | |
| Endo Pharmaceuticals Holdings, Inc. * | | | | | | 4,500 | | | | 117,630 |
| |
|
| INDUSTRIALS 13.9% | | | | | | | | | | | | |
| Aerospace & Defense 4.2% | | | | | | | | | | | | |
| Precision Castparts Corp. | | | | | | | | 840 | | | | 95,592 |
| Spirit AeroSystems Holdings, Inc., Class A | | | | 3,575 | | | | 98,741 |
| |
|
| | | | | | | | | | | | | 194,333 |
| |
|
| Commercial Services & Supplies 2.5% | | | | | | | | |
| Manpower, Inc. | | | | | | | | 2,050 | | | | 115,333 |
| |
|
| Machinery 4.8% | | | | | | | | | | | | |
| Parker Hannifin Corp. | | | | | | | | 1,590 | | | | 107,500 |
| Terex Corp. * | | | | | | | | 1,920 | | | | 112,819 |
| |
|
| | | | | | | | | | | | | 220,319 |
| |
|
| Trading Companies & Distributors 2.4% | | | | | | | | |
| W.W. Grainger, Inc. | | | | | | | | 1,350 | | | | 107,420 |
| |
|
| INFORMATION TECHNOLOGY 19.9% | | | | | | | | |
| Communications Equipment 7.1% | | | | | | | | |
| ADC Telecommunications, Inc. * | | | | | | | | 6,665 | | | | 98,575 |
| CommScope, Inc. * | | | | | | | | 2,665 | | | | 118,193 |
| Harris Corp. | | | | | | | | 2,010 | | | | 109,927 |
| |
|
| | | | | | | | | | | | | 326,695 |
| |
|
| Electronic Equipment & Instruments 2.3% | | | | | | | | |
| Mettler-Toledo International, Inc. * | | | | | | | | 1,080 | | | | 107,244 |
| |
|
| Semiconductors & Semiconductor Equipment 4.9% | | | | |
| Intersil Corp., Class A | | | | | | | | 5,085 | | | | 117,108 |
| Lam Research Corp. * | | | | | | | | 2,755 | | | | 105,764 |
| |
|
| | | | | | | | | | | | | 222,872 |
| |
|
| Software 5.6% | | | | | | | | | | | | |
| BEA Systems, Inc. * | | | | | | | | 7,830 | | | | 146,343 |
| BMC Software, Inc. * | | | | | | | | 3,410 | | | | 109,256 |
| |
|
| | | | | | | | | | | | | 255,599 |
| |
|
| MATERIALS 4.5% | | | | | | | | | | | | |
| Chemicals 4.5% | | | | | | | | | | | | |
| Albemarle Corp. | | | | | | | | 2,905 | | | | 105,335 |
| Celanese Corp., Ser. A | | | | | | | | 2,750 | | | | 102,245 |
| |
|
| | | | | | | | | | | | | 207,580 |
| |
|
See Notes to Financial Statements
11
SCHEDULE OF INVESTMENTS continued
January 31, 2008 (unaudited)
| | | | | | | Shares | | | | Value |
|
| COMMON STOCKS continued | | | | | | |
| UTILITIES 7.4% | | | | | | | | | | |
| Electric Utilities 2.5% | | | | | | | | |
| PPL Corp. | | | | | | 2,280 | | $ | | 111,538 |
| |
|
| Independent Power Producers & Energy Traders 2.5% | | | | | | |
| Constellation Energy Group, Inc. | | | | 1,210 | | | | 113,692 |
| |
|
| Multi-Utilities 2.4% | | | | | | | | |
| Sempra Energy | | | | | | 1,995 | | | | 111,520 |
| |
|
| Total Common Stocks (cost $4,871,663) | | | | | | 4,448,985 |
| |
|
| SHORT-TERM INVESTMENTS 3.2% | | | | | | |
| MUTUAL FUND SHARES 3.2% | | | | | | |
| Evergreen Institutional Money Market Fund, Class I, 4.31% q ø | | | | |
| (cost $147,423) | | | | | | 147,423 | | | | 147,423 |
| |
|
| Total Investments (cost $5,019,086) 100.4% | | | | | | 4,596,408 |
| Other Assets and Liabilities (0.4%) | | | | | | (17,645) |
| |
|
| Net Assets 100.0% | | | | | | $ | | 4,578,763 |
| |
|
| * | | Non-income producing security |
| q | | Rate shown is the 7-day annualized yield at period end. |
| ø | | Evergreen Investment Management Company, LLC is the investment advisor to both the Fund and the money market |
| | | fund. |
The following table shows the percent of total long-term investments by sector as of January 31, 2008:
| Information Technology | | 20.5% |
| Industrials | | 14.3% |
| Health Care | | 12.9% |
| Financials | | 12.9% |
| Consumer Discretionary | | 10.5% |
| Energy | | 9.1% |
| Utilities | | 7.6% |
| Consumer Staples | | 7.5% |
| Materials | | 4.7% |
| |
|
| | | 100.0% |
| | |
|
See Notes to Financial Statements
12
STATEMENT OF ASSETS AND LIABILITIES
January 31, 2008 (unaudited)
| Assets | | | | |
| Investments in securities, at value (cost $4,871,663) | | $ | | 4,448,985 |
| Investments in affiliated money market fund, at value (cost $147,423) | | | | 147,423 |
|
| Total investments | | | | 4,596,408 |
| Dividends receivable | | | | 2,642 |
| Receivable from investment advisor | | | | 497 |
| Prepaid expenses and other assets | | | | 92,808 |
|
| Total assets | | | | 4,692,355 |
|
| Liabilities | | | | |
| Distribution Plan expenses payable | | | | 27 |
| Due to other related parties | | | | 3,210 |
| Accrued expenses and other liabilities | | | | 110,355 |
|
| Total liabilities | | | | 113,592 |
|
| Net assets | | $ | | 4,578,763 |
|
| Net assets represented by | | | | |
| Paid-in capital | | $ | | 5,002,292 |
| Undistributed net investment loss | | | | (851) |
| Net unrealized losses on investments | | | | (422,678) |
|
| Total net assets | | $ | | 4,578,763 |
|
| Net assets consists of | | | | |
| Class A | | $ | | 458,799 |
| Class B | | | | 457,751 |
| Class C | | | | 457,751 |
| Class I | | | | 3,204,462 |
|
| Total net assets | | $ | | 4,578,763 |
|
| Shares outstanding (unlimited number of shares authorized) | | | | |
| Class A | | | | 50,126 |
| Class B | | | | 50,000 |
| Class C | | | | 50,000 |
| Class I | | | | 350,000 |
|
| Net asset value per share | | | | |
| Class A | | $ | | 9.15 |
| Class A — Offering price (based on sales charge of 5.75%) | | $ | | 9.71 |
| Class B | | $ | | 9.16 |
| Class C | | $ | | 9.16 |
| Class I | | $ | | 9.16 |
|
See Notes to Financial Statements
13
STATEMENT OF OPERATIONS
Period Ended January 31, 2008 (unaudited) (a)
| Investment income | | | | |
| Dividends | | $ | | 4,020 |
| Income from affiliate | | | | 2,288 |
|
| Total investment income | | | | 6,308 |
|
| Expenses | | | | |
| Advisory fee | | | | 3,799 |
| Distribution Plan expenses | | | | |
| Class A | | | | 146 |
| Class B | | | | 584 |
| Class C | | | | 584 |
| Administrative services fee | | | | 584 |
| Transfer agent fees | | | | 3,209 |
| Trustees’ fees and expenses | | | | 452 |
| Printing and postage expenses | | | | 5,067 |
| Custodian and accounting fees | | | | 427 |
| Registration and filing fees | | | | 13,078 |
| Professional fees | | | | 4,652 |
| Other | | | | 489 |
|
| Total expenses | | | | 33,071 |
| Less: Expense reductions | | | | (7) |
| Fee waivers and expense reimbursements | | | | (25,905) |
|
| Net expenses | | | | 7,159 |
|
| Net investment loss | | | | (851) |
|
| Net change in unrealized gains or losses on investments | | | | (422,678) |
|
| Net decrease in net assets resulting from operations | | $ | | (423,529) |
|
(a) For the period from December 17, 2007 (commencement of operations), to January 31, 2008.
See Notes to Financial Statements
14
STATEMENT OF CHANGES IN NET ASSETS
| | | Period Ended |
| | | January 31, 2008 |
| | | (unaudited) (a) |
|
| Operations | | | | |
| Net investment loss | | $ | | (851) |
| Net change in unrealized gains or losses on investments | | | | (422,678) |
|
| Net decrease in net assets resulting from operations | | | | (423,529) |
|
| | | Shares | | |
| Capital share transactions | | | | |
| Proceeds from shares sold | | | | |
| Class A | | 50,126 | | 501,187 |
| Class B | | 50,000 | | 500,550 |
| Class C | | 50,000 | | 500,550 |
| Class I | | 350,000 | | 3,500,005 |
|
| Net increase in net assets resulting from capital share transactions | | | | 5,002,292 |
|
| Total increase in net assets | | | | 4,578,763 |
| Net assets | | | | |
| Beginning of period | | | | 0 |
|
| End of period | | $ | | 4,578,763 |
|
| Undistributed net investment loss | | $ | | (851) |
|
(a) For the period from December 17, 2007 (commencement of operations), to January 31, 2008.
See Notes to Financial Statements
15
NOTES TO FINANCIAL STATEMENTS (unaudited)
1. ORGANIZATION
Evergreen Golden Mid Cap Core Fund (the “Fund”) is a diversified series of Evergreen Equity Trust (the “Trust”), a Delaware statutory trust organized on September 18, 1997. The Trust is an open-end management investment company registered under the Investment Company Act of 1940, as amended (the “1940 Act”).
The Fund offers Class A, Class B, Class C and Class I shares. Class A shares are sold with a front-end sales charge. However, Class A share investments of $1 million or more are not subject to a front-end sales charge but are subject to a contingent deferred sales charge of 1.00% upon redemption within 18 months. Class B shares are sold without a front-end sales charge but are subject to a contingent deferred sales charge that is payable upon redemption and decreases depending on how long the shares have been held. Class C shares are sold without a front-end sales charge but are subject to a contingent deferred sales charge that is payable upon redemption within one year. Class I shares are sold without a front-end sales charge or contingent deferred sales charge. Each class of shares, except Class I shares, pays an ongoing distribution fee.
2. SIGNIFICANT ACCOUNTING POLICIES
The following is a summary of significant accounting policies consistently followed by the Fund in the preparation of its financial statements. The policies are in conformity with generally accepted accounting principles in the United States of America, which require management to make estimates and assumptions that affect amounts reported herein. Actual results could differ from these estimates.
a. Valuation of investments
Listed equity securities are usually valued at the last sales price or official closing price on the national securities exchange where the securities are principally traded.
Investments in open-end mutual funds are valued at net asset value. Securities for which market quotations are not readily available or not reflective of current market value are valued at fair value as determined by the investment advisor in good faith, according to procedures approved by the Board of Trustees.
b. Security transactions and investment income
Security transactions are recorded on trade date. Realized gains and losses are computed using the specific cost of the security sold. Dividend income is recorded on the ex-dividend date.
c. Federal taxes
The Fund intends to qualify as a regulated investment company and distribute all of its taxable income, including any net capital gains. Accordingly, no provision for federal taxes is required.
d. Distributions
Distributions to shareholders from net investment income and net realized gains, if any, are recorded on the ex-dividend date. Such distributions are determined in conformity with income tax regulations, which may differ from generally accepted accounting principles.
16
NOTES TO FINANCIAL STATEMENTS (unaudited) continued
e. Class allocations
Income, common expenses and realized and unrealized gains and losses are allocated to the classes based on the relative net assets of each class. Distribution fees, if any, are calculated daily at the class level based on the appropriate net assets of each class and the specific expense rates applicable to each class.
3. ADVISORY FEE AND OTHER TRANSACTIONS WITH AFFILIATES
Evergreen Investment Management Company, LLC (“EIMC”), an indirect, wholly-owned subsidiary of Wachovia Corporation (“Wachovia”), is the investment advisor to the Fund and is paid an annual fee starting at 0.65% and declining to 0.55% as average daily net assets increase. For the period ended January 31, 2008, the advisory fee was equivalent to 0.65% of the Fund’s average daily net assets (on an annualized basis).
Golden Capital Management, LLC (“Golden Capital”) is the investment sub-advisor to the Fund and is paid by EIMC for its services to the Fund. Wachovia Alternative Strategies, Inc., a wholly-owned subsidiary of Wachovia, owns a 45% minority interest in Golden Capital.
From time to time, EIMC may voluntarily or contractually waive its fee and/or reimburse expenses in order to limit operating expenses. During the period ended January 31, 2008, EIMC voluntarily waived its advisory fee in the amount of $3,799 and voluntarily reimbursed other expenses in the amount of $22,106.
The Fund may invest in money market funds which are advised by EIMC. Income earned on these investments is included in income from affiliate on the Statement of Operations.
Effective January 1, 2008, EIMC replaced Evergreen Investment Services, Inc. (“EIS”), an indirect, wholly-owned subsidiary of Wachovia, as the administrator to the Fund upon the assignment of the Fund’s Administrative Services Agreement from EIS to EIMC. There were no changes to the services being provided or fees being paid by the Fund. The administrator provides the Fund with facilities, equipment and personnel and is paid an annual rate determined by applying percentage rates to the aggregate average daily net assets of the Evergreen funds (excluding money market funds and Evergreen Institutional Enhanced Income Fund), starting at 0.10% and declining to 0.05% as the aggregate average daily net assets of the Evergreen funds (excluding money market funds and Evergreen Institutional Enhanced Income Fund) increase.
Evergreen Service Company, LLC (“ESC”), an indirect, wholly-owned subsidiary of Wachovia, is the transfer and dividend disbursing agent for the Fund. ESC receives account fees that vary based on the type of account held by the shareholders in the Fund. For the period ended January 31, 2008, the transfer agent fees were equivalent to an annual rate of 0.55% of the Fund’s average daily net assets.
17
NOTES TO FINANCIAL STATEMENTS (unaudited) continued
4. DISTRIBUTION PLANS
EIS serves as distributor of the Fund’s shares. The Fund has adopted Distribution Plans, as allowed by Rule 12b-1 of the 1940 Act, for each class of shares, except Class I. Under the Distribution Plans, distribution fees are paid at an annual rate of 0.25% of the average daily net assets for Class A shares and 1.00% of the average daily net assets for each of Class B and Class C shares.
5. INVESTMENT TRANSACTIONS
Cost of purchases and proceeds from sales of investment securities (excluding short-term securities) were $4,871,664 and $0, respectively, for the period ended January 31, 2008.
Various inputs are used in determining the value of the Fund’s investments. These inputs are summarized into three broad levels as follows:
Level 1 — quoted prices in active markets for identical securities
Level 2 — other significant observable inputs (including quoted prices for similar securities, interest rates, prepayment speeds, credit risk, etc.)
Level 3 — significant unobservable inputs (including the Fund’s own assumptions in determining the fair value of investments)
As of January 31, 2008, the inputs used in valuing the Fund’s assets, which are carried at fair value, were as follows:
| | | Valuation | | | | Investments |
| | | Inputs | | | | in Securities |
|
| Level 1 | | Quoted Prices | | $ | | 4,596,408 |
| Level 2 | | Other Significant | | | | |
| | | Observable Inputs | | | | 0 |
| Level 3 | | Significant | | | | |
| | | Unobservable | | | | |
| | | Inputs | | | | 0 |
| |
|
| Total | | | | $ | | 4,596,408 |
|
On January 31, 2008, the aggregate cost of securities for federal income tax purposes was $5,019,086. The gross unrealized appreciation and depreciation on securities based on tax cost was $26,717 and $449,395, respectively, with a net unrealized depreciation of $422,678.
6. INTERFUND LENDING
Pursuant to an Exemptive Order issued by the SEC, the Fund may participate in an interfund lending program with certain funds in the Evergreen fund family. This program allows the Fund to borrow from, or lend money to, other participating funds. During the period ended January 31, 2008, the Fund did not participate in the interfund lending program.
18
NOTES TO FINANCIAL STATEMENTS (unaudited) continued
7. EXPENSE REDUCTIONS
Through expense offset arrangements with ESC and the Fund’s custodian, a portion of fund expenses has been reduced.
8. DEFERRED TRUSTEES’ FEES
Each Trustee of the Fund may defer any or all compensation related to performance of his or her duties as a Trustee. The Trustees’ deferred balances are allocated to deferral accounts, which are included in the accrued expenses for the Fund. The investment performance of the deferral accounts is based on the investment performance of certain Evergreen funds. Any gains earned or losses incurred in the deferral accounts are reported in the Fund’s Trustees’ fees and expenses. At the election of the Trustees, the deferral account will be paid either in one lump sum or in quarterly installments for up to ten years.
9. REGULATORY MATTERS AND LEGAL PROCEEDINGS
Pursuant to an administrative order issued by the SEC on September 19, 2007, EIMC, EIS, ESC (collectively, the “Evergreen Entities”), Wachovia Securities, LLC and the SEC have entered into an agreement settling allegations of (i) improper short-term trading arrangements in effect prior to May 2003 involving former officers and employees of EIMC and certain broker-dealers, (ii) insufficient systems for monitoring exchanges and enforcing exchange limitations as stated in certain funds’ prospectuses, and (iii) inadequate e-mail retention practices. Under the settlement, the Evergreen Entities were censured and paid approximately $32 million in disgorgement and penalties. This amount, along with a fine assessed by the SEC against Wachovia Securities, LLC will be distributed pursuant to a plan to be developed by an independent distribution consultant and approved by the SEC. The Evergreen Entities neither admitted nor denied the allegations and findings set forth in its settlement with the SEC.
In addition, the Evergreen funds and EIMC and certain of its affiliates are involved in various legal actions, including private litigation and class action lawsuits. EIMC does not expect that any of such legal actions currently pending or threatened will have a material adverse impact on the financial position or operations of any of the Evergreen funds or on EIMC’s ability to provide services to the Evergreen funds.
Although EIMC believes that none of the matters discussed above will have a material adverse impact on the Evergreen funds, there can be no assurance that these matters and any publicity surrounding or resulting from them will not result in reduced sales or increased redemptions of Evergreen fund shares, which could increase Evergreen fund transaction costs or operating expenses, or that they will not have other adverse consequences on the Evergreen funds.
19
NOTES TO FINANCIAL STATEMENTS (unaudited) continued
10. NEW ACCOUNTING PRONOUNCEMENTS
In June 2006, the Financial Accounting Standards Board (“FASB”) issued FASB Interpretation No. 48, Accounting for Uncertainty in Income Taxes — an interpretation of FASB statement 109 (“FIN 48”). FIN 48 supplements FASB 109 by prescribing a recognition threshold and measurement attribute for the financial statement recognition and measurement of a tax position taken or expected to be taken in a tax return. The Fund’s financial statements have not been impacted by the adoption of FIN 48. However, the conclusions regarding FIN 48 may be subject to review and adjustment at a later date based on factors including, but not limited to, further implementation guidance expected from FASB, and on-going analysis of tax laws, regulations, and interpretations thereof.
In September 2006, FASB issued Statement of Financial Accounting Standards No. 157, Fair Value Measurements (“FAS 157”). FAS 157 establishes a single authoritative definition of fair value, establishes a framework for measuring fair value and expands disclosures about fair value measurements. FAS 157 applies to fair value measurements already required or permitted by existing standards. The change to current generally accepted accounting principles from the application of FAS 157 relates to the definition of fair value, the methods used to measure fair value, and the expanded disclosures about fair value measurements. The adoption of FAS 157 has not impacted the financial statement amounts, however, additional disclosures about the inputs used to develop the measurements and the effect of certain of the measurements on changes in net assets for the current period have been incorporated into this shareholder report as required.
20
ADDITIONAL INFORMATION (unaudited)
INFORMATION ABOUT THE REVIEW AND APPROVAL OF THE FUND’S INVESTMENT ADVISORY AGREEMENT
The Fund’s Board of Trustees considered the proposed investment advisory agreement between the Fund and EIMC and the proposed sub-advisory agreement between EIMC and Golden Capital Management, LLC (“Golden Capital”) at a meeting held in December of 2007. At that meeting, the Trustees, including a majority of the Trustees who are not interested persons (as that term is defined in the 1940 Act) of the Fund, Golden Capital, or EIMC approved the Fund’s investment advisory agreements. (References below to the “Fund” are to Evergreen Golden Mid Cap Core Fund; references to the “funds” are to the Evergreen funds generally.)
The Board of Trustees regularly meets with representatives of Evergreen Investments (“Evergreen”) during the course of the year, and met with representatives of Golden Capital in December of 2007, and, in considering the advisory and administrative arrangements for the Fund, the Trustees took into account information provided in those meetings.
The disinterested Trustees discussed the approval of the investment advisory agreements with representatives of Evergreen and with legal counsel. In all of its deliberations with respect to the Fund and the investment advisory agreements, the Board of Trustees and the disinterested Trustees were advised by independent counsel to the disinterested Trustees and counsel to the Fund. In considering the investment advisory agreements, the Trustees did not identify any particular information or consideration that was all-important or controlling, and each Trustee attributed different weights to various factors. This summary describes a number of the most important, but not necessarily all, of the factors considered by the Board and the disinterested Trustees.
The Trustees considered that EIMC and its affiliates generally provide a comprehensive investment management service to the funds. They noted that EIMC and Golden Capital would formulate and implement an investment program for the Fund. They noted that EIMC makes its personnel available to serve as officers of the funds and concluded that the reporting and management functions provided by EIMC with respect to the funds were generally satisfactory. In considering approval of the Fund’s investment advisory agreements with EIMC and Golden Capital, the Trustees considered, among other factors, Golden Capital’s portfolio management team’s investment approach; information regarding Golden Capital’s historical investment performance, as represented by a composite of accounts managed by Golden Capital, in comparison to comparable funds and the Russell Mid Cap Index; the fees to be paid by the Fund to EIMC and affiliates of EIMC and by EIMC to Golden Capital; and the estimated expenses that the Fund would pay after its launch. On the basis of these factors, they determined that Golden Capital appeared qualified to manage the Fund.
The Trustees also considered the proposed investment advisory fee to be paid by the Fund in comparison to comparable mutual funds and to other comparable accounts managed by Evergreen and concluded that the proposed fees and contractual arrangements appeared reasonable and appropriate. The Trustees considered whether further growth in assets of the Fund might
21
ADDITIONAL INFORMATION (unaudited) continued
result in economies of scale and noted that the Fund was in its start-up phase and that the advisory fee for the Fund contemplated breakpoints starting at $1 billion. The Trustees also relied, in part, on comparisons of the Fund’s projected fees and expenses to the fees and expenses of other peer mutual funds, based on data compiled by Evergreen from information provided by an independent data provider. In their consideration of the fees to be paid by the Fund, the Trustees considered information provided by EIMC regarding the projected profitability of the Fund to EIMC.
22
This page left intentionally blank
23
TRUSTEES AND OFFICERS
TRUSTEES1
| Charles A. Austin III | | Investment Counselor, Anchor Capital Advisors, LLC. (investment advice); Director, The Andover |
| Trustee | | Companies (insurance); Trustee, Arthritis Foundation of New England; Former Director, The |
| DOB: 10/23/1934 | | Francis Ouimet Society (scholarship program); Former Director, Executive Vice President and |
| Term of office since: 1991 | | Treasurer, State Street Research & Management Company (investment advice) |
| Other directorships: None | | |
|
| |
| K. Dun Gifford | | Chairman and President, Oldways Preservation and Exchange Trust (education); Trustee, |
| Trustee | | Chairman of the Finance Committee, Member of the Executive Committee, and Former |
| DOB: 10/23/1938 | | Treasurer, Cambridge College |
| Term of office since: 1974 | | |
| Other directorships: None | | |
|
| |
| Dr. Leroy Keith, Jr. | | Managing Director, Almanac Capital Management (commodities firm); Trustee, Phoenix |
| Trustee | | Fund Complex; Director, Diversapack Co. (packaging company); Former Partner, Stonington |
| DOB: 2/14/1939 | | Partners, Inc. (private equity fund); Former Director, Obagi Medical Products Co.; Former |
| Term of office since: 1983 | | Director, Lincoln Educational Services |
| Other directorships: Trustee, | | |
| Phoenix Fund Complex (consisting | | |
| of 53 portfolios as of 12/31/2007) | | |
|
| |
| Carol A. Kosel1 | | Former Consultant to the Evergreen Boards of Trustees; Former Vice President and Senior Vice |
| Trustee | | President, Evergreen Investments, Inc.; Former Treasurer, Evergreen Funds; Former Treasurer, |
| DOB: 12/25/1963 | | Vestaur Securities Fund |
| Term of office since: 2008 | | |
| Other directorships: None | | |
|
| |
| Gerald M. McDonnell | | Former Manager of Commercial Operations, CMC Steel (steel producer) |
| Trustee | | |
| DOB: 7/14/1939 | | |
| Term of office since: 1988 | | |
| Other directorships: None | | |
|
| |
| Patricia B. Norris | | President and Director of Buckleys of Kezar Lake, Inc. (real estate company); Former President |
| Trustee | | and Director of Phillips Pond Homes Association (home community); Former Partner, |
| DOB: 4/9/1948 | | PricewaterhouseCoopers, LLP (independent registered public accounting firm) |
| Term of office since: 2006 | | |
| Other directorships: None | | |
|
| |
| William Walt Pettit | | Partner and Vice President, Kellam & Pettit, P.A. (law firm); Director, Superior Packaging Corp. |
| Trustee | | (packaging company); Member, Superior Land, LLC (real estate holding company), Member, |
| DOB: 8/26/1955 | | K&P Development, LLC (real estate development); Former Director, National Kidney Foundation |
| Term of office since: 1988 | | of North Carolina, Inc. (non-profit organization) |
| Other directorships: None | | |
|
| |
| David M. Richardson | | President, Richardson, Runden LLC (executive recruitment advisory services); Director, J&M |
| Trustee | | Cumming Paper Co. (paper merchandising); Trustee, NDI Technologies, LLP (communications); |
| DOB: 9/19/1941 | | Former Consultant, AESC (The Association of Executive Search Consultants) |
| Term of office since: 1982 | | |
| Other directorships: None | | |
|
| |
| Dr. Russell A. Salton III | | President/CEO, AccessOne MedCard, Inc. |
| Trustee | | |
| DOB: 6/2/1947 | | |
| Term of office since: 1984 | | |
| Other directorships: None | | |
|
24
TRUSTEES AND OFFICERS continued
| Michael S. Scofield | | Retired Attorney, Law Offices of Michael S. Scofield; Former Director and Chairman, Branded |
| Trustee | | Media Corporation (multi-media branding company) |
| DOB: 2/20/1943 | | |
| Term of office since: 1984 | | |
| Other directorships: None | | |
|
| |
| Richard J. Shima | | Independent Consultant; Director, Hartford Hospital; Trustee, Greater Hartford YMCA; Former |
| Trustee | | Director, Trust Company of CT; Former Director, Old State House Association; Former Trustee, |
| DOB: 8/11/1939 | | Saint Joseph College (CT) |
| Term of office since: 1993 | | |
| Other directorships: None | | |
|
| |
| Richard K. Wagoner, CFA2 | | Member and Former President, North Carolina Securities Traders Association; Member, Financial |
| Trustee | | Analysts Society |
| DOB: 12/12/1937 | | |
| Term of office since: 1999 | | |
| Other directorships: None | | |
|
| |
| |
| OFFICERS | | |
| |
| Dennis H. Ferro3 | | Principal occupations: President and Chief Executive Officer, Evergreen Investment Company, |
| President | | Inc. and Executive Vice President, Wachovia Bank, N.A.; former Chief Investment Officer, |
| DOB: 6/20/1945 | | Evergreen Investment Company, Inc. |
| Term of office since: 2003 | | |
|
| |
| Jeremy DePalma4 | | Principal occupations: Senior Vice President, Evergreen Investment Management Company, LLC; |
| Treasurer | | Former Vice President, Evergreen Investment Services, Inc.; Former Assistant Vice President, |
| DOB: 2/5/1974 | | Evergreen Investment Services, Inc. |
| Term of office since: 2005 | | |
|
| |
| Michael H. Koonce4 | | Principal occupations: Senior Vice President and General Counsel, Evergreen Investment |
| Secretary | | Services, Inc.; Secretary, Senior Vice President and General Counsel, Evergreen Investment |
| DOB: 4/20/1960 | | Management Company, LLC and Evergreen Service Company, LLC; Senior Vice President and |
| Term of office since: 2000 | | Assistant General Counsel, Wachovia Corporation |
|
| |
| Robert Guerin4 | | Principal occupations: Chief Compliance Officer, Evergreen Funds and Senior Vice President of |
| Chief Compliance Officer | | Evergreen Investments Co, Inc; Former Managing Director and Senior Compliance Officer, |
| DOB: 9/20/1965 | | Babson Capital Management LLC; Former Principal and Director, Compliance and Risk |
| Term of office since: 2007 | | Management, State Street Global Advisors; Former Vice President and Manager, Sales Practice |
| | | Compliance, Deutsche Asset Management. |
1 Each Trustee, except Mses. Kosel and Norris, serves until a successor is duly elected or qualified or until his or her death, resignation, retirement or removal from office. As new Trustees, Ms. Kosel’s and Ms. Norris’ initial terms end December 31, 2010 and June 30, 2009, respectively, at which times they may be re-elected by Trustees to serve until a successor is duly elected or qualified or until her death, resignation, retirement or removal from office by the Trustees. Each Trustee, except Ms. Kosel, oversaw 93 Evergreen funds as of December 31, 2007. Ms. Kosel became a Trustee on January 1, 2008. Correspondence for each Trustee may be sent to Evergreen Board of Trustees, P.O. Box 20083, Charlotte, NC 28202.
2 Mr. Wagoner is an “interested person” of the Fund because of his ownership of shares in Wachovia Corporation, the parent to the Fund’s investment advisor.
3 The address of the Officer is 401 S. Tryon Street, 20th Floor, Charlotte, NC 28288.
4 The address of the Officer is 200 Berkeley Street, Boston, MA 02116.
Additional information about the Fund’s Board of Trustees and Officers can be found in the Statement of Additional Information (SAI) and is available upon request without charge by calling 800.343.2898.
25
581820 03/2008
Evergreen Intrinsic Value Fund
| table of contents |
| 1 | | LETTER TO SHAREHOLDERS |
| 4 | | FUND AT A GLANCE |
| 6 | | ABOUT YOUR FUND’S EXPENSES |
| 7 | | FINANCIAL HIGHLIGHTS |
| 11 | | SCHEDULE OF INVESTMENTS |
| 15 | | STATEMENT OF ASSETS AND LIABILITIES |
| 16 | | STATEMENT OF OPERATIONS |
| 17 | | STATEMENTS OF CHANGES IN NET ASSETS |
| 19 | | NOTES TO FINANCIAL STATEMENTS |
| 24 | | ADDITIONAL INFORMATION |
| 28 | | TRUSTEES AND OFFICERS |
This semiannual report must be preceded or accompanied by a prospectus of the Evergreen fund contained herein. The prospectus contains more complete information, including fees and expenses, and should be read carefully before investing or sending money.
The fund will file its complete schedule of portfolio holdings with the SEC for the first and third quarters of each fiscal year on Form N-Q. The fund’s Form N-Q will be available on the SEC’s Web site at http://www.sec.gov. In addition, the fund’s Form N-Q may be reviewed and copied at the SEC’s Public Reference Room in Washington, D.C. Information on the operation of the Public Reference Room may be obtained by calling 800.SEC.0330.
A description of the fund’s proxy voting policies and procedures, as well as information regarding how the fund voted proxies relating to portfolio securities during the most recent 12-month period ended June 30, is available by visiting our Web site at EvergreenInvestments.com or by visiting the SEC’s Web site at http://www.sec.gov. The fund’s proxy voting policies and procedures are also available without charge, upon request, by calling 800.343.2898.
| Mutual Funds: | | | | |
| NOT FDIC INSURED | | MAY LOSE VALUE | | NOT BANK GUARANTEED |
Evergreen InvestmentsSM is a service mark of Evergreen Investment Management Company, LLC.
Copyright 2008, Evergreen Investment Management Company, LLC.
Evergreen Investment Management Company, LLC is a subsidiary of Wachovia Corporation
and is an affiliate of Wachovia Corporation’s other Broker Dealer subsidiaries.
Evergreen mutual funds are distributed by Evergreen Investment Services, Inc.
200 Berkeley Street, Boston, MA 02116
LETTER TO SHAREHOLDERS
March 2008

Dennis H. Ferro
President and Chief Executive Officer
Dear Shareholder:
We are pleased to provide the Semiannual Report for Evergreen Intrinsic Value Fund, covering the six-month period ended January 31, 2008.
Investors in the domestic equity market faced challenging and increasingly stormy conditions over the six-month period ended January 31, 2008. Problems in the housing and subprime mortgage markets led to a tightening of credit, which in turn contributed to widening fears of a dramatic deceleration in the economy’s expansion. As the economy weakened, equity prices generally declined across companies of all sizes. Large cap stocks held up somewhat better than mid cap and small cap shares, while growth stocks outperformed more economically sensitive value stocks. Fixed income investors, meanwhile, sought out the highest-quality securities and attempted to avoid credit risk. Longer-maturity Treasuries outperformed other sectors, while the prices of corporate bonds and many asset-backed securities fell as the yield spreads between Treasuries and lower-rated securities widened. In this environment, the price of gold surged while the dollar remained weak.
The U.S. economy exhibited increasing signs of weakness in the latter half of 2007 and the first month of 2008 after experiencing solid growth early in 2007. Although housing and credit-related concerns began weighing on investor sentiment early in the year, the economy’s growth trajectory continued to be supported early in 2007 by the combination of solid trends in employment, income, investment and export trends. That began to change in the latter months of 2007, however, as each of these pillars of support began to weaken. Growth in Gross Domestic Product
1
LETTER TO SHAREHOLDERS continued
rose by just 0.6% during the final quarter of 2007 as economic output slowed because of a sharp reduction in business inventories. The rate of corporate earnings growth, meanwhile, declined over the second half of 2007. Payrolls dropped by 17,000 in January 2008, contributing to growing concerns about the outlook for consumer spending, which accounts for up to 70% of economic output. Faced with growing evidence of the economy’s deceleration, the Federal Reserve Board (the “Fed”) began to focus more on stimulating growth and less on watching inflation. The Fed cut the target fed funds rate from 5.25% to 4.25% during the last four months of 2007 and then slashed the rate by an additional 1.25% in two separate actions within just eight days of each other in January 2008. Also in early 2008, Congress passed, and President Bush signed, a $168 billion fiscal stimulus bill that contained rebates for taxpayers, tax breaks for businesses and additional assistance for Social Security recipients and disabled veterans.
Over the six-month period ended January 31, 2008, the management teams of Evergreen’s value-oriented equity funds tended to emphasize investments in attractively priced, fundamentally sound corporations. The portfolio manager of both Evergreen Disciplined Value Fund and Evergreen Disciplined Small-Mid Value Fund, for example, used a combination of quantitative tools and traditional fundamental analysis in reviewing opportunities among larger and smaller companies, respectively. The manager of Evergreen Equity Index Fund maintained a portfolio reflecting the composition of the Standard & Poor’s 500® Index, using a proprietary process to control trading and operational costs. Managers of Evergreen Equity Income Fund emphasized companies they believe have the ability to maintain and increase their dividends to shareholders. The managers of Evergreen Fundamental Large Cap Fund focused on larger corporations with stable earnings growth records while the managers of Evergreen Fundamental Mid Cap Value Fund, which was launched on September 28, 2007, emphasized mid-sized companies selling at what the managers believed to be reasonable valuations. The team managing Evergreen Intrinsic Value Fund sought out investments in
2
LETTER TO SHAREHOLDERS continued
established companies selling at stock prices below the managers’ estimate of the company’s intrinsic value. Meanwhile, the managers of Evergreen Small Cap Value Fund and Evergreen Special Values Fund each focused on higher-quality small companies that the managers believed to have reasonable prices and strong balance sheets.
We believe the experiences in the investment markets during the past six months have underscored the value of a well-diversified, long-term investment strategy to help soften the effects of volatility in any one market or asset class. As always, we encourage investors to maintain diversified investment portfolios in pursuit of their long-term investment goals.
Please visit us at EvergreenInvestments.com for more information about our funds and other investment products available to you. Thank you for your continued support of Evergreen Investments.
Sincerely,

Dennis H. Ferro
President and Chief Executive Officer
Evergreen Investment Company, Inc.
Special Notice to Shareholders:
Please visit our Web site at EvergreenInvestments.com for statements from President and Chief Executive Officer, Dennis Ferro, regarding the firm’s recent settlement with the Securities and Exchange Commission (SEC) and prior settlement with the Financial Industry Regulatory Authority (FINRA).
3
FUND AT A GLANCE
as of January 31, 2008
MANAGEMENT TEAM
Investment Advisor:
• Evergreen Investment Management Company, LLC
Sub-Advisor:
• Metropolitan West Capital Management, LLC
Portfolio Managers:
• Howard Gleicher, CFA
• Gary W. Lisenbee
• David M. Graham
• Jeffrey Peck
CURRENT INVESTMENT STYLE
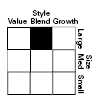
Source: Morningstar, Inc.
Morningstar's style box is based on a portfolio date as of 12/31/2007.
The Equity style box placement is based on 10 growth and valuation measures for each fund holding and the median size of the companies in which the fund invests.
PERFORMANCE AND RETURNS
Portfolio inception date: 8/1/2006
| | | Class A | | Class B | | Class C | | Class I |
| Class inception date | | 8/1/2006 | | 8/1/2006 | | 8/1/2006 | | 8/1/2006 |
|
| Nasdaq symbol | | EIVAX | | EIVBX | | EIVCX | | EIVIX |
|
| 6-month return with sales charge | | -5.23% | | -4.64% | | -0.77% | | N/A |
|
| 6-month return w/o sales charge | | 0.52% | | 0.19% | | 0.19% | | 0.65% |
|
| Average annual return* | | | | | | | | |
|
| 1-year with sales charge | | -1.95% | | -1.73% | | 2.26% | | N/A |
|
| 1-year w/o sales charge | | 4.04% | | 3.25% | | 3.25% | | 4.26% |
|
| Since portfolio inception | | 6.24% | | 7.27% | | 9.83% | | 10.77% |
|
| Maximum sales charge | | 5.75% | | 5.00% | | 1.00% | | N/A |
| | | Front-end | | CDSC | | CDSC | | |
|
* Adjusted for maximum applicable sales charge, unless noted.
Past performance is no guarantee of future results. The performance quoted represents past performance and current performance may be lower or higher. The investment return and principal value of an investment will fluctuate so that investors’ shares, when redeemed, may be worth more or less than their original cost. To obtain performance information current to the most recent month-end for Classes A, B, C or I, please go to EvergreenInvestments.com/fundperformance. The performance of each class may vary based on differences in loads, fees and expenses paid by the shareholders investing in each class. Performance includes the reinvestment of income dividends and capital gain distributions. Performance shown does not reflect the deduction of taxes that a shareholder would pay on fund distributions or the redemption of fund shares.
The fund incurs a 12b-1 fee of 0.25% for Class A and 1.00% for Classes B and C. Class I does not pay a 12b-1 fee.
The advisor is waiving a portion of its advisory fee. Had the fee not been waived, returns would have been lower.
4
FUND AT A GLANCE continued
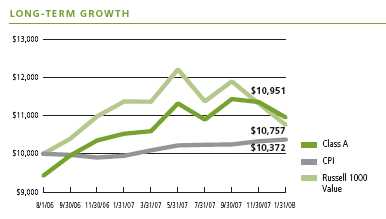
Comparison of a $10,000 investment in the Evergreen Intrinsic Value Fund Class A shares versus a similar investment in the Russell 1000 Value Index (Russell 1000 Value) and the Consumer Price Index (CPI).
The Russell 1000 Value is an unmanaged market index and does not include transaction costs associated with buying and selling securities, any mutual fund fees or expenses or any taxes. The CPI is a commonly used measure of inflation and does not represent an investment return. It is not possible to invest directly in an index.
Class I shares are only offered in the following manner: (1) to investment advisory clients of Evergreen Investment Management Company, LLC (or its advisory affiliates) when purchased by such advisor(s) on behalf of its clients, (2) to certain mutual fund wrap program clients of Wachovia Securities and of third-party broker/dealers when purchased through a clearing relationship with Wachovia Securities or an affiliate providing mutual fund clearing services, (3) through arrangements entered into on behalf of the Evergreen funds with certain financial services firms, (4) to certain institutional investors, and (5) to persons who owned Class Y shares in registered name in an Evergreen fund on or before December 31, 1994 or who owned shares of any SouthTrust fund in registered name as of March 18, 2005 or who owned shares of Vestaur Securities Fund as of May 20, 2005.
Class I shares are only available to institutional shareholders with a minimum of $1 million investment, which may be waived in certain situations.
The fund’s investment objective may be changed without a vote of the fund’s shareholders.
Foreign investments may contain more risk due to the inherent risks associated with changing political climates, foreign market instability and foreign currency fluctuations.
Since the fund tends to invest in a smaller number of stocks than many similar mutual funds, changes in the value of individual stocks may have a larger impact on its net asset value than such fluctuations would if the fund were more broadly invested.
Value-based investments are subject to the risk that the broad market may not recognize their intrinsic value.
All data is as of January 31, 2008, and subject to change.
5
ABOUT YOUR FUND’S EXPENSES
The Example below is intended to describe the fees and expenses borne by shareholders and the impact of those costs on your investment.
Example
As a shareholder of the fund, you incur two types of costs: (1) transaction costs, including sales charges (loads), redemption fees and exchange fees; and (2) ongoing costs, including management fees, distribution (12b-1) fees and other fund expenses. This Example is intended to help you understand your ongoing costs (in dollars) of investing in the fund and to compare these costs with the ongoing costs of investing in other mutual funds. The Example is based on an investment of $1,000 invested at the beginning of the period and held for the entire period from August 1, 2007 to January 31, 2008.
The example illustrates your fund’s costs in two ways:
• Actual expenses
The section in the table under the heading “Actual” provides information about actual account values and actual expenses. You may use the information in these columns, together with the amount you invested, to estimate the expenses that you paid over the period. Simply divide your account value by $1,000 (for example, an $8,600 account value divided by $1,000 = 8.6), then multiply the result by the number in the appropriate column for your share class, in the column entitled “Expenses Paid During Period” to estimate the expenses you paid on your account during this period.
• Hypothetical example for comparison purposes
The section in the table under the heading “Hypothetical (5% return before expenses)” provides information about hypothetical account values and hypothetical expenses based on the fund’s actual expense ratio and an assumed rate of return of 5% per year before expenses, which is not the fund’s actual return. The hypothetical account values and expenses may not be used to estimate the actual ending account balance or expenses you paid for the period. You may use this information to compare the ongoing costs of investing in the fund and other funds. To do so, compare this 5% hypothetical example with the 5% hypothetical examples that appear in the shareholder reports of the other funds.
Please note that the expenses shown in the table are meant to highlight your ongoing costs only and do not reflect any transactional costs, such as sales charges (loads), redemption fees or exchange fees. Therefore, the section in the table under the heading “Hypothetical (5% return before expenses)” is useful in comparing ongoing costs only, and will not help you determine the relative total costs of owning different funds. In addition, if these transactional costs were included, your costs would have been higher.
| | | Beginning | | Ending | | |
| | | Account | | Account | | Expenses |
| | | Value | | Value | | Paid During |
| | | 8/1/2007 | | 1/31/2008 | | Period* |
|
| Actual | | | | | | |
| Class A | | $ 1,000.00 | | $ 1,005.21 | | $ 5.80 |
| Class B | | $ 1,000.00 | | $ 1,001.90 | | $ 9.76 |
| Class C | | $ 1,000.00 | | $ 1,001.93 | | $ 9.76 |
| Class I | | $ 1,000.00 | | $ 1,006.52 | | $ 4.74 |
| Hypothetical | | | | | | |
| (5% return | | | | | | |
| before expenses) | | | | | | |
| Class A | | $ 1,000.00 | | $ 1,019.36 | | $ 5.84 |
| Class B | | $ 1,000.00 | | $ 1,015.38 | | $ 9.83 |
| Class C | | $ 1,000.00 | | $ 1,015.38 | | $ 9.83 |
| Class I | | $ 1,000.00 | | $ 1,020.41 | | $ 4.77 |
|
* For each class of the Fund, expenses are equal to the annualized expense ratio of each class (1.15% for Class A, 1.94% for Class B, 1.94% for Class C and 0.94% for Class I), multiplied by the average account value over the period, multiplied by 184 / 366 days.
6
FINANCIAL HIGHLIGHTS
(For a share outstanding throughout each period)
| | | Six Months Ended | | |
| | | January 31, 2008 | | Year Ended |
| CLASS A | | (unaudited) | | July 31, 20071 |
|
| Net asset value, beginning of period | | $ 11.53 | | $ 10.00 |
|
| Income from investment operations | | | | |
| Net investment income (loss) | | 0.02 | | 0.07 |
| Net realized and unrealized gains or losses on investments | | 0.042 | | 1.49 |
| Total from investment operations | | 0.06 | | 1.56 |
|
| Distributions to shareholders from | | | | |
| Net investment income | | (0.05) | | (0.03) |
| Net realized gains | | (0.42) | | 0 |
| Total distributions to shareholders | | (0.47) | | (0.03) |
|
| Net asset value, end of period | | $ 11.12 | | $ 11.53 |
|
| Total return3 | | 0.52% | | 15.58% |
|
| Ratios and supplemental data | | | | |
| Net assets, end of period (thousands) | | $97,440 | | $81,087 |
| Ratios to average net assets | | | | |
| Expenses including waivers/reimbursements but excluding expense reductions | | 1.15%4 | | 1.21% |
| Expenses excluding waivers/reimbursements and expense reductions | | 1.18%4 | | 1.33% |
| Net investment income (loss) | | 0.63%4 | | 1.14% |
| Portfolio turnover rate | | 9% | | 91% |
|
1 Class A commenced operations on August 1, 2006.
2 The per share net realized and unrealized gains or losses is not in accord with the net realized and unrealized gains or losses for the period due to the timing of sales and redemptions of Fund shares in relation to fluctuating market values for the portfolio.
3 Excluding applicable sales charges
4 Annualized
See Notes to Financial Statements
7
FINANCIAL HIGHLIGHTS
(For a share outstanding throughout each period)
| | | Six Months Ended | | |
| | | January 31, 2008 | | Year Ended |
| CLASS B | | (unaudited) | | July 31, 20071 |
|
| Net asset value, beginning of period | | $ 11.48 | | $ 10.00 |
|
| Income from investment operations | | | | |
| Net investment income (loss) | | (0.01) | | 0.02 |
| Net realized and unrealized gains or losses on investments | | 0.032 | | 1.47 |
| Total from investment operations | | 0.02 | | 1.49 |
|
| Distributions to shareholders from | | | | |
| Net investment income | | 0 | | (0.01) |
| Net realized gains | | (0.42) | | 0 |
| Total distributions to shareholders | | (0.42) | | (0.01) |
|
| Net asset value, end of period | | $ 11.08 | | $ 11.48 |
|
| Total return3 | | 0.19% | | 14.89% |
|
| Ratios and supplemental data | | | | |
| Net assets, end of period (thousands) | | $21,996 | | $24,084 |
| Ratios to average net assets | | | | |
| Expenses including waivers/reimbursements but excluding expense reductions | | 1.94%4 | | 1.97% |
| Expenses excluding waivers/reimbursements and expense reductions | | 1.97%4 | | 2.09% |
| Net investment income (loss) | | (0.14%)4 | | 0.44% |
| Portfolio turnover rate | | 9% | | 91% |
|
1 Class B commenced operations on August 1, 2006.
2 The per share net realized and unrealized gains or losses is not in accord with the net realized and unrealized gains or losses for the period due to the timing of sales and redemptions of Fund shares in relation to fluctuating market values for the portfolio.
3 Excluding applicable sales charges
4 Annualized
See Notes to Financial Statements
8
FINANCIAL HIGHLIGHTS
(For a share outstanding throughout each period)
| | | Six Months Ended | | |
| | | January 31, 2008 | | Year Ended |
| CLASS C | | (unaudited) | | July 31, 20071 |
|
| Net asset value, beginning of period | | $ 11.48 | | $ 10.00 |
|
| Income from investment operations | | | | |
| Net investment income (loss) | | (0.01) | | 0.02 |
| Net realized and unrealized gains or losses on investments | | 0.032 | | 1.47 |
| Total from investment operations | | 0.02 | | 1.49 |
|
| Distributions to shareholders from | | | | |
| Net investment income | | 0 | | (0.01) |
| Net realized gains | | (0.42) | | 0 |
| Total distributions to shareholders | | (0.42) | | (0.01) |
|
| Net asset value, end of period | | $ 11.08 | | $ 11.48 |
|
| Total return3 | | 0.19% | | 14.90% |
|
| Ratios and supplemental data | | | | |
| Net assets, end of period (thousands) | | $22,370 | | $19,640 |
| Ratios to average net assets | | | | |
| Expenses including waivers/reimbursements but excluding expense reductions | | 1.94%4 | | 1.98% |
| Expenses excluding waivers/reimbursements and expense reductions | | 1.97%4 | | 2.10% |
| Net investment income (loss) | | (0.16%)4 | | 0.31% |
| Portfolio turnover rate | | 9% | | 91% |
|
1 Class C commenced operations on August 1, 2006.
2 The per share net realized and unrealized gains or losses is not in accord with the net realized and unrealized gains or losses for the period due to the timing of sales and redemptions of Fund shares in relation to fluctuating market values for the portfolio.
3 Excluding applicable sales charges
4 Annualized
See Notes to Financial Statements
9
FINANCIAL HIGHLIGHTS
(For a share outstanding throughout each period)
| | | Six Months Ended | | |
| | | January 31, 2008 | | Year Ended |
| CLASS I | | (unaudited) | | July 31, 20071 |
|
| Net asset value, beginning of period | | $ 11.55 | | $ 10.00 |
|
| Income from investment operations | | | | |
| Net investment income (loss) | | 0.052 | | 0.10 |
| Net realized and unrealized gains or losses on investments | | 0.033 | | 1.48 |
| Total from investment operations | | 0.08 | | 1.58 |
|
| Distributions to shareholders from | | | | |
| Net investment income | | (0.07) | | (0.03) |
| Net realized gains | | (0.42) | | 0 |
| Total distributions to shareholders | | (0.49) | | (0.03) |
|
| Net asset value, end of period | | $ 11.14 | | $ 11.55 |
|
| Total return | | 0.65% | | 15.84% |
|
| Ratios and supplemental data | | | | |
| Net assets, end of period (thousands) | | $103,568 | | $61,469 |
| Ratios to average net assets | | | | |
| Expenses including waivers/reimbursements but excluding expense reductions | | 0.94%4 | | 0.99% |
| Expenses excluding waivers/reimbursements and expense reductions | | 0.97%4 | | 1.11% |
| Net investment income (loss) | | 0.80%4 | | 1.18% |
| Portfolio turnover rate | | 9% | | 91% |
|
1 Class I commenced operations on August 1, 2006.
2 Net investment income (loss) per share is based on average shares outstanding during the period.
3 The per share net realized and unrealized gains or losses is not in accord with the net realized and unrealized gains or losses for the period due to the timing of sales and redemptions of Fund shares in relation to fluctuating market values for the portfolio.
4 Annualized
See Notes to Financial Statements
10
SCHEDULE OF INVESTMENTS
January 31, 2008 (unaudited)
| | | | | Shares | | | | Value |
|
| COMMON STOCKS 95.6% | | | | | | | | |
| CONSUMER DISCRETIONARY 8.3% | | | | | | |
| Media 3.4% | | | | | | | | |
| Time Warner, Inc. | | | | 438,000 | | $ | | 6,894,120 |
| Warner Music Group Corp. p | | | | 177,700 | | | | 1,412,715 |
| |
|
| | | | | | | | | 8,306,835 |
| |
|
| Multi-line Retail 2.7% | | | | | | | | |
| J.C. Penney Co., Inc. p | | | | 140,000 | | | | 6,637,400 |
| |
|
| Specialty Retail 2.2% | | | | | | | | |
| Home Depot, Inc. | | | | 175,000 | | | | 5,367,250 |
| |
|
| CONSUMER STAPLES 17.3% | | | | | | | | |
| Beverages 2.5% | | | | | | | | |
| Diageo plc, ADR | | | | 74,900 | | �� | | 6,045,179 |
| |
|
| Food & Staples Retailing 4.8% | | | | | | |
| Safeway, Inc. | | | | 188,000 | | | | 5,826,120 |
| Sysco Corp. | | | | 205,500 | | | | 5,969,775 |
| |
|
| | | | | | | | | 11,795,895 |
| |
|
| Food Products 4.9% | | | | | | | | |
| Archer Daniels Midland Co. | | | | 151,850 | | | | 6,688,993 |
| Kellogg Co. | | | | 112,000 | | | | 5,364,800 |
| |
|
| | | | | | | | | 12,053,793 |
| |
|
| Personal Products 2.5% | | | | | | | | |
| L’Oreal Co., ADR p | | | | 255,000 | | | | 6,222,000 |
| |
|
| Tobacco 2.6% | | | | | | | | |
| UST, Inc. | | | | 122,000 | | | | 6,339,120 |
| |
|
| ENERGY 6.2% | | | | | | | | |
| Energy Equipment & Services 2.7% | | | | | | |
| Weatherford International, Ltd. * | | | | 108,400 | | | | 6,700,204 |
| |
|
| Oil, Gas & Consumable Fuels 3.5% | | | | | | |
| ConocoPhillips | | | | 108,000 | | | | 8,674,560 |
| |
|
| FINANCIALS 22.0% | | | | | | | | |
| Capital Markets 4.5% | | | | | | | | |
| Charles Schwab Corp. | | | | 267,000 | | | | 5,954,100 |
| Morgan Stanley | | | | 105,000 | | | | 5,190,150 |
| |
|
| | | | | | | | | 11,144,250 |
| |
|
| Commercial Banks 9.4% | | | | | | | | |
| East West Bancorp, Inc. p | | | | 193,000 | | | | 4,643,580 |
| Mitsubishi UFJ Financial Group, Inc., ADR | | 478,000 | | | | 4,722,640 |
| Synovus Financial Corp. | | | | 275,600 | | | | 3,640,676 |
| Wells Fargo & Co. | | | | 112,000 | | | | 3,809,120 |
| Zions Bancorp | | | | 113,000 | | | | 6,185,620 |
| |
|
| | | | | | | | | 23,001,636 |
| |
|
See Notes to Financial Statements
11
SCHEDULE OF INVESTMENTS continued
January 31, 2008 (unaudited)
| | | | | | | | | Shares | | | | Value |
|
| COMMON STOCKS continued | | | | | | | | | | |
| FINANCIALS continued | | | | | | | | | | |
| Consumer Finance 0.1% | | | | | | | | | | |
| Discover Financial Services | | | | | | | | 19,500 | | $ | | 341,250 |
| |
|
| Diversified Financial Services 3.1% | | | | | | | | | | |
| JPMorgan Chase & Co. | | | | | | | | 159,000 | | | | 7,560,450 |
| |
|
| Insurance 4.9% | | | | | | | | | | | | |
| AFLAC, Inc. | | | | | | | | 110,500 | | | | 6,776,965 |
| American International Group, Inc. | | | | | | 93,000 | | | | 5,129,880 |
| |
|
| | | | | | | | | | | | | 11,906,845 |
| |
|
| HEALTH CARE 9.0% | | | | | | | | | | | | |
| Health Care Equipment & Supplies 4.9% | | | | | | | | |
| Baxter International, Inc. | | | | | | | | 123,700 | | | | 7,513,538 |
| Hospira, Inc. * | | | | | | | | 110,000 | | | | 4,522,100 |
| |
|
| | | | | | | | | | | | | 12,035,638 |
| |
|
| Health Care Providers & Services 1.9% | | | | | | | | |
| Universal Health Services, Inc., Class B | | | | | | 96,200 | | | | 4,533,906 |
| |
|
| Pharmaceuticals 2.2% | | | | | | | | | | |
| Eli Lilly & Co. | | | | | | | | 107,000 | | | | 5,512,640 |
| |
|
| INDUSTRIALS 10.4% | | | | | | | | | | | | |
| Aerospace & Defense 5.4% | | | | | | | | | | |
| Boeing Co. | | | | | | | | 84,000 | | | | 6,987,120 |
| Northrop Grumman Corp. | | | | | | | | 78,800 | | | | 6,253,568 |
| |
|
| | | | | | | | | | | | | 13,240,688 |
| |
|
| Electrical Equipment 2.0% | | | | | | | | | | |
| Thomas & Betts Corp. * | | | | | | | | 111,000 | | | | 5,022,750 |
| |
|
| Machinery 3.0% | | | | | | | | | | | | |
| Deere & Co. | | | | | | | | 83,000 | | | | 7,284,080 |
| |
|
| INFORMATION TECHNOLOGY 12.3% | | | | | | | | |
| Computers & Peripherals 5.5% | | | | | | | | | | |
| Apple, Inc. * | | | | | | | | 54,000 | | | | 7,309,440 |
| International Business Machines Corp. | | | | | | 57,000 | | | | 6,118,380 |
| |
|
| | | | | | | | | | | | | 13,427,820 |
| |
|
| Electronic Equipment & Instruments 1.7% | | | | | | | | |
| Molex, Inc. | | | | | | | | 20,000 | | | | 480,800 |
| Molex, Inc., Class A | | | | | | | | 155,200 | | | | 3,614,608 |
| |
|
| | | | | | | | | | | | | 4,095,408 |
| |
|
| Semiconductors & Semiconductor Equipment 2.3% | | | | |
| Texas Instruments, Inc. | | | | | | | | 184,000 | | | | 5,691,120 |
| |
|
See Notes to Financial Statements
12
SCHEDULE OF INVESTMENTS continued
January 31, 2008 (unaudited)
| | | | | | | Shares | | | | Value |
|
| COMMON STOCKS continued | | | | | | | | |
| INFORMATION TECHNOLOGY continued | | | | | | |
| Software 2.8% | | | | | | | | | | |
| Oracle Corp. * | | | | | | 340,000 | | $ | | 6,987,000 |
| |
|
| MATERIALS 2.7% | | | | | | | | | | |
| Chemicals 2.7% | | | | | | | | | | |
| Air Products & Chemicals, Inc. | | | | | | 75,300 | | | | 6,778,505 |
| |
|
| TELECOMMUNICATION SERVICES 4.9% | | | | | | |
| Diversified Telecommunication Services 2.9% | | | | | | |
| AT&T, Inc. | | | | | | 184,000 | | | | 7,082,160 |
| |
|
| Wireless Telecommunication Services 2.0% | | | | | | |
| Vodafone Group plc, ADR | | | | | | 140,000 | | | | 4,872,000 |
| |
|
| UTILITIES 2.5% | | | | | | | | | | |
| Multi-Utilities 2.5% | | | | | | | | | | |
| Dominion Resources, Inc. p | | | | | | 141,000 | | | | 6,063,000 |
| |
|
| Total Common Stocks (cost $234,114,598) | | | | | | 234,723,382 |
| | |
|
|
| | | | | | | Principal | | | | |
| | | | | | | Amount | | | | Value |
|
| SHORT-TERM INVESTMENTS 7.4% | | | | | | | | |
| REPURCHASE AGREEMENTS ^ 4.1% | | | | | | | | |
| ABN Amro, Inc., 3.21%, dated 01/31/2008, maturing 02/01/2008, maturity value | | | | | | |
| $2,000,178 pp | | | | | | $2,000,000 | | | | 2,000,000 |
| Banc of America Securities, LLC, 3.20%, dated 01/31/2008, maturing 02/01/2008, | | | | | | |
| maturity value $1,000,088 -- | | | | | | 1,000,000 | | | | 1,000,000 |
| BNP Paribas SA, 3.21%, dated 01/31/2008, maturing 02/01/2008, maturity value | | | | | | |
| $1,000,088 pp | | | | | | 1,000,000 | | | | 1,000,000 |
| Credit Suisse First Boston, LLC, 3.21%, dated 01/31/2008, maturing 02/01/2008, | | | | | | |
| maturity value $1,000,088 pp | | | | | | 1,000,000 | | | | 1,000,000 |
| Deutsche Bank Securities, Inc., 3.21%, dated 01/31/2008, maturing 02/01/2008, | | | | | | |
| maturity value $1,000,088 pp | | | | | | 1,000,000 | | | | 1,000,000 |
| Greenwich Capital Markets, Inc., 3.21%, dated 01/31/2008, maturing 02/01/2008, | | | | | | |
| maturity value $1,000,088 pp | | | | | | 1,000,000 | | | | 1,000,000 |
| JPMorgan Securities, Inc., 3.20%, dated 01/31/2008, maturing 02/01/2008, | | | | | | |
| maturity value $1,000,088 pp | | | | | | 1,000,000 | | | | 1,000,000 |
| Lehman Brothers, Inc., 3.20%, dated 01/31/2008, maturing 02/01/2008, maturity | | | | | | |
| value $1,000,088 pp | | | | | | 1,000,000 | | | | 1,000,000 |
| Merrill Lynch Pierce Fenner & Smith, Inc., 3.20%, dated 01/31/2008, maturing | | | | | | |
| 02/01/2008, maturity value $1,000,088 pp | | 1,000,000 | | | | 1,000,000 |
| |
|
| | | | | | | | | | | 10,000,000 |
| |
|
See Notes to Financial Statements
13
SCHEDULE OF INVESTMENTS continued
January 31, 2008 (unaudited)
| | | Shares | | | | Value |
|
| SHORT-TERM INVESTMENTS continued | | | | | | |
| MUTUAL FUND SHARES 3.3% | | | | | | |
| AIM Short-Term Investments Trust Government & Agency Portfolio, Class I, | | | | | | |
| 3.72% pp q | | 678,585 | | $ | | 678,585 |
| Evergreen Institutional Money Market Fund, Class I, 4.31% q ø | | 7,423,572 | | | | 7,423,572 |
| |
|
| | | | | | | 8,102,157 |
| |
|
| Total Short-Term Investments (cost $18,102,157) | | | | | | 18,102,157 |
| |
|
| Total Investments (cost $252,216,755) 103.0% | | | | | | 252,825,539 |
| Other Assets and Liabilities (3.0%) | | | | | | (7,452,261) |
| |
|
| Net Assets 100.0% | | | | $ | | 245,373,278 |
| |
|
| p | | All or a portion of this security is on loan. |
| * | | Non-income producing security |
| ^ | | Collateral is pooled with the collateral of other Evergreen funds and allocated on a pro-rata basis into 97 issues of high |
| | | grade short-term securities such that sufficient collateral is applied to the respective repurchase agreement. |
| pp | | All or a portion of this security represents investment of cash collateral received from securities on loan. |
| q | | Rate shown is the 7-day annualized yield at period end. |
| ø | | Evergreen Investment Management Company, LLC is the investment advisor to both the Fund and the money market |
| | | fund. |
Summary of Abbreviations
ADR American Depository Receipt
The following table shows the percent of total long-term investments by sector as of January 31, 2008:
| Financials | | 22.9% |
| Consumer Staples | | 18.0% |
| Information Technology | | 12.9% |
| Industrials | | 10.9% |
| Health Care | | 9.4% |
| Consumer Discretionary | | 8.7% |
| Energy | | 6.6% |
| Telecommunication Services | | 5.1% |
| Materials | | 2.9% |
| Utilities | | 2.6% |
| |
|
| | | 100.0% |
| | |
|
See Notes to Financial Statements
14
STATEMENT OF ASSETS AND LIABILITIES
January 31, 2008 (unaudited)
| Assets | | | | |
| Investments in securities, at value (cost $244,793,183) including $10,544,020 of securities | | | | |
| loaned | | $ | | 245,401,967 |
| Investments in affiliated money market fund, at value (cost $7,423,572) | | | | 7,423,572 |
|
| Total investments | | | | 252,825,539 |
| Receivable for Fund shares sold | | | | 3,120,447 |
| Dividends receivable | | | | 263,761 |
| Receivable for securities lending income | | | | 4,406 |
| Prepaid expenses and other assets | | | | 9,560 |
|
| Total assets | | | | 256,223,713 |
|
| Liabilities | | | | |
| Payable for Fund shares redeemed | | | | 118,821 |
| Payable for securities on loan | | | | 10,678,585 |
| Advisory fee payable | | | | 4,252 |
| Distribution Plan expenses payable | | | | 1,772 |
| Due to other related parties | | | | 6,357 |
| Accrued expenses and other liabilities | | | | 40,648 |
|
| Total liabilities | | | | 10,850,435 |
|
| Net assets | | $ | | 245,373,278 |
|
| Net assets represented by | | | | |
| Paid-in capital | | $ | | 243,329,433 |
| Undistributed net investment income | | | | 325,481 |
| Accumulated net realized gains on investments | | | | 1,109,580 |
| Net unrealized gains on investments | | | | 608,784 |
|
| Total net assets | | $ | | 245,373,278 |
|
| Net assets consists of | | | | |
| Class A | | $ | | 97,439,692 |
| Class B | | | | 21,995,507 |
| Class C | | | | 22,369,998 |
| Class I | | | | 103,568,081 |
|
| Total net assets | | $ | | 245,373,278 |
|
| Shares outstanding (unlimited number of shares authorized) | | | | |
| Class A | | | | 8,760,793 |
| Class B | | | | 1,984,904 |
| Class C | | | | 2,019,471 |
| Class I | | | | 9,296,838 |
|
| Net asset value per share | | | | |
| Class A | | $ | | 11.12 |
| Class A — Offering price (based on sales charge of 5.75%) | | $ | | 11.80 |
| Class B | | $ | | 11.08 |
| Class C | | $ | | 11.08 |
| Class I | | $ | | 11.14 |
|
See Notes to Financial Statements
15
STATEMENT OF OPERATIONS
Six Months Ended January 31, 2008 (unaudited)
| Investment income | | | | |
| Dividends (net of foreign withholding taxes of $3,392) | | $ | | 1,634,935 |
| Income from affiliate | | | | 196,978 |
| Securities lending | | | | 11,510 |
|
| Total investment income | | | | 1,843,423 |
|
| Expenses | | | | |
| Advisory fee | | | | 645,687 |
| Distribution Plan expenses | | | | |
| Class A | | | | 94,567 |
| Class B | | | | 118,245 |
| Class C | | | | 106,029 |
| Administrative services fee | | | | 103,761 |
| Transfer agent fees | | | | 127,614 |
| Trustees’ fees and expenses | | | | 3,351 |
| Printing and postage expenses | | | | 15,995 |
| Custodian and accounting fees | | | | 29,311 |
| Registration and filing fees | | | | 64,747 |
| Professional fees | | | | 12,758 |
| Other | | | | 4,563 |
|
| Total expenses | | | | 1,326,628 |
| Less: Expense reductions | | | | (2,200) |
| Fee waivers | | | | (28,594) |
|
| Net expenses | | | | 1,295,834 |
|
| Net investment income | | | | 547,589 |
|
| Net realized and unrealized gains or losses on investments | | | | |
| Net realized gains on investments | | | | 1,112,552 |
| Net change in unrealized gains or losses on investments | | | | (2,003,470) |
|
| Net realized and unrealized gains or losses on investments | | | | (890,918) |
|
| Net decrease in net assets resulting from operations | | $ | | (343,329) |
|
See Notes to Financial Statements
16
STATEMENTS OF CHANGES IN NET ASSETS
| | | Six Months Ended | | |
| | | January 31, 2008 | | Year Ended |
| | | (unaudited) | | July 31, 2007 |
|
| Operations | | | | | | | | |
| Net investment income | | $ | | 547,589 | | $ | | 752,416 |
| Net realized gains on investments | | | | 1,112,552 | | | | 6,976,101 |
| Net change in unrealized gains or losses | | | | | | | | |
| on investments | | | | (2,003,470) | | | | (5,304,743) |
|
| Net increase (decrease) in net assets | | | | | | | | |
| resulting from operations | | | | (343,329) | | | | 2,423,774 |
|
| Distributions to shareholders from | | | | | | | | |
| Net investment income | | | | | | | | |
| Class A | | | | (434,161) | | | | (31,857) |
| Class B | | | | 0 | | | | (2,981) |
| Class C | | | | 0 | | | | (3,846) |
| Class I | | | | (481,869) | | | | (19,810) |
| Net realized gains | | | | | | | | |
| Class A | | | | (2,951,263) | | | | 0 |
| Class B | | | | (839,088) | | | | 0 |
| Class C | | | | (769,342) | | | | 0 |
| Class I | | | | (2,419,380) | | | | 0 |
|
| Total distributions to shareholders | | | | (7,895,103) | | | | (58,494) |
|
| | | Shares | | | | Shares | | |
| Capital share transactions | | | | | | | | |
| Proceeds from shares sold | | | | | | | | |
| Class A | | 2,637,999 | | 29,898,735 | | 3,786,755 | | 42,209,437 |
| Class B | | 94,549 | | 1,089,156 | | 702,101 | | 7,696,700 |
| Class C | | 507,877 | | 5,883,136 | | 1,140,041 | | 12,645,265 |
| Class I | | 4,335,367 | | 49,968,390 | | 5,551,342 | | 62,350,064 |
|
| | | | | 86,839,417 | | | | 124,901,466 |
|
| Net asset value of shares issued in | | | | | | | | |
| reinvestment of distributions | | | | | | | | |
| Class A | | 281,689 | | 3,168,824 | | 2,230 | | 24,823 |
| Class B | | 69,499 | | 772,828 | | 112 | | 1,246 |
| Class C | | 61,400 | | 682,150 | | 252 | | 2,803 |
| Class I | | 217,901 | | 2,459,154 | | 1,132 | | 12,600 |
|
| | | | | 7,082,956 | | | | 41,472 |
|
| Automatic conversion of Class B shares | | | | | | | | |
| to Class A shares | | | | | | | | |
| Class A | | 44,958 | | 526,911 | | 0 | | 0 |
| Class B | | (45,200) | | (526,911) | | 0 | | 0 |
|
| | | | | 0 | | | | 0 |
|
| Payment for shares redeemed | | | | | | | | |
| Class A | | (1,238,058) | | (14,214,146) | | (698,606) | | (8,254,512) |
| Class B | | (231,015) | | (2,656,574) | | (239,554) | | (2,837,011) |
| Class C | | (260,619) | | (2,966,715) | | (144,966) | | (1,724,332) |
| Class I | | (579,069) | | (6,753,347) | | (472,118) | | (5,545,673) |
|
| | | | | (26,590,782) | | | | (18,361,528) |
|
| Net asset value of shares issued in | | | | | | | | |
| acquisition | | | | | | | | |
| Class A | | 0 | | 0 | | 3,943,826 | | 46,701,803 |
| Class B | | 0 | | 0 | | 1,634,412 | | 19,309,100 |
| Class C | | 0 | | 0 | | 715,486 | | 8,449,319 |
| Class I | | 0 | | 0 | | 242,283 | | 2,873,207 |
|
| | | | | 0 | | | | 77,333,429 |
|
See Notes to Financial Statements
17
STATEMENTS OF CHANGES IN NET ASSETS continued
| | | Six Months Ended | | |
| | | January 31, 2008 | | Year Ended |
| | | (unaudited) | | July 31, 2007 |
|
| Capital share transactions | | | | | | | | |
| continued | | | | | | | | |
| Net increase in net assets resulting from | | | | | | | | |
| capital share transactions | | $ | | 67,331,591 | | $ | | 183,914,839 |
|
| Total increase in net assets | | | | 59,093,159 | | | | 186,280,119 |
| Net assets | | | | | | | | |
| Beginning of period | | | | 186,280,119 | | | | 0 |
|
| End of period | | $ | | 245,373,278 | | $ | | 186,280,119 |
|
| Undistributed net investment income | | $ | | 325,481 | | $ | | 693,922 |
|
See Notes to Financial Statements
18
NOTES TO FINANCIAL STATEMENTS (unaudited)
1. ORGANIZATION
Evergreen Intrinsic Value Fund (the “Fund”) is a diversified series of Evergreen Equity Trust (the “Trust”), a Delaware statutory trust organized on September 18, 1997. The Trust is an open-end management investment company registered under the Investment Company Act of 1940, as amended (the “1940 Act”).
The Fund offers Class A, Class B, Class C and Class I shares. Class A shares are sold with a front-end sales charge. However, Class A share investments of $1 million or more are not subject to a front-end sales charge but are subject to a contingent deferred sales charge of 1.00% upon redemption within 18 months. Class B shares are sold without a front-end sales charge but are subject to a contingent deferred sales charge that is payable upon redemption and decreases depending on how long the shares have been held. Class C shares are sold without a front-end sales charge but are subject to a contingent deferred sales charge that is payable upon redemption within one year. Class I shares are sold without a front-end sales charge or contingent deferred sales charge. Each class of shares, except Class I shares, pays an ongoing distribution fee.
2. SIGNIFICANT ACCOUNTING POLICIES
The following is a summary of significant accounting policies consistently followed by the Fund in the preparation of its financial statements. The policies are in conformity with generally accepted accounting principles in the United States of America, which require management to make estimates and assumptions that affect amounts reported herein. Actual results could differ from these estimates.
a. Valuation of investments
Listed equity securities are usually valued at the last sales price or official closing price on the national securities exchange where the securities are principally traded.
Short-term securities with remaining maturities of 60 days or less at the time of purchase are valued at amortized cost, which approximates market value.
Investments in open-end mutual funds are valued at net asset value. Securities for which market quotations are not readily available or not reflective of current market value are valued at fair value as determined by the investment advisor in good faith, according to procedures approved by the Board of Trustees.
b. Repurchase agreements
Securities pledged as collateral for repurchase agreements are held by the custodian bank or in a segregated account in the Fund’s name until the agreements mature. Collateral for certain tri-party repurchase agreements is held at the counterparty’s custodian in a segregated account for the benefit of the Fund and the counterparty. Each agreement requires that the market value of the collateral be sufficient to cover payments of interest and principal. However, in the event of default or bankruptcy by the other party to the agreement, retention of the collateral may be subject to legal proceedings. The Fund will enter into repurchase agreements with banks and other financial institutions, which are deemed by the investment advisor to be creditworthy pursuant to guidelines established by the Board of Trustees. In certain instances, the Fund’s securities lending agent may provide collateral in the form of repurchase agreements.
19
NOTES TO FINANCIAL STATEMENTS (unaudited) continued
c. Securities lending
The Fund may lend its securities to certain qualified brokers in order to earn additional income. The Fund receives compensation in the form of fees or interest earned on the investment of any cash collateral received. The Fund also continues to receive interest and dividends on the securities loaned. The Fund receives collateral in the form of cash or securities with a market value at least equal to the market value of the securities on loan. In the event of default or bankruptcy by the borrower, the Fund could experience delays and costs in recovering the loaned securities or in gaining access to the collateral. The Fund has the right under the lending agreement to recover the securities from the borrower on demand.
d. Security transactions and investment income
Security transactions are recorded on trade date. Realized gains and losses are computed using the specific cost of the security sold. Dividend income is recorded on the ex-dividend date. Foreign income and capital gains realized on some securities may be subject to foreign taxes, which are accrued as applicable.
e. Federal taxes
The Fund intends to continue to qualify as a regulated investment company and distribute all of its taxable income, including any net capital gains (which have already been offset by available capital loss carryovers). Accordingly, no provision for federal taxes is required.
f. Distributions
Distributions to shareholders from net investment income and net realized gains, if any, are recorded on the ex-dividend date. Such distributions are determined in conformity with income tax regulations, which may differ from generally accepted accounting principles.
g. Class allocations
Income, common expenses and realized and unrealized gains and losses are allocated to the classes based on the relative net assets of each class. Distribution fees, if any, are calculated daily at the class level based on the appropriate net assets of each class and the specific expense rates applicable to each class.
3. ADVISORY FEE AND OTHER TRANSACTIONS WITH AFFILIATES
Evergreen Investment Management Company, LLC (“EIMC”), an indirect, wholly-owned subsidiary of Wachovia Corporation (“Wachovia”), is the investment advisor to the Fund and is paid an annual fee starting at 0.62% and declining to 0.45% as average daily net assets increase. For the six months ended January 31, 2008, the advisory fee was equivalent to 0.62% of the Fund’s average daily net assets (on an annualized basis).
Metropolitan West Capital Management, LLC, an indirect subsidiary of Wachovia, is the investment sub-advisor to the Fund and is paid by EIMC for its services to the Fund.
From time to time, EIMC may voluntarily or contractually waive its fee and/or reimburse expenses in order to limit operating expenses. During the six months ended January 31, 2008, EIMC contractually waived its advisory fee in the amount of $28,594.
The Fund may invest in money market funds which are advised by EIMC. Income earned on these investments is included in income from affiliate on the Statement of Operations.
20
NOTES TO FINANCIAL STATEMENTS (unaudited) continued
Effective January 1, 2008, EIMC replaced Evergreen Investment Services, Inc. (“EIS”), an indirect, wholly-owned subsidiary of Wachovia, as the administrator to the Fund upon the assignment of the Fund’s Administrative Services Agreement from EIS to EIMC. There were no changes to the services being provided or fees being paid by the Fund. The administrator provides the Fund with facilities, equipment and personnel and is paid an annual rate determined by applying percentage rates to the aggregate average daily net assets of the Evergreen funds (excluding money market funds and Evergreen Institutional Enhanced Income Fund), starting at 0.10% and declining to 0.05% as the aggregate average daily net assets of the Evergreen funds (excluding money market funds and Evergreen Institutional Enhanced Income Fund) increase.
Evergreen Service Company, LLC (“ESC”), an indirect, wholly-owned subsidiary of Wachovia, is the transfer and dividend disbursing agent for the Fund. ESC receives account fees that vary based on the type of account held by the shareholders in the Fund. For the six months ended January 31, 2008, the transfer agent fees were equivalent to an annual rate of 0.12% of the Fund’s average daily net assets.
Wachovia Bank NA, through its securities lending division of Wachovia Global Securities Lending, acts as the securities lending agent for the Fund.
4. DISTRIBUTION PLANS
EIS serves as distributor of the Fund’s shares. The Fund has adopted Distribution Plans, as allowed by Rule 12b-1 of the 1940 Act, for each class of shares, except Class I. Under the Distribution Plans, distribution fees are paid at an annual rate of 0.25% of the average daily net assets for Class A and 1.00% of the average daily net assets for each of Class B and Class C shares. Class A assets received from GMO Pelican Fund through the acquisition of Evergreen Large Cap Value Fund (see Note 5) are not assessed a distribution fee.
For the six months ended January 31, 2008, EIS received $5,981 from the sale of Class A shares and $30,368 and $5,333 in contingent deferred sales charges from redemptions of Class B and Class C shares, respectively.
5. ACQUISITION
Effective at the close of business on May 25, 2007, the Fund acquired the net assets of Evergreen Large Cap Value Fund in a tax-free exchange for Class A, Class B, Class C and Class I shares of the Fund. Shares were issued to Class A, Class B, Class C and Class I shareholders of Evergreen Large Cap Value Fund at an exchange ratio of 0.98 for Class A, Class B, Class C and Class I shares of the Fund. The acquired net assets consisted primarily of portfolio securities with unrealized appreciation of $7,916,997. The aggregate net assets of the Fund and Evergreen Large Cap Value Fund immediately prior to the acquisition were $112,749,249 and $77,333,429, respectively. The aggregate net assets of the Fund immediately after the acquisition were $190,082,678.
6. INVESTMENT TRANSACTIONS
Cost of purchases and proceeds from sales of investment securities (excluding short-term securities) were $72,603,728 and $18,613,240, respectively, for the six months ended January 31, 2008.
21
NOTES TO FINANCIAL STATEMENTS (unaudited) continued
During the six months ended January 31, 2008, the Fund loaned securities to certain brokers. At January 31, 2008, the value of securities on loan and the total amount of collateral received for securities loaned amounted to $10,544,020 and $10,678,585, respectively.
On January 31, 2008, the aggregate cost of securities for federal income tax purposes was $252,216,755. The gross unrealized appreciation and depreciation on securities based on tax cost was $16,455,318 and $15,846,534, respectively, with a net unrealized appreciation of $608,784.
7. INTERFUND LENDING
Pursuant to an Exemptive Order issued by the SEC, the Fund may participate in an interfund lending program with certain funds in the Evergreen fund family. This program allows the Fund to borrow from, or lend money to, other participating funds. During the six months ended January 31, 2008, the Fund did not participate in the interfund lending program.
8. EXPENSE REDUCTIONS
Through expense offset arrangements with ESC and the Fund’s custodian, a portion of fund expenses has been reduced.
9. DEFERRED TRUSTEES’ FEES
Each Trustee of the Fund may defer any or all compensation related to performance of his or her duties as a Trustee. The Trustees’ deferred balances are allocated to deferral accounts, which are included in the accrued expenses for the Fund. The investment performance of the deferral accounts is based on the investment performance of certain Evergreen funds. Any gains earned or losses incurred in the deferral accounts are reported in the Fund’s Trustees’ fees and expenses. At the election of the Trustees, the deferral account will be paid either in one lump sum or in quarterly installments for up to ten years.
10. FINANCING AGREEMENT
The Fund and certain other Evergreen funds share in an unsecured revolving credit commitment for temporary and emergency purposes, including the funding of redemptions, as permitted by each participating fund’s borrowing restrictions. Borrowings under this facility bear interest at 0.50% per annum above the Federal Funds rate. All of the participating funds are charged an annual commitment fee on the unused balance, which is allocated pro rata. The credit facility is for $100 million with an annual commitment fee of 0.08% . During the six months ended January 31, 2008, the Fund had no borrowings.
11. REGULATORY MATTERS AND LEGAL PROCEEDINGS
Pursuant to an administrative order issued by the SEC on September 19, 2007, EIMC, EIS, ESC (collectively, the “Evergreen Entities”), Wachovia Securities, LLC and the SEC have entered into an agreement settling allegations of (i) improper short-term trading arrangements in effect prior to May 2003 involving former officers and employees of EIMC and certain broker-dealers, (ii) insufficient systems for monitoring exchanges and enforcing exchange limitations as stated in certain funds’ prospectuses, and (iii) inadequate e-mail retention practices. Under the settlement, the Evergreen Entities were censured and paid approximately $32 million in disgorgement and penalties. This amount, along with a fine assessed by the SEC against Wachovia Securities, LLC will be distributed pursuant to a plan to be developed by an independent distribution consultant
22
NOTES TO FINANCIAL STATEMENTS (unaudited) continued
and approved by the SEC. The Evergreen Entities neither admitted nor denied the allegations and findings set forth in its settlement with the SEC.
In addition, the Evergreen funds and EIMC and certain of its affiliates are involved in various legal actions, including private litigation and class action lawsuits. EIMC does not expect that any of such legal actions currently pending or threatened will have a material adverse impact on the financial position or operations of any of the Evergreen funds or on EIMC’s ability to provide services to the Evergreen funds.
Although EIMC believes that none of the matters discussed above will have a material adverse impact on the Evergreen funds, there can be no assurance that these matters and any publicity surrounding or resulting from them will not result in reduced sales or increased redemptions of Evergreen fund shares, which could increase Evergreen fund transaction costs or operating expenses, or that they will not have other adverse consequences on the Evergreen funds.
12. NEW ACCOUNTING PRONOUNCEMENTS
In June 2006, the Financial Accounting Standards Board (“FASB”) issued FASB Interpretation No. 48, Accounting for Uncertainty in Income Taxes — an interpretation of FASB statement 109 (“FIN 48”). FIN 48 supplements FASB 109 by prescribing a recognition threshold and measurement attribute for the financial statement recognition and measurement of a tax position taken or expected to be taken in a tax return. The Fund’s financial statements have not been impacted by the adoption of FIN 48. However, the conclusions regarding FIN 48 may be subject to review and adjustment at a later date based on factors including, but not limited to, further implementation guidance expected from FASB, and on-going analysis of tax laws, regulations, and interpretations thereof.
In September 2006, FASB issued Statement of Financial Accounting Standards No. 157, Fair Value Measurements (“FAS 157”). FAS 157 establishes a single authoritative definition of fair value, establishes a framework for measuring fair value and expands disclosures about fair value measurements. FAS 157 applies to fair value measurements already required or permitted by existing standards. The change to current generally accepted accounting principles from the application of FAS 157 relates to the definition of fair value, the methods used to measure fair value, and the expanded disclosures about fair value measurements. Management of the Fund does not believe the adoption of FAS 157 will materially impact the financial statement amounts, however, additional disclosures may be required about the inputs used to develop the measurements and the effect of certain of the measurements on changes in net assets for the period. FAS 157 is effective for financial statements issued for fiscal years beginning after November 15, 2007 and interim periods within those fiscal years.
23
ADDITIONAL INFORMATION (unaudited)
INFORMATION ABOUT THE REVIEW AND APPROVAL OF THE FUND’S INVESTMENT ADVISORY AGREEMENT
Each year, the Fund’s Board of Trustees is required to consider whether to continue in place the Fund’s investment advisory agreements. In September 2007, the Trustees, including a majority of the Trustees who are not interested persons (as that term is defined in the 1940 Act) of the Fund, Metropolitan West Capital Management, LLC (the “Sub-Advisor”), or EIMC, approved the continuation of the Fund’s investment advisory agreements. (References below to the “Fund” are to Evergreen Intrinsic Value Fund; references to the “funds” are to the Evergreen funds generally.)
At the same time, the Trustees considered the continuation of the investment advisory agreements for all of the funds, and the description below refers in many cases to the Trustees’ process and conclusions in connection with their consideration of this matter for all of the funds. (See “Certain Fund-Specific Considerations” below for a discussion regarding certain factors considered by the Trustees relating specifically to the Fund.) In all of its deliberations, the Board of Trustees and the disinterested Trustees were advised by independent counsel to the disinterested Trustees and counsel to the funds.
The review process. The 1940 Act requires that the Board of Trustees request and evaluate, and that EIMC and any sub-advisors furnish, such information as may reasonably be necessary to evaluate the terms of a fund’s advisory agreements. The review process began at the time of the last advisory contract-renewal process in September 2006. In the course of that process, the Trustees identified a number of funds that had experienced either short-term or longer-term performance issues. During the following months, the Trustees reviewed information relating to any changes in the performance of those funds and/or any changes in the investment process or the investment teams responsible for the management of the funds. In addition, during the course of the year, the Trustees reviewed information regarding the investment performance of all of the funds and identified additional funds that they believed warranted further attention based on performance since September 2006.
In spring 2007, a committee of the Board of Trustees (the “Committee”), working with EIMC management, determined generally the types of information the Board would review and set a timeline detailing the information required and the dates for its delivery to the Trustees. The independent data provider Keil Fiduciary Strategies LLC (“Keil”) was engaged to provide fund-specific and industry-wide data to the Board containing information of a nature and in a format generally prescribed by the Committee, and the Committee worked with Keil and EIMC to develop appropriate groups of peer funds for each fund. The Committee also identified a number of expense, performance, and other issues and requested specific information as to those issues.
The Trustees reviewed, with the assistance of an independent industry consultant retained by the disinterested Trustees, the information provided by EIMC and the Sub-Advisor in response to the Committee’s requests and the information provided by Keil. The Trustees formed small committees to review individual funds in greater detail. In addition, the Trustees requested information regarding, among other things, brokerage practices of the funds, the use of derivatives by the funds, strategic planning for the funds, analyst and research support available to the portfolio management teams, and information regarding the various fall-out benefits received directly and indirectly by EIMC and its affiliates from the funds. The Trustees requested and received additional information following that review.
24
ADDITIONAL INFORMATION (unaudited) continued
The Committee met several times by telephone to consider the information provided by EIMC. The Committee met with representatives of EIMC in early September. At a meeting of the full Board of Trustees later in September, the Committee reported the results of its discussions with EIMC, and the full Board met with representatives of EIMC, engaged in further review of the materials provided to them, and approved the continuation of each of the advisory and sub-advisory agreements.
The disinterested Trustees discussed the continuation of the funds’ advisory agreements with representatives of EIMC and in multiple private sessions with legal counsel at which no personnel of EIMC were present. In considering the continuation of the agreements, the Trustees did not identify any particular information or consideration that was all-important or controlling, and each Trustee attributed different weights to various factors. The Trustees evaluated information provided to them both in terms of the Evergreen mutual funds generally and with respect to each fund, including the Fund, specifically as they considered appropriate; although the Trustees considered the continuation of the agreements as part of the larger process of considering the continuation of the advisory contracts for all of the funds, their determination to continue the advisory agreements for each of the funds was ultimately made on a fund-by-fund basis.
This summary describes a number of the most important, but not necessarily all, of the factors considered by the Board and the disinterested Trustees.
Information reviewed. The Board of Trustees and committees of the Board of Trustees meet periodically during the course of the year. At those meetings, the Board receives a wide variety of information regarding the services performed by EIMC, the investment performance of the funds, and other aspects of the business and operations of the funds. At those meetings, and in the process of considering the continuation of the agreements, the Trustees considered information regarding, for example, the funds’ investment results; the portfolio management teams for the funds and the experience of the members of those teams, and any recent changes in the membership of the teams; portfolio trading practices; compliance by the funds, EIMC, and the Sub-Advisor with applicable laws and regulations and with the funds’ and EIMC’s compliance policies and procedures; risk evaluation and oversight procedures at EIMC; services provided by affiliates of EIMC to the funds and shareholders of the funds; and other information relating to the nature, extent, and quality of services provided by EIMC and the Sub-Advisor. The Trustees considered a number of changes in portfolio management personnel at EIMC and its advisory affiliates in the year since September 2006, and recent changes in compliance personnel at EIMC, including the appointment of a new Chief Compliance Officer for the funds.
The Trustees considered the rates at which the funds pay investment advisory fees, and the efforts generally by EIMC and its affiliates as sponsors of the funds. The data provided by Keil showed the management fees paid by each fund in comparison to the management fees of other peer mutual funds, in addition to data regarding the investment performance of the funds in comparison to other peer mutual funds. The Trustees were assisted by the independent industry consultant in reviewing the information presented to them.
The Trustees considered the transfer agency fees paid by the funds to an affiliate of EIMC. They reviewed information presented to them showing that the transfer agency fees charged to the funds were generally consistent with industry norms.
25
ADDITIONAL INFORMATION (unaudited) continued
The Trustees also considered that EIS, an affiliate of EIMC, serves as administrator to the funds and receives a fee for its services as administrator. In their comparison of the advisory fee paid by the funds with those paid by other mutual funds, the Trustees took into account administrative fees paid by the funds and those other mutual funds. The Board considered that EIS serves as distributor to the funds generally and receives fees from the funds for those services. They considered other so-called “fall-out” benefits to EIMC and its affiliates due to their other relationships with the funds, including, for example, soft-dollar services received by EIMC attributable to transactions entered into by EIMC for the benefit of the funds and brokerage commissions received by Wachovia Securities, LLC, an affiliate of EIMC, from transactions effected by it for the funds. The Trustees also noted that the funds pay sub-transfer agency fees to various financial institutions who hold fund shares in omnibus accounts, and that Wachovia Securities, LLC and its affiliates receive such payments from the funds in respect of client accounts they hold in omnibus arrangements, and that an affiliate of EIMC receives fees for administering the sub-transfer agency payment program. They also considered that Wachovia Securities, LLC and its affiliates receive distribution-related fees and shareholder servicing payments (including amounts derived from payments under the funds’ Rule 12b-1 plans) in respect of shares sold or held through it. The Trustees also noted that an affiliate of EIMC receives compensation for serving as a securities lending agent for the funds.
Nature and quality of the services provided. The Trustees considered that EIMC and its affil-iates generally provide a comprehensive investment management service to the funds. They noted that EIMC and the Sub-Advisor formulate and implement an investment program for the Fund. They noted that EIMC makes its personnel available to serve as officers of the funds, and concluded that the reporting and management functions provided by EIMC with respect to the funds were generally satisfactory. The Trustees considered the investment philosophy of the Fund’s portfolio management team, and considered the in-house research capabilities of EIMC and its affiliates, as well as other resources available to EIMC, including research services available to it from third parties. The Board considered the managerial and financial resources available to EIMC and its affiliates, and the commitment that the Wachovia organization has made to the funds generally. On the basis of these factors, they determined that the nature and scope of the services provided by EIMC and the Sub-Advisor were consistent with their respective duties under the investment advisory agreements and appropriate and consistent with the investment programs and best interests of the funds.
The Trustees noted the resources EIMC and its affiliates have committed to the regulatory, compliance, accounting, tax and oversight of tax reporting, and shareholder servicing functions, and the number and quality of staff committed to those functions, which they concluded were appropriate and generally in line with EIMC’s responsibilities to the Fund and to the funds generally. The Board and the disinterested Trustees concluded, within the context of their overall conclusions regarding the funds’ advisory agreements, that they were generally satisfied with the nature, extent, and quality of the services provided by the Sub-Advisor and EIMC, including services provided by EIS under its administrative services agreements with the funds.
Investment performance. The Trustees considered the investment performance of each fund, both by comparison to other comparable mutual funds and to broad market indices. The Trustees emphasized that the continuation of the investment advisory agreement for a fund should not be taken as any indication that the Trustees did not believe investment performance for any specific
26
ADDITIONAL INFORMATION (unaudited) continued
fund might not be improved, and they noted that they would continue to monitor closely the investment performance of the funds going forward.
Advisory and administrative fees. The Trustees recognized that EIMC does not seek to provide the lowest cost investment advisory service, but to provide a high quality, full-service investment management product at a reasonable price. They also noted that EIMC has in many cases sought to set its investment advisory fees at levels consistent with industry norms. The Trustees noted that, in certain cases, a fund’s management fees were higher than many or most other mutual funds in the same Keil peer group. However, in each case, the Trustees determined on the basis of the information presented that the level of management fees was not excessive.
Certain Fund-specific considerations. The Trustees noted that the Fund had recently commenced operations and so had only a limited operating history.
The Trustees noted that the Fund’s management fee was lower than the management fees paid by a majority of the mutual funds against which the Trustees compared the Fund’s management fee and that the level of profitability realized by EIMC in respect of the fee did not appear excessive.
Economies of scale. The Trustees noted that economies of scale would likely be achieved by EIMC in managing the funds as the funds grow. The Trustees noted that the Fund had implemented breakpoints in its advisory fee structure. The Trustees noted that they would continue to review the appropriate levels of breakpoints in the future, but concluded that the breakpoints as implemented appeared to be a reasonable step toward the realization of economies of scale by the Fund.
Profitability. The Trustees considered information provided to them regarding the profitability to the EIMC organization of the investment advisory, administration, and transfer agency (with respect to the open-end funds only) fees paid to EIMC and its affiliates by each of the funds. They considered that the information provided to them was necessarily estimated, and that the profitability information provided to them, especially on a fund-by-fund basis, did not necessarily provide a definitive tool for evaluating the appropriateness of each fund’s advisory fee. They noted that the levels of profitability of the funds to EIMC varied widely, depending on among other things the size and type of fund. They considered the profitability of the funds in light of such factors as, for example, the information they had received regarding the relation of the fees paid by the funds to those paid by other mutual funds, the investment performance of the funds, and the amount of revenues involved. In light of these factors, the Trustees concluded that the profitability of any of the funds, individually or in the aggregate, should not prevent the Trustees from approving the continuation of the agreements.
27
TRUSTEES AND OFFICERS
TRUSTEES1
| Charles A. Austin III | | Investment Counselor, Anchor Capital Advisors, LLC. (investment advice); Director, The Andover |
| Trustee | | Companies (insurance); Trustee, Arthritis Foundation of New England; Former Director, The |
| DOB: 10/23/1934 | | Francis Ouimet Society (scholarship program); Former Director, Executive Vice President and |
| Term of office since: 1991 | | Treasurer, State Street Research & Management Company (investment advice) |
| Other directorships: None | | |
|
| K. Dun Gifford | | Chairman and President, Oldways Preservation and Exchange Trust (education); Trustee, |
| Trustee | | Chairman of the Finance Committee, Member of the Executive Committee, and Former |
| DOB: 10/23/1938 | | Treasurer, Cambridge College |
| Term of office since: 1974 | | |
| Other directorships: None | | |
|
| Dr. Leroy Keith, Jr. | | Managing Director, Almanac Capital Management (commodities firm); Trustee, Phoenix |
| Trustee | | Fund Complex; Director, Diversapack Co. (packaging company); Former Partner, Stonington |
| DOB: 2/14/1939 | | Partners, Inc. (private equity fund); Former Director, Obagi Medical Products Co.; Former |
| Term of office since: 1983 | | Director, Lincoln Educational Services |
| Other directorships: Trustee, | | |
| Phoenix Fund Complex (consisting | | |
| of 53 portfolios as of 12/31/2007) | | |
|
| Carol A. Kosel1 | | Former Consultant to the Evergreen Boards of Trustees; Former Vice President and Senior Vice |
| Trustee | | President, Evergreen Investments, Inc.; Former Treasurer, Evergreen Funds; Former Treasurer, |
| DOB: 12/25/1963 | | Vestaur Securities Fund |
| Term of office since: 2008 | | |
| Other directorships: None | | |
|
| Gerald M. McDonnell | | Former Manager of Commercial Operations, CMC Steel (steel producer) |
| Trustee | | |
| DOB: 7/14/1939 | | |
| Term of office since: 1988 | | |
| Other directorships: None | | |
|
| Patricia B. Norris | | President and Director of Buckleys of Kezar Lake, Inc. (real estate company); Former President |
| Trustee | | and Director of Phillips Pond Homes Association (home community); Former Partner, |
| DOB: 4/9/1948 | | PricewaterhouseCoopers, LLP (independent registered public accounting firm) |
| Term of office since: 2006 | | |
| Other directorships: None | | |
|
| William Walt Pettit | | Partner and Vice President, Kellam & Pettit, P.A. (law firm); Director, Superior Packaging Corp. |
| Trustee | | (packaging company); Member, Superior Land, LLC (real estate holding company), Member, |
| DOB: 8/26/1955 | | K&P Development, LLC (real estate development); Former Director, National Kidney Foundation |
| Term of office since: 1988 | | of North Carolina, Inc. (non-profit organization) |
| Other directorships: None | | |
|
| David M. Richardson | | President, Richardson, Runden LLC (executive recruitment advisory services); Director, J&M |
| Trustee | | Cumming Paper Co. (paper merchandising); Trustee, NDI Technologies, LLP (communications); |
| DOB: 9/19/1941 | | Former Consultant, AESC (The Association of Executive Search Consultants) |
| Term of office since: 1982 | | |
| Other directorships: None | | |
|
| Dr. Russell A. Salton III | | President/CEO, AccessOne MedCard, Inc. |
| Trustee | | |
| DOB: 6/2/1947 | | |
| Term of office since: 1984 | | |
| Other directorships: None | | |
|
28
TRUSTEES AND OFFICERS continued
| Michael S. Scofield | | Retired Attorney, Law Offices of Michael S. Scofield; Former Director and Chairman, Branded |
| Trustee | | Media Corporation (multi-media branding company) |
| DOB: 2/20/1943 | | |
| Term of office since: 1984 | | |
| Other directorships: None | | |
|
| Richard J. Shima | | Independent Consultant; Director, Hartford Hospital; Trustee, Greater Hartford YMCA; Former |
| Trustee | | Director, Trust Company of CT; Former Director, Old State House Association; Former Trustee, |
| DOB: 8/11/1939 | | Saint Joseph College (CT) |
| Term of office since: 1993 | | |
| Other directorships: None | | |
|
| Richard K. Wagoner, CFA2 | | Member and Former President, North Carolina Securities Traders Association; Member, Financial |
| Trustee | | Analysts Society |
| DOB: 12/12/1937 | | |
| Term of office since: 1999 | | |
| Other directorships: None | | |
|
| OFFICERS | | |
| Dennis H. Ferro3 | | Principal occupations: President and Chief Executive Officer, Evergreen Investment Company, |
| President | | Inc. and Executive Vice President, Wachovia Bank, N.A.; former Chief Investment Officer, |
| DOB: 6/20/1945 | | Evergreen Investment Company, Inc. |
| Term of office since: 2003 | | |
|
| Jeremy DePalma4 | | Principal occupations: Senior Vice President, Evergreen Investment Management Company, LLC; |
| Treasurer | | Former Vice President, Evergreen Investment Services, Inc.; Former Assistant Vice President, |
| DOB: 2/5/1974 | | Evergreen Investment Services, Inc. |
| Term of office since: 2005 | | |
|
| Michael H. Koonce4 | | Principal occupations: Senior Vice President and General Counsel, Evergreen Investment |
| Secretary | | Services, Inc.; Secretary, Senior Vice President and General Counsel, Evergreen Investment |
| DOB: 4/20/1960 | | Management Company, LLC and Evergreen Service Company, LLC; Senior Vice President and |
| Term of office since: 2000 | | Assistant General Counsel, Wachovia Corporation |
|
| Robert Guerin4 | | Principal occupations: Chief Compliance Officer, Evergreen Funds and Senior Vice President of |
| Chief Compliance Officer | | Evergreen Investments Co, Inc; Former Managing Director and Senior Compliance Officer, |
| DOB: 9/20/1965 | | Babson Capital Management LLC; Former Principal and Director, Compliance and Risk |
| Term of office since: 2007 | | Management, State Street Global Advisors; Former Vice President and Manager, Sales Practice |
| | | Compliance, Deutsche Asset Management. |
|
| 1 Each Trustee, except Mses. Kosel and Norris, serves until a successor is duly elected or qualified or until his or her death, resignation, |
| retirement or removal from office. As new Trustees, Ms. Kosel’s and Ms. Norris’ initial terms end December 31, 2010 and June 30, |
| 2009, respectively, at which times they may be re-elected by Trustees to serve until a successor is duly elected or qualified or until her |
| death, resignation, retirement or removal from office by the Trustees. Each Trustee, except Ms. Kosel, oversaw 93 Evergreen funds as of |
| December 31, 2007. Ms. Kosel became a Trustee on January 1, 2008. Correspondence for each Trustee may be sent to Evergreen |
| Board of Trustees, P.O. Box 20083, Charlotte, NC 28202. |
| |
| 2 Mr. Wagoner is an “interested person” of the Fund because of his ownership of shares in Wachovia Corporation, the parent to the |
| Fund’s investment advisor. |
| |
| 3 The address of the Officer is 401 S. Tryon Street, 20th Floor, Charlotte, NC 28288. |
| |
| 4 The address of the Officer is 200 Berkeley Street, Boston, MA 02116. |
Additional information about the Fund’s Board of Trustees and Officers can be found in the Statement of Additional Information (SAI) and is available upon request without charge by calling 800.343.2898.
29
579104rv1 3/2008
Evergreen Small Cap Value Fund
| table of contents |
| 1 | | LETTER TO SHAREHOLDERS |
| 4 | | FUND AT A GLANCE |
| 6 | | ABOUT YOUR FUND’S EXPENSES |
| 7 | | FINANCIAL HIGHLIGHTS |
| 11 | | SCHEDULE OF INVESTMENTS |
| 15 | | STATEMENT OF ASSETS AND LIABILITIES |
| 16 | | STATEMENT OF OPERATIONS |
| 17 | | STATEMENTS OF CHANGES IN NET ASSETS |
| 18 | | NOTES TO FINANCIAL STATEMENTS |
| 23 | | ADDITIONAL INFORMATION |
| 28 | | TRUSTEES AND OFFICERS |
This semiannual report must be preceded or accompanied by a prospectus of the Evergreen fund contained herein. The prospectus contains more complete information, including fees and expenses, and should be read carefully before investing or sending money.
The fund will file its complete schedule of portfolio holdings with the SEC for the first and third quarters of each fiscal year on Form N-Q. The fund’s Form N-Q will be available on the SEC’s Web site at http://www.sec.gov. In addition, the fund’s Form N-Q may be reviewed and copied at the SEC’s Public Reference Room in Washington, D.C. Information on the operation of the Public Reference Room may be obtained by calling 800.SEC.0330.
A description of the fund’s proxy voting policies and procedures, as well as information regarding how the fund voted proxies relating to portfolio securities during the most recent 12-month period ended June 30, is available by visiting our Web site at EvergreenInvestments.com or by visiting the SEC’s Web site at http://www.sec.gov. The fund’s proxy voting policies and procedures are also available without charge, upon request, by calling 800.343.2898.
| Mutual Funds: |
| NOT FDIC INSURED | | MAY LOSE VALUE | | NOT BANK GUARANTEED |
Evergreen InvestmentsSM is a service mark of Evergreen Investment Management Company, LLC.
Copyright 2008, Evergreen Investment Management Company, LLC.
Evergreen Investment Management Company, LLC is a subsidiary of Wachovia Corporation and is an affiliate of Wachovia Corporation’s other Broker Dealer subsidiaries.
Evergreen mutual funds are distributed by Evergreen Investment Services, Inc.
200 Berkeley Street, Boston, MA 02116
LETTER TO SHAREHOLDERS
March 2008

Dennis H. Ferro
President and Chief Executive Officer
Dear Shareholder:
We are pleased to provide the Semiannual Report for Evergreen Small Cap Value Fund, covering the six-month period ended January 31, 2008.
Investors in the domestic equity market faced challenging and increasingly stormy conditions over the six-month period ended January 31, 2008. Problems in the housing and subprime mortgage markets led to a tightening of credit, which in turn contributed to widening fears of a dramatic deceleration in the economy’s expansion. As the economy weakened, equity prices generally declined across companies of all sizes. Large cap stocks held up somewhat better than mid cap and small cap shares, while growth stocks outperformed more economically sensitive value stocks. Fixed income investors, meanwhile, sought out the highest-quality securities and attempted to avoid credit risk. Longer-maturity Treasuries outperformed other sectors, while the prices of corporate bonds and many asset-backed securities fell as the yield spreads between Treasuries and lower-rated securities widened. In this environment, the price of gold surged while the dollar remained weak.
The U.S. economy exhibited increasing signs of weakness in the latter half of 2007 and the first month of 2008 after experiencing solid growth early in 2007. Although housing and credit-related concerns began weighing on investor sentiment early in the year, the economy’s growth trajectory continued to be supported early in 2007 by the combination of solid trends in employment, income, investment and export trends. That began to change in the latter months of 2007, however, as each of these pillars of support began to weaken. Growth in Gross Domestic Product
1
LETTER TO SHAREHOLDERS continued
rose by just 0.6% during the final quarter of 2007 as economic output slowed because of a sharp reduction in business inventories. The rate of corporate earnings growth, meanwhile, declined over the second half of 2007. Payrolls dropped by 17,000 in January 2008, contributing to growing concerns about the outlook for consumer spending, which accounts for up to 70% of economic output. Faced with growing evidence of the economy’s deceleration, the Federal Reserve Board (the “Fed”) began to focus more on stimulating growth and less on watching inflation. The Fed cut the target fed funds rate from 5.25% to 4.25% during the last four months of 2007 and then slashed the rate by an additional 1.25% in two separate actions within just eight days of each other in January 2008. Also in early 2008, Congress passed, and President Bush signed, a $168 billion fiscal stimulus bill that contained rebates for taxpayers, tax breaks for businesses and additional assistance for Social Security recipients and disabled veterans.
Over the six-month period ended January 31, 2008, the management teams of Evergreen’s value-oriented equity funds tended to emphasize investments in attractively priced, fundamentally sound corporations. The portfolio manager of both Evergreen Disciplined Value Fund and Evergreen Disciplined Small-Mid Value Fund, for example, used a combination of quantitative tools and traditional fundamental analysis in reviewing opportunities among larger and smaller companies, respectively. The manager of Evergreen Equity Index Fund maintained a portfolio reflecting the composition of the Standard & Poor’s 500(R) Index, using a proprietary process to control trading and operational costs. Managers of Evergreen Equity Income Fund emphasized companies they believe have the ability to maintain and increase their dividends to shareholders. The managers of Evergreen Fundamental Large Cap Fund focused on larger corporations with stable earnings growth records while the managers of Evergreen Fundamental Mid Cap Value Fund, which was launched on September 28, 2007, emphasized mid-sized companies selling at what the managers believed to be reasonable valuations. The team managing Evergreen Intrinsic Value Fund sought out investments in
2
LETTER TO SHAREHOLDERS continued
established companies selling at stock prices below the managers’ estimate of the company’s intrinsic value. Meanwhile, the managers of Evergreen Small Cap Value Fund and Evergreen Special Values Fund each focused on higher-quality small companies that the managers believed to have reasonable prices and strong balance sheets.
We believe the experiences in the investment markets during the past six months have underscored the value of a well-diversified, long-term investment strategy to help soften the effects of volatility in any one market or asset class. As always, we encourage investors to maintain diversified investment portfolios in pursuit of their long-term investment goals.
Please visit us at EvergreenInvestments.com for more information about our funds and other investment products available to you. Thank you for your continued support of Evergreen Investments.
Sincerely,

Dennis H. Ferro
President and Chief Executive Officer
Evergreen Investment Company, Inc.
Special Notice to Shareholders:
Please visit our Web site at EvergreenInvestments.com for statements from President and Chief Executive Officer, Dennis Ferro, regarding the firm’s recent settlement with the Securities and Exchange Commission (SEC) and prior settlement with the Financial Industry Regulatory Authority (FINRA).
3
FUND AT A GLANCE
as of January 31, 2008
MANAGEMENT TEAM
Investment Advisor:
• Evergreen Investment Management Company, LLC
Sub-Advisor:
• J.L. Kaplan Associates, LLC
Portfolio Managers:
• Paul Weisman
• Regina Wiedenski
CURRENT INVESTMENT STYLE
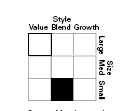
Source: Morningstar, Inc.
Morningstar’s style box is based on a portfolio date as of 12/31/2007.
The Equity style box placement is based on 10 growth and valuation measures for each fund holding and the median size of the companies in which the fund invests.
PERFORMANCE AND RETURNS
Portfolio inception date: 12/30/1997
| | | Class A | | Class B | | Class C | | Class I |
| Class inception date | | 7/31/1998 | | 4/25/2003 | | 4/25/2003 | | 12/30/1997 |
|
| Nasdaq symbol | | ESKAX | | ESKBX | | ESKCX | | ESKIX |
|
| 6-month return with sales charge | | -16.57% | | -15.83% | | -12.64% | | N/A |
|
| 6-month return w/o sales charge | | -11.48% | | -11.85% | | -11.84% | | -11.39% |
|
| Average annual return* |
|
| 1-year with sales charge | | -15.37% | | -14.46% | | -11.61% | | N/A |
|
| 1-year w/o sales charge | | -10.21% | | -10.90% | | -10.90% | | -9.98% |
|
| 5-year | | 11.37% | | 11.71% | | 11.97% | | 13.02% |
|
| 10-year | | 8.71% | | 9.39% | | 9.39% | | 9.90% |
|
| Maximum sales charge | | 5.75% | | 5.00% | | 1.00% | | N/A |
| | | Front-end | | CDSC | | CDSC | | |
|
* Adjusted for maximum applicable sales charge, unless noted.Past performance is no guarantee of future results. The performance quoted represents past performance and current performance may be lower or higher. The investment return and principal value of an investment will fluctuate so that investors’ shares, when redeemed, may be worth more or less than their original cost. To obtain performance information current to the most recent month-end for Classes A, B, C or I, please go to EvergreenInvestments.com/fundperformance. The performance of each class may vary based on differences in loads, fees and expenses paid by the shareholders investing in each class. Performance includes the reinvestment of income dividends and capital gain distributions. Performance shown does not reflect the deduction of taxes that a shareholder would pay on fund distributions or the redemption of fund shares.
Historical performance shown for Class A prior to 4/25/2003 is based on the performance of the Investor shares of the fund’s predecessor fund, Undiscovered Managers Small Cap Value Fund, and prior to its inception, on the Institutional shares, the original class offered by the fund’s predecessor fund. Historical performance shown for Classes B and C prior to their inception is based on the performance of Class I. Historical performance for Class I prior to 4/25/2003 is based on the performance of the Institutional shares of the fund’s predecessor fund. The historical returns for Classes A, B and C have not been adjusted to reflect the effect of each class’ 12b-1 fees. These fees are 0.25% for Class A, 0.35% for Investor shares, and 1.00% for Classes B and C. Class I does not and Institutional shares did not pay a 12b-1 fee. If these fees had been reflected, returns for Classes B and C would have been lower while returns for Class A would have been different.
Returns reflect expense limits previously in effect, without which returns would have been lower.
4
FUND AT A GLANCE continued
LONG-TERM GROWTH
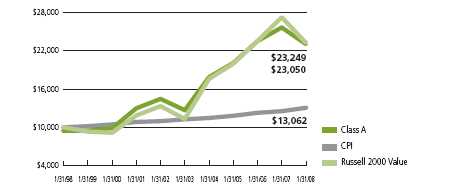
Comparison of a $10,000 investment in the Evergreen Small Cap Value Fund Class A shares versus a similar investment in the Russell 2000 Value Index (Russell 2000 Value) and the Consumer Price Index (CPI).
The Russell 2000 Value is an unmanaged market index and does not include transaction costs associated with buying and selling securities, any mutual fund fees or expenses or any taxes. The CPI is a commonly used measure of inflation and does not represent an investment return. It is not possible to invest directly in an index.
Class I shares are only offered in the following manner: (1) to investment advisory clients of Evergreen Investment Management Company, LLC (or its advisory affiliates) when purchased by such advisor(s) on behalf of its clients, (2) to certain mutual fund wrap program clients of Wachovia Securities and of third-party broker/dealers when purchased through a clearing relationship with Wachovia Securities or an affiliate providing mutual fund clearing services, (3) through arrangements entered into on behalf of the Evergreen funds with certain financial services firms, (4) to certain institutional investors, and (5) to persons who owned Class Y shares in registered name in an Evergreen fund on or before December 31, 1994 or who owned shares of any SouthTrust fund in registered name as of March 18, 2005 or who owned shares of Vestaur Securities Fund as of May 20, 2005.
Class I shares are only available to institutional shareholders with a minimum of $1 million investment, which may be waived in certain situations.
The fund’s investment objective may be changed without a vote of the fund’s shareholders.
The stocks of smaller companies may be more volatile than those of larger companies due to the higher risk of failure.
Value-based investments are subject to the risk that the broad market may not recognize their intrinsic value.
All data is as of January 31, 2008, and subject to change.
5
ABOUT YOUR FUND’S EXPENSES
The Example below is intended to describe the fees and expenses borne by shareholders and the impact of those costs on your investment.
Example
As a shareholder of the fund, you incur two types of costs: (1) transaction costs, including sales charges (loads), redemption fees and exchange fees; and (2) ongoing costs, including management fees, distribution (12b-1) fees and other fund expenses. This Example is intended to help you understand your ongoing costs (in dollars) of investing in the fund and to compare these costs with the ongoing costs of investing in other mutual funds. The Example is based on an investment of $1,000 invested at the beginning of the period and held for the entire period from August 1, 2007 to January 31, 2008.
The example illustrates your fund’s costs in two ways:
• Actual expenses
The section in the table under the heading “Actual” provides information about actual account values and actual expenses. You may use the information in these columns, together with the amount you invested, to estimate the expenses that you paid over the period. Simply divide your account value by $1,000 (for example, an $8,600 account value divided by $1,000 = 8.6), then multiply the result by the number in the appropriate column for your share class, in the column entitled “Expenses Paid During Period” to estimate the expenses you paid on your account during this period.
• Hypothetical example for comparison purposes
The section in the table under the heading “Hypothetical (5% return before expenses)” provides information about hypothetical account values and hypothetical expenses based on the fund’s actual expense ratio and an assumed rate of return of 5% per year before expenses, which is not the fund’s actual return. The hypothetical account values and expenses may not be used to estimate the actual ending account balance or expenses you paid for the period. You may use this information to compare the ongoing costs of investing in the fund and other funds. To do so, compare this 5% hypothetical example with the 5% hypothetical examples that appear in the shareholder reports of the other funds.
Please note that the expenses shown in the table are meant to highlight your ongoing costs only and do not reflect any transactional costs, such as sales charges (loads), redemption fees or exchange fees. Therefore, the section in the table under the heading “Hypothetical (5% return before expenses)” is useful in comparing ongoing costs only, and will not help you determine the relative total costs of owning different funds. In addition, if these transactional costs were included, your costs would have been higher.
| | | Beginning | | Ending | | |
| | Account | | Account | | Expenses |
| | Value | | Value | | Paid During |
| | 8/1/2007 | | 1/31/2008 | | Period* |
|
| Actual |
| Class A | | $ 1,000.00 | | $ 885.23 | | $ 7.53 |
| Class B | | $ 1,000.00 | | $ 881.51 | | $11.07 |
| Class C | | $ 1,000.00 | | $ 881.57 | | $11.07 |
| Class I | | $ 1,000.00 | | $ 886.11 | | $ 6.35 |
| Hypothetical | | |
| (5% return | |
| before expenses) | |
| Class A | | $ 1,000.00 | | $ 1,017.14 | | $ 8.06 |
| Class B | | $ 1,000.00 | | $ 1,013.37 | | $11.84 |
| Class C | | $ 1,000.00 | | $ 1,013.37 | | $11.84 |
| Class I | | $ 1,000.00 | | $ 1,018.40 | | $ 6.80 |
|
* For each class of the Fund, expenses are equal to the annualized expense ratio of each class (1.59% for Class A, 2.34% for Class B, 2.34% for Class C and 1.34% for Class I), multiplied by the average account value over the period, multiplied by 184 / 366 days.6
| FINANCIAL HIGHLIGHTS |
|
| (For a share outstanding throughout each period) |
| | | Six Months Ended | | Year Ended July 31, | | Year Ended |
| January 31, 2008 | |
| | August 31, |
| CLASS A | | (unaudited) | | 2007 | | 2006 | | 2005 | | 2004 | | 20031,2 | | 20022 |
|
| Net asset value, beginning of period | | $ 21.95 | | $ 24.12 | | $ 24.45 | | $ 20.94 | | $ 18.50 | | $ 16.72 | | $ 17.51 |
|
| Income from investment operations |
| Net investment income (loss) | | (0.02) | | 0.02 | | (0.04) | | (0.12) | | (0.07) | | (0.10) | | (0.14) |
| Net realized and unrealized gains or losses on | | |
| investments | | (2.34) | | 3.37 | | 0.99 | | 5.04 | | 3.02 | | 1.91 | | (0.16) |
| |
|
| Total from investment operations | | (2.36) | | 3.39 | | 0.95 | | 4.92 | | 2.95 | | 1.81 | | (0.30) |
|
| Distributions to shareholders from |
| Net investment income | | (0.09) | | 0 | | 0 | | 0 | | 0 | | 0 | | 0 |
| Net realized gains | | (2.00) | | (5.56) | | (1.28) | | (1.41) | | (0.51) | | (0.03) | | (0.49) |
| |
|
| Total distributions to shareholders | | (2.09) | | (5.56) | | (1.28) | | (1.41) | | (0.51) | | (0.03) | | (0.49) |
|
| Net asset value, end of period | | $ 17.50 | | $ 21.95 | | $ 24.12 | | $ 24.45 | | $ 20.94 | | $ 18.50 | | $ 16.72 |
|
| Total return3 | | (11.48%) | | 13.97% | | 4.12% | | 24.39%4 | | 16.16% | | 10.86% | | (1.76%) |
|
| Ratios and supplemental data |
| Net assets, end of period (thousands) | | $64,914 | | $85,292 | | $91,139 | | $100,763 | | $66,878 | | $35,905 | | $26,335 |
| Ratios to average net assets |
| Expenses including waivers/reimbursements | | |
| but excluding expense reductions | | 1.59%5 | | 1.47% | | 1.43% | | 1.53% | | 1.60% | | 1.76%5 | | 1.75% |
| Expenses excluding waivers/reimbursements | | |
| and expense reductions | | 1.59%5 | | 1.47% | | 1.43% | | 1.53% | | 1.60% | | 1.81%5 | | 1.86% |
| Net investment income (loss) | | (0.11%)5 | | 0.07% | | (0.11%) | | (0.59%) | | (0.54%) | | (0.70%)5 | | (0.80%) |
| Portfolio turnover rate | | 18% | | 23% | | 42% | | 56% | | 43% | | 27% | | 31% |
|
1 For the eleven months ended July 31, 2003. The Fund changed its fiscal year end from August 31 to July 31, effective July 31, 2003.2 Effective at the close of business on April 25, 2003, the Fund acquired the net assets of Undiscover ed Managers Small Cap Value Fund (“Undiscovered Managers Fund”). Undiscovered Managers Fund was the accounting and performance survivor in this transactio n. The financial highlights for the periods prior to April 28, 2003 are those of Investor Class shares of Undiscovered Managers Fund.
3 Excluding applicable sales charges
4 Total return increased 0.16% during the period due to a voluntary reimbursement by the investment advisor for losses incurred in connection with a violation of an investment restriction of the Fund.
5 Annualized
See Notes to Financial Statements
7
| FINANCIAL HIGHLIGHTS |
|
| (For a share outstanding throughout each period) |
| | | Six Months Ended | | Year Ended July 31, |
| January 31, 2008 | |
|
| CLASS B | | (unaudited) | | 2007 | | 2006 | | 2005 | | 2004 | | 20031 |
|
| Net asset value, beginning of period | | $ 21.60 | | $ 23.97 | | $ 24.48 | | $ 21.11 | | $ 18.76 | | $ 16.21 |
|
| Income from investment operations |
| Net investment income (loss) | | (0.12) | | (0.13) | | (0.24) | | (0.22) | | (0.12) | | (0.06)2 |
| Net realized and unrealized gains or losses on investments | | (2.28) | | 3.32 | | 1.01 | | 5.00 | | 2.98 | | 2.61 |
| |
|
| Total from investment operations | | (2.40) | | 3.19 | | 0.77 | | 4.78 | | 2.86 | | 2.55 |
|
| Distributions to shareholders from |
| Net realized gains | | (2.00) | | (5.56) | | (1.28) | | (1.41) | | (0.51) | | 0 |
|
| Net asset value, end of period | | $ 17.20 | | $ 21.60 | | $ 23.97 | | $ 24.48 | | $ 21.11 | | $ 18.76 |
|
| Total return3 | | (11.85%) | | 13.16% | | 3.35% | | 23.49%4 | | 15.45% | | 15.73% |
|
| Ratios and supplemental data |
| Net assets, end of period (thousands) | | $7,265 | | $9,601 | | $10,178 | | $11,086 | | $5,663 | | $163 |
| Ratios to average net assets |
| Expenses including waivers/reimbursements but excluding | | |
| expense reductions | | 2.34%5 | | 2.22% | | 2.18% | | 2.24% | | 2.25% | | 2.47%5 |
| Expenses excluding waivers/reimbursements and expense | | |
| reductions | | 2.34%5 | | 2.22% | | 2.18% | | 2.24% | | 2.25% | | 2.47%5 |
| Net investment income (loss) | | (0.86%)5 | | (0.68%) | | (0.86%) | | (1.29%) | | (1.20%) | | (1.40%)5 |
| Portfolio turnover rate | | 18% | | 23% | | 42% | | 56% | | 43% | | 27% |
|
1 For the period from April 25, 2003 (commencem ent of class operations), to July 31, 2003.2 Net investment income (loss) per share is based on average shares outstanding during the period.
3 Excluding applicable sales charges
4 Total return increased 0.15% during the period due to a voluntary reimbursement by the investment advisor for losses incurred in connection with a violation of an investment restriction of the Fund.
5 Annualized
See Notes to Financial Statements
8
| FINANCIAL HIGHLIGHTS |
|
| (For a share outstanding throughout each period) |
| | | Six Months Ended | | Year Ended July 31, |
| January 31, 2008 | |
|
| CLASS C | | (unaudited) | | 2007 | | 2006 | | 2005 | | 2004 | | 20031 |
|
| Net asset value, beginning of period | | $ 21.61 | | $ 23.99 | | $ 24.50 | | $ 21.12 | | $ 18.77 | | $ 16.21 |
|
| Income from investment operations |
| Net investment income (loss) | | (0.13) | | (0.16) | | (0.26) | | (0.20) | | (0.12) | | (0.05)2 |
| Net realized and unrealized gains or losses on investments | | (2.27) | | 3.34 | | 1.03 | | 4.99 | | 2.98 | | 2.61 |
| |
|
| Total from investment operations | | (2.40) | | 3.18 | | 0.77 | | 4.79 | | 2.86 | | 2.56 |
|
| Distributions to shareholders from |
| Net realized gains | | (2.00) | | (5.56) | | (1.28) | | (1.41) | | (0.51) | | 0 |
|
| Net asset value, end of period | | $ 17.21 | | $ 21.61 | | $ 23.99 | | $ 24.50 | | $ 21.12 | | $ 18.77 |
|
| Total return3 | | (11.84%) | | 13.11% | | 3.35% | | 23.53%4 | | 15.44% | | 15.79% |
|
| Ratios and supplemental data |
| Net assets, end of period (thousands) | | $6,812 | | $9,075 | | $10,188 | | $11,976 | | $5,510 | | $ 11 |
| Ratios to average net assets |
| Expenses including waivers/reimbursements but excluding | | |
| expense reductions | | 2.34%5 | | 2.22% | | 2.18% | | 2.24% | | 2.25% | | 2.39%5 |
| Expenses excluding waivers/reimbursements and expense | | |
| reductions | | 2.34%5 | | 2.22% | | 2.18% | | 2.24% | | 2.25% | | 2.39%5 |
| Net investment income (loss) | | (0.86%)5 | | (0.68%) | | (0.86%) | | (1.30%) | | (1.20%) | | (1.29%)5 |
| Portfolio turnover rate | | 18% | | 23% | | 42% | | 56% | | 43% | | 27% |
|
1 For the period from April 25, 2003 (commencem ent of class operations), to July 31, 2003.2 Net investment income (loss) per share is based on average shares outstanding during the period.
3 Excluding applicable sales charges
4 Total return increased 0.15% during the period due to a voluntary reimbursement by the investment advisor for losses incurred in connection with a violation of an investment restriction of the Fund.
5 Annualized
See Notes to Financial Statements
9
| FINANCIAL HIGHLIGHTS |
|
| (For a share outstanding throughout each period) |
| | | Six Months Ended | | Year Ended July 31, | | Year Ended |
| January 31, 2008 | |
| | August 31, |
| CLASS I | | (unaudited) | | 2007 | | 2006 | | 2005 | | 2004 | | 20031,2 | | 20022 |
|
| Net asset value, beginning of period | | $ 22.81 | | $ 24.81 | | $ 25.05 | | $ 21.36 | | $ 18.80 | | $ 16.94 | | $ 17.67 |
|
| Income from investment operations |
| Net investment income (loss) | | 0.023 | | 0.103 | | 0.03 | | (0.07) | | (0.05) | | (0.05) | | (0.08) |
| Net realized and unrealized gains or losses on | | |
| investments | | (2.45) | | 3.46 | | 1.01 | | 5.17 | | 3.12 | | 1.94 | | (0.16) |
| |
|
| Total from investment operations | | (2.43) | | 3.56 | | 1.04 | | 5.10 | | 3.07 | | 1.89 | | (0.24) |
|
| Distributions to shareholders from |
| Net investment income | | (0.18) | | 0 | | 0 | | 0 | | 0 | | 0 | | 0 |
| Net realized gains | | (2.00) | | (5.56) | | (1.28) | | (1.41) | | (0.51) | | (0.03) | | (0.49) |
| |
|
| Total distributions to shareholders | | (2.18) | | (5.56) | | (1.28) | | (1.41) | | (0.51) | | (0.03) | | (0.49) |
|
| Net asset value, end of period | | $ 18.20 | | $ 22.81 | | $ 24.81 | | $ 25.05 | | $ 21.36 | | $ 18.80 | | $ 16.94 |
|
| Total return | | (11.39%) | | 14.30% | | 4.39% | | 24.76%4 | | 16.55% | | 11.19% | | (1.40%) |
|
| Ratios and supplemental data |
| Net assets, end of period (thousands) | | $59,513 | | $104,898 | | $348,269 | | $335,601 | | $216,778 | | $154,397 | | $108,157 |
| Ratios to average net assets |
| Expenses including waivers/reimbursements | | |
| but excluding expense reductions | | 1.34%5 | | 1.20% | | 1.18% | | 1.24% | | 1.26% | | 1.40%5 | | 1.40% |
| Expenses excluding waivers/reimbursements | | |
| and expense reductions | | 1.34%5 | | 1.20% | | 1.18% | | 1.24% | | 1.26% | | 1.45%5 | | 1.51% |
| Net investment income (loss) | | 0.14%5 | | 0.39% | | 0.14% | | (0.30%) | | (0.21%) | | (0.35%)5 | | (0.45%) |
| Portfolio turnover rate | | 18% | | 23% | | 42% | | 56% | | 43% | | 27% | | 31% |
|
1 For the eleven months ended July 31, 2003. The Fund changed its fiscal year end from August 31 to July 31, effective July 31, 2003.2 Effective at the close of business on April 25, 2003, the Fund acquired the net assets of Undiscover ed Managers Small Cap Value Fund (“Undiscovered Managers Fund”). Undiscovered Managers Fund was the accounting and performance survivor in this transactio n. The financial highlights for the periods prior to April 28, 2003 are those of Institutional Class shares of Undiscovered Managers Fund.
3 Net investment income (loss) per share is based on average shares outstanding during the period.
4 Total return increased 0.14% during the period due to a voluntary reimbursement by the investment advisor for losses incurred in connection with a violation of an investment restriction of the Fund.
5 Annualized
See Notes to Financial Statements
10
| SCHEDULE OF INVESTMENTS |
|
| January 31, 2008 (unaudited) |
| | | Shares | | | | Value |
|
| COMMON STOCKS 99.1% |
| CONSUMER DISCRETIONARY 14.6% |
| Automobiles 2.1% |
| Thor Industries, Inc. (r) | | 84,600 | | $ 2,988,072 |
| |
|
| Hotels, Restaurants & Leisure 2.3% |
| Papa John’s International, Inc. * | | 125,000 | | | | 3,161,250 |
| |
|
| Household Durables 2.2% |
| Ethan Allen Interiors, Inc. (r) | | 100,000 | | | | 3,095,000 |
| |
|
| Specialty Retail 8.0% |
| Charlotte Russe Holding, Inc. * | | 135,000 | | | | 2,434,050 |
| Group 1 Automotive, Inc. (r) | | 199,700 | | | | 5,280,068 |
| Men’s Wearhouse, Inc. (r) | | 130,000 | | | | 3,313,700 |
| |
|
| | | | | 11,027,818 |
| |
|
| CONSUMER STAPLES 2.0% |
| Food Products 2.0% |
| Reddy Ice Holdings, Inc. | | 125,000 | | | | 2,803,750 |
| |
|
| ENERGY 11.5% |
| Energy Equipment & Services 7.1% |
| Complete Production Services, Inc. * | | 250,000 | | | | 3,975,000 |
| Superior Energy Services, Inc. * | | 145,000 | | | | 5,813,050 |
| |
|
| | | | | 9,788,050 |
| |
|
| Oil, Gas & Consumable Fuels 4.4% |
| Newfield Exploration Co. * | | 45,000 | | | | 2,244,600 |
| W&T Offshore, Inc. (r) | | 135,000 | | | | 3,819,150 |
| |
|
| | | | | 6,063,750 |
| |
|
| FINANCIALS 18.7% |
| Commercial Banks 9.5% |
| American West Bancorp (r) | | 170,000 | | | | 2,070,600 |
| Prosperity Bancshares, Inc. | | 200,000 | | | | 5,750,000 |
| Whitney Holding Corp. (r) | | 200,000 | | | | 5,368,000 |
| |
|
| | | | | 13,188,600 |
| |
|
| Consumer Finance 2.3% |
| Cash America International, Inc. | | 99,400 | | | | 3,231,494 |
| |
|
| Insurance 4.6% |
| HCC Insurance Holdings, Inc. | | 230,000 | | | | 6,407,800 |
| |
|
| Real Estate Investment Trusts 2.3% |
| Ashford Hospitality Trust | | 500,000 | | | | 3,125,000 |
| |
|
| HEALTH CARE 3.0% |
| Health Care Providers & Services 3.0% |
| Owens & Minor, Inc. | | 100,000 | | | | 4,132,000 |
| |
|
See Notes to Financial Statements11
| SCHEDULE OF INVESTMENTS continued |
|
| January 31, 2008 (unaudited) |
| | | Shares | | | | Value |
|
| COMMON STOCKS continued |
| INDUSTRIALS 23.6% |
| Aerospace & Defense 4.4% |
| Esterline Technologies Corp. * | | 130,000 | | $ 6,056,700 |
| |
|
| Air Freight & Logistics 3.3% |
| Pacer International, Inc. | | 270,000 | | | | 4,625,100 |
| |
|
| Building Products 1.5% |
| NCI Building Systems, Inc. * | | 72,150 | | | | 2,075,034 |
| |
|
| Electrical Equipment 3.1% |
| Ametek, Inc. | | 96,700 | | | | 4,258,668 |
| |
|
| Machinery 9.1% |
| Barnes Group, Inc. (r) | | 166,000 | | | | 4,423,900 |
| Commercial Vehicle Group, Inc. * | | 290,000 | | | | 2,900,000 |
| Gehl Co. * | | 50,000 | | | | 884,000 |
| Kennametal, Inc. | | 142,000 | | | | 4,349,460 |
| |
|
| | | | | 12,557,360 |
| |
|
| Road & Rail 2.2% |
| YRC Worldwide, Inc. * (r) | | 170,000 | | | | 3,112,700 |
| |
|
| INFORMATION TECHNOLOGY 12.1% |
| Electronic Equipment & Instruments 10.0% |
| Arrow Electronics, Inc. * | | 160,000 | | | | 5,475,200 |
| Benchmark Electronics, Inc. * | | 309,500 | | | | 5,493,625 |
| Nu Horizons Electronics Corp. * | | 42,100 | | | | 237,865 |
| TTM Technologies, Inc. * | | 265,700 | | | | 2,702,169 |
| |
|
| | | | | 13,908,859 |
| |
|
| IT Services 2.1% |
| Perot Systems Corp., Class A * (r) | | 234,300 | | | | 2,844,402 |
| |
|
| MATERIALS 13.6% |
| Chemicals 11.2% |
| Albemarle Corp. (r) | | 145,000 | | | | 5,257,700 |
| Cytec Industries, Inc. | | 85,000 | | | | 4,811,850 |
| Scotts Miracle-Gro Co., Class A (r) | | 140,000 | | | | 5,465,600 |
| |
|
| | | | | 15,535,150 |
| |
|
| Metals & Mining 2.4% |
| Commercial Metals Co. | | 115,300 | | | | 3,268,755 |
| |
|
| Total Common Stocks (cost $124,949,829) | | | | 137,255,312 |
| |
|
See Notes to Financial Statements12
| SCHEDULE OF INVESTMENTS continued |
|
| January 31, 2008 (unaudited) | | Principal | | | | |
| | | Amount | | | | Value |
|
| SHORT-TERM INVESTMENTS 25.1% |
| CORPORATE BONDS 2.9% |
| Consumer Finance 0.7% |
| Toyota Motor Credit Corp., FRN, 3.30%, 05/08/2008 (rr) | | $ 1,000,000 | | $ 999,572 |
| |
|
| Diversified Financial Services 2.2% |
| Bank of America Corp., FRN, 3.175%, 06/13/2008 (rr) | | | | 3,000,000 | | | | 3,001,041 |
| |
|
| REPURCHASE AGREEMENTS ^ 21.7% |
| ABN Amro, Inc., 3.21%, dated 01/31/2008, maturing 02/01/2008, maturity value | | |
| $2,000,178 (rr) | | | | 2,000,000 | | | | 2,000,000 |
| Banc of America Securities, LLC, 3.20%, dated 01/31/2008, maturing 02/01/2008, | | |
| maturity value $5,000,444 (rr) | | | | 5,000,000 | | | | 5,000,000 |
| Bear Stearns Cos., 3.23%, dated 01/31/2008, maturing 02/01/2008, maturity | | |
| value $5,000,449 (rr) | | | | 5,000,000 | | | | 5,000,000 |
| BNP Paribas SA, 3.21%, dated 01/31/2008, maturing 02/01/2008, maturity value | | |
| $2,000,178 (rr) | | | | 2,000,000 | | | | 2,000,000 |
| Credit Suisse First Boston, LLC, 3.21%, dated 01/31/2008, maturing 02/01/2008, | | |
| maturity value $1,000,089 (rr) | | | | 1,000,000 | | | | 1,000,000 |
| Deutsche Bank Securities, Inc., 3.21%, dated 01/31/2008, maturing 02/01/2008, | | |
| maturity value $2,000,178 (rr) | | | | 2,000,000 | | | | 2,000,000 |
| Dresdner Kleinwort Wasserstein Securities, LLC, 3.21%, dated 01/31/2008, | | |
| maturing 02/01/2008, maturity value $2,000,178 (rr) | | | | 2,000,000 | | | | 2,000,000 |
| Greenwich Capital Markets, Inc., 3.21%, dated 01/31/2008, maturing 02/01/2008, | | |
| maturity value $2,000,178 (rr) | | | | 2,000,000 | | | | 2,000,000 |
| JPMorgan Securities, Inc., 3.20%, dated 01/31/2008, maturing 02/01/2008, | | |
| maturity value $3,000,267 (rr) | | | | 3,000,000 | | | | 3,000,000 |
| Lehman Brothers, Inc., 3.20%, dated 01/31/2008, maturing 02/01/2008, | | |
| maturity value $2,000,178 (rr) | | | | 2,000,000 | | | | 2,000,000 |
| Merrill Lynch Pierce Fenner & Smith, Inc., 3.20%, dated 01/31/2008, maturing | | |
| 02/01/2008, maturity value $4,000,356 (rr) | | | | 4,000,000 | | | | 4,000,000 |
| |
|
| | | | | 30,000,000 |
| |
|
See Notes to Financial Statements13
| SCHEDULE OF INVESTMENTS continued |
|
| January 31, 2008 (unaudited) |
| | | Shares | | | | Value |
|
| SHORT-TERM INVESTMENTS continued |
| MUTUAL FUND SHARES 0.5% |
| AIM Short-Term Investments Trust Government & Agency Portfolio, Class I, | | |
| 3.72% (rr) q | | 765,097 | | $ 765,097 |
| |
|
| Total Short-Term Investments (cost $34,765,097) | | | | 34,765,710 |
| |
|
| Total Investments (cost $159,714,926) 124.2% | | | | 172,021,022 |
| Other Assets and Liabilities (24.2%) | | | | (33,515,974) |
| |
|
| Net Assets 100.0% | | $ 138,505,048 |
| |
|
| (r) | | All or a portion of this security is on loan. |
| * | | Non-income producing security |
| ^ | | Collateral is pooled with the collateral of other Evergreen funds and allocated on a pro-rata basis into 163 issues of |
| | | high grade short-term securities such that sufficient collateral is applied to the respective repurchase agreement. |
| (rr) | | All or a portion of this security represents investment of cash collateral received from securities on loan. |
| q | | Rate shown is the 7-day annualized yield at period end. |
| |
| Summary of Abbreviations |
| FRN | | Floating Rate Note |
The following table shows the percent of total long-term investments by sector as of January 31, 2008:| Industrials | | 23.8% |
| Financials | | 18.9% |
| Consumer Discretionary | | 14.8% |
| Materials | | 13.7% |
| Information Technology | | 12.2% |
| Energy | | 11.6% |
| Health Care | | 3.0% |
| Consumer Staples | | 2.0% |
| |
|
| | | 100.0% |
See Notes to Financial Statements14
| STATEMENT OF ASSETS AND LIABILITIES |
|
| January 31, 2008 (unaudited) |
|
| Assets |
| Investments in securities, at value (cost $129,714,926) including $34,505,194 | | |
| of securities loaned | | $ 142,021,022 |
| Investments in repurchase agreements, at value (cost $30,000,000) | | 30,000,000 |
|
| Total investments | | 172,021,022 |
| Receivable for securities sold | | 2,449,658 |
| Receivable for Fund shares sold | | 86,408 |
| Dividends receivable | | 6,158 |
| Receivable for securities lending income | | 6,229 |
| Prepaid expenses and other assets | | 45,428 |
|
| Total assets | | 174,614,903 |
|
| Liabilities |
| Payable for securities purchased | | 7,797 |
| Payable for Fund shares redeemed | | 438,852 |
| Payable for securities on loan | | 34,765,097 |
| Due to custodian bank | | 848,992 |
| Advisory fee payable | | 3,328 |
| Distribution Plan expenses payable | | 811 |
| Due to other related parties | | 2,087 |
| Accrued expenses and other liabilities | | 42,891 |
|
| Total liabilities | | 36,109,855 |
|
| Net assets | | $ 138,505,048 |
|
| Net assets represented by |
| Paid-in capital | | $ 87,858,169 |
| Overdistributed net investment loss | | (115,396) |
| Accumulated net realized gains on investments | | 38,456,179 |
| Net unrealized gains on investments | | 12,306,096 |
|
| Total net assets | | $ 138,505,048 |
|
| Net assets consists of |
| Class A | | $ 64,914,385 |
| Class B | | 7,264,935 |
| Class C | | 6,812,327 |
| Class I | | 59,513,401 |
|
| Total net assets | | $ 138,505,048 |
|
| Shares outstanding (unlimited number of shares authorized) |
| Class A | | 3,710,414 |
| Class B | | 422,417 |
| Class C | | 395,810 |
| Class I | | 3,270,360 |
|
| Net asset value per share |
| Class A | | $ 17.50 |
| Class A — Offering price (based on sales charge of 5.75%) | | $ 18.57 |
| Class B | | $ 17.20 |
| Class C | | $ 17.21 |
| Class I | | $ 18.20 |
|
See Notes to Financial Statements15
| STATEMENT OF OPERATIONS |
|
| Six Months Ended January 31, 2008 (unaudited) |
|
| Investment income |
| Dividends | | $ 1,121,594 |
| Income from affiliate | | 140,068 |
| Securities lending | | 25,623 |
|
| Total investment income | | 1,287,285 |
|
| Expenses |
| Advisory fee | | 783,339 |
| Distribution Plan expenses |
| Class A | | 97,914 |
| Class B | | 44,016 |
| Class C | | 41,247 |
| Administrative services fee | | 86,681 |
| Transfer agent fees | | 177,155 |
| Trustees’ fees and expenses | | 2,068 |
| Printing and postage expenses | | 20,259 |
| Custodian and accounting fees | | 25,624 |
| Registration and filing fees | | 36,322 |
| Professional fees | | 14,368 |
| Interest expense | | 2,605 |
| Other | | 16,861 |
|
| Total expenses | | 1,348,459 |
| Less: Expense reductions | | (2,436) |
|
| Net expenses | | 1,346,023 |
|
| Net investment loss | | (58,738) |
|
| Net realized and unrealized gains or losses on investments |
| Net realized gains on investments | | 24,667,688 |
| Net change in unrealized gains or losses on investments | | (43,691,965) |
|
| Net realized and unrealized gains or losses on investments | | (19,024,277) |
|
| Net decrease in net assets resulting from operations | | $ (19,083,015) |
|
See Notes to Financial Statements16
| STATEMENTS OF CHANGES IN NET ASSETS |
|
| | | Six Months Ended | | |
| | January 31, 2008 | | Year Ended |
| | (unaudited) | | July 31, 2007 |
|
| Operations |
| Net investment income (loss) | | $ (58,738) | | $ 1,061,536 |
| Net realized gains on investments | | 24,667,688 | | 71,686,637 |
| Net change in unrealized gains or losses | | |
| on investments | | (43,691,965) | | (7,737,412) |
|
| Net increase (decrease) in net assets | | |
| resulting from operations | | (19,083,015) | | 65,010,761 |
|
| Distributions to shareholders from |
| Net investment income |
| Class A | | (360,886) | | 0 |
| Class I | | (602,941) | | 0 |
| Net realized gains |
| Class A | | (7,329,973) | | (19,300,356) |
| Class B | | (837,101) | | (2,220,991) |
| Class C | | (789,010) | | (2,131,996) |
| Class I | | (6,544,508) | | (58,101,797) |
|
| Total distributions to shareholders | | (16,464,419) | | (81,755,140) |
|
| | | Shares | | | | Shares | | |
| Capital share transactions |
| Proceeds from shares sold |
| Class A | | 396,521 | | 7,752,875 | | 503,228 | | 12,316,452 |
| Class B | | 14,102 | | 294,599 | | 24,092 | | 581,449 |
| Class C | | 32,508 | | 623,221 | | 38,061 | | 926,332 |
| Class I | | 287,405 | | 5,837,860 | | 2,762,563 | | 68,619,476 |
|
| 14,508,555 | | 82,443,709 |
|
| Net asset value of shares issued in | | |
| reinvestment of distributions | |
| Class A | | 368,932 | | 7,033,120 | | 745,608 | | 17,393,645 |
| Class B | | 41,318 | | 773,065 | | 88,082 | | 2,029,070 |
| Class C | | 35,427 | | 663,187 | | 75,308 | | 1,735,556 |
| Class I | | 322,599 | | 6,411,347 | | 1,187,324 | | 28,699,902 |
|
| 14,880,719 | | 49,858,173 |
|
| Automatic conversion of Class B shares | | |
| to Class A shares | |
| Class A | | 4,281 | | 89,940 | | 7,124 | | 174,772 |
| Class B | | (4,357) | | (89,940) | | (7,201) | | (174,772) |
|
| 0 | | 0 |
|
| Payment for shares redeemed |
| Class A | | (944,908) | | (18,532,836) | | (1,148,999) | | (28,208,946) |
| Class B | | (73,227) | | (1,414,623) | | (84,985) | | (2,070,905) |
| Class C | | (92,092) | | (1,767,236) | | (118,135) | | (2,848,640) |
| Class I | | (1,938,579) | | (42,488,533) | | (13,387,531) | | (333,336,911) |
|
| (64,203,228) | | (366,465,402) |
|
| Net decrease in net assets resulting | | |
| from capital share transactions | | (34,813,954) | | (234,163,520) |
|
| Total decrease in net assets | | (70,361,388) | | (250,907,899) |
| Net assets |
| Beginning of period | | 208,866,436 | | 459,774,335 |
|
| End of period | | $ 138,505,048 | | $ 208,866,436 |
|
| Undistributed (overdistributed) net | | |
| investment income (loss) | | $ (115,396) | | $ 907,169 |
|
See Notes to Financial Statements17
NOTES TO FINANCIAL STATEMENTS (unaudited)
1. ORGANIZATION
Evergreen Small Cap Value Fund (the “Fund”) is a diversified series of Evergreen Equity Trust (the “Trust”), a Delaware statutory trust organized on September 18, 1997. The Trust is an open-end management investment company registered under the Investment Company Act of 1940, as amended (the “1940 Act”).
The Fund offers Class A, Class B, Class C and Class I shares. Class A shares are sold with a front-end sales charge. However, Class A share investments of $1 million or more are not subject to a front-end sales charge but are subject to a contingent deferred sales charge of 1.00% upon redemption within 18 months. Class B shares are sold without a front-end sales charge but are subject to a contingent deferred sales charge that is payable upon redemption and decreases depending on how long the shares have been held. Class C shares are sold without a front-end sales charge but are subject to a contingent deferred sales charge that is payable upon redemption within one year. Class I shares are sold without a front-end sales charge or contingent deferred sales charge. Each class of shares, except Class I shares, pays an ongoing distribution fee.
2. SIGNIFICANT ACCOUNTING POLICIES
The following is a summary of significant accounting policies consistently followed by the Fund in the preparation of its financial statements. The policies are in conformity with generally accepted accounting principles in the United States of America, which require management to make estimates and assumptions that affect amounts reported herein. Actual results could differ from these estimates.
a. Valuation of investments
Listed equity securities are usually valued at the last sales price or official closing price on the national securities exchange where the securities are principally traded.
Foreign securities traded on an established exchange are valued at the last sales price on the exchange where the security is primarily traded. If there has been no sale, the securities are valued at the mean between bid and asked prices. Foreign securities may be valued at fair value according to procedures approved by the Board of Trustees if the closing price is not reflective of current market values due to trading or events occurring in the foreign markets between the close of the established exchange and the valuation time of the Fund. In addition, substantial changes in values in the U.S. markets subsequent to the close of a foreign market may also affect the values of securities traded in the foreign market. The value of foreign securities may be adjusted if such movements in the U.S. market exceed a specified threshold.
Short-term securities with remaining maturities of 60 days or less at the time of purchase are valued at amortized cost, which approximates market value.
Investments in open-end mutual funds are valued at net asset value. Securities for which market quotations are not readily available or not reflective of current market value are valued at fair value as determined by the investment advisor in good faith, according to procedures approved by the Board of Trustees.
b. Repurchase agreements
Securities pledged as collateral for repurchase agreements are held by the custodian bank or in a segregated account in the Fund’s name until the agreements mature. Collateral for certain tri-party repurchase agreements is held at the counterparty’s custodian in a segregated account for the
18
NOTES TO FINANCIAL STATEMENTS (unaudited) continued
benefit of the Fund and the counterparty. Each agreement requires that the market value of the collateral be sufficient to cover payments of interest and principal. However, in the event of default or bankruptcy by the other party to the agreement, retention of the collateral may be subject to legal proceedings. The Fund will enter into repurchase agreements with banks and other financial institutions, which are deemed by the investment advisor to be creditworthy pursuant to guidelines established by the Board of Trustees. In certain instances, the Fund’s securities lending agent may provide collateral in the form of repurchase agreements.
c. Foreign currency translation
All assets and liabilities denominated in foreign currencies are translated into U.S. dollar amounts at the date of valuation. Purchases and sales of portfolio securities and income items denominated in foreign currencies are translated into U.S. dollar amounts on the respective dates of such transactions. The Fund does not separately account for that portion of the results of operations resulting from changes in foreign exchange rates on investments and the fluctuations arising from changes in market prices of securities held. Such fluctuations are included with the net realized and unrealized gains or losses on investments.
d. Securities lending
The Fund may lend its securities to certain qualified brokers in order to earn additional income. The Fund receives compensation in the form of fees or interest earned on the investment of any cash collateral received. The Fund also continues to receive interest and dividends on the securities loaned. The Fund receives collateral in the form of cash or securities with a market value at least equal to the market value of the securities on loan. In the event of default or bankruptcy by the borrower, the Fund could experience delays and costs in recovering the loaned securities or in gaining access to the collateral. The Fund has the right under the lending agreement to recover the securities from the borrower on demand.
e. Security transactions and investment income
Security transactions are recorded on trade date. Realized gains and losses are computed using the specific cost of the security sold. Dividend income is recorded on the ex-dividend date or in the case of some foreign securities, on the date when the Fund is made aware of the dividend.
f. Federal taxes
The Fund intends to continue to qualify as a regulated investment company and distribute all of its taxable income, including any net capital gains (which have already been offset by available capital loss carryovers). Accordingly, no provision for federal taxes is required.
g. Distributions
Distributions to shareholders from net investment income and net realized gains, if any, are recorded on the ex-dividend date. Such distributions are determined in conformity with income tax regulations, which may differ from generally accepted accounting principles.
h. Class allocations
Income, common expenses and realized and unrealized gains and losses are allocated to the classes based on the relative net assets of each class. Distribution fees, if any, are calculated daily at the class level based on the appropriate net assets of each class and the specific expense rates applicable to each class.
19
NOTES TO FINANCIAL STATEMENTS (unaudited) continued
3. ADVISORY FEE AND OTHER TRANSACTIONS WITH AFFILIATES
Evergreen Investment Management Company, LLC (“EIMC”), an indirect, wholly-owned subsidiary of Wachovia Corporation (“Wachovia”), is the investment advisor to the Fund and is paid an annual fee starting at 0.90% and declining to 0.70% as average daily net assets increase. For the six months ended January 31, 2008, the advisory fee was equivalent to 0.90% of the Fund’s average daily net assets (on an annualized basis).
J.L. Kaplan Associates, LLC, an indirect, wholly-owned subsidiary of Wachovia, is the investment sub-advisor to the Fund and is paid by EIMC for its services to the Fund.
The Fund may invest in money market funds which are advised by EIMC. Income earned on these investments is included in income from affiliate on the Statement of Operations.
Effective January 1, 2008, EIMC replaced Evergreen Investment Services, Inc. (“EIS”), an indirect, wholly-owned subsidiary of Wachovia, as the administrator to the Fund upon the assignment of the Fund’s Administrative Services Agreement from EIS to EIMC. There were no changes to the services being provided or fees being paid by the Fund. The administrator provides the Fund with facilities, equipment and personnel and is paid an annual rate determined by applying percentage rates to the aggregate average daily net assets of the Evergreen funds (excluding money market funds and Evergreen Institutional Enhanced Income Fund), starting at 0.10% and declining to 0.05% as the aggregate average daily net assets of the Evergreen funds (excluding money market funds and Evergreen Institutional Enhanced Income Fund) increase.
Evergreen Service Company, LLC (“ESC”), an indirect, wholly-owned subsidiary of Wachovia, is the transfer and dividend disbursing agent for the Fund. ESC receives account fees that vary based on the type of account held by the shareholders in the Fund. For the six months ended January 31, 2008, the transfer agent fees were equivalent to an annual rate of 0.20% of the Fund’s average daily net assets.
Wachovia Bank NA, through its securities lending division of Wachovia Global Securities Lending, acts as the securities lending agent for the Fund.
4. DISTRIBUTION PLANS
EIS also serves as distributor of the Fund’s shares. The Fund has adopted Distribution Plans, as allowed by Rule 12b-1 of the 1940 Act, for each class of shares, except Class I. Under the Distribution Plans, distribution fees are paid at an annual rate of 0.25% of the average daily net assets for Class A shares and 1.00% of the average daily net assets for each of Class B and Class C shares.
For the six months ended January 31, 2008, EIS received $715 from the sale of Class A shares and $26, $13,321 and $577 in contingent deferred sales charges from redemptions of Class A, Class B and Class C shares, respectively.
5. INVESTMENT TRANSACTIONS
Cost of purchases and proceeds from sales of investment securities (excluding short-term securities) were $30,623,994 and $78,812,438, respectively, for the six months ended January 31, 2008.
20
NOTES TO FINANCIAL STATEMENTS (unaudited) continued
During the six months ended January 31, 2008, the Fund loaned securities to certain brokers. At January 31, 2008, the value of securities on loan and the total amount of collateral received for securities loaned amounted to $34,505,194 and $34,765,097, respectively.
On January 31, 2008, the aggregate cost of securities for federal income tax purposes was $159,714,926. The gross unrealized appreciation and depreciation on securities based on tax cost was $29,906,262 and $17,600,166, respectively, with a net unrealized appreciation of $12,306,096.
6. INTERFUND LENDING
Pursuant to an Exemptive Order issued by the SEC, the Fund may participate in an interfund lending program with certain funds in the Evergreen fund family. This program allows the Fund to borrow from, or lend money to, other participating funds. During the six months ended January 31, 2008, the Fund did not participate in the interfund lending program.
7. EXPENSE REDUCTIONS
Through expense offset arrangements with ESC and the Fund’s custodian, a portion of fund expenses has been reduced.
8. DEFERRED TRUSTEES’ FEES
Each Trustee of the Fund may defer any or all compensation related to performance of his or her duties as a Trustee. The Trustees’ deferred balances are allocated to deferral accounts, which are included in the accrued expenses for the Fund. The investment performance of the deferral accounts is based on the investment performance of certain Evergreen funds. Any gains earned or losses incurred in the deferral accounts are reported in the Fund’s Trustees’ fees and expenses. At the election of the Trustees, the deferral account will be paid either in one lump sum or in quarterly installments for up to ten years.
9. FINANCING AGREEMENT
The Fund and certain other Evergreen funds share in an unsecured revolving credit commitment for temporary and emergency purposes, including the funding of redemptions, as permitted by each participating fund’s borrowing restrictions. Borrowings under this facility bear interest at 0.50% per annum above the Federal Funds rate. All of the participating funds are charged an annual commitment fee on the unused balance, which is allocated pro rata. The credit facility is for $100 million with an annual commitment fee of 0.08% .
During the six months ended January 31, 2008, the Fund had average borrowings outstanding of $47,447 (on an annualized basis) at an average rate of 5.49% and paid interest of $2,605.
10. REGULATORY MATTERS AND LEGAL PROCEEDINGS
Pursuant to an administrative order issued by the SEC on September 19, 2007, EIMC, EIS, ESC (collectively, the “Evergreen Entities”), Wachovia Securities, LLC and the SEC have entered into an agreement settling allegations of (i) improper short-term trading arrangements in effect prior to May 2003 involving former officers and employees of EIMC and certain broker-dealers, (ii) insufficient systems for monitoring exchanges and enforcing exchange limitations as stated in certain funds’ prospectuses, and (iii) inadequate e-mail retention practices. Under the settlement, the Evergreen Entities were censured and paid approximately $32 million in disgorgement and
21
NOTES TO FINANCIAL STATEMENTS (unaudited) continued
penalties. This amount, along with a fine assessed by the SEC against Wachovia Securities, LLC will be distributed pursuant to a plan to be developed by an independent distribution consultant and approved by the SEC. The Evergreen Entities neither admitted nor denied the allegations and findings set forth in its settlement with the SEC.
In addition, the Evergreen funds and EIMC and certain of its affiliates are involved in various legal actions, including private litigation and class action lawsuits. EIMC does not expect that any of such legal actions currently pending or threatened will have a material adverse impact on the financial position or operations of any of the Evergreen funds or on EIMC’s ability to provide services to the Evergreen funds.
Although EIMC believes that none of the matters discussed above will have a material adverse impact on the Evergreen funds, there can be no assurance that these matters and any publicity surrounding or resulting from them will not result in reduced sales or increased redemptions of Evergreen fund shares, which could increase Evergreen fund transaction costs or operating expenses, or that they will not have other adverse consequences on the Evergreen funds.
11. NEW ACCOUNTING PRONOUNCEMENTS
In June 2006, the Financial Accounting Standards Board (“FASB”) issued FASB Interpretation No. 48, Accounting for Uncertainty in Income Taxes — an interpretation of FASB statement 109 (“FIN 48”). FIN 48 supplements FASB 109 by prescribing a recognition threshold and measurement attribute for the financial statement recognition and measurement of a tax position taken or expected to be taken in a tax return. The Fund’s financial statements have not been impacted by the adoption of FIN 48. However, the conclusions regarding FIN 48 may be subject to review and adjustment at a later date based on factors including, but not limited to, further implementation guidance expected from FASB, and on-going analysis of tax laws, regulations, and interpretations thereof.
In September 2006, FASB issued Statement of Financial Accounting Standards No. 157, Fair Value Measurements (“FAS 157”). FAS 157 establishes a single authoritative definition of fair value, establishes a framework for measuring fair value and expands disclosures about fair value measurements. FAS 157 applies to fair value measurements already required or permitted by existing standards. The change to current generally accepted accounting principles from the application of FAS 157 relates to the definition of fair value, the methods used to measure fair value, and the expanded disclosures about fair value measurements. Management of the Fund does not believe the adoption of FAS 157 will materially impact the financial statement amounts, however, additional disclosures may be required about the inputs used to develop the measurements and the effect of certain of the measurements on changes in net assets for the period. FAS 157 is effective for financial statements issued for fiscal years beginning after November 15, 2007 and interim periods within those fiscal years.
22
ADDITIONAL INFORMATION (unaudited)
INFORMATION ABOUT THE REVIEW AND APPROVAL OF THE FUND’S INVESTMENT ADVISORY AGREEMENT
Each year, the Fund’s Board of Trustees is required to consider whether to continue in place the Fund’s investment advisory agreements. In September 2007, the Trustees, including a majority of the Trustees who are not interested persons (as that term is defined in the 1940 Act) of the Fund, J.L. Kaplan Associates, LLC (the “Sub-Advisor”), or EIMC, approved the continuation of the Fund’s investment advisory agreements. (References below to the “Fund” are to Evergreen Small Cap Value Fund; references to the “funds” are to the Evergreen funds generally.)
At the same time, the Trustees considered the continuation of the investment advisory agreements for all of the funds, and the description below refers in many cases to the Trustees’ process and conclusions in connection with their consideration of this matter for all of the funds. (See “Certain Fund-Specific Considerations” below for a discussion regarding certain factors considered by the Trustees relating specifically to the Fund.) In all of its deliberations, the Board of Trustees and the disinterested Trustees were advised by independent counsel to the disinterested Trustees and counsel to the funds.
The review process. The 1940 Act requires that the Board of Trustees request and evaluate, and that EIMC and any sub-advisors furnish, such information as may reasonably be necessary to evaluate the terms of a fund’s advisory agreements. The review process began at the time of the last advisory contract-renewal process in September 2006. In the course of that process, the Trustees identified a number of funds that had experienced either short-term or longer-term performance issues. During the following months, the Trustees reviewed information relating to any changes in the performance of those funds and/or any changes in the investment process or the investment teams responsible for the management of the funds. In addition, during the course of the year, the Trustees reviewed information regarding the investment performance of all of the funds and identified additional funds that they believed warranted further attention based on performance since September 2006.
In spring 2007, a committee of the Board of Trustees (the “Committee”), working with EIMC management, determined generally the types of information the Board would review and set a timeline detailing the information required and the dates for its delivery to the Trustees. The independent data provider Keil Fiduciary Strategies LLC (“Keil”) was engaged to provide fund-specific and industry-wide data to the Board containing information of a nature and in a format generally prescribed by the Committee, and the Committee worked with Keil and EIMC to develop appropriate groups of peer funds for each fund. The Committee also identified a number of expense, performance, and other issues and requested specific information as to those issues.
The Trustees reviewed, with the assistance of an independent industry consultant retained by the disinterested Trustees, the information provided by EIMC and the Sub-Advisor in response to the Committee’s requests and the information provided by Keil. The Trustees formed small committees to review individual funds in greater detail. In addition, the Trustees requested information regarding, among other things, brokerage practices of the funds, the use of derivatives by the funds, strategic planning for the funds, analyst and research support available to the portfolio management teams, and information regarding the various fall-out benefits received directly and indirectly by EIMC and its affiliates from the funds. The Trustees requested and received additional information following that review.
23
ADDITIONAL INFORMATION (unaudited) continued
The Committee met several times by telephone to consider the information provided by EIMC. The Committee met with representatives of EIMC in early September. At a meeting of the full Board of Trustees later in September, the Committee reported the results of its discussions with EIMC, and the full Board met with representatives of EIMC, engaged in further review of the materials provided to them, and approved the continuation of each of the advisory and sub-advisory agreements.
The disinterested Trustees discussed the continuation of the funds’ advisory agreements with representatives of EIMC and in multiple private sessions with legal counsel at which no personnel of EIMC were present. In considering the continuation of the agreements, the Trustees did not identify any particular information or consideration that was all-important or controlling, and each Trustee attributed different weights to various factors. The Trustees evaluated information provided to them both in terms of the Evergreen mutual funds generally and with respect to each fund, including the Fund, specifically as they considered appropriate; although the Trustees considered the continuation of the agreements as part of the larger process of considering the continuation of the advisory contracts for all of the funds, their determination to continue the advisory agreements for each of the funds was ultimately made on a fund-by-fund basis.
This summary describes a number of the most important, but not necessarily all, of the factors considered by the Board and the disinterested Trustees.
Information reviewed. The Board of Trustees and committees of the Board of Trustees meet periodically during the course of the year. At those meetings, the Board receives a wide variety of information regarding the services performed by EIMC, the investment performance of the funds, and other aspects of the business and operations of the funds. At those meetings, and in the process of considering the continuation of the agreements, the Trustees considered information regarding, for example, the funds’ investment results; the portfolio management teams for the funds and the experience of the members of those teams, and any recent changes in the membership of the teams; portfolio trading practices; compliance by the funds, EIMC, and the Sub-Advisor with applicable laws and regulations and with the funds’ and EIMC’s compliance policies and procedures; risk evaluation and oversight procedures at EIMC; services provided by affiliates of EIMC to the funds and shareholders of the funds; and other information relating to the nature, extent, and quality of services provided by EIMC and the Sub-Advisor. The Trustees considered a number of changes in portfolio management personnel at EIMC and its advisory affiliates in the year since September 2006, and recent changes in compliance personnel at EIMC, including the appointment of a new Chief Compliance Officer for the funds.
The Trustees considered the rates at which the funds pay investment advisory fees, and the efforts generally by EIMC and its affiliates as sponsors of the funds. The data provided by Keil showed the management fees paid by each fund in comparison to the management fees of other peer mutual funds, in addition to data regarding the investment performance of the funds in comparison to other peer mutual funds. The Trustees were assisted by the independent industry consultant in reviewing the information presented to them.
The Trustees considered the transfer agency fees paid by the funds to an affiliate of EIMC. They reviewed information presented to them showing that the transfer agency fees charged to the funds were generally consistent with industry norms.
24
ADDITIONAL INFORMATION (unaudited) continued
The Trustees also considered that EIS, an affiliate of EIMC, serves as administrator to the funds and receives a fee for its services as administrator. In their comparison of the advisory fee paid by the funds with those paid by other mutual funds, the Trustees took into account administrative fees paid by the funds and those other mutual funds. The Board considered that EIS serves as distributor to the funds generally and receives fees from the funds for those services. They considered other so-called “fall-out” benefits to EIMC and its affiliates due to their other relationships with the funds, including, for example, soft-dollar services received by EIMC attributable to transactions entered into by EIMC for the benefit of the funds and brokerage commissions received by Wachovia Securities, LLC, an affiliate of EIMC, from transactions effected by it for the funds. The Trustees also noted that the funds pay sub-transfer agency fees to various financial institutions who hold fund shares in omnibus accounts, and that Wachovia Securities, LLC and its affiliates receive such payments from the funds in respect of client accounts they hold in omnibus arrangements, and that an affiliate of EIMC receives fees for administering the sub-transfer agency payment program. They also considered that Wachovia Securities, LLC and its affiliates receive distribution-related fees and shareholder servicing payments (including amounts derived from payments under the funds’ Rule 12b-1 plans) in respect of shares sold or held through it. The Trustees also noted that an affiliate of EIMC receives compensation for serving as a securities lending agent for the funds.
Nature and quality of the services provided. The Trustees considered that EIMC and its affili-ates generally provide a comprehensive investment management service to the funds. They noted that EIMC and the Sub-Advisor formulate and implement an investment program for the Fund. They noted that EIMC makes its personnel available to serve as officers of the funds, and concluded that the reporting and management functions provided by EIMC with respect to the funds were generally satisfactory. The Trustees considered the investment philosophy of the Fund’s portfolio management team, and considered the in-house research capabilities of EIMC and its affiliates, as well as other resources available to EIMC, including research services available to it from third parties. The Board considered the managerial and financial resources available to EIMC and its affiliates, and the commitment that the Wachovia organization has made to the funds generally. On the basis of these factors, they determined that the nature and scope of the services provided by EIMC and the Sub-Advisor were consistent with their respective duties under the investment advisory agreements and appropriate and consistent with the investment programs and best interests of the funds.
The Trustees noted the resources EIMC and its affiliates have committed to the regulatory, compliance, accounting, tax and oversight of tax reporting, and shareholder servicing functions, and the number and quality of staff committed to those functions, which they concluded were appropriate and generally in line with EIMC’s responsibilities to the Fund and to the funds generally. The Board and the disinterested Trustees concluded, within the context of their overall conclusions regarding the funds’ advisory agreements, that they were generally satisfied with the nature, extent, and quality of the services provided by the Sub-Advisor and EIMC, including services provided by EIS under its administrative services agreements with the funds.
Investment performance. The Trustees considered the investment performance of each fund, both by comparison to other comparable mutual funds and to broad market indices. The Trustees emphasized that the continuation of the investment advisory agreement for a fund should not be taken as any indication that the Trustees did not believe investment performance for any specific
25
ADDITIONAL INFORMATION (unaudited) continued
fund might not be improved, and they noted that they would continue to monitor closely the investment performance of the funds going forward.
Advisory and administrative fees. The Trustees recognized that EIMC does not seek to provide the lowest cost investment advisory service, but to provide a high quality, full-service investment management product at a reasonable price. They also noted that EIMC has in many cases sought to set its investment advisory fees at levels consistent with industry norms. The Trustees noted that, in certain cases, a fund’s management fees were higher than many or most other mutual funds in the same Keil peer group. However, in each case, the Trustees determined on the basis of the information presented that the level of management fees was not excessive.
Certain Fund-specific considerations. The Trustees noted that, for the one-, three-, and five-year periods ended December 31, 2006, the Fund’s Class A shares had underperformed the Fund’s benchmark index, the Russell 2000 Value Index, and a majority of the mutual funds against which the Trustees compared the Fund’s performance. The Trustees noted that the Fund’s relative performance had improved quite recently at a time when portfolio management responsibility for the Fund was being transitioned within Kaplan.
The Trustees noted that the management fee paid by the Fund was higher than the management fees paid by most of the other mutual funds against which the Trustees compared the Fund’s management fee, but also noted that the level of profitability realized by EIMC in respect of the fee did not appear excessive.
The Trustees considered information regarding the rates at which other clients pay advisory fees to EIMC or its affiliates for advisory services that are comparable to the advisory services they provide to the Fund. Fees charged by EIMC to those other clients were generally lower than those charged to the Fund. EIMC explained that compliance, reporting, and other legal burdens of providing investment advice to mutual funds generally exceed those required to provide advisory services to non-mutual fund clients such as retirement or pension plans. In addition, EIMC pointed out that there is substantially greater legal and other risk to EIMC and its affiliates from managing public mutual funds than in managing private accounts. The Trustees also considered the investment performance of those other accounts managed by EIMC and its affiliates, and concluded that the performance of those accounts did not reflect any substantial difference in the quality of the service provided by EIMC and its affiliates to those accounts.
Economies of scale. The Trustees noted that economies of scale would likely be achieved by EIMC in managing the funds as the funds grow. The Trustees noted that the Fund had implemented breakpoints in its advisory fee structure. The Trustees noted that they would continue to review the appropriate levels of breakpoints in the future, but concluded that the breakpoints as implemented appeared to be a reasonable step toward the realization of economies of scale by the Fund.
Profitability. The Trustees considered information provided to them regarding the profitability to the EIMC organization of the investment advisory, administration, and transfer agency (with respect to the open-end funds only) fees paid to EIMC and its affiliates by each of the funds. They considered that the information provided to them was necessarily estimated, and that the profitability information provided to them, especially on a fund-by-fund basis, did not necessarily provide a definitive tool for evaluating the appropriateness of each fund’s advisory fee. They noted
26
ADDITIONAL INFORMATION (unaudited) continued
that the levels of profitability of the funds to EIMC varied widely, depending on among other things the size and type of fund. They considered the profitability of the funds in light of such factors as, for example, the information they had received regarding the relation of the fees paid by the funds to those paid by other mutual funds, the investment performance of the funds, and the amount of revenues involved. In light of these factors, the Trustees concluded that the profitability of any of the funds, individually or in the aggregate, should not prevent the Trustees from approving the continuation of the agreements.
27
| TRUSTEES AND OFFICERS |
|
| TRUSTEES1 |
| Charles A. Austin III | | Investment Counselor, Anchor Capital Advisors, LLC. (investment advice); Director, The Andover |
| Trustee | | Companies (insurance); Trustee, Arthritis Foundation of New England; Former Director, The |
| DOB: 10/23/1934 | | Francis Ouimet Society (scholarship program); Former Director, Executive Vice President and |
| Term of office since: 1991 | | Treasurer, State Street Research & Management Company (investment advice) |
| Other directorships: None | | |
|
| K. Dun Gifford | | Chairman and President, Oldways Preservation and Exchange Trust (education); Trustee, |
| Trustee | | Chairman of the Finance Committee, Member of the Executive Committee, and Former |
| DOB: 10/23/1938 | | Treasurer, Cambridge College |
| Term of office since: 1974 | | |
| Other directorships: None | |
|
| Dr. Leroy Keith, Jr. | | Managing Director, Almanac Capital Management (commodities firm); Trustee, Phoenix |
| Trustee | | Fund Complex; Director, Diversapack Co. (packaging company); Former Partner, Stonington |
| DOB: 2/14/1939 | | Partners, Inc. (private equity fund); Former Director, Obagi Medical Products Co.; Former |
| Term of office since: 1983 | | Director, Lincoln Educational Services |
| Other directorships: Trustee, | | |
| Phoenix Fund Complex (consisting | |
| of 53 portfolios as of 12/31/2007) | |
|
| Carol A. Kosel1 | | Former Consultant to the Evergreen Boards of Trustees; Former Vice President and Senior Vice |
| Trustee | | President, Evergreen Investments, Inc.; Former Treasurer, Evergreen Funds; Former Treasurer, |
| DOB: 12/25/1963 | | Vestaur Securities Fund |
| Term of office since: 2008 | | |
| Other directorships: None | |
|
| Gerald M. McDonnell | | Former Manager of Commercial Operations, CMC Steel (steel producer) |
| Trustee | | |
| DOB: 7/14/1939 | |
| Term of office since: 1988 | |
| Other directorships: None | |
|
| Patricia B. Norris | | President and Director of Buckleys of Kezar Lake, Inc. (real estate company); Former President |
| Trustee | | and Director of Phillips Pond Homes Association (home community); Former Partner, |
| DOB: 4/9/1948 | | PricewaterhouseCoopers, LLP (independent registered public accounting firm) |
| Term of office since: 2006 | | |
| Other directorships: None | |
|
| William Walt Pettit | | Partner and Vice President, Kellam & Pettit, P.A. (law firm); Director, Superior Packaging Corp. |
| Trustee | | (packaging company); Member, Superior Land, LLC (real estate holding company), Member, |
| DOB: 8/26/1955 | | K&P Development, LLC (real estate development); Former Director, National Kidney Foundation |
| Term of office since: 1988 | | of North Carolina, Inc. (non-profit organization) |
| Other directorships: None | | |
|
| David M. Richardson | | President, Richardson, Runden LLC (executive recruitment advisory services); Director, J&M |
| Trustee | | Cumming Paper Co. (paper merchandising); Trustee, NDI Technologies, LLP (communications); |
| DOB: 9/19/1941 | | Former Consultant, AESC (The Association of Executive Search Consultants) |
| Term of office since: 1982 | | |
| Other directorships: None | |
|
| Dr. Russell A. Salton III | | President/CEO, AccessOne MedCard, Inc. |
| Trustee | | |
| DOB: 6/2/1947 | |
| Term of office since: 1984 | |
| Other directorships: None | |
|
28
| TRUSTEES AND OFFICERS continued |
|
| Michael S. Scofield | | Retired Attorney, Law Offices of Michael S. Scofield; Former Director and Chairman, Branded |
| Trustee | | Media Corporation (multi-media branding company) |
| DOB: 2/20/1943 | | |
| Term of office since: 1984 | |
| Other directorships: None | |
|
| Richard J. Shima | | Independent Consultant; Director, Hartford Hospital; Trustee, Greater Hartford YMCA; Former |
| Trustee | | Director, Trust Company of CT; Former Director, Old State House Association; Former Trustee, |
| DOB: 8/11/1939 | | Saint Joseph College (CT) |
| Term of office since: 1993 | | |
| Other directorships: None | |
|
| Richard K. Wagoner, CFA2 | | Member and Former President, North Carolina Securities Traders Association; Member, Financial |
| Trustee | | Analysts Society |
| DOB: 12/12/1937 | | |
| Term of office since: 1999 | |
| Other directorships: None | |
|
| OFFICERS |
| Dennis H. Ferro3 | | Principal occupations: President and Chief Executive Officer, Evergreen Investment Company, |
| President | | Inc. and Executive Vice President, Wachovia Bank, N.A.; former Chief Investment Officer, |
| DOB: 6/20/1945 | | Evergreen Investment Company, Inc. |
| Term of office since: 2003 | | |
|
| Jeremy DePalma4 | | Principal occupations: Senior Vice President, Evergreen Investment Management Company, LLC; |
| Treasurer | | Former Vice President, Evergreen Investment Services, Inc.; Former Assistant Vice President, |
| DOB: 2/5/1974 | | Evergreen Investment Services, Inc. |
| Term of office since: 2005 | | |
|
| Michael H. Koonce4 | | Principal occupations: Senior Vice President and General Counsel, Evergreen Investment |
| Secretary | | Services, Inc.; Secretary, Senior Vice President and General Counsel, Evergreen Investment |
| DOB: 4/20/1960 | | Management Company, LLC and Evergreen Service Company, LLC; Senior Vice President and |
| Term of office since: 2000 | | Assistant General Counsel, Wachovia Corporation |
|
| Robert Guerin4 | | Principal occupations: Chief Compliance Officer, Evergreen Funds and Senior Vice President of |
| Chief Compliance Officer | | Evergreen Investments Co, Inc; Former Managing Director and Senior Compliance Officer, |
| DOB: 9/20/1965 | | Babson Capital Management LLC; Former Principal and Director, Compliance and Risk |
| Term of office since: 2007 | | Management, State Street Global Advisors; Former Vice President and Manager, Sales Practice |
| | | Compliance, Deutsche Asset Management. |
|
1 Each Trustee, except Mses. Kosel and Norris, serves until a successor is duly elected or qualified or until his or her death, resignation, retirement or removal from office. As new Trustees, Ms. Kosel’s and Ms. Norris’ initial terms end December 31, 2010 and June 30, 2009, respectively, at which times they may be re-elected by Trustees to serve until a successor is duly elected or qualified or until her death, resignation, retirement or removal from office by the Trustees. Each Trustee, except Ms. Kosel, oversaw 93 Evergreen funds as of December 31, 2007. Ms. Kosel became a Trustee on January 1, 2008. Correspondence for each Trustee may be sent to Evergreen Board of Trustees, P.O. Box 20083, Charlotte, NC 28202.2 Mr. Wagoner is an “interested person” of the Fund because of his ownership of shares in Wachovia Corporation, the parent to the Fund’s investment advisor.
3 The address of the Officer is 401 S. Tryon Street, 20th Floor, Charlotte, NC 28288.
4 The address of the Officer is 200 Berkeley Street, Boston, MA 02116.
Additional information about the Fund’s Board of Trustees and Officers can be found in the Statement of Additional Information (SAI) and is available upon request without charge by calling 800.343.2898.
29
569091 rv5 03/2008
Evergreen Special Values Fund
| | | table of contents |
| 1 | | LETTER TO SHAREHOLDERS |
| 4 | | FUND AT A GLANCE |
| 6�� | | ABOUT YOUR FUND’S EXPENSES |
| 7 | | FINANCIAL HIGHLIGHTS |
| 12 | | SCHEDULE OF INVESTMENTS |
| 20 | | STATEMENT OF ASSETS AND LIABILITIES |
| 21 | | STATEMENT OF OPERATIONS |
| 22 | | STATEMENTS OF CHANGES IN NET ASSETS |
| 24 | | NOTES TO FINANCIAL STATEMENTS |
| 30 | | ADDITIONAL INFORMATION |
| 36 | | TRUSTEES AND OFFICERS |
This semiannual report must be preceded or accompanied by a prospectus of the Evergreen fund contained herein. The prospectus contains more complete information, including fees and expenses, and should be read carefully before investing or sending money.
The fund will file its complete schedule of portfolio holdings with the SEC for the first and third quarters of each fiscal year on Form N-Q. The fund’s Form N-Q will be available on the SEC’s Web site at http://www.sec.gov. In addition, the fund’s Form N-Q may be reviewed and copied at the SEC’s Public Reference Room in Washington, D.C. Information on the operation of the Public Reference Room may be obtained by calling 800.SEC.0330.
A description of the fund’s proxy voting policies and procedures, as well as information regarding how the fund voted proxies relating to portfolio securities during the most recent 12-month period ended June 30, is available by visiting our Web site at EvergreenInvestments.com or by visiting the SEC’s Web site at http://www.sec.gov. The fund’s proxy voting policies and procedures are also available without charge, upon request, by calling 800.343.2898.
| Mutual Funds: | | | | |
| NOT FDIC INSURED | | MAY LOSE VALUE | | NOT BANK GUARANTEED |
Evergreen InvestmentsSM is a service mark of Evergreen Investment Management Company, LLC.
Copyright 2008, Evergreen Investment Management Company, LLC.
Evergreen Investment Management Company, LLC is a subsidiary of Wachovia Corporation and is an affiliate of Wachovia Corporation’s other Broker Dealer subsidiaries.
Evergreen mutual funds are distributed by Evergreen Investment Services, Inc.
200 Berkeley Street, Boston, MA 02116
LETTER TO SHAREHOLDERS
March 2008

Dennis H. Ferro
President and Chief
Executive Officer
Dear Shareholder:
We are pleased to provide the Semiannual Report for Evergreen Special Values Fund, covering the six-month period ended January 31, 2008.
Investors in the domestic equity market faced challenging and increasingly stormy conditions over the six-month period ended January 31, 2008. Problems in the housing and subprime mortgage markets led to a tightening of credit, which in turn contributed to widening fears of a dramatic deceleration in the economy’s expansion. As the economy weakened, equity prices generally declined across companies of all sizes. Large cap stocks held up somewhat better than mid cap and small cap shares, while growth stocks outperformed more economically sensitive value stocks. Fixed income investors, meanwhile, sought out the highest-quality securities and attempted to avoid credit risk. Longer-maturity Treasuries outperformed other sectors, while the prices of corporate bonds and many asset-backed securities fell as the yield spreads between Treasuries and lower-rated securities widened. In this environment, the price of gold surged while the dollar remained weak.
The U.S. economy exhibited increasing signs of weakness in the latter half of 2007 and the first month of 2008 after experiencing solid growth early in 2007. Although housing and credit-related concerns began weighing on investor sentiment early in the year, the economy’s growth trajectory continued to be supported early in 2007 by the combination of solid trends in employment, income, investment and export trends. That began to change in the latter months of 2007, however, as each of these pillars of support began to weaken. Growth in Gross Domestic Product
1
LETTER TO SHAREHOLDERS continued
rose by just 0.6% during the final quarter of 2007 as economic output slowed because of a sharp reduction in business inventories. The rate of corporate earnings growth, meanwhile, declined over the second half of 2007. Payrolls dropped by 17,000 in January 2008, contributing to growing concerns about the outlook for consumer spending, which accounts for up to 70% of economic output. Faced with growing evidence of the economy’s deceleration, the Federal Reserve Board (the “Fed”) began to focus more on stimulating growth and less on watching inflation. The Fed cut the target fed funds rate from 5.25% to 4.25% during the last four months of 2007 and then slashed the rate by an additional 1.25% in two separate actions within just eight days of each other in January 2008. Also in early 2008, Congress passed, and President Bush signed, a $168 billion fiscal stimulus bill that contained rebates for taxpayers, tax breaks for businesses and additional assistance for Social Security recipients and disabled veterans.
Over the six-month period ended January 31, 2008, the management teams of Evergreen’s value-oriented equity funds tended to emphasize investments in attractively priced, fundamentally sound corporations. The portfolio manager of both Evergreen Disciplined Value Fund and Evergreen Disciplined Small-Mid Value Fund, for example, used a combination of quantitative tools and traditional fundamental analysis in reviewing opportunities among larger and smaller companies, respectively. The manager of Evergreen Equity Index Fund maintained a portfolio reflecting the composition of the Standard & Poor’s 500® Index, using a proprietary process to control trading and operational costs. Managers of Evergreen Equity Income Fund emphasized companies they believe have the ability to maintain and increase their dividends to shareholders. The managers of Evergreen Fundamental Large Cap Fund focused on larger corporations with stable earnings growth records while the managers of Evergreen Fundamental Mid Cap Value Fund, which was launched on September 28, 2007, emphasized mid-sized companies selling at what the managers believed to be reasonable valuations. The team managing Evergreen Intrinsic Value Fund sought out investments in
2
LETTER TO SHAREHOLDERS continued
established companies selling at stock prices below the managers’ estimate of the company’s intrinsic value. Meanwhile, the managers of Evergreen Small Cap Value Fund and Evergreen Special Values Fund each focused on higher-quality small companies that the managers believed to have reasonable prices and strong balance sheets.
We believe the experiences in the investment markets during the past six months have underscored the value of a well-diversified, long-term investment strategy to help soften the effects of volatility in any one market or asset class. As always, we encourage investors to maintain diversified investment portfolios in pursuit of their long-term investment goals.
Please visit us at EvergreenInvestments.com for more information about our funds and other investment products available to you. Thank you for your continued support of Evergreen Investments.
Sincerely,

Dennis H. Ferro
President and Chief Executive Officer
Evergreen Investment Company, Inc.
Special Notice to Shareholders:
Please visit our Web site at EvergreenInvestments.com for statements from President and Chief Executive Officer, Dennis Ferro, regarding the firm’s recent settlement with the Securities and Exchange Commission (SEC) and prior settlement with the Financial Industry Regulatory Authority (FINRA).
3
FUND AT A GLANCE
as of January 31, 2008
MANAGEMENT TEAM
Investment Advisor:
• Evergreen Investment Management Company, LLC
Portfolio Manager:
• James M. Tringas, CFA
CURRENT INVESTMENT STYLE
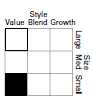
Source: Morningstar, Inc.
Morningstar’s style box is based on a portfolio date as of 12/31/2007.
The Equity style box placement is based on 10 growth and valuation measures for each fund holding and the median size of the companies in which the fund invests.
PERFORMANCE AND RETURNS
Portfolio inception date: 5/7/1993
| | | Class A | | Class B | | Class C | | Class I | | Class R |
| Class inception date | | 5/7/1993 | | 3/26/1999 | | 12/12/2000 | | 7/23/1996 | | 10/10/2003 |
|
| Nasdaq symbol | | ESPAX | | ESPBX | | ESPCX | | ESPIX | | ESPRX |
|
| 6-month return with | | | | | | | | | | |
| sales charge | | -15.54% | | -14.31% | | -11.44% | | N/A | | N/A |
|
| 6-month return w/o | | | | | | | | | | |
| sales charge | | -10.39% | | -10.68% | | -10.71% | | -10.24% | | -10.44% |
|
| Average annual return* | | | | | | | | | | |
|
| 1-year with sales charge | | -16.95% | | -16.07% | | -13.25% | | N/A | | N/A |
|
| 1-year w/o sales charge | | -11.88% | | -12.52% | | -12.54% | | -11.63% | | -12.06% |
|
| 5-year | | 13.63% | | 13.91% | | 14.16% | | 15.31% | | 14.77% |
|
| 10-year | | 9.31% | | 9.27% | | 9.40% | | 10.25% | | 9.86% |
|
| Maximum sales charge | | 5.75% | | 5.00% | | 1.00% | | N/A | | N/A |
| | | Front-end | | CDSC | | CDSC | | | | |
|
* Adjusted for maximum applicable sales charge, unless noted.
Past performance is no guarantee of future results. The performance quoted represents past performance and current performance may be lower or higher. The investment return and principal value of an investment will fluctuate so that investors’ shares, when redeemed, may be worth more or less than their original cost. To obtain performance information current to the most recent month-end for Classes A, B, C or I, please go to EvergreenInvestments.com/fundperformance. Please call 1.800.847.5397 for the most recent month-end performance information for Class R. The performance of each class may vary based on differences in loads, fees and expenses paid by the shareholders investing in each class. Performance includes the reinvestment of income dividends and capital gain distributions. Performance shown does not reflect the deduction of taxes that a shareholder would pay on fund distributions or the redemption of fund shares.
Historical performance shown for Classes A, B, C and I prior to 6/17/2002 are based on the performance of Classes A, B, C and Y of the fund’s predecessor fund, Wachovia Special Values Fund. The historical returns shown for Classes B, C and R prior to their inception is based on the performance of Class A, the original class offered. The historical returns for Classes B, C and R have not been adjusted to reflect the effect of each class’ 12b-1 fee. These fees are 0.25% for Class A, 0.50% for Class R and 1.00% for Classes B and C. Class I does not and Class Y did not pay a 12b-1 fee. If these fees had been reflected, returns for Classes B, C and R would have been lower.
The advisor is waiving a portion of its advisory fee. Had the fee not been waived, returns would have been lower. Returns reflect expense limits previously in effect for Class A, without which returns for Class A would have been lower.
4
FUND AT A GLANCE continued
LONG-TERM GROWTH
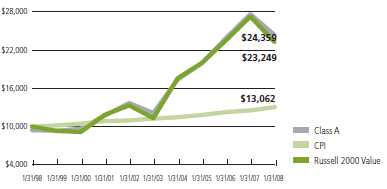
Comparison of a $10,000 investment in the Evergreen Special Values Fund Class A shares versus a similar investment in the Russell 2000 Value Index (Russell 2000 Value) and the Consumer Price Index (CPI).
The Russell 2000 Value is an unmanaged market index and does not include transaction costs associated with buying and selling securities, any mutual fund fees or expenses or any taxes. The CPI is a commonly used measure of inflation and does not represent an investment return. It is not possible to invest directly in an index.
The Fund is currently closed to new investors.
Class I shares are only offered in the following manner: (1) to investment advisory clients of Evergreen Investment Management Company, LLC (or its advisory affiliates) when purchased by such advisor(s) on behalf of its clients, (2) to certain mutual fund wrap program clients of Wachovia Securities and of third-party broker/dealers when purchased through a clearing relationship with Wachovia Securities or an affiliate providing mutual fund clearing services, (3) through arrangements entered into on behalf of the Evergreen funds with certain financial services firms, (4) to certain institutional investors, and (5) to persons who owned Class Y shares in registered name in an Evergreen fund on or before December 31, 1994 or who owned shares of any SouthTrust fund in registered name as of March 18, 2005 or who owned shares of Vestaur Securities Fund as of May 20, 2005.
Class I shares are only available to institutional shareholders with a minimum of $1 million investment, which may be waived in certain situations.
Class R shares generally are available only to 401(k) plans, 457 plans, employer-sponsored 403(b) plans, profit sharing and money purchase pension plans, defined benefit plans and non-qualified deferred compensation plans.
The fund’s investment objective may be changed without a vote of the fund’s shareholders.
Foreign investments may contain more risk due to the inherent risks associated with changing political climates, foreign market instability and foreign currency fluctuations.
The stocks of smaller companies may be more volatile than those of larger companies due to the higher risk of failure.
Value-based investments are subject to the risk that the broad market may not recognize their intrinsic value.
All data is as of January 31, 2008, and subject to change.
5
ABOUT YOUR FUND’S EXPENSES
The Example below is intended to describe the fees and expenses borne by shareholders and the impact of those costs on your investment.
Example
As a shareholder of the fund, you incur two types of costs: (1) transaction costs, including sales charges (loads), redemption fees and exchange fees; and (2) ongoing costs, including management fees, distribution (12b-1) fees and other fund expenses. This Example is intended to help you understand your ongoing costs (in dollars) of investing in the fund and to compare these costs with the ongoing costs of investing in other mutual funds. The Example is based on an investment of $1,000 invested at the beginning of the period and held for the entire period from August 1, 2007 to January 31, 2008.
The example illustrates your fund’s costs in two ways:
The section in the table under the heading “Actual” provides information about actual account values and actual expenses. You may use the information in these columns, together with the amount you invested, to estimate the expenses that you paid over the period. Simply divide your account value by $1,000 (for example, an $8,600 account value divided by $1,000 = 8.6), then multiply the result by the number in the appropriate column for your share class, in the column entitled “Expenses Paid During Period” to estimate the expenses you paid on your account during this period.
- Hypothetical example for comparison purposes
The section in the table under the heading “Hypothetical (5% return before expenses)” provides information about hypothetical account values and hypothetical expenses based on the fund’s actual expense ratio and an assumed rate of return of 5% per year before expenses, which is not the fund’s actual return. The hypothetical account values and expenses may not be used to estimate the actual ending account balance or expenses you paid for the period. You may use this information to compare the ongoing costs of investing in the fund and other funds. To do so, compare this 5% hypothetical example with the 5% hypothetical examples that appear in the shareholder reports of the other funds.
Please note that the expenses shown in the table are meant to highlight your ongoing costs only and do not reflect any transactional costs, such as sales charges (loads), redemption fees or exchange fees. Therefore, the section in the table under the heading “Hypothetical (5% return before expenses)” is useful in comparing ongoing costs only, and will not help you determine the relative total costs of owning different funds. In addition, if these transactional costs were included, your costs would have been higher.
| | | Beginning | | | | Ending | | | | |
| | | Account | | | | Account | | Expenses |
| | | Value | | | | Value | | Paid During |
| | | 8/1/2007 | | 1/31/2008 | | Period* |
|
| Actual | | | | | | | | | | |
| Class A | | $ 1,000.00 | | $ 896.06 | | $ 6.24 |
| Class B | | $ 1,000.00 | | $ 893.23 | | $ 9.80 |
| Class C | | $ 1,000.00 | | $ 892.92 | | $ 9.80 |
| Class I | | $ 1,000.00 | | $ 897.58 | | $ 5.06 |
| Class R | | $ 1,000.00 | | $ 895.63 | | $ 7.43 |
| Hypothetical | | | | | | | | | | |
| (5% return | | | | | | | | | | |
| before expenses) | | | | | | | | | | |
| Class A | | $ 1,000.00 | | $ 1,018.55 | | $ 6.65 |
| Class B | | $ 1,000.00 | | $ 1,014.78 | | $10.43 |
| Class C | | $ 1,000.00 | | $ 1,014.78 | | $10.43 |
| Class I | | $ 1,000.00 | | $ 1,019.81 | | $ 5.38 |
| Class R | | $ 1,000.00 | | $ 1,017.29 | | $ 7.91 |
|
* For each class of the Fund, expenses are equal to the annualized expense ratio of each class (1.31% for Class A, 2.06% for Class B, 2.06% for Class C, 1.06% for Class I and 1.56% for Class R), multiplied by the average account value over the period, multiplied by 184 / 366 days.
6
FINANCIAL HIGHLIGHTS
(For a share outstanding throughout each period)
| | | Six Months Ended | | Year Ended July 31, |
| | | January 31, 2008 | |
|
| CLASS A | | (unaudited) | | 2007 | | 2006 | | 2005 | | 2004 | | 2003 |
|
| Net asset value, beginning of period | | $ 27.25 | | $ 28.55 | | $ 30.03 | | $ 25.16 | | $ 20.62 | | $ 18.09 |
|
| Income from investment operations | | | | | | | | | | | | | | | | |
| Net investment income (loss) | | | | 0.06 | | 0.30 | | 0.07 | | | | 0.35 | | 0 | | (0.02) |
Net realized and unrealized gains
or losses on investments | | | | (2.67) | | 3.43 | | 1.95 | | | | 5.87 | | 4.54 | | 3.12 |
| |
|
| Total from investment operations | | | | (2.61) | | 3.73 | | 2.02 | | | | 6.22 | | 4.54 | | 3.10 |
|
| Distributions to shareholders from | | | | | | | | | | | | | | | | |
| Net investment income | | | | (0.27) | | (0.10) | | (0.21) | | | | (0.18) | | 0 | | 0 |
| Net realized gains | | | | (4.52) | | (4.93) | | (3.29) | | | | (1.17) | | 0 | | (0.57) |
| |
|
| Total distributions to shareholders | | | | (4.79) | | (5.03) | | (3.50) | | | | (1.35) | | 0 | | (0.57) |
|
| Net asset value, end of period | | $ 19.85 | | $ 27.25 | | $ 28.55 | | $ 30.03 | | $ 25.16 | | $ 20.62 |
|
| Total return1 | | | | (10.39%) | | 13.30% | | 7.82% | | | | 25.55% | | 22.02% | | 17.63% |
|
| Ratios and supplemental data | | | | | | | | | | | | | | | | |
| Net assets, end of period (thousands) | | $698,021 | | $959,305 | | $923,225 | | $1,161,899 | | $659,114 | | $375,118 |
| Ratios to average net assets | | | | | | | | | | | | | | | | |
| Expenses including waivers/reimbursements | | | | | | | | | | | | | | | | |
| but excluding expense reductions | | | | 1.31%2 | | 1.31% | | 1.31% | | | | 1.35% | | 1.37% | | 1.24% |
| Expenses excluding waivers/reimbursements | | | | | | | | | | | | | | | | |
| and expense reductions | | | | 1.35%2 | | 1.32% | | 1.34% | | | | 1.40% | | 1.45% | | 1.36% |
| Net investment income (loss) | | | | 0.65%2 | | 1.07% | | 0.33% | | | | 1.36% | | (0.01%) | | (0.13%) |
| Portfolio turnover rate | | | | 24% | | 45% | | 49% | | | | 42% | | 38% | | 45% |
|
1 Excluding applicable sales charges
2 Annualized
See Notes to Financial Statements
7
FINANCIAL HIGHLIGHTS
(For a share outstanding throughout each period)
| | | Six Months Ended | | Year Ended July 31, |
| | | January 31, 2008 | |
|
| CLASS B | | (unaudited) | | 2007 | | 2006 | | 2005 | | 2004 | | 2003 |
|
| Net asset value, beginning of period | | $ 26.17 | | $ 27.69 | | $ 29.25 | | $ 24.54 | | $ 20.26 | | $ 17.92 |
|
| Income from investment operations | | | | | | | | | | | | | | | | |
| Net investment income (loss) | | | | (0.02) | | 0.08 | | (0.13) | | | | 0.15 | | (0.16) | | (0.19)1 |
Net realized and unrealized gains
or losses on investments | | | | (2.57) | | 3.33 | | 1.86 | | | | 5.73 | | 4.44 | | 3.10 |
| |
|
| Total from investment operations | | | | (2.59) | | 3.41 | | 1.73 | | | | 5.88 | | 4.28 | | 2.91 |
|
| Distributions to shareholders from | | | | | | | | | | | | | | | | |
| Net investment income | | | | (0.06) | | 0 | | 0 | | | | 0 | | 0 | | 0 |
| Net realized gains | | | | (4.52) | | (4.93) | | (3.29) | | | | (1.17) | | 0 | | (0.57) |
| |
|
| Total distributions to shareholders | | | | (4.58) | | (4.93) | | (3.29) | | | | (1.17) | | 0 | | (0.57) |
|
| Net asset value, end of period | | $ 19.00 | | $ 26.17 | | $ 27.69 | | $ 29.25 | | $ 24.54 | | $ 20.26 |
|
| Total return2 | | | | (10.68%) | | 12.46% | | 6.94% | | | | 24.69% | | 21.13% | | 16.79% |
|
| Ratios and supplemental data�� | | | | | | | | | | | | | | | | |
| Net assets, end of period (thousands) | | $117,493 | | $163,723 | | $179,710 | | $211,594 | | $202,069 | | $159,896 |
| Ratios to average net assets | | | | | | | | | | | | | | | | |
| Expenses including waivers/reimbursements | | | | | | | | | | | | | | | | |
| but excluding expense reductions | | | | 2.06%3 | | 2.06% | | 2.06% | | | | 2.06% | | 2.06% | | 2.02% |
| Expenses excluding waivers/reimbursements | | | | | | | | | | | | | | | | |
| and expense reductions | | | | 2.10%3 | | 2.07% | | 2.09% | | | | 2.11% | | 2.14% | | 2.12% |
| Net investment income (loss) | | | | (0.09%)3 | | 0.30% | | (0.42%) | | | | 0.62% | | (0.71%) | | (0.99%) |
| Portfolio turnover rate | | | | 24% | | 45% | | 49% | | | | 42% | | 38% | | 45% |
|
1 Net investment income (loss) per share is based on average shares outstanding during the period.
2 Excluding applicable sales charges
3 Annualized
See Notes to Financial Statements
8
FINANCIAL HIGHLIGHTS
(For a share outstanding throughout each period)
| | | Six Months Ended | | Year Ended July 31, |
| | | January 31, 2008 | |
|
| CLASS C | | (unaudited) | | 2007 | | 2006 | | 2005 | | 2004 | | 2003 |
|
| Net asset value, beginning of period | | $ 26.24 | | $ 27.75 | | $ 29.30 | | $ 24.61 | | $ 20.31 | | $ 17.96 |
|
| Income from investment operations | | | | | | | | | | | | | | | | |
| Net investment income (loss) | | | | (0.03) | | 0.09 | | (0.12) | | | | 0.19 | | (0.14) | | (0.18)1 |
Net realized and unrealized gains
or losses on investments | | | | (2.56) | | 3.33 | | 1.86 | | | | 5.70 | | 4.44 | | 3.10 |
| |
|
| Total from investment operations | | | | (2.59) | | 3.42 | | 1.74 | | | | 5.89 | | 4.30 | | 2.92 |
|
| Distributions to shareholders from | | | | | | | | | | | | | | | | |
| Net investment income | | | | (0.05) | | 0 | | 0 | | | | (0.03) | | 0 | | 0 |
| Net realized gains | | | | (4.52) | | (4.93) | | (3.29) | | | | (1.17) | | 0 | | (0.57) |
| |
|
| Total distributions to shareholders | | | | (4.57) | | (4.93) | | (3.29) | | | | (1.20) | | 0 | | (0.57) |
|
| Net asset value, end of period | | $ 19.08 | | $ 26.24 | | $ 27.75 | | $ 29.30 | | $ 24.61 | | $ 20.31 |
|
| Total return2 | | | | (10.71%) | | 12.48% | | 6.97% | | | | 24.66% | | 21.17% | | 16.74% |
|
| Ratios and supplemental data | | | | | | | | | | | | | | | | |
| Net assets, end of period (thousands) | | $79,394 | | $131,213 | | $137,808 | | $151,718 | | $106,126 | | $65,833 |
| Ratios to average net assets | | | | | | | | | | | | | | | | |
| Expenses including waivers/reimbursements | | | | | | | | | | | | | | | | |
| but excluding expense reductions | | | | 2.06%3 | | 2.06% | | 2.06% | | | | 2.07% | | 2.07% | | 2.01% |
| Expenses excluding waivers/reimbursements | | | | | | | | | | | | | | | | |
| and expense reductions | | | | 2.10%3 | | 2.07% | | 2.09% | | | | 2.12% | | 2.15% | | 2.13% |
| Net investment income (loss) | | | | (0.09%)3 | | 0.31% | | (0.42%) | | | | 0.63% | | (0.71%) | | (0.95%) |
| Portfolio turnover rate | | | | 24% | | 45% | | 49% | | | | 42% | | 38% | | 45% |
|
1 Net investment income (loss) per share is based on average shares outstanding during the period.
2 Excluding applicable sales charges
3 Annualized
See Notes to Financial Statements
9
FINANCIAL HIGHLIGHTS
(For a share outstanding throughout each period)
| | | Six Months Ended | | Year Ended July 31, |
| | | January 31, 2008 | |
|
| CLASS I | | (unaudited) | | 2007 | | 2006 | | 2005 | | 2004 | | 2003 |
|
| Net asset value, beginning of period | | $ 27.46 | | $ 28.73 | | $ 30.20 | | $ 25.28 | | $ 20.66 | | $ 18.13 |
|
| Income from investment operations | | | | | | | | | | | | | | | | |
| Net investment income (loss) | | | | 0.09 | | 0.37 | | 0.15 | | | | 0.44 | | 0.07 | | 0.04 |
| Net realized and unrealized gains or losses on | | |
| investments | | | | (2.70) | | 3.47 | | 1.94 | | | | 5.90 | | 4.55 | | 3.11 |
| |
|
| Total from investment operations | | | | (2.61) | | 3.84 | | 2.09 | | | | 6.34 | | 4.62 | | 3.15 |
|
| Distributions to shareholders from | | | | | | | | | | | | | | | | |
| Net investment income | | | | (0.33) | | (0.18) | | (0.27) | | | | (0.25) | | 01 | | (0.05) |
| Net realized gains | | | | (4.52) | | (4.93) | | (3.29) | | | | (1.17) | | 0 | | (0.57) |
| |
|
| Total distributions to shareholders | | | | (4.85) | | (5.11) | | (3.56) | | | | (1.42) | | 0 | | (0.62) |
|
| Net asset value, end of period | | $ 20.00 | | $ 27.46 | | $ 28.73 | | $ 30.20 | | $ 25.28 | | $ 20.66 |
|
| Total return | | | | (10.24%) | | 13.62% | | 8.05% | | | | 25.91% | | 22.39% | | 17.89% |
|
| Ratios and supplemental data | | | | | | | | | | | | | | | | |
| Net assets, end of period (thousands) | | $801,869 | | $1,067,452 | | $1,072,390 | | $1,069,191 | | $1,002,368 | | $689,126 |
| Ratios to average net assets | | | | | | | | | | | | | | | | |
| Expenses including waivers/reimbursements | | | | | | | | | | | | | | | | |
| but excluding expense reductions | | | | 1.06%2 | | 1.06% | | 1.06% | | | | 1.06% | | 1.06% | | 0.97% |
| Expenses excluding waivers/reimbursements | | | | | | | | | | | | | | | | |
| and expense reductions | | | | 1.10%2 | | 1.07% | | 1.09% | | | | 1.11% | | 1.14% | | 1.08% |
| Net investment income (loss) | | | | 0.90%2 | | 1.32% | | 0.58% | | | | 1.64% | | 0.30% | | 0.15% |
| Portfolio turnover rate | | | | 24% | | 45% | | 49% | | | | 42% | | 38% | | 45% |
|
1 Amount represents less than $0.005 per share.
2 Annualized
See Notes to Financial Statements
10
FINANCIAL HIGHLIGHTS
(For a share outstanding throughout each period)
| | | Six Months Ended | | Year Ended July 31, |
| | | January 31, 2008 | |
|
| CLASS R | | (unaudited) | | 2007 | | 2006 | | 2005 | | 20041 |
|
| Net asset value, beginning of period | | $27.02 | | $28.36 | | $29.89 | | $25.12 | | $22.01 |
|
| Income from investment operations | | | | | | | | | | |
| Net investment income (loss) | | 0.03 | | 0.24 | | 0.032 | | 0.32 | | (0.01) |
Net realized and unrealized gains
or losses on investments | | (2.62) | | 3.39 | | 1.89 | | 5.83 | | 3.12 |
| |
|
| Total from investment operations | | (2.59) | | 3.63 | | 1.92 | | 6.15 | | 3.11 |
|
| Distributions to shareholders from | | | | | | | | | | |
| Net investment income | | (0.21) | | (0.04) | | (0.16) | | (0.21) | | 0 |
| Net realized gains | | (4.52) | | (4.93) | | (3.29) | | (1.17) | | 0 |
| |
|
| Total distributions to shareholders | | (4.73) | | (4.97) | | (3.45) | | (1.38) | | 0 |
|
| Net asset value, end of period | | $19.70 | | $27.02 | | $28.36 | | $29.89 | | $25.12 |
|
| Total return | | (10.44%) | | 13.01% | | 7.50% | | 25.32% | | 14.13% |
|
| Ratios and supplemental data | | | | | | | | | | |
| Net assets, end of period (thousands) | | $5,757 | | $7,732 | | $6,990 | | $5,928 | | $ 27 |
| Ratios to average net assets | | | | | | | | | | |
Expenses including waivers/reimbursements
but excluding expense reductions | | 1.56%3 | | 1.56% | | 1.56% | | 1.57% | | 1.61%3 |
Expenses excluding waivers/reimbursements
and expense reductions | | 1.60%3 | | 1.57% | | 1.59% | | 1.62% | | 1.69%3 |
| Net investment income (loss) | | 0.40%3 | | 0.83% | | 0.09% | | 1.11% | | (0.23%)3 |
| Portfolio turnover rate | | 24% | | 45% | | 49% | | 42% | | 38% |
|
1 For the period from October 10, 2003 (commencement of class operations), to July 31, 2004.
2 Net investment income (loss) per share is based on average shares outstanding during the period.
3 Annualized
See Notes to Financial Statements
11
SCHEDULE OF INVESTMENTS
January 31, 2008 (unaudited)
| | | Shares | | | | Value |
|
| |
| COMMON STOCKS 88.5% | | | | | | |
| CONSUMER DISCRETIONARY 12.7% | | | | | | |
| Auto Components 0.6% | | | | | | |
| Modine Manufacturing Co. | | 430,299 | | $ | | 6,643,817 |
| Superior Industries International, Inc. (p) | | 189,673 | | | | 3,455,842 |
| |
|
| | | | | | | 10,099,659 |
| |
|
| Hotels, Restaurants & Leisure 3.8% | | | | | | |
| IHOP Corp. (p) | | 206,195 | | | | 10,977,822 |
| Ruby Tuesday, Inc. (p) | | 1,693,939 | | | | 13,026,391 |
| Triarc Companies, Inc., Class A | | 1,214,841 | | | | 11,480,247 |
| Triarc Companies, Inc., Class B | | 3,097,301 | | | | 28,804,899 |
| |
|
| | | | | | | 64,289,359 |
| |
|
| Household Durables 3.2% | | | | | | |
| BLYTH, Inc. (p) | | 457,980 | | | | 9,979,384 |
| Cavco Industries, Inc. * (p) | | 302,034 | | | | 9,927,858 |
| Dixie Group, Inc. * + | | 602,447 | | | | 5,000,310 |
| Ethan Allen Interiors, Inc. (p) | | 427,689 | | | | 13,236,974 |
| Furniture Brands International, Inc. | | 456,825 | | | | 4,362,679 |
| Helen of Troy Corp. * | | 280,547 | | | | 4,769,299 |
| Tupperware Brands Corp. | | 170,723 | | | | 6,316,751 |
| |
|
| | | | | | | 53,593,255 |
| |
|
| Media 0.7% | | | | | | |
| Journal Communications, Inc., Class A (p) | | 1,513,211 | | | | 12,483,991 |
| |
|
| Specialty Retail 2.7% | | | | | | |
| Charming Shoppes, Inc. * (p) | | 695,056 | | | | 4,483,111 |
| Children’s Place Retail Stores, Inc. * (p) | | 242,000 | | | | 4,486,680 |
| Christopher & Banks Corp. | | 533,014 | | | | 6,806,589 |
| Finish Line, Inc., Class A | | 213,815 | | | | 478,946 |
| Foot Locker, Inc. | | 1,158,030 | | | | 15,853,431 |
| Zale Corp. * (p) | | 865,781 | | | | 14,198,808 |
| |
|
| | | | | | | 46,307,565 |
| |
|
| Textiles, Apparel & Luxury Goods 1.7% | | | | | | |
| Delta Apparel Co. | | 201,410 | | | | 1,792,549 |
| K-Swiss, Inc., Class A (p) | | 218,235 | | | | 3,963,147 |
| Kellwood Co. | | 441,344 | | | | 8,818,053 |
| Kenneth Cole Productions, Inc., Class A (p) | | 612,331 | | | | 10,599,450 |
| Oxford Industries, Inc. (p) | | 165,000 | | | | 3,757,050 |
| |
|
| | | | | | | 28,930,249 |
| |
|
| CONSUMER STAPLES 3.2% | | | | | | |
| Food & Staples Retailing 1.9% | | | | | | |
| Casey’s General Stores, Inc. (p) | | 1,225,229 | | | | 31,855,954 |
| |
|
See Notes to Financial Statements
12
SCHEDULE OF INVESTMENTS continued
January 31, 2008 (unaudited)
| | | | | | | Shares | | | | Value |
|
| |
| COMMON STOCKS continued | | | | | | | | |
| CONSUMER STAPLES continued | | | | | | |
| Food Products 0.6% | | | | | | | | |
| American Italian Pasta Co., Class A * (p) | | 412,701 | | $ | | 2,806,367 |
| Tootsie Roll Industries, Inc. | | | | 1 | | | | 25 |
| TreeHouse Foods, Inc. * | | | | | | 371,822 | | | | 7,759,925 |
| |
|
| | | | | | | | | | | 10,566,317 |
| |
|
| Household Products 0.4% | | | | | | | | |
| WD-40 Co. | | | | | | 212,159 | | | | 7,162,488 |
| |
|
| Personal Products 0.3% | | | | | | | | |
| Prestige Brands Holdings, Inc. * | | | | 680,060 | | | | 5,080,048 |
| |
|
| ENERGY 8.7% | | | | | | | | | | |
| Energy Equipment & Services 1.1% | | | | | | |
| Atwood Oceanics, Inc. * (p) | | | | 181,704 | | | | 15,097,785 |
| WSP Holdings, Ltd. * | | | | | | 314,800 | | | | 2,556,176 |
| |
|
| | | | | | | | | | | 17,653,961 |
| |
|
| Oil, Gas & Consumable Fuels 7.6% | | | | | | |
| BioFuel Energy Corp. * (p) | | | | 453,198 | | | | 2,932,191 |
| Forest Oil Corp. * | | | | | | 349,678 | | | | 15,812,439 |
| Mariner Energy, Inc. * (p) | | | | | | 1,445,468 | | | | 36,223,428 |
| Stone Energy Corp. * (p) | | | | | | 1,025,779 | | | | 42,056,939 |
| Venoco, Inc. * | | | | | | 76,420 | | | | 1,168,462 |
| Whiting Petroleum Corp. * | | | | 584,255 | | | | 31,397,864 |
| |
|
| | | | | | | | | | | 129,591,323 |
| |
|
| FINANCIALS 18.9% | | | | | | | | |
| Capital Markets 1.8% | | | | | | | | |
| ACA Capital Holdings, Inc. * (p) | | | | 401,664 | | | | 301,248 |
| Apollo Investment Corp. (p) | | | | 539,914 | | | | 8,195,895 |
| Knight Capital Group, Inc., Class A * | | 1,142,694 | | | | 19,140,124 |
| Westwood Holdings Group, Inc. + | | | | 85,344 | | | | 2,925,592 |
| |
|
| | | | | | | | | | | 30,562,859 |
| |
|
| Commercial Banks 5.6% | | | | | | | | |
| Amcore Financial, Inc. + | | | | 831,322 | | | | 18,430,409 |
| BancorpSouth, Inc. (p) | | | | | | 938,785 | | | | 23,019,008 |
| First Citizens Bancshares, Inc., Class A | | 287,633 | | | | 39,215,883 |
| Renasant Corp. (p) | | | | | | 179,700 | | | | 3,768,309 |
| UMB Financial Corp. | | | | | | 251,248 | | | | 10,585,078 |
| |
|
| | | | | | | | | | | 95,018,687 |
| |
|
| Consumer Finance 0.2% | | | | | | | | |
| Advance America Cash Advance Centers, Inc. | | 315,305 | | | | 2,821,980 |
| |
|
See Notes to Financial Statements
13
SCHEDULE OF INVESTMENTS continued
January 31, 2008 (unaudited)
| | | | | | | Shares | | | | Value |
|
| |
| COMMON STOCKS continued | | | | | | | | | | |
| FINANCIALS continued | | | | | | | | | | |
| Insurance 8.6% | | | | | | | | | | |
| Assured Guaranty, Ltd. (p) | | | | | | 818,937 | | $ | | 19,376,049 |
| Endurance Specialty Holdings, Ltd. (p) | | | | | | 892,513 | | | | 36,164,627 |
| Hilb, Rogal & Hobbs Co. (p) | | | | | | 864,528 | | | | 31,278,623 |
| IPC Holdings, Ltd. | | | | | | 862,982 | | | | 22,204,527 |
| Stewart Information Services Corp. | | | | | | 1,081,024 | | | | 37,003,452 |
| |
|
| | | | | | | | | | | 146,027,278 |
| |
|
| Real Estate Investment Trusts 0.6% | | | | | | | | |
| Deerfield Capital Corp. (p) | | | | | | 1,233,853 | | | | 9,858,485 |
| |
|
| Real Estate Management & Development 0.5% | | | | | | |
| Forest City Enterprises, Inc., Class A (p) | | | | | | 240,941 | | | | 9,601,499 |
| |
|
| Thrifts & Mortgage Finance 1.6% | | | | | | | | | | |
| BankAtlantic Bancorp, Inc., Class A | | | | | | 529,246 | | | | 2,990,240 |
| NewAlliance Bancshares, Inc. (p) | | | | | | 2,012,593 | | | | 24,754,894 |
| |
|
| | | | | | | | | | | 27,745,134 |
| |
|
| HEALTH CARE 2.3% | | | | | | | | | | |
| Health Care Equipment & Supplies 0.6% | | | | | | | | |
| Edwards Lifesciences Corp. * | | | | | | 174,058 | | | | 8,053,664 |
| Syneron Medical, Ltd. * | | | | | | 97,095 | | | | 1,477,786 |
| |
|
| | | | | | | | | | | 9,531,450 |
| |
|
| Health Care Providers & Services 0.7% | | | | | | | | |
| AMN Healthcare Services, Inc. * | | | | | | 523,104 | | | | 8,170,884 |
| Cross Country Healthcare, Inc. * | | | | | | 278,054 | | | | 3,511,822 |
| |
|
| | | | | | | | | | | 11,682,706 |
| |
|
| Life Sciences Tools & Services 0.6% | | | | | | | | |
| Cambrex Corp. | | | | | | 1,156,255 | | | | 10,984,422 |
| |
|
| Pharmaceuticals 0.4% | | | | | | | | | | |
| Alpharma, Inc., Class A (p) | | | | | | 351,434 | | | | 7,211,426 |
| |
|
| INDUSTRIALS 16.8% | | | | | | | | | | |
| Aerospace & Defense 1.0% | | | | | | | | | | |
| GenCorp, Inc. * (p) | | | | | | 1,398,814 | | | | 16,422,076 |
| |
|
| Building Products 0.5% | | | | | | | | | | |
| Apogee Enterprises, Inc. | | | | | | 464,916 | | | | 8,112,784 |
| Simpson Manufacturing Co. (p) | | | | | | 43,105 | | | | 1,187,543 |
| |
|
| | | | | | | | | | | 9,300,327 |
| |
|
| Commercial Services & Supplies 3.4% | | | | | | | | |
| Deluxe Corp. | | | | | | 233,373 | | | | 5,675,632 |
| Heidrick & Struggles International, Inc. | | | | | | 452,763 | | | | 12,441,927 |
| Kelly Services, Inc., Class A | | | | | | 288,841 | | | | 4,973,842 |
| Korn/Ferry International * | | | | | | 727,935 | | | | 11,712,474 |
| Viad Corp. | | | | | | 854,243 | | | | 22,851,000 |
| |
|
| | | | | | | | | | | 57,654,875 |
| |
|
See Notes to Financial Statements
14
SCHEDULE OF INVESTMENTS continued
January 31, 2008 (unaudited)
| | | | | | | Shares | | | | Value |
|
| |
| COMMON STOCKS continued | | | | | | | | |
| INDUSTRIALS continued | | | | | | | | | | |
| Electrical Equipment 1.3% | | | | | | | | | | |
| EnerSys, Inc. * | | | | | | 78,220 | | $ | | 1,802,189 |
| Franklin Electric Co., Inc. (p) | | | | | | 251,995 | | | | 9,485,092 |
| Superior Essex, Inc. * | | | | | | 443,510 | | | | 10,666,415 |
| |
|
| | | | | | | | | | | 21,953,696 |
| |
|
| Machinery 7.0% | | | | | | | | | | |
| Briggs & Stratton Corp. (p) | | | | | | 501,258 | | | | 10,451,229 |
| Crane Co. | | | | | | 262,355 | | | | 10,722,449 |
| EnPro Industries, Inc. * (p) | | | | | | 305,782 | | | | 9,173,460 |
| Gardner Denver, Inc. * | | | | | | 402,500 | | | | 13,057,100 |
| Kadant, Inc. * + | | | | | | 1,016,949 | | | | 26,877,962 |
| Mueller Industries, Inc. | | | | | | 1,663,841 | | | | 46,587,548 |
| Xerium Technologies, Inc. | | | | | | 318,419 | | | | 1,515,675 |
| |
|
| | | | | | | | | | | 118,385,423 |
| |
|
| Marine 0.7% | | | | | | | | | | |
| Horizon Lines, Inc., Class A (p) | | | | | | 670,397 | | | | 12,596,760 |
| |
|
| Road & Rail 2.4% | | | | | | | | | | |
| Arkansas Best Corp. (p) | | | | | | 556,708 | | | | 17,141,039 |
| Dollar Thrifty Automotive Group, Inc. * | | | | 476,003 | | | | 11,619,233 |
| Werner Enterprises, Inc. (p) | | | | | | 620,497 | | | | 12,639,524 |
| |
|
| | | | | | | | | | | 41,399,796 |
| |
|
| Trading Companies & Distributors 0.5% | | | | | | |
| NuCo2, Inc. * (p) | | | | | | 311,660 | | | | 8,791,929 |
| |
|
| INFORMATION TECHNOLOGY 12.2% | | | | | | |
| Communications Equipment 1.0% | | | | | | | | |
| Avocent Corp. * | | | | | | 196,306 | | | | 3,258,679 |
| Black Box Corp. (p) | | | | | | 308,247 | | | | 10,252,295 |
| CommScope, Inc. * | | | | | | 95,539 | | | | 4,237,155 |
| |
|
| | | | | | | | | | | 17,748,129 |
| |
|
| Computers & Peripherals 4.9% | | | | | | | | |
| Adaptec, Inc. * | | | | | | 3,440,268 | | | | 10,733,636 |
| Electronics for Imaging, Inc. * | | | | | | 619,171 | | | | 9,138,964 |
| Imation Corp. | | | | | | 1,964,965 | | | | 50,912,243 |
| Quantum Corp. * | | | | | | 3,710,968 | | | | 8,535,227 |
| Silicon Graphics, Inc. * (p) | | | | | | 205,239 | | | | 4,299,757 |
| |
|
| | | | | | | | | | | 83,619,827 |
| |
|
| Electronic Equipment & Instruments 2.4% | | | | | | |
| AVX Corp. | | | | | | 744,995 | | | | 9,707,285 |
| Coherent, Inc. * | | | | | | 259,081 | | | | 6,736,106 |
| Insight Enterprises, Inc. * | | | | | | 149,528 | | | | 2,582,349 |
| Kemet Corp. * (p) | | | | | | 762,283 | | | | 3,971,494 |
See Notes to Financial Statements
15
SCHEDULE OF INVESTMENTS continued
January 31, 2008 (unaudited)
| | | | | Shares | | | | Value |
|
| |
| COMMON STOCKS continued | | | | | | | | |
| INFORMATION TECHNOLOGY continued | | | | | | | | |
| Electronic Equipment & Instruments continued | | | | | | |
| Orbotech, Ltd. * | | | | 801,194 | | $ | | 13,732,465 |
| Technitrol, Inc. | | | | 190,616 | | | | 4,319,359 |
| |
|
| | | | | | | | | 41,049,058 |
| |
|
| IT Services 0.2% | | | | | | | | |
| Gevity HR, Inc. | | | | 421,940 | | | | 2,962,019 |
| |
|
| Semiconductors & Semiconductor Equipment 2.6% | | | | | | |
| Cabot Microelectronics Corp. * (p) | | | | 295,536 | | | | 10,219,635 |
| Cirrus Logic, Inc. | | | | 58,173 | | | | 239,964 |
| Conexant Systems, Inc. * | | | | 1,764,600 | | | | 1,217,574 |
| Cymer, Inc. * | | | | 28,862 | | | | 779,563 |
| DSP Group, Inc. * | | | | 689,409 | | | | 7,893,733 |
| Exar Corp. * | | | | 868,069 | | | | 7,126,846 |
| Lattice Semiconductor Corp. * | | | | 2,108,918 | | | | 5,588,633 |
| Standard Microsystems Corp. * (p) | | | | 136,528 | | | | 4,084,918 |
| Teradyne, Inc. * | | | | 320,460 | | | | 3,515,446 |
| Trident Microsystems, Inc. * | | | | 387,678 | | | | 1,950,020 |
| Zoran Corp. * | | | | 164,239 | | | | 1,938,020 |
| |
|
| | | | | | | | | 44,554,352 |
| |
|
| Software 1.1% | | | | | | | | |
| Borland Software Corp. * (p) | | | | 1,148,397 | | | | 2,870,992 |
| Corel Corp. * | | | | 776,340 | | | | 5,775,970 |
| Novell, Inc. * | | | | 1,507,459 | | | | 9,587,439 |
| |
|
| | | | | | | | | 18,234,401 |
| |
|
| MATERIALS 9.1% | | | | | | | | |
| Chemicals 1.6% | | | | | | | | |
| A. Schulman, Inc. | | | | 608,978 | | | | 12,417,061 |
| American Pacific Corp. * + | | | | 360,844 | | | | 5,380,184 |
| Arch Chemicals, Inc. (p) | | | | 293,835 | | | | 9,893,425 |
| |
|
| | | | | | | | | 27,690,670 |
| |
|
| Containers & Packaging 1.3% | | | | | | | | |
| Owens-Illinois, Inc. * | | | | 229,400 | | | | 11,561,760 |
| Packaging Corporation of America (p) | | | | 426,022 | | | | 10,326,774 |
| |
|
| | | | | | | | | 21,888,534 |
| |
|
| Metals & Mining 3.3% | | | | | | | | |
| Quanex Corp. (p) | | | | 1,078,481 | | | | 56,523,189 |
| |
|
| Paper & Forest Products 2.9% | | | | | | | | |
| Glatfelter | | | | 587,197 | | | | 8,490,869 |
| Neenah Paper, Inc. (p) | | | | 957,621 | | | | 25,951,529 |
| Schweitzer-Mauduit International, Inc. | | | | 624,203 | | | | 14,880,999 |
| |
|
| | | | | | | | | 49,323,397 |
| |
|
See Notes to Financial Statements
16
SCHEDULE OF INVESTMENTS continued
January 31, 2008 (unaudited)
| | | | | Shares | | | | Value |
|
| COMMON STOCKS continued | | | | | | |
| TELECOMMUNICATION SERVICES 0.2% | | | | | | |
| Diversified Telecommunication Services 0.2% | | | | | | |
| Citizens Communications Co. | | | | 310,586 | | $ | | 3,562,421 |
| |
|
| UTILITIES 4.4% | | | | | | | | |
| Electric Utilities 3.5% | | | | | | | | |
| Allete, Inc. (p) | | | | 996,292 | | | | 38,347,279 |
| El Paso Electric Co. * (p) | | | | 877,512 | | | | 20,560,106 |
| |
|
| | | | | | | | | 58,907,385 |
| |
|
| Gas Utilities 0.9% | | | | | | | | |
| Atmos Energy Corp. (p) | | | | 551,758 | | | | 15,846,490 |
| |
|
| Total Common Stocks (cost $1,603,865,050) | | | | | | 1,507,074,849 |
| |
|
| EXCHANGE TRADED FUNDS 3.5% | | | | | | |
| iShares Russell 2000 Index Fund (p) | | 161,212 | | | | 11,426,706 |
| iShares Russell 2000 Value Index Fund (p) | | 710,701 | | | | 48,128,672 |
| |
|
| Total Exchange Traded Funds (cost $63,862,724) | | | | | | 59,555,378 |
| | |
|
|
| | | | | Principal | | | | |
| | | | | Amount | | | | Value |
|
| |
| SHORT-TERM INVESTMENTS 28.9% | | | | | | |
| CERTIFICATES OF DEPOSIT 0.9% | | | | | | |
| Credit Industries, 3.90%, 03/20/2008 (pp) | | $ 9,000,000 | | | | 9,003,222 |
| Unicredito Italiano SpA, 4.86%, 05/06/2008 (pp) | | 6,500,000 | | | | 6,496,854 |
| |
|
| | | | | | | | | 15,500,076 |
| |
|
| COMMERCIAL PAPER 0.7% | | | | | | |
| Cheyne Finance, LLC, FRN, SIV, 3.17%, 05/19/2008 (pp) + (h) • | | 15,000,000 | | | | 11,933,051 |
| |
|
| CORPORATE BONDS 5.6% | | | | | | | | |
| Capital Markets 0.5% | | | | | | | | |
| Citigroup Global Markets, Inc., 3.25%, 02/01/2008 (pp) | | 9,000,000 | | | | 9,000,000 |
| |
|
| Consumer Finance 2.7% | | | | | | | | |
| Beta Finance, Inc., FRN, SIV, 3.20%, 07/18/2008 (pp) + | | 20,000,000 | | | | 19,853,300 |
| Cortland Capital, LLC, FRN, SIV, 3.18%, 04/10/2008 (pp) + | | 10,000,000 | | | | 9,973,400 |
| Toyota Motor Credit Corp., FRN, 3.30%, 05/08/2008 (pp) | | 5,000,000 | | | | 4,997,860 |
| White Pine Finance, LLC, FRN, SIV, 4.19%, 03/17/2008 (pp) + | | 10,000,000 | | | | 9,977,930 |
| |
|
| | | | | | | | | 44,802,490 |
| |
|
| Diversified Financial Services 2.4% | | | | | | |
| Bank of America Corp., FRN, 3.18%, 06/13/2008 (pp) | | 10,000,000 | | | | 10,003,470 |
| Natixis Corp., FRN, 3.18%, 02/11/2008 (pp) | | 10,000,000 | | | | 9,999,860 |
| Premier Asset Collateralized Entity, LLC, FRN, SIV, 4.22%, 05/15/2008 (pp) + | | 11,000,000 | | | | 10,969,200 |
| Sigma Finance, Inc., FRN, SIV, 3.09%, 06/16/2008 (pp) + | | 10,000,000 | | | | 9,925,100 |
| |
|
| | | | | | | | | 40,897,630 |
| |
|
See Notes to Financial Statements
17
SCHEDULE OF INVESTMENTS continued
January 31, 2008 (unaudited)
| | | | | Principal | | | | |
| | | | | Amount | | | | Value |
|
| |
| SHORT-TERM INVESTMENTS continued | | | | | | |
| REPURCHASE AGREEMENTS ^ 13.8% | | | | | | |
| ABN AMRO, Inc., 3.21%, dated 01/31/2008, maturing 02/01/2008, maturity value | | | | | | |
| $24,002,140 (pp) | | | | $ 24,000,000 | | $ | | 24,000,000 |
| Bank of America Securities, LLC, 3.20%, dated 01/31/2008, maturing 02/01/2008, | | | | | | |
| maturity value $35,003,111 (pp) | | 35,000,000 | | | | 35,000,000 |
| Bear Stearns & Co., Inc., 3.23%, dated 01/31/2008, maturing 02/01/2008, | | | | | | |
| maturity value $16,001,436 (pp) | | 16,000,000 | | | | 16,000,000 |
| BNP Paribas SA, 3.21%, dated 01/31/2008, maturing 02/01/2008, maturity value | | | | | | |
| $2,000,178 (pp) | | | | 2,000,000 | | | | 2,000,000 |
| Cantor Fitzgerald & Co., 3.30%, dated 01/31/2008, maturing 02/01/2008, | | | | | | |
| maturity value $25,002,292 (pp) | | 25,000,000 | | | | 25,000,000 |
| Credit Suisse First Boston, LLC, 3.21%, dated 01/31/2008, maturing 02/01/2008, | | | | | | |
| maturity value $25,002,229 (pp) | | 25,000,000 | | | | 25,000,000 |
| Deutsche Bank Securities, Inc.,3.21%, dated 01/31/2008, maturing 02/01/2008, | | | | | | |
| maturity value $14,001,248 (pp) | | 14,000,000 | | | | 14,000,000 |
| Dresdner Kleinwort Wasserstein Securities, LLC, 3.21%, dated 01/31/2008, | | | | | | |
| maturing 02/01/2008, maturity value $15,001,338 (pp) | | 15,000,000 | | | | 15,000,000 |
| Greenwich Capital Markets, Inc., 3.21%, dated 01/31/2008, maturing 02/01/2008, | | | | | | |
| maturity value $18,001,605 (pp) | | 18,000,000 | | | | 18,000,000 |
| JPMorgan Securities, Inc., 3.20%, dated 01/31/2008, maturing 02/01/2008, | | | | | | |
| maturity value $25,002,222 (pp) | | 25,000,000 | | | | 25,000,000 |
| Lehman Brothers, Inc., 3.20%, dated 01/31/2008, maturing 02/01/2008, maturity | | | | | | |
| value $14,001,244 (pp) | | | | 14,000,000 | | | | 14,000,000 |
| Merrill Lynch Pierce Fenner & Smith, Inc., 3.20%, dated 01/31/2008, maturing | | | | | | |
| 02/01/2008, maturity value $22,001,956 (pp) | | 22,000,000 | | | | 22,000,000 |
| |
|
| | | | | | | | | 235,000,000 |
| |
|
| YANKEE OBLIGATIONS - CORPORATE 0.6% | | | | | | |
| Commercial Banks 0.6% | | | | | | | | |
| BNP Paribas SA, FRN, 3.10%, 02/22/2008 (pp) | | 10,000,000 | | | | 9,999,590 |
| | |
|
|
| | | | | Shares | | | | Value |
|
| |
| MUTUAL FUND SHARES 7.3% | | | | | | |
| AIM Short-Term Investment Trust Government & Agency Portfolio, Class I, | | | | | | |
| 3.72% (pp) q | | | | 1,433,957 | | | | 1,433,957 |
| Evergreen Institutional Money Market Fund, Class I, 4.31% q ø | | 123,215,410 | | | | 123,215,410 |
| |
|
| | | | | | | | | 124,649,367 |
| |
|
| Total Short-Term Investments (cost $495,147,514) | | | | | | 491,782,204 |
| |
|
| Total Investments (cost $2,162,875,288) 120.9% | | | | | | 2,058,412,431 |
| Other Assets and Liabilities (20.9%) | | | | | | (355,878,171) |
| |
|
| Net Assets 100.0% | | | | | | $ 1,702,534,260 |
| |
|
See Notes to Financial Statements
18
SCHEDULE OF INVESTMENTS continued
January 31, 2008 (unaudited)
| (p) | | All or a portion of this security is on loan. |
| * | | Non-income producing security |
| + | | Security is deemed illiquid and is valued using market quotations when readily available, unless otherwise noted. |
| (pp) | | All or a portion of this security represents investment of cash collateral received from securities on loan. |
| (h) | | Security is valued at fair value as determined by the investment advisor in good faith, according to procedures approved |
| | | by the Board of Trustees. |
| • | | Security which has defaulted on payment of interest and/or principal. The Fund has stopped accruing interest on this |
| | | security. |
| ^ | | Collateral is pooled with the collateral of other Evergreen funds and allocated on a pro-rata basis into 163 issues of |
| | | high grade short-term securities such that sufficient collateral is applied to the respective repurchase agreement. |
| q | | Rate shown is the 7-day annualized yield at period end. |
| ø | | Evergreen Investment Management Company, LLC is the investment advisor to both the Fund and the money market |
| | | fund. |
| Summary of Abbreviations |
| FRN | | Floating Rate Note |
| SIV | | Structured Investment Vehicles |
The following table shows the percent of total long-term investments by sector as of January 31, 2008:
| Financials | | 20.5% |
| Industrials | | 18.3% |
| Consumer Discretionary | | 13.8% |
| Information Technology | | 13.3% |
| Materials | | 9.9% |
| Energy | | 9.4% |
| Utilities | | 4.8% |
| Consumer Staples | | 3.5% |
| Health Care | | 2.5% |
| Telecommunication Services | | 0.2% |
| Other | | 3.8% |
| |
|
| | | 100.0% |
| | |
|
See Notes to Financial Statements
19
STATEMENT OF ASSETS AND LIABILITIES
January 31, 2008 (unaudited)
| Assets | | | | |
| Investments in securities, at value (cost $1,804,659,878) including $367,371,907 | | | | |
| of securities loaned | | $ | | 1,700,197,021 |
| Investments in repurchase agreements, at value (cost $235,000,000) | | | | 235,000,000 |
| Investments in affiliated money market fund, at value (cost $123,215,410) | | | | 123,215,410 |
|
| Total investments | | | | 2,058,412,431 |
| Receivable for securities sold | | | | 17,878,386 |
| Receivable for Fund shares sold | | | | 5,642,773 |
| Dividends receivable | | | | 848,780 |
| Receivable for securities lending income | | | | 216,394 |
| Prepaid expenses and other assets | | | | 21,848 |
|
| Total assets | | | | 2,083,020,612 |
|
| Liabilities | | | | |
| Payable for securities purchased | | | | 2,655,708 |
| Payable for Fund shares redeemed | | | | 5,619,718 |
| Payable for securities on loan | | | | 371,932,104 |
| Advisory fee payable | | | | 31,512 |
| Distribution Plan expenses payable | | | | 9,956 |
| Due to other related parties | | | | 47,171 |
| Accrued expenses and other liabilities | | | | 190,183 |
|
| Total liabilities | | | | 380,486,352 |
|
| Net assets | | $ | | 1,702,534,260 |
|
| Net assets represented by | | | | |
| Paid-in capital | | $ | | 1,793,728,865 |
| Undistributed net investment income | | | | 157,242 |
| Accumulated net realized gains on investments | | | | 13,111,010 |
| Net unrealized losses on investments | | | | (104,462,857) |
|
| Total net assets | | $ | | 1,702,534,260 |
|
| Net assets consists of | | | | |
| Class A | | $ | | 698,021,414 |
| Class B | | | | 117,493,133 |
| Class C | | | | 79,393,759 |
| Class I | | | | 801,869,013 |
| Class R | | | | 5,756,941 |
|
| Total net assets | | $ | | 1,702,534,260 |
|
| Shares outstanding (unlimited number of shares authorized) | | | | |
| Class A | | | | 35,156,179 |
| Class B | | | | 6,183,168 |
| Class C | | | | 4,161,932 |
| Class I | | | | 40,084,761 |
| Class R | | | | 292,248 |
|
| Net asset value per share | | | | |
| Class A | | $ | | 19.85 |
| Class A— Offering price (based on sales charge of 5.75%) | | $ | | 21.06 |
| Class B | | $ | | 19.00 |
| Class C | | $ | | 19.08 |
| Class I | | $ | | 20.00 |
| Class R | | $ | | 19.70 |
|
See Notes to Financial Statements
20
STATEMENT OF OPERATIONS
Six Months Ended January 31, 2008 (unaudited)
| Investment income | | | | |
| Dividends | | $ | | 15,676,317 |
| Income from affiliate | | | | 2,787,295 |
| Securities lending | | | | 1,698,707 |
|
| Total investment income | | | | 20,162,319 |
|
| Expenses | | | | |
| Advisory fee | | | | 8,071,321 |
| Distribution Plan expenses | | | | |
| Class A | | | | 1,068,927 |
| Class B | | | | 722,577 |
| Class C | | | | 551,809 |
| Class R | | | | 17,617 |
| Administrative services fee | | | | 1,024,602 |
| Transfer agent fees | | | | 1,708,376 |
| Trustees’ fees and expenses | | | | 20,658 |
| Printing and postage expenses | | | | 96,122 |
| Custodian and accounting fees | | | | 270,488 |
| Registration and filing fees | | | | 27,621 |
| Professional fees | | | | 49,979 |
| Other | | | | 26,361 |
|
| Total expenses | | | | 13,656,458 |
| Less: Expense reductions | | | | (57,458) |
| Fee waivers | | | | (371,078) |
|
| Net expenses | | | | 13,227,922 |
|
| Net investment income | | | | 6,934,397 |
|
| Net realized and unrealized gains or losses on investments | | | | |
| Net realized gains on investments | | | | 69,680,991 |
| Net change in unrealized gains or losses on investments | | | | (294,299,490) |
|
| Net realized and unrealized gains or losses on investments | | | | (224,618,499) |
|
| Net decrease in net assets resulting from operations | | $ | | (217,684,102) |
|
See Notes to Financial Statements
21
STATEMENTS OF CHANGES IN NET ASSETS
| | | Six Months Ended | | | | |
| | | January 31, 2008 | | Year Ended |
| | | (unaudited) | | July 31, 2007 |
|
| Operations | | | | | | | | |
| Net investment income | | $ | | 6,934,397 | | $ | | 26,982,867 |
| Net realized gains on investments | | | | 69,680,991 | | | | 396,115,412 |
| Net change in unrealized gains or | | | | | | | | |
| losses on investments | | | | (294,299,490) | | | | (112,375,522) |
|
| Net increase (decrease) in net assets | | | | | | | | |
| resulting from operations | | | | (217,684,102) | | | | 310,722,757 |
|
| Distributions to shareholders from | | | | | | | | |
| Net investment income | | | | | | | | |
| Class A | | | | (9,958,633) | | | | (3,754,846) |
| Class B | | | | (409,364) | | | | 0 |
| Class C | | | | (224,396) | | | | 0 |
| Class I | | | | (13,513,724) | | | | (7,252,380) |
| Class R | | | | (65,026) | | | | (12,022) |
| Net realized gains | | | | | | | | |
| Class A | | | | (144,060,915) | | | | (157,437,138) |
| Class B | | | | (25,609,881) | | | | (30,313,852) |
| Class C | | | | (19,260,967) | | | | (23,657,403) |
| Class I | | | | (158,062,068) | | | | (179,101,506) |
| Class R | | | | (1,179,159) | | | | (1,161,420) |
|
| Total distributions to shareholders | | | | (372,344,133) | | | | (402,690,567) |
|
| | | Shares | | | | Shares | | |
| Capital share transactions | | | | | | | | |
| Proceeds from shares sold | | | | | | | | |
| Class A | | 2,380,948 | | 54,674,354 | | 5,902,093 | | 168,072,944 |
| Class B | | 69,644 | | 1,525,735 | | 161,410 | | 4,389,045 |
| Class C | | 167,253 | | 3,447,797 | | 257,074 | | 6,905,677 |
| Class I | | 5,012,794 | | 117,767,323 | | 8,129,152 | | 233,486,496 |
| Class R | | 34,494 | | 749,881 | | 61,530 | | 1,721,789 |
|
| | | | | 178,165,090 | | | | 414,575,951 |
|
| Net asset value of shares issued in | | | | | | | | |
| reinvestment of distributions | | | | | | | | |
| Class A | | 6,858,428 | | 144,328,255 | | 5,632,329 | | 152,126,906 |
| Class B | | 1,193,467 | | 23,877,477 | | 1,065,022 | | 27,669,283 |
| Class C | | 781,578 | | 15,684,550 | | 725,716 | | 18,897,581 |
| Class I | | 6,593,901 | | 140,148,123 | | 5,090,146 | | 138,668,076 |
| Class R | | 50,435 | | 1,050,139 | | 36,422 | | 975,196 |
|
| | | | | 325,088,544 | | | | 338,337,042 |
|
| Automatic conversion of Class B | | | | | | | | |
| shares to Class A shares | | | | | | | | |
| Class A | | 116,980 | | 2,861,510 | | 250,219 | | 7,148,072 |
| Class B | | (122,127) | | (2,861,510) | | (259,428) | | (7,148,072) |
|
| | | | | 0 | | | | 0 |
|
| Payment for shares redeemed | | | | | | | | |
| Class A | | (9,407,798) | | (217,950,214) | | (8,918,960) | | (254,766,289) |
| Class B | | (1,212,802) | | (26,775,063) | | (1,200,969) | | (33,135,880) |
| Class C | | (1,788,255) | | (39,629,837) | | (947,665) | | (26,128,872) |
| Class I | | (10,399,788) | | (253,966,535) | | (11,664,769) | | (335,944,923) |
| Class R | | (78,820) | | (1,794,609) | | (58,299) | | (1,668,349) |
|
| | | | | (540,116,258) | | | | (651,644,313) |
|
See Notes to Financial Statements
22
STATEMENTS OF CHANGES IN NET ASSETS continued
| | | Six Months Ended | | | | |
| | | January 31, 2008 | | Year Ended |
| | | (unaudited) | | July 31, 2007 |
|
| Capital share transactions | | | | | | | | |
| continued | | | | | | | | |
| Net increase (decrease) in net assets | | | | | | | | |
| resulting from capital share | | | | | | | | |
| transactions | | $ | | (36,862,624) | | $ | | 101,268,680 |
|
| Total increase (decrease) in net assets | | | | (626,890,859) | | | | 9,300,870 |
| Net assets | | | | | | | | |
| Beginning of period | | | | 2,329,425,119 | | | | 2,320,124,249 |
|
| End of period | | $ | | 1,702,534,260 | | $ | | 2,329,425,119 |
|
| Undistributed net investment income | | $ | | 157,242 | | $ | | 17,393,988 |
|
See Notes to Financial Statements
23
NOTES TO FINANCIAL STATEMENTS (unaudited)
1. ORGANIZATION
Evergreen Special Values Fund (the “Fund”) is a diversified series of Evergreen Equity Trust (the “Trust”), a Delaware statutory trust organized on September 18, 1997. The Trust is an open-end management investment company registered under the Investment Company Act of 1940, as amended (the “1940 Act”).
Currently, shares of the Fund are only available for purchase by existing shareholders holding accounts directly with the Fund or through certain financial intermediaries, retirement plans or plan providers.
The Fund offers Class A, Class B, Class C, Class I and Class R shares. Class A shares are sold with a front-end sales charge. However, Class A share investments of $1 million or more are not subject to a front-end sales charge but are subject to a contingent deferred sales charge of 1.00% upon redemption within 18 months. Class B shares are sold without a front-end sales charge but are subject to a contingent deferred sales charge that is payable upon redemption and decreases depending on how long the shares have been held. Class C shares are sold without a front-end sales charge but are subject to a contingent deferred sales charge that is payable upon redemption within one year. Class I shares are sold without a front-end sales charge or contingent deferred sales charge. Class R shares are only available to participants in certain retirement plans and are sold without a front-end sales charge or contingent deferred sales charge. Each class of shares, except Class I shares, pays an ongoing distribution fee.
2. SIGNIFICANT ACCOUNTING POLICIES
The following is a summary of significant accounting policies consistently followed by the Fund in the preparation of its financial statements. The policies are in conformity with generally accepted accounting principles in the United States of America, which require management to make estimates and assumptions that affect amounts reported herein. Actual results could differ from these estimates.
a. Valuation of investments
Listed equity securities are usually valued at the last sales price or official closing price on the national securities exchange where the securities are principally traded.
Portfolio debt securities acquired with more than 60 days to maturity are fair valued using matrix pricing methods determined by an independent pricing service which takes into consideration such factors as similar security prices, yields, maturities, liquidity and ratings. Securities for which valuations are not readily available from an independent pricing service may be valued by brokers which use prices provided by market makers or estimates of market value obtained from yield data relating to investments or securities with similar characteristics.
Short-term securities with remaining maturities of 60 days or less at the time of purchase are valued at amortized cost, which approximates market value.
24
NOTES TO FINANCIAL STATEMENTS (unaudited) continued
Investments in open-end mutual funds are valued at net asset value. Securities for which market quotations are not readily available or not reflective of current market value are valued at fair value as determined by the investment advisor in good faith, according to procedures approved by the Board of Trustees.
b. Repurchase agreements
Securities pledged as collateral for repurchase agreements are held by the custodian bank or in a segregated account in the Fund’s name until the agreements mature. Collateral for certain tri-party repurchase agreements is held at the counterparty’s custodian in a segregated account for the benefit of the Fund and the counterparty. Each agreement requires that the market value of the collateral be sufficient to cover payments of interest and principal. However, in the event of default or bankruptcy by the other party to the agreement, retention of the collateral may be subject to legal proceedings. The Fund will enter into repurchase agreements with banks and other financial institutions, which are deemed by the investment advisor to be creditworthy pursuant to guidelines established by the Board of Trustees. In certain instances, the Fund’s securities lending agent may provide collateral in the form of repurchase agreements.
c. Securities lending
The Fund may lend its securities to certain qualified brokers in order to earn additional income. The Fund receives compensation in the form of fees or interest earned on the investment of any cash collateral received. The Fund also continues to receive interest and dividends on the securities loaned. The Fund receives collateral in the form of cash or securities with a market value at least equal to the market value of the securities on loan. In the event of default or bankruptcy by the borrower, the Fund could experience delays and costs in recovering the loaned securities or in gaining access to the collateral. The Fund has the right under the lending agreement to recover the securities from the borrower on demand.
d. Security transactions and investment income
Security transactions are recorded on trade date. Realized gains and losses are computed using the specific cost of the security sold. Dividend income is recorded on the ex-dividend.
e. Federal taxes
The Fund intends to continue to qualify as a regulated investment company and distribute all of its taxable income, including any net capital gains (which have already been offset by available capital loss carryovers). Accordingly, no provision for federal taxes is required.
f. Distributions
Distributions to shareholders from net investment income and net realized gains, if any, are recorded on the ex-dividend date. Such distributions are determined in conformity with income tax regulations, which may differ from generally accepted accounting principles.
25
NOTES TO FINANCIAL STATEMENTS (unaudited) continued
g. Class allocations
Income, common expenses and realized and unrealized gains and losses are allocated to the classes based on the relative net assets of each class. Distribution fees, if any, are calculated daily at the class level based on the appropriate net assets of each class and the specific expense rates applicable to each class.
3. ADVISORY FEE AND OTHER TRANSACTIONS WITH AFFILIATES
Evergreen Investment Management Company, LLC (“EIMC”), an indirect, wholly-owned subsidiary of Wachovia Corporation (“Wachovia”), is the investment advisor to the Fund and is paid an annual fee starting at 0.80% and declining to 0.75% as the aggregate average daily net assets of the Fund and its variable annuity counterpart, Evergreen VA Special Values Fund, increase. For the six months ended January 31, 2008, the advisory fee was equivalent to 0.78% of the Fund’s average daily net assets (on an annualized basis).
From time to time, EIMC may voluntarily or contractually waive its fee and/or reimburse expenses in order to limit operating expenses. During the six months ended January 31, 2008, EIMC voluntarily waived its advisory fee in the amount of $371,078.
The Fund may invest in money market funds which are advised by EIMC. Income earned on these investments is included in income from affiliate on the Statement of Operations.
Effective January 1, 2008, EIMC replaced Evergreen Investment Services, Inc. (“EIS”), an indirect, wholly-owned subsidiary of Wachovia, as the administrator to the Fund upon the assignment of the Fund’s Administrative Services Agreement from EIS to EIMC. There were no changes to the services being provided or fees being paid by the Fund. The administrator provides the Fund with facilities, equipment and personnel and is paid an annual rate determined by applying percentage rates to the aggregate average daily net assets of the Evergreen funds (excluding money market funds and Evergreen Institutional Enhanced Income Fund), starting at 0.10% and declining to 0.05% as the aggregate average daily net assets of the Evergreen funds (excluding money market funds and Evergreen Institutional Enhanced Income Fund) increase.
Evergreen Service Company, LLC (“ESC”), an indirect, wholly-owned subsidiary of Wachovia, is the transfer and dividend disbursing agent for the Fund. ESC receives account fees that vary based on the type of account held by the shareholders in the Fund. For the six months ended January 31, 2008, the transfer agent fees were equivalent to an annual rate of 0.17% of the Fund’s average daily net assets.
Wachovia Bank NA, through its securities lending division of Wachovia Global Securities Lending, acts as the securities lending agent for the Fund.
The Fund has placed a portion of its portfolio transactions with brokerage firms that are affiliates of Wachovia. During the six months ended January 31, 2008, the Fund paid brokerage commissions of $161,556 to Wachovia Securities, LLC.
26
NOTES TO FINANCIAL STATEMENTS (unaudited) continued
4. DISTRIBUTION PLANS
EIS serves as distributor of the Fund’s shares. The Fund has adopted Distribution Plans, as allowed by Rule 12b-1 of the 1940 Act, for each class of shares, except Class I. Under the Distribution Plans, distribution fees are paid at an annual rate of 0.25% of the average daily net assets for Class A shares, 0.50% of the average daily net assets for Class R shares and 1.00% of the average daily net assets for each of Class B and Class C shares.
For the six months ended January 31, 2008, EIS received $4,573 from the sale of Class A shares and $1,193, $136,717 and $3,365 in contingent deferred sales charges from redemptions of Class A, Class B and Class C shares, respectively.
5. INVESTMENT TRANSACTIONS
Cost of purchases and proceeds from sales of investment securities (excluding short-term securities) were $457,645,925 and $824,094,029, respectively, for the six months ended January 31, 2008.
During the six months ended January 31, 2008, the Fund loaned securities to certain brokers. At January 31, 2008, the value of securities on loan and the total amount of collateral received for securities loaned amounted to $367,371,907and $371,932,104, respectively.
On January 31, 2008, the aggregate cost of securities for federal income tax purposes was $2,165,352,586. The gross unrealized appreciation and depreciation on securities based on tax cost was $152,248,649 and $259,188,804, respectively, with a net unrealized depreciation of $106,940,155.
6. INTERFUND LENDING
Pursuant to an Exemptive Order issued by the SEC, the Fund may participate in an interfund lending program with certain funds in the Evergreen fund family. This program allows the Fund to borrow from, or lend money to, other participating funds. During the six months ended January 31, 2008, the Fund did not participate in the interfund lending program.
7. EXPENSE REDUCTIONS
Through expense offset arrangements with ESC and the Fund’s custodian, a portion of fund expenses has been reduced.
8. DEFERRED TRUSTEES’ FEES
Each Trustee of the Fund may defer any or all compensation related to performance of his or her duties as a Trustee. The Trustees’ deferred balances are allocated to deferral accounts, which are included in the accrued expenses for the Fund. The investment performance of the deferral accounts is based on the investment performance of certain Evergreen funds. Any gains earned or losses incurred in the deferral accounts are reported in the Fund’s Trustees’ fees and expenses. At the election of the Trustees, the deferral account will be paid either in one lump sum or in quarterly installments for up to ten years.
27
NOTES TO FINANCIAL STATEMENTS (unaudited) continued
9. FINANCING AGREEMENT
The Fund and certain other Evergreen funds share in an unsecured revolving credit commitment for temporary and emergency purposes, including the funding of redemptions, as permitted by each participating fund’s borrowing restrictions. Borrowings under this facility bear interest at 0.50% per annum above the Federal Funds rate. All of the participating funds are charged an annual commitment fee on the unused balance, which is allocated pro rata. The credit facility is for $100 million with an annual commitment fee of 0.08%. During the six months ended January 31, 2008, the Fund had no borrowings.
10. REGULATORY MATTERS AND LEGAL PROCEEDINGS
Pursuant to an administrative order issued by the SEC on September 19, 2007, EIMC, EIS, ESC (collectively, the “Evergreen Entities”), Wachovia Securities, LLC and the SEC have entered into an agreement settling allegations of (i) improper short-term trading arrangements in effect prior to May 2003 involving former officers and employees of EIMC and certain broker-dealers, (ii) insufficient systems for monitoring exchanges and enforcing exchange limitations as stated in certain funds’ prospectuses, and (iii) inadequate e-mail retention practices. Under the settlement, the Evergreen Entities were censured and paid approximately $32 million in disgorgement and penalties. This amount, along with a fine assessed by the SEC against Wachovia Securities, LLC will be distributed pursuant to a plan to be developed by an independent distribution consultant and approved by the SEC. The Evergreen Entities neither admitted nor denied the allegations and findings set forth in its settlement with the SEC.
In addition, the Evergreen funds and EIMC and certain of its affiliates are involved in various legal actions, including private litigation and class action lawsuits. EIMC does not expect that any of such legal actions currently pending or threatened will have a material adverse impact on the financial position or operations of any of the Evergreen funds or on EIMC’s ability to provide services to the Evergreen funds.
Although EIMC believes that none of the matters discussed above will have a material adverse impact on the Evergreen funds, there can be no assurance that these matters and any publicity surrounding or resulting from them will not result in reduced sales or increased redemptions of Evergreen fund shares, which could increase Evergreen fund transaction costs or operating expenses, or that they will not have other adverse consequences on the Evergreen funds.
11. NEW ACCOUNTING PRONOUNCEMENTS
In June 2006, the Financial Accounting Standards Board (“FASB”) issued FASB Interpretation No. 48, Accounting for Uncertainty in Income Taxes — an interpretation of FASB statement 109 (“FIN 48”). FIN 48 supplements FASB 109 by prescribing a recognition threshold and measurement attribute for the financial statement recognition and measurement of a tax position taken or expected to be taken in a tax return. The Fund’s financial statements have not been impacted
28
NOTES TO FINANCIAL STATEMENTS (unaudited) continued
by the adoption of FIN 48. However, the conclusions regarding FIN 48 may be subject to review and adjustment at a later date based on factors including, but not limited to, further implementation guidance expected from FASB, and on-going analysis of tax laws, regulations, and interpretations thereof.
In September 2006, FASB issued Statement of Financial Accounting Standards No. 157, Fair Value Measurements (“FAS 157”). FAS 157 establishes a single authoritative definition of fair value, establishes a framework for measuring fair value and expands disclosures about fair value measurements. FAS 157 applies to fair value measurements already required or permitted by existing standards. The change to current generally accepted accounting principles from the application of FAS 157 relates to the definition of fair value, the methods used to measure fair value, and the expanded disclosures about fair value measurements. Management of the Fund does not believe the adoption of FAS 157 will materially impact the financial statement amounts, however, additional disclosures may be required about the inputs used to develop the measurements and the effect of certain of the measurements on changes in net assets for the period. FAS 157 is effective for financial statements issued for fiscal years beginning after November 15, 2007 and interim periods within those fiscal years.
29
ADDITIONAL INFORMATION (unaudited)
INFORMATION ABOUT THE REVIEW AND APPROVAL OF THE FUND’S INVESTMENT ADVISORY AGREEMENT
Each year, the Fund’s Board of Trustees is required to consider whether to continue in place the Fund’s investment advisory agreement. In September 2007, the Trustees, including a majority of the Trustees who are not interested persons (as that term is defined in the 1940 Act) of the Fund or of EIMC, approved the continuation of the Fund’s investment advisory agreement. (References below to the “Fund” are to Evergreen Special Values Fund; references to the “funds” are to the Evergreen funds generally.)
At the same time, the Trustees considered the continuation of the investment advisory agreements for all of the funds, and the description below refers in many cases to the Trustees’ process and conclusions in connection with their consideration of this matter for all of the funds. (See “Certain Fund-Specific Considerations” below for a discussion regarding certain factors considered by the Trustees relating specifically to the Fund.) In all of its deliberations, the Board of Trustees and the disinterested Trustees were advised by independent counsel to the disinterested Trustees and counsel to the funds.
The review process. The 1940 Act requires that the Board of Trustees request and evaluate, and that EIMC and any sub-advisors furnish, such information as may reasonably be necessary to evaluate the terms of a fund’s advisory agreement. The review process began at the time of the last advisory contract-renewal process in September 2006. In the course of that process, the Trustees identified a number of funds that had experienced either short-term or longer-term performance issues. During the following months, the Trustees reviewed information relating to any changes in the performance of those funds and/or any changes in the investment process or the investment teams responsible for the management of the funds. In addition, during the course of the year, the Trustees reviewed information regarding the investment performance of all of the funds and identified additional funds that they believed warranted further attention based on performance since September 2006.
In spring 2007, a committee of the Board of Trustees (the “Committee”), working with EIMC management, determined generally the types of information the Board would review and set a timeline detailing the information required and the dates for its delivery to the Trustees. The independent data provider Keil Fiduciary Strategies LLC (“Keil”) was engaged to provide fund-specific and industry-wide data to the Board containing information of a nature and in a format generally prescribed by the Committee, and the Committee worked with Keil and EIMC to develop appropriate groups of peer funds for each fund. The Committee also identified a number of expense, performance, and other issues and requested specific information as to those issues.
The Trustees reviewed, with the assistance of an independent industry consultant retained by the disinterested Trustees, the information provided by EIMC in response to the Committee’s requests and the information provided by Keil. The Trustees formed small committees to review individual funds in greater detail. In addition, the Trustees requested information regarding,
30
ADDITIONAL INFORMATION (unaudited) continued
among other things, brokerage practices of the funds, the use of derivatives by the funds, strategic planning for the funds, analyst and research support available to the portfolio management teams, and information regarding the various fall-out benefits received directly and indirectly by EIMC and its affiliates from the funds. The Trustees requested and received additional information following that review.
The Committee met several times by telephone to consider the information provided by EIMC. The Committee met with representatives of EIMC in early September. At a meeting of the full Board of Trustees later in September, the Committee reported the results of its discussions with EIMC, and the full Board met with representatives of EIMC, engaged in further review of the materials provided to them, and approved the continuation of each of the advisory and sub-advisory agreements.
The disinterested Trustees discussed the continuation of the funds’ advisory agreements with representatives of EIMC and in multiple private sessions with legal counsel at which no personnel of EIMC were present. In considering the continuation of the agreement, the Trustees did not identify any particular information or consideration that was all-important or controlling, and each Trustee attributed different weights to various factors. The Trustees evaluated information provided to them both in terms of the Evergreen mutual funds generally and with respect to each fund, including the Fund, specifically as they considered appropriate; although the Trustees considered the continuation of the agreement as part of the larger process of considering the continuation of the advisory contracts for all of the funds, their determination to continue the advisory agreement for each of the funds was ultimately made on a fund-by-fund basis.
This summary describes a number of the most important, but not necessarily all, of the factors considered by the Board and the disinterested Trustees.
Information reviewed. The Board of Trustees and committees of the Board of Trustees meet periodically during the course of the year. At those meetings, the Board receives a wide variety of information regarding the services performed by EIMC, the investment performance of the funds, and other aspects of the business and operations of the funds. At those meetings, and in the process of considering the continuation of the agreements, the Trustees considered information regarding, for example, the funds’ investment results; the portfolio management teams for the funds and the experience of the members of those teams, and any recent changes in the membership of the teams; portfolio trading practices; compliance by the funds and EIMC with applicable laws and regulations and with the funds’ and EIMC’s compliance policies and procedures; risk evaluation and oversight procedures at EIMC; services provided by affiliates of EIMC to the funds and shareholders of the funds; and other information relating to the nature, extent, and quality of services provided by EIMC. The Trustees considered a number of changes in portfolio management personnel at EIMC and its advisory affiliates in the year since September 2006, and recent changes in compliance personnel at EIMC, including the appointment of a new Chief Compliance Officer for the funds.
31
ADDITIONAL INFORMATION (unaudited) continued
The Trustees considered the rates at which the funds pay investment advisory fees, and the efforts generally by EIMC and its affiliates as sponsors of the funds. The data provided by Keil showed the management fees paid by each fund in comparison to the management fees of other peer mutual funds, in addition to data regarding the investment performance of the funds in comparison to other peer mutual funds. The Trustees were assisted by the independent industry consultant in reviewing the information presented to them.
The Trustees considered the transfer agency fees paid by the funds to an affiliate of EIMC. They reviewed information presented to them showing that the transfer agency fees charged to the funds were generally consistent with industry norms.
The Trustees also considered that EIS, an affiliate of EIMC, serves as administrator to the funds and receives a fee for its services as administrator. In their comparison of the advisory fee paid by the funds with those paid by other mutual funds, the Trustees took into account administrative fees paid by the funds and those other mutual funds. The Board considered that EIS serves as distributor to the funds generally and receives fees from the funds for those services. They considered other so-called “fall-out” benefits to EIMC and its affiliates due to their other relationships with the funds, including, for example, soft-dollar services received by EIMC attributable to transactions entered into by EIMC for the benefit of the funds and brokerage commissions received by Wachovia Securities, LLC, an affiliate of EIMC, from transactions effected by it for the funds. The Trustees also noted that the funds pay sub-transfer agency fees to various financial institutions who hold fund shares in omnibus accounts, and that Wachovia Securities, LLC and its affiliates receive such payments from the funds in respect of client accounts they hold in omnibus arrangements, and that an affiliate of EIMC receives fees for administering the sub-transfer agency payment program. They also considered that Wachovia Securities, LLC and its affiliates receive distribution-related fees and shareholder servicing payments (including amounts derived from payments under the funds’ Rule 12b-1 plans) in respect of shares sold or held through it. The Trustees also noted that an affiliate of EIMC receives compensation for serving as a securities lending agent for the funds.
Nature and quality of the services provided. The Trustees considered that EIMC and its affili-ates generally provide a comprehensive investment management service to the funds. They noted that EIMC makes its personnel available to serve as officers of the funds, and concluded that the reporting and management functions provided by EIMC with respect to the funds were generally satisfactory. The Trustees considered the investment philosophy of the Fund’s portfolio management team, and considered the in-house research capabilities of EIMC and its affiliates, as well as other resources available to EIMC, including research services available to it from third parties. The Board considered the managerial and financial resources available to EIMC and its affiliates, and the commitment that the Wachovia organization has made to the funds generally. On the basis of these factors, they determined that the nature and scope of the services provided by EIMC were consistent with its duties under the investment advisory agreements and appropriate and consistent with the investment programs and best interests of the funds.
32
ADDITIONAL INFORMATION (unaudited) continued
The Trustees noted the resources EIMC and its affiliates have committed to the regulatory, compliance, accounting, tax and oversight of tax reporting, and shareholder servicing functions, and the number and quality of staff committed to those functions, which they concluded were appropriate and generally in line with EIMC’s responsibilities to the Fund and to the funds generally. The Board and the disinterested Trustees concluded, within the context of their overall conclusions regarding the funds’ advisory agreements, that they were generally satisfied with the nature, extent, and quality of the services provided by EIMC, including services provided by EIS under its administrative services agreements with the funds.
Investment performance. The Trustees considered the investment performance of each fund, both by comparison to other comparable mutual funds and to broad market indices. The Trustees emphasized that the continuation of the investment advisory agreement for a fund should not be taken as any indication that the Trustees did not believe investment performance for any specific fund might not be improved, and they noted that they would continue to monitor closely the investment performance of the funds going forward.
Advisory and administrative fees. The Trustees recognized that EIMC does not seek to provide the lowest cost investment advisory service, but to provide a high quality, full-service investment management product at a reasonable price. They also noted that EIMC has in many cases sought to set its investment advisory fees at levels consistent with industry norms. The Trustees noted that, in certain cases, a fund’s management fees were higher than many or most other mutual funds in the same Keil peer group. However, in each case, the Trustees determined on the basis of the information presented that the level of management fees was not excessive.
Certain Fund-specific considerations. The Trustees noted that, for the one- and five-year periods ended December 31, 2006, the Fund’s Class A shares had underperformed the Fund’s benchmark index, the Russell 2000 Value Index, but that, for the three- and ten-year periods ended December 31, 2006, the Fund’s Class A shares had outperformed the Fund’s benchmark index. The Trustees noted that for the one-, three-, five-, and ten-year periods ended December 31, 2006, the Fund’s Class A shares had outperformed a majority of the mutual funds against which the Trustees compared the Fund’s performance.
The Trustees noted that the management fee paid by the Fund was near but higher than the average management fee of the other mutual funds against which the Trustees compared the Fund’s management fee and that the level of profitability realized by EIMC in respect of the fee did not appear excessive.
The Trustees considered information regarding the rates at which other clients pay advisory fees to EIMC or its affiliates for advisory services that are comparable to the advisory services they provide to the Fund. Fees charged by EIMC to those other clients were generally lower than those charged to the Fund. EIMC explained that compliance, reporting, and other legal burdens of providing investment advice to mutual funds generally exceed those required to provide advisory services to non-mutual fund clients such as retirement or pension plans. In addition, EIMC pointed out that there is substantially greater legal and other risk to EIMC and its affiliates from
33
ADDITIONAL INFORMATION (unaudited) continued
managing public mutual funds than in managing private accounts. The Trustees also considered the investment performance of those other accounts managed by EIMC and its affiliates, and concluded that the performance of those accounts did not reflect any substantial difference in the quality of the service provided by EIMC and its affiliates to those accounts.
Economies of scale. The Trustees noted that economies of scale would likely be achieved by EIMC in managing the funds as the funds grow. The Trustees noted that the Fund had implemented breakpoints in its advisory fee structure. The Trustees noted that they would continue to review the appropriate levels of breakpoints in the future, but concluded that the breakpoints as implemented appeared to be a reasonable step toward the realization of economies of scale by the Fund.
Profitability. The Trustees considered information provided to them regarding the profitability to the EIMC organization of the investment advisory, administration, and transfer agency (with respect to the open-end funds only) fees paid to EIMC and its affiliates by each of the funds. They considered that the information provided to them was necessarily estimated, and that the profitability information provided to them, especially on a fund-by-fund basis, did not necessarily provide a definitive tool for evaluating the appropriateness of each fund’s advisory fee. They noted that the levels of profitability of the funds to EIMC varied widely, depending on among other things the size and type of fund. They considered the profitability of the funds in light of such factors as, for example, the information they had received regarding the relation of the fees paid by the funds to those paid by other mutual funds, the investment performance of the funds, and the amount of revenues involved. In light of these factors, the Trustees concluded that the profitability of any of the funds, individually or in the aggregate, should not prevent the Trustees from approving the continuation of the agreements.
34
This page left intentionally blank
35
TRUSTEES AND OFFICERS
TRUSTEES1
| Charles A. Austin III | | Investment Counselor, Anchor Capital Advisors, LLC. (investment advice); Director, The Andover |
| Trustee | | Companies (insurance); Trustee, Arthritis Foundation of New England; Former Director, The |
| DOB: 10/23/1934 | | Francis Ouimet Society (scholarship program); Former Director, Executive Vice President and |
| Term of office since: 1991 | | Treasurer, State Street Research & Management Company (investment advice) |
| Other directorships: None | | |
|
| K. Dun Gifford | | Chairman and President, Oldways Preservation and Exchange Trust (education); Trustee, |
| Trustee | | Chairman of the Finance Committee, Member of the Executive Committee, and Former |
| DOB: 10/23/1938 | | Treasurer, Cambridge College |
| Term of office since: 1974 | | |
| Other directorships: None | | |
|
| Dr. Leroy Keith, Jr. | | Managing Director, Almanac Capital Management (commodities firm); Trustee, Phoenix |
| Trustee | | Fund Complex; Director, Diversapack Co. (packaging company); Former Partner, Stonington |
| DOB: 2/14/1939 | | Partners, Inc. (private equity fund); Former Director, Obagi Medical Products Co.; Former |
| Term of office since: 1983 | | Director, Lincoln Educational Services |
| Other directorships: Trustee, | | |
| Phoenix Fund Complex (consisting | | |
| of 53 portfolios as of 12/31/2007) | | |
|
| Carol A. Kosel1 | | Former Consultant to the Evergreen Boards of Trustees; Former Vice President and Senior Vice |
| Trustee | | President, Evergreen Investments, Inc.; Former Treasurer, Evergreen Funds; Former Treasurer, |
| DOB: 12/25/1963 | | Vestaur Securities Fund |
| Term of office since: 2008 | | |
| Other directorships: None | | |
|
| Gerald M. McDonnell | | Former Manager of Commercial Operations, CMC Steel (steel producer) |
| Trustee | | |
| DOB: 7/14/1939 | | |
| Term of office since: 1988 | | |
| Other directorships: None | | |
|
| Patricia B. Norris | | President and Director of Buckleys of Kezar Lake, Inc. (real estate company); Former President |
| Trustee | | and Director of Phillips Pond Homes Association (home community); Former Partner, |
| DOB: 4/9/1948 | | PricewaterhouseCoopers, LLP (independent registered public accounting firm) |
| Term of office since: 2006 | | |
| Other directorships: None | | |
|
| William Walt Pettit | | Partner and Vice President, Kellam & Pettit, P.A. (law firm); Director, Superior Packaging Corp. |
| Trustee | | (packaging company); Member, Superior Land, LLC (real estate holding company), Member, |
| DOB: 8/26/1955 | | K&P Development, LLC (real estate development); Former Director, National Kidney Foundation |
| Term of office since: 1988 | | of North Carolina, Inc. (non-profit organization) |
| Other directorships: None | | |
|
| David M. Richardson | | President, Richardson, Runden LLC (executive recruitment advisory services); Director, J&M |
| Trustee | | Cumming Paper Co. (paper merchandising); Trustee, NDI Technologies, LLP (communications); |
| DOB: 9/19/1941 | | Former Consultant, AESC (The Association of Executive Search Consultants) |
| Term of office since: 1982 | | |
| Other directorships: None | | |
|
| Dr. Russell A. Salton III | | President/CEO, AccessOne MedCard, Inc. |
| Trustee | | |
| DOB: 6/2/1947 | | |
| Term of office since: 1984 | | |
| Other directorships: None | | |
|
36
TRUSTEES AND OFFICERS continued
| Michael S. Scofield | | Retired Attorney, Law Offices of Michael S. Scofield; Former Director and Chairman, Branded |
| Trustee | | Media Corporation (multi-media branding company) |
| DOB: 2/20/1943 | | |
| Term of office since: 1984 | | |
| Other directorships: None | | |
|
| Richard J. Shima | | Independent Consultant; Director, Hartford Hospital; Trustee, Greater Hartford YMCA; Former |
| Trustee | | Director, Trust Company of CT; Former Director, Old State House Association; Former Trustee, |
| DOB: 8/11/1939 | | Saint Joseph College (CT) |
| Term of office since: 1993 | | |
| Other directorships: None | | |
|
| Richard K. Wagoner, CFA2 | | Member and Former President, North Carolina Securities Traders Association; Member, Financial |
| Trustee | | Analysts Society |
| DOB: 12/12/1937 | | |
| Term of office since: 1999 | | |
| Other directorships: None | | |
|
| OFFICERS | | |
| Dennis H. Ferro3 | | Principal occupations: President and Chief Executive Officer, Evergreen Investment Company, |
| President | | Inc. and Executive Vice President, Wachovia Bank, N.A.; former Chief Investment Officer, |
| DOB: 6/20/1945 | | Evergreen Investment Company, Inc. |
| Term of office since: 2003 | | |
|
| Jeremy DePalma4 | | Principal occupations: Senior Vice President, Evergreen Investment Management Company, LLC; |
| Treasurer | | Former Vice President, Evergreen Investment Services, Inc.; Former Assistant Vice President, |
| DOB: 2/5/1974 | | Evergreen Investment Services, Inc. |
| Term of office since: 2005 | | |
|
| Michael H. Koonce4 | | Principal occupations: Senior Vice President and General Counsel, Evergreen Investment |
| Secretary | | Services, Inc.; Secretary, Senior Vice President and General Counsel, Evergreen Investment |
| DOB: 4/20/1960 | | Management Company, LLC and Evergreen Service Company, LLC; Senior Vice President and |
| Term of office since: 2000 | | Assistant General Counsel, Wachovia Corporation |
|
| Robert Guerin4 | | Principal occupations: Chief Compliance Officer, Evergreen Funds and Senior Vice President of |
| Chief Compliance Officer | | Evergreen Investments Co, Inc; Former Managing Director and Senior Compliance Officer, |
| DOB: 9/20/1965 | | Babson Capital Management LLC; Former Principal and Director, Compliance and Risk |
| Term of office since: 2007 | | Management, State Street Global Advisors; Former Vice President and Manager, Sales Practice |
| | | Compliance, Deutsche Asset Management. |
|
1 Each Trustee, except Mses. Kosel and Norris, serves until a successor is duly elected or qualified or until his or her death, resignation, retirement or removal from office. As new Trustees, Ms. Kosel’s and Ms. Norris’ initial terms end December 31, 2010 and June 30, 2009, respectively, at which times they may be re-elected by Trustees to serve until a successor is duly elected or qualified or until her death, resignation, retirement or removal from office by the Trustees. Each Trustee, except Ms. Kosel, oversaw 93 Evergreen funds as of December 31, 2007. Ms. Kosel became a Trustee on January 1, 2008. Correspondence for each Trustee may be sent to Evergreen Board of Trustees, P.O. Box 20083, Charlotte, NC 28202.
2 Mr. Wagoner is an “interested person” of the Fund because of his ownership of shares in Wachovia Corporation, the parent to the Fund’s investment advisor.
3 The address of the Officer is 401 S. Tryon Street, 20th Floor, Charlotte, NC 28288.
4 The address of the Officer is 200 Berkeley Street, Boston, MA 02116.
Additional information about the Fund’s Board of Trustees and Officers can be found in the Statement of Additional Information (SAI) and is available upon request without charge by calling 800.343.2898.
37
562796 rv5 03/2008
Item 2 - Code of Ethics
Not required for this semi-annual filing.
Item 3 - Audit Committee Financial Expert
Not required for this semi-annual filing.
Items 4 – Principal Accountant Fees and Services
Not required for this semi-annual filing.
Items 5 – Audit Committee of Listed Registrants
Not applicable.
Item 6 – Schedule of Investments
Please see schedule of investments contained in the Report to Stockholders included under Item 1 of this Form N-CSR.
Item 7 – Disclosure of Proxy Voting Policies and Procedures for Closed-End Management Investment Companies.
Not applicable.
Item 8 – Portfolio Managers of Closed-End Management Investment Companies.
Not applicable.
Item 9 – Purchases of Equity Securities by Closed-End Management Investment Company and Affiliated Purchasers.
Not applicable.
Item 10 – Submission of Matters to a Vote of Security Holders
There have been no material changes to the procedures by which shareholders may recommend nominees to the Registrant’s board of trustees that have been implemented since the Registrant last provided disclosure in response to the requirements of this Item.
Item 11 - Controls and Procedures
(a) The Registrant's principal executive officer and principal financial officer have evaluated the Registrant's disclosure controls and procedures (as defined in Rule 30a-3(c) under the Investment Company Act of 1940) within 90 days of this filing and have concluded that the Registrant's disclosure controls and procedures were effective, as of that date, in ensuring that information required to be disclosed by the Registrant in this Form N-CSR was recorded, processed, summarized, and reported timely.
(b) There has been no changes in the Registrant's internal controls over financial reporting (as defined in Rule 30a-3(d) under the Investment Company Act of 1940) that occurred during the second fiscal quarter of the period covered by this report that has materially affected, or is reasonable likely to affect, the Registrant’s internal control over financial reporting .
Item 12 - Exhibits
File the exhibits listed below as part of this Form. Letter or number the exhibits in the sequence indicated.
(a) Any code of ethics, or amendment thereto, that is the subject of the disclosure required by Item 2, to the extent that the Registrant intends to satisfy the Item 2 requirements through filing of an exhibit.
(b)(1) Separate certifications for the Registrant's principal executive officer and principal financial officer, as required by Section 302 of the Sarbanes-Oxley Act of 2002 and Rule 30a-2(a) under the Investment Company Act of 1940, are attached as EX99.CERT.
(b)(2) Separate certifications for the Registrant's principal executive officer and principal financial officer, as required by Section 1350 of Title 18 of United States Code, as adopted pursuant to Section 906 of the Sarbanes-Oxley Act of 2002, and Rule 30a-2(b) under the Investment Company Act of 1940, are attached as EX99.906CERT. The certifications furnished pursuant to this paragraph are not deemed to be "filed" for purposes of Section 18 of the Securities Exchange Act of 1934, or otherwise subject to the liability of that section. Such certifications are not deemed to be incorporated by reference into any filing under the Securities Act of 1933 or the Securities Exchange Act of 1934, except to the extent that the Registrant specifically incorporates them by reference.
Pursuant to the requirements of the Securities Exchange Act of 1934 and the Investment Company Act of 1940, the Registrant has duly caused this report to be signed on its behalf by the undersigned, thereunto duly authorized.
Evergreen Equity Trust
By: _______________________
Dennis H. Ferro,
Principal Executive Officer
Date: March 30, 2008
Pursuant to the requirements of the Securities Exchange Act of 1934 and the Investment Company Act of 1940, this report has been signed below by the following persons on behalf of the Registrant and in the capacities and on the dates indicated.
By: _______________________
Dennis H. Ferro,
Principal Executive Officer
Date: March 30, 2008
By: ________________________
Jeremy DePalma
Principal Financial Officer
Date: March 30, 2008