| OMB APPROVAL |
OMB Number: 3235-0570 Expires: September 30, 2007 Estimated average burden hours per response: 19.4 |
UNITED STATES
SECURITIES AND EXCHANGE COMMISSION
Washington, D.C. 20549
FORM N-CSRS
CERTIFIED SHAREHOLDER REPORT OF REGISTERED MANAGEMENT INVESTMENT COMPANIES
Investment Company Act file number 811-08413
Evergreen Equity Trust
_____________________________________________________________
(Exact name of registrant as specified in charter)
200 Berkeley Street Boston, Massachusetts 02116
_____________________________________________________________
(Address of principal executive offices) (Zip code)
Michael H. Koonce, Esq. 200 Berkeley Street Boston, Massachusetts 02116
____________________________________________________________
(Name and address of agent for service)
Registrant's telephone number, including area code: (617) 210-3200
Date of fiscal year end: Registrant is making a semi-annual filing for three of its series, Evergreen Market Index Fund, Evergreen Market Index Growth Fund and Evergreen Market Index Value Fund for the six months ended November 30, 2007. These three series have a May 31 fiscal year end.
Date of reporting period: November 30, 2007
Item 1 - Reports to Stockholders.
Evergreen Market Index Funds

This semiannual report must be preceded or accompanied by a prospectus of the Evergreen funds contained herein. The prospectus contains more complete information, including fees and expenses, and should be read carefully before investing or sending money.
Each fund will file its complete schedule of portfolio holdings with the SEC for the first and third quarters of each fiscal year onForm N-Q. Each fund's Form N-Q will be available on the SEC’s Web site at http://www.sec.gov. In addition, each fund's Form N-Q may be reviewed and copied at the SEC’s Public Reference Room in Washington, D.C. Information on the operation of the Public Reference Room may be obtained by calling 800.SEC.0330.
A description of each fund's proxy voting policies and procedures, as well as information regarding how each fund voted proxies relating to portfolio securities during the most recent 12-month period ended June 30, is available by visiting our Web site at EvergreenInvestments.com or by visiting the SEC’s Web site at http://www.sec.gov. Each fund's proxy voting policies and procedures are also available without charge, upon request, by calling 800.343.2898.
| Mutual Funds: | | | | |
| NOT FDIC INSURED | | MAY LOSE VALUE | | NOT BANK GUARANTEED |
Evergreen InvestmentsSM is a service mark of Evergreen Investment Management Company, LLC.
Copyright 2008, Evergreen Investment Management Company, LLC.
Evergreen Investment Management Company, LLC is a subsidiary of Wachovia Corporation and is an affiliate of Wachovia Corporation's other Broker Dealer Subsidiaries.
Evergreen mutual funds are distributed by Evergreen Investment Services, Inc.
200 Berkeley Street, Boston, MA 02116
LETTER TO SHAREHOLDERS JANUARY 2008
Dear Shareholder,
We are pleased to provide the Semiannual Report for Evergreen Market Index Funds for the six-month period ended November 30, 2007.
Equity investors in the U.S. faced an increasingly challenging environment during the six-month period as fears grew about the overall economic effects of weakness in the housing industry and a widening credit crisis that began with the meltdown of the subprime mortgage market. Stock prices were volatile throughout the period, but the major market indexes appeared to bounce back from several early setbacks before falling sharply in the final month of the period. As worries grew about the slowing of the nation’s economic expansion and a deceleration of corporate profit growth, large cap stocks tended to be preferred over smaller cap stocks, while growth stocks maintained a performance edge over value stocks. Foreign equity markets also became more volatile during the period, despite evidence of persistently solid growth in most economies outside the U.S. In the domestic fixed-income market, Treasury prices rose as their yields declined in a general flight to quality. Investors sought to avoid credit risk, and yield spreads between Treasuries and high-yield corporate bonds widened as corporate bonds, in general, fell out of favor.
The U.S. economy appeared to maintain its growth path early in the six-month period, with robust export activity and healthy business investment spending offsetting declines in residential home values. Despite the credit crisis and the housing slump, U.S. Gross Domestic Product grew by approximately 4.0% from April through September. However, the economy slowed noticeably as the period progressed. The combination of mortgage-related weakness, higher energy prices and tighter lending standards limited both consumer spending and business investment in the closing months of the period, helping prompt the Federal Reserve Board to begin adding liquidity to the nation’s financial system. Operating earnings of companies in the S&P 500 Index declined for the third quarter of the year, principally because of massive write-downs by major corporations, most notably in the financials sector.
During the six-month period, the portfolio manager of Evergreen’s three market index funds continued to implement quantitative-based methodologies intended to produce results consistent with underlying stock market indexes of each portfolio. Evergreen Market Index Fund, for example, is designed to reflect the results of the Standard & Poor’s 500 Index, a benchmark for the overall stock market. Evergreen Market Index Growth Fund is designed to reflect the performance of the Russell 1000 Growth Index, a standard for large cap growth stocks, while Evergreen Market Index Value Fund is intended to be in line with the Russell 1000 Value Index, which reflects the performance of large cap value stocks.
We believe the experiences in the investment markets during the past six months have underscored the value of a well diversified, long-term investment strategy to help soften the effects of volatility in any one market or asset class. As always, we encourage investors to maintain diversified investment portfolios in pursuit of their long-term investment goals.
Please visit us at EvergreenInvestments.com for more information about our funds and other investment products available to you. Thank you for your continued support of Evergreen Investments.
Sincerely,

Dennis H. Ferro
President and Chief Executive Officer
Evergreen Investment Company, Inc.
Special Notice to Shareholders:
Please visit our Web site at EvergreenInvestments.com for statements from President and Chief Executive Officer, Dennis Ferro, regarding the firm’s recent settlement with the Securities and Exchange Commission (SEC) and prior settlement with the National Association of Securities Dealers (NASD).
Market Index Fund
FUND AT A GLANCE
as of November 30, 2007
MANAGEMENT TEAM
Investment Advisor:
Evergreen Investment Management Company, LLC
Portfolio Manager:
William E. Zieff
CURRENT INVESTMENT STYLE
Morningstar Style Box
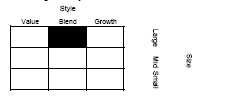
Source: Morningstar, Inc.
Morningstar’s style box is based on a portfolio date as of 9/30/2007.
The Equity style box placement is based on 10 growth and valuation measures for each fund holding and the median size of the companies in which the fund invests.
PERFORMANCE AND RETURNS
Portfolio inception date: 10/15/2002
| | | Class I |
| Class inception date | | 10/15/2002 |
| 6-month return | | -2.35% |
| Average annual return | | |
| 1-year | | 7.72% |
| 5-year | | 11.60% |
| Since portfolio inception | | 12.67% |
Past performance is no guarantee of future results. The performance quoted represents past performance and current performance may be lower or higher. The investment return and principal value of an investment will fluctuate so that investors’ shares, when redeemed, may be worth more or less than their original cost. Performance includes the reinvestment of income dividends and capital gain distributions.
The advisor is waiving its advisory fee and reimbursing the fund for a portion of other expenses. Had the fee not been waived and expenses not reimbursed, returns would have been lower.
LONG-TERM GROWTH
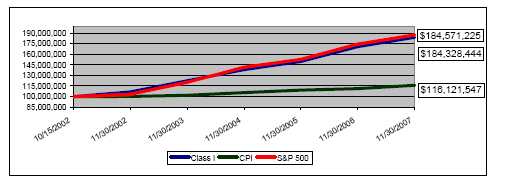
Comparison of a $100,000,000 investment in the Evergreen Market Index Fund Class I shares versus a similar investment in the S&P 500 Index (S&P 500) and the Consumer Price Index (CPI).
The S&P 500 is an unmanaged market index and does not include transaction costs associated with buying and selling securities, any mutual fund fees or expenses or any taxes. The CPI is a commonly used measure of inflation and does not represent an investment return. It is not possible to invest directly in an index.
The fund is only offered to certain pension plans having at least $100 million. Class I shares are sold without a front-end or deferred sales charge. The minimum initial investment for the fund is $100 million, which may be waived in certain situations. There is no minimum amount required for subsequent purchases.
The fund's investment objective may be changed without a vote of the fund's shareholders.
"Standard & Poor's," "S&P," "S&P 500," "Standard & Poor's 500" and "500" are trademarks of The McGraw-Hill Companies, Inc. and have been licensed for use by Evergreen Investments. The product is not sponsored, endorsed, sold or promoted by Standard & Poor's and Standard & Poor's makes no representation regarding the advisability of investing in the product.
All data is as of November 30, 2007, and subject to change.
Market Index Fund
ABOUT YOUR FUND’S EXPENSES
The Example below is intended to describe the fees and expenses borne by shareholders and the impact of those costs on your investment.
Example
As a shareholder of the fund, you incur two types of costs: (1) transaction costs, including sales charges (loads), redemption fees and exchange fees; and (2) ongoing costs, including management fees, distribution (12b-1) fees and other fund expenses. This Example is intended to help you understand your ongoing costs (in dollars) of investing in the fund and to compare these costs with the ongoing costs of investing in other mutual funds. The Example is based on an investment of $1,000 invested at the beginning of the period and held for the entire period from June 1, 2007 to November 30, 2007.
The example illustrates your fund’s costs in two ways:
• Actual expenses
The section in the table under the heading “Actual” provides information about actual account values and actual expenses. You may use the information in these columns, together with the amount you invested, to estimate the expenses that you paid over the period. Simply divide your account value by $1,000 (for example, an $8,600 account value divided by $1,000 = 8.6), then multiply the result by the number in the appropriate column for your share class, in the column entitled “Expenses Paid During Period” to estimate the expenses you paid on your account during this period.
• Hypothetical example for comparison purposes
The section in the table under the heading “Hypothetical (5% return before expenses)” provides information about hypothetical account values and hypothetical expenses based on the fund’s actual expense ratio and an assumed rate of return of 5% per year before expenses, which is not the fund’s actual return. The hypothetical account values and expenses may not be used to estimate the actual ending account balance or expenses you paid for the period. You may use this information to compare the ongoing costs of investing in the fund and other funds. To do so, compare this 5% hypothetical example with the 5% hypothetical examples that appear in the shareholder reports of the other funds.
Please note that the expenses shown in the table are meant to highlight your ongoing costs only and do not reflect any transactional costs, such as sales charges (loads), redemption fees or exchange fees. Therefore, the section in the table under the heading “Hypothetical (5% return before expenses)” is useful in comparing ongoing costs only, and will not help you determine the relative total costs of owning different funds. In addition, if these transactional costs were included, your costs would have been higher.
| | | Beginning | | Ending | | |
| | | Account | | Account | | Expenses |
| | | Value | | Value | | Paid During |
| | | 6/1/2007 | | 11/30/2007 | | Period* |
| Actual | | | | | | |
| Class I | | $1,000.00 | | $976.52 | | $0.15 |
| Hypothetical | | | | | | |
| (5% return before expenses) | | | | | | |
| Class I | | $1,000.00 | | $1,024.85 | | $0.15 |
*Expenses are equal to the Fund's annualized expense ratio (0.03% for Class I), multiplied by the average account value over the period, multiplied by 183 / 366 days.
Market Index Fund
FINANCIAL HIGHLIGHTS - CLASS I
(For a share outstanding throughout each period)
| | | | | Six Months Ended | | | | | | | | | | |
| | | | | November 30, | | Year Ended May 31, |
| | | | 2007 | |
|
| | | | | (unaudited) | | 2007 | | 2006 | | 2005 | | 2004 | | 20031 |
|
| Net asset value, beginning of period | | $14.48 | | $14.50 | | $13.81 | | $12.97 | | $11.02 | | $10.00 |
|
| Income from investment operations | | | | | | | | | | | | |
| Net investment income (loss) | | 0.14 | | 0.272 | | 0.272 | | 0.30 | | 0.18 | | 0.12 |
| Net realized and unrealized gains or losses on | | | | | | | | | | | | |
| | | investments | | (0.48) | | 2.76 | | 0.91 | | 0.76 | | 1.83 | | 0.94 |
| |
|
| Total from investment operations | | (0.34) | | 3.03 | | 1.18 | | 1.06 | | 2.01 | | 1.06 |
|
| Distributions to shareholders from | | | | | | | | | | | | |
| Net investment income | | 0 | | (0.30) | | (0.32) | | (0.20) | | (0.06) | | (0.04) |
| Net realized gains | | 0 | | (2.75) | | (0.17) | | (0.02) | | 0 | | 0 |
| |
|
| Total distributions to shareholders | | 0 | | (3.05) | | (0.49) | | (0.22) | | (0.06) | | (0.04) |
|
| Net asset value, end of period | | $14.14 | | $14.48 | | $14.50 | | $13.81 | | $12.97 | | $11.02 |
|
| Total return | | (2.35)% | | 22.78% | | 8.56% | | 8.24% | | 18.25% | | 10.63% |
|
| Ratios and supplemental data | | | | | | | | | | | | |
| Net assets, end of period (thousands) | | $545,310 | | $558,366 | | $406,581 | | $722,863 | | $716,998 | | $477,477 |
| Ratios to average net assets | | | | | | | | | | | | |
| | | Expenses including waivers/reimbursements | | | | | | | | | | | | |
| | | but excluding expense reductions | | 0.03%3 | | 0.03% | | 0.03% | | 0.03% | | 0.02% | | 0.02%3 |
| | | Expenses excluding waivers/reimbursements | | | | | | | | | | | | |
| | | and expense reductions | | 0.46%3 | | 0.46% | | 0.46% | | 0.46% | | 0.45% | | 0.48%3 |
| | | Net investment income (loss) | | 1.91%3 | | 1.93% | | 1.90% | | 2.08% | | 1.70% | | 1.84%3 |
| Portfolio turnover rate | | 2% | | 5% | | 6% | | 6% | | 2% | | 3% |
|
| 1 | | For the period from October 15, 2002 (commencement of operations), to May 31, 2003. |
| 2 | | Net investment income (loss) per share is based on average shares outstanding during the period. |
| 3 Annualized | | | | | | | | | | | | |
See Combined Notes to Financial Statements
SCHEDULE OF INVESTMENTS
Market Index Fund
November 30, 2007 (unaudited)
| | | | | Shares | | Value |
|
| |
| COMMON STOCKS 97.2% | | | | | | |
| CONSUMER DISCRETIONARY 8.6% | | | | |
| Auto Components 0.2% | | | | | | |
| Goodyear Tire & Rubber Co. * Þ | | | | 8,576 | | $ 246,560 |
| Johnson Controls, Inc. | | | | 24,141 | | 932,325 |
| |
|
| | | | | | | 1,178,885 |
| |
|
| |
| Automobiles 0.3% | | | | | | |
| Ford Motor Co. * Þ | | | | 85,334 | | 640,859 |
| General Motors Corp. Þ | | | | 22,999 | | 686,060 |
| Harley-Davidson, Inc. | | | | 10,210 | | 490,284 |
| |
|
| | | | | | | 1,817,203 |
| |
|
| |
| Distributors 0.1% | | | | | | |
| Genuine Parts Co. | | | | 6,906 | | 331,833 |
| |
|
| |
| Diversified Consumer Services 0.1% | | | | |
| Apollo Group, Inc., Class A * | | | | 5,775 | | 441,903 |
| H&R Block, Inc. | | | | 13,194 | | 259,658 |
| |
|
| | | | | | | 701,561 |
| |
|
| |
| Hotels, Restaurants & Leisure 1.4% | | | | |
| Carnival Corp. | | | | 17,735 | | 800,203 |
| Darden Restaurants, Inc. | | | | 5,758 | | 229,111 |
| Harrah's Entertainment, Inc. | | | | 7,610 | | 670,213 |
| International Game Technology | | | | 13,640 | | 595,522 |
| Marriott International, Inc., Class A | | | | 12,988 | | 487,050 |
| McDonald's Corp. | | | | 48,437 | | 2,832,111 |
| Starbucks Corp. * | | | | 30,291 | | 708,506 |
| Starwood Hotels & Resorts Worldwide, Inc. | | 8,094 | | 434,486 |
| Wendy's International, Inc. | | | | 3,550 | | 99,507 |
| Wyndham Worldwide Corp. * | | | | 7,259 | | 211,745 |
| Yum! Brands, Inc. | | | | 21,133 | | 785,091 |
| |
|
| | | | | | | 7,853,545 |
| |
|
| |
| Household Durables 0.4% | | | | | | |
| Black & Decker Corp. Þ | | | | 2,670 | | 220,676 |
| Centex Corp. Þ | | | | 4,876 | | 101,713 |
| D.R. Horton, Inc. Þ | | | | 11,106 | | 132,939 |
| Fortune Brands, Inc. | | | | 6,225 | | 477,146 |
| Harman International Industries, Inc. | | | | 2,458 | | 180,909 |
| KB Home Þ | | | | 3,129 | | 65,365 |
| Leggett & Platt, Inc. Þ | | | | 7,100 | | 146,118 |
| Lennar Corp., Class A Þ | | | | 5,667 | | 89,765 |
| Newell Rubbermaid, Inc. | | | | 11,230 | | 300,740 |
| Pulte Homes, Inc. Þ | | | | 8,633 | | 88,229 |
| Snap-On, Inc. | | | | 2,354 | | 115,064 |
| Stanley Works Þ | | | | 3,336 | | 173,972 |
| Whirlpool Corp. Þ | | | | 3,170 | | 256,643 |
| |
|
| | | | | | | 2,349,279 |
| |
|
| |
| Internet & Catalog Retail 0.3% | | | | | | |
| Amazon.com, Inc. * Þ | | | | 12,421 | | 1,124,846 |
| Expedia, Inc. * Þ | | | | 8,305 | | 270,743 |
| |
| See Combined Notes to Financial Statements | | | | |
SCHEDULE OF INVESTMENTS continued
Market Index Fund
November 30, 2007 (unaudited)
| IAC/InterActiveCorp. Þ | | | | 7,765 | | 216,100 |
| |
|
| | | | | | | 1,611,689 |
| |
|
| |
| Leisure Equipment & Products 0.2% | | | | |
| Brunswick Corp. Þ | | | | 3,613 | | 73,669 |
| Eastman Kodak Co. Þ | | | | 11,665 | | 273,894 |
| Hasbro, Inc. Þ | | | | 5,977 | | 165,981 |
| Mattel, Inc. | | | | 14,910 | | 297,902 |
| |
|
| | | | | | | 811,446 |
| |
|
| |
| Media 2.9% | | | | | | |
| CBS Corp., Class B Þ | | | | 27,838 | | 763,596 |
| Clear Channel Communications, Inc. | | | | 20,237 | | 726,508 |
| Comcast Corp., Class A * Þ | | | | 125,612 | | 2,580,071 |
| DIRECTV Group, Inc. * | | | | 29,178 | | 725,657 |
| Dow Jones & Co., Inc. | | | | 2,652 | | 158,457 |
| E.W. Scripps Co., Class A Þ | | | | 3,648 | | 158,506 |
| Gannett Co., Inc. | | | | 9,466 | | 347,876 |
| Interpublic Group of Cos. * Þ | | | | 19,162 | | 181,847 |
| McGraw-Hill Cos. | | | | 13,774 | | 676,028 |
| Meredith Corp. | | | | 1,564 | | 86,098 |
| New York Times Co., Class A Þ | | | | 5,849 | | 96,509 |
| News Corp., Class A | | | | 94,089 | | 1,982,455 |
| Omnicom Group, Inc. | | | | 13,343 | | 650,471 |
| Time Warner, Inc. | | | | 151,570 | | 2,616,098 |
| Tribune Co. Þ | | | | 3,129 | | 97,124 |
| Viacom, Inc., Class B * | | | | 27,906 | | 1,172,610 |
| Walt Disney Co. | | | | 78,885 | | 2,615,038 |
| |
|
| | | | | | | 15,634,949 |
| |
|
| |
| Multi-line Retail 0.8% | | | | | | |
| Big Lots, Inc. * Þ | | | | 4,136 | | 77,219 |
| Dillard's, Inc., Class A Þ | | | | 2,473 | | 50,424 |
| Family Dollar Stores, Inc. Þ | | | | 5,917 | | 139,345 |
| J.C. Penney Co., Inc. | | | | 9,008 | | 397,433 |
| Kohl's Corp. * | | | | 12,916 | | 636,501 |
| Macy's, Inc. | | | | 17,620 | | 522,433 |
| Nordstrom, Inc. Þ | | | | 8,040 | | 269,662 |
| Sears Holdings Corp. * Þ | | | | 3,077 | | 324,654 |
| Target Corp. | | | | 34,408 | | 2,066,545 |
| |
|
| | | | | | | 4,484,216 |
| |
|
| |
| Specialty Retail 1.5% | | | | | | |
| Abercrombie & Fitch Co., Class A Þ | | | | 3,523 | | 289,027 |
| AutoNation, Inc. * | | | | 5,608 | | 92,532 |
| AutoZone, Inc. * | | | | 1,860 | | 207,632 |
| Bed, Bath & Beyond, Inc. * Þ | | | | 11,028 | | 346,831 |
| Best Buy Co., Inc. Þ | | | | 14,263 | | 728,126 |
| Circuit City Stores, Inc. Þ | | | | 6,849 | | 44,313 |
| Gap, Inc. | | | | 20,114 | | 410,325 |
| Home Depot, Inc. | | | | 68,629 | | 1,960,044 |
| Limited Brands, Inc. | | | | 12,958 | | 260,197 |
| Lowe's Cos. | | | | 60,095 | | 1,466,919 |
| Office Depot, Inc. * | | | | 11,086 | | 190,014 |
| OfficeMax, Inc. | | | | 3,062 | | 76,336 |
| RadioShack Corp. Þ | | | | 5,600 | | 103,600 |
| |
| See Combined Notes to Financial Statements | | | | |
SCHEDULE OF INVESTMENTS continued
Market Index Fund
November 30, 2007 (unaudited)
| Sherwin-Williams Co. Þ | | | | | | 4,413 | | 277,269 |
| Staples, Inc. | | | | | | 29,016 | | 687,679 |
| Tiffany & Co. | | | | | | 5,557 | | 258,011 |
| TJX Cos. | | | | | | 18,071 | | 530,203 |
| |
|
| | | | | | | | | 7,929,058 |
| |
|
| |
| Textiles, Apparel & Luxury Goods 0.4% | | | | |
| Coach, Inc. * | | | | | | 15,164 | | 563,191 |
| Jones Apparel Group, Inc. Þ | | 3,465 | | 64,588 |
| Liz Claiborne, Inc. Þ | | | | | | 4,156 | | 104,274 |
| Nike, Inc., Class B | | | | | | 15,714 | | 1,031,624 |
| Polo Ralph Lauren Corp. | | | | | | 2,435 | | 167,966 |
| VF Corp. | | | | | | 3,612 | | 270,142 |
| |
|
| | | | | | | | | 2,201,785 |
| |
|
| |
| CONSUMER STAPLES 10.0% | | | | | | |
| Beverages 2.4% | | | | | | | | |
| Anheuser-Busch Companies, Inc. | | | | 30,465 | | 1,606,115 |
| Brown-Forman Corp., Class B | | | | 3,515 | | 248,300 |
| Coca-Cola Co. | | | | | | 80,866 | | 5,021,779 |
| Coca-Cola Enterprises, Inc. | | | | 11,585 | | 300,862 |
| Constellation Brands, Inc., Class A * | | | | 7,886 | | 185,715 |
| Molson Coors Brewing Co., Class B | | | | 5,540 | | 298,274 |
| Pepsi Bottling Group, Inc. | | | | | | 5,695 | | 243,006 |
| PepsiCo, Inc. | | | | | | 65,670 | | 5,068,410 |
| |
|
| | | | | | | | | 12,972,461 |
| |
|
| |
| Food & Staples Retailing 2.3% | | | | | | |
| Costco Wholesale Corp. | | | | | | 17,799 | | 1,199,653 |
| CVS Caremark Corp. | | | | | | 60,188 | | 2,412,937 |
| Kroger Co. | | | | | | 28,755 | | 826,706 |
| Safeway, Inc. | | | | | | 17,846 | | 621,041 |
| SUPERVALU, Inc. | | | | | | 8,539 | | 357,528 |
| Sysco Corp. | | | | | | 24,791 | | 805,955 |
| Wal-Mart Stores, Inc. | | | | | | 97,554 | | 4,672,837 |
| Walgreen Co. | | | | | | 40,385 | | 1,477,687 |
| Whole Foods Market, Inc. Þ | | | | 5,649 | | 242,963 |
| |
|
| | | | | | | | | 12,617,307 |
| |
|
| |
| Food Products 1.4% | | | | | | | | |
| Archer Daniels Midland Co. | | | | | | 26,157 | | 950,807 |
| Campbell Soup Co. | | | | | | 9,133 | | 335,364 |
| ConAgra Foods, Inc. | | | | | | 19,907 | | 498,073 |
| Dean Foods Co. Þ | | | | | | 5,264 | | 131,284 |
| General Mills, Inc. | | | | | | 13,420 | | 807,213 |
| H.J. Heinz Co. | | | | | | 12,971 | | 613,528 |
| Hershey Co. Þ | | | | | | 6,871 | | 274,222 |
| Kellogg Co. | | | | | | 10,783 | | 582,713 |
| Kraft Foods, Inc., Class A | | | | | | 64,082 | | 2,214,033 |
| McCormick & Co., Inc. | | | | | | 5,271 | | 201,405 |
| Sara Lee Corp. | | | | | | 29,447 | | 495,593 |
| Tyson Foods, Inc., Class A | | | | | | 11,180 | | 166,694 |
| Wm. Wrigley Jr. Co. | | | | | | 8,829 | | 565,056 |
| |
|
| | | | | | | | | 7,835,985 |
| |
|
| |
| |
| |
| See Combined Notes to Financial Statements | | | | |
SCHEDULE OF INVESTMENTS continued
Market Index Fund
November 30, 2007 (unaudited)
| Household Products 2.3% | | | | | | |
| Clorox Co. | | | | 5,624 | | 364,885 |
| Colgate-Palmolive Co. | | | | 20,726 | | 1,659,738 |
| Kimberly-Clark Corp. | | | | 17,298 | | 1,207,574 |
| Procter & Gamble Co. | | | | 126,837 | | 9,385,938 |
| |
|
| | | | | | | 12,618,135 |
| |
|
| |
| Personal Products 0.2% | | | | | | |
| Avon Products, Inc. | | | | 17,584 | | 721,823 |
| Estee Lauder Cos., Class A | | | | 4,659 | | 209,096 |
| |
|
| | | | | | | 930,919 |
| |
|
| |
| Tobacco 1.4% | | | | | | |
| Altria Group, Inc. | | | | 85,562 | | 6,636,189 |
| Reynolds American, Inc. Þ | | | | 6,954 | | 486,919 |
| UST, Inc. Þ | | | | 6,477 | | 375,018 |
| |
|
| | | | | | | 7,498,126 |
| |
|
| |
| ENERGY 11.5% | | | | | | |
| Energy Equipment & Services 2.3% | | | | |
| Baker Hughes, Inc. | | | | 12,988 | | 1,042,547 |
| BJ Services Co. | | | | 11,852 | | 291,322 |
| ENSCO International, Inc. | | | | 6,015 | | 323,908 |
| Halliburton Co. | | | | 36,179 | | 1,324,513 |
| Nabors Industries, Ltd. * | | | | 11,428 | | 307,413 |
| National Oilwell Varco, Inc. * | | | | 14,478 | | 986,676 |
| Noble Corp. | | | | 10,912 | | 568,843 |
| Rowan Companies, Inc. | | | | 4,492 | | 159,017 |
| Schlumberger, Ltd. | | | | 48,449 | | 4,527,559 |
| Smith International, Inc. Þ | | | | 8,150 | | 511,168 |
| Transocean, Inc. * | | | | 12,587 | | 1,728,097 |
| Weatherford International, Ltd. * | | | | 13,696 | | 857,643 |
| |
|
| | | | | | | 12,628,706 |
| |
|
| |
| Oil, Gas & Consumable Fuels 9.2% | | | | |
| Anadarko Petroleum Corp. | | | | 18,854 | | 1,067,136 |
| Apache Corp. | | | | 13,494 | | 1,306,084 |
| Chesapeake Energy Corp. Þ | | | | 17,992 | | 680,997 |
| Chevron Corp. | | | | 86,639 | | 7,604,305 |
| ConocoPhillips | | | | 66,134 | | 5,293,365 |
| Consol Energy, Inc. | | | | 7,410 | | 439,265 |
| Devon Energy Corp. | | | | 18,127 | | 1,501,097 |
| El Paso Corp. | | | | 28,473 | | 457,846 |
| EOG Resources, Inc. | | | | 9,950 | | 823,661 |
| Exxon Mobil Corp. | | | | 225,417 | | 20,098,180 |
| Hess Corp. | | | | 11,244 | | 800,798 |
| Marathon Oil Corp. | | | | 29,076 | | 1,625,348 |
| Murphy Oil Corp. | | | | 7,661 | | 547,915 |
| Noble Energy, Inc. | | | | 6,955 | | 501,038 |
| Occidental Petroleum Corp. | | | | 33,764 | | 2,355,717 |
| Peabody Energy Corp. | | | | 10,791 | | 600,411 |
| Spectra Energy Corp. | | | | 25,691 | | 633,026 |
| Sunoco, Inc. | | | | 4,892 | | 328,253 |
| Tesoro Corp. | | | | 5,561 | | 273,490 |
| Valero Energy Corp. | | | | 22,509 | | 1,464,661 |
| |
| See Combined Notes to Financial Statements | | | | |
SCHEDULE OF INVESTMENTS continued
Market Index Fund
November 30, 2007 (unaudited)
| Williams Cos. | | | | 24,395 | | 846,751 |
| XTO Energy, Inc. | | | | 15,681 | | 969,400 |
| |
|
| | | | | | | 50,218,744 |
| |
|
| |
| FINANCIALS 18.0% | | | | | | |
| Capital Markets 3.3% | | | | | | |
| American Capital Strategies, Ltd. Þ | | | | 7,638 | | 287,265 |
| Ameriprise Financial, Inc. | | | | 9,563 | | 561,252 |
| Bank of New York Mellon Corp. | | | | 46,246 | | 2,217,958 |
| Bear Stearns Cos. Þ | | | | 4,720 | | 470,584 |
| Charles Schwab Corp. | | | | 38,520 | | 936,421 |
| E*TRADE Financial Corp. * Þ | | | | 17,284 | | 79,506 |
| Federated Investors, Inc., Class B | | | | 3,558 | | 145,131 |
| Franklin Resources, Inc. | | | | 6,597 | | 812,618 |
| Goldman Sachs Group, Inc. | | | | 16,487 | | 3,736,614 |
| Janus Capital Group, Inc. Þ | | | | 6,415 | | 215,352 |
| Legg Mason, Inc. | | | | 5,396 | | 411,769 |
| Lehman Brothers Holdings, Inc. | | | | 21,573 | | 1,351,117 |
| Merrill Lynch & Co., Inc. | | | | 35,031 | | 2,099,758 |
| Morgan Stanley | | | | 42,779 | | 2,255,309 |
| Northern Trust Corp. | | | | 7,782 | | 630,264 |
| State Street Corp. | | | | 15,831 | | 1,264,739 |
| T. Rowe Price Group, Inc. | | | | 10,777 | | 662,570 |
| |
|
| | | | | | | 18,138,227 |
| |
|
| |
| Commercial Banks 3.2% | | | | | | |
| BB&T Corp. | | | | 22,433 | | 809,383 |
| Comerica, Inc. | | | | 6,219 | | 284,706 |
| Commerce Bancorp, Inc. | | | | 7,813 | | 311,114 |
| Fifth Third Bancorp | | | | 21,772 | | 651,201 |
| First Horizon National Corp. Þ | | | | 5,131 | | 113,292 |
| Huntington Bancshares, Inc. | | | | 14,872 | | 233,342 |
| KeyCorp | | | | 15,825 | | 416,830 |
| M&T Bank Corp. | | | | 3,048 | | 277,246 |
| Marshall & Ilsley Corp. Þ | | | | 10,833 | | 340,914 |
| National City Corp. Þ | | | | 25,738 | | 508,583 |
| PNC Financial Services Group, Inc. | | | | 13,900 | | 1,017,619 |
| Regions Financial Corp. | | | | 28,610 | | 756,162 |
| SunTrust Banks, Inc. | | | | 14,187 | | 994,651 |
| Synovus Financial Corp. Þ | | | | 13,307 | | 331,211 |
| U.S. Bancorp | | | | 70,168 | | 2,321,859 |
| Wachovia Corp. ° | | | | 77,344 | | 3,325,792 |
| Wells Fargo & Co. | | | | 135,848 | | 4,405,551 |
| Zions Bancorp | | | | 4,372 | | 238,580 |
| |
|
| | | | | | | 17,338,036 |
| |
|
| |
| Consumer Finance 0.9% | | | | | | |
| American Express Co. | | | | 48,076 | | 2,835,522 |
| Capital One Financial Corp. | | | | 16,976 | | 904,991 |
| Discover Financial Services | | | | 19,396 | | 336,908 |
| SLM Corp. | | | | 16,770 | | 638,602 |
| |
|
| | | | | | | 4,716,023 |
| |
|
| |
| Diversified Financial Services 4.6% | | | | |
| Bank of America Corp. | | | | 180,347 | | 8,319,407 |
| CIT Group, Inc. | | | | 7,755 | | 206,283 |
| |
| See Combined Notes to Financial Statements | | | | |
SCHEDULE OF INVESTMENTS continued
Market Index Fund
November 30, 2007 (unaudited)
| Citigroup, Inc. | | | | 202,181 | | 6,732,627 |
| CME Group, Inc., Class A Þ | | | | 2,159 | | 1,421,918 |
| IntercontinentalExchange, Inc. | | | | 2,816 | | 470,159 |
| JPMorgan Chase & Co. | | | | 137,532 | | 6,274,210 |
| Leucadia National Corp. | | | | 6,692 | | 314,256 |
| Moody's Corp. | | | | 9,004 | | 339,091 |
| NYSE Euronext | | | | 10,730 | | 929,218 |
| |
|
| | | | | | | 25,007,169 |
| |
|
| |
| Insurance 4.2% | | | | | | |
| ACE, Ltd. | | | | 13,372 | | 800,047 |
| AFLAC, Inc. | | | | 19,853 | | 1,243,592 |
| Allstate Corp. | | | | 23,776 | | 1,215,429 |
| Ambac Financial Group, Inc. Þ | | | | 4,135 | | 112,596 |
| American International Group, Inc. | | | | 104,224 | | 6,058,541 |
| AON Corp. | | | | 11,899 | | 594,593 |
| Assurant, Inc. Þ | | | | 3,922 | | 256,616 |
| Chubb Corp. | | | | 15,985 | | 871,982 |
| Cincinnati Financial Corp. | | | | 6,991 | | 279,500 |
| Genworth Financial, Inc., Class A | | | | 17,992 | | 472,110 |
| Hartford Financial Services Group, Inc. | | | | 12,912 | | 1,230,772 |
| Lincoln National Corp. | | | | 11,001 | | 677,332 |
| Loews Corp. | | | | 18,069 | | 863,517 |
| Marsh & McLennan Cos. | | | | 22,029 | | 553,368 |
| MBIA, Inc. Þ | | | | 5,143 | | 187,771 |
| MetLife, Inc. | | | | 30,193 | | 1,980,359 |
| Principal Financial Group, Inc. | | | | 10,795 | | 706,965 |
| Progressive Corp. | | | | 29,430 | | 541,512 |
| Prudential Financial, Inc. | | | | 18,655 | | 1,756,182 |
| SAFECO Corp. | | | | 3,843 | | 221,780 |
| Torchmark Corp. | | | | 3,889 | | 239,873 |
| Travelers Companies, Inc. | | | | 26,683 | | 1,417,134 |
| UnumProvident Corp. | | | | 14,664 | | 364,254 |
| XL Capital, Ltd., Class A | | | | 7,387 | | 432,361 |
| |
|
| | | | | | | 23,078,186 |
| |
|
| |
| Real Estate Investment Trusts 1.1% | | | | | | |
| Apartment Investment & Management Co., Class A | | | | 3,932 | | 156,376 |
| AvalonBay Communities, Inc. | | | | 3,241 | | 322,285 |
| Boston Properties, Inc. | | | | 4,838 | | 476,156 |
| Developers Diversified Realty Corp. | | | | 5,048 | | 224,182 |
| Equity Residential | | | | 11,264 | | 419,133 |
| General Growth Properties, Inc. | | | | 9,981 | | 463,518 |
| Host Hotels & Resorts, Inc. | | | | 21,226 | | 407,327 |
| Kimco Realty Corp. | | | | 10,251 | | 404,812 |
| Plum Creek Timber Co., Inc. | | | | 7,095 | | 328,995 |
| ProLogis | | | | 10,444 | | 683,246 |
| Public Storage, Inc. | | | | 5,059 | | 391,263 |
| Simon Property Group, Inc. | | | | 9,080 | | 893,926 |
| Vornado Realty Trust | | | | 5,437 | | 489,330 |
| |
|
| | | | | | | 5,660,549 |
| |
|
| |
| Real Estate Management & Development 0.0% | | | | |
| CB Richard Ellis Group, Inc., Class A * Þ | | | | 8,014 | | 190,332 |
| |
|
| |
| |
| |
| See Combined Notes to Financial Statements | | | | | | |
SCHEDULE OF INVESTMENTS continued
Market Index Fund
November 30, 2007 (unaudited)
| Thrifts & Mortgage Finance 0.7% | | | | | | |
| Countrywide Financial Corp. Þ | | | | 23,411 | | 253,307 |
| Fannie Mae | | | | 39,564 | | 1,520,049 |
| Freddie Mac | | | | 26,424 | | 926,690 |
| Hudson City Bancorp, Inc. | | | | 21,615 | | 328,980 |
| MGIC Investment Corp. Þ | | | | 3,331 | | 78,345 |
| Sovereign Bancorp, Inc. | | | | 14,606 | | 171,913 |
| Washington Mutual, Inc. Þ | | | | 35,592 | | 694,044 |
| |
|
| | | | | | | 3,973,328 |
| |
|
| |
| HEALTH CARE 11.9% | | | | | | |
| Biotechnology 1.3% | | | | | | |
| Amgen, Inc. * | | | | 44,168 | | 2,440,282 |
| Biogen Idec, Inc. * | | | | 11,702 | | 867,352 |
| Celgene Corp. * | | | | 15,555 | | 957,410 |
| Genzyme Corp. * | | | | 10,718 | | 803,100 |
| Gilead Sciences, Inc. * | | | | 37,650 | | 1,752,231 |
| |
|
| | | | | | | 6,820,375 |
| |
|
| |
| Health Care Equipment & Supplies 1.6% | | | | |
| Baxter International, Inc. | | | | 26,204 | | 1,568,833 |
| Becton, Dickinson & Co. | | | | 9,892 | | 818,365 |
| Boston Scientific Corp. * | | | | 54,222 | | 684,824 |
| C.R. Bard, Inc. | | | | 4,201 | | 355,111 |
| Covidien, Ltd. | | | | 20,207 | | 810,503 |
| Hospira, Inc. * | | | | 6,385 | | 276,471 |
| Medtronic, Inc. | | | | 46,094 | | 2,343,880 |
| St. Jude Medical, Inc. * | | | | 13,855 | | 550,736 |
| Stryker Corp. | | | | 9,643 | | 700,371 |
| Varian Medical Systems, Inc. * | | | | 5,138 | | 256,694 |
| Zimmer Holdings, Inc. * | | | | 9,599 | | 621,343 |
| |
|
| | | | | | | 8,987,131 |
| |
|
| |
| Health Care Providers & Services 2.3% | | | | |
| Aetna, Inc. | | | | 20,785 | | 1,161,466 |
| AmerisourceBergen Corp. | | | | 7,323 | | 332,244 |
| Cardinal Health, Inc. | | | | 14,816 | | 897,109 |
| CIGNA Corp. | | | | 11,496 | | 616,301 |
| Coventry Health Care, Inc. * | | | | 6,352 | | 367,654 |
| Express Scripts, Inc. * | | | | 10,480 | | 710,020 |
| Humana, Inc. * | | | | 6,851 | | 527,732 |
| Laboratory Corporation of America Holdings * | | 4,767 | | 346,418 |
| McKesson Corp. | | | | 12,030 | | 802,762 |
| Medco Health Solutions, Inc. * | | | | 11,005 | | 1,100,390 |
| Patterson Companies, Inc. * | | | | 5,688 | | 183,040 |
| Quest Diagnostics, Inc. | | | | 6,353 | | 349,796 |
| Tenet Healthcare Corp. * Þ | | | | 19,259 | | 106,117 |
| UnitedHealth Group, Inc. | | | | 53,847 | | 2,961,585 |
| WellPoint, Inc. * | | | | 23,221 | | 1,955,440 |
| |
|
| | | | | | | 12,418,074 |
| |
|
| |
| Health Care Technology 0.0% | | | | | | |
| IMS Health, Inc. | | | | 7,924 | | 185,026 |
| |
|
| |
| |
| |
| |
| See Combined Notes to Financial Statements | | | | |
SCHEDULE OF INVESTMENTS continued
Market Index Fund
November 30, 2007 (unaudited)
| Life Sciences Tools & Services 0.3% | | | | |
| Applera Corp. - Applied Biosystems Group | | 7,453 | | 254,595 |
| Millipore Corp. * Þ | | 2,193 | | 179,563 |
| PerkinElmer, Inc. | | 4,930 | | 134,490 |
| Thermo Fisher Scientific, Inc. * | | 17,337 | | 999,305 |
| Waters Corp. * | | 4,056 | | 316,530 |
| |
|
| | | | | 1,884,483 |
| |
|
| |
| Pharmaceuticals 6.4% | | | | |
| Abbott Laboratories | | 62,812 | | 3,612,318 |
| Allergan, Inc. | | 12,498 | | 837,866 |
| Barr Pharmaceuticals, Inc. * | | 4,357 | | 233,971 |
| Bristol-Myers Squibb Co. | | 80,388 | | 2,381,896 |
| Eli Lilly & Co. | | 40,108 | | 2,123,719 |
| Forest Laboratories, Inc. * | | 12,849 | | 495,329 |
| Johnson & Johnson | | 117,642 | | 7,969,069 |
| King Pharmaceuticals, Inc. * | | 9,924 | | 105,095 |
| Merck & Co., Inc. | | 88,454 | | 5,250,629 |
| Mylan Laboratories, Inc. Þ | | 12,286 | | 176,673 |
| Pfizer, Inc. | | 281,538 | | 6,689,343 |
| Schering-Plough Corp. | | 65,817 | | 2,060,072 |
| Watson Pharmaceuticals, Inc. * | | 4,166 | | 122,106 |
| Wyeth | | 54,650 | | 2,683,315 |
| |
|
| | | | | 34,741,401 |
| |
|
| |
| INDUSTRIALS 11.2% | | | | |
| Aerospace & Defense 2.8% | | | | |
| Boeing Co. | | 31,852 | | 2,947,584 |
| General Dynamics Corp. | | 16,489 | | 1,463,893 |
| Goodrich Corp. | | 5,090 | | 362,866 |
| Honeywell International, Inc. | | 30,417 | | 1,722,211 |
| L-3 Communications Holdings, Inc. | | 5,123 | | 566,860 |
| Lockheed Martin Corp. | | 14,112 | | 1,561,775 |
| Northrop Grumman Corp. | | 13,968 | | 1,100,539 |
| Precision Castparts Corp. | | 5,603 | | 825,546 |
| Raytheon Co. | | 17,775 | | 1,099,384 |
| Rockwell Collins Corp. | | 6,774 | | 488,541 |
| United Technologies Corp. | | 40,309 | | 3,013,904 |
| |
|
| | | | | 15,153,103 |
| |
|
| |
| Air Freight & Logistics 0.9% | | | | |
| C.H. Robinson Worldwide, Inc. | | 7,015 | | 361,623 |
| Expeditors International of Washington, Inc. | | 8,657 | | 406,186 |
| FedEx Corp. | | 12,549 | | 1,235,700 |
| United Parcel Service, Inc., Class B | | 42,667 | | 3,143,705 |
| |
|
| | | | | 5,147,214 |
| |
|
| |
| Airlines 0.1% | | | | |
| Southwest Airlines Co. | | 30,373 | | 429,778 |
| |
|
| |
| Building Products 0.1% | | | | |
| American Standard Companies, Inc. | | 6,967 | | 255,758 |
| Masco Corp. | | 14,922 | | 334,253 |
| |
|
| | | | | 590,011 |
| |
|
| |
| |
| See Combined Notes to Financial Statements | | | | |
SCHEDULE OF INVESTMENTS continued
Market Index Fund
November 30, 2007 (unaudited)
| Commercial Services & Supplies 0.5% | | | | |
| Allied Waste Industries, Inc. * | | | | 11,720 | | 133,725 |
| Avery Dennison Corp. | | | | 4,328 | | 225,532 |
| Cintas Corp. | | | | 5,483 | | 175,401 |
| Equifax, Inc. | | | | 5,358 | | 199,478 |
| Monster Worldwide, Inc. * | | | | 5,379 | | 181,649 |
| Pitney Bowes, Inc. | | | | 8,936 | | 344,036 |
| R.R. Donnelley & Sons Co. | | | | 9,027 | | 330,930 |
| Robert Half International, Inc. | | | | 6,663 | | 179,635 |
| Waste Management, Inc. | | | | 21,098 | | 724,083 |
| |
|
| | | | | | | 2,494,469 |
| |
|
| |
| Construction & Engineering 0.2% | | | | | | |
| Fluor Corp. | | | | 3,589 | | 528,193 |
| Jacobs Engineering Group, Inc. * | | | | 4,874 | | 408,295 |
| |
|
| | | | | | | 936,488 |
| |
|
| |
| Electrical Equipment 0.5% | | | | | | |
| Cooper Industries, Inc. | | | | 7,466 | | 374,942 |
| Emerson Electric Co. | | | | 32,190 | | 1,835,474 |
| Rockwell Automation, Inc. | | | | 6,200 | | 420,918 |
| |
|
| | | | | | | 2,631,334 |
| |
|
| |
| Industrial Conglomerates 3.6% | | | | | | |
| 3M Co. | | | | 29,093 | | 2,422,283 |
| General Electric Co. | | | | 416,435 | | 15,945,296 |
| Textron, Inc. | | | | 10,149 | | 700,789 |
| Tyco International, Ltd. | | | | 20,205 | | 810,827 |
| |
|
| | | | | | | 19,879,195 |
| |
|
| |
| Machinery 1.8% | | | | | | |
| Caterpillar, Inc. | | | | 25,977 | | 1,867,746 |
| Cummins, Inc. | | | | 4,229 | | 494,370 |
| Danaher Corp. | | | | 10,020 | | 869,936 |
| Deere & Co. | | | | 9,018 | | 1,549,293 |
| Dover Corp. | | | | 8,315 | | 384,818 |
| Eaton Corp. | | | | 5,922 | | 528,894 |
| Illinois Tool Works, Inc. | | | | 17,052 | | 946,386 |
| Ingersoll-Rand Co., Ltd., Class A | | | | 11,651 | | 601,658 |
| ITT Corp. | | | | 7,360 | | 474,278 |
| Manitowoc Co. Inc. | | | | 5,099 | | 223,591 |
| Paccar, Inc. Þ | | | | 15,156 | | 767,045 |
| Pall Corp. | | | | 4,983 | | 190,600 |
| Parker Hannifin Corp. | | | | 7,081 | | 562,444 |
| Terex Corp. * | | | | 4,142 | | 266,952 |
| |
|
| | | | | | | 9,728,011 |
| |
|
| |
| Road & Rail 0.7% | | | | | | |
| Burlington Northern Santa Fe Corp. | | | | 12,209 | | 1,019,696 |
| CSX Corp. | | | | 17,843 | | 749,406 |
| Norfolk Southern Corp. | | | | 15,997 | | 819,206 |
| Ryder System, Inc. | | | | 2,432 | | 105,451 |
| Union Pacific Corp. | | | | 10,827 | | 1,365,718 |
| |
|
| | | | | | | 4,059,477 |
| |
|
| |
| |
| |
| See Combined Notes to Financial Statements | | | | |
SCHEDULE OF INVESTMENTS continued
Market Index Fund
November 30, 2007 (unaudited)
| Trading Companies & Distributors 0.0% | | | | |
| W.W. Grainger, Inc. Þ | | | | 2,738 | | 241,766 |
| |
|
| |
| INFORMATION TECHNOLOGY 15.9% | | | | |
| Communications Equipment 2.5% | | | | |
| Ciena Corp. * Þ | | | | 3,494 | | 153,666 |
| Cisco Systems, Inc. * | | | | 247,552 | | 6,936,407 |
| Corning, Inc. | | | | 63,931 | | 1,552,884 |
| JDS Uniphase Corp. * Þ | | | | 8,602 | | 115,783 |
| Juniper Networks, Inc. * | | | | 20,895 | | 620,999 |
| Motorola, Inc. | | | | 94,072 | | 1,502,330 |
| QUALCOMM, Inc. | | | | 68,046 | | 2,774,916 |
| Tellabs, Inc. * Þ | | | | 17,814 | | 123,986 |
| |
|
| | | | | | | 13,780,971 |
| |
|
| |
| Computers & Peripherals 4.3% | | | | |
| Apple, Inc. * | | | | 35,345 | | 6,440,566 |
| Dell, Inc. * | | | | 92,325 | | 2,265,655 |
| EMC Corp. * | | | | 85,240 | | 1,642,575 |
| Hewlett-Packard Co. | | | | 104,780 | | 5,360,545 |
| International Business Machines Corp. | | 55,291 | | 5,815,507 |
| Lexmark International, Inc., Class A * Þ | | 3,841 | | 133,974 |
| Network Appliance, Inc. * | | | | 14,462 | | 357,356 |
| QLogic Corp. * | | | | 5,563 | | 75,212 |
| SanDisk Corp. * Þ | | | | 9,260 | | 346,694 |
| Sun Microsystems, Inc. | | | | 33,677 | | 699,803 |
| Teradata Corp. | | | | 7,336 | | 190,443 |
| |
|
| | | | | | | 23,328,330 |
| |
|
| |
| Electronic Equipment & Instruments 0.3% | | | | |
| Agilent Technologies, Inc. * | | | | 15,710 | | 594,309 |
| Jabil Circuit, Inc. | | | | 8,436 | | 142,990 |
| Molex, Inc. | | | | 5,836 | | 160,840 |
| Tyco Electronics, Ltd. | | | | 20,207 | | 755,540 |
| |
|
| | | | | | | 1,653,679 |
| |
|
| |
| Internet Software & Services 1.9% | | | | |
| Akamai Technologies, Inc. * Þ | | | | 6,731 | | 256,182 |
| eBay, Inc. * | | | | 46,370 | | 1,554,786 |
| Google, Inc., Class A * | | | | 9,388 | | 6,505,884 |
| VeriSign, Inc. * | | | | 8,980 | | 367,282 |
| Yahoo!, Inc. * | | | | 54,753 | | 1,467,928 |
| |
|
| | | | | | | 10,152,062 |
| |
|
| |
| IT Services 0.8% | | | | | | |
| Affiliated Computer Services, Inc., Class A * | | 4,046 | | 169,770 |
| Automatic Data Processing, Inc. | | | | 21,584 | | 972,575 |
| Cognizant Technology Solutions Corp., Class A * | | 11,754 | | 365,550 |
| Computer Sciences Corp. * Þ | | | | 7,072 | | 373,543 |
| Convergys Corp. * | | | | 5,510 | | 89,868 |
| Electronic Data Systems Corp. | | | | 20,685 | | 419,078 |
| Fidelity National Information Services, Inc. | | 6,905 | | 298,434 |
| Fiserv, Inc. * | | | | 6,782 | | 348,120 |
| Paychex, Inc. | | | | 13,825 | | 539,175 |
| Unisys Corp. * Þ | | | | 14,223 | | 70,546 |
| |
| See Combined Notes to Financial Statements | | | | |
SCHEDULE OF INVESTMENTS continued
Market Index Fund
November 30, 2007 (unaudited)
| Western Union Co. | | | | 31,403 | | 709,708 |
| |
|
| | | | | | | 4,356,367 |
| |
|
| |
| Office Electronics 0.1% | | | | | | |
| Xerox Corp. * | | | | 38,036 | | 642,048 |
| |
|
| |
| Semiconductors & Semiconductor Equipment 2.6% | | | | |
| Advanced Micro Devices, Inc. * Þ | | | | 24,345 | | 237,607 |
| Altera Corp. | | | | 13,651 | | 256,366 |
| Analog Devices, Inc. | | | | 12,647 | | 389,275 |
| Applied Materials, Inc. | | | | 56,010 | | 1,054,668 |
| Broadcom Corp., Class A * | | | | 19,066 | | 509,825 |
| Intel Corp. | | | | 237,355 | | 6,190,218 |
| KLA-Tencor Corp. Þ | | | | 7,403 | | 355,936 |
| Linear Technology Corp. Þ | | | | 9,023 | | 274,840 |
| LSI Logic Corp. * Þ | | | | 29,103 | | 161,522 |
| MEMC Electronic Materials, Inc. * | | | | 9,148 | | 709,702 |
| Microchip Technology, Inc. | | | | 8,837 | | 254,417 |
| Micron Technology, Inc. * Þ | | | | 30,762 | | 255,940 |
| National Semiconductor Corp. | | | | 9,771 | | 223,365 |
| Novellus Systems, Inc. * | | | | 4,720 | | 122,767 |
| NVIDIA Corp. * | | | | 22,305 | | 703,500 |
| Teradyne, Inc. * Þ | | | | 7,057 | | 76,851 |
| Texas Instruments, Inc. | | | | 58,082 | | 1,833,649 |
| Xilinx, Inc. | | | | 12,026 | | 263,369 |
| |
|
| | | | | | | 13,873,817 |
| |
|
| |
| Software 3.4% | | | | | | |
| Adobe Systems, Inc. * | | | | 23,916 | | 1,007,820 |
| Autodesk, Inc. * | | | | 9,348 | | 440,197 |
| BMC Software, Inc. * | | | | 8,177 | | 270,495 |
| CA, Inc. | | | | 15,796 | | 386,844 |
| Citrix Systems, Inc. * | | | | 7,710 | | 285,116 |
| Compuware Corp. * | | | | 11,632 | | 96,080 |
| Electronic Arts, Inc. * | | | | 12,642 | | 710,354 |
| Intuit, Inc. * | | | | 13,774 | | 403,854 |
| Microsoft Corp. | | | | 327,701 | | 11,010,754 |
| Novell, Inc. * | | | | 14,219 | | 99,818 |
| Oracle Corp. * | | | | 160,013 | | 3,229,062 |
| Symantec Corp. * | | | | 36,555 | | 650,679 |
| |
|
| | | | | | | 18,591,073 |
| |
|
| |
| MATERIALS 3.2% | | | | | | |
| Chemicals 1.7% | | | | | | |
| Air Products & Chemicals, Inc. | | | | 8,782 | | 869,769 |
| Ashland, Inc. | | | | 2,272 | | 111,873 |
| Dow Chemical Co. | | | | 38,613 | | 1,619,429 |
| E.I. DuPont de Nemours & Co. | | | | 37,413 | | 1,726,610 |
| Eastman Chemical Co. | | | | 3,416 | | 219,341 |
| Ecolab, Inc. | | | | 7,079 | | 339,084 |
| Hercules, Inc. * | | | | 4,715 | | 91,518 |
| International Flavors & Fragrances, Inc. | | | | 3,306 | | 165,763 |
| Monsanto Co. | | | | 22,169 | | 2,202,934 |
| PPG Industries, Inc. | | | | 6,668 | | 457,692 |
| Praxair, Inc. | | | | 13,000 | | 1,109,940 |
| Rohm & Haas Co. Þ | | | | 5,161 | | 280,604 |
| |
| |
| See Combined Notes to Financial Statements | | | | | | |
SCHEDULE OF INVESTMENTS continued
Market Index Fund
November 30, 2007 (unaudited)
| Sigma-Aldrich Corp. | | | | | | 5,336 | | 280,940 |
| |
|
| | | | | | | | | 9,475,497 |
| |
|
| |
| Construction Materials 0.1% | | | | |
| Vulcan Materials Co. Þ | | | | | | 4,390 | | 389,832 |
| |
|
| |
| Containers & Packaging 0.1% | | | | |
| Ball Corp. | | | | | | 4,162 | | 192,492 |
| Bemis Co., Inc. Þ | | | | | | 4,247 | | 115,221 |
| Pactiv Corp. * | | | | | | 5,313 | | 134,950 |
| Sealed Air Corp. | | | | | | 6,564 | | 153,401 |
| Temple-Inland, Inc. Þ | | | | | | 4,307 | | 197,993 |
| |
|
| | | | | | | | | 794,057 |
| |
|
| |
| Metals & Mining 1.0% | | | | | | | | |
| Alcoa, Inc. | | | | | | 35,930 | | 1,306,774 |
| Allegheny Technologies, Inc. | | | | | | 4,154 | | 406,054 |
| Freeport-McMoRan Copper & Gold, Inc. | | | | 15,515 | | 1,534,899 |
| Newmont Mining Corp. | | | | | | 18,352 | | 911,911 |
| NuCor Corp. | | | | | | 11,701 | | 692,816 |
| Titanium Metals Corp. * Þ | | | | | | 3,560 | | 105,625 |
| United States Steel Corp. | | | | | | 4,805 | | 469,448 |
| |
|
| | | | | | | | | 5,427,527 |
| |
|
| |
| Paper & Forest Products 0.3% | | | | | | |
| International Paper Co. | | | | | | 17,462 | | 589,343 |
| MeadWestvaco Corp. Þ | | | | | | 7,455 | | 245,046 |
| Weyerhaeuser Co. | | | | | | 8,773 | | 642,008 |
| |
|
| | | | | | | | | 1,476,397 |
| |
|
| |
| TELECOMMUNICATION SERVICES 3.4% | | | | | | |
| Diversified Telecommunication Services 2.9% | | | | |
| AT&T, Inc. | | | | | | 247,880 | | 9,471,495 |
| CenturyTel, Inc. | | | | | | 4,549 | | 193,924 |
| Citizens Communications Co. | | | | | | 13,829 | | 179,500 |
| Embarq Corp. | | | | | | 6,201 | | 315,941 |
| Qwest Communications International, Inc. * Þ | | | | 64,934 | | 430,512 |
| Verizon Communications, Inc. | | | | 117,968 | | 5,097,397 |
| Windstream Corp. | | | | | | 19,403 | | 251,269 |
| |
|
| | | | | | | | | 15,940,038 |
| |
|
| |
| Wireless Telecommunication Services 0.5% | | | | |
| American Tower Corp., Class A * | | | | 16,697 | | 760,381 |
| Sprint Nextel Corp. | | | | | | 115,695 | | 1,795,587 |
| |
|
| | | | | | | | | 2,555,968 |
| |
|
| |
| UTILITIES 3.5% | | | | | | | | |
| Electric Utilities 2.1% | | | | | | | | |
| Allegheny Energy, Inc. * | | | | | | 6,750 | | 410,062 |
| American Electric Power Co., Inc. | | | | 16,225 | | 773,446 |
| Consolidated Edison, Inc. Þ | | | | | | 11,013 | | 533,580 |
| Duke Energy Corp. | | | | | | 51,219 | | 1,013,624 |
| Edison International | | | | | | 13,242 | | 741,287 |
| Entergy Corp. | | | | | | 7,953 | | 950,702 |
| Exelon Corp. | | | | | | 27,400 | | 2,221,318 |
| FirstEnergy Corp. | | | | | | 12,389 | | 849,390 |
| |
| See Combined Notes to Financial Statements | | | | | | |
SCHEDULE OF INVESTMENTS continued
Market Index Fund
November 30, 2007 (unaudited)
| FPL Group, Inc. | | | | 16,535 | | 1,153,482 |
| Pepco Holdings, Inc. | | | | 7,865 | | 221,006 |
| Pinnacle West Capital Corp. | | | | 4,077 | | 174,740 |
| PPL Corp. | | | | 15,570 | | 793,447 |
| Progress Energy, Inc. | | | | 10,523 | | 513,733 |
| Southern Co. | | | | 30,744 | | 1,156,589 |
| |
|
| | | | | | | 11,506,406 |
| |
|
| |
| Gas Utilities 0.1% | | | | | | |
| Nicor, Inc. Þ | | | | 1,834 | | 77,285 |
| Questar Corp. | | | | 7,016 | | 375,005 |
| |
|
| | | | | | | 452,290 |
| |
|
| |
| Independent Power Producers & Energy Traders 0.3% | | | | | | |
| AES Corp. * | | | | 27,174 | | 593,752 |
| Constellation Energy Group, Inc. | | | | 7,336 | | 735,140 |
| Dynegy, Inc., Class A * | | | | 20,142 | | 153,281 |
| |
|
| | | | | | | 1,482,173 |
| |
|
| |
| Multi-Utilities 1.0% | | | | | | |
| Ameren Corp. | | | | 8,438 | | 454,386 |
| CenterPoint Energy, Inc. Þ | | | | 13,054 | | 233,014 |
| CMS Energy Corp. Þ | | | | 9,128 | | 159,101 |
| Dominion Resources, Inc. Þ | | | | 23,656 | | 1,117,273 |
| DTE Energy Co. | | | | 6,936 | | 340,211 |
| Integrys Energy Group, Inc. Þ | | | | 3,089 | | 157,570 |
| NiSource, Inc. | | | | 11,143 | | 206,257 |
| PG&E Corp. | | | | 14,362 | | 664,530 |
| Public Service Enterprise Group, Inc. | | | | 10,335 | | 989,473 |
| Sempra Energy | | | | 10,731 | | 671,975 |
| TECO Energy, Inc. | | | | 8,557 | | 148,207 |
| Xcel Energy, Inc. Þ | | | | 17,065 | | 394,372 |
| |
|
| | | | | | | 5,536,369 |
| |
|
| Total Common Stocks (cost $351,605,629) | | | | | | 530,069,919 |
| |
|
| |
| INVESTMENTS OF CASH COLLATERAL FROM SECURITIES LOANED 4.5% | | |
| MUTUAL FUND SHARES 4.5% | | | | | | |
| Navigator Prime Portfolio, 4.79% § (cost $24,494,657) | | | | 24,494,657 | | 24,494,657 |
| |
|
| |
| | | | | Principal | | |
| | | | | Amount | | Value |
|
| |
| SHORT-TERM INVESTMENTS 2.5% | | | | | | |
| U.S. TREASURY OBLIGATIONS 0.1% | | | | | | |
| U.S. Treasury Bills: | | | | | | |
| 3.15%, 02/21/2008 ß ƒ | | $ 100,000 | | 99,300 |
| 3.39%, 02/07/2008 ß ƒ | | | | 500,000 | | 496,892 |
| 3.53%, 12/27/2007 ß ƒ | | | | 100,000 | | 99,765 |
| 3.95%, 01/10/2008 ß ƒ | | | | 50,000 | | 49,792 |
| |
|
| | | | | | | 745,749 |
| |
|
| |
| | | | | Shares | | Value |
|
| |
| MUTUAL FUND SHARES 2.4% | | | | | | |
| Evergreen Institutional Money Market Fund, Class I, 4.88% q ø | | | | 13,091,431 | | 13,091,431 |
| |
|
| |
| |
| See Combined Notes to Financial Statements | | | | | | |
SCHEDULE OF INVESTMENTS continued
Market Index Fund
November 30, 2007 (unaudited)
| Total Short-Term Investments (cost $13,837,180) | | 13,837,180 |
| |
|
| Total Investments (cost $389,937,466) 104.2% | | 568,401,756 |
| Other Assets and Liabilities (4.2%) | | (23,091,474) |
| |
|
| Net Assets 100.0% | | $ 545,310,282 |
| |
|
| * | | Non-income producing security |
| Þ | | All or a portion of this security is on loan. |
| ° | | Investment in non-controlled affiliate. The Fund owns shares of Wachovia Corporation with a cost basis of $2,792,832 |
| | | at November 30, 2007. The Fund earned $99,043 of income from Wachovia Corporation during the six months ended |
| | | November 30, 2007 which is included in income from affiliates. |
| § | | Rate shown is the 1-day annualized yield at period end. |
| ß | | Rate shown represents the yield to maturity at date of purchase. |
| ƒ | | All or a portion of this security was pledged to cover initial margin requirements for open futures contracts. |
| q | | Rate shown is the 7-day annualized yield at period end. |
| ø | | Evergreen Investment Management Company, LLC is the investment advisor to both the Fund and the money market |
| | | fund. |
| The following table shows the percent of total long-term investments by sector as of November 30, 2007: |
| |
| Financials | | 18.4% | |
| Information Technology | | 16.3% | |
| Health Care | | 12.3% | |
| Energy | | 11.9% | |
| Industrials | | 11.6% | |
| Consumer Staples | | 10.3% | |
| Consumer Discretionary | | 8.8% | |
| Utilities | | 3.6% | |
| Telecommunication Services | | 3.5% | |
| Materials | | 3.3% | |
| |
| |
| | | 100.0% | |
| |
| |
See Combined Notes to Financial Statements
Market Index Fund
STATEMENT OF ASSETS AND LIABILITIES
November 30, 2007 (unaudited)
| Assets | | |
| Investments in securities, at value (cost $374,053,203) including $25,987,396 of securities loaned | | $ 551,984,533 |
| Investments in affiliates, at value (cost $15,884,263) | | 16,417,223 |
|
| Total investments | | 568,401,756 |
| Receivable for securities sold | | 213,580 |
| Dividends receivable | | 1,161,161 |
| Receivable for daily variation margin on open futures contracts | | 125,460 |
| Receivable for securities lending income | | 4,202 |
| Receivable from investment advisor | | 5,096 |
|
| Total assets | | 569,911,255 |
|
| Liabilities | | |
| Payable for securities purchased | | 49,955 |
| Payable for securities on loan | | 24,494,657 |
| Due to related parties | | 4,509 |
| Accrued expenses and other liabilities | | 51,852 |
|
| Total liabilities | | 24,600,973 |
|
| Net assets | | $ 545,310,282 |
|
| Net assets represented by | | |
| Paid-in capital | | $ 340,295,714 |
| Undistributed net investment income | | 14,318,264 |
| Accumulated net realized gains on investments | | 12,365,161 |
| Net unrealized gains on investments | | 178,331,143 |
|
| Total net assets | | $ 545,310,282 |
|
| Shares outstanding (unlimited number of shares authorized) | | |
| Class I | | 38,562,596 |
|
| Net asset value per share | | |
| Class I | | $ 14.14 |
|
See Combined Notes to Financial Statements
Market Index Fund
STATEMENT OF OPERATIONS
Six Months Ended November 30, 2007 (unaudited)
| Investment income | | |
| Dividends | | $ 4,973,465 |
| Income from affiliates | | 357,020 |
| Securities lending | | 29,120 |
| Interest | | 11,887 |
|
| Total investment income | | 5,371,492 |
|
| Expenses | | |
| Advisory fee | | 887,617 |
| Administrative services fee | | 275,603 |
| Transfer agent fees | | 31 |
| Trustees' fees and expenses | | 6,198 |
| Printing and postage expenses | | 8,363 |
| Custodian and accounting fees | | 70,913 |
| Registration and filing fees | | 956 |
| Professional fees | | 16,978 |
| Other | | 11,287 |
|
| Total expenses | | 1,277,946 |
| Less: Expense reductions | | (5,466) |
| Fee waivers and expense reimbursements | | (1,204,522) |
|
| Net expenses | | 67,958 |
|
| Net investment income | | 5,303,534 |
|
| Net realized and unrealized gains or losses on investments | | |
| Net realized gains on: | | |
| Securities | | 5,929,827 |
| Futures contracts | | 98,219 |
|
| Net realized gains on investments | | 6,028,046 |
| Net change in unrealized gains or losses on investments | | (24,386,964) |
|
| Net realized and unrealized gains or losses on investments | | (18,358,918) |
|
| Net decrease in net assets resulting from operations | | $ (13,055,384) |
|
See Combined Notes to Financial Statements
Market Index Fund
STATEMENTS OF CHANGES IN NET ASSETS
| | | Six Months Ended | | | | |
| | | November 30, 2007 | | Year Ended |
| | | (unaudited) | | May 31, 2007 |
|
| Operations | | | | | | | | |
| Net investment income | | $ 5,303,534 | | $ 9,131,218 |
| Net realized gains on investments | | | | 6,028,046 | | | | 6,502,723 |
| Net change in unrealized gains or | | | | | | | | |
| losses on investments | | | | (24,386,964) | | | | 82,150,520 |
|
| Net increase (decrease) in net assets | | | | | | | | |
| resulting from operations | | | | (13,055,384) | | | | 97,784,461 |
|
| Distributions to shareholders from | | | | | | | | |
| Net investment income | | | | 0 | | | | (11,565,258) |
| Net realized gains | | | | 0 | | | | (87,788,507) |
|
| Total distributions to shareholders | | | | 0 | | | | (99,353,765) |
|
| | | Shares | | | | Shares | | |
| |
| Capital share transactions | | | | | | | | |
| Proceeds from shares sold | | 0 | | 0 | | 3,940,886 | | 64,000,000 |
| Net asset value of shares issued in | | | | | | | | |
| reinvestment of distributions | | 0 | | 0 | | 7,339,094 | | 99,353,765 |
| Payment for shares redeemed | | 0 | | 0 | | (750,751) | | (10,000,000) |
|
| Net increase in net assets resulting from | | | | | | | | |
| capital share transactions | | | | 0 | | | | 153,353,765 |
|
| Total increase (decrease) in net assets | | | | (13,055,384) | | | | 151,784,461 |
| Net assets | | | | | | | | |
| Beginning of period | | | | 558,365,666 | | | | 406,581,205 |
|
| End of period | | $ 545,310,282 | | $ 558,365,666 |
|
| Undistributed net investment income | | $ 14,318,264 | | $ 9,014,730 |
|
See Combined Notes to Financial Statements
Market Index Growth Fund
FUND AT A GLANCE
as of November 30, 2007
MANAGEMENT TEAM
Investment Advisor:
Evergreen Investment Management Company, LLC
Portfolio Manager:
William E. Zieff
CURRENT INVESTMENT STYLE

| Source: Morningstar, Inc. | | |
| Morningstar’s style box is based on a portfolio date as of 9/30/2007. |
| The Equity style box placement is based on 10 growth and valuation measures for |
| each fund holding and the median size of the companies in which the fund invests. |
| |
| |
| PERFORMANCE AND RETURNS |
| Portfolio inception date: 10/15/2002 |
| |
| | | Class I |
| Class inception date | | 10/15/2002 |
| 6-month return | | 2.28% |
| Average annual return | | |
| 1-year | | 12.61% |
| 5-year | | 10.57% |
| Since portfolio inception | | 11.31% |
| |
Past performance is no guarantee of future results. The performance quoted represents
past performance and current performance may be lower or higher. The investment return
and principal value of an investment will fluctuate so that investors’ shares, when redeemed,
may be worth more or less than their original cost. Performance includes the reinvestment
of income dividends and capital gain distributions. |
| |
The advisor is waiving its advisory fee and reimbursing the fund for a portion of other expenses.
Had the fee not been waived and expenses not reimbursed, returns would have been lower. |
| |
| LONG-TERM GROWTH | | |
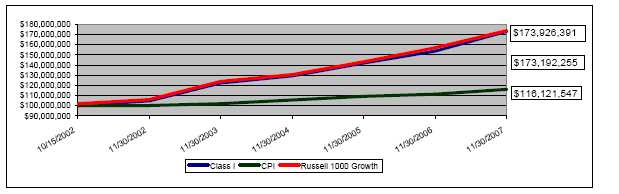
Comparison of a $100,000,000 investment in the Evergreen Market Index Growth Fund Class I shares versus a similar investment in the Russell 1000 Growth Index (Russell 1000 Growth) and the Consumer Price Index (CPI).
The Russell 1000 Growth is an unmanaged market index and does not include transaction costs associated with buying and selling securities, any mutual fund fees or expenses or any taxes. The CPI is a commonly used measure of inflation and does not represent an investment return. It is not possible to invest directly in an index.
The fund is only offered to certain pension plans having at least $100 million. Class I shares are sold without a front-end or deferred sales charge. The minimum initial investment for the fund is $100 million, which may be waived in certain situations. There is no minimum amount required for subsequent purchases.
The fund's investment objective may be changed without a vote of the fund's shareholders.
“Russell 1000 Growth Index” is a trademark and service mark of Frank Russell Company (FRC) and has been licensed for use by Evergreen Investments. The product is not sponsored, endorsed, sold or promoted by FRC and FRC makes no representation regarding the advisability of investing in the product.
All data is as of November 30, 2007, and subject to change.
Market Index Growth Fund
ABOUT YOUR FUND’S EXPENSES
The Example below is intended to describe the fees and expenses borne by shareholders and the impact of those costs on your investment.
Example
As a shareholder of the fund, you incur two types of costs: (1) transaction costs, including sales charges (loads), redemption fees and exchange fees; and (2) ongoing costs, including management fees, distribution (12b-1) fees and other fund expenses. This Example is intended to help you understand your ongoing costs (in dollars) of investing in the fund and to compare these costs with the ongoing costs of investing in other mutual funds. The Example is based on an investment of $1,000 invested at the beginning of the period and held for the entire period from June 1, 2007 to November 30, 2007.
The example illustrates your fund’s costs in two ways:
• Actual expenses
The section in the table under the heading “Actual” provides information about actual account values and actual expenses. You may use the information in these columns, together with the amount you invested, to estimate the expenses that you paid over the period. Simply divide your account value by $1,000 (for example, an $8,600 account value divided by $1,000 = 8.6), then multiply the result by the number in the appropriate column for your share class, in the column entitled “Expenses Paid During Period” to estimate the expenses you paid on your account during this period.
• Hypothetical example for comparison purposes
The section in the table under the heading “Hypothetical (5% return before expenses)” provides information about hypothetical account values and hypothetical expenses based on the fund’s actual expense ratio and an assumed rate of return of 5% per year before expenses, which is not the fund’s actual return. The hypothetical account values and expenses may not be used to estimate the actual ending account balance or expenses you paid for the period. You may use this information to compare the ongoing costs of investing in the fund and other funds. To do so, compare this 5% hypothetical example with the 5% hypothetical examples that appear in the shareholder reports of the other funds.
Please note that the expenses shown in the table are meant to highlight your ongoing costs only and do not reflect any transactional costs, such as sales charges (loads), redemption fees or exchange fees. Therefore, the section in the table under the heading “Hypothetical (5% return before expenses)” is useful in comparing ongoing costs only, and will not help you determine the relative total costs of owning different funds. In addition, if these transactional costs were included, your costs would have been higher.
| | | Beginning | | Ending | | |
| | | Account | | Account | | Expenses |
| | | Value | | Value | | Paid During |
| | | 6/1/2007 | | 11/30/2007 | | Period* |
| Actual | | | | | | |
| Class I | | $1,000.00 | | $1,022.79 | | $0.15 |
| Hypothetical | | | | | | |
| (5% return before expenses) | | | | | | |
| Class I | | $1,000.00 | | $1,024.85 | | $0.15 |
*Expenses are equal to the Fund's annualized expense ratio (0.03% for Class I), multiplied by the average account value over the period, multiplied by 183 / 366 days.
Market Index Growth Fund
FINANCIAL HIGHLIGHTS - CLASS I
(For a share outstanding throughout each period)
| | | | | Six Months Ended | | | | | | | | | | |
| | | | | November 30, | | Year Ended May 31, |
| | | | 2007 | |
|
| | | | | (unaudited) | | 2007 | | 2006 | | 2005 | | 2004 | | 20031 |
| | | |
|
| Net asset value, beginning of period | | $15.36 | | $13.44 | | $12.99 | | $12.77 | | $10.86 | | $10.00 |
|
| Income from investment operations | | | | | | | | | | | | |
| Net investment income (loss) | | 0.10 | | 0.14 | | 0.18 | | 0.15 | | 0.12 | | 0.072 |
| Net realized and unrealized gains or losses on | | | | | | | | | | | | |
| | | investments | | 0.25 | | 2.53 | | 0.62 | | 0.27 | | 1.83 | | 0.81 |
| |
|
| Total from investment operations | | 0.35 | | 2.67 | | 0.80 | | 0.42 | | 1.95 | | 0.88 |
|
| Distributions to shareholders from | | | | | | | | | | | | |
| Net investment income | | 0 | | (0.16) | | (0.15) | | (0.12) | | (0.04) | | (0.02) |
| Net realized gains | | 0 | | (0.59) | | (0.20) | | (0.08) | | 0 | | 0 |
| |
|
| Total distributions to shareholders | | 0 | | (0.75) | | (0.35) | | (0.20) | | (0.04) | | (0.02) |
|
| Net asset value, end of period | | $15.71 | | $15.36 | | $13.44 | | $12.99 | | $12.77 | | $10.86 |
|
| Total return | | 2.28% | | 20.34% | | 6.11% | | 3.28% | | 17.97% | | 8.83% |
|
| Ratios and supplemental data | | | | | | | | | | | | |
| Net assets, end of period (thousands) | | $914,655 | | $945,116 | | $721,771 | | $854,566 | | $678,560 | | $529,545 |
| Ratios to average net assets | | | | | | | | | | | | |
| | | Expenses including waivers/reimbursements but | | 3 | | | | | | | | | | 3 |
| | | excluding expense reductions | | 0.03% | | 0.03% | | 0.03% | | 0.03% | | 0.02% | | 0.02% |
| | | Expenses excluding waivers/reimbursements | | 3 | | | | | | | | | | 3 |
| | | and expense reductions | | 0.46% | | 0.46% | | 0.46% | | 0.46% | | 0.45% | | 0.48% |
| | | Net investment income (loss) | | 1.14%3 | | 1.23% | | 1.12% | | 1.45% | | 1.03% | | 1.16%3 |
| Portfolio turnover rate | | 19% | | 18% | | 25% | | 15% | | 9% | | 2% |
|
| 1 | | For the period from October 15, 2002 (commencement of class operations), to May 31, 2003. |
| 2 | | Net investment income (loss) per share is based on average shares outstanding during the period. |
| 3 | | Annualized |
See Combined Notes to Financial Statements
SCHEDULE OF INVESTMENTS
Market Index Growth Fund
November 30, 2007 (unaudited)
| | | | | Shares | | Value |
|
| |
| COMMON STOCKS 99.2% | | | | | | |
| CONSUMER DISCRETIONARY 11.8% | | | | |
| Auto Components 0.4% | | | | | | |
| Autoliv, Inc. | | | | 5,505 | | $ 321,492 |
| BorgWarner, Inc. | | | | 1,417 | | 136,896 |
| Gentex Corp. | | | | 16,670 | | 330,400 |
| Goodyear Tire & Rubber Co. * Þ | | | | 24,496 | | 704,260 |
| Johnson Controls, Inc. | | | | 54,828 | | 2,117,457 |
| Wabco Holdings, Inc. | | | | 7,028 | | 330,035 |
| |
|
| | | | | | | 3,940,540 |
| |
|
| |
| Automobiles 0.2% | | | | | | |
| Harley-Davidson, Inc. | | | | 28,209 | | 1,354,596 |
| Thor Industries, Inc. Þ | | | | 3,684 | | 129,861 |
| |
|
| | | | | | | 1,484,457 |
| |
|
| |
| Diversified Consumer Services 0.3% | | | | |
| Apollo Group, Inc., Class A * | | | | 16,892 | | 1,292,576 |
| Career Education Corp. * | | | | 11,098 | | 318,845 |
| H&R Block, Inc. | | | | 37,721 | | 742,349 |
| ITT Educational Services, Inc. * | | | | 4,757 | | 538,207 |
| Weight Watchers International, Inc. * Þ | | 4,137 | | 197,542 |
| |
|
| | | | | | | 3,089,519 |
| |
|
| |
| Hotels, Restaurants & Leisure 2.2% | | | | |
| Boyd Gaming Corp. Þ | | | | 6,571 | | 254,429 |
| Brinker International, Inc. | | | | 12,282 | | 282,854 |
| Burger King Holdings, Inc. * | | | | 7,421 | | 195,172 |
| Carnival Corp. | | | | 21,213 | | 957,131 |
| Cheesecake Factory, Inc. * Þ | | | | 8,406 | | 195,776 |
| Choice Hotels International, Inc. Þ | | | | 4,145 | | 143,624 |
| Darden Restaurants, Inc. | | | | 16,515 | | 657,132 |
| Harrah's Entertainment, Inc. | | | | 12,517 | | 1,102,372 |
| International Game Technology | | | | 38,832 | | 1,695,405 |
| Las Vegas Sands Corp. * | | | | 12,185 | | 1,381,779 |
| Marriott International, Inc., Class A | | | | 38,449 | | 1,441,838 |
| McDonald's Corp. | | | | 28,867 | | 1,687,853 |
| MGM MIRAGE * | | | | 13,816 | | 1,195,084 |
| Orient Express Hotels, Ltd. | | | | 4,686 | | 290,110 |
| Panera Bread Co., Class A * Þ | | | | 3,317 | | 132,912 |
| Penn National Gaming, Inc. * | | | | 8,577 | | 510,760 |
| Scientific Games Corp., Class A * Þ | | | | 7,577 | | 245,419 |
| Starbucks Corp. * | | | | 86,529 | | 2,023,913 |
| Starwood Hotels & Resorts Worldwide, Inc. | | 23,514 | | 1,262,232 |
| Tim Hortons, Inc. Þ | | | | 22,120 | | 850,072 |
| Wendy's International, Inc. | | | | 10,192 | | 285,682 |
| Wyndham Worldwide Corp. * | | | | 1,576 | | 45,972 |
| Wynn Resorts, Ltd. * Þ | | | | 6,406 | | 813,178 |
| Yum! Brands, Inc. | | | | 61,185 | | 2,273,023 |
| |
|
| | | | | | | 19,923,722 |
| |
|
| |
| Household Durables 0.4% | | | | | | |
| Black & Decker Corp. Þ | | | | 3,777 | | 312,169 |
| |
| See Combined Notes to Financial Statements | | | | |
SCHEDULE OF INVESTMENTS continued
Market Index Growth Fund
November 30, 2007 (unaudited)
| Centex Corp. Þ | | 716 | | 14,936 |
| Garmin, Ltd. Þ | | 13,492 | | 1,448,366 |
| Harman International Industries, Inc. | | 7,064 | | 519,910 |
| Jarden Corp. * Þ | | 4,114 | | 108,445 |
| Newell Rubbermaid, Inc. | | 16,843 | | 451,055 |
| NVR, Inc. * Þ | | 207 | | 101,844 |
| Pulte Homes, Inc. Þ | | 8,803 | | 89,967 |
| Stanley Works | | 3,126 | | 163,021 |
| Whirlpool Corp. | | 6,601 | | 534,417 |
| |
|
| | | | | 3,744,130 |
| |
|
| |
| Internet & Catalog Retail 0.5% | | | | |
| Amazon.com, Inc. * Þ | | 35,557 | | 3,220,042 |
| IAC/InterActiveCorp. | | 1,367 | | 38,044 |
| Liberty Interactive Group, Ser. A * | | 42,562 | | 857,624 |
| NutriSystem, Inc. Þ | | 4,013 | | 100,927 |
| |
|
| | | | | 4,216,637 |
| |
|
| |
| Leisure Equipment & Products 0.1% | | | | |
| Hasbro, Inc. | | 5,789 | | 160,760 |
| Mattel, Inc. | | 19,197 | | 383,556 |
| Pool Corp. Þ | | 5,759 | | 122,782 |
| |
|
| | | | | 667,098 |
| |
|
| |
| Media 3.2% | | | | |
| Cablevision Systems Corp., Class A * | | 8,500 | | 229,755 |
| Central European Media Enterprises, Ltd., Class A | | 3,625 | | 397,699 |
| Clear Channel Communications, Inc. | | 12,408 | | 445,447 |
| Clear Channel Outdoor Holdings, Inc. * Þ | | 4,645 | | 126,623 |
| Comcast Corp., Class A * Þ | | 211,469 | | 4,343,573 |
| CTC Media, Inc. * Þ | | 6,071 | | 146,068 |
| DIRECTV Group, Inc. * | | 83,317 | | 2,072,094 |
| Discovery Holding Co., Class A * | | 18,071 | | 442,017 |
| Dow Jones & Co., Inc. | | 6,969 | | 416,398 |
| DreamWorks Animation SKG, Inc., Class A * | | 6,108 | | 160,640 |
| EchoStar Communications Corp., Class A * | | 24,319 | | 1,048,149 |
| Getty Images, Inc. * Þ | | 2,832 | | 82,553 |
| Harte-Hanks, Inc. Þ | | 4,082 | | 68,578 |
| Interpublic Group of Cos. * Þ | | 33,793 | | 320,696 |
| John Wiley & Sons, Inc., Class A | | 5,930 | | 249,949 |
| Lamar Advertising Co., Class A Þ | | 9,660 | | 502,417 |
| Liberty Global, Inc., Class A * Þ | | 22,827 | | 927,233 |
| McGraw-Hill Cos. | | 40,089 | | 1,967,568 |
| Meredith Corp. | | 5,618 | | 309,271 |
| New York Times Co., Class A Þ | | 4,211 | | 69,481 |
| News Corp., Class A | | 175,951 | | 3,707,288 |
| Omnicom Group, Inc. | | 38,640 | | 1,883,700 |
| Regal Entertainment Group, Class A Þ | | 7,408 | | 146,604 |
| Sirius Satellite Radio, Inc. * Þ | | 170,795 | | 654,145 |
| Time Warner Cable, Inc. | | 10,015 | | 260,690 |
| Time Warner, Inc. | | 63,355 | | 1,093,507 |
| Viacom, Inc., Class B * | | 71,159 | | 2,990,101 |
| Walt Disney Co. | | 101,616 | | 3,368,570 |
| Warner Music Group Corp. Þ | | 2,314 | | 17,471 |
| |
| |
| |
| See Combined Notes to Financial Statements | | | | |
SCHEDULE OF INVESTMENTS continued
Market Index Growth Fund
November 30, 2007 (unaudited)
| XM Satellite Radio Holdings, Inc., Class A * Þ | | 33,358 | | 520,385 |
| |
|
| | | | | 28,968,670 |
| |
|
| |
| Multi-line Retail 1.2% | | | | |
| Big Lots, Inc. * Þ | | 12,484 | | 233,076 |
| Dollar Tree Stores, Inc. * | | 11,390 | | 326,437 |
| Family Dollar Stores, Inc. Þ | | 16,408 | | 386,408 |
| J.C. Penney Co., Inc. | | 26,375 | | 1,163,665 |
| Kohl's Corp. * | | 37,510 | | 1,848,493 |
| Nordstrom, Inc. Þ | | 28,527 | | 956,796 |
| Saks, Inc. Þ | | 14,149 | | 291,469 |
| Target Corp. | | 99,909 | | 6,000,535 |
| |
|
| | | | | 11,206,879 |
| |
|
| |
| Specialty Retail 2.7% | | | | |
| Abercrombie & Fitch Co., Class A | | 10,251 | | 840,992 |
| Advance Auto Parts, Inc. * | | 11,789 | | 423,932 |
| American Eagle Outfitters, Inc. | | 21,694 | | 496,576 |
| AnnTaylor Stores Corp. * Þ | | 6,044 | | 184,040 |
| AutoZone, Inc. * | | 5,417 | | 604,700 |
| Barnes & Noble, Inc. | | 535 | | 20,571 |
| Bed, Bath & Beyond, Inc. * | | 32,371 | | 1,018,068 |
| Best Buy Co., Inc. Þ | | 40,309 | | 2,057,774 |
| CarMax, Inc. * Þ | | 25,255 | | 577,582 |
| Chico's FAS, Inc. * Þ | | 20,558 | | 232,511 |
| Circuit City Stores, Inc. Þ | | 8,613 | | 55,726 |
| Coldwater Creek, Inc. * Þ | | 7,210 | | 59,482 |
| Dick's Sporting Goods, Inc. * Þ | | 9,441 | | 295,126 |
| GameStop Corp., Class A * | | 18,387 | | 1,056,333 |
| Guess?, Inc. * | | 6,348 | | 297,912 |
| Home Depot, Inc. | | 114,496 | | 3,270,006 |
| Limited Brands, Inc. | | 37,200 | | 746,976 |
| Lowe's Cos. | | 175,882 | | 4,293,279 |
| O'Reilly Automotive, Inc. * | | 13,331 | | 438,057 |
| Office Depot, Inc. * | | 32,099 | | 550,177 |
| OfficeMax, Inc. | | 4,040 | | 100,717 |
| PETsMART, Inc. | | 15,883 | | 452,348 |
| RadioShack Corp. Þ | | 11,116 | | 205,646 |
| Ross Stores, Inc. | | 16,229 | | 428,121 |
| Sherwin-Williams Co. | | 12,972 | | 815,031 |
| Staples, Inc. | | 83,544 | | 1,979,993 |
| Tiffany & Co. | | 15,921 | | 739,212 |
| TJX Cos. | | 53,109 | | 1,558,218 |
| Tractor Supply Co. * Þ | | 4,034 | | 165,475 |
| Urban Outfitters, Inc. * Þ | | 13,227 | | 346,547 |
| Williams-Sonoma, Inc. Þ | | 10,629 | | 309,410 |
| |
|
| | | | | 24,620,538 |
| |
|
| |
| Textiles, Apparel & Luxury Goods 0.6% | | | | |
| Coach, Inc. * | | 43,352 | | 1,610,093 |
| Crocs, Inc. Þ | | 9,337 | | 364,423 |
| Hanesbrands, Inc. * | | 11,262 | | 317,926 |
| Liz Claiborne, Inc. Þ | | 830 | | 20,825 |
| Nike, Inc., Class B | | 41,629 | | 2,732,944 |
| Phillips-Van Heusen Corp. | | 6,539 | | 277,385 |
| |
| |
| |
| See Combined Notes to Financial Statements | | | | |
SCHEDULE OF INVESTMENTS continued
Market Index Growth Fund
November 30, 2007 (unaudited)
| Polo Ralph Lauren Corp. | | | | 7,152 | | 493,345 |
| |
|
| | | | | | | 5,816,941 |
| |
|
| |
| CONSUMER STAPLES 10.3% | | | | |
| Beverages 3.3% | | | | | | |
| Anheuser-Busch Companies, Inc. | | 55,913 | | 2,947,733 |
| Brown-Forman Corp., Class B | | 6,399 | | 452,025 |
| Coca-Cola Co. | | | | 178,076 | | 11,058,520 |
| Hansen Natural Corp. Þ | | | | 7,963 | | 345,674 |
| Pepsi Bottling Group, Inc. | | | | 4,130 | | 176,227 |
| PepsiCo, Inc. | | | | 190,272 | | 14,685,193 |
| |
|
| | | | | | | 29,665,372 |
| |
|
| |
| Food & Staples Retailing 2.7% | | | | |
| Costco Wholesale Corp. | | | | 35,894 | | 2,419,256 |
| CVS Caremark Corp. | | | | 92,268 | | 3,699,024 |
| Kroger Co. | | | | 52,762 | | 1,516,908 |
| Sysco Corp. | | | | 72,183 | | 2,346,669 |
| Wal-Mart Stores, Inc. | | | | 206,728 | | 9,902,271 |
| Walgreen Co. | | | | 116,509 | | 4,263,064 |
| Whole Foods Market, Inc. Þ | | 16,513 | | 710,224 |
| |
|
| | | | | | | 24,857,416 |
| |
|
| |
| Food Products 0.7% | | | | | | |
| Campbell Soup Co. | | | | 15,371 | | 564,423 |
| Dean Foods Co. | | | | 1,002 | | 24,990 |
| General Mills, Inc. | | | | 3,021 | | 181,713 |
| H.J. Heinz Co. | | | | 20,908 | | 988,948 |
| Hershey Co. Þ | | | | 13,892 | | 554,430 |
| Kellogg Co. | | | | 18,567 | | 1,003,361 |
| McCormick & Co., Inc. | | | | 10,119 | | 386,647 |
| Sara Lee Corp. | | | | 44,876 | | 755,263 |
| Wm. Wrigley Jr. Co. | | | | 24,631 | | 1,576,384 |
| |
|
| | | | | | | 6,036,159 |
| |
|
| |
| Household Products 2.0% | | | | |
| Church & Dwight Co. | | | | 7,239 | | 406,253 |
| Clorox Co. | | | | 14,870 | | 964,765 |
| Colgate-Palmolive Co. | | | | 55,086 | | 4,411,287 |
| Energizer Holdings, Inc. * | | | | 4,734 | | 537,924 |
| Kimberly-Clark Corp. | | | | 22,123 | | 1,544,407 |
| Procter & Gamble Co. | | | | 145,657 | | 10,778,618 |
| |
|
| | | | | | | 18,643,254 |
| |
|
| |
| Personal Products 0.3% | | | | |
| Alberto-Culver Co. | | | | 1,644 | | 42,021 |
| Avon Products, Inc. | | | | 47,264 | | 1,940,187 |
| Bare Escentuals, Inc. * Þ | | | | 4,541 | | 95,588 |
| Estee Lauder Cos., Class A | | 12,765 | | 572,893 |
| Herbalife, Ltd. | | | | 5,598 | | 234,389 |
| NBTY, Inc. * | | | | 6,460 | | 192,960 |
| |
|
| | | | | | | 3,078,038 |
| |
|
| |
| Tobacco 1.3% | | | | | | |
| Altria Group, Inc. | | | | 140,282 | | 10,880,272 |
| Carolina Group | | | | 7,511 | | 668,104 |
| |
| See Combined Notes to Financial Statements | | | | |
SCHEDULE OF INVESTMENTS continued
Market Index Growth Fund
November 30, 2007 (unaudited)
| UST, Inc. Þ | | | | 10,328 | | 597,991 |
| |
|
| | | | | | | 12,146,367 |
| |
|
| |
| ENERGY 8.1% | | | | | | |
| Energy Equipment & Services 4.6% | | | | |
| Baker Hughes, Inc. | | | | 37,418 | | 3,003,543 |
| BJ Services Co. | | | | 34,264 | | 842,209 |
| Cameron International Corp. * | | | | 12,865 | | 1,199,404 |
| Diamond Offshore Drilling, Inc. Þ | | | | 7,967 | | 927,598 |
| Dresser-Rand Group, Inc. * | | | | 10,025 | | 356,890 |
| ENSCO International, Inc. Þ | | | | 16,143 | | 869,301 |
| FMC Technologies, Inc. * | | | | 15,170 | | 843,149 |
| Global Industries, Ltd. * | | | | 10,753 | | 238,394 |
| Grant Prideco, Inc. * | | | | 14,887 | | 716,065 |
| Halliburton Co. | | | | 106,769 | | 3,908,813 |
| Nabors Industries, Ltd. * | | | | 28,989 | | 779,804 |
| National Oilwell Varco, Inc. * | | | | 41,494 | | 2,827,816 |
| Noble Corp. | | | | 31,310 | | 1,632,190 |
| Oceaneering International, Inc. * | | | | 6,369 | | 406,406 |
| Pride International, Inc. * | | | | 14,356 | | 473,317 |
| Rowan Companies, Inc. | | | | 9,228 | | 326,671 |
| Schlumberger, Ltd. | | | | 137,666 | | 12,864,888 |
| Smith International, Inc. | | | | 23,417 | | 1,468,714 |
| Superior Energy Services, Inc. * | | | | 9,426 | | 328,967 |
| Tetra Technologies, Inc. * Þ | | | | 8,482 | | 134,100 |
| Tidewater, Inc. Þ | | | | 4,319 | | 211,156 |
| Transocean, Inc. | | | | 36,215 | | 4,971,896 |
| Unit Corp. * | | | | 4,239 | | 189,568 |
| Weatherford International, Ltd. * | | | | 39,400 | | 2,467,228 |
| |
|
| | | | | | | 41,988,087 |
| |
|
| |
| Oil, Gas & Consumable Fuels 3.5% | | | | |
| Arch Coal, Inc. | | | | 16,659 | | 630,710 |
| Cabot Oil & Gas Corp. | | | | 11,319 | | 389,600 |
| Cheniere Energy, Inc. * Þ | | | | 4,964 | | 172,747 |
| Chesapeake Energy Corp. Þ | | | | 31,376 | | 1,187,582 |
| CNX Gas Corp. * Þ | | | | 3,260 | | 100,408 |
| Consol Energy, Inc. | | | | 21,270 | | 1,260,886 |
| Continental Resources, Inc. Þ | | | | 1,617 | | 38,517 |
| Denbury Resources, Inc. * | | | | 14,144 | | 754,158 |
| Exxon Mobil Corp. | | | | 134,235 | | 11,968,393 |
| Foundation Coal Holdings, Inc. | | | | 5,281 | | 239,969 |
| Frontier Oil Corp. | | | | 6,474 | | 286,151 |
| Frontline, Ltd. Þ | | | | 5,664 | | 263,659 |
| Helix Energy Solutions, Inc. * Þ | | | | 8,511 | | 345,461 |
| Holly Corp. | | | | 5,279 | | 255,768 |
| Massey Energy Co. | | | | 9,473 | | 321,608 |
| Noble Energy, Inc. | | | | 2,834 | | 204,161 |
| Patriot Coal Corp. | | | | 3,096 | | 104,669 |
| Peabody Energy Corp. Þ | | | | 30,951 | | 1,722,114 |
| Quicksilver Resources, Inc. * | | | | 5,852 | | 296,111 |
| Range Resources Corp. | | | | 17,290 | | 703,357 |
| Southwestern Energy Co. * | | | | 19,839 | | 987,387 |
| Sunoco, Inc. | | | | 14,186 | | 951,881 |
| Tesoro Corp. | | | | 15,960 | | 784,913 |
| |
| |
| |
| See Combined Notes to Financial Statements | | | | |
SCHEDULE OF INVESTMENTS continued
Market Index Growth Fund
November 30, 2007 (unaudited)
| Valero Energy Corp. | | | | 50,596 | | 3,292,282 |
| W&T Offshore, Inc. | | | | 2,046 | | 54,014 |
| Western Refining, Inc. Þ | | | | 1,653 | | 47,772 |
| Williams Cos. | | | | 58,550 | | 2,032,270 |
| XTO Energy, Inc. | | | | 45,186 | | 2,793,398 |
| |
|
| | | | | | | 32,189,946 |
| |
|
| |
| FINANCIALS 7.0% | | | | | | |
| Capital Markets 2.8% | | | | | | |
| Affiliated Managers Group, Inc. * Þ | | | | 3,480 | | 432,390 |
| Bank of New York Mellon Corp. | | | | 45,880 | | 2,200,405 |
| Blackrock, Inc. Þ | | | | 4,251 | | 843,271 |
| Charles Schwab Corp. | | | | 109,552 | | 2,663,209 |
| E*TRADE Financial Corp. * Þ | | | | 18,748 | | 86,241 |
| Eaton Vance Corp. | | | | 12,887 | | 563,935 |
| Federated Investors, Inc., Class B | | | | 10,178 | | 415,161 |
| Franklin Resources, Inc. | | | | 19,361 | | 2,384,888 |
| GLG Partners, Inc. | | | | 4,892 | | 67,265 |
| Goldman Sachs Group, Inc. | | | | 20,898 | | 4,736,323 |
| Investment Technology Group, Inc. * | | | | 5,178 | | 236,531 |
| Janus Capital Group, Inc. | | | | 15,876 | | 532,957 |
| Lazard, Ltd. Þ | | | | 6,022 | | 293,030 |
| Legg Mason, Inc. | | | | 6,342 | | 483,958 |
| Merrill Lynch & Co., Inc. | | | | 25,686 | | 1,539,619 |
| MF Global, Ltd. | | | | 6,154 | | 177,420 |
| Morgan Stanley | | | | 7,017 | | 369,936 |
| Northern Trust Corp. | | | | 21,733 | | 1,760,156 |
| SEI Investments Co. * | | | | 15,120 | | 469,022 |
| State Street Corp. | | | | 37,536 | | 2,998,751 |
| T. Rowe Price Group, Inc. | | | | 31,027 | | 1,907,540 |
| TD Ameritrade Holding Corp. * | | | | 29,006 | | 542,122 |
| |
|
| | | | | | | 25,704,130 |
| |
|
| |
| Commercial Banks 0.1% | | | | | | |
| Bank of Hawaii Corp. | | | | 1,951 | | 101,588 |
| Commerce Bancorp, Inc. Þ | | | | 6,416 | | 255,485 |
| Synovus Financial Corp. | | | | 12,210 | | 303,907 |
| |
|
| | | | | | | 660,980 |
| |
|
| |
| Consumer Finance 1.0% | | | | | | |
| American Express Co. | | | | 120,964 | | 7,134,457 |
| AmeriCredit Corp. * Þ | | | | 937 | | 10,747 |
| Discover Financial Services | | | | 3,177 | | 55,185 |
| First Marblehead Corp. Þ | | | | 7,146 | | 214,451 |
| SLM Corp. | | | | 48,057 | | 1,830,011 |
| |
|
| | | | | | | 9,244,851 |
| |
|
| |
| Diversified Financial Services 1.2% | | | | |
| CME Group, Inc., Class A | | | | 6,390 | | 4,208,454 |
| IntercontinentalExchange, Inc. | | | | 8,218 | | 1,372,077 |
| Moody's Corp. Þ | | | | 24,992 | | 941,199 |
| Nasdaq Stock Market, Inc. * | | | | 10,531 | | 456,624 |
| Nymex Holdings, Inc. Þ | | | | 10,756 | | 1,339,660 |
| NYSE Euronext | | | | 30,826 | | 2,669,531 |
| |
|
| | | | | | | 10,987,545 |
| |
|
| |
| See Combined Notes to Financial Statements | | | | |
SCHEDULE OF INVESTMENTS continued
Market Index Growth Fund
November 30, 2007 (unaudited)
| Insurance 0.8% | | | | | | |
| ACE, Ltd. | | | | 2,111 | | 126,301 |
| AFLAC, Inc. | | | | 52,337 | | 3,278,390 |
| American International Group, Inc. | | | | 18,327 | | 1,065,348 |
| Arthur J. Gallagher & Co. Þ | | | | 2,128 | | 55,924 |
| Brown & Brown, Inc. | | | | 13,071 | | 321,547 |
| CNA Financial Corp. * | | | | 324 | | 11,483 |
| Erie Indemnity Co., Class A Þ | | | | 1,043 | | 53,965 |
| HCC Insurance Holdings, Inc. | | | | 5,656 | | 173,865 |
| PartnerRe, Ltd. | | | | 1,473 | | 121,626 |
| Philadelphia Consolidated Holding Co. * | | | | 5,082 | | 216,392 |
| Principal Financial Group, Inc. | | | | 1,752 | | 114,738 |
| Prudential Financial, Inc. | | | | 13,038 | | 1,227,397 |
| The Hanover Insurance Group, Inc. | | | | 307 | | 13,846 |
| TransAtlantic Holdings, Inc. | | | | 1,115 | | 82,900 |
| W.R. Berkley Corp. | | | | 5,056 | | 154,612 |
| XL Capital, Ltd., Class A | | | | 2,541 | | 148,725 |
| |
|
| | | | | | | 7,167,059 |
| |
|
| |
| Real Estate Investment Trusts 0.8% | | | | | | |
| Apartment Investment & Management Co., Class A | | | | 613 | | 24,379 |
| CapitalSource, Inc. Þ | | | | 9,729 | | 163,058 |
| Duke Realty Corp. | | | | 12,430 | | 326,785 |
| Essex Property Trust, Inc. Þ | | | | 1,309 | | 135,796 |
| Federal Realty Investment Trust | | | | 3,416 | | 284,177 |
| General Growth Properties, Inc. | | | | 13,954 | | 648,024 |
| Health Care REIT, Inc. Þ | | | | 1,176 | | 52,696 |
| Kilroy Realty Corp. Þ | | | | 3,820 | | 213,500 |
| Macerich Co. | | | | 8,372 | | 650,086 |
| Plum Creek Timber Co., Inc. | | | | 1,610 | | 74,656 |
| ProLogis | | | | 26,226 | | 1,715,705 |
| Public Storage, Inc. | | | | 1,122 | | 86,775 |
| Rayonier, Inc. Þ | | | | 552 | | 25,602 |
| Simon Property Group, Inc. | | | | 14,216 | | 1,399,565 |
| Taubman Centers, Inc. | | | | 3,456 | | 185,000 |
| UDR, Inc. Þ | | | | 15,871 | | 349,638 |
| Ventas, Inc. | | | | 15,566 | | 678,677 |
| Weingarten Realty Investors Þ | | | | 8,986 | | 320,351 |
| |
|
| | | | | | | 7,334,470 |
| |
|
| |
| Real Estate Management & Development 0.1% | | | | |
| CB Richard Ellis Group, Inc., Class A * Þ | | | | 22,810 | | 541,737 |
| Forest City Enterprises, Inc., Class A Þ | | | | 8,423 | | 422,329 |
| Jones Lang LaSalle, Inc. | | | | 4,298 | | 361,333 |
| St. Joe Co. Þ | | | | 8,686 | | 247,117 |
| |
|
| | | | | | | 1,572,516 |
| |
|
| |
| Thrifts & Mortgage Finance 0.2% | | | | | | |
| Capitol Federal Financial Þ | | | | 1,774 | | 60,121 |
| Freddie Mac | | | | 30,286 | | 1,062,130 |
| Hudson City Bancorp, Inc. | | | | 25,310 | | 385,218 |
| People's United Financial, Inc. | | | | 17,558 | | 297,964 |
| TFS Financial Corp. | | | | 2,190 | | 27,047 |
| |
|
| | | | | | | 1,832,480 |
| |
|
| |
| |
| |
| |
| See Combined Notes to Financial Statements | | | | | | |
SCHEDULE OF INVESTMENTS continued
Market Index Growth Fund
November 30, 2007 (unaudited)
| HEALTH CARE 16.2% | | | | | | |
| Biotechnology 2.5% | | | | | | |
| Abraxis BioScience, Inc. Þ | | | | 750 | | 44,265 |
| Amgen, Inc. * | | | | 90,763 | | 5,014,656 |
| Amylin Pharmaceuticals, Inc. * | | | | 15,366 | | 586,828 |
| Biogen Idec, Inc. * | | | | 6,424 | | 476,147 |
| Celgene Corp. * | | | | 44,375 | | 2,731,281 |
| Cephalon, Inc. * Þ | | | | 7,733 | | 579,356 |
| Gen-Probe, Inc. * | | | | 6,126 | | 409,768 |
| Genentech, Inc. * | | | | 54,375 | | 4,146,094 |
| Genzyme Corp. * | | | | 30,843 | | 2,311,066 |
| Gilead Sciences, Inc. * | | | | 109,080 | | 5,076,583 |
| ImClone Systems, Inc. * | | | | 6,992 | | 315,269 |
| Millennium Pharmaceuticals, Inc. * | | | | 20,705 | | 305,192 |
| PDL BioPharma, Inc. * Þ | | | | 13,620 | | 241,210 |
| Vertex Pharmaceuticals, Inc. * Þ | | | | 15,301 | | 388,492 |
| |
|
| | | | | | | 22,626,207 |
| |
|
| |
| Health Care Equipment & Supplies 3.0% | | | | |
| Advanced Medical Optics, Inc. * | | | | 7,002 | | 176,590 |
| Baxter International, Inc. | | | | 76,103 | | 4,556,287 |
| Beckman Coulter, Inc. | | | | 5,875 | | 415,539 |
| Becton, Dickinson & Co. | | | | 28,616 | | 2,367,402 |
| C.R. Bard, Inc. | | | | 12,089 | | 1,021,883 |
| Cooper Cos. Þ | | | | 2,088 | | 89,847 |
| Dentsply International, Inc. | | | | 17,744 | | 759,088 |
| Edwards Lifesciences Corp. * Þ | | | | 6,732 | | 332,897 |
| Hillenbrand Industries, Inc. | | | | 1,232 | | 66,331 |
| Hospira, Inc. * | | | | 18,295 | | 792,173 |
| IDEXX Laboratories, Inc. * | | | | 7,236 | | 437,778 |
| Intuitive Surgical, Inc. | | | | 4,377 | | 1,434,255 |
| Kinetic Concepts, Inc. * Þ | | | | 5,093 | | 298,654 |
| Medtronic, Inc. | | | | 134,216 | | 6,824,884 |
| ResMed, Inc. * Þ | | | | 9,092 | | 416,414 |
| Respironics, Inc. * | | | | 8,602 | | 423,735 |
| St. Jude Medical, Inc. * | | | | 39,519 | | 1,570,880 |
| Stryker Corp. | | | | 35,456 | | 2,575,169 |
| Varian Medical Systems, Inc. * | | | | 14,889 | | 743,854 |
| Zimmer Holdings, Inc. * | | | | 27,657 | | 1,790,238 |
| |
|
| | | | | | | 27,093,898 |
| |
|
| |
| Health Care Providers & Services 3.8% | | | | |
| Aetna, Inc. | | | | 48,411 | | 2,705,207 |
| AmerisourceBergen Corp. | | | | 8,934 | | 405,336 |
| Brookdale Senior Living, Inc. Þ | | | | 1,069 | | 35,384 |
| Cardinal Health, Inc. | | | | 42,580 | | 2,578,219 |
| CIGNA Corp. | | | | 33,617 | | 1,802,207 |
| Community Health Systems, Inc. * | | | | 962 | | 32,150 |
| Coventry Health Care, Inc. * | | | | 17,074 | | 988,243 |
| DaVita, Inc. * | | | | 12,300 | | 762,108 |
| Express Scripts, Inc. * | | | | 25,692 | | 1,740,633 |
| Health Net, Inc. * | | | | 13,112 | | 636,981 |
| Henry Schein, Inc. * | | | | 10,377 | | 613,799 |
| Humana, Inc. * | | | | 19,628 | | 1,511,945 |
| Laboratory Corporation of America Holdings * | | 13,737 | | 998,268 |
| |
| See Combined Notes to Financial Statements | | | | |
SCHEDULE OF INVESTMENTS continued
Market Index Growth Fund
November 30, 2007 (unaudited)
| Lincare Holdings, Inc. * | | 9,793 | | 334,823 |
| McKesson Corp. | | 32,008 | | 2,135,894 |
| Medco Health Solutions, Inc. * | | 32,723 | | 3,271,973 |
| Omnicare, Inc. Þ | | 1,718 | | 43,775 |
| Patterson Companies, Inc. * | | 16,252 | | 522,989 |
| Pediatrix Medical Group, Inc. * | | 5,665 | | 366,299 |
| Quest Diagnostics, Inc. | | 16,921 | | 931,670 |
| Sierra Health Services, Inc. * | | 6,478 | | 270,456 |
| Tenet Healthcare Corp. * Þ | | 42,766 | | 235,641 |
| UnitedHealth Group, Inc. | | 156,529 | | 8,609,095 |
| Universal Health Services, Inc., Class B | | 1,465 | | 74,642 |
| VCA Antech, Inc. * | | 9,817 | | 402,791 |
| Wellcare Group, Inc. Þ | | 4,831 | | 187,974 |
| WellPoint, Inc. * | | 30,098 | | 2,534,552 |
| |
|
| | | | | 34,733,054 |
| |
|
| |
| Health Care Technology 0.1% | | | | |
| Cerner Corp. * Þ | | 7,681 | | 458,940 |
| HLTH Corp. | | 21,190 | | 296,448 |
| IMS Health, Inc. | | 20,470 | | 477,974 |
| WebMD Health Corp., Class A * Þ | | 886 | | 37,797 |
| |
|
| | | | | 1,271,159 |
| |
|
| |
| Life Sciences Tools & Services 0.5% | | | | |
| Applera Corp. - Applied Biosystems Group | | 3,497 | | 119,457 |
| Charles River Laboratories International, Inc. * | | 2,681 | | 170,324 |
| Covance, Inc. * | | 7,424 | | 648,338 |
| Invitrogen Corp. * | | 2,053 | | 199,162 |
| Millipore Corp. * | | 6,305 | | 516,253 |
| PerkinElmer, Inc. | | 3,511 | | 95,780 |
| Pharmaceutical Product Development, Inc. | | 12,090 | | 511,891 |
| Techne Corp. | | 4,608 | | 300,211 |
| Thermo Fisher Scientific, Inc. * | | 24,495 | | 1,411,892 |
| Waters Corp. * | | 11,786 | | 919,779 |
| |
|
| | | | | 4,893,087 |
| |
|
| |
| Pharmaceuticals 6.3% | | | | |
| Abbott Laboratories | | 179,927 | | 10,347,602 |
| Allergan, Inc. | | 35,636 | | 2,389,037 |
| APP Pharmaceuticals, Inc. Þ | | 2,999 | | 35,238 |
| Barr Pharmaceuticals, Inc. * | | 12,820 | | 688,434 |
| Bristol-Myers Squibb Co. | | 229,887 | | 6,811,552 |
| Eli Lilly & Co. | | 56,744 | | 3,004,595 |
| Endo Pharmaceuticals Holdings, Inc. * | | 15,626 | | 428,309 |
| Forest Laboratories, Inc. * | | 37,381 | | 1,441,038 |
| Johnson & Johnson | | 126,879 | | 8,594,783 |
| Merck & Co., Inc. | | 209,107 | | 12,412,592 |
| Mylan Laboratories, Inc. Þ | | 35,322 | | 507,930 |
| Schering-Plough Corp. | | 189,198 | | 5,921,897 |
| Sepracor, Inc. * Þ | | 12,432 | | 329,821 |
| Warner Chilcott, Ltd., Class A Þ | | 10,595 | | 193,359 |
| Watson Pharmaceuticals, Inc. * | | 6,958 | | 203,939 |
| Wyeth | | 82,649 | | 4,058,066 |
| |
|
| | | | | 57,368,192 |
| |
|
| |
| |
| |
| |
| See Combined Notes to Financial Statements | | | | |
SCHEDULE OF INVESTMENTS continued
Market Index Growth Fund
November 30, 2007 (unaudited)
| INDUSTRIALS 12.9% | | | | |
| Aerospace & Defense 3.5% | | | | |
| Alliant Techsystems, Inc. * Þ | | 3,331 | | 389,161 |
| BE Aerospace, Inc. * | | 10,769 | | 506,143 |
| Boeing Co. | | 91,975 | | 8,511,366 |
| DRS Technologies, Inc. | | 262 | | 15,513 |
| General Dynamics Corp. | | 6,573 | | 583,551 |
| Goodrich Corp. | | 14,620 | | 1,042,260 |
| Honeywell International, Inc. | | 77,963 | | 4,414,265 |
| L-3 Communications Holdings, Inc. | | 4,912 | | 543,513 |
| Lockheed Martin Corp. | | 41,124 | | 4,551,193 |
| Northrop Grumman Corp. | | 2,540 | | 200,127 |
| Precision Castparts Corp. | | 16,072 | | 2,368,048 |
| Raytheon Co. | | 26,753 | | 1,654,673 |
| Rockwell Collins Corp. | | 19,547 | | 1,409,730 |
| Spirit AeroSystems Holdings, Inc., Class A | | 6,740 | | 235,563 |
| United Technologies Corp. | | 70,856 | | 5,297,903 |
| |
|
| | | | | 31,723,009 |
| |
|
| |
| Air Freight & Logistics 1.2% | | | | |
| C.H. Robinson Worldwide, Inc. | | 19,768 | | 1,019,040 |
| Expeditors International of Washington, Inc. | | 24,896 | | 1,168,120 |
| FedEx Corp. | | 30,165 | | 2,970,348 |
| United Parcel Service, Inc., Class B | | 78,429 | | 5,778,649 |
| UTi Worldwide, Inc. | | 11,558 | | 274,271 |
| |
|
| | | | | 11,210,428 |
| |
|
| |
| Airlines 0.3% | | | | |
| AMR Corp. * Þ | | 28,103 | | 595,221 |
| Continental Airlines, Inc., Class B * Þ | | 11,345 | | 319,362 |
| Copa Holdings SA, Class A Þ | | 2,031 | | 73,380 |
| Delta Air Lines, Inc. * | | 31,435 | | 621,156 |
| Northwest Airlines Corp. | | 20,384 | | 370,581 |
| Southwest Airlines Co. | | 18,006 | | 254,785 |
| UAL Corp. Þ | | 8,006 | | 327,766 |
| |
|
| | | | | 2,562,251 |
| |
|
| |
| Building Products 0.1% | | | | |
| American Standard Companies, Inc. | | 21,084 | | 773,994 |
| Lennox International, Inc. | | 868 | | 29,373 |
| Masco Corp. | | 2,559 | | 57,321 |
| |
|
| | | | | 860,688 |
| |
|
| |
| Commercial Services & Supplies 1.0% | | | | |
| Allied Waste Industries, Inc. * | | 5,078 | | 57,940 |
| Avery Dennison Corp. | | 10,629 | | 553,877 |
| Brink's Co. | | 5,093 | | 325,850 |
| ChoicePoint, Inc. * | | 8,356 | | 316,275 |
| Cintas Corp. | | 12,058 | | 385,735 |
| Copart, Inc. * | | 7,451 | | 278,369 |
| Corporate Executive Board Co. Þ | | 4,142 | | 277,887 |
| Corrections Corporation of America * | | 14,346 | | 437,697 |
| Covanta Holding Corp. * Þ | | 14,030 | | 378,670 |
| Dun & Bradstreet Corp. * | | 6,939 | | 619,167 |
| Equifax, Inc. | | 15,407 | | 573,603 |
| |
| See Combined Notes to Financial Statements | | | | |
SCHEDULE OF INVESTMENTS continued
Market Index Growth Fund
November 30, 2007 (unaudited)
| HNI Corp. Þ | | | | 5,598 | | 204,495 |
| Manpower, Inc. | | | | 9,874 | | 603,301 |
| Monster Worldwide, Inc. * | | | | 14,690 | | 496,081 |
| Pitney Bowes, Inc. | | | | 20,987 | | 808,000 |
| Republic Services, Inc. | | | | 17,364 | | 575,964 |
| Robert Half International, Inc. | | | | 17,167 | | 462,822 |
| Steelcase, Inc. Þ | | | | 7,599 | | 114,973 |
| Stericycle, Inc. * | | | | 10,248 | | 603,095 |
| Waste Management, Inc. | | | | 33,907 | | 1,163,688 |
| |
|
| | | | | | | 9,237,489 |
| |
|
| |
| Construction & Engineering | | 0.6% | | | | |
| Fluor Corp. | | | | 10,300 | | 1,515,851 |
| Foster Wheeler, Ltd. | | | | 8,225 | | 1,225,525 |
| Jacobs Engineering Group, Inc. * | | | | 13,929 | | 1,166,832 |
| Quanta Services, Inc. * Þ | | | | 19,214 | | 526,079 |
| Shaw Group, Inc. | | | | 8,632 | | 547,442 |
| URS Corp. * Þ | | | | 1,982 | | 113,945 |
| |
|
| | | | | | | 5,095,674 |
| |
|
| |
| Electrical Equipment 1.0% | | | | | | |
| Ametek, Inc. | | | | 12,467 | | 548,548 |
| Cooper Industries, Inc. | | | | 6,885 | | 345,765 |
| Emerson Electric Co. | | | | 77,195 | | 4,401,659 |
| First Solar, Inc. Þ | | | | 4,170 | | 988,915 |
| General Cable Corp. * Þ | | | | 6,107 | | 454,239 |
| Hubbell, Inc., Class B | | | | 2,334 | | 128,207 |
| Rockwell Automation, Inc. | | | | 17,431 | | 1,183,391 |
| Roper Industries, Inc. | | | | 10,312 | | 654,296 |
| SunPower Corp., Class A Þ | | | | 2,900 | | 360,876 |
| Thomas & Betts Corp. * | | | | 6,795 | | 369,376 |
| |
|
| | | | | | | 9,435,272 |
| |
|
| |
| Industrial Conglomerates 1.7% | | | | |
| 3M Co. | | | | 78,742 | | 6,556,059 |
| Carlisle Cos. Þ | | | | 1,972 | | 78,505 |
| General Electric Co. | | | | 133,394 | | 5,107,656 |
| McDermott International, Inc. * | | | | 25,996 | | 1,359,591 |
| Textron, Inc. | | | | 29,108 | | 2,009,908 |
| |
|
| | | | | | | 15,111,719 |
| |
|
| |
| Machinery 2.4% | | | | | | |
| AGCO Corp. * | | | | 6,989 | | 481,822 |
| Caterpillar, Inc. | | | | 74,804 | | 5,378,408 |
| Cummins, Inc. | | | | 12,180 | | 1,423,842 |
| Danaher Corp. | | | | 28,713 | | 2,492,863 |
| Deere & Co. | | | | 1,484 | | 254,951 |
| Donaldson Co., Inc. | | | | 9,263 | | 433,323 |
| Dover Corp. | | | | 7,688 | | 355,801 |
| Eaton Corp. | | | | 2,019 | | 180,317 |
| Flowserve Corp. * | | | | 5,991 | | 563,693 |
| Graco, Inc. Þ | | | | 7,346 | | 273,565 |
| Harsco Corp. | | | | 9,830 | | 590,488 |
| IDEX Corp. | | | | 9,476 | | 338,293 |
| Illinois Tool Works, Inc. | | | | 43,224 | | 2,398,932 |
| Ingersoll-Rand Co., Ltd., Class A | | | | 1,973 | | 101,886 |
| |
| |
| |
| See Combined Notes to Financial Statements | | | | |
SCHEDULE OF INVESTMENTS continued
Market Index Growth Fund
November 30, 2007 (unaudited)
| ITT Corp. | | | | | | 2,653 | | 170,959 |
| Joy Global, Inc. | | | | | | 12,687 | | 735,846 |
| Kennametal, Inc. | | | | | | 2,628 | | 205,115 |
| Lincoln Electric Holdings, Inc. | | | | | | 3,421 | | 238,683 |
| Manitowoc Co. | | | | | | 14,569 | | 638,851 |
| Oshkosh Truck Corp. | | | | | | 8,651 | | 416,027 |
| Paccar, Inc. Þ | | | | | | 43,524 | | 2,202,750 |
| Pall Corp. | | | | | | 13,118 | | 501,763 |
| Terex Corp. * | | | | | | 12,043 | | 776,171 |
| Toro Co. Þ | | | | | | 4,708 | | 262,000 |
| Trinity Industries, Inc. Þ | | | | | | 8,198 | | 207,491 |
| |
|
| | | | | | | | | 21,623,840 |
| |
|
| |
| Marine 0.0% | | | | | | | | |
| Kirby Corp. * | | | | | | 6,226 | | 299,284 |
| |
|
| |
| Road & Rail 0.9% | | | | | | | | |
| Avis Budget Group, Inc. | | | | | | 4,238 | | 63,697 |
| Burlington Northern Santa Fe Corp. | | | | | | 39,227 | | 3,276,239 |
| Con-Way, Inc. | | | | | | 4,159 | | 175,842 |
| CSX Corp. | | | | | | 8,732 | | 366,744 |
| Hertz Global Holdings, Inc. Þ | | | | | | 24,419 | | 466,403 |
| J.B. Hunt Transport Services, Inc. Þ | | | | | | 10,226 | | 268,842 |
| Kansas City Southern * Þ | | | | | | 5,392 | | 185,647 |
| Landstar System, Inc. | | | | | | 6,490 | | 258,172 |
| Norfolk Southern Corp. | | | | | | 23,333 | | 1,194,883 |
| Union Pacific Corp. | | | | | | 19,325 | | 2,437,655 |
| |
|
| | | | | | | | | 8,694,124 |
| |
|
| |
| Trading Companies & Distributors 0.2% | | | | |
| Aircastle, Ltd. | | | | | | 3,371 | | 89,062 |
| Fastenal Co. Þ | | | | | | 14,773 | | 585,602 |
| GATX Corp. | | | | | | 2,183 | | 80,836 |
| MSC Industrial Direct Co., Class A | | | | | | 5,380 | | 232,524 |
| W.W. Grainger, Inc. | | | | | | 6,578 | | 580,837 |
| Wesco International, Inc. * Þ | | | | | | 5,327 | | 215,637 |
| |
|
| | | | | | | | | 1,784,498 |
| |
|
| |
| INFORMATION TECHNOLOGY 27.5% | | | | |
| Communications Equipment 3.9% | | | | |
| Ciena Corp. * | | | | | | 9,969 | | 438,437 |
| Cisco Systems, Inc. * | | | | | | 709,175 | | 19,871,083 |
| CommScope, Inc. * Þ | | | | | | 7,152 | | 289,656 |
| Corning, Inc. | | | | | | 183,715 | | 4,462,437 |
| F5 Networks, Inc. * | | | | | | 9,752 | | 257,648 |
| Harris Corp. | | | | | | 15,685 | | 984,547 |
| JDS Uniphase Corp. * Þ | | | | | | 13,178 | | 177,376 |
| Juniper Networks, Inc. * | | | | | | 43,057 | | 1,279,654 |
| QUALCOMM, Inc. | | | | | | 194,693 | | 7,939,581 |
| Riverbed Technology, Inc. | | | | | | 2,285 | | 64,620 |
| |
|
| | | | | | | | | 35,765,039 |
| |
|
| |
| Computers & Peripherals 6.9% | | | | | | |
| Apple, Inc. * | | | | | | 101,033 | | 18,410,233 |
| Brocade Communications Systems, Inc. * | | | | 46,806 | | 341,216 |
| Dell, Inc. * | | | | | | 265,344 | | 6,511,542 |
| |
| See Combined Notes to Financial Statements | | | | |
SCHEDULE OF INVESTMENTS continued
Market Index Growth Fund
November 30, 2007 (unaudited)
| Diebold, Inc. | | 7,685 | | 260,983 |
| EMC Corp. * | | 245,118 | | 4,723,424 |
| Hewlett-Packard Co. | | 312,632 | | 15,994,253 |
| International Business Machines Corp. | | 127,013 | | 13,359,227 |
| Lexmark International, Inc., Class A * | | 6,009 | | 209,594 |
| NCR Corp. * | | 2,627 | | 62,890 |
| Network Appliance, Inc. * | | 43,343 | | 1,071,006 |
| QLogic Corp. * | | 14,310 | | 193,471 |
| SanDisk Corp. * Þ | | 15,834 | | 592,825 |
| Seagate Technology, Inc. | | 24,069 | | 620,740 |
| Sun Microsystems, Inc. | | 26,587 | | 552,467 |
| Teradata Corp. | | 2,627 | | 68,197 |
| Western Digital Corp. * | | 7,724 | | 213,414 |
| |
|
| | | | | 63,185,482 |
| |
|
| |
| Electronic Equipment & Instruments 0.6% | | | | |
| Agilent Technologies, Inc. * | | 47,150 | | 1,783,684 |
| Amphenol Corp., Class A | | 20,899 | | 905,972 |
| Arrow Electronics, Inc. * | | 7,991 | | 295,747 |
| Avnet, Inc. * | | 10,249 | | 353,590 |
| AVX Corp. Þ | | 1,140 | | 16,336 |
| Dolby Laboratories, Inc., Class A * | | 4,609 | | 231,556 |
| Jabil Circuit, Inc. | | 13,485 | | 228,571 |
| Mettler-Toledo International, Inc. * | | 4,412 | | 513,380 |
| Molex, Inc. | | 9,162 | | 252,505 |
| National Instruments Corp. | | 6,713 | | 224,013 |
| Sanmina-SCI Corp. * | | 13,741 | | 24,322 |
| Trimble Navigation, Ltd. * | | 13,953 | | 517,238 |
| Vishay Intertechnology, Inc. * | | 3,650 | | 45,588 |
| |
|
| | | | | 5,392,502 |
| |
|
| |
| Internet Software & Services 3.1% | | | | |
| Akamai Technologies, Inc. * Þ | | 19,264 | | 733,188 |
| eBay, Inc. * | | 133,500 | | 4,476,255 |
| Google, Inc., Class A * | | 26,784 | | 18,561,312 |
| VeriSign, Inc. * | | 25,809 | | 1,055,588 |
| Yahoo!, Inc. * | | 141,276 | | 3,787,609 |
| |
|
| | | | | 28,613,952 |
| |
|
| |
| IT Services 2.0% | | | | |
| Accenture, Ltd., Class A | | 69,337 | | 2,396,287 |
| Acxiom Corp. | | 7,405 | | 91,230 |
| Affiliated Computer Services, Inc., Class A * | | 4,517 | | 189,533 |
| Alliance Data Systems Corp. * Þ | | 9,193 | | 714,296 |
| Automatic Data Processing, Inc. | | 64,623 | | 2,911,912 |
| Broadridge Financial Solutions, Inc. | | 16,261 | | 370,263 |
| CheckFree Corp. * | | 7,289 | | 346,956 |
| Cognizant Technology Solutions Corp., Class A * | | 33,584 | | 1,044,462 |
| DST Systems, Inc. * Þ | | 6,309 | | 534,688 |
| Electronic Data Systems Corp. | | 34,475 | | 698,464 |
| Fidelity National Information Services, Inc. | | 18,960 | | 819,451 |
| Fiserv, Inc. * | | 19,646 | | 1,008,429 |
| Genpact, Ltd. | | 3,490 | | 49,907 |
| Global Payments, Inc. | | 9,428 | | 407,478 |
| Hewitt Associates, Inc., Class A * | | 6,937 | | 260,138 |
| Iron Mountain, Inc. * Þ | | 20,677 | | 754,297 |
| |
| |
| See Combined Notes to Financial Statements | | | | |
SCHEDULE OF INVESTMENTS continued
Market Index Growth Fund
November 30, 2007 (unaudited)
| MasterCard, Inc., Class A Þ | | | | 9,310 | | 1,868,052 |
| MoneyGram International, Inc. Þ | | | | 9,747 | | 150,494 |
| Paychex, Inc. | | | | 39,616 | | 1,545,024 |
| Total System Services, Inc. Þ | | | | 4,358 | | 122,198 |
| VeriFone Holdings, Inc. Þ | | | | 7,259 | | 348,650 |
| Western Union Co. | | | | 85,109 | | 1,923,463 |
| |
|
| | | | | | | 18,555,672 |
| |
|
| |
| Office Electronics 0.1% | | | | | | |
| Zebra Technologies Corp., Class A * | | | | 8,069 | | 311,221 |
| |
|
| |
| Semiconductors & Semiconductor Equipment 4.6% | | | | |
| Advanced Micro Devices, Inc. * Þ | | | | 28,698 | | 280,092 |
| Altera Corp. | | | | 39,232 | | 736,777 |
| Analog Devices, Inc. | | | | 38,208 | | 1,176,042 |
| Applied Materials, Inc. | | | | 161,426 | | 3,039,652 |
| Broadcom Corp., Class A * | | | | 54,726 | | 1,463,373 |
| Cree, Inc. * Þ | | | | 2,451 | | 60,368 |
| Cypress Semiconductor Corp. * | | | | 18,595 | | 617,726 |
| Fairchild Semiconductor International, Inc. * | | | | 5,955 | | 94,446 |
| Integrated Device Technology, Inc. | | | | 7,763 | | 94,165 |
| Intel Corp. | | | | 678,658 | | 17,699,401 |
| International Rectifier Corp. * Þ | | | | 1,914 | | 62,243 |
| Intersil Corp., Class A | | | | 8,635 | | 215,357 |
| KLA-Tencor Corp. Þ | | | | 22,383 | | 1,076,175 |
| Lam Research Corp. * | | | | 14,430 | | 661,616 |
| Linear Technology Corp. Þ | | | | 25,931 | | 789,858 |
| LSI Logic Corp. * Þ | | | | 49,516 | | 274,814 |
| Marvell Technology Group, Ltd. * Þ | | | | 55,164 | | 824,150 |
| MEMC Electronic Materials, Inc. * | | | | 26,210 | | 2,033,372 |
| Microchip Technology, Inc. | | | | 25,506 | | 734,318 |
| Micron Technology, Inc. * Þ | | | | 28,802 | | 239,633 |
| National Semiconductor Corp. | | | | 31,552 | | 721,279 |
| Novellus Systems, Inc. * Þ | | | | 8,832 | | 229,720 |
| NVIDIA Corp. * | | | | 63,587 | | 2,005,534 |
| Rambus, Inc. * Þ | | | | 9,435 | | 182,945 |
| Silicon Laboratories, Inc. * | | | | 6,397 | | 237,585 |
| Teradyne, Inc. * | | | | 10,243 | | 111,546 |
| Texas Instruments, Inc. | | | | 167,470 | | 5,287,028 |
| Varian Semiconductor Equipment Associates, Inc. * | | | | 9,183 | | 381,186 |
| Xilinx, Inc. Þ | | | | 34,796 | | 762,032 |
| |
|
| | | | | | | 42,092,433 |
| |
|
| |
| Software 6.3% | | | | | | |
| Activision, Inc. * | | | | 33,093 | | 733,010 |
| Adobe Systems, Inc. * | | | | 68,684 | | 2,894,344 |
| Amdocs, Ltd. * | | | | 23,093 | | 764,147 |
| Autodesk, Inc. * | | | | 26,953 | | 1,269,217 |
| BEA Systems, Inc. * | | | | 45,789 | | 724,840 |
| BMC Software, Inc. * | | | | 23,426 | | 774,932 |
| CA, Inc. | | | | 30,062 | | 736,218 |
| Cadence Design Systems, Inc. * | | | | 8,973 | | 148,952 |
| Citrix Systems, Inc. * | | | | 22,159 | | 819,440 |
| Compuware Corp. * | | | | 28,529 | | 235,650 |
| Electronic Arts, Inc. * | | | | 36,383 | | 2,044,361 |
| FactSet Research Systems, Inc. Þ | | | | 5,015 | | 314,340 |
| |
| See Combined Notes to Financial Statements | | | | | | |
SCHEDULE OF INVESTMENTS continued
Market Index Growth Fund
November 30, 2007 (unaudited)
| Fair Isaac Corp. Þ | | 663 | | 24,505 |
| Intuit, Inc. * | | 39,335 | | 1,153,302 |
| McAfee, Inc. * | | 18,634 | | 725,794 |
| Microsoft Corp. | | 958,803 | | 32,215,781 |
| NAVTEQ Corp. * Þ | | 11,411 | | 854,570 |
| Novell, Inc. * | | 5,063 | | 35,542 |
| Oracle Corp. * | | 450,373 | | 9,088,527 |
| Red Hat, Inc. * Þ | | 22,565 | | 451,751 |
| Salesforce.com, Inc. * | | 11,090 | | 629,136 |
| Symantec Corp. * | | 15,155 | | 269,759 |
| Synopsys, Inc. * | | 16,907 | | 416,081 |
| VMware, Inc., Class A * Þ | | 3,649 | | 333,409 |
| |
|
| | | | | 57,657,608 |
| |
|
| |
| MATERIALS 3.3% | | | | |
| Chemicals 1.8% | | | | |
| Air Products & Chemicals, Inc. | | 11,917 | | 1,180,260 |
| Airgas, Inc. | | 8,601 | | 425,577 |
| Albemarle Corp. | | 9,322 | | 411,473 |
| Cabot Corp. | | 5,694 | | 195,987 |
| Celanese Corp., Ser. A | | 9,573 | | 379,857 |
| Chemtura Corp. | | 1,775 | | 13,313 |
| E.I. DuPont de Nemours & Co. | | 17,155 | | 791,703 |
| Ecolab, Inc. | | 20,415 | | 977,879 |
| International Flavors & Fragrances, Inc. Þ | | 7,046 | | 353,286 |
| Lubrizol Corp. | | 2,118 | | 135,849 |
| Monsanto Co. | | 63,574 | | 6,317,348 |
| Mosaic Co. * | | 7,753 | | 536,120 |
| Nalco Holding Co. * | | 16,862 | | 404,014 |
| Praxair, Inc. | | 37,227 | | 3,178,441 |
| Rohm & Haas Co. Þ | | 8,699 | | 472,965 |
| RPM International, Inc. | | 12,144 | | 231,343 |
| Scotts Miracle-Gro Co., Class A Þ | | 952 | | 35,138 |
| Sigma-Aldrich Corp. | | 4,632 | | 243,875 |
| Valspar Corp. | | 1,413 | | 31,849 |
| |
|
| | | | | 16,316,277 |
| |
|
| |
| Construction Materials 0.2% | | | | |
| Eagle Materials, Inc. Þ | | 5,181 | | 202,007 |
| Martin Marietta Materials, Inc. Þ | | 4,979 | | 669,924 |
| Vulcan Materials Co. Þ | | 12,187 | | 1,082,165 |
| |
|
| | | | | 1,954,096 |
| |
|
| |
| Containers & Packaging 0.3% | | | | |
| Ball Corp. | | 11,926 | | 551,578 |
| Crown Holdings, Inc. * | | 19,099 | | 490,080 |
| Owens-Illinois, Inc. * | | 16,940 | | 760,437 |
| Packaging Corporation of America | | 10,805 | | 305,673 |
| Pactiv Corp. * | | 15,230 | | 386,842 |
| Sealed Air Corp. | | 2,604 | | 60,855 |
| |
|
| | | | | 2,555,465 |
| |
|
| |
| Metals & Mining 1.0% | | | | |
| AK Steel Holding Corp. * | | 13,003 | | 579,544 |
| Allegheny Technologies, Inc. | | 11,932 | | 1,166,353 |
| Carpenter Technology Corp. Þ | | 3,192 | | 240,836 |
| |
| |
| See Combined Notes to Financial Statements | | | | |
SCHEDULE OF INVESTMENTS continued
Market Index Growth Fund
November 30, 2007 (unaudited)
| Cleveland-Cliffs, Inc. | | | | 4,792 | | 432,238 |
| Freeport-McMoRan Copper & Gold, Inc. | | | | 36,685 | | 3,629,247 |
| Newmont Mining Corp. | | | | 20,717 | | 1,029,428 |
| NuCor Corp. | | | | 7,929 | | 469,476 |
| Reliance Steel & Aluminum Co. | | | | 769 | | 39,673 |
| Southern Copper Corp. Þ | | | | 8,565 | | 947,717 |
| Steel Dynamics, Inc. | | | | 3,402 | | 171,155 |
| Titanium Metals Corp. * Þ | | | | 7,965 | | 236,322 |
| |
|
| | | | | | | 8,941,989 |
| |
|
| |
| Paper & Forest Products 0.0% | | | | | | |
| Domtar Corp. * Þ | | | | 26,877 | | 204,265 |
| |
|
| |
| TELECOMMUNICATION SERVICES 0.7% | | | | | | |
| Diversified Telecommunication Services 0.1% | | | | | | |
| Citizens Communications Co. | | | | 7,039 | | 91,366 |
| Level 3 Communications, Inc. * Þ | | | | 178,705 | | 600,449 |
| NeuStar, Inc., Class A * Þ | | | | 8,859 | | 281,450 |
| Windstream Corp. | | | | 30,771 | | 398,485 |
| |
|
| | | | | | | 1,371,750 |
| |
|
| |
| Wireless Telecommunication Services 0.6% | | | | | | |
| American Tower Corp., Class A * | | | | 48,809 | | 2,222,762 |
| Crown Castle International Corp. * | | | | 22,151 | | 929,234 |
| Leap Wireless International, Inc. * | | | | 5,957 | | 206,768 |
| MetroPCS Communications, Inc. * | | | | 6,721 | | 114,929 |
| NII Holdings, Inc. * | | | | 20,196 | | 1,114,011 |
| SBA Communcations Corp. * | | | | 12,008 | | 449,580 |
| Telephone & Data Systems, Inc. | | | | 5,368 | | 334,158 |
| U.S. Cellular Corp. * | | | | 661 | | 54,202 |
| |
|
| | | | | | | 5,425,644 |
| |
|
| |
| UTILITIES 1.4% | | | | | | |
| Electric Utilities 0.8% | | | | | | |
| Allegheny Energy, Inc. * | | | | 19,356 | | 1,175,877 |
| DPL, Inc. Þ | | | | 7,110 | | 215,291 |
| Exelon Corp. | | | | 35,514 | | 2,879,120 |
| Mirant Corp. Þ | | | | 20,474 | | 790,092 |
| NRG Energy, Inc. * Þ | | | | 22,785 | | 965,856 |
| PPL Corp. | | | | 33,631 | | 1,713,836 |
| Sierra Pacific Resources | | | | 3,773 | | 64,895 |
| |
|
| | | | | | | 7,804,967 |
| |
|
| |
| Gas Utilities 0.1% | | | | | | |
| Equitable Resources, Inc. | | | | 10,796 | | 570,676 |
| Questar Corp. | | | | 6,888 | | 368,164 |
| |
|
| | | | | | | 938,840 |
| |
|
| |
| Independent Power Producers & Energy Traders 0.4% | | | | |
| AES Corp. * | | | | 77,979 | | 1,703,841 |
| Constellation Energy Group, Inc. | | | | 16,344 | | 1,637,832 |
| Dynegy, Inc., Class A * | | | | 6,352 | | 48,339 |
| |
|
| | | | | | | 3,390,012 |
| |
|
| |
| Multi-Utilities 0.1% | | | | | | |
| CenterPoint Energy, Inc. Þ | | | | 37,471 | | 668,857 |
| |
|
| |
| See Combined Notes to Financial Statements | | | | | | |
SCHEDULE OF INVESTMENTS continued
Market Index Growth Fund
November 30, 2007 (unaudited)
| Water Utilities 0.0% | | | | | | |
| Aqua America, Inc. Þ | | | | 1,053 | | 23,314 |
| |
|
| Total Common Stocks (cost $639,463,345) | | | | | | 907,581,059 |
| |
|
| EXCHANGE TRADED FUND 0.6% | | | | | | |
| iShares Russell 1000 Growth Index Fund Þ (cost $5,023,182) | | | | 87,550 | | 5,369,441 |
| |
|
| INVESTMENTS OF CASH COLLATERAL FROM SECURITIES LOANED 6.9% | | |
| MUTUAL FUND SHARES 6.9% | | | | | | |
| Navigator Prime Portfolio, 4.79% § (cost $62,958,089) | | | | 62,958,089 | | 62,958,089 |
| |
|
| | | | | Principal | | |
| | | | | Amount | | Value |
|
| SHORT-TERM INVESTMENTS 0.0% | | | | | | |
| U.S. TREASURY OBLIGATIONS 0.0% | | | | | | |
| U.S. Treasury Bill, 3.95%, 01/10/2008 ß ƒ | | | | $ 100,000 | | 99,583 |
| |
|
| | | | | Shares | | Value |
|
| MUTUAL FUND SHARES 0.0% | | | | | | |
| Evergreen Institutional Money Market Fund, Class I, 4.88% q ø | | | | 223,735 | | 223,735 |
| |
|
| Total Short-Term Investments (cost $323,318) | | | | | | 323,318 |
| |
|
| Total Investments (cost $707,767,934) 106.7% | | | | | | 976,231,907 |
| Other Assets and Liabilities (6.7%) | | | | | | (61,577,251) |
| |
|
| Net Assets 100.0% | | | | | | $ 914,654,656 |
| |
|
| * | | Non-income producing security |
| Þ | | All or a portion of this security is on loan. |
| § | | Rate shown is the 1-day annualized yield at period end. |
| ß | | Rate shown represents the yield to maturity at date of purchase. |
| ƒ | | All or a portion of this security was pledged to cover initial margin requirements for open futures contracts. |
| q | | Rate shown is the 7-day annualized yield at period end. |
| ø | | Evergreen Investment Management Company, LLC is the investment advisor to both the Fund and the money market |
| | | fund. |
| The following table shows the percent of total long-term investments by sector as of November 30, 2007: |
| |
| Information Technology | | 27.6% | |
| Health Care | | 16.2% | |
| Industrials | | 12.9% | |
| Consumer Discretionary | | 11.8% | |
| Consumer Staples | | 10.3% | |
| Energy | | 8.1% | |
| Financials | | 7.1% | |
| Materials | | 3.3% | |
| Utilities | | 1.4% | |
| Telecommunication Services | | 0.7% | |
| Other | | 0.6% | |
| |
| |
| | | 100.0% | |
| |
| |
See Combined Notes to Financial Statements
Market Index Growth Fund
STATEMENT OF ASSETS AND LIABILITIES
November 30, 2007 (unaudited)
| Assets | | |
| Investments in securities, at value (cost $707,544,199) including $70,840,112 of securities loaned | | $ 976,008,172 |
| Investments in affiliated money market fund, at value (cost $223,735) | | 223,735 |
|
| Total investments | | 976,231,907 |
| Receivable for securities sold | | 1,563,019 |
| Dividends receivable | | 1,161,201 |
| Receivable for daily variation margin on open futures contracts | | 12,915 |
| Receivable for securities lending income | | 16,431 |
| Receivable from investment advisor | | 8,118 |
|
| Total assets | | 978,993,591 |
|
| Liabilities | | |
| Payable for securities purchased | | 1,337,844 |
| Payable for securities on loan | | 62,958,089 |
| Due to related parties | | 7,761 |
| Accrued expenses and other liabilities | | 35,241 |
|
| Total liabilities | | 64,338,935 |
|
| Net assets | | $ 914,654,656 |
|
| Net assets represented by | | |
| Paid-in capital | | $ 595,407,811 |
| Undistributed net investment income | | 15,347,398 |
| Accumulated net realized gains on investments | | 35,439,039 |
| Net unrealized gains on investments | | 268,460,408 |
|
| Total net assets | | $ 914,654,656 |
|
| Shares outstanding (unlimited number of shares authorized) | | |
| Class I | | 58,237,048 |
|
| Net asset value per share | | |
| Class I | | $ 15.71 |
|
See Combined Notes to Financial Statements
Market Index Growth Fund
STATEMENT OF OPERATIONS
Six Months Ended November 30, 2007 (unaudited)
| Investment income | | |
| Dividends | | $ 5,386,631 |
| Securities lending | | 120,026 |
| Income from affiliates | | 29,617 |
| Interest | | 2,753 |
|
| Total investment income | | 5,539,027 |
|
| Expenses | | |
| Advisory fee | | 1,527,412 |
| Administrative services fee | | 474,263 |
| Transfer agent fees | | 13 |
| Trustees' fees and expenses | | 7,543 |
| Printing and postage expenses | | 4,640 |
| Custodian and accounting fees | | 121,169 |
| Registration and filing fees | | 26 |
| Professional fees | | 19,929 |
| Other | | 13,314 |
|
| Total expenses | | 2,168,309 |
| Less: Expense reductions | | (9,138) |
| Fee waivers and expense reimbursements | | (2,042,228) |
|
| Net expenses | | 116,943 |
|
| Net investment income | | 5,422,084 |
|
| Net realized and unrealized gains or losses on investments | | |
| Net realized gains on: | | |
| Securities | | 26,107,640 |
| Futures contracts | | 67,773 |
|
| Net realized gains on investments | | 26,175,413 |
| Net change in unrealized gains or losses on investments | | (12,059,170) |
|
| Net realized and unrealized gains or losses on investments | | 14,116,243 |
|
| Net increase in net assets resulting from operations | | $ 19,538,327 |
|
See Combined Notes to Financial Statements
Market Index Growth Fund
STATEMENTS OF CHANGES IN NET ASSETS
| | | Six Months Ended | | | | |
| | | November 30, 2007 | | Year Ended |
| | | (unaudited) | | May 31, 2007 |
|
| Operations | | | | | | | | |
| Net investment income | | $ 5,422,084 | | $ 10,001,664 |
| Net realized gains on investments | | | | 26,175,413 | | | | 9,438,611 |
| Net change in unrealized gains or | | | | | | | | |
| losses on investments | | | | (12,059,170) | | | | 133,905,152 |
|
| Net increase in net assets resulting from | | | | | | | | |
| operations | | | | 19,538,327 | | | | 153,345,427 |
|
| Distributions to shareholders from | | | | | | | | |
| Net investment income | | | | 0 | | | | (9,699,900) |
| Net realized gains | | | | 0 | | | | (34,929,033) |
|
| Total distributions to shareholders | | | | 0 | | | | (44,628,933) |
|
| | | Shares | | | | Shares | | |
| |
| Capital share transactions | | | | | | | | |
| Proceeds from shares sold | | 0 | | 0 | | 5,401,755 | | 80,000,000 |
| Net asset value of shares issued in | | | | | | | | |
| reinvestment of distributions | | 0 | | 0 | | 3,132,001 | | 44,628,933 |
| Payment for shares redeemed | | (3,287,311) | | (50,000,000) | | (709,220) | | (10,000,000) |
|
| Net increase (decrease) in net assets | | | | | | | | |
| resulting from capital share | | | | | | | | |
| transactions | | | | (50,000,000) | | | | 114,628,933 |
|
| Total increase (decrease) in net assets | | | | (30,461,673) | | | | 223,345,427 |
| Net assets | | | | | | | | |
| Beginning of period | | | | 945,116,329 | | | | 721,770,902 |
|
| End of period | | $ 914,654,656 | | $ 945,116,329 |
|
| Undistributed net investment income | | $ 15,347,398 | | $ 9,925,314 |
|
See Combined Notes to Financial Statements
Market Index Value Fund
FUND AT A GLANCE
as of November 30, 2007
MANAGEMENT TEAM
Investment Advisor:
Evergreen Investment Management Company, LLC
Portfolio Manager:
William E. Zieff
CURRENT INVESTMENT STYLE
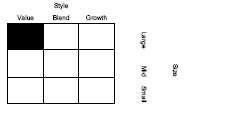
Source: Morningstar, Inc.
Morningstar’s style box is based on a portfolio date as of 9/30/2007.
The Equity style box placement is based on 10 growth and valuation measures for each fund holding and the median size of the companies in which the fund invests.
PERFORMANCE AND RETURNS
Portfolio inception date: 10/15/2002
| | | Class I |
| Class inception date | | 10/15/2002 |
| 6-month return | | -7.34% |
| Average annual return | | |
| 1-year | | 3.07% |
| 5-year | | 13.80% |
| Since portfolio inception | | 14.76% |
Past performance is no guarantee of future results. The performance quoted represents past performance and current performance may be lower or higher. The investment return and principal value of an investment will fluctuate so that investors’ shares, when redeemed, may be worth more or less than their original cost. Performance includes the reinvestment of income dividends and capital gain distributions.
The advisor is waiving its advisory fee and reimbursing the fund for a portion of other expenses. Had the fee not been waived and expenses not reimbursed, returns would have been lower.
LONG-TERM GROWTH
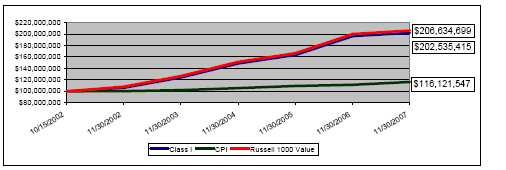
Comparison of a $100,000,000 investment in the Evergreen Market Index Value Fund Class I shares versus a similar investment in the Russell 1000 Value Index (Russell 1000 Value) and the Consumer Price Index (CPI).
The Russell 1000 Value is an unmanaged market index and does not include transaction costs associated with buying and selling securities, any mutual fund fees or expenses or any taxes. The CPI is a commonly used measure of inflation and does not represent an investment return. It is not possible to invest directly in an index.
The fund is only offered to certain pension plans having at least $100 million. Class I shares are sold without a front-end or deferred sales charge. The minimum initial investment for the fund is $100 million, which may be waived in certain situations. There is no minimum amount required for subsequent purchases.
“Russell 1000 Value Index” is a trademark and service mark of Frank Russell Company (FRC) and has been licensed for use by Evergreen Investments. The product is not sponsored, endorsed, sold or promoted by FRC and FRC makes no representation regarding the advisability of investing in the product.
The fund's investment objective may be changed without a vote of the fund's shareholders.
All data is as of November 30, 2007, and subject to change.
Market Index Value Fund
ABOUT YOUR FUND’S EXPENSES
The Example below is intended to describe the fees and expenses borne by shareholders and the impact of those costs on your investment.
Example
As a shareholder of the fund, you incur two types of costs: (1) transaction costs, including sales charges (loads), redemption fees and exchange fees; and (2) ongoing costs, including management fees, distribution (12b-1) fees and other fund expenses. This Example is intended to help you understand your ongoing costs (in dollars) of investing in the fund and to compare these costs with the ongoing costs of investing in other mutual funds. The Example is based on an investment of $1,000 invested at the beginning of the period and held for the entire period from June 1, 2007 to November 30, 2007.
The example illustrates your fund’s costs in two ways:
• Actual expenses
The section in the table under the heading “Actual” provides information about actual account values and actual expenses. You may use the information in these columns, together with the amount you invested, to estimate the expenses that you paid over the period. Simply divide your account value by $1,000 (for example, an $8,600 account value divided by $1,000 = 8.6), then multiply the result by the number in the appropriate column for your share class, in the column entitled “Expenses Paid During Period” to estimate the expenses you paid on your account during this period.
• Hypothetical example for comparison purposes
The section in the table under the heading “Hypothetical (5% return before expenses)” provides information about hypothetical account values and hypothetical expenses based on the fund’s actual expense ratio and an assumed rate of return of 5% per year before expenses, which is not the fund’s actual return. The hypothetical account values and expenses may not be used to estimate the actual ending account balance or expenses you paid for the period. You may use this information to compare the ongoing costs of investing in the fund and other funds. To do so, compare this 5% hypothetical example with the 5% hypothetical examples that appear in the shareholder reports of the other funds.
Please note that the expenses shown in the table are meant to highlight your ongoing costs only and do not reflect any transactional costs, such as sales charges (loads), redemption fees or exchange fees. Therefore, the section in the table under the heading “Hypothetical (5% return before expenses)” is useful in comparing ongoing costs only, and will not help you determine the relative total costs of owning different funds. In addition, if these transactional costs were included, your costs would have been higher.
| | | Beginning | | Ending | | |
| | | Account | | Account | | Expenses |
| | | Value | | Value | | Paid During |
| | | 6/1/2007 | | 11/30/2007 | | Period* |
| Actual | | | | | | |
| Class I | | $1,000.00 | | $926.61 | | $0.14 |
| Hypothetical | | | | | | |
| (5% return before expenses) | | | | | | |
| Class I | | $1,000.00 | | $1,024.85 | | $0.15 |
*Expenses are equal to the Fund's annualized expense ratio (0.03% for Class I), multiplied by the average account value over the period, multiplied by 183 / 366 days.
Market Index Value Fund
FINANCIAL HIGHLIGHTS - CLASS I
(For a share outstanding throughout each period)
| | | | | Six Months Ended | | | | | | | | | | |
| | | | | November 30, | | Year Ended May 31, |
| | | | 2007 | |
|
| | | | | (unaudited) | | 2007 | | 2006 | | 2005 | | 2004 | | 20031 |
|
| Net asset value, beginning of period | | $15.67 | | $15.75 | | $14.83 | | $13.23 | | $11.14 | | $10.00 |
|
| Income from investment operations | | | | | | | | | | | | |
| Net investment income (loss) | | 0.19 | | 0.392 | | 0.64 | | 0.35 | | 0.28 | | 0.15 |
| Net realized and unrealized gains or losses on | | | | | | | | | | | | |
| | | investments | | (1.34) | | 3.26 | | 1.18 | | 1.69 | | 1.91 | | 1.03 |
| |
|
| Total from investment operations | | (1.15) | | 3.65 | | 1.82 | | 2.04 | | 2.19 | | 1.18 |
|
| Distributions to shareholders from | | | | | | | | | | | | |
| Net investment income | | 0 | | (0.38) | | (0.34) | | (0.28) | | (0.10) | | (0.04) |
| Net realized gains | | 0 | | (3.35) | | (0.56) | | (0.16) | | 0 | | 0 |
| |
|
| Total distributions to shareholders | | 0 | | (3.73) | | (0.90) | | (0.44) | | (0.10) | | (0.04) |
|
| Net asset value, end of period | | $14.52 | | $15.67 | | $15.75 | | $14.83 | | $13.23 | | $11.14 |
|
| Total return | | (7.34)% | | 25.57% | | 12.53% | | 15.51% | | 19.73% | | 11.85% |
|
| Ratios and supplemental data | | | | | | | | | | | | |
| Net assets, end of period (thousands) | | $778,239 | | $839,657 | | $505,681 | | $818,284 | | $708,489 | | $544,427 |
| Ratios to average net assets | | | | | | | | | | | | |
| | | Expenses including waivers/reimbursements but | | | | | | | | | | | | |
| | | excluding expense reductions | | 0.03%3 | | 0.03% | | 0.03% | | 0.03% | | 0.02% | | 0.02%3 |
| | | Expenses excluding waivers/reimbursements | | | | | | | | | | | | |
| | | and expense reductions | | 0.46%3 | | 0.46% | | 0.46% | | 0.45% | | 0.46% | | 0.47%3 |
| | | Net investment income (loss) | | 2.46%3 | | 2.56% | | 2.63% | | 2.54% | | 2.41% | | 2.67%3 |
| Portfolio turnover rate | | 20% | | 17% | | 27% | | 16% | | 10% | | 5% |
|
| 1 | | For the period from October 15, 2002 (commencement of operations), to May 31, 2003. |
| 2 | | Net investment income (loss) per share is based on average shares outstanding during the period. |
| 3 | | Annualized | | |
See Combined Notes to Financial Statements
SCHEDULE OF INVESTMENTS
Market Index Value Fund
November 30, 2007 (unaudited)
| | | | | Shares | | Value |
|
| |
| COMMON STOCKS 99.0% | | | | | | |
| CONSUMER DISCRETIONARY 7.4% | | | | |
| Auto Components 0.2% | | | | | | |
| Autoliv, Inc. | | | | 3,517 | | $ 205,393 |
| BorgWarner, Inc. | | | | 4,971 | | 480,248 |
| Johnson Controls, Inc. | | | | 13,268 | | 512,410 |
| TRW Automotive Holdings Corp. | | | | 4,598 | | 103,225 |
| |
|
| | | | | | | 1,301,276 |
| |
|
| |
| Automobiles 0.4% | | | | | | |
| Ford Motor Co. * Þ | | | | 218,951 | | 1,644,322 |
| General Motors Corp. | | | | 52,197 | | 1,557,037 |
| Thor Industries, Inc. Þ | | | | 325 | | 11,456 |
| |
|
| | | | | | | 3,212,815 |
| |
|
| |
| Distributors 0.1% | | | | | | |
| Genuine Parts Co. | | | | 18,450 | | 886,522 |
| |
|
| |
| Diversified Consumer Services 0.1% | | | | |
| Service Corporation International | | | | 30,177 | | 400,751 |
| |
|
| |
| Hotels, Restaurants & Leisure 1.2% | | | | |
| Carnival Corp. Þ | | | | 27,721 | | 1,250,772 |
| Harrah's Entertainment, Inc. | | | | 8,612 | | 758,459 |
| International Speedway Corp., Class A | | 3,766 | | 160,469 |
| McDonald's Corp. | | | | 102,522 | | 5,994,461 |
| Orient Express Hotels, Ltd. Þ | | | | 243 | | 15,044 |
| Royal Caribbean Cruises, Ltd. Þ | | | | 14,425 | | 585,078 |
| Wyndham Worldwide Corp. * | | | | 18,281 | | 533,257 |
| |
|
| | | | | | | 9,297,540 |
| |
|
| |
| Household Durables 0.7% | | | | | | |
| Black & Decker Corp. | | | | 3,271 | | 270,348 |
| Centex Corp. Þ | | | | 12,345 | | 257,517 |
| D.R. Horton, Inc. Þ | | | | 34,014 | | 407,147 |
| Fortune Brands, Inc. | | | | 16,542 | | 1,267,944 |
| Jarden Corp. * Þ | | | | 3,607 | | 95,080 |
| KB Home Þ | | | | 8,338 | | 174,181 |
| Leggett & Platt, Inc. Þ | | | | 19,183 | | 394,786 |
| Lennar Corp., Class A Þ | | | | 14,696 | | 232,785 |
| M.D.C. Holdings, Inc. Þ | | | | 3,783 | | 133,880 |
| Mohawk Industries, Inc. * Þ | | | | 5,962 | | 479,583 |
| Newell Rubbermaid, Inc. | | | | 14,587 | | 390,640 |
| NVR, Inc. * Þ | | | | 259 | | 127,428 |
| Pulte Homes, Inc. Þ | | | | 14,763 | | 150,878 |
| Ryland Group, Inc. Þ | | | | 4,553 | | 104,719 |
| Snap-On, Inc. | | | | 6,278 | | 306,869 |
| Stanley Works | | | | 6,131 | | 319,732 |
| Toll Brothers, Inc. * Þ | | | | 13,649 | | 282,125 |
| Whirlpool Corp. Þ | | | | 2,427 | | 196,490 |
| |
|
| | | | | | | 5,592,132 |
| |
|
| |
| Internet & Catalog Retail 0.2% | | | | | | |
| Expedia, Inc. * Þ | | | | 20,549 | | 669,898 |
| |
| See Combined Notes to Financial Statements | | | | |
SCHEDULE OF INVESTMENTS continued
Market Index Value Fund
November 30, 2007 (unaudited)
| IAC/InterActiveCorp. | | 17,647 | | 491,116 |
| Liberty Interactive Group, Ser. A * | | 26,415 | | 532,262 |
| |
|
| | | | | 1,693,276 |
| |
|
| |
| Leisure Equipment & Products 0.2% | | | | |
| Brunswick Corp. Þ | | 9,785 | | 199,516 |
| Eastman Kodak Co. Þ | | 31,154 | | 731,496 |
| Hasbro, Inc. | | 10,559 | | 293,223 |
| Mattel, Inc. | | 21,928 | | 438,122 |
| |
|
| | | | | 1,662,357 |
| |
|
| |
| Media 3.2% | | | | |
| Cablevision Systems Corp., Class A * | | 15,999 | | 432,453 |
| CBS Corp., Class B | | 65,058 | | 1,784,541 |
| Central European Media Enterprises, Ltd., Class A | | 340 | | 37,301 |
| Clear Channel Communications, Inc. | | 42,249 | | 1,516,739 |
| Comcast Corp., Class A * Þ | | 123,768 | | 2,542,195 |
| Discovery Holding Co., Class A * | | 13,597 | | 332,583 |
| DreamWorks Animation SKG, Inc., Class A * | | 1,487 | | 39,108 |
| E.W. Scripps Co., Class A Þ | | 9,752 | | 423,724 |
| Gannett Co., Inc. | | 25,412 | | 933,891 |
| Getty Images, Inc. * Þ | | 2,766 | | 80,629 |
| Harte-Hanks, Inc. Þ | | 1,630 | | 27,384 |
| Hearst-Argyle Television, Inc. Þ | | 2,676 | | 52,396 |
| Idearc, Inc. Þ | | 15,901 | | 300,847 |
| Interpublic Group of Cos. * Þ | | 19,447 | | 184,552 |
| Liberty Global, Inc., Class A * Þ | | 20,414 | | 829,217 |
| Liberty Media Holding Corp., Ser. A | | 13,972 | | 1,663,506 |
| McClatchy Co., Class A Þ | | 4,894 | | 66,118 |
| New York Times Co., Class A Þ | | 11,587 | | 191,186 |
| News Corp., Class A | | 83,657 | | 1,762,653 |
| R.H. Donnelley Corp. Þ | | 7,689 | | 341,545 |
| Regal Entertainment Group, Class A Þ | | 1,600 | | 31,664 |
| Time Warner Cable, Inc. | | 7,536 | | 196,162 |
| Time Warner, Inc. | | 349,142 | | 6,026,191 |
| Tribune Co. | | 9,021 | | 280,012 |
| Virgin Media, Inc. Þ | | 31,742 | | 603,098 |
| Walt Disney Co. | | 120,385 | | 3,990,763 |
| Warner Music Group Corp. Þ | | 1,741 | | 13,145 |
| Washington Post Co., Class B | | 635 | | 512,127 |
| |
|
| | | | | 25,195,730 |
| |
|
| |
| Multi-line Retail 0.3% | | | | |
| Dillard's, Inc., Class A Þ | | 6,629 | | 135,165 |
| Macy's, Inc. | | 47,171 | | 1,398,620 |
| Saks, Inc. Þ | | 2,135 | | 43,981 |
| Sears Holdings Corp. * Þ | | 8,121 | | 856,847 |
| |
|
| | | | | 2,434,613 |
| |
|
| |
| Specialty Retail 0.6% | | | | |
| AnnTaylor Stores Corp. * | | 1,401 | | 42,660 |
| AutoNation, Inc. * Þ | | 14,941 | | 246,526 |
| Barnes & Noble, Inc. | | 5,077 | | 195,211 |
| Circuit City Stores, Inc. Þ | | 10,498 | | 67,922 |
| Foot Locker, Inc. | | 16,813 | | 219,410 |
| Gap, Inc. | | 64,933 | | 1,324,633 |
| |
| See Combined Notes to Financial Statements | | | | |
SCHEDULE OF INVESTMENTS continued
Market Index Value Fund
November 30, 2007 (unaudited)
| Home Depot, Inc. | | | | | | 76,864 | | 2,195,236 |
| OfficeMax, Inc. | | | | | | 4,414 | | 110,041 |
| Penske Automotive Group, Inc. Þ | | | | 6,062 | | 121,240 |
| RadioShack Corp. Þ | | | | | | 4,374 | | 80,919 |
| |
|
| | | | | | | | | 4,603,798 |
| |
|
| |
| Textiles, Apparel & Luxury Goods 0.2% | | | | |
| Jones Apparel Group, Inc. Þ | | 9,233 | | 172,103 |
| Liz Claiborne, Inc. Þ | | | | | | 10,550 | | 264,699 |
| VF Corp. | | | | | | 9,672 | | 723,369 |
| |
|
| | | | | | | | | 1,160,171 |
| |
|
| |
| CONSUMER STAPLES 8.6% | | | | |
| Beverages 1.3% | | | | | | | | |
| Anheuser-Busch Companies, Inc. | | | | 30,443 | | 1,604,955 |
| Brown-Forman Corp., Class B Þ | | | | 2,494 | | 176,176 |
| Coca-Cola Co. | | | | | | 85,046 | | 5,281,357 |
| Coca-Cola Enterprises, Inc. | | | | 33,748 | | 876,435 |
| Constellation Brands, Inc., Class A * | | | | 20,758 | | 488,851 |
| Molson Coors Brewing Co., Class B | | | | 11,863 | | 638,704 |
| Pepsi Bottling Group, Inc. | | | | | | 11,425 | | 487,505 |
| PepsiAmericas, Inc. | | | | | | 6,388 | | 216,234 |
| |
|
| | | | | | | | | 9,770,217 |
| |
|
| |
| Food & Staples Retailing 1.4% | | | | | | |
| BJ's Wholesale Club, Inc. * | | | | | | 7,073 | | 264,884 |
| Costco Wholesale Corp. | | | | | | 15,090 | | 1,017,066 |
| CVS Caremark Corp. | | | | | | 74,347 | | 2,980,571 |
| Kroger Co. | | | | | | 27,995 | | 804,856 |
| Rite Aid Corp. Þ | | | | | | 73,712 | | 274,209 |
| Safeway, Inc. | | | | | | 47,821 | | 1,664,171 |
| SUPERVALU, Inc. | | | | | | 22,752 | | 952,626 |
| Wal-Mart Stores, Inc. | | | | | | 69,454 | | 3,326,847 |
| |
|
| | | | | | | | | 11,285,230 |
| |
|
| |
| Food Products 2.4% | | | | | | | | |
| Archer Daniels Midland Co. | | | | | | 70,684 | | 2,569,363 |
| Bunge, Ltd. | | | | | | 13,073 | | 1,468,621 |
| Campbell Soup Co. | | | | | | 10,794 | | 396,356 |
| ConAgra Foods, Inc. | | | | | | 53,938 | | 1,349,529 |
| Corn Products International, Inc. | | | | 8,061 | | 317,039 |
| Dean Foods Co. Þ | | | | | | 13,148 | | 327,911 |
| Del Monte Foods Co. | | | | | | 21,864 | | 192,403 |
| General Mills, Inc. | | | | | | 32,214 | | 1,937,672 |
| H.J. Heinz Co. | | | | | | 15,795 | | 747,104 |
| Hershey Co. Þ | | | | | | 5,363 | | 214,037 |
| Hormel Foods Corp. | | | | | | 8,005 | | 318,199 |
| J.M. Smucker Co. | | | | | | 6,131 | | 301,216 |
| Kellogg Co. | | | | | | 8,363 | | 451,937 |
| Kraft Foods, Inc., Class A | | | | | | 173,708 | | 6,001,611 |
| McCormick & Co., Inc. | | | | | | 4,768 | | 182,185 |
| Sara Lee Corp. | | | | | | 37,944 | | 638,598 |
| Smithfield Foods, Inc. * Þ | | | | | | 11,821 | | 355,221 |
| Tyson Foods, Inc., Class A | | | | | | 28,609 | | 426,560 |
| |
| |
| |
| See Combined Notes to Financial Statements | | | | |
SCHEDULE OF INVESTMENTS continued
Market Index Value Fund
November 30, 2007 (unaudited)
| Wm. Wrigley Jr. Co. | | | | 3,114 | | 199,296 |
| |
|
| | | | | | | 18,394,858 |
| |
|
| |
| Household Products 2.3% | | | | | | |
| Church & Dwight Co. | | | | 413 | | 23,177 |
| Clorox Co. | | | | 1,199 | | 77,791 |
| Colgate-Palmolive Co. | | | | 4,320 | | 345,946 |
| Energizer Holdings, Inc. * Þ | | | | 1,724 | | 195,898 |
| Kimberly-Clark Corp. | | | | 25,580 | | 1,785,740 |
| Procter & Gamble Co. | | | | 205,961 | | 15,241,114 |
| |
|
| | | | | | | 17,669,666 |
| |
|
| |
| Personal Products 0.0% | | | | | | |
| Alberto-Culver Co. | | | | 7,548 | | 192,927 |
| Avon Products, Inc. | | | | 3,707 | | 152,172 |
| |
|
| | | | | | | 345,099 |
| |
|
| |
| Tobacco 1.2% | | | | | | |
| Altria Group, Inc. | | | | 97,709 | | 7,578,310 |
| Carolina Group | | | | 4,779 | | 425,092 |
| Reynolds American, Inc. Þ | | | | 18,560 | | 1,299,571 |
| UST, Inc. Þ | | | | 7,770 | | 449,883 |
| |
|
| | | | | | | 9,752,856 |
| |
|
| |
| ENERGY 14.9% | | | | | | |
| Energy Equipment & Services | | 0.2% | | | | |
| ENSCO International, Inc. | | | | 1,179 | | 63,489 |
| Helmerich & Payne, Inc. | | | | 11,188 | | 386,546 |
| Nabors Industries, Ltd. * | | | | 3,596 | | 96,732 |
| Patterson-UTI Energy, Inc. Þ | | | | 16,970 | | 319,885 |
| Pride International, Inc. * | | | | 4,652 | | 153,377 |
| Rowan Companies, Inc. | | | | 3,427 | | 121,316 |
| SEACOR Holdings, Inc. Þ | | | | 2,618 | | 237,112 |
| Tidewater, Inc. Þ | | | | 2,090 | | 102,180 |
| Unit Corp. * | | | | 1,095 | | 48,968 |
| |
|
| | | | | | | 1,529,605 |
| |
|
| |
| Oil, Gas & Consumable Fuels 14.7% | | | | |
| Anadarko Petroleum Corp. | | | | 50,238 | | 2,843,471 |
| Apache Corp. | | | | 35,861 | | 3,470,986 |
| Chesapeake Energy Corp. | | | | 20,805 | | 787,469 |
| Chevron Corp. | | | | 232,740 | | 20,427,590 |
| Cimarex Energy Co. Þ | | | | 9,019 | | 348,404 |
| ConocoPhillips | | | | 176,988 | | 14,166,120 |
| Continental Resources, Inc. Þ | | | | 1,704 | | 40,589 |
| Devon Energy Corp. | | | | 48,187 | | 3,990,365 |
| El Paso Corp. | | | | 75,829 | | 1,219,330 |
| EOG Resources, Inc. | | | | 26,487 | | 2,192,594 |
| Exxon Mobil Corp. | | | | 485,579 | | 43,294,224 |
| Forest Oil Corp. * | | | | 8,542 | | 402,157 |
| Frontier Oil Corp. | | | | 5,930 | | 262,106 |
| Helix Energy Solutions, Inc. * Þ | | | | 1,997 | | 81,058 |
| Hess Corp. | | | | 30,063 | | 2,141,087 |
| Marathon Oil Corp. | | | | 77,915 | | 4,355,448 |
| Murphy Oil Corp. | | | | 20,372 | | 1,457,005 |
| Newfield Exploration Co. * | | | | 14,076 | | 701,689 |
| |
| See Combined Notes to Financial Statements | | | | |
SCHEDULE OF INVESTMENTS continued
Market Index Value Fund
November 30, 2007 (unaudited)
| Noble Energy, Inc. | | | | 15,875 | | 1,143,635 |
| Occidental Petroleum Corp. | | 90,293 | | 6,299,743 |
| Overseas Shipholding Group, Inc. Þ | | 3,380 | | 242,008 |
| Pioneer Natural Resources Co. | | 13,368 | | 595,812 |
| Plains Exploration & Production Co. * | | 12,084 | | 609,169 |
| Spectra Energy Corp. | | 68,420 | | 1,685,869 |
| St. Mary Land & Exploration Co. | | 6,798 | | 267,161 |
| Teekay Shipping Corp. Þ | | 4,369 | | 245,756 |
| Valero Energy Corp. | | | | 12,544 | | 816,238 |
| W&T Offshore, Inc. Þ | | 1,124 | | 29,674 |
| Western Refining, Inc. Þ | | 1,415 | | 40,894 |
| Williams Cos. | | | | 10,571 | | 366,919 |
| |
|
| | | | | | | 114,524,570 |
| |
|
| |
| FINANCIALS 30.1% | | | | |
| Capital Markets 3.9% | | | | |
| Allied Capital Corp. Þ | | 16,490 | | 401,202 |
| American Capital Strategies, Ltd. Þ | | 20,351 | | 765,401 |
| Ameriprise Financial, Inc. | | 25,475 | | 1,495,128 |
| Bank of New York Mellon Corp. | | 80,042 | | 3,838,814 |
| Bear Stearns Cos. Þ | | 12,890 | | 1,285,133 |
| Blackrock, Inc. Þ | | | | 2,973 | | 589,754 |
| E*TRADE Financial Corp. * Þ | | 28,844 | | 132,682 |
| GLG Partners, Inc. Þ | | 1,184 | | 16,280 |
| Goldman Sachs Group, Inc. | | 24,859 | | 5,634,044 |
| Janus Capital Group, Inc. Þ | | 4,273 | | 143,445 |
| Jefferies Group, Inc. | | | | 13,583 | | 347,181 |
| Legg Mason, Inc. | | | | 8,392 | | 640,394 |
| Lehman Brothers Holdings, Inc. | | 57,677 | | 3,612,310 |
| Merrill Lynch & Co., Inc. | | 71,438 | | 4,281,994 |
| MF Global, Ltd. | | | | 4,840 | | 139,537 |
| Morgan Stanley | | | | 107,624 | | 5,673,937 |
| Northern Trust Corp. | | 3,611 | | 292,455 |
| Raymond James Financial, Inc. | | 10,187 | | 330,874 |
| State Street Corp. | | | | 8,216 | | 656,376 |
| |
|
| | | | | | | 30,276,941 |
| |
|
| |
| Commercial Banks 6.5% | | | | |
| Associated Banc-Corp. Þ | | 13,810 | | 375,770 |
| BancorpSouth, Inc. | | | | 8,901 | | 217,719 |
| Bank of Hawaii Corp. | | 3,558 | | 185,265 |
| BB&T Corp. | | | | 59,667 | | 2,152,785 |
| BOK Financial Corp. | | | | 2,410 | | 131,923 |
| City National Corp. Þ | | 4,431 | | 285,445 |
| Colonial BancGroup, Inc. Þ | | 17,212 | | 274,015 |
| Comerica, Inc. | | | | 16,887 | | 773,087 |
| Commerce Bancorp, Inc. | | 14,776 | | 588,380 |
| Commerce Bancshares, Inc. Þ | | 7,914 | | 358,751 |
| Cullen/Frost Bankers, Inc. Þ | | 6,498 | | 341,860 |
| East West Bancorp, Inc. Þ | | 6,832 | | 184,122 |
| Fifth Third Bancorp | | | | 59,567 | | 1,781,649 |
| First Citizens Bancshares, Inc., Class A | | 651 | | 102,005 |
| First Horizon National Corp. Þ | | 13,617 | | 300,663 |
| Fulton Financial Corp. Þ | | 18,753 | | 234,600 |
| Huntington Bancshares, Inc. | | 39,562 | | 620,728 |
| |
| See Combined Notes to Financial Statements | | | | |
SCHEDULE OF INVESTMENTS continued
Market Index Value Fund
November 30, 2007 (unaudited)
| KeyCorp | | 42,481 | | 1,118,950 |
| M&T Bank Corp. | | 7,431 | | 675,924 |
| Marshall & Ilsley Corp. Þ | | 28,059 | | 883,017 |
| National City Corp. Þ | | 62,542 | | 1,235,830 |
| PNC Financial Services Group, Inc. | | 37,664 | | 2,757,381 |
| Popular, Inc. Þ | | 30,252 | | 290,722 |
| Regions Financial Corp. | | 76,312 | | 2,016,926 |
| SunTrust Banks, Inc. | | 38,619 | | 2,707,578 |
| Synovus Financial Corp. Þ | | 18,706 | | 465,592 |
| TCF Financial Corp. | | 14,004 | | 271,818 |
| U.S. Bancorp | | 188,285 | | 6,230,351 |
| UnionBanCal Corp. | | 5,178 | | 279,560 |
| Valley National Bancorp Þ | | 13,032 | | 255,433 |
| Wachovia Corp. ° | | 215,295 | | 9,257,685 |
| Wells Fargo & Co. | | 367,922 | | 11,931,711 |
| Whitney Holding Corp. Þ | | 7,315 | | 200,431 |
| Wilmington Trust Corp. Þ | | 7,442 | | 265,828 |
| Zions Bancorp | | 11,706 | | 638,796 |
| |
|
| | | | | 50,392,300 |
| |
|
| |
| Consumer Finance 0.4% | | | | |
| AmeriCredit Corp. * Þ | | 11,901 | | 136,504 |
| Capital One Financial Corp. | | 42,384 | | 2,259,491 |
| Discover Financial Services | | 48,734 | | 846,510 |
| Student Loan Corp. | | 433 | | 60,841 |
| |
|
| | | | | 3,303,346 |
| |
|
| |
| Diversified Financial Services 7.5% | | | | |
| Bank of America Corp. | | 480,563 | | 22,168,371 |
| CIT Group, Inc. | | 20,768 | | 552,429 |
| Citigroup, Inc. | | 535,647 | | 17,837,045 |
| JPMorgan Chase & Co. | | 369,929 | | 16,876,161 |
| Leucadia National Corp. Þ | | 17,754 | | 833,728 |
| Nasdaq Stock Market, Inc. * | | 2,441 | | 105,842 |
| |
|
| | | | | 58,373,576 |
| |
|
| |
| Insurance 7.9% | | | | |
| ACE, Ltd. | | 33,627 | | 2,011,903 |
| AFLAC, Inc. | | 4,449 | | 278,685 |
| Alleghany Corp. Þ | | 537 | | 219,428 |
| Allied World Assurance Co. Holdings, Ltd. | | 6,540 | | 302,671 |
| Allstate Corp. | | 61,802 | | 3,159,318 |
| Ambac Financial Group, Inc. Þ | | 11,038 | | 300,565 |
| American International Group, Inc. | | 225,731 | | 13,121,743 |
| American National Insurance Co. | | 1,698 | | 202,996 |
| AON Corp. | | 31,795 | | 1,588,796 |
| Arch Capital Group, Ltd. | | 5,161 | | 360,135 |
| Arthur J. Gallagher & Co. Þ | | 8,196 | | 215,391 |
| Assurant, Inc. Þ | | 13,104 | | 857,395 |
| Axis Capital Holdings, Ltd. | | 16,649 | | 634,993 |
| Chubb Corp. | | 43,476 | | 2,371,616 |
| Cincinnati Financial Corp. | | 18,591 | | 743,268 |
| CNA Financial Corp. * | | 2,933 | | 103,945 |
| Conseco, Inc. Þ | | 20,423 | | 262,231 |
| Endurance Specialty Holdings, Ltd. | | 6,356 | | 256,719 |
| Erie Indemnity Co., Class A Þ | | 3,943 | | 204,011 |
| |
| See Combined Notes to Financial Statements | | | | |
SCHEDULE OF INVESTMENTS continued
Market Index Value Fund
November 30, 2007 (unaudited)
| Everest Re Group, Ltd. | | 6,842 | | 717,931 |
| Fidelity National Title Group, Inc., Class A Þ | | 24,002 | | 374,911 |
| First American Corp. Þ | | 9,926 | | 339,271 |
| Genworth Financial, Inc., Class A | | 47,092 | | 1,235,694 |
| Hartford Financial Services Group, Inc. | | 34,291 | | 3,268,618 |
| HCC Insurance Holdings, Inc. | | 6,894 | | 211,922 |
| Lincoln National Corp. | | 29,322 | | 1,805,355 |
| Loews Corp. | | 47,163 | | 2,253,920 |
| Markel Corp. * | | 1,078 | | 519,758 |
| Marsh & McLennan Cos. | | 56,327 | | 1,414,934 |
| MBIA, Inc. Þ | | 14,164 | | 517,128 |
| Mercury General Corp. | | 2,878 | | 149,339 |
| MetLife, Inc. | | 51,076 | | 3,350,075 |
| Nationwide Financial Services, Inc., Class A | | 5,731 | | 256,520 |
| Old Republic International Corp. | | 25,058 | | 376,121 |
| OneBeacon Insurance Group, Ltd. | | 3,065 | | 64,671 |
| PartnerRe, Ltd. Þ | | 4,786 | | 395,180 |
| Philadelphia Consolidated Holding Co. * | | 1,455 | | 61,954 |
| Principal Financial Group, Inc. | | 27,375 | | 1,792,789 |
| Progressive Corp. | | 75,597 | | 1,390,985 |
| Protective Life Corp. | | 7,588 | | 313,991 |
| Prudential Financial, Inc. | | 38,066 | | 3,583,533 |
| Reinsurance Group of America, Inc. | | 3,183 | | 172,232 |
| RenaissanceRe Holdings, Ltd. | | 7,825 | | 462,536 |
| SAFECO Corp. | | 10,239 | | 590,893 |
| StanCorp Financial Group, Inc. | | 5,362 | | 279,307 |
| The Hanover Insurance Group, Inc. | | 5,291 | | 238,624 |
| Torchmark Corp. | | 10,342 | | 637,895 |
| TransAtlantic Holdings, Inc. | | 1,871 | | 139,109 |
| Travelers Companies, Inc. | | 71,904 | | 3,818,821 |
| Unitrin, Inc. Þ | | 4,941 | | 228,571 |
| Universal American Financial Corp. | | 8,907 | | 260,262 |
| UnumProvident Corp. | | 39,070 | | 970,499 |
| W.R. Berkley Corp. | | 12,738 | | 389,528 |
| Wesco Financial Corp. | | 153 | | 66,096 |
| White Mountains Insurance Group, Ltd. | | 987 | | 508,305 |
| XL Capital, Ltd., Class A | | 17,780 | | 1,040,663 |
| |
|
| | | | | 61,393,750 |
| |
|
| |
| Real Estate Investment Trusts 2.4% | | | | |
| AMB Property Corp. | | 10,788 | | 659,794 |
| Annaly Mortgage Management, Inc. | | 43,512 | | 748,842 |
| Apartment Investment & Management Co., Class A | | 9,953 | | 395,831 |
| AvalonBay Communities, Inc. | | 8,625 | | 857,670 |
| Boston Properties, Inc. | | 11,096 | | 1,092,068 |
| Brandywine Realty Trust | | 9,426 | | 193,233 |
| BRE Properties, Inc. Þ | | 5,490 | | 244,579 |
| Camden Property Trust | | 6,153 | | 323,709 |
| CapitalSource, Inc. Þ | | 6,242 | | 104,616 |
| CBL & Associates Properties, Inc. | | 7,107 | | 205,250 |
| Colonial Properties Trust | | 5,033 | | 123,258 |
| Developers Diversified Realty Corp. | | 13,531 | | 600,912 |
| Douglas Emmett, Inc. Þ | | 11,208 | | 269,104 |
| Duke Realty Corp. | | 4,240 | | 111,470 |
| Equity Residential | | 29,353 | | 1,092,225 |
| |
| See Combined Notes to Financial Statements | | | | |
SCHEDULE OF INVESTMENTS continued
Market Index Value Fund
November 30, 2007 (unaudited)
| Essex Property Trust, Inc. Þ | | | | 1,431 | | 148,452 |
| Federal Realty Investment Trust | | | | 2,935 | | 244,163 |
| General Growth Properties, Inc. | | | | 10,499 | | 487,574 |
| HCP, Inc. | | | | 22,310 | | 746,269 |
| Health Care REIT, Inc. Þ | | | | 7,630 | | 341,900 |
| Hospitality Properties Trust | | | | 10,165 | | 371,429 |
| Host Hotels & Resorts, Inc. | | | | 56,533 | | 1,084,868 |
| HRPT Properties Trust | | | | 24,412 | | 202,131 |
| iStar Financial, Inc. Þ | | | | 13,879 | | 406,238 |
| Kimco Realty Corp. | | | | 23,251 | | 918,182 |
| Liberty Property Trust | | | | 9,958 | | 311,785 |
| Mack-Cali Realty Corp. | | | | 7,355 | | 262,500 |
| Plum Creek Timber Co., Inc. | | | | 17,648 | | 818,338 |
| ProLogis | | | | 3,473 | | 227,204 |
| Public Storage, Inc. | | | | 12,473 | | 964,662 |
| Rayonier, Inc. | | | | 7,873 | | 365,150 |
| Regency Centers Corp. | | | | 7,524 | | 499,895 |
| Simon Property Group, Inc. | | | | 10,696 | | 1,053,021 |
| SL Green Realty Corp. | | | | 6,434 | | 668,493 |
| Taubman Centers, Inc. | | | | 2,600 | | 139,178 |
| Thornburg Mortgage, Inc. Þ | | | | 14,153 | | 150,871 |
| Vornado Realty Trust | | | | 14,455 | | 1,300,950 |
| |
|
| | | | | | | 18,735,814 |
| |
|
| |
| Thrifts & Mortgage Finance 1.5% | | | | | | |
| Astoria Financial Corp. | | | | 9,401 | | 235,401 |
| Capitol Federal Financial Þ | | | | 736 | | 24,943 |
| Countrywide Financial Corp. Þ | | | | 64,258 | | 695,272 |
| Fannie Mae | | | | 105,371 | | 4,048,354 |
| Freddie Mac | | | | 43,549 | | 1,527,263 |
| Hudson City Bancorp, Inc. | | | | 35,491 | | 540,173 |
| IndyMac Bancorp, Inc. Þ | | | | 8,716 | | 83,238 |
| MGIC Investment Corp. Þ | | | | 8,995 | | 211,562 |
| New York Community Bancorp, Inc. Þ | | | | 34,821 | | 648,019 |
| People's United Financial, Inc. | | | | 7,211 | | 122,371 |
| PMI Group, Inc. Þ | | | | 8,784 | | 116,212 |
| Radian Group, Inc. Þ | | | | 8,689 | | 98,533 |
| Sovereign Bancorp, Inc. | | | | 46,430 | | 546,481 |
| TFS Financial Corp. Þ | | | | 9,377 | | 115,806 |
| Washington Federal, Inc. Þ | | | | 9,457 | | 221,956 |
| Washington Mutual, Inc. Þ | | | | 95,555 | | 1,863,323 |
| Webster Financial Corp. | | | | 5,796 | | 195,267 |
| |
|
| | | | | | | 11,294,174 |
| |
|
| |
| HEALTH CARE 7.4% | | | | | | |
| Biotechnology 0.5% | | | | | | |
| Amgen, Inc. * | | | | 33,539 | | 1,853,030 |
| Biogen Idec, Inc. * | | | | 25,224 | | 1,869,603 |
| Millennium Pharmaceuticals, Inc. * | | | | 15,579 | | 229,634 |
| |
|
| | | | | | | 3,952,267 |
| |
|
| |
| Health Care Equipment & Supplies 0.6% | | | | |
| Beckman Coulter, Inc. | | | | 1,261 | | 89,190 |
| Boston Scientific Corp. * | | | | 144,232 | | 1,821,650 |
| Cooper Cos. Þ | | | | 2,892 | | 124,443 |
| |
| See Combined Notes to Financial Statements | | | | |
SCHEDULE OF INVESTMENTS continued
Market Index Value Fund November 30, 2007 (unaudited)
| Covidien, Ltd. | | 53,670 | | 2,152,704 |
| Hillenbrand Industries, Inc. | | 5,537 | | 298,112 |
| Kinetic Concepts, Inc. * Þ | | 1,051 | | 61,631 |
| |
|
| | | | | 4,547,730 |
| |
|
| |
| Health Care Providers & Services 0.7% | | | | |
| Aetna, Inc. | | 10,596 | | 592,104 |
| AmerisourceBergen Corp. | | 9,802 | | 444,717 |
| Brookdale Senior Living, Inc. Þ | | 3,087 | | 102,180 |
| Community Health Systems, Inc. * Þ | | 9,475 | | 316,654 |
| Coventry Health Care, Inc. * | | 1,100 | | 63,668 |
| Health Management Associates, Inc., Class A Þ | | 26,239 | | 178,688 |
| Lifepoint Hospitals, Inc. * | | 6,252 | | 197,813 |
| McKesson Corp. | | 2,510 | | 167,492 |
| Omnicare, Inc. Þ | | 11,569 | | 294,778 |
| Quest Diagnostics, Inc. Þ | | 1,235 | | 67,999 |
| Tenet Healthcare Corp. * Þ | | 11,576 | | 63,784 |
| Universal Health Services, Inc., Class B | | 3,563 | | 181,535 |
| WellPoint, Inc. * | | 33,966 | | 2,860,277 |
| |
|
| | | | | 5,531,689 |
| |
|
| |
| Health Care Technology 0.0% | | | | |
| IMS Health, Inc. | | 2,274 | | 53,098 |
| |
|
| |
| Life Sciences Tools & Services 0.4% | | | | |
| Applera Corp. - Applied Biosystems Group | | 14,971 | | 511,409 |
| Charles River Laboratories International, Inc. * | | 4,803 | | 305,135 |
| Invitrogen Corp. * | | 3,159 | | 306,455 |
| PerkinElmer, Inc. | | 9,714 | | 264,998 |
| Thermo Fisher Scientific, Inc. * | | 22,982 | | 1,324,682 |
| |
|
| | | | | 2,712,679 |
| |
|
| |
| Pharmaceuticals 5.2% | | | | |
| Eli Lilly & Co. | | 54,972 | | 2,910,767 |
| Johnson & Johnson | | 196,042 | | 13,279,885 |
| King Pharmaceuticals, Inc. * | | 26,386 | | 279,428 |
| Merck & Co., Inc. | | 40,836 | | 2,424,025 |
| Pfizer, Inc. | | 760,003 | | 18,057,671 |
| Watson Pharmaceuticals, Inc. * | | 4,652 | | 136,350 |
| Wyeth | | 69,046 | | 3,390,159 |
| |
|
| | | | | 40,478,285 |
| |
|
| |
| INDUSTRIALS 10.5% | | | | |
| Aerospace & Defense 1.6% | | | | |
| Alliant Techsystems, Inc. * Þ | | 498 | | 58,181 |
| DRS Technologies, Inc. | | 4,167 | | 246,728 |
| General Dynamics Corp. | | 37,745 | | 3,351,001 |
| Honeywell International, Inc. | | 12,159 | | 688,443 |
| L-3 Communications Holdings, Inc. | | 8,999 | | 995,739 |
| Northrop Grumman Corp. | | 35,017 | | 2,758,989 |
| Raytheon Co. | | 23,263 | | 1,438,817 |
| Spirit AeroSystems Holdings, Inc., Class A | | 1,390 | | 48,581 |
| United Technologies Corp. | | 41,998 | | 3,140,190 |
| |
|
| | | | | 12,726,669 |
| |
|
| |
| |
| |
| See Combined Notes to Financial Statements | | | | |
SCHEDULE OF INVESTMENTS continued
Market Index Value Fund
November 30, 2007 (unaudited)
| Air Freight & Logistics 0.1% | | | | | | |
| FedEx Corp. | | | | 5,366 | | 528,390 |
| |
|
| |
| Airlines 0.2% | | | | | | |
| Northwest Airlines Corp. | | | | 9,605 | | 174,619 |
| Southwest Airlines Co. | | | | 62,796 | | 888,563 |
| UAL Corp. Þ | | | | 5,094 | | 208,548 |
| US Airways Group, Inc. * Þ | | | | 8,811 | | 183,005 |
| |
|
| | | | | | | 1,454,735 |
| |
|
| |
| Building Products 0.2% | | | | | | |
| Armstrong World Industries, Inc. | | | | 2,105 | | 89,884 |
| Lennox International, Inc. | | | | 5,069 | | 171,535 |
| Masco Corp. | | | | 38,529 | | 863,050 |
| Owens Corning, Inc. Þ | | | | 11,940 | | 262,799 |
| USG Corp. * Þ | | | | 8,677 | | 318,359 |
| |
|
| | | | | | | 1,705,627 |
| |
|
| |
| Commercial Services & Supplies | | 0.3% | | | | |
| Allied Waste Industries, Inc. * | | | | 26,263 | | 299,661 |
| Avery Dennison Corp. | | | | 1,685 | | 87,805 |
| Cintas Corp. | | | | 3,511 | | 112,317 |
| Copart, Inc. * | | | | 496 | | 18,531 |
| Pitney Bowes, Inc. | | | | 4,329 | | 166,666 |
| R.R. Donnelley & Sons Co. | | | | 23,834 | | 873,754 |
| Republic Services, Inc. | | | | 1,909 | | 63,322 |
| Steelcase, Inc. Þ | | | | 1,861 | | 28,157 |
| Waste Management, Inc. | | | | 24,598 | | 844,203 |
| |
|
| | | | | | | 2,494,416 |
| |
|
| |
| Construction & Engineering 0.1% | | | | | | |
| KBR, Inc. | | | | 18,277 | | 727,790 |
| Shaw Group, Inc. | | | | 743 | | 47,121 |
| URS Corp. * Þ | | | | 6,749 | | 388,000 |
| |
|
| | | | | | | 1,162,911 |
| |
|
| |
| Electrical Equipment 0.2% | | | | | | |
| Cooper Industries, Inc. | | | | 13,439 | | 674,907 |
| Emerson Electric Co. | | | | 14,554 | | 829,869 |
| Hubbell, Inc., Class B | | | | 4,295 | | 235,924 |
| |
|
| | | | | | | 1,740,700 |
| |
|
| |
| Industrial Conglomerates 5.3% | | | | | | |
| 3M Co. | | | | 4,991 | | 415,551 |
| Carlisle Cos. Þ | | | | 4,893 | | 194,790 |
| General Electric Co. | | | | 990,433 | | 37,923,680 |
| Teleflex, Inc. | | | | 4,244 | | 256,040 |
| Tyco International, Ltd. | | | | 53,670 | | 2,153,777 |
| |
|
| | | | | | | 40,943,838 |
| |
|
| |
| Machinery 1.7% | | | | | | |
| AGCO Corp. * | | | | 3,428 | | 236,326 |
| Crane Co. | | | | 5,515 | | 247,844 |
| Deere & Co. | | | | 23,190 | | 3,984,042 |
| Dover Corp. | | | | 15,008 | | 694,570 |
| Eaton Corp. | | | | 13,992 | | 1,249,626 |
| |
| See Combined Notes to Financial Statements | | | | |
SCHEDULE OF INVESTMENTS continued
Market Index Value Fund
November 30, 2007 (unaudited)
| Flowserve Corp. * | | | | | | 624 | | 58,712 |
| Gardner Denver, Inc. * | | | | | | 5,726 | | 189,588 |
| Illinois Tool Works, Inc. | | | | | | 13,644 | | 757,242 |
| Ingersoll-Rand Co., Ltd., Class A | | | | | | 27,672 | | 1,428,982 |
| ITT Corp. | | | | | | 17,219 | | 1,109,592 |
| Kennametal, Inc. | | | | | | 1,772 | | 138,305 |
| Lincoln Electric Holdings, Inc. | | | | | | 1,472 | | 102,701 |
| Pall Corp. | | | | | | 1,159 | | 44,332 |
| Parker Hannifin Corp. | | | | | | 18,814 | | 1,494,396 |
| Pentair, Inc. | | | | | | 10,806 | | 366,540 |
| SPX Corp. | | | | | | 5,674 | | 577,386 |
| Timken Co. | | | | | | 10,276 | | 327,702 |
| Trinity Industries, Inc. Þ | | | | | | 1,096 | | 27,740 |
| |
|
| | | | | | | | | 13,035,626 |
| |
|
| |
| Marine 0.0% | | | | | | | | |
| Alexander & Baldwin, Inc. Þ | | | | | | 4,646 | | 238,712 |
| |
|
| |
| Road & Rail 0.7% | | | | | | | | |
| Avis Budget Group, Inc. | | | | | | 7,108 | | 106,833 |
| Burlington Northern Santa Fe Corp. | | | | | | 2,198 | | 183,577 |
| Con-Way, Inc. Þ | | | | | | 1,087 | | 45,959 |
| CSX Corp. | | | | | | 39,244 | | 1,648,248 |
| Hertz Global Holdings, Inc. Þ | | | | | | 12,083 | | 230,785 |
| Kansas City Southern * Þ | | | | | | 3,319 | | 114,273 |
| Norfolk Southern Corp. | | | | | | 20,950 | | 1,072,850 |
| Ryder System, Inc. | | | | | | 6,284 | | 272,474 |
| Union Pacific Corp. | | | | | | 11,263 | �� | 1,420,715 |
| YRC Worldwide, Inc. * Þ | | | | | | 6,227 | | 110,280 |
| |
|
| | | | | | | | | 5,205,994 |
| |
|
| |
| Trading Companies & Distributors 0.1% | | | | |
| GATX Corp. | | | | | | 3,165 | | 117,200 |
| United Rentals, Inc. Þ | | | | | | 9,291 | | 216,202 |
| W.W. Grainger, Inc. Þ | | | | | | 1,188 | | 104,900 |
| |
|
| | | | | | | | | 438,302 |
| |
|
| |
| INFORMATION TECHNOLOGY 3.3% | | | | |
| Communications Equipment 0.6% | | | | | | |
| ADC Telecommunications, Inc. * | | | | | | 12,699 | | 210,295 |
| JDS Uniphase Corp. * Þ | | | | | | 10,076 | | 135,623 |
| Juniper Networks, Inc. * | | | | | | 15,755 | | 468,239 |
| Motorola, Inc. | | | | | | 250,649 | | 4,002,864 |
| Tellabs, Inc. * | | | | | | 47,406 | | 329,946 |
| |
|
| | | | | | | | | 5,146,967 |
| |
|
| |
| Computers & Peripherals 1.0% | | | | | | |
| International Business Machines Corp. | | | | 30,177 | | 3,174,017 |
| Lexmark International, Inc., Class A * Þ | | | | 4,670 | | 162,890 |
| NCR Corp. * | | | | | | 17,046 | | 408,081 |
| QLogic Corp. * | | | | | | 1,556 | | 21,037 |
| SanDisk Corp. * | | | | | | 10,033 | | 375,636 |
| Seagate Technology, Inc. | | | | | | 36,561 | | 942,908 |
| Sun Microsystems, Inc. | | | | | | 72,009 | | 1,496,337 |
| Teradata Corp. | | | | | | 17,046 | | 442,514 |
| |
| |
| See Combined Notes to Financial Statements | | | | |
SCHEDULE OF INVESTMENTS continued
Market Index Value Fund
November 30, 2007 (unaudited)
| Western Digital Corp. * | | | | 16,869 | | 466,090 |
| |
|
| | | | | | | 7,489,510 |
| |
|
| |
| Electronic Equipment & Instruments 0.5% | | | | | | |
| Arrow Electronics, Inc. * | | | | 6,037 | | 223,429 |
| Avnet, Inc. * | | | | 6,685 | | 230,633 |
| AVX Corp. Þ | | | | 4,393 | | 62,952 |
| Ingram Micro, Inc., Class A | | | | 15,710 | | 312,629 |
| Jabil Circuit, Inc. | | | | 7,374 | | 124,989 |
| Molex, Inc. | | | | 6,408 | | 176,605 |
| Sanmina-SCI Corp. * | | | | 44,642 | | 79,016 |
| Tech Data Corp. * | | | | 5,954 | | 223,930 |
| Tyco Electronics, Ltd. | | | | 53,670 | | 2,006,721 |
| Vishay Intertechnology, Inc. * | | | | 16,639 | | 207,821 |
| |
|
| | | | | | | 3,648,725 |
| |
|
| |
| IT Services 0.4% | | | | | | |
| Affiliated Computer Services, Inc., Class A * | | | | 5,831 | | 244,669 |
| CheckFree Corp. * | | | | 1,851 | | 88,108 |
| Computer Sciences Corp. * Þ | | | | 18,757 | | 990,745 |
| Convergys Corp. * | | | | 14,825 | | 241,796 |
| Electronic Data Systems Corp. | | | | 23,144 | | 468,897 |
| Fidelity National Information Services, Inc. | | | | 3,274 | | 141,502 |
| Genpact, Ltd. | | | | 593 | | 8,480 |
| Hewitt Associates, Inc., Class A * | | | | 3,859 | | 144,712 |
| Metavante Technologies, Inc. Þ | | | | 9,353 | | 213,061 |
| Unisys Corp. * Þ | | | | 37,658 | | 186,784 |
| Western Union Co. | | | | 4,769 | | 107,779 |
| |
|
| | | | | | | 2,836,533 |
| |
|
| |
| Office Electronics 0.2% | | | | | | |
| Xerox Corp. * | | | | 101,505 | | 1,713,405 |
| |
|
| |
| Semiconductors & Semiconductor Equipment 0.3% | | | | |
| Advanced Micro Devices, Inc. * Þ | | | | 38,763 | | 378,327 |
| Atmel Corp. * | | | | 48,634 | | 213,503 |
| Cree, Inc. * Þ | | | | 6,853 | | 168,790 |
| Fairchild Semiconductor International, Inc. * | | | | 7,879 | | 124,961 |
| Integrated Device Technology, Inc. | | | | 14,223 | | 172,525 |
| International Rectifier Corp. * Þ | | | | 6,078 | | 197,657 |
| Intersil Corp., Class A | | | | 6,629 | | 165,327 |
| LSI Logic Corp. * Þ | | | | 31,637 | | 175,585 |
| Micron Technology, Inc. * Þ | | | | 55,204 | | 459,297 |
| Novellus Systems, Inc. * Þ | | | | 4,389 | | 114,158 |
| Rambus, Inc. * Þ | | | | 2,381 | | 46,168 |
| Teradyne, Inc. * Þ | | | | 9,308 | | 101,364 |
| |
|
| | | | | | | 2,317,662 |
| |
|
| |
| Software 0.3% | | | | | | |
| CA, Inc. | | | | 16,721 | | 409,497 |
| Cadence Design Systems, Inc. * | | | | 21,822 | | 362,245 |
| Compuware Corp. * | | | | 6,164 | | 50,915 |
| Fair Isaac Corp. Þ | | | | 5,597 | | 206,865 |
| Novell, Inc. * | | | | 32,855 | | 230,642 |
| Symantec Corp. * | | | | 83,521 | | 1,486,674 |
| |
| |
| See Combined Notes to Financial Statements | | | | | | |
SCHEDULE OF INVESTMENTS continued
Market Index Value Fund
November 30, 2007 (unaudited)
| VMware, Inc., Class A * Þ | | 733 | | 66,974 |
| |
|
| | | | | 2,813,812 |
| |
|
| |
| MATERIALS 4.2% | | | | |
| Chemicals 2.1% | | | | |
| Air Products & Chemicals, Inc. | | 12,409 | | 1,228,987 |
| Airgas, Inc. | | 536 | | 26,521 |
| Ashland, Inc. | | 6,077 | | 299,232 |
| Cabot Corp. | | 2,053 | | 70,664 |
| Celanese Corp., Ser. A | | 4,927 | | 195,503 |
| Chemtura Corp. | | 24,476 | | 183,570 |
| Cytec Industries, Inc. | | 4,559 | | 279,649 |
| Dow Chemical Co. | | 103,226 | | 4,329,298 |
| E.I. DuPont de Nemours & Co. | | 84,120 | | 3,882,138 |
| Eastman Chemical Co. | | 9,110 | | 584,953 |
| FMC Corp. | | 8,293 | | 453,793 |
| Huntsman Corp. Þ | | 9,780 | | 248,021 |
| International Flavors & Fragrances, Inc. Þ | | 2,236 | | 112,113 |
| Lubrizol Corp. | | 5,530 | | 354,694 |
| Lyondell Chemical Co. | | 25,058 | | 1,182,738 |
| Mosaic Co. * | | 9,566 | | 661,489 |
| PPG Industries, Inc. | | 17,778 | | 1,220,282 |
| Rohm & Haas Co. Þ | | 6,842 | | 372,000 |
| RPM International, Inc. | | 1,833 | | 34,919 |
| Scotts Miracle-Gro Co., Class A Þ | | 3,839 | | 141,698 |
| Sigma-Aldrich Corp. | | 9,926 | | 522,604 |
| Valspar Corp. | | 9,793 | | 220,734 |
| Westlake Chemical Corp. Þ | | 2,077 | | 41,062 |
| |
|
| | | | | 16,646,662 |
| |
|
| |
| Containers & Packaging 0.3% | | | | |
| Bemis Co., Inc. Þ | | 11,327 | | 307,301 |
| Owens-Illinois, Inc. * | | 1,056 | | 47,404 |
| Sealed Air Corp. | | 15,080 | | 352,420 |
| Smurfit-Stone Container Corp. * | | 27,616 | | 304,052 |
| Sonoco Products Co. | | 10,829 | | 328,985 |
| Temple-Inland, Inc. Þ | | 11,459 | | 526,770 |
| |
|
| | | | | 1,866,932 |
| |
|
| |
| Metals & Mining 1.2% | | | | |
| Alcoa, Inc. | | 94,160 | | 3,424,599 |
| Carpenter Technology Corp. Þ | | 2,363 | | 178,288 |
| Commercial Metals Co. | | 12,911 | | 399,079 |
| Freeport-McMoRan Copper & Gold, Inc. | | 7,264 | | 718,628 |
| Newmont Mining Corp. | | 26,852 | | 1,334,276 |
| NuCor Corp. | | 25,320 | | 1,499,197 |
| Reliance Steel & Aluminum Co. | | 6,419 | | 331,156 |
| Steel Dynamics, Inc. | | 6,289 | | 316,400 |
| United States Steel Corp. | | 12,812 | | 1,251,732 |
| |
|
| | | | | 9,453,355 |
| |
|
| |
| Paper & Forest Products 0.6% | | | | |
| Domtar Corp. * Þ | | 25,319 | | 192,424 |
| International Paper Co. | | 47,167 | | 1,591,886 |
| Louisiana-Pacific Corp. Þ | | 11,297 | | 173,748 |
| MeadWestvaco Corp. Þ | | 19,973 | | 656,513 |
| |
| See Combined Notes to Financial Statements | | | | |
SCHEDULE OF INVESTMENTS continued
Market Index Value Fund
November 30, 2007 (unaudited)
| Weyerhaeuser Co. | | | | 23,381 | | 1,711,022 |
| |
|
| | | | | | | 4,325,593 |
| |
|
| |
| TELECOMMUNICATION SERVICES 6.1% | | | | | | |
| Diversified Telecommunication Services 5.4% | | | | |
| AT&T, Inc. | | | | 667,664 | | 25,511,441 |
| CenturyTel, Inc. | | | | 11,860 | | 505,592 |
| Citizens Communications Co. | | | | 30,554 | | 396,591 |
| Embarq Corp. | | | | 16,359 | | 833,491 |
| Qwest Communications International, Inc. * Þ | | | | 174,216 | | 1,155,052 |
| Verizon Communications, Inc. | | | | 314,403 | | 13,585,354 |
| Windstream Corp. | | | | 23,152 | | 299,818 |
| |
|
| | | | | | | 42,287,339 |
| |
|
| |
| Wireless Telecommunication Services 0.7% | | | | |
| Clearwire Corp. Þ | | | | 2,512 | | 39,112 |
| Crown Castle International Corp. * | | | | 4,569 | | 191,670 |
| Sprint Nextel Corp. | | | | 304,576 | | 4,727,019 |
| Telephone & Data Systems, Inc. | | | | 6,132 | | 381,717 |
| U.S. Cellular Corp. * | | | | 1,222 | | 100,204 |
| |
|
| | | | | | | 5,439,722 |
| |
|
| |
| UTILITIES 6.5% | | | | | | |
| Electric Utilities 3.6% | | | | | | |
| American Electric Power Co., Inc. | | | | 43,182 | | 2,058,486 |
| Consolidated Edison, Inc. Þ | | | | 29,294 | | 1,419,294 |
| DPL, Inc. Þ | | | | 5,683 | | 172,081 |
| Duke Energy Corp. | | | | 136,386 | | 2,699,079 |
| Edison International | | | | 35,282 | | 1,975,086 |
| Entergy Corp. | | | | 21,362 | | 2,553,614 |
| Exelon Corp. | | | | 39,917 | | 3,236,071 |
| FirstEnergy Corp. | | | | 33,010 | | 2,263,166 |
| FPL Group, Inc. | | | | 44,011 | | 3,070,207 |
| Great Plains Energy, Inc. Þ | | | | 9,313 | | 276,410 |
| Hawaiian Electric Industries, Inc. Þ | | | | 8,876 | | 205,479 |
| Mirant Corp. Þ | | | | 8,728 | | 336,814 |
| Northeast Utilities | | | | 16,737 | | 528,555 |
| NRG Energy, Inc. * Þ | | | | 5,117 | | 216,910 |
| Pepco Holdings, Inc. | | | | 20,909 | | 587,543 |
| Pinnacle West Capital Corp. | | | | 10,855 | | 465,245 |
| PPL Corp. | | | | 10,616 | | 540,991 |
| Progress Energy, Inc. | | | | 27,924 | | 1,363,250 |
| Reliant Energy, Inc. | | | | 36,994 | | 963,324 |
| Sierra Pacific Resources Þ | | | | 20,461 | | 351,929 |
| Southern Co. Þ | | | | 81,413 | | 3,062,757 |
| |
|
| | | | | | | 28,346,291 |
| |
|
| |
| Gas Utilities 0.5% | | | | | | |
| AGL Resources, Inc. | | | | 8,424 | | 312,362 |
| Atmos Energy Corp. | | | | 9,617 | | 251,869 |
| Energen Corp. | | | | 7,768 | | 495,132 |
| Equitable Resources, Inc. | | | | 3,161 | | 167,091 |
| National Fuel Gas Co. Þ | | | | 9,040 | | 430,756 |
| ONEOK, Inc. | | | | 11,250 | | 523,125 |
| Questar Corp. | | | | 12,285 | | 656,633 |
| |
| See Combined Notes to Financial Statements | | | | | | |
SCHEDULE OF INVESTMENTS continued
Market Index Value Fund
November 30, 2007 (unaudited)
| Southern Union Co. | | | | 11,641 | | 347,484 |
| UGI Corp. | | | | 11,504 | | 304,166 |
| |
|
| | | | | | | 3,488,618 |
| |
|
| |
| Independent Power Producers & Energy Traders 0.1% | | | | | | |
| Constellation Energy Group, Inc. | | | | 4,374 | | 438,319 |
| Dynegy, Inc., Class A * | | | | 30,687 | | 233,528 |
| |
|
| | | | | | | 671,847 |
| |
|
| |
| Multi-Utilities 2.3% | | | | | | |
| Alliant Energy Corp. | | | | 12,317 | | 511,402 |
| Ameren Corp. | | | | 22,418 | | 1,207,209 |
| CMS Energy Corp. Þ | | | | 24,311 | | 423,741 |
| Dominion Resources, Inc. Þ | | | | 63,068 | | 2,978,702 |
| DTE Energy Co. | | | | 17,728 | | 869,558 |
| Energy East Corp. | | | | 17,113 | | 473,003 |
| Integrys Energy Group, Inc. Þ | | | | 8,196 | | 418,078 |
| MDU Resources Group, Inc. | | | | 19,691 | | 537,367 |
| NiSource, Inc. | | | | 29,678 | | 549,340 |
| NSTAR Þ | | | | 11,566 | | 404,810 |
| OGE Energy Corp. | | | | 9,935 | | 353,686 |
| PG&E Corp. | | | | 38,064 | | 1,761,221 |
| Public Service Enterprise Group, Inc. | | | | 27,465 | | 2,629,499 |
| Puget Energy, Inc. | | | | 12,655 | | 355,226 |
| SCANA Corp. | | | | 12,634 | | 538,335 |
| Sempra Energy | | | | 28,568 | | 1,788,928 |
| TECO Energy, Inc. Þ | | | | 22,700 | | 393,164 |
| Vectren Corp. Þ | | | | 8,284 | | 243,218 |
| Wisconsin Energy Corp. | | | | 12,664 | | 605,846 |
| Xcel Energy, Inc. Þ | | | | 44,281 | | 1,023,334 |
| |
|
| | | | | | | 18,065,667 |
| |
|
| |
| Water Utilities 0.0% | | | | | | |
| Aqua America, Inc. Þ | | | | 13,382 | | 296,277 |
| |
|
| Total Common Stocks (cost $633,786,949) | | | | | | 770,289,568 |
| |
|
| |
| EXCHANGE TRADED FUND 0.7% | | | | | | |
| iShares Russell 1000 Value Index Fund (cost $5,838,474) | | | | 70,807 | | 5,789,888 |
| |
|
| |
| INVESTMENTS OF CASH COLLATERAL FROM SECURITIES LOANED 7.1% | | |
| MUTUAL FUND SHARES 7.1% | | | | | | |
| Navigator Prime Portfolio, 4.79% § (cost $55,495,138) | | | | 55,495,138 | | 55,495,138 |
| |
|
| |
| SHORT-TERM INVESTMENTS 0.1% | | | | | | |
| |
| | | | | Principal | | |
| | | | | Amount | | Value |
|
| |
| U.S. TREASURY OBLIGATIONS 0.0% | | | | | | |
| U.S. Treasury Bill, 2.98%, 02/28/2008 ß ƒ | | $ 100,000 | | 99,280 |
| |
|
| |
| | | | | Shares | | Value |
|
| |
| MUTUAL FUND SHARES 0.1% | | | | | | |
| Evergreen Institutional Money Market Fund, Class I, 4.88% q ø | | | | 359,748 | | 359,748 |
| |
|
| Total Short-Term Investments (cost $459,028) | | | | | | 459,028 |
| |
|
| |
| |
| See Combined Notes to Financial Statements | | | | | | |
SCHEDULE OF INVESTMENTS continued
Market Index Value Fund
November 30, 2007 (unaudited)
| Total Investments (cost $695,579,589) 106.9% | | 832,033,622 |
| Other Assets and Liabilities (6.9%) | | (53,794,635) |
| |
|
| Net Assets 100.0% | | $ 778,238,987 |
| |
|
* Non-income producing security
Þ All or a portion of this security is on loan.
° Investment in non-controlled affiliate. The Fund owns shares of Wachovia Corporation with a cost basis of $8,901,711 at November 30, 2007. The Fund earned $266,840 of income from Wachovia Corporation during the six months ended November 30, 2007, which is included in income from affiliates.
§ Rate shown is the 1-day annualized yield at period end.
ß Rate shown represents the yield to maturity at date of purchase.
ƒ All or a portion of this security was pledged to cover initial margin requirements for open futures contracts.
q Rate shown is the 7-day annualized yield at period end.
ø Evergreen Investment Management Company, LLC is the investment advisor to both the Fund and the money market fund.
| The following table shows the percent of total long-term investments by sector as of November 30, 2007: |
| |
| Financials | | 30.1% | |
| Energy | | 15.0% | |
| Industrials | | 10.5% | |
| Consumer Staples | | 8.7% | |
| Consumer Discretionary | | 7.4% | |
| Health Care | | 7.4% | |
| Utilities | | 6.6% | |
| Telecommunication Services | | 6.1% | |
| Materials | | 4.2% | |
| Information Technology | | 3.3% | |
| Other | | 0.7% | |
| |
| |
| | | 100.0% | |
| | |
| |
See Combined Notes to Financial Statements
Market Index Value Fund
STATEMENT OF ASSETS AND LIABILITIES
November 30, 2007 (unaudited)
| Assets | | |
| Investments in securities, at value (cost $686,318,130) including $57,711,613 of securities loaned | | $ 822,416,189 |
| Investments in affiliates, at value (cost $9,261,459) | | 9,617,433 |
|
| Total investments | | 832,033,622 |
| Receivable for securities sold | | 1,332,073 |
| Dividends receivable | | 2,065,041 |
| Receivable for daily variation margin on open futures contracts | | 17,220 |
| Receivable for securities lending income | | 11,726 |
| Receivable from investment advisor | | 7,029 |
|
| Total assets | | 835,466,711 |
|
| Liabilities | | |
| Payable for securities purchased | | 1,650,746 |
| Payable for securities on loan | | 55,495,138 |
| Due to related parties | | 6,321 |
| Accrued expenses and other liabilities | | 75,519 |
|
| Total liabilities | | 57,227,724 |
|
| Net assets | | $ 778,238,987 |
|
| Net assets represented by | | |
| Paid-in capital | | $ 550,297,846 |
| Undistributed net investment income | | 26,375,850 |
| Accumulated net realized gains on investments | | 65,117,927 |
| Net unrealized gains on investments | | 136,447,364 |
|
| Total net assets | | $ 778,238,987 |
|
| Shares outstanding (unlimited number of shares authorized) | | |
| Class I | | 53,586,556 |
|
| Net asset value per share | | |
| Class I | | $ 14.52 |
|
See Combined Notes to Financial Statements
Market Index Value Fund
STATEMENT OF OPERATIONS
Six Months Ended November 30, 2007 (unaudited)
| Investment income | | |
| Dividends (net of foreign withholding taxes of $956) | | $ 9,728,019 |
| Income from affiliates | | 286,380 |
| Securities lending | | 78,181 |
| Interest | | 2,049 |
|
| Total investment income | | 10,094,629 |
|
| Expenses | | |
| Advisory fee | | 1,301,229 |
| Administrative services fee | | 404,020 |
| Transfer agent fees | | 111 |
| Trustees' fees and expenses | | 8,540 |
| Printing and postage expenses | | 6,904 |
| Custodian and accounting fees | | 104,015 |
| Professional fees | | 24,048 |
| Other | | 10,630 |
|
| Total expenses | | 1,859,497 |
| Less: Expense reductions | | (8,160) |
| Fee waivers and expense reimbursements | | (1,751,712) |
|
| Net expenses | | 99,625 |
|
| Net investment income | | 9,995,004 |
|
| Net realized and unrealized gains or losses on investments | | |
| Net realized gains on: | | |
| Securities | | 38,497,232 |
| Futures contracts | | 29,879 |
|
| Net realized gains on investments | | 38,527,111 |
| Net change in unrealized gains or losses on investments | | (109,940,233) |
|
| Net realized and unrealized gains or losses on investments | | (71,413,122) |
|
| Net decrease in net assets resulting from operations | | $ (61,418,118) |
|
See Combined Notes to Financial Statements
Market Index Value Fund
STATEMENTS OF CHANGES IN NET ASSETS
| | | Six Months Ended | | | | |
| | | November 30, 2007 | | Year Ended |
| | | (unaudited) | | May 31, 2007 |
|
| Operations | | | | | | | | |
| Net investment income | | $ 9,995,004 | | $ 16,805,892 |
| Net realized gains on investments | | | | 38,527,111 | | | | 26,175,337 |
| Net change in unrealized gains or | | | | | | | | |
| losses on investments | | | | (109,940,233) | | | | 105,995,232 |
|
| Net increase (decrease) in net assets | | | | | | | | |
| resulting from operations | | | | (61,418,118) | | | | 148,976,461 |
|
| Distributions to shareholders from | | | | | | | | |
| Net investment income | | | | 0 | | | | (20,329,523) |
| Net realized gains | | | | 0 | | | | (143,965,390) |
|
| Total distributions to shareholders | | | | 0 | | | | (164,294,913) |
|
| | | Shares | | | | Shares | | |
| |
| Capital share transactions | | | | | | | | |
| Proceeds from shares sold | | 0 | | 0 | | 10,912,143 | | 195,000,000 |
| Net asset value of shares issued in | | | | | | | | |
| reinvestment of distributions | | 0 | | 0 | | 11,272,416 | | 164,294,913 |
| Payment for shares redeemed | | 0 | | 0 | | (697,837) | | (10,000,000) |
|
| Net increase in net assets resulting | | | | | | | | |
| from capital share transactions | | | | 0 | | | | 349,294,913 |
|
| Total increase (decrease) in net assets | | | | (61,418,118) | | | | 333,976,461 |
| Net assets | | | | | | | | |
| Beginning of period | | | | 839,657,105 | | | | 505,680,644 |
|
| End of period | | $ 778,238,987 | | $ 839,657,105 |
|
| Undistributed net investment income | | $ 26,375,850 | | $ 16,380,846 |
|
See Combined Notes to Financial Statements
COMBINED NOTES TO FINANCIAL STATEMENTS (unaudited)
1. ORGANIZATION
Evergreen Market Index Fund (“Market Index Fund”), Evergreen Market Index Growth Fund (“Market Index Growth Fund”) and Evergreen Market Index Value Fund (“Market Index Value Fund”), (collectively, the “Funds”) are each a diversified series of Evergreen Equity Trust (the “Trust”), a Delaware statutory trust organized on September 18, 1997. The Trust is an open-end management investment company registered under the Investment Company Act of 1940, as amended (the “1940 Act”).
Each Fund offers Class I shares. Class I shares are sold without a front-end sales charge or contingent deferred sales charge.
2. SIGNIFICANT ACCOUNTING POLICIES
The following is a summary of significant accounting policies consistently followed by each Fund in the preparation of its financial statements. The policies are in conformity with generally accepted accounting principles in the United States of America, which require management to make estimates and assumptions that affect amounts reported herein. Actual results could differ from these estimates.
a. Valuation of investments
Listed equity securities are usually valued at the last sales price or official closing price on the national securities exchange where the securities are principally traded.
Portfolio debt securities acquired with more than 60 days to maturity are fair valued using matrix pricing methods determined by an independent pricing service which takes into consideration such factors as similar security prices, yields, maturities, liquidity and ratings. Securities for which valuations are not readily available from an independent pricing service may be valued by brokers which use prices provided by market makers or estimates of market value obtained from yield data relating to investments or securities with similar characteristics.
Short-term securities with remaining maturities of 60 days or less at the time of purchase are valued at amortized cost, which approximates market value.
Investments in open-end mutual funds are valued at net asset value. Securities for which market quotations are not readily available or not reflective of current market value are valued at fair value as determined by the investment advisor in good faith, according to procedures approved by the Board of Trustees.
b. Futures contracts
In order to gain exposure to, or protect against changes in, security values, each Fund may buy and sell futures contracts. The primary risks associated with the use of futures contracts are the imperfect correlation between changes in market values of securities held by each Fund and the prices of futures contracts, and the possibility of an illiquid market.
Futures contracts are valued based upon their quoted daily settlement prices. The aggregate principal amounts of the contracts are not recorded in each Fund’s financial statements. Fluctuations in the value of the contracts are recorded in each Statement of Assets and Liabilities as an asset or liability and in each Statement of Operations as unrealized gains or losses until the contracts are closed, at which point they are recorded as net realized gains or losses on futures contracts.
c. Securities lending
Each Fund may lend its securities to certain qualified brokers in order to earn additional income. The Funds receive compensation in the form of fees or interest earned on the investment of any cash collateral received. The Funds also continue to receive interest and dividends on the securities loaned. The Funds receive collateral in the form of cash or securities with a market value at least equal to the market value of the securities on loan. In the event of default or bankruptcy by the borrower, the Funds could experience delays and costs in recovering the loaned securities or in gaining access to the collateral. Each Fund has the right under the lending agreement to recover the securities from the borrower on demand.
COMBINED NOTES TO FINANCIAL STATEMENTS (unaudited) continued
d. Security transactions and investment income
Security transactions are recorded on trade date. Realized gains and losses are computed using the specific cost of the security sold. Interest income is recorded on the accrual basis and includes accretion of discounts and amortization of premiums. Dividend income is recorded on the ex-dividend date. Foreign income and capital gains realized on some securities may be subject to foreign taxes, which are accrued as applicable.
e. Federal taxes
Each Fund intends to continue to qualify as a regulated investment company and distribute all of its taxable income, including any net capital gains (which have already been offset by available capital loss carryovers). Accordingly, no provision for federal taxes is required.
f. Distributions
Distributions to shareholders from net investment income and net realized gains, if any, are recorded on the ex-dividend date. Such distributions are determined in conformity with income tax regulations, which may differ from generally accepted accounting principles.
3. ADVISORY FEE AND OTHER TRANSACTIONS WITH AFFILIATES
Evergreen Investment Management Company, LLC (“EIMC”), an indirect, wholly-owned subsidiary of Wachovia Corporation (“Wachovia”), is the investment advisor to the Funds and is paid an annual fee starting at 0.32% and declining to 0.25% as the average daily net assets of each Fund increase. For the six months ended November 30, 2007, the advisory fee was equivalent to 0.32% of each Fund’s average daily net assets.
From time to time, EIMC may voluntarily or contractually waive its fee and/or reimburse expenses in order to limit operating expenses. During the six months ended November 30, 2007, EIMC waived its advisory fees and reimbursed other expenses as follows:
| | | | | Other Expenses | | Other Expenses |
| | | Fees Contractually | | Contractually | | Voluntarily |
| | | Waived | | Reimbursed | | Reimbursed |
|
| Market Index Fund | | $887,617 | | $233,697 | | $83,208 |
| Market Index Growth Fund | | 1,527,412 | | 180,729 | | 334,087 |
| Market Index Value Fund | | 1,301,229 | | 165,852 | | 284,631 |
|
Each Fund may invest in Evergreen-managed money market funds, which are also advised by EIMC. Income earned on these investments is included in income from affiliates on each Fund’s Statement of Operations.
Evergreen Investment Services, Inc. (“EIS”), an indirect, wholly-owned subsidiary of Wachovia, is the administrator to the Funds. As administrator, EIS provides the Funds with facilities, equipment and personnel and is paid an annual rate determined by applying percentage rates to the aggregate average daily net assets of the Evergreen funds (excluding money market funds and Evergreen Institutional Enhanced Income Fund), starting at 0.10% and declining to 0.05% as the aggregate average daily net assets of the Evergreen funds (excluding money market funds and Evergreen Institutional Enhanced Income Fund) increase.
Evergreen Service Company, LLC (“ESC”), an indirect, wholly-owned subsidiary of Wachovia, is the transfer and dividend disbursing agent for the Funds. ESC receives account fees that vary based on the type of account held by the shareholders in each Fund.
COMBINED NOTES TO FINANCIAL STATEMENTS (unaudited) continued
4. INVESTMENT TRANSACTIONS
Cost of purchases and proceeds from sales of investment securities (excluding short-term securities) were as follows for the six months ended November 30, 2007:
| | | Cost of Purchases | | Proceeds from Sales |
|
| Market Index Fund | | $13,966,600 | | $9,826,213 |
| Market Index Growth Fund | | 183,924,904 | | 213,993,595 |
| Market Index Value Fund | | 178,058,799 | | 157,311,124 |
|
At November 30, 2007, Market Index Fund had open long futures contracts outstanding as follows:
| | | | | | | | | Initial | | | | |
| | | | | | | | | Contract | | Value at | | |
| Expiration | | | | Contracts | | Amount | | November 30, 2007 | | Unrealized Loss |
|
| December | | 2007 | | 39 | | E-mini S&P 500 Futures | | $2,915,880 | | $2,893,215 | | $22,665 |
|
| December | | 2007 | | 33 | | S&P 500 Futures | | 12,351,007 | | 12,240,525 | | 110,482 |
|
At November 30, 2007, Market Index Growth Fund had open long futures contracts outstanding as follows:
| | | | | | | | | Initial | | | | |
| | | | | | | | | Contract | | Value at | | Unrealized |
| Expiration | | | | Contracts | | Amount | | November 30, 2007 | | Gain (Loss) |
|
| December | | 2007 | | 6 | | E-mini S&P 500 Futures | | $443,404 | | $445,110 | | $1,706 |
|
| December | | 2007 | | 3 | | S&P 500 Futures | | 1,118,046 | | 1,112,775 | | (5,271) |
|
At November 30, 2007, Market Index Value Fund had open long futures contracts outstanding as follows:
| | | | | | | | | Initial | | | | |
| | | | | | | | | Contract | | Value at | | Unrealized |
| Expiration | | | | Contracts | | Amount | | November 30, 2007 | | Gain (Loss) |
|
| December | | 2007 | | 3 | | E-mini S&P 500 Futures | | $221,138 | | $222,555 | | $1,417 |
|
| December | | 2007 | | 5 | | S&P 500 Futures | | 1,862,710 | | 1,854,624 | | (8,086) |
|
During the six months ended November 30, 2007, each Fund loaned securities to certain brokers. At November 30, 2007, the value of securities on loan and the total value of collateral (including the market value of U.S. Treasury obligations and U.S. government agency obligations received as non-cash collateral) were as follows:
| | | Value of | | Value of Cash | | Value of Non-Cash | | Total Value of |
| | | Securities on Loan | | Collateral | | Collateral | | Collateral |
|
| Market Index Fund | | $25,987,396 | | $24,494,657 | | $1,720,685 | | $26,215,342 |
| Market Index Growth Fund | | 70,840,112 | | 62,958,089 | | 9,072,836 | | 72,030,925 |
| Market Index Value Fund | | 57,711,613 | | 55,495,138 | | 2,472,824 | | 57,967,962 |
|
On November 30, 2007, composition of unrealized appreciation and depreciation on securities based on the aggregate cost of securities for federal income tax purposes was as follows:
| | | | | Gross Unrealized | | Gross Unrealized | | Net Unrealized |
| | | Tax Cost | | Appreciation | | Depreciation | | Appreciation |
|
| Market Index Fund | | $390,230,477 | | $194,686,756 | | $16,515,477 | | $178,171,279 |
| Market Index Growth Fund | | 708,267,106 | | 286,274,190 | | 18,309,389 | | 267,964,801 |
| Market Index Value Fund | | 696,027,942 | | 171,898,269 | | 35,892,589 | | 136,005,680 |
|
COMBINED NOTES TO FINANCIAL STATEMENTS (unaudited) continued
5. INTERFUND LENDING
Pursuant to an Exemptive Order issued by the SEC, the Funds may participate in an interfund lending program with certain funds in the Evergreen fund family. This program allows the Funds to borrow from, or lend money to, other participating funds. During the six months ended November 30, 2007, the Funds did not participate in the interfund lending program.
6. EXPENSE REDUCTIONS
Through expense offset arrangements with ESC and the Funds’ custodian, a portion of fund expenses for each Fund has been reduced.
7. DEFERRED TRUSTEES’ FEES
Each Trustee of the Funds may defer any or all compensation related to performance of his or her duties as a Trustee. The Trustees’ deferred balances are allocated to deferral accounts, which are included in the accrued expenses for each Fund. The investment performance of the deferral accounts is based on the investment performance of certain Evergreen funds. Any gains earned or losses incurred in the deferral accounts are reported in each Fund’s Trustees’ fees and expenses. At the election of the Trustees, the deferral account will be paid either in one lump sum or in quarterly installments for up to ten years.
8. FINANCING AGREEMENT
The Funds and certain other Evergreen funds share in an unsecured revolving credit commitment for temporary and emergency purposes, including the funding of redemptions, as permitted by each participating fund's borrowing restrictions. Borrowings under this facility bear interest at 0.50% per annum above the Federal Funds rate. All of the participating funds are charged an annual commitment fee on the unused balance, which is allocated pro rata. The credit facility is for $100 million with an annual commitment fee of 0.08% . During the six months ended November 30, 2007, the Funds had no borrowings.
9. REGULATORY MATTERS AND LEGAL PROCEEDINGS
Pursuant to an administrative order issued by the SEC on September 19, 2007, EIMC, EIS, ESC (collectively, the “Evergreen Entities”), Wachovia Securities, LLC and the SEC have entered into an agreement settling allegations of (i) improper short-term trading arrangements in effect prior to May 2003 involving former officers and employees of EIMC and certain broker-dealers, (ii) insufficient systems for monitoring exchanges and enforcing exchange limitations as stated in certain funds' prospectuses, and (iii) inadequate e-mail retention practices. Under the settlement, the Evergreen Entities were censured and will pay approximately $32 million in disgorgement and penalties. This amount, along with a fine assessed by the SEC against Wachovia Securities, LLC will be distributed pursuant to a plan to be developed by an independent distribution consultant and approved by the SEC. The Evergreen Entities neither admitted nor denied the allegations and findings set forth in its settlement with the SEC.
EIS has entered into an agreement with the NASD (now known as the Financial Industry Regulatory Authority (“FINRA”)) settling allegations that EIS (i) arranged for Evergreen fund portfolio trades to be directed to Wachovia Securities, LLC, an affiliate of EIS that sold Evergreen fund shares, during the period of January 2001 to December 2003 and (ii) provided non-cash compensation by sponsoring offsite meetings attended by Wachovia Securities, LLC brokers during that period, where the eligibility of a broker to attend the meetings depended upon the broker meeting certain sales targets of Evergreen fund shares. Pursuant to the settlement agreement, EIS has agreed to a censure and a fine of $4,200,000. EIS neither admitted nor denied the allegations and findings set forth in its agreement with the NASD.
In addition, the Evergreen funds and EIMC and certain of its affiliates are involved in various legal actions, including private litigation and class action lawsuits. EIMC does not expect that any of such legal actions currently pending or threatened will have a material adverse impact on the financial position or operations of any of the Evergreen funds or on EIMC’s ability to provide services to the Evergreen funds.
Although EIMC believes that none of the matters discussed above will have a material adverse impact on the Evergreen funds, there can be no assurance that these matters and any publicity surrounding or resulting from them will not result in reduced sales or increased redemptions of Evergreen fund shares, which could
COMBINED NOTES TO FINANCIAL STATEMENTS (unaudited) continued
increase Evergreen fund transaction costs or operating expenses, or that they will not have other adverse consequences on the Evergreen funds.
10. NEW ACCOUNTING PRONOUNCEMENTS
In June 2006, the Financial Accounting Standards Board ("FASB") issued FASB Interpretation No. 48, Accounting for Uncertainty in Income Taxes – an interpretation of FASB statement 109 ("FIN 48"). FIN 48 supplements FASB 109 by prescribing a recognition threshold and measurement attribute for the financial statement recognition and measurement of a tax position taken or expected to be taken in a tax return. Each Fund's financial statements have not been impacted by the adoption of FIN 48. However, the conclusions regarding FIN 48 may be subject to review and adjustment at a later date based on factors including, but not limited to, further implementation guidance expected from FASB, and on-going analysis of tax laws, regulations, and interpretations thereof.
In September 2006, FASB issued Statement of Financial Accounting Standards No. 157, Fair Value Measurements (“FAS 157”). FAS 157 establishes a single authoritative definition of fair value, establishes a framework for measuring fair value and expands disclosures about fair value measurements. FAS 157 applies to fair value measurements already required or permitted by existing standards. The change to current generally accepted accounting principles from the application of FAS 157 relates to the definition of fair value, the methods used to measure fair value, and the expanded disclosures about fair value measurements. Management of the Funds does not believe the adoption of FAS 157 will materially impact the financial statement amounts, however, additional disclosures may be required about the inputs used to develop the measurements and the effect of certain of the measurements on changes in net assets for the period. FAS 157 is effective for financial statements issued for fiscal years beginning after November 15, 2007 and interim periods within those fiscal years.
Market Index Fund
ADDITIONAL INFORMATION (unaudited)
INFORMATION ABOUT THE REVIEW AND APPROVAL OF THE FUND’S INVESTMENT ADVISORY AGREEMENT
Each year, the Fund’s Board of Trustees is required to consider whether to continue in place the Fund’s investment advisory agreement. In September 2007, the Trustees, including a majority of the Trustees who are not interested persons (as that term is defined in the 1940 Act) of the Fund or of EIMC, approved the continuation of the Fund’s investment advisory agreement. (References below to the “Fund” are to Evergreen Market Index Fund; references to the “funds” are to the Evergreen funds generally.)
At the same time, the Trustees considered the continuation of the investment advisory agreements for all of the funds, and the description below refers in many cases to the Trustees’ process and conclusions in connection with their consideration of this matter for all of the funds. (See “Certain Fund-Specific Considerations” below for a discussion regarding certain factors considered by the Trustees relating specifically to the Fund.) In all of its deliberations, the Board of Trustees and the disinterested Trustees were advised by independent counsel to the disinterested Trustees and counsel to the funds.
The review process. The 1940 Act requires that the Board of Trustees request and evaluate, and that EIMC and any sub-advisors furnish, such information as may reasonably be necessary to evaluate the terms of a fund’s advisory agreement. The review process began at the time of the last advisory contract-renewal process in September 2006. In the course of that process, the Trustees identified a number of funds that had experienced either short-term or longer-term performance issues. During the following months, the Trustees reviewed information relating to any changes in the performance of those funds and/or any changes in the investment process or the investment teams responsible for the management of the funds. In addition, during the course of the year, the Trustees reviewed information regarding the investment performance of all of the funds and identified additional funds that they believed warranted further attention based on performance since September 2006.
In spring 2007, a committee of the Board of Trustees (the “Committee”), working with EIMC management, determined generally the types of information the Board would review and set a timeline detailing the information required and the dates for its delivery to the Trustees. The independent data provider Keil Fiduciary Strategies LLC (“Keil”) was engaged to provide fund-specific and industry-wide data to the Board containing information of a nature and in a format generally prescribed by the Committee, and the Committee worked with Keil and EIMC to develop appropriate groups of peer funds for each fund. The Committee also identified a number of expense, performance, and other issues and requested specific information as to those issues.
The Trustees reviewed, with the assistance of an independent industry consultant retained by the disinterested Trustees, the information provided by EIMC in response to the Committee's requests and the information provided by Keil. The Trustees formed small committees to review individual funds in greater detail. In addition, the Trustees requested information regarding, among other things, brokerage practices of the funds, the use of derivatives by the funds, strategic planning for the funds, analyst and research support available to the portfolio management teams, and information regarding the various fall-out benefits received directly and indirectly by EIMC and its affiliates from the funds. The Trustees requested and received additional information following that review.
The Committee met several times by telephone to consider the information provided by EIMC. The Committee met with representatives of EIMC in early September. At a meeting of the full Board of Trustees later in September, the Committee reported the results of its discussions with EIMC, and the full Board met with representatives of EIMC, engaged in further review of the materials provided to them, and approved the continuation of each of the advisory and sub-advisory agreements.
The disinterested Trustees discussed the continuation of the funds' advisory agreements with representatives of EIMC and in multiple private sessions with legal counsel at which no personnel of EIMC were present. In considering the continuation of the agreement, the Trustees did not identify any particular information or consideration that was all-important or controlling, and each Trustee attributed different weights to various factors.
Market Index Fund
ADDITIONAL INFORMATION (unaudited) continued
The Trustees evaluated information provided to them both in terms of the Evergreen mutual funds generally and with respect to each fund, including the Fund, specifically as they considered appropriate; although the Trustees considered the continuation of the agreement as part of the larger process of considering the continuation of the advisory contracts for all of the funds, their determination to continue the advisory agreement for each of the funds was ultimately made on a fund-by-fund basis.
This summary describes a number of the most important, but not necessarily all, of the factors considered by the Board and the disinterested Trustees.
Information reviewed. The Board of Trustees and committees of the Board of Trustees meet periodically during the course of the year. At those meetings, the Board receives a wide variety of information regarding the services performed by EIMC, the investment performance of the funds, and other aspects of the business and operations of the funds. At those meetings, and in the process of considering the continuation of the agreements, the Trustees considered information regarding, for example, the funds’ investment results; the portfolio management teams for the funds and the experience of the members of those teams, and any recent changes in the membership of the teams; portfolio trading practices; compliance by the funds and EIMC with applicable laws and regulations and with the funds’ and EIMC’s compliance policies and procedures; risk evaluation and oversight procedures at EIMC; services provided by affiliates of EIMC to the funds and shareholders of the funds; and other information relating to the nature, extent, and quality of services provided by EIMC. The Trustees considered a number of changes in portfolio management personnel at EIMC and its advisory affiliates in the year since September 2006, and recent changes in compliance personnel at EIMC, including the appointment of a new Chief Compliance Officer for the funds.
The Trustees considered the rates at which the funds pay investment advisory fees, and the efforts generally by EIMC and its affiliates as sponsors of the funds. The data provided by Keil showed the management fees paid by each fund in comparison to the management fees of other peer mutual funds, in addition to data regarding the investment performance of the funds in comparison to other peer mutual funds. The Trustees were assisted by the independent industry consultant in reviewing the information presented to them.
The Trustees considered the transfer agency fees paid by the funds to an affiliate of EIMC. They reviewed information presented to them showing that the transfer agency fees charged to the funds were generally consistent with industry norms.
The Trustees also considered that EIS, an affiliate of EIMC, serves as administrator to the funds and receives a fee for its services as administrator. In their comparison of the advisory fee paid by the funds with those paid by other mutual funds, the Trustees took into account administrative fees paid by the funds and those other mutual funds. The Board considered that EIS serves as distributor to the funds generally and receives fees from the funds for those services. They considered other so-called “fall-out” benefits to EIMC and its affiliates due to their other relationships with the funds, including, for example, soft-dollar services received by EIMC attributable to transactions entered into by EIMC for the benefit of the funds and brokerage commissions received by Wachovia Securities, LLC, an affiliate of EIMC, from transactions effected by it for the funds. The Trustees also noted that the funds pay sub-transfer agency fees to various financial institutions who hold fund shares in omnibus accounts, and that Wachovia Securities, LLC and its affiliates receive such payments from the funds in respect of client accounts they hold in omnibus arrangements, and that an affiliate of EIMC receives fees for administering the sub-transfer agency payment program. They also considered that Wachovia Securities, LLC and its affiliates receive distribution-related fees and shareholder servicing payments (including amounts derived from payments under the funds’ Rule 12b-1 plans) in respect of shares sold or held through it. The Trustees also noted that an affiliate of EIMC receives compensation for serving as a securities lending agent for the funds.
Nature and quality of the services provided. The Trustees considered that EIMC and its affiliates generally provide a comprehensive investment management service to the funds. They noted that EIMC makes its personnel available to serve as officers of the funds, and concluded that the reporting and management functions provided by EIMC with respect to the funds were generally satisfactory. The Trustees considered the investment philosophy of the
Market Index Fund
ADDITIONAL INFORMATION (unaudited) continued
Fund’s portfolio management team, and considered the in-house research capabilities of EIMC and its affiliates, as well as other resources available to EIMC, including research services available to it from third parties. The Board considered the managerial and financial resources available to EIMC and its affiliates, and the commitment that the Wachovia organization has made to the funds generally. On the basis of these factors, they determined that the nature and scope of the services provided by EIMC were consistent with its duties under the investment advisory agreements and appropriate and consistent with the investment programs and best interests of the funds.
The Trustees noted the resources EIMC and its affiliates have committed to the regulatory, compliance, accounting, tax and oversight of tax reporting, and shareholder servicing functions, and the number and quality of staff committed to those functions, which they concluded were appropriate and generally in line with EIMC’s responsibilities to the Fund and to the funds generally. The Board and the disinterested Trustees concluded, within the context of their overall conclusions regarding the funds’ advisory agreements, that they were generally satisfied with the nature, extent, and quality of the services provided by EIMC, including services provided by EIS under its administrative services agreements with the funds.
Investment performance. The Trustees considered the investment performance of each fund, both by comparison to other comparable mutual funds and to broad market indices. The Trustees emphasized that the continuation of the investment advisory agreement for a fund should not be taken as any indication that the Trustees did not believe investment performance for any specific fund might not be improved, and they noted that they would continue to monitor closely the investment performance of the funds going forward.
Advisory and administrative fees. The Trustees recognized that EIMC does not seek to provide the lowest cost investment advisory service, but to provide a high quality, full-service investment management product at a reasonable price. They also noted that EIMC has in many cases sought to set its investment advisory fees at levels consistent with industry norms. The Trustees noted that, in certain cases, a fund’s management fees were higher than many or most other mutual funds in the same Keil peer group. However, in each case, the Trustees determined on the basis of the information presented that the level of management fees was not excessive.
Certain Fund-specific considerations. The Trustees noted that, for the one- and three-year periods ended December 31, 2006, the Fund’s Class I shares had underperformed the Fund’s benchmark index, the S&P 500 Index, but outperformed a majority of the funds against which the Trustees compared the Fund’s performance.
The Trustees noted that the management fee paid by the Fund was lower than the management fees paid by all of the other funds against which the Trustees compared the Fund’s management fee, and that the level of profitability realized by EIMC in respect of the fee did not appear excessive.
Economies of scale. The Trustees noted that economies of scale would likely be achieved by EIMC in managing the funds as the funds grow. The Trustees noted that the Fund had implemented breakpoints in its advisory fee structure. The Trustees noted that they would continue to review the appropriate levels of breakpoints in the future, but concluded that the breakpoints as implemented appeared to be a reasonable step toward the realization of economies of scale by the Fund.
Profitability. The Trustees considered information provided to them regarding the profitability to the EIMC organization of the investment advisory, administration, and transfer agency (with respect to the open-end funds only) fees paid to EIMC and its affiliates by each of the funds. They considered that the information provided to them was necessarily estimated, and that the profitability information provided to them, especially on a fund-by-fund basis, did not necessarily provide a definitive tool for evaluating the appropriateness of each fund's advisory fee. They noted that the levels of profitability of the funds to EIMC varied widely, depending on among other things the size and type of fund. They considered the profitability of the funds in light of such factors as, for example, the information they had received regarding the relation of the fees paid by the funds to those paid by other mutual funds, the investment performance of the funds, and the amount of revenues involved. In light of these factors, the Trustees concluded that the profitability of any of the funds, individually or in the aggregate, should not prevent the Trustees from approving the continuation of the agreements.
Market Index Growth Fund
ADDITIONAL INFORMATION (unaudited)
INFORMATION ABOUT THE REVIEW AND APPROVAL OF THE FUND’S INVESTMENT ADVISORY AGREEMENT
Each year, the Fund’s Board of Trustees is required to consider whether to continue in place the Fund’s investment advisory agreement. In September 2007, the Trustees, including a majority of the Trustees who are not interested persons (as that term is defined in the 1940 Act) of the Fund or of EIMC, approved the continuation of the Fund’s investment advisory agreement. (References below to the “Fund” are to Evergreen Market Index Growth Fund; references to the “funds” are to the Evergreen funds generally.)
At the same time, the Trustees considered the continuation of the investment advisory agreements for all of the funds, and the description below refers in many cases to the Trustees’ process and conclusions in connection with their consideration of this matter for all of the funds. (See “Certain Fund-Specific Considerations” below for a discussion regarding certain factors considered by the Trustees relating specifically to the Fund.) In all of its deliberations, the Board of Trustees and the disinterested Trustees were advised by independent counsel to the disinterested Trustees and counsel to the funds.
The review process. The 1940 Act requires that the Board of Trustees request and evaluate, and that EIMC and any sub-advisors furnish, such information as may reasonably be necessary to evaluate the terms of a fund’s advisory agreement. The review process began at the time of the last advisory contract-renewal process in September 2006. In the course of that process, the Trustees identified a number of funds that had experienced either short-term or longer-term performance issues. During the following months, the Trustees reviewed information relating to any changes in the performance of those funds and/or any changes in the investment process or the investment teams responsible for the management of the funds. In addition, during the course of the year, the Trustees reviewed information regarding the investment performance of all of the funds and identified additional funds that they believed warranted further attention based on performance since September 2006.
In spring 2007, a committee of the Board of Trustees (the “Committee”), working with EIMC management, determined generally the types of information the Board would review and set a timeline detailing the information required and the dates for its delivery to the Trustees. The independent data provider Keil Fiduciary Strategies LLC (“Keil”) was engaged to provide fund-specific and industry-wide data to the Board containing information of a nature and in a format generally prescribed by the Committee, and the Committee worked with Keil and EIMC to develop appropriate groups of peer funds for each fund. The Committee also identified a number of expense, performance, and other issues and requested specific information as to those issues.
The Trustees reviewed, with the assistance of an independent industry consultant retained by the disinterested Trustees, the information provided by EIMC in response to the Committee's requests and the information provided by Keil. The Trustees formed small committees to review individual funds in greater detail. In addition, the Trustees requested information regarding, among other things, brokerage practices of the funds, the use of derivatives by the funds, strategic planning for the funds, analyst and research support available to the portfolio management teams, and information regarding the various fall-out benefits received directly and indirectly by EIMC and its affiliates from the funds. The Trustees requested and received additional information following that review.
The Committee met several times by telephone to consider the information provided by EIMC. The Committee met with representatives of EIMC in early September. At a meeting of the full Board of Trustees later in September, the Committee reported the results of its discussions with EIMC, and the full Board met with representatives of EIMC, engaged in further review of the materials provided to them, and approved the continuation of each of the advisory and sub-advisory agreements.
The disinterested Trustees discussed the continuation of the funds' advisory agreements with representatives of EIMC and in multiple private sessions with legal counsel at which no personnel of EIMC were present. In considering the continuation of the agreement, the Trustees did not identify any particular information or consideration that was all-important or controlling, and each Trustee attributed different weights to various factors. The Trustees evaluated information provided to them both in terms of the Evergreen mutual funds generally and
Market Index Growth Fund
ADDITIONAL INFORMATION (unaudited) continued
with respect to each fund, including the Fund, specifically as they considered appropriate; although the Trustees considered the continuation of the agreement as part of the larger process of considering the continuation of the advisory contracts for all of the funds, their determination to continue the advisory agreement for each of the funds was ultimately made on a fund-by-fund basis.
This summary describes a number of the most important, but not necessarily all, of the factors considered by the Board and the disinterested Trustees.
Information reviewed. The Board of Trustees and committees of the Board of Trustees meet periodically during the course of the year. At those meetings, the Board receives a wide variety of information regarding the services performed by EIMC, the investment performance of the funds, and other aspects of the business and operations of the funds. At those meetings, and in the process of considering the continuation of the agreements, the Trustees considered information regarding, for example, the funds’ investment results; the portfolio management teams for the funds and the experience of the members of those teams, and any recent changes in the membership of the teams; portfolio trading practices; compliance by the funds and EIMC with applicable laws and regulations and with the funds’ and EIMC’s compliance policies and procedures; risk evaluation and oversight procedures at EIMC; services provided by affiliates of EIMC to the funds and shareholders of the funds; and other information relating to the nature, extent, and quality of services provided by EIMC. The Trustees considered a number of changes in portfolio management personnel at EIMC and its advisory affiliates in the year since September 2006, and recent changes in compliance personnel at EIMC, including the appointment of a new Chief Compliance Officer for the funds.
The Trustees considered the rates at which the funds pay investment advisory fees, and the efforts generally by EIMC and its affiliates as sponsors of the funds. The data provided by Keil showed the management fees paid by each fund in comparison to the management fees of other peer mutual funds, in addition to data regarding the investment performance of the funds in comparison to other peer mutual funds. The Trustees were assisted by the independent industry consultant in reviewing the information presented to them.
The Trustees considered the transfer agency fees paid by the funds to an affiliate of EIMC. They reviewed information presented to them showing that the transfer agency fees charged to the funds were generally consistent with industry norms.
The Trustees also considered that EIS, an affiliate of EIMC, serves as administrator to the funds and receives a fee for its services as administrator. In their comparison of the advisory fee paid by the funds with those paid by other mutual funds, the Trustees took into account administrative fees paid by the funds and those other mutual funds. The Board considered that EIS serves as distributor to the funds generally and receives fees from the funds for those services. They considered other so-called “fall-out” benefits to EIMC and its affiliates due to their other relationships with the funds, including, for example, soft-dollar services received by EIMC attributable to transactions entered into by EIMC for the benefit of the funds and brokerage commissions received by Wachovia Securities, LLC, an affiliate of EIMC, from transactions effected by it for the funds. The Trustees also noted that the funds pay sub-transfer agency fees to various financial institutions who hold fund shares in omnibus accounts, and that Wachovia Securities, LLC and its affiliates receive such payments from the funds in respect of client accounts they hold in omnibus arrangements, and that an affiliate of EIMC receives fees for administering the sub-transfer agency payment program. They also considered that Wachovia Securities, LLC and its affiliates receive distribution-related fees and shareholder servicing payments (including amounts derived from payments under the funds’ Rule 12b-1 plans) in respect of shares sold or held through it. The Trustees also noted that an affiliate of EIMC receives compensation for serving as a securities lending agent for the funds.
Nature and quality of the services provided. The Trustees considered that EIMC and its affiliates generally provide a comprehensive investment management service to the funds. They noted that EIMC makes its personnel available to serve as officers of the funds, and concluded that the reporting and management functions provided by EIMC with respect to the funds were generally satisfactory. The Trustees considered the investment philosophy of the Fund’s portfolio management team, and considered the in-house research capabilities of EIMC and its affiliates, as
Market Index Growth Fund
ADDITIONAL INFORMATION (unaudited) continued
well as other resources available to EIMC, including research services available to it from third parties. The Board considered the managerial and financial resources available to EIMC and its affiliates, and the commitment that the Wachovia organization has made to the funds generally. On the basis of these factors, they determined that the nature and scope of the services provided by EIMC were consistent with its duties under the investment advisory agreements and appropriate and consistent with the investment programs and best interests of the funds.
The Trustees noted the resources EIMC and its affiliates have committed to the regulatory, compliance, accounting, tax and oversight of tax reporting, and shareholder servicing functions, and the number and quality of staff committed to those functions, which they concluded were appropriate and generally in line with EIMC’s responsibilities to the Fund and to the funds generally. The Board and the disinterested Trustees concluded, within the context of their overall conclusions regarding the funds’ advisory agreements, that they were generally satisfied with the nature, extent, and quality of the services provided by EIMC, including services provided by EIS under its administrative services agreements with the funds.
Investment performance. The Trustees considered the investment performance of each fund, both by comparison to other comparable mutual funds and to broad market indices. The Trustees emphasized that the continuation of the investment advisory agreement for a fund should not be taken as any indication that the Trustees did not believe investment performance for any specific fund might not be improved, and they noted that they would continue to monitor closely the investment performance of the funds going forward.
Advisory and administrative fees. The Trustees recognized that EIMC does not seek to provide the lowest cost investment advisory service, but to provide a high quality, full-service investment management product at a reasonable price. They also noted that EIMC has in many cases sought to set its investment advisory fees at levels consistent with industry norms. The Trustees noted that, in certain cases, a fund’s management fees were higher than many or most other mutual funds in the same Keil peer group. However, in each case, the Trustees determined on the basis of the information presented that the level of management fees was not excessive.
Certain Fund-specific considerations. The Trustees noted that, for the one-year period ended December 31, 2006, the Fund’s Class I shares had outperformed the Fund’s benchmark index, the Russell 1000 Growth Index, and a majority of the funds against which the Trustees compared the Fund’s performance. The Trustees also noted that, for the three-year period ended December 31, 2006, the Fund’s Class I shares had performed near but below the Fund’s benchmark index, and that the Fund’s Class I shares performance was in the third quintile of funds against which the Trustees compared the Fund’s performance for the same period.
The Trustees noted that the Fund’s management fee was lower than the management fees paid by the other funds against which the Trustees compared the Fund’s management fee, and that the level of profitability realized by EIMC in respect of the fee did not appear excessive.
Economies of scale. The Trustees noted that economies of scale would likely be achieved by EIMC in managing the funds as the funds grow. The Trustees noted that the Fund had implemented breakpoints in its advisory fee structure. The Trustees noted that they would continue to review the appropriate levels of breakpoints in the future, but concluded that the breakpoints as implemented appeared to be a reasonable step toward the realization of economies of scale by the Fund.
Profitability. The Trustees considered information provided to them regarding the profitability to the EIMC organization of the investment advisory, administration, and transfer agency (with respect to the open-end funds only) fees paid to EIMC and its affiliates by each of the funds. They considered that the information provided to them was necessarily estimated, and that the profitability information provided to them, especially on a fund-by-fund basis, did not necessarily provide a definitive tool for evaluating the appropriateness of each fund's advisory fee. They noted that the levels of profitability of the funds to EIMC varied widely, depending on among other things the size and type of fund. They considered the profitability of the funds in light of such factors as, for example, the information they had received regarding the relation of the fees paid by the funds to those paid by other mutual funds, the investment performance of the funds, and the amount of revenues involved. In light of these
Market Index Growth Fund
ADDITIONAL INFORMATION (unaudited) continued
factors, the Trustees concluded that the profitability of any of the funds, individually or in the aggregate, should not prevent the Trustees from approving the continuation of the agreements.
Market Index Value Fund
ADDITIONAL INFORMATION (unaudited)
INFORMATION ABOUT THE REVIEW AND APPROVAL OF THE FUND’S INVESTMENT ADVISORY AGREEMENT
Each year, the Fund’s Board of Trustees is required to consider whether to continue in place the Fund’s investment advisory agreement. In September 2007, the Trustees, including a majority of the Trustees who are not interested persons (as that term is defined in the 1940 Act) of the Fund or of EIMC, approved the continuation of the Fund’s investment advisory agreement. (References below to the “Fund” are to Evergreen Market Index Value Fund; references to the “funds” are to the Evergreen funds generally.)
At the same time, the Trustees considered the continuation of the investment advisory agreements for all of the funds, and the description below refers in many cases to the Trustees’ process and conclusions in connection with their consideration of this matter for all of the funds. (See “Certain Fund-Specific Considerations” below for a discussion regarding certain factors considered by the Trustees relating specifically to the Fund.) In all of its deliberations, the Board of Trustees and the disinterested Trustees were advised by independent counsel to the disinterested Trustees and counsel to the funds.
The review process. The 1940 Act requires that the Board of Trustees request and evaluate, and that EIMC and any sub-advisors furnish, such information as may reasonably be necessary to evaluate the terms of a fund’s advisory agreement. The review process began at the time of the last advisory contract-renewal process in September 2006. In the course of that process, the Trustees identified a number of funds that had experienced either short-term or longer-term performance issues. During the following months, the Trustees reviewed information relating to any changes in the performance of those funds and/or any changes in the investment process or the investment teams responsible for the management of the funds. In addition, during the course of the year, the Trustees reviewed information regarding the investment performance of all of the funds and identified additional funds that they believed warranted further attention based on performance since September 2006.
In spring 2007, a committee of the Board of Trustees (the “Committee”), working with EIMC management, determined generally the types of information the Board would review and set a timeline detailing the information required and the dates for its delivery to the Trustees. The independent data provider Keil Fiduciary Strategies LLC (“Keil”) was engaged to provide fund-specific and industry-wide data to the Board containing information of a nature and in a format generally prescribed by the Committee, and the Committee worked with Keil and EIMC to develop appropriate groups of peer funds for each fund. The Committee also identified a number of expense, performance, and other issues and requested specific information as to those issues.
The Trustees reviewed, with the assistance of an independent industry consultant retained by the disinterested Trustees, the information provided by EIMC in response to the Committee's requests and the information provided by Keil. The Trustees formed small committees to review individual funds in greater detail. In addition, the Trustees requested information regarding, among other things, brokerage practices of the funds, the use of derivatives by the funds, strategic planning for the funds, analyst and research support available to the portfolio management teams, and information regarding the various fall-out benefits received directly and indirectly by EIMC and its affiliates from the funds. The Trustees requested and received additional information following that review.
The Committee met several times by telephone to consider the information provided by EIMC. The Committee met with representatives of EIMC in early September. At a meeting of the full Board of Trustees later in September, the Committee reported the results of its discussions with EIMC, and the full Board met with representatives of EIMC, engaged in further review of the materials provided to them, and approved the continuation of each of the advisory and sub-advisory agreements.
The disinterested Trustees discussed the continuation of the funds' advisory agreements with representatives of EIMC and in multiple private sessions with legal counsel at which no personnel of EIMC were present. In considering the continuation of the agreement, the Trustees did not identify any particular information or consideration that was all-important or controlling, and each Trustee attributed different weights to various factors. The Trustees evaluated information provided to them both in terms of the Evergreen mutual funds generally and
Market Index Value Fund
ADDITIONAL INFORMATION (unaudited) continued
with respect to each fund, including the Fund, specifically as they considered appropriate; although the Trustees considered the continuation of the agreement as part of the larger process of considering the continuation of the advisory contracts for all of the funds, their determination to continue the advisory agreement for each of the funds was ultimately made on a fund-by-fund basis.
This summary describes a number of the most important, but not necessarily all, of the factors considered by the Board and the disinterested Trustees.
Information reviewed. The Board of Trustees and committees of the Board of Trustees meet periodically during the course of the year. At those meetings, the Board receives a wide variety of information regarding the services performed by EIMC, the investment performance of the funds, and other aspects of the business and operations of the funds. At those meetings, and in the process of considering the continuation of the agreements, the Trustees considered information regarding, for example, the funds’ investment results; the portfolio management teams for the funds and the experience of the members of those teams, and any recent changes in the membership of the teams; portfolio trading practices; compliance by the funds and EIMC with applicable laws and regulations and with the funds’ and EIMC’s compliance policies and procedures; risk evaluation and oversight procedures at EIMC; services provided by affiliates of EIMC to the funds and shareholders of the funds; and other information relating to the nature, extent, and quality of services provided by EIMC. The Trustees considered a number of changes in portfolio management personnel at EIMC and its advisory affiliates in the year since September 2006, and recent changes in compliance personnel at EIMC, including the appointment of a new Chief Compliance Officer for the funds.
The Trustees considered the rates at which the funds pay investment advisory fees, and the efforts generally by EIMC and its affiliates as sponsors of the funds. The data provided by Keil showed the management fees paid by each fund in comparison to the management fees of other peer mutual funds, in addition to data regarding the investment performance of the funds in comparison to other peer mutual funds. The Trustees were assisted by the independent industry consultant in reviewing the information presented to them.
The Trustees considered the transfer agency fees paid by the funds to an affiliate of EIMC. They reviewed information presented to them showing that the transfer agency fees charged to the funds were generally consistent with industry norms.
The Trustees also considered that EIS, an affiliate of EIMC, serves as administrator to the funds and receives a fee for its services as administrator. In their comparison of the advisory fee paid by the funds with those paid by other mutual funds, the Trustees took into account administrative fees paid by the funds and those other mutual funds. The Board considered that EIS serves as distributor to the funds generally and receives fees from the funds for those services. They considered other so-called “fall-out” benefits to EIMC and its affiliates due to their other relationships with the funds, including, for example, soft-dollar services received by EIMC attributable to transactions entered into by EIMC for the benefit of the funds and brokerage commissions received by Wachovia Securities, LLC, an affiliate of EIMC, from transactions effected by it for the funds. The Trustees also noted that the funds pay sub-transfer agency fees to various financial institutions who hold fund shares in omnibus accounts, and that Wachovia Securities, LLC and its affiliates receive such payments from the funds in respect of client accounts they hold in omnibus arrangements, and that an affiliate of EIMC receives fees for administering the sub-transfer agency payment program. They also considered that Wachovia Securities, LLC and its affiliates receive distribution-related fees and shareholder servicing payments (including amounts derived from payments under the funds’ Rule 12b-1 plans) in respect of shares sold or held through it. The Trustees also noted that an affiliate of EIMC receives compensation for serving as a securities lending agent for the funds.
Nature and quality of the services provided. The Trustees considered that EIMC and its affiliates generally provide a comprehensive investment management service to the funds. They noted that EIMC makes its personnel available to serve as officers of the funds, and concluded that the reporting and management functions provided by EIMC with respect to the funds were generally satisfactory. The Trustees considered the investment philosophy of the Fund’s portfolio management team, and considered the in-house research capabilities of EIMC and its affiliates, as
Market Index Value Fund
ADDITIONAL INFORMATION (unaudited) continued
well as other resources available to EIMC, including research services available to it from third parties. The Board considered the managerial and financial resources available to EIMC and its affiliates, and the commitment that the Wachovia organization has made to the funds generally. On the basis of these factors, they determined that the nature and scope of the services provided by EIMC were consistent with its duties under the investment advisory agreements and appropriate and consistent with the investment programs and best interests of the funds.
The Trustees noted the resources EIMC and its affiliates have committed to the regulatory, compliance, accounting, tax and oversight of tax reporting, and shareholder servicing functions, and the number and quality of staff committed to those functions, which they concluded were appropriate and generally in line with EIMC’s responsibilities to the Fund and to the funds generally. The Board and the disinterested Trustees concluded, within the context of their overall conclusions regarding the funds’ advisory agreements, that they were generally satisfied with the nature, extent, and quality of the services provided by EIMC, including services provided by EIS under its administrative services agreements with the funds.
Investment performance. The Trustees considered the investment performance of each fund, both by comparison to other comparable mutual funds and to broad market indices. The Trustees emphasized that the continuation of the investment advisory agreement for a fund should not be taken as any indication that the Trustees did not believe investment performance for any specific fund might not be improved, and they noted that they would continue to monitor closely the investment performance of the funds going forward.
Advisory and administrative fees. The Trustees recognized that EIMC does not seek to provide the lowest cost investment advisory service, but to provide a high quality, full-service investment management product at a reasonable price. They also noted that EIMC has in many cases sought to set its investment advisory fees at levels consistent with industry norms. The Trustees noted that, in certain cases, a fund’s management fees were higher than many or most other mutual funds in the same Keil peer group. However, in each case, the Trustees determined on the basis of the information presented that the level of management fees was not excessive.
Certain Fund-specific considerations. The Trustees noted that, for the one- and three-year periods ended December 31, 2006, the Fund’s Class I shares had performance similar to the Fund’s benchmark index, the Russell 1000 Value Index, but that the Fund's Class I shares had outperformed a majority of the funds against which the Trustees compared the Fund’s performance. The Trustees noted that the Fund’s management fee was lower than the management fees paid by the other funds against which the Trustees compared the Fund’s management fee and that the level of profitability realized by EIMC in respect of the fee did not appear excessive.
Economies of scale. The Trustees noted that economies of scale would likely be achieved by EIMC in managing the funds as the funds grow. The Trustees noted that the Fund had implemented breakpoints in its advisory fee structure. The Trustees noted that they would continue to review the appropriate levels of breakpoints in the future, but concluded that the breakpoints as implemented appeared to be a reasonable step toward the realization of economies of scale by the Fund.
Profitability. The Trustees considered information provided to them regarding the profitability to the EIMC organization of the investment advisory, administration, and transfer agency (with respect to the open-end funds only) fees paid to EIMC and its affiliates by each of the funds. They considered that the information provided to them was necessarily estimated, and that the profitability information provided to them, especially on a fund-by-fund basis, did not necessarily provide a definitive tool for evaluating the appropriateness of each fund's advisory fee. They noted that the levels of profitability of the funds to EIMC varied widely, depending on among other things the size and type of fund. They considered the profitability of the funds in light of such factors as, for example, the information they had received regarding the relation of the fees paid by the funds to those paid by other mutual funds, the investment performance of the funds, and the amount of revenues involved. In light of these factors, the Trustees concluded that the profitability of any of the funds, individually or in the aggregate, should not prevent the Trustees from approving the continuation of the agreements.
| TRUSTEES AND OFFICERS |
|
| |
| TRUSTEES1 | | |
| Charles A. Austin III | | Investment Counselor, Anchor Capital Advisors, LLC. (investment advice); Director, The Andover |
| Trustee | | Companies (insurance); Trustee, Arthritis Foundation of New England; Former Director, The |
| DOB: 10/23/1934 | | Francis Ouimet Society (scholarship program); Former Director, Executive Vice President and |
| Term of office since: 1991 | | Treasurer, State Street Research & Management Company (investment advice) |
| Other directorships: None | | |
|
| |
| K. Dun Gifford | | Chairman and President, Oldways Preservation and Exchange Trust (education); Trustee, |
| Trustee | | Treasurer and Chairman of the Finance Committee, Cambridge College |
| DOB: 10/23/1938 | | |
| Term of office since: 1974 | | |
| Other directorships: None | | |
|
| |
| Dr. Leroy Keith, Jr. | | Managing Director, Almanac Capital Management (commodities firm); Trustee, Phoenix |
| Trustee | | Fund Complex; Director, Diversapack Co. (packaging company); Former Partner, Stonington |
| DOB: 2/14/1939 | | Partners, Inc. (private equity fund); Former Director, Obagi Medical Products Co.; Former |
| Term of office since: 1983 | | Director, Lincoln Educational Services |
| Other directorships: Trustee, | | |
| Phoenix Fund Complex (consisting | | |
| of 60 portfolios as of 12/31/2006) | | |
|
| |
| Carol A. Kosel1 | | Former Consultant to the Evergreen Boards of Trustees; Former Senior Vice President, |
| Trustee | | Evergreen Investments, Inc.; Former Treasurer, Evergreen Funds; Former Treasurer, Vestaur |
| DOB: 12/25/1963 | | Securities Fund |
| Term of office since: 2008 | | |
| Other directorships: None | | |
|
| |
| Gerald M. McDonnell | | Manager of Commercial Operations, CMC Steel (steel producer) |
| Trustee | | |
| DOB: 7/14/1939 | | |
| Term of office since: 1988 | | |
| Other directorships: None | | |
|
| |
| Patricia B. Norris | | President and Director of Buckleys of Kezar Lake, Inc. (real estate company); Former President |
| Trustee | | and Director of Phillips Pond Homes Association (home community); Former Partner, |
| DOB: 4/9/1948 | | PricewaterhouseCoopers, LLP (independent registered public accounting firm) |
| Term of office since: 2006 | | |
| Other directorships: None | | |
|
| |
| William Walt Pettit | | Partner and Vice President, Kellam & Pettit, P.A. (law firm); Director, Superior Packaging Corp. |
| Trustee | | (packaging company); Member, Superior Land, LLC (real estate holding company), Member, |
| DOB: 8/26/1955 | | K&P Development, LLC (real estate development); Former Director, National Kidney Foundation |
| Term of office since: 1988 | | of North Carolina, Inc. (non-profit organization) |
| Other directorships: None | | |
|
| |
| David M. Richardson | | President, Richardson, Runden LLC (executive recruitment business development/consulting |
| Trustee | | company); Consultant, Kennedy Information, Inc. (executive recruitment information and |
| DOB: 9/19/1941 | | research company); Consultant, AESC (The Association of Executive Search Consultants); |
| Term of office since: 1982 | | Director, J&M Cumming Paper Co. (paper merchandising); Former Trustee, NDI Technologies, LLP |
| | | (communications) |
| Other directorships: None | | |
|
| |
| Dr. Russell A. Salton III | | President/CEO, AccessOne MedCard, Inc.; Former Medical Director, Healthcare Resource |
| Trustee | | Associates, Inc. |
| DOB: 6/2/1947 | | |
| Term of office since: 1984 | | |
| Other directorships: None | | |
|
| TRUSTEES AND OFFICERS continued |
|
| |
| |
| Michael S. Scofield | | Retired Attorney, Law Offices of Michael S. Scofield; Former Director and Chairman, Branded |
| Trustee | | Media Corporation (multi-media branding company) |
| DOB: 2/20/1943 | | |
| Term of office since: 1984 | | |
| Other directorships: None | | |
|
| |
| Richard J. Shima | | Independent Consultant; Director, Hartford Hospital; Trustee, Greater Hartford YMCA; Former |
| Trustee | | Director, Trust Company of CT; Former Director, Old State House Association; Former Trustee, |
| DOB: 8/11/1939 | | Saint Joseph College (CT) |
| Term of office since: 1993 | | |
| Other directorships: None | | |
|
| |
| Richard K. Wagoner, CFA2 | | Member and Former President, North Carolina Securities Traders Association; Member, Financial |
| Trustee | | Analysts Society |
| DOB: 12/12/1937 | | |
| Term of office since: 1999 | | |
| Other directorships: None | | |
|
| |
| |
| OFFICERS | | |
| |
| Dennis H. Ferro3 | | Principal occupations: President and Chief Executive Officer, Evergreen Investment Company, |
| President | | Inc. and Executive Vice President, Wachovia Bank, N.A.; former Chief Investment Officer, |
| DOB: 6/20/1945 | | Evergreen Investment Company, Inc. |
| Term of office since: 2003 | | |
|
| |
| Jeremy DePalma4 | | Principal occupations: Senior Vice President, Evergreen Investment Management Company, LLC; |
| Treasurer | | Former Vice President, Evergreen Investment Services, Inc.; Former Assistant Vice President, |
| DOB: 2/5/1974 | | Evergreen Investment Services, Inc. |
| Term of office since: 2005 | | |
|
| |
| Michael H. Koonce4 | | Principal occupations: Senior Vice President and General Counsel, Evergreen Investment |
| Secretary | | Services, Inc.; Secretary, Senior Vice President and General Counsel, Evergreen Investment |
| DOB: 4/20/1960 | | Management Company, LLC and Evergreen Service Company, LLC; Senior Vice President and |
| Term of office since: 2000 | | Assistant General Counsel, Wachovia Corporation |
|
| |
| Robert Guerin4 | | Principal occupations: Chief Compliance Officer, Evergreen Funds and Senior Vice President of |
| Chief Compliance Officer | | Evergreen Investments Co, Inc; Former Managing Director and Senior Compliance Officer, |
| DOB: 9/20/1965 | | Babson Capital Management LLC; Former Principal and Director, Compliance and Risk |
| Term of office since: 2007 | | Management, State Street Global Advisors; Former Vice President and Manager, Sales Practice |
| | | Compliance, Deutsche Asset Management. |
|
1 Each Trustee, except Mses. Kosel and Norris, serves until a successor is duly elected or qualified or until his or her death, resignation, retirement or removal from office. As new Trustees, Ms. Kosel’s and Ms. Norris’ initial terms end December 31, 2010 and June 30, 2009, respectively, at which times they may be re-elected by Trustees to serve until a successor is duly elected or qualified or until her death, resignation, retirement or removal from office by the Trustees. Each Trustee, except Ms. Kosel, oversaw 93 Evergreen funds as of December 31, 2007. Ms. Kosel became a Trustee on January 1, 2008. Correspondence for each Trustee may be sent to Evergreen Board of Trustees, P.O. Box 20083, Charlotte, NC 28202.
2 Mr. Wagoner is an “interested person” of the Fund because of his ownership of shares in Wachovia Corporation, the parent to the Fund’s investment advisor.
3 The address of the Officer is 401 S. Tryon Street, 20th Floor, Charlotte, NC 28288.
4 The address of the Officer is 200 Berkeley Street, Boston, MA 02116.
Additional information about the Fund’s Board of Trustees and Officers can be found in the Statement of Additional Information (SAI) and is available upon request without charge by calling 800.343.2898.
564618 rv5 1/2008
Item 2 - Code of Ethics
Not required for this semi-annual filing.
Item 3 - Audit Committee Financial Expert
Not required for this semi-annual filing.
Items 4 – Principal Accountant Fees and Services
Not required for this semi-annual filing.
Items 5 – Audit Committee of Listed Registrants
Not applicable.
Item 6 – Schedule of Investments
Please see schedule of investments contained in the Report to Stockholders included under Item 1 of this Form N-CSR.
Item 7 – Disclosure of Proxy Voting Policies and Procedures for Closed-End Management Investment Companies.
Not applicable.
Item 8 – Portfolio Managers of Closed-End Management Investment Companies.
Not applicable.
Item 9 – Purchases of Equity Securities by Closed-End Management Investment Company and Affiliated Purchasers.
Not applicable.
Item 10 – Submission of Matters to a Vote of Security Holders
There have been no material changes to the procedures by which shareholders may recommend nominees to the Registrant’s board of trustees that have been implemented since the Registrant last provided disclosure in response to the requirements of this Item.
Item 11 - Controls and Procedures
(a) The Registrant's principal executive officer and principal financial officer have evaluated the Registrant's disclosure controls and procedures (as defined in Rule 30a-3(c) under the Investment Company Act of 1940) within 90 days of this filing and have concluded that the Registrant's disclosure controls and procedures were effective, as of that date, in ensuring that information required to be disclosed by the Registrant in this Form N-CSR was recorded, processed, summarized, and reported timely.
(b) There has been no changes in the Registrant's internal controls over financial reporting (as defined in Rule 30a-3(d) under the Investment Company Act of 1940) that occurred during the second fiscal quarter of the period covered by this report that has materially affected, or is reasonable likely to affect, the Registrant’s internal control over financial reporting .
Item 12 - Exhibits
File the exhibits listed below as part of this Form. Letter or number the exhibits in the sequence indicated.
(a) Any code of ethics, or amendment thereto, that is the subject of the disclosure required by Item 2, to the extent that the Registrant intends to satisfy the Item 2 requirements through filing of an exhibit.
(b)(1) Separate certifications for the Registrant's principal executive officer and principal financial officer, as required by Section 302 of the Sarbanes-Oxley Act of 2002 and Rule 30a-2(a) under the Investment Company Act of 1940, are attached as EX99.CERT.
(b)(2) Separate certifications for the Registrant's principal executive officer and principal financial officer, as required by Section 1350 of Title 18 of United States Code, as adopted pursuant to Section 906 of the Sarbanes-Oxley Act of 2002, and Rule 30a-2(b) under the Investment Company Act of 1940, are attached as EX99.906CERT. The certifications furnished pursuant to this paragraph are not deemed to be "filed" for purposes of Section 18 of the Securities Exchange Act of 1934, or otherwise subject to the liability of that section. Such certifications are not deemed to be incorporated by reference into any filing under the Securities Act of 1933 or the Securities Exchange Act of 1934, except to the extent that the Registrant specifically incorporates them by reference.
Pursuant to the requirements of the Securities Exchange Act of 1934 and the Investment Company Act of 1940, the Registrant has duly caused this report to be signed on its behalf by the undersigned, thereunto duly authorized.
Evergreen Equity Trust
By: _______________________
Dennis H. Ferro,
Principal Executive Officer
Date: January 29, 2008
Pursuant to the requirements of the Securities Exchange Act of 1934 and the Investment Company Act of 1940, this report has been signed below by the following persons on behalf of the Registrant and in the capacities and on the dates indicated.
By: _______________________
Dennis H. Ferro,
Principal Executive Officer
Date: January 29, 2008
By: ________________________
Jeremy Depalma
Principal Financial Officer
Date: January 29, 2008