OMB APPROVAL |
OMB Number: 3235-0570
Expires: September 30, 2007
Estimated average burden hours per response: 19.4 |
UNITED STATES
SECURITIES AND EXCHANGE COMMISSION
Washington, D.C. 20549
FORM N-CSRS
CERTIFIED SHAREHOLDER REPORT OF REGISTERED MANAGEMENT INVESTMENT COMPANIES
Investment Company Act file number 811-08413
Evergreen Equity Trust
_____________________________________________________________
(Exact name of registrant as specified in charter)
200 Berkeley Street
Boston, Massachusetts 02116
_____________________________________________________________
(Address of principal executive offices) (Zip code)
Michael H. Koonce, Esq.
200 Berkeley Street
Boston, Massachusetts 02116
____________________________________________________________
(Name and address of agent for service)
Registrant's telephone number, including area code: (617) 210-3200
Date of fiscal year end: Registrant is making a semi-annual filing for three of its series, Evergreen Market Index Fund, Evergreen Market Index Growth Fund and Evergreen Market Index Value Fund, for the six months ended November 30, 2008. These series have May 31 fiscal year end.
Date of reporting period: November 30, 2008
Item 1 - Reports to Stockholders.
Semiannual Report
as of November 30, 2008
|
This semiannual report must be preceded or accompanied by a prospectus of the Evergreen funds contained herein. The prospectus contains more complete information, including fees and expenses, and should be read carefully before investing or sending money. Each fund will file its complete schedule of portfolio holdings with the SEC for the first and third quarters of each fiscal year on Form N-Q.
Each fund's Form N-Q will be available on the SEC's Web site at http://www.sec.gov. In addition, each fund's Form N-Q may be reviewed and copied at the SEC's Public Reference Room in Washington, D.C. Information on the operation of the Public Reference Room may be obtained by calling 800.SEC.0330.
A description of each fund's proxy voting policies and procedures, as well as information regarding how each fund voted proxies relating to portfolio securities during the most recent 12-month period ended June 30, is available by visiting our Web site at EvergreenInvestments.com or by visiting the SEC's Web site at http://www.sec.gov. Each fund's proxy voting policies and procedures are also available without charge, upon request, by calling 800.343.2898.
Mutual Funds:
| NOT FDIC INSURED | MAY LOSE VALUE | NOT BANK GUARUANTEED |
Evergreen InvestmentsSM is a service mark of Evergreen Investment Management Company, LLC. Copyright 2008, Evergreen Investment Management Company, LLC.
Evergreen Investment Management Company, LLC is a subsidiary of Wachovia Corporation and is an affiliate of Wachovia Corporation's other Broker Dealer subsidiaries.
Evergreen mutual funds are distributed by Evergreen Investment Services, Inc. 200 Berkeley Street, Boston, MA 02116
| 1 | | LETTER TO SHAREHOLDERS |
MARKET INDEX FUND |
| 4 | | FUND AT A GLANCE |
| 6 | | ABOUT YOUR FUND'S EXPENSES |
| 7 | | FINANCIAL HIGHLIGHTS |
| 8 | | SCHEDULE OF INVESTMENTS |
| 23 | | STATEMENT OF ASSETS AND LIABILITIES |
| 24 | | STATEMENT OF OPERATIONS |
| 25 | | STATEMENTS OF CHANGES IN NET ASSETS |
MARKET INDEX GROWTH FUND |
| 26 | | FUND AT A GLANCE |
| 28 | | ABOUT YOUR FUND'S EXPENSES |
| 29 | | FINANCIAL HIGHLIGHTS |
| 30 | | SCHEDULE OF INVESTMENTS |
| 48 | | STATEMENT OF ASSETS AND LIABILITIES |
| 49 | | STATEMENT OF OPERATIONS |
| 50 | | STATEMENTS OF CHANGES IN NET ASSETS |
MARKET INDEX VALUE FUND |
| 51 | | FUND AT A GLANCE |
| 53 | | ABOUT YOUR FUND'S EXPENSES |
| 54 | | FINANCIAL HIGHLIGHTS |
| 55 | | SCHEDULE OF INVESTMENTS |
| 73 | | STATEMENT OF ASSETS AND LIABILITIES |
| 74 | | STATEMENT OF OPERATIONS |
| 75 | | STATEMENTS OF CHANGES IN NET ASSETS |
CLOSING PAGE |
| 76 | | COMBINED NOTES TO FINANCIAL STATEMENTS |
| 84 | | ADDITIONAL INFORMATION |
| 111 | | TRUSTEES AND OFFICERS |
Dear Shareholder:

W. Douglas Munn
President and Chief Executive Officer
We are pleased to provide the Semiannual Report for the Evergreen Market Index Funds for the six-month period ended November 30, 2008 (the "period").
Growing concerns about a weakening economy, deteriorating corporate profitability and an uncertain future for the auto industry combined to cause domestic equity prices to plummet during the period. Few stocks escaped the damage that affected shares of growth companies, value companies and corporations of all sizes and industry groups. Well-recognized benchmarks for the general stock market as well as for specific subgroups typically fell by 30% or more during the period. In the bond markets, investors sought out quality and tried to minimize risk. Treasuries and higher quality short-term debt securities held up well, while corporate bond prices fell victim to the same forces undermining equity valuations. As sentiment in the fixed income markets moved from worries about inflation to concerns about deflation, investors appeared willing to accept virtually nothing for short-term loans to the federal government. The domestic trends extended to capital markets beyond the United States. Foreign sovereign government debt of industrialized nations held up relatively well, but equity prices and virtually all other asset classes suffered declines. Further signs of a global recession also pulled commodity and oil prices lower, while the market for gold strengthened.
Economic news seemed only to get worse during the period. After months of deceleration, the U.S. economy finally contracted in the third quarter of 2008. Real Gross Domestic Product ("GDP") fell by 0.5%, with consumer spending recording its greatest drop in three decades. Economists believed GDP for the fourth quarter of 2008 could drop by more and that the nation's unemployment rate could climb above 8% in 2009. The National Bureau of Economic Research announced that the domestic economy was officially in recession. Meanwhile, reports of slumping manufacturing production and weakening economic activity appeared throughout the world, signaling a global slowdown. The European Union's economic analysis bureau reported that GDP for the 15-nation Eurozone fell by 0.2% during the third quarter of 2008. The economic deceleration extended to China, where the central government announced a major fiscal program to stimulate growth while the central bank cut interest rates by one-half of a percentage point. Faced with widening evidence of economic deterioration, the central banks in the U.S. and other major industrialized nations injected added liquidity into the markets. These efforts continued into December 2008, after the fiscal period ended, when the U.S. Federal Reserve dropped official interest rates to an historically low range, slashing the target fed funds rate to a range of zero to 0.25%. Meanwhile, Congress and officials of both the outgoing and incoming administrations considered new spending plans to revive the economy and, perhaps, rescue the staggering domestic auto industry.
During a volatile and challenging period in the capital markets, the portfolio manager of Evergreen's market index funds continued to implement quantitative-based methodologies intended to produce results consistent with underlying stock market indexes of each portfolio. Evergreen Market Index Fund, for example, is designed to reflect the results of the Standard & Poor's 500 Index, a benchmark for the overall stock market. Evergreen Market Index Growth Fund, meanwhile, is designed to reflect the performance of the Russell 1000 Growth Index, a standard for large cap growth stocks, while the portfolio of Evergreen Market Index Value Fund is structured to be consistent with the Russell 1000 Value Index, which reflects the performance of large cap value stocks.
As we look back over the extraordinary series of events during the period, we believe it is vitally important for all investors to keep perspective and remain focused on their long-term strategies. Most importantly, we continue to urge investors to pursue fully diversified strategies to participate in future market gains and limit the risks of potential losses. If they haven't already done so, we encourage individual investors to work with their financial advisors to develop a diversified, long-term strategy and, most importantly, to adhere to it. Investors should keep in mind that the economy and the financial markets have had long and successful histories of adaptability, recovery, innovation and growth. Proper asset allocation decisions can have significant impacts on the returns of long-term portfolios.
Please visit us at EvergreenInvestments.com for more information about our funds and other investment products available to you. Thank you for your continued support of Evergreen Investments.
Sincerely,

W. Douglas Munn
President and Chief Executive Officer
Evergreen Funds
Notices to Shareholders:
- On December 31, 2008, Wachovia Corporation merged with and into Wells Fargo & Company ("Wells Fargo"). As a result of the merger, Evergreen Investment Management Company, LLC ("EIMC"), Tattersall Advisory Group, Inc., J.L. Kaplan Associates, LLC, First International Advisors, LLC, Metropolitan West Capital Management, LLC, Evergreen Investment Services, Inc. and Evergreen Service Company, LLC, are subsidiaries of Wells Fargo.
After the merger, new interim advisory agreements between the Evergreen Funds and EIMC went into effect, as did new interim sub-advisory agreements with each sub-advisor to the Evergreen Funds. These interim agreements will be in effect until no later than March 19, 2009. Shareholders of the Evergreen Funds will meet on or around February 12, 2009 to consider definitive advisory and sub-advisory agreements for the Evergreen Funds, which would replace the interim agreements.
- Effective January 1, 2009, W. Douglas Munn became President and Chief Executive Officer of the Evergreen Funds.
Market Index Fund
FUND AT A GLANCE |
Management Team
| Investment Advisor: |
| Evergreen Investment Management Company, LLC |
|
| Portfolio Manager: |
| William E. Zieff |
CURRENT INVESTMENT STYLE
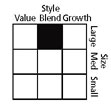 | Source: Morningstar, Inc. Morningstar's style box is based on a portfolio date as of 9/30/2008. The Equity style box placement is based on 10 growth and valuation measures for each fund holding and the median size of the companies in which the fund invests. |
PERFORMANCE AND RETURNS
| Portfolio inception date: 10/15/2002 |
| Class I |
| Class inception date | 10/15/2002 |
| 6-month return | -35.16 | % |
| Average annual return |
| 1-year | -38.06 | % |
| 5-year | -1.41 | % |
| Since portfolio inception | 2.19 | % |
| Past performance is no guarantee of future results. The performance quoted represents past performance and current performance may be lower or higher. The investment return and principal value of an investment will fluctuate so that investors' shares, when redeemed, may be worth more or less than their original cost. Performance includes the reinvestment of income dividends and capital gain distributions. |
| The advisor is waiving its advisory fee and reimbursing the fund for a portion of other expenses. Had the fee not been waived and expenses not reimbursed, returns would have been lower. |
| The fund is only offered to certain pension plans having at least $100 million. Class I are sold without a front-end or deferred sales charge. The minimum initial investment for the fund is $100 million, which may be waived in certain situations. There is no minimum required for subsequent purchases. |
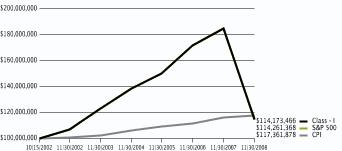
LONG-TERM GROWTH
| Comparison of a $100,000,000 investment in the Evergreen Market Index Fund Class I shares versus a similar investment in the S&P 500 Index (S&P) and the Consumer Price Index (CPI). |
| The S&P 500 is an unmanaged market index and does not include transaction costs associated with buying and selling securities, any mutual fund fees or expenses or any taxes. The CPI is a commonly used measure of inflation and does not represent an investment return. It is not possible to invest directly in an index. |
| The fund's investment objective may be changed without a vote of the fund's shareholders. |
| "Standard & Poor's," "S&P," "S&P 500," "Standard & Poor's 500" and "500" are trademarks of The McGraw-Hill Companies, Inc. and have been licensed for use by Evergreen Investments. The product is not sponsored, endorsed, sold or promoted by Standard & Poor's and Standard & Poor's makes no representation regarding the advisability of investing in the product. |
| All data is as of November 30, 2008, and subject to change. |
Market Index Fund ABOUT YOUR FUND'S EXPENSES |
The Example below is intended to describe the fees and expenses borne by shareholders and the impact of those costs on your investment.
Example
As a shareholder of the fund, you incur two types of costs: (1) transaction costs, including sales charges (loads), redemption fees and exchange fees; and (2) ongoing costs, including management fees, distribution (12b-1) fees and other fund expenses. This Example is intended to help you understand your ongoing costs (in dollars) of investing in the fund and to compare these costs with the ongoing costs of investing in other mutual funds. The Example is based on an investment of $1,000 invested at the beginning of the period and held for the entire period from June 1, 2008 to November 30, 2008.
The example illustrates your fund's costs in two ways:
- Actual expenses
The section in the table under the heading "Actual" provides information about actual account values and actual expenses. You may use the information in these columns, together with the amount you invested, to estimate the expenses that you paid over the period. Simply divide your account value by $1,000 (for example, an $8,600 account value divided by $1,000 = 8.6), then multiply the result by the number in the appropriate column for your share class, in the column entitled "Expenses Paid During Period" to estimate the expenses you paid on your account during this period. - Hypothetical example for comparison purposes
The section in the table under the heading "Hypothetical (5% return before expenses)" provides information about hypothetical account values and hypothetical expenses based on the fund's actual expense ratio and an assumed rate of return of 5% per year before expenses, which is not the fund's actual return. The hypothetical account values and expenses may not be used to estimate the actual ending account balance or expenses you paid for the period. You may use this information to compare the ongoing costs of investing in the fund and other funds. To do so, compare this 5% hypothetical example with the 5% hypothetical examples that appear in the shareholder reports of the other funds.
Please note that the expenses shown in the table are meant to highlight your ongoing costs only and do not reflect any transactional costs, such as sales charges (loads), redemption fees or exchange fees. Therefore, the section in the table under the heading "Hypothetical (5% return before expenses)" is useful in comparing ongoing costs only, and will not help you determine the relative total costs of owning different funds. In addition, if these transactional costs were included, your costs would havebeen higher.
| Beginning
Account Value
6/1/2008 | Ending
Account Value
11/30/2008 | Expenses Paid
During Period* |
| Actual | | | | | | |
| Class I | $1,000.00 | | $648.36 | | $0.08 | |
| Hypothetical (5% return before expenses) | | | | | | |
| Class I | $1,000.00 | | $1,024.97 | | $0.10 | |
| *Expenses are equal to the fund's annualized expense ratio (0.02% for Class I), multiplied by the average account value over the period, multiplied by 183/365 days. |
Market Index Fund FINANCIAL HIGHLIGHTS |
(For a share outstanding throughout each period) |
| | Six Months Ended November 30, 2008 | | Year Ended May 31, |
| Class I | (unaudited) | 2008 | 2007 | 2006 | 2005 | 2004 |
| Net asset value, beginning of period | $ | 13.11 | | $ | 14.48 | | $ | 14.50 | | $ | 13.81 | | $ | 12.97 | | $ | 11.02 | |
| Income from investment operations | | | | | | | | | | | | | | | | | | |
| Net investment income (loss) | | 0.14 | | | 0.28 | 1 | | 0.27 | 1 | | 0.27 | 1 | | 0.30 | | | 0.18 | |
| Net realized and unrealized gains or losses on investments | | (4.75 | ) | | (1.24 | ) | | 2.76 | | | 0.91 | | | 0.76 | | | 1.83 | |
| Total from investment operations | | (4.61 | ) | | (0.96 | ) | | 3.03 | | | 1.18 | | | 1.06 | | | 2.01 | |
| Distributions to shareholders from | | | | | | | | | | | | | | | | | | |
| Net investment income | | 0 | | | (0.23 | ) | | (0.30 | ) | | (0.32 | ) | | (0.20 | ) | | (0.06 | ) |
| Net realized gains | | 0 | | | (0.18 | ) | | (2.75 | ) | | (0.17 | ) | | (0.02 | ) | | 0 | |
| Total distributions to shareholders | | 0 | | | (0.41 | ) | | (3.05 | ) | | (0.49 | ) | | (0.22 | ) | | (0.06 | ) |
| Net asset value, end of period | $ | 8.50 | | $ | 13.11 | | $ | 14.48 | | $ | 14.50 | | $ | 13.81 | | $ | 12.97 | |
| Total return | | (35.16 | )% | | (6.71 | )% | | 22.78 | % | | 8.56 | % | | 8.24 | % | | 18.25 | % |
| Ratios and supplemental data | | | | | | | | | | | | | | | | | | |
| Net assets, end of period (thousands) | $ | 227,730 | | $ | 351,138 | | $ | 558,366 | | $ | 406,581 | | $ | 722,863 | | $ | 716,998 | |
| Ratios to average net assets | | | | | | | | | | | | | | | | | | |
| Expenses including waivers/reimbursements but excluding expense reductions | | 0.02 | %2 | | 0.03 | % | | 0.03 | % | | 0.03 | % | | 0.03 | % | | 0.02 | % |
| Expenses excluding waivers/reimbursements and expense reductions | | 0.46 | %2 | | 0.46 | % | | 0.46 | % | | 0.46 | % | | 0.46 | % | | 0.45 | % |
| Net investment income (loss) | | 2.55 | %2 | | 2.01 | % | | 1.93 | % | | 1.90 | % | | 2.08 | % | | 1.70 | % |
| Portfolio turnover rate | | 2 | % | | 7 | % | | 5 | % | | 6 | % | | 6 | % | | 2 | % |
| 1 | Net investment income (loss) per share is based on average shares outstanding during the period. |
| 2 | Annualized |
See Combined Notes to Financial Statements Market Index Fund SCHEDULE OF INVESTMENTS |
November 30, 2008 (unaudited) |
| | Shares | | | Value | |
| COMMON STOCKS 99.5% | | | | | | |
| CONSUMER DISCRETIONARY 8.0% | | | | | | |
| Auto Components 0.1% | | | | | | |
| Goodyear Tire & Rubber Co. * | | 6,978 | | $ | 44,868 | |
| Johnson Controls, Inc. | | 17,183 | | | 303,452 | |
| | | | | 348,320 | |
| Automobiles 0.2% | | | | | | |
| Ford Motor Co. * Þ | | 65,440 | | | 176,034 | |
| General Motors Corp. Þ | | 17,666 | | | 92,570 | |
| Harley-Davidson, Inc. Þ | | 6,810 | | | 115,838 | |
| | | | | 384,442 | |
| Distributors 0.1% | | | | | | |
| Genuine Parts Co. | | 4,682 | | | 183,300 | |
| | | | | | |
| Diversified Consumer Services 0.2% | | | | | | |
| Apollo Group, Inc., Class A * | | 3,073 | | | 236,129 | |
| H&R Block, Inc. Þ | | 9,494 | | | 181,620 | |
| | | | | 417,749 | |
| Hotels, Restaurants & Leisure 1.4% | | | | | | |
| Carnival Corp. Þ | | 12,645 | | | 265,545 | |
| Darden Restaurants, Inc. Þ | | 4,064 | | | 74,331 | |
| International Game Technology | | 8,959 | | | 95,951 | |
| Marriott International, Inc., Class A Þ | | 8,552 | | | 143,588 | |
| McDonald's Corp. | | 32,546 | | | 1,912,077 | |
| Starbucks Corp. * | | 21,142 | | | 188,798 | |
| Starwood Hotels & Resorts Worldwide, Inc. Þ | | 5,403 | | | 91,095 | |
| Wyndham Worldwide Corp. | | 5,136 | | | 24,550 | |
| Wynn Resorts, Ltd. Þ | | 1,779 | | | 70,840 | |
| Yum! Brands, Inc. | | 13,564 | | | 365,414 | |
| | | | | 3,232,189 | |
| Household Durables 0.4% | | | | | | |
| Black & Decker Corp. Þ | | 1,735 | | | 73,633 | |
| Centex Corp. Þ | | 3,576 | | | 32,756 | |
| D.R. Horton, Inc. Þ | | 7,971 | | | 54,761 | |
| Fortune Brands, Inc. | | 4,338 | | | 163,976 | |
| Harman International Industries, Inc. Þ | | 1,694 | | | 25,495 | |
| KB Home Þ | | 2,178 | | | 25,330 | |
| Leggett & Platt, Inc. | | 4,652 | | | 67,919 | |
| Lennar Corp., Class A Þ | | 4,091 | | | 29,087 | |
| Newell Rubbermaid, Inc. | | 8,019 | | | 107,134 | |
| Pulte Homes, Inc. Þ | | 6,183 | | | 65,849 | |
| Snap-On, Inc. Þ | | 1,662 | | | 59,915 | |
| Stanley Works | | 2,274 | | | 72,291 | |
| Whirlpool Corp. Þ | | 2,154 | | | 84,825 | |
| | | | | 862,971 | |
| Internet & Catalog Retail 0.2% | | | | | | |
| Amazon.com, Inc. * Þ | | 9,244 | | | 394,719 | |
| Expedia, Inc. * | | 6,056 | | | 50,870 | |
| | | | | 445,589 | |
| Leisure Equipment & Products 0.1% | | | | | | |
| Eastman Kodak Co. Þ | | 7,769 | | | 58,811 | |
| Hasbro, Inc. Þ | | 3,633 | | | 97,365 | |
| | Shares | | | Value | |
| COMMON STOCKS continued | | | | | | |
| CONSUMER DISCRETIONARY continued | | | | | | |
| Leisure Equipment & Products continued | | | | | | |
| Mattel, Inc. | | 10,433 | | $ | 142,619 | |
| | | | | 298,795 | |
| Media 2.5% | | | | | | |
| CBS Corp., Class B Þ | | 19,676 | | | 131,042 | |
| Comcast Corp., Class A | | 84,448 | | | 1,464,328 | |
| DIRECTV Group, Inc. * Þ | | 15,805 | | | 347,868 | |
| Gannett Co., Inc. Þ | | 6,601 | | | 57,495 | |
| Interpublic Group of Cos. * Þ | | 13,788 | | | 56,393 | |
| McGraw-Hill Cos. Þ | | 9,191 | | | 229,775 | |
| Meredith Corp. Þ | | 1,048 | | | 16,915 | |
| New York Times Co., Class A Þ | | 3,370 | | | 25,410 | |
| News Corp., Class A | | 66,442 | | | 524,892 | |
| Omnicom Group, Inc. | | 9,226 | | | 261,003 | |
| Scripps Networks Interactive, Inc., Class A Þ | | 2,601 | | | 72,282 | |
| Time Warner, Inc. Þ | | 103,681 | | | 938,313 | |
| Viacom, Inc., Class B * | | 17,968 | | | 286,051 | |
| Walt Disney Co. Þ | | 54,301 | | | 1,222,858 | |
| Washington Post Co., Class B Þ | | 173 | | | 68,491 | |
| | | | | 5,703,116 | |
| Multiline Retail 0.7% | | | | | | |
| Big Lots, Inc. * Þ | | 2,374 | | | 41,592 | |
| Family Dollar Stores, Inc. Þ | | 4,043 | | | 112,314 | |
| J.C. Penney Co., Inc. | | 6,427 | | | 122,049 | |
| Kohl's Corp. * Þ | | 8,813 | | | 287,833 | |
| Macy's, Inc. Þ | | 12,170 | | | 90,301 | |
| Nordstrom, Inc. Þ | | 4,615 | | | 52,473 | |
| Sears Holdings Corp. * Þ | | 1,646 | | | 59,667 | |
| Target Corp. | | 21,839 | | | 737,285 | |
| | | | | 1,503,514 | |
| Specialty Retail 1.7% | | | | | | |
| Abercrombie & Fitch Co., Class A Þ | | 2,519 | | | 48,692 | |
| AutoNation, Inc. * Þ | | 3,118 | | | 26,628 | |
| AutoZone, Inc. * Þ | | 1,107 | | | 120,907 | |
| Bed Bath & Beyond, Inc. * Þ | | 7,536 | | | 152,906 | |
| Best Buy Co., Inc. Þ | | 9,775 | | | 202,440 | |
| GameStop Corp., Class A * Þ | | 4,727 | | | 103,285 | |
| Gap, Inc. Þ | | 13,588 | | | 176,916 | |
| Home Depot, Inc. Þ | | 49,151 | | | 1,135,880 | |
| Limited Brands, Inc. | | 8,259 | | | 76,891 | |
| Lowe's Cos. | | 42,415 | | | 876,294 | |
| Office Depot, Inc. * | | 7,958 | | | 15,677 | |
| RadioShack Corp. Þ | | 3,795 | | | 37,381 | |
| Sherwin-Williams Co. Þ | | 2,855 | | | 168,245 | |
| Staples, Inc. | | 20,576 | | | 357,199 | |
| Tiffany & Co. Þ | | 3,589 | | | 71,026 | |
| TJX Cos. | | 12,137 | | | 276,966 | |
| | | | | 3,847,333 | |
| | Shares | | | Value | |
| COMMON STOCKS continued | | | | | | |
| CONSUMER DISCRETIONARY continued | | | | | | |
| Textiles, Apparel & Luxury Goods 0.4% | | | | | | |
| Coach, Inc. * | | 9,749 | | $ | 174,507 | |
| Jones Apparel Group, Inc. | | 2,414 | | | 12,384 | |
| Liz Claiborne, Inc. Þ | | 2,743 | | | 7,818 | |
| Nike, Inc., Class B Þ | | 11,353 | | | 604,547 | |
| Polo Ralph Lauren Corp. Þ | | 1,645 | | | 71,064 | |
| VF Corp. Þ | | 2,521 | | | 131,823 | |
| | | | | 1,002,143 | |
| CONSUMER STAPLES 13.0% | | | | | | |
| Beverages 2.6% | | | | | | |
| Brown-Forman Corp., Class B | | 2,838 | | | 124,560 | |
| Coca-Cola Co. | | 57,526 | | | 2,696,243 | |
| Coca-Cola Enterprises, Inc. | | 9,176 | | | 84,235 | |
| Constellation Brands, Inc., Class A * | | 5,609 | | | 71,571 | |
| Dr. Pepper Snapple Group, Inc. * | | 7,341 | | | 118,484 | |
| Molson Coors Brewing Co., Class B | | 4,359 | | | 193,845 | |
| Pepsi Bottling Group, Inc. | | 3,952 | | | 71,492 | |
| PepsiCo, Inc. | | 45,304 | | | 2,568,737 | |
| | | | | 5,929,167 | |
| Food & Staples Retailing 3.3% | | | | | | |
| Costco Wholesale Corp. | | 12,582 | | | 647,596 | |
| CVS Caremark Corp. | | 41,532 | | | 1,201,521 | |
| Kroger Co. | | 18,952 | | | 524,212 | |
| Safeway, Inc. | | 12,600 | | | 274,680 | |
| SUPERVALU, Inc. | | 6,147 | | | 73,211 | |
| Sysco Corp. | | 17,421 | | | 408,522 | |
| Wal-Mart Stores, Inc. | | 64,891 | | | 3,626,109 | |
| Walgreen Co. Þ | | 28,646 | | | 708,702 | |
| Whole Foods Market, Inc. Þ | | 4,060 | | | 42,955 | |
| | | | | 7,507,508 | |
| Food Products 1.8% | | | | | | |
| Archer Daniels Midland Co. | | 18,644 | | | 510,473 | |
| Campbell Soup Co. Þ | | 6,128 | | | 196,402 | |
| ConAgra Foods, Inc. | | 13,109 | | | 193,358 | |
| Dean Foods Co. * | | 4,409 | | | 64,195 | |
| General Mills, Inc. | | 9,729 | | | 614,581 | |
| H.J. Heinz Co. Þ | | 9,038 | | | 351,036 | |
| Hershey Co. Þ | | 4,796 | | | 172,656 | |
| J.M. Smucker Co. | | 3,414 | | | 154,893 | |
| Kellogg Co. | | 7,246 | | | 314,694 | |
| Kraft Foods, Inc., Class A | | 43,932 | | | 1,195,390 | |
| McCormick & Co., Inc. | | 3,732 | | | 111,101 | |
| Sara Lee Corp. | | 20,442 | | | 187,657 | |
| Tyson Foods, Inc., Class A | | 8,683 | | | 58,263 | |
| | | | | 4,124,699 | |
| Household Products 3.3% | | | | | | |
| Clorox Co. Þ | | 3,996 | | | 236,403 | |
| Colgate-Palmolive Co. | | 14,635 | | | 952,299 | |
| | Shares | | | Value | |
| COMMON STOCKS continued | | | | | | |
| CONSUMER STAPLES continued | | | | | | |
| Household Products continued | | | | | | |
| Kimberly-Clark Corp. | | 12,016 | | $ | 694,405 | |
| Procter & Gamble Co. Þ | | 86,690 | | | 5,578,502 | |
| | | | | 7,461,609 | |
| Personal Products 0.1% | | | | | | |
| Avon Products, Inc. | | 12,319 | | | 259,931 | |
| Estee Lauder Cos., Class A Þ | | 3,323 | | | 92,712 | |
| | | | | 352,643 | |
| Tobacco 1.9% | | | | | | |
| Altria Group, Inc. | | 59,605 | | | 958,448 | |
| Lorillard, Inc. Þ | | 5,033 | | | 304,144 | |
| Philip Morris International, Inc. | | 59,648 | | | 2,514,760 | |
| Reynolds American, Inc. Þ | | 4,919 | | | 202,073 | |
| UST, Inc. | | 4,270 | | | 293,562 | |
| | | | | 4,272,987 | |
| ENERGY 14.2% | | | | | | |
| Energy Equipment & Services 2.0% | | | | | | |
| Baker Hughes, Inc. | | 8,920 | | | 310,684 | |
| BJ Services Co. | | 8,512 | | | 102,059 | |
| Cameron International Corp. * Þ | | 6,299 | | | 132,909 | |
| ENSCO International, Inc. | | 4,147 | | | 134,404 | |
| Halliburton Co. | | 25,375 | | | 446,600 | |
| Nabors Industries, Ltd. * Þ | | 8,107 | | | 117,551 | |
| National Oilwell Varco, Inc. * | | 12,078 | | | 341,687 | |
| Noble Corp. Þ | | 7,788 | | | 208,641 | |
| Rowan Companies, Inc. | | 3,270 | | | 56,734 | |
| Schlumberger, Ltd. Þ | | 34,715 | | | 1,761,439 | |
| Smith International, Inc. | | 6,251 | | | 182,779 | |
| Transocean, Inc. | | 9,232 | | | 617,436 | |
| Weatherford International, Ltd. * | | 19,697 | | | 251,531 | |
| | | | | 4,664,454 | |
| Oil, Gas & Consumable Fuels 12.2% | | | | | | |
| Anadarko Petroleum Corp. Þ | | 13,557 | | | 556,515 | |
| Apache Corp. | | 9,679 | | | 748,187 | |
| Cabot Oil & Gas Corp. | | 2,991 | | | 89,640 | |
| Chesapeake Energy Corp. | | 15,084 | | | 259,143 | |
| Chevron Corp. | | 59,453 | | | 4,697,382 | |
| ConocoPhillips Þ | | 43,981 | | | 2,309,882 | |
| Consol Energy, Inc. | | 5,301 | | | 153,570 | |
| Devon Energy Corp. | | 12,785 | | | 924,867 | |
| El Paso Corp. Þ | | 20,292 | | | 149,958 | |
| EOG Resources, Inc. | | 7,200 | | | 612,144 | |
| Exxon Mobil Corp. | | 150,307 | | | 12,047,106 | |
| Hess Corp. | | 8,191 | | | 442,642 | |
| Marathon Oil Corp. | | 20,418 | | | 534,543 | |
| Massey Energy Co. | | 2,447 | | | 38,222 | |
| Murphy Oil Corp. | | 5,511 | | | 242,760 | |
| Noble Energy, Inc. | | 4,998 | | | 261,295 | |
| Occidental Petroleum Corp. | | 23,645 | | | 1,280,140 | |
| | Shares | | | Value | |
| COMMON STOCKS continued | | | | | | |
| ENERGY continued | | | | | | |
| Oil, Gas & Consumable Fuels continued | | | | | | |
| Peabody Energy Corp. | | 7,870 | | $ | 184,394 | |
| Pioneer Natural Resources Co. Þ | | 3,463 | | | 69,537 | |
| Range Resources Corp. | | 4,488 | | | 186,117 | |
| Southwestern Energy Co. * | | 9,931 | | | 341,328 | |
| Spectra Energy Corp. | | 17,792 | | | 289,298 | |
| Sunoco, Inc. Þ | | 3,382 | | | 134,401 | |
| Tesoro Corp. Þ | | 3,990 | | | 36,668 | |
| Valero Energy Corp. | | 15,139 | | | 277,801 | |
| Williams Cos. Þ | | 16,676 | | | 270,485 | |
| XTO Energy, Inc. | | 15,897 | | | 607,901 | |
| | | | | 27,745,926 | |
| FINANCIALS 13.4% | | | | | | |
| Capital Markets 2.4% | | | | | | |
| American Capital, Ltd. Þ | | 5,990 | | | 25,398 | |
| Ameriprise Financial, Inc. | | 6,278 | | | 115,892 | |
| Bank of New York Mellon Corp. | | 33,166 | | | 1,001,945 | |
| Charles Schwab Corp. Þ | | 26,996 | | | 494,837 | |
| E*TRADE Financial Corp. * Þ | | 15,547 | | | 20,988 | |
| Federated Investors, Inc., Class B | | 2,543 | | | 50,479 | |
| Franklin Resources, Inc. Þ | | 4,406 | | | 267,664 | |
| Goldman Sachs Group, Inc. | | 12,572 | | | 993,062 | |
| INVESCO, Ltd. Þ | | 11,192 | | | 140,460 | |
| Janus Capital Group, Inc. Þ | | 4,625 | | | 37,694 | |
| Legg Mason, Inc. Þ | | 4,102 | | | 73,918 | |
| Merrill Lynch & Co., Inc. | | 44,318 | | | 585,884 | |
| Morgan Stanley | | 32,093 | | | 473,372 | |
| Northern Trust Corp. | | 6,397 | | | 293,558 | |
| State Street Corp. | | 12,494 | | | 526,122 | |
| T. Rowe Price Group, Inc. Þ | | 7,488 | | | 256,164 | |
| | | | | 5,357,437 | |
| Commercial Banks 3.2% | | | | | | |
| BB&T Corp. Þ | | 15,901 | | | 476,553 | |
| Comerica, Inc. Þ | | 4,354 | | | 98,183 | |
| Fifth Third Bancorp Þ | | 16,713 | | | 159,776 | |
| First Horizon National Corp. Þ | | 5,838 | | | 62,408 | |
| Huntington Bancshares, Inc. Þ | | 10,596 | | | 84,768 | |
| KeyCorp. Þ | | 14,315 | | | 134,275 | |
| M&T Bank Corp. Þ | | 2,232 | | | 143,406 | |
| Marshall & Ilsley Corp. Þ | | 7,508 | | | 115,998 | |
| National City Corp. Þ | | 60,567 | | | 121,740 | |
| PNC Financial Services Group, Inc. | | 10,027 | | | 529,125 | |
| Regions Financial Corp. Þ | | 20,106 | | | 204,880 | |
| SunTrust Banks, Inc. | | 10,235 | | | 324,756 | |
| U.S. Bancorp | | 50,412 | | | 1,360,116 | |
| Wachovia Corp. ° | | 62,474 | | | 351,104 | |
| Wells Fargo & Co. Þ ° | | 107,549 | | | 3,107,091 | |
| Zions Bancorp Þ | | 3,318 | | | 105,811 | |
| | | | | 7,379,990 | |
| | | | | | |
| | Shares | | | Value | |
| COMMON STOCKS continued | | | | | | |
| FINANCIALS continued | | | | | | |
| Consumer Finance 0.8% | | | | | | |
| American Express Co. | | 33,551 | | $ | 782,074 | |
| Capital One Financial Corp. Þ | | 10,873 | | | 374,140 | |
| Discover Financial Services Þ | | 13,872 | | | 141,910 | |
| MasterCard, Inc., Class A Þ | | 2,093 | | | 304,113 | |
| SLM Corp. * Þ | | 13,523 | | | 124,547 | |
| | | | | 1,726,784 | |
| Diversified Financial Services 3.6% | | | | | | |
| Bank of America Corp. Þ | | 145,130 | | | 2,358,362 | |
| CIT Group, Inc. Þ | | 8,258 | | | 27,582 | |
| Citigroup, Inc. | | 157,581 | | | 1,306,346 | |
| CME Group, Inc., Class A Þ | | 1,942 | | | 411,607 | |
| IntercontinentalExchange, Inc. * Þ | | 2,181 | | | 160,522 | |
| JPMorgan Chase & Co. | | 106,608 | | | 3,375,209 | |
| Leucadia National Corp. Þ | | 5,121 | | | 100,116 | |
| Moody's Corp. Þ | | 5,712 | | | 124,008 | |
| NASDAQ OMX Group, Inc. * Þ | | 3,934 | | | 84,581 | |
| NYSE Euronext Þ | | 7,698 | | | 183,289 | |
| | | | | 8,131,622 | |
| Insurance 2.4% | | | | | | |
| AFLAC, Inc. | | 13,781 | | | 638,060 | |
| Allstate Corp. | | 15,671 | | | 398,670 | |
| American International Group, Inc. Þ | | 77,811 | | | 156,400 | |
| AON Corp. | | 8,035 | | | 363,986 | |
| Assurant, Inc. | | 3,432 | | | 74,715 | |
| Chubb Corp. | | 10,434 | | | 535,890 | |
| Cincinnati Financial Corp. Þ | | 4,699 | | | 137,399 | |
| Genworth Financial, Inc., Class A | | 12,532 | | | 18,171 | |
| Hartford Financial Services Group, Inc. Þ | | 8,719 | | | 73,676 | |
| Lincoln National Corp. | | 7,432 | | | 102,041 | |
| Loews Corp. | | 10,479 | | | 287,020 | |
| Marsh & McLennan Cos. | | 14,843 | | | 378,496 | |
| MBIA, Inc. Þ | | 5,658 | | | 33,099 | |
| MetLife, Inc. Þ | | 22,042 | | | 633,928 | |
| Principal Financial Group, Inc. | | 7,500 | | | 103,575 | |
| Progressive Corp. Þ | | 19,549 | | | 293,626 | |
| Prudential Financial, Inc. | | 12,357 | | | 268,147 | |
| Torchmark Corp. Þ | | 2,524 | | | 91,243 | |
| Travelers Companies, Inc. | | 17,097 | | | 746,284 | |
| UnumProvident Corp. | | 9,998 | | | 148,970 | |
| XL Capital, Ltd., Class A Þ | | 9,572 | | | 48,147 | |
| | | | | 5,531,543 | |
| Real Estate Investment Trusts (REITs) 0.8% | | | | | | |
| Apartment Investment & Management Co., Class A Þ | | 2,478 | | | 28,423 | |
| AvalonBay Communities, Inc. Þ | | 2,230 | | | 135,294 | |
| Boston Properties, Inc. Þ | | 3,467 | | | 185,138 | |
| Developers Diversified Realty Corp. Þ | | 3,480 | | | 16,704 | |
| Equity Residential Þ | | 7,840 | | | 238,571 | |
| HCP, Inc. | | 7,282 | | | 150,519 | |
| | Shares | | | Value | |
| COMMON STOCKS continued | | | | | | |
| FINANCIALS continued | | | | | | |
| Real Estate Investment Trusts (REITs) continued | | | | | | |
| Host Hotels & Resorts, Inc. Þ | | 15,033 | | $ | 113,048 | |
| Kimco Realty Corp. Þ | | 6,571 | | | 92,980 | |
| Plum Creek Timber Co., Inc. Þ | | 4,952 | | | 176,242 | |
| ProLogis Þ | | 7,596 | | | 29,093 | |
| Public Storage, Inc. Þ | | 3,624 | | | 253,281 | |
| Simon Property Group, Inc. Þ | | 6,512 | | | 309,320 | |
| Vornado Realty Trust Þ | | 3,963 | | | 211,822 | |
| | | | | 1,940,435 | |
| Real Estate Management & Development 0.0% | | | | | | |
| CB Richard Ellis Group, Inc., Class A * Þ | | 6,207 | | | 28,304 | |
| | | | | | |
| Thrifts & Mortgage Finance 0.2% | | | | | | |
| Hudson City Bancorp, Inc. Þ | | 15,039 | | | 251,301 | |
| People's United Financial, Inc. Þ | | 10,039 | | | 191,444 | |
| Sovereign Bancorp, Inc. Þ | | 15,727 | | | 38,846 | |
| | | | | 481,591 | |
| HEALTH CARE 14.0% | | | | | | |
| Biotechnology 2.0% | | | | | | |
| Amgen, Inc. * | | 30,618 | | | 1,700,524 | |
| Biogen Idec, Inc. * | | 8,400 | | | 355,404 | |
| Celgene Corp. * | | 13,164 | | | 685,844 | |
| Cephalon, Inc. Þ | | 1,967 | | | 144,535 | |
| Genzyme Corp. * | | 7,774 | | | 497,691 | |
| Gilead Sciences, Inc. * | | 26,621 | | | 1,192,355 | |
| | | | | 4,576,353 | |
| Health Care Equipment & Supplies 2.1% | | | | | | |
| Baxter International, Inc. | | 18,164 | | | 960,876 | |
| Becton, Dickinson & Co. | | 7,048 | | | 447,759 | |
| Boston Scientific Corp. * | | 43,426 | | | 267,938 | |
| C.R. Bard, Inc. Þ | | 2,875 | | | 235,836 | |
| Covidien, Ltd. | | 14,522 | | | 535,136 | |
| Dentsply International, Inc. | | 4,302 | | | 112,196 | |
| Hospira, Inc. * | | 4,614 | | | 138,558 | |
| Intuitive Surgical, Inc. * Þ | | 1,124 | | | 148,964 | |
| Medtronic, Inc. | | 32,651 | | | 996,509 | |
| St. Jude Medical, Inc. * | | 9,891 | | | 277,245 | |
| Stryker Corp. | | 7,159 | | | 278,628 | |
| Varian Medical Systems, Inc. * Þ | | 3,613 | | | 145,821 | |
| Zimmer Holdings, Inc. * | | 6,518 | | | 243,252 | |
| | | | | 4,788,718 | |
| Health Care Providers & Services 1.9% | | | | | | |
| Aetna, Inc. | | 13,647 | | | 297,778 | |
| AmerisourceBergen Corp. | | 4,586 | | | 143,771 | |
| Cardinal Health, Inc. | | 10,393 | | | 337,980 | |
| CIGNA Corp. | | 7,954 | | | 96,323 | |
| Coventry Health Care, Inc. * | | 4,286 | | | 53,446 | |
| DaVita, Inc. * | | 3,021 | | | 151,805 | |
| Express Scripts, Inc. * Þ | | 7,137 | | | 410,449 | |
| Humana, Inc. * | | 4,887 | | | 147,734 | |
| | Shares | | | Value | |
| COMMON STOCKS continued | | | | | | |
| HEALTH CARE continued | | | | | | |
| Health Care Providers & Services continued | | | | | | |
| Laboratory Corp. of America Holdings * Þ | | 3,218 | | $ | 203,893 | |
| McKesson Corp. | | 7,984 | | | 278,961 | |
| Medco Health Solutions, Inc. * | | 14,634 | | | 614,628 | |
| Patterson Companies, Inc. * Þ | | 2,636 | | | 49,610 | |
| Quest Diagnostics, Inc. | | 4,574 | | | 213,011 | |
| Tenet Healthcare Corp. * Þ | | 12,004 | | | 14,525 | |
| UnitedHealth Group, Inc. | | 35,237 | | | 740,329 | |
| WellPoint, Inc. * | | 14,797 | | | 526,773 | |
| | | | | 4,281,016 | |
| Health Care Technology 0.0% | | | | | | |
| IMS Health, Inc. | | 5,263 | | | 69,208 | |
| | | | | | |
| Life Sciences Tools & Services 0.4% | | | | | | |
| Life Technologies Corp. Þ | | 4,992 | | | 130,303 | |
| Millipore Corp. * Þ | | 1,597 | | | 80,904 | |
| PerkinElmer, Inc. | | 3,458 | | | 62,451 | |
| Thermo Fisher Scientific, Inc. * Þ | | 12,126 | | | 432,656 | |
| Waters Corp. * Þ | | 2,864 | | | 118,083 | |
| | | | | 824,397 | |
| Pharmaceuticals 7.6% | | | | | | |
| Abbott Laboratories Þ | | 44,610 | | | 2,337,118 | |
| Allergan, Inc. | | 8,899 | | | 335,314 | |
| Barr Pharmaceuticals, Inc. * | | 3,149 | | | 205,913 | |
| Bristol-Myers Squibb Co. | | 57,287 | | | 1,185,841 | |
| Eli Lilly & Co. | | 28,953 | | | 988,745 | |
| Forest Laboratories, Inc. * | | 8,822 | | | 213,316 | |
| Johnson & Johnson | | 80,868 | | | 4,737,247 | |
| King Pharmaceuticals, Inc. * Þ | | 7,133 | | | 68,548 | |
| Merck & Co., Inc. | | 62,000 | | | 1,656,640 | |
| Mylan Laboratories, Inc. * Þ | | 8,811 | | | 82,912 | |
| Pfizer, Inc. | | 195,074 | | | 3,205,066 | |
| Schering-Plough Corp. | | 47,042 | | | 790,776 | |
| Watson Pharmaceuticals, Inc. * | | 3,023 | | | 71,796 | |
| Wyeth | | 38,588 | | | 1,389,554 | |
| | | | | 17,268,786 | |
| INDUSTRIALS 11.0% | | | | | | |
| Aerospace & Defense 2.6% | | | | | | |
| Boeing Co. | | 21,422 | | | 913,220 | |
| General Dynamics Corp. | | 11,496 | | | 593,998 | |
| Goodrich Corp. | | 3,620 | | | 121,813 | |
| Honeywell International, Inc. | | 21,543 | | | 600,188 | |
| L-3 Communications Holdings, Inc. | | 3,514 | | | 236,035 | |
| Lockheed Martin Corp. | | 9,635 | | | 742,955 | |
| Northrop Grumman Corp. | | 9,768 | | | 400,000 | |
| Precision Castparts Corp. | | 4,033 | | | 252,869 | |
| Raytheon Co. Þ | | 12,065 | | | 588,772 | |
| Rockwell Collins Corp. Þ | | 4,613 | | | 157,211 | |
| United Technologies Corp. | | 27,907 | | | 1,354,327 | |
| | | | | 5,961,388 | |
| | | | | | |
| | Shares | | | Value | |
| COMMON STOCKS continued | | | | | | |
| INDUSTRIALS continued | | | | | | |
| Air Freight & Logistics 1.2% | | | | | | |
| C.H. Robinson Worldwide, Inc. Þ | | 4,920 | | $ | 251,314 | |
| Expeditors International of Washington, Inc. Þ | | 6,165 | | | 206,096 | |
| FedEx Corp. Þ | | 9,005 | | | 636,203 | |
| United Parcel Service, Inc., Class B Þ | | 29,175 | | | 1,680,480 | |
| | | | | 2,774,093 | |
| Airlines 0.1% | | | | | | |
| Southwest Airlines Co. | | 21,239 | | | 183,717 | |
| | | | | | |
| Building Products 0.0% | | | | | | |
| Masco Corp. Þ | | 10,418 | | | 99,804 | |
| | | | | | |
| Commercial Services & Supplies 0.5% | | | | | | |
| Allied Waste Industries, Inc. * | | 9,807 | | | 105,327 | |
| Avery Dennison Corp. Þ | | 3,082 | | | 95,850 | |
| Cintas Corp. Þ | | 3,825 | | | 91,876 | |
| Pitney Bowes, Inc. | | 6,013 | | | 148,581 | |
| R.R. Donnelley & Sons Co. | | 6,077 | | | 77,543 | |
| Stericycle, Inc. | | 2,472 | | | 141,646 | |
| Waste Management, Inc. | | 14,193 | | | 414,436 | |
| | | | | 1,075,259 | |
| Construction & Engineering 0.2% | | | | | | |
| Fluor Corp. | | 5,180 | | | 235,897 | |
| Jacobs Engineering Group, Inc. * | | 3,543 | | | 158,620 | |
| | | | | 394,517 | |
| Electrical Equipment 0.5% | | | | | | |
| Cooper Industries, Inc. | | 5,035 | | | 121,545 | |
| Emerson Electric Co. | | 22,455 | | | 805,910 | |
| Rockwell Automation, Inc. | | 4,213 | | | 131,235 | |
| | | | | 1,058,690 | |
| Industrial Conglomerates 3.1% | | | | | | |
| 3M Co. Þ | | 20,228 | | | 1,353,860 | |
| General Electric Co. | | 303,734 | | | 5,215,113 | |
| Textron, Inc. Þ | | 7,192 | | | 109,534 | |
| Tyco International, Ltd. | | 13,741 | | | 287,187 | |
| | | | | 6,965,694 | |
| Machinery 1.6% | | | | | | |
| Caterpillar, Inc. | | 17,615 | | | 722,039 | |
| Cummins, Inc. | | 5,866 | | | 150,052 | |
| Danaher Corp. Þ | | 7,384 | | | 410,846 | |
| Deere & Co. | | 12,357 | | | 430,147 | |
| Dover Corp. | | 5,436 | | | 162,156 | |
| Eaton Corp. | | 4,810 | | | 222,895 | |
| Flowserve Corp. | | 1,660 | | | 83,548 | |
| Illinois Tool Works, Inc. Þ | | 11,573 | | | 394,871 | |
| Ingersoll-Rand Co., Ltd., Class A | | 9,218 | | | 144,538 | |
| ITT Corp. | | 5,259 | | | 220,142 | |
| Manitowoc Co. | | 3,770 | | | 29,708 | |
| Paccar, Inc. Þ | | 10,515 | | | 293,053 | |
| | Shares | | | Value | |
| COMMON STOCKS continued | | | | | | |
| INDUSTRIALS continued | | | | | | |
| Machinery continued | | | | | | |
| Pall Corp. | | 3,469 | | $ | 95,432 | |
| Parker Hannifin Corp. | | 4,851 | | | 199,279 | |
| | | | | 3,558,706 | |
| Professional Services 0.1% | | | | | | |
| Equifax, Inc. Þ | | 3,711 | | | 94,445 | |
| Monster Worldwide, Inc. * Þ | | 3,588 | | | 41,154 | |
| Robert Half International, Inc. Þ | | 4,512 | | | 94,256 | |
| | | | | 229,855 | |
| Road & Rail 1.0% | | | | | | |
| Burlington Northern Santa Fe Corp. | | 8,173 | | | 626,134 | |
| CSX Corp. | | 11,797 | | | 439,320 | |
| Norfolk Southern Corp. Þ | | 10,858 | | | 537,145 | |
| Ryder System, Inc. Þ | | 1,634 | | | 58,677 | |
| Union Pacific Corp. | | 14,735 | | | 737,339 | |
| | | | | 2,398,615 | |
| Trading Companies & Distributors 0.1% | | | | | | |
| Fastenal Co. Þ | | 3,739 | | | 143,989 | |
| W.W. Grainger, Inc. Þ | | 1,875 | | | 132,319 | |
| | | | | 276,308 | |
| INFORMATION TECHNOLOGY 14.9% | | | | | | |
| Communications Equipment 2.5% | | | | | | |
| Ciena Corp. * Þ | | 2,614 | | | 19,343 | |
| Cisco Systems, Inc. * | | 170,944 | | | 2,827,414 | |
| Corning, Inc. | | 45,663 | | | 411,424 | |
| Harris Corp. | | 3,883 | | | 135,439 | |
| JDS Uniphase Corp. * | | 6,204 | | | 16,875 | |
| Juniper Networks, Inc. * Þ | | 15,729 | | | 273,370 | |
| Motorola, Inc. Þ | | 65,557 | | | 282,551 | |
| QUALCOMM, Inc. | | 47,487 | | | 1,594,138 | |
| Tellabs, Inc. * Þ | | 11,505 | | | 47,976 | |
| | | | | 5,608,530 | |
| Computers & Peripherals 4.3% | | | | | | |
| Apple, Inc. * Þ | | 25,636 | | | 2,375,688 | |
| Dell, Inc. * | | 50,438 | | | 563,393 | |
| EMC Corp. * | | 59,918 | | | 633,333 | |
| Hewlett-Packard Co. Þ | | 70,873 | | | 2,500,400 | |
| International Business Machines Corp. | | 39,207 | | | 3,199,291 | |
| Lexmark International, Inc., Class A * Þ | | 2,269 | | | 59,402 | |
| NetApp, Inc. * Þ | | 9,474 | | | 127,899 | |
| QLogic Corp. * Þ | | 3,796 | | | 40,314 | |
| SanDisk Corp. * Þ | | 6,511 | | | 52,088 | |
| Sun Microsystems, Inc. * | | 21,789 | | | 69,071 | |
| Teradata Corp. * | | 5,166 | | | 69,379 | |
| | | | | 9,690,258 | |
| Electronic Equipment & Instruments 0.3% | | | | | | |
| Agilent Technologies, Inc. * | | 10,347 | | | 194,834 | |
| Amphenol Corp., Class A | | 5,116 | | | 118,793 | |
| Jabil Circuit, Inc. | | 6,078 | | | 39,993 | |
| | Shares | | | Value | |
| COMMON STOCKS continued | | | | | | |
| INFORMATION TECHNOLOGY continued | | | | | | |
| Electronic Equipment & Instruments continued | | | | | | |
| Molex, Inc. Þ | | 4,128 | | $ | 56,141 | |
| Tyco Electronics, Ltd. | | 13,668 | | | 225,249 | |
| | | | | 635,010 | |
| Internet Software & Services 1.3% | | | | | | |
| Akamai Technologies, Inc. * | | 4,894 | | | 60,049 | |
| eBay, Inc. * Þ | | 31,615 | | | 415,105 | |
| Google, Inc., Class A * | | 6,916 | | | 2,026,111 | |
| VeriSign, Inc. * | | 5,591 | | | 120,710 | |
| Yahoo!, Inc. * Þ | | 40,103 | | | 461,586 | |
| | | | | 3,083,561 | |
| IT Services 0.8% | | | | | | |
| Affiliated Computer Services, Inc., Class A * | | 2,815 | | | 113,867 | |
| Automatic Data Processing, Inc. | | 14,726 | | | 604,649 | |
| Cognizant Technology Solutions Corp., Class A * | | 8,439 | | | 162,029 | |
| Computer Sciences Corp. * | | 4,380 | | | 122,027 | |
| Convergys Corp. * | | 3,525 | | | 22,172 | |
| Fidelity National Information Services, Inc. | | 5,490 | | | 94,318 | |
| Fiserv, Inc. * | | 4,747 | | | 162,063 | |
| Paychex, Inc. | | 9,285 | | | 262,394 | |
| Total System Services, Inc. | | 5,721 | | | 81,639 | |
| Western Union Co. | | 21,100 | | | 279,997 | |
| | | | | 1,905,155 | |
| Office Electronics 0.1% | | | | | | |
| Xerox Corp. | | 25,241 | | | 176,434 | |
| | | | | | |
| Semiconductors & Semiconductor Equipment 2.0% | | | | | | |
| Advanced Micro Devices, Inc. * Þ | | 17,571 | | | 41,468 | |
| Altera Corp. Þ | | 8,705 | | | 128,051 | |
| Analog Devices, Inc. Þ | | 8,405 | | | 143,725 | |
| Applied Materials, Inc. | | 38,826 | | | 371,953 | |
| Broadcom Corp., Class A * | | 12,772 | | | 195,539 | |
| Intel Corp. Þ | | 162,692 | | | 2,245,150 | |
| KLA-Tencor Corp. Þ | | 5,013 | | | 94,294 | |
| Linear Technology Corp. Þ | | 6,411 | | | 127,899 | |
| LSI Corp. * Þ | | 18,625 | | | 49,915 | |
| MEMC Electronic Materials, Inc. * | | 6,537 | | | 98,186 | |
| Microchip Technology, Inc. Þ | | 5,328 | | | 98,568 | |
| Micron Technology, Inc. * Þ | | 22,023 | | | 60,343 | |
| National Semiconductor Corp. | | 5,642 | | | 62,062 | |
| Novellus Systems, Inc. * Þ | | 2,869 | | | 35,547 | |
| NVIDIA Corp. * | | 16,107 | | | 120,319 | |
| Teradyne, Inc. * | | 4,887 | | | 18,522 | |
| Texas Instruments, Inc. | | 37,935 | | | 590,648 | |
| Xilinx, Inc. | | 8,000 | | | 130,880 | |
| | | | | 4,613,069 | |
| Software 3.6% | | | | | | |
| Adobe Systems, Inc. * | | 15,351 | | | 355,529 | |
| Autodesk, Inc. * Þ | | 6,510 | | | 108,001 | |
| BMC Software, Inc. * | | 5,499 | | | 137,255 | |
| | Shares | | | Value | |
| COMMON STOCKS continued | | | | | | |
| INFORMATION TECHNOLOGY continued | | | | | | |
| Software continued | | | | | | |
| CA, Inc. | | 11,398 | | $ | 191,942 | |
| Citrix Systems, Inc. * | | 5,278 | | | 140,712 | |
| Compuware Corp. * | | 7,376 | | | 46,838 | |
| Electronic Arts, Inc. * | | 9,226 | | | 175,848 | |
| Intuit, Inc. * | | 9,289 | | | 205,844 | |
| Microsoft Corp. | | 227,226 | | | 4,594,510 | |
| Novell, Inc. * | | 9,991 | | | 45,459 | |
| Oracle Corp. * | | 113,394 | | | 1,824,509 | |
| Salesforce.com, Inc. * Þ | | 3,011 | | | 86,175 | |
| Symantec Corp. * Þ | | 24,282 | | | 292,112 | |
| | | | | 8,204,734 | |
| MATERIALS 3.0% | | | | | | |
| Chemicals 1.9% | | | | | | |
| Air Products & Chemicals, Inc. Þ | | 6,130 | | | 292,769 | |
| CF Industries Holdings, Inc. | | 1,635 | | | 86,050 | |
| Dow Chemical Co. Þ | | 26,767 | | | 496,528 | |
| E.I. DuPont de Nemours & Co. | | 26,107 | | | 654,241 | |
| Eastman Chemical Co. Þ | | 2,099 | | | 69,057 | |
| Ecolab, Inc. Þ | | 5,080 | | | 195,021 | |
| International Flavors & Fragrances, Inc. | | 2,273 | | | 69,417 | |
| Monsanto Co. | | 15,916 | | | 1,260,547 | |
| PPG Industries, Inc. | | 4,749 | | | 208,576 | |
| Praxair, Inc. Þ | | 9,115 | | | 538,241 | |
| Rohm & Haas Co. | | 3,584 | | | 245,182 | |
| Sigma-Aldrich Corp. Þ | | 3,645 | | | 157,136 | |
| | | | | 4,272,765 | |
| Construction Materials 0.1% | | | | | | |
| Vulcan Materials Co. Þ | | 3,178 | | | 190,617 | |
| | | | | | |
| Containers & Packaging 0.1% | | | | | | |
| Ball Corp. | | 2,798 | | | 101,987 | |
| Bemis Co., Inc. | | 2,884 | | | 77,926 | |
| Pactiv Corp. * | | 3,789 | | | 94,687 | |
| Sealed Air Corp. | | 4,575 | | | 72,422 | |
| | | | | 347,022 | |
| Metals & Mining 0.7% | | | | | | |
| AK Steel Holding Corp. Þ | | 3,247 | | | 25,586 | |
| Alcoa, Inc. Þ | | 23,538 | | | 253,269 | |
| Allegheny Technologies, Inc. Þ | | 2,902 | | | 66,601 | |
| Freeport-McMoRan Copper & Gold, Inc. Þ | | 11,111 | | | 266,553 | |
| Newmont Mining Corp. Þ | | 13,216 | | | 444,718 | |
| NuCor Corp. Þ | | 9,161 | | | 326,865 | |
| Titanium Metals Corp. Þ | | 2,463 | | | 20,812 | |
| United States Steel Corp. Þ | | 3,400 | | | 103,360 | |
| | | | | 1,507,764 | |
| Paper & Forest Products 0.2% | | | | | | |
| International Paper Co. Þ | | 12,373 | | | 154,044 | |
| | Shares | | | Value | |
| COMMON STOCKS continued | | | | | | |
| MATERIALS continued | | | | | | |
| Paper & Forest Products continued | | | | | | |
| MeadWestvaco Corp. Þ | | 4,943 | | $ | 57,635 | |
| Weyerhaeuser Co. Þ | | 6,114 | | | 230,009 | |
| | | | | 441,688 | |
| TELECOMMUNICATION SERVICES 3.8% | | | | | | |
| Diversified Telecommunication Services 3.6% | | | | | | |
| AT&T, Inc. Þ | | 170,534 | | | 4,870,451 | |
| CenturyTel, Inc. Þ | | 2,962 | | | 78,671 | |
| Embarq Corp. | | 4,124 | | | 134,607 | |
| Frontier Communications Corp. Þ | | 9,143 | | | 79,727 | |
| Qwest Communications International, Inc. Þ | | 42,954 | | | 137,453 | |
| Verizon Communications, Inc. | | 82,409 | | | 2,690,654 | |
| Windstream Corp. Þ | | 12,722 | | | 112,717 | |
| | | | | 8,104,280 | |
| Wireless Telecommunication Services 0.2% | | | | | | |
| American Tower Corp., Class A * | | 11,400 | | | 310,536 | |
| Sprint Nextel Corp. | | 82,596 | | | 230,443 | |
| | | | | 540,979 | |
| UTILITIES 4.2% | | | | | | |
| Electric Utilities 2.7% | | | | | | |
| Allegheny Energy, Inc. | | 4,887 | | | 172,267 | |
| American Electric Power Co., Inc. Þ | | 11,641 | | | 364,247 | |
| Consolidated Edison, Inc. Þ | | 7,906 | | | 319,323 | |
| Duke Energy Corp. | | 36,604 | | | 569,558 | |
| Edison International | | 9,428 | | | 314,895 | |
| Entergy Corp. | | 5,544 | | | 471,794 | |
| Exelon Corp. | | 19,022 | | | 1,069,227 | |
| FirstEnergy Corp. | | 8,821 | | | 516,734 | |
| FPL Group, Inc. Þ | | 11,821 | | | 576,392 | |
| Pepco Holdings, Inc. | | 6,244 | | | 112,330 | |
| Pinnacle West Capital Corp. | | 2,915 | | | 88,616 | |
| PPL Corp. Þ | | 10,837 | | | 367,266 | |
| Progress Energy, Inc. Þ | | 7,582 | | | 300,930 | |
| Southern Co. Þ | | 22,288 | | | 809,500 | |
| | | | | 6,053,079 | |
| Gas Utilities 0.1% | | | | | | |
| Nicor, Inc. Þ | | 1,307 | | | 53,300 | |
| Questar Corp. | | 5,017 | | | 161,497 | |
| | | | | 214,797 | |
| Independent Power Producers & Energy Traders 0.1% | | | | | | |
| AES Corp. * | | 19,468 | | | 149,709 | |
| Constellation Energy Group, Inc. | | 5,161 | | | 126,289 | |
| Dynegy, Inc., Class A * Þ | | 14,630 | | | 32,625 | |
| | | | | 308,623 | |
| Multi-Utilities 1.3% | | | | | | |
| Ameren Corp. Þ | | 6,083 | | | 216,433 | |
| CenterPoint Energy, Inc. | | 9,892 | | | 127,904 | |
| CMS Energy Corp. Þ | | 6,519 | | | 66,233 | |
| Dominion Resources, Inc. Þ | | 16,783 | | | 617,950 | |
| | Shares | | | Value | |
| COMMON STOCKS continued | | | | | | |
| UTILITIES continued | | | | | | |
| Multi-Utilities continued | | | | | | |
| DTE Energy Co. | | 4,720 | | $ | 175,537 | |
| Integrys Energy Group, Inc. | | 2,212 | | | 97,726 | |
| NiSource, Inc. | | 7,936 | | | 95,629 | |
| PG&E Corp. | | 10,376 | | | 394,703 | |
| Public Service Enterprise Group, Inc. | | 14,715 | | | 454,693 | |
| Sempra Energy | | 7,130 | | | 332,757 | |
| TECO Energy, Inc. Þ | | 6,156 | | | 80,028 | |
| Wisconsin Energy Corp. Þ | | 3,383 | | | 147,025 | |
| Xcel Energy, Inc. Þ | | 12,907 | | | 242,781 | |
| | | | | 3,049,399 | |
| Total Common Stocks (cost $228,675,496) | | | | | 226,599,048 | |
| | | | | | |
| | Principal Amount | | | Value | |
| SHORT-TERM INVESTMENTS 23.4% | | | | | | |
| U.S. TREASURY OBLIGATION 0.1% | | | | | | |
| U.S. Treasury Bill, 0.85%, 12/04/2008 ƒ ß | $ | 150,000 | | | 150,000 | |
| | Shares | | | Value | |
| MUTUAL FUND SHARES 23.3% | | | | | | |
| Evergreen Institutional Money Market Fund, Class I, 2.09% q ø | | 109,810 | | | 109,810 | |
| State Street Navigator Securities Lending Prime Portfolio, 1.99% § ÞÞ | | 53,090,268 | | | 53,090,268 | |
| | | | | 53,200,078 | |
| Total Short-Term Investments (cost $53,350,057) | | | | | 53,350,078 | |
| Total Investments (cost $282,025,553) 122.9% | | | | | 279,949,126 | |
| Other Assets and Liabilities (22.9%) | | | | | (52,218,914 | ) |
| Net Assets 100.0% | | | | $ | 227,730,212 | |
| * | Non-income producing security |
| Þ | All or a portion of this security is on loan. |
| ° | Investment in non-controlled affiliate. At November 30, 2008, the Fund owned shares of Wachovia Corporation with a cost basis of $6,066,590 and shares of Wells Fargo & Co. with a cost basis of $2,739,122. The Fund earned $6,188 of income from Wachovia Corporation for the six months ended November 30, 2008 and $32,412 of income from Wells Fargo & Co. for the period from October 3, 2008 to November 30, 2008, which is included in income from affiliates. |
| ƒ | All or a portion of this security was pledged to cover initial margin requirements for open futures contracts. |
| ß | Rate shown represents the yield to maturity at date of purchase. |
| q | Rate shown is the 7-day annualized yield at period end. |
| ÞÞ | All or a portion of this security represents investment of cash collateral received from securities on loan. |
| ø | Evergreen Investment Management Company, LLC is the investment advisor to both the Fund and the money market fund. |
| § | Rate shown is the 1-day annualized yield at period end. |
The following table shows the percent of total long-term investments by sector as of November 30, 2008:
| Information Technology | 15.0 | % | | | |
| Energy | 14.3 | % | | | |
| Health Care | 14.1 | % | | | |
| Financials | 13.5 | % | | | |
| Consumer Staples | 13.1 | % | | | |
| Industrials | 11.0 | % | | | |
| Consumer Discretionary | 8.0 | % | | | |
| Utilities | 4.2 | % | | | |
| Telecommunication Services | 3.8 | % | | | |
| Materials | 3.0 | % | | | |
| 100.0 | % | | | |
Market Index Fund STATEMENT OF ASSETS AND LIABILITIES |
November 30, 2008 (unaudited) |
| Assets | | | |
| Investments in securities, at value (cost $273,110,031) including $52,503,676 of securities loaned | $ | 276,381,121 | |
| Investments in affiliates, at value (cost $8,915,522) | | 3,568,005 | |
| Total investments | | 279,949,126 | |
| Receivable for securities sold | | 146,387 | |
| Dividends receivable | | 746,475 | |
| Receivable for daily variation margin on open futures contracts | | 10,465 | |
| Receivable for securities lending income | | 44,682 | |
| Receivable from investment advisor | | 2,336 | |
| Total assets | | 280,899,471 | |
| Liabilities | | | |
| Payable for securities purchased | | 46,226 | |
| Payable for securities on loan | | 53,090,268 | |
| Due to related parties | | 1,973 | |
| Trustees' fees and expenses payable | | 15,426 | |
| Custodian and accounting fees payable | | 5,655 | |
| Accrued expenses and other liabilities | | 9,711 | |
| Total liabilities | | 53,169,259 | |
| Net assets | $ | 227,730,212 | |
| Net assets represented by | | | |
| Paid-in capital | $ | 186,453,399 | |
| Undistributed net investment income | | 12,953,446 | |
| Accumulated net realized gains on investments | | 30,404,806 | |
| Net unrealized losses on investments | | (2,081,439 | ) |
| Total net assets | $ | 227,730,212 | |
| Shares outstanding (unlimited number of shares authorized) | | | |
| Class I | | 26,789,084 | |
| Net asset value per share | | | |
| Class I | $ | 8.50 | |
Market Index Fund STATEMENT OF OPERATIONS |
Six Months Ended November 30, 2008 (unaudited) |
| Investment income | | | |
| Dividends | $ | 3,521,734 | |
| Securities lending | | 180,906 | |
| Income from affiliates | | 50,583 | |
| Interest | | 1,365 | |
| Total investment income | | 3,754,588 | |
| Expenses | | | |
| Advisory fee | | 466,984 | |
| Administrative services fee | | 145,933 | |
| Transfer agent fees | | 31 | |
| Trustees' fees and expenses | | 2,977 | |
| Printing and postage expenses | | 4,899 | |
| Custodian and accounting fees | | 36,620 | |
| Registration and filing fees | | 941 | |
| Professional fees | | 17,051 | |
| Other | | 7,727 | |
| Total expenses | | 683,163 | |
| Less: Expense reductions | | (632 | ) |
| Fee waivers and expense reimbursements | | (646,778 | ) |
| Net expenses | | 35,753 | |
| Net investment income | | 3,718,835 | |
| Net realized and unrealized gains or losses on investments | | | |
| Net realized losses on: | | | |
| Securities | | (3,941,556 | ) |
| Futures contracts | | (402,706 | ) |
| Net realized losses on investments | | (4,344,262 | ) |
| Net change in unrealized gains or losses on investments | | (122,782,636 | ) |
| Net realized and unrealized gains or losses on investments | | (127,126,898 | ) |
| Net decrease in net assets resulting from operations | $ | (123,408,063 | ) |
Market Index Fund STATEMENTS OF CHANGES IN NET ASSETS |
| Six Months Ended
November 30, 2008
(unaudited) | Year Ended
May 31, 2008 |
| Operations | | | | | | | | | | |
| Net investment income | | | $ | 3,718,835 | | | | $ | 9,425,929 | |
| Net realized gains or losses on investments | | | | (4,344,262 | ) | | | | 35,363,590 | |
| Net change in unrealized gains or losses on investments | | | | (122,782,636 | ) | | | | (82,016,910 | ) |
| Net decrease in net assets resulting from operations | | | | (123,408,063 | ) | | | | (37,227,391 | ) |
| Distributions to shareholders from | | | | | | | | | | |
| Net investment income | | | | 0 | | | | | (9,035,174 | ) |
| Net realized gains | | | | 0 | | | | | (7,122,511 | ) |
| Total distributions to shareholders | | | | 0 | | | | | (16,157,685 | ) |
| Shares | | | | | Shares | | | | |
| Capital share transactions | | | | | | | | | | |
| Net asset value of shares issued in reinvestment of distributions | 0 | | | 0 | | 1,172,071 | | | 16,157,685 | |
| Payment for shares redeemed | 0 | | | 0 | | (12,945,583 | ) | | (170,000,000 | ) |
| Net increase (decrease) in net assets resulting from capital share transactions | | | | 0 | | | | | (153,842,315 | ) |
| Total decrease in net assets | | | | (123,408,063 | ) | | | | (207,227,391 | ) |
| Net assets | | | | | | | | | | |
| Beginning of period | | | | 351,138,275 | | | | | 558,365,666 | |
| End of period | | | $ | 227,730,212 | | | | $ | 351,138,275 | |
| Undistributed net investment income | | | $ | 12,953,446 | | | | $ | 9,234,611 | |
Market Index Growth Fund FUND AT A GLANCE |
Management Team
| Investment Advisor: |
| Evergreen Investment Management Company, LLC |
|
| Portfolio Manager: |
| William E. Zieff |
CURRENT INVESTMENT STYLE
| Source: Morningstar, Inc. Morningstar's style box is based on a portfolio date as of 9/30/2008. The Equity style box placement is based on 10 growth and valuation measures for each fund holding and the median size of the companies in which the fund invests. |
PERFORMANCE AND RETURNS
| Portfolio inception date: 10/15/2002 |
| Class I |
| Class inception date | 10/15/2002 |
| 6-month return | -38.24 | % |
| Average annual return |
| 1-year | -39.70 | % |
| 5-year | -3.10 | % |
| Since portfolio inception | 0.71 | % |
| Past performance is no guarantee of future results. The performance quoted represents past performance and current performance may be lower or higher. The investment return and principal value of an investment will fluctuate so that investors' shares, when redeemed, may be worth more or less than their original cost. Performance includes the reinvestment of income dividends and capital gain distributions. |
| The advisor is waiving its advisory fee and reimbursing the fund for a portion of other expenses. Had the fee not been waived and expenses not reimbursed, returns would have been lower. |
| The fund is only offered to certain pension plans having at least $100 million. Class I shares are sold without a front-end or deferred sales charge. The minimum initial investment for the fund is $100 million, which may be waived in certain situations. There is no minimum amount required for subsequent purchases. |
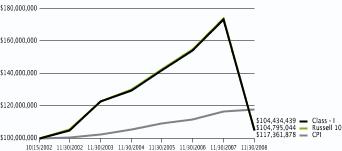
LONG-TERM GROWTH
| Comparison of a $100,000,000 investment in the Evergreen Market Index Growth Fund Class I shares versus a similar investment in the Russell 1000 Growth Index (Russell 1000 Growth) and the Consumer Price Index (CPI). |
The Russell 1000 Growth is an unmanaged market index and does not include transaction costs associated with buying and selling securities, any mutual fund fees or expenses or any taxes. . The CPI is a commonly used measure of inflation and does not represent an investment return. It is not possible to invest directly in an index. |
| The Fund's investment objective may be charged without a vote of the fund's shareholders. |
| "Russell 1000 Growth Index" is a trademark and service mark of Frank Russell Company (FRC) and has been licensed for use by Evergreen Investments. The product is not sponsored, endorsed, sold or promoted by FRC and FRC makes no representation regarding the advisability of investing in the product. |
| All data is as of November 30, 2008, and subject to change. |
Market Index Growth Fund ABOUT YOUR FUND'S EXPENSES |
The Example below is intended to describe the fees and expenses borne by shareholders and the impact of those costs on your investment.
Example
As a shareholder of the fund, you incur two types of costs: (1) transaction costs, including sales charges (loads), redemption fees and exchange fees; and (2) ongoing costs, including management fees, distribution (12b-1) fees and other fund expenses. This Example is intended to help you understand your ongoing costs (in dollars) of investing in the fund and to compare these costs with the ongoing costs of investing in other mutual funds. The Example is based on an investment of $1,000 invested at the beginning of the period and held for the entire period from June 1, 2008 to November 30, 2008.
The example illustrates your fund's costs in two ways:
- Actual expenses
The section in the table under the heading "Actual" provides information about actual account values and actual expenses. You may use the information in these columns, together with the amount you invested, to estimate the expenses that you paid over the period. Simply divide your account value by $1,000 (for example, an $8,600 account value divided by $1,000 = 8.6), then multiply the result by the number in the appropriate column for your share class, in the column entitled "Expenses Paid During Period" to estimate the expenses you paid on your account during this period. - Hypothetical example for comparison purposes
The section in the table under the heading "Hypothetical (5% return before expenses)" provides information about hypothetical account values and hypothetical expenses based on the fund's actual expense ratio and an assumed rate of return of 5% per year before expenses, which is not the fund's actual return. The hypothetical account values and expenses may not be used to estimate the actual ending account balance or expenses you paid for the period. You may use this information to compare the ongoing costs of investing in the fund and other funds. To do so, compare this 5% hypothetical example with the 5% hypothetical examples that appear in the shareholder reports of the other funds.
Please note that the expenses shown in the table are meant to highlight your ongoing costs only and do not reflect any transactional costs, such as sales charges (loads), redemption fees or exchange fees. Therefore, the section in the table under the heading "Hypothetical (5% return before expenses)" is useful in comparing ongoing costs only, and will not help you determine the relative total costs of owning different funds. In addition, if these transactional costs were included, your costs would havebeen higher.
| Beginning
Account Value
6/1/2008 | Ending
Account Value
11/30/2008 | Expenses Paid
During Period* |
| Actual | | | | | | |
| Class I | $1,000.00 | | $617.59 | | $0.12 | |
| Hypothetical (5% return before expenses) | | | | | | |
| Class I | $1,000.00 | | $1,024.92 | | $0.15 | |
| *Expenses are equal to the fund's annualized expense ratio (0.03% for Class I), multiplied by the average account value over the period, multiplied by 183/365 days. |
Market Index Growth Fund FINANCIAL HIGHLIGHTS |
(For a share outstanding throughout each period) |
| | Six Months Ended November 30, 2008 | | Year Ended May 31, |
| Class I | (unaudited) | 2008 | 2007 | 2006 | 2005 | 2004 |
| Net asset value, beginning of period | $ | 15.01 | | $ | 15.36 | | $ | 13.44 | | $ | 12.99 | | $ | 12.77 | | $ | 10.86 | |
| Income from investment operations | | | | | | | | | | | | | | | | | | |
| Net investment income (loss) | | 0.11 | | | 0.22 | | | 0.14 | | | 0.18 | | | 0.15 | | | 0.12 | |
| Net realized and unrealized gains or losses on investments | | (5.85 | ) | | (0.23 | ) | | 2.53 | | | 0.62 | | | 0.27 | | | 1.83 | |
| Total from investment operations | | (5.74 | ) | | (0.01 | ) | | 2.67 | | | 0.80 | | | 0.42 | | | 1.95 | |
| Distributions to shareholders from | | | | | | | | | | | | | | | | | | |
| Net investment income | | 0 | | | (0.17 | ) | | (0.16 | ) | | (0.15 | ) | | (0.12 | ) | | (0.04 | ) |
| Net realized gains | | 0 | | | (0.17 | ) | | (0.59 | ) | | (0.20 | ) | | (0.08 | ) | | 0 | |
| Total distributions to shareholders | | 0 | | | (0.34 | ) | | (0.75 | ) | | (0.35 | ) | | (0.20 | ) | | (0.04 | ) |
| Net asset value, end of period | $ | 9.27 | | $ | 15.01 | | $ | 15.36 | | $ | 13.44 | | $ | 12.99 | | $ | 12.77 | |
| Total return | | (38.24 | )% | | (0.14 | )% | | 20.34 | % | | 6.11 | % | | 3.28 | % | | 17.97 | % |
| Ratios and supplemental data | | | | | | | | | | | | | | | | | | |
| Net assets, end of period (thousands) | $ | 432,533 | | $ | 729,526 | | $ | 945,116 | | $ | 721,771 | | $ | 854,566 | | $ | 678,560 | |
| Ratios to average net assets | | | | | | | | | | | | | | | | | | |
| Expenses including waivers/reimbursements but excluding expense reductions | | 0.03 | %1 | | 0.03 | % | | 0.03 | % | | 0.03 | % | | 0.03 | % | | 0.02 | % |
| Expenses excluding waivers/reimbursements and expense reductions | | 0.46 | %1 | | 0.46 | % | | 0.46 | % | | 0.46 | % | | 0.46 | % | | 0.45 | % |
| Net investment income (loss) | | 1.56 | %1 | | 1.21 | % | | 1.23 | % | | 1.12 | % | | 1.45 | % | | 1.03 | % |
| Portfolio turnover rate | | 20 | % | | 24 | % | | 18 | % | | 25 | % | | 15 | % | | 9 | % |
See Combined Notes to Financial Statements
Market Index Growth Fund SCHEDULE OF INVESTMENTS |
November 30, 2008 (unaudited) |
| | Shares | | | Value | |
| COMMON STOCKS 98.8% | | | | | | |
| CONSUMER DISCRETIONARY 9.1% | | | | | | |
| Auto Components 0.2% | | | | | | |
| BorgWarner, Inc. Þ | | 9,910 | | $ | 234,471 | |
| Gentex Corp. Þ | | 13,962 | | | 122,447 | |
| Goodyear Tire & Rubber Co. * | | 15,124 | | | 97,247 | |
| Johnson Controls, Inc. | | 8,819 | | | 155,743 | |
| Wabco Holdings, Inc. | | 6,413 | | | 95,297 | |
| | | | | 705,205 | |
| Automobiles 0.1% | | | | | | |
| Harley-Davidson, Inc. Þ | | 20,538 | | | 349,351 | |
| Thor Industries, Inc. Þ | | 1,028 | | | 16,078 | |
| | | | | 365,429 | |
| Distributors 0.0% | | | | | | |
| LKQ Corp. Þ * | | 13,245 | | | 138,013 | |
| | | | | | |
| Diversified Consumer Services 0.7% | | | | | | |
| Apollo Group, Inc., Class A * | | 12,460 | | | 957,426 | |
| Brink's Home Security Holdings, Inc. * | | 3,967 | | | 79,340 | |
| DeVry, Inc. Þ | | 5,990 | | | 344,305 | |
| H&R Block, Inc. Þ | | 31,812 | | | 608,564 | |
| Hillenbrand, Inc. | | 6,104 | | | 97,176 | |
| ITT Educational Services, Inc. Þ * | | 3,796 | | | 341,944 | |
| Strayer Education, Inc. Þ | | 1,390 | | | 333,058 | |
| Weight Watchers International, Inc. | | 2,995 | | | 84,758 | |
| | | | | 2,846,571 | |
| Hotels, Restaurants & Leisure 2.5% | | | | | | |
| Boyd Gaming Corp. Þ | | 678 | | | 2,983 | |
| Brinker International, Inc. | | 9,900 | | | 65,736 | |
| Burger King Holdings, Inc. Þ | | 7,842 | | | 168,681 | |
| Carnival Corp. | | 8,699 | | | 182,679 | |
| Chipotle Mexican Grill, Inc., Class A Þ * | | 3,224 | | | 159,846 | |
| Choice Hotels International, Inc. Þ | | 1,027 | | | 25,788 | |
| Darden Restaurants, Inc. | | 13,693 | | | 250,445 | |
| International Game Technology | | 30,270 | | | 324,192 | |
| Interval Leisure Group, Inc. * | | 465 | | | 2,464 | |
| Las Vegas Sands Corp. Þ * | | 10,321 | | | 53,360 | |
| Marriott International, Inc., Class A | | 28,897 | | | 485,181 | |
| McDonald's Corp. | | 100,520 | | | 5,905,550 | |
| MGM MIRAGE Þ * | | 11,413 | | | 136,728 | |
| Orient Express Hotels, Ltd. Þ | | 3,526 | | | 24,153 | |
| Panera Bread Co., Class A Þ * | | 2,593 | | | 115,233 | |
| Penn National Gaming, Inc. Þ | | 7,251 | | | 153,721 | |
| Scientific Games Corp., Class A * Þ | | 6,311 | | | 94,728 | |
| Starbucks Corp. * | | 71,178 | | | 635,619 | |
| Starwood Hotels & Resorts Worldwide, Inc. Þ | | 18,253 | | | 307,746 | |
| Tim Hortons, Inc. Þ | | 18,059 | | | 449,488 | |
| Wynn Resorts, Ltd. Þ | | 5,589 | | | 222,554 | |
| Yum! Brands, Inc. | | 46,317 | | | 1,247,780 | |
| | | | | 11,014,655 | |
| | | | | | |
| | Shares | | | Value | |
| COMMON STOCKS continued | | | | | | |
| CONSUMER DISCRETIONARY continued | | | | | | |
| Household Durables 0.1% | | | | | | |
| Garmin, Ltd. Þ * | | 12,525 | | $ | 213,927 | |
| Harman International Industries, Inc. | | 4,244 | | | 63,872 | |
| NVR, Inc. * Þ | | 32 | | | 13,896 | |
| Pulte Homes, Inc. Þ | | 4,837 | | | 51,514 | |
| | | | | 343,209 | |
| Internet & Catalog Retail 0.4% | | | | | | |
| Amazon.com, Inc. * Þ | | 30,791 | | | 1,314,776 | |
| HSN, Inc. * Þ | | 465 | | | 1,739 | |
| IAC/InteractiveCorp. Þ | | 1,163 | | | 17,201 | |
| priceline.com, Inc. * Þ | | 3,766 | | | 259,854 | |
| Ticketmaster Entertainment, Inc. * | | 465 | | | 1,855 | |
| | | | | 1,595,425 | |
| Leisure Equipment & Products 0.0% | | | | | | |
| Hasbro, Inc. Þ | | 5,049 | | | 135,313 | |
| | | | | | |
| Media 1.9% | | | | | | |
| Central European Media Enterprises, Ltd., Class A * Þ | | 3,521 | | | 54,118 | |
| Clear Channel Outdoor Holdings, Inc. Þ * | | 3,092 | | | 22,633 | |
| Comcast Corp., Class A | | 80,052 | | | 1,388,102 | |
| CTC Media, Inc. Þ * | | 5,147 | | | 21,875 | |
| DIRECTV Group, Inc. Þ * | | 58,256 | | | 1,282,215 | |
| DISH Network Corp., Class A Þ | | 19,942 | | | 220,957 | |
| DreamWorks Animation SKG, Inc., Class A * | | 7,812 | | | 180,457 | |
| Interpublic Group of Cos. Þ * | | 39,498 | | | 161,547 | |
| John Wiley & Sons, Inc., Class A Þ | | 3,938 | | | 141,610 | |
| Lamar Advertising Co., Class A Þ * | | 7,523 | | | 111,867 | |
| Liberty Global, Inc., Class A Þ * | | 15,331 | | | 222,146 | |
| Liberty Media Corp. - Liberty Entertainment, Ser. A * | | 50,516 | | | 599,625 | |
| McGraw-Hill Cos. Þ | | 15,644 | | | 391,100 | |
| Morningstar, Inc. * Þ | | 1,578 | | | 50,812 | |
| News Corp., Class A | | 90,578 | | | 715,566 | |
| Omnicom Group, Inc. | | 28,968 | | | 819,505 | |
| Sirius XM Radio, Inc. * Þ | | 290,284 | | | 60,466 | |
| Time Warner Cable, Inc. * | | 7,563 | | | 153,529 | |
| Time Warner, Inc. Þ | | 38,834 | | | 351,448 | |
| Viacom, Inc., Class B * | | 51,355 | | | 817,572 | |
| Walt Disney Co. Þ | | 21,608 | | | 486,612 | |
| Warner Music Group Corp. Þ | | 1,378 | | | 4,106 | |
| | | | | 8,257,868 | |
| Multiline Retail 0.9% | | | | | | |
| Big Lots, Inc. * Þ | | 7,956 | | | 139,389 | |
| Dollar Tree Stores, Inc. Þ * | | 8,798 | | | 372,683 | |
| Family Dollar Stores, Inc. Þ | | 1,065 | | | 29,586 | |
| Kohl's Corp. Þ * | | 23,015 | | | 751,670 | |
| Nordstrom, Inc. Þ | | 17,792 | | | 202,295 | |
| Target Corp. Þ | | 71,397 | | | 2,410,363 | |
| | | | | 3,905,986 | |
| | | | | | |
| | Shares | | | Value | |
| COMMON STOCKS continued | | | | | | |
| CONSUMER DISCRETIONARY continued | | | | | | |
| Specialty Retail 1.6% | | | | | | |
| Abercrombie & Fitch Co., Class A Þ | | 8,452 | | $ | 163,377 | |
| Advance Auto Parts, Inc. | | 9,316 | | | 282,834 | |
| American Eagle Outfitters, Inc. | | 11,829 | | | 113,558 | |
| AnnTaylor Stores Corp. * | | 2,130 | | | 9,564 | |
| AutoZone, Inc. * Þ | | 3,788 | | | 413,725 | |
| Bed Bath & Beyond, Inc. * Þ | | 20,835 | | | 422,742 | |
| Best Buy Co., Inc. Þ | | 32,653 | | | 676,244 | |
| CarMax, Inc. Þ * | | 21,381 | | | 162,710 | |
| Dick's Sporting Goods, Inc. * Þ | | 8,257 | | | 104,121 | |
| GameStop Corp., Class A Þ * | | 15,962 | | | 348,770 | |
| Gap, Inc. | | 23,512 | | | 306,126 | |
| Guess?, Inc. | | 5,897 | | | 78,017 | |
| Limited Brands, Inc. Þ | | 18,214 | | | 169,572 | |
| Lowe's Cos. | | 7,147 | | | 147,657 | |
| O'Reilly Automotive, Inc. * Þ | | 4,781 | | | 124,641 | |
| PETsMART, Inc. | | 12,448 | | | 218,462 | |
| Ross Stores, Inc. Þ | | 13,031 | | | 345,322 | |
| Sherwin-Williams Co. Þ | | 9,839 | | | 579,812 | |
| Staples, Inc. | | 58,350 | | | 1,012,956 | |
| Tiffany & Co. Þ | | 12,328 | | | 243,971 | |
| TJX Cos. | | 41,524 | | | 947,578 | |
| Urban Outfitters, Inc. * Þ | | 11,101 | | | 201,705 | |
| Williams-Sonoma, Inc. Þ | | 1,398 | | | 9,800 | |
| | | | | 7,083,264 | |
| Textiles, Apparel & Luxury Goods 0.7% | | | | | | |
| Coach, Inc. * | | 33,369 | | | 597,305 | |
| Hanesbrands, Inc. Þ * | | 9,197 | | | 118,825 | |
| Nike, Inc., Class B | | 34,588 | | | 1,841,811 | |
| Phillips-Van Heusen Corp. | | 4,400 | | | 76,736 | |
| Polo Ralph Lauren Corp. Þ | | 5,482 | | | 236,823 | |
| | | | | 2,871,500 | |
| CONSUMER STAPLES 14.5% | | | | | | |
| Beverages 3.8% | | | | | | |
| Brown-Forman Corp., Class B | | 7,518 | | | 329,965 | |
| Central European Distribution Corp. * | | 3,982 | | | 94,134 | |
| Coca-Cola Co. | | 160,109 | | | 7,504,309 | |
| Hansen Natural Corp. Þ * | | 7,077 | | | 210,541 | |
| PepsiCo, Inc. | | 145,770 | | | 8,265,159 | |
| | | | | 16,404,108 | |
| Food & Staples Retailing 4.3% | | | | | | |
| Costco Wholesale Corp. | | 42,360 | | | 2,180,269 | |
| CVS Caremark Corp. | | 75,467 | | | 2,183,260 | |
| Kroger Co. | | 28,544 | | | 789,527 | |
| Sysco Corp. | | 58,725 | | | 1,377,101 | |
| Wal-Mart Stores, Inc. | | 177,028 | | | 9,892,325 | |
| Walgreen Co. Þ | | 89,479 | | | 2,213,711 | |
| Whole Foods Market, Inc. Þ | | 13,708 | | | 145,031 | |
| | | | | 18,781,224 | |
| | | | | | |
| | Shares | | | Value | |
| COMMON STOCKS continued | | | | | | |
| CONSUMER STAPLES continued | | | | | | |
| Food Products 0.6% | | | | | | |
| Campbell Soup Co. Þ | | 10,649 | | $ | 341,300 | |
| Dean Foods Co. * | | 10,333 | | | 150,449 | |
| General Mills, Inc. | | 2,784 | | | 175,865 | |
| H.J. Heinz Co. | | 17,101 | | | 664,203 | |
| Hershey Co. Þ | | 7,574 | | | 272,664 | |
| J.M. Smucker Co. | | 2,287 | | | 103,761 | |
| Kellogg Co. | | 13,958 | | | 606,196 | |
| McCormick & Co., Inc. | | 4,116 | | | 122,533 | |
| Tyson Foods, Inc., Class A | | 3,194 | | | 21,432 | |
| | | | | 2,458,403 | |
| Household Products 2.8% | | | | | | |
| Church & Dwight Co. Þ | | 6,500 | | | 386,360 | |
| Clorox Co. Þ | | 4,164 | | | 246,342 | |
| Colgate-Palmolive Co. | | 49,649 | | | 3,230,661 | |
| Energizer Holdings, Inc. Þ * | | 5,621 | | | 244,064 | |
| Kimberly-Clark Corp. | | 16,814 | | | 971,681 | |
| Procter & Gamble Co. Þ | | 109,340 | | | 7,036,029 | |
| | | | | 12,115,137 | |
| Personal Products 0.3% | | | | | | |
| Alberto-Culver Co. | | 1,105 | | | 23,724 | |
| Avon Products, Inc. | | 41,725 | | | 880,397 | |
| Bare Escentuals, Inc. * Þ | | 5,930 | | | 27,990 | |
| Estee Lauder Cos., Class A Þ | | 9,572 | | | 267,059 | |
| Herbalife, Ltd. Þ | | 6,366 | | | 113,187 | |
| NBTY, Inc. * | | 2,559 | | | 37,285 | |
| | | | | 1,349,642 | |
| Tobacco 2.7% | | | | | | |
| Altria Group, Inc. | | 153,165 | | | 2,462,893 | |
| Lorillard, Inc. Þ | | 8,911 | | | 538,492 | |
| Philip Morris International, Inc. | | 206,231 | | | 8,694,699 | |
| | | | | 11,696,084 | |
| ENERGY 9.3% | | | | | | |
| Energy Equipment & Services 3.9% | | | | | | |
| Atwood Oceanics, Inc. * | | 5,464 | | | 98,898 | |
| Baker Hughes, Inc. | | 30,116 | | | 1,048,940 | |
| Cameron International Corp. Þ * | | 21,184 | | | 446,982 | |
| Diamond Offshore Drilling, Inc. Þ | | 6,724 | | | 496,231 | |
| Dresser-Rand Group, Inc. * | | 8,409 | | | 140,514 | |
| ENSCO International, Inc. | | 13,167 | | | 426,742 | |
| FMC Technologies, Inc. | | 12,520 | | | 343,924 | |
| Global Industries, Ltd. Þ * | | 7,191 | | | 21,213 | |
| Halliburton Co. | | 85,293 | | | 1,501,157 | |
| Key Energy Services, Inc. * | | 2,046 | | | 9,719 | |
| Nabors Industries, Ltd. * Þ | | 3,881 | | | 56,275 | |
| National Oilwell Varco, Inc. * | | 40,592 | | | 1,148,348 | |
| Noble Corp. Þ | | 26,277 | | | 703,961 | |
| Oceaneering International, Inc. * | | 5,389 | | | 139,144 | |
| Oil States International, Inc. * | | 3,212 | | | 68,801 | |
| | Shares | | | Value | |
| COMMON STOCKS continued | | | | | | |
| ENERGY continued | | | | | | |
| Energy Equipment & Services continued | | | | | | |
| Patterson-UTI Energy, Inc. | | 9,331 | | $ | 116,544 | |
| Pride International, Inc. * | | 11,761 | | | 190,646 | |
| Rowan Companies, Inc. | | 3,853 | | | 66,850 | |
| Schlumberger, Ltd. Þ | | 116,650 | | | 5,918,821 | |
| SEACOR Holdings, Inc. * Þ | | 236 | | | 15,607 | |
| Smith International, Inc. | | 21,094 | | | 616,789 | |
| Superior Energy Services, Inc. * | | 7,894 | | | 133,014 | |
| Tetra Technologies, Inc. * | | 7,292 | | | 35,147 | |
| Tidewater, Inc. Þ | | 266 | | | 10,502 | |
| Transocean, Inc. | | 31,177 | | | 2,085,118 | |
| Unit Corp. * | | 3,518 | | | 100,896 | |
| Weatherford International, Ltd. * | | 66,444 | | | 848,490 | |
| | | | | 16,789,273 | |
| Oil, Gas & Consumable Fuels 5.4% | | | | | | |
| Alpha Natural Resources, Inc. * | | 6,874 | | | 152,534 | |
| Arch Coal, Inc. | | 14,092 | | | 216,735 | |
| Cabot Oil & Gas Corp. | | 4,588 | | | 137,502 | |
| Chesapeake Energy Corp. | | 22,584 | | | 387,993 | |
| CNX Gas Corp. Þ * | | 2,700 | | | 83,889 | |
| Consol Energy, Inc. | | 17,870 | | | 517,694 | |
| Continental Resources, Inc. Þ * | | 2,909 | | | 56,871 | |
| Denbury Resources, Inc. * | | 24,051 | | | 229,206 | |
| El Paso Corp. Þ | | 14,695 | | | 108,596 | |
| Encore Aquisition Co. * | | 1,313 | | | 34,716 | |
| EOG Resources, Inc. | | 18,257 | | | 1,552,210 | |
| Exxon Mobil Corp. | | 95,570 | | | 7,659,936 | |
| Foundation Coal Holdings, Inc. | | 4,435 | | | 63,287 | |
| Frontier Oil Corp. | | 10,163 | | | 121,346 | |
| Frontline, Ltd. Þ | | 4,763 | | | 140,699 | |
| Helix Energy Solutions, Inc. Þ * | | 771 | | | 4,958 | |
| Hess Corp. | | 27,503 | | | 1,486,262 | |
| Holly Corp. Þ | | 4,174 | | | 75,925 | |
| Mariner Energy, Inc. * | | 6,266 | | | 68,863 | |
| Massey Energy Co. | | 7,878 | | | 123,054 | |
| Murphy Oil Corp. Þ | | 18,575 | | | 818,229 | |
| Noble Energy, Inc. | | 1,078 | | | 56,358 | |
| Occidental Petroleum Corp. | | 80,244 | | | 4,344,410 | |
| Patriot Coal Corp. * Þ | | 7,566 | | | 64,084 | |
| Peabody Energy Corp. | | 26,546 | | | 621,973 | |
| Petrohawk Energy Corp. * Þ | | 23,140 | | | 404,256 | |
| Plains Exploration & Production Co. * | | 9,586 | | | 221,916 | |
| Quicksilver Resources, Inc. * Þ | | 10,124 | | | 63,073 | |
| Range Resources Corp. | | 15,088 | | | 625,699 | |
| SandRidge Energy, Inc. Þ * | | 10,180 | | | 90,195 | |
| Southwestern Energy Co. * | | 33,434 | | | 1,149,127 | |
| St. Mary Land & Exploration Co. Þ | | 2,484 | | | 49,953 | |
| Sunoco, Inc. Þ | | 6,787 | | | 269,715 | |
| Tesoro Corp. Þ | | 3,918 | | | 36,006 | |
| W&T Offshore, Inc. Þ | | 2,949 | | | 41,286 | |
| | Shares | | | Value | |
| COMMON STOCKS continued | | | | | | |
| ENERGY continued | | | | | | |
| Oil, Gas & Consumable Fuels continued | | | | | | |
| Walter Industries, Inc. | | 5,450 | | $ | 99,408 | |
| Whiting Petroleum Corp. * | | 4,138 | | | 158,485 | |
| Williams Cos. Þ | | 57,139 | | | 926,795 | |
| XTO Energy, Inc. | | 5,896 | | | 225,463 | |
| | | | | 23,488,707 | |
| FINANCIALS 4.5% | | | | | | |
| Capital Markets 1.5% | | | | | | |
| Affiliated Managers Group, Inc. * Þ | | 4,002 | | | 112,056 | |
| BlackRock, Inc. Þ | | 1,243 | | | 156,258 | |
| Charles Schwab Corp. Þ | | 91,354 | | | 1,674,519 | |
| E*TRADE Financial Corp. Þ * | | 7,277 | | | 9,824 | |
| Eaton Vance Corp. Þ | | 10,018 | | | 191,544 | |
| Federated Investors, Inc., Class B | | 8,532 | | | 169,360 | |
| Franklin Resources, Inc. Þ | | 8,016 | | | 486,972 | |
| GLG Partners, Inc. Þ | | 4,798 | | | 12,187 | |
| Goldman Sachs Group, Inc. | | 4,085 | | | 322,674 | |
| INVESCO, Ltd. Þ | | 4,776 | | | 59,939 | |
| Investment Technology Group, Inc. * | | 3,912 | | | 65,448 | |
| Janus Capital Group, Inc. Þ | | 14,802 | | | 120,636 | |
| Lazard, Ltd. Þ | | 7,392 | | | 231,074 | |
| MF Global, Ltd. * Þ | | 4,390 | | | 11,502 | |
| Morgan Stanley | | 6,387 | | | 94,208 | |
| Northern Trust Corp. | | 19,435 | | | 891,872 | |
| SEI Investments Co. | | 13,166 | | | 203,546 | |
| State Street Corp. | | 11,013 | | | 463,757 | |
| T. Rowe Price Group, Inc. Þ | | 25,391 | | | 868,626 | |
| TD Ameritrade Holding Corp. * | | 23,769 | | | 316,128 | |
| Waddell & Reed Financial, Inc., Class A | | 8,475 | | | 113,904 | |
| | | | | 6,576,034 | |
| Consumer Finance 1.3% | | | | | | |
| American Express Co. Þ | | 82,577 | | | 1,924,870 | |
| MasterCard, Inc., Class A Þ | | 7,106 | | | 1,032,502 | |
| SLM Corp. * Þ | | 40,440 | | | 372,452 | |
| Visa, Inc., Class A Þ | | 43,769 | | | 2,300,499 | |
| | | | | 5,630,323 | |
| Diversified Financial Services 0.4% | | | | | | |
| CME Group, Inc., Class A Þ | | 4,622 | | | 979,633 | |
| IntercontinentalExchange, Inc. * Þ | | 6,900 | | | 507,840 | |
| MSCI, Inc., Class A * | | 4,303 | | | 66,395 | |
| NASDAQ OMX Group, Inc. * Þ | | 7,203 | | | 154,865 | |
| NYSE Euronext Þ | | 15,598 | | | 371,388 | |
| | | | | 2,080,121 | |
| Insurance 0.6% | | | | | | |
| AFLAC, Inc. | | 46,475 | | | 2,151,792 | |
| Axis Capital Holdings, Ltd. | | 3,389 | | | 85,776 | |
| Brown & Brown, Inc. | | 2,692 | | | 53,571 | |
| Erie Indemnity Co., Class A | | 250 | | | 9,360 | |
| Philadelphia Consolidated Holding Co. * | | 1,958 | | | 120,319 | |
| | Shares | | | Value | |
| COMMON STOCKS continued | | | | | | |
| FINANCIALS continued | | | | | | |
| Insurance continued | | | | | | |
| Prudential Financial, Inc. | | 7,295 | | $ | 158,302 | |
| TransAtlantic Holdings, Inc. | | 633 | | | 25,092 | |
| W.R. Berkley Corp. | | 715 | | | 20,327 | |
| | | | | 2,624,539 | |
| Real Estate Investment Trusts (REITs) 0.5% | | | | | | |
| Apartment Investment & Management Co., Class A Þ | | 2,720 | | | 31,198 | |
| Camden Property Trust Þ | | 3,289 | | | 87,060 | |
| Digital Realty Trust, Inc. Þ | | 4,782 | | | 130,836 | |
| Essex Property Trust, Inc. Þ | | 542 | | | 46,867 | |
| Federal Realty Investment Trust Þ | | 1,690 | | | 97,750 | |
| General Growth Properties, Inc. Þ | | 11,688 | | | 16,129 | |
| HCP, Inc. | | 2,903 | | | 60,005 | |
| Health Care REIT, Inc. Þ | | 1,124 | | | 42,712 | |
| Kilroy Realty Corp. Þ | | 285 | | | 8,684 | |
| Macerich Co. Þ | | 7,308 | | | 98,366 | |
| Nationwide Health Properties, Inc. | | 867 | | | 19,620 | |
| Plum Creek Timber Co., Inc. Þ | | 5,454 | | | 194,108 | |
| Rayonier, Inc. Þ | | 943 | | | 31,496 | |
| Simon Property Group, Inc. Þ | | 21,975 | | | 1,043,812 | |
| Taubman Centers, Inc. Þ | | 5,164 | | | 123,110 | |
| Ventas, Inc. Þ | | 2,231 | | | 51,268 | |
| | | | | 2,083,021 | |
| Real Estate Management & Development 0.1% | | | | | | |
| CB Richard Ellis Group, Inc., Class A Þ * | | 5,840 | | | 26,630 | |
| Forest City Enterprises, Inc., Class A Þ | | 7,257 | | | 43,252 | |
| St. Joe Co. * Þ | | 7,594 | | | 200,558 | |
| | | | | 270,440 | |
| Thrifts & Mortgage Finance 0.1% | | | | | | |
| Capitol Federal Financial | | 770 | | | 32,933 | |
| Freddie Mac Þ | | 57,983 | | | 68,420 | |
| Hudson City Bancorp, Inc. Þ | | 17,612 | | | 294,296 | |
| Tree.com, Inc. * Þ | | 77 | | | 141 | |
| | | | | 395,790 | |
| HEALTH CARE 14.8% | | | | | | |
| Biotechnology 3.2% | | | | | | |
| Abraxis BioScience, Inc. * | | 673 | | | 39,243 | |
| Amylin Pharmaceuticals, Inc. * Þ | | 13,402 | | | 99,309 | |
| Biogen Idec, Inc. * | | 28,383 | | | 1,200,885 | |
| BioMarin Pharmaceutical, Inc. Þ * | | 9,635 | | | 164,084 | |
| Celgene Corp. * | | 42,615 | | | 2,220,241 | |
| Cephalon, Inc. Þ * | | 6,623 | | | 486,658 | |
| Gen-Probe, Inc. * | | 5,280 | | | 194,568 | |
| Genentech, Inc. * | | 45,414 | | | 3,478,712 | |
| Genzyme Corp. * | | 26,136 | | | 1,673,227 | |
| Gilead Sciences, Inc. Þ * | | 90,191 | | | 4,039,655 | |
| Vertex Pharmaceuticals, Inc. Þ * | | 14,641 | | | 360,022 | |
| | | | | 13,956,604 | |
| | Shares | | | Value | |
| COMMON STOCKS continued | | | | | | |
| HEALTH CARE continued | | | | | | |
| Health Care Equipment & Supplies 3.3% | | | | | | |
| Advanced Medical Optics, Inc. Þ * | | 4,357 | | $ | 25,314 | |
| Baxter International, Inc. | | 61,340 | | | 3,244,886 | |
| Beckman Coulter, Inc. | | 4,967 | | | 216,462 | |
| Becton, Dickinson & Co. | | 23,863 | | | 1,516,016 | |
| Boston Scientific Corp. * | | 9,509 | | | 58,671 | |
| C.R. Bard, Inc. | | 9,706 | | | 796,183 | |
| Dentsply International, Inc. Þ | | 14,552 | | | 379,516 | |
| Edwards Lifesciences Corp. * Þ | | 5,363 | | | 266,917 | |
| Hill-Rom Holdings, Inc. Þ | | 829 | | | 17,028 | |
| Hologic, Inc. Þ * | | 12,508 | | | 175,862 | |
| Hospira, Inc. * | | 2,240 | | | 67,267 | |
| IDEXX Laboratories, Inc. Þ * | | 5,896 | | | 182,245 | |
| Intuitive Surgical, Inc. * Þ | | 3,784 | | | 501,494 | |
| Inverness Medical Innovations, Inc. * | | 3,838 | | | 67,434 | |
| Kinetic Concepts, Inc. Þ * | | 5,527 | | | 119,604 | |
| Medtronic, Inc. | | 109,800 | | | 3,351,096 | |
| ResMed, Inc. * | | 7,554 | | | 274,512 | |
| St. Jude Medical, Inc. * | | 33,205 | | | 930,736 | |
| Stryker Corp. Þ | | 30,076 | | | 1,170,558 | |
| Varian Medical Systems, Inc. * Þ | | 12,282 | | | 495,702 | |
| Zimmer Holdings, Inc. * | | 15,210 | | | 567,637 | |
| | | | | 14,425,140 | |
| Health Care Providers & Services 2.3% | | | | | | |
| Aetna, Inc. | | 30,478 | | | 665,030 | |
| AmerisourceBergen Corp. | | 1,921 | | | 60,223 | |
| Cardinal Health, Inc. | | 26,099 | | | 848,739 | |
| CIGNA Corp. | | 3,816 | | | 46,212 | |
| Community Health Systems, Inc. * | | 2,117 | | | 27,648 | |
| Coventry Health Care, Inc. * | | 3,025 | | | 37,722 | |
| DaVita, Inc. * | | 8,517 | | | 427,979 | |
| Express Scripts, Inc. Þ * | | 20,577 | | | 1,183,383 | |
| Health Management Associates, Inc., Class A Þ * | | 15,745 | | | 22,988 | |
| Health Net, Inc. * | | 566 | | | 5,100 | |
| Henry Schein, Inc. * | | 8,190 | | | 292,629 | |
| Humana, Inc. * | | 9,397 | | | 284,071 | |
| Laboratory Corp. of America Holdings Þ * | | 10,882 | | | 689,484 | |
| Lincare Holdings, Inc. Þ * | | 6,520 | | | 156,024 | |
| McKesson Corp. | | 19,465 | | | 680,107 | |
| Medco Health Solutions, Inc. * | | 49,537 | | | 2,080,554 | |
| Omnicare, Inc. Þ | | 760 | | | 18,324 | |
| Patterson Companies, Inc. * Þ | | 11,863 | | | 223,262 | |
| Pediatrix Medical Group, Inc. * | | 3,944 | | | 122,737 | |
| Quest Diagnostics, Inc. | | 12,699 | | | 591,392 | |
| Tenet Healthcare Corp. * Þ | | 26,514 | | | 32,082 | |
| UnitedHealth Group, Inc. | | 44,329 | | | 931,352 | |
| VCA Antech, Inc. * Þ | | 8,247 | | | 157,105 | |
| Wellcare Group, Inc. * Þ | | 4,078 | | | 36,539 | |
| WellPoint, Inc. * | | 4,990 | | | 177,644 | |
| | | | | 9,798,330 | |
| | | | | | |
| | Shares | | | Value | |
| COMMON STOCKS continued | | | | | | |
| HEALTH CARE continued | | | | | | |
| Health Care Technology 0.1% | | | | | | |
| Cerner Corp. * Þ | | 6,609 | | $ | 237,792 | |
| HLTH Corp. * | | 5,152 | | | 48,274 | |
| IMS Health, Inc. | | 3,865 | | | 50,824 | |
| WebMD Health Corp., Class A * Þ | | 760 | | | 14,577 | |
| | | | | 351,467 | |
| Life Sciences Tools & Services 0.6% | | | | | | |
| Charles River Laboratories International, Inc. Þ * | | 3,024 | | | 68,947 | |
| Covance, Inc. Þ * | | 6,146 | | | 240,186 | |
| Illumina, Inc. Þ * | | 11,992 | | | 263,944 | |
| Life Technologies Corp. Þ * | | 10,233 | | | 267,070 | |
| Millipore Corp. * Þ | | 5,386 | | | 272,855 | |
| PerkinElmer, Inc. | | 5,174 | | | 93,442 | |
| Pharmaceutical Product Development, Inc. | | 10,446 | | | 275,148 | |
| Techne Corp. | | 3,778 | | | 234,274 | |
| Thermo Fisher Scientific, Inc. * Þ | | 13,902 | | | 496,023 | |
| Waters Corp. * | | 9,787 | | | 403,518 | |
| | | | | 2,615,407 | |
| Pharmaceuticals 5.3% | | | | | | |
| Abbott Laboratories | | 150,891 | | | 7,905,179 | |
| Allergan, Inc. | | 29,820 | | | 1,123,618 | |
| Barr Pharmaceuticals, Inc. * | | 3,127 | | | 204,474 | |
| Bristol-Myers Squibb Co. | | 176,710 | | | 3,657,897 | |
| Eli Lilly & Co. | | 9,283 | | | 317,014 | |
| Endo Pharmaceuticals Holdings, Inc. * | | 10,662 | | | 234,457 | |
| Forest Laboratories, Inc. * | | 2,592 | | | 62,675 | |
| Fresenius Kabi Pharmaceuticals Holding, Inc. * | | 2,511 | | | 1,607 | |
| Johnson & Johnson | | 72,467 | | | 4,245,117 | |
| Merck & Co., Inc. | | 60,023 | | | 1,603,815 | |
| Mylan Laboratories, Inc. * Þ | | 5,477 | | | 51,539 | |
| Perrigo Co. Þ | | 7,616 | | | 262,067 | |
| Schering-Plough Corp. | | 158,528 | | | 2,664,856 | |
| Sepracor, Inc. * Þ | | 10,538 | | | 123,927 | |
| Warner Chilcott, Ltd., Class A Þ * | | 8,974 | | | 118,905 | |
| Watson Pharmaceuticals, Inc. * | | 5,044 | | | 119,795 | |
| | | | | 22,696,942 | |
| INDUSTRIALS 13.1% | | | | | | |
| Aerospace & Defense 3.2% | | | | | | |
| Alliant Techsystems, Inc. * Þ | | 1,397 | | | 114,833 | |
| BE Aerospace, Inc. * | | 9,013 | | | 73,726 | |
| Boeing Co. | | 73,471 | | | 3,132,069 | |
| Goodrich Corp. | | 12,229 | | | 411,506 | |
| Honeywell International, Inc. | | 72,500 | | | 2,019,850 | |
| L-3 Communications Holdings, Inc. | | 9,295 | | | 624,345 | |
| Lockheed Martin Corp. | | 32,151 | | | 2,479,164 | |
| Northrop Grumman Corp. | | 8,528 | | | 349,222 | |
| Precision Castparts Corp. | | 13,619 | | | 853,911 | |
| Raytheon Co. | | 15,013 | | | 732,634 | |
| | Shares | | | Value | |
| COMMON STOCKS continued | | | | | | |
| INDUSTRIALS continued | | | | | | |
| Aerospace & Defense continued | | | | | | |
| Rockwell Collins Corp. Þ | | 15,716 | | $ | 535,601 | |
| United Technologies Corp. | | 54,237 | | | 2,632,122 | |
| | | | | 13,958,983 | |
| Air Freight & Logistics 1.2% | | | | | | |
| C.H. Robinson Worldwide, Inc. Þ | | 16,674 | | | 851,708 | |
| Expeditors International of Washington, Inc. Þ | | 20,854 | | | 697,149 | |
| United Parcel Service, Inc., Class B Þ | | 66,873 | | | 3,851,885 | |
| UTi Worldwide, Inc. | | 8,796 | | | 94,293 | |
| | | | | 5,495,035 | |
| Airlines 0.1% | | | | | | |
| AMR Corp. * Þ | | 13,709 | | | 120,365 | |
| Copa Holdings SA, Class A | | 2,139 | | | 47,422 | |
| Delta Air Lines, Inc. * Þ | | 14,441 | | | 127,225 | |
| | | | | 295,012 | |
| Building Products 0.0% | | | | | | |
| Lennox International, Inc. | | 4,561 | | | 126,066 | |
| USG Corp. Þ * | | 3,624 | | | 34,247 | |
| | | | | 160,313 | |
| Commercial Services & Supplies 0.6% | | | | | | |
| Brink's Co. | | 3,967 | | | 86,362 | |
| Copart, Inc. * | | 6,180 | | | 164,821 | |
| Corrections Corporation of America * | | 10,831 | | | 195,933 | |
| Covanta Holding Corp. * Þ | | 11,793 | | | 235,270 | |
| IHS, Inc., Class A * | | 4,233 | | | 153,615 | |
| Pitney Bowes, Inc. | | 18,347 | | | 453,354 | |
| Republic Services, Inc. Þ | | 14,016 | | | 336,384 | |
| Stericycle, Inc. * | | 8,429 | | | 482,982 | |
| Waste Management, Inc. | | 13,625 | | | 397,850 | |
| | | | | 2,506,571 | |
| Construction & Engineering 0.6% | | | | | | |
| AECOM Technology Corp. * | | 8,859 | | | 234,675 | |
| Fluor Corp. | | 17,345 | | | 789,891 | |
| Foster Wheeler, Ltd. * | | 14,093 | | | 313,710 | |
| Jacobs Engineering Group, Inc. Þ * | | 11,909 | | | 533,166 | |
| KBR, Inc. Þ | | 13,463 | | | 185,386 | |
| Quanta Services, Inc. * | | 13,059 | | | 212,339 | |
| Shaw Group, Inc. * Þ | | 8,105 | | | 149,132 | |
| URS Corp. * | | 1,486 | | | 56,409 | |
| | | | | 2,474,708 | |
| Electrical Equipment 1.2% | | | | | | |
| Ametek, Inc. | | 10,431 | | | 364,355 | |
| Cooper Industries, Inc. | | 12,947 | | | 312,541 | |
| Emerson Electric Co. | | 76,337 | | | 2,739,735 | |
| First Solar, Inc. * Þ | | 4,367 | | | 545,176 | |
| General Cable Corp. Þ * | | 5,157 | | | 85,142 | |
| Hubbell, Inc., Class B | | 2,388 | | | 71,401 | |
| Rockwell Automation, Inc. | | 14,347 | | | 446,909 | |
| | Shares | | | Value | |
| COMMON STOCKS continued | | | | | | |
| INDUSTRIALS continued | | | | | | |
| Electrical Equipment continued | | | | | | |
| Roper Industries, Inc. Þ | | 8,741 | | $ | 400,076 | |
| SunPower Corp., Class A * Þ | | 8,050 | | | 279,576 | |
| | | | | 5,244,911 | |
| Industrial Conglomerates 1.3% | | | | | | |
| 3M Co. Þ | | 68,859 | | | 4,608,733 | |
| Carlisle Cos. Þ | | 650 | | | 13,800 | |
| McDermott International, Inc. * | | 22,142 | | | 215,884 | |
| Textron, Inc. | | 24,369 | | | 371,140 | |
| Tyco International, Ltd. | | 24,471 | | | 511,444 | |
| | | | | 5,721,001 | |
| Machinery 2.6% | | | | | | |
| AGCO Corp. * Þ | | 6,511 | | | 160,301 | |
| Bucyrus International, Inc. Þ | | 7,321 | | | 142,979 | |
| Caterpillar, Inc. | | 60,143 | | | 2,465,262 | |
| Cummins, Inc. | | 19,859 | | | 507,993 | |
| Danaher Corp. Þ | | 17,525 | | | 975,091 | |
| Deere & Co. | | 42,135 | | | 1,466,719 | |
| Donaldson Co., Inc. Þ | | 7,616 | | | 260,620 | |
| Dover Corp. | | 16,201 | | | 483,276 | |
| Eaton Corp. | | 7,274 | | | 337,077 | |
| Flowserve Corp. | | 2,552 | | | 128,442 | |
| Graco, Inc. Þ | | 5,922 | | | 127,086 | |
| Harsco Corp. | | 8,238 | | | 207,186 | |
| IDEX Corp. Þ | | 7,156 | | | 164,588 | |
| Illinois Tool Works, Inc. Þ | | 2,338 | | | 79,773 | |
| Ingersoll-Rand Co., Ltd., Class A | | 5,361 | | | 84,060 | |
| ITT Corp. | | 13,465 | | | 563,645 | |
| John Bean Technologies Corp. | | 2,704 | | | 23,606 | |
| Joy Global, Inc. Þ | | 10,584 | | | 246,501 | |
| Kennametal, Inc. | | 1,585 | | | 29,639 | |
| Lincoln Electric Holdings, Inc. Þ | | 2,849 | | | 130,171 | |
| Manitowoc Co. Þ | | 12,712 | | | 100,171 | |
| Oshkosh Corp. Þ | | 5,078 | | | 35,546 | |
| Paccar, Inc. Þ | | 35,701 | | | 994,987 | |
| Pall Corp. | | 11,993 | | | 329,927 | |
| Parker Hannifin Corp. | | 16,399 | | | 673,671 | |
| SPX Corp. | | 5,222 | | | 194,885 | |
| Timken Co. | | 412 | | | 5,978 | |
| Toro Co. Þ | | 3,472 | | | 98,744 | |
| Valmont Industries, Inc. Þ | | 1,850 | | | 102,305 | |
| | | | | 11,120,229 | |
| Marine 0.0% | | | | | | |
| Kirby Corp. Þ * | | 5,273 | | | 134,092 | |
| | | | | | |
| Professional Services 0.3% | | | | | | |
| Corporate Executive Board Co. | | 3,334 | | | 76,882 | |
| Dun & Bradstreet Corp. | | 3,863 | | | 309,040 | |
| Equifax, Inc. Þ | | 6,750 | | | 171,787 | |
| FTI Consulting, Inc. Þ * | | 4,903 | | | 268,881 | |
| | Shares | | | Value | |
| COMMON STOCKS continued | | | | | | |
| INDUSTRIALS continued | | | | | | |
| Professional Services continued | | | | | | |
| Manpower, Inc. | | 590 | | $ | 18,573 | |
| Monster Worldwide, Inc. * Þ | | 11,690 | | | 134,084 | |
| Robert Half International, Inc. Þ | | 13,975 | | | 291,938 | |
| | | | | 1,271,185 | |
| Road & Rail 1.7% | | | | | | |
| Burlington Northern Santa Fe Corp. | | 27,519 | | | 2,108,230 | |
| Con-Way, Inc. | | 731 | | | 20,446 | |
| CSX Corp. | | 39,568 | | | 1,473,512 | |
| Hertz Global Holdings, Inc. Þ * | | 1,735 | | | 6,055 | |
| J.B. Hunt Transport Services, Inc. Þ | | 7,975 | | | 213,810 | |
| Kansas City Southern * Þ | | 7,279 | | | 159,556 | |
| Landstar System, Inc. Þ | | 5,156 | | | 165,714 | |
| Norfolk Southern Corp. Þ | | 10,617 | | | 525,223 | |
| Ryder System, Inc. | | 1,849 | | | 66,398 | |
| Union Pacific Corp. | | 50,523 | | | 2,528,171 | |
| | | | | 7,267,115 | |
| Trading Companies & Distributors 0.3% | | | | | | |
| Fastenal Co. Þ | | 12,626 | | | 486,227 | |
| GATX Corp. Þ | | 538 | | | 15,145 | |
| MSC Industrial Direct Co., Class A Þ | | 4,327 | | | 149,757 | |
| W.W. Grainger, Inc. Þ | | 7,480 | | | 527,864 | |
| Wesco International, Inc. * | | 3,019 | | | 44,651 | |
| | | | | 1,223,644 | |
| INFORMATION TECHNOLOGY 27.1% | | | | | | |
| Communications Equipment 4.2% | | | | | | |
| Brocade Communications Systems, Inc. * | | 5,185 | | | 16,696 | |
| Ciena Corp. * Þ | | 8,512 | | | 62,989 | |
| Cisco Systems, Inc. * | | 577,550 | | | 9,552,677 | |
| CommScope, Inc. * Þ | | 6,829 | | | 77,099 | |
| Corning, Inc. | | 153,981 | | | 1,387,369 | |
| EchoStar Corp. Þ * | | 295 | | | 5,036 | |
| F5 Networks, Inc. Þ * | | 8,008 | | | 199,399 | |
| Harris Corp. | | 13,170 | | | 459,370 | |
| JDS Uniphase Corp. * | | 10,967 | | | 29,830 | |
| Juniper Networks, Inc. Þ * | | 51,325 | | | 892,028 | |
| QUALCOMM, Inc. | | 158,262 | | | 5,312,855 | |
| | | | | 17,995,348 | |
| Computers & Peripherals 7.5% | | | | | | |
| Apple, Inc. * Þ | | 86,198 | | | 7,987,969 | |
| Dell, Inc. * | | 177,514 | | | 1,982,831 | |
| Diebold, Inc. | | 5,378 | | | 150,584 | |
| EMC Corp. * | | 141,078 | | | 1,491,194 | |
| Hewlett-Packard Co. Þ | | 241,036 | | | 8,503,750 | |
| International Business Machines Corp. Þ | | 134,287 | | | 10,957,819 | |
| NCR Corp. * | | 14,756 | | | 223,996 | |
| NetApp, Inc. Þ * | | 33,587 | | | 453,425 | |
| SanDisk Corp. * Þ | | 4,329 | | | 34,632 | |
| Seagate Technology, Inc. | | 22,936 | | | 96,561 | |
| | Shares | | | Value | |
| COMMON STOCKS continued | | | | | | |
| INFORMATION TECHNOLOGY continued | | | | | | |
| Computers & Peripherals continued | | | | | | |
| Teradata Corp. * | | 8,609 | | $ | 115,619 | |
| Western Digital Corp. * | | 21,646 | | | 264,081 | |
| | | | | 32,262,461 | |
| Electronic Equipment & Instruments 0.6% | | | | | | |
| Agilent Technologies, Inc. * | | 35,691 | | | 672,062 | |
| Amphenol Corp., Class A | | 17,146 | | | 398,130 | |
| Arrow Electronics, Inc. * | | 816 | | | 11,261 | |
| Avnet, Inc. * | | 6,441 | | | 91,720 | |
| AVX Corp. Þ | | 401 | | | 3,505 | |
| Dolby Laboratories, Inc., Class A * | | 4,931 | | | 147,042 | |
| Flir Systems, Inc. Þ * | | 13,426 | | | 416,475 | |
| Itron, Inc. * Þ | | 3,338 | | | 158,154 | |
| Jabil Circuit, Inc. | | 9,857 | | | 64,859 | |
| Mettler-Toledo International, Inc. * | | 3,396 | | | 279,321 | |
| Molex, Inc. Þ | | 3,748 | | | 50,973 | |
| National Instruments Corp. Þ | | 5,539 | | | 133,545 | |
| Tech Data Corp. * | | 734 | | | 12,801 | |
| Trimble Navigation, Ltd. * Þ | | 11,865 | | | 241,571 | |
| | | | | 2,681,419 | |
| Internet Software & Services 2.5% | | | | | | |
| Akamai Technologies, Inc. * | | 16,449 | | | 201,829 | |
| eBay, Inc. Þ * | | 108,493 | | | 1,424,513 | |
| Equinix, Inc. Þ * | | 3,197 | | | 145,176 | |
| Google, Inc., Class A * | | 23,155 | | | 6,783,489 | |
| Sohu.com, Inc. * Þ | | 2,769 | | | 134,407 | |
| VeriSign, Inc. * Þ | | 19,037 | | | 411,009 | |
| Yahoo!, Inc. * Þ | | 134,738 | | | 1,550,834 | |
| | | | | 10,651,257 | |
| IT Services 2.1% | | | | | | |
| Accenture, Ltd., Class A | | 58,392 | | | 1,808,984 | |
| Affiliated Computer Services, Inc., Class A * | | 2,430 | | | 98,294 | |
| Alliance Data Systems Corp. * Þ | | 6,578 | | | 284,893 | |
| Automatic Data Processing, Inc. | | 50,687 | | | 2,081,208 | |
| Broadridge Financial Solutions, Inc. | | 13,695 | | | 156,123 | |
| Cognizant Technology Solutions Corp., Class A Þ * | | 28,245 | | | 542,304 | |
| DST Systems, Inc. Þ * | | 3,549 | | | 134,188 | |
| Fidelity National Information Services, Inc. | | 4,330 | | | 74,389 | |
| Fiserv, Inc. * | | 16,028 | | | 547,196 | |
| Genpact, Ltd. * | | 5,648 | | | 44,789 | |
| Global Payments, Inc. | | 7,778 | | | 281,330 | |
| Hewitt Associates, Inc., Class A * | | 9,523 | | | 272,167 | |
| Iron Mountain, Inc. Þ * | | 17,494 | | | 380,145 | |
| Lender Processing Services, Inc. | | 2,165 | | | 47,760 | |
| Metavante Technologies, Inc. | | 8,779 | | | 151,613 | |
| NeuStar, Inc., Class A * | | 7,583 | | | 145,215 | |
| Paychex, Inc. Þ | | 31,639 | | | 894,118 | |
| SAIC, Inc. * | | 3,028 | | | 53,898 | |
| Total System Services, Inc. | | 15,986 | | | 228,120 | |
| | Shares | | | Value | |
| COMMON STOCKS continued | | | | | | |
| INFORMATION TECHNOLOGY continued | | | | | | |
| IT Services continued | | | | | | |
| Unisys Corp. * | | 19,192 | | $ | 12,859 | |
| Western Union Co. | | 72,348 | | | 960,058 | |
| | | | | 9,199,651 | |
| Office Electronics 0.0% | | | | | | |
| Zebra Technologies Corp., Class A * Þ | | 5,937 | | | 125,627 | |
| | | | | | |
| Semiconductors & Semiconductor Equipment 3.6% | | | | | | |
| Advanced Micro Devices, Inc. * Þ | | 7,413 | | | 17,495 | |
| Altera Corp. | | 29,311 | | | 431,165 | |
| Analog Devices, Inc. Þ | | 28,366 | | | 485,059 | |
| Applied Materials, Inc. | | 132,345 | | | 1,267,865 | |
| Atmel Corp. * | | 27,792 | | | 77,818 | |
| Broadcom Corp., Class A * | | 50,264 | | | 769,542 | |
| Cree, Inc. Þ * | | 3,621 | | | 57,501 | |
| Cypress Semiconductor Corp. Þ | | 14,721 | | | 54,909 | |
| Integrated Device Technology, Inc. * | | 7,536 | | | 38,961 | |
| Intel Corp. Þ | | 483,871 | | | 6,677,420 | |
| International Rectifier Corp. * | | 1,560 | | | 18,236 | |
| Intersil Corp., Class A | | 4,127 | | | 37,391 | |
| KLA-Tencor Corp. Þ | | 15,563 | | | 292,740 | |
| Lam Research Corp. Þ * | | 11,181 | | | 225,856 | |
| Linear Technology Corp. Þ | | 21,692 | | | 432,755 | |
| LSI Corp. Þ * | | 47,242 | | | 126,609 | |
| Marvell Technology Group, Ltd. * | | 47,425 | | | 275,065 | |
| MEMC Electronic Materials, Inc. * | | 22,267 | | | 334,450 | |
| Microchip Technology, Inc. Þ | | 18,083 | | | 334,535 | |
| Micron Technology, Inc. Þ * | | 9,298 | | | 25,477 | |
| National Semiconductor Corp. | | 22,426 | | | 246,686 | |
| Novellus Systems, Inc. * | | 2,939 | | | 36,414 | |
| NVIDIA Corp. * | | 54,237 | | | 405,150 | |
| ON Semiconductor Corp. * Þ | | 39,842 | | | 116,339 | |
| Rambus, Inc. * Þ | | 10,210 | | | 105,265 | |
| Silicon Laboratories, Inc. Þ * | | 4,762 | | | 99,812 | |
| Teradyne, Inc. * | | 10,518 | | | 39,863 | |
| Texas Instruments, Inc. | | 129,326 | | | 2,013,606 | |
| Varian Semiconductor Equipment Associates, Inc. * Þ | | 7,249 | | | 133,382 | |
| Xilinx, Inc. Þ | | 27,304 | | | 446,693 | |
| | | | | 15,624,059 | |
| Software 6.6% | | | | | | |
| Activision Blizzard, Inc. * Þ | | 58,027 | | | 678,916 | |
| Adobe Systems, Inc. * | | 51,997 | | | 1,204,250 | |
| Amdocs, Ltd. * | | 8,126 | | | 152,688 | |
| Ansys, Inc. * | | 8,279 | | | 238,932 | |
| Autodesk, Inc. * Þ | | 21,845 | | | 362,409 | |
| BMC Software, Inc. * | | 18,675 | | | 466,128 | |
| CA, Inc. | | 17,733 | | | 298,624 | |
| Citrix Systems, Inc. * | | 17,945 | | | 478,414 | |
| Compuware Corp. * | | 15,017 | | | 95,358 | |
| Electronic Arts, Inc. * | | 31,132 | | | 593,376 | |
| | Shares | | | Value | |
| COMMON STOCKS continued | | | | | | |
| INFORMATION TECHNOLOGY continued | | | | | | |
| Software continued | | | | | | |
| FactSet Research Systems, Inc. Þ | | 4,175 | | $ | 167,000 | |
| Intuit, Inc. * | | 31,385 | | | 695,492 | |
| McAfee, Inc. * | | 13,283 | | | 402,873 | |
| Microsoft Corp. | | 784,916 | | | 15,871,001 | |
| Novell, Inc. * | | 15,492 | | | 70,489 | |
| Nuance Communications, Inc. * Þ | | 18,133 | | | 166,461 | |
| Oracle Corp. * | | 380,777 | | | 6,126,702 | |
| Red Hat, Inc. * Þ | | 18,638 | | | 172,401 | |
| Salesforce.com, Inc. * Þ | | 10,279 | | | 294,185 | |
| VMware, Inc., Class A * Þ | | 4,055 | | | 78,464 | |
| | | | | 28,614,163 | |
| MATERIALS 3.6% | | | | | | |
| Chemicals 2.6% | | | | | | |
| Air Products & Chemicals, Inc. Þ | | 20,597 | | | 983,713 | |
| Airgas, Inc. | | 8,095 | | | 289,396 | |
| Albemarle Corp. | | 8,943 | | | 181,811 | |
| Ashland, Inc. | | 575 | | | 5,491 | |
| Celanese Corp., Ser. A Þ | | 12,198 | | | 140,887 | |
| CF Industries Holdings, Inc. | | 5,512 | | | 290,096 | |
| Chemtura Corp. | | 1,918 | | | 3,203 | |
| Ecolab, Inc. | | 17,060 | | | 654,933 | |
| FMC Corp. | | 2,831 | | | 123,715 | |
| Huntsman Corp. Þ | | 1,713 | | | 12,248 | |
| International Flavors & Fragrances, Inc. | | 7,871 | | | 240,380 | |
| Intrepid Potash, Inc. * Þ | | 1,910 | | | 36,672 | |
| Monsanto Co. | | 53,654 | | | 4,249,397 | |
| Mosaic Co. | | 15,182 | | | 460,774 | |
| Nalco Holding Co. | | 12,802 | | | 146,071 | |
| PPG Industries, Inc. | | 1,765 | | | 77,519 | |
| Praxair, Inc. | | 30,614 | | | 1,807,757 | |
| Rohm & Haas Co. Þ | | 10,946 | | | 748,816 | |
| Scotts Miracle-Gro Co., Class A | | 3,330 | | | 107,759 | |
| Sigma-Aldrich Corp. Þ | | 6,642 | | | 286,336 | |
| Terra Industries, Inc. | | 9,986 | | | 146,894 | |
| Valhi, Inc. Þ | | 222 | | | 3,108 | |
| | | | | 10,996,976 | |
| Construction Materials 0.1% | | | | | | |
| Eagle Materials, Inc. Þ | | 3,784 | | | 79,464 | |
| Martin Marietta Materials, Inc. Þ | | 3,742 | | | 327,949 | |
| | | | | 407,413 | |
| Containers & Packaging 0.1% | | | | | | |
| AptarGroup, Inc. Þ | | 1,237 | | | 41,365 | |
| Ball Corp. | | 1,434 | | | 52,269 | |
| Crown Holdings, Inc. * | | 15,693 | | | 251,873 | |
| Greif, Inc., Class A | | 3,258 | | | 108,003 | |
| Owens-Illinois, Inc. * | | 4,662 | | | 94,266 | |
| Packaging Corporation of America Þ | | 2,365 | | | 35,309 | |
| | | | | 583,085 | |
| | | | | | |
| | Shares | | | Value | |
| COMMON STOCKS continued | | | | | | |
| MATERIALS continued | | | | | | |
| Metals & Mining 0.8% | | | | | | |
| AK Steel Holding Corp. Þ | | 10,952 | | $ | 86,302 | |
| Alcoa, Inc. | | 61,921 | | | 666,270 | |
| Allegheny Technologies, Inc. Þ | | 9,885 | | | 226,861 | |
| Carpenter Technology Corp. | | 286 | | | 4,765 | |
| Century Aluminum Co. * Þ | | 1,686 | | | 13,741 | |
| Cliffs Natural Resources, Inc. | | 11,097 | | | 263,554 | |
| Newmont Mining Corp. Þ | | 42,685 | | | 1,436,350 | |
| NuCor Corp. | | 6,586 | | | 234,988 | |
| Schnitzer Steel Industries, Inc., Class A Þ | | 272 | | | 7,344 | |
| Southern Copper Corp. Þ | | 21,506 | | | 295,922 | |
| Steel Dynamics, Inc. | | 4,319 | | | 35,675 | |
| Titanium Metals Corp. Þ | | 1,540 | | | 13,013 | |
| United States Steel Corp. Þ | | 10,899 | | | 331,330 | |
| | | | | 3,616,115 | |
| TELECOMMUNICATION SERVICES 0.7% | | | | | | |
| Diversified Telecommunication Services 0.2% | | | | | | |
| Embarq Corp. | | 7,256 | | | 236,836 | |
| Frontier Communications Corp. Þ | | 7,038 | | | 61,371 | |
| Level 3 Communications, Inc. Þ * | | 151,734 | | | 142,676 | |
| Qwest Communications International, Inc. Þ | | 73,085 | | | 233,872 | |
| Windstream Corp. Þ | | 21,778 | | | 192,953 | |
| | | | | 867,708 | |
| Wireless Telecommunication Services 0.5% | | | | | | |
| American Tower Corp., Class A * | | 38,774 | | | 1,056,204 | |
| Clearwire Corp. * Þ | | 5,864 | | | 38,820 | |
| Crown Castle International Corp. * | | 5,716 | | | 80,424 | |
| Leap Wireless International, Inc. Þ * | | 453 | | | 9,060 | |
| MetroPCS Communications, Inc. Þ * | | 23,817 | | | 348,681 | |
| NII Holdings, Inc. * | | 16,383 | | | 318,485 | |
| SBA Communications Corp., Class A * | | 10,624 | | | 167,753 | |
| Telephone & Data Systems, Inc. | | 4,321 | | | 140,216 | |
| U.S. Cellular Corp. * | | 679 | | | 26,773 | |
| | | | | 2,186,416 | |
| UTILITIES 2.1% | | | | | | |
| Electric Utilities 1.2% | | | | | | |
| Allegheny Energy, Inc. | | 16,429 | | | 579,122 | |
| DPL, Inc. Þ | | 855 | | | 17,801 | |
| Entergy Corp. | | 13,256 | | | 1,128,086 | |
| Exelon Corp. | | 32,069 | | | 1,802,599 | |
| Mirant Corp. * Þ | | 11,618 | | | 200,062 | |
| NRG Energy, Inc. * Þ | | 8,696 | | | 206,008 | |
| NV Energy, Inc. | | 6,038 | | | 57,240 | |
| PPL Corp. Þ | | 36,472 | | | 1,236,036 | |
| | | | | 5,226,954 | |
| Gas Utilities 0.2% | | | | | | |
| Energen Corp. | | 1,325 | | | 40,810 | |
| | Shares | | | Value | |
| COMMON STOCKS continued | | | | | | |
| UTILITIES continued | | | | | | |
| Gas Utilities continued | | | | | | |
| Equitable Resources, Inc. | | 12,795 | | $ | 426,969 | |
| Questar Corp. | | 6,421 | | | 206,692 | |
| | | | | 674,471 | |
| Independent Power Producers & Energy Traders 0.3% | | | | | | |
| AES Corp. * | | 65,684 | | | 505,110 | |
| Calpine Corp. Þ * | | 34,614 | | | 310,142 | |
| Constellation Energy Group, Inc. | | 15,958 | | | 390,492 | |
| | | | | 1,205,744 | |
| Multi-Utilities 0.4% | | | | | | |
| CenterPoint Energy, Inc. | | 20,316 | | | 262,686 | |
| Public Service Enterprise Group, Inc. | | 49,717 | | | 1,536,255 | |
| | | | | 1,798,941 | |
| Total Common Stocks (cost $478,613,446) | | | | | 427,439,781 | |
| EXCHANGE TRADED FUND 0.8% | | | | | | |
| iShares Russell 1000 Growth Index Fund Þ (cost $4,355,557) | | 95,590 | | | 3,496,682 | |
| | | | | | |
| | Principal Amount | | | Value | |
| SHORT-TERM INVESTMENTS 25.8% | | | | | | |
| U.S. TREASURY OBLIGATIONS 0.1% | | | | | | |
| U.S. Treasury Bills: | | | | | | |
| 0.10%, 02/19/2009-02/26/2009 ß ƒ | $ | 115,000 | | | 114,990 | |
| 0.75%, 01/29/2009 ß ƒ | | 25,000 | | | 24,999 | |
| 1.64%, 12/11/2008 ß ƒ | | 50,000 | | | 50,000 | |
| | | | | 189,989 | |
| | Shares | | | Value | |
| MUTUAL FUND SHARES 25.7% | | | | | | |
| Evergreen Institutional Money Market Fund, Class I, 2.09% q ø | | 121,699 | | | 121,699 | |
| State Street Navigator Securities Lending Prime Portfolio, 1.99% § ÞÞ | | 110,984,807 | | | 110,984,807 | |
| | | | | 111,106,506 | |
| Total Short-Term Investments (cost $111,296,415) | | | | | 111,296,495 | |
| Total Investments (cost $594,265,418) 125.4% | | | | | 542,232,958 | |
| Other Assets and Liabilities (25.4%) | | | | | (109,699,887 | ) |
| Net Assets 100.0% | | | | $ | 432,533,071 | |
| Þ | All or a portion of this security is on loan. |
| * | Non-income producing security |
| ß | Rate shown represents the yield to maturity at date of purchase. |
| ƒ | All or a portion of this security was pledged to cover initial margin requirements for open futures contracts. |
| q | Rate shown is the 7-day annualized yield at period end. |
| ø | Evergreen Investment Management Company, LLC is the investment advisor to both the Fund and the money market fund. |
| § | Rate shown is the 1-day annualized yield at period end. |
| ÞÞ | All or a portion of this security represents investment of cash collateral received from securities on loan. |
The following table shows the percent of total long-term investments by sector as of November 30, 2008:
| Information Technology | 27.2 | % | | | |
| Health Care | 14.8 | % | | | |
| Consumer Staples | 14.6 | % | | | |
| Industrials | 13.2 | % | | | |
| Energy | 9.3 | % | | | |
| Consumer Discretionary | 9.1 | % | | | |
| Financials | 4.6 | % | | | |
| Materials | 3.6 | % | | | |
| Utilities | 2.1 | % | | | |
| Telecommunication Services | 0.7 | % | | | |
| Other | 0.8 | % | | | |
| 100.0 | % | | | |
Market Index Growth Fund STATEMENT OF ASSETS AND LIABILITIES |
November 30, 2008 (unaudited) |
| Assets | | | |
| Investments in securities, at value (cost $594,143,719) including $108,541,811 of securities loaned | $ | 542,111,259 | |
| Investments in affiliated money market fund, at value (cost $121,699) | | 121,699 | |
| Total investments | | 542,232,958 | |
| Receivable for securities sold | | 575,105 | |
| Dividends receivable | | 940,890 | |
| Receivable for daily variation margin on open futures contracts | | 15,015 | |
| Receivable for securities lending income | | 86,271 | |
| Receivable from investment advisor | | 3,963 | |
| Total assets | | 543,854,202 | |
| Liabilities | | | |
| Payable for securities purchased | | 278,403 | |
| Payable for securities on loan | | 110,984,807 | |
| Due to related parties | | 3,834 | |
| Trustees' fees and expenses payable | | 23,233 | |
| Accrued expenses and other liabilities | | 30,854 | |
| Total liabilities | | 111,321,131 | |
| Net assets | $ | 432,533,071 | |
| Net assets represented by | | | |
| Paid-in capital | $ | 430,088,215 | |
| Undistributed net investment income | | 14,753,374 | |
| Accumulated net realized gains on investments | | 40,024,993 | |
| Net unrealized losses on investments | | (52,333,511 | ) |
| Total net assets | $ | 432,533,071 | |
| Shares outstanding (unlimited number of shares authorized) | | | |
| Class I | | 46,677,729 | |
| Net asset value per share | | | |
| Class I | $ | 9.27 | |
Market Index Growth Fund STATEMENT OF OPERATIONS |
Six Months Ended November 30, 2008 (unaudited) |
| Investment income | | | |
| Dividends (net of foreign withholding taxes of $63) | $ | 4,345,194 | |
| Securities lending | | 336,395 | |
| Income from affiliate | | 6,533 | |
| Interest | | 627 | |
| Total investment income | | 4,688,749 | |
| Expenses | | | |
| Advisory fee | | 947,809 | |
| Administrative services fee | | 296,190 | |
| Transfer agent fees | | 13 | |
| Trustees' fees and expenses | | 2,325 | |
| Printing and postage expenses | | 5,911 | |
| Custodian and accounting fees | | 70,377 | |
| Registration and filing fees | | 2,372 | |
| Professional fees | | 17,268 | |
| Interest expense | | 113 | |
| Other | | 8,885 | |
| Total expenses | | 1,351,263 | |
| Less: Expense reductions | | (1,376 | ) |
| Fee waivers and expense reimbursements | | (1,277,209 | ) |
| Net expenses | | 72,678 | |
| Net investment income | | 4,616,071 | |
| Net realized and unrealized gains or losses on investments | | | |
| Net realized losses on: | | | |
| Securities | | (4,633,853 | ) |
| Futures contracts | | (101,639 | ) |
| Net realized losses on investments | | (4,735,492 | ) |
| Net change in unrealized gains or losses on investments | | (271,873,847 | ) |
| Net realized and unrealized gains or losses on investments | | (276,609,339 | ) |
| Net decrease in net assets resulting from operations | $ | (271,993,268 | ) |
Market Index Growth Fund STATEMENTS OF CHANGES IN NET ASSETS |
| Six Months Ended
November 30, 2008
(unaudited) | Year Ended
May 31, 2008 |
| Operations | | | | | | | | | | |
| Net investment income | | | $ | 4,616,071 | | | | $ | 10,261,326 | |
| Net realized gains or losses on investments | | | | (4,735,492 | ) | | | | 45,127,926 | |
| Net change in unrealized gains or losses on investments | | | | (271,873,847 | ) | | | | (60,979,242 | ) |
| Net decrease in net assets resulting from operations | | | | (271,993,268 | ) | | | | (5,589,990 | ) |
| Distributions to shareholders from | | | | | | | | | | |
| Net investment income | | | | 0 | | | | | (9,948,993 | ) |
| Net realized gains | | | | 0 | | | | | (9,731,411 | ) |
| Total distributions to shareholders | | | | 0 | | | | | (19,680,404 | ) |
| Shares | | | | | Shares | | | | |
| Capital share transactions | | | | | | | | | | |
| Net asset value of shares issued in reinvestment of distributions | 0 | | | 0 | | 1,275,847 | | | 19,680,404 | |
| Payment for shares redeemed | (1,931,994 | ) | | (25,000,000 | ) | (14,190,483 | ) | | (210,000,000 | ) |
| Net decrease in net assets resulting from capital share transactions | | | | (25,000,000 | ) | | | | (190,319,596 | ) |
| Total decrease in net assets | | | | (296,993,268 | ) | | | | (215,589,990 | ) |
| Net assets | | | | | | | | | | |
| Beginning of period | | | | 729,526,339 | | | | | 945,116,329 | |
| End of period | | | $ | 432,533,071 | | | | $ | 729,526,339 | |
| Undistributed net investment income | | | $ | 14,753,374 | | | | $ | 10,137,303 | |
Market Index Value Fund FUND AT A GLANCE |
Management Team
| Investment Advisor: |
| Evergreen Investment Management Company, LLC |
|
| Portfolio Manager: |
| William E. Zieff |
CURRENT INVESTMENT STYLE
| Source: Morningstar, Inc. Morningstar's style box is based on a portfolio date as of 9/30/2008. The Equity style box placement is based on 10 growth and valuation measures for each fund holding and the median size of the companies in which the fund invests. |
PERFORMANCE AND RETURNS
| Portfolio inception date: 10/15/2002 |
| Class I |
| Class inception date | 10/15/2002 |
| 6-month return | -34.80 | % |
| Average annual return |
| 1-year | -38.25 | % |
| 5-year | 0.14 | % |
| Since portfolio inception | 3.72 | % |
| Past performance is no guarantee of future results. The performance quoted represents past performance and current performance may be lower or higher. The investment return and principal value of an investment will fluctuate so that investors? shares, when redeemed, may be worth more or less than their original cost. Performance includes the reinvestment of income dividends and capital gain distributions. |
| The advisor is waiving its advisory fee and reimbursing the fund for a portion of other expenses. Had the fee not been waived and expenses not reimbursed, returns would have been lower. |
| The fund is only offered to certain pension plans having at least $100 million. Class I shares are sold without a front-end or deferred sales charge. The minimum initial investment for the fund is $100 million, which may be waived in certain situations. There is no minimum amount required for subsequent purchases. |
LONG-TERM GROWTH
| Comparison of a $100,000,000 investment in the Evergreen Market Index Value Fund Class I shares versus a similar investment in the Russell 1000 Value Index (Russell 1000 Value) and the Consumer Price Index (CPI). |
| The Russell 1000 Value is an unmanaged market index and does not include transaction costs associated with buying and selling securities, any mutual fund fees or expenses or any taxes. The CPI is a commonly used measure of inflation and does not represent an investment return. It is not possible to invest directly in an index. |
| "Russell 1000 Value Index" is a trademark and service mark of Frank Russell Company (FRC) and has been licensed for use by Evergreen Investments. The product is not sponsored, endorsed, sold or promoted by FRC and FRC makes no representation regarding the advisability of investing in the product. |
| The fund's investment objective may be changed without a vote of the fund's shareholders. |
| All data is as of November 30, 2008, and subject to change. |
Market Index Value Fund ABOUT YOUR FUND'S EXPENSES |
The Example below is intended to describe the fees and expenses borne by shareholders and the impact of those costs on your investment.
Example
As a shareholder of the fund, you incur two types of costs: (1) transaction costs, including sales charges (loads), redemption fees and exchange fees; and (2) ongoing costs, including management fees, distribution (12b-1) fees and other fund expenses. This Example is intended to help you understand your ongoing costs (in dollars) of investing in the fund and to compare these costs with the ongoing costs of investing in other mutual funds. The Example is based on an investment of $1,000 invested at the beginning of the period and held for the entire period from June 1, 2008 to November 30, 2008.
The example illustrates your fund's costs in two ways:
- Actual expenses
The section in the table under the heading "Actual" provides information about actual account values and actual expenses. You may use the information in these columns, together with the amount you invested, to estimate the expenses that you paid over the period. Simply divide your account value by $1,000 (for example, an $8,600 account value divided by $1,000 = 8.6), then multiply the result by the number in the appropriate column for your share class, in the column entitled "Expenses Paid During Period" to estimate the expenses you paid on your account during this period.
- Hypothetical example for comparison purposes
The section in the table under the heading "Hypothetical (5% return before expenses)" provides information about hypothetical account values and hypothetical expenses based on the fund's actual expense ratio and an assumed rate of return of 5% per year before expenses, which is not the fund's actual return. The hypothetical account values and expenses may not be used to estimate the actual ending account balance or expenses you paid for the period. You may use this information to compare the ongoing costs of investing in the fund and other funds. To do so, compare this 5% hypothetical example with the 5% hypothetical examples that appear in the shareholder reports of the other funds.
Please note that the expenses shown in the table are meant to highlight your ongoing costs only and do not reflect any transactional costs, such as sales charges (loads), redemption fees or exchange fees. Therefore, the section in the table under the heading "Hypothetical (5% return before expenses)" is useful in comparing ongoing costs only, and will not help you determine the relative total costs of owning different funds. In addition, if these transactional costs were included, your costs would havebeen higher.
| Beginning
Account Value
6/1/2008 | Ending
Account Value
11/30/2008 | Expenses Paid
During Period* |
| Actual | | | | | | |
| Class I | $1,000.00 | | $652.04 | | $0.12 | |
| Hypothetical (5% return before expenses) | | | | | | |
| Class I | $1,000.00 | | $1,024.92 | | $0.15 | |
| *Expenses are equal to the fund's annualized expense ratio (0.03% for Class I), multiplied by the average account value over the period, multiplied by 183/365 days. |
Market Index Value Fund FINANCIAL HIGHLIGHTS |
(For a share outstanding throughout each period) |
| | Six Months Ended November 30, 2008 | | Year Ended May 31, |
| Class I | (unaudited) | 2008 | 2007 | 2006 | 2005 | 2004 |
| Net asset value, beginning of period | $ | 12.99 | | $ | 15.67 | | $ | 15.75 | | $ | 14.83 | | $ | 13.23 | | $ | 11.14 | |
| Income from investment operations | | | | | | | | | | | | | | | | | | |
| Net investment income (loss) | | 0.20 | | | 0.38 | | | 0.39 | 1 | | 0.64 | | | 0.35 | | | 0.28 | |
| Net realized and unrealized gains or losses on investments | | (4.72 | ) | | (2.26 | ) | | 3.26 | | | 1.18 | | | 1.69 | | | 1.91 | |
| Total from investment operations | | (4.52 | ) | | (1.88 | ) | | 3.65 | | | 1.82 | | | 2.04 | | | 2.19 | |
| Distributions to shareholders from | | | | | | | | | | | | | | | | | | |
| Net investment income | | 0 | | | (0.30 | ) | | (0.38 | ) | | (0.34 | ) | | (0.28 | ) | | (0.10 | ) |
| Net realized gains | | 0 | | | (0.50 | ) | | (3.35 | ) | | (0.56 | ) | | (0.16 | ) | | 0 | |
| Total distributions to shareholders | | 0 | | | (0.80 | ) | | (3.73 | ) | | (0.90 | ) | | (0.44 | ) | | (0.10 | ) |
| Net asset value, end of period | $ | 8.47 | | $ | 12.99 | | $ | 15.67 | | $ | 15.75 | | $ | 14.83 | | $ | 13.23 | |
| Total return | | (34.80 | )% | | (12.25 | )% | | 25.57 | % | | 12.53 | % | | 15.51 | % | | 19.73 | % |
| Ratios and supplemental data | | | | | | | | | | | | | | | | | | |
| Net assets, end of period (thousands) | $ | 416,595 | | $ | 656,058 | | $ | 839,657 | | $ | 505,681 | | $ | 818,284 | | $ | 708,489 | |
| Ratios to average net assets | | | | | | | | | | | | | | | | | | |
| Expenses including waivers/reimbursements but excluding expense reductions | | 0.03 | %2 | | 0.03 | % | | 0.03 | % | | 0.03 | % | | 0.03 | % | | 0.02 | % |
| Expenses excluding waivers/reimbursements and expense reductions | | 0.46 | %2 | | 0.46 | % | | 0.46 | % | | 0.46 | % | | 0.45 | % | | 0.46 | % |
| Net investment income (loss) | | 3.40 | %2 | | 2.66 | % | | 2.56 | % | | 2.63 | % | | 2.54 | % | | 2.41 | % |
| Portfolio turnover rate | | 22 | % | | 27 | % | | 17 | % | | 27 | % | | 16 | % | | 10 | % |
| 1 | Net investment income (loss) per share is based on average shares outstanding during the period. |
| 2 | Annualized |
See Combined Notes to Financial Statements
Market Index Value Fund SCHEDULE OF INVESTMENTS (unaudited) |
| | Shares | | | Value | |
| COMMON STOCKS 98.3% | | | | | | |
| CONSUMER DISCRETIONARY 7.8% | | | | | | |
| Auto Components 0.3% | | | | | | |
| Autoliv, Inc. | | 6,767 | | $ | 129,182 | |
| BorgWarner, Inc. | | 1,373 | | | 32,485 | |
| Federal-Mogul Corp. * Þ | | 2,115 | | | 11,188 | |
| Goodyear Tire & Rubber Co. * | | 7,999 | | | 51,434 | |
| Johnson Controls, Inc. | | 46,868 | | | 827,689 | |
| TRW Automotive Holdings Corp. * Þ | | 4,676 | | | 16,647 | |
| | | | | 1,068,625 | |
| Automobiles 0.2% | | | | | | |
| Ford Motor Co. * Þ | | 201,922 | | | 543,170 | |
| General Motors Corp. Þ | | 45,400 | | | 237,896 | |
| Harley-Davidson, Inc. Þ | | 2,468 | | | 41,981 | |
| Thor Industries, Inc. Þ | | 2,329 | | | 36,425 | |
| | | | | 859,472 | |
| Distributors 0.1% | | | | | | |
| Genuine Parts Co. | | 15,258 | | | 597,351 | |
| | | | | | |
| Diversified Consumer Services 0.1% | | | | | | |
| Career Education Corp. Þ * | | 8,342 | | | 154,160 | |
| Service Corporation International | | 24,322 | | | 141,554 | |
| Weight Watchers International, Inc. | | 499 | | | 14,122 | |
| | | | | 309,836 | |
| Hotels, Restaurants & Leisure 0.4% | | | | | | |
| Boyd Gaming Corp. Þ | | 4,652 | | | 20,469 | |
| Carnival Corp. | | 32,335 | | | 679,035 | |
| Choice Hotels International, Inc. Þ | | 1,857 | | | 46,629 | |
| International Speedway Corp., Class A | | 3,020 | | | 78,369 | |
| Interval Leisure Group, Inc. * | | 2,990 | | | 15,847 | |
| McDonald's Corp. | | 9,818 | | | 576,808 | |
| MGM MIRAGE Þ * | | 682 | | | 8,170 | |
| Orient Express Hotels, Ltd. Þ | | 547 | | | 3,747 | |
| Royal Caribbean Cruises, Ltd. Þ | | 12,843 | | | 120,981 | |
| Wyndham Worldwide Corp. | | 16,474 | | | 78,746 | |
| | | | | 1,628,801 | |
| Household Durables 0.8% | | | | | | |
| Black & Decker Corp. | | 5,694 | | | 241,653 | |
| Centex Corp. | | 11,505 | | | 105,386 | |
| D.R. Horton, Inc. Þ | | 29,419 | | | 202,109 | |
| Fortune Brands, Inc. | | 14,314 | | | 541,069 | |
| Harman International Industries, Inc. | | 1,376 | | | 20,709 | |
| Jarden Corp. Þ * | | 6,330 | | | 78,998 | |
| KB Home Þ | | 7,033 | | | 81,794 | |
| Leggett & Platt, Inc. Þ | | 14,623 | | | 213,496 | |
| Lennar Corp., Class A Þ | | 12,697 | | | 90,276 | |
| M.D.C. Holdings, Inc. | | 3,190 | | | 98,890 | |
| Mohawk Industries, Inc. * | | 5,199 | | | 159,817 | |
| Newell Rubbermaid, Inc. | | 25,790 | | | 344,554 | |
| NVR, Inc. Þ * | | 356 | | | 154,593 | |
| Pulte Homes, Inc. Þ | | 15,168 | | | 161,539 | |
| Snap-On, Inc. | | 5,369 | | | 193,552 | |
| | Shares | | | Value | |
| COMMON STOCKS continued | | | | | | |
| CONSUMER DISCRETIONARY continued | | | | | | |
| Household Durables continued | | | | | | |
| Stanley Works | | 7,300 | | $ | 232,067 | |
| Toll Brothers, Inc. * | | 12,136 | | | 241,871 | |
| Whirlpool Corp. Þ | | 6,997 | | | 275,542 | |
| | | | | 3,437,915 | |
| Internet & Catalog Retail 0.1% | | | | | | |
| Expedia, Inc. * | | 19,329 | | | 162,364 | |
| HSN, Inc. Þ * | | 2,990 | | | 11,183 | |
| IAC/InteractiveCorp. Þ | | 7,474 | | | 110,540 | |
| Liberty Media Holding Corp. - Interactive, Ser. A * | | 55,309 | | | 145,463 | |
| Ticketmaster Entertainment, Inc. * | | 2,990 | | | 11,930 | |
| | | | | 441,480 | |
| Leisure Equipment & Products 0.2% | | | | | | |
| Eastman Kodak Co. Þ | | 26,843 | | | 203,202 | |
| Hasbro, Inc. Þ | | 6,669 | | | 178,729 | |
| Mattel, Inc. | | 33,708 | | | 460,788 | |
| | | | | 842,719 | |
| Media 3.2% | | | | | | |
| Ascent Media Corp., Ser. A * | | 1,310 | | | 26,200 | |
| Cablevision Systems Corp., Class A Þ | | 20,646 | | | 302,670 | |
| CBS Corp., Class B | | 54,929 | | | 365,827 | |
| Clear Channel Outdoor Holdings, Inc. Þ * | | 831 | | | 6,083 | |
| Comcast Corp., Class A | | 184,899 | | | 3,206,149 | |
| Discover Communications Inc., Ser. C * | | 26,193 | | | 396,300 | |
| E.W. Scripps Co., Class A Þ | | 2,694 | | | 7,893 | |
| Gannett Co., Inc. Þ | | 21,299 | | | 185,514 | |
| Hearst-Argyle Television, Inc. Þ | | 2,125 | | | 17,043 | |
| Interpublic Group of Cos. Þ * | | 6,330 | | | 25,890 | |
| Liberty Global, Inc., Class A Þ * | | 16,013 | | | 232,028 | |
| McClatchy Co., Class A | | 1 | | | 2 | |
| McGraw-Hill Cos. Þ | | 15,022 | | | 375,550 | |
| Meredith Corp. Þ | | 3,671 | | | 59,250 | |
| New York Times Co., Class A Þ | | 13,391 | | | 100,968 | |
| News Corp., Class A | | 129,426 | | | 1,022,465 | |
| Omnicom Group, Inc. | | 2,237 | | | 63,285 | |
| Regal Entertainment Group, Class A Þ | | 7,433 | | | 68,161 | |
| Scripps Networks Interactive, Inc., Class A Þ | | 8,086 | | | 224,710 | |
| Time Warner Cable, Inc. * | | 7,263 | | | 147,439 | |
| Time Warner, Inc. Þ | | 296,282 | | | 2,681,352 | |
| Viacom, Inc., Class B * | | 3,178 | | | 50,594 | |
| Virgin Media, Inc. Þ | | 27,380 | | | 129,507 | |
| Walt Disney Co. Þ | | 156,860 | | | 3,532,487 | |
| Warner Music Group Corp. Þ | | 3,896 | | | 11,610 | |
| Washington Post Co., Class B | | 573 | | | 226,851 | |
| | | | | 13,465,828 | |
| Multiline Retail 0.4% | | | | | | |
| Family Dollar Stores, Inc. Þ | | 11,996 | | | 333,249 | |
| J.C. Penney Co., Inc. Þ | | 20,659 | | | 392,314 | |
| Kohl's Corp. Þ * | | 6,848 | | | 223,656 | |
| | Shares | | | Value | |
| COMMON STOCKS continued | | | | | | |
| CONSUMER DISCRETIONARY continued | | | | | | |
| Multiline Retail continued | | | | | | |
| Macy's, Inc. Þ | | 39,244 | | $ | 291,190 | |
| Saks, Inc. * Þ | | 13,446 | | | 57,952 | |
| Sears Holdings Corp. * Þ | | 5,496 | | | 199,230 | |
| Target Corp. | | 5,435 | | | 183,486 | |
| | | | | 1,681,077 | |
| Specialty Retail 1.9% | | | | | | |
| American Eagle Outfitters, Inc. | | 4,852 | | | 46,579 | |
| AnnTaylor Stores Corp. * | | 3,470 | | | 15,580 | |
| AutoNation, Inc. Þ * | | 10,709 | | | 91,455 | |
| Barnes & Noble, Inc. | | 3,369 | | | 53,163 | |
| Bed Bath & Beyond, Inc. * | | 4,268 | | | 86,598 | |
| Foot Locker, Inc. Þ | | 14,415 | | | 97,013 | |
| Gap, Inc. | | 22,942 | | | 298,705 | |
| Home Depot, Inc. | | 157,405 | | | 3,637,630 | |
| Limited Brands, Inc. | | 9,179 | | | 85,456 | |
| Lowe's Cos. | | 129,358 | | | 2,672,536 | |
| O'Reilly Automotive, Inc. * Þ | | 7,958 | | | 207,465 | |
| Office Depot, Inc. * | | 25,436 | | | 50,109 | |
| OfficeMax, Inc. Þ | | 7,071 | | | 38,537 | |
| Penske Automotive Group, Inc. Þ | | 3,793 | | | 28,751 | |
| RadioShack Corp. Þ | | 12,219 | | | 120,357 | |
| Signet Jewelers, Ltd. | | 7,942 | | | 62,186 | |
| Staples, Inc. | | 9,809 | | | 170,284 | |
| Williams-Sonoma, Inc. Þ | | 7,486 | | | 52,477 | |
| | | | | 7,814,881 | |
| Textiles, Apparel & Luxury Goods 0.1% | | | | | | |
| Jones Apparel Group, Inc. | | 8,065 | | | 41,373 | |
| Liz Claiborne, Inc. Þ | | 8,828 | | | 25,160 | |
| Phillips-Van Heusen Corp. | | 593 | | | 10,342 | |
| VF Corp. Þ | | 8,131 | | | 425,170 | |
| | | | | 502,045 | |
| CONSUMER STAPLES 9.5% | | | | | | |
| Beverages 1.3% | | | | | | |
| Brown-Forman Corp., Class B | | 2,529 | | | 110,998 | |
| Coca-Cola Co. | | 63,820 | | | 2,991,243 | |
| Coca-Cola Enterprises, Inc. | | 29,654 | | | 272,224 | |
| Constellation Brands, Inc., Class A Þ * | | 17,227 | | | 219,817 | |
| Dr. Pepper Snapple Group, Inc. * | | 23,610 | | | 381,065 | |
| Molson Coors Brewing Co., Class B | | 10,760 | | | 478,497 | |
| Pepsi Bottling Group, Inc. | | 12,777 | | | 231,136 | |
| PepsiAmericas, Inc. | | 5,408 | | | 90,638 | |
| PepsiCo, Inc. Þ | | 8,863 | | | 502,532 | |
| | | | | 5,278,150 | |
| Food & Staples Retailing 1.5% | | | | | | |
| BJ's Wholesale Club, Inc. Þ * | | 5,564 | | | 199,080 | |
| CVS Caremark Corp. | | 61,239 | | | 1,771,644 | |
| Kroger Co. | | 34,327 | | | 949,485 | |
| Rite Aid Corp. * Þ | | 47,339 | | | 24,616 | |
| | Shares | | | Value | |
| COMMON STOCKS continued | | | | | | |
| CONSUMER STAPLES continued | | | | | | |
| Food & Staples Retailing continued | | | | | | |
| Safeway, Inc. | | 40,794 | | $ | 889,309 | |
| SUPERVALU, Inc. | | 19,771 | | | 235,473 | |
| Wal-Mart Stores, Inc. | | 40,331 | | | 2,253,697 | |
| Walgreen Co. | | 7,011 | | | 173,452 | |
| | | | | 6,496,756 | |
| Food Products 2.8% | | | | | | |
| Archer Daniels Midland Co. | | 59,973 | | | 1,642,061 | |
| Bunge, Ltd. Þ | | 11,320 | | | 480,647 | |
| Campbell Soup Co. Þ | | 10,185 | | | 326,429 | |
| ConAgra Foods, Inc. | | 42,192 | | | 622,332 | |
| Corn Products International, Inc. | | 6,904 | | | 189,169 | |
| Dean Foods Co. * | | 2,809 | | | 40,899 | |
| Del Monte Foods Co. | | 18,374 | | | 108,774 | |
| General Mills, Inc. | | 28,552 | | | 1,803,630 | |
| H.J. Heinz Co. | | 13,062 | | | 507,328 | |
| Hershey Co. Þ | | 7,101 | | | 255,636 | |
| Hormel Foods Corp. | | 6,619 | | | 175,801 | |
| J.M. Smucker Co. | | 8,882 | | | 402,976 | |
| Kellogg Co. | | 9,990 | | | 433,866 | |
| Kraft Foods, Inc., Class A Þ | | 136,903 | | | 3,725,131 | |
| McCormick & Co., Inc. | | 6,562 | | | 195,351 | |
| Sara Lee Corp. | | 65,783 | | | 603,888 | |
| Smithfield Foods, Inc. * Þ | | 10,865 | | | 73,991 | |
| Tyson Foods, Inc., Class A | | 24,372 | | | 163,536 | |
| | | | | 11,751,445 | |
| Household Products 3.2% | | | | | | |
| Clorox Co. Þ | | 8,871 | | | 524,808 | |
| Kimberly-Clark Corp. | | 22,954 | | | 1,326,512 | |
| Procter & Gamble Co. Þ | | 176,589 | | | 11,363,502 | |
| | | | | 13,214,822 | |
| Personal Products 0.0% | | | | | | |
| Alberto-Culver Co. | | 7,106 | | | 152,566 | |
| NBTY, Inc. * | | 2,517 | | | 36,672 | |
| | | | | 189,238 | |
| Tobacco 0.7% | | | | | | |
| Altria Group, Inc. | | 49,155 | | | 790,412 | |
| Lorillard, Inc. Þ | | 7,711 | | | 465,976 | |
| Reynolds American, Inc. Þ | | 15,953 | | | 655,349 | |
| UST, Inc. Þ | | 13,769 | | | 946,619 | |
| | | | | 2,858,356 | |
| ENERGY 17.6% | | | | | | |
| Energy Equipment & Services 0.4% | | | | | | |
| BJ Services Co. | | 27,370 | | | 328,166 | |
| ENSCO International, Inc. | | 901 | | | 29,201 | |
| Exterran Holdings, Inc. Þ * | | 6,113 | | | 107,283 | |
| Global Industries, Ltd. Þ * | | 3,887 | | | 11,467 | |
| Helmerich & Payne, Inc. | | 9,717 | | | 246,423 | |
| Hercules Offshore, Inc. Þ * | | 8,276 | | | 48,166 | |
| | Shares | | | Value | |
| COMMON STOCKS continued | | | | | | |
| ENERGY continued | | | | | | |
| Energy Equipment & Services continued | | | | | | |
| Key Energy Services, Inc. * | | 9,721 | | $ | 46,175 | |
| Nabors Industries, Ltd. Þ * | | 22,523 | | | 326,583 | |
| Oil States International, Inc. * | | 1,555 | | | 33,308 | |
| Patterson-UTI Energy, Inc. | | 5,494 | | | 68,620 | |
| Pride International, Inc. * | | 4,422 | | | 71,681 | |
| Rowan Companies, Inc. | | 6,817 | | | 118,275 | |
| SEACOR Holdings, Inc. * Þ | | 1,717 | | | 113,545 | |
| Tidewater, Inc. Þ | | 4,618 | | | 182,319 | |
| Unit Corp. * | | 1,041 | | | 29,856 | |
| | | | | 1,761,068 | |
| Oil, Gas & Consumable Fuels 17.2% | | | | | | |
| Anadarko Petroleum Corp. | | 43,600 | | | 1,789,780 | |
| Apache Corp. | | 31,070 | | | 2,401,711 | |
| Cabot Oil & Gas Corp. | | 5,256 | | | 157,522 | |
| Chesapeake Energy Corp. | | 32,270 | | | 554,399 | |
| Chevron Corp. Þ | | 192,644 | | | 15,220,802 | |
| Cimarex Energy Co. Þ | | 7,716 | | | 218,903 | |
| ConocoPhillips | | 143,659 | | | 7,544,971 | |
| Devon Energy Corp. | | 41,554 | | | 3,006,016 | |
| El Paso Corp. | | 51,414 | | | 379,949 | |
| Encore Aquisition Co. * | | 3,713 | | | 98,172 | |
| EOG Resources, Inc. | | 5,735 | | | 487,590 | |
| Exxon Mobil Corp. | | 401,068 | | | 32,145,600 | |
| Forest Oil Corp. * Þ | | 8,266 | | | 144,242 | |
| Helix Energy Solutions, Inc. Þ * | | 7,803 | | | 50,173 | |
| Marathon Oil Corp. | | 65,936 | | | 1,726,204 | |
| Mariner Energy, Inc. * | | 2,208 | | | 24,266 | |
| Newfield Exploration Co. * | | 12,271 | | | 277,079 | |
| Noble Energy, Inc. | | 15,013 | | | 784,880 | |
| Overseas Shipholding Group, Inc. | | 2,098 | | | 77,752 | |
| Petrohawk Energy Corp. * Þ | | 1,332 | | | 23,270 | |
| Pioneer Natural Resources Co. Þ | | 11,134 | | | 223,571 | |
| Plains Exploration & Production Co. * | | 881 | | | 20,395 | |
| Spectra Energy Corp. | | 58,952 | | | 958,560 | |
| St. Mary Land & Exploration Co. | | 3,363 | | | 67,630 | |
| Sunoco, Inc. Þ | | 4,419 | | | 175,611 | |
| Teekay Shipping Corp. Þ | | 3,933 | | | 64,462 | |
| Tesoro Corp. Þ | | 9,095 | | | 83,583 | |
| Valero Energy Corp. | | 49,223 | | | 903,242 | |
| XTO Energy, Inc. | | 45,908 | | | 1,755,522 | |
| | | | | 71,365,857 | |
| FINANCIALS 23.3% | | | | | | |
| Capital Markets 3.0% | | | | | | |
| Allied Capital Corp. Þ | | 16,643 | | | 38,945 | |
| American Capital, Ltd. Þ | | 18,897 | | | 80,123 | |
| Ameriprise Financial, Inc. | | 20,691 | | | 381,956 | |
| Bank of New York Mellon Corp. | | 106,532 | | | 3,218,332 | |
| BlackRock, Inc. Þ | | 440 | | | 55,312 | |
| | Shares | | | Value | |
| COMMON STOCKS continued | | | | | | |
| FINANCIALS continued | | | | | | |
| Capital Markets continued | | | | | | |
| E*TRADE Financial Corp. Þ * | | 32,230 | | $ | 43,511 | |
| Franklin Resources, Inc. | | 6,717 | | | 408,058 | |
| Goldman Sachs Group, Inc. | | 32,823 | | | 2,592,689 | |
| INVESCO, Ltd. Þ | | 31,560 | | | 396,078 | |
| Investment Technology Group, Inc. * | | 346 | | | 5,789 | |
| Janus Capital Group, Inc. Þ | | 1,061 | | | 8,647 | |
| Jefferies Group, Inc. Þ | | 11,720 | | | 145,797 | |
| Legg Mason, Inc. Þ | | 12,961 | | | 233,557 | |
| Merrill Lynch & Co., Inc. | | 142,405 | | | 1,882,594 | |
| MF Global, Ltd. Þ * | | 4,889 | | | 12,809 | |
| Morgan Stanley | | 97,034 | | | 1,431,251 | |
| Northern Trust Corp. | | 1,989 | | | 91,275 | |
| Raymond James Financial, Inc. Þ | | 8,900 | | | 195,533 | |
| State Street Corp. | | 29,248 | | | 1,231,633 | |
| | | | | 12,453,889 | |
| Commercial Banks 6.0% | | | | | | |
| Associated Banc-Corp. | | 11,864 | | | 257,805 | |
| BancorpSouth, Inc. | | 7,671 | | | 170,603 | |
| Bank of Hawaii Corp. | | 4,464 | | | 199,139 | |
| BB&T Corp. | | 50,931 | | | 1,526,402 | |
| BOK Financial Corp. Þ | | 2,073 | | | 96,166 | |
| City National Corp. Þ | | 3,731 | | | 163,716 | |
| Comerica, Inc. Þ | | 14,016 | | | 316,061 | |
| Commerce Bancshares, Inc. | | 5,772 | | | 252,891 | |
| Cullen/Frost Bankers, Inc. | | 5,475 | | | 296,800 | |
| Fifth Third Bancorp Þ | | 46,801 | | | 447,418 | |
| First Citizens Bancshares, Inc., Class A | | 563 | | | 79,130 | |
| First Horizon National Corp. Þ | | 18,791 | | | 200,876 | |
| Fulton Financial Corp. Þ | | 16,206 | | | 180,211 | |
| Huntington Bancshares, Inc. Þ | | 34,108 | | | 272,864 | |
| KeyCorp Þ | | 45,846 | | | 430,035 | |
| M&T Bank Corp. Þ | | 6,122 | | | 393,339 | |
| Marshall & Ilsley Corp. Þ | | 24,140 | | | 372,963 | |
| National City Corp. Þ | | 189,627 | | | 381,150 | |
| PNC Financial Services Group, Inc. Þ | | 32,211 | | | 1,699,774 | |
| Popular, Inc. Þ | | 26,174 | | | 163,588 | |
| Regions Financial Corp. Þ | | 64,712 | | | 659,415 | |
| SunTrust Banks, Inc. Þ | | 32,907 | | | 1,044,139 | |
| Synovus Financial Corp. Þ | | 26,163 | | | 217,676 | |
| TCF Financial Corp. Þ | | 11,780 | | | 196,726 | |
| U.S. Bancorp Þ | | 162,111 | | | 4,373,755 | |
| Valley National Bancorp Þ | | 12,462 | | | 240,890 | |
| Wachovia Corp. ° | | 201,141 | | | 1,130,412 | |
| Wells Fargo & Co. Þ ° | | 307,597 | | | 8,886,477 | |
| Whitney Holding Corp. Þ | | 5,973 | | | 104,707 | |
| Wilmington Trust Corp. | | 6,267 | | | 151,599 | |
| Zions Bancorp Þ | | 10,739 | | | 342,467 | |
| | | | | 25,249,194 | |
| | | | | | |
| | Shares | | | Value | |
| COMMON STOCKS continued | | | | | | |
| FINANCIALS continued | | | | | | |
| Consumer Finance 0.5% | | | | | | |
| American Express Co. | | 15,095 | | $ | 351,864 | |
| AmeriCredit Corp. Þ * | | 10,730 | | | 78,866 | |
| Capital One Financial Corp. Þ | | 34,944 | | | 1,202,423 | |
| Discover Financial Services Þ | | 44,643 | | | 456,698 | |
| SLM Corp. * Þ | | 4,957 | | | 45,654 | |
| Student Loan Corp. | | 367 | | | 13,898 | |
| | | | | 2,149,403 | |
| Diversified Financial Services 6.0% | | | | | | |
| Bank of America Corp. | | 467,274 | | | 7,593,202 | |
| CIT Group, Inc. Þ | | 26,322 | | | 87,915 | |
| Citigroup, Inc. Þ | | 507,053 | | | 4,203,469 | |
| CME Group, Inc., Class A Þ | | 1,842 | | | 390,412 | |
| JPMorgan Chase & Co. | | 364,316 | | | 11,534,245 | |
| Leucadia National Corp. Þ | | 16,537 | | | 323,298 | |
| Liberty Media Corp. - Capital, Ser. A Þ | | 10,380 | | | 34,358 | |
| Moody's Corp. Þ | | 18,346 | | | 398,292 | |
| NASDAQ OMX Group, Inc. Þ * | | 5,729 | | | 123,174 | |
| NYSE Euronext Þ | | 9,823 | | | 233,886 | |
| | | | | 24,922,251 | |
| Insurance 5.0% | | | | | | |
| Alleghany Corp. * | | 475 | | | 125,875 | |
| Allied World Assurance Co. Holdings, Ltd. | | 4,549 | | | 160,853 | |
| Allstate Corp. | | 51,297 | | | 1,304,996 | |
| American International Group, Inc. | | 216,367 | | | 434,898 | |
| American National Insurance Co. | | 1,465 | | | 108,146 | |
| AON Corp. | | 25,861 | | | 1,171,503 | |
| Arch Capital Group, Ltd. * | | 4,283 | | | 290,345 | |
| Arthur J. Gallagher & Co. Þ | | 8,643 | | | 214,346 | |
| Assurant, Inc. | | 11,011 | | | 239,709 | |
| Axis Capital Holdings, Ltd. | | 10,626 | | | 268,944 | |
| Brown & Brown, Inc. | | 8,210 | | | 163,379 | |
| Chubb Corp. | | 34,040 | | | 1,748,294 | |
| Cincinnati Financial Corp. Þ | | 13,570 | | | 396,787 | |
| CNA Financial Corp. Þ | | 2,556 | | | 35,171 | |
| Conseco, Inc. * | | 17,198 | | | 57,957 | |
| Endurance Specialty Holdings, Ltd. | | 4,866 | | | 130,993 | |
| Erie Indemnity Co., Class A | | 2,739 | | | 102,548 | |
| Everest Re Group, Ltd. | | 5,768 | | | 452,557 | |
| Fidelity National Financial, Inc. Þ | | 19,922 | | | 245,638 | |
| First American Corp. | | 8,616 | | | 206,956 | |
| Genworth Financial, Inc., Class A | | 40,316 | | | 58,458 | |
| Hartford Financial Services Group, Inc. | | 29,311 | | | 247,678 | |
| HCC Insurance Holdings, Inc. | | 10,739 | | | 250,326 | |
| Lincoln National Corp. | | 24,151 | | | 331,593 | |
| Loews Corp. | | 29,238 | | | 800,829 | |
| Markel Corp. Þ * | | 925 | | | 284,900 | |
| Marsh & McLennan Cos. | | 47,647 | | | 1,214,998 | |
| MBIA, Inc. Þ | | 19,911 | | | 116,479 | |
| | Shares | | | Value | |
| COMMON STOCKS continued | | | | | | |
| FINANCIALS continued | | | | | | |
| Insurance continued | | | | | | |
| Mercury General Corp. Þ | | 2,477 | | $ | 112,679 | |
| MetLife, Inc. | | 40,707 | | | 1,170,733 | |
| Nationwide Financial Services, Inc., Class A Þ | | 4,299 | | | 218,389 | |
| Old Republic International Corp. | | 21,469 | | | 220,272 | |
| OneBeacon Insurance Group, Ltd. Þ | | 2,251 | | | 24,536 | |
| PartnerRe, Ltd. | | 5,055 | | | 353,648 | |
| Philadelphia Consolidated Holding Co. * | | 3,464 | | | 212,863 | |
| Principal Financial Group, Inc. | | 24,113 | | | 333,001 | |
| Progressive Corp. Þ | | 63,101 | | | 947,777 | |
| Protective Life Corp. | | 6,503 | | | 60,608 | |
| Prudential Financial, Inc. | | 33,455 | | | 725,973 | |
| Reinsurance Group of America, Inc. | | 5,491 | | | 222,935 | |
| RenaissanceRe Holdings, Ltd. | | 5,704 | | | 268,830 | |
| StanCorp Financial Group, Inc. | | 4,560 | | | 151,894 | |
| The Hanover Insurance Group, Inc. | | 4,787 | | | 193,012 | |
| Torchmark Corp. Þ | | 8,364 | | | 302,359 | |
| TransAtlantic Holdings, Inc. | | 1,909 | | | 75,673 | |
| Travelers Companies, Inc. | | 56,320 | | | 2,458,368 | |
| Unitrin, Inc. Þ | | 3,835 | | | 73,402 | |
| Universal American Financial Corp. | | 7,329 | | | 150,171 | |
| UnumProvident Corp. | | 32,258 | | | 480,644 | |
| W.R. Berkley Corp. | | 12,672 | | | 360,265 | |
| Wesco Financial Corp. | | 125 | | | 37,125 | |
| White Mountains Insurance Group, Ltd. | | 824 | | | 222,480 | |
| XL Capital, Ltd., Class A Þ | | 30,811 | | | 154,979 | |
| | | | | 20,697,772 | |
| Real Estate Investment Trusts (REITs) 2.2% | | | | | | |
| Alexandria Real Estate Equities, Inc. | | 2,988 | | | 132,309 | |
| AMB Property Corp. Þ | | 9,125 | | | 157,133 | |
| Annaly Capital Management, Inc. | | 50,081 | | | 719,664 | |
| Apartment Investment & Management Co., Class A Þ | | 5,767 | | | 66,148 | |
| AvalonBay Communities, Inc. | | 7,169 | | | 434,943 | |
| Boston Properties, Inc. Þ | | 11,149 | | | 595,357 | |
| Brandywine Realty Trust | | 8,159 | | | 40,142 | |
| BRE Properties, Inc. | | 4,485 | | | 131,680 | |
| Camden Property Trust Þ | | 1,817 | | | 48,096 | |
| CapitalSource, Inc. Þ | | 18,106 | | | 94,332 | |
| CBL & Associates Properties, Inc. Þ | | 6,177 | | | 25,140 | |
| Developers Diversified Realty Corp. Þ | | 11,156 | | | 53,549 | |
| Digital Realty Trust, Inc. Þ | | 2,144 | | | 58,660 | |
| Douglas Emmett, Inc. Þ | | 11,296 | | | 115,219 | |
| Duke Realty Corp. Þ | | 13,662 | | | 112,165 | |
| Equity Residential Þ | | 25,194 | | | 766,653 | |
| Essex Property Trust, Inc. Þ | | 1,862 | | | 161,007 | |
| Federal Realty Investment Trust Þ | | 3,866 | | | 223,609 | |
| General Growth Properties, Inc. Þ | | 9,993 | | | 13,790 | |
| HCP, Inc. | | 20,672 | | | 427,290 | |
| Health Care REIT, Inc. Þ | | 8,404 | | | 319,352 | |
| Hospitality Properties Trust | | 8,750 | | | 100,275 | |
| | Shares | | | Value | |
| COMMON STOCKS continued | | | | | | |
| FINANCIALS continued | | | | | | |
| Real Estate Investment Trusts (REITs) continued | | | | | | |
| Host Hotels & Resorts, Inc. Þ | | 48,639 | | $ | 365,765 | |
| HRPT Properties Trust | | 20,997 | | | 57,952 | |
| iStar Financial, Inc. Þ | | 12,518 | | | 16,899 | |
| Kilroy Realty Corp. Þ | | 2,777 | | | 84,615 | |
| Kimco Realty Corp. Þ | | 20,085 | | | 284,203 | |
| Liberty Property Trust | | 8,635 | | | 165,101 | |
| Mack-Cali Realty Corp. | | 6,118 | | | 116,058 | |
| Nationwide Health Properties, Inc. Þ | | 8,149 | | | 184,412 | |
| Plum Creek Timber Co., Inc. Þ | | 10,741 | | | 382,272 | |
| ProLogis Þ | | 24,416 | | | 93,513 | |
| Public Storage, Inc. Þ | | 11,784 | | | 823,584 | |
| Rayonier, Inc. Þ | | 6,407 | | | 213,994 | |
| Regency Centers Corp. Þ | | 6,513 | | | 231,928 | |
| SL Green Realty Corp. Þ | | 5,436 | | | 103,067 | |
| UDR, Inc. Þ | | 11,943 | | | 180,698 | |
| Ventas, Inc. Þ | | 10,088 | | | 231,822 | |
| Vornado Realty Trust | | 12,675 | | | 677,479 | |
| Weingarten Realty Investors Þ | | 6,927 | | | 98,779 | |
| | | | | 9,108,654 | |
| Real Estate Management & Development 0.0% | | | | | | |
| CB Richard Ellis Group, Inc., Class A * | | 10,423 | | | 47,529 | |
| Jones Lang LaSalle, Inc. Þ | | 2,966 | | | 70,680 | |
| St. Joe Co. * Þ | | 1,378 | | | 36,393 | |
| | | | | 154,602 | |
| Thrifts & Mortgage Finance 0.6% | | | | | | |
| Astoria Financial Corp. | | 7,839 | | | 144,708 | |
| Capitol Federal Financial | | 1,315 | | | 56,243 | |
| Fannie Mae | | 99,128 | | | 114,988 | |
| Freddie Mac Þ | | 4,999 | | | 5,899 | |
| Hudson City Bancorp, Inc. Þ | | 31,573 | | | 527,585 | |
| MGIC Investment Corp. Þ | | 11,648 | | | 31,683 | |
| New York Community Bancorp, Inc. Þ | | 31,930 | | | 416,686 | |
| People's United Financial, Inc. Þ | | 32,223 | | | 614,493 | |
| Sovereign Bancorp, Inc. Þ | | 41,324 | | | 102,070 | |
| TFS Financial Corp. Þ | | 9,687 | | | 124,284 | |
| Tree.com, Inc. * Þ | | 498 | | | 911 | |
| Washington Federal, Inc. | | 8,176 | | | 138,093 | |
| Webster Financial Corp. Þ | | 4,889 | | | 73,335 | |
| | | | | 2,350,978 | |
| HEALTH CARE 12.4% | | | | | | |
| Biotechnology 1.3% | | | | | | |
| Amgen, Inc. * | | 101,398 | | | 5,631,645 | |
| | | | | | |
| Health Care Equipment & Supplies 0.9% | | | | | | |
| Advanced Medical Optics, Inc. Þ * | | 664 | | | 3,858 | |
| Beckman Coulter, Inc. | | 1,124 | | | 48,984 | |
| Boston Scientific Corp. * | | 130,299 | | | 803,945 | |
| Cooper Cos. Þ | | 4,190 | | | 56,146 | |
| Covidien, Ltd. | | 46,529 | | | 1,714,593 | |
| | Shares | | | Value | |
| COMMON STOCKS continued | | | | | | |
| HEALTH CARE continued | | | | | | |
| Health Care Equipment & Supplies continued | | | | | | |
| Hill-Rom Holdings, Inc. Þ | | 5,018 | | $ | 103,070 | |
| Hologic, Inc. Þ * | | 11,915 | | | 167,525 | |
| Hospira, Inc. * | | 12,684 | | | 380,900 | |
| Inverness Medical Innovations, Inc. * | | 3,570 | | | 62,725 | |
| Zimmer Holdings, Inc. * | | 7,072 | | | 263,927 | |
| | | | | 3,605,673 | |
| Health Care Providers & Services 1.4% | | | | | | |
| Aetna, Inc. | | 16,120 | | | 351,738 | |
| AmerisourceBergen Corp. | | 13,167 | | | 412,785 | |
| Brookdale Senior Living, Inc. Þ | | 3,352 | | | 13,643 | |
| Cardinal Health, Inc. | | 8,376 | | | 272,388 | |
| CIGNA Corp. | | 22,519 | | | 272,705 | |
| Community Health Systems, Inc. * | | 6,946 | | | 90,715 | |
| Coventry Health Care, Inc. * | | 11,244 | | | 140,213 | |
| DaVita, Inc. * | | 1,638 | | | 82,309 | |
| Health Management Associates, Inc., Class A Þ * | | 7,658 | | | 11,181 | |
| Health Net, Inc. * | | 9,454 | | | 85,181 | |
| Henry Schein, Inc. * | | 605 | | | 21,617 | |
| Humana, Inc. * | | 6,808 | | | 205,806 | |
| Lifepoint Hospitals, Inc. Þ * | | 5,049 | | | 101,283 | |
| Lincare Holdings, Inc. Þ * | | 607 | | | 14,525 | |
| McKesson Corp. | | 7,283 | | | 254,468 | |
| Omnicare, Inc. Þ | | 9,200 | | | 221,812 | |
| Pediatrix Medical Group, Inc. * | | 637 | | | 19,823 | |
| Quest Diagnostics, Inc. | | 2,637 | | | 122,805 | |
| Tenet Healthcare Corp. * Þ | | 19,367 | | | 23,434 | |
| UnitedHealth Group, Inc. | | 72,210 | | | 1,517,132 | |
| Universal Health Services, Inc., Class B | | 4,396 | | | 163,311 | |
| WellPoint, Inc. * | | 44,253 | | | 1,575,407 | |
| | | | | 5,974,281 | |
| Health Care Technology 0.1% | | | | | | |
| HLTH Corp. * | | 12,193 | | | 114,249 | |
| IMS Health, Inc. | | 13,207 | | | 173,672 | |
| | | | | 287,921 | |
| Life Sciences Tools & Services 0.3% | | | | | | |
| Charles River Laboratories International, Inc. Þ * | | 3,465 | | | 79,002 | |
| Life Technologies Corp. Þ | | 5,724 | | | 149,396 | |
| PerkinElmer, Inc. | | 6,098 | | | 110,130 | |
| Thermo Fisher Scientific, Inc. * Þ | | 25,708 | | | 917,262 | |
| | | | | 1,255,790 | |
| Pharmaceuticals 8.4% | | | | | | |
| Barr Pharmaceuticals, Inc. * | | 7,086 | | | 463,353 | |
| Bristol-Myers Squibb Co. | | 16,041 | | | 332,049 | |
| Eli Lilly & Co. | | 84,239 | | | 2,876,762 | |
| Endo Pharmaceuticals Holdings, Inc. * Þ | | 1,041 | | | 22,892 | |
| Forest Laboratories, Inc. * | | 25,915 | | | 626,625 | |
| Fresenius Kabi Pharmaceuticals Holding, Inc. * | | 263 | | | 168 | |
| Johnson & Johnson | | 193,446 | | | 11,332,067 | |
| | Shares | | | Value | |
| COMMON STOCKS continued | | | | | | |
| HEALTH CARE continued | | | | | | |
| Pharmaceuticals continued | | | | | | |
| King Pharmaceuticals, Inc. Þ * | | 22,969 | | $ | 220,732 | |
| Merck & Co., Inc. | | 142,744 | | | 3,814,120 | |
| Mylan Laboratories, Inc. Þ * | | 23,138 | | | 217,728 | |
| Pfizer, Inc. | | 630,091 | | | 10,352,395 | |
| Watson Pharmaceuticals, Inc. * Þ | | 4,922 | | | 116,897 | |
| Wyeth | | 124,183 | | | 4,471,830 | |
| | | | | 34,847,618 | |
| INDUSTRIALS 8.7% | | | | | | |
| Aerospace & Defense 1.5% | | | | | | |
| Alliant Techsystems, Inc. * | | 1,735 | | | 142,617 | |
| BE Aerospace, Inc. * | | 646 | | | 5,284 | |
| General Dynamics Corp. | | 37,114 | | | 1,917,680 | |
| L-3 Communications Holdings, Inc. | | 2,570 | | | 172,627 | |
| Northrop Grumman Corp. | | 23,734 | | | 971,907 | |
| Raytheon Co. Þ | | 25,096 | | | 1,224,685 | |
| Spirit AeroSystems Holdings, Inc., Class A * | | 9,749 | | | 88,229 | |
| United Technologies Corp. | | 38,976 | | | 1,891,505 | |
| | | | | 6,414,534 | |
| Air Freight & Logistics 0.5% | | | | | | |
| FedEx Corp. | | 28,878 | | | 2,040,230 | |
| UTi Worldwide, Inc. | | 890 | | | 9,541 | |
| | | | | 2,049,771 | |
| Airlines 0.3% | | | | | | |
| AMR Corp. * Þ | | 12,903 | | | 113,288 | |
| Continental Airlines, Inc., Class B * Þ | | 10,226 | | | 150,118 | |
| Copa Holdings SA, Class A | | 742 | | | 16,450 | |
| Delta Air Lines, Inc. * | | 41,939 | | | 369,483 | |
| Southwest Airlines Co. | | 68,154 | | | 589,532 | |
| | | | | 1,238,871 | |
| Building Products 0.1% | | | | | | |
| Armstrong World Industries, Inc. | | 1,879 | | | 31,943 | |
| Masco Corp. | | 33,688 | | | 322,731 | |
| Owens Corning, Inc. * Þ | | 7,102 | | | 113,277 | |
| USG Corp. * Þ | | 2,813 | | | 26,583 | |
| | | | | 494,534 | |
| Commercial Services & Supplies 0.6% | | | | | | |
| Allied Waste Industries, Inc. * | | 35,444 | | | 380,669 | |
| Avery Dennison Corp. | | 9,917 | | | 308,419 | |
| Cintas Corp. | | 12,267 | | | 294,653 | |
| Corrections Corporation of America * | | 1,327 | | | 24,005 | |
| Pitney Bowes, Inc. | | 1,856 | | | 45,862 | |
| R.R. Donnelley & Sons Co. | | 19,773 | | | 252,303 | |
| Republic Services, Inc. Þ | | 1,067 | | | 25,608 | |
| Steelcase, Inc., Class A Þ | | 5,775 | | | 37,249 | |
| Waste Management, Inc. | | 32,721 | | | 955,453 | |
| | | | | 2,324,221 | |
| | | | | | |
| | Shares | | | Value | |
| COMMON STOCKS continued | | | | | | |
| INDUSTRIALS continued | | | | | | |
| Construction & Engineering 0.1% | | | | | | |
| AECOM Technology Corp. * | | 990 | | $ | 26,225 | |
| KBR, Inc. Þ | | 2,989 | | | 41,159 | |
| Quanta Services, Inc. * | | 3,550 | | | 57,723 | |
| URS Corp. * | | 6,447 | | | 244,728 | |
| | | | | 369,835 | |
| Electrical Equipment 0.1% | | | | | | |
| Cooper Industries, Inc. | | 3,873 | | | 93,494 | |
| Hubbell, Inc., Class B | | 2,942 | | | 87,966 | |
| Thomas & Betts Corp. * | | 5,415 | | | 102,831 | |
| | | | | 284,291 | |
| Industrial Conglomerates 4.0% | | | | | | |
| Carlisle Cos. Þ | | 5,064 | | | 107,509 | |
| General Electric Co. | | 928,334 | | | 15,939,495 | |
| Teleflex, Inc. | | 3,688 | | | 174,737 | |
| Tyco International, Ltd. | | 21,604 | | | 451,524 | |
| | | | | 16,673,265 | |
| Machinery 1.0% | | | | | | |
| AGCO Corp. * Þ | | 2,341 | | | 57,635 | |
| Crane Co. | | 4,722 | | | 69,980 | |
| Danaher Corp. Þ | | 7,121 | | | 396,212 | |
| Dover Corp. | | 2,205 | | | 65,775 | |
| Eaton Corp. | | 8,401 | | | 389,302 | |
| Flowserve Corp. | | 2,935 | | | 147,719 | |
| Gardner Denver, Inc. * | | 4,889 | | | 121,003 | |
| IDEX Corp. Þ | | 851 | | | 19,573 | |
| Illinois Tool Works, Inc. Þ | | 41,448 | | | 1,414,206 | |
| Ingersoll-Rand Co., Ltd., Class A | | 24,076 | | | 377,512 | |
| ITT Corp. | | 4,095 | | | 171,417 | |
| Kennametal, Inc. | | 5,645 | | | 105,561 | |
| Lincoln Electric Holdings, Inc. Þ | | 1,265 | | | 57,798 | |
| Oshkosh Corp. Þ | | 2,103 | | | 14,721 | |
| Pentair, Inc. | | 9,229 | | | 229,433 | |
| Terex Corp. * | | 9,398 | | | 134,015 | |
| Timken Co. | | 7,300 | | | 105,923 | |
| Trinity Industries, Inc. Þ | | 7,539 | | | 112,105 | |
| | | | | 3,989,890 | |
| Marine 0.0% | | | | | | |
| Alexander & Baldwin, Inc. | | 3,847 | | | 99,445 | |
| Professional Services 0.1% | | | | | | |
| Dun & Bradstreet Corp. | | 1,518 | | | 121,440 | |
| Equifax, Inc. Þ | | 5,633 | | | 143,360 | |
| Manpower, Inc. | | 6,830 | | | 215,008 | |
| | | | | 479,808 | |
| Road & Rail 0.4% | | | | | | |
| Avis Budget Group, Inc. * | | 9,416 | | | 7,156 | |
| Con-Way, Inc. | | 3,550 | | | 99,294 | |
| Hertz Global Holdings, Inc. Þ * | | 28,400 | | | 99,116 | |
| Kansas City Southern * Þ | | 1,532 | | | 33,581 | |
| | Shares | | | Value | |
| COMMON STOCKS continued | | | | | | |
| INDUSTRIALS continued | | | | | | |
| Road & Rail continued | | | | | | |
| Norfolk Southern Corp. | | 24,883 | | $ | 1,230,962 | |
| Ryder System, Inc. | | 3,593 | | | 129,025 | |
| | | | | 1,599,134 | |
| Trading Companies & Distributors 0.0% | | | | | | |
| GATX Corp. Þ | | 4,023 | | | 113,247 | |
| United Rentals, Inc. * Þ | | 5,523 | | | 44,571 | |
| Wesco International, Inc. * | | 1,048 | | | 15,500 | |
| | | | | 173,318 | |
| INFORMATION TECHNOLOGY 2.5% | | | | | | |
| Communications Equipment 0.3% | | | | | | |
| ADC Telecommunications, Inc. * Þ | | 10,961 | | | 77,933 | |
| Brocade Communications Systems, Inc. * | | 30,089 | | | 96,886 | |
| EchoStar Corp. Þ * | | 3,623 | | | 61,845 | |
| JDS Uniphase Corp. * | | 9,043 | | | 24,597 | |
| Motorola, Inc. Þ | | 210,045 | | | 905,294 | |
| Tellabs, Inc. * Þ | | 37,015 | | | 154,352 | |
| | | | | 1,320,907 | |
| Computers & Peripherals 0.4% | | | | | | |
| Diebold, Inc. | | 1,005 | | | 28,140 | |
| EMC Corp. * | | 58,146 | | | 614,603 | |
| Lexmark International, Inc., Class A Þ * | | 8,194 | | | 214,519 | |
| NCR Corp. * | | 1,544 | | | 23,438 | |
| QLogic Corp. * | | 12,347 | | | 131,125 | |
| SanDisk Corp. * Þ | | 16,808 | | | 134,464 | |
| Seagate Technology, Inc. | | 23,293 | | | 98,064 | |
| Sun Microsystems, Inc. * | | 72,813 | | | 230,817 | |
| Teradata Corp. * | | 8,536 | | | 114,639 | |
| | | | | 1,589,809 | |
| Electronic Equipment & Instruments 0.4% | | | | | | |
| Arrow Electronics, Inc. * | | 10,652 | | | 146,998 | |
| Avnet, Inc. * | | 7,872 | | | 112,097 | |
| AVX Corp. Þ | | 4,223 | | | 36,909 | |
| Ingram Micro, Inc., Class A * | | 15,659 | | | 168,647 | |
| Jabil Circuit, Inc. | | 10,091 | | | 66,399 | |
| Molex, Inc. Þ | | 9,046 | | | 123,026 | |
| Tech Data Corp. * | | 4,225 | | | 73,684 | |
| Tyco Electronics, Ltd. | | 44,522 | | | 733,723 | |
| Vishay Intertechnology, Inc. * | | 17,356 | | | 75,672 | |
| | | | | 1,537,155 | |
| IT Services 0.3% | | | | | | |
| Affiliated Computer Services, Inc., Class A * | | 6,043 | | | 244,439 | |
| Computer Sciences Corp. * | | 14,077 | | | 392,185 | |
| Convergys Corp. * | | 11,508 | | | 72,385 | |
| DST Systems, Inc. * Þ | | 778 | | | 29,416 | |
| Fidelity National Information Services, Inc. | | 14,047 | | | 241,328 | |
| Genpact, Ltd. * | | 301 | | | 2,387 | |
| Lender Processing Services, Inc. | | 7,024 | | | 154,949 | |
| | Shares | | | Value | |
| COMMON STOCKS continued | | | | | | |
| INFORMATION TECHNOLOGY continued | | | | | | |
| IT Services continued | | | | | | |
| SAIC, Inc. * | | 14,287 | | $ | 254,309 | |
| Unisys Corp. * | | 14,898 | | | 9,982 | |
| | | | | 1,401,380 | |
| Office Electronics 0.2% | | | | | | |
| Xerox Corp. | | 83,742 | | | 585,357 | |
| Zebra Technologies Corp., Class A * Þ | | 400 | | | 8,464 | |
| | | | | 593,821 | |
| Semiconductors & Semiconductor Equipment 0.4% | | | | | | |
| Advanced Micro Devices, Inc. * | | 49,435 | | | 116,667 | |
| Atmel Corp. * | | 15,022 | | | 42,062 | |
| Cree, Inc. Þ * | | 4,902 | | | 77,844 | |
| Fairchild Semiconductor International, Inc. * | | 11,603 | | | 46,296 | |
| Integrated Device Technology, Inc. * | | 8,774 | | | 45,361 | |
| Intel Corp. | | 72,555 | | | 1,001,259 | |
| International Rectifier Corp. * | | 5,268 | | | 61,583 | |
| Intersil Corp., Class A | | 7,597 | | | 68,829 | |
| KLA-Tencor Corp. | | 1,014 | | | 19,073 | |
| Lam Research Corp. Þ * | | 989 | | | 19,978 | |
| LSI Corp. Þ * | | 14,368 | | | 38,506 | |
| Micron Technology, Inc. Þ * | | 62,004 | | | 169,891 | |
| Novellus Systems, Inc. * Þ | | 6,501 | | | 80,547 | |
| Teradyne, Inc. * | | 5,961 | | | 22,592 | |
| | | | | 1,810,488 | |
| Software 0.5% | | | | | | |
| Amdocs, Ltd. * | | 10,559 | | | 198,404 | |
| CA, Inc. | | 19,280 | | | 324,675 | |
| Cadence Design Systems, Inc. Þ * | | 24,016 | | | 92,702 | |
| Compuware Corp. * | | 10,065 | | | 63,913 | |
| McAfee, Inc. * | | 1,437 | | | 43,584 | |
| Novell, Inc. * | | 18,037 | | | 82,068 | |
| Symantec Corp. * Þ | | 78,247 | | | 941,311 | |
| Synopsys, Inc. * | | 13,203 | | | 211,644 | |
| | | | | 1,958,301 | |
| MATERIALS 3.0% | | | | | | |
| Chemicals 1.5% | | | | | | |
| Ashland, Inc. | | 6,294 | | | 60,108 | |
| Cabot Corp. | | 6,003 | | | 124,202 | |
| Celanese Corp., Ser. A Þ | | 1,736 | | | 20,051 | |
| Chemtura Corp. | | 20,728 | | | 34,616 | |
| Cytec Industries, Inc. | | 4,436 | | | 97,725 | |
| Dow Chemical Co. | | 86,657 | | | 1,607,487 | |
| E.I. DuPont de Nemours & Co. | | 83,889 | | | 2,102,258 | |
| Eastman Chemical Co. Þ | | 7,100 | | | 233,590 | |
| FMC Corp. | | 4,272 | | | 186,686 | |
| Huntsman Corp. Þ | | 13,479 | | | 96,375 | |
| Intrepid Potash, Inc. Þ * | | 1,395 | | | 26,784 | |
| Lubrizol Corp. Þ | | 6,345 | | | 222,836 | |
| Nalco Holding Co. | | 960 | | | 10,954 | |
| | Shares | | | Value | |
| COMMON STOCKS continued | | | | | | |
| MATERIALS continued | | | | | | |
| Chemicals continued | | | | | | |
| PPG Industries, Inc. | | 13,602 | | $ | 597,400 | |
| Rohm & Haas Co. Þ | | 1,913 | | | 130,868 | |
| RPM International, Inc. | | 12,024 | | | 144,168 | |
| Scotts Miracle-Gro Co., Class A | | 854 | | | 27,635 | |
| Sigma-Aldrich Corp. Þ | | 5,679 | | | 244,822 | |
| Valhi, Inc. Þ | | 339 | | | 4,746 | |
| Valspar Corp. Þ | | 9,331 | | | 183,074 | |
| | | | | 6,156,385 | |
| Construction Materials 0.1% | | | | | | |
| Eagle Materials, Inc. Þ | | 441 | | | 9,261 | |
| Martin Marietta Materials, Inc. Þ | | 285 | | | 24,977 | |
| Vulcan Materials Co. Þ | | 10,193 | | | 611,376 | |
| | | | | 645,614 | |
| Containers & Packaging 0.4% | | | | | | |
| AptarGroup, Inc. | | 5,156 | | | 172,417 | |
| Ball Corp. | | 7,741 | | | 282,159 | |
| Bemis Co., Inc. | | 9,281 | | | 250,773 | |
| Owens-Illinois, Inc. * | | 11,088 | | | 224,199 | |
| Packaging Corporation of America Þ | | 7,416 | | | 110,721 | |
| Pactiv Corp. * | | 12,181 | | | 304,403 | |
| Sealed Air Corp. | | 14,915 | | | 236,104 | |
| Smurfit-Stone Container Corp. * | | 23,829 | | | 13,583 | |
| Sonoco Products Co. | | 9,267 | | | 232,602 | |
| Temple-Inland, Inc. Þ | | 9,893 | | | 31,262 | |
| | | | | 1,858,223 | |
| Metals & Mining 0.6% | | | | | | |
| Alcoa, Inc. | | 16,929 | | | 182,156 | |
| Carpenter Technology Corp. | | 3,861 | | | 64,324 | |
| Century Aluminum Co. Þ * | | 1,632 | | | 13,301 | |
| Commercial Metals Co. | | 10,628 | | | 127,324 | |
| Freeport-McMoRan Copper & Gold, Inc. Þ | | 35,692 | | | 856,251 | |
| NuCor Corp. | | 23,179 | | | 827,027 | |
| Reliance Steel & Aluminum Co. | | 5,840 | | | 120,421 | |
| Schnitzer Steel Industries, Inc., Class A Þ | | 1,750 | | | 47,250 | |
| Steel Dynamics, Inc. | | 11,012 | | | 90,959 | |
| Titanium Metals Corp. Þ | | 6,507 | | | 54,984 | |
| United States Steel Corp. Þ | | 581 | | | 17,662 | |
| | | | | 2,401,659 | |
| Paper & Forest Products 0.4% | | | | | | |
| Domtar Corp. * | | 45,723 | | | 64,012 | |
| International Paper Co. | | 39,828 | | | 495,859 | |
| MeadWestvaco Corp. | | 16,180 | | | 188,659 | |
| Weyerhaeuser Co. Þ | | 19,676 | | | 740,211 | |
| | | | | 1,488,741 | |
| TELECOMMUNICATION SERVICES 6.5% | | | | | | |
| Diversified Telecommunication Services 6.2% | | | | | | |
| AT&T, Inc. | | 553,327 | | | 15,803,019 | |
| CenturyTel, Inc. Þ | | 9,821 | | | 260,846 | |
| | Shares | | | Value | |
| COMMON STOCKS continued | | | | | | |
| TELECOMMUNICATION SERVICES continued | | | | | | |
| Diversified Telecommunication Services continued | | | | | | |
| Embarq Corp. | | 6,830 | | $ | 222,931 | |
| Frontier Communications Corp. | | 23,495 | | | 204,877 | |
| Qwest Communications International, Inc. Þ | | 70,462 | | | 225,479 | |
| Verizon Communications, Inc. | | 265,499 | | | 8,668,542 | |
| Windstream Corp. Þ | | 20,913 | | | 185,289 | |
| | | | | 25,570,983 | |
| Wireless Telecommunication Services 0.3% | | | | | | |
| Clearwire Corp. * Þ | | 669 | | | 4,429 | |
| Crown Castle International Corp. * | | 20,859 | | | 293,486 | |
| Leap Wireless International, Inc. * Þ | | 4,471 | | | 89,420 | |
| Sprint Nextel Corp. | | 258,630 | | | 721,577 | |
| Telephone & Data Systems, Inc. | | 5,569 | | | 180,714 | |
| U.S. Cellular Corp. * | | 911 | | | 35,921 | |
| | | | | 1,325,547 | |
| UTILITIES 7.0% | | | | | | |
| Electric Utilities 4.0% | | | | | | |
| American Electric Power Co., Inc. | | 37,403 | | | 1,170,340 | |
| Consolidated Edison, Inc. Þ | | 25,392 | | | 1,025,583 | |
| DPL, Inc. Þ | | 9,767 | | | 203,349 | |
| Duke Energy Corp. | | 117,783 | | | 1,832,704 | |
| Edison International | | 30,345 | | | 1,013,523 | |
| Entergy Corp. | | 5,208 | | | 443,201 | |
| Exelon Corp. | | 30,549 | | | 1,717,159 | |
| FirstEnergy Corp. | | 28,391 | | | 1,663,145 | |
| FPL Group, Inc. Þ | | 38,011 | | | 1,853,416 | |
| Great Plains Energy, Inc. | | 11,041 | | | 207,460 | |
| Hawaiian Electric Industries, Inc. Þ | | 7,831 | | | 213,551 | |
| Mirant Corp. Þ * | | 6,225 | | | 107,195 | |
| Northeast Utilities | | 14,477 | | | 337,314 | |
| NRG Energy, Inc. * Þ | | 13,689 | | | 324,292 | |
| NV Energy, Inc. | | 16,037 | | | 152,031 | |
| Pepco Holdings, Inc. | | 18,757 | | | 337,438 | |
| Pinnacle West Capital Corp. | | 9,373 | | | 284,939 | |
| Progress Energy, Inc. | | 24,339 | | | 966,015 | |
| Southern Co. Þ | | 71,456 | | | 2,595,282 | |
| | | | | 16,447,937 | |
| Gas Utilities 0.4% | | | | | | |
| AGL Resources, Inc. | | 7,128 | | | 214,624 | |
| Atmos Energy Corp. | | 8,400 | | | 209,412 | |
| Energen Corp. | | 5,415 | | | 166,782 | |
| National Fuel Gas Co. | | 7,567 | | | 246,155 | |
| ONEOK, Inc. | | 9,712 | | | 284,950 | |
| Questar Corp. | | 10,023 | | | 322,640 | |
| Southern Union Co. | | 10,383 | | | 142,662 | |
| UGI Corp. | | 9,958 | | | 232,619 | |
| | | | | 1,819,844 | |
| | | | | | |
| | Shares | | | Value | |
| COMMON STOCKS continued | | | | | | |
| UTILITIES continued | | | | | | |
| Independent Power Producers & Energy Traders 0.1% | | | | | | |
| Constellation Energy Group, Inc. | | 1,412 | | $ | 34,552 | |
| Dynegy, Inc., Class A Þ * | | 46,118 | | | 102,843 | |
| Reliant Energy, Inc. * | | 32,229 | | | 184,994 | |
| | | | | 322,389 | |
| Multi-Utilities 2.4% | | | | | | |
| Alliant Energy Corp. | | 10,286 | | | 327,815 | |
| Ameren Corp. | | 19,510 | | | 694,166 | |
| CenterPoint Energy, Inc. | | 11,221 | | | 145,088 | |
| CMS Energy Corp. Þ | | 20,982 | | | 213,177 | |
| Dominion Resources, Inc. | | 53,833 | | | 1,982,131 | |
| DTE Energy Co. | | 15,195 | | | 565,102 | |
| Integrys Energy Group, Inc. | | 7,118 | | | 314,473 | |
| MDU Resources Group, Inc. | | 17,032 | | | 346,261 | |
| NiSource, Inc. | | 25,539 | | | 307,745 | |
| NSTAR | | 9,948 | | | 353,154 | |
| OGE Energy Corp. | | 8,566 | | | 226,913 | |
| PG&E Corp. | | 33,274 | | | 1,265,743 | |
| Puget Energy, Inc. | | 12,078 | | | 295,669 | |
| SCANA Corp. | | 10,866 | | | 377,594 | |
| Sempra Energy | | 23,316 | | | 1,088,158 | |
| TECO Energy, Inc. Þ | | 19,629 | | | 255,177 | |
| Vectren Corp. | | 7,542 | | | 212,383 | |
| Wisconsin Energy Corp. Þ | | 10,890 | | | 473,279 | |
| Xcel Energy, Inc. | | 40,129 | | | 754,826 | |
| | | | | 10,198,854 | |
| Water Utilities 0.1% | | | | | | |
| American Water Works Co., Inc. | | 5,886 | | | 119,368 | |
| Aqua America, Inc. Þ | | 12,446 | | | 269,954 | |
| | | | | 389,322 | |
| Total Common Stocks (cost $565,098,668) | | | | | 409,283,669 | |
| EXCHANGE TRADED FUND 1.2% | | | | | | |
| iShares Russell 1000 Value Index Fund Þ (cost $6,501,653) | | 104,762 | | | 5,153,243 | |
| | | | | | |
| | Principal Amount | | | Value | |
| SHORT-TERM INVESTMENTS 26.9% | | | | | | |
| U.S. TREASURY OBLIGATIONS 0.1% | | | | | | |
| U.S. Treasury Bills: | | | | | | |
| 0.07%, 02/26/2009 ß ƒ | $ | 165,000 | | | 164,986 | |
| 0.13%, 02/12/2009 ß ƒ | | 30,000 | | | 29,998 | |
| 0.18%, 01/08/2009 ß ƒ | | 30,000 | | | 29,999 | |
| 0.53%, 01/15/2009 ß ƒ | | 20,000 | | | 19,999 | |
| 1.09%, 01/22/2009 ß ƒ | | 25,000 | | | 24,999 | |
| | | | | 269,981 | |
| | | | | | |
| | Shares | | | Value | |
| SHORT-TERM INVESTMENTS continued | | | | | | |
| MUTUAL FUND SHARES 26.8% | | | | | | |
| Evergreen Institutional Money Market Fund, Class I, 2.09% q ø | | 427,520 | | $ | 427,520 | |
| State Street Navigator Securities Lending Prime Portfolio, 1.99% § ÞÞ | | 111,509,353 | | | 111,509,353 | |
| | | | | 111,936,873 | |
| Total Short-Term Investments (cost $112,206,742) | | | | | 112,206,854 | |
| Total Investments (cost $683,807,063) 126.4% | | | | | 526,643,766 | |
| Other Assets and Liabilities (26.4%) | | | | | (110,049,250 | ) |
| Net Assets 100.0% | | | | $ | 416,594,516 | |
| * | Non-income producing security |
| Þ | All or a portion of this security is on loan. |
| ° | Investment in non-controlled affiliate. At November 30, 2008, the Fund owned shares of Wachovia Corporation with a cost basis of $8,154,812 and shares of Wells Fargo & Co. with a cost basis of $8,183,166. The Fund earned $20,299 of income from Wachovia Corporation for the six months ended November 30, 2008 and $104,035 of income from Wells Fargo & Co. for the period from October 3, 2008 to November 30, 2008, which is included in income from affiliates. |
| ß | Rate shown represents the yield to maturity at date of purchase. |
| ƒ | All or a portion of this security was pledged to cover initial margin requirements for open futures contracts. |
| q | Rate shown is the 7-day annualized yield at period end. |
| ø | Evergreen Investment Management Company, LLC is the investment advisor to both the Fund and the money market fund. |
| § | Rate shown is the 1-day annualized yield at period end. |
| ÞÞ | All or a portion of this security represents investment of cash collateral received from securities on loan. |
The following table shows the percent of total long-term investments by sector as of November 30, 2008:
| Financials | 23.4 | % | | | |
| Energy | 17.7 | % | | | |
| Health Care | 12.5 | % | | | |
| Consumer Staples | 9.6 | % | | | |
| Industrials | 8.7 | % | | | |
| Consumer Discretionary | 7.9 | % | | | |
| Utilities | 7.0 | % | | | |
| Telecommunication Services | 6.5 | % | | | |
| Materials | 3.0 | % | | | |
| Information Technology | 2.5 | % | | | |
| Other | 1.2 | % | | | |
| 100.0 | % | | | |
Market Index Value Fund STATEMENT OF ASSETS AND LIABILITIES |
November 30, 2008 (unaudited) |
| Assets | | | |
| Investments in securities, at value (cost $667,041,565) including $110,176,723 of securities loaned | $ | 516,199,357 | |
| Investments in affiliates, at value (cost $16,765,498) | | 10,444,409 | |
| Total investments | | 526,643,766 | |
| Dividends receivable | | 1,645,241 | |
| Receivable for daily variation margin on open futures contracts | | 20,475 | |
| Receivable for securities lending income | | 85,752 | |
| Receivable from investment advisor | | 3,885 | |
| Total assets | | 528,399,119 | |
| Liabilities | | | |
| Payable for securities purchased | | 225,996 | |
| Payable for securities on loan | | 111,509,353 | |
| Due to related parties | | 3,609 | |
| Trustees' fees and expenses payable | | 20,833 | |
| Custodian and accounting fees payable | | 22,022 | |
| Accrued expenses and other liabilities | | 22,790 | |
| Total liabilities | | 111,804,603 | |
| Net assets | $ | 416,594,516 | |
| Net assets represented by | | | |
| Paid-in capital | $ | 498,591,811 | |
| Undistributed net investment income | | 28,351,778 | |
| Accumulated net realized gains on investments | | 47,117,218 | |
| Net unrealized losses on investments | | (157,466,291 | ) |
| Total net assets | $ | 416,594,516 | |
| Shares outstanding (unlimited number of shares authorized) | | | |
| Class I | | 49,186,620 | |
| Net asset value per share | | | |
| Class I | $ | 8.47 | |
Market Index Value Fund STATEMENT OF OPERATIONS |
Six Months Ended November 30, 2008 (unaudited) |
| Investment income | | | |
| Dividends (net of foreign withholding taxes of $309) | $ | 8,636,959 | |
| Securities lending | | 435,460 | |
| Income from affiliates | | 131,734 | |
| Interest | | 889 | |
| Total investment income | | 9,205,042 | |
| Expenses | | | |
| Advisory fee | | 861,028 | |
| Administrative services fee | | 269,072 | |
| Transfer agent fees | | 109 | |
| Trustees' fees and expenses | | 4,667 | |
| Printing and postage expenses | | 4,825 | |
| Custodian and accounting fees | | 64,647 | |
| Professional fees | | 19,771 | |
| Interest expense | | 470 | |
| Other | | 9,111 | |
| Total expenses | | 1,233,700 | |
| Less: Expense reductions | | (1,237 | ) |
| Fee waivers and expense reimbursements | | (1,166,071 | ) |
| Net expenses | | 66,392 | |
| Net investment income | | 9,138,650 | |
| Net realized and unrealized gains or losses on investments | | | |
| Net realized gains or losses on: | | | |
| Securities | | 11,311,979 | |
| Futures contracts | | (175,352 | ) |
| Net realized gains on investments | | 11,136,627 | |
| Net change in unrealized gains or losses on investments | | (244,738,619 | ) |
| Net realized and unrealized gains or losses on investments | | (233,601,992 | ) |
| Net decrease in net assets resulting from operations | $ | (224,463,342 | ) |
Market Index Value Fund STATEMENTS OF CHANGES IN NET ASSETS |
| Six Months Ended
November 30, 2008
(unaudited) | Year Ended
May 31, 2008 |
| Operations | | | | | | | | | | |
| Net investment income | | | $ | 9,138,650 | | | | $ | 19,888,249 | |
| Net realized gains on investments | | | | 11,136,627 | | | | | 35,627,773 | |
| Net change in unrealized gains or losses on investments | | | | (244,738,619 | ) | | | | (159,115,269 | ) |
| Net decrease in net assets resulting from operations | | | | (224,463,342 | ) | | | | (103,599,247 | ) |
| Distributions to shareholders from | | | | | | | | | | |
| Net investment income | | | | 0 | | | | | (16,404,231 | ) |
| Net realized gains | | | | 0 | | | | | (26,889,734 | ) |
| Total distributions to shareholders | | | | 0 | | | | | (43,293,965 | ) |
| Shares | | | | | Shares | | | | |
| Capital share transactions | | | | | | | | | | |
| Net asset value of shares issued in reinvestment of distributions | 0 | | | 0 | | 3,138,747 | | | 43,293,965 | |
| Payment for shares redeemed | (1,325,088 | ) | | (15,000,000 | ) | (6,213,595 | ) | | (80,000,000 | ) |
| Net decrease in net assets resulting from capital share transactions | | | | (15,000,000 | ) | | | | (36,706,035 | ) |
| Total decrease in net assets | | | | (239,463,342 | ) | | | | (183,599,247 | ) |
| Net assets | | | | | | | | | | |
| Beginning of period | | | | 656,057,858 | | | | | 839,657,105 | |
| End of period | | | $ | 416,594,516 | | | | $ | 656,057,858 | |
| Undistributed net investment income | | | $ | 28,351,778 | | | | $ | 19,213,128 | |
| COMBINED NOTES TO FINANCIAL STATEMENTS (unaudited) |
1. ORGANIZATION
Evergreen Market Index Fund ("Market Index Fund"), Evergreen Market Index Growth Fund ("Market Index Growth Fund") and Evergreen Market Index Value Fund ("Market Index Value Fund"), (collectively, the "Funds") are each a diversified series of Evergreen Equity Trust (the "Trust"), a Delaware statutory trust organized on September 18, 1997. The Trust is an open-end management investment company registered under the Investment Company Act of 1940, as amended (the "1940 Act").
Each Fund offers Class I shares. Class I shares are sold without a front-end sales charge or contingent deferred sales charge.
2. SIGNIFICANT ACCOUNTING POLICIES
The following is a summary of significant accounting policies consistently followed by each Fund in the preparation of its financial statements. The policies are in conformity with generally accepted accounting principles in the United States of America, which require management to make estimates and assumptions that affect amounts reported herein. Actual results could differ from these estimates.
a. Valuation of investments
Listed equity securities are usually valued at the last sales price or official closing price on the national securities exchange where the securities are principally traded.
Foreign securities traded on an established exchange are valued at the last sales price on the exchange where the security is primarily traded. If there has been no sale, the securities are valued at the mean between bid and asked prices. Foreign securities may be valued at fair value according to procedures approved by the Board of Trustees if the closing price is not reflective of current market values due to trading or events occurring in the foreign markets between the close of the established exchange and the valuation time of the Fund. In addition, substantial changes in values in the U.S. markets subsequent to the close of a foreign market may also affect the values of securities traded in the foreign market. The value of foreign securities may be adjusted if such movements in the U.S. market exceed a specified threshold.
Short-term securities with remaining maturities of 60 days or less at the time of purchase are valued at amortized cost, which approximates market value.
Investments in open-end mutual funds are valued at net asset value. Securities for which market quotations are not readily available or not reflective of current market value are valued at fair value as determined by the investment advisor in good faith, according to procedures approved by the Board of Trustees.
b. Futures contracts
In order to gain exposure to, or protect against changes in, security values, each Fund may buy and sell futures contracts. The primary risks associated with the use of futures contracts are the imperfect correlation between changes in market values of securities held by each Fund and the prices of futures contracts, and the possibility of an illiquid market.
Futures contracts are valued based upon their quoted daily settlement prices. The aggregate principal amounts of the contracts are not recorded in each Fund's financial statements. Fluctuations in the value of the contracts are recorded in each Statement of Assets and Liabilities as an asset or liability and in each Statement of Operations as unrealized gains or losses until the contracts are closed, at which point they are recorded as net realized gains or losses on futures contracts..
c. Securities lending
Each Fund may lend its securities to certain qualified brokers in order to earn additional income. The Funds receive compensation in the form of fees or interest earned on the investment of any cash collateral received. The Funds also continue to receive interest and dividends on the securities loaned. The Funds receive collateral in the form of cash or securities with a market value at least equal to the market value of the securities on loan. In the event of default or bankruptcy by the borrower, the Funds could experience delays and costs in recovering the loaned securities or in gaining access to the collateral. Each Fund has the right under the lending agreement to recover the securities from the borrower on demand.
d. Security transactions and investment income
Security transactions are recorded on trade date. Realized gains and losses are computed using the specific cost of the security sold. Interest income is recorded on the accrual basis and includes accretion of discounts and amortization of premiums. Dividend income is recorded on the ex-dividend date. Foreign income and capital gains realized on some securities may be subject to foreign taxes, which are accrued as applicable.
e. Federal and other taxes
Each Fund intends to continue to qualify as a regulated investment company and distribute all of its taxable income, including any net capital gains (which have already been offset by available capital loss carryovers). Accordingly, no provision for federal taxes is required. The Funds have adopted the provisions of FASB Interpretation No. 48, Accounting for Uncertainty in Income Taxes ("FIN 48") which prescribes a minimum threshold for financial statement recognition of the benefit of a tax position taken or expected to be taken in a tax return. The Funds' financial statements have not been impacted by the adoption of FIN 48.
f. Distributions
Distributions to shareholders from net investment income and net realized gains, if any, are recorded on the ex-dividend date. Such distributions are determined in conformity with income tax regulations, which may differ from generally accepted accounting principles.
3. ADVISORY FEE AND OTHER TRANSACTIONS WITH AFFILIATES
Evergreen Investment Management Company, LLC ("EIMC"), an indirect, wholly-owned subsidiary of Wachovia Corporation ("Wachovia"), is the investment advisor to the Funds and is paid an annual fee starting at 0.32% and declining to 0.25% as the average daily net assets of each Fund increase. For the six months ended November 30, 2008, the advisory fee was equivalent to an annual rate of 0.32% of each Fund's average daily net assets.
On October 3, 2008, Wells Fargo & Company ("Wells Fargo") and Wachovia announced that Wells Fargo agreed to acquire Wachovia in a whole company transaction that will include all of Wachovia's banking and other businesses. In connection with this transaction, Wachovia issued preferred shares to Wells Fargo representing approximately a 40% voting interest in Wachovia. Due to its ownership of preferred shares, Wells Fargo may be deemed to control EIMC. If Wells Fargo is deemed to control EIMC, then the existing advisory agreement between the Funds and EIMC would have terminated automatically in connection with the issuance of preferred shares. To address this possibility, on October 20, 2008 the Board of Trustees approved an interim advisory agreement with EIMC with the same terms and conditions as the existing agreement which became effective upon the issuance of the preferred shares. EIMC's receipt of the advisory fees under the interim advisory agreement is subject to the approval by shareholders of the Funds of a new advisory agreement with EIMC.
From time to time, EIMC may voluntarily or contractually waive its fee and/or reimburse expenses in order to limit operating expenses. During the six months ended November 30, 2008, EIMC waived its advisory fees and reimbursed other expenses as follows:
| Fees Contractually Waived | Other Expenses Contractually Reimbursed | Other Expenses Voluntarily Reimbursed |
| Market Index Fund | $466,984 | $121,424 | $ 58,370 |
| Market Index Growth Fund | 947,809 | 122,076 | 207,324 |
| Market Index Value Fund | 861,028 | 116,707 | 188,336 |
Each Fund may invest in money market funds which are advised by EIMC. Income earned on these investments is included in income from affiliate(s) on each Fund's Statement of Operations.
EIMC also serves as the administrator to the Funds and is paid an annual rate determined by applying percentage rates to the aggregate average daily net assets of the Evergreen funds (excluding money market funds) starting at 0.10% and declining to 0.05% as the aggregate average daily net assets of the Evergreen funds (excluding money market funds) increase. For the six months ended November 30, 2008, the administrative services fee was equivalent to an annual rate of 0.10% of each Fund's average daily net assets.
Evergreen Service Company, LLC ("ESC"), an indirect, wholly-owned subsidiary of Wachovia, is the transfer and dividend disbursing agent for the Funds. ESC receives account fees that vary based on the type of account held by the shareholders in each Fund.
4. INVESTMENT TRANSACTIONS
Cost of purchases and proceeds from sales of investment securities (excluding short-term securities) were as follows for the six months ended November 30, 2008:
| | | | |
| Cost of Purchases | Proceeds from Sales |
| Market Index Fund | $ | 12,151,576 | | $ | 4,861,055 | |
| Market Index Growth Fund | | 118,963,333 | | | 132,784,569 | |
| Market Index Value Fund | | 119,368,335 | | | 119,324,459 | |
At November 30, 2008, Market Index Fund had open long futures contracts outstanding as follows:
| Expiration | Contracts | Initial Contract Amount | Value at
November 30, 2008 | Unrealized
Gain (Loss) |
| December 2008 | 23 E-mini S&P 500 Futures | $ | 1,034,607 | | $ | 1,029,595 | | $ | (5,012 | ) |
At November 30, 2008, Market Index Growth Fund had open long futures contracts outstanding as follows:
| Expiration | Contracts | Initial Contract Amount | Value at
November 30, 2008 | Unrealized Gain (Loss) |
| December 2008 | 23 E-mini S&P 500 Futures | $ | 1,367,718 | | $ | 1,029,595 | | $ | (338,123 | ) |
| December 2008 | 2 S&P 500 Futures | | 410,564 | | | 447,650 | | | 37,086 | |
At November 30, 2008, Market Index Value Fund had open long futures contracts outstanding as follows:
| Expiration | Contracts | Initial Contract Amount | Value at
November 30, 2008 | Unrealized
Gain (Loss) |
| December 2008 | 35 E-mini S&P 500 Futures | $ | 1,756,742 | | $ | 1,566,775 | | $ | (189,967 | ) |
| December 2008 | 2 S&P 500 Futures | | 560,677 | | | 447,650 | | | (113,027 | ) |
During the six months ended November 30, 2008, each Fund loaned securities to certain brokers. At November 30, 2008, the value of securities on loan and the total value of collateral (including the market value of U.S. Treasury obligations and U.S. government agency obligations received as non-cash collateral) were as follows:
| Value of
Securities on Loan | Total Value of Collateral | Value of Cash Collateral | Value of Non-Cash Collateral |
| Market Index Fund | $ | 52,503,676 | $ | 53,230,099 | | $ | 53,090,268 | | $ | 139,831 | |
| Market Index Growth Fund | | 108,541,811 | | 111,054,307 | | | 110,984,807 | | | 69,500 | |
| Market Index Value Fund | | 110,176,723 | | 111,727,827 | | | 111,509,353 | | | 218,474 | |
On November 30, 2008, composition of unrealized appreciation and depreciation on securities based on the aggregate cost of securities for federal income tax purposes was as follows:
| Tax Cost | Gross Unrealized
Appreciation | Gross Unrealized
Depreciation | Net Unrealized
Depreciation |
| Market Index Fund | $ | 282,433,776 | | $ | 55,432,540 | | $ | 57,917,190 | $ | 2,484,650 | |
| Market Index Growth Fund | | 594,767,047 | | | 59,498,250 | | | 112,032,339 | | 52,534,089 | |
| Market Index Value Fund | | 685,658,061 | | | 49,983,856 | | | 208,998,151 | | 159,014,295 | |
On June 1, 2008, each Fund implemented Statement of Financial Accounting Standards No. 157, Fair Value Measurements ("FAS 157"). FAS 157 establishes a single authoritative definition of fair value, establishes a framework for measuring fair value and expands disclosures about fair value measurements. FAS 157 establishes a fair value hierarchy based upon the various inputs used in determining the value of the Fund's investments. These inputs are summarized into three broad levels as follows:
Level 1 – quoted prices in active markets for identical securities
Level 2 – other significant observable inputs (including quoted prices for similar
securities, interest rates, prepayment speeds, credit risk, etc.)
Level 3 – significant unobservable inputs (including the Fund's own assumptions
in determining the fair value of investments)
The inputs or methodologies used for valuing securities are not necessarily an indication of the risk associated with investing in those securities.
As of November 30, 2008, the inputs used in valuing Market Index Fund's assets, which are carried at fair value, were as follows:
| Valuation Inputs | Investments in Securities | Other Financial Instruments* |
| Level 1 - Quoted Prices | $279,949,126 | $(5,012) |
| Level 2 - Other Signifigant Observable Inputs | 0 | 0 |
| Level 3 - Other Signifigant Unobservable Inputs | 0 | 0 |
| Total | $279,949,126 | $(5,012) |
| * Other financial instruments include futures. | | |
As of November 30, 2008, the inputs used in valuing Market Index Growth Fund's assets, which are carried at fair value, were as follows:
| Valuation Inputs | Investments in Securities | Other Financial Instruments* |
| Level 1 - Quoted Prices | $542,232,958 | $(301,037) |
| Level 2 - Other Signifigant Observable Inputs | 0 | 0 |
| Level 3 - Other Signifigant Unobservable Inputs | 0 | 0 |
| Total | $542,232,958 | $(301,037) |
| * Other financial instruments include futures. | | |
As of November 30, 2008, the inputs used in valuing Market Index Value Fund's assets, which are carried at fair value, were as follows:
| Valuation Inputs | Invesmtents in Securities | Other Financial Instruments* |
| Level 1 - Quoted Prices | $526,643,766 | $(302,994) |
| Leve 2 - Other Significant Observable Inputs | 0 | 0 |
| Level 3 - Significant Unobservable Inputs | 0 | 0 |
| Total | $526,643,766 | $(302,994) |
| * Other financial instruments include futures. | | |
5. INTERFUND LENDING
Pursuant to an Exemptive Order issued by the SEC, the Funds may participate in an interfund lending program with certain funds in the Evergreen fund family. This program allows the Funds to borrow from, or lend money to, other participating funds. During the six months ended November 30, 2008, the Funds did not participate in the interfund lending program.
6. EXPENSE REDUCTIONS
Through expense offset arrangements with ESC and the Funds' custodian, a portion of fund expenses for each Fund has been reduced.
7. DEFERRED TRUSTEES' FEES
Each Trustee of the Funds may defer any or all compensation related to performance of his or her duties as a Trustee. The Trustees' deferred balances are allocated to deferral accounts, which are included in the accrued expenses for each Fund. The investment performance of the deferral accounts is based on the investment performance of certain Evergreen funds. Any gains earned or losses incurred in the deferral accounts are reported in each Fund's Trustees' fees and expenses. At the election of the Trustees, the deferral account will be paid either in one lump sum or in quarterly installments for up to ten years.
8. FINANCING AGREEMENT
The Funds and certain other Evergreen funds share in an unsecured revolving credit commitment for temporary and emergency purposes, including the funding of redemptions, as permitted by each participating fund's borrowing restrictions. Borrowings under this facility bear interest at 0.50% per annum above the Federal Funds rate. All of the participating funds are charged an annual commitment fee on the unused balance, which is allocated pro rata. The credit facility is for $100 million with an annual commitment fee of 0.08%.
During the six months ended November 30, 2008, Market Index Growth Fund had average borrowings outstanding of $3,177 (on an annualized basis) at an average rate of 3.55% and paid interest of $113 and Market Index Value Fund had average borrowings outstanding of $13,232 (on an annualized basis) at an average rate of 3.55% and paid interest of $470. During the six months ended November 30, 2008, Market Index Fund had no borrowings.
9. REGULATORY MATTERS AND LEGAL PROCEEDINGS
The Evergreen funds, EIMC and certain of EIMC's affiliates are involved in various legal actions, including private litigation and class action lawsuits. In addition, certain Evergreen funds, EIMC and certain of EIMC's affiliates are currently, and may in the future be, subject to regulatory inquiries and investigations.
The SEC and the Secretary of the Commonwealth, Securities Division, of the Commonwealth of Massachusetts are conducting separate investigations of EIMC and EIS concerning alleged issues surrounding the drop in net asset value of the Evergreen Ultra Short Opportunities Fund (the "Ultra Short Fund") in May and June 2008. In addition, three purported class actions have been filed in the U.S. District Court for the District of Massachusetts relating to the same events; defendants include various Evergreen entities and Evergreen Fixed Income Trust and its Trustees. The cases generally allege that investors in the Ultra Short Fund suffered losses as a result of (i) misleading statements in Ultra Short Fund's prospectus, (ii) the failure to accurately price securities in the Ultra Short Fund at different points in time and (iii) the failure of the Ultra Short Fund's risk disclosures and description of its investment strategy to inform investors adequately of the actual risks of the fund.
EIMC does not expect that any of the legal actions, inquiries or investigations currently pending or threatened will have a material adverse impact on the financial position or operations of any of the Evergreen funds to which these financial statements relate. Any publicity surrounding or resulting from any legal actions or regulatory inquiries involving EIMC or its affiliates or any of the Evergreen Funds could result in reduced sales or increased redemptions of Evergreen fund shares, which could increase Evergreen fund transaction costs or operating expenses or have other adverse consequences on the Evergreen funds.
10. NEW ACCOUNTING PRONOUNCEMENTS
In March 2008, FASB issued Statement of Financial Accounting Standards No. 161, Disclosures about Derivative Instruments and Hedging Activities ("FAS 161"), an amendment of FASB Statement No. 133. FAS 161 requires enhanced disclosures about (a) how and why a fund uses derivative instruments, (b) how derivative instruments and hedging activities are accounted for, and (c) how derivative instruments and related hedging activities affect a fund's financial position, financial performance, and cash flows. Management of the Funds does not believe the adoption of FAS 161 will materially impact the financial statement amounts, but will require additional disclosures. This will include qualitative and quantitative disclosures on derivative positions existing at period end and the effect of using derivatives during the reporting period. FAS 161 is effective for financial statements issued for fiscal years and interim periods beginning after November 15, 2008.
In September 2008, FASB issued FASB Staff Position No. FAS 133-1 and FIN 45-4, Disclosures about Credit Derivatives and Certain Guarantees: An Amendment of FASB Statement No. 133 and FASB Interpretation No. 45; and Clarification of the Effective Date of FASB Statement No. 161. This FASB Staff Position (1) amends FASB Statement No. 133 to require disclosures by sellers of credit derivatives, including credit derivatives embedded in a hybrid instrument (2) amends FASB Interpretation No. 45 to require additional disclosure about the current status of the payment/performance risk of a guarantee and (3) clarifies the effective date of FAS 161. This FASB Staff Position is effective for reporting periods (annual or interim) ending after November 15, 2008. The adoption of this FASB Staff Position did not require additional disclosures to each Fund's financial statements.
Market Index Fund ADDITIONAL INFORMATION (unaudited) |
INFORMATION ABOUT THE REVIEW AND APPROVAL OF THE FUND'S INVESTMENT ADVISORY AGREEMENT
Each year, the Fund's Board of Trustees determines whether to approve the continuation of the Fund's investment advisory agreements. In September 2008, the Trustees, including a majority of the Trustees who are not "interested persons" (as that term is defined in the 1940 Act) of the Fund or EIMC (the "independent Trustees"), approved the continuation of the Fund's investment advisory agreements. (References below to the "Fund" are to Evergreen Market Index Fund; references to the "funds" are to the Evergreen funds generally.)
At the same time, the Trustees considered the continuation of the investment advisory agreements for all of the funds. The description below refers in many cases to the Trustees' process for considering, and conclusions regarding, all of the funds' agreements. In all of its deliberations, the Board of Trustees and the independent Trustees were advised by independent counsel to the independent Trustees and counsel to the funds.
The review process. In connection with its review of the funds' investment advisory agreements, the Board of Trustees requests and evaluates, and EIMC and any sub-advisors furnish, such information as the Trustees consider to be reasonably necessary in the circumstances. The Trustees began their 2008 review process at the time of the last advisory contract-renewal process in September 2007. In the course of their 2007 review, the Trustees identified a number of funds that had experienced either short-term or longer-term performance issues. During the 2008 review process, the Trustees monitored each of these funds in particular for changes in performance and for the results of any changes in a fund's investment process or investment team. In addition, during the course of the year, the Trustees regularly reviewed information regarding the investment performance of all of the funds, paying particular attention to funds whose performance since September 2007 indicated short-term or longer-term performance issues.
In spring 2008, a committee of the Board of Trustees (the "Committee"), working with EIMC management, determined generally the types of information the Board would review as part of its 2008 review process and set a timeline detailing the information required and the dates for its delivery to the Trustees. The Board engaged the independent data provider Keil Fiduciary Strategies LLC ("Keil") to provide fund-specific and industry-wide data containing information of a nature and in a format generally prescribed by the Committee, and the Committee worked with Keil and EIMC to develop appropriate groups of peer funds for each fund. The Committee also identified a number of expense, performance, and other issues and requested specific information as to those issues.
The Trustees reviewed, with the assistance of an independent industry consultant retained by the independent Trustees, the information that EIMC and Keil provided. The Trustees formed small groups to review individual funds in greater detail. In addition, the Trustees considered information regarding, among other things, brokerage practices of the funds, the use of derivatives by the funds, strategic planning for the funds, analyst and research support available to the portfolio management teams, and information regarding the various fall-out benefits received directly and indirectly by EIMC and its affiliates from the funds. The Trustees requested and received additional information following that review.
The Committee met several times by telephone during the 2008 review process to consider the information provided by EIMC. The Committee then met with representatives of EIMC. In addition, over the period of this review, the independent Trustees discussed the continuation of the funds' advisory agreements with representatives of EIMC and in multiple private sessions with independent legal counsel at which no personnel of EIMC were present. At a meeting of the full Board of Trustees in September, the Committee reported the results of its discussions with EIMC, and the full Board met with representatives of EIMC and engaged in further review of the materials provided to it, and approved the continuation of each of the advisory and sub-advisory agreements.
In considering the continuation of the agreements, the Trustees did not identify any particular information or consideration that was all-important or controlling, and each Trustee attributed different weights to various factors. The Trustees evaluated information provided to them both in terms of the funds generally and with respect to each fund, including the Fund, specifically as they considered appropriate. Although the Trustees considered the continuation of the agreements as part of the larger process of considering the continuation of the advisory contracts for all of the funds, their determination to continue the advisory agreements for each of the funds was ultimately made on a fund-by-fund basis.
This summary describes a number of the most important, but not necessarily all, of the factors considered by the Board and the independent Trustees.
Information reviewed. The Board of Trustees and committees of the Board of Trustees meet periodically during the course of the year. At those meetings, EIMC presents a wide variety of information regarding the services it performs, the investment performance of the funds, and other aspects of the business and operations of the funds. At those meetings, and in the process of considering the continuation of the agreements, the Trustees considered information regarding, for example, the funds' investment results; the portfolio management teams for the funds and the experience of the members of those teams, and any recent changes in the membership of the teams; portfolio trading practices; compliance by the funds and EIMC with applicable laws and regulations and with the funds' and EIMC's compliance policies and procedures; risk evaluation and oversight procedures at EIMC; services provided by affiliates of EIMC to the funds and shareholders of the funds; and other information relating to the nature, extent, and quality of services provided by EIMC. The Trustees considered a number of changes in portfolio management personnel at EIMC and its advisory affiliates in the year since September 2007. The Trustees also considered changes in personnel at the funds and EIMC, including the appointment of a new Chief Compliance Officer for the funds in June of 2007 and a new Chief Investment Officer at EIMC in August of 2008.
The Trustees considered the rates at which the funds pay investment advisory fees, and the efforts generally by EIMC and its affiliates as sponsors of the funds. The data provided by Keil showed the management fees paid by each fund in comparison to the management fees of other peer mutual funds, in addition to data regarding the investment performance of the funds in comparison to other peer mutual funds. The Trustees were assisted by an independent industry consultant in reviewing the information presented to them.
The Trustees noted that, in certain cases, EIMC and/or its affiliates provide advisory services to other clients that are comparable to the advisory services they provide to certain funds. The Trustees considered the information EIMC provided regarding the rates at which those other clients pay advisory fees to EIMC or its affiliates for such services. Fees charged to those other clients were generally lower than those charged to the respective funds. In respect of these other accounts, EIMC noted that the compliance, reporting, and other legal burdens of providing investment advice to mutual funds generally exceed those required to provide advisory services to non-mutual fund clients such as retirement or pension plans. The Trustees also considered the investment performance of those other accounts managed by EIMC and its affiliates, where applicable, and concluded that the performance of those accounts did not suggest any substantial difference in the quality of the service provided by EIMC and its affiliates to those accounts.
The Trustees considered the transfer agency fees paid by the funds to an affiliate of EIMC. They reviewed information presented to them showing that the transfer agency fees charged to the funds were generally consistent with industry norms.
The Trustees also considered that EIMC serves as administrator to the funds and receives a fee for its services as administrator. In their comparison of the advisory fee paid by the funds with those paid by other mutual funds, the Trustees considered administrative fees paid by the funds and those other mutual funds. The Board considered that EIS, an affiliate of EIMC, serves as distributor to the funds generally and receives fees from the funds for those services. They considered other so-called "fall-out" benefits to EIMC and its affiliates due to their other relationships with the funds, including, for example, soft-dollar services received by EIMC attributable to transactions entered into by EIMC for the benefit of the funds and brokerage commissions received by Wachovia Securities, LLC, an affiliate of EIMC, from transactions effected by it for the funds. The Trustees also noted that the funds pay sub-transfer agency fees to various financial institutions, including Wachovia Securities, LLC and its affiliates, that hold fund shares in omnibus accounts, and that an affiliate of EIMC receives fees for administering the sub-transfer agency payment program. In reviewing the services provided by an affiliate of EIMC, the Trustees noted that an affiliate of EIMC had won recognition from Dalbar customer service each year since 1998, and also won recognition from National Quality Review for customer service and for accuracy in processing transactions in 2008. They also considered that Wachovia Securities, LLC and its affiliates receive distribution-related fees and shareholder servicing payments (including amounts derived from payments under the funds' Rule 12b-1 plans) in respect of shares sold or held through it. The Trustees also noted that an affiliate of EIMC receives compensation for serving as a securities lending agent for a number of the funds.
In the period leading up to the Trustees' approval of continuation of the investment advisory agreements, the Trustees were mindful of the financial condition of Wachovia Corporation ("Wachovia"), EIMC's parent company. They considered the possibility that a significant adverse change in Wachovia's financial condition could impair the ability of EIMC or its affiliates to perform services for the funds at the same level as in the past. The Trustees concluded that any change in Wachovia's financial condition had not to date had any such effect, but determined to monitor EIMC's and its affiliates' performance, and financial conditions generally, going forward in order to identify any such impairment that may develop and to take appropriate action.
Nature and quality of the services provided. The Trustees considered that EIMC and its affiliates generally provide a comprehensive investment management service to the funds. They noted that EIMC formulates and implements an investment program for the Fund. They noted that EIMC makes its personnel available to serve as officers of the funds, and concluded that the reporting and management functions provided by EIMC with respect to the funds were generally satisfactory. The Trustees considered the investment philosophy of the Fund's portfolio management team, and considered the in-house research capabilities of EIMC and its affiliates, as well as other resources available to EIMC, including research services available to it from third parties. The Board considered the managerial and financial resources available to EIMC and its affiliates, and the commitment that the Wachovia organization has made to the funds generally. On the basis of these factors, they determined that the nature and scope of the services provided by EIMC were consistent with their respective duties under the investment advisory agreements and appropriate and consistent with the investment programs and best interests of the funds.
The Trustees noted the resources EIMC and its affiliates have committed to the regulatory, compliance, accounting, tax and oversight of tax reporting, and shareholder servicing functions, and the number and quality of staff committed to those functions, which they concluded were appropriate and generally in line with EIMC's responsibilities to the Fund and to the funds generally. The Board and the disinterested Trustees concluded, within the context of their overall conclusions regarding the funds' advisory agreements, that they were generally satisfied with the nature, extent, and quality of the services provided by EIMC, including services provided by EIMC under its administrative services agreements with the funds.
Investment performance. The Trustees considered the investment performance of each fund, both by comparison to other comparable mutual funds and to broad market indices. The Trustees noted that, for the one-year period ended December 31, 2007, the Fund's Class I shares (the Fund's only share class) had outperformed the Fund's benchmark index, the S&P 500 Index, and a majority of the mutual funds against which the Trustees compared the Fund's performance. The Trustees noted that, for the three- and five-year periods ended December 31, 2007, the Fund's Class I shares had underperformed the Fund's benchmark index, and outperformed a majority of the mutual funds against which the Trustees compared the Fund's performance.
The Trustees discussed each fund's performance with representatives of EIMC. In each instance where a fund experienced a substantial period of underperformance relative to its benchmark index and/or the non-Evergreen fund peers against which the Trustees compared the fund's performance, the Trustees considered EIMC's explanation of the reasons for the relative underperformance and the steps being taken to address the relative underperformance. The Trustees also noted that EIMC had appointed a new Chief Investment Officer in August of 2008 who had not yet had sufficient time to evaluate and direct remedial efforts with respect to funds that have experienced a substantial period of relative underperformance. The Trustees emphasized that the continuation of the investment advisory agreement for a fund should not be taken as any indication that the Trustees did not believe investment performance for any specific fund might not be improved, and they noted that they would continue to monitor closely the investment performance of the funds going forward.
Advisory and administrative fees. The Trustees recognized that EIMC does not seek to provide the lowest cost investment advisory service, but to provide a high quality, full-service investment management product at a reasonable price. They also noted that EIMC has in many cases sought to set its investment advisory fees at levels consistent with industry norms. The Trustees noted that, in certain cases, a fund's management fees were higher than many or most other mutual funds in the same Keil peer group. However, in each case, the Trustees determined on the basis of the information presented that the level of management fees was not excessive. The Trustees noted that the management fee paid by the Fund was lower than the management fees paid by a majority of the other mutual funds against which the Trustees compared the Fund's management fee, and that the level of profitability realized by EIMC in respect of the fee did not appear excessive.
Economies of scale. The Trustees noted the possibility that economies of scale would be achieved by EIMC in managing the funds as the funds grow. The Trustees noted that the Fund had implemented breakpoints in its advisory fee structure. The Trustees noted that they would continue to review the appropriate levels of breakpoints in the future, and concluded that the breakpoints as implemented appeared to be a reasonable step toward the realization of economies of scale by the Fund.
Profitability. The Trustees considered information provided to them regarding the profitability to the EIMC organization of the investment advisory, administration, and transfer agency (with respect to the open-end funds only) fees paid to EIMC and its affiliates by each of the funds. They considered that the information provided to them was necessarily estimated, and that the profitability information provided to them, especially on a fund-by-fund basis, did not necessarily provide a definitive tool for evaluating the appropriateness of each fund's advisory fee. They noted that the levels of profitability of the funds to EIMC varied widely, depending on among other things the size and type of fund. They considered the profitability of the funds in light of such factors as, for example, the information they had received regarding the relation of the fees paid by the funds to those paid by other mutual funds, the investment performance of the funds, and the amount of revenues involved. In light of these factors, the Trustees concluded that the profitability of any of the funds, individually or in the aggregate, should not prevent the Trustees from approving the continuation of the agreements.
Matters Relating to Approval of Interim Advisory and Sub-Advisory Agreements. Following the Trustees' approval of the continuation of the funds' investment advisory agreements, Wells Fargo & Company ("Wells Fargo") announced that it had agreed to acquire Wachovia in a whole company transaction that would include all of Wachovia's banking and other businesses, including EIMC. In connection with this transaction, on October 20, 2008, Wachovia issued preferred shares representing a 39.9% voting interest in Wachovia to Wells Fargo pursuant to a Share Exchange Agreement. Wells Fargo subsequently completed its acquisition of Wachovia on December 31, 2008.
Under the 1940 Act, both the issuance of the preferred shares to Wells Fargo and the completion of the acquisition could be viewed as resulting in the termination of the funds' investment advisory and sub-advisory agreements. Accordingly, on October 20, 2008, the Board of Trustees approved interim investment advisory and sub-advisory agreements that would become effective upon Wachovia's issuance of preferred shares to Wells Fargo. On November 12, 2008, the Trustees approved a second set of interim investment advisory and sub-advisory agreements that would become effective upon the completion of the acquisition. (The first set of interim agreements approved on October 20, 2008, together with the second set of interim agreements approved November 12, 2008, are referred to as "Interim Agreements.") In addition, the Trustees approved on November 12, 2008, and again at an in-person meeting on December 3 and 4, 2008, definitive investment advisory and sub-advisory agreements (the "New Agreements") and recommended that shareholders of the funds approve them at meetings to be held in early 2009.
In considering whether to approve the first set of Interim Agreements on October 20, 2008, the Trustees took into account that they had recently approved the annual continuation of all of the funds' existing investment advisory and sub-advisory agreements in September 2008. The Trustees reviewed the terms of the Interim Agreements, noting that the terms were generally identical to those of the funds' investment advisory agreements that were in effect before October 20, 2008 (but for provisions required by law to be included in the Interim Agreements). They also took into account current and anticipated market and economic conditions, the financial condition of EIMC and of Wachovia generally, and the likely effect of the merger on the financial condition of Wachovia. In general, the Trustees considered that the proposed merger of Wachovia with Wells Fargo would very likely improve substantially the financial condition of EIMC's parent company, increase the capital available to support the funds, and ensure that EIMC and its affiliates would have the resources to provide continuing services to the funds. In light principally of these considerations and their recent continuation of the funds' investment advisory arrangements in September, the Trustees unanimously approved the first set of Interim Agreements that became effective on October 20, 2008.
In addition to the foregoing, at their meetings on November 12, 2008 and December 3 and 4, 2008 when the Trustees considered whether to approve the second set of Interim Agreements as well as the New Agreements, the Trustees considered presentations made to them on November 12, 2008 by representatives of EIMC and Wells Fargo regarding the anticipated implications of the merger for EIMC and the funds. The Trustees also considered:
- Their understanding that the merger was not expected to result in any adverse effect on the funds, on the quality and level of services that EIMC would provide to the funds, or on the resources available to the funds and to EIMC, and that Wells Fargo is committed to continue providing the funds with high quality services;
- Information about Wells Fargo's financial condition, reputation, and resources, and the likelihood that the merger would result in improved organizational stability for EIMC, benefiting the funds as well as offering the potential for the funds, over time, to access Wells Fargo's infrastructure, resources and capabilities;
- That EIMC and Wells Fargo representatives have stated that there is no present intention to change the funds' existing advisory fees or expense limitations;
- That the representatives of Wells Fargo have expressed their intention to pursue the integration of EIMC and the funds with corresponding Wells Fargo businesses and funds only after a deliberative process designed to identify and retain the relative strengths of both organizations;
- That the Wells Fargo representatives expect that the deliberative process and any subsequent integration will take more than a year;
- That, in the meantime, Wells Fargo expects to retain, largely in its current form, the existing EIMC management team and investment advisory and other key professionals and to operate EIMC following the merger as a separate business unit under the Evergreen brand;
- That Wells Fargo and EIMC would consult with the Trustees before implementing any significant changes that would affect the funds or the services provided by EIMC or its affiliates to the funds;
- Wells Fargo's experience and approach with respect to acquisitions of other fund complexes;
- The fact that, if the New Agreements were not approved, on March 19, 2009, the Subsequent Interim Agreements will expire and the funds will no longer have a contractual right to investment advisory services from EIMC or any sub-advisors;
- That EIMC's management supports the merger; and
- That representatives of EIMC have committed that the funds will not bear the expenses relating to Wells Fargo's acquisition of Wachovia, including the costs of soliciting fund shareholders to approve the New Agreements.
Based on the foregoing, the Trustees, including all of the Trustees who are not "interested persons" of the funds or EIMC, unanimously approved the second set of Interim Agreements and the New Agreements.
Market Index Growth Fund ADDITIONAL INFORMATION (unaudited) |
INFORMATION ABOUT THE REVIEW AND APPROVAL OF THE FUND'S INVESTMENT ADVISORY AGREEMENT
Each year, the Fund's Board of Trustees determines whether to approve the continuation of the Fund's investment advisory agreements. In September 2008, the Trustees, including a majority of the Trustees who are not "interested persons" (as that term is defined in the 1940 Act) of the Fund or EIMC (the "independent Trustees"), approved the continuation of the Fund's investment advisory agreements. (References below to the "Fund" are to Evergreen Market Index Growth Fund; references to the "funds" are to the Evergreen funds generally.)
At the same time, the Trustees considered the continuation of the investment advisory agreements for all of the funds. The description below refers in many cases to the Trustees' process for considering, and conclusions regarding, all of the funds' agreements. In all of its deliberations, the Board of Trustees and the independent Trustees were advised by independent counsel to the independent Trustees and counsel to the funds.
The review process. In connection with its review of the funds' investment advisory agreements, the Board of Trustees requests and evaluates, and EIMC and any sub-advisors furnish, such information as the Trustees consider to be reasonably necessary in the circumstances. The Trustees began their 2008 review process at the time of the last advisory contract-renewal process in September 2007. In the course of their 2007 review, the Trustees identified a number of funds that had experienced either short-term or longer-term performance issues. During the 2008 review process, the Trustees monitored each of these funds in particular for changes in performance and for the results of any changes in a fund's investment process or investment team. In addition, during the course of the year, the Trustees regularly reviewed information regarding the investment performance of all of the funds, paying particular attention to funds whose performance since September 2007 indicated short-term or longer-term performance issues.
In spring 2008, a committee of the Board of Trustees (the "Committee"), working with EIMC management, determined generally the types of information the Board would review as part of its 2008 review process and set a timeline detailing the information required and the dates for its delivery to the Trustees. The Board engaged the independent data provider Keil Fiduciary Strategies LLC ("Keil") to provide fund-specific and industry-wide data containing information of a nature and in a format generally prescribed by the Committee, and the Committee worked with Keil and EIMC to develop appropriate groups of peer funds for each fund. The Committee also identified a number of expense, performance, and other issues and requested specific information as to those issues.
The Trustees reviewed, with the assistance of an independent industry consultant retained by the independent Trustees, the information that EIMC and Keil provided. The Trustees formed small groups to review individual funds in greater detail. In addition, the Trustees considered information regarding, among other things, brokerage practices of the funds, the use of derivatives by the funds, strategic planning for the funds, analyst and research support available to the portfolio management teams, and information regarding the various fall-out benefits received directly and indirectly by EIMC and its affiliates from the funds. The Trustees requested and received additional information following that review.
The Committee met several times by telephone during the 2008 review process to consider the information provided by EIMC. The Committee then met with representatives of EIMC. In addition, over the period of this review, the independent Trustees discussed the continuation of the funds' advisory agreements with representatives of EIMC and in multiple private sessions with independent legal counsel at which no personnel of EIMC were present. At a meeting of the full Board of Trustees in September, the Committee reported the results of its discussions with EIMC, and the full Board met with representatives of EIMC and engaged in further review of the materials provided to it, and approved the continuation of each of the advisory and sub-advisory agreements.
In considering the continuation of the agreements, the Trustees did not identify any particular information or consideration that was all-important or controlling, and each Trustee attributed different weights to various factors. The Trustees evaluated information provided to them both in terms of the funds generally and with respect to each fund, including the Fund, specifically as they considered appropriate. Although the Trustees considered the continuation of the agreements as part of the larger process of considering the continuation of the advisory contracts for all of the funds, their determination to continue the advisory agreements for each of the funds was ultimately made on a fund-by-fund basis.
This summary describes a number of the most important, but not necessarily all, of the factors considered by the Board and the independent Trustees.
Information reviewed. The Board of Trustees and committees of the Board of Trustees meet periodically during the course of the year. At those meetings, EIMC presents a wide variety of information regarding the services it performs, the investment performance of the funds, and other aspects of the business and operations of the funds. At those meetings, and in the process of considering the continuation of the agreements, the Trustees considered information regarding, for example, the funds' investment results; the portfolio management teams for the funds and the experience of the members of those teams, and any recent changes in the membership of the teams; portfolio trading practices; compliance by the funds and EIMC with applicable laws and regulations and with the funds' and EIMC's compliance policies and procedures; risk evaluation and oversight procedures at EIMC; services provided by affiliates of EIMC to the funds and shareholders of the funds; and other information relating to the nature, extent, and quality of services provided by EIMC. The Trustees considered a number of changes in portfolio management personnel at EIMC and its advisory affiliates in the year since September 2007. The Trustees also considered changes in personnel at the funds and EIMC, including the appointment of a new Chief Compliance Officer for the funds in June of 2007 and a new Chief Investment Officer at EIMC in August of 2008.
The Trustees considered the rates at which the funds pay investment advisory fees, and the efforts generally by EIMC and its affiliates as sponsors of the funds. The data provided by Keil showed the management fees paid by each fund in comparison to the management fees of other peer mutual funds, in addition to data regarding the investment performance of the funds in comparison to other peer mutual funds. The Trustees were assisted by an independent industry consultant in reviewing the information presented to them.
The Trustees noted that, in certain cases, EIMC and/or its affiliates provide advisory services to other clients that are comparable to the advisory services they provide to certain funds. The Trustees considered the information EIMC provided regarding the rates at which those other clients pay advisory fees to EIMC or its affiliates for such services. Fees charged to those other clients were generally lower than those charged to the respective funds. In respect of these other accounts, EIMC noted that the compliance, reporting, and other legal burdens of providing investment advice to mutual funds generally exceed those required to provide advisory services to non-mutual fund clients such as retirement or pension plans. The Trustees also considered the investment performance of those other accounts managed by EIMC and its affiliates, where applicable, and concluded that the performance of those accounts did not suggest any substantial difference in the quality of the service provided by EIMC and its affiliates to those accounts.
The Trustees considered the transfer agency fees paid by the funds to an affiliate of EIMC. They reviewed information presented to them showing that the transfer agency fees charged to the funds were generally consistent with industry norms.
The Trustees also considered that EIMC serves as administrator to the funds and receives a fee for its services as administrator. In their comparison of the advisory fee paid by the funds with those paid by other mutual funds, the Trustees considered administrative fees paid by the funds and those other mutual funds. The Board considered that EIS, an affiliate of EIMC, serves as distributor to the funds generally and receives fees from the funds for those services. They considered other so-called "fall-out" benefits to EIMC and its affiliates due to their other relationships with the funds, including, for example, soft-dollar services received by EIMC attributable to transactions entered into by EIMC for the benefit of the funds and brokerage commissions received by Wachovia Securities, LLC, an affiliate of EIMC, from transactions effected by it for the funds. The Trustees also noted that the funds pay sub-transfer agency fees to various financial institutions, including Wachovia Securities LLC and its affiliates, that hold fund shares in omnibus accounts, and that an affiliate of EIMC receives fees for administering the sub-transfer agency payment program. In reviewing the services provided by an affiliate of EIMC, the Trustees noted that an affiliate of EIMC had won recognition from Dalbar customer service each year since 1998, and also won recognition from National Quality Review for customer service and for accuracy in processing transactions in 2008. They also considered that Wachovia Securities, LLC and its affiliates receive distribution-related fees and shareholder servicing payments (including amounts derived from payments under the funds' Rule 12b-1 plans) in respect of shares sold or held through it. The Trustees also noted that an affiliate of EIMC receives compensation for serving as a securities lending agent for a number of the funds.
In the period leading up to the Trustees' approval of continuation of the investment advisory agreements, the Trustees were mindful of the financial condition of Wachovia Corporation ("Wachovia"), EIMC's parent company. They considered the possibility that a significant adverse change in Wachovia's financial condition could impair the ability of EIMC or its affiliates to perform services for the funds at the same level as in the past. The Trustees concluded that any change in Wachovia's financial condition had not to date had any such effect, but determined to monitor EIMC's and its affiliates' performance, and financial conditions generally, going forward in order to identify any such impairment that may develop and to take appropriate action.
Nature and quality of the services provided. The Trustees considered that EIMC and its affiliates generally provide a comprehensive investment management service to the funds. They noted that EIMC formulates and implements an investment program for the Fund. They noted that EIMC makes its personnel available to serve as officers of the funds, and concluded that the reporting and management functions provided by EIMC with respect to the funds were generally satisfactory. The Trustees considered the investment philosophy of the Fund's portfolio management team, and considered the in-house research capabilities of EIMC and its affiliates, as well as other resources available to EIMC, including research services available to it from third parties. The Board considered the managerial and financial resources available to EIMC and its affiliates, and the commitment that the Wachovia organization has made to the funds generally. On the basis of these factors, they determined that the nature and scope of the services provided by EIMC were consistent with their respective duties under the investment advisory agreements and appropriate and consistent with the investment programs and best interests of the funds.
The Trustees noted the resources EIMC and its affiliates have committed to the regulatory, compliance, accounting, tax and oversight of tax reporting, and shareholder servicing functions, and the number and quality of staff committed to those functions, which they concluded were appropriate and generally in line with EIMC's responsibilities to the Fund and to the funds generally. The Board and the disinterested Trustees concluded, within the context of their overall conclusions regarding the funds' advisory agreements, that they were generally satisfied with the nature, extent, and quality of the services provided by EIMC, including services provided by EIMC under its administrative services agreements with the funds.
Investment performance. The Trustees considered the investment performance of each fund, both by comparison to other comparable mutual funds and to broad market indices. The Trustees noted that, for the one-, three-, and five-year periods ended December 31, 2007, the Fund's Class I shares (the Fund's only share class) had performed near and below the Fund's benchmark index, the Russell 1000 Growth Index. The Trustees also noted that the Fund's Class I shares' performance was in the third quintile for the three- and five-year periods ended December 31, 2007, and in the fourth quintile for the one-year period ended December 31, 2007, of the mutual funds against which the Trustees compared the Fund's performance.
The Trustees discussed each fund's performance with representatives of EIMC. In each instance where a fund experienced a substantial period of underperformance relative to its benchmark index and/or the non-Evergreen fund peers against which the Trustees compared the fund's performance, the Trustees considered EIMC's explanation of the reasons for the relative underperformance and the steps being taken to address the relative underperformance. The Trustees also noted that EIMC had appointed a new Chief Investment Officer in August of 2008 who had not yet had sufficient time to evaluate and direct remedial efforts with respect to funds that have experienced a substantial period of relative underperformance. The Trustees emphasized that the continuation of the investment advisory agreement for a fund should not be taken as any indication that the Trustees did not believe investment performance for any specific fund might not be improved, and they noted that they would continue to monitor closely the investment performance of the funds going forward.
Advisory and administrative fees. The Trustees recognized that EIMC does not seek to provide the lowest cost investment advisory service, but to provide a high quality, full-service investment management product at a reasonable price. They also noted that EIMC has in many cases sought to set its investment advisory fees at levels consistent with industry norms. The Trustees noted that, in certain cases, a fund's management fees were higher than many or most other mutual funds in the same Keil peer group. However, in each case, the Trustees determined on the basis of the information presented that the level of management fees was not excessive. The Trustees noted that the Fund's management fee was lower than the management fees paid by the other mutual funds against which the Trustees compared the Fund's management fee. The Trustees noted that the level of profitability realized by EIMC in respect of the fee did not appear excessive.
Economies of scale. The Trustees noted the possibility that economies of scale would be achieved by EIMC in managing the funds as the funds grow. The Trustees noted that the Fund had implemented breakpoints in its advisory fee structure. The Trustees noted that they would continue to review the appropriate levels of breakpoints in the future, and concluded that the breakpoints as implemented appeared to be a reasonable step toward the realization of economies of scale by the Fund.
Profitability. The Trustees considered information provided to them regarding the profitability to the EIMC organization of the investment advisory, administration, and transfer agency (with respect to the open-end funds only) fees paid to EIMC and its affiliates by each of the funds. They considered that the information provided to them was necessarily estimated, and that the profitability information provided to them, especially on a fund-by-fund basis, did not necessarily provide a definitive tool for evaluating the appropriateness of each fund's advisory fee. They noted that the levels of profitability of the funds to EIMC varied widely, depending on among other things the size and type of fund. They considered the profitability of the funds in light of such factors as, for example, the information they had received regarding the relation of the fees paid by the funds to those paid by other mutual funds, the investment performance of the funds, and the amount of revenues involved. In light of these factors, the Trustees concluded that the profitability of any of the funds, individually or in the aggregate, should not prevent the Trustees from approving the continuation of the agreements.
Matters Relating to Approval of Interim Advisory and Sub-Advisory Agreements. Following the Trustees' approval of the continuation of the funds' investment advisory agreements, Wells Fargo & Company ("Wells Fargo") announced that it had agreed to acquire Wachovia in a whole company transaction that would include all of Wachovia's banking and other businesses, including EIMC. In connection with this transaction, on October 20, 2008, Wachovia issued preferred shares representing a 39.9% voting interest in Wachovia to Wells Fargo pursuant to a Share Exchange Agreement. Wells Fargo subsequently completed its acquisition of Wachovia on December 31, 2008.
Under the 1940 Act, both the issuance of the preferred shares to Wells Fargo and the completion of the acquisition could be viewed as resulting in the termination of the funds' investment advisory and sub-advisory agreements. Accordingly, on October 20, 2008, the Board of Trustees approved interim investment advisory and sub-advisory agreements that would become effective upon Wachovia's issuance of preferred shares to Wells Fargo. On November 12, 2008, the Trustees approved a second set of interim investment advisory and sub-advisory agreements that would become effective upon the completion of the acquisition. (The first set of interim agreements approved on October 20, 2008, together with the second set of interim agreements approved November 12, 2008, are referred to as "Interim Agreements.") In addition, the Trustees approved on November 12, 2008, and again at an in-person meeting on December 3 and 4, 2008, definitive investment advisory and sub-advisory agreements (the "New Agreements") and recommended that shareholders of the funds approve them at meetings to be held in early 2009.
In considering whether to approve the first set of Interim Agreements on October 20, 2008, the Trustees took into account that they had recently approved the annual continuation of all of the funds' existing investment advisory and sub-advisory agreements in September 2008. The Trustees reviewed the terms of the Interim Agreements, noting that the terms were generally identical to those of the funds' investment advisory agreements that were in effect before October 20, 2008 (but for provisions required by law to be included in the Interim Agreements). They also took into account current and anticipated market and economic conditions, the financial condition of EIMC and of Wachovia generally, and the likely effect of the merger on the financial condition of Wachovia. In general, the Trustees considered that the proposed merger of Wachovia with Wells Fargo would very likely improve substantially the financial condition of EIMC's parent company, increase the capital available to support the funds, and ensure that EIMC and its affiliates would have the resources to provide continuing services to the funds. In light principally of these considerations and their recent continuation of the funds' investment advisory arrangements in September, the Trustees unanimously approved the first set of Interim Agreements that became effective on October 20, 2008.
In addition to the foregoing, at their meetings on November 12, 2008 and December 3 and 4, 2008 when the Trustees considered whether to approve the second set of Interim Agreements as well as the New Agreements, the Trustees considered presentations made to them on November 12, 2008 by representatives of EIMC and Wells Fargo regarding the anticipated implications of the merger for EIMC and the funds. The Trustees also considered:
- Their understanding that the merger was not expected to result in any adverse effect on the funds, on the quality and level of services that EIMC would provide to the funds, or on the resources available to the funds and to EIMC, and that Wells Fargo is committed to continue providing the funds with high quality services;
- Information about Wells Fargo's financial condition, reputation, and resources, and the likelihood that the merger would result in improved organizational stability for EIMC, benefiting the funds as well as offering the potential for the funds, over time, to access Wells Fargo's infrastructure, resources and capabilities;
- That EIMC and Wells Fargo representatives have stated that there is no present intention to change the funds' existing advisory fees or expense limitations;
- That the representatives of Wells Fargo have expressed their intention to pursue the integration of EIMC and the funds with corresponding Wells Fargo businesses and funds only after a deliberative process designed to identify and retain the relative strengths of both organizations;
- That the Wells Fargo representatives expect that the deliberative process and any subsequent integration will take more than a year;
- That, in the meantime, Wells Fargo expects to retain, largely in its current form, the existing EIMC management team and investment advisory and other key professionals and to operate EIMC following the merger as a separate business unit under the Evergreen brand;
- That Wells Fargo and EIMC would consult with the Trustees before implementing any significant changes that would affect the funds or the services provided by EIMC or its affiliates to the funds;
- Wells Fargo's experience and approach with respect to acquisitions of other fund complexes;
- The fact that, if the New Agreements were not approved, on March 19, 2009, the Subsequent Interim Agreements will expire and the funds will no longer have a contractual right to investment advisory services from EIMC or any sub-advisors;
- That EIMC's management supports the merger; and
- That representatives of EIMC have committed that the funds will not bear the expenses relating to Wells Fargo's acquisition of Wachovia, including the costs of soliciting fund shareholders to approve the New Agreements.
Based on the foregoing, the Trustees, including all of the Trustees who are not "interested persons" of the funds or EIMC, unanimously approved the second set of Interim Agreements and the New Agreements.
Market Index Value Fund ADDITIONAL INFORMATION (unaudited) |
INFORMATION ABOUT THE REVIEW AND APPROVAL OF THE FUND'S INVESTMENT ADVISORY AGREEMENT
Each year, the Fund's Board of Trustees determines whether to approve the continuation of the Fund's investment advisory agreements. In September 2008, the Trustees, including a majority of the Trustees who are not "interested persons" (as that term is defined in the 1940 Act) of the Fund or EIMC (the "independent Trustees"), approved the continuation of the Fund's investment advisory agreements. (References below to the "Fund" are to Evergreen Market Index Value Fund; references to the "funds" are to the Evergreen funds generally.)
At the same time, the Trustees considered the continuation of the investment advisory agreements for all of the funds. The description below refers in many cases to the Trustees' process for considering, and conclusions regarding, all of the funds' agreements. In all of its deliberations, the Board of Trustees and the independent Trustees were advised by independent counsel to the independent Trustees and counsel to the funds.
The review process. In connection with its review of the funds' investment advisory agreements, the Board of Trustees requests and evaluates, and EIMC and any sub-advisors furnish, such information as the Trustees consider to be reasonably necessary in the circumstances. The Trustees began their 2008 review process at the time of the last advisory contract-renewal process in September 2007. In the course of their 2007 review, the Trustees identified a number of funds that had experienced either short-term or longer-term performance issues. During the 2008 review process, the Trustees monitored each of these funds in particular for changes in performance and for the results of any changes in a fund's investment process or investment team. In addition, during the course of the year, the Trustees regularly reviewed information regarding the investment performance of all of the funds, paying particular attention to funds whose performance since September 2007 indicated short-term or longer-term performance issues.
In spring 2008, a committee of the Board of Trustees (the "Committee"), working with EIMC management, determined generally the types of information the Board would review as part of its 2008 review process and set a timeline detailing the information required and the dates for its delivery to the Trustees. The Board engaged the independent data provider Keil Fiduciary Strategies LLC ("Keil") to provide fund-specific and industry-wide data containing information of a nature and in a format generally prescribed by the Committee, and the Committee worked with Keil and EIMC to develop appropriate groups of peer funds for each fund. The Committee also identified a number of expense, performance, and other issues and requested specific information as to those issues.
The Trustees reviewed, with the assistance of an independent industry consultant retained by the independent Trustees, the information that EIMC and Keil provided. The Trustees formed small groups to review individual funds in greater detail. In addition, the Trustees considered information regarding, among other things, brokerage practices of the funds, the use of derivatives by the funds, strategic planning for the funds, analyst and research support available to the portfolio management teams, and information regarding the various fall-out benefits received directly and indirectly by EIMC and its affiliates from the funds. The Trustees requested and received additional information following that review.
The Committee met several times by telephone during the 2008 review process to consider the information provided by EIMC. The Committee then met with representatives of EIMC. In addition, over the period of this review, the independent Trustees discussed the continuation of the funds' advisory agreements with representatives of EIMC and in multiple private sessions with independent legal counsel at which no personnel of EIMC were present. At a meeting of the full Board of Trustees in September, the Committee reported the results of its discussions with EIMC, and the full Board met with representatives of EIMC and engaged in further review of the materials provided to it, and approved the continuation of each of the advisory and sub-advisory agreements.
In considering the continuation of the agreements, the Trustees did not identify any particular information or consideration that was all-important or controlling, and each Trustee attributed different weights to various factors. The Trustees evaluated information provided to them both in terms of the funds generally and with respect to each fund, including the Fund, specifically as they considered appropriate. Although the Trustees considered the continuation of the agreements as part of the larger process of considering the continuation of the advisory contracts for all of the funds, their determination to continue the advisory agreements for each of the funds was ultimately made on a fund-by-fund basis.
This summary describes a number of the most important, but not necessarily all, of the factors considered by the Board and the independent Trustees.
Information reviewed. The Board of Trustees and committees of the Board of Trustees meet periodically during the course of the year. At those meetings, EIMC presents a wide variety of information regarding the services it performs, the investment performance of the funds, and other aspects of the business and operations of the funds. At those meetings, and in the process of considering the continuation of the agreements, the Trustees considered information regarding, for example, the funds' investment results; the portfolio management teams for the funds and the experience of the members of those teams, and any recent changes in the membership of the teams; portfolio trading practices; compliance by the funds and EIMC with applicable laws and regulations and with the funds' and EIMC's compliance policies and procedures; risk evaluation and oversight procedures at EIMC; services provided by affiliates of EIMC to the funds and shareholders of the funds; and other information relating to the nature, extent, and quality of services provided by EIMC. The Trustees considered a number of changes in portfolio management personnel at EIMC and its advisory affiliates in the year since September 2007. The Trustees also considered changes in personnel at the funds and EIMC, including the appointment of a new Chief Compliance Officer for the funds in June of 2007 and a new Chief Investment Officer at EIMC in August of 2008.
The Trustees considered the rates at which the funds pay investment advisory fees, and the efforts generally by EIMC and its affiliates as sponsors of the funds. The data provided by Keil showed the management fees paid by each fund in comparison to the management fees of other peer mutual funds, in addition to data regarding the investment performance of the funds in comparison to other peer mutual funds. The Trustees were assisted by an independent industry consultant in reviewing the information presented to them.
The Trustees noted that, in certain cases, EIMC and/or its affiliates provide advisory services to other clients that are comparable to the advisory services they provide to certain funds. The Trustees considered the information EIMC provided regarding the rates at which those other clients pay advisory fees to EIMC or its affiliates for such services. Fees charged to those other clients were generally lower than those charged to the respective funds. In respect of these other accounts, EIMC noted that the compliance, reporting, and other legal burdens of providing investment advice to mutual funds generally exceed those required to provide advisory services to non-mutual fund clients such as retirement or pension plans. The Trustees also considered the investment performance of those other accounts managed by EIMC and its affiliates, where applicable, and concluded that the performance of those accounts did not suggest any substantial difference in the quality of the service provided by EIMC and its affiliates to those accounts.
The Trustees considered the transfer agency fees paid by the funds to an affiliate of EIMC. They reviewed information presented to them showing that the transfer agency fees charged to the funds were generally consistent with industry norms.
The Trustees also considered that EIMC serves as administrator to the funds and receives a fee for its services as administrator. In their comparison of the advisory fee paid by the funds with those paid by other mutual funds, the Trustees considered administrative fees paid by the funds and those other mutual funds. The Board considered that EIS, an affiliate of EIMC, serves as distributor to the funds generally and receives fees from the funds for those services. They considered other so-called "fall-out" benefits to EIMC and its affiliates due to their other relationships with the funds, including, for example, soft-dollar services received by EIMC attributable to transactions entered into by EIMC for the benefit of the funds and brokerage commissions received by Wachovia Securities, LLC, an affiliate of EIMC, from transactions effected by it for the funds. The Trustees also noted that the funds pay sub-transfer agency fees to various financial institutions, including Wachovia Securities LLC and its affiliates, that hold fund shares in omnibus accounts, and that an affiliate of EIMC receives fees for administering the sub-transfer agency payment program. In reviewing the services provided by an affiliate of EIMC, the Trustees noted that an affiliate of EIMC had won recognition from Dalbar customer service each year since 1998, and also won recognition from National Quality Review for customer service and for accuracy in processing transactions in 2008. They also considered that Wachovia Securities, LLC and its affiliates receive distribution-related fees and shareholder servicing payments (including amounts derived from payments under the funds' Rule 12b-1 plans) in respect of shares sold or held through it. The Trustees also noted that an affiliate of EIMC receives compensation for serving as a securities lending agent for a number of the funds.
In the period leading up to the Trustees' approval of continuation of the investment advisory agreements, the Trustees were mindful of the financial condition of Wachovia Corporation ("Wachovia"), EIMC's parent company. They considered the possibility that a significant adverse change in Wachovia's financial condition could impair the ability of EIMC or its affiliates to perform services for the funds at the same level as in the past. The Trustees concluded that any change in Wachovia's financial condition had not to date had any such effect, but determined to monitor EIMC's and its affiliates' performance, and financial conditions generally, going forward in order to identify any such impairment that may develop and to take appropriate action.
Nature and quality of the services provided. The Trustees considered that EIMC and its affiliates generally provide a comprehensive investment management service to the funds. They noted that EIMC formulates and implements an investment program for the Fund. They noted that EIMC makes its personnel available to serve as officers of the funds, and concluded that the reporting and management functions provided by EIMC with respect to the funds were generally satisfactory. The Trustees considered the investment philosophy of the Fund's portfolio management team, and considered the in-house research capabilities of EIMC and its affiliates, as well as other resources available to EIMC, including research services available to it from third parties. The Board considered the managerial and financial resources available to EIMC and its affiliates, and the commitment that the Wachovia organization has made to the funds generally. On the basis of these factors, they determined that the nature and scope of the services provided by EIMC were consistent with their respective duties under the investment advisory agreements and appropriate and consistent with the investment programs and best interests of the funds.
The Trustees noted the resources EIMC and its affiliates have committed to the regulatory, compliance, accounting, tax and oversight of tax reporting, and shareholder servicing functions, and the number and quality of staff committed to those functions, which they concluded were appropriate and generally in line with EIMC's responsibilities to the Fund and to the funds generally. The Board and the disinterested Trustees concluded, within the context of their overall conclusions regarding the funds' advisory agreements, that they were generally satisfied with the nature, extent, and quality of the services provided by EIMC, including services provided by EIMC under its administrative services agreements with the funds.
Investment performance. The Trustees considered the investment performance of each fund, both by comparison to other comparable mutual funds and to broad market indices. The Trustees noted that, for the one-year period ended December 31, 2007, the Fund's Class I shares' (the Fund's only share class) performance was comparable to the performance of the Fund's benchmark index, the Russell 1000 Value Index, and in the third quintile of mutual funds against which the Trustees compared the Fund's performance. The Trustees also noted that, for the three-year period ended December 31, 2007, the Fund's Class I shares had slightly outperformed the Fund's benchmark index, and had outperformed a majority of the mutual funds against which the Trustees compared the Fund's performance. The Trustees noted that, for the five-year period ended December 31, 2007, the Fund's Class I shares had slightly underperformed the Fund's benchmark index, and had outperformed a majority of the mutual funds against which the Trustees compared the Fund's performance.
The Trustees discussed each fund's performance with representatives of EIMC. In each instance where a fund experienced a substantial period of underperformance relative to its benchmark index and/or the non-Evergreen fund peers against which the Trustees compared the fund's performance, the Trustees considered EIMC's explanation of the reasons for the relative underperformance and the steps being taken to address the relative underperformance. The Trustees also noted that EIMC had appointed a new Chief Investment Officer in August of 2008 who had not yet had sufficient time to evaluate and direct remedial efforts with respect to funds that have experienced a substantial period of relative underperformance. The Trustees emphasized that the continuation of the investment advisory agreement for a fund should not be taken as any indication that the Trustees did not believe investment performance for any specific fund might not be improved, and they noted that they would continue to monitor closely the investment performance of the funds going forward.
Advisory and administrative fees. The Trustees recognized that EIMC does not seek to provide the lowest cost investment advisory service, but to provide a high quality, full-service investment management product at a reasonable price. They also noted that EIMC has in many cases sought to set its investment advisory fees at levels consistent with industry norms. The Trustees noted that, in certain cases, a fund's management fees were higher than many or most other mutual funds in the same Keil peer group. However, in each case, the Trustees determined on the basis of the information presented that the level of management fees was not excessive. The Trustees noted that the Fund's management fee was lower than the management fees paid by the other mutual funds against which the Trustees compared the Fund's management fee. The Trustees noted that the level of profitability realized by EIMC in respect of the fee did not appear excessive.
Economies of scale. The Trustees noted the possibility that economies of scale would be achieved by EIMC in managing the funds as the funds grow. The Trustees noted that the Fund had implemented breakpoints in its advisory fee structure. The Trustees noted that they would continue to review the appropriate levels of breakpoints in the future, and concluded that the breakpoints as implemented appeared to be a reasonable step toward the realization of economies of scale by the Fund.
Profitability. The Trustees considered information provided to them regarding the profitability to the EIMC organization of the investment advisory, administration, and transfer agency (with respect to the open-end funds only) fees paid to EIMC and its affiliates by each of the funds. They considered that the information provided to them was necessarily estimated, and that the profitability information provided to them, especially on a fund-by-fund basis, did not necessarily provide a definitive tool for evaluating the appropriateness of each fund's advisory fee. They noted that the levels of profitability of the funds to EIMC varied widely, depending on among other things the size and type of fund. They considered the profitability of the funds in light of such factors as, for example, the information they had received regarding the relation of the fees paid by the funds to those paid by other mutual funds, the investment performance of the funds, and the amount of revenues involved. In light of these factors, the Trustees concluded that the profitability of any of the funds, individually or in the aggregate, should not prevent the Trustees from approving the continuation of the agreements.
Matters Relating to Approval of Interim Advisory and Sub-Advisory Agreements. Following the Trustees' approval of the continuation of the funds' investment advisory agreements, Wells Fargo & Company ("Wells Fargo") announced that it had agreed to acquire Wachovia in a whole company transaction that would include all of Wachovia's banking and other businesses, including EIMC. In connection with this transaction, on October 20, 2008, Wachovia issued preferred shares representing a 39.9% voting interest in Wachovia to Wells Fargo pursuant to a Share Exchange Agreement. Wells Fargo subsequently completed its acquisition of Wachovia on December 31, 2008.
Under the 1940 Act, both the issuance of the preferred shares to Wells Fargo and the completion of the acquisition could be viewed as resulting in the termination of the funds' investment advisory and sub-advisory agreements. Accordingly, on October 20, 2008, the Board of Trustees approved interim investment advisory and sub-advisory agreements that would become effective upon Wachovia's issuance of preferred shares to Wells Fargo. On November 12, 2008, the Trustees approved a second set of interim investment advisory and sub-advisory agreements that would become effective upon the completion of the acquisition. (The first set of interim agreements approved on October 20, 2008, together with the second set of interim agreements approved November 12, 2008, are referred to as "Interim Agreements.") In addition, the Trustees approved on November 12, 2008, and again at an in-person meeting on December 3 and 4, 2008, definitive investment advisory and sub-advisory agreements (the "New Agreements") and recommended that shareholders of the funds approve them at meetings to be held in early 2009.
In considering whether to approve the first set of Interim Agreements on October 20, 2008, the Trustees took into account that they had recently approved the annual continuation of all of the funds' existing investment advisory and sub-advisory agreements in September 2008. The Trustees reviewed the terms of the Interim Agreements, noting that the terms were generally identical to those of the funds' investment advisory agreements that were in effect before October 20, 2008 (but for provisions required by law to be included in the Interim Agreements). They also took into account current and anticipated market and economic conditions, the financial condition of EIMC and of Wachovia generally, and the likely effect of the merger on the financial condition of Wachovia. In general, the Trustees considered that the proposed merger of Wachovia with Wells Fargo would very likely improve substantially the financial condition of EIMC's parent company, increase the capital available to support the funds, and ensure that EIMC and its affiliates would have the resources to provide continuing services to the funds. In light principally of these considerations and their recent continuation of the funds' investment advisory arrangements in September, the Trustees unanimously approved the first set of Interim Agreements that became effective on October 20, 2008.
In addition to the foregoing, at their meetings on November 12, 2008 and December 3 and 4, 2008 when the Trustees considered whether to approve the second set of Interim Agreements as well as the New Agreements, the Trustees considered presentations made to them on November 12, 2008 by representatives of EIMC and Wells Fargo regarding the anticipated implications of the merger for EIMC and the funds. The Trustees also considered:
- Their understanding that the merger was not expected to result in any adverse effect on the funds, on the quality and level of services that EIMC would provide to the funds, or on the resources available to the funds and to EIMC, and that Wells Fargo is committed to continue providing the funds with high quality services;
- Information about Wells Fargo's financial condition, reputation, and resources, and the likelihood that the merger would result in improved organizational stability for EIMC, benefiting the funds as well as offering the potential for the funds, over time, to access Wells Fargo's infrastructure, resources and capabilities;
- That EIMC and Wells Fargo representatives have stated that there is no present intention to change the funds' existing advisory fees or expense limitations;
- That the representatives of Wells Fargo have expressed their intention to pursue the integration of EIMC and the funds with corresponding Wells Fargo businesses and funds only after a deliberative process designed to identify and retain the relative strengths of both organizations;
- That the Wells Fargo representatives expect that the deliberative process and any subsequent integration will take more than a year;
- That, in the meantime, Wells Fargo expects to retain, largely in its current form, the existing EIMC management team and investment advisory and other key professionals and to operate EIMC following the merger as a separate business unit under the Evergreen brand;
- That Wells Fargo and EIMC would consult with the Trustees before implementing any significant changes that would affect the funds or the services provided by EIMC or its affiliates to the funds;
- Wells Fargo's experience and approach with respect to acquisitions of other fund complexes;
- The fact that, if the New Agreements were not approved, on March 19, 2009, the Subsequent Interim Agreements will expire and the funds will no longer have a contractual right to investment advisory services from EIMC or any sub-advisors;
- That EIMC's management supports the merger; and
- That representatives of EIMC have committed that the funds will not bear the expenses relating to Wells Fargo's acquisition of Wachovia, including the costs of soliciting fund shareholders to approve the New Agreements.
Based on the foregoing, the Trustees, including all of the Trustees who are not "interested persons" of the funds or EIMC, unanimously approved the second set of Interim Agreements and the New Agreements.
| TRUSTEES1 | |
Charles A. Austin III
Trustee
DOB: 10/23/1934
Term of office since: 1991
Other directorships: None | Investment Counselor, Anchor Capital Advisors, LLC. (investment advice); Director, The Andover Companies (insurance); Trustee, Arthritis Foundation of New England; Former Director, The Francis Ouimet Society (scholarship program); Former Director, Executive Vice President and Treasurer, State Street Research & Management Company (investment advice) |
K. Dun Gifford
Trustee
DOB: 10/23/1938
Term of office since: 1974
Other directorships: None | Chairman and President, Oldways Preservation and Exchange Trust (education); Trustee, Chairman of the Finance Committee, Member of the Executive Committee, and Former Treasurer, Cambridge College |
Dr. Leroy Keith, Jr.
Trustee
DOB: 2/14/1939
Term of office since: 1983
Other directorships: Trustee, Phoenix Fund Complex (consisting
of 53 portfolios as of 12/31/2007) | Managing Director, Almanac Capital Management (commodities firm); Trustee, Phoenix Fund Complex; Director, Diversapack Co. (packaging company); Former Partner, Stonington Partners, Inc. (private equity fund); Former Director, Obagi Medical Products Co.; Former Director, Lincoln Educational Services |
Carol A. Kosel1
Trustee
DOB: 12/25/1963
Term of office since: 2008
Other directorships: None | Former Consultant to the Evergreen Boards of Trustees; Former Vice President and Senior Vice President, Evergreen Investments, Inc.: Former Treasurer, Evergreen Funds; Former Treasurer, Vestaur Securities Fund. |
Gerald M. McDonald
Trustee
DOB: 7/14/1939
Term of office since: 1988
Other directorships: None | Former Manager of Commercial Operations, CMC Steel (steel producer) |
Patricia B. Norris
Trustee
DOB: 4/9/1948
Term of office since: 2006
Other directorships: None | President and Director of Buckleys of Kezar Lake, Inc. (real estate company); Former President and Director Phillips Pond Homes Association (home community); Former Partner, PricewaterhouseCoopers, LLP (independent registered public accounting firm) |
William Walt Pettit2
Trustee
DOB: 8/26/1955
Term of office since: 1988
Other directorships: None | Partner and Vice President, Kellam & Pettit, P.A. (law firm); Director, Superior Packaging Corp. (packaging company); Member, Superior Land, LLC (real estate holding company), Member, K&P Development, LLC (real estate development); Former Director, National Kidney Foundation of North Carolina, Inc. (non-profit organization) |
David M. Richardson
Trustee
DOB: 9/19/1941
Term of office since: 1982
Other directorships: None | President, Richardson, Runden LLC (executive recruitment advisory services); Director, J&M Cumming Paper Co. (paper merchandising); Trustee, NDI Technologies, LLP (communications); Former Consultant, AESC (The Association of Executive Search Consultants) |
Dr. Russell A. Salton III
Trustee
DOB: 6/2/1947
Term of office since: 1984
Other directorships: None | President/CEO, AccessOne MedCard, Inc. |
Michael S. Scofield
Trustee
DOB: 2/20/1943
Term of office since: 1984
Other directorships: None | Retired Attorney, Law Offices of Michael S. Scofield; Former Director and Chairman, Branded Media Corporation (multi-media branding company) |
Richard J. Shima
Trustee
DOB: 8/11/1939
Term of office since:1993
Other directorships: None | Independent Consultant; Director, Hartford Hospital; Trustee, Greater Hartford YMCA; Former Director, Trust Company of CT; Former Director, Old State House Association; Former Trustee, Saint Joseph College (CT) |
Richard K. Wagoner,CFA3
Trustee
DOB: 12/12/1937
Term of office since:1999
Other directorships: None | Member and Former President, North Carolina Securities Traders Association; Member, Financial Analysts Society |
| OFFICERS | |
W. Douglas Munn4
President
DOB: 4/21/1963
Term of office since: 2009 | Principal occupations: President and Chief Executive Officer, Evergreen Investment Company, Inc.; former Chief Operating Officer, Evergreen Investment Company, Inc. |
Jeremy DePalma4
Treasurer
DOB: 2/5/1974
Term of office since: 2005 | Principal occupations: Senior Vice President, Evergreen Investment Management Company, LLC; Former Vice President, Evergreen Investment Services, Inc.; Former Assistant Vice President, Evergreen Investment Services, Inc. |
Michael H. Koonce4
Secretary
DOB: 4/20/1960
Term of office since: 2000 | Principal occupations: Senior Vice President and General Counsel, Evergreen Investment Services, Inc.; Secretary, Senior Vice President and General Counsel; Evergreen Investment Management Company, LLC and Evergreen Service Company, LLC; Senior Vice President and Assistant General Counsel, Wachovia Corporation |
Robert Guerin4
Chief Compliance Officer
DOB: 9/20/1965
Term of office since: 2007 | Principal occupations: Chief Compliance Officer, Evergreen Funds and Senior Vice President of Evergreen Investments Co., Inc.; Former Managing Director and Senior Compliance Officer, Babson Capital Management LLC; Former Principal and Director, Compliance and Risk Management, State Street Global Advisors; Former Vice President and Manager, Sales Practice Compliance, Deutsche Asset Management |
Additional information about the Fund's Board of Trustees and Officers can be found in the Statement of Additional Information (SAI) and is available upon request without charge by calling 800.343.2898.
INVESTMENTS THAT STAND THE TEST OF TIME
At Evergreen Investments, we remain steadfastly dedicated to four core principles that lead to success in today's financial world.
- Leadership — With more than $209 billion in assets as of September 30, 2008, Evergreen Investments has the scale and resources to help investors and financial professionals succeed
- Excellence — Our investments are built for long-term performance, through strategies designed in an effort to outperform their benchmarks and peers over a full market cycle.
- Experience — Our investment teams operate independently, performing their own original research, across a full range of investment disciplines.
- Commitment — We are dedicated to working with financial professionals, crafting innovative solutions that meet your needs and translate into successful investor-advisor partnerships.
Visit us online at EvergreenInvestments.com
FOR MORE INFORMATION
Evergreen Express Line 800.346.3858
Evergreen Investor Services 800.343.2898
 | For the ninth consecutive year, Evergreen Investments has earned the Dalbar Mutual Fund Service Award, which recognizes those firms that exceed industry norms in key service areas. For 2007, Evergreen was ranked fifth overall out of 32 participating companies. |
564618 RV 6 1/2009

Evergreen Investments
200 Berkeley Street
Boston, MA 02116-5034
Item 2 - Code of EthicsNot required for this semi-annual filing.
Item 3 - Audit Committee Financial Expert
Not required for this semi-annual filing.
Items 4 – Principal Accountant Fees and Services
Not required for this semi-annual filing.
Items 5 – Audit Committee of Listed Registrants
Not applicable.
Item 6 – Schedule of Investments
Please see schedule of investments contained in the Report to Stockholders included under Item 1 of this Form N-CSR.
Item 7 – Disclosure of Proxy Voting Policies and Procedures for Closed-End Management Investment Companies.
Not applicable.
Item 8 – Portfolio Managers of Closed-End Management Investment Companies.
Not applicable.
Item 9 – Purchases of Equity Securities by Closed-End Management Investment Company and Affiliated Purchasers.
Not applicable.
Item 10 – Submission of Matters to a Vote of Security Holders
There have been no material changes to the procedures by which shareholders may recommend nominees to the Registrant’s board of trustees that have been implemented since the Registrant last provided disclosure in response to the requirements of this Item.
Item 11 - Controls and Procedures
(a) The Registrant's principal executive officer and principal financial officer have evaluated the Registrant's disclosure controls and procedures (as defined in Rule 30a-3(c) under the Investment Company Act of 1940) within 90 days of this filing and have concluded that the Registrant's disclosure controls and procedures were effective, as of that date, in ensuring that information required to be disclosed by the Registrant in this Form N-CSR was recorded, processed, summarized, and reported timely.
(b) There has been no changes in the Registrant's internal controls over financial reporting (as defined in Rule 30a-3(d) under the Investment Company Act of 1940) that occurred during the second fiscal quarter of the period covered by this report that has materially affected, or is reasonable likely to affect, the Registrant’s internal control over financial reporting .
Item 12 - Exhibits
File the exhibits listed below as part of this Form. Letter or number the exhibits in the sequence indicated.
(a) Any code of ethics, or amendment thereto, that is the subject of the disclosure required by Item 2, to the extent that the Registrant intends to satisfy the Item 2 requirements through filing of an exhibit.
(b)(1) Separate certifications for the Registrant's principal executive officer and principal financial officer, as required by Section 302 of the Sarbanes-Oxley Act of 2002 and Rule 30a-2(a) under the Investment Company Act of 1940, are attached as EX99.CERT.
(b)(2) Separate certifications for the Registrant's principal executive officer and principal financial officer, as required by Section 1350 of Title 18 of United States Code, as adopted pursuant to Section 906 of the Sarbanes-Oxley Act of 2002, and Rule 30a-2(b) under the Investment Company Act of 1940, are attached as EX99.906CERT. The certifications furnished pursuant to this paragraph are not deemed to be "filed" for purposes of Section 18 of the Securities Exchange Act of 1934, or otherwise subject to the liability of that section. Such certifications are not deemed to be incorporated by reference into any filing under the Securities Act of 1933 or the Securities Exchange Act of 1934, except to the extent that the Registrant specifically incorporates them by reference.
Pursuant to the requirements of the Securities Exchange Act of 1934 and the Investment Company Act of 1940, the Registrant has duly caused this report to be signed on its behalf by the undersigned, thereunto duly authorized.
Evergreen Equity Trust
By: _______________________
W. Douglas Munn
Principal Executive Officer
Date: February 2, 2009
Pursuant to the requirements of the Securities Exchange Act of 1934 and the Investment Company Act of 1940, this report has been signed below by the following persons on behalf of the Registrant and in the capacities and on the dates indicated.
By: _______________________
W. Douglas Munn
Principal Executive Officer
Date: February 2, 2009
By: ________________________
Jeremy DePalma
Principal Financial Officer
Date: February 2, 2009