those returns for the prior three fiscal years are subject to examination by the federal, Massachusetts and Delaware revenue authorities.
Distributions to shareholders from net investment income and net realized gains, if any, are recorded on the ex-dividend date. Such distributions are determined in conformity with income tax regulations, which may differ from generally accepted accounting principles.
Income, common expenses and realized and unrealized gains and losses are allocated to the classes based on the relative net assets of each class. Distribution fees, if any, are calculated daily at the class level based on the appropriate net assets of each class and the specific expense rates applicable to each class.
Evergreen Investment Management Company, LLC (“EIMC”), a subsidiary of Wells Fargo & Company (“Wells Fargo”), is the investment advisor to the Fund and is paid an annual fee starting at 0.80% and declining to 0.70% as average daily net assets increase. For the six months ended January 31, 2009, the advisory fee was equivalent to an annual rate of 0.80% of the Fund’s average daily net assets.
Golden Capital Management, LLC (“Golden Capital”) is the investment sub-advisor to the Fund and is paid by EIMC for its services to the Fund. Wachovia Alternative Strategies, Inc., an affiliate of EIMC and a subsidiary of Wells Fargo, owns an approximately 45% minority interest in Golden Capital.
On October 3, 2008, Wells Fargo and Wachovia Corporation (“Wachovia”) announced that Wells Fargo agreed to acquire Wachovia in a whole company transaction that will include all of Wachovia’s banking and other businesses. In connection with this transaction, Wachovia issued preferred shares to Wells Fargo representing approximately a 40% voting interest in Wachovia. Due to its ownership of preferred shares, Wells Fargo may be deemed to control EIMC. If Wells Fargo is deemed to control EIMC, then the existing advisory agreement between the Fund and EIMC and the sub-advisory agreement between EIMC and the Fund’s sub-advisor would have terminated automatically in connection with the issuance of preferred shares. To address this possibility, on October 20, 2008 the Board of Trustees approved an interim advisory agreement with EIMC and an interim sub-advisory agreement with the sub-advisor with the same terms and conditions as the existing agreements, which became effective upon the issuance of the preferred shares. EIMC’s receipt of the advisory fees under the interim advisory agreement is subject to the approval by shareholders of the Fund of a new advisory agreement with EIMC.
On December 31, 2008, Wachovia merged with and into Wells Fargo and as a result of the merger, EIMC, Evergreen Investment Services, Inc. (“EIS”) and Evergreen Service Company, LLC (“ESC”) became subsidiaries of Wells Fargo. After the merger, a new
NOTES TO FINANCIAL STATEMENTS (unaudited) continued
interim advisory agreement with the same terms and conditions between the Fund and EIMC went into effect. In addition, a new interim sub-advisory agreement with the same terms and conditions became effective with the sub-advisor to the Fund.
From time to time, EIMC may voluntarily or contractually waive its fee and/or reimburse expenses in order to limit operating expenses. During the six months ended January 31, 2009, EIMC contractually and voluntarily waived its advisory fee in the amount of $95,524 and $14,728, respectively, and contractually reimbursed other expenses in the amount of $3,125.
The Fund may invest in money market funds which are advised by EIMC. Income earned on these investments is included in income from affiliate on the Statement of Operations.
EIMC also serves as the administrator to the Fund providing the Fund with facilities, equipment and personnel. EIMC is paid an annual rate determined by applying percentage rates to the aggregate average daily net assets of the Evergreen funds (excluding money market funds) starting at 0.10% and declining to 0.05% as the aggregate average daily net assets of the Evergreen funds (excluding money market funds) increase. For the six months ended January 31, 2009, the administrative services fee was equivalent to an annual rate of 0.10% of the Fund’s average daily net assets.
ESC, an affiliate of EIMC and a subsidiary of Wells Fargo, is the transfer and dividend disbursing agent for the Fund. ESC receives account fees that vary based on the type of account held by the shareholders in the Fund. For the six months ended January 31, 2009, the transfer agent fees were equivalent to an annual rate of 0.67% of the Fund’s average daily net assets.
4. DISTRIBUTION PLANS
EIS, an affiliate of EIMC and a subsidiary of Wells Fargo, serves as distributor of the Fund’s shares. The Fund has adopted Distribution Plans, as allowed by Rule 12b-1 of the 1940 Act, for each class of shares, except Class I. Under the Distribution Plans, the Fund is permitted to pay distribution fees at an annual rate of up to 0.75% of the average daily net assets for Class A shares and up to 1.00% of the average daily net assets for each of Class B and Class C shares. However, currently the distribution fees for Class A shares are limited to 0.25% of the average daily net assets of the class.
For the six months ended January 31, 2009, EIS received $126 from the sale of Class A shares and $6,419 and $653 in contingent deferred sales charges from redemption of Class B and Class C shares, respectively.
5. ACQUISITION
Effective at the close of business on September 19, 2008, the Fund acquired the net assets of Evergreen Special Equity Fund in a tax-free exchange for Class A, Class B, Class C, and Class I shares of the Fund. Shares were issued to Class A, Class B, Class C, Class I and
19
NOTES TO FINANCIAL STATEMENTS (unaudited) continued
Class IS shareholders of Evergreen Special Equity Fund at an exchange ratio of 1.22, 1.14, 1.14, 1.28 and 1.23 for Class A, Class B, Class C, Class I and Class A shares, respectively, of the Fund. The acquired net assets consisted primarily of portfolio securities with unrealized depreciation of $1,641,682. The aggregate net assets of the Fund and Special Equity Fund immediately prior to the acquisition were $4,929,372 and $54,052,602, respectively. The aggregate net assets of the Fund immediately after the acquisition were $58,981,974.
6. INVESTMENT TRANSACTIONS
Cost of purchases and proceeds from sales of investment securities (excluding short-term securities) were $57,813,070 and $61,581,346, respectively, for the six months ended January 31, 2009.
Statement of Financial Accounting Standards No. 157, Fair Value Measurements (“FAS 157”) establishes a single authoritative definition of fair value, establishes a framework for measuring fair value and expands disclosures about fair value measurements. FAS 157 establishes a fair value hierarchy based upon the various inputs used in determining the value of the Fund’s investments. These inputs are summarized into three broad levels as follows:
Level 1 – quoted prices in active markets for identical securities Level 2 – other significant observable inputs (including quoted prices for similar securities, interest rates, prepayment speeds, credit risk, etc.) Level 3 – significant unobservable inputs (including the Fund’s own assumptions in determining the fair value of investments) |
The inputs or methodologies used for valuing securities are not necessarily an indication of the risk associated with investing in those securities.
As of January 31, 2009, the inputs used in valuing the Fund’s assets, which are carried at fair value, were as follows:
Valuation Inputs | | Investments in
Securities |
|
|
|
|
Level 1 – Quoted Prices | | $ | 29,431,209 | |
Level 2 – Other Significant Observable Inputs | | | 0 | |
Level 3 – Significant Unobservable Inputs | | | 0 | |
|
|
|
|
|
Total | | $ | 29,431,209 | |
|
|
|
|
|
On January 31, 2009, the aggregate cost of securities for federal income tax purposes was $42,459,926. The gross unrealized appreciation and depreciation on securities based on tax cost was $184,563 and $13,213,280, respectively, with a net unrealized depreciation of $13,028,717.
20
NOTES TO FINANCIAL STATEMENTS (unaudited) continued
For income tax purposes, capital losses incurred after October 31 within the Fund’s fiscal year are deemed to arise on the first business day of the following fiscal year. As of July 31, 2008, the Fund incurred and elected to defer post-October losses of $168,043.
7. INTERFUND LENDING
Pursuant to an Exemptive Order issued by the SEC, the Fund may participate in an interfund lending program with certain funds in the Evergreen fund family. This program allows the Fund to borrow from, or lend money to, other participating funds. During the six months ended January 31, 2009, the Fund did not participate in the interfund lending program.
8. EXPENSE REDUCTIONS
Through expense offset arrangements with ESC and the Fund’s custodian, a portion of fund expenses has been reduced.
9. DEFERRED TRUSTEES’ FEES
Each Trustee of the Fund may defer any or all compensation related to performance of his or her duties as a Trustee. The Trustees’ deferred balances are allocated to deferral accounts, which are included in the accrued expenses for the Fund. The investment performance of the deferral accounts is based on the investment performance of certain Evergreen funds. Any gains earned or losses incurred in the deferral accounts are reported in the Fund’s Trustees’ fees and expenses. At the election of the Trustees, the deferral account will be paid either in one lump sum or in quarterly installments for up to ten years.
10. FINANCING AGREEMENT
The Fund and certain other Evergreen funds share in a $100 million unsecured revolving credit commitment for temporary and emergency purposes, including the funding of redemptions, as permitted by each participating fund’s borrowing restrictions. Borrowings under this facility bear interest at 0.50% per annum above the Federal Funds rate. All of the participating funds are charged an annual commitment fee of 0.09% on the unused balance, which is allocated pro rata. During the six months ended January 31, 2009, the Fund had no borrowings.
11. REGULATORY MATTERS AND LEGAL PROCEEDINGS
The Evergreen funds, EIMC and certain of EIMC’s affiliates are involved in various legal actions, including private litigation and class action lawsuits, and are and may in the future be subject to regulatory inquiries and investigations.
The SEC and the Secretary of the Commonwealth, Securities Division, of the Commonwealth of Massachusetts are conducting separate investigations of EIMC, EIS and Evergreen Ultra Short Opportunities Fund (the “Ultra Short Fund”) concerning
21
NOTES TO FINANCIAL STATEMENTS (unaudited) continued
alleged issues surrounding the drop in net asset value of the Ultra Short Fund in May and June 2008. In addition, three purported class actions have been filed in the U.S. District Court for the District of Massachusetts relating to the same events; defendants include various Evergreen entities, including EIMC and EIS, and Evergreen Fixed Income Trust and its Trustees. The cases generally allege that investors in the Ultra Short Fund suffered losses as a result of (i) misleading statements in Ultra Short Fund’s registration statement and prospectus, (ii) the failure to accurately price securities in the Ultra Short Fund at different points in time and (iii) the failure of the Ultra Short Fund’s risk disclosures and description of its investment strategy to inform investors adequately of the actual risks of the fund.
EIMC does not expect that any of the legal actions, inquiries or investigations currently pending or threatened will have a material adverse impact on the financial position or operations of any of the Evergreen funds to which these financial statements relate. Any publicity surrounding or resulting from any legal actions or regulatory inquiries involving EIMC or its affiliates or any of the Evergreen Funds could result in reduced sales or increased redemptions of Evergreen fund shares, which could increase Evergreen fund transaction costs or operating expenses or have other adverse consequences on the Evergreen funds.
12. NEW ACCOUNTING PRONOUNCEMENT
In March 2008, FASB issued Statement of Financial Accounting Standards No. 161, Disclosures about Derivative Instruments and Hedging Activities (“FAS 161”), an amendment of FASB Statement No. 133. FAS 161 requires enhanced disclosures about (a) how and why a fund uses derivative instruments, (b) how derivative instruments and hedging activities are accounted for, and (c) how derivative instruments and related hedging activities affect a fund’s financial position, financial performance, and cash flows. Management of the Fund does not believe the adoption of FAS 161 will materially impact the financial statement amounts, but will require additional disclosures. This will include qualitative and quantitative disclosures on derivative positions existing at period end and the effect of using derivatives during the reporting period. FAS 161 is effective for financial statements issued for fiscal years and interim periods beginning after November 15, 2008.
22
ADDITIONAL INFORMATION (unaudited)
SPECIAL MEETING OF SHAREHOLDERS
On March 12, 2009, a Special Meeting of Shareholders for the Fund was held to consider a number of proposals. On December 1, 2008, the record date for the meeting, the Fund had $29,361,810 of net assets outstanding of which $15,546,062 (52.95%) of net assets were represented at the meeting.
Proposal 1a — To consider and act upon a new investment advisory agreement with Evergreen Investment Management Company, LLC:
|
|
|
| |
Net Assets voted “For” | | $ | 14,862,471 | |
Net Assets voted “Against” | | $ | 287,795 | |
Net Assets voted “Abstain” | | $ | 395,796 | |
|
|
|
| |
Proposal 1b — To consider and act upon a new sub-advisory agreement with Golden Capital Management, LLC:
|
|
|
| |
Net Assets voted “For” | | $ | 14,764,520 | |
Net Assets voted “Against” | | $ | 399,853 | |
Net Assets voted “Abstain” | | $ | 381,689 | |
|
|
|
| |
23
TRUSTEES AND OFFICERS
TRUSTEES1 | | |
Charles A. Austin III
Trustee
DOB: 10/23/1934
Term of office since: 1991
Other directorships: None | | Investment Counselor, Anchor Capital Advisors, LLC. (investment advice); Director, The Andover Companies (insurance); Trustee, Arthritis Foundation of New England; Former Director, The Francis Ouimet Society (scholarship program); Former Director, Executive Vice President and Treasurer, State Street Research & Management Company (investment advice) |
|
|
|
K. Dun Gifford
Trustee
DOB: 10/23/1938
Term of office since: 1974
Other directorships: None | | Chairman and President, Oldways Preservation and Exchange Trust (education); Trustee, Member of the Executive Committee, Former Chairman of the Finance Committee, and Former Treasurer, Cambridge College |
|
|
|
Dr. Leroy Keith, Jr.
Trustee
DOB: 2/14/1939
Term of office since: 1983
Other directorships: Trustee,
Phoenix Fund Complex
(consisting of 50 portfolios
as of 12/31/2008) | | Managing Director, Almanac Capital Management (commodities firm); Trustee, Phoenix Fund Complex; Director, Diversapack Co. (packaging company); Former Partner, Stonington Partners, Inc. (private equity fund); Former Director, Obagi Medical Products Co.; Former Director, Lincoln Educational Services |
|
|
|
Carol A. Kosel
Trustee
DOB: 12/25/1963
Term of office since: 2008
Other directorships: None | | Former Consultant to the Evergreen Boards of Trustees; Former Vice President and Senior Vice President, Evergreen Investments, Inc.; Former Treasurer, Evergreen Funds; Former Treasurer, Vestaur Securities Fund |
|
|
|
Gerald M. McDonnell
Trustee
DOB: 7/14/1939
Term of office since: 1988
Other directorships: None | | Former Manager of Commercial Operations, CMC Steel (steel producer) |
|
|
|
Patricia B. Norris
Trustee
DOB: 4/9/1948
Term of office since: 2006
Other directorships: None | | President and Director of Buckleys of Kezar Lake, Inc. (real estate company); Former President and Director of Phillips Pond Homes Association (home community); Former Partner, PricewaterhouseCoopers, LLP (independent registered public accounting firm) |
|
|
|
William Walt Pettit2
Trustee
DOB: 8/26/1955
Term of office since: 1988
Other directorships: None | | Partner and Vice President, Kellam & Pettit, P.A. (law firm); Director, Superior Packaging Corp. (packaging company); Member, Superior Land, LLC (real estate holding company), Member, K&P Development, LLC (real estate development); Former Director, National Kidney Foundation of North Carolina, Inc. (non-profit organization) |
|
|
|
David M. Richardson
Trustee
DOB: 9/19/1941
Term of office since: 1982
Other directorships: None | | President, Richardson, Runden LLC (executive recruitment advisory services); Director, J&M Cumming Paper Co. (paper merchandising); Former Trustee, NDI Technologies, LLP (communications); Former Consultant, AESC (The Association of Executive Search Consultants) |
|
|
|
Russell A. Salton III, MD
Trustee
DOB: 6/2/1947
Term of office since: 1984
Other directorships: None | | President/CEO, AccessOne MedCard, Inc. |
|
|
|
24
TRUSTEES AND OFFICERS continued
Michael S. Scofield
Trustee
DOB: 2/20/1943
Term of office since: 1984
Other directorships: None | | Retired Attorney, Law Offices of Michael S. Scofield; Former Director and Chairman, Branded Media Corporation (multi-media branding company) |
|
|
|
Richard J. Shima
Trustee
DOB: 8/11/1939
Term of office since: 1993
Other directorships: None | | Independent Consultant; Director, Hartford Hospital; Trustee, Greater Hartford YMCA; Former Director, Trust Company of CT; Former Trustee, Saint Joseph College (CT) |
|
|
|
Richard K. Wagoner, CFA3
Trustee
DOB: 12/12/1937
Term of office since: 1999
Other directorships: None | | Member and Former President, North Carolina Securities Traders Association; Member, Financial Analysts Society |
|
|
|
OFFICERS | | |
W. Douglas Munn4
President
DOB: 4/21/1963
Term of office since: 2009 | | Principal occupations: Chief Operating Officer, Wells Fargo Funds Management, LLC; former Chief Operating Officer, Evergreen Investment Company, Inc. |
|
|
|
Jeremy DePalma4
Treasurer
DOB: 2/5/1974
Term of office since: 2005 | | Principal occupations: Senior Vice President, Evergreen Investment Management Company, LLC; Former Vice President, Evergreen Investment Services, Inc.; Former Assistant Vice President, Evergreen Investment Services, Inc. |
|
|
|
Michael H. Koonce4
Secretary
DOB: 4/20/1960
Term of office since: 2000 | | Principal occupations: Senior Vice President and General Counsel, Evergreen Investment Services, Inc.; Secretary, Senior Vice President and General Counsel, Evergreen Investment Management Company, LLC and Evergreen Service Company, LLC |
|
|
|
Robert Guerin4
Chief Compliance Officer
DOB: 9/20/1965
Term of office since: 2007 | | Principal occupations: Chief Compliance Officer, Evergreen Funds and Senior Vice President of Evergreen Investment Company, Inc.; Former Managing Director and Senior Compliance Officer, Babson Capital Management LLC; Former Principal and Director, Compliance and Risk Management, State Street Global Advisors; Former Vice President and Manager, Sales Practice Compliance, Deutsche Asset Management |
|
|
|
1 | Each Trustee serves until a successor is duly elected or qualified or until his or her death, resignation, retirement or removal from office. Each Trustee oversaw 77 Evergreen funds as of December 31, 2008. Correspondence for each Trustee may be sent to Evergreen Board of Trustees, P.O. Box 20083, Charlotte, NC 28202. |
2 | It is possible that Mr. Pettit may be viewed as an “interested person” of the Evergreen funds, as defined in the 1940 Act, because of his law firm’s previous representation of affiliates of Wells Fargo & Company (“Wells Fargo”), the parent to the Evergreen funds’ investment advisor, EIMC. The Trustees are treating Mr. Pettit as an interested trustee for the time being. |
3 | Mr. Wagoner is an “interested person” of the Evergreen funds because of his ownership of shares in Wells Fargo & Company, the parent to the Evergreen funds’ investment advisor. |
4 | The address of the Officer is 200 Berkeley Street, Boston, MA 02116. |
Additional information about the Fund’s Board of Trustees and Officers can be found in the Statement of Additional Information (SAI) and is available upon request without charge by calling 800.343.2898.
25
581816 rv1 03/2009
Evergreen Golden Large Cap Core Fund

| | table of contents |
1 | | LETTER TO SHAREHOLDERS |
4 | | FUND AT A GLANCE |
6 | | ABOUT YOUR FUND’S EXPENSES |
7 | | FINANCIAL HIGHLIGHTS |
11 | | SCHEDULE OF INVESTMENTS |
14 | | STATEMENT OF ASSETS AND LIABILITIES |
15 | | STATEMENT OF OPERATIONS |
16 | | STATEMENTS OF CHANGES IN NET ASSETS |
17 | | NOTES TO FINANCIAL STATEMENTS |
23 | | ADDITIONAL INFORMATION |
24 | | TRUSTEES AND OFFICERS |
This semiannual report must be preceded or accompanied by a prospectus of the Evergreen fund contained herein. The prospectus contains more complete information, including fees and expenses, and should be read carefully before investing or sending money.
The fund will file its complete schedule of portfolio holdings with the SEC for the first and third quarters of each fiscal year on Form N-Q. The fund’s Form N-Q will be available on the SEC’s Web site at http://www.sec.gov. In addition, the fund’s Form N-Q may be reviewed and copied at the SEC’s Public Reference Room in Washington, D.C. Information on the operation of the Public Reference Room may be obtained by calling 800.SEC.0330.
A description of the fund’s proxy voting policies and procedures, as well as information regarding how the fund voted proxies relating to portfolio securities during the most recent 12-month period ended June 30, is available by visiting our Web site at EvergreenInvestments.com or by visiting the SEC’s Web site at http://www.sec.gov. The fund’s proxy voting policies and procedures are also available without charge, upon request, by calling 800.343.2898.
Mutual Funds:
| NOT FDIC INSURED | MAY LOSE VALUE | NOT BANK GUARANTEED |
Evergreen InvestmentsSM is a service mark of Evergreen Investment Management Company, LLC. Copyright 2009, Evergreen Investment Management Company, LLC.
Evergreen Investment Management Company, LLC is a subsidiary of Wells Fargo & Company and is an affiliate of Wells Fargo & Company’s other Broker Dealer subsidiaries.
Evergreen mutual funds are distributed by Evergreen Investment Services, Inc. 200 Berkeley Street, Boston, MA 02116
LETTER TO SHAREHOLDERS
March 2009

W. Douglas Munn
President and Chief Executive Officer
Dear Shareholder:
We are pleased to provide the Semiannual Report for Evergreen Golden Large Cap Core Fund for the six-month period ended January 31, 2009 (the “period”).
During the latter half of 2008, one of the worst periods in the history of the financial markets developed as the crises in housing and credit forced the economy into recession, and by extension, the financial markets fell into turmoil. While the U.S. economy held up relatively well in the first half of 2008, these gains were largely due to strength in government spending and exports, powered higher by the weakening U.S. currency. Meanwhile, home prices continued to fall and job losses persisted. Finally, September 2008 marked the crucial event, when federal officials allowed for the collapse of Lehman Brothers, which history will likely judge as a colossal policy failure. The collateral damage from this event led to further collapse. Venerable financial institutions fell like dominos in the ensuing weeks as distrust prevailed and counter-party risk, whether real or imagined, escalated. Inter-bank lending ceased to exist, and the credit markets froze.
Consequently, officials at the Federal Reserve Board and U.S. Treasury increased their involvement, utilizing innovative measures to improve both liquidity and confidence. These efforts culminated with Congress’ approval of the $700 billion Troubled Asset Relief Program (“TARP”), enacted to purchase distressed mortgage-related securities, until the Treasury decided against it one month after TARP’s approval. Not surprisingly, confidence at the consumer and investor levels was shaken further, and banks, despite the recapitalization efforts to revive their balance sheets, became both increasingly vigilant and militant relative to their lending policies. As a result, economic activity in the fourth quarter of 2008 was positioned to be among the weakest in history.
During this period of unprecedented events, the Golden fund management teams pursued strategies based on each fund’s objective. Evergreen Golden Large Cap Core Fund sought undervalued large cap companies likely to meet or exceed earnings expectations. Evergreen Golden Mid Cap Core Fund sought undervalued, mid cap companies similar to those found in the Russell Midcap Index. Evergreen Golden Core Opportunities Fund sought undervalued stocks of small to mid cap companies similar to those found in the Russell 2500 Index.
1
LETTER TO SHAREHOLDERS continued
As we look back over the extraordinary series of events during the period, we believe it is vitally important for all investors to keep perspective and remain focused on their long-term strategies. Most importantly, we continue to urge investors to pursue fully diversified strategies in order to participate in future market gains and limit the risks of potential losses. If they haven’t already done so, we encourage individual investors to work with their financial advisors to develop a diversified, long-term strategy and, most importantly, to adhere to it. Investors should keep in mind that the economy and the financial markets have had long and successful histories of adaptability, recovery, innovation and growth. Proper asset allocation decisions can have significant impacts on the returns of long-term portfolios.
Please visit us at EvergreenInvestments.com for more information about our funds and other investment products available to you. Thank you for your continued support of Evergreen Investments.
Sincerely,

W. Douglas Munn
President and Chief Executive Officer
Evergreen Funds
2
LETTER TO SHAREHOLDERS continued
Notices to Shareholders:
• | On December 31, 2008, Wachovia Corporation merged with and into Wells Fargo & Company (“Wells Fargo”). As a result of the merger, Evergreen Investment Management Company, LLC (“EIMC”), Tattersall Advisory Group, Inc., First International Advisors, LLC, Metropolitan West Capital Management, LLC, Evergreen Investment Services, Inc. and Evergreen Service Company, LLC, are subsidiaries of Wells Fargo. |
• | Effective January 1, 2009, W. Douglas Munn became President and Chief Executive Officer of the Evergreen Funds. |
3
FUND AT A GLANCE
as of January 31, 2009
MANAGEMENT TEAM
Investment Advisor:
Evergreen Investment Management Company, LLC
Sub-Advisor:
Golden Capital Management, LLC
Portfolio Manager:
Jeff C. Moser, CFA
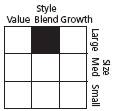
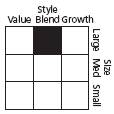
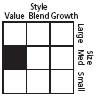
CURRENT INVESTMENT STYLE

Source: Morningstar, Inc.
Morningstar’s style box is based on a portfolio date as of 12/31/2008.
The Equity style box placement is based on 10 growth and valuation measures for each fund holding and the median size of the companies in which the fund invests.
PERFORMANCE AND RETURNS
Portfolio inception date: 12/17/2007
Class inception date | Class A
12/17/2007 | Class B
12/17/2007 | Class C
12/17/2007 | Class I
12/17/2007 |
|
|
|
|
|
Nasdaq symbol | EGOAX | EGOBX | EGOCX | EGOIX |
|
|
|
|
|
6-month return with sales charge | -34.21% | -33.83% | -31.13% | N/A |
|
|
|
|
|
6-month return w/o sales charge | -30.16% | -30.35% | -30.43% | -30.10% |
|
|
|
|
|
Average annual return* | | | | |
|
|
|
|
|
1-year with sales charge | -38.63% | -38.54% | -36.02% | N/A |
|
|
|
|
|
1-year w/o sales charge | -34.91% | -35.31% | -35.38% | -34.78% |
|
|
|
|
|
Since portfolio inception | -38.68% | -37.95% | -35.72% | -35.19% |
|
|
|
|
|
Maximum sales charge | 5.75% | 5.00% | 1.00% | N/A |
| Front-end | CDSC | CDSC | |
|
|
|
|
|
* | Adjusted for maximum applicable sales charge, unless noted. |
Past performance is no guarantee of future results. The performance quoted represents past performance and current performance may be lower or higher. The investment return and principal value of an investment will fluctuate so that investors’ shares, when redeemed, may be worth more or less than their original cost. To obtain performance information current to the most recent month-end for Classes A, B, C or I, please go to EvergreenInvestments.com/fundperformance. The performance of each class may vary based on differences in loads, fees and expenses paid by the shareholders investing in each class. Performance includes the reinvestment of income dividends and capital gain distributions. Performance shown does not reflect the deduction of taxes that a shareholder would pay on fund distributions or the redemption of fund shares.
Performance results are extremely short term, and may not provide an adequate basis for evaluating a fund’s performance over varying market conditions or economic cycles. Unusual investment returns may be a result of a fund’s recent inception, existing market and economic conditions and the increased potential of a small number of stocks affecting fund performance due to the smaller asset size. Most mutual funds are intended to be long-term investments.
The fund incurs a 12b-1 fee of 0.25% for Class A and 1.00% for Classes B and C. Class I does not pay a 12b-1 fee.
The advisor is waiving its advisory fee and reimbursing the fund for a portion of other expenses. Had the fee not been waived and expenses not reimbursed, returns would have been lower.
4
FUND AT A GLANCE continued
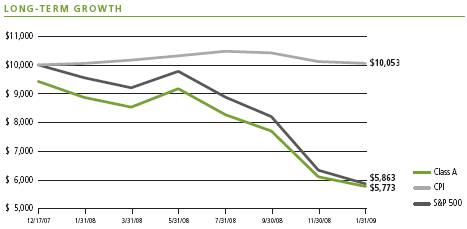
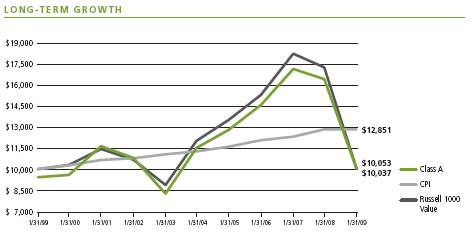
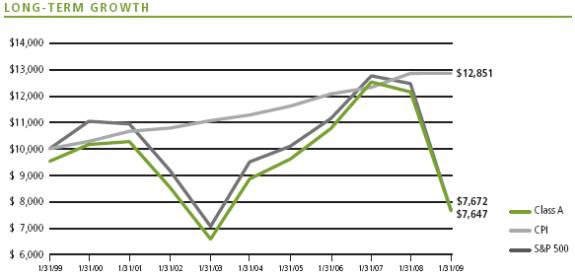
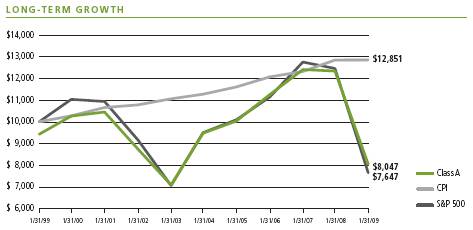
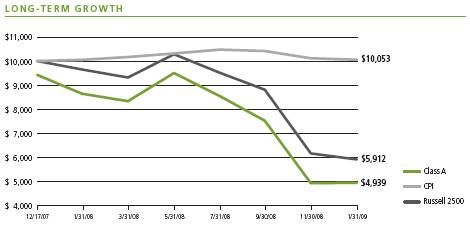
Comparison of a $10,000 investment in the Evergreen Golden Large Cap Core Fund Class A shares versus a similar investment in the S&P 500 Index (S&P 500) and the Consumer Price Index (CPI).
The S&P 500 is an unmanaged market index and does not include transaction costs associated with buying and selling securities, any mutual fund fees or expenses or any taxes. The CPI is a commonly used measure of inflation and does not represent an investment return. It is not possible to invest directly in an index.
Class I shares are only offered, subject to the minimum initial purchase requirements, in the following manner: (1) to investment advisory clients of EIMC (or its advisory affiliates), (2) to employer- or state-sponsored benefit plans, including but not limited to, retirement plans, defined benefit plans, deferred compensation plans, or savings plans, (3) to fee-based mutual fund wrap accounts, (4) through arrangements entered into on behalf of the Evergreen funds with certain financial services firms, (5) to certain institutional investors, and (6) to persons who owned Class Y shares in registered name in an Evergreen fund on or before December 31, 1994 or who owned shares of any SouthTrust fund in registered name as of March 18, 2005 or who owned shares of Vestaur Securities Fund as of May 20, 2005.
Class I shares are only available to institutional shareholders with a minimum of $1 million investment, which may be waived in certain situations.
The fund’s investment objective may be changed without a vote of the fund’s shareholders.
Since the fund tends to invest in a smaller number of stocks than many similar mutual funds, changes in the value of individual stocks may have a larger impact on its net asset value than such fluctuations would if the fund were more broadly invested.
Small and mid cap securities may be subject to special risks associated with narrower product lines and limited financial resources compared to their large cap counterparts, and, as a result, small and mid cap securities may decline significantly in market downturns and may be more volatile than those of larger companies due to the higher risk of failure.
All data is as of January 31, 2009, and subject to change.
5
ABOUT YOUR FUND’S EXPENSES
The Example below is intended to describe the fees and expenses borne by shareholders and the impact of those costs on your investment.
Example
As a shareholder of the fund, you incur two types of costs: (1) transaction costs, including sales charges (loads), redemption fees and exchange fees; and (2) ongoing costs, including management fees, distribution (12b-1) fees and other fund expenses. This Example is intended to help you understand your ongoing costs (in dollars) of investing in the fund and to compare these costs with the ongoing costs of investing in other mutual funds. The Example is based on an investment of $1,000 invested at the beginning of the period and held for the entire period from August 1, 2008 to January 31, 2009.
The example illustrates your fund’s costs in two ways:
• Actual expenses
The section in the table under the heading “Actual” provides information about actual account values and actual expenses. You may use the information in these columns, together with the amount you invested, to estimate the expenses that you paid over the period. Simply divide your account value by $1,000 (for example, an $8,600 account value divided by $1,000 = 8.6), then multiply the result by the number in the appropriate column for your share class, in the column entitled “Expenses Paid During Period” to estimate the expenses you paid on your account during this period.
• Hypothetical example for comparison purposes
The section in the table under the heading “Hypothetical (5% return before expenses)” provides information about hypothetical account values and hypothetical expenses based on the fund’s actual expense ratio and an assumed rate of return of 5% per year before expenses, which is not the fund’s actual return. The hypothetical account values and expenses may not be used to estimate the actual ending account balance or expenses you paid for the period. You may use this information to compare the ongoing costs of investing in the fund and other funds. To do so, compare this 5% hypothetical example with the 5% hypothetical examples that appear in the shareholder reports of the other funds.
Please note that the expenses shown in the table are meant to highlight your ongoing costs only and do not reflect any transactional costs, such as sales charges (loads), redemption fees or exchange fees. Therefore, the section in the table under the heading “Hypothetical (5% return before expenses)” is useful in comparing ongoing costs only, and will not help you determine the relative total costs of owning different funds. In addition, if these transactional costs were included, your costs would have been higher.
| Beginning
Account Value
8/1/2008 | Ending
Account Value
1/31/2009 | Expenses Paid
During Period* |
|
|
|
|
Actual | | | | | |
Class A | $1,000.00 | $ | 698.42 | | $4.92 |
Class B | $1,000.00 | $ | 696.46 | | $8.12 |
Class C | $1,000.00 | $ | 695.66 | | $8.12 |
Class I | $1,000.00 | $ | 698.96 | | $3.85 |
Hypothetical | | | | | |
(5% return before expenses) | | | | | |
Class A | $1,000.00 | $ | 1,019.41 | | $5.85 |
Class B | $1,000.00 | $ | 1,015.63 | | $9.65 |
Class C | $1,000.00 | $ | 1,015.63 | | $9.65 |
Class I | $1,000.00 | $ | 1,020.67 | | $4.58 |
|
|
|
|
|
|
* | For each class of the fund, expenses are equal to the annualized expense ratio of each class (1.15% for Class A, 1.90% for Class B, 1.90% for Class C and 0.90% for Class I), multiplied by the average account value over the period, multiplied by 184 / 365 days. |
6
FINANCIAL HIGHLIGHTS
(For a share outstanding throughout each period)
CLASS A | | | Six Months Ended
January 31, 2009
(unaudited) | | | Year Ended
July 31, 20081 | |
|
|
|
|
|
|
| |
Net asset value, beginning of period | | $ | 8.77 | | $ | 10.00 | |
|
|
|
|
|
|
| |
Income from investment operations | | | | | | | |
Net investment income (loss) | | | 0.04 | | | 0.03 | |
Net realized and unrealized gains or losses on investments | | | (2.68 | ) | | (1.26 | ) |
| |
|
|
|
|
| |
Total from investment operations | | | (2.64 | ) | | (1.23 | ) |
|
|
|
|
|
|
| |
Distributions to shareholders from | | | | | | | |
Net investment income | | | (0.07 | ) | | 0 | |
|
|
|
|
|
|
| |
Net asset value, end of period | | $ | 6.06 | | $ | 8.77 | |
|
|
|
|
|
|
| |
Total return2 | | | (30.16 | )% | | (12.30 | )% |
|
|
|
|
|
|
| |
Ratios and supplemental data | | | | | | | |
Net assets, end of period (thousands) | | $ | 479 | | $ | 604 | |
Ratios to average net assets | | | | | | | |
Expenses including waivers/reimbursements but excluding expense reductions | | | 1.15 | %3 | | 1.15 | %3 |
Expenses excluding waivers/reimbursements and expense reductions | | | 4.20 | %3 | | 5.03 | %3 |
Net investment income (loss) | | | 1.10 | %3 | | 0.69 | %3 |
Portfolio turnover rate | | | 23 | % | | 23 | % |
|
|
|
|
|
|
| |
1 | For the period from December 17, 2007 (commencement of class operations), to July 31, 2008. |
2 | Excluding applicable sales charges |
See Notes to Financial Statements
7
FINANCIAL HIGHLIGHTS
(For a share outstanding throughout each period)
CLASS B | | | Six Months Ended
January 31, 2009
(unaudited) | | | Year Ended
July 31, 2008 |