William E. Zieff
Source: Morningstar, Inc.
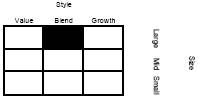
Morningstar’s style box is based on a portfolio date as of 3/31/2009.
The Equity style box placement is based on 10 growth and valuation measures for each fund holding and the median size of the companies in which the fund invests.
The advisor is waiving its advisory fee and reimbursing the fund for a portion of other expenses. Had the fee not been waived and expenses not reimbursed, returns would have been lower.
The fund is only offered to certain pension plans having at least $100 million. Class I shares are sold without a front-end or deferred sales charge. The minimum initial investment for the fund is $100 million, which may be waived in certain situations. There is no minimum amount required for subsequent purchases.
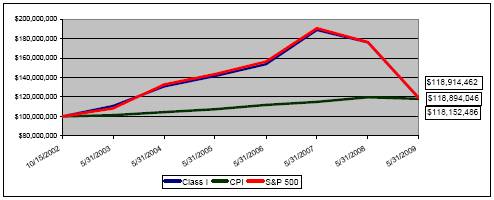
Comparison of a $100,000,000 investment in the Evergreen Market Index Fund Class I shares versus a similar investment in the S&P 500 Index (S&P 500) and the Consumer Price Index (CPI).
The fund’s investment objective may be changed without a vote of the fund’s shareholders.
“Standard & Poor’s,” “S&P,” “S&P 500,” “Standard & Poor’s 500” and “500” are trademarks of The McGraw-Hill Companies, Inc. and have been licensed for use by Evergreen Investment Management Company, LLC. The product is not sponsored, endorsed, sold or promoted by Standard & Poor’s and Standard & Poor’s makes no representation regarding the advisability of investing in the product.
All data is as of May 31, 2009, and subject to change.
Evergreen Market Index Fund
PORTFOLIO MANAGER COMMENTARY
The fund’s Class I shares returned -32.47% for the twelve-month period ended May 31, 2009. During the same period, the S&P 500 returned -32.57%.
The fund’s objective is to seek investment results that achieve price and yield performance similar to the S&P 500 Index.
Investment process
The domestic stock market produced sharply negative overall returns during the fiscal year ended May 31, 2009. Some of these losses, however, were tempered by the end of the period, as domestic markets enjoyed a rebound.
The fund’s objective is to replicate the performance of the S&P 500 Index (before fees and expenses). The portfolio management team uses an investment process designed to control trading and implementation costs and reduce tracking error as much as possible. As a result, the fund’s performance should closely align with that of the index. Periodic rebalancing takes place in order to reflect the frequently changing constituents of the index.
Contributors to performance
The composition of the benchmark as measured by market capitalization was led by Information Technology, Health Care and Energy—contrasting with last year’s top spot, which belonged to Financials. Not surprisingly given market conditions, stocks in defensive sectors such as Health Care and Consumer Staples generated the least negative returns for the period. Given their collectively small weight in the fund, Telecommunications Services, Materials and Utilities companies detracted the least from performance, with individual stocks such as Qwest Communications, Embarq, Newmont Mining, Rohm & Haas, FPL Group and EQT generating gains. Rohm & Haas, specifically, generated a positive return as a result of its acquisition by Dow Chemical Company. Absent group classifications, the top contributors on a relative basis included names such as Schering Plough and Wyeth from Health Care and Anheuser-Busch from Consumer Staples. Overall, performance on an absolute basis included Life Technologies and Barr Pharmaceuticals.
Detractors from performance
Sector detractors from performance included Financials, Energy and Industrials. Financials, which lost almost one-half of its market value, suffered under constrained capital markets, causing several companies to file for bankruptcy or be partly nationalized. Top individual detractors in the group included Bank of America, Citigroup, AIG and Merrill Lynch, while companies with smaller capitalizations such as Washington Mutual, Lehman Brothers and General Growth Properties suffered the worst declines on a percentage basis. Within Energy, heavyweight Exxon Mobil detracted the most on a relative basis, followed by Conoco Phillips. General Electric and Caterpillar from Industrials also dragged down performance. On an individual basis, General Electric, Bank of America and Citigroup, as previously mentioned, were the top detractors, while the worst performers on an absolute basis, also previously mentioned, included Washington Mutual and Lehman Brothers.
This commentary reflects the views and opinions of the fund’s portfolio manager(s) on the date indicated and may include statements that constitute “forward-looking statements” under the U.S. Securities laws. Forward-looking statements include, among other things, projections, estimates, and information about possible or future results related to the fund, markets, or regulatory developments. The views expressed above are not guarantees of future performance or economic results and involve certain risks, uncertainties, and assumptions that could cause actual outcomes and results to differ materially from the views expressed herein. The views expressed above are subject to change at any time based upon economic, market, or other conditions and Evergreen undertakes no obligation to update the views expressed herein. Any discussions of specific securities should not be considered a recommendation to buy or sell those securities. The views expressed herein (including any forward-looking statements) may not be relied upon as investment advice or as an indication of the fund’s trading intent.
Market Index Fund
ABOUT YOUR FUND’S EXPENSES
The Example below is intended to describe the fees and expenses borne by shareholders and the impact of those costs on your investment.
Example
As a shareholder of the fund, you incur two types of costs: (1) transaction costs, including sales charges (loads), redemption fees and exchange fees; and (2) ongoing costs, including management fees, distribution (12b-1) fees and other fund expenses. This Example is intended to help you understand your ongoing costs (in dollars) of investing in the fund and to compare these costs with the ongoing costs of investing in other mutual funds. The Example is based on an investment of $1,000 invested at the beginning of the period and held for the entire period from December 1, 2008 to May 31, 2009.
The example illustrates your fund’s costs in two ways:
• Actual expenses
The section in the table under the heading “Actual” provides information about actual account values and actual expenses. You may use the information in these columns, together with the amount you invested, to estimate the expenses that you paid over the period. Simply divide your account value by $1,000 (for example, an $8,600 account value divided by $1,000 = 8.6), then multiply the result by the number in the appropriate column for your share class, in the column entitled “Expenses Paid During Period” to estimate the expenses you paid on your account during this period.
• Hypothetical example for comparison purposes
The section in the table under the heading “Hypothetical (5% return before expenses)” provides information about hypothetical account values and hypothetical expenses based on the fund’s actual expense ratio and an assumed rate of return of 5% per year before expenses, which is not the fund’s actual return. The hypothetical account values and expenses may not be used to estimate the actual ending account balance or expenses you paid for the period. You may use this information to compare the ongoing costs of investing in the fund and other funds. To do so, compare this 5% hypothetical example with the 5% hypothetical examples that appear in the shareholder reports of the other funds.
Please note that the expenses shown in the table are meant to highlight your ongoing costs only and do not reflect any transactional costs, such as sales charges (loads), redemption fees or exchange fees. Therefore, the section in the table under the heading “Hypothetical (5% return before expenses)” is useful in comparing ongoing costs only, and will not help you determine the relative total costs of owning different funds. In addition, if these transactional costs were included, your costs would have been higher.
| Beginning | Ending | |
| Account | Account | Expenses |
| Value | Value | Paid During |
| 12/1/2008 | 05/31/2009 | Period* |
|
|
|
|
Actual | | | |
Class I | $1,000.00 | $1,041.52 | $0.10 |
Hypothetical | | | |
(5% return before expenses) | | | |
Class I | $1,000.00 | $1,024.83 | $0.10 |
|
|
|
|
* | Expenses are equal to the Fund’s annualized expense ratio (0.02% for Class I), multiplied by the average account value over the period, multiplied by 182 / 365 days. |
Market Index Fund
FINANCIAL HIGHLIGHTS - CLASS I
(For a share outstanding throughout each period)
| | Year Ended May 31, | |
| |
| |
| | 2009 | | 2008 | | 2007 | | 2006 | | 2005 | |
|
|
|
|
|
|
|
|
|
|
|
|
|
|
|
| |
Net asset value, beginning of period | | $ | 13.11 | | $ | 14.48 | | $ | 14.50 | | $ | 13.81 | | $ | 12.97 | |
|
|
|
|
|
|
|
|
|
|
|
|
|
|
|
| |
Income from investment operations | | | | | | | | | | | | | | | | |
Net investment income (loss) | | | 0.23 | 1 | | 0.28 | 1 | | 0.27 | 1 | | 0.27 | 1 | | 0.30 | |
Net realized and unrealized gains or losses on investments | | | (4.59 | ) | | (1.24 | ) | | 2.76 | | | 0.91 | | | 0.76 | |
| |
|
|
|
|
|
|
|
|
|
|
|
|
|
| |
Total from investment operations | | | (4.36 | ) | | (0.96 | ) | | 3.03 | | | 1.18 | | | 1.06 | |
|
|
|
|
|
|
|
|
|
|
|
|
|
|
|
| |
Distributions to shareholders from | | | | | | | | | | | | | | | | |
Net investment income | | | (0.29 | ) | | (0.23 | ) | | (0.30 | ) | | (0.32 | ) | | (0.20 | ) |
Net realized gains | | | (1.31 | ) | | (0.18 | ) | | (2.75 | ) | | (0.17 | ) | | (0.02 | ) |
| |
|
|
|
|
|
|
|
|
|
|
|
|
|
| |
Total distributions to shareholders | | | (1.60 | ) | | (0.41 | ) | | (3.05 | ) | | (0.49 | ) | | (0.22 | ) |
|
|
|
|
|
|
|
|
|
|
|
|
|
|
|
| |
Net asset value, end of period | | $ | 7.15 | | $ | 13.11 | | $ | 14.48 | | $ | 14.50 | | $ | 13.81 | |
|
|
|
|
|
|
|
|
|
|
|
|
|
|
|
| |
Total return | | | (32.47 | )% | | (6.71 | )% | | 22.78 | % | | 8.56 | % | | 8.24 | % |
|
|
|
|
|
|
|
|
|
|
|
|
|
|
|
| |
Ratios and supplemental data | | | | | | | | | | | | | | | | |
Net assets, end of period (thousands) | | $ | 237,129 | | $ | 351,138 | | $ | 558,366 | | $ | 406,581 | | $ | 722,863 | |
Ratios to average net assets | | | | | | | | | | | | | | | | |
Expenses including waivers/reimbursements but excluding expense reductions | | | 0.02 | % | | 0.03 | % | | 0.03 | % | | 0.03 | % | | 0.03 | % |
Expenses excluding waivers/reimbursements and expense reductions | | | 0.46 | % | | 0.46 | % | | 0.46 | % | | 0.46 | % | | 0.46 | % |
Net investment income (loss) | | | 2.74 | % | | 2.01 | % | | 1.93 | % | | 1.90 | % | | 2.08 | % |
Portfolio turnover rate | | | 3 | % | | 7 | % | | 5 | % | | 6 | % | | 6 | % |
|
|
|
|
|
|
|
|
|
|
|
|
|
|
|
| |
1 | Net investment income (loss) per share is based on average shares outstanding during the period. |
See Combined Notes to Financial Statements
SCHEDULE OF INVESTMENTS
Market Index Fund
May 31, 2009
| | | Shares | | | Value | |
|
|
|
|
|
|
| |
COMMON STOCKS 98.7% | | | | | | | |
CONSUMER DISCRETIONARY 8.8% | | | | | | | |
Auto Components 0.2% | | | | | | | |
Goodyear Tire & Rubber Co. * | | | 7,033 | | $ | 80,528 | |
Johnson Controls, Inc. | | | 17,317 | | | 345,128 | |
| | | | |
|
| |
| | | | | | 425,656 | |
| | | | |
|
| |
Automobiles 0.3% | | | | | | | |
Ford Motor Co. * | | | 92,201 | | | 530,156 | |
General Motors Corp. | | | 17,791 | | | 13,343 | |
Harley-Davidson, Inc. | | | 6,807 | | | 115,515 | |
| | | | |
|
| |
| | | | | | 659,014 | |
| | | | |
|
| |
Distributors 0.1% | | | | | | | |
Genuine Parts Co. | | | 4,647 | | | 155,581 | |
| | | | |
|
| |
Diversified Consumer Services 0.1% | | | | | | | |
Apollo Group, Inc., Class A * | | | 3,115 | | | 184,097 | |
H&R Block, Inc. | | | 9,899 | | | 144,525 | |
| | | | |
|
| |
| | | | | | 328,622 | |
| | | | |
|
| |
Hotels, Restaurants & Leisure 1.6% | | | | | | | |
Carnival Corp. | | | 12,757 | | | 324,538 | |
Darden Restaurants, Inc. | | | 3,992 | | | 144,391 | |
International Game Technology | | | 8,609 | | | 149,452 | |
Marriott International, Inc., Class A | | | 8,564 | | | 200,055 | |
McDonald’s Corp. | | | 32,453 | | | 1,914,402 | |
Starbucks Corp. * | | | 21,408 | | | 308,061 | |
Starwood Hotels & Resorts Worldwide, Inc. | | | 5,317 | | | 130,107 | |
Wyndham Worldwide Corp. | | | 5,173 | | | 60,990 | |
Wynn Resorts, Ltd. * | | | 1,949 | | | 72,230 | |
Yum! Brands, Inc. | | | 13,403 | | | 464,146 | |
| | | | |
|
| |
| | | | | | 3,768,372 | |
| | | | |
|
| |
Household Durables 0.4% | | | | | | | |
Black & Decker Corp. | | | 1,752 | | | 56,187 | |
Centex Corp. | | | 3,624 | | | 30,550 | |
D.R. Horton, Inc. | | | 8,031 | | | 73,966 | |
Fortune Brands, Inc. | | | 4,376 | | | 153,204 | |
Harman International Industries, Inc. | | | 1,707 | | | 31,818 | |
KB Home | | | 2,194 | | | 32,910 | |
Leggett & Platt, Inc. | | | 4,571 | | | 67,102 | |
Lennar Corp., Class A | | | 4,117 | | | 39,153 | |
Newell Rubbermaid, Inc. | | | 8,078 | | | 92,978 | |
Pulte Homes, Inc. | | | 6,255 | | | 55,044 | |
Snap-On, Inc. | | | 1,675 | | | 52,176 | |
Stanley Works | | | 2,299 | | | 82,074 | |
Whirlpool Corp. | | | 2,143 | | | 90,306 | |
| | | | |
|
| |
| | | | | | 857,468 | |
| | | | |
|
| |
Internet & Catalog Retail 0.3% | | | | | | | |
Amazon.com, Inc. * | | | 9,367 | | | 730,532 | |
Expedia, Inc. * | | | 6,113 | | | 105,816 | |
| | | | |
|
| |
| | | | | | 836,348 | |
| | | | |
|
| |
See Combined Notes to Financial Statements
SCHEDULE OF INVESTMENTS continued
Market Index Fund
May 31, 2009
Leisure Equipment & Products 0.1% | | | | | | | |
Eastman Kodak Co. | | | 7,816 | | | 20,400 | |
Hasbro, Inc. | | | 3,612 | | | 91,781 | |
Mattel, Inc. | | | 10,446 | | | 163,062 | |
| | | | |
|
| |
| | | | | | 275,243 | |
| | | | |
|
| |
Media 2.5% | | | | | | | |
CBS Corp., Class B | | | 19,790 | | | 146,050 | |
Comcast Corp., Class A | | | 83,948 | | | 1,155,964 | |
DIRECTV Group, Inc. * | | | 15,416 | | | 346,860 | |
Gannett Co., Inc. | | | 6,656 | | | 31,749 | |
Interpublic Group of Cos. * | | | 13,884 | | | 72,752 | |
McGraw-Hill Cos. | | | 9,163 | | | 275,715 | |
Meredith Corp. | | | 1,049 | | | 28,281 | |
New York Times Co., Class A | | | 3,398 | | | 22,427 | |
News Corp., Class A | | | 67,031 | | | 655,563 | |
Omnicom Group, Inc. | | | 9,061 | | | 276,360 | |
Scripps Networks Interactive, Inc., Class A | | | 2,627 | | | 72,873 | |
Time Warner Cable, Inc. | | | 10,267 | | | 316,121 | |
Time Warner, Inc. | | | 34,852 | | | 816,234 | |
Viacom, Inc., Class B * | | | 17,669 | | | 391,722 | |
Walt Disney Co. | | | 54,098 | | | 1,310,254 | |
Washington Post Co., Class B | | | 175 | | | 63,000 | |
| | | | |
|
| |
| | | | | | 5,981,925 | |
| | | | |
|
| |
Multiline Retail 0.8% | | | | | | | |
Big Lots, Inc. * | | | 2,393 | | | 55,063 | |
Family Dollar Stores, Inc. | | | 4,077 | | | 123,411 | |
J.C. Penney Co., Inc. | | | 6,475 | | | 168,933 | |
Kohl’s Corp. * | | | 8,880 | | | 377,133 | |
Macy’s, Inc. | | | 12,256 | | | 143,150 | |
Nordstrom, Inc. | | | 4,645 | | | 91,460 | |
Sears Holdings Corp. * | | | 1,600 | | | 90,960 | |
Target Corp. | | | 21,938 | | | 862,163 | |
| | | | |
|
| |
| | | | | | 1,912,273 | |
| | | | |
|
| |
Specialty Retail 1.9% | | | | | | | |
Abercrombie & Fitch Co., Class A | | | 2,537 | | | 76,389 | |
AutoNation, Inc. * | | | 3,144 | | | 49,927 | |
AutoZone, Inc. * | | | 1,105 | | | 168,126 | |
Bed Bath & Beyond, Inc. * | | | 7,569 | | | 212,765 | |
Best Buy Co., Inc. | | | 9,880 | | | 346,788 | |
GameStop Corp., Class A * | | | 4,773 | | | 119,086 | |
Gap, Inc. | | | 13,588 | | | 242,546 | |
Home Depot, Inc. | | | 49,409 | | | 1,144,312 | |
Limited Brands, Inc. | | | 7,885 | | | 98,641 | |
Lowe’s Cos. | | | 42,713 | | | 811,974 | |
O’Reilly Automotive, Inc. * | | | 3,933 | | | 141,785 | |
Office Depot, Inc. * | | | 8,009 | | | 37,322 | |
RadioShack Corp. | | | 3,645 | | | 48,989 | |
Sherwin-Williams Co. | | | 2,869 | | | 151,483 | |
Staples, Inc. | | | 20,790 | | | 425,155 | |
Tiffany & Co. | | | 3,588 | | | 101,792 | |
TJX Cos. | | | 12,133 | | | 358,045 | |
| | | | |
|
| |
| | | | | | 4,535,125 | |
| | | | |
|
| |
See Combined Notes to Financial Statements
SCHEDULE OF INVESTMENTS continued
Market Index Fund
May 31, 2009
Textiles, Apparel & Luxury Goods 0.5% | | | | | | | |
Coach, Inc. * | | | 9,356 | | | 245,782 | |
Nike, Inc., Class B | | | 11,286 | | | 643,866 | |
Polo Ralph Lauren Corp. | | | 1,646 | | | 88,588 | |
VF Corp. * | | | 2,568 | | | 145,914 | |
| | | | |
|
| |
| | | | | | 1,124,150 | |
| | | | |
|
| |
CONSUMER STAPLES 11.9% | | | | | | | |
Beverages 2.6% | | | | | | | |
Brown-Forman Corp., Class B | | | 2,858 | | | 125,323 | |
Coca-Cola Co. | | | 58,011 | | | 2,851,821 | |
Coca-Cola Enterprises, Inc. | | | 9,241 | | | 153,955 | |
Constellation Brands, Inc., Class A * | | | 5,675 | | | 65,603 | |
Dr. Pepper Snapple Group, Inc. * | | | 7,393 | | | 160,650 | |
Molson Coors Brewing Co., Class B | | | 4,367 | | | 192,104 | |
Pepsi Bottling Group, Inc. | | | 3,946 | | | 129,666 | |
PepsiCo, Inc. | | | 45,354 | | | 2,360,676 | |
| | | | |
|
| |
| | | | | | 6,039,798 | |
| | | | |
|
| |
Food & Staples Retailing 3.1% | | | | | | | |
Costco Wholesale Corp. | | | 12,626 | | | 612,613 | |
CVS Caremark Corp. | | | 42,417 | | | 1,264,027 | |
Kroger Co. | | | 19,014 | | | 433,519 | |
Safeway, Inc. * | | | 12,499 | | | 253,230 | |
SUPERVALU, Inc. | | | 6,171 | | | 102,439 | |
Sysco Corp. | | | 17,171 | | | 411,417 | |
Wal-Mart Stores, Inc. | | | 65,158 | | | 3,240,959 | |
Walgreen Co. | | | 28,756 | | | 856,641 | |
Whole Foods Market, Inc. | | | 4,092 | | | 77,216 | |
| | | | |
|
| |
| | | | | | 7,252,061 | |
| | | | |
|
| |
Food Products 1.7% | | | | | | | |
Archer Daniels Midland Co. * | | | 18,706 | | | 514,789 | |
Campbell Soup Co. | | | 5,969 | | | 165,461 | |
ConAgra Foods, Inc. | | | 13,030 | | | 242,228 | |
Dean Foods Co. * | | | 5,154 | | | 96,895 | |
General Mills, Inc. | | | 9,554 | | | 488,974 | |
H.J. Heinz Co. | | | 9,169 | | | 335,402 | |
Hershey Co. | | | 4,829 | | | 170,077 | |
Hormel Foods Corp. | | | 2,035 | | | 70,696 | |
J.M. Smucker Co. | | | 3,451 | | | 138,937 | |
Kellogg Co. | | | 7,346 | | | 317,715 | |
Kraft Foods, Inc., Class A | | | 42,821 | | | 1,118,056 | |
McCormick & Co., Inc. | | | 3,792 | | | 115,732 | |
Sara Lee Corp. | | | 20,270 | | | 182,227 | |
Tyson Foods, Inc., Class A | | | 8,810 | | | 117,349 | |
| | | | |
|
| |
| | | | | | 4,074,538 | |
| | | | |
|
| |
Household Products 2.6% | | | | | | | |
Clorox Co. | | | 4,051 | | | 212,434 | |
Colgate-Palmolive Co. | | | 14,609 | | | 963,464 | |
Kimberly-Clark Corp. | | | 12,059 | | | 625,742 | |
Procter & Gamble Co. | | | 85,411 | | | 4,436,247 | |
| | | | |
|
| |
| | | | | | 6,237,887 | |
| | | | |
|
| |
See Combined Notes to Financial Statements
SCHEDULE OF INVESTMENTS continued
Market Index Fund
May 31, 2009
Personal Products 0.2% | | | | | | | |
Avon Products, Inc. | | | 12,425 | | | 330,008 | |
Estee Lauder Cos., Class A | | | 3,382 | | | 111,876 | |
| | | | |
|
| |
| | | | | | 441,884 | |
| | | | |
|
| |
Tobacco 1.7% | | | | | | | |
Altria Group, Inc. | | | 60,213 | | | 1,029,040 | |
Lorillard, Inc. | | | 4,898 | | | 334,681 | |
Philip Morris International, Inc. | | | 58,400 | | | 2,490,176 | |
Reynolds American, Inc. | | | 4,926 | | | 196,892 | |
| | | | |
|
| |
| | | | | | 4,050,789 | |
| | | | |
|
| |
ENERGY 12.9% | | | | | | | |
Energy Equipment & Services 1.9% | | | | | | | |
Baker Hughes, Inc. | | | 9,001 | | | 351,579 | |
BJ Services Co. | | | 8,511 | | | 133,112 | |
Cameron International Corp. * | | | 6,321 | | | 197,405 | |
Diamond Offshore Drilling, Inc. | | | 2,025 | | | 170,667 | |
ENSCO International, Inc. | | | 4,133 | | | 160,732 | |
Halliburton Co. | | | 26,146 | | | 599,528 | |
Nabors Industries, Ltd. * | | | 8,245 | | | 147,421 | |
National Oilwell Varco, Inc. * | | | 12,163 | | | 469,735 | |
Rowan Companies, Inc. | | | 3,293 | | | 67,375 | |
Schlumberger, Ltd. | | | 34,854 | | | 1,994,694 | |
Smith International, Inc. | | | 6,389 | | | 186,495 | |
| | | | |
|
| |
| | | | | | 4,478,743 | |
| | | | |
|
| |
Oil, Gas & Consumable Fuels 11.0% | | | | | | | |
Anadarko Petroleum Corp. | | | 14,276 | | | 682,107 | |
Apache Corp. | | | 9,755 | | | 821,956 | |
Cabot Oil & Gas Corp. | | | 3,015 | | | 105,917 | |
Chesapeake Energy Corp. | | | 16,379 | | | 371,148 | |
Chevron Corp. | | | 58,417 | | | 3,894,661 | |
ConocoPhillips | | | 43,138 | | | 1,977,446 | |
Consol Energy, Inc. | | | 5,263 | | | 216,625 | |
Denbury Resources, Inc. * | | | 7,239 | | | 124,438 | |
Devon Energy Corp. | | | 12,933 | | | 817,883 | |
El Paso Corp. | | | 20,359 | | | 198,500 | |
EOG Resources, Inc. | | | 7,277 | | | 532,604 | |
Exxon Mobil Corp. | | | 144,010 | | | 9,987,093 | |
Hess Corp. | | | 8,269 | | | 550,633 | |
Marathon Oil Corp. | | | 20,619 | | | 657,334 | |
Massey Energy Co. | | | 2,491 | | | 57,019 | |
Murphy Oil Corp. | | | 5,559 | | | 328,037 | |
Noble Energy, Inc. | | | 5,039 | | | 299,720 | |
Occidental Petroleum Corp. | | | 23,614 | | | 1,584,736 | |
Peabody Energy Corp. | | | 7,792 | | | 264,772 | |
Pioneer Natural Resources Co. * | | | 3,369 | | | 94,736 | |
Range Resources Corp. | | | 4,552 | | | 208,527 | |
Southwestern Energy Co. * | | | 10,014 | | | 435,309 | |
Spectra Energy Corp. | | | 18,748 | | | 300,905 | |
Sunoco, Inc. | | | 3,406 | | | 103,645 | |
Tesoro Corp. | | | 4,032 | | | 68,302 | |
Valero Energy Corp. | | | 15,046 | | | 336,579 | |
Williams Cos. * | | | 16,880 | | | 283,246 | |
See Combined Notes to Financial Statements
SCHEDULE OF INVESTMENTS continued
Market Index Fund
May 31, 2009
XTO Energy, Inc. | | | 16,893 | | | 722,514 | |
| | | | |
|
| |
| | | | | | 26,026,392 | |
| | | | |
|
| |
FINANCIALS 13.5% | | | | | | | |
Capital Markets 2.9% | | | | | | | |
Ameriprise Financial, Inc. | | | 6,377 | | | 192,585 | |
Bank of New York Mellon Corp. | | | 33,484 | | | 930,186 | |
Charles Schwab Corp. | | | 27,318 | | | 480,797 | |
E*TRADE Financial Corp. * | | | 16,671 | | | 24,006 | |
Federated Investors, Inc., Class B | | | 2,593 | | | 64,903 | |
Franklin Resources, Inc. | | | 4,412 | | | 294,942 | |
Goldman Sachs Group, Inc. | | | 14,642 | | | 2,116,794 | |
INVESCO, Ltd. | | | 11,861 | | | 185,625 | |
Janus Capital Group, Inc. | | | 4,608 | | | 46,725 | |
Legg Mason, Inc. | | | 4,162 | | | 80,243 | |
Morgan Stanley | | | 35,568 | | | 1,078,422 | |
Northern Trust Corp. | | | 6,949 | | | 400,610 | |
State Street Corp. | | | 14,083 | | | 654,155 | |
T. Rowe Price Group, Inc. | | | 7,461 | | | 302,693 | |
| | | | |
|
| |
| | | | | | 6,852,686 | |
| | | | |
|
| |
Commercial Banks 2.7% | | | | | | | |
BB&T Corp. | | | 18,485 | | | 414,434 | |
Comerica, Inc. | | | 4,407 | | | 95,544 | |
Fifth Third Bancorp | | | 16,826 | | | 116,099 | |
First Horizon National Corp. | | | 6,150 | | | 74,661 | |
Huntington Bancshares, Inc. | | | 11,715 | | | 45,923 | |
KeyCorp | | | 14,417 | | | 72,085 | |
M&T Bank Corp. | | | 2,383 | | | 119,865 | |
Marshall & Ilsley Corp. | | | 7,732 | | | 50,877 | |
PNC Financial Services Group, Inc. | | | 12,471 | | | 568,054 | |
Regions Financial Corp. | | | 31,900 | | | 133,661 | |
SunTrust Banks, Inc. | | | 10,395 | | | 136,902 | |
U.S. Bancorp | | | 55,199 | | | 1,059,821 | |
Wells Fargo & Co. ° | | | 133,436 | | | 3,402,618 | |
Zions Bancorp | | | 3,361 | | | 45,978 | |
| | | | |
|
| |
| | | | | | 6,336,522 | |
| | | | |
|
| |
Consumer Finance 0.7% | | | | | | | |
American Express Co. | | | 34,127 | | | 848,056 | |
Capital One Financial Corp. | | | 13,051 | | | 318,966 | |
Discover Financial Services | | | 14,031 | | | 134,136 | |
MasterCard, Inc., Class A | | | 2,111 | | | 372,233 | |
SLM Corp. * | | | 13,621 | | | 90,035 | |
| | | | |
|
| |
| | | | | | 1,763,426 | |
| | | | |
|
| |
Diversified Financial Services 3.6% | | | | | | | |
Bank of America Corp. | | | 222,978 | | | 2,512,962 | |
CIT Group, Inc. | | | 11,330 | | | 43,394 | |
Citigroup, Inc. * | | | 159,589 | | | 593,671 | |
CME Group, Inc., Class A | | | 1,933 | | | 621,730 | |
IntercontinentalExchange, Inc. * | | | 2,117 | | | 228,192 | |
JPMorgan Chase & Co. | | | 109,514 | | | 4,041,067 | |
Leucadia National Corp. * | | | 5,282 | | | 110,288 | |
Moody’s Corp. | | | 5,552 | | | 152,069 | |
NASDAQ OMX Group, Inc. * | | | 4,002 | | | 84,482 | |
See Combined Notes to Financial Statements
SCHEDULE OF INVESTMENTS continued
Market Index Fund
May 31, 2009
NYSE Euronext | | | 7,548 | | | 226,440 | |
| | | | |
|
| |
| | | | | | 8,614,295 | |
| | | | |
|
| |
Insurance 2.4% | | | | | | | |
AFLAC, Inc. * | | | 13,624 | | | 483,652 | |
Allstate Corp. | | | 15,621 | | | 401,928 | |
American International Group, Inc. | | | 78,414 | | | 132,520 | |
AON Corp. | | | 7,972 | | | 286,992 | |
Assurant, Inc. | | | 3,432 | | | 81,098 | |
Chubb Corp. | | | 10,268 | | | 407,126 | |
Cincinnati Financial Corp. | | | 4,736 | | | 107,081 | |
Genworth Financial, Inc., Class A | | | 12,623 | | | 74,728 | |
Hartford Financial Services Group, Inc. | | | 9,478 | | | 135,914 | |
Lincoln National Corp. | | | 7,462 | | | 141,405 | |
Loews Corp. | | | 10,525 | | | 284,701 | |
Marsh & McLennan Cos. | | | 15,008 | | | 283,951 | |
MBIA, Inc. * | | | 4,988 | | | 32,173 | |
MetLife, Inc. | | | 23,841 | | | 750,991 | |
Principal Financial Group, Inc. | | | 9,040 | | | 200,688 | |
Progressive Corp. * | | | 19,721 | | | 318,100 | |
Prudential Financial, Inc. | | | 12,356 | | | 493,128 | |
Torchmark Corp. | | | 2,463 | | | 98,914 | |
Travelers Companies, Inc. | | | 17,045 | | | 693,050 | |
Unum Group * | | | 9,651 | | | 165,129 | |
XL Capital, Ltd., Class A | | | 9,973 | | | 100,927 | |
| | | | |
|
| |
| | | | | | 5,674,196 | |
| | | | |
|
| |
Real Estate Investment Trusts (REITs) 1.0% | | | | | | | |
Apartment Investment & Management Co., Class A | | | 3,418 | | | 32,300 | |
AvalonBay Communities, Inc. | | | 2,324 | | | 142,879 | |
Boston Properties, Inc. | | | 3,534 | | | 170,763 | |
Equity Residential | | | 7,950 | | | 193,503 | |
HCP, Inc. | | | 7,925 | | | 184,098 | |
Health Care REIT, Inc. * | | | 3,227 | | | 110,525 | |
Host Hotels & Resorts, Inc. | | | 17,236 | | | 161,674 | |
Kimco Realty Corp. | | | 9,087 | | | 106,227 | |
Plum Creek Timber Co., Inc. * | | | 4,804 | | | 166,459 | |
ProLogis | | | 12,899 | | | 109,512 | |
Public Storage, Inc. | | | 3,655 | | | 243,460 | |
Simon Property Group, Inc. | | | 7,921 | | | 423,536 | |
Ventas, Inc. | | | 4,551 | | | 138,168 | |
Vornado Realty Trust | | | 4,494 | | | 209,690 | |
| | | | |
|
| |
| | | | | | 2,392,794 | |
| | | | |
|
| |
Real Estate Management & Development 0.0% | | | | | | | |
CB Richard Ellis Group, Inc., Class A * | | | 6,555 | | | 47,851 | |
| | | | |
|
| |
Thrifts & Mortgage Finance 0.2% | | | | | | | |
Hudson City Bancorp, Inc. | | | 15,222 | | | 195,298 | |
People’s United Financial, Inc. | | | 10,148 | | | 160,339 | |
| | | | |
|
| |
| | | | | | 355,637 | |
| | | | |
|
| |
HEALTH CARE 13.7% | | | | | | | |
Biotechnology 1.8% | | | | | | | |
Amgen, Inc. * | | | 30,132 | | | 1,504,792 | |
Biogen Idec, Inc. * | | | 8,663 | | | 448,657 | |
See Combined Notes to Financial Statements
SCHEDULE OF INVESTMENTS continued
Market Index Fund
May 31, 2009
Celgene Corp. * | | | 13,390 | | | 565,593 | |
Cephalon, Inc. * | | | 2,151 | | | 125,425 | |
Genzyme Corp. * | | | 7,908 | | | 467,679 | |
Gilead Sciences, Inc. * | | | 26,547 | | | 1,144,176 | |
| | | | |
|
| |
| | | | | | 4,256,322 | |
| | | | |
|
| |
Health Care Equipment & Supplies 2.2% | | | | | | | |
Baxter International, Inc. | | | 17,889 | | | 915,738 | |
Becton, Dickinson & Co. | | | 6,986 | | | 472,812 | |
Boston Scientific Corp. * | | | 43,779 | | | 411,523 | |
C.R. Bard, Inc. | | | 2,898 | | | 207,178 | |
Covidien, Ltd. | | | 14,685 | | | 524,548 | |
Dentsply International, Inc. | | | 4,331 | | | 126,725 | |
Hospira, Inc. * | | | 4,652 | | | 160,494 | |
Intuitive Surgical, Inc. * | | | 1,142 | | | 170,935 | |
Medtronic, Inc. | | | 32,588 | | | 1,119,398 | |
St. Jude Medical, Inc. * | | | 10,088 | | | 393,634 | |
Stryker Corp. | | | 6,933 | | | 266,504 | |
Varian Medical Systems, Inc. * | | | 3,625 | | | 129,630 | |
Zimmer Holdings, Inc. * | | | 6,494 | | | 289,308 | |
| | | | |
|
| |
| | | | | | 5,188,427 | |
| | | | |
|
| |
Health Care Providers & Services 2.1% | | | | | | | |
Aetna, Inc. | | | 13,216 | | | 353,924 | |
AmerisourceBergen Corp. | | | 4,438 | | | 164,650 | |
Cardinal Health, Inc. | | | 10,503 | | | 375,482 | |
CIGNA Corp. | | | 7,899 | | | 175,121 | |
Coventry Health Care, Inc. * | | | 4,322 | | | 78,012 | |
DaVita, Inc. * | | | 3,028 | | | 136,593 | |
Express Scripts, Inc. * | | | 7,218 | | | 462,313 | |
Humana, Inc. * | | | 4,921 | | | 154,175 | |
Laboratory Corp. of America Holdings * | | | 3,156 | | | 192,390 | |
McKesson Corp. | | | 7,980 | | | 328,377 | |
Medco Health Solutions, Inc. * | | | 14,310 | | | 656,686 | |
Patterson Companies, Inc. * | | | 2,666 | | | 54,893 | |
Quest Diagnostics, Inc. | | | 4,499 | | | 234,938 | |
Tenet Healthcare Corp. * | | | 12,104 | | | 43,937 | |
UnitedHealth Group, Inc. | | | 35,426 | | | 942,331 | |
WellPoint, Inc. * | | | 14,524 | | | 676,383 | |
| | | | |
|
| |
| | | | | | 5,030,205 | |
| | | | |
|
| |
Health Care Technology 0.0% | | | | | | | |
IMS Health, Inc. | | | 5,292 | | | 63,716 | |
| | | | |
|
| |
Life Sciences Tools & Services 0.4% | | | | | | | |
Life Technologies Corp. * | | | 5,065 | | | 196,421 | |
Millipore Corp. * | | | 1,614 | | | 101,504 | |
PerkinElmer, Inc. | | | 3,386 | | | 55,090 | |
Thermo Fisher Scientific, Inc. * | | | 12,186 | | | 474,157 | |
Waters Corp. * | | | 2,828 | | | 122,509 | |
| | | | |
|
| |
| | | | | | 949,681 | |
| | | | |
|
| |
Pharmaceuticals 7.2% | | | | | | | |
Abbott Laboratories | | | 45,036 | | | 2,029,322 | |
Allergan, Inc. | | | 8,962 | | | 395,493 | |
Bristol-Myers Squibb Co. | | | 57,687 | | | 1,149,125 | |
See Combined Notes to Financial Statements
SCHEDULE OF INVESTMENTS continued
Market Index Fund
May 31, 2009
Eli Lilly & Co. | | | 29,467 | | | 1,018,674 | |
Forest Laboratories, Inc. * | | | 8,790 | | | 208,235 | |
Johnson & Johnson | | | 80,602 | | | 4,446,006 | |
King Pharmaceuticals, Inc. * | | | 7,183 | | | 67,951 | |
Merck & Co., Inc. | | | 61,423 | | | 1,694,047 | |
Mylan Laboratories, Inc. * | | | 8,880 | | | 117,305 | |
Pfizer, Inc. | | | 196,572 | | | 2,985,929 | |
Schering-Plough Corp. | | | 47,397 | | | 1,156,487 | |
Watson Pharmaceuticals, Inc. * | | | 3,049 | | | 92,232 | |
Wyeth | | | 38,800 | | | 1,740,568 | |
| | | | |
|
| |
| | | | | | 17,101,374 | |
| | | | |
|
| |
INDUSTRIALS 10.0% | | | | | | | |
Aerospace & Defense 2.7% | | | | | | | |
Boeing Co. | | | 21,161 | | | 949,071 | |
General Dynamics Corp. | | | 11,251 | | | 640,182 | |
Goodrich Corp. | | | 3,607 | | | 175,084 | |
Honeywell International, Inc. | | | 21,425 | | | 710,453 | |
L-3 Communications Holdings, Inc. | | | 3,456 | | | 254,051 | |
Lockheed Martin Corp. | | | 9,676 | | | 809,204 | |
Northrop Grumman Corp. | | | 9,535 | | | 454,057 | |
Precision Castparts Corp. | | | 4,078 | | | 336,720 | |
Raytheon Co. | | | 11,660 | | | 520,619 | |
Rockwell Collins Corp. | | | 4,608 | | | 195,471 | |
United Technologies Corp. | | | 27,461 | | | 1,444,723 | |
| | | | |
|
| |
| | | | | | 6,489,635 | |
| | | | |
|
| |
Air Freight & Logistics 1.0% | | | | | | | |
C.H. Robinson Worldwide, Inc. | | | 4,960 | | | 252,067 | |
Expeditors International of Washington, Inc. | | | 6,181 | | | 202,799 | |
FedEx Corp. | | | 9,072 | | | 502,861 | |
United Parcel Service, Inc., Class B | | | 29,009 | | | 1,483,520 | |
| | | | |
|
| |
| | | | | | 2,441,247 | |
| | | | |
|
| |
Airlines 0.1% | | | | | | | |
Southwest Airlines Co. | | | 21,570 | | | 145,382 | |
| | | | |
|
| |
Building Products 0.0% | | | | | | | |
Masco Corp. | | | 10,477 | | | 108,542 | |
| | | | |
|
| |
Commercial Services & Supplies 0.5% | | | | | | | |
Avery Dennison Corp. | | | 3,285 | | | 90,535 | |
Cintas Corp. | | | 3,829 | | | 89,177 | |
Iron Mountain, Inc. * | | | 5,234 | | | 142,627 | |
Pitney Bowes, Inc. | | | 6,013 | | | 137,577 | |
R.R. Donnelley & Sons Co. | | | 5,980 | | | 80,610 | |
Republic Services, Inc. | | | 9,383 | | | 213,839 | |
Stericycle, Inc. * | | | 2,485 | | | 124,200 | |
Waste Management, Inc. | | | 14,322 | | | 395,144 | |
| | | | |
|
| |
| | | | | | 1,273,709 | |
| | | | |
|
| |
Construction & Engineering 0.2% | | | | | | | |
Fluor Corp. | | | 5,290 | | | 248,524 | |
Jacobs Engineering Group, Inc. * | | | 3,587 | | | 153,883 | |
| | | | |
|
| |
| | | | | | 402,407 | |
| | | | |
|
| |
See Combined Notes to Financial Statements
SCHEDULE OF INVESTMENTS continued
Market Index Fund
May 31, 2009
Electrical Equipment 0.4% | | | | | | | |
Cooper Industries, Inc. | | | 4,870 | | | 159,834 | |
Emerson Electric Co. | | | 22,003 | | | 706,076 | |
Rockwell Automation, Inc. | | | 4,132 | | | 126,811 | |
| | | | |
|
| |
| | | | | | 992,721 | |
| | | | |
|
| |
Industrial Conglomerates 2.3% | | | | | | | |
3M Co. | | | 20,219 | | | 1,154,505 | |
General Electric Co. | | | 307,754 | | | 4,148,524 | |
Textron, Inc. | | | 7,683 | | | 88,354 | |
| | | | |
|
| |
| | | | | | 5,391,383 | |
| | | | |
|
| |
Machinery 1.6% | | | | | | | |
Caterpillar, Inc. | | | 17,530 | | | 621,614 | |
Cummins, Inc. | | | 5,868 | | | 190,299 | |
Danaher Corp. | | | 7,430 | | | 448,401 | |
Deere & Co. | | | 12,318 | | | 535,463 | |
Dover Corp. | | | 5,421 | | | 170,436 | |
Eaton Corp. | | | 4,814 | | | 209,409 | |
Flowserve Corp. | | | 1,630 | | | 119,919 | |
Illinois Tool Works, Inc. | | | 11,201 | | | 361,680 | |
Ingersoll-Rand Co., Ltd., Class A | | | 9,292 | | | 187,977 | |
ITT Corp. | | | 5,298 | | | 218,172 | |
Manitowoc Co. | | | 3,799 | | | 24,770 | |
Paccar, Inc. | | | 10,572 | | | 315,574 | |
Pall Corp. | | | 3,441 | | | 88,365 | |
Parker Hannifin Corp. | | | 4,682 | | | 197,861 | |
| | | | |
|
| |
| | | | | | 3,689,940 | |
| | | | |
|
| |
Professional Services 0.2% | | | | | | | |
Dun & Bradstreet Corp. | | | 1,556 | | | 127,265 | |
Equifax, Inc. | | | 3,686 | | | 100,333 | |
Monster Worldwide, Inc. * | | | 3,729 | | | 43,555 | |
Robert Half International, Inc. | | | 4,411 | | | 94,351 | |
| | | | |
|
| |
| | | | | | 365,504 | |
| | | | |
|
| |
Road & Rail 0.9% | | | | | | | |
Burlington Northern Santa Fe Corp. | | | 8,110 | | | 587,488 | |
CSX Corp. | | | 11,635 | | | 369,528 | |
Norfolk Southern Corp. | | | 10,679 | | | 397,259 | |
Ryder System, Inc. | | | 1,621 | | | 45,680 | |
Union Pacific Corp. | | | 14,664 | | | 722,495 | |
| | | | |
|
| |
| | | | | | 2,122,450 | |
| | | | |
|
| |
Trading Companies & Distributors 0.1% | | | | | | | |
Fastenal Co. | | | 3,766 | | | 125,106 | |
W.W. Grainger, Inc. | | | 1,854 | | | 146,151 | |
| | | | |
|
| |
| | | | | | 271,257 | |
| | | | |
|
| |
INFORMATION TECHNOLOGY 17.4% | | | | | | | |
Communications Equipment 2.9% | | | | | | | |
Ciena Corp. * | | | 2,642 | | | 29,062 | |
Cisco Systems, Inc. * | | | 170,104 | | | 3,146,924 | |
Corning, Inc. | | | 45,317 | | | 666,160 | |
Harris Corp. | | | 3,894 | | | 121,025 | |
See Combined Notes to Financial Statements
SCHEDULE OF INVESTMENTS continued
Market Index Fund
May 31, 2009
JDS Uniphase Corp. * | | | 6,269 | | | 33,790 | |
Juniper Networks, Inc. * | | | 15,216 | | | 376,292 | |
Motorola, Inc. | | | 66,344 | | | 402,044 | |
QUALCOMM, Inc. | | | 48,069 | | | 2,095,328 | |
Tellabs, Inc. * | | | 11,531 | | | 63,997 | |
| | | | |
|
| |
| | | | | | 6,934,622 | |
| | | | |
|
| |
Computers & Peripherals 5.1% | | | | | | | |
Apple, Inc. * | | | 25,953 | | | 3,524,677 | |
Dell, Inc. * | | | 50,432 | | | 584,003 | |
EMC Corp. * | | | 58,631 | | | 688,914 | |
Hewlett-Packard Co. | | | 69,843 | | | 2,399,107 | |
International Business Machines Corp. | | | 39,099 | | | 4,155,442 | |
Lexmark International, Inc., Class A * | | | 2,267 | | | 37,043 | |
NetApp, Inc. * | | | 9,639 | | | 187,961 | |
QLogic Corp. * | | | 3,533 | | | 48,225 | |
SanDisk Corp. * | | | 6,590 | | | 103,199 | |
Sun Microsystems, Inc. * | | | 21,702 | | | 195,318 | |
Teradata Corp. * | | | 5,043 | | | 108,929 | |
| | | | |
|
| |
| | | | | | 12,032,818 | |
| | | | |
|
| |
Electronic Equipment, Instruments & Components 0.3% | | | | | | | |
Agilent Technologies, Inc. * | | | 10,258 | | | 187,003 | |
Amphenol Corp., Class A | | | 4,989 | | | 166,583 | |
Flir Systems, Inc. * | | | 4,395 | | | 98,712 | |
Jabil Circuit, Inc. | | | 6,232 | | | 48,797 | |
Molex, Inc. | | | 4,039 | | | 61,716 | |
Tyco Electronics, Ltd. | | | 13,347 | | | 231,837 | |
| | | | |
|
| |
| | | | | | 794,648 | |
| | | | |
|
| |
Internet Software & Services 1.8% | | | | | | | |
Akamai Technologies, Inc. * | | | 4,969 | | | 110,610 | |
eBay, Inc. * | | | 31,406 | | | 553,374 | |
Google, Inc., Class A * | | | 6,983 | | | 2,913,517 | |
VeriSign, Inc. * | | | 5,605 | | | 131,213 | |
Yahoo!, Inc. * | | | 40,630 | | | 643,579 | |
| | | | |
|
| |
| | | | | | 4,352,293 | |
| | | | |
|
| |
IT Services 0.9% | | | | | | | |
Affiliated Computer Services, Inc., Class A * | | | 2,843 | | | 127,764 | |
Automatic Data Processing, Inc. * | | | 14,714 | | | 559,279 | |
Cognizant Technology Solutions Corp., Class A * | | | 8,503 | | | 214,191 | |
Computer Sciences Corp. * | | | 4,415 | | | 187,461 | |
Convergys Corp. * | | | 3,561 | | | 32,939 | |
Fidelity National Information Services, Inc. | | | 5,564 | | | 107,163 | |
Fiserv, Inc. * | | | 4,546 | | | 192,569 | |
Paychex, Inc. | | | 9,358 | | | 256,128 | |
Total System Services, Inc. | | | 5,749 | | | 78,474 | |
Western Union Co. | | | 20,691 | | | 364,782 | |
| | | | |
|
| |
| | | | | | 2,120,750 | |
| | | | |
|
| |
Office Electronics 0.1% | | | | | | | |
Xerox Corp. | | | 25,202 | | | 171,374 | |
| | | | |
|
| |
Semiconductors & Semiconductor Equipment 2.4% | | | | | | | |
Advanced Micro Devices, Inc. * | | | 16,315 | | | 74,070 | |
Altera Corp. | | | 8,547 | | | 145,470 | |
See Combined Notes to Financial Statements
SCHEDULE OF INVESTMENTS continued
Market Index Fund
May 31, 2009
Analog Devices, Inc. | | | 8,487 | | | 207,168 | |
Applied Materials, Inc. | | | 38,740 | | | 436,212 | |
Broadcom Corp., Class A * | | | 12,398 | | | 315,901 | |
Intel Corp. | | | 162,089 | | | 2,548,039 | |
KLA-Tencor Corp. | | | 4,950 | | | 133,650 | |
Linear Technology Corp. | | | 6,465 | | | 151,346 | |
LSI Corp. * | | | 18,888 | | | 84,429 | |
MEMC Electronic Materials, Inc. * | | | 6,513 | | | 125,636 | |
Microchip Technology, Inc. | | | 5,308 | | | 114,493 | |
Micron Technology, Inc. * | | | 24,014 | | | 121,511 | |
National Semiconductor Corp. | | | 5,682 | | | 78,866 | |
Novellus Systems, Inc. * | | | 2,829 | | | 50,724 | |
NVIDIA Corp. * | | | 15,651 | | | 163,240 | |
Teradyne, Inc. * | | | 5,033 | | | 35,986 | |
Texas Instruments, Inc. | | | 37,202 | | | 721,719 | |
Xilinx, Inc. | | | 7,988 | | | 165,671 | |
| | | | |
|
| |
| | | | | | 5,674,131 | |
| | | | |
|
| |
Software 3.9% | | | | | | | |
Adobe Systems, Inc. * | | | 15,272 | | | 430,365 | |
Autodesk, Inc. * | | | 6,595 | | | 141,529 | |
BMC Software, Inc. * | | | 5,381 | | | 183,492 | |
CA, Inc. | | | 11,492 | | | 200,535 | |
Citrix Systems, Inc. * | | | 5,249 | | | 164,871 | |
Compuware Corp. * | | | 7,187 | | | 54,837 | |
Electronic Arts, Inc. * | | | 9,379 | | | 215,623 | |
Intuit, Inc. * | | | 9,361 | | | 254,806 | |
McAfee, Inc. * | | | 4,491 | | | 176,182 | |
Microsoft Corp. | | | 222,818 | | | 4,654,668 | |
Novell, Inc. * | | | 10,036 | | | 41,750 | |
Oracle Corp. | | | 111,763 | | | 2,189,437 | |
Salesforce.com, Inc. * | | | 3,080 | | | 116,886 | |
Symantec Corp. * | | | 23,925 | | | 372,991 | |
| | | | |
|
| |
| | | | | | 9,197,972 | |
| | | | |
|
| |
MATERIALS 3.3% | | | | | | | |
Chemicals 1.9% | | | | | | | |
Air Products & Chemicals, Inc. | | | 6,110 | | | 395,806 | |
CF Industries Holdings, Inc. | | | 1,410 | | | 109,472 | |
Dow Chemical Co. | | | 30,739 | | | 543,466 | |
E.I. DuPont de Nemours & Co. | | | 26,302 | | | 748,818 | |
Eastman Chemical Co. | | | 2,114 | | | 87,604 | |
Ecolab, Inc. | | | 4,887 | | | 182,529 | |
International Flavors & Fragrances, Inc. | | | 2,293 | | | 73,147 | |
Monsanto Co. | | | 15,968 | | | 1,311,771 | |
PPG Industries, Inc. | | | 4,786 | | | 212,833 | |
Praxair, Inc. | | | 8,949 | | | 655,067 | |
Sigma-Aldrich Corp. | | | 3,559 | | | 172,469 | |
| | | | |
|
| |
| | | | | | 4,492,982 | |
| | | | |
|
| |
Construction Materials 0.1% | | | | | | | |
Vulcan Materials Co. | | | 3,216 | | | 142,437 | |
| | | | |
|
| |
Containers & Packaging 0.2% | | | | | | | |
Ball Corp. | | | 2,733 | | | 108,773 | |
Bemis Co., Inc. | | | 2,910 | | | 73,012 | |
See Combined Notes to Financial Statements
SCHEDULE OF INVESTMENTS continued
Market Index Fund
May 31, 2009
Owens-Illinois, Inc. * | | | 4,871 | | | 139,457 | |
Pactiv Corp. * | | | 3,833 | | | 85,859 | |
Sealed Air Corp. | | | 4,601 | | | 92,066 | |
| | | | |
|
| |
| | | | | | 499,167 | |
| | | | |
|
| |
Metals & Mining 0.9% | | | | | | | |
AK Steel Holding Corp. * | | | 3,232 | | | 46,217 | |
Alcoa, Inc. | | | 27,694 | | | 255,339 | |
Allegheny Technologies, Inc. | | | 2,840 | | | 100,564 | |
Freeport-McMoRan Copper & Gold, Inc. | | | 11,997 | | | 652,997 | |
Newmont Mining Corp. * | | | 14,256 | | | 696,691 | |
Nucor Corp. | | | 9,152 | | | 401,864 | |
Titanium Metals Corp. | | | 2,480 | | | 22,965 | |
United States Steel Corp. | | | 4,074 | | | 138,842 | |
| | | | |
|
| |
| | | | | | 2,315,479 | |
| | | | |
|
| |
Paper & Forest Products 0.2% | | | | | | | |
International Paper Co. | | | 12,466 | | | 179,136 | |
MeadWestvaco Corp. | | | 4,978 | | | 79,499 | |
Weyerhaeuser Co. | | | 6,156 | | | 206,719 | |
| | | | |
|
| |
| | | | | | 465,354 | |
| | | | |
|
| |
TELECOMMUNICATION SERVICES 3.4% | | | | | | | |
Diversified Telecommunication Services 3.1% | | | | | | | |
AT&T, Inc. | | | 171,744 | | | 4,257,534 | |
CenturyTel, Inc. | | | 2,924 | | | 90,205 | |
Embarq Corp. | | | 4,155 | | | 174,593 | |
Frontier Communications Corp. | | | 9,072 | | | 66,044 | |
Qwest Communications International, Inc. * | | | 42,827 | | | 186,726 | |
Verizon Communications, Inc. | | | 82,781 | | | 2,422,172 | |
Windstream Corp. | | | 12,855 | | | 108,111 | |
| | | | |
|
| |
| | | | | | 7,305,385 | |
| | | | |
|
| |
Wireless Telecommunication Services 0.3% | | | | | | | |
American Tower Corp., Class A * | | | 11,572 | | | 368,799 | |
Sprint Nextel Corp. * | | | 83,491 | | | 429,979 | |
| | | | |
|
| |
| | | | | | 798,778 | |
| | | | |
|
| |
UTILITIES 3.8% | | | | | | | |
Electric Utilities 2.3% | | | | | | | |
Allegheny Energy, Inc. | | | 4,937 | | | 123,425 | |
American Electric Power Co., Inc. | | | 13,582 | | | 357,750 | |
CMS Energy Corp. | | | 6,604 | | | 74,889 | |
Consolidated Edison, Inc. | | | 7,981 | | | 283,006 | |
Duke Energy Corp. | | | 37,336 | | | 528,304 | |
Edison International | | | 9,495 | | | 277,634 | |
Entergy Corp. | | | 5,521 | | | 411,977 | |
Exelon Corp. | | | 19,183 | | | 920,976 | |
FirstEnergy Corp. | | | 8,884 | | | 335,726 | |
FPL Group, Inc. | | | 11,918 | | | 673,725 | |
Northeast Utilities | | | 5,018 | | | 104,324 | |
Pepco Holdings, Inc. | | | 6,385 | | | 82,877 | |
Pinnacle West Capital Corp. | | | 2,943 | | | 81,374 | |
PPL Corp. | | | 10,938 | | | 355,157 | |
Progress Energy, Inc. | | | 8,031 | | | 285,181 | |
See Combined Notes to Financial Statements
SCHEDULE OF INVESTMENTS continued
Market Index Fund
May 31, 2009
Southern Co. * | | | 22,662 | | | 643,828 | |
| | | | |
|
| |
| | | | | | 5,540,153 | |
| | | | |
|
| |
Gas Utilities 0.1% | | | | | | | |
EQT Corp. | | | 3,814 | | | 142,071 | |
Nicor, Inc. | | | 1,317 | | | 41,420 | |
Questar Corp. | | | 5,059 | | | 171,450 | |
| | | | |
|
| |
| | | | | | 354,941 | |
| | | | |
|
| |
Independent Power Producers & Energy Traders 0.2% | | | | | | | |
AES Corp. * | | | 19,415 | | | 193,956 | |
Constellation Energy Group, Inc. | | | 5,803 | | | 158,306 | |
Dynegy, Inc., Class A * | | | 14,752 | | | 29,651 | |
| | | | |
|
| |
| | | | | | 381,913 | |
| | | | |
|
| |
Multi-Utilities 1.2% | | | | | | | |
Ameren Corp. | | | 6,193 | | | 144,049 | |
CenterPoint Energy, Inc. | | | 10,124 | | | 102,455 | |
Dominion Resources, Inc. | | | 17,004 | | | 540,557 | |
DTE Energy Co. | | | 4,758 | | | 143,929 | |
Integrys Energy Group, Inc. | | | 2,227 | | | 60,329 | |
NiSource, Inc. | | | 7,994 | | | 85,456 | |
PG&E Corp. | | | 10,659 | | | 391,292 | |
Public Service Enterprise Group, Inc. | | | 14,746 | | | 469,955 | |
SCANA Corp. | | | 3,532 | | | 106,031 | |
Sempra Energy | | | 7,094 | | | 324,054 | |
TECO Energy, Inc. | | | 6,205 | | | 69,620 | |
Wisconsin Energy Corp. | | | 3,407 | | | 134,440 | |
Xcel Energy, Inc. | | | 13,237 | | | 227,015 | |
| | | | |
|
| |
| | | | | | 2,799,182 | |
| | | | |
|
| |
Total Common Stocks (cost $229,401,050) | | | | | | 234,157,557 | |
| | | | |
|
| |
| | | | | | | |
| | Principal | | | | |
| | Amount | | Value | |
|
|
|
|
|
|
| |
SHORT-TERM INVESTMENTS 1.0% | | | | | | | |
U.S. TREASURY OBLIGATIONS 0.1% | | | | | | | |
U.S. Treasury Bills: | | | | | | | |
0.08%, 07/23/2009 ß ƒ | | $ | 100,000 | | | 99,985 | |
0.13%, 06/18/2009 ß ƒ | | | 200,000 | | | 199,989 | |
0.18%, 06/25/2009 ß ƒ | | | 25,000 | | | 24,998 | |
| | | | |
|
| |
| | | | | | 324,972 | |
| | | | |
|
| |
| | | | | | | |
| | Shares | | Value | |
|
|
|
|
|
|
| |
MUTUAL FUND SHARES 0.9% | | | | | | | |
Evergreen Institutional Money Market Fund, Class I, 0.35% q ø | | | 2,022,143 | | | 2,022,143 | |
| | | | |
|
| |
Total Short-Term Investments (cost $2,347,115) | | | | | | 2,347,115 | |
| | | | |
|
| |
Total Investments (cost $231,748,165) 99.7% | | | | | | 236,504,672 | |
Other Assets and Liabilities 0.3% | | | | | | 624,802 | |
| | | | |
|
| |
Net Assets 100.0% | | | | | $ | 237,129,474 | |
| | | | |
|
| |
See Combined Notes to Financial Statements
SCHEDULE OF INVESTMENTS continued
Market Index Fund
May 31, 2009
* | Non-income producing security |
° | Investment in non-controlled affiliate. At May 31, 2009, the Fund invested in securities issued by Wachovia Corp. and/or Wells Fargo & Co. with a cost basis of $5,175,852 and earned $86,479 of income for the year ended May 31, 2009 which is included in income from affiliated issuers. |
ß | Rate shown represents the yield to maturity at date of purchase. |
ƒ | All or a portion of this security was pledged to cover initial margin requirements for open futures contracts. |
ø | Evergreen Investment Management Company, LLC is the investment advisor to both the Fund and the money market fund. |
q | Rate shown is the 7-day annualized yield at period end. |
The following table shows the percent of total long-term investments by sector as of May 31, 2009:
Information Technology | 17.6 | % |
Health Care | 13.9 | % |
Financials | 13.7 | % |
Energy | 13.0 | % |
Consumer Staples | 12.0 | % |
Industrials | 10.1 | % |
Consumer Discretionary | 8.9 | % |
Utilities | 3.9 | % |
Telecommunication Services | 3.5 | % |
Materials | 3.4 | % |
|
| |
| 100.0 | % |
|
| |
See Combined Notes to Financial Statements
Market Index Fund
STATEMENT OF ASSETS AND LIABILITIES
May 31, 2009
Assets | | | | |
Investments in unaffiliated issuers, at value (cost $224,550,170) | | $ | 231,079,911 | |
Investments in affiliated issuers, at value (cost $7,197,995) | | | 5,424,761 | |
|
|
|
| |
Total investments | | | 236,504,672 | |
Dividends receivable | | | 621,502 | |
Receivable for daily variation margin on open futures contracts | | | 41,600 | |
Receivable from investment advisor | | | 2,406 | |
|
|
|
| |
Total assets | | | 237,170,180 | |
|
|
|
| |
Liabilities | | | | |
Payable for securities purchased | | | 5,381 | |
Due to related parties | | | 2,061 | |
Trustees’ fees and expenses payable | | | 14,404 | |
Printing and postage expenses payable | | | 4,531 | |
Custodian and accounting fees payable | | | 4,194 | |
Accrued expenses and other liabilities | | | 10,135 | |
|
|
|
| |
Total liabilities | | | 40,706 | |
|
|
|
| |
Net assets | | $ | 237,129,474 | |
|
|
|
| |
Net assets represented by | | | | |
Paid-in capital | | $ | 230,781,307 | |
Undistributed net investment income | | | 6,827,237 | |
Accumulated net realized losses on investments | | | (5,997,784 | ) |
Net unrealized gains on investments | | | 5,518,714 | |
|
|
|
| |
Total net assets | | $ | 237,129,474 | |
|
|
|
| |
Shares outstanding (unlimited number of shares authorized) | | | | |
Class I | | | 33,169,600 | |
|
|
|
| |
Net asset value per share | | | | |
Class I | | $ | 7.15 | |
|
|
|
| |
See Combined Notes to Financial Statements
Market Index Fund
STATEMENT OF OPERATIONS
Year Ended May 31, 2009
Investment income | | | | |
Dividends | | $ | 6,588,161 | |
Securities lending | | | 306,333 | |
Income from affiliated issuers | | | 104,980 | |
Interest | | | 1,627 | |
|
|
|
| |
Total investment income | | | 7,001,101 | |
|
|
|
| |
Expenses | | | | |
Advisory fee | | | 811,332 | |
Administrative services fee | | | 253,541 | |
Transfer agent fees | | | 62 | |
Trustees’ fees and expenses | | | 5,846 | |
Printing and postage expenses | | | 9,799 | |
Custodian and accounting fees | | | 63,848 | |
Registration and filing fees | | | 1,882 | |
Professional fees | | | 33,602 | |
Other | | | 10,874 | |
|
|
|
| |
Total expenses | | | 1,190,786 | |
Less: Expense reductions | | | (684 | ) |
Fee waivers and expense reimbursements | | | (1,127,984 | ) |
|
|
|
| |
Net expenses | | | 62,118 | |
|
|
|
| |
Net investment income | | | 6,938,983 | |
|
|
|
| |
Net realized and unrealized gains or losses on investments | | | | |
Net realized losses on: | | | | |
Securities | | | | |
Unaffiliated issuers | | | (4,897,769 | ) |
Affiliated issuers | | | (2,299 | ) |
Futures contracts | | | (865,233 | ) |
|
|
|
| |
Net realized losses on investments | | | (5,765,301 | ) |
|
|
|
| |
Net change in unrealized gains or losses on: | | | | |
Securities | | | | |
Unaffiliated issuers | | | (114,656,451 | ) |
Affiliated issuers | | | (1,178,580 | ) |
Futures contracts | | | 652,548 | |
|
|
|
| |
Net change in unrealized gains or losses on investments | | | (115,182,483 | ) |
|
|
|
| |
Net realized and unrealized gains or losses on investments | | | (120,947,784 | ) |
|
|
|
| |
Net decrease in net assets resulting from operations | | $ | (114,008,801 | ) |
|
|
|
| |
See Combined Notes to Financial Statements
Market Index Fund
STATEMENTS OF CHANGES IN NET ASSETS
| | Year Ended May 31, | |
| |
| |
| | 2009 | | 2008 | |
|
|
|
|
| |
Operations | | | | | | | | | | | |
Net investment income | | | | $ | 6,938,983 | | | | $ | 9,425,929 | |
Net realized gains or losses on investments | | | | | (5,765,301 | ) | | | | 35,363,590 | |
Net change in unrealized gains or losses on investments | | | | | (115,182,483 | ) | | | | (82,016,910 | ) |
|
|
|
|
|
|
|
|
|
|
| |
Net decrease in net assets resulting from operations | | | | | (114,008,801 | ) | | | | (37,227,391 | ) |
|
|
|
|
|
|
|
|
|
|
| |
Distributions to shareholders from | | | | | | | | | | | |
Net investment income | | | | | (9,255,640 | ) | | | | (9,035,174 | ) |
Net realized gains | | | | | (35,072,268 | ) | | | | (7,122,511 | ) |
|
|
|
|
|
|
|
|
|
|
| |
Total distributions to shareholders | | | | | (44,327,908 | ) | | | | (16,157,685 | ) |
|
|
|
|
|
|
|
|
|
|
| |
| | Shares | | | | | Shares | | | | |
|
|
|
|
|
|
|
|
|
|
| |
Capital share transactions | | | | | | | | | | | |
Net asset value of shares issued in reinvestment of distributions | | 6,380,516 | | | 44,327,908 | | 1,172,071 | | | 16,157,685 | |
Payment for shares redeemed | | 0 | | | 0 | | (12,945,583 | ) | | (170,000,000 | ) |
|
|
|
|
|
|
|
|
|
|
| |
Net increase (decrease) in net assets resulting from capital share transactions | | | | | 44,327,908 | | | | | (153,842,315 | ) |
|
|
|
|
|
|
|
|
|
|
| |
Total decrease in net assets | | | | | (114,008,801 | ) | | | | (207,227,391 | ) |
Net assets | | | | | | | | | | | |
Beginning of period | | | | | 351,138,275 | | | | | 558,365,666 | |
|
|
|
|
|
|
|
|
|
|
| |
End of period | | | | $ | 237,129,474 | | | | $ | 351,138,275 | |
|
|
|
|
|
|
|
|
|
|
| |
Undistributed net investment income | | | | $ | 6,827,237 | | | | $ | 9,234,611 | |
|
|
|
|
|
|
|
|
|
|
| |
See Combined Notes to Financial Statements
This page left intentionally blank
Market Index Growth Fund
FUND AT A GLANCE
as of May 31, 2009
MANAGEMENT TEAM
Investment Advisor:
Evergreen Investment Management Company, LLC
Portfolio Manager:
William E. Zieff
CURRENT INVESTMENT STYLE
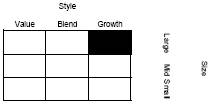
Source: Morningstar, Inc.
Morningstar’s style box is based on a portfolio date as of 3/31/2009.
The Equity style box placement is based on 10 growth and valuation measures for each fund holding and the median size of the companies in which the fund invests.
PERFORMANCE AND RETURNS
Portfolio inception date: 10/15/2002
| Class I |
Class inception date | 10/15/2002 |
|
|
Average annual return | |
|
|
1-year | -30.66% |
|
|
5-year | -1.80% |
|
|
Since portfolio inception | 2.43% |
|
|
Past performance is no guarantee of future results. The performance quoted represents past performance and current performance may be lower or higher. The investment return and principal value of an investment will fluctuate so that investors’ shares, when redeemed, may be worth more or less than their original cost. Performance includes the reinvestment of income dividends and capital gain distributions.
The advisor is waiving its advisory fee and reimbursing the fund for a portion of other expenses. Had the fee not been waived and expenses not reimbursed, returns would have been lower.
The fund is only offered to certain pension plans having at least $100 million. Class I shares are sold without a front-end or deferred sales charge. The minimum initial investment for the fund is $100 million, which may be waived in certain situations. There is no minimum amount required for subsequent purchases.
LONG-TERM GROWTH

Comparison of a $100,000,000 investment in the Evergreen Market Index Growth Fund Class I shares versus a similar investment in the Russell 1000 Growth Index (Russell 1000 Growth) and the Consumer Price Index (CPI).
The Russell 1000 Growth is an unmanaged market index and does not include transaction costs associated with buying and selling securities, any mutual fund fees or expenses or any taxes. The CPI is a commonly used measure of inflation and does not represent an investment return. It is not possible to invest directly in an index.
The fund’s investment objective may be changed without a vote of the fund’s shareholders.
“Russell 1000 Growth Index” is a trademark and service mark of Frank Russell Company (FRC) and has been licensed for use by Evergreen Investments. The product is not sponsored, endorsed, sold or promoted by FRC and FRC makes no representation regarding the advisability of investing in the product.
All data is as of May 31, 2009, and subject to change.
Evergreen Market Index Growth Fund
PORTFOLIO MANAGER COMMENTARY
The fund’s Class I shares returned -30.66% for the twelve-month period ended May 31, 2009. During the same period, the Russell 1000 Growth returned -30.71%.
The fund’s objective is to seek investment results that achieve price and yield performance similar to the Russell 1000 Growth Index.
Investment process
The overall domestic stock market produced sharply negative returns during the fiscal year ended May 31, 2009, with growth-oriented stocks faring better than value-oriented stocks. Some of those losses were tempered by the end of the period, as domestic markets enjoyed a major rebound.
The fund’s objective is to replicate the performance of the Russell 1000 Growth Index (before fees and expenses). The portfolio management team uses an investment process designed to control trading and implementation costs and reduce tracking error as much as possible. As a result, the fund’s performance should closely align with that of the index. Periodic rebalancing takes place in order to reflect the frequently changing constituents of the index.
Contributors to performance
The best-performing sector, which nonetheless lost about one-sixth of its value, was Consumer Staples. Despite the overall loss, individual stocks within the sector produced gains. Names such as Anheuser-Busch and Hansen Natural Corp. finished the period with respectably positive returns. Despite the gloomy news and market returns, numerous stocks in other sectors still eked out gains over the period, in some cases substantial gains. The companies returning the most in value included APP Pharmaceuticals, Philadelphia Consolidated Holding and ImClone Systems. Given their collectively small weight in the fund, Telecommunications Services, Utilities and Materials companies detracted the least from performance and individual stocks in these sectors posted gains. Notable contributors included Qwest Communications, Rohm & Haas and Newmont Mining.
Detractors from performance
The composition of the benchmark is weighted more heavily by Information Technology-oriented companies, followed by Health Care. Indeed, the worse contribution to total return was from the Information Technology sector, followed by Industrials. Among Technology companies, Microsoft and Cisco Systems materially detracted from performance. Across the Industrials sector, Caterpillar and Boeing were leading detractors. The sector with the overall worst return was Energy, including such names as Schlumberger and Transocean. Also producing dismal returns were Utilities companies, with names like Exelon and Constellation Energy Group. Finally, companies that filed for bankruptcy or that were partially nationalized generated the worst returns, losing almost all of their market value. These names included Chemtura Corp., General Growth Properties and Freddie Mac.
This commentary reflects the views and opinions of the fund’s portfolio manager(s) on the date indicated and may include statements that constitute “forward-looking statements” under the U.S. Securities laws. Forward-looking statements include, among other things, projections, estimates, and information about possible or future results related to the fund, markets, or regulatory developments. The views expressed above are not guarantees of future performance or economic results and involve certain risks, uncertainties, and assumptions that could cause actual outcomes and results to differ materially from the views expressed herein. The views expressed above are subject to change at any time based upon economic, market, or other conditions and Evergreen undertakes no obligation to update the views expressed herein. Any discussions of specific securities should not be considered a recommendation to buy or sell those securities. The views expressed herein (including any forward-looking statements) may not be relied upon as investment advice or as an indication of the fund’s trading intent.
Market Index Growth Fund
ABOUT YOUR FUND’S EXPENSES
The Example below is intended to describe the fees and expenses borne by shareholders and the impact of those costs on your investment.
Example
As a shareholder of the fund, you incur two types of costs: (1) transaction costs, including sales charges (loads), redemption fees and exchange fees; and (2) ongoing costs, including management fees, distribution (12b-1) fees and other fund expenses. This Example is intended to help you understand your ongoing costs (in dollars) of investing in the fund and to compare these costs with the ongoing costs of investing in other mutual funds. The Example is based on an investment of $1,000 invested at the beginning of the period and held for the entire period from December 1, 2008 to May 31, 2009.
The example illustrates your fund’s costs in two ways:
• Actual expenses
The section in the table under the heading “Actual” provides information about actual account values and actual expenses. You may use the information in these columns, together with the amount you invested, to estimate the expenses that you paid over the period. Simply divide your account value by $1,000 (for example, an $8,600 account value divided by $1,000 = 8.6), then multiply the result by the number in the appropriate column for your share class, in the column entitled “Expenses Paid During Period” to estimate the expenses you paid on your account during this period.
• Hypothetical example for comparison purposes
The section in the table under the heading “Hypothetical (5% return before expenses)” provides information about hypothetical account values and hypothetical expenses based on the fund’s actual expense ratio and an assumed rate of return of 5% per year before expenses, which is not the fund’s actual return. The hypothetical account values and expenses may not be used to estimate the actual ending account balance or expenses you paid for the period. You may use this information to compare the ongoing costs of investing in the fund and other funds. To do so, compare this 5% hypothetical example with the 5% hypothetical examples that appear in the shareholder reports of the other funds.
Please note that the expenses shown in the table are meant to highlight your ongoing costs only and do not reflect any transactional costs, such as sales charges (loads), redemption fees or exchange fees. Therefore, the section in the table under the heading “Hypothetical (5% return before expenses)” is useful in comparing ongoing costs only, and will not help you determine the relative total costs of owning different funds. In addition, if these transactional costs were included, your costs would have been higher.
| Beginning
Account
Value
12/1/2008 | Ending
Account
Value
05/31/2009 | Expenses
Paid During
Period* |
|
|
|
|
Actual | | | |
Class I | $1,000.00 | $1,122.74 | $0.11 |
Hypothetical | | | |
(5% return before expenses) | | | |
Class I | $1,000.00 | $1,024.83 | $0.10 |
|
|
|
|
* | Expenses are equal to the Fund’s annualized expense ratio (0.02% for Class I), multiplied by the average account value over the period, multiplied by 182 / 365 days. |
Market Index Growth Fund
FINANCIAL HIGHLIGHTS – CLASS I
(For a share outstanding throughout each period)
| | Year Ended May 31, | |
| |
| |
| | 2009 | | 2008 | | 2007 | | 2006 | | 2005 | |
|
|
|
|
|
|
|
|
|
|
| |
Net asset value, beginning of period | | $ | 15.01 | | $ | 15.36 | | $ | 13.44 | | $ | 12.99 | | $ | 12.77 | |
|
|
|
|
|
|
|
|
|
|
|
|
|
|
|
| |
Income from investment operations | | | | | | | | | | | | | | | | |
Net investment income (loss) | | | 0.18 | 1 | | 0.22 | | | 0.14 | | | 0.18 | | | 0.15 | |
Net realized and unrealized gains or losses on investments | | | (4.96 | ) | | (0.23 | ) | | 2.53 | | | 0.62 | | | 0.27 | |
| |
|
|
|
|
|
|
|
|
|
|
|
|
|
| |
Total from investment operations | | | (4.78 | ) | | (0.01 | ) | | 2.67 | | | 0.80 | | | 0.42 | |
|
|
|
|
|
|
|
|
|
|
|
|
|
|
|
| |
Distributions to shareholders from | | | | | | | | | | | | | | | | |
Net investment income | | | (0.19 | ) | | (0.17 | ) | | (0.16 | ) | | (0.15 | ) | | (0.12 | ) |
Net realized gains | | | (0.97 | ) | | (0.17 | ) | | (0.59 | ) | | (0.20 | ) | | (0.08 | ) |
| |
|
|
|
|
|
|
|
|
|
|
|
|
|
| |
Total distributions to shareholders | | | (1.16 | ) | | (0.34 | ) | | (0.75 | ) | | (0.35 | ) | | (0.20 | ) |
|
|
|
|
|
|
|
|
|
|
|
|
|
|
|
| |
Net asset value, end of period | | $ | 9.07 | | $ | 15.01 | | $ | 15.36 | | $ | 13.44 | | $ | 12.99 | |
|
|
|
|
|
|
|
|
|
|
|
|
|
|
|
| |
Total return | | | (30.66 | )% | | (0.14 | )% | | 20.34 | % | | 6.11 | % | | 3.28 | % |
|
|
|
|
|
|
|
|
|
|
|
|
|
|
|
| |
Ratios and supplemental data | | | | | | | | | | | | | | | | |
Net assets, end of period (thousands) | | $ | 485,834 | | $ | 729,526 | | $ | 945,116 | | $ | 721,771 | | $ | 854,566 | |
Ratios to average net assets | | | | | | | | | | | | | | | | |
Expenses including waivers/reimbursements but excluding expense reductions | | | 0.02 | % | | 0.03 | % | | 0.03 | % | | 0.03 | % | | 0.03 | % |
Expenses excluding waivers/reimbursements and expense reductions | | | 0.45 | % | | 0.46 | % | | 0.46 | % | | 0.46 | % | | 0.46 | % |
Net investment income (loss) | | | 1.80 | % | | 1.21 | % | | 1.23 | % | | 1.12 | % | | 1.45 | % |
Portfolio turnover rate | | | 28 | % | | 24 | % | | 18 | % | | 25 | % | | 15 | % |
|
|
|
|
|
|
|
|
|
|
|
|
|
|
|
| |
1 | Net investment income (loss) per share is based on average shares outstanding during the period. |
See Combined Notes to Financial Statements
SCHEDULE OF INVESTMENTS
Market Index Growth Fund
May 31, 2009
| |
Shares
| |
Value
| |
|
|
|
|
| |
COMMON STOCKS 99.4% | | | | | | | |
CONSUMER DISCRETIONARY 10.1% | | | | | | | |
Auto Components 0.2% | | | | | | | |
BorgWarner, Inc. | | | 10,288 | | $ | 331,788 | |
Gentex Corp. | | | 14,495 | | | 170,896 | |
Goodyear Tire & Rubber Co. * | | | 15,701 | | | 179,776 | |
Johnson Controls, Inc. | | | 9,155 | | | 182,459 | |
Wabco Holdings, Inc. | | | 6,658 | | | 113,053 | |
| | | | |
|
| |
| | | | | | 977,972 | |
| | | | |
|
| |
Automobiles 0.1% | | | | | | | |
Harley-Davidson, Inc. | | | 21,322 | | | 361,834 | |
Thor Industries, Inc. | | | 1,067 | | | 21,458 | |
| | | | |
|
| |
| | | | | | 383,292 | |
| | | | |
|
| |
Distributors 0.0% | | | | | | | |
LKQ Corp. * | | | 13,750 | | | 210,238 | |
| | | | |
|
| |
Diversified Consumer Services 0.5% | | | | | | | |
Apollo Group, Inc., Class A * | | | 12,936 | | | 764,517 | |
Brink’s Home Security Holdings, Inc. * | | | 4,118 | | | 118,598 | |
DeVry, Inc. | | | 6,219 | | | 270,962 | |
H&R Block, Inc. | | | 33,026 | | | 482,180 | |
Hillenbrand, Inc. | | | 6,337 | | | 108,743 | |
ITT Educational Services, Inc. * | | | 3,941 | | | 361,744 | |
Strayer Education, Inc. | | | 1,443 | | | 265,902 | |
Weight Watchers International, Inc. | | | 3,109 | | | 72,844 | |
| | | | |
|
| |
| | | | | | 2,445,490 | |
| | | | |
|
| |
Hotels, Restaurants & Leisure 2.8% | | | | | | | |
Boyd Gaming Corp. | | | 704 | | | 7,068 | |
Brinker International, Inc. | | | 10,277 | | | 183,958 | |
Burger King Holdings, Inc. | | | 8,141 | | | 134,815 | |
Carnival Corp. | | | 9,031 | | | 229,749 | |
Chipotle Mexican Grill, Inc., Class A * | | | 3,347 | | | 265,049 | |
Choice Hotels International, Inc. | | | 1,066 | | | 29,091 | |
Darden Restaurants, Inc. | | | 14,215 | | | 514,157 | |
International Game Technology | | | 31,425 | | | 545,538 | |
Interval Leisure Group, Inc. * | | | 483 | | | 4,622 | |
Las Vegas Sands Corp. * | | | 16,746 | | | 165,953 | |
Marriott International, Inc., Class A | | | 30,000 | | | 700,800 | |
McDonald’s Corp. | | | 104,356 | | | 6,155,960 | |
MGM MIRAGE * | | | 18,744 | | | 139,830 | |
Orient Express Hotels, Ltd. | | | 5,740 | | | 40,869 | |
Panera Bread Co., Class A * | | | 2,692 | | | 143,322 | |
Penn National Gaming, Inc. * | | | 6,764 | | | 223,685 | |
Scientific Games Corp., Class A * | | | 6,552 | | | 116,822 | |
Starbucks Corp. * | | | 73,894 | | | 1,063,335 | |
Starwood Hotels & Resorts Worldwide, Inc. | | | 18,950 | | | 463,707 | |
Tim Hortons, Inc. | | | 18,748 | | | 496,447 | |
Wynn Resorts, Ltd. * | | | 6,883 | | | 255,084 | |
Yum! Brands, Inc. | | | 48,085 | | | 1,665,184 | |
| | | | |
|
| |
| | | | | | 13,545,045 | |
| | | | |
|
| |
See Combined Notes to Financial Statements
SCHEDULE OF INVESTMENTS continued
Market Index Growth Fund
May 31, 2009
Household Durables 0.1% | | | | | | | |
Garmin, Ltd. | | | 12,212 | | | 254,987 | |
Harman International Industries, Inc. | | | 4,406 | | | 82,128 | |
NVR, Inc. * | | | 35 | | | 17,321 | |
Pulte Homes, Inc. | | | 5,022 | | | 44,194 | |
| | | | |
|
| |
| | | | | | 398,630 | |
| | | | |
|
| |
Internet & Catalog Retail 0.6% | | | | | | | |
Amazon.com, Inc. * | | | 31,966 | | | 2,493,028 | |
HSN, Inc. * | | | 483 | | | 5,458 | |
priceline.com, Inc. * | | | 4,120 | | | 453,653 | |
Ticketmaster Entertainment, Inc. * | | | 483 | | | 3,758 | |
| | | | |
|
| |
| | | | | | 2,955,897 | |
| | | | |
|
| |
Leisure Equipment & Products 0.0% | | | | | | | |
Hasbro, Inc. | | | 5,242 | | | 133,199 | |
| | | | |
|
| |
Media 2.1% | | | | | | | |
Central European Media Enterprises, Ltd., Class A * | | | 3,655 | | | 68,422 | |
Clear Channel Outdoor Holdings, Inc. * | | | 3,210 | | | 11,299 | |
Comcast Corp., Class A | | | 83,107 | | | 1,144,383 | |
CTC Media, Inc. * | | | 5,343 | | | 52,949 | |
DIRECTV Group, Inc. * | | | 55,435 | | | 1,247,287 | |
DISH Network Corp., Class A * | | | 20,703 | | | 339,529 | |
DreamWorks Animation SKG, Inc., Class A * | | | 7,594 | | | 211,569 | |
Interpublic Group of Cos. * | | | 41,006 | | | 214,871 | |
John Wiley & Sons, Inc., Class A | | | 4,088 | | | 129,222 | |
Lamar Advertising Co., Class A * | | | 7,810 | | | 145,032 | |
Liberty Global, Inc., Class A * | | | 13,341 | | | 184,373 | |
Liberty Media Corp. - Liberty Entertainment, Ser. A * | | | 52,444 | | | 1,267,047 | |
McGraw-Hill Cos. | | | 16,241 | | | 488,692 | |
Morningstar, Inc. * | | | 1,638 | | | 67,846 | |
News Corp., Class A | | | 94,034 | | | 919,653 | |
Omnicom Group, Inc. | | | 30,073 | | | 917,227 | |
Sirius XM Radio, Inc. * | | | 385,019 | | | 134,564 | |
Time Warner Cable, Inc. | | | 17,809 | | | 548,339 | |
Time Warner, Inc. | | | 13,439 | | | 314,741 | |
Viacom, Inc., Class B * | | | 53,314 | | | 1,181,971 | |
Walt Disney Co. | | | 22,432 | | | 543,303 | |
Warner Music Group Corp. * | | | 1,430 | | | 9,724 | |
| | | | |
|
| |
| | | | | | 10,142,043 | |
| | | | |
|
| |
Multiline Retail 1.0% | | | | | | | |
Big Lots, Inc. * | | | 8,260 | | | 190,063 | |
Dollar Tree Stores, Inc. * | | | 9,134 | | | 408,929 | |
Family Dollar Stores, Inc. | | | 1,106 | | | 33,479 | |
Kohl’s Corp. * | | | 23,894 | | | 1,014,778 | |
Nordstrom, Inc. | | | 18,471 | | | 363,694 | |
Target Corp. | | | 74,122 | | | 2,912,994 | |
| | | | |
|
| |
| | | | | | 4,923,937 | |
| | | | |
|
| |
Specialty Retail 2.0% | | | | | | | |
Abercrombie & Fitch Co., Class A | | | 8,774 | | | 264,185 | |
Advance Auto Parts, Inc. | | | 9,672 | | | 411,931 | |
American Eagle Outfitters, Inc. | | | 12,280 | | | 181,867 | |
AnnTaylor Stores Corp. * | | | 2,211 | | | 16,185 | |
See Combined Notes to Financial Statements
SCHEDULE OF INVESTMENTS continued
Market Index Growth Fund
May 31, 2009
AutoZone, Inc. * | | | 3,608 | | | 548,957 | |
Bed Bath & Beyond, Inc. * | | | 21,630 | | | 608,019 | |
Best Buy Co., Inc. | | | 33,899 | | | 1,189,855 | |
CarMax, Inc. * | | | 22,197 | | | 248,828 | |
Dick’s Sporting Goods, Inc. * | | | 8,572 | | | 152,582 | |
GameStop Corp., Class A * | | | 16,572 | | | 413,471 | |
Gap, Inc. | | | 23,129 | | | 412,853 | |
Guess?, Inc. | | | 6,122 | | | 158,070 | |
Limited Brands, Inc. | | | 17,877 | | | 223,641 | |
Lowe’s Cos. | | | 7,420 | | | 141,054 | |
O’Reilly Automotive, Inc. * | | | 4,964 | | | 178,952 | |
PetSmart, Inc. | | | 12,923 | | | 263,112 | |
Ross Stores, Inc. | | | 13,529 | | | 529,796 | |
Sherwin-Williams Co. | | | 10,215 | | | 539,352 | |
Staples, Inc. | | | 60,577 | | | 1,238,800 | |
Tiffany & Co. | | | 12,798 | | | 363,079 | |
TJX Cos. | | | 43,108 | | | 1,272,117 | |
Urban Outfitters, Inc. * | | | 11,524 | | | 235,320 | |
Williams-Sonoma, Inc. | | | 1,451 | | | 18,776 | |
| | | | |
|
| |
| | | | | | 9,610,802 | |
| | | | |
|
| |
Textiles, Apparel & Luxury Goods 0.7% | | | | | | | |
Coach, Inc. * | | | 32,586 | | | 856,034 | |
Hanesbrands, Inc. * | | | 9,548 | | | 161,361 | |
Nike, Inc., Class B | | | 35,908 | | | 2,048,551 | |
Phillips-Van Heusen Corp. | | | 4,568 | | | 134,619 | |
Polo Ralph Lauren Corp. | | | 5,691 | | | 306,290 | |
| | | | |
|
| |
| | | | | | 3,506,855 | |
| | | | |
|
| |
CONSUMER STAPLES 13.0% | | | | | | | |
Beverages 3.4% | | | | | | | |
Brown-Forman Corp., Class B | | | 7,805 | | | 342,249 | |
Central European Distribution Corp. * | | | 4,427 | | | 111,428 | |
Coca-Cola Co. | | | 166,219 | | | 8,171,326 | |
Hansen Natural Corp. * | | | 7,347 | | | 269,488 | |
PepsiCo, Inc. | | | 151,333 | | | 7,876,883 | |
| | | | |
|
| |
| | | | | | 16,771,374 | |
| | | | |
|
| |
Food & Staples Retailing 3.9% | | | | | | | |
Costco Wholesale Corp. | | | 43,977 | | | 2,133,764 | |
CVS Caremark Corp. | | | 78,346 | | | 2,334,711 | |
Kroger Co. | | | 29,633 | | | 675,632 | |
Sysco Corp. | | | 60,966 | | | 1,460,745 | |
Wal-Mart Stores, Inc. | | | 183,783 | | | 9,141,367 | |
Walgreen Co. | | | 92,894 | | | 2,767,312 | |
Whole Foods Market, Inc. | | | 14,231 | | | 268,539 | |
| | | | |
|
| |
| | | | | | 18,782,070 | |
| | | | |
|
| |
Food Products 0.5% | | | | | | | |
Campbell Soup Co. | | | 10,465 | | | 290,090 | |
Dean Foods Co. * | | | 12,497 | | | 234,944 | |
General Mills, Inc. | | | 2,891 | | | 147,961 | |
H.J. Heinz Co. | | | 17,754 | | | 649,441 | |
Hershey Co. | | | 7,863 | | | 276,935 | |
J.M. Smucker Co. | | | 2,375 | | | 95,617 | |
Kellogg Co. | | | 14,491 | | | 626,736 | |
See Combined Notes to Financial Statements
SCHEDULE OF INVESTMENTS continued
Market Index Growth Fund
May 31, 2009
McCormick & Co., Inc. | | | 4,273 | | | 130,412 | |
Tyson Foods, Inc., Class A | | | 3,316 | | | 44,169 | |
| | | | |
|
| |
| | | | | | 2,496,305 | |
| | | | |
|
| |
Household Products 2.3% | | | | | | | |
Church & Dwight Co. | | | 7,108 | | | 357,319 | |
Clorox Co. | | | 4,323 | | | 226,698 | |
Colgate-Palmolive Co. | | | 51,544 | | | 3,399,327 | |
Energizer Holdings, Inc. * | | | 7,033 | | | 367,545 | |
Kimberly-Clark Corp. | | | 17,456 | | | 905,792 | |
Procter & Gamble Co. | | | 113,512 | | | 5,895,813 | |
| | | | |
|
| |
| | | | | | 11,152,494 | |
| | | | |
|
| |
Personal Products 0.4% | | | | | | | |
Alberto-Culver Co. | | | 1,147 | | | 26,656 | |
Avon Products, Inc. | | | 43,317 | | | 1,150,499 | |
Bare Escentuals, Inc. * | | | 6,156 | | | 53,865 | |
Estee Lauder Cos., Class A | | | 9,937 | | | 328,716 | |
Herbalife, Ltd. | | | 6,242 | | | 182,329 | |
Mead Johnson Nutrition Co., Class A * | | | 2,080 | | | 64,813 | |
NBTY, Inc. * | | | 2,656 | | | 65,577 | |
| | | | |
|
| |
| | | | | | 1,872,455 | |
| | | | |
|
| |
Tobacco 2.5% | | | | | | | |
Altria Group, Inc. | | | 159,010 | | | 2,717,481 | |
Lorillard, Inc. | | | 9,251 | | | 632,121 | |
Philip Morris International, Inc. | | | 201,290 | | | 8,583,005 | |
| | | | |
|
| |
| | | | | | 11,932,607 | |
| | | | |
|
| |
ENERGY 8.9% | | | | | | | |
Energy Equipment & Services 3.4% | | | | | | | |
Atwood Oceanics, Inc. * | | | 5,673 | | | 150,108 | |
Baker Hughes, Inc. | | | 31,265 | | | 1,221,211 | |
Cameron International Corp. * | | | 21,992 | | | 686,810 | |
Diamond Offshore Drilling, Inc. | | | 6,981 | | | 588,359 | |
Dresser-Rand Group, Inc. * | | | 8,730 | | | 244,440 | |
ENSCO International, Inc. | | | 13,670 | | | 531,626 | |
FMC Technologies, Inc. | | | 12,998 | | | 540,977 | |
Global Industries, Ltd. * | | | 7,466 | | | 52,262 | |
Halliburton Co. | | | 88,548 | | | 2,030,406 | |
Key Energy Services, Inc. * | | | 2,124 | | | 13,700 | |
Nabors Industries, Ltd. * | | | 4,029 | | | 72,039 | |
National Oilwell Varco, Inc. * | | | 42,141 | | | 1,627,485 | |
Oceaneering International, Inc. * | | | 5,595 | | | 287,695 | |
Oil States International, Inc. * | | | 3,334 | | | 87,117 | |
Patterson-UTI Energy, Inc. | | | 9,687 | | | 138,912 | |
Pride International, Inc. * | | | 12,210 | | | 295,726 | |
Rowan Companies, Inc. | | | 4,001 | | | 81,860 | |
Schlumberger, Ltd. | | | 121,102 | | | 6,930,667 | |
SEACOR Holdings, Inc. * | | | 245 | | | 18,720 | |
Smith International, Inc. | | | 21,899 | | | 639,232 | |
Superior Energy Services, Inc. * | | | 8,195 | | | 188,977 | |
Tetra Technologies, Inc. * | | | 7,571 | | | 65,868 | |
Tidewater, Inc. | | | 276 | | | 13,157 | |
See Combined Notes to Financial Statements
SCHEDULE OF INVESTMENTS continued
Market Index Growth Fund
May 31, 2009
Unit Corp. * | | | 3,652 | | | 122,378 | |
| | | | |
|
| |
| | | | | | 16,629,732 | |
| | | | |
|
| |
Oil, Gas & Consumable Fuels 5.5% | | | | | | | |
Alpha Natural Resources, Inc. * | | | 7,136 | | | 196,597 | |
Arch Coal, Inc. | | | 14,630 | | | 271,094 | |
Cabot Oil & Gas Corp. | | | 4,763 | | | 167,324 | |
Chesapeake Energy Corp. | | | 24,645 | | | 558,456 | |
CNX Gas Corp. * | | | 2,804 | | | 86,195 | |
Consol Energy, Inc. | | | 18,552 | | | 763,600 | |
Continental Resources, Inc. * | | | 3,021 | | | 89,452 | |
Denbury Resources, Inc. * | | | 24,969 | | | 429,217 | |
El Paso Corp. | | | 15,256 | | | 148,746 | |
Encore Aquisition Co. * | | | 1,363 | | | 48,373 | |
EOG Resources, Inc. | | | 18,953 | | | 1,387,170 | |
Exxon Mobil Corp. | | | 93,439 | | | 6,479,995 | |
Foundation Coal Holdings, Inc. | | | 4,605 | | | 135,157 | |
Frontier Oil Corp. | | | 10,551 | | | 184,326 | |
Frontline, Ltd. | | | 4,944 | | | 115,591 | |
Helix Energy Solutions, Inc. * | | | 859 | | | 9,664 | |
Hess Corp. | | | 28,553 | | | 1,901,344 | |
Holly Corp. | | | 4,333 | | | 104,815 | |
Mariner Energy, Inc. * | | | 6,505 | | | 94,062 | |
Massey Energy Co. | | | 8,641 | | | 197,792 | |
Murphy Oil Corp. | | | 19,283 | | | 1,137,890 | |
Noble Energy, Inc. | | | 1,119 | | | 66,558 | |
Occidental Petroleum Corp. | | | 83,306 | | | 5,590,666 | |
Patriot Coal Corp. * | | | 7,855 | | | 71,166 | |
Peabody Energy Corp. | | | 27,559 | | | 936,455 | |
Petrohawk Energy Corp. * | | | 26,355 | | | 664,146 | |
Plains Exploration & Production Co. * | | | 11,121 | | | 314,502 | |
Quicksilver Resources, Inc. * | | | 11,060 | | | 124,425 | |
Range Resources Corp. | | | 15,664 | | | 717,568 | |
SandRidge Energy, Inc. * | | | 11,650 | | | 126,868 | |
Southwestern Energy Co. * | | | 34,710 | | | 1,508,844 | |
St. Mary Land & Exploration Co. | | | 2,579 | | | 55,861 | |
Sunoco, Inc. | | | 7,046 | | | 214,410 | |
Tesoro Corp. | | | 4,068 | | | 68,912 | |
W&T Offshore, Inc. | | | 3,062 | | | 31,232 | |
Walter Industries, Inc. | | | 5,367 | | | 175,179 | |
Whiting Petroleum Corp. * | | | 5,134 | | | 240,579 | |
Williams Cos. | | | 59,319 | | | 995,373 | |
XTO Energy, Inc. | | | 6,121 | | | 261,795 | |
| | | | |
|
| |
| | | | | | 26,671,399 | |
| | | | |
|
| |
FINANCIALS 4.9% | | | | | | | |
Capital Markets 1.7% | | | | | | | |
Affiliated Managers Group, Inc. * | | | 4,155 | | | 233,137 | |
BlackRock, Inc. | | | 1,290 | | | 205,755 | |
Charles Schwab Corp. | | | 94,840 | | | 1,669,184 | |
E*TRADE Financial Corp. * | | | 8,190 | | | 11,794 | |
Eaton Vance Corp. | | | 10,400 | | | 281,840 | |
Federated Investors, Inc., Class B | | | 8,858 | | | 221,716 | |
Franklin Resources, Inc. | | | 8,322 | | | 556,326 | |
GLG Partners, Inc. | | | 4,981 | | | 18,181 | |
See Combined Notes to Financial Statements
SCHEDULE OF INVESTMENTS continued
Market Index Growth Fund
May 31, 2009
Goldman Sachs Group, Inc. | | | 5,411 | | | 782,268 | |
INVESCO, Ltd. | | | 5,315 | | | 83,180 | |
Investment Technology Group, Inc. * | | | 4,061 | | | 84,469 | |
Janus Capital Group, Inc. | | | 15,367 | | | 155,821 | |
Lazard, Ltd. | | | 7,674 | | | 217,021 | |
MF Global, Ltd. * | | | 4,557 | | | 27,707 | |
Morgan Stanley | | | 6,272 | | | 190,167 | |
Northern Trust Corp. | | | 22,085 | | | 1,273,200 | |
SEI Investments Co. | | | 13,668 | | | 210,897 | |
State Street Corp. | | | 13,232 | | | 614,626 | |
T. Rowe Price Group, Inc. | | | 26,360 | | | 1,069,425 | |
TD Ameritrade Holding Corp. * | | | 23,181 | | | 395,004 | |
Waddell & Reed Financial, Inc., Class A | | | 8,798 | | | 214,671 | |
| | | | |
|
| |
| | | | | | 8,516,389 | |
| | | | |
|
| |
Consumer Finance 1.4% | | | | | | | |
American Express Co. | | | 85,728 | | | 2,130,341 | |
MasterCard, Inc., Class A | | | 7,377 | | | 1,300,786 | |
SLM Corp. * | | | 41,984 | | | 277,514 | |
Visa, Inc., Class A | | | 45,439 | | | 3,076,675 | |
| | | | |
|
| |
| | | | | | 6,785,316 | |
| | | | |
|
| |
Diversified Financial Services 0.6% | | | | | | | |
CME Group, Inc., Class A | | | 4,798 | | | 1,543,229 | |
IntercontinentalExchange, Inc. * | | | 7,163 | | | 772,100 | |
MSCI, Inc., Class A * | | | 4,467 | | | 95,013 | |
NASDAQ OMX Group, Inc. * | | | 7,478 | | | 157,860 | |
NYSE Euronext | | | 16,193 | | | 485,790 | |
| | | | |
|
| |
| | | | | | 3,053,992 | |
| | | | |
|
| |
Insurance 0.4% | | | | | | | |
AFLAC, Inc. | | | 48,248 | | | 1,712,804 | |
Axis Capital Holdings, Ltd. | | | 3,221 | | | 76,918 | |
Brown & Brown, Inc. | | | 2,794 | | | 53,868 | |
Erie Indemnity Co., Class A | | | 260 | | | 8,996 | |
Prudential Financial, Inc. | | | 7,574 | | | 302,278 | |
TransAtlantic Holdings, Inc. | | | 657 | | | 25,433 | |
W.R. Berkley Corp. | | | 705 | | | 15,291 | |
| | | | |
|
| |
| | | | | | 2,195,588 | |
| | | | |
|
| |
Real Estate Investment Trusts (REITs) 0.6% | | | | | | | |
Apartment Investment & Management Co., Class A | | | 3,691 | | | 34,880 | |
Camden Property Trust | | | 4,284 | | | 128,606 | |
Digital Realty Trust, Inc. | | | 5,232 | | | 187,149 | |
Essex Property Trust, Inc. | | | 591 | | | 40,241 | |
Federal Realty Investment Trust | | | 1,754 | | | 92,348 | |
HCP, Inc. | | | 3,264 | | | 75,823 | |
Health Care REIT, Inc. | | | 1,247 | | | 42,710 | |
Kilroy Realty Corp. | | | 296 | | | 6,302 | |
Macerich Co. | | | 7,587 | | | 128,069 | |
Nationwide Health Properties, Inc. | | | 955 | | | 25,374 | |
Plum Creek Timber Co., Inc. | | | 5,662 | | | 196,188 | |
Rayonier, Inc. | | | 979 | | | 39,160 | |
Simon Property Group, Inc. | | | 28,241 | | | 1,510,046 | |
Taubman Centers, Inc. | | | 5,361 | | | 132,631 | |
Ventas, Inc. | | | 2,612 | | | 79,300 | |
See Combined Notes to Financial Statements
SCHEDULE OF INVESTMENTS continued
Market Index Growth Fund
May 31, 2009
Walter Investment Management Corp. * | | | 1,981 | | | 26,743 | |
| | | | |
|
| |
| | | | | | 2,745,570 | |
| | | | |
|
| |
Real Estate Management & Development 0.1% | | | | | | | |
CB Richard Ellis Group, Inc., Class A * | | | 7,643 | | | 55,794 | |
Forest City Enterprises, Inc., Class A | | | 10,866 | | | 77,040 | |
St. Joe Co. * | | | 7,884 | | | 201,357 | |
| | | | |
|
| |
| | | | | | 334,191 | |
| | | | |
|
| |
Thrifts & Mortgage Finance 0.1% | | | | | | | |
Capitol Federal Financial | | | 799 | | | 33,630 | |
Freddie Mac | | | 60,196 | | | 48,157 | |
Hudson City Bancorp, Inc. | | | 18,284 | | | 234,584 | |
Tree.com, Inc. * | | | 86 | | | 884 | |
| | | | |
|
| |
| | | | | | 317,255 | |
| | | | |
|
| |
HEALTH CARE 13.4% | | | | | | | |
Biotechnology 2.2% | | | | | | | |
Abraxis BioScience, Inc. * | | | 699 | | | 35,873 | |
Amylin Pharmaceuticals, Inc. * | | | 13,913 | | | 157,495 | |
Biogen Idec, Inc. * | | | 29,466 | | | 1,526,044 | |
BioMarin Pharmaceutical, Inc. * | | | 10,003 | | | 139,842 | |
Celgene Corp. * | | | 46,507 | | | 1,964,456 | |
Cephalon, Inc. * | | | 7,494 | | | 436,975 | |
Gen-Probe, Inc. * | | | 5,481 | | | 233,655 | |
Genzyme Corp. * | | | 27,133 | | | 1,604,645 | |
Gilead Sciences, Inc. * | | | 93,633 | | | 4,035,582 | |
Vertex Pharmaceuticals, Inc. * | | | 17,559 | | | 523,434 | |
| | | | |
|
| |
| | | | | | 10,658,001 | |
| | | | |
|
| |
Health Care Equipment & Supplies 3.3% | | | | | | | |
Baxter International, Inc. | | | 63,681 | | | 3,259,830 | |
Beckman Coulter, Inc. | | | 5,573 | | | 302,057 | |
Becton, Dickinson & Co. | | | 24,773 | | | 1,676,637 | |
Boston Scientific Corp. * | | | 9,872 | | | 92,797 | |
C.R. Bard, Inc. | | | 10,077 | | | 720,405 | |
Dentsply International, Inc. | | | 15,107 | | | 442,031 | |
Edwards Lifesciences Corp. * | | | 5,568 | | | 355,461 | |
Hill-Rom Holdings, Inc. | | | 861 | | | 13,914 | |
Hologic, Inc. * | | | 12,985 | | | 164,520 | |
Hospira, Inc. * | | | 2,325 | | | 80,212 | |
IDEXX Laboratories, Inc. * | | | 6,121 | | | 256,164 | |
Intuitive Surgical, Inc. * | | | 3,929 | | | 588,093 | |
Inverness Medical Innovations, Inc. * | | | 3,985 | | | 129,632 | |
Kinetic Concepts, Inc. * | | | 5,737 | | | 148,760 | |
Medtronic, Inc. | | | 113,990 | | | 3,915,556 | |
ResMed, Inc. * | | | 7,843 | | | 290,740 | |
St. Jude Medical, Inc. * | | | 34,472 | | | 1,345,097 | |
Stryker Corp. | | | 31,223 | | | 1,200,212 | |
Varian Medical Systems, Inc. * | | | 12,751 | | | 455,976 | |
Zimmer Holdings, Inc. * | | | 14,672 | | | 653,638 | |
| | | | |
|
| |
| | | | | | 16,091,732 | |
| | | | |
|
| |
Health Care Providers & Services 2.4% | | | | | | | |
Aetna, Inc. | | | 29,598 | | | 792,634 | |
AmerisourceBergen Corp. | | | 1,886 | | | 69,971 | |
See Combined Notes to Financial Statements
SCHEDULE OF INVESTMENTS continued
Market Index Growth Fund
May 31, 2009
Cardinal Health, Inc. | | | 27,095 | | | 968,646 | |
CIGNA Corp. | | | 3,962 | | | 87,838 | |
Community Health Systems, Inc. * | | | 2,198 | | | 58,005 | |
Coventry Health Care, Inc. * | | | 3,140 | | | 56,677 | |
DaVita, Inc. * | | | 8,842 | | | 398,863 | |
Express Scripts, Inc. * | | | 21,362 | | | 1,368,236 | |
Health Management Associates, Inc., Class A * | | | 16,346 | | | 94,970 | |
Health Net, Inc. * | | | 588 | | | 8,808 | |
Henry Schein, Inc. * | | | 8,502 | | | 387,181 | |
Humana, Inc. * | | | 9,756 | | | 305,656 | |
Laboratory Corp. of America Holdings * | | | 11,297 | | | 688,665 | |
Lincare Holdings, Inc. * | | | 6,361 | | | 138,543 | |
McKesson Corp. | | | 20,208 | | | 831,559 | |
Medco Health Solutions, Inc. * | | | 51,427 | | | 2,359,985 | |
Mednax, Inc. * | | | 4,094 | | | 165,807 | |
Omnicare, Inc. | | | 789 | | | 21,327 | |
Patterson Companies, Inc. * | | | 12,316 | | | 253,586 | |
Quest Diagnostics, Inc. | | | 13,183 | | | 688,416 | |
Tenet Healthcare Corp. * | | | 27,526 | | | 99,919 | |
UnitedHealth Group, Inc. | | | 46,020 | | | 1,224,132 | |
VCA Antech, Inc. * | | | 8,562 | | | 207,800 | |
Wellcare Group, Inc. * | | | 4,233 | | | 80,427 | |
WellPoint, Inc. * | | | 4,907 | | | 228,519 | |
| | | | |
|
| |
| | | | | | 11,586,170 | |
| | | | |
|
| |
Health Care Technology 0.1% | | | | | | | |
Cerner Corp. * | | | 6,861 | | | 399,928 | |
HLTH Corp. * | | | 2,951 | | | 34,792 | |
IMS Health, Inc. | | | 4,013 | | | 48,317 | |
WebMD Health Corp., Class A * | | | 789 | | | 21,429 | |
| | | | |
|
| |
| | | | | | 504,466 | |
| | | | |
|
| |
Life Sciences Tools & Services 0.6% | | | | | | | |
Charles River Laboratories International, Inc. * | | | 3,139 | | | 98,659 | |
Covance, Inc. * | | | 6,381 | | | 268,130 | |
Illumina, Inc. * | | | 12,449 | | | 457,003 | |
Life Technologies Corp. * | | | 11,170 | | | 433,173 | |
Millipore Corp. * | | | 5,592 | | | 351,681 | |
PerkinElmer, Inc. | | | 5,372 | | | 87,402 | |
Pharmaceutical Product Development, Inc. | | | 10,845 | | | 217,225 | |
Techne Corp. | | | 3,922 | | | 236,379 | |
Thermo Fisher Scientific, Inc. * | | | 14,433 | | | 561,588 | |
Waters Corp. * | | | 10,161 | | | 440,174 | |
| | | | |
|
| |
| | | | | | 3,151,414 | |
| | | | |
|
| |
Pharmaceuticals 4.8% | | | | | | | |
Abbott Laboratories | | | 156,649 | | | 7,058,604 | |
Allergan, Inc. | | | 30,958 | | | 1,366,177 | |
Bristol-Myers Squibb Co. | | | 183,453 | | | 3,654,384 | |
Eli Lilly & Co. | | | 9,637 | | | 333,151 | |
Endo Pharmaceuticals Holdings, Inc. * | | | 11,069 | | | 176,329 | |
Forest Laboratories, Inc. * | | | 2,691 | | | 63,750 | |
Fresenius Kabi Pharmaceuticals Holding, Inc. * | | | 2,511 | | | 753 | |
Johnson & Johnson | | | 75,232 | | | 4,149,797 | |
Merck & Co., Inc. | | | 62,313 | | | 1,718,593 | |
Mylan Laboratories, Inc. * | | | 5,686 | | | 75,112 | |
See Combined Notes to Financial Statements
SCHEDULE OF INVESTMENTS continued
Market Index Growth Fund
May 31, 2009
Perrigo Co. | | | 7,907 | | | 212,382 | |
Schering-Plough Corp. | | | 164,578 | | | 4,015,703 | |
Sepracor, Inc. * | | | 10,940 | | | 171,211 | |
Warner Chilcott, Ltd., Class A * | | | 9,317 | | | 122,612 | |
Watson Pharmaceuticals, Inc. * | | | 5,237 | | | 158,419 | |
| | | | |
|
| |
| | | | | | 23,276,977 | |
| | | | |
|
| |
INDUSTRIALS 12.4% | | | | | | | |
Aerospace & Defense 3.4% | | | | | | | |
Alliant Techsystems, Inc. * | | | 1,450 | | | 125,120 | |
BE Aerospace, Inc. * | | | 9,357 | | | 139,232 | |
Boeing Co. | | | 76,274 | | | 3,420,889 | |
Goodrich Corp. | | | 12,695 | | | 616,215 | |
Honeywell International, Inc. | | | 75,267 | | | 2,495,854 | |
ITT Corp. | | | 13,979 | | | 575,655 | |
L-3 Communications Holdings, Inc. | | | 9,649 | | | 709,298 | |
Lockheed Martin Corp. | | | 33,378 | | | 2,791,402 | |
Northrop Grumman Corp. | | | 8,372 | | | 398,675 | |
Precision Castparts Corp. | | | 14,139 | | | 1,167,457 | |
Raytheon Co. | | | 14,743 | | | 658,275 | |
Rockwell Collins Corp. | | | 16,316 | | | 692,125 | |
United Technologies Corp. | | | 56,306 | | | 2,962,259 | |
| | | | |
|
| |
| | | | | | 16,752,456 | |
| | | | |
|
| |
Air Freight & Logistics 1.1% | | | | | | | |
C.H. Robinson Worldwide, Inc. | | | 17,311 | | | 879,745 | |
Expeditors International of Washington, Inc. | | | 21,650 | | | 710,337 | |
United Parcel Service, Inc., Class B | | | 69,425 | | | 3,550,394 | |
UTi Worldwide, Inc. * | | | 9,132 | | | 119,721 | |
| | | | |
|
| |
| | | | | | 5,260,197 | |
| | | | |
|
| |
Airlines 0.1% | | | | | | | |
AMR Corp. * | | | 14,232 | | | 63,333 | |
Copa Holdings SA, Class A | | | 2,221 | | | 77,335 | |
Delta Air Lines, Inc. * | | | 19,346 | | | 112,400 | |
| | | | |
|
| |
| | | | | | 253,068 | |
| | | | |
|
| |
Building Products 0.0% | | | | | | | |
Lennox International, Inc. | | | 4,735 | | | 146,832 | |
USG Corp. * | | | 3,762 | | | 45,144 | |
| | | | |
|
| |
| | | | | | 191,976 | |
| | | | |
|
| |
Commercial Services & Supplies 0.6% | | | | | | | |
Brink’s Co. | | | 4,118 | | | 109,498 | |
Copart, Inc. * | | | 6,416 | | | 196,907 | |
Corrections Corporation of America * | | | 10,356 | | | 158,965 | |
Covanta Holding Corp. * | | | 12,243 | | | 184,992 | |
IHS, Inc., Class A * | | | 4,394 | | | 210,912 | |
Iron Mountain, Inc. * | | | 18,161 | | | 494,887 | |
Pitney Bowes, Inc. | | | 19,047 | | | 435,795 | |
Republic Services, Inc. | | | 14,562 | | | 331,868 | |
Stericycle, Inc. * | | | 8,751 | | | 437,375 | |
Waste Management, Inc. | | | 14,145 | | | 390,260 | |
| | | | |
|
| |
| | | | | | 2,951,459 | |
| | | | |
|
| |
See Combined Notes to Financial Statements
SCHEDULE OF INVESTMENTS continued
Market Index Growth Fund
May 31, 2009
Construction & Engineering 0.5% | | | | | | | |
AECOM Technology Corp. * | | | 9,893 | | | 315,686 | |
Fluor Corp. | | | 18,007 | | | 845,969 | |
Jacobs Engineering Group, Inc. * | | | 12,364 | | | 530,415 | |
KBR, Inc. | | | 13,242 | | | 243,918 | |
Quanta Services, Inc. * | | | 15,519 | | | 353,988 | |
Shaw Group, Inc. * | | | 8,414 | | | 228,861 | |
URS Corp. * | | | 1,542 | | | 74,139 | |
| | | | |
|
| |
| | | | | | 2,592,976 | |
| | | | |
|
| |
Electrical Equipment 1.2% | | | | | | | |
Ametek, Inc. | | | 10,830 | | | 340,603 | |
Cooper Industries, Inc. | | | 13,441 | | | 441,134 | |
Emerson Electric Co. | | | 79,250 | | | 2,543,132 | |
First Solar, Inc. * | | | 4,801 | | | 912,190 | |
General Cable Corp. * | | | 5,354 | | | 204,737 | |
Hubbell, Inc., Class B | | | 2,479 | | | 82,328 | |
Rockwell Automation, Inc. | | | 14,895 | | | 457,128 | |
Roper Industries, Inc. | | | 9,075 | | | 390,043 | |
SunPower Corp., Class A * | | | 8,358 | | | 243,552 | |
| | | | |
|
| |
| | | | | | 5,614,847 | |
| | | | |
|
| |
Industrial Conglomerates 1.0% | | | | | | | |
3M Co. | | | 71,487 | | | 4,081,908 | |
Carlisle Cos. | | | 675 | | | 15,437 | |
McDermott International, Inc. * | | | 22,987 | | | 505,024 | |
Textron, Inc. | | | 27,255 | | | 313,433 | |
| | | | |
|
| |
| | | | | | 4,915,802 | |
| | | | |
|
| |
Machinery 2.4% | | | | | | | |
AGCO Corp. * | | | 6,760 | | | 195,094 | |
Bucyrus International, Inc. | | | 7,600 | | | 217,968 | |
Caterpillar, Inc. | | | 62,438 | | | 2,214,052 | |
Cummins, Inc. | | | 20,617 | | | 668,609 | |
Danaher Corp. | | | 18,194 | | | 1,098,008 | |
Deere & Co. | | | 43,742 | | | 1,901,465 | |
Donaldson Co., Inc. | | | 7,907 | | | 266,387 | |
Dover Corp. | | | 16,819 | | | 528,789 | |
Eaton Corp. | | | 7,552 | | | 328,512 | |
Flowserve Corp. | | | 2,649 | | | 194,887 | |
Graco, Inc. | | | 6,148 | | | 137,039 | |
Harsco Corp. | | | 8,553 | | | 248,550 | |
IDEX Corp. | | | 7,429 | | | 173,467 | |
Illinois Tool Works, Inc. | | | 2,427 | | | 78,368 | |
Ingersoll-Rand Co., Ltd., Class A | | | 5,566 | | | 112,600 | |
John Bean Technologies Corp. | | | 2,807 | | | 42,217 | |
Joy Global, Inc. | | | 10,366 | | | 357,316 | |
Kennametal, Inc. | | | 1,645 | | | 31,058 | |
Lincoln Electric Holdings, Inc. | | | 2,957 | | | 120,646 | |
Manitowoc Co. | | | 13,197 | | | 86,044 | |
Oshkosh Corp. | | | 5,272 | | | 62,579 | |
Paccar, Inc. | | | 37,064 | | | 1,106,360 | |
Pall Corp. | | | 12,451 | | | 319,742 | |
Parker Hannifin Corp. | | | 17,025 | | | 719,477 | |
SPX Corp. | | | 4,995 | | | 229,320 | |
See Combined Notes to Financial Statements
SCHEDULE OF INVESTMENTS continued
Market Index Growth Fund
May 31, 2009
Timken Co. | | | 428 | | | 7,237 | |
Toro Co. | | | 3,605 | | | 111,034 | |
Valmont Industries, Inc. | | | 1,921 | | | 131,800 | |
| | | | |
|
| |
| | | | | | 11,688,625 | |
| | | | |
|
| |
Marine 0.0% | | | | | | | |
Kirby Corp. * | | | 5,475 | | | 184,069 | |
| | | | |
|
| |
Professional Services 0.3% | | | | | | | |
Corporate Executive Board Co. | | | 3,461 | | | 60,187 | |
Dun & Bradstreet Corp. | | | 4,011 | | | 328,060 | |
Equifax, Inc. | | | 7,007 | | | 190,731 | |
FTI Consulting, Inc. * | | | 5,090 | | | 255,620 | |
Manpower, Inc. | | | 612 | | | 26,016 | |
Monster Worldwide, Inc. * | | | 12,136 | | | 141,748 | |
Robert Half International, Inc. | | | 14,508 | | | 310,326 | |
| | | | |
|
| |
| | | | | | 1,312,688 | |
| | | | |
|
| |
Road & Rail 1.5% | | | | | | | |
Burlington Northern Santa Fe Corp. | | | 28,569 | | | 2,069,538 | |
Con-Way, Inc. | | | 759 | | | 24,364 | |
CSX Corp. | | | 41,078 | | | 1,304,637 | |
Hertz Global Holdings, Inc. * | | | 2,244 | | | 15,371 | |
J.B. Hunt Transport Services, Inc. | | | 8,279 | | | 254,414 | |
Kansas City Southern * | | | 7,557 | | | 124,615 | |
Landstar System, Inc. | | | 5,353 | | | 203,414 | |
Norfolk Southern Corp. | | | 11,022 | | | 410,018 | |
Ryder System, Inc. | | | 1,920 | | | 54,106 | |
Union Pacific Corp. | | | 52,451 | | | 2,584,261 | |
| | | | |
|
| |
| | | | | | 7,044,738 | |
| | | | |
|
| |
Trading Companies & Distributors 0.3% | | | | | | | |
Fastenal Co. | | | 13,108 | | | 435,448 | |
GATX Corp. | | | 559 | | | 14,075 | |
MSC Industrial Direct Co., Class A | | | 4,493 | | | 163,455 | |
W.W. Grainger, Inc. | | | 7,766 | | | 612,194 | |
Wesco International, Inc. * | | | 3,134 | | | 83,772 | |
| | | | |
|
| |
| | | | | | 1,308,944 | |
| | | | |
|
| |
INFORMATION TECHNOLOGY 30.1% | | | | | | | |
Communications Equipment 4.3% | | | | | | | |
Brocade Communications Systems, Inc. * | | | 5,382 | | | 39,504 | |
Ciena Corp. * | | | 8,837 | | | 97,207 | |
Cisco Systems, Inc. * | | | 599,590 | | | 11,092,415 | |
CommScope, Inc. * | | | 7,089 | | | 186,015 | |
EchoStar Corp. * | | | 306 | | | 4,905 | |
F5 Networks, Inc. * | | | 8,313 | | | 264,021 | |
Harris Corp. | | | 13,672 | | | 424,926 | |
JDS Uniphase Corp. * | | | 11,385 | | | 61,365 | |
Juniper Networks, Inc. * | | | 53,284 | | | 1,317,713 | |
QUALCOMM, Inc. | | | 164,301 | | | 7,161,881 | |
| | | | |
|
| |
| | | | | | 20,649,952 | |
| | | | |
|
| |
Computers & Peripherals 8.5% | | | | | | | |
Apple, Inc. * | | | 89,487 | | | 12,153,229 | |
Dell, Inc. * | | | 184,288 | | | 2,134,055 | |
See Combined Notes to Financial Statements
SCHEDULE OF INVESTMENTS continued
Market Index Growth Fund
May 31, 2009
Diebold, Inc. | | 5,583 | | 138,012 | |
EMC Corp. * | | 146,461 | | 1,720,917 | |
Hewlett-Packard Co. | | 250,234 | | 8,595,538 | |
International Business Machines Corp. | | 139,412 | | 14,816,707 | |
NCR Corp. * | | 14,431 | | 154,989 | |
NetApp, Inc. * | | 34,869 | | 679,945 | |
SanDisk Corp. * | | 4,494 | | 70,376 | |
Seagate Technology, Inc. | | 23,811 | | 207,394 | |
Teradata Corp. * | | 8,938 | | 193,061 | |
Western Digital Corp. * | | 22,472 | | 558,429 | |
| | | |
| |
| | | | 41,422,652 | |
| | | |
| |
Electronic Equipment, Instruments & Components 1.1% | | | | | |
Agilent Technologies, Inc. * | | 35,044 | | 638,852 | |
Amphenol Corp., Class A | | 17,800 | | 594,342 | |
Arrow Electronics, Inc. * | | 847 | | 20,489 | |
Avnet, Inc. * | | 6,686 | | 153,845 | |
AVX Corp. | | 416 | | 3,861 | |
Corning, Inc. | | 159,857 | | 2,349,898 | |
Dolby Laboratories, Inc., Class A * | | 5,120 | | 184,627 | |
Flir Systems, Inc. * | | 15,250 | | 342,515 | |
Itron, Inc. * | | 3,733 | | 217,783 | |
Jabil Circuit, Inc. | | 10,233 | | 80,124 | |
Mettler-Toledo International, Inc. * | | 3,526 | | 251,016 | |
Molex, Inc. | | 3,891 | | 59,455 | |
National Instruments Corp. | | 5,750 | | 121,958 | |
Tech Data Corp. * | | 721 | | 23,086 | |
Trimble Navigation, Ltd. * | | 12,318 | | 236,259 | |
| | | |
| |
| | | | 5,278,110 | |
| | | |
| |
Internet Software & Services 3.2% | | | | | |
Akamai Technologies, Inc. * | | 17,077 | | 380,134 | |
eBay, Inc. * | | 112,633 | | 1,984,593 | |
Equinix, Inc. * | | 3,319 | | 246,934 | |
Google, Inc., Class A * | | 24,038 | | 10,029,375 | |
IAC/InterActiveCorp. | | 1,307 | | 21,121 | |
Sohu.com, Inc. * | | 2,875 | | 181,528 | |
VeriSign, Inc. * | | 19,763 | | 462,652 | |
Yahoo!, Inc. * | | 139,879 | | 2,215,683 | |
| | | |
| |
| | | | 15,522,020 | |
| | | |
| |
IT Services 2.0% | | | | | |
Accenture, Ltd., Class A | | 60,620 | | 1,814,357 | |
Affiliated Computer Services, Inc., Class A * | | 2,523 | | 113,384 | |
Alliance Data Systems Corp. * | | 6,050 | | 245,025 | |
Amdocs, Ltd. * | | 8,436 | | 182,555 | |
Automatic Data Processing, Inc. | | 52,621 | | 2,000,124 | |
Broadridge Financial Solutions, Inc. | | 14,217 | | 235,433 | |
Cognizant Technology Solutions Corp., Class A * | | 29,322 | | 738,621 | |
DST Systems, Inc. * | | 3,353 | | 128,420 | |
Fidelity National Information Services, Inc. | | 4,496 | | 86,593 | |
Fiserv, Inc. * | | 15,775 | | 668,229 | |
Genpact, Ltd. * | | 5,864 | | 61,337 | |
Global Payments, Inc. | | 8,074 | | 290,341 | |
Hewitt Associates, Inc., Class A * | | 9,886 | | 286,694 | |
Lender Processing Services, Inc. | | 2,248 | | 65,304 | |
See Combined Notes to Financial Statements
SCHEDULE OF INVESTMENTS continued
Market Index Growth Fund
May 31, 2009
Metavante Technologies, Inc. * | | 9,114 | | 233,774 | |
NeuStar, Inc., Class A * | | 7,337 | | 147,107 | |
Paychex, Inc. | | 32,846 | | 898,995 | |
SAIC, Inc. * | | 3,457 | | 60,394 | |
Total System Services, Inc. | | 16,596 | | 226,535 | |
Unisys Corp. * | | 19,925 | | 27,696 | |
Western Union Co. | | 71,174 | | 1,254,798 | |
| | | |
| |
| | | | 9,765,716 | |
| | | |
| |
Office Electronics 0.0% | | | | | |
Zebra Technologies Corp., Class A * | | 5,770 | | 125,959 | |
| | | |
| |
Semiconductors & Semiconductor Equipment 4.2% | | | | | |
Advanced Micro Devices, Inc. * | | 8,463 | | 38,422 | |
Altera Corp. | | 30,430 | | 517,919 | |
Analog Devices, Inc. | | 29,448 | | 718,826 | |
Applied Materials, Inc. | | 137,395 | | 1,547,068 | |
Atmel Corp. * | | 28,853 | | 111,084 | |
Broadcom Corp., Class A * | | 52,182 | | 1,329,597 | |
Cree, Inc. * | | 3,759 | | 114,386 | |
Cypress Semiconductor Corp. | | 14,006 | | 120,452 | |
Integrated Device Technology, Inc. * | | 7,824 | | 44,049 | |
Intel Corp. | | 502,336 | | 7,896,722 | |
International Rectifier Corp. * | | 1,619 | | 23,427 | |
Intersil Corp., Class A | | 4,284 | | 52,479 | |
KLA-Tencor Corp. | | 16,157 | | 436,239 | |
Lam Research Corp. * | | 11,608 | | 304,013 | |
Linear Technology Corp. | | 22,520 | | 527,193 | |
LSI Corp. * | | 49,045 | | 219,231 | |
Marvell Technology Group, Ltd. * | | 49,235 | | 562,756 | |
MEMC Electronic Materials, Inc. * | | 23,117 | | 445,927 | |
Microchip Technology, Inc. | | 18,773 | | 404,934 | |
Micron Technology, Inc. * | | 10,744 | | 54,365 | |
National Semiconductor Corp. | | 23,282 | | 323,154 | |
Novellus Systems, Inc. * | | 3,051 | | 54,704 | |
NVIDIA Corp. * | | 56,307 | | 587,282 | |
ON Semiconductor Corp. * | | 41,362 | | 283,330 | |
Rambus, Inc. * | | 10,600 | | 137,270 | |
Silicon Laboratories, Inc. * | | 4,695 | | 157,846 | |
Teradyne, Inc. * | | 10,920 | | 78,078 | |
Texas Instruments, Inc. | | 134,261 | | 2,604,663 | |
Varian Semiconductor Equipment Associates, Inc. * | | 7,526 | | 177,012 | |
Xilinx, Inc. | | 28,346 | | 587,896 | |
| | | |
| |
| | | | 20,460,324 | |
| | | |
| |
Software 6.8% | | | | | |
Activision Blizzard, Inc. * | | 60,242 | | 727,723 | |
Adobe Systems, Inc. * | | 53,981 | | 1,521,185 | |
Ansys, Inc. * | | 8,595 | | 256,647 | |
Autodesk, Inc. * | | 22,679 | | 486,691 | |
BMC Software, Inc. * | | 19,387 | | 661,097 | |
CA, Inc. | | 18,410 | | 321,255 | |
Citrix Systems, Inc. * | | 18,629 | | 585,137 | |
Compuware Corp. * | | 14,687 | | 112,062 | |
Electronic Arts, Inc. * | | 32,320 | | 743,037 | |
FactSet Research Systems, Inc. | | 4,334 | | 229,269 | |
See Combined Notes to Financial Statements
SCHEDULE OF INVESTMENTS continued
Market Index Growth Fund
May 31, 2009
Intuit, Inc. * | | 32,583 | | 886,909 | |
McAfee, Inc. * | | 13,790 | | 540,982 | |
Microsoft Corp. | | 814,869 | | 17,022,613 | |
Novell, Inc. * | | 16,083 | | 66,905 | |
Nuance Communications, Inc. * | | 19,896 | | 246,710 | |
Oracle Corp. | | 395,307 | | 7,744,064 | |
Red Hat, Inc. * | | 19,350 | | 386,033 | |
Salesforce.com, Inc. * | | 10,672 | | 405,002 | |
VMware, Inc., Class A * | | 4,210 | | 130,678 | |
| | | |
| |
| | | | 33,073,999 | |
| | | |
| |
MATERIALS 3.9% | | | | | |
Chemicals 2.6% | | | | | |
Air Products & Chemicals, Inc. | | 21,383 | | 1,385,191 | |
Airgas, Inc. | | 8,404 | | 355,153 | |
Albemarle Corp. | | 9,284 | | 261,995 | |
Ashland, Inc. | | 596 | | 15,973 | |
Celanese Corp., Ser. A | | 12,664 | | 259,739 | |
CF Industries Holdings, Inc. | | 4,913 | | 381,445 | |
Ecolab, Inc. | | 17,711 | | 661,506 | |
FMC Corp. | | 2,939 | | 159,735 | |
Huntsman Corp. | | 1,779 | | 11,243 | |
International Flavors & Fragrances, Inc. | | 8,171 | | 260,655 | |
Intrepid Potash, Inc. * | | 1,874 | | 61,092 | |
Monsanto Co. | | 55,702 | | 4,575,919 | |
Mosaic Co. | | 15,761 | | 862,127 | |
Nalco Holding Co. | | 13,291 | | 230,732 | |
PPG Industries, Inc. | | 1,832 | | 81,469 | |
Praxair, Inc. | | 31,782 | | 2,326,442 | |
Scotts Miracle-Gro Co., Class A | | 3,457 | | 118,575 | |
Sigma-Aldrich Corp. | | 6,531 | | 316,492 | |
Terra Industries, Inc. | | 10,367 | | 288,099 | |
Valhi, Inc. | | 230 | | 2,493 | |
| | | |
| |
| | | | 12,616,075 | |
| | | |
| |
Construction Materials 0.1% | | | | | |
Eagle Materials, Inc. | | 3,929 | | 96,653 | |
Martin Marietta Materials, Inc. | | 4,184 | | 340,871 | |
| | | |
| |
| | | | 437,524 | |
| | | |
| |
Containers & Packaging 0.1% | | | | | |
AptarGroup, Inc. | | 1,284 | | 39,817 | |
Ball Corp. | | 1,489 | | 59,262 | |
Crown Holdings, Inc. * | | 16,292 | | 382,862 | |
Greif, Inc., Class A | | 3,383 | | 163,466 | |
Owens-Illinois, Inc. * | | 4,840 | | 138,569 | |
Packaging Corporation of America | | 2,455 | | 39,575 | |
| | | |
| |
| | | | 823,551 | |
| | | |
| |
Metals & Mining 1.1% | | | | | |
AK Steel Holding Corp. | | 11,370 | | 162,591 | |
Alcoa, Inc. | | 76,724 | | 707,395 | |
Allegheny Technologies, Inc. | | 10,262 | | 363,377 | |
Carpenter Technology Corp. | | 297 | | 6,677 | |
Century Aluminum Co. * | | 2,648 | | 15,914 | |
Cliffs Natural Resources, Inc. | | 13,294 | | 362,262 | |
See Combined Notes to Financial Statements
SCHEDULE OF INVESTMENTS continued
Market Index Growth Fund
May 31, 2009
Newmont Mining Corp. | | | 48,570 | | | 2,373,616 | |
Nucor Corp. | | | 6,837 | | | 300,213 | |
Schnitzer Steel Industries, Inc., Class A | | | 282 | | | 15,380 | |
Southern Copper Corp. | | | 22,327 | | | 467,304 | |
Steel Dynamics, Inc. | | | 4,484 | | | 66,991 | |
Titanium Metals Corp. | | | 1,599 | | | 14,807 | |
United States Steel Corp. | | | 13,776 | | | 469,486 | |
| | | | |
|
| |
| | | | | | 5,326,013 | |
| | | | |
|
| |
TELECOMMUNICATION SERVICES 0.8% | | | | | | | |
Diversified Telecommunication Services 0.2% | | | | | | | |
Embarq Corp. | | | 7,533 | | | 316,536 | |
Frontier Communications Corp. | | | 7,306 | | | 53,188 | |
Level 3 Communications, Inc. * | | | 157,524 | | | 168,551 | |
Qwest Communications International, Inc. | | | 75,874 | | | 330,810 | |
Windstream Corp. | | | 22,609 | | | 190,142 | |
| | | | |
|
| |
| | | | | | 1,059,227 | |
| | | | |
|
| |
Wireless Telecommunication Services 0.6% | | | | | | | |
American Tower Corp., Class A * | | | 40,253 | | | 1,282,863 | |
Clearwire Corp. * | | | 6,088 | | | 27,092 | |
Crown Castle International Corp. * | | | 5,934 | | | 143,959 | |
Leap Wireless International, Inc. * | | | 470 | | | 17,620 | |
MetroPCS Communications, Inc. * | | | 24,726 | | | 423,556 | |
NII Holdings, Inc. * | | | 17,009 | | | 348,004 | |
SBA Communications Corp., Class A * | | | 11,834 | | | 302,595 | |
Telephone & Data Systems, Inc. | | | 4,486 | | | 135,971 | |
U.S. Cellular Corp. * | | | 705 | | | 29,279 | |
| | | | |
|
| |
| | | | | | 2,710,939 | |
| | | | |
|
| |
UTILITIES 1.9% | | | | | | | |
Electric Utilities 1.0% | | | | | | | |
Allegheny Energy, Inc. | | | 17,056 | | | 426,400 | |
DPL, Inc. | | | 888 | | | 19,323 | |
Entergy Corp. | | | 13,762 | | | 1,026,920 | |
Exelon Corp. | | | 33,293 | | | 1,598,397 | |
Mirant Corp. * | | | 9,363 | | | 146,156 | |
NRG Energy, Inc. * | | | 10,151 | | | 228,398 | |
NV Energy, Inc. | | | 6,269 | | | 62,690 | |
PPL Corp. | | | 37,864 | | | 1,229,444 | |
| | | | |
|
| |
| | | | | | 4,737,728 | |
| | | | |
|
| |
Gas Utilities 0.2% | | | | | | | |
Energen Corp. | | | 1,375 | | | 51,177 | |
EQT Corp. | | | 13,283 | | | 494,792 | |
Questar Corp. | | | 6,666 | | | 225,911 | |
| | | | |
|
| |
| | | | | | 771,880 | |
| | | | |
|
| |
Independent Power Producers & Energy Traders 0.3% | | | | | | | |
AES Corp. * | | | 68,191 | | | 681,228 | |
Calpine Corp. * | | | 35,935 | | | 486,919 | |
Constellation Energy Group, Inc. | | | 18,498 | | | 504,626 | |
| | | | |
|
| |
| | | | | | 1,672,773 | |
| | | | |
|
| |
See Combined Notes to Financial Statements
SCHEDULE OF INVESTMENTS continued
Market Index Growth Fund
May 31, 2009
Multi-Utilities 0.4% | | | | | | | |
CenterPoint Energy, Inc. | | | 22,347 | | | 226,152 | |
Public Service Enterprise Group, Inc. | | | 51,615 | | | 1,644,970 | |
| | | | |
|
| |
| | | | | | 1,871,122 | |
| | | | |
|
| |
Total Common Stocks (cost $483,882,142) | | | | | | 483,156,306 | |
| | | | |
|
| |
EXCHANGE TRADED FUND 0.3% | | | | | | | |
iShares Russell 1000 Growth Index Fund (cost $1,243,307) | | | 37,800 | | | 1,536,570 | |
| | | | |
|
| |
| | | | | | | |
| | | Principal
Amount | | | Value | |
|
|
|
|
|
|
| |
SHORT-TERM INVESTMENTS 0.1% | | | | | | | |
U.S. TREASURY OBLIGATIONS 0.0% | | | | | | | |
U.S. Treasury Bills: | | | | | | | |
0.01%, 06/04/2009 ß ƒ | | $ | 25,000 | | | 25,000 | |
0.12%, 08/27/2009 ß ƒ | | | 100,000 | | | 99,970 | |
| | | | |
|
| |
| | | | | | 124,970 | |
| | | | |
|
| |
| | | | | | | |
| | | Shares | | | Value | |
|
|
|
|
|
|
| |
MUTUAL FUND SHARES 0.1% | | | | | | | |
Evergreen Institutional Money Market Fund, Class I, 0.35% q ø | | | 168,885 | | | 168,885 | |
| | | | |
|
| |
Total Short-Term Investments (cost $293,846) | | | | | | 293,855 | |
| | | | |
|
| |
Total Investments (cost $485,419,295) 99.8% | | | | | | 484,986,731 | |
Other Assets and Liabilities 0.2% | | | | | | 847,299 | |
| | | | |
|
| |
Net Assets 100.0% | | | | | $ | 485,834,030 | |
| | | | |
|
| |
* | Non-income producing security |
ß | Rate shown represents the yield to maturity at date of purchase. |
ƒ | All or a portion of this security was pledged to cover initial margin requirements for open futures contracts. |
q | Rate shown is the 7-day annualized yield at period end. |
ø | Evergreen Investment Management Company, LLC is the investment advisor to both the Fund and the money market fund. |
The following table shows the percent of total long-term investments by sector as of May 31, 2009:
Information Technology | | 30.1 | % |
Health Care | | 13.5 | % |
Consumer Staples | | 13.0 | % |
Industrials | | 12.4 | % |
Consumer Discretionary | | 10.2 | % |
Energy | | 8.9 | % |
Financials | | 4.9 | % |
Materials | | 4.0 | % |
Utilities | | 1.9 | % |
Telecommunication Services | | 0.8 | % |
Other | | 0.3 | % |
| |
| |
| | 100.0 | % |
| |
| |
See Combined Notes to Financial Statements
Market Index Growth Fund
STATEMENT OF ASSETS AND LIABILITIES
May 31, 2009
Assets | | | | |
Investments in unaffiliated issuers, at value (cost $485,250,410) | | $ | 484,817,846 | |
Investments in affiliated issuers, at value (cost $168,885) | | | 168,885 | |
|
|
|
| |
Total investments | | | 484,986,731 | |
Receivable for securities sold | | | 939,504 | |
Dividends receivable | | | 935,058 | |
Receivable for daily variation margin on open futures contracts | | | 15,600 | |
Receivable from investment advisor | | | 4,368 | |
|
|
|
| |
Total assets | | | 486,881,261 | |
|
|
|
| |
Liabilities | | | | |
Payable for securities purchased | | | 1,004,578 | |
Due to related parties | | | 4,236 | |
Accrued expenses and other liabilities | | | 38,417 | |
|
|
|
| |
Total liabilities | | | 1,047,231 | |
|
|
|
| |
Net assets | | $ | 485,834,030 | |
|
|
|
| |
Net assets represented by | | | | |
Paid-in capital | | $ | 485,305,275 | |
Undistributed net investment income | | | 9,092,094 | |
Accumulated net realized losses on investments | | | (8,402,168 | ) |
Net unrealized losses on investments | | | (161,171 | ) |
|
|
|
| |
Total net assets | | $ | 485,834,030 | |
|
|
|
| |
Shares outstanding (unlimited number of shares authorized) | | | | |
Class I | | | 53,562,630 | |
|
|
|
| |
Net asset value per share | | | | |
Class I | | $ | 9.07 | |
|
|
|
| |
See Combined Notes to Financial Statements
Market Index Growth Fund
STATEMENT OF OPERATIONS
Year Ended May 31, 2009
Investment income | | | | |
Dividends (net of foreign withholding taxes of $63) | | $ | 8,736,235 | |
Securities lending | | | 590,919 | |
Income from affiliated issuers | | | 8,797 | |
Interest | | | 845 | |
|
|
|
| |
Total investment income | | | 9,336,796 | |
|
|
|
| |
Expenses | | | | |
Advisory fee | | | 1,638,458 | |
Administrative services fee | | | 512,018 | |
Transfer agent fees | | | 25 | |
Trustees’ fees and expenses | | | 7,939 | |
Printing and postage expenses | | | 10,261 | |
Custodian and accounting fees | | | 125,951 | |
Professional fees | | | 30,546 | |
Interest expense | | | 113 | |
Other | | | 11,410 | |
|
|
|
| |
Total expenses | | | 2,336,721 | |
Less: Expense reductions | | | (1,478 | ) |
Fee waivers and expense reimbursements | | | (2,209,686 | ) |
|
|
|
| |
Net expenses | | | 125,557 | |
|
|
|
| |
Net investment income | | | 9,211,239 | |
|
|
|
| |
Net realized and unrealized gains or losses on investments | | | | |
Net realized losses on: | | | | |
Securities in unaffiliated issuers | | | (7,621,240 | ) |
Futures contracts | | | (580,760 | ) |
Foreign currency related transactions | | | (41 | ) |
|
|
|
| |
Net realized losses on investments | | | (8,202,041 | ) |
|
|
|
| |
Net change in unrealized gains or losses on: | | | | |
Securities in unaffiliated issuers | | | (219,942,296 | ) |
Futures contracts | | | 240,789 | |
|
|
|
| |
Net change in unrealized gains or losses on investments | | | (219,701,507 | ) |
|
|
|
| |
Net realized and unrealized gains or losses on investments | | | (227,903,548 | ) |
|
|
|
| |
Net decrease in net assets resulting from operations | | $ | (218,692,309 | ) |
|
|
|
| |
See Combined Notes to Financial Statements
Market Index Growth Fund
STATEMENTS OF CHANGES IN NET ASSETS
| | Year Ended May 31, | |
| |
| |
| | 2009 | | 2008 | |
|
|
|
|
| |
Operations | | | | | | | | | | | |
Net investment income | | | | $ | 9,211,239 | | | | $ | 10,261,326 | |
Net realized gains or losses on investments | | | | | (8,202,041 | ) | | | | 45,127,926 | |
Net change in unrealized gains or losses on investments | | | | | (219,701,507 | ) | | | | (60,979,242 | ) |
|
|
|
|
|
|
|
|
|
|
| |
Net decrease in net assets resulting from operations | | | | | (218,692,309 | ) | | | | (5,589,990 | ) |
|
|
|
|
|
|
|
|
|
|
| |
Distributions to shareholders from | | | | | | | | | | | |
Net investment income | | | | | (10,163,716 | ) | | | | (9,948,993 | ) |
Net realized gains | | | | | (45,053,344 | ) | | | | (9,731,411 | ) |
|
|
|
|
|
|
|
|
|
|
| |
Total distributions to shareholders | | | | | (55,217,060 | ) | | | | (19,680,404 | ) |
|
|
|
|
|
|
|
|
|
|
| |
| | Shares | | | | | Shares | | | | |
|
|
|
|
|
|
|
|
|
|
| |
Capital share transactions | | | | | | | | | | | |
Net asset value of shares issued in reinvestment of distributions | | 6,884,901 | | | 55,217,060 | | 1,275,847 | | | 19,680,404 | |
Payment for shares redeemed | | (1,931,994 | ) | | (25,000,000 | ) | (14,190,483 | ) | | (210,000,000 | ) |
|
|
|
|
|
|
|
|
|
|
| |
Net increase (decrease) in net assets resulting from capital share transactions | | | | | 30,217,060 | | | | | (190,319,596 | ) |
|
|
|
|
|
|
|
|
|
|
| |
Total decrease in net assets | | | | | (243,692,309 | ) | | | | (215,589,990 | ) |
Net assets | | | | | | | | | | | |
Beginning of period | | | | | 729,526,339 | | | | | 945,116,329 | |
|
|
|
|
|
|
|
|
|
|
| |
End of period | | | | $ | 485,834,030 | | | | $ | 729,526,339 | |
|
|
|
|
|
|
|
|
|
|
| |
Undistributed net investment income | | | | $ | 9,092,094 | | | | $ | 10,137,303 | |
|
|
|
|
|
|
|
|
|
|
| |
See Combined Notes to Financial Statements
This page left intentionally blank
Market Index Value Fund
FUND AT A GLANCE
as of May 31, 2009
MANAGEMENT TEAM
Investment Advisor:
Evergreen Investment Management Company, LLC
Portfolio Manager:
William E. Zieff
CURRENT INVESTMENT STYLE
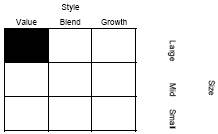
Source: Morningstar, Inc.
Morningstar’s style box is based on a portfolio date as of 3/31/2009.
The Equity style box placement is based on 10 growth and valuation measures for each fund holding and the median size of the companies in which the fund invests.
PERFORMANCE AND RETURNS
Portfolio inception date: 10/15/2002
| Class I |
Class inception date | 10/15/2002 |
|
|
Average annual return | |
|
|
1-year | -35.28% |
|
|
5-year | -1.50% |
|
|
Since portfolio inception | 3.32% |
|
|
Past performance is no guarantee of future results. The performance quoted represents past performance and current performance may be lower or higher. The investment return and principal value of an investment will fluctuate so that investors’ shares, when redeemed, may be worth more or less than their original cost. Performance includes the reinvestment of income dividends and capital gain distributions.
The advisor is waiving its advisory fee and reimbursing the fund for a portion of other expenses. Had the fee not been waived and expenses not reimbursed, returns would have been lower.
The fund is only offered to certain pension plans having at least $100 million. Class I shares are sold without a front-end or deferred sales charge. The minimum initial investment for the fund is $100 million, which may be waived in certain situations. There is no minimum amount required for subsequent purchases.
LONG-TERM GROWTH

Comparison of a $100,000,000 investment in the Evergreen Market Index Value Fund Class I shares versus a similar investment in the Russell 1000 Value Index (Russell 1000 Value) and the Consumer Price Index (CPI).
The Russell 1000 Value is an unmanaged market index and does not include transaction costs associated with buying and selling securities, any mutual fund fees or expenses or any taxes. The CPI is a commonly used measure of inflation and does not represent an investment return. It is not possible to invest directly in an index.
The fund’s investment objective may be changed without a vote of the fund’s shareholders.
“Russell 1000 Value Index” is a trademark and service mark of Frank Russell Company (FRC) and has been licensed for use by Evergreen Investments. The product is not sponsored, endorsed, sold or promoted by FRC and FRC makes no representation regarding the advisability of investing in the product.
All data is as of May 31, 2009, and subject to change.
Market Index Value Fund
PORTFOLIO MANAGER COMMENTARY
The fund’s Class I shares returned -35.28% for the twelve-month period ended May 31, 2009. During the same period, the Russell 1000 Value returned -35.35%.
The fund’s objective is to seek investment results that achieve price and yield performance similar to the Russell 1000 Value Index.
Investment process
The overall domestic stock market produced sharply negative returns during the fiscal year ended May 31, 2009 with value-oriented stocks faring worse than growth-oriented stocks. Some of those losses were tempered by the end of the period, as domestic markets enjoyed a major rebound.
The fund’s objective is to replicate the performance of the Russell 1000 Value Index (before fees and expenses). The portfolio management team uses an investment process designed to control trading and implementation costs and reduce tracking error as much as possible. As a result, the fund’s performance should closely align with that of the index. Periodic rebalancing takes place in order to reflect the frequently changing constituents of the index.
Contributors to performance
Given their collectively small weight in the fund, Information Technology, Telecommunication Services and Materials companies detracted the least from performance and individual stocks in these sectors posted gains. Notable contributors from the Information Technology and Materials sectors include Tellabs, Mosaic and Rohm & Haas, which all added modestly positive returns. The best-performing sector, which nonetheless lost about one-sixth of its value, was Health Care. Despite the overall loss, individual stocks within the sector produced gains. Names such as APP Pharmaceuticals, ImClone Systems and Barr Pharmaceuticals finished the period with respectably positive returns. Despite the gloomy news and market returns, numerous stocks, such as Philadelphia Consolidated Holding and O’Reilly Automotive, still eked out handsome gains over the period.
Detractors from performance
The benchmark is dominated by Financials companies, which comprise almost one-quarter of the index weight and together lost almost one-half of their market value. The Energy and Industrials sectors combined make up another quarter of the benchmark. Given its heavy weight, the Financials sector drove over one-third of the negative performance of the fund, with the most notable drains coming from Citigroup, Bank of America and American International Group, all of which required substantial government bailouts. Further negative performance resulted from losses in the Energy sector, including giants such as Exxon Mobil, ConocoPhillips and Chevron. Industrials companies, especially General Electric, also suffered major declines. Finally, companies that filed for bankruptcy or that were partially nationalized generated the worst returns, losing almost all of their market value. These names include Lehman Brothers, Chemtura Corp., Washington Mutual, Smurfit-Stone Container, General Growth Properties, Fannie Mae and Freddie Mac.
This commentary reflects the views and opinions of the fund’s portfolio manager(s) on the date indicated and may include statements that constitute “forward-looking statements” under the U.S. Securities laws. Forward-looking statements include, among other things, projections, estimates and information about possible or future results related to the fund, markets, or regulatory developments. The views expressed above are not guarantees of future performance or economic results and involve certain risks, uncertainties and assumptions that could cause actual outcomes and results to differ materially from the views expressed herein. The views expressed above are subject to change at any time based upon economic, market, or other conditions and Evergreen undertakes no obligation to update the views expressed herein. Any discussions of specific securities should not be considered a recommendation to buy or sell those securities. The views expressed herein (including any forward-looking statements) may not be relied upon as investment advice or as an indication of the fund’s trading intent.
Market Index Value Fund
ABOUT YOUR FUND’S EXPENSES
The Example below is intended to describe the fees and expenses borne by shareholders and the impact of those costs on your investment.
Example
As a shareholder of the fund, you incur two types of costs: (1) transaction costs, including sales charges (loads), redemption fees and exchange fees; and (2) ongoing costs, including management fees, distribution (12b-1) fees and other fund expenses. This Example is intended to help you understand your ongoing costs (in dollars) of investing in the fund and to compare these costs with the ongoing costs of investing in other mutual funds. The Example is based on an investment of $1,000 invested at the beginning of the period and held for the entire period from December 1, 2008 to May 31, 2009.
The example illustrates your fund’s costs in two ways:
• Actual expenses
The section in the table under the heading “Actual” provides information about actual account values and actual expenses. You may use the information in these columns, together with the amount you invested, to estimate the expenses that you paid over the period. Simply divide your account value by $1,000 (for example, an $8,600 account value divided by $1,000 = 8.6), then multiply the result by the number in the appropriate column for your share class, in the column entitled “Expenses Paid During Period” to estimate the expenses you paid on your account during this period.
• Hypothetical example for comparison purposes
The section in the table under the heading “Hypothetical (5% return before expenses)” provides information about hypothetical account values and hypothetical expenses based on the fund’s actual expense ratio and an assumed rate of return of 5% per year before expenses, which is not the fund’s actual return. The hypothetical account values and expenses may not be used to estimate the actual ending account balance or expenses you paid for the period. You may use this information to compare the ongoing costs of investing in the fund and other funds. To do so, compare this 5% hypothetical example with the 5% hypothetical examples that appear in the shareholder reports of the other funds.
Please note that the expenses shown in the table are meant to highlight your ongoing costs only and do not reflect any transactional costs, such as sales charges (loads), redemption fees or exchange fees. Therefore, the section in the table under the heading “Hypothetical (5% return before expenses)” is useful in comparing ongoing costs only, and will not help you determine the relative total costs of owning different funds. In addition, if these transactional costs were included, your costs would have been higher.
| Beginning
Account
Value
12/1/2008 | Ending
Account
Value
05/31/2009 | Expenses
Paid During
Period* |
|
|
|
|
Actual | | | |
Class I | $1,000.00 | $ 992.60 | $0.10 |
Hypothetical | | | |
(5% return before expenses) | | | |
Class I | $1,000.00 | $1,024.83 | $0.10 |
|
|
|
|
* | Expenses are equal to the Fund’s annualized expense ratio (0.02% for Class I), multiplied by the average account value over the period, multiplied by 182 / 365 days. |
Market Index Value Fund
FINANCIAL HIGHLIGHTS - CLASS I
(For a share outstanding throughout each period)
| | Year Ended May 31, | |
| |
| |
| | 2009 | | 2008 | | 2007 | | 2006 | | 2005 | |
|
|
|
|
|
|
|
|
|
|
| |
Net asset value, beginning of period | | $ | 12.99 | | $ | 15.67 | | $ | 15.75 | | $ | 14.83 | | $ | 13.23 | |
|
|
|
|
|
|
|
|
|
|
|
|
|
|
|
| |
Income from investment operations | | | | | | | | | | | | | | | | |
Net investment income (loss) | | | 0.31 | 1 | | 0.38 | | | 0.39 | 1 | | 0.64 | | | 0.35 | |
Net realized and unrealized gains or losses on investments | | | (4.91 | ) | | (2.26 | ) | | 3.26 | | | 1.18 | | | 1.69 | |
| |
|
|
|
|
|
|
|
|
|
|
|
|
|
| |
Total from investment operations | | | (4.60 | ) | | (1.88 | ) | | 3.65 | | | 1.82 | | | 2.04 | |
|
|
|
|
|
|
|
|
|
|
|
|
|
|
|
| |
Distributions to shareholders from | | | | | | | | | | | | | | | | |
Net investment income | | | (0.35 | ) | | (0.30 | ) | | (0.38 | ) | | (0.34 | ) | | (0.28 | ) |
Net realized gains | | | (0.77 | ) | | (0.50 | ) | | (3.35 | ) | | (0.56 | ) | | (0.16 | ) |
| |
|
|
|
|
|
|
|
|
|
|
|
|
|
| |
Total distributions to shareholders | | | (1.12 | ) | | (0.80 | ) | | (3.73 | ) | | (0.90 | ) | | (0.44 | ) |
|
|
|
|
|
|
|
|
|
|
|
|
|
|
|
| |
Net asset value, end of period | | $ | 7.27 | | $ | 12.99 | | $ | 15.67 | | $ | 15.75 | | $ | 14.83 | |
|
|
|
|
|
|
|
|
|
|
|
|
|
|
|
| |
Total return | | | (35.28 | )% | | (12.25 | )% | | 25.57 | % | | 12.53 | % | | 15.51 | % |
|
|
|
|
|
|
|
|
|
|
|
|
|
|
|
| |
Ratios and supplemental data | | | | | | | | | | | | | | | | |
Net assets, end of period (thousands) | | $ | 413,715 | | $ | 656,058 | | $ | 839,657 | | $ | 505,681 | | $ | 818,284 | |
Ratios to average net assets | | | | | | | | | | | | | | | | |
Expenses including waivers/reimbursements but excluding expense reductions | | | 0.02 | % | | 0.03 | % | | 0.03 | % | | 0.03 | % | | 0.03 | % |
Expenses excluding waivers/reimbursements and expense reductions | | | 0.45 | % | | 0.46 | % | | 0.46 | % | | 0.46 | % | | 0.45 | % |
Net investment income (loss) | | | 3.56 | % | | 2.66 | % | | 2.56 | % | | 2.63 | % | | 2.54 | % |
Portfolio turnover rate | | | 31 | % | | 27 | % | | 17 | % | | 27 | % | | 16 | % |
|
|
|
|
|
|
|
|
|
|
|
|
|
|
|
| |
1 | Net investment income (loss) per share is based on average shares outstanding during the period. |
See Combined Notes to Financial Statements
SCHEDULE OF INVESTMENTS
Market Index Value Fund
May 31, 2009
| | Shares | | Value | |
|
|
|
|
| |
COMMON STOCKS 99.3% | | | | | | | |
CONSUMER DISCRETIONARY 8.9% | | | | | | | |
Auto Components 0.3% | | | | | | | |
Autoliv, Inc. | | | 8,124 | | $ | 225,685 | |
BorgWarner, Inc. | | | 1,408 | | | 45,408 | |
Federal-Mogul Corp. * | | | 2,169 | | | 21,690 | |
Goodyear Tire & Rubber Co. * | | | 8,200 | | | 93,890 | |
Johnson Controls, Inc. | | | 48,049 | | | 957,617 | |
TRW Automotive Holdings Corp. * | | | 4,794 | | | 42,762 | |
| | | | |
|
| |
| | | | | | 1,387,052 | |
| | | | |
|
| |
Automobiles 0.4% | | | | | | | |
Ford Motor Co. * | | | 297,149 | | | 1,708,607 | |
General Motors Corp. | | | 50,187 | | | 37,640 | |
Harley-Davidson, Inc. | | | 2,530 | | | 42,934 | |
Thor Industries, Inc. | | | 2,388 | | | 48,023 | |
| | | | |
|
| |
| | | | | | 1,837,204 | |
| | | | |
|
| |
Distributors 0.1% | | | | | | | |
Genuine Parts Co. | | | 15,642 | | | 523,694 | |
| | | | |
|
| |
Diversified Consumer Services 0.1% | | | | | | | |
Career Education Corp. * | | | 8,552 | | | 171,724 | |
Service Corporation International | | | 24,935 | | | 133,403 | |
Weight Watchers International, Inc. | | | 512 | | | 11,996 | |
| | | | |
|
| |
| | | | | | 317,123 | |
| | | | |
|
| |
Hotels, Restaurants & Leisure 0.5% | | | | | | | |
Boyd Gaming Corp. | | | 4,769 | | | 47,881 | |
Carnival Corp. | | | 33,149 | | | 843,311 | |
Choice Hotels International, Inc. | | | 1,904 | | | 51,960 | |
International Speedway Corp., Class A | | | 3,096 | | | 76,750 | |
Interval Leisure Group, Inc. * | | | 3,065 | | | 29,332 | |
McDonald’s Corp. | | | 10,066 | | | 593,793 | |
MGM MIRAGE * | | | 1,106 | | | 8,251 | |
Orient Express Hotels, Ltd. | | | 879 | | | 6,258 | |
Royal Caribbean Cruises, Ltd. | | | 13,167 | | | 198,295 | |
Wyndham Worldwide Corp. | | | 16,889 | | | 199,121 | |
| | | | |
|
| |
| | | | | | 2,054,952 | |
| | | | |
|
| |
Household Durables 0.9% | | | | | | | |
Black & Decker Corp. | | | 5,837 | | | 187,192 | |
Centex Corp. | | | 11,794 | | | 99,423 | |
D.R. Horton, Inc. | | | 30,160 | | | 277,774 | |
Fortune Brands, Inc. | | | 14,675 | | | 513,772 | |
Harman International Industries, Inc. | | | 1,411 | | | 26,301 | |
Jarden Corp. * | | | 7,407 | | | 131,696 | |
KB Home | | | 7,210 | | | 108,150 | |
Leggett & Platt, Inc. | | | 14,991 | | | 220,068 | |
Lennar Corp., Class A | | | 13,017 | | | 123,792 | |
M.D.C. Holdings, Inc. | | | 3,270 | | | 100,422 | |
Mohawk Industries, Inc. * | | | 5,330 | | | 203,979 | |
Newell Rubbermaid, Inc. | | | 26,439 | | | 304,313 | |
NVR, Inc. * | | | 394 | | | 194,991 | |
See Combined Notes to Financial Statements
SCHEDULE OF INVESTMENTS continued
Market Index Value Fund
May 31, 2009
Pulte Homes, Inc. | | | 15,551 | | | 136,849 | |
Snap-On, Inc. | | | 5,505 | | | 171,481 | |
Stanley Works | | | 7,484 | | | 267,179 | |
Toll Brothers, Inc. * | | | 12,442 | | | 231,172 | |
Whirlpool Corp. | | | 7,173 | | | 302,270 | |
| | | | |
|
| |
| | | | | | 3,600,824 | |
| | | | |
|
| |
Internet & Catalog Retail 0.2% | | | | | | | |
Expedia, Inc. * | | | 19,816 | | | 343,015 | |
HSN, Inc. * | | | 3,065 | | | 34,634 | |
Liberty Media Holding Corp. - Interactive, Ser. A * | | | 56,703 | | | 332,280 | |
Ticketmaster Entertainment, Inc. * | | | 3,065 | | | 23,846 | |
| | | | |
|
| |
| | | | | | 733,775 | |
| | | | |
|
| |
Leisure Equipment & Products 0.2% | | | | | | | |
Eastman Kodak Co. | | | 25,633 | | | 66,902 | |
Hasbro, Inc. | | | 6,837 | | | 173,728 | |
Mattel, Inc. | | | 34,557 | | | 539,435 | |
| | | | |
|
| |
| | | | | | 780,065 | |
| | | | |
|
| |
Media 3.4% | | | | | | | |
Ascent Media Corp., Ser. A * | | | 1,343 | | | 38,840 | |
Cablevision Systems Corp., Class A | | | 21,166 | | | 402,789 | |
CBS Corp., Class B | | | 56,312 | | | 415,583 | |
Clear Channel Outdoor Holdings, Inc. * | | | 852 | | | 2,999 | |
Comcast Corp., Class A | | | 189,557 | | | 2,610,200 | |
Discover Communications Inc., Ser. C * | | | 26,853 | | | 559,616 | |
E.W. Scripps Co., Class A | | | 2,762 | | | 5,386 | |
Gannett Co., Inc. | | | 21,836 | | | 104,158 | |
Hearst-Argyle Television, Inc. | | | 2,178 | | | 9,757 | |
Interpublic Group of Cos. * | | | 6,489 | | | 34,002 | |
Liberty Global, Inc., Class A * | | | 13,760 | | | 190,163 | |
McGraw-Hill Cos. | | | 15,401 | | | 463,416 | |
Meredith Corp. | | | 3,764 | | | 101,477 | |
New York Times Co., Class A | | | 13,728 | | | 90,605 | |
News Corp., Class A | | | 132,687 | | | 1,297,679 | |
Omnicom Group, Inc. | | | 2,294 | | | 69,967 | |
Regal Entertainment Group, Class A | | | 7,620 | | | 97,231 | |
Scripps Networks Interactive, Inc., Class A | | | 8,290 | | | 229,965 | |
Time Warner Cable, Inc. | | | 16,887 | | | 519,951 | |
Time Warner, Inc. | | | 101,249 | | | 2,371,252 | |
Viacom, Inc., Class B * | | | 3,258 | | | 72,230 | |
Virgin Media, Inc. | | | 28,070 | | | 244,209 | |
Walt Disney Co. | | | 160,811 | | | 3,894,842 | |
Warner Music Group Corp. * | | | 3,994 | | | 27,159 | |
Washington Post Co., Class B | | | 588 | | | 211,680 | |
| | | | |
|
| |
| | | | | | 14,065,156 | |
| | | | |
|
| |
Multiline Retail 0.6% | | | | | | | |
Family Dollar Stores, Inc. | | | 12,298 | | | 372,261 | |
J.C. Penney Co., Inc. | | | 21,180 | | | 552,586 | |
Kohl’s Corp. * | | | 7,020 | | | 298,139 | |
Macy’s, Inc. | | | 40,233 | | | 469,921 | |
Saks, Inc. * | | | 13,785 | | | 52,659 | |
Sears Holdings Corp. * | | | 5,277 | | | 299,997 | |
See Combined Notes to Financial Statements
SCHEDULE OF INVESTMENTS continued
Market Index Value Fund
May 31, 2009
Target Corp. | | | 5,572 | | | 218,980 | |
| | | | |
|
| |
| | | | | | 2,264,543 | |
| | | | |
|
| |
Specialty Retail 2.1% | | | | | | | |
American Eagle Outfitters, Inc. | | | 4,974 | | | 73,665 | |
AnnTaylor Stores Corp. * | | | 3,557 | | | 26,037 | |
AutoNation, Inc. * | | | 10,978 | | | 174,331 | |
Barnes & Noble, Inc. | | | 3,454 | | | 85,348 | |
Bed Bath & Beyond, Inc. * | | | 4,376 | | | 123,009 | |
Foot Locker, Inc. | | | 14,778 | | | 164,184 | |
Gap, Inc. | | | 22,286 | | | 397,805 | |
Home Depot, Inc. | | | 161,370 | | | 3,737,329 | |
Limited Brands, Inc. | | | 8,897 | | | 111,301 | |
Lowe’s Cos. | | | 132,617 | | | 2,521,049 | |
O’Reilly Automotive, Inc. * | | | 8,159 | | | 294,132 | |
Office Depot, Inc. * | | | 26,077 | | | 121,519 | |
OfficeMax, Inc. | | | 7,249 | | | 59,804 | |
Penske Automotive Group, Inc. | | | 3,888 | | | 47,589 | |
RadioShack Corp. | | | 12,527 | | | 168,363 | |
Signet Jewelers, Ltd. | | | 8,143 | | | 146,493 | |
Staples, Inc. | | | 10,056 | | | 205,645 | |
Williams-Sonoma, Inc. | | | 7,675 | | | 99,315 | |
| | | | |
|
| |
| | | | | | 8,556,918 | |
| | | | |
|
| |
Textiles, Apparel & Luxury Goods 0.1% | | | | | | | |
Jones Apparel Group, Inc. | | | 8,268 | | | 75,239 | |
Liz Claiborne, Inc. | | | 9,050 | | | 40,725 | |
Phillips-Van Heusen Corp. | | | 608 | | | 17,918 | |
VF Corp. | | | 8,336 | | | 473,651 | |
| | | | |
|
| |
| | | | | | 607,533 | |
| | | | |
|
| |
CONSUMER STAPLES 9.2% | | | | | | | |
Beverages 1.5% | | | | | | | |
Brown-Forman Corp., Class B | | | 2,593 | | | 113,703 | |
Coca-Cola Co. | | | 65,428 | | | 3,216,440 | |
Coca-Cola Enterprises, Inc. | | | 30,401 | | | 506,481 | |
Constellation Brands, Inc., Class A * | | | 17,661 | | | 204,161 | |
Dr. Pepper Snapple Group, Inc. * | | | 24,205 | | | 525,975 | |
Molson Coors Brewing Co., Class B | | | 11,031 | | | 485,254 | |
Pepsi Bottling Group, Inc. | | | 13,099 | | | 430,433 | |
PepsiAmericas, Inc. | | | 5,545 | | | 145,834 | |
PepsiCo, Inc. | | | 9,087 | | | 472,978 | |
| | | | |
|
| |
| | | | | | 6,101,259 | |
| | | | |
|
| |
Food & Staples Retailing 1.5% | | | | | | | |
BJ’s Wholesale Club, Inc. * | | | 5,223 | | | 184,058 | |
CVS Caremark Corp. | | | 62,782 | | | 1,870,904 | |
Kroger Co. | | | 35,192 | | | 802,378 | |
Rite Aid Corp. * | | | 51,015 | | | 59,177 | |
Safeway, Inc. | | | 41,822 | | | 847,314 | |
SUPERVALU, Inc. | | | 20,269 | | | 336,465 | |
Wal-Mart Stores, Inc. | | | 41,347 | | | 2,056,600 | |
Walgreen Co. | | | 7,187 | | | 214,101 | |
| | | | |
|
| |
| | | | | | 6,370,997 | |
| | | | |
|
| |
See Combined Notes to Financial Statements
SCHEDULE OF INVESTMENTS continued
Market Index Value Fund
May 31, 2009
Food Products 2.9% | | | | | | | |
Archer Daniels Midland Co. | | | 61,484 | | | 1,692,040 | |
Bunge, Ltd. | | | 11,605 | | | 734,248 | |
Campbell Soup Co. | | | 9,884 | | | 273,984 | |
ConAgra Foods, Inc. | | | 43,255 | | | 804,110 | |
Corn Products International, Inc. | | | 7,077 | | | 186,903 | |
Dean Foods Co. * | | | 3,354 | | | 63,055 | |
Del Monte Foods Co. | | | 18,837 | | | 154,087 | |
General Mills, Inc. | | | 29,271 | | | 1,498,090 | |
H.J. Heinz Co. | | | 13,391 | | | 489,843 | |
Hershey Co. | | | 7,280 | | | 256,402 | |
Hormel Foods Corp. | | | 6,786 | | | 235,746 | |
J.M. Smucker Co. | | | 9,105 | | | 366,567 | |
Kellogg Co. | | | 10,241 | | | 442,923 | |
Kraft Foods, Inc., Class A | | | 140,352 | | | 3,664,591 | |
McCormick & Co., Inc. | | | 6,727 | | | 205,308 | |
Sara Lee Corp. | | | 67,441 | | | 606,295 | |
Smithfield Foods, Inc. * | | | 11,139 | | | 138,458 | |
Tyson Foods, Inc., Class A | | | 24,986 | | | 332,813 | |
| | | | |
|
| |
| | | | | | 12,145,463 | |
| | | | |
|
| |
Household Products 2.7% | | | | | | | |
Clorox Co. | | | 9,095 | | | 476,942 | |
Kimberly-Clark Corp. | | | 23,533 | | | 1,221,127 | |
Procter & Gamble Co. | | | 181,038 | | | 9,403,114 | |
| | | | |
|
| |
| | | | | | 11,101,183 | |
| | | | |
|
| |
Personal Products 0.1% | | | | | | | |
Alberto-Culver Co. | | | 7,285 | | | 169,304 | |
Mead Johnson Nutrition Co. * | | | 1,343 | | | 41,848 | |
NBTY, Inc. * | | | 2,580 | | | 63,700 | |
| | | | |
|
| |
| | | | | | 274,852 | |
| | | | |
|
| |
Tobacco 0.5% | | | | | | | |
Altria Group, Inc. | | | 50,393 | | | 861,216 | |
Lorillard, Inc. | | | 7,905 | | | 540,149 | |
Reynolds American, Inc. | | | 16,355 | | | 653,709 | |
| | | | |
|
| |
| | | | | | 2,055,074 | |
| | | | |
|
| |
ENERGY 16.4% | | | | | | | |
Energy Equipment & Services 0.5% | | | | | | | |
BJ Services Co. | | | 28,060 | | | 438,859 | |
ENSCO International, Inc. | | | 923 | | | 35,896 | |
Exterran Holdings, Inc. * | | | 5,888 | | | 117,230 | |
Global Industries, Ltd. * | | | 3,985 | | | 27,895 | |
Helmerich & Payne, Inc. | | | 9,962 | | | 348,371 | |
Hercules Offshore, Inc. * | | | 8,485 | | | 39,370 | |
Key Energy Services, Inc. * | | | 9,966 | | | 64,281 | |
Nabors Industries, Ltd. * | | | 23,090 | | | 412,849 | |
Oil States International, Inc. * | | | 1,594 | | | 41,651 | |
Patterson-UTI Energy, Inc. | | | 5,633 | | | 80,777 | |
Pride International, Inc. * | | | 4,533 | | | 109,789 | |
Rowan Companies, Inc. | | | 6,989 | | | 142,995 | |
SEACOR Holdings, Inc. * | | | 1,760 | | | 134,482 | |
Tidewater, Inc. | | | 4,734 | | | 225,670 | |
See Combined Notes to Financial Statements
SCHEDULE OF INVESTMENTS continued
Market Index Value Fund
May 31, 2009
Unit Corp. * | | | 1,067 | | | 35,755 | |
| | | | |
|
| |
| | | | | | 2,255,870 | |
| | | | |
|
| |
Oil, Gas & Consumable Fuels 15.9% | | | | | | | |
Anadarko Petroleum Corp. | | | 47,665 | | | 2,277,434 | |
Apache Corp. | | | 31,852 | | | 2,683,850 | |
Cabot Oil & Gas Corp. | | | 5,388 | | | 189,280 | |
Chesapeake Energy Corp. | | | 34,775 | | | 788,001 | |
Chevron Corp. | | | 197,497 | | | 13,167,125 | |
Cimarex Energy Co. | | | 7,911 | | | 258,057 | |
ConocoPhillips | | | 147,278 | | | 6,751,223 | |
Devon Energy Corp. | | | 42,601 | | | 2,694,087 | |
El Paso Corp. | | | 52,710 | | | 513,922 | |
Encore Aquisition Co. * | | | 3,806 | | | 135,075 | |
EOG Resources, Inc. | | | 5,880 | | | 430,357 | |
Exxon Mobil Corp. | | | 387,228 | | | 26,854,262 | |
Forest Oil Corp. * | | | 10,645 | | | 202,361 | |
Helix Energy Solutions, Inc. * | | | 8,586 | | | 96,592 | |
Marathon Oil Corp. | | | 67,598 | | | 2,155,024 | |
Mariner Energy, Inc. * | | | 2,263 | | | 32,723 | |
Newfield Exploration Co. * | | | 12,580 | | | 454,390 | |
Noble Energy, Inc. | | | 15,391 | | | 915,457 | |
Overseas Shipholding Group, Inc. | | | 2,034 | | | 68,790 | |
Petrohawk Energy Corp. * | | | 1,499 | | | 37,775 | |
Pioneer Natural Resources Co. | | | 11,414 | | | 320,962 | |
Plains Exploration & Production Co. * | | | 1,009 | | | 28,535 | |
Spectra Energy Corp. | | | 60,437 | | | 970,014 | |
St. Mary Land & Exploration Co. | | | 3,448 | | | 74,684 | |
Sunoco, Inc. | | | 4,530 | | | 137,848 | |
Teekay Shipping Corp. | | | 4,032 | | | 64,673 | |
Tesoro Corp. | | | 9,324 | | | 157,949 | |
Valero Energy Corp. | | | 50,463 | | | 1,128,857 | |
XTO Energy, Inc. | | | 47,065 | | | 2,012,970 | |
| | | | |
|
| |
| | | | | | 65,602,277 | |
| | | | |
|
| |
FINANCIALS 24.0% | | | | | | | |
Capital Markets 4.0% | | | | | | | |
Allied Capital Corp. | | | 17,062 | | | 51,015 | |
American Capital, Ltd. | | | 20,503 | | | 56,383 | |
Ameriprise Financial, Inc. | | | 21,212 | | | 640,602 | |
Bank of New York Mellon Corp. | | | 109,216 | | | 3,034,021 | |
BlackRock, Inc. | | | 451 | | | 71,935 | |
E*TRADE Financial Corp. * | | | 35,825 | | | 51,588 | |
Franklin Resources, Inc. | | | 6,887 | | | 460,396 | |
Goldman Sachs Group, Inc. | | | 42,931 | | | 6,206,535 | |
INVESCO, Ltd. | | | 34,680 | | | 542,742 | |
Investment Technology Group, Inc. * | | | 355 | | | 7,384 | |
Janus Capital Group, Inc. | | | 1,088 | | | 11,032 | |
Jefferies Group, Inc. | | | 12,693 | | | 274,550 | |
Legg Mason, Inc. | | | 13,287 | | | 256,173 | |
MF Global, Ltd. * | | | 5,012 | | | 30,473 | |
Morgan Stanley | | | 94,101 | | | 2,853,142 | |
Northern Trust Corp. | | | 2,232 | | | 128,675 | |
Raymond James Financial, Inc. | | | 9,124 | | | 145,072 | |
See Combined Notes to Financial Statements
SCHEDULE OF INVESTMENTS continued
Market Index Value Fund
May 31, 2009
State Street Corp. | | | 34,701 | | | 1,611,861 | |
| | | | |
|
| |
| | | | | | 16,433,579 | |
| | | | |
|
| |
Commercial Banks 5.6% | | | | | | | |
Associated Banc-Corp. | | | 12,163 | | | 175,999 | |
BancorpSouth, Inc. | | | 7,864 | | | 174,895 | |
Bank of Hawaii Corp. | | | 4,577 | | | 171,317 | |
BB&T Corp. | | | 61,767 | | | 1,384,816 | |
BOK Financial Corp. | | | 2,125 | | | 86,190 | |
City National Corp. | | | 4,074 | | | 148,986 | |
Comerica, Inc. | | | 14,370 | | | 311,542 | |
Commerce Bancshares, Inc. | | | 5,918 | | | 186,239 | |
Cullen/Frost Bankers, Inc. | | | 5,613 | | | 274,756 | |
Fifth Third Bancorp | | | 47,980 | | | 331,062 | |
First Citizens Bancshares, Inc., Class A | | | 577 | | | 76,447 | |
First Horizon National Corp. | | | 20,141 | | | 244,512 | |
Fulton Financial Corp. | | | 16,614 | | | 96,527 | |
Huntington Bancshares, Inc. | | | 41,467 | | | 162,551 | |
KeyCorp | | | 47,001 | | | 235,005 | |
M&T Bank Corp. | | | 6,820 | | | 343,046 | |
Marshall & Ilsley Corp. | | | 24,748 | | | 162,842 | |
PNC Financial Services Group, Inc. | | | 40,643 | | | 1,851,289 | |
Popular, Inc. | | | 26,833 | | | 78,889 | |
Regions Financial Corp. | | | 110,286 | | | 462,098 | |
SunTrust Banks, Inc. | | | 33,736 | | | 444,303 | |
Synovus Financial Corp. | | | 26,822 | | | 87,708 | |
TCF Financial Corp. | | | 12,077 | | | 173,426 | |
U.S. Bancorp | | | 181,188 | | | 3,478,810 | |
Valley National Bancorp | | | 14,121 | | | 171,429 | |
Wells Fargo & Co. ° | | | 454,125 | | | 11,580,187 | |
Whitney Holding Corp. | | | 6,430 | | | 79,732 | |
Wilmington Trust Corp. | | | 6,425 | | | 92,584 | |
Zions Bancorp | | | 11,010 | | | 150,617 | |
| | | | |
|
| |
| | | | | | 23,217,804 | |
| | | | |
|
| |
Consumer Finance 0.5% | | | | | | | |
American Express Co. | | | 15,475 | | | 384,554 | |
AmeriCredit Corp. * | | | 12,547 | | | 159,472 | |
Capital One Financial Corp. | | | 43,126 | | | 1,053,999 | |
Discover Financial Services | | | 45,767 | | | 437,533 | |
SLM Corp. * | | | 5,082 | | | 33,592 | |
Student Loan Corp. | | | 376 | | | 16,713 | |
| | | | |
|
| |
| | | | | | 2,085,863 | |
| | | | |
|
| |
Diversified Financial Services 5.8% | | | | | | | |
Bank of America Corp. | | | 604,526 | | | 6,813,008 | |
CIT Group, Inc. | | | 37,114 | | | 142,147 | |
Citigroup, Inc. | | | 519,827 | | | 1,933,756 | |
CME Group, Inc., Class A | | | 1,889 | | | 607,578 | |
JPMorgan Chase & Co. | | | 353,664 | | | 13,050,202 | |
Leucadia National Corp. * | | | 16,954 | | | 354,000 | |
Liberty Media Corp. – Capital, Ser. A | | | 9,323 | | | 129,496 | |
Moody’s Corp. | | | 18,809 | | | 515,178 | |
NASDAQ OMX Group, Inc. * | | | 5,873 | | | 123,979 | |
See Combined Notes to Financial Statements
SCHEDULE OF INVESTMENTS continued
Market Index Value Fund
May 31, 2009
NYSE Euronext | | | 10,071 | | | 302,130 | |
| | | | |
|
| |
| | | | | | 23,971,474 | |
| | | | |
|
| |
Insurance 5.1% | | | | | | | |
Alleghany Corp. * | | | 496 | | | 128,960 | |
Allied World Assurance Co. Holdings, Ltd. | | | 4,664 | | | 176,066 | |
Allstate Corp. | | | 52,590 | | | 1,353,141 | |
American International Group, Inc. | | | 221,818 | | | 374,872 | |
American National Insurance Co. | | | 1,502 | | | 118,988 | |
AON Corp. | | | 26,513 | | | 954,468 | |
Arch Capital Group, Ltd. * | | | 4,391 | | | 249,892 | |
Arthur J. Gallagher & Co. | | | 9,532 | | | 199,695 | |
Assurant, Inc. | | | 11,289 | | | 266,759 | |
Axis Capital Holdings, Ltd. | | | 9,976 | | | 238,227 | |
Brown & Brown, Inc. | | | 8,416 | | | 162,260 | |
Chubb Corp. | | | 34,898 | | | 1,383,706 | |
Cincinnati Financial Corp. | | | 13,912 | | | 314,550 | |
CNA Financial Corp. | | | 2,620 | | | 38,016 | |
Conseco, Inc. * | | | 17,632 | | | 42,493 | |
Endurance Specialty Holdings, Ltd. | | | 4,728 | | | 129,878 | |
Erie Indemnity Co., Class A | | | 2,808 | | | 97,157 | |
Everest Re Group, Ltd. | | | 5,913 | | | 409,357 | |
Fidelity National Financial, Inc. | | | 22,420 | | | 312,535 | |
First American Corp. | | | 8,833 | | | 201,569 | |
Genworth Financial, Inc., Class A | | | 41,332 | | | 244,685 | |
Hartford Financial Services Group, Inc. | | | 30,050 | | | 430,917 | |
HCC Insurance Holdings, Inc. | | | 11,009 | | | 271,812 | |
Lincoln National Corp. | | | 24,759 | | | 469,183 | |
Loews Corp. | | | 29,975 | | | 810,824 | |
Markel Corp. * | | | 949 | | | 270,465 | |
Marsh & McLennan Cos. | | | 48,847 | | | 924,185 | |
MBIA, Inc. * | | | 15,644 | | | 100,904 | |
Mercury General Corp. | | | 2,540 | | | 84,176 | |
MetLife, Inc. | | | 48,193 | | | 1,518,080 | |
Old Republic International Corp. | | | 22,010 | | | 225,162 | |
OneBeacon Insurance Group, Ltd. | | | 2,308 | | | 25,065 | |
PartnerRe, Ltd. | | | 5,183 | | | 338,243 | |
Principal Financial Group, Inc. | | | 29,664 | | | 658,541 | |
Progressive Corp. * | | | 64,691 | | | 1,043,466 | |
Protective Life Corp. | | | 8,171 | | | 100,994 | |
Prudential Financial, Inc. | | | 34,298 | | | 1,368,833 | |
Reinsurance Group of America, Inc. | | | 6,559 | | | 241,240 | |
RenaissanceRe Holdings, Ltd. | | | 5,847 | | | 267,617 | |
StanCorp Financial Group, Inc. | | | 4,675 | | | 145,019 | |
The Hanover Insurance Group, Inc. | | | 4,907 | | | 168,359 | |
Torchmark Corp. | | | 8,119 | | �� | 326,059 | |
TransAtlantic Holdings, Inc. | | | 1,957 | | | 75,755 | |
Travelers Companies, Inc. | | | 57,739 | | | 2,347,668 | |
Unitrin, Inc. | | | 3,932 | | | 57,093 | |
Universal American Financial Corp. | | | 7,514 | | | 160,950 | |
Unum Group | | | 33,071 | | | 565,845 | |
W.R. Berkley Corp. | | | 12,336 | | | 267,568 | |
Wesco Financial Corp. | | | 128 | | | 38,016 | |
White Mountains Insurance Group, Ltd. | | | 708 | | | 155,760 | |
See Combined Notes to Financial Statements
SCHEDULE OF INVESTMENTS continued
Market Index Value Fund
May 31, 2009
XL Capital, Ltd., Class A | | | 31,587 | | | 319,660 | |
| | | | |
|
| |
| | | | | | 21,174,733 | |
| | | | |
|
| |
Real Estate Investment Trusts (REITs) 2.5% | | | | | | | |
Alexandria Real Estate Equities, Inc. | | | 3,759 | | | 134,948 | |
AMB Property Corp. | | | 13,962 | | | 249,222 | |
Annaly Capital Management, Inc. | | | 51,342 | | | 715,708 | |
Apartment Investment & Management Co., Class A | | | 7,728 | | | 73,030 | |
AvalonBay Communities, Inc. | | | 7,350 | | | 451,878 | |
Boston Properties, Inc. | | | 11,429 | | | 552,249 | |
Brandywine Realty Trust | | | 8,365 | | | 62,319 | |
BRE Properties, Inc. | | | 4,598 | | | 114,858 | |
Camden Property Trust | | | 2,336 | | | 70,127 | |
CapitalSource, Inc. | | | 20,753 | | | 77,824 | |
CBL & Associates Properties, Inc. | | | 6,786 | | | 42,277 | |
Developers Diversified Realty Corp. | | | 13,073 | | | 64,188 | |
Digital Realty Trust, Inc. | | | 2,316 | | | 82,843 | |
Douglas Emmett, Inc. | | | 11,580 | | | 107,694 | |
Duke Realty Corp. | | | 21,369 | | | 203,219 | |
Equity Residential | | | 25,828 | | | 628,654 | |
Essex Property Trust, Inc. | | | 2,005 | | | 136,520 | |
Federal Realty Investment Trust | | | 3,963 | | | 208,652 | |
HCP, Inc. | | | 22,949 | | | 533,105 | |
Health Care REIT, Inc. | | | 9,209 | | | 315,408 | |
Hospitality Properties Trust | | | 8,970 | | | 125,311 | |
Host Hotels & Resorts, Inc. | | | 57,500 | | | 539,350 | |
HRPT Properties Trust | | | 21,526 | | | 102,249 | |
iStar Financial, Inc. | | | 9,512 | | | 29,487 | |
Kilroy Realty Corp. | | | 2,847 | | | 60,613 | |
Kimco Realty Corp. | | | 30,541 | | | 357,024 | |
Liberty Property Trust | | | 10,080 | | | 234,662 | |
Mack-Cali Realty Corp. | | | 7,470 | | | 184,584 | |
Nationwide Health Properties, Inc. | | | 8,869 | | | 235,649 | |
Plum Creek Timber Co., Inc. | | | 11,012 | | | 381,566 | |
ProLogis | | | 42,260 | | | 358,787 | |
Public Storage, Inc. | | | 12,081 | | | 804,715 | |
Rayonier, Inc. | | | 6,568 | | | 262,720 | |
Regency Centers Corp. | | | 7,641 | | | 272,249 | |
SL Green Realty Corp. | | | 5,573 | | | 127,622 | |
UDR, Inc. | | | 14,206 | | | 156,266 | |
Ventas, Inc. | | | 11,666 | | | 354,180 | |
Vornado Realty Trust | | | 14,911 | | | 695,747 | |
Weingarten Realty Investors | | | 10,118 | | | 160,674 | |
| | | | |
|
| |
| | | | | | 10,268,178 | |
| | | | |
|
| |
Real Estate Management & Development 0.1% | | | | | | | |
CB Richard Ellis Group, Inc., Class A * | | | 13,470 | | | 98,331 | |
Jones Lang LaSalle, Inc. | | | 3,294 | | | 115,455 | |
St. Joe Co. * | | | 1,413 | | | 36,088 | |
| | | | |
|
| |
| | | | | | 249,874 | |
| | | | |
|
| |
Thrifts & Mortgage Finance 0.4% | | | | | | | |
Astoria Financial Corp. | | | 8,036 | | | 61,958 | |
Capitol Federal Financial | | | 1,349 | | | 56,779 | |
Fannie Mae | | | 101,625 | | | 74,186 | |
Freddie Mac | | | 5,125 | | | 4,100 | |
See Combined Notes to Financial Statements
SCHEDULE OF INVESTMENTS continued
Market Index Value Fund
May 31, 2009
Hudson City Bancorp, Inc. | | | 32,368 | | | 415,281 | |
MGIC Investment Corp. | | | 11,942 | | | 52,067 | |
New York Community Bancorp, Inc. | | | 32,734 | | | 362,038 | |
People’s United Financial, Inc. | | | 33,035 | | | 521,953 | |
TFS Financial Corp. | | | 8,109 | | | 92,524 | |
Tree.com, Inc. * | | | 549 | | | 5,644 | |
Washington Federal, Inc. | | | 8,382 | | | 109,972 | |
Webster Financial Corp. | | | 5,012 | | | 37,390 | |
| | | | |
|
| |
| | | | | | 1,793,892 | |
| | | | |
|
| |
HEALTH CARE 13.0% | | | | | | | |
Biotechnology 1.2% | | | | | | | |
Amgen, Inc. * | | | 97,567 | | | 4,872,496 | |
| | | | |
|
| |
Health Care Equipment & Supplies 1.0% | | | | | | | |
Beckman Coulter, Inc. | | | 1,246 | | | 67,533 | |
Boston Scientific Corp. * | | | 133,582 | | | 1,255,671 | |
Cooper Cos. | | | 4,296 | | | 113,887 | |
Covidien, Ltd. | | | 47,701 | | | 1,703,879 | |
Hill-Rom Holdings, Inc. | | | 5,144 | | | 83,127 | |
Hologic, Inc. * | | | 12,215 | | | 154,764 | |
Hospira, Inc. * | | | 13,004 | | | 448,638 | |
Inverness Medical Innovations, Inc. * | | | 3,660 | | | 119,060 | |
Zimmer Holdings, Inc. * | | | 6,736 | | | 300,089 | |
| | | | |
|
| |
| | | | | | 4,246,648 | |
| | | | |
|
| |
Health Care Providers & Services 1.9% | | | | | | | |
Aetna, Inc. | | | 15,459 | | | 413,992 | |
AmerisourceBergen Corp. | | | 12,766 | | | 473,619 | |
Brookdale Senior Living, Inc. | | | 3,436 | | | 39,823 | |
Cardinal Health, Inc. | | | 8,587 | | | 306,985 | |
CIGNA Corp. | | | 23,086 | | | 511,817 | |
Community Health Systems, Inc. * | | | 7,121 | | | 187,923 | |
Coventry Health Care, Inc. * | | | 11,527 | | | 208,062 | |
DaVita, Inc. * | | | 1,679 | | | 75,740 | |
Health Management Associates, Inc., Class A * | | | 7,851 | | | 45,614 | |
Health Net, Inc. * | | | 9,692 | | | 145,186 | |
Henry Schein, Inc. * | | | 621 | | | 28,280 | |
Humana, Inc. * | | | 6,980 | | | 218,683 | |
Lifepoint Hospitals, Inc. * | | | 5,176 | | | 141,046 | |
Lincare Holdings, Inc. * | | | 584 | | | 12,720 | |
McKesson Corp. | | | 7,466 | | | 307,226 | |
Mednax, Inc. * | | | 653 | | | 26,446 | |
Omnicare, Inc. | | | 9,432 | | | 254,947 | |
Quest Diagnostics, Inc. | | | 2,704 | | | 141,203 | |
Tenet Healthcare Corp. * | | | 19,855 | | | 72,074 | |
UnitedHealth Group, Inc. | | | 74,030 | | | 1,969,198 | |
Universal Health Services, Inc., Class B | | | 4,507 | | | 247,570 | |
WellPoint, Inc. * | | | 42,972 | | | 2,001,206 | |
| | | | |
|
| |
| | | | | | 7,829,360 | |
| | | | |
|
| |
Health Care Technology 0.1% | | | | | | | |
HLTH Corp. * | | | 6,896 | | | 81,304 | |
IMS Health, Inc. | | | 13,540 | | | 163,022 | |
| | | | |
|
| |
| | | | | | 244,326 | |
| | | | |
|
| |
See Combined Notes to Financial Statements
SCHEDULE OF INVESTMENTS continued
Market Index Value Fund
May 31, 2009
Life Sciences Tools & Services 0.3% | | | | | | | |
Charles River Laboratories International, Inc. * | | | 3,552 | | | 111,639 | |
Life Technologies Corp. * | | | 6,171 | | | 239,312 | |
PerkinElmer, Inc. | | | 6,251 | | | 101,704 | |
Thermo Fisher Scientific, Inc. * | | | 26,355 | | | 1,025,473 | |
| | | | |
|
| |
| | | | | | 1,478,128 | |
| | | | |
|
| |
Pharmaceuticals 8.5% | | | | | | | |
Bristol-Myers Squibb Co. | | | 16,445 | | | 327,584 | |
Eli Lilly & Co. | | | 86,361 | | | 2,985,500 | |
Endo Pharmaceuticals Holdings, Inc. * | | | 1,068 | | | 17,013 | |
Forest Laboratories, Inc. * | | | 26,568 | | | 629,396 | |
Johnson & Johnson | | | 198,320 | | | 10,939,331 | |
King Pharmaceuticals, Inc. * | | | 23,548 | | | 222,764 | |
Merck & Co., Inc. | | | 146,340 | | | 4,036,057 | |
Mylan Laboratories, Inc. * | | | 23,721 | | | 313,355 | |
Pfizer, Inc. | | | 645,965 | | | 9,812,208 | |
Watson Pharmaceuticals, Inc. * | | | 5,046 | | | 152,642 | |
Wyeth | | | 127,312 | | | 5,711,216 | |
| | | | |
|
| |
| | | | | | 35,147,066 | |
| | | | |
|
| |
INDUSTRIALS 8.2% | | | | | | | |
Aerospace & Defense 1.7% | | | | | | | |
Alliant Techsystems, Inc. * | | | 1,779 | | | 153,510 | |
BE Aerospace, Inc. * | | | 662 | | | 9,851 | |
General Dynamics Corp. | | | 38,049 | | | 2,164,988 | |
L-3 Communications Holdings, Inc. | | | 2,635 | | | 193,699 | |
Northrop Grumman Corp. | | | 23,010 | | | 1,095,736 | |
Raytheon Co. | | | 24,336 | | | 1,086,603 | |
Spirit AeroSystems Holdings, Inc., Class A * | | | 9,995 | | | 137,431 | |
United Technologies Corp. | | | 39,958 | | | 2,102,190 | |
| | | | |
|
| |
| | | | | | 6,944,008 | |
| | | | |
|
| |
Air Freight & Logistics 0.4% | | | | | | | |
FedEx Corp. | | | 29,606 | | | 1,641,061 | |
UTi Worldwide, Inc. | | | 912 | | | 11,956 | |
| | | | |
|
| |
| | | | | | 1,653,017 | |
| | | | |
|
| |
Airlines 0.2% | | | | | | | |
AMR Corp. * | | | 13,228 | | | 58,865 | |
Continental Airlines, Inc., Class B * | | | 11,795 | | | 109,929 | |
Copa Holdings SA, Class A | | | 761 | | | 26,498 | |
Delta Air Lines, Inc. * | | | 55,480 | | | 322,339 | |
Southwest Airlines Co. | | | 69,871 | | | 470,930 | |
| | | | |
|
| |
| | | | | | 988,561 | |
| | | | |
|
| |
Building Products 0.1% | | | | | | | |
Armstrong World Industries, Inc. | | | 1,926 | | | 34,437 | |
Masco Corp. | | | 34,536 | | | 357,793 | |
Owens Corning, Inc. * | | | 7,281 | | | 101,424 | |
USG Corp. * | | | 2,884 | | | 34,608 | |
| | | | |
|
| |
| | | | | | 528,262 | |
| | | | |
|
| |
Commercial Services & Supplies 0.6% | | | | | | | |
Avery Dennison Corp. | | | 10,765 | | | 296,683 | |
See Combined Notes to Financial Statements
SCHEDULE OF INVESTMENTS continued
Market Index Value Fund
May 31, 2009
Cintas Corp. | | | 12,576 | | | 292,895 | |
Corrections Corporation of America * | | | 1,253 | | | 19,234 | |
Pitney Bowes, Inc. | | | 1,903 | | | 43,541 | |
R.R. Donnelley & Sons Co. | | | 20,271 | | | 273,253 | |
Republic Services, Inc. | | | 17,435 | | | 397,344 | |
Steelcase, Inc., Class A | | | 5,921 | | | 28,598 | |
Waste Management, Inc. | | | 33,546 | | | 925,534 | |
| | | | |
|
| |
| | | | | | 2,277,082 | |
| | | | |
|
| |
Construction & Engineering 0.1% | | | | | | | |
AECOM Technology Corp. * | | | 1,092 | | | 34,846 | |
KBR, Inc. | | | 2,903 | | | 53,473 | |
Quanta Services, Inc. * | | | 4,166 | | | 95,026 | |
URS Corp. * | | | 6,609 | | | 317,761 | |
| | | | |
|
| |
| | | | | | 501,106 | |
| | | | |
|
| |
Electrical Equipment 0.1% | | | | | | | |
Cooper Industries, Inc. | | | 3,971 | | | 130,328 | |
Hubbell, Inc., Class B | | | 3,016 | | | 100,162 | |
Thomas & Betts Corp. * | | | 5,090 | | | 156,161 | |
| | | | |
|
| |
| | | | | | 386,651 | |
| | | | |
|
| |
Industrial Conglomerates 3.4% | | | | | | | |
Carlisle Cos. | | | 5,191 | | | 118,718 | |
General Electric Co. | | | 1,004,695 | | | 13,543,288 | |
Teleflex, Inc. | | | 3,781 | | | 169,578 | |
| | | | |
|
| |
| | | | | | 13,831,584 | |
| | | | |
|
| |
Machinery 1.0% | | | | | | | |
AGCO Corp. * | | | 2,400 | | | 69,264 | |
Crane Co. | | | 4,841 | | | 114,151 | |
Danaher Corp. | | | 7,300 | | | 440,555 | |
Dover Corp. | | | 2,260 | | | 71,054 | |
Eaton Corp. | | | 8,613 | | | 374,665 | |
Flowserve Corp. | | | 3,009 | | | 221,372 | |
Gardner Denver, Inc. * | | | 5,012 | | | 142,040 | |
IDEX Corp. | | | 872 | | | 20,361 | |
Illinois Tool Works, Inc. | | | 42,492 | | | 1,372,067 | |
Ingersoll-Rand Co., Ltd., Class A | | | 24,682 | | | 499,317 | |
ITT Corp. | | | 4,198 | | | 172,874 | |
Kennametal, Inc. | | | 5,787 | | | 109,258 | |
Lincoln Electric Holdings, Inc. | | | 1,297 | | | 52,918 | |
Oshkosh Corp. | | | 2,156 | | | 25,592 | |
Pentair, Inc. | | | 9,461 | | | 236,809 | |
Terex Corp. * | | | 9,061 | | | 121,599 | |
Timken Co. | | | 7,484 | | | 126,554 | |
Trinity Industries, Inc. | | | 7,729 | | | 117,790 | |
| | | | |
|
| |
| | | | | | 4,288,240 | |
| | | | |
|
| |
Marine 0.0% | | | | | | | |
Alexander & Baldwin, Inc. | | | 3,944 | | | 97,614 | |
| | | | |
|
| |
Professional Services 0.2% | | | | | | | |
Dun & Bradstreet Corp. | | | 1,556 | | | 127,265 | |
Equifax, Inc. | | | 5,775 | | | 157,196 | |
See Combined Notes to Financial Statements
SCHEDULE OF INVESTMENTS continued
Market Index Value Fund
May 31, 2009
Manpower, Inc. | | | 7,002 | | | 297,655 | |
| | | | |
|
| |
| | | | | | 582,116 | |
| | | | |
|
| |
Road & Rail 0.4% | | | | | | | |
Avis Budget Group, Inc. * | | | 9,653 | | | 46,334 | |
Con-Way, Inc. | | | 3,640 | | | 116,844 | |
Hertz Global Holdings, Inc. * | | | 36,269 | | | 248,443 | |
Kansas City Southern * | | | 1,571 | | | 25,906 | |
Norfolk Southern Corp. | | | 25,510 | | | 948,972 | |
Ryder System, Inc. | | | 3,684 | | | 103,815 | |
| | | | |
|
| |
| | | | | | 1,490,314 | |
| | | | |
|
| |
Trading Companies & Distributors 0.0% | | | | | | | |
GATX Corp. | | | 4,125 | | | 103,867 | |
United Rentals, Inc. * | | | 5,662 | | | 26,895 | |
Wesco International, Inc. * | | | 1,074 | | | 28,708 | |
| | | | |
|
| |
| | | | | | 159,470 | |
| | | | |
|
| |
INFORMATION TECHNOLOGY 3.3% | | | | | | | |
Communications Equipment 0.5% | | | | | | | |
ADC Telecommunications, Inc. * | | | 9,211 | | | 64,846 | |
Brocade Communications Systems, Inc. * | | | 30,847 | | | 226,417 | |
EchoStar Corp. * | | | 3,714 | | | 59,535 | |
JDS Uniphase Corp. * | | | 9,271 | | | 49,971 | |
Motorola, Inc. | | | 215,337 | | | 1,304,942 | |
Tellabs, Inc. * | | | 37,947 | | | 210,606 | |
| | | | |
|
| |
| | | | | | 1,916,317 | |
| | | | |
|
| |
Computers & Peripherals 0.6% | | | | | | | |
Diebold, Inc. | | | 1,030 | | | 25,462 | |
EMC Corp. * | | | 59,611 | | | 700,429 | |
Lexmark International, Inc., Class A * | | | 7,486 | | | 122,321 | |
NCR Corp. * | | | 1,492 | | | 16,024 | |
QLogic Corp. * | | | 11,576 | | | 158,012 | |
SanDisk Corp. * | | | 17,232 | | | 269,853 | |
Seagate Technology, Inc. | | | 23,880 | | | 207,995 | |
Sun Microsystems, Inc. * | | | 70,523 | | | 634,707 | |
Teradata Corp. * | | | 8,751 | | | 189,022 | |
| | | | |
|
| |
| | | | | | 2,323,825 | |
| | | | |
|
| |
Electronic Equipment, Instruments & Components 0.5% | | | | | | | |
Arrow Electronics, Inc. * | | | 10,920 | | | 264,155 | |
Avnet, Inc. * | | | 8,070 | | | 185,691 | |
AVX Corp. | | | 4,329 | | | 40,173 | |
Ingram Micro, Inc., Class A * | | | 16,053 | | | 265,195 | |
Jabil Circuit, Inc. | | | 10,346 | | | 81,009 | |
Molex, Inc. | | | 9,274 | | | 141,707 | |
Tech Data Corp. * | | | 4,098 | | | 131,218 | |
Tyco Electronics, Ltd. | | | 45,643 | | | 792,819 | |
Vishay Intertechnology, Inc. * | | | 17,793 | | | 98,395 | |
| | | | |
|
| |
| | | | | | 2,000,362 | |
| | | | |
|
| |
Internet Software & Services 0.0% | | | | | | | |
IAC/InterActiveCorp. | | | 8,296 | | | 134,063 | |
| | | | |
|
| |
See Combined Notes to Financial Statements
SCHEDULE OF INVESTMENTS continued
Market Index Value Fund
May 31, 2009
IT Services 0.4% | | | | | | | |
Affiliated Computer Services, Inc., Class A * | | | 6,195 | | | 278,403 | |
Computer Sciences Corp. * | | | 14,431 | | | 612,740 | |
Convergys Corp. * | | | 11,798 | | | 109,132 | |
DST Systems, Inc. * | | | 725 | | | 27,768 | |
Fidelity National Information Services, Inc. | | | 14,401 | | | 277,363 | |
Genpact, Ltd. * | | | 309 | | | 3,232 | |
Lender Processing Services, Inc. | | | 7,201 | | | 209,189 | |
SAIC, Inc. * | | | 16,105 | | | 281,354 | |
Unisys Corp. * | | | 15,273 | | | 21,230 | |
| | | | |
|
| |
| | | | | | 1,820,411 | |
| | | | |
|
| |
Office Electronics 0.1% | | | | | | | |
Xerox Corp. | | | 85,852 | | | 583,793 | |
Zebra Technologies Corp., Class A * | | | 383 | | | 8,361 | |
| | | | |
|
| |
| | | | | | 592,154 | |
| | | | |
|
| |
Semiconductors & Semiconductor Equipment 0.6% | | | | | | | |
Advanced Micro Devices, Inc. * | | | 55,727 | | | 253,000 | |
Atmel Corp. * | | | 15,400 | | | 59,290 | |
Cree, Inc. * | | | 5,026 | | | 152,941 | |
Fairchild Semiconductor International, Inc. * | | | 11,895 | | | 83,979 | |
Integrated Device Technology, Inc. * | | | 8,995 | | | 50,642 | |
Intel Corp. | | | 74,382 | | | 1,169,285 | |
International Rectifier Corp. * | | | 5,401 | | | 78,152 | |
Intersil Corp., Class A | | | 7,788 | | | 95,403 | |
KLA-Tencor Corp. | | | 1,039 | | | 28,053 | |
Lam Research Corp. * | | | 1,014 | | | 26,557 | |
LSI Corp. * | | | 14,729 | | | 65,839 | |
Micron Technology, Inc. * | | | 70,746 | | | 357,975 | |
Novellus Systems, Inc. * | | | 6,665 | | | 119,503 | |
Teradyne, Inc. * | | | 6,111 | | | 43,694 | |
| | | | |
|
| |
| | | | | | 2,584,313 | |
| | | | |
|
| |
Software 0.6% | | | | | | | |
Amdocs, Ltd. * | | | 10,825 | | | 234,253 | |
CA, Inc. | | | 19,766 | | | 344,917 | |
Cadence Design Systems, Inc. * | | | 24,621 | | | 139,109 | |
Compuware Corp. * | | | 9,720 | | | 74,163 | |
McAfee, Inc. * | | | 1,473 | | | 57,786 | |
Novell, Inc. * | | | 18,492 | | | 76,927 | |
Symantec Corp. * | | | 80,218 | | | 1,250,598 | |
Synopsys, Inc. * | | | 13,535 | | | 263,662 | |
| | | | |
|
| |
| | | | | | 2,441,415 | |
| | | | |
|
| |
MATERIALS 3.7% | | | | | | | |
Chemicals 1.7% | | | | | | | |
Ashland, Inc. | | | 6,452 | | | 172,914 | |
Cabot Corp. | | | 6,154 | | | 98,279 | |
Celanese Corp., Ser. A | | | 1,780 | | | 36,508 | |
Cytec Industries, Inc. | | | 4,548 | | | 97,691 | |
Dow Chemical Co. | | | 106,236 | | | 1,878,253 | |
E.I. DuPont de Nemours & Co. | | | 86,003 | | | 2,448,505 | |
Eastman Chemical Co. | | | 7,279 | | | 301,642 | |
FMC Corp. | | | 4,380 | | | 238,053 | |
See Combined Notes to Financial Statements
SCHEDULE OF INVESTMENTS continued
Market Index Value Fund
May 31, 2009
Huntsman Corp. | | | 13,819 | | | 87,336 | |
Intrepid Potash, Inc. * | | | 1,352 | | | 44,075 | |
Lubrizol Corp. | | | 6,505 | | | 290,578 | |
Nalco Holding Co. | | | 985 | | | 17,100 | |
PPG Industries, Inc. | | | 13,945 | | | 620,134 | |
RPM International, Inc. | | | 12,327 | | | 188,850 | |
Scotts Miracle-Gro Co., Class A | | | 875 | | | 30,013 | |
Sigma-Aldrich Corp. | | | 5,514 | | | 267,208 | |
Valhi, Inc. | | | 348 | | | 3,772 | |
Valspar Corp. | | | 9,566 | | | 218,583 | |
| | | | |
|
| |
| | | | | | 7,039,494 | |
| | | | |
|
| |
Construction Materials 0.1% | | | | | | | |
Eagle Materials, Inc. | | | 452 | | | 11,119 | |
Martin Marietta Materials, Inc. | | | 315 | | | 25,663 | |
Vulcan Materials Co. | | | 10,450 | | | 462,831 | |
| | | | |
|
| |
| | | | | | 499,613 | |
| | | | |
|
| |
Containers & Packaging 0.5% | | | | | | | |
AptarGroup, Inc. | | | 5,286 | | | 163,919 | |
Ball Corp. | | | 7,936 | | | 315,853 | |
Bemis Co., Inc. | | | 9,515 | | | 238,731 | |
Owens-Illinois, Inc. * | | | 11,367 | | | 325,437 | |
Packaging Corporation of America | | | 7,603 | | | 122,560 | |
Pactiv Corp. * | | | 12,488 | | | 279,731 | |
Sealed Air Corp. | | | 15,291 | | | 305,973 | |
Sonoco Products Co. | | | 9,501 | | | 231,444 | |
Temple-Inland, Inc. | | | 10,143 | | | 129,628 | |
| | | | |
|
| |
| | | | | | 2,113,276 | |
| | | | |
|
| |
Metals & Mining 1.0% | | | | | | | |
Alcoa, Inc. | | | 20,714 | | | 190,983 | |
Carpenter Technology Corp. | | | 3,958 | | | 88,976 | |
Century Aluminum Co. * | | | 2,531 | | | 15,211 | |
Commercial Metals Co. | | | 10,896 | | | 184,905 | |
Freeport-McMoRan Copper & Gold, Inc. | | | 39,265 | | | 2,137,194 | |
Nucor Corp. | | | 23,763 | | | 1,043,433 | |
Reliance Steel & Aluminum Co. | | | 5,987 | | | 227,446 | |
Schnitzer Steel Industries, Inc., Class A | | | 1,794 | | | 97,845 | |
Steel Dynamics, Inc. | | | 11,289 | | | 168,658 | |
Titanium Metals Corp. | | | 6,671 | | | 61,774 | |
United States Steel Corp. | | | 725 | | | 24,708 | |
| | | | |
|
| |
| | | | | | 4,241,133 | |
| | | | |
|
| |
Paper & Forest Products 0.4% | | | | | | | |
Domtar Corp. * | | | 46,875 | | | 53,438 | |
International Paper Co. | | | 40,831 | | | 586,741 | |
MeadWestvaco Corp. | | | 16,588 | | | 264,910 | |
Weyerhaeuser Co. | | | 20,171 | | | 677,342 | |
| | | | |
|
| |
| | | | | | 1,582,431 | |
| | | | |
|
| |
TELECOMMUNICATION SERVICES 6.2% | | | | | | | |
Diversified Telecommunication Services 5.6% | | | | | | | |
AT&T, Inc. | | | 567,267 | | | 14,062,549 | |
CenturyTel, Inc. | | | 9,562 | | | 294,988 | |
Embarq Corp. | | | 7,002 | | | 294,224 | |
See Combined Notes to Financial Statements
SCHEDULE OF INVESTMENTS continued
Market Index Value Fund
May 31, 2009
Frontier Communications Corp. | | | 24,087 | | | 175,353 | |
Qwest Communications International, Inc. | | | 72,237 | | | 314,953 | |
Verizon Communications, Inc. | | | 272,188 | | | 7,964,221 | |
Windstream Corp. | | | 21,439 | | | 180,302 | |
| | | | |
|
| |
| | | | | | 23,286,590 | |
| | | | |
|
| |
Wireless Telecommunication Services 0.6% | | | | | | | |
Clearwire Corp. * | | | 686 | | | 3,053 | |
Crown Castle International Corp. * | | | 21,385 | | | 518,800 | |
Leap Wireless International, Inc. * | | | 4,584 | | | 171,854 | |
Sprint Nextel Corp. * | | | 265,146 | | | 1,365,502 | |
Telephone & Data Systems, Inc. | | | 5,709 | | | 173,040 | |
U.S. Cellular Corp. * | | | 934 | | | 38,789 | |
| | | | |
|
| |
| | | | | | 2,271,038 | |
| | | | |
|
| |
UTILITIES 6.4% | | | | | | | |
Electric Utilities 3.7% | | | | | | | |
American Electric Power Co., Inc. | | | 45,446 | | | 1,197,048 | |
CMS Energy Corp. | | | 21,511 | | | 243,935 | |
Consolidated Edison, Inc. | | | 26,032 | | | 923,095 | |
DPL, Inc. | | | 10,013 | | | 217,883 | |
Duke Energy Corp. | | | 120,750 | | | 1,708,612 | |
Edison International | | | 31,110 | | | 909,656 | |
Entergy Corp. | | | 5,339 | | | 398,396 | |
Exelon Corp. | | | 31,319 | | | 1,503,625 | |
FirstEnergy Corp. | | | 29,107 | | | 1,099,953 | |
FPL Group, Inc. | | | 38,969 | | | 2,202,918 | |
Great Plains Energy, Inc. | | | 12,895 | | | 194,328 | |
Hawaiian Electric Industries, Inc. | | | 8,610 | | | 148,522 | |
Mirant Corp. * | | | 4,954 | | | 77,332 | |
Northeast Utilities | | | 16,711 | | | 347,422 | |
NRG Energy, Inc. * | | | 15,780 | | | 355,050 | |
NV Energy, Inc. | | | 16,441 | | | 164,410 | |
Pepco Holdings, Inc. | | | 20,922 | | | 271,567 | |
Pinnacle West Capital Corp. | | | 9,609 | | | 265,689 | |
Progress Energy, Inc. | | | 26,586 | | | 944,069 | |
Southern Co. | | | 73,256 | | | 2,081,203 | |
| | | | |
|
| |
| | | | | | 15,254,713 | |
| | | | |
|
| |
Gas Utilities 0.4% | | | | | | | |
AGL Resources, Inc. | | | 7,307 | | | 211,318 | |
Atmos Energy Corp. | | | 8,612 | | | 206,688 | |
Energen Corp. | | | 5,552 | | | 206,645 | |
National Fuel Gas Co. | | | 7,757 | | | 260,092 | |
ONEOK, Inc. | | | 9,957 | | | 291,740 | |
Questar Corp. | | | 10,275 | | | 348,220 | |
Southern Union Co. | | | 10,644 | | | 184,993 | |
UGI Corp. | | | 10,209 | | | 246,139 | |
| | | | |
|
| |
| | | | | | 1,955,835 | |
| | | | |
|
| |
Independent Power Producers & Energy Traders 0.1% | | | | | | | |
Constellation Energy Group, Inc. | | | 1,616 | | | 44,084 | |
Dynegy, Inc., Class A * | | | 47,280 | | | 95,033 | |
RRI Energy, Inc. * | | | 33,041 | | | 181,065 | |
| | | | |
|
| |
| | | | | | 320,182 | |
| | | | |
|
| |
See Combined Notes to Financial Statements
SCHEDULE OF INVESTMENTS continued
Market Index Value Fund
May 31, 2009
Multi-Utilities 2.1% | | | | | | | |
Alliant Energy Corp. | | | 10,545 | | | 250,233 | |
Ameren Corp. | | | 20,001 | | | 465,223 | |
CenterPoint Energy, Inc. | | | 12,188 | | | 123,343 | |
Dominion Resources, Inc. | | | 55,189 | | | 1,754,458 | |
DTE Energy Co. | | | 15,578 | | | 471,234 | |
Integrys Energy Group, Inc. | | | 7,297 | | | 197,676 | |
MDU Resources Group, Inc. | | | 17,461 | | | 322,330 | |
NiSource, Inc. | | | 26,182 | | | 279,886 | |
NSTAR | | | 10,198 | | | 306,654 | |
OGE Energy Corp. | | | 8,782 | | | 226,751 | |
PG&E Corp. | | | 34,112 | | | 1,252,252 | |
SCANA Corp. | | | 11,140 | | | 334,423 | |
Sempra Energy | | | 23,904 | | | 1,091,935 | |
TECO Energy, Inc. | | | 20,124 | | | 225,791 | |
Vectren Corp. | | | 7,732 | | | 175,903 | |
Wisconsin Energy Corp. | | | 11,165 | | | 440,571 | |
Xcel Energy, Inc. | | | 43,370 | | | 743,795 | |
| | | | |
|
| |
| | | | | | 8,662,458 | |
| | | | |
|
| |
Water Utilities 0.1% | | | | | | | |
American Water Works Co., Inc. | | | 6,035 | | | 104,285 | |
Aqua America, Inc. | | | 12,759 | | | 210,396 | |
| | | | |
|
| |
| | | | | | 314,681 | |
| | | | |
|
| |
Total Common Stocks (cost $570,777,678) | | | | | | 410,731,564 | |
| | | | |
|
| |
RIGHTS 0.0% | | | | | | | |
HEALTH CARE 0.0% | | | | | | | |
Pharmaceuticals 0.0% | | | | | | | |
Fresenius Kabi Pharmaceuticals Holding, Inc. * (cost $244) | | | 263 | | | 79 | |
| | | | |
|
| |
EXCHANGE TRADED FUND 0.3% | | | | | | | |
iShares Russell 1000 Value Index Fund (cost $1,032,404) | | | 26,612 | | | 1,278,174 | |
| | | | |
|
| |
SHORT-TERM INVESTMENTS 0.1% | | | | | | | |
| | | | | | | |
| | | Principal
Amount | | | Value | |
|
|
|
|
|
|
| |
U.S. TREASURY OBLIGATIONS 0.0% | | | | | | | |
U.S. Treasury Bills, 0.16%, 08/27/2009 ß ƒ | | $ | 200,000 | | | 199,940 | |
| | | | |
|
| |
| | | | | | | |
| | | Shares | | | Value | |
|
|
|
|
|
|
| |
MUTUAL FUND SHARES 0.1% | | | | | | | |
Evergreen Institutional Money Market Fund, Class I, 0.35% q ø | | | 440,922 | | | 440,922 | |
| | | | |
|
| |
Total Short-Term Investments (cost $640,845) | | | | | | 640,862 | |
| | | | |
|
| |
Total Investments (cost $572,451,171) 99.7% | | | | | | 412,650,679 | |
Other Assets and Liabilities 0.3% | | | | | | 1,064,736 | |
| | | | |
|
| |
Net Assets 100.0% | | | | | $ | 413,715,415 | |
| | | | |
|
| |
* | Non-income producing security |
See Combined Notes to Financial Statements
SCHEDULE OF INVESTMENTS continued
Market Index Value Fund
May 31, 2009
° | Investment in non-controlled affiliate. At May 31, 2009, the Fund invested in securities issued by Wachovia Corp. and/or Wells Fargo & Co. with a cost basis of $19,145,997 and earned $279,074 of income for the year ended May 31, 2009, which is included in income from affiliated issuers. |
ƒ | All or a portion of this security was pledged to cover initial margin requirements for open futures contracts. |
ß | Rate shown represents the yield to maturity at date of purchase. |
ø | Evergreen Investment Management Company, LLC is the investment advisor to both the Fund and the money market fund. |
q | Rate shown is the 7-day annualized yield at period end. |
The following table shows the percent of total long-term investments by sector as of May 31, 2009:
Financials | | 24.0 | % |
Energy | | 16.5 | % |
Health Care | | 13.1 | % |
Consumer Staples | | 9.2 | % |
Consumer Discretionary | | 8.9 | % |
Industrials | | 8.2 | % |
Utilities | | 6.4 | % |
Telecommunication Services | | 6.2 | % |
Materials | | 3.8 | % |
Information Technology | | 3.4 | % |
Other | | 0.3 | % |
| |
| |
| | 100.0 | % |
| |
| |
See Combined Notes to Financial Statements
Market Index Value Fund
STATEMENT OF ASSETS AND LIABILITIES
May 31, 2009
Assets | | | | |
Investments in unaffiliated issuers, at value (cost $552,864,252) | | $ | 400,629,570 | |
Investments in affiliated issuers, at value (cost $19,586,919) | | | 12,021,109 | |
|
|
|
| |
Total investments | | | 412,650,679 | |
Receivable for securities sold | | | 3,368,154 | |
Dividends receivable | | | 1,233,214 | |
Receivable for daily variation margin on open futures contracts | | | 24,700 | |
Receivable from investment advisor | | | 3,866 | |
|
|
|
| |
Total assets | | | 417,280,613 | |
|
|
|
| |
Liabilities | | | | |
Payable for securities purchased | | | 3,507,160 | |
Due to related parties | | | 3,687 | |
Accrued expenses and other liabilities | | | 54,351 | |
|
|
|
| |
Total liabilities | | | 3,565,198 | |
|
|
|
| |
Net assets | | $ | 413,715,415 | |
|
|
|
| |
Net assets represented by | | | | |
Paid-in capital | | $ | 555,887,730 | |
Undistributed net investment income | | | 15,911,362 | |
Accumulated net realized gains on investments | | | 1,251,105 | |
Net unrealized losses on investments | | | (159,334,782 | ) |
|
|
|
| |
Total net assets | | $ | 413,715,415 | |
|
|
|
| |
Shares outstanding (unlimited number of shares authorized) | | | | |
Class I | | | 56,881,356 | |
|
|
|
| |
Net asset value per share | | | | |
Class I | | $ | 7.27 | |
|
|
|
| |
See Combined Notes to Financial Statements
Market Index Value Fund
STATEMENT OF OPERATIONS
Year Ended May 31, 2009
Investment income | | | | |
Dividends (net of foreign withholding taxes of $781) | | $ | 15,511,683 | |
Securities lending | | | 660,497 | |
Income from affiliated issuers | | | 289,365 | |
Interest | | | 1,205 | |
|
|
|
| |
Total investment income | | | 16,462,750 | |
|
|
|
| |
Expenses | | | | |
Advisory fee | | | 1,468,286 | |
Administrative services fee | | | 458,839 | |
Transfer agent fees | | | 218 | |
Trustees’ fees and expenses | | | 6,133 | |
Printing and postage expenses | | | 12,650 | |
Custodian and accounting fees | | | 104,882 | |
Professional fees | | | 42,543 | |
Interest expense | | | 470 | |
Other | | | 13,905 | |
|
|
|
| |
Total expenses | | | 2,107,926 | |
Less: Expense reductions | | | (1,331 | ) |
Fee waivers and expense reimbursements | | | (1,993,710 | ) |
|
|
|
| |
Net expenses | | | 112,885 | |
|
|
|
| |
Net investment income | | | 16,349,865 | |
|
|
|
| |
Net realized and unrealized gains or losses on investments | | | | |
Net realized gains or losses on: | | | | |
Securities | | | | |
Unaffiliated issuers | | | 4,066,446 | |
Affiliated issuers | | | (270,023 | ) |
Futures contracts | | | (881,621 | ) |
|
|
|
| |
Net realized gains on investments | | | 2,914,802 | |
|
|
|
| |
Net change in unrealized gains or losses on: | | | | |
Securities | | | | |
Unaffiliated issuers | | | (242,894,243 | ) |
Affiliated issuers | | | (4,105,279 | ) |
Futures contracts | | | 392,412 | |
|
|
|
| |
Net change in unrealized gains or losses on investments | | | (246,607,110 | ) |
|
|
|
| |
Net realized and unrealized gains or losses on investments | | | (243,692,308 | ) |
|
|
|
| |
Net decrease in net assets resulting from operations | | $ | (227,342,443 | ) |
|
|
|
| |
See Combined Notes to Financial Statements
Market Index Value Fund
STATEMENTS OF CHANGES IN NET ASSETS
| | Year Ended May 31, | |
| |
| |
| | 2009 | | 2008 | |
|
|
|
|
|
|
|
|
|
|
| |
Operations | | | | | | | | | | | |
Net investment income | | | | $ | 16,349,865 | | | | $ | 19,888,249 | |
Net realized gains on investments | | | | | 2,914,802 | | | | | 35,627,773 | |
Net change in unrealized gains or losses on investments | | | | | (246,607,110 | ) | | | | (159,115,269 | ) |
|
|
|
|
|
|
|
|
|
|
| |
Net decrease in net assets resulting from operations | | | | | (227,342,443 | ) | | | | (103,599,247 | ) |
|
|
|
|
|
|
|
|
|
|
| |
Distributions to shareholders from | | | | | | | | | | | |
Net investment income | | | | | (19,240,231 | ) | | | | (16,404,231 | ) |
Net realized gains | | | | | (38,055,688 | ) | | | | (26,889,734 | ) |
|
|
|
|
|
|
|
|
|
|
| |
Total distributions to shareholders | | | | | (57,295,919 | ) | | | | (43,293,965 | ) |
|
|
|
|
|
|
|
|
|
|
| |
| | Shares | | | | | Shares | | | | |
|
|
|
|
|
|
|
|
|
|
| |
Capital share transactions | | | | | | | | | | | |
Net asset value of shares issued in reinvestment of distributions | | 7,694,736 | | | 57,295,919 | | 3,138,747 | | | 43,293,965 | |
Payment for shares redeemed | | (1,325,088 | ) | | (15,000,000 | ) | (6,213,595 | ) | | (80,000,000 | ) |
|
|
|
|
|
|
|
|
|
|
| |
Net increase (decrease) in net assets resulting from capital share transactions | | | | | 42,295,919 | | | | | (36,706,035 | ) |
|
|
|
|
|
|
|
|
|
|
| |
Total decrease in net assets | | | | | (242,342,443 | ) | | | | (183,599,247 | ) |
Net assets | | | | | | | | | | | |
Beginning of period | | | | | 656,057,858 | | | | | 839,657,105 | |
|
|
|
|
|
|
|
|
|
|
| |
End of period | | | | $ | 413,715,415 | | | | $ | 656,057,858 | |
|
|
|
|
|
|
|
|
|
|
| |
Undistributed net investment income | | | | $ | 15,911,362 | | | | $ | 19,213,128 | |
|
|
|
|
|
|
|
|
|
|
| |
See Combined Notes to Financial Statements
COMBINED NOTES TO FINANCIAL STATEMENTS
1. ORGANIZATION
Evergreen Market Index Fund (“Market Index Fund”), Evergreen Market Index Growth Fund (“Market Index Growth Fund”) and Evergreen Market Index Value Fund (“Market Index Value Fund”), (collectively, the “Funds”) are each a diversified series of Evergreen Equity Trust (the “Trust”), a Delaware statutory trust organized on September 18, 1997. The Trust is an open-end management investment company registered under the Investment Company Act of 1940, as amended (the “1940 Act”).
Each Fund offers Class I shares. Class I shares are sold without a front-end sales charge or contingent deferred sales charge.
2. SIGNIFICANT ACCOUNTING POLICIES
The following is a summary of significant accounting policies consistently followed by each Fund in the preparation of its financial statements. The policies are in conformity with generally accepted accounting principles in the United States of America, which require management to make estimates and assumptions that affect amounts reported herein. Actual results could differ from these estimates.
a. Valuation of investments
Listed equity securities are usually valued at the last sales price or official closing price on the national securities exchange where the securities are principally traded.
Foreign securities traded on an established exchange are valued at the last sales price on the exchange where the security is primarily traded. If there has been no sale, the securities are valued at the mean between bid and asked prices. Foreign securities may be valued at fair value according to procedures approved by the Board of Trustees if the closing price is not reflective of current market values due to trading or events occurring in the foreign markets between the close of the established exchange and the valuation time of the Fund. In addition, substantial changes in values in the U.S. markets subsequent to the close of a foreign market may also affect the values of securities traded in the foreign market. The value of foreign securities may be adjusted if such movements in the U.S. market exceed a specified threshold.
Portfolio debt securities acquired with more than 60 days to maturity are fair valued using matrix pricing methods determined by an independent pricing service which takes into consideration such factors as similar security prices, yields, maturities, liquidity and ratings. Securities for which valuations are not readily available from an independent pricing service may be valued by brokers which use prices provided by market makers or estimates of fair market value obtained from yield data relating to investments or securities with similar characteristics.
Short-term securities of sufficient credit quality with remaining maturities of 60 days or less at the time of purchase are valued at amortized cost, which approximates fair value.
Investments in open-end mutual funds are valued at net asset value. Securities for which market quotations are not readily available or not reflective of current fair value are valued at fair value as determined by the investment advisor in good faith, according to procedures approved by the Board of Trustees.
b. Foreign currency translation
All assets and liabilities denominated in foreign currencies are translated into U.S. dollar amounts at the date of valuation. Purchases and sales of portfolio securities and income items denominated in foreign currencies are translated into U.S. dollar amounts on the respective dates of such transactions. The Fund does not separately account for that portion of the results of operations resulting from changes in foreign exchange rates on investments and the fluctuations arising from changes in market prices of securities held. Such fluctuations are included with the net realized and unrealized gains or losses on investments.
c. Futures contracts
Each Fund is subject to interest rate risk, equity price risk and foreign currency exchange rate risk in the normal course of pursuing its investment objectives. The Funds may buy and sell futures contracts in order to gain exposure to, or protect against changes in, security values. The primary risks associated with the use of futures contracts are the imperfect correlation between changes in market values of securities held by each Fund and the prices of futures contracts, and the possibility of an illiquid market.
COMBINED NOTES TO FINANCIAL STATEMENTS continued
Futures contracts are valued based upon their quoted daily settlement prices. The aggregate principal amounts of the contracts are not recorded in the financial statements. Fluctuations in the value of the contracts are recorded in the Statement of Assets and Liabilities as an asset or liability and in the Statement of Operations as unrealized gains or losses until the contracts are closed, at which point they are recorded as net realized gains or losses on futures contracts. With futures contracts, there is minimal counterparty risk to the Fund since futures are exchange traded and the exchange’s clearinghouse, as counterparty to all exchange traded futures, guarantees the futures against default.
d. Securities lending
Each Fund may lend its securities to certain qualified brokers in order to earn additional income. The Funds receives compensation in the form of fees or interest earned on the investment of any cash collateral received. The Funds also continues to receive interest and dividends on the securities loaned. The Funds receive collateral in the form of cash or securities with a market value at least equal to the market value of the securities on loan. In the event of default or bankruptcy by the borrower, the Funds could experience delays and costs in recovering the loaned securities or in gaining access to the collateral. In addition, the investment of any cash collateral received may lose all or part of its value. Each Fund has the right under the lending agreement to recover the securities from the borrower on demand.
e. Security transactions and investment income
Security transactions are recorded on trade date. Realized gains and losses are computed using the specific cost of the security sold. Interest income is recorded on the accrual basis and includes accretion of discounts and amortization of premiums. Dividend income is recorded on the ex-dividend date. Foreign income and capital gains realized on some securities may be subject to foreign taxes, which are accrued as applicable.
f. Federal and other taxes
Each Fund intends to continue to qualify as a regulated investment company and distribute all of its taxable income, including any net capital gains (which have already been offset by available capital loss carryovers). Accordingly, no provision for federal taxes is required. Each Fund’s income and excise tax returns and all financial records supporting those returns for the prior three fiscal years are subject to examination by the federal, Massachusetts and Delaware revenue authorities.
g. Distributions
Distributions to shareholders from net investment income and net realized gains, if any, are recorded on the ex-dividend date. Such distributions are determined in conformity with income tax regulations, which may differ from generally accepted accounting principles.
Reclassifications have been made to each Fund’s components of net assets to reflect income and gains available for distribution (or available capital loss carryovers, as applicable) under income tax regulations. The primary permanent differences causing such reclassifications are due to real estate investment trusts. During the year ended May 31, 2009, the following amounts were reclassified:
| Market Index
Fund | | Market Index
Growth Fund | | Market Index
Value Fund | |
|
|
|
|
|
|
|
Undistributed net investment income | $ | (90,717 | ) | | $ | (92,732 | ) | | $ | (411,400 | ) | |
Accumulated net realized gains or losses on investments | | 90,717 | | | | 92,732 | | | | 411,400 | | |
3. ADVISORY FEE AND OTHER TRANSACTIONS WITH AFFILIATES
Evergreen Investment Management Company, LLC (“EIMC”), a subsidiary of Wells Fargo & Company (“Wells Fargo”), is the investment advisor to the Funds and is paid an annual fee starting at 0.32% and declining to 0.25% as the average daily net assets of each Fund increase. For the year ended May 31, 2009, the advisory fee was equivalent to an annual rate of 0.32% of each Fund’s average daily net assets.
On October 3, 2008, Wells Fargo and Wachovia Corporation (“Wachovia”) announced that Wells Fargo agreed to acquire Wachovia in a whole company transaction that would include all of Wachovia’s banking and other businesses. In connection with this transaction, Wachovia issued preferred shares to Wells Fargo representing approximately a 40% voting interest in Wachovia. Due to its ownership of preferred shares, Wells Fargo may have been deemed to control EIMC. If Wells Fargo was deemed to control EIMC, then
COMBINED NOTES TO FINANCIAL STATEMENTS continued
the existing advisory agreement between each Fund and EIMC would have terminated automatically in connection with the issuance of preferred shares. To address this possibility, on October 20, 2008 the Board of Trustees approved an interim advisory agreement with EIMC with the same terms and conditions as the existing agreement which became effective upon the issuance of the preferred shares. EIMC’s receipt of the advisory fees under the interim advisory agreement was subject to the approval by shareholders of each Fund of a new advisory agreement with EIMC.
On December 31, 2008, Wachovia merged with and into Wells Fargo and as a result of the merger, EIMC, Evergreen Investment Services, Inc. (“EIS”) and Evergreen Service Company, LLC (“ESC”) became subsidiaries of Wells Fargo. After the merger, a new interim advisory agreement with the same terms and conditions between each Fund and EIMC went into effect.
Shareholders approved the new advisory agreement between each Fund and EIMC on February 12, 2009.
From time to time, EIMC may voluntarily or contractually waive its fee and/or reimburse expenses in order to limit operating expenses. During the year ended May 31, 2009, EIMC waived its advisory fees and reimbursed other expenses as follows:
| | Fees Contractually
Waived | | Other Expenses
Contractually
Reimbursed | | Other Expenses
Voluntarily
Reimbursed | |
|
|
|
|
|
|
|
|
Market Index Fund | | $ | 811,332 | | | $ | 215,235 | | | $ | 101,417 | | |
Market Index Growth Fund | | | 1,638,458 | | | | 161,614 | | | | 409,614 | | |
Market Index Value Fund | | | 1,468,286 | | | | 158,368 | | | | 367,056 | | |
|
|
|
|
|
|
|
|
|
|
|
|
|
|
Each Fund may invest in money market funds which are advised by EIMC. Income earned on these investments is included in income from affiliated issuers on each Fund’s Statement of Operations.
EIMC also serves as the administrator to each Fund providing each Fund with facilities, equipment and personnel. EIMC is paid an annual rate determined by applying percentage rates to the aggregate average daily net assets of the Evergreen funds (excluding money market funds) starting at 0.10% and declining to 0.05% as the aggregate average daily net assets of the Evergreen funds (excluding money market funds) increase. For the year ended May 31, 2009, the administrative services fee was equivalent to an annual rate of 0.10% of each Fund’s average daily net assets.
ESC, an affiliate of EIMC and a subsidiary of Wells Fargo, is the transfer and dividend disbursing agent for the Funds. ESC receives account fees that vary based on the type of account held by the shareholders in the Fund.
4. INVESTMENT TRANSACTIONS
Cost of purchases and proceeds from sales of investment securities (excluding short-term securities) were as follows for the year ended May 31, 2009:
| Cost of Purchases | | Proceeds from Sales | |
|
|
|
|
|
Market Index Fund | $ | 17,354,168 | | | $ | 7,959,343 | | |
Market Index Growth Fund | | 146,461,683 | | | | 154,264,124 | | |
Market Index Value Fund | | 155,469,028 | | | | 146,065,642 | | |
|
|
|
|
|
|
|
|
|
On June 1, 2008, the Funds implemented Statement of Financial Accounting Standards No. 157, Fair Value Measurements (“FAS 157”). FAS 157 establishes a single authoritative definition of fair value, establishes a framework for measuring fair value and expands disclosures about fair value measurements. FAS 157 establishes a fair value hierarchy based upon the various inputs used in determining the value of the Funds’ investments. These inputs are summarized into three broad levels as follows:
Level 1 – quoted prices in active markets for identical securities Level 2 – other significant observable inputs (including quoted prices for similar securities, interest rates, prepayment speeds, credit risk, etc.) Level 3 – significant unobservable inputs (including each Fund’s own assumptions in determining the fair value of investments) |
COMBINED NOTES TO FINANCIAL STATEMENTS continued
The inputs or methodologies used for valuing securities are not necessarily an indication of the risk associated with investing in those securities.
As of May 31, 2009, the inputs used in valuing Market Index Fund’s assets, which are carried at fair value, were as follows:
Valuation Inputs | | Investments in
Securities | | Other Financial
Instruments* | |
|
|
|
|
| |
Level 1 – Quoted Prices | | | $ | 236,504,672 | | | | $ | 762,207 | | |
Level 2 – Other Significant Observable Inputs | | | | 0 | | | | | 0 | | |
Level 3 – Significant Unobservable Inputs | | | | 0 | | | | | 0 | | |
|
|
|
|
|
|
|
|
|
|
| |
Total | | | $ | 236,504,672 | | | | $ | 762,207 | | |
|
|
|
|
|
|
|
|
|
|
| |
* | Other financial instruments include futures contracts. |
As of May 31, 2009, the inputs used in valuing Market Index Growth Fund’s assets, which are carried at fair value, were as follows:
Valuation Inputs | | Investments in
Securities | | Other Financial
Instruments* | |
|
|
|
|
| |
Level 1 – Quoted Prices | | | $ | 484,986,731 | | | | $ | 271,386 | | |
Level 2 – Other Significant Observable Inputs | | | | 0 | | | | | 0 | | |
Level 3 – Significant Unobservable Inputs | | | | 0 | | | | | 0 | | |
|
|
|
|
|
|
|
|
|
|
| |
Total | | | $ | 484,986,731 | | | | $ | 271,386 | | |
|
|
|
|
|
|
|
|
|
|
| |
* | Other financial instruments include futures contracts. |
As of May 31, 2009, the inputs used in valuing Market Index Value Fund’s assets, which are carried at fair value, were as follows:
Valuation Inputs | | Investments in
Securities | | Other Financial
Instruments* | |
|
|
|
|
| |
Level 1 – Quoted Prices | | | $ | 412,650,679 | | | | $ | 465,710 | | |
Level 2 – Other Significant Observable Inputs | | | | 0 | | | | | 0 | | |
Level 3 – Significant Unobservable Inputs | | | | 0 | | | | | 0 | | |
|
|
|
|
|
|
|
|
|
|
| |
Total | | | $ | 412,650,679 | | | | $ | 465,710 | | |
|
|
|
|
|
|
|
|
|
|
| |
* | Other financial instruments include futures contracts. |
On May 31, 2009, composition of unrealized appreciation and depreciation on securities based on the aggregate cost of securities for federal income tax purposes was as follows:
| | Tax Cost | | Gross Unrealized
Appreciation | | Gross Unrealized
Depreciation | | Net Unrealized
Appreciation
(Depreciation) | |
|
|
|
|
|
|
|
|
| |
Market Index Fund | | $ | 232,047,511 | | $ | 59,078,263 | | $ | 54,621,102 | | $ | 4,457,161 | |
Market Index Growth Fund | | | 486,262,422 | | | 84,849,236 | | | 86,124,927 | | | (1,275,691 | ) |
Market Index Value Fund | | | 576,579,078 | | | 38,364,291 | | | 202,292,690 | | | (163,928,399 | ) |
|
|
|
|
|
|
|
|
|
|
|
|
| |
As of May 31, 2009, Market Index Fund had $4,265,709 in capital loss carryovers for federal income tax purposes expiring in 2017 and Market Index Growth Fund had $5,656,948 in capital loss carryovers for federal income tax purposes expiring in 2017.
For income tax purposes, capital losses incurred after October 31 within the Funds’ fiscal year are deemed to arise on the first business day of the following fiscal year. As of May 31, 2009, Market Index
COMBINED NOTES TO FINANCIAL STATEMENTS continued
Fund, Market Index Growth Fund and Market Index Value Fund each incurred and will elect to defer post-October losses of $670,522, $1,630,707 and $4,199,141, respectively.
5. DERIVATIVE TRANSACTIONS
At May 31, 2009, Market Index Fund had long futures contracts outstanding as follows:
Expiration | | Contracts | | Initial
Contract
Amount | | Value at
May 31, 2009 | | Unrealized Gain
(Loss) | |
|
|
|
|
|
|
|
|
|
|
June 2009 | | 64 E-Mini S&P 500 Futures | | $2,175,713 | | $2,937,920 | | $762,207 | |
At May 31, 2009, Market Index Growth Fund had long futures contracts outstanding as follows:
Expiration | | Contracts | | Initial
Contract
Amount | | Value at
May 31, 2009 | | Unrealized
Gain (Loss) | |
|
|
|
|
|
|
|
|
|
|
June 2009 | | 14 E-Mini S&P 500 Futures | | $ | 493,845 | | | $ | 642,670 | | | $ | 148,825 | | |
June 2009 | | 2 S&P 500 Futures | | | 336,489 | | | | 459,050 | | | | 122,561 | | |
At May 31, 2009, Market Index Value Fund had long futures contracts outstanding as follows:
Expiration | | Contracts | | Initial
Contract
Amount | | Value at
May 31, 2009 | | Unrealized
Gain (Loss) | |
|
|
|
|
|
|
|
|
|
|
June 2009 | | 18 E-Mini S&P 500 Futures | | $ | 605,702 | | | $ | 826,290 | | | $ | 220,588 | | |
June 2009 | | 4 S&P 500 Futures | | | 672,978 | | | | 918,100 | | | | 245,122 | | |
On May 31, 2009, the fair value of futures contracts in each Fund which is reflected in net unrealized gains or losses on investments on each Fund’s Statement of Assets and Liabilities was as follows:
|
|
|
|
Market Index Fund | | $ | 762,207 |
Market Index Growth Fund | | | 271,386 |
Market Index Value Fund | | | 465,710 |
|
|
|
|
The total initial contract amount in the tables above are representative of the volume of derivative activity for the Funds during the year ended May 31, 2009.
The realized losses and change in unrealized gains or losses on futures contracts are reflected in each Fund’s Statement of Operations.
6. INTERFUND LENDING
Pursuant to an Exemptive Order issued by the SEC, each Fund may participate in an interfund lending program with certain funds in the Evergreen fund family. This program allows each Fund to borrow from, or lend money to, other participating funds. During the year ended May 31, 2009, the Funds did not participate in the interfund lending program.
7. DISTRIBUTIONS TO SHAREHOLDERS
As of May 31, 2009, the components of distributable earnings on a tax basis were as follows:
| | Undistributed
Ordinary Income | | Undistributed
Long-term
Capital
Gain | | Unrealized
Appreciation
(Depreciation) | | Capital Loss
Carryovers
and Post-
October
Losses | | Temporary
Book/Tax
Differences | |
|
|
|
|
|
|
|
|
|
|
| |
Market Index Fund | | | $ | 6,842,956 | | | | $ | 0 | | | | $ | 4,457,161 | | | | $ | 4,936,231 | | | | $ | (15,719 | ) | |
Market Index Growth Fund | | | | 9,109,873 | | | | | 0 | | | | | (1,275,684 | ) | | | | 7,287,655 | | | | | (17,779 | ) | |
Market Index Value Fund | | | | 15,928,301 | | | | | 10,043,863 | | | | | (163,928,399 | ) | | | | 4,199,141 | | | | | (16,939 | ) | |
The differences between the components of distributable earnings on a tax basis and the amounts reflected in each Fund’s Statement of Assets and Liabilities are primarily due to wash sales, futures contracts,
COMBINED NOTES TO FINANCIAL STATEMENTS continued
partnership investments and real estate investment trusts. The temporary book/tax differences are a result of timing differences between book and tax recognition of income and/or expenses.
The tax character of distributions paid was as follows:
| | Year Ended
May 31, 2009 | | | Year Ended
May 31, 2008 | |
| |
| | |
| |
| | Ordinary Income | | Long-term Capital
Gain | | | Ordinary Income | | Long-term Capital
Gain | |
|
|
|
|
|
|
|
|
|
| |
Market Index Fund | | | $ | 9,255,958 | | | | $ | 35,071,950 | | | | | $ | 9,112,299 | | | | $ | 7,045,386 | | |
Market Index Growth Fund | | | | 11,153,921 | | | | | 44,063,139 | | | | | | 10,560,482 | | | | | 9,119,922 | | |
Market Index Value Fund | | | | 23,583,410 | | | | | 33,712,509 | | | | | | 17,299,127 | | | | | 25,994,838 | | |
|
|
|
|
|
|
|
|
|
|
|
|
|
|
|
|
|
|
|
|
|
| |
8. EXPENSE REDUCTIONS
Through expense offset arrangements with ESC and the Funds’ custodian, a portion of fund expenses has been reduced.
9. DEFERRED TRUSTEES’ FEES
Each Trustee of the Funds may defer any or all compensation related to performance of his or her duties as a Trustee. The Trustees’ deferred balances are allocated to deferral accounts, which are included in the accrued expenses for each Fund. The investment performance of the deferral accounts is based on the investment performance of certain Evergreen funds. Any gains earned or losses incurred in the deferral accounts are reported in each Fund’s Trustees’ fees and expenses. At the election of the Trustees, the deferral account will be paid either in one lump sum or in quarterly installments for up to ten years.
10. FINANCING AGREEMENT
The Funds and certain other Evergreen funds share in a $100 million unsecured revolving credit commitment for temporary and emergency purposes, including the funding of redemptions, as permitted by each participating fund’s borrowing restrictions. Borrowings under this facility bear interest at 0.50% per annum above the Federal Funds rate. All of the participating funds are charged an annual commitment fee of 0.09% on the unused balance, which is allocated pro rata. Prior to June 27, 2008, the annual commitment fee was 0.08%.
During the year ended May 31, 2009, Market Index Fund had no borrowings.
During the year ended May 31, 2009, Market Index Growth Fund had average borrowings outstanding of $3,183 at a rate of 3.55% and paid interest of $113.
During the year ended May 31, 2009, Market Index Value Fund had average borrowings outstanding of $13,239 at a rate of 3.55% and paid interest of $470.
11. REGULATORY MATTERS AND LEGAL PROCEEDINGS
The Evergreen funds, EIMC and certain of EIMC’s affiliates are involved in various legal actions, including private litigation and class action lawsuits, and are and may in the future be subject to regulatory inquiries and investigations.
EIMC and EIS have reached final settlements with the Securities and Exchange Commission (“SEC”) and the Securities Division of the Secretary of the Commonwealth of Massachusetts (“Commonwealth”) primarily relating to the liquidation of Evergreen Ultra Short Opportunities Fund (“Ultra Short Fund”). The claims settled include the following: first, that during the period February 2007 through Ultra Short Fund’s liquidation on June 18, 2008, Ultra Short Fund’s former portfolio management team failed to properly take into account readily-available information in valuing certain non-agency residential mortgage-backed securities held by the Ultra Short Fund, resulting in the Ultra Short Fund’s net asset value (“NAV”) being overstated during the period; second, that EIMC and EIS acted inappropriately when, in an effort to explain the decline in Ultra Short Fund’s NAV , certain information regarding the decline was communicated to some, but not all, shareholders and financial intermediaries; third, that the Ultra Short Fund portfolio management team did not adhere to regulatory requirements for affiliated cross trades in executing trades with other Evergreen funds; and finally, that from at least September 2007 to August 2008, EIS did not
COMBINED NOTES TO FINANCIAL STATEMENTS continued
preserve certain text and instant messages transmitted via personal digital assistant devices. In settling these matters, EIMC and EIS have agreed to payments totaling $41,125,000, up to $40,125,000 of which will be distributed to eligible shareholders of Ultra Short Fund pursuant to a methodology and plan approved by the regulators. EIMC and EIS neither admitted nor denied the regulators’ conclusions.
Three purported class actions have also been filed in the U.S. District Court for the District of Massachusetts relating to the same events; defendants include various Evergreen entities, including EIMC and EIS, and Evergreen Fixed Income Trust and its Trustees. The cases generally allege that investors in the Ultra Short Fund suffered losses as a result of (i) misleading statements in Ultra Short Fund’s registration statement and prospectus, (ii) the failure to accurately price securities in the Ultra Short Fund at different points in time and (iii) the failure of the Ultra Short Fund’s risk disclosures and description of its investment strategy to inform investors adequately of the actual risks of the fund.
EIMC does not expect that any of the legal actions, inquiries or settlement of regulatory matters will have a material adverse impact on the financial position or operations of the Funds to which these financial statements relate. Any publicity surrounding or resulting from any legal actions or regulatory inquiries involving EIMC or its affiliates or any of the Evergreen Funds could result in reduced sales or increased redemptions of Evergreen fund shares, which could increase Evergreen fund transaction costs or operating expenses or have other adverse consequences on the Evergreen funds, including the Funds.
12. NEW ACCOUNTING PRONOUNCEMENT
In April 2009, FASB issued FASB Staff Position No. FAS 157-4, Determining Fair Value When the Volume and Level of Activity for the Asset or Liability Have Significantly Decreased and Identifying Transactions That Are Not Orderly (“FAS 157-4”). FAS 157-4 provides additional guidance for determining fair value when the volume and level of activity for an asset or a liability have significantly decreased and identifying transactions that are not orderly. FAS 157-4 requires enhanced disclosures about the inputs and valuation technique(s) used to measure fair value and a discussion of changes in valuation techniques and related inputs, if any, during the period. In addition, the three-level hierarchy disclosure and the level three roll-forward disclosure wil l be expanded for each major category of assets. Management of the Funds does not believe the adoption of FAS 157-4 will materially impact the financial statement amounts, but will require additional disclosures. FAS 157-4 is effective for interim and annual reporting periods ending after June 15, 2009.
Report of Independent Registered Public Accounting Firm
Board of Trustees and Shareholders
Evergreen Equity Trust
We have audited the accompanying statements of assets and liabilities, including the schedules of investments, of the Evergreen Market Index Fund, Evergreen Market Index Growth Fund and Evergreen Market Index Value Fund, each a series of the Evergreen Equity Trust, as of May 31, 2009 and the related statements of operations for the year then ended, statements of changes in net assets for each of the years in the two-year period then ended and the financial highlights for each of the years in the five-year period then ended. These financial statements and financial highlights are the responsibility of the Fund’s management. Our responsibility is to express an opinion on these financial statements and financial highlights based on our audits.
We conducted our audits in accordance with the standards of the Public Company Accounting Oversight Board (United States). Those standards require that we plan and perform the audit to obtain reasonable assurance about whether the financial statements and financial highlights are free of material misstatement. An audit includes examining, on a test basis, evidence supporting the amounts and disclosures in the financial statements. Our procedures included confirmation of securities owned as of May 31, 2009 by correspondence with the custodian and brokers, or by other appropriate auditing procedures where replies from brokers were not received. An audit also includes assessing the accounting principles used and significant estimates made by management, as well as evaluating the overall financial statement presentation. We believe that our audits provide a reasonable basis for our opinion.
In our opinion, the financial statements and financial highlights referred to above present fairly, in all material respects, the financial positions of the Evergreen Market Index Fund, Evergreen Market Index Growth Fund and Evergreen Market Index Value Fund, as of May 31, 2009, the results of their operations, changes in their net assets and financial highlights for each of the years described above, in conformity with U.S. generally accepted accounting principles.

Boston, Massachusetts
July 24, 2009
“ADDITIONAL INFORMATION (Unaudited)”
Federal Tax Distributions
Pursuant to Section 852 of the Internal Revenue Code, each Fund has designated aggregate capital gain distributions as follows for the fiscal year ended May 31, 2009:
| | |
|
| |
Market Index Fund | $35,071,950 | |
Market Index Growth Fund | 44,063,139 | |
Market Index Value Fund | 33,712,509 | |
|
| |
For corporate shareholders, the following percentage of ordinary income dividends paid during the fiscal year ended May 31, 2009 qualified for the dividends received deduction.
| | |
|
| |
Market Index Fund | 85.83 | % |
Market Index Growth Fund | 77.11 | % |
Market Index Value Fund | 68.88 | % |
|
| |
With respect to dividends paid from investment company taxable income during the fiscal year ended May 31, 2009, each Fund designated the following percentage of ordinary income and any short-term capital gain distributions as Qualified Dividend Income in accordance with the Internal Revenue Code. Complete 2009 year-end tax information will be reported on your 2009 Form 1099-DIV, which shall be provided to you in early 2010.
| | |
|
| |
Market Index Fund | 69.43 | % |
Market Index Growth Fund | 69.09 | % |
Market Index Value Fund | 56.41 | % |
|
| |
SPECIAL MEETING OF SHAREHOLDERS
On February 12, 2009, a Special Meeting of Shareholders for each Fund was held to consider the following proposal. The results of the proposal for each Fund are indicated below:
Proposal 1 – To consider and act upon a new Investment Advisory Agreement with Evergreen Investment Management Company, LLC:
Market Index Fund | | |
Net assets voted “For” | $ | 207,347,502 |
Market Index Growth Fund | | |
Net assets voted “For” | $ | 396,293,919 |
Market Index Value Fund | | |
Net assets voted “For” | $ | 376,277,635 |
TRUSTEES AND OFFICERS
TRUSTEES1 | | |
Charles A. Austin III
Trustee
DOB: 10/23/1934
Term of office since: 1991
Other directorships: None | | Investment Counselor, Anchor Capital Advisors, LLC. (investment advice); Director, The Andover Companies (insurance); Trustee, Arthritis Foundation of New England; Former Director, The Francis Ouimet Society (scholarship program); Former Director, Executive Vice President and Treasurer, State Street Research & Management Company (investment advice) |
|
|
|
K. Dun Gifford
Trustee
DOB: 10/23/1938
Term of office since: 1974
Other directorships: None | | Chairman and President, Oldways Preservation and Exchange Trust (education); Trustee, Member of the Executive Committee, Former Chairman of the Finance Committee, and Former Treasurer, Cambridge College |
|
|
|
Dr. Leroy Keith, Jr.
Trustee
DOB: 2/14/1939
Term of office since: 1983
Other directorships: Trustee,
Phoenix Fund Complex
(consisting of 50 portfolios
as of 12/31/2008) | | Managing Director, Almanac Capital Management (commodities firm); Trustee, Phoenix Fund Complex; Director, Diversapack Co. (packaging company); Former Partner, Stonington Partners, Inc. (private equity fund); Former Director, Obagi Medical Products Co.; Former Director, Lincoln Educational Services |
|
|
|
Carol A. Kosel
Trustee
DOB: 12/25/1963
Term of office since: 2008
Other directorships: None | | Former Consultant to the Evergreen Boards of Trustees; Former Vice President and Senior Vice President, Evergreen Investments, Inc.; Former Treasurer, Evergreen Funds; Former Treasurer, Vestaur Securities Fund |
|
|
|
Gerald M. McDonnell
Trustee
DOB: 7/14/1939
Term of office since: 1988
Other directorships: None | | Former Manager of Commercial Operations, CMC Steel (steel producer) |
|
|
|
Patricia B. Norris
Trustee
DOB: 4/9/1948
Term of office since: 2006
Other directorships: None | | President and Director of Buckleys of Kezar Lake, Inc. (real estate company); Former President and Director of Phillips Pond Homes Association (home community); Former Partner, PricewaterhouseCoopers, LLP (independent registered public accounting firm) |
|
|
|
William Walt Pettit2
Trustee
DOB: 8/26/1955
Term of office since: 1988
Other directorships: None | | Partner and Vice President, Kellam & Pettit, P.A. (law firm); Director, Superior Packaging Corp. (packaging company); Member, Superior Land, LLC (real estate holding company), Member, K&P Development, LLC (real estate development); Former Director, National Kidney Foundation of North Carolina, Inc. (non-profit organization) |
|
|
|
David M. Richardson
Trustee
DOB: 9/19/1941
Term of office since: 1982
Other directorships: None | | President, Richardson, Runden LLC (executive recruitment advisory services); Director, J&M Cumming Paper Co. (paper merchandising); Former Trustee, NDI Technologies, LLP (communications); Former Consultant, AESC (The Association of Executive Search Consultants) |
|
|
|
Russell A. Salton III, MD
Trustee
DOB: 6/2/1947
Term of office since: 1984
Other directorships: None | | President/CEO, AccessOne MedCard, Inc. |
|
|
|
TRUSTEES AND OFFICERS continued
Michael S. Scofield
Trustee
DOB: 2/20/1943
Term of office since: 1984
Other directorships: None | | Retired Attorney, Law Offices of Michael S. Scofield; Former Director and Chairman, Branded Media Corporation (multi-media branding company) |
|
|
|
Richard J. Shima
Trustee
DOB: 8/11/1939
Term of office since: 1993
Other directorships: None | | Independent Consultant; Director, Hartford Hospital; Trustee, Greater Hartford YMCA; Former Director, Trust Company of CT; Former Trustee, Saint Joseph College (CT) |
|
|
|
Richard K. Wagoner, CFA3
Trustee
DOB: 12/12/1937
Term of office since: 1999
Other directorships: None | | Member and Former President, North Carolina Securities Traders Association; Member, Financial Analysts Society |
|
|
|
| | |
OFFICERS | | |
W. Douglas Munn4
President
DOB: 4/21/1963
Term of office since: 2009 | | Principal occupations: Chief Operating Officer, Wells Fargo Funds Management, LLC; former Chief Operating Officer, Evergreen Investment Company, Inc. |
|
|
|
Jeremy DePalma4
Treasurer
DOB: 2/5/1974
Term of office since: 2005 | | Principal occupations: Senior Vice President, Evergreen Investment Management Company, LLC; Former Vice President, Evergreen Investment Services, Inc.; Former Assistant Vice President, Evergreen Investment Services, Inc. |
|
|
|
Michael H. Koonce4
Secretary
DOB: 4/20/1960
Term of office since: 2000 | | Principal occupations: Senior Vice President and General Counsel, Evergreen Investment Services, Inc.; Secretary, Senior Vice President and General Counsel, Evergreen Investment Management Company, LLC and Evergreen Service Company, LLC |
|
|
|
Robert Guerin4
Chief Compliance Officer
DOB: 9/20/1965
Term of office since: 2007 | | Principal occupations: Chief Compliance Officer, Evergreen Funds and Senior Vice President of Evergreen Investment Company, Inc.; Former Managing Director and Senior Compliance Officer, Babson Capital Management LLC; Former Principal and Director, Compliance and Risk Management, State Street Global Advisors; Former Vice President and Manager, Sales Practice Compliance, Deutsche Asset Management |
|
|
|
1 | Each Trustee serves until a successor is duly elected or qualified or until his or her death, resignation, retirement or removal from office. Each Trustee oversaw 77 Evergreen funds as of December 31, 2008. Correspondence for each Trustee may be sent to Evergreen Board of Trustees, P.O. Box 20083, Charlotte, NC 28202. |
2 | It is possible that Mr. Pettit may be viewed as an “interested person” of the Evergreen funds, as defined in the 1940 Act, because of his law firm’s previous representation of affiliates of Wells Fargo & Company (“Wells Fargo”), the parent to the Evergreen funds’ investment advisor, EIMC. The Trustees are treating Mr. Pettit as an interested trustee for the time being. |
3 | Mr. Wagoner is an “interested person” of the Evergreen funds because of his ownership of shares in Wells Fargo & Company, the parent to the Evergreen funds’ investment advisor. |
4 | The address of the Officer is 200 Berkeley Street, Boston, MA 02116. |
Additional information about the Fund’s Board of Trustees and Officers can be found in the Statement of Additional Information (SAI) and is available upon request without charge by calling 800.343.2898.
574181 rv4 07/2009
Item 2 - Code of Ethics
(a) | The Registrant has adopted a code of ethics that applies to the Registrant’s principal executive officer and principal financial officer. |
(b) | During the period covered by this report, there were no amendments to the provisions of the code of ethics adopted in 2.(a) above. |
(c) | During the period covered by this report, there were no implicit or explicit waivers to the provisions of the code of ethics adopted in
2.(a) above. |
Item 3 - Audit Committee Financial Expert
Charles A. Austin III and Patricia B. Norris have been determined by the Registrant’s Board of Trustees to be audit committee financial experts within the meaning of Section 407 of the Sarbanes-Oxley Act. These financial experts are independent of management.
Items 4 – Principal Accountant Fees and Services
The following table represents fees for professional audit services rendered by KPMG LLP, for the audits of each of the three series of the Registrant’s annual financial statements for the fiscal years ended May 31, 2009 and May 31, 2008, and fees billed for other services rendered by KPMG LLP.
| | 2009 | | 2008 | |
| |
| |
| |
Audit fees | | $ | 72,400 | | $ | 68,500 | |
Audit-related fees | | $ | 0 | | $ | 0 | |
Tax fees | | $ | 0 | | $ | 0 | |
Non-audit fees (1) | | $ | 720,000 | | $ | 1,062,374 | |
All other fees | | $ | 0 | | $ | 0 | |
(1) | Non-audit fees consists of the aggregate fees for non-audit services rendered to the Fund, EIMC (not including any sub-advisor whose role is primarily portfolio management and is subcontracted with or overseen by another investment advisor) and EIS. |
Evergreen Funds
Evergreen Global Dividend Opportunity Fund
Evergreen Income Advantage Fund
Evergreen International Balanced Income Fund
Evergreen Multi-Sector Income Fund
Evergreen Utilities and High Income Fund
Audit and Non-Audit Services Pre-Approval Policy
I. Statement of Principles
Under the Sarbanes-Oxley Act of 2002 (the “Act”), the Audit Committee of the Board of Trustees/Directors is responsible for the appointment, compensation and oversight of the work of the independent auditor. As part of this responsibility, the Audit Committee is required to pre-approve the audit and non-audit services performed by the independent auditor for the Funds, as well as non-audit services performed by the independent auditor for the Funds’ investment adviser or any of its control affiliates that relates directly to the Funds’ operations and financial reporting, in order to assure that they do not impair the auditor’s independence from the Funds. To implement these provisions of the Act, the Securities and Exchange Commission (the “SEC”) has issued rules specifying the types of services that an independent auditor may not provide to its audit client, as well as regarding the audit committee’s administration of the engagement of the independent auditor. Accordingly, the Audit Committee has adopted, and the Board of Trustees has ratified, the Audit and Non-Audit Services Pre Approval Policy (the “Policy”), which sets forth the procedures and the conditions pursuant to which services proposed to be performed by the independent auditor may be pre-approved.
The SEC’s rules establish two different approaches to pre-approving services, which the SEC considers to be equally valid. Proposed services either: may be pre-approved by the Audit Committee pursuant to detailed pre-approval policies and procedures that describe the types of services for which the independent auditor may be engaged (“general pre-approval”); or may be expressly pre-approved by the Audit Committee (“specific pre-approval”). The Audit Committee believes that the combination of these two approaches expressed in this Policy will result in an effective and efficient procedure to pre-approve services performed by the independent auditor. As set forth in this Policy, unless a type of service has received general pre-approval, it will require specific pre-approval by the Audit Committee if it is to be provided by the independent auditor.
For both types of pre-approval, the Audit Committee will consider whether such services are consistent with the SEC’s rules on auditor independence. The Audit Committee will also consider whether the independent auditor is best positioned to provide the most effective and efficient service, for reasons such as its familiarity with the Funds’ business people, culture, accounting systems, risk profile and other factors, and whether the service might enhance the Funds’ ability to manage or control risk or improve audit quality. All such factors will be considered as a whole, and no one factor should necessarily be determinative.
The Audit Committee is also mindful of the relationship between fees for audit and non-audit services in deciding whether to pre-approve any such services and may determine, for each fiscal year, the ratio between the total amount of fees for Audit, Audit-related and Tax services and the total amount of fees for certain permissible non-audit services classified as All Other services.
The appendices to this Policy describe the Audit, Audit-related, Tax and All Other services that have the general pre-approval of the Audit Committee. The term of any general pre-approval is 12 months from the date of pre-approval, unless the Audit Committee considers a different period and states otherwise. The Audit Committee will annually review and pre-approve the services that may be provided by the independent auditor without obtaining specific pre-approval from the Audit Committee. The Audit Committee will add or subtract to the list of general pre-approved services from time to time, based on subsequent determinations.
The purpose of this Policy is to set forth the procedures by which the Audit Committee intends to fulfill its responsibilities. It does not delegate the Audit Committee’s responsibilities to pre-approve services performed by the independent auditor to management.
The independent auditor has reviewed this Policy and believes that implementation of the policy will not adversely affect the auditor’s independence.
II. Delegation
As provided in the Act and the SEC’s rules, the Audit Committee may delegate either type of pre-approval authority to one or more of its members. The member to whom such authority is delegated must report, for informational purposes only, any pre-approval decisions to the Audit Committee at its next scheduled meeting.
III. Audit Services
The annual Audit services engagement terms and fees will be subject to the specific pre-approval of the Audit Committee. Audit services include the annual financial statement audit and other procedures required to be performed by the independent auditor to be able to form an opinion on the Funds’ financial statements. These other procedures include information systems and procedural reviews and testing performed in order to understand and place reliance on the systems of internal control, and consultations relating to the audit. Audit services also include the attestation engagement for the independent auditor’s report on management’s report on internal controls for financial reporting. The Audit Committee will monitor the Audit services engagement as necessary, but on no less than on a quarterly basis, and will also approve, if necessary, any changes in terms, conditions and fees resulting from changes in audit scope, Fund service providers or other items.
In addition to the annual Audit services engagement approved by the Audit Committee, the Audit Committee may grant general pre-approval for other Audit services, which are those services that only the independent auditor reasonably can provide. Other Audit services may include services associated with SEC registration statements, periodic reports and other documents filed with the SEC or other documents issued in connection with mergers or acquisitions.
The Audit Committee has pre-approved the Audit services in Appendix A. All other audit services not listed in Appendix A must be specifically pre-approved by the Audit Committee.
IV. Audit-related Services
Audit-related services are assurance and related services that are reasonably related to the performance of the audit or review of the Funds’ financial statements or that are traditionally performed by the independent auditor. Because the Audit Committee believes that the provision of Audit-related services does not impair the independence of the auditor and is consistent with SEC’s rules on auditor independence, the Audit Committee may grant general pre-approval for Audit-related services. Audit-related services include, among others, due diligence services pertaining to potential business acquisitions/dispositions; accounting consultations related to accounting, financial reporting or disclosure matters not classified as “Audit services”; assistance with understanding and implementing new accounting and financial reporting guidance from rulemaking authorities; agreed-upon or expanded audit procedures related to accounting records required to respond to or comply with financial, accounting or regulatory reporting matters; and assistance with internal control reporting requirements.
The Audit Committee has pre-approved the Audit-related services in Appendix B. All other Audit-related services not listed in appendix B must be specifically pre-approved by the Audit Committee.
V. Tax Services
The Audit Committee believes that the independent auditor can provide Tax services to the Funds such as tax compliance, tax planning and tax advice without impairing the auditor’s independence, and the SEC has stated that the independent auditor may provide such services. Hence, the Audit Committee believes it may grant general pre-approval to those Tax services that have historically been provided by the auditor, that the Audit Committee has reviewed and believes would not impair the independence of the auditor, and that are consistent with the SEC’s rules on auditor independence. The Audit Committee will not permit the retention of the independent auditor in connection with a transaction initially recommended by the independent auditor, the sole business purpose of which may be tax avoidance and the tax treatment of which may not be supported in the Internal Revenue Code and related regulations. The Audit Committee will consult with the Director of Fund Administration, the Senior Vice President of Tax Services or outside counsel to determine that the tax planning and reporting positions are consistent with this policy.
Pursuant to the preceding paragraph, the Audit Committee has pre-approved the Tax services in Appendix C. All Tax services involving large and complex transactions not listed in Appendix C must be specifically pre-approved by the Audit Committee, including: tax services proposed to be provide by the independent auditor to any executive officer or director of the Funds, in his or her individual capacity, where such services are paid for by the Funds or the investment advisor.
VI. All Other Services
The Audit Committee believes, based on the SEC’s rules prohibiting the independent auditor from providing specific non-audit services, that other types of non-audit services are permitted. Accordingly, the Audit Committee believes it may grant general pre-approval to those permissible non-audit services classified as All Other services that it believes are routine and recurring services, would not impair the independence of the auditor and are consistent with the SEC’s rules on auditor independence.
The Audit Committee has pre-approved the All Other services in Appendix C. Permissible All Other services not listed in Appendix C must be specifically pre-approved by the Audit Committee.
A list of the SEC’s prohibited non-audit services is attached to this policy as Exhibit 1. The SEC’s rules and relevant guidance should be consulted to determine the precise definitions of these services and the applicability of exceptions to certain of the prohibitions.
VII. Pre-Approval Fee Levels or Budgeted Amounts
Fee levels or budgeted amounts for all services to be provided by the independent auditor subject to general pre-approval will be established annually by the Audit Committee. Fee levels or budgeted amounts for services to be provided by the independent auditor subject to specific pre-approval will be established at the time of the specific pre-approval. Any proposed fees exceeding these levels or amounts will require specific pre-approval by the Audit Committee. The Audit Committee is mindful of the overall relationship of fees for audit and non-audit services in determining whether to pre-approve any such services. For each fiscal year, the Audit Committee may determine to ratio between the total amount of fees for Audit, Audit-related and Tax services, and the total amount of fees for services classified as All Other services.
VIII. Procedures
All requests or applications for services to be provided by the independent auditor that do not require specific approval by the Audit Committee will be submitted to the Director of Fund Administration or Assistant Director of Fund Administration and must include a detailed description of the services to be rendered. The Director/Assistant Director of Fund Administration will determine whether such services are included within the list of services that have received the general pre-approval of the Audit Committee. The Audit Committee will be informed on a quarterly basis (or more frequent if requested by the Audit Committee) of any such services rendered by the independent auditor.
Requests or applications to provide services that require specific approval by the Audit Committee will be submitted to the Audit Committee by both the independent auditor and the Director/Assistant Director of Fund Administration, and must include a joint statement as to whether, in their view, the request or application is consistent with the SEC’s rules on auditor independence.
The Director/Assistant Director of Fund Administration will report to the Audit Committee at each of its regular meetings regarding all services provided by the independent auditor that are subject to this policy since the last such report was rendered, including: (1) a general description of the services; (2) actual billed and projected fees; and (3) the means by which such services were pre-approved by the Audit Committee, as well as the date of approval and any related fee level or budgeted amount to which the services are subject.
The Audit Committee has designated the Chief Compliance Officer to monitor the performance of all services provided by the independent auditor and to determine whether such services are in compliance with this policy. The Chief Compliance Officer will report to the Audit Committee on a periodic basis on the results of its monitoring. Both the Chief Compliance Officer and management will immediately report to the chairman of the Audit Committee any breach of this policy that comes to the attention of the Chief Compliance Officer or any member of management.
IX. Additional Requirements
The Audit Committee has determined to take additional measures on an annual basis to meet its responsibility to oversee the work of the independent auditor and to assure the auditor’s independence from the Funds, such as reviewing a formal written statement from the independent auditor delineating all relationships between the independent auditor and the Funds, the Funds’ investment advisor and related parties of the investment advisor, consistent with Independence Standards Board Standard No. 1, and discussing with the independent auditor its methods and procedures for ensuring independence.
Items 5 – Audit Committee of Listed Registrants
On January 1, 2009, Patricia B. Norris replaced Charles A. Austin III as chair of the Audit Committee.
Item 6 – Schedule of Investments
Please see schedule of investments contained in the Report to Stockholders included under Item 1 of this Form N-CSR.
Item 7 – Disclosure of Proxy Voting Policies and Procedures for Closed-End Management Investment Companies.
Not applicable.
Item 8 – Portfolio Managers of Closed-End Management Investment Companies.
Not applicable.
Item 9 – Purchases of Equity Securities by Closed-End Management Investment Company and Affiliated Purchasers.
Not applicable.
Item 10 – Submission of Matters to a Vote of Security Holders
There have been no material changes to the procedures by which shareholders may recommend nominees to the Registrant’s board of trustees that have been implemented since the Registrant last provided disclosure in response to the requirements of this Item.
Item 11 - Controls and Procedures
(a) | The Registrant’s principal executive officer and principal financial officer have evaluated the Registrant’s disclosure controls and procedures (as defined in Rule 30a-3(c) under the Investment Company Act of 1940) within 90 days of this filing and have concluded that the Registrant’s disclosure controls and procedures were effective, as of that date, in ensuring that information required to be disclosed by the Registrant in this Form N-CSR was recorded, processed, summarized, and reported timely. |
(b) | There has been no changes in the Registrant’s internal controls over financial reporting (as defined in Rule 30a-3(d) under the Investment Company Act of 1940) that occurred during the second fiscal quarter of the period covered by this report that has materially affected, or is reasonably likely to affect, the Registrant’s internal control over financial reporting . |
Item 12 - Exhibits
File the exhibits listed below as part of this Form. Letter or number the exhibits in the sequence indicated.
(a) | Any code of ethics, or amendment thereto, that is the subject of the disclosure required by Item 2, to the extent that the Registrant intends to satisfy the Item 2 requirements through filing of an exhibit. |
(b)(1) | Separate certifications for the Registrant’s principal executive officer and principal financial officer, as required by Section 302 of the Sarbanes-Oxley Act of 2002 and Rule 30a-2(a) under the Investment Company Act of 1940, are attached as EX99.CERT. |
(b)(2) | Separate certifications for the Registrant’s principal executive officer and principal financial officer, as required by Section 1350 of Title 18 of United States Code, as adopted pursuant to Section 906 of the Sarbanes-Oxley Act of 2002, and Rule 30a-2(b) under the Investment Company Act of 1940, are attached as EX99.906CERT. The certifications furnished pursuant to this paragraph are not deemed to be “filed” for purposes of Section 18 of the Securities Exchange Act of 1934, or otherwise subject to the liability of that section. Such certifications are not deemed to be incorporated by reference into any filing under the Securities Act of 1933 or the Securities Exchange Act of 1934, except to the extent that the Registrant specifically incorporates them by reference. |
Pursuant to the requirements of the Securities Exchange Act of 1934 and the Investment Company Act of 1940, the Registrant has duly caused this report to be signed on its behalf by the undersigned, thereunto duly authorized.
Evergreen Equity Trust
| | | |
By: | /s/ W. Douglas Munn | | | |
|
| | | |
| W. Douglas Munn
Principal Executive Officer | | | |
Date: July 30, 2009
Pursuant to the requirements of the Securities Exchange Act of 1934 and the Investment Company Act of 1940, this report has been signed below by the following persons on behalf of the Registrant and in the capacities and on the dates indicated.
| | | |
By: | /s/ W. Douglas Munn | | | |
|
| | | |
| W. Douglas Munn
Principal Executive Officer | | | |
Date: July 30, 2009
| | | |
By: | /s/ Jeremy DePalma | | | |
|
| | | |
| Jeremy DePalma
Principal Financial Officer | | | |
Date: July 30, 2009